Income, common expenses and realized and unrealized gains and losses are allocated to the classes based on the relative net assets of each class. Distribution fees, if any, are calculated daily at the class level based on the appropriate net assets of each class and the specific expense rates applicable to each class.
Evergreen Investment Management Company, LLC (“EIMC”), a subsidiary of Wells Fargo & Company (“Wells Fargo”), is the investment advisor to the Fund and is paid an annual fee starting at 0.51% and declining to 0.26% as average daily net assets increase. For the year ended September 30, 2009, the advisory fee was equivalent to an annual rate of 0.51% of the Fund’s average daily net assets.
On October 3, 2008, Wells Fargo and Wachovia Corporation (“Wachovia”) announced that Wells Fargo agreed to acquire Wachovia in a whole company transaction that would include all of Wachovia’s banking and other businesses. In connection with this transaction, Wachovia issued preferred shares to Wells Fargo representing approximately a 40% voting interest in Wachovia. Due to its ownership of preferred shares, Wells Fargo may have been deemed to control EIMC. If Wells Fargo was deemed to control EIMC, then the existing advisory agreement between the Fund and EIMC would have terminated automatically in connection with the issuance of preferred shares. To address this possibility, on October 20, 2008 the Board of Trustees approved an interim advisory agreement with EIMC with the same terms and conditions as the existing agreement which became effective upon the issuance of the preferred shares. EIMC’s receipt of the advisory fees under the interim advisory agreement was subject to the approval by shareholders of the Fund of a new advisory agreement with EIMC.
On December 31, 2008, Wachovia merged with and into Wells Fargo and as a result of the merger, EIMC, Evergreen Investment Services, Inc. (“EIS”) and Evergreen Service Company, LLC (“ESC”) became subsidiaries of Wells Fargo. After the merger, a new interim advisory agreement with the same terms and conditions between the Fund and EIMC went into effect.
Shareholders approved the new advisory agreement between the Fund and EIMC on February 12, 2009.
From time to time, EIMC may voluntarily or contractually waive its fee and/or reimburse expenses in order to limit operating expenses. During the year ended September 30, 2009, EIMC voluntarily waived its advisory fee in the amount of $112.
The Fund may invest in money market funds which are advised by EIMC. Income earned on these investments is included in income from affiliated issuers on the Statement of Operations.
NOTES TO FINANCIAL STATEMENTS continued
EIMC also serves as the administrator to the Fund providing the Fund with facilities, equipment and personnel. EIMC is paid an annual rate determined by applying percentage rates to the aggregate average daily net assets of the Evergreen funds (excluding money market funds) starting at 0.10% and declining to 0.05% as the aggregate average daily net assets of the Evergreen funds (excluding money market funds) increase. For the year ended September 30, 2009, the administrative services fee was equivalent to an annual rate of 0.10% of the Fund’s average daily net assets.
ESC, an affiliate of EIMC and a subsidiary of Wells Fargo, is the transfer and dividend disbursing agent for the Fund. ESC receives account fees that vary based on the type of account held by the shareholders in the Fund. For the year ended September 30, 2009, the transfer agent fees were equivalent to an annual rate of 0.18% of the Fund’s average daily net assets.
Wachovia Bank NA, a subsidiary of Wells Fargo and an affiliate of EIMC, through its securities lending division, Wachovia Global Securities Lending, acts as the securities lending agent for the Fund (see Note 5).
The Fund has placed a portion of its portfolio transactions with brokerage firms that are affiliates of Wells Fargo. During the year ended September 30, 2009, the Fund paid brokerage commissions of $4,939 to broker-dealers affiliated with Wells Fargo.
4. DISTRIBUTION PLANS
EIS, an affiliate of EIMC and a subsidiary of Wells Fargo, serves as distributor of the Fund’s shares. The Fund has adopted Distribution Plans, as allowed by Rule 12b-1 of the 1940 Act, for each class of shares, except Class I. Under the Distribution Plans, the Fund is permitted to pay distribution fees at an annual rate of up to 0.75% of the average daily net assets for Class A shares and up to 1.00% of the average daily net assets for each of Class B and Class C shares. However, currently the distribution fees for Class A shares are limited to 0.25% of the average daily net assets of the class.
For the year ended September 30, 2009, EIS received $14,089 from the sale of Class A shares and $34, $19,216 and $2,043 in contingent deferred sales charges from redemptions of Class A, Class B and Class C shares, respectively.
5. INVESTMENT TRANSACTIONS
Cost of purchases and proceeds from sales of investment securities (excluding short-term securities) were $60,176,850 and $62,118,153, respectively, for the year ended September 30, 2009.
27
NOTES TO FINANCIAL STATEMENTS continued
Fair value measurements are determined within a framework that has established a fair value hierarchy based upon the various data inputs utilized in determining the value of the Fund’s investments. These inputs are summarized into three broad levels as follows:
Level 1 – quoted prices in active markets for identical securities Level 2 – other significant observable inputs (including quoted prices for similar securities, interest rates, prepayment speeds, credit risk, etc.) Level 3 – significant unobservable inputs (including the Fund’s own assumptions in determining the fair value of investments) |
The inputs or methodologies used for valuing securities are not necessarily an indication of the risk associated with investing in those securities.
As of September 30, 2009, the inputs used in valuing the Fund’s assets, which are carried at fair value, were as follows:
| | | | | Significant | | | | | | |
| | | | | Other | | Significant | | | | |
| | | | | Observable | | Unobservable | | | | |
| | Quoted Prices | | Inputs | | Inputs | | | | |
Investments in Securities | | (Level 1) | | (Level 2) | | (Level 3) | | | Total | |
|
|
|
|
|
|
|
|
|
|
| |
Equity securities | | | | | | | | | | | |
Common stocks | | $ | 298,313,067 | | $ | 0 | | $ | 0 | | $ | 298,313,067 | |
Short-term investments | | | 38,358,950 | | | 0 | | | 0 | | | 38,358,950 | |
|
|
|
|
|
|
|
|
|
|
|
|
| |
| | $ | 336,672,017 | | $ | 0 | | $ | 0 | | $ | 336,672,017 | |
|
|
|
|
|
|
|
|
|
|
|
|
| |
Further details on the major security types listed above can be found in the Schedule of Investments.
During the year ended September 30, 2009, the Fund loaned securities to certain brokers and earned $350,926, net of $39,075 paid to Wachovia Global Securities Lending as the securities lending agent. At September 30, 2009, the value of securities on loan and the total value of collateral received for securities loaned (including segregated cash) amounted to $34,858,555 and $36,110,473, respectively.
On September 30, 2009, the aggregate cost of securities for federal income tax purposes was $316,183,158. The gross unrealized appreciation and depreciation on securities based on tax cost was $41,234,703 and $20,745,844, respectively, with a net unrealized appreciation of $20,488,859.
As of September 30, 2009, the Fund had $63,677,014 in capital loss carryovers for federal income tax purposes with $24,379,268 expiring in 2010, $37,876,227 expiring in 2011 and $1,421,519 expiring in 2017.
For income tax purposes, capital losses incurred after October 31 within the Fund’s fiscal year are deemed to arise on the first business day of the following fiscal year. As of September 30, 2009, the Fund incurred and will elect to defer post-October losses of $12,388,598.
28
NOTES TO FINANCIAL STATEMENTS continued
6. INTERFUND LENDING
Pursuant to an Exemptive Order issued by the SEC, the Fund may participate in an interfund lending program with certain funds in the Evergreen fund family. This program allows the Fund to borrow from, or lend money to, other participating funds. During the year ended September 30, 2009, the Fund did not participate in the interfund lending program.
7. DISTRIBUTIONS TO SHAREHOLDERS
As of September 30, 2009, the components of distributable earnings on a tax basis were as follows:
Undistributed | | Capital Loss
Carryovers and | Temporary |
Ordinary | Unrealized | Post-October | Book/Tax |
Income | Appreciation | Losses | Differences |
|
|
|
|
$2,019,505 | $20,488,859 | $76,065,612 | $(32,851) |
|
|
|
|
The differences between the components of distributable earnings on a tax basis and the amounts reflected in the Statement of Assets and Liabilities are primarily due to wash sales. The temporary book/tax differences are a result of timing differences between book and tax recognition of income and/or expenses.
The tax character of distributions paid were $1,374,060 and $233,744 of ordinary income for the years ended September 30, 2009 and September 30, 2008, respectively.
8. EXPENSE REDUCTIONS
Through expense offset arrangements with ESC and the Fund’s custodian, a portion of fund expenses has been reduced.
9. DEFERRED TRUSTEES’ FEES
Each Trustee of the Fund may defer any or all compensation related to performance of his or her duties as a Trustee. The Trustees’ deferred balances are allocated to deferral accounts, which are included in the accrued expenses for the Fund. The investment performance of the deferral accounts is based on the investment performance of certain Evergreen funds. Any gains earned or losses incurred in the deferral accounts are reported in the Fund’s Trustees’ fees and expenses. At the election of the Trustees, the deferral account will be paid either in one lump sum or in quarterly installments for up to ten years.
10. FINANCING AGREEMENT
The Fund and certain other Evergreen funds share in a $100 million unsecured revolving credit commitment for temporary and emergency purposes, including the funding of redemptions, as permitted by each participating fund’s borrowing restrictions. Borrowings under this facility bear interest at the higher of the Federal Funds rate plus 1.25% or
29
NOTES TO FINANCIAL STATEMENTS continued
LIBOR plus 1.25%. Prior to June 26, 2009, the interest rate was 0.50% per annum above the Federal Funds rate. All of the participating funds are charged an annual commitment fee of 0.145% on the unused balance, which is allocated pro rata. Prior to June 26, 2009, the annual commitment fee was 0.09%. During the year ended September 30, 2009, the Fund had no borrowings.
11. REGULATORY MATTERS AND LEGAL PROCEEDINGS
The Evergreen funds, EIMC and certain of EIMC’s affiliates are involved in various legal actions, including private litigation and class action lawsuits, and are and may in the future be subject to regulatory inquiries and investigations.
EIMC and EIS have reached final settlements with the Securities and Exchange Commission (“SEC”) and the Securities Division of the Secretary of the Commonwealth of Massachusetts (“Commonwealth”) primarily relating to the liquidation of Evergreen Ultra Short Opportunities Fund (“Ultra Short Fund”). The claims settled include the following: first, that during the period February 2007 through Ultra Short Fund’s liquidation on June 18, 2008, Ultra Short Fund’s former portfolio management team failed to properly take into account readily-available information in valuing certain non-agency residential mortgage-backed securities held by the Ultra Short Fund, resulting in the Ultra Short Fund’s net asset value (“NAV”) being overstated during the period; second, that EIMC and EIS acted inappropriately when, in an effort to explain the decline in Ultra Short Fund’s NAV, certain information regarding the decline was communicated to some, but not all, shareholders and financial intermediaries; third, that the Ultra Short Fund portfolio management team did not adhere to regulatory requirements for affiliated cross trades in executing trades with other Evergreen funds; and finally, that from at least September 2007 to August 2008, EIS did not preserve certain text and instant messages transmitted via personal digital assistant devices. In settling these matters, EIMC and EIS have agreed to payments totaling $41,125,000, up to $40,125,000 of which will be distributed to eligible shareholders of Ultra Short Fund pursuant to a methodology and plan approved by the regulators. EIMC and EIS neither admitted nor denied the regulators’ conclusions.
Three purported class actions have also been filed in the U.S. District Court for the District of Massachusetts relating to the same events; defendants include various Evergreen entities, including EIMC and EIS, and Evergreen Fixed Income Trust and its Trustees. The cases generally allege that investors in the Ultra Short Fund suffered losses as a result of (i) misleading statements in Ultra Short Fund’s registration statement and prospectus, (ii) the failure to accurately price securities in the Ultra Short Fund at different points in time and (iii) the failure of the Ultra Short Fund’s risk disclosures and description of its investment strategy to inform investors adequately of the actual risks of the fund.
30
NOTES TO FINANCIAL STATEMENTS continued
EIMC does not expect that any of the legal actions, inquiries or settlement of regulatory matters will have a material adverse impact on the financial position or operations of the Fund to which these financial statements relate. Any publicity surrounding or resulting from any legal actions or regulatory inquiries involving EIMC or its affiliates or any of the Evergreen Funds could result in reduced sales or increased redemptions of Evergreen fund shares, which could increase Evergreen fund transaction costs or operating expenses or have other adverse consequences on the Evergreen funds, including the Fund.
31
REPORT OF INDEPENDENT REGISTERED PUBLIC ACCOUNTING FIRM
Board of Trustees and Shareholders
Evergreen Equity Trust
We have audited the accompanying statement of assets and liabilities, including the schedule of investments, of the Evergreen Large Company Growth Fund, a series of the Evergreen Equity Trust, as of September 30, 2009 and the related statement of operations for the year then ended, statements of changes in net assets for each of the years in the two-year period then ended and the financial highlights for each of the years in the five-year period then ended. These financial statements and financial highlights are the responsibility of the Fund’s management. Our responsibility is to express an opinion on these financial statements and financial highlights based on our audits.
We conducted our audits in accordance with the standards of the Public Company Accounting Oversight Board (United States). Those standards require that we plan and perform the audit to obtain reasonable assurance about whether the financial statements and financial highlights are free of material misstatement. An audit includes examining, on a test basis, evidence supporting the amounts and disclosures in the financial statements. Our procedures included confirmation of securities owned as of September 30, 2009 by correspondence with the custodian and brokers. An audit also includes assessing the accounting principles used and significant estimates made by management, as well as evaluating the overall financial statement presentation. We believe that our audits provide a reasonable basis for our opinion.
In our opinion, the financial statements and financial highlights referred to above present fairly, in all material respects, the financial position of the Evergreen Large Company Growth Fund as of September 30, 2009, the results of its operations, changes in its net assets and financial highlights for each of the years described above, in conformity with U.S. generally accepted accounting principles.

Boston, Massachusetts
November 24, 2009
32
ADDITIONAL INFORMATION (unaudited)
FEDERAL TAX DISTRIBUTIONS
For corporate shareholders, 100% of ordinary income dividends paid during the fiscal year ended September 30, 2009 qualified for the dividends received deduction.
With respect to dividends paid from investment company taxable income during the fiscal year ended September 30, 2009, the Fund designates 100% of ordinary income and any short-term capital gain distributions as Qualified Dividend Income in accordance with the Internal Revenue Code. Complete 2009 year-end tax information will be reported on your 2009 Form 1099-DIV, which shall be provided to you in early 2010.
33
ADDITIONAL INFORMATION (unaudited) continued
INFORMATION ABOUT THE REVIEW AND APPROVAL OF THE FUND’S INVESTMENT ADVISORY AGREEMENT
Each year, as required by law, the Fund’s Board of Trustees determines whether to approve the continuation of the Fund’s investment advisory agreements. At an in person meeting on September 23-24, 2009, the Trustees, including a majority of the Trustees who are not “interested persons” (as that term is defined in the 1940 Act) of the Fund or EIMC (the “independent Trustees”), approved the continuation of the Fund’s investment advisory agreements. (References below to the “Fund” are to Evergreen Large Company Growth Fund; references to the “funds” are to the Evergreen funds generally.)
At the same time, the Trustees considered the continuation of the investment advisory agreements for all of the Evergreen funds. The description below refers in many cases to the Trustees’ process for considering, and conclusions regarding, all of the funds’ agreements. In all of their deliberations, the Board of Trustees and the independent Trustees were advised by independent counsel to the independent Trustees and counsel to the funds.
The review process. In connection with its review of the funds’ investment advisory agreements, the Board of Trustees requests and evaluates, and EIMC and any sub-advisors are required to furnish, such information as the Trustees consider to be reasonably necessary in the circumstances. Over the course of the year preceding their September 2009 meeting, the Trustees regularly reviewed information regarding the investment performance of all of the funds. As part of their ongoing review of investment performance, the Trustees monitored for changes in performance and for the results of any changes in a fund’s investment process or investment team. The Trustees paid particular attention to funds whose performance since September 2008 (when the Trustees completed their 2008 review of the funds’ investment advisory agreements) indicated short-term or longer-term performance issues and to funds that they had identified during their 2008 review process as having short- or longer-term performance issues.
In spring 2009, a committee of the Board of Trustees (the “Committee”), working with EIMC management, determined generally the types of information the Trustees would review as part of the 2009 review process and set a timeline detailing the information required and the dates for its delivery to the Trustees. The Board engaged the independent data provider Keil Fiduciary Strategies LLC (“Keil”) to provide fund-specific and industry-wide data containing information of a nature and in a format generally prescribed by the Committee, and the Committee worked with Keil and EIMC to develop appropriate groups of peer funds for each fund. The Committee also identified a number of expense, performance, and other areas of review and requested specific information as to those areas of review.
The Trustees formed small groups to review individual funds in greater detail. They reviewed, with the assistance of an independent industry consultant that they retained, the
34
ADDITIONAL INFORMATION (unaudited) continued
information that EIMC and Keil provided. In addition, the Trustees considered information regarding, among other things, the funds’ brokerage practices, the funds’ use of derivatives, analyst and research support available to the portfolio management teams, risk management practices, and certain fall-out benefits received directly and indirectly by EIMC and its affiliates from the funds. The Trustees requested and received additional information following that review.
In December 2008 Wells Fargo & Company (“Wells Fargo”) acquired Wachovia Corporation (“Wachovia”), EIMC’s parent company. Wells Fargo and EIMC have taken steps to combine the operations of Wells Fargo’s investment management affiliates and EIMC during the past year and have proposed to the Trustees the combination of the mutual fund families managed by them. During the course of the year, and during their review, the Trustees requested and received information about Wells Fargo and its advisory and broker-dealer operations, the status of efforts to combine the Wells Fargo and Evergreen investment management operations, and the effects on the funds and on the services provided by EIMC and its affiliates to the funds. In their deliberations, the Trustees were mindful that it was possible that the proposed combination of the two fund families might be effected during the coming 12-month period.
The Committee met several times by telephone during the 2009 review process to consider the information provided to it. The Committee then met with representatives of EIMC and its affiliates, including Wells Fargo. In addition, during the course of their review, the Trustees discussed the continuation of the funds’ advisory agreements with representatives of EIMC, and in meetings with independent legal counsel in multiple private sessions at which no personnel of EIMC were present. At a meeting of the full Board of Trustees held on September 23-24, 2009, the Committee reported the results of its discussions with EIMC. The full Board met with representatives of EIMC and its affiliates and engaged in further review of the materials provided to it, after which the independent Trustees and the full Board approved the continuation of each of the advisory and sub-advisory agreements.
The Trustees’ determination to approve the continuation of the advisory and sub-advisory agreements was based on a comprehensive evaluation of all of the information provided to them. In considering the continuation of the agreements, the Trustees did not identify any particular information or consideration that was all-important or controlling, and each Trustee attributed different weights to various factors. The Trustees evaluated information provided to them both in terms of the funds generally and with respect to each fund, including the Fund, specifically as they considered appropriate. Although the Trustees considered the continuation of the agreements for each of the funds as part of the larger process of considering the continuation of the advisory contracts for all of the funds, their determination to continue the advisory agreements for each of the funds was ultimately made on a fund-by-fund basis.
35
ADDITIONAL INFORMATION (unaudited) continued
This summary describes a number of the most important, but not necessarily all, of the factors considered by the Board and the independent Trustees.
Information reviewed. The Board of Trustees and committees of the Board of Trustees met periodically during the course of the year. EIMC presented a wide variety of information at those meetings regarding the services it provides for the funds, the investment performance of the funds, and other aspects of the business and operations of the funds. At those meetings, and in the process of considering the continuation of the agreements, the Trustees considered information regarding, for example, the funds’ investment results; the portfolio management teams for the funds and the experience of the members of the teams, and any recent changes in the membership of the teams; portfolio trading practices; compliance by the funds and EIMC with applicable laws and regulations and with the funds’ and EIMC’s compliance policies and procedures; risk evaluation and oversight procedures at EIMC; services provided by affiliates of EIMC to the funds and shareholders of the funds; and other information relating to the nature, extent, and quality of services provided by EIMC. The Trustees considered a number of changes in portfolio management personnel at EIMC and its advisory affiliates in the year since September 2008. The Trustees also considered changes in personnel at the funds and EIMC, including the appointment of a new President of the funds, who also serves as President and Chief Operating Officer of EIMC, and a new Chief Investment Officer of EIMC in August of 2008.
The Trustees considered the rates at which the funds pay investment advisory fees, and the efforts generally by EIMC and its affiliates as sponsors of the funds. The data provided by Keil showed the management fees paid by each fund in comparison to the management fees of other peer mutual funds, in addition to data regarding the investment performance of the funds in comparison to other peer mutual funds. The Trustees were assisted by an independent industry consultant in reviewing the information presented to them.
The Trustees noted that, in certain cases, EIMC and/or its affiliates provide advisory services to other clients that are comparable to the advisory services they provide to certain funds. The Trustees considered the information EIMC provided regarding the rates at which those other clients pay advisory fees to EIMC. Fees charged to those other clients were generally lower than those charged to the respective funds. In respect of these other accounts, EIMC noted that the compliance, reporting, and other legal burdens of providing investment advice to mutual funds generally exceed those required to provide advisory services to non-mutual fund clients such as retirement or pension plans.
The Trustees considered the transfer agency fees paid by the funds to an affiliate of EIMC. They reviewed information presented to them showing that the transfer agency fees charged to the funds were generally consistent with industry norms.
36
ADDITIONAL INFORMATION (unaudited) continued
The Trustees also considered that EIMC serves as administrator to the funds and receives a fee for its services as administrator. In their comparison of fees paid by the funds with those paid by other mutual funds, the Trustees considered administrative fees paid by the funds and those other mutual funds. They considered that EIS, an affiliate of EIMC, would serve as distributor to the funds until January 3, 2010, and that Wells Fargo Funds Distributor, LLC, also an affiliate of EIMC, would serve as distributor to the funds beginning on January 4, 2010, and noted that the distributor receives fees from the funds for those services. The Trustees also considered other so-called “fall-out” benefits to EIMC and its affiliates due to their other relationships with the funds, including, for example, soft-dollar services received by EIMC attributable to transactions entered into by EIMC on behalf of the funds and brokerage commissions received by Wells Fargo Advisors, LLC (“Wells Fargo Advisors”) (formerly Wachovia Securities, LLC), an affiliate of EIMC, from transactions effected by it for the funds. The Trustees noted that the funds pay sub-transfer agency fees to various financial institutions, including Wells Fargo Advisors and its affiliates, that hold fund shares in omnibus accounts, and that an affiliate of EIMC receives fees for administering the sub-transfer agency payment program. In reviewing the services provided by an affiliate of EIMC, the Trustees noted that the affiliate of EIMC that provides transfer agency services to the funds had won recognition from Dalbar customer service each year since 1998, and also won recognition from National Quality Review for customer service and for accuracy in processing transactions in 2008. They also considered that Wells Fargo Advisors and its affiliates receive distribution-related fees and shareholder servicing payments (including amounts derived from payments under the funds’ Rule 12b-1 plans) in respect of shares sold or held through them and that an affiliate of EIMC receives compensation for serving as a securities lending agent for a number of the funds.
The Trustees considered regulatory actions taken against EIMC or its affiliates in the past year, and on-going reviews of the operations of EIMC and its affiliates as they might affect the funds. They considered the findings of the regulators, the cooperation of EIMC and its affiliates with those regulators and with the Trustees in respect of those actions and reviews, and the remedial steps EIMC and its affiliates have taken in response. They also considered the scope and nature of on-going reviews being conducted by EIMC and its affiliates, and communications to the Trustees relating to those reviews.
Nature and quality of the services provided. The Trustees considered that EIMC and its affiliates generally provide a comprehensive investment management service to the funds. They noted that EIMC formulates and implements an investment program for the Fund. They noted that EIMC makes its personnel available to serve as officers of the funds, and concluded that the reporting and management functions provided by EIMC with respect to the funds were generally satisfactory. The Trustees considered the investment philosophy of the Fund’s portfolio management team and the in-house research
37
ADDITIONAL INFORMATION (unaudited) continued
capabilities of EIMC and its affiliates, as well as other resources available to EIMC, including research services available to it from third parties.
The Trustees considered the managerial and financial resources available to EIMC and its affiliates and the commitment that the Evergreen/Wells Fargo organization has made to the funds generally. They considered assurances from representatives of Wells Fargo that the merger of Wells Fargo and Wachovia and the integration of those firms’ advisory and broker-dealer operations was not expected to result in any adverse effect on the funds, on the quality and level of services that EIMC provides to the funds, or on the resources available to the funds and to EIMC, and that Wells Fargo is committed to continue providing the funds with high-quality services.
The Trustees noted the resources EIMC and its affiliates have committed to the regulatory, compliance, accounting, tax and oversight of tax reporting, and shareholder servicing functions, and the number and quality of staff committed to those functions, which they concluded were appropriate and generally in line with EIMC’s responsibilities to the Fund and to the funds generally. The Board and the independent Trustees concluded, within the context of their overall conclusions regarding the funds’ advisory agreements, that they were generally satisfied with the nature, extent, and quality of the services provided by EIMC, including services provided by EIMC under its administrative services agreements with the funds. They determined that the nature and scope of the services provided by EIMC were consistent with EIMC’s duties under the investment advisory agreements and appropriate and consistent with the investment programs and best interests of the funds.
Investment performance. The Trustees considered the investment performance of each fund, both by comparison to other comparable mutual funds and to broad market indices. Although the Trustees considered the performance of all share classes, the Trustees noted that for the one-, three-, five-, and ten-year periods ended December 31, 2008, the Fund’s Class A shares had outperformed the Fund’s benchmark index, the Russell 1000 Growth Index. The Trustees also noted that the Fund’s Class A shares’ performance was in the first quintile for the one-, three-, and five-year periods ended December 31, 2008, and in the second quintile for the ten-year period ended December 31, 2008, of the mutual funds against which the Trustees compared the Fund’s performance.
The Trustees discussed each fund’s performance with representatives of EIMC. In each instance where a fund experienced a substantial period of underperformance relative to its benchmark index and/or the non-Evergreen fund peers against which the Trustees compared the fund’s performance, the Trustees considered EIMC’s explanation of the reasons for the relative underperformance and the steps being taken to address the relative underperformance. The Trustees emphasized that the continuation of the investment advisory agreement for a fund should not be taken as any indication that the Trustees did not believe investment performance for any specific fund might not be improved, and
38
ADDITIONAL INFORMATION (unaudited) continued
they noted that they would continue to monitor closely the investment performance of the funds going forward.
Advisory and administrative fees. The Trustees recognized that EIMC does not seek to provide the lowest cost investment advisory service, but to provide a high quality, full-service investment management product at a reasonable price. They also noted that EIMC has in many cases sought to set its investment advisory fees at levels consistent with industry norms. The Trustees noted that, in certain cases, a fund’s management fees were higher than many or most other mutual funds in the same Keil peer group. However, in each case, the Trustees determined on the basis of the information presented that the level of management fees was not excessive. The Trustees noted that the management fee paid by the Fund was lower than the management fees paid by a majority of the mutual funds against which the Trustees compared the Fund’s management fee, and that the level of profitability realized by EIMC in respect of the fee did not appear excessive.
Economies of scale. The Trustees noted the possibility that economies of scale would be achieved by EIMC in managing the funds as the funds grow. They reviewed the breakpoints in the Fund’s advisory fee structure, which operate generally to reduce the effective management fee rate of the Fund (as a percentage of Fund assets) as the Fund grows in size. They considered that, as a fund shrinks in size, breakpoints result in increasing fee levels. The Trustees noted that they would continue to review the appropriate levels of breakpoints in the future, and concluded that the breakpoints as implemented appeared to be a reasonable step toward the realization of economies of scale by the Fund.
Profitability. The Trustees considered information provided to them regarding the profitability to the EIMC organization of the investment advisory, administration, and transfer agency (with respect to the open-end funds only) fees paid to EIMC and its affiliates by each of the funds. They considered that the information provided to them was necessarily estimated, and that the profitability information provided to them, especially on a fund-by-fund basis, did not necessarily provide a definitive tool for evaluating the appropriateness of each fund’s advisory fee. They noted that the levels of profitability of the funds to EIMC varied widely, depending on, among other things, the size and type of fund. They considered the profitability of the funds in light of such factors as, for example, the information they had received regarding the relation of the fees paid by the funds to those paid by other mutual funds, the investment performance of the funds, and the amount of revenues involved. In light of these factors, the Trustees concluded that the profitability to EIMC of the services provided to any of the funds, individually or in the aggregate, should not prevent the Trustees from approving the continuation of the agreements.
39
TRUSTEES AND OFFICERS
TRUSTEES1 | | |
Charles A. Austin III
Trustee
DOB: 10/23/1934
Term of office since: 1991
Other directorships: None | | Investment Counselor, Anchor Capital Advisors, LLC. (investment advice); Director, The Andover Companies (insurance); Trustee, Arthritis Foundation of New England; Former Director, The Francis Ouimet Society (scholarship program); Former Director, Executive Vice President and Treasurer, State Street Research & Management Company (investment advice) |
|
|
|
K. Dun Gifford
Trustee
DOB: 10/23/1938
Term of office since: 1974
Other directorships: None | | Chairman and President, Oldways Preservation and Exchange Trust (education); Trustee, Member of the Executive Committee, Former Chairman of the Finance Committee, and Former Treasurer, Cambridge College |
|
|
|
Dr. Leroy Keith, Jr.
Trustee
DOB: 2/14/1939
Term of office since: 1983
Other directorships: Trustee,
Phoenix Fund Complex
(consisting of 50 portfolios
as of 12/31/2008) | | Managing Director, Almanac Capital Management (commodities firm); Trustee, Phoenix Fund Complex; Director, Diversapack Co. (packaging company); Former Partner, Stonington Partners, Inc. (private equity fund); Former Director, Obagi Medical Products Co.; Former Director, Lincoln Educational Services |
|
|
|
Carol A. Kosel
Trustee
DOB: 12/25/1963
Term of office since: 2008
Other directorships: None | | Former Consultant to the Evergreen Boards of Trustees; Former Vice President and Senior Vice President, Evergreen Investments, Inc.; Former Treasurer, Evergreen Funds; Former Treasurer, Vestaur Securities Fund |
|
|
|
Gerald M. McDonnell
Trustee
DOB: 7/14/1939
Term of office since: 1988
Other directorships: None | | Former Manager of Commercial Operations, CMC Steel (steel producer) |
|
|
|
Patricia B. Norris
Trustee
DOB: 4/9/1948
Term of office since: 2006
Other directorships: None | | President and Director of Buckleys of Kezar Lake, Inc. (real estate company); Former President and Director of Phillips Pond Homes Association (home community); Former Partner, PricewaterhouseCoopers, LLP (independent registered public accounting firm) |
|
|
|
William Walt Pettit2
Trustee
DOB: 8/26/1955
Term of office since: 1988
Other directorships: None | | Partner and Vice President, Kellam & Pettit, P.A. (law firm); Director, Superior Packaging Corp. (packaging company); Member, Superior Land, LLC (real estate holding company), Member, K&P Development, LLC (real estate development); Former Director, National Kidney Foundation of North Carolina, Inc. (non-profit organization) |
|
|
|
David M. Richardson
Trustee
DOB: 9/19/1941
Term of office since: 1982
Other directorships: None | | President, Richardson, Runden LLC (executive recruitment advisory services); Director, J&M Cumming Paper Co. (paper merchandising); Former Trustee, NDI Technologies, LLP (communications); Former Consultant, AESC (The Association of Executive Search Consultants) |
|
|
|
Russell A. Salton III, MD
Trustee
DOB: 6/2/1947
Term of office since: 1984
Other directorships: None | | President/CEO, AccessOne MedCard, Inc. |
|
|
|
40
TRUSTEES AND OFFICERS continued
Michael S. Scofield
Trustee
DOB: 2/20/1943
Term of office since: 1984
Other directorships: None | | Retired Attorney, Law Offices of Michael S. Scofield; Former Director and Chairman, Branded Media Corporation (multi-media branding company) |
|
|
|
Richard J. Shima
Trustee
DOB: 8/11/1939
Term of office since: 1993
Other directorships: None | | Independent Consultant; Director, Hartford Hospital; Trustee, Greater Hartford YMCA; Former Director,Trust Company of CT; Former Trustee, Saint Joseph College (CT) |
|
|
|
Richard K. Wagoner, CFA3
Trustee
DOB: 12/12/1937
Term of office since: 1999
Other directorships: None | | Member and Former President, North Carolina Securities Traders Association; Member, Financial Analysts Society |
|
|
|
OFFICERS | | |
W. Douglas Munn4
President
DOB: 4/21/1963
Term of office since: 2009 | | Principal occupations: Chief Operating Officer, Wells Fargo Funds Management, LLC; President and Chief Operating Officer, Evergreen Investment Company, Inc. |
|
|
|
Jeremy DePalma4
Treasurer
DOB: 2/5/1974
Term of office since: 2005 | | Principal occupations: Senior Vice President, Evergreen Investment Management Company, LLC; Former Vice President, Evergreen Investment Services, Inc.; Former Assistant Vice President, Evergreen Investment Services, Inc. |
|
|
|
Michael H. Koonce4
Secretary
DOB: 4/20/1960
Term of office since: 2000 | | Principal occupations: Senior Vice President and General Counsel, Evergreen Investment Services, Inc.; Secretary, Senior Vice President and General Counsel, Evergreen Investment Management Company, LLC and Evergreen Service Company, LLC |
|
|
|
Robert Guerin4
Chief Compliance Officer
DOB: 9/20/1965
Term of office since: 2007 | | Principal occupations: Chief Compliance Officer, Evergreen Funds and Senior Vice President of Evergreen Investment Company, Inc.; Former Managing Director and Senior Compliance Officer, Babson Capital Management LLC; Former Principal and Director, Compliance and Risk Management, State Street Global Advisors; Former Vice President and Manager, Sales Practice Compliance, Deutsche Asset Management |
|
|
|
1 | Each Trustee serves until a successor is duly elected or qualified or until his or her death, resignation, retirement or removal from office. Each Trustee oversaw 77 Evergreen funds as of December 31, 2008. Correspondence for each Trustee may be sent to Evergreen Board of Trustees, P.O. Box 20083, Charlotte, NC 28202. |
2 | It is possible that Mr. Pettit may be viewed as an “interested person” of the Evergreen funds, as defined in the 1940 Act, because of his law firm’s previous representation of affiliates of Wells Fargo & Company (“Wells Fargo”), the parent to the Evergreen funds’ investment advisor, EIMC. The Trustees are treating Mr. Pettit as an interested trustee for the time being. |
3 | Mr. Wagoner is an “interested person” of the Evergreen funds because of his ownership of shares in Wells Fargo & Company, the parent to the Evergreen funds’ investment advisor. |
4 | The address of the Officer is 200 Berkeley Street, Boston, MA 02116. |
Additional information about the Fund’s Board of Trustees and Officers can be found in the Statement of Additional Information (SAI) and is available upon request without charge by calling 800.343.2898.
41

563828 rv7 11/2009
Evergreen Mid Cap Growth Fund
| | table of contents |
1 | | LETTER TO SHAREHOLDERS |
4 | | FUND AT A GLANCE |
6 | | PORTFOLIO MANAGER COMMENTARY |
10 | | ABOUT YOUR FUND’S EXPENSES |
11 | | FINANCIAL HIGHLIGHTS |
15 | | SCHEDULE OF INVESTMENTS |
20 | | STATEMENT OF ASSETS AND LIABILITIES |
21 | | STATEMENT OF OPERATIONS |
22 | | STATEMENTS OF CHANGES IN NET ASSETS |
23 | | NOTES TO FINANCIAL STATEMENTS |
31 | | REPORT OF INDEPENDENT REGISTERED PUBLIC ACCOUNTING FIRM |
32 | | ADDITIONAL INFORMATION |
40 | | TRUSTEES AND OFFICERS |
This annual report must be preceded or accompanied by a prospectus of the Evergreen fund contained herein. The prospectus contains more complete information, including fees and expenses, and should be read carefully before investing or sending money.
The fund will file its complete schedule of portfolio holdings with the SEC for the first and third quarters of each fiscal year on Form N-Q. The fund’s Form N-Q will be available on the SEC’s Web site at http://www.sec.gov. In addition, the fund’s Form N-Q may be reviewed and copied at the SEC’s Public Reference Room in Washington, D.C. Information on the operation of the Public Reference Room may be obtained by calling 800.SEC.0330.
A description of the fund’s proxy voting policies and procedures, as well as information regarding how the fund voted proxies relating to portfolio securities during the most recent 12-month period ended June 30, is available by visiting our Web site at EvergreenInvestments.com or by visiting the SEC’s Web site at http://www.sec.gov. The fund’s proxy voting policies and procedures are also available without charge, upon request, by calling 800.343.2898.
Mutual Funds:
| NOT FDIC INSURED | MAY LOSE VALUE | NOT BANK GUARANTEED |
Evergreen InvestmentsSM is a service mark of Evergreen Investment Management Company, LLC. Copyright 2009, Evergreen Investment Management Company, LLC.
Evergreen Investment Management Company, LLC is a subsidiary of Wells Fargo & Company and is an affiliate of Wells Fargo & Company’s other Broker Dealer subsidiaries.
Evergreen mutual funds are distributed by Evergreen Investment Services, Inc. 200 Berkeley Street, Boston, MA 02116
LETTER TO SHAREHOLDERS
November 2009

W. Douglas Munn
President and Chief Executive Officer
Dear Shareholder:
We are pleased to provide the Annual Report for Evergreen Mid Cap Growth Fund for the twelve-month period ended September 30, 2009 (the “period”).
Capital markets throughout the globe continued to experience extreme pressure during the period. Home prices fell and job losses persisted. The collapse of Lehman Brothers in September 2008 led to collateral damage in the ensuing weeks as venerable financial institutions both in the United States and Europe fell like dominos. Distrust prevailed, and counter-party risk, whether real or imagined, escalated. Inter-bank lending ceased to exist, and the credit markets froze. In response, the Federal Reserve Board (the “Fed”), the U.S. Treasury, the Federal Deposit Insurance Corporation, and the Securities and Exchange Commission took a series of dramatic and innovative steps to help the economy and the financial markets emerge from this crisis. In October 2008, Congress rushed through a $700 billion rescue plan designed to address the capital inadequacy of banks. Meanwhile, in a further effort to re-stimulate lending activity, the Fed twice slashed the key fed funds rate in October 2008, bringing the influential overnight lending rate to just 1.00%. The Fed slashed rates again in December to near zero, where it stayed during the remainder of the period. Overseas, other major central banks also cut short-term rates to inject liquidity into the financial markets. At the same time, foreign governments took other measures to buttress financial institutions and forestall the possibility of a global recession.
Early in 2009, the fixed-income markets worried about deflation, as evidenced by investor willingness to accept virtually nothing for short-term loans to the government. Concerns about federal spending also increased with the $787 billion American Recovery and Reinvestment Act of 2009, signed into law in February. Yields climbed for longer-term U.S. Treasuries during the first quarter of 2009. International markets were hit hard, as economies in both developed and emerging countries struggled. Equity markets were affected by the weakness in economic data and corporate profits, although stocks rallied off their March 9th lows, with international and small cap stocks leading the gains. Signs of stability emerged in the corporate credit markets, as both issuance and performance improved. The price of oil surged in the second quarter of 2009, pulling most commodities higher, as the dollar weakened and gold gave back earlier gains. However, gold surged at the end of the fiscal year, and stocks finished a banner third quarter 2009, with all major market indexes climbing by approximately 15%, as investor sentiment was buoyed by signs of improvement in the economy and corporate
1
LETTER TO SHAREHOLDERS continued
earnings. In international markets, most major equity indexes doubled in the developing world from their lows of last year, while the market gains in developed economies have been somewhat more muted.
While recent data reflect an economy that is managing to climb from the depths reached in March, we question whether the fundamentals are in place for sustainable growth, given that economic reports continue to display data that is simply “less bad” than it was earlier in the fiscal year. Until we see stabilization in home prices and employment, it is unlikely that activity will exceed anything beyond what is considered to be “below potential” for any period of time.
During a volatile and challenging period in the capital markets, the investment managers of Evergreen’s growth-oriented equity funds focused on managing risk and finding potential opportunities while maintaining the goal of seeking long-term capital appreciation. Managers of Evergreen Large Company Growth Fund and Evergreen Omega Fund focused on bottom-up, fundamental analysis in making individual stock selections. The management teams supervising Evergreen Mid Cap Growth Fund and Evergreen Small-Mid Growth Fund, meanwhile, sought out growing companies with strong fundamentals and reasonable valuations. At the same time, managers of Evergreen Growth Fund concentrated on opportunities among small cap growth companies with above-average earnings prospects and reasonable stock prices. The team supervising Evergreen Strategic Growth Fund, meanwhile, focused on large cap companies offering superior long-term growth potential.
We believe the changing conditions in the investment environment over the period have underscored the value of a well-diversified, long-term investment strategy that seeks to help soften the effects of volatility in any one market or asset class. As always, we encourage investors to maintain diversified investment portfolios in pursuit of their long-term investment goals.
Please visit us at EvergreenInvestments.com for more information about our funds and other investment products available to you. Thank you for your continued support of Evergreen Investments.
Sincerely,

W. Douglas Munn
President and Chief Executive Officer
Evergreen Funds
2
LETTER TO SHAREHOLDERS continued
Notice to Shareholders:
Effective after the close of business on June 30, 2009, Class B shares of the Fund were closed to new accounts and additional purchases by existing shareholders. Existing shareholders of Class B shares of the Fund may continue to exchange their Class B shares for Class B shares of other Evergreen Funds subject to the limitations described in each fund’s prospectus and may also continue to add to their accounts through dividend reinvestment. All other Class B share features and attributes, including, but not limited to, the 12b-1 fee, contingent deferred sales charge and conversion after a number of years to Class A shares, remain unchanged. Shareholders of the Fund may continue to redeem Fund shares in the manner described in the Fund’s prospectus.
3
FUND AT A GLANCE
as of September 30, 2009
MANAGEMENT TEAM
Investment Advisor:
Evergreen Investment Management Company, LLC
Portfolio Managers:
Robert C. Junkin, CPA; Lori S. Evans; Julian J. Johnson
CURRENT INVESTMENT STYLE

Source: Morningstar, Inc.
Morningstar’s style box is based on a portfolio date as of 9/30/2009.
The Equity style box placement is based on 10 growth and valuation measures for each fund holding and the median size of the companies in which the fund invests.
PERFORMANCE AND RETURNS
Portfolio inception date: 9/11/1935
| Class A | Class B | Class C | Class I |
Class inception date | 1/20/1998 | 9/11/1935 | 1/26/1998 | 1/26/1998 |
|
|
|
|
|
Nasdaq symbol | EKAAX | EKABX | EKACX | EKAYX |
|
|
|
|
|
Average annual return* | | | | |
|
|
|
|
|
1-year with sales charge | -13.32% | -13.21% | -9.59% | N/A |
|
|
|
|
|
1-year w/o sales charge | -8.05% | -8.68% | -8.68% | -7.92% |
|
|
|
|
|
5-year | -0.86% | -0.82% | -0.40% | 0.55% |
|
|
|
|
|
10-year | 1.15% | 1.00% | 1.02% | 1.99% |
|
|
|
|
|
Maximum sales charge | 5.75% | 5.00% | 1.00% | N/A |
| Front-end | CDSC | CDSC | |
|
|
|
|
|
* | Adjusted for maximum applicable sales charge, unless noted. |
Past performance is no guarantee of future results. The performance quoted represents past performance and current performance may be lower or higher. The investment return and principal value of an investment will fluctuate so that investors’ shares, when redeemed, may be worth more or less than their original cost. To obtain performance information current to the most recent month-end for Classes A, B, C or I, please go to EvergreenInvestments.com/fundperformance. The performance of each class may vary based on differences in loads, fees and expenses paid by the shareholders investing in each class. Performance includes the reinvestment of income dividends and capital gain distributions. Performance shown does not reflect the deduction of taxes that a shareholder would pay on fund distributions or the redemption of fund shares.
The fund incurs a 12b-1 fee of 0.25% for Class A and 1.00% for Classes B and C. Class I does not pay a 12b-1 fee.
The returns shown for Class B shares do not reflect the conversion of Class B shares to Class A shares after eight years.
Class B shares are closed to new investments by new and existing shareholders.
Returns reflect expense limits previously in effect, without which returns would have been lower.
4
FUND AT A GLANCE continued

Comparison of a $10,000 investment in the Evergreen Mid Cap Growth Fund Class A shares versus a similar investment in the Russell Midcap Growth Index (Russell Midcap Growth) and the Consumer Price Index (CPI).
The Russell Midcap Growth is an unmanaged market index and does not include transaction costs associated with buying and selling securities, any mutual fund fees or expenses or any taxes. The CPI is a commonly used measure of inflation and does not represent an investment return. It is not possible to invest directly in an index.
Class I shares are only offered, subject to the minimum initial purchase requirements, in the following manner: (1) to investment advisory clients of EIMC (or its advisory affiliates), (2) to employer- or state-sponsored benefit plans, including but not limited to, retirement plans, defined benefit plans, deferred compensation plans, or savings plans, (3) to fee-based mutual fund wrap accounts, (4) through arrangements entered into on behalf of the Evergreen funds with certain financial services firms, (5) to certain institutional investors, and (6) to persons who owned Class Y shares in registered name in an Evergreen fund on or before December 31, 1994 or who owned shares of any SouthTrust fund in registered name as of March 18, 2005 or who owned shares of Vestaur Securities Fund as of May 20, 2005.
Class I shares are only available to institutional shareholders with a minimum of $1 million investment, which may be waived in certain situations.
The fund’s investment objective may be changed without a vote of the fund’s shareholders.
Foreign investments may contain more risk due to the inherent risks associated with changing political climates, foreign market instability and foreign currency fluctuations.
Small and mid cap securities may be subject to special risks associated with narrower product lines and limited financial resources compared to their large cap counterparts, and, as a result, small and mid cap securities may decline significantly in market downturns and may be more volatile than those of larger companies due to the higher risk of failure.
All data is as of September 30, 2009, and subject to change.
5
PORTFOLIO MANAGER COMMENTARY
The fund’s Class A shares returned -8.05% for the twelve-month period ended September 30, 2009, excluding any applicable sales charges. During the same period, the Russell Midcap Growth returned -0.40%.
The fund’s objective is to seek long-term capital growth.
Investment process
The U.S. equity markets and international indexes have rebounded significantly since March, as economic conditions and profitability have shown signs of improvement. The best-performing sectors were the higher-beta, more cyclical sectors, which are most sensitive to changes in the economy. Since the upturn, Energy has been the top performer. Over the fiscal year, expectations for the economic recovery have increased considerably. As the credit crisis receded and capital became available, the market continued to rotate into lower-quality distressed companies with weak balance sheets and poor profits.
We kept to our long-term discipline during the fiscal year while positioning the portfolio for the period ahead. At the end of the period, the fund was overweight in sectors linked to U.S. exports and manufacturing, reflecting our belief that exports will continue to gain share and contribute positively to the growth of the domestic economy. The weak U.S. dollar, combined with the sheer size of emerging markets and their secular growth trends, should provide great potential for continued gains in exports. Strong balance sheets for manufacturing companies, many of which restrained their capital investments, also encourage an optimistic view. At the same time, in view of the financial backstops put into place by government and monetary authorities, we would expect to add to Financials, as empirical evidence continues to emerge that the worst of the credit crisis has passed.
In times of market tumult, we believe it is important to remain focused and to adhere to a disciplined long-term investment process. Under severe stress, opportunities are typically created, and we see them occurring as credit losses faced by financial institutions enter the later stages of a cycle, and offsetting developments have begun to emerge. We believe that the preconditions for a sustainable economic recovery are also apparent in the advent of lower mortgage rates, which, in combination with lower house prices, have dramatically improved housing affordability. Various government initiatives have also supported the housing market and shored up financial institutions. In addition, oil and commodity prices have retreated.
Contributors to performance
By sector, our overweighting of Energy and Materials tended to support performance. The underweighting of Health Care also contributed positively. Stock selection was best in the Energy and Telecommunication Services sectors. The strongest individual stock performers included: Priceline.com, Inc., a Consumer Discretionary position; Cognizant
6
PORTFOLIO MANAGER COMMENTARY continued
Technology Solutions Corp., an Information Technology holding; and Flowserve Corp., from the Industrials sector.
Priceline provides e-commerce Internet services at a price that enable consumers to purchase a wide range of products over the Internet and save money. Priceline is still in its early-growth stage. It is gaining market share from offline sources and from suppliers. Priceline will likely benefit from its high customer retention and high international hotel exposure. We believe it is well positioned to maintain a pipeline of high international gross bookings growth through the early entry into emerging markets.
Cognizant provides IT design development, integration, and maintenance services for companies primarily in financial services, health care, manufacturing/retail, and telecommunication/media. Cognizant is an outsourcing company based in India that supplies labor. Cognizant is facing a positive demand environment as an increasing portion of IT spending is moving offshore to save costs.
Flowserve manufactures flow control equipment for critical service applications in the water treatment, power generations, chemical, and petroleum industries. The end markets are stable, orders are picking up, and costs have been reduced due to optimization of the operating platform. Flowserve has a strong balance sheet which may be levered to create long-term shareowner value. We believe there may be buybacks and some M&A.
Detractors from performance
The fund’s underweight in Consumer Discretionary and Information Technology detracted from results, as did the overweight in Telecommunication Services. Stock selection in Information Technology, Health Care, and Financials also held back performance. As the liquidity squeeze receded in March, the fund’s exposure to profitable companies with strong balance sheets lagged. Many of the more significant detractors for the full twelve-month period had performed relatively well the first half of the period. The largest performance detractors since the market upturn in March included Qwest Communications, Granite Construction, and Alliant Techsystems.
Qwest provides broadband Internet-based data, voice, and image communications in the United States. Qwest is the fourth-largest Regional Bell Operating Company in the United States and serves regional customers in 14 Northern and Midwestern states. It also provides long distance and wireless services within its territory. Last quarter, Qwest reported a decline in revenues, attributed to weakness in the wholesale and mass market segments and flat revenues in the business market segment. We continue to hold Qwest for its strong free cash flow generation, attractive valuation, and costs reduction. Qwest announced an agreement to extend the partnership with Direct TV for bundling broadband and voice services and entered an agreement with IBM to offer managed services to mid-size businesses.
7
PORTFOLIO MANAGER COMMENTARY continued
Granite Construction provides heavy civil construction services for both public and private sectors. Construction projects include major highways, large dams, mass transit facilities, bridges, pipelines, canals, tunnels, and airport infrastructure. Revenues are negatively affected by the competitive environment for low-bid public construction projects from the California state transportation department. However the long-term thesis is still intact of increased spending in domestic infrastructure. The slow pickup in funding and project award for the remainder of 2009 is reflected in expectations. Near-and long-term catalysts include funding for the highway trust fund, Build America bond funding, stimulus funding, and reauthorization of highway bill.
Alliant Techsystems manufactures and supplies advanced defense and aerospace systems. Products include missile systems, military ammunition, satellite components and sub-systems. Given the pending administration decision on NASA Constellation, we expect stock price volatility over the next few months. We believe that most of the risk is already reflected in the shares. We believe the potential upside to earnings at the current Constellation program, or something close to it, significantly outweighs the worst-case NASA scenario, including a decline in ammunition revenues from war withdrawal.
Portfolio management outlook
Economic recoveries are typically self-sustaining. As the recovery gains momentum, confidence and credit are restored, enabling the private sector to grow. However, there is always much uncertainty and skepticism during the early stages of a recovery, which make it fragile. Today’s uncertainties include unemployment, federal spending, home prices, and bank balance sheets. It is important for policy stimulus to remain intact in order to support the recovery. Prematurely trying to reduce budget deficits by raising taxes and cutting spending may undermine the recovery.
The key question is whether the recovery is sustainable long-term or, conversely, whether the United States is entering a period of prolonged multi-year stagnation, as occurred in Japan. To avoid stagnation, it is crucial that the imbalances that created the recession are alleviated. Some of the progress we see on several of the economy’s imbalances include the reduction of overcapacity in banking, housing, commercial real estate, and retailing. However, the most important factor is the U.S. consumer, upon whom the sustainability of the worldwide recovery ultimately depends. Some positive signs of improvement include the strengthening consumer balance sheet, the stabilization of the negative wealth effect from falling house prices, and the stabilization of equity markets. In addition, housing has become more affordable, oil prices have fallen, and the consumer is de-leveraging.
The self-sustaining nature of a recovery can create the perception, as is the case today, of markets getting ahead of fundamentals. We believe that high unemployment and delinquencies on consumer loans are valid concerns. The economy is not out of the woods. However, while a short-term pull-back would not surprise us, we believe that
8
PORTFOLIO MANAGER COMMENTARY continued
fundamentals are improving overall, and we expect the economic issues to be resolved during the recovery process. In our view, a market pull-back is an opportunity to incrementally add market exposure.
This commentary reflects the views and opinions of the fund’s portfolio manager(s) on the date indicated and may include statements that constitute “forward-looking statements” under the U.S. Securities laws. Forward-looking statements include, among other things, projections, estimates and information about possible or future results related to the fund, markets, or regulatory developments. The views expressed above are not guarantees of future performance or economic results and involve certain risks, uncertainties and assumptions that could cause actual outcomes and results to differ materially from the views expressed herein. The views expressed above are subject to change at any time based upon economic, market, or other conditions and Evergreen undertakes no obligation to update the views expressed herein. Any discussions of specific securities should not be considered a recommendation to buy or sell those securities. The views expressed herein (including any forward-looking statements) may not be relied upon as investment advice or as an indication of the fund’s trading intent.
9
ABOUT YOUR FUND’S EXPENSES
The Example below is intended to describe the fees and expenses borne by shareholders and the impact of those costs on your investment.
Example
As a shareholder of the fund, you incur two types of costs: (1) transaction costs, including sales charges (loads), redemption fees and exchange fees; and (2) ongoing costs, including management fees, distribution (12b-1) fees and other fund expenses. This Example is intended to help you understand your ongoing costs (in dollars) of investing in the fund and to compare these costs with the ongoing costs of investing in other mutual funds. The Example is based on an investment of $1,000 invested at the beginning of the period and held for the entire period from April 1, 2009 to September 30, 2009.
The example illustrates your fund’s costs in two ways:
• Actual expenses
The section in the table under the heading “Actual” provides information about actual account values and actual expenses. You may use the information in these columns, together with the amount you invested, to estimate the expenses that you paid over the period. Simply divide your account value by $1,000 (for example, an $8,600 account value divided by $1,000 = 8.6), then multiply the result by the number in the appropriate column for your share class, in the column entitled “Expenses Paid During Period” to estimate the expenses you paid on your account during this period.
• Hypothetical example for comparison purposes
The section in the table under the heading “Hypothetical (5% return before expenses)” provides information about hypothetical account values and hypothetical expenses based on the fund’s actual expense ratio and an assumed rate of return of 5% per year before expenses, which is not the fund’s actual return. The hypothetical account values and expenses may not be used to estimate the actual ending account balance or expenses you paid for the period. You may use this information to compare the ongoing costs of investing in the fund and other funds. To do so, compare this 5% hypothetical example with the 5% hypothetical examples that appear in the shareholder reports of the other funds.
Please note that the expenses shown in the table are meant to highlight your ongoing costs only and do not reflect any transactional costs, such as sales charges (loads), redemption fees or exchange fees. Therefore, the section in the table under the heading “Hypothetical (5% return before expenses)” is useful in comparing ongoing costs only, and will not help you determine the relative total costs of owning different funds. In addition, if these transactional costs were included, your costs would have been higher.
| Beginning | Ending | |
| Account Value | Account Value | Expenses Paid |
| 4/1/2009 | 9/30/2009 | During Period* |
|
|
|
|
Actual | | | |
Class A | $1,000.00 | $1,325.37 | $ 6.76 |
Class B | $1,000.00 | $1,318.33 | $11.10 |
Class C | $1,000.00 | $1,318.33 | $11.10 |
Class I | $1,000.00 | $1,324.64 | $ 5.30 |
Hypothetical | | | |
(5% return before expenses) | | | |
Class A | $1,000.00 | $1,019.25 | $ 5.87 |
Class B | $1,000.00 | $1,015.49 | $ 9.65 |
Class C | $1,000.00 | $1,015.49 | $ 9.65 |
Class I | $1,000.00 | $1,020.51 | $ 4.61 |
|
|
|
|
* | For each class of the fund, expenses are equal to the annualized expense ratio of each class (1.16% for Class A, 1.91% for Class B, 1.91% for Class C and 0.91% for Class I), multiplied by the average account value over the period, multiplied by 183 / 365 days. |
10
FINANCIAL HIGHLIGHTS
(For a share outstanding throughout each period)
| | Year Ended September 30, | |
| |
| |
CLASS A | | 2009 | | 2008 | | 2007 | | 2006 | | 2005 | |
|
|
|
|
|
|
|
|
|
|
| |
Net asset value, beginning of period | | $ | 4.94 | | $ | 7.01 | | $ | 5.55 | | $ | 5.44 | | $ | 4.65 | |
|
|
|
|
|
|
|
|
|
|
|
|
|
|
|
| |
Income from investment operations | | | | | | | | | | | | | | | | |
Net investment income (loss) | | | 0.01 | | | (0.01 | )1 | | (0.01 | ) | | (0.02 | ) | | (0.03 | ) |
Net realized and unrealized gains or losses on investments | | | (0.43 | ) | | (1.80 | ) | | 1.47 | | | 0.13 | | | 0.82 | |
| |
|
|
|
|
|
|
|
|
|
|
|
|
|
| |
Total from investment operations | | | (0.42 | ) | | (1.81 | ) | | 1.46 | | | 0.11 | | | 0.79 | |
|
|
|
|
|
|
|
|
|
|
|
|
|
|
|
| |
Distributions to shareholders from | | | | | | | | | | | | | | | | |
Net investment income | | | (0.05 | ) | | (0.09 | ) | | 0 | | | 0 | | | 0 | |
Net realized gains | | | (0.03 | ) | | (0.17 | ) | | 0 | | | 0 | | | 0 | |
| |
|
|
|
|
|
|
|
|
|
|
|
|
|
| |
Total distributions to shareholders | | | (0.08 | ) | | (0.26 | ) | | 0 | | | 0 | | | 0 | |
|
|
|
|
|
|
|
|
|
|
|
|
|
|
|
| |
Net asset value, end of period | | $ | 4.44 | | $ | 4.94 | | $ | 7.01 | | $ | 5.55 | | $ | 5.44 | |
|
|
|
|
|
|
|
|
|
|
|
|
|
|
|
| |
Total return2 | | | (8.05 | )% | | (26.74 | )% | | 26.31 | % | | 2.02 | % | | 16.99 | % |
|
|
|
|
|
|
|
|
|
|
|
|
|
|
|
| |
Ratios and supplemental data | | | | | | | | | | | | | | | | |
Net assets, end of period (millions) | | $ | 296 | | $ | 354 | | $ | 540 | | $ | 506 | | $ | 564 | |
Ratios to average net assets | | | | | | | | | | | | | | | | |
Expenses including waivers/reimbursements but excluding expense reductions | | | 1.09 | % | | 0.93 | % | | 1.06 | % | | 1.09 | % | | 1.13 | % |
Expenses excluding waivers/reimbursements and expense reductions | | | 1.19 | % | | 1.05 | % | | 1.07 | % | | 1.09 | % | | 1.13 | % |
Net investment income (loss) | | | 0.05 | % | | (0.14 | )% | | (0.36 | )% | | (0.34 | )% | | (0.68 | )% |
Portfolio turnover rate | | | 41 | % | | 114 | % | | 89 | % | | 110 | % | | 141 | % |
|
|
|
|
|
|
|
|
|
|
|
|
|
|
|
| |
1 | Per share amount is based on average shares outstanding during the period. |
2 | Excluding applicable sales charges |
See Notes to Financial Statements
11
FINANCIAL HIGHLIGHTS
(For a share outstanding throughout each period)
| | Year Ended September 30, | |
| |
| |
CLASS B | | 2009 | | 2008 | | 2007 | | 2006 | | 2005 | |
|
|
|
|
|
|
|
|
|
|
| |
Net asset value, beginning of period | | $ | 4.53 | | $ | 6.45 | | $ | 5.15 | | $ | 5.08 | | $ | 4.37 | |
|
|
|
|
|
|
|
|
|
|
|
|
|
|
|
| |
Income from investment operations | | | | | | | | | | | | | | | | |
Net investment loss | | | (0.02 | )1 | | (0.05 | )1 | | (0.06 | )1 | | (0.05 | )1 | | (0.07 | )1 |
Net realized and unrealized gains or losses on investments | | | (0.38 | ) | | (1.67 | ) | | 1.36 | | | 0.12 | | | 0.78 | |
| |
|
|
|
|
|
|
|
|
|
|
|
|
|
| |
Total from investment operations | | | (0.40 | ) | | (1.72 | ) | | 1.30 | | | 0.07 | | | 0.71 | |
|
|
|
|
|
|
|
|
|
|
|
|
|
|
|
| |
Distributions to shareholders from | | | | | | | | | | | | | | | | |
Net investment income | | | 0 | | | (0.03 | ) | | 0 | | | 0 | | | 0 | |
Net realized gains | | | (0.03 | ) | | (0.17 | ) | | 0 | | | 0 | | | 0 | |
| |
|
|
|
|
|
|
|
|
|
|
|
|
|
| |
Total distributions to shareholders | | | (0.03 | ) | | (0.20 | ) | | 0 | | | 0 | | | 0 | |
|
|
|
|
|
|
|
|
|
|
|
|
|
|
|
| |
Net asset value, end of period | | $ | 4.10 | | $ | 4.53 | | $ | 6.45 | | $ | 5.15 | | $ | 5.08 | |
|
|
|
|
|
|
|
|
|
|
|
|
|
|
|
| |
Total return2 | | | (8.68 | )% | | (27.41 | )% | | 25.24 | % | | 1.38 | % | | 16.25 | % |
|
|
|
|
|
|
|
|
|
|
|
|
|
|
|
| |
Ratios and supplemental data | | | | | | | | | | | | | | | | |
Net assets, end of period (millions) | | $ | 7 | | $ | 11 | | $ | 21 | | $ | 21 | | $ | 27 | |
Ratios to average net assets | | | | | | | | | | | | | | | | |
Expenses including waivers/reimbursements but excluding expense reductions | | | 1.83 | % | | 1.68 | % | | 1.78 | % | | 1.79 | % | | 1.83 | % |
Expenses excluding waivers/reimbursements and expense reductions | | | 1.93 | % | | 1.78 | % | | 1.78 | % | | 1.79 | % | | 1.83 | % |
Net investment loss | | | (0.68 | )% | | (0.89 | )% | | (1.08 | )% | | (1.04 | )% | | (1.38 | )% |
Portfolio turnover rate | | | 41 | % | | 114 | % | | 89 | % | | 110 | % | | 141 | % |
|
|
|
|
|
|
|
|
|
|
|
|
|
|
|
| |
1 | Per share amount is based on average shares outstanding during the period. |
2 | Excluding applicable sales charges |
See Notes to Financial Statements
12
FINANCIAL HIGHLIGHTS
(For a share outstanding throughout each period)
| | Year Ended September 30, | |
| |
| |
CLASS C | | 2009 | | 2008 | | 2007 | | 2006 | | 2005 | |
|
|
|
|
|
|
|
|
|
|
| |
Net asset value, beginning of period | | $ | 4.53 | | $ | 6.45 | | $ | 5.15 | | $ | 5.08 | | $ | 4.37 | |
|
|
|
|
|
|
|
|
|
|
|
|
|
|
|
| |
Income from investment operations | | | | | | | | | | | | | | | | |
Net investment loss | | | (0.02 | )1 | | (0.05 | )1 | | (0.06 | )1 | | (0.05 | )1 | | (0.07 | )1 |
Net realized and unrealized gains or losses on investments | | | (0.38 | ) | | (1.66 | ) | | 1.36 | | | 0.12 | | | 0.78 | |
| |
|
|
|
|
|
|
|
|
|
|
|
|
|
| |
Total from investment operations | | | (0.40 | ) | | (1.71 | ) | | 1.30 | | | 0.07 | | | 0.71 | |
|
|
|
|
|
|
|
|
|
|
|
|
|
|
|
| |
Distributions to shareholders from | | | | | | | | | | | | | | | | |
Net investment income | | | 0 | | | (0.04 | ) | | 0 | | | 0 | | | 0 | |
Net realized gains | | | (0.03 | ) | | (0.17 | ) | | 0 | | | 0 | | | 0 | |
| |
|
|
|
|
|
|
|
|
|
|
|
|
|
| |
Total distributions to shareholders | | | (0.03 | ) | | (0.21 | ) | | 0 | | | 0 | | | 0 | |
|
|
|
|
|
|
|
|
|
|
|
|
|
|
|
| |
Net asset value, end of period | | $ | 4.10 | | $ | 4.53 | | $ | 6.45 | | $ | 5.15 | | $ | 5.08 | |
|
|
|
|
|
|
|
|
|
|
|
|
|
|
|
| |
Total return2 | | | (8.68 | )% | | (27.26 | )% | | 25.24 | % | | 1.38 | % | | 16.25 | % |
|
|
|
|
|
|
|
|
|
|
|
|
|
|
|
| |
Ratios and supplemental data | | | | | | | | | | | | | | | | |
Net assets, end of period (millions) | | $ | 5 | | $ | 5 | | $ | 7 | | $ | 6 | | $ | 7 | |
Ratios to average net assets | | | | | | | | | | | | | | | | |
Expenses including waivers/reimbursements but excluding expense reductions | | | 1.84 | % | | 1.68 | % | | 1.78 | % | | 1.79 | % | | 1.83 | % |
Expenses excluding waivers/reimbursements and expense reductions | | | 1.94 | % | | 1.78 | % | | 1.78 | % | | 1.79 | % | | 1.83 | % |
Net investment loss | | | (0.72 | )% | | (0.89 | )% | | (1.09 | )% | | (1.04 | )% | | (1.38 | )% |
Portfolio turnover rate | | | 41 | % | | 114 | % | | 89 | % | | 110 | % | | 141 | % |
|
|
|
|
|
|
|
|
|
|
|
|
|
|
|
| |
1 | Per share amount is based on average shares outstanding during the period. |
2 | Excluding applicable sales charges |
See Notes to Financial Statements
13
FINANCIAL HIGHLIGHTS
(For a share outstanding throughout each period)
| | Year Ended September 30, | |
| |
| |
CLASS I | | 2009 | | 2008 | | 2007 | | 2006 | | 2005 | |
|
|
|
|
|
|
|
|
|
|
| |
Net asset value, beginning of period | | $ | 5.10 | | $ | 7.24 | | $ | 5.72 | | $ | 5.59 | | $ | 4.76 | |
|
|
|
|
|
|
|
|
|
|
|
|
|
|
|
| |
Income from investment operations | | | | | | | | | | | | | | | | |
Net investment income (loss) | | | 0.07 | | | 0.01 | 1 | | 0 | 1 | | (0.01 | ) | | (0.02 | ) |
Net realized and unrealized gains or losses on investments | | | (0.50 | ) | | (1.87 | ) | | 1.52 | | | 0.14 | | | 0.85 | |
| |
|
|
|
|
|
|
|
|
|
|
|
|
|
| |
Total from investment operations | | | (0.43 | ) | | (1.86 | ) | | 1.52 | | | 0.13 | | | 0.83 | |
|
|
|
|
|
|
|
|
|
|
|
|
|
|
|
| |
Distributions to shareholders from | | | | | | | | | | | | | | | | |
Net investment income | | | (0.07 | ) | | (0.11 | ) | | 0 | | | 0 | | | 0 | |
Net realized gains | | | (0.03 | ) | | (0.17 | ) | | 0 | | | 0 | | | 0 | |
| |
|
|
|
|
|
|
|
|
|
|
|
|
|
| |
Total distributions to shareholders | | | (0.10 | ) | | (0.28 | ) | | 0 | | | 0 | | | 0 | |
|
|
|
|
|
|
|
|
|
|
|
|
|
|
|
| |
Net asset value, end of period | | $ | 4.57 | | $ | 5.10 | | $ | 7.24 | | $ | 5.72 | | $ | 5.59 | |
|
|
|
|
|
|
|
|
|
|
|
|
|
|
|
| |
Total return | | | (7.92 | )% | | (26.62 | )% | | 26.57 | % | | 2.33 | % | | 17.44 | % |
|
|
|
|
|
|
|
|
|
|
|
|
|
|
|
| |
Ratios and supplemental data | | | | | | | | | | | | | | | | |
Net assets, end of period (millions) | | $ | 26 | | $ | 77 | | $ | 94 | | $ | 114 | | $ | 86 | |
Ratios to average net assets | | | | | | | | | | | | | | | | |
Expenses including waivers/reimbursements but excluding expense reductions | | | 0.82 | % | | 0.69 | % | | 0.78 | % | | 0.79 | % | | 0.83 | % |
Expenses excluding waivers/reimbursements and expense reductions | | | 0.92 | % | | 0.79 | % | | 0.78 | % | | 0.79 | % | | 0.83 | % |
Net investment income (loss) | | | 0.33 | % | | 0.10 | % | | (0.08 | )% | | (0.03 | )% | | (0.38 | )% |
Portfolio turnover rate | | | 41 | % | | 114 | % | | 89 | % | | 110 | % | | 141 | % |
|
|
|
|
|
|
|
|
|
|
|
|
|
|
|
| |
1 | Per share amount is based on average shares outstanding during the period. |
See Notes to Financial Statements
14
SCHEDULE OF INVESTMENTS
September 30, 2009
| | | Shares | | | Value | |
|
|
|
|
|
|
|
|
COMMON STOCKS 97.6% | | | | | | | |
CONSUMER DISCRETIONARY 15.8% | | | | | | | |
Diversified Consumer Services 2.5% | | | | | | | |
ITT Educational Services, Inc. * | | | 23,400 | | $ | 2,583,594 | |
Strayer Education, Inc. ρ | | | 25,900 | | | 5,637,912 | |
| | | | |
|
| |
| | | | | | 8,221,506 | |
| | | | |
|
| |
Hotels, Restaurants & Leisure 1.7% | | | | | | | |
WMS Industries, Inc. * | | | 126,500 | | | 5,636,840 | |
| | | | |
|
| |
Internet & Catalog Retail 2.9% | | | | | | | |
Liberty Media Holding Corp. – Interactive, Ser. A * | | | 290,200 | | | 3,183,494 | |
priceline.com, Inc. * | | | 39,200 | | | 6,500,144 | |
| | | | |
|
| |
| | | | | | 9,683,638 | |
| | | | |
|
| |
Media 2.0% | | | | | | | |
Marvel Entertainment, Inc. * | | | 137,700 | | | 6,832,674 | |
| | | | |
|
| |
Specialty Retail 4.4% | | | | | | | |
Aeropostale, Inc. * | | | 96,800 | | | 4,207,896 | |
AutoZone, Inc. * | | | 23,600 | | | 3,450,792 | |
PetSmart, Inc. | | | 143,000 | | | 3,110,250 | |
Ross Stores, Inc. | | | 79,500 | | | 3,797,715 | |
| | | | |
|
| |
| | | | | | 14,566,653 | |
| | | | |
|
| |
Textiles, Apparel & Luxury Goods 2.3% | | | | | | | |
Coach, Inc. | | | 160,722 | | | 5,290,968 | |
Deckers Outdoor Corp. * | | | 28,400 | | | 2,409,740 | |
| | | | |
|
| |
| | | | | | 7,700,708 | |
| | | | |
|
| |
CONSUMER STAPLES 5.9% | | | | | | | |
Food & Staples Retailing 1.3% | | | | | | | |
Sysco Corp. | | | 176,300 | | | 4,381,055 | |
| | | | |
|
| |
Food Products 2.6% | | | | | | | |
Del Monte Foods Co. | | | 393,700 | | | 4,559,046 | |
Hershey Co. | | | 107,000 | | | 4,158,020 | |
| | | | |
|
| |
| | | | | | 8,717,066 | |
| | | | |
|
| |
Household Products 2.0% | | | | | | | |
Church & Dwight Co. | | | 73,100 | | | 4,147,694 | |
Energizer Holdings, Inc. * | | | 34,100 | | | 2,262,194 | |
| | | | |
|
| |
| | | | | | 6,409,888 | |
| | | | |
|
| |
ENERGY 6.6% | | | | | | | |
Energy Equipment & Services 5.8% | | | | | | | |
Cameron International Corp. * | | | 195,200 | | | 7,382,464 | |
Diamond Offshore Drilling, Inc. ρ | | | 42,700 | | | 4,078,704 | |
National Oilwell Varco, Inc. * | | | 79,900 | | | 3,446,087 | |
Oceaneering International, Inc. * | | | 78,000 | | | 4,426,500 | |
| | | | |
|
| |
| | | | | | 19,333,755 | |
| | | | |
|
| |
See Notes to Financial Statements
15
SCHEDULE OF INVESTMENTS continued
September 30, 2009
| | | Shares | | | Value | |
|
|
|
|
|
|
| |
COMMON STOCKS continued | | | | | | | |
ENERGY continued | | | | | | | |
Oil, Gas & Consumable Fuels 0.8% | | | | | | | |
Alpha Natural Resources, Inc. * | | | 78,264 | | $ | 2,747,066 | |
| | | | |
|
| |
FINANCIALS 6.1% | | | | | | | |
Capital Markets 2.1% | | | | | | | |
BlackRock, Inc. | | | 17,600 | | | 3,816,032 | |
Northern Trust Corp. | | | 51,400 | | | 2,989,424 | |
| | | | |
|
| |
| | | | | | 6,805,456 | |
| | | | |
|
| |
Insurance 2.4% | | | | | | | |
Axis Capital Holdings, Ltd. | | | 93,700 | | | 2,827,866 | |
Torchmark Corp. | | | 51,100 | | | 2,219,273 | |
Unum Group | | | 132,500 | | | 2,840,800 | |
| | | | |
|
| |
| | | | | | 7,887,939 | |
| | | | |
|
| |
Real Estate Investment Trusts (REITs) 1.6% | | | | | | | |
Plum Creek Timber Co., Inc. ρ | | | 63,500 | | | 1,945,640 | |
Taubman Centers, Inc. ρ | | | 96,400 | | | 3,478,112 | |
| | | | |
|
| |
| | | | | | 5,423,752 | |
| | | | |
|
| |
HEALTH CARE 11.6% | | | | | | | |
Biotechnology 2.0% | | | | | | | |
Alexion Pharmaceuticals, Inc. * | | | 74,200 | | | 3,304,868 | |
Cephalon, Inc. * | | | 58,500 | | | 3,407,040 | |
| | | | |
|
| |
| | | | | | 6,711,908 | |
| | | | |
|
| |
Health Care Equipment & Supplies 5.5% | | | | | | | |
Becton, Dickinson & Co. | | | 36,800 | | | 2,566,800 | |
C.R. Bard, Inc. | | | 40,700 | | | 3,199,427 | |
Edwards Lifesciences Corp. * | | | 45,300 | | | 3,166,923 | |
St. Jude Medical, Inc. * | | | 74,800 | | | 2,917,948 | |
STERIS Corp. | | | 61,600 | | | 1,875,720 | |
Varian Medical Systems, Inc. * | | | 107,800 | | | 4,541,614 | |
| | | | |
|
| |
| | | | | | 18,268,432 | |
| | | | |
|
| |
Health Care Providers & Services 2.2% | | | | | | | |
Express Scripts, Inc. * | | | 24,800 | | | 1,923,984 | |
Henry Schein, Inc. * | | | 42,100 | | | 2,311,711 | |
Medco Health Solutions, Inc. * | | | 59,900 | | | 3,313,069 | |
| | | | |
|
| |
| | | | | | 7,548,764 | |
| | | | |
|
| |
Pharmaceuticals 1.9% | | | | | | | |
Forest Laboratories, Inc. * | | | 79,500 | | | 2,340,480 | |
Watson Pharmaceuticals, Inc. * | | | 105,800 | | | 3,876,512 | |
| | | | |
|
| |
| | | | | | 6,216,992 | |
| | | | |
|
| |
See Notes to Financial Statements
16
SCHEDULE OF INVESTMENTS continued
September 30, 2009
| | | Shares | | | Value | |
|
|
|
|
|
|
| |
COMMON STOCKS continued | | | | | | | |
INDUSTRIALS 18.5% | | | | | | | |
Aerospace & Defense 4.7% | | | | | | | |
Alliant Techsystems, Inc. ρ * | | | 30,600 | | $ | 2,382,210 | |
Goodrich Corp. | | | 88,000 | | | 4,781,920 | |
ITT Corp. | | | 130,700 | | | 6,816,005 | |
Rockwell Collins Corp. | | | 36,800 | | | 1,869,440 | |
| | | | |
|
| |
| | | | | | 15,849,575 | |
| | | | |
|
| |
Construction & Engineering 1.3% | | | | | | | |
EMCOR Group, Inc. * | | | 103,400 | | | 2,618,088 | |
Granite Construction, Inc. ρ | | | 53,100 | | | 1,642,914 | |
| | | | |
|
| |
| | | | | | 4,261,002 | |
| | | | |
|
| |
Electrical Equipment 2.5% | | | | | | | |
Acuity Brands, Inc. ρ | | | 68,200 | | | 2,196,722 | |
Cooper Industries plc | | | 92,800 | | | 3,486,496 | |
GrafTech International, Ltd. * | | | 172,200 | | | 2,531,340 | |
| | | | |
|
| |
| | | | | | 8,214,558 | |
| | | | |
|
| |
Machinery 5.4% | | | | | | | |
Cummins, Inc. | | | 69,400 | | | 3,109,814 | |
Flowserve Corp. | | | 27,500 | | | 2,709,850 | |
Joy Global, Inc. | | | 80,300 | | | 3,929,882 | |
SPX Corp. | | | 27,000 | | | 1,654,290 | |
Valmont Industries, Inc. | | | 75,700 | | | 6,448,126 | |
| | | | |
|
| |
| | | | | | 17,851,962 | |
| | | | |
|
| |
Marine 1.0% | | | | | | | |
Kirby Corp. * | | | 94,700 | | | 3,486,854 | |
| | | | |
|
| |
Road & Rail 2.1% | | | | | | | |
Landstar System, Inc. | | | 87,600 | | | 3,334,056 | |
Norfolk Southern Corp. | | | 88,700 | | | 3,823,857 | |
| | | | |
|
| |
| | | | | | 7,157,913 | |
| | | | |
|
| |
Trading Companies & Distributors 1.5% | | | | | | | |
W.W. Grainger, Inc. ρ | | | 54,800 | | | 4,896,928 | |
| | | | |
|
| |
INFORMATION TECHNOLOGY 21.3% | | | | | | | |
Communications Equipment 4.6% | | | | | | | |
Adtran, Inc. | | | 198,800 | | | 4,880,540 | |
F5 Networks, Inc. * | | | 156,328 | | | 6,195,279 | |
NICE-Systems, Ltd., ADS * | | | 138,200 | | | 4,206,808 | |
| | | | |
|
| |
| | | | | | 15,282,627 | |
| | | | |
|
| |
Electronic Equipment, Instruments & Components 0.9% | | | | | | | |
Amphenol Corp., Class A | | | 77,100 | | | 2,905,128 | |
| | | | |
|
| |
Internet Software & Services 1.2% | | | | | | | |
SINA Corp. * | | | 106,700 | | | 4,050,332 | |
| | | | |
|
| |
See Notes to Financial Statements
17
SCHEDULE OF INVESTMENTS continued
September 30, 2009
| | | Shares | | | Value | |
|
|
|
|
|
|
| |
COMMON STOCKS continued | | | | | | | |
INFORMATION TECHNOLOGY continued | | | | | | | |
IT Services 8.4% | | | | | | | |
Accenture plc | | | 106,700 | | $ | 3,976,709 | |
Cognizant Technology Solutions Corp., Class A * | | | 193,300 | | | 7,472,978 | |
Fiserv, Inc. * | | | 67,400 | | | 3,248,680 | |
Global Payments, Inc. | | | 121,600 | | | 5,678,720 | |
NeuStar, Inc., Class A * | | | 125,300 | | | 2,831,780 | |
SAIC, Inc. * | | | 167,200 | | | 2,932,688 | |
Western Union Co. | | | 93,600 | | | 1,770,912 | |
| | | | |
|
| |
| | | | | | 27,912,467 | |
| | | | |
|
| |
Semiconductors & Semiconductor Equipment 4.8% | | | | | | | |
Altera Corp. | | | 188,900 | | | 3,874,339 | |
Broadcom Corp., Class A * | | | 204,400 | | | 6,273,036 | |
Marvell Technology Group, Ltd. * | | | 359,300 | | | 5,817,067 | |
| | | | |
|
| |
| | | | | | 15,964,442 | |
| | | | |
|
| |
Software 1.4% | | | | | | | |
Adobe Systems, Inc. * | | | 75,100 | | | 2,481,304 | |
McAfee, Inc. * | | | 53,200 | | | 2,329,628 | |
| | | | |
|
| |
| | | | | | 4,810,932 | |
| | | | |
|
| |
MATERIALS 5.8% | | | | | | | |
Chemicals 4.0% | | | | | | | |
Agrium, Inc. ρ | | | 88,400 | | | 4,401,436 | |
Airgas, Inc. | | | 90,500 | | | 4,377,485 | |
CF Industries Holdings, Inc. | | | 53,000 | | | 4,570,190 | |
| | | | |
|
| |
| | | | | | 13,349,111 | |
| | | | |
|
| |
Metals & Mining 1.8% | | | | | | | |
Steel Dynamics, Inc. | | | 109,400 | | | 1,678,196 | |
Walter Energy, Inc. | | | 69,300 | | | 4,162,158 | |
| | | | |
|
| |
| | | | | | 5,840,354 | |
| | | | |
|
| |
TELECOMMUNICATION SERVICES 2.7% | | | | | | | |
Diversified Telecommunication Services 0.5% | | | | | | | |
Qwest Communications International, Inc. ρ | | | 484,200 | | | 1,844,802 | |
| | | | |
|
| |
Wireless Telecommunication Services 2.2% | | | | | | | |
American Tower Corp., Class A * | | | 122,400 | | | 4,455,360 | |
Syniverse Holdings, Inc. * | | | 158,500 | | | 2,773,750 | |
| | | | |
|
| |
| | | | | | 7,229,110 | |
| | | | |
|
| |
UTILITIES 3.3% | | | | | | | |
Electric Utilities 2.2% | | | | | | | |
CMS Energy Corp. | | | 167,000 | | | 2,237,800 | |
Entergy Corp. | | | 20,000 | | | 1,597,200 | |
NRG Energy, Inc. * | | | 124,500 | | | 3,509,655 | |
| | | | |
|
| |
| | | | | | 7,344,655 | |
| | | | |
|
| |
See Notes to Financial Statements
18
SCHEDULE OF INVESTMENTS continued
September 30, 2009
| | | Shares | | | Value | |
|
|
|
|
|
|
| |
COMMON STOCKS continued | | | | | | | |
UTILITIES continued | | | | | | | |
Independent Power Producers & Energy Traders 1.1% | | | | | | | |
AES Corp. * | | | 245,600 | | $ | 3,639,792 | |
| | | | |
|
| |
Total Common Stocks (cost $316,346,896) | | | | | | 324,986,636 | |
| | | | |
|
| |
SHORT-TERM INVESTMENTS 7.5% | | | | | | | |
MUTUAL FUND SHARES 7.5% | | | | | | | |
BGI Prime Money Market Fund, Premium Shares, 0.19% q ρρ | | | 1,291 | | | 1,291 | |
BlackRock Liquidity TempFund, Institutional Class, 0.22% q ρρ | | | 3,811,459 | | | 3,811,459 | |
Evergreen Institutional Money Market Fund, Class I, 0.13% q ø ρρ | | | 20,502,229 | | | 20,502,229 | |
Morgan Stanley Institutional Liquidity Fund Money Market Portfolio, Institutional Class, 0.16% q ρρ | | | 568,658 | | | 568,658 | |
| | | | |
|
| |
Total Short-Term Investments (cost $24,883,637) | | | | | | 24,883,637 | |
| | | | |
|
| |
Total Investments (cost $341,230,533) 105.1% | | | | | | 349,870,273 | |
Other Assets and Liabilities (5.1%) | | | | | | (16,880,952 | ) |
| | | | |
|
| |
Net Assets 100.0% | | | | | $ | 332,989,321 | |
| | | | |
|
| |
* | Non-income producing security |
ρ | All or a portion of this security is on loan. |
q | Rate shown is the 7-day annualized yield at period end. |
ρρ | All or a portion of this security represents investment of cash collateral received from securities on loan. |
ø | Evergreen Investment Management Company, LLC is the investment advisor to both the Fund and the money market fund. |
Summary of Abbreviations |
ADS | American Depository Shares |
The following table shows the percent of total long-term investments by sector as of September 30, 2009:
Information Technology | | 21.8 | % |
Industrials | | 19.0 | % |
Consumer Discretionary | | 16.2 | % |
Health Care | | 11.9 | % |
Energy | | 6.8 | % |
Financials | | 6.2 | % |
Consumer Staples | | 6.0 | % |
Materials | | 5.9 | % |
Utilities | | 3.4 | % |
Telecommunication Services | | 2.8 | % |
| |
| |
| | 100.0 | % |
| |
| |
See Notes to Financial Statements
19
STATEMENT OF ASSETS AND LIABILITIES
September 30, 2009
Assets | | | | |
Investments in unaffiliated issuers, at value (cost $320,728,304) including $15,646,818 of securities loaned | | $ | 329,368,044 | |
Investments in affiliated issuers, at value (cost $20,502,229) | | | 20,502,229 | |
|
|
|
| |
Total investments | | | 349,870,273 | |
Segregated cash | | | 3,343 | |
Receivable for Fund shares sold | | | 157,084 | |
Dividends receivable | | | 155,071 | |
Receivable for securities lending income | | | 629 | |
Prepaid expenses and other assets | | | 68,795 | |
|
|
|
| |
Total assets | | | 350,255,195 | |
|
|
|
| |
Liabilities | | | | |
Payable for Fund shares redeemed | | | 281,636 | |
Payable for securities on loan | | | 16,892,372 | |
Advisory fee payable | | | 4,660 | |
Distribution Plan expenses payable | | | 2,350 | |
Due to other related parties | | | 2,803 | |
Trustees’ fees and expenses payable | | | 37,937 | |
Printing and postage expenses payable | | | 32,811 | |
Accrued expenses and other liabilities | | | 11,305 | |
|
|
|
| |
Total liabilities | | | 17,265,874 | |
|
|
|
| |
Net assets | | $ | 332,989,321 | |
|
|
|
| |
Net assets represented by | | | | |
Paid-in capital | | $ | 421,194,696 | |
Undistributed net investment income | | | 8,869 | |
Accumulated net realized losses on investments | | | (96,853,984 | ) |
Net unrealized gains on investments | | | 8,639,740 | |
|
|
|
| |
Total net assets | | $ | 332,989,321 | |
|
|
|
| |
Net assets consists of | | | | |
Class A | | $ | 295,679,785 | |
Class B | | | 7,124,202 | |
Class C | | | 4,571,282 | |
Class I | | | 25,614,052 | |
|
|
|
| |
Total net assets | | $ | 332,989,321 | |
|
|
|
| |
Shares outstanding (unlimited number of shares authorized) | | | | |
Class A | | | 66,618,282 | |
Class B | | | 1,736,971 | |
Class C | | | 1,115,673 | |
Class I | | | 5,601,863 | |
|
|
|
| |
Net asset value per share | | | | |
Class A | | $ | 4.44 | |
Class A — Offering price (based on sales charge of 5.75%) | | $ | 4.71 | |
Class B | | $ | 4.10 | |
Class C | | $ | 4.10 | |
Class I | | $ | 4.57 | |
|
|
|
| |
See Notes to Financial Statements
20
STATEMENT OF OPERATIONS
Year Ended September 30, 2009
Investment income | | | | |
Dividends | | $ | 2,941,106 | |
Securities lending | | | 406,597 | |
Income from affiliated issuers | | | 57,964 | |
|
|
|
| |
Total investment income | | | 3,405,667 | |
|
|
|
| |
Expenses | | | | |
Advisory fee | | | 1,527,803 | |
Distribution Plan expenses | | | | |
Class A | | | 641,776 | |
Class B | | | 71,901 | |
Class C | | | 34,664 | |
Administrative services fee | | | 299,569 | |
Transfer agent fees | | | 625,028 | |
Trustees’ fees and expenses | | | 6,617 | |
Printing and postage expenses | | | 111,286 | |
Custodian and accounting fees | | | 75,322 | |
Registration and filing fees | | | 50,750 | |
Professional fees | | | 96,981 | |
Other | | | 10,963 | |
|
|
|
| |
Total expenses | | | 3,552,660 | |
Less: Expense reductions | | | (371 | ) |
Fee waivers | | | (305,252 | ) |
|
|
|
| |
Net expenses | | | 3,247,037 | |
|
|
|
| |
Net investment income | | | 158,630 | |
|
|
|
| |
Net realized and unrealized gains or losses on investments | | | | |
Net realized losses on securities in unaffiliated issuers | | | (94,052,748 | ) |
Net change in unrealized gains or losses on securities in unaffiliated issuers | | | 47,621,759 | |
|
|
|
| |
Net realized and unrealized gains or losses on investments | | | (46,430,989 | ) |
|
|
|
| |
Net decrease in net assets resulting from operations | | $ | (46,272,359 | ) |
|
|
|
| |
See Notes to Financial Statements
21
STATEMENTS OF CHANGES IN NET ASSETS
| | Year Ended September 30, | |
| |
| |
| | 2009 | | 2008 | |
|
|
|
|
| |
Operations | | | | | | | | | | | |
Net investment income (loss) | | | | $ | 158,630 | | | | $ | (725,712 | ) |
Net realized gains or losses on investments | | | | | (94,052,748 | ) | | | | 15,088,379 | |
Net change in unrealized gains or losses on investments | | | | | 47,621,759 | | | | | (193,236,042 | ) |
|
|
|
|
|
|
|
|
|
|
| |
Net decrease in net assets resulting from operations | | | | | (46,272,359 | ) | | | | (178,873,375 | ) |
|
|
|
|
|
|
|
|
|
|
| |
Distributions to shareholders from | | | | | | | | | | | |
Net investment income | | | | | | | | | | | |
Class A | | | | | (3,594,908 | ) | | | | (6,489,910 | ) |
Class B | | | | | 0 | | | | | (88,869 | ) |
Class C | | | | | 0 | | | | | (49,653 | ) |
Class I | | | | | (534,242 | ) | | | | (2,470,873 | ) |
Net realized gains | | | | | | | | | | | |
Class A | | | | | (1,954,848 | ) | | | | (13,134,151 | ) |
Class B | | | | | (64,846 | ) | | | | (537,941 | ) |
Class C | | | | | (27,093 | ) | | | | (203,157 | ) |
Class I | | | | | (216,273 | ) | | | | (3,449,860 | ) |
|
|
|
|
|
|
|
|
|
|
| |
Total distributions to shareholders | | | | | (6,392,210 | ) | | | | (26,424,414 | ) |
|
|
|
|
|
|
|
|
|
|
| |
| | Shares | | | | | Shares | | | | |
|
|
|
|
|
|
|
|
|
|
| |
Capital share transactions | | | | | | | | | | | |
Proceeds from shares sold | | | | | | | | | | | |
Class A | | 801,271 | | | 2,879,591 | | 1,026,034 | | | 6,439,997 | |
Class B | | 197,880 | | | 664,764 | | 194,763 | | | 1,110,981 | |
Class C | | 418,766 | | | 1,452,776 | | 260,755 | | | 1,497,699 | |
Class I | | 3,323,311 | | | 12,828,163 | | 19,869,125 | | | 136,130,866 | |
|
|
|
|
|
|
|
|
|
|
| |
| | | | | 17,825,294 | | | | | 145,179,543 | |
|
|
|
|
|
|
|
|
|
|
| |
Net asset value of shares issued in reinvestment of distributions | | | | | | | | | | | |
Class A | | 1,356,780 | | | 4,672,373 | | 2,516,161 | | | 16,535,807 | |
Class B | | 19,649 | | | 60,911 | | 96,125 | | | 577,923 | |
Class C | | 7,261 | | | 22,509 | | 34,539 | | | 207,886 | |
Class I | | 74,993 | | | 266,504 | | 326,722 | | | 2,220,518 | |
|
|
|
|
|
|
|
|
|
|
| |
| | | | | 5,022,297 | | | | | 19,542,134 | |
|
|
|
|
|
|
|
|
|
|
| |
Automatic conversion of Class B shares to Class A shares | | | | | | | | | | | |
Class A | | 393,184 | | | 1,467,400 | | 394,919 | | | 2,428,976 | |
Class B | | (424,750 | ) | | (1,467,400 | ) | (429,067 | ) | | (2,428,976 | ) |
|
|
|
|
|
|
|
|
|
|
| |
| | | | | 0 | | | | | 0 | |
|
|
|
|
|
|
|
|
|
|
| |
Payment for shares redeemed | | | | | | | | | | | |
Class A | | (7,579,616 | ) | | (27,830,607 | ) | (9,374,076 | ) | | (58,330,604 | ) |
Class B | | (553,316 | ) | | (1,877,336 | ) | (612,675 | ) | | (3,499,431 | ) |
Class C | | (341,415 | ) | | (1,151,128 | ) | (423,081 | ) | | (2,318,535 | ) |
Class I | | (12,908,978 | ) | | (52,979,146 | ) | (18,052,205 | ) | | (111,361,997 | ) |
|
|
|
|
|
|
|
|
|
|
| |
| | | | | (83,838,217 | ) | | | | (175,510,567 | ) |
|
|
|
|
|
|
|
|
|
|
| |
Net decrease in net assets resulting from capital share transactions | | | | | (60,990,626 | ) | | | | (10,788,890 | ) |
|
|
|
|
|
|
|
|
|
|
| |
Total decrease in net assets | | | | | (113,655,195 | ) | | | | (216,086,679 | ) |
Net assets | | | | | | | | | | | |
Beginning of period | | | | | 446,644,516 | | | | | 662,731,195 | |
|
|
|
|
|
|
|
|
|
|
| |
End of period | | | | $ | 332,989,321 | | | | $ | 446,644,516 | |
|
|
|
|
|
|
|
|
|
|
| |
Undistributed net investment income | | | | $ | 8,869 | | | | $ | 4,084,698 | |
|
|
|
|
|
|
|
|
|
|
| |
See Notes to Financial Statements
22
NOTES TO FINANCIAL STATEMENTS
1. ORGANIZATION
Evergreen Mid Cap Growth Fund (the “Fund”) is a diversified series of Evergreen Equity Trust (the “Trust”), a Delaware statutory trust organized on September 18, 1997. The Trust is an open-end management investment company registered under the Investment Company Act of 1940, as amended (the “1940 Act”).
The Fund offers Class A, Class B, Class C and Class I shares. Class A shares are sold with a front-end sales charge. However, Class A share investments of $1 million or more are not subject to a front-end sales charge, but are subject to a contingent deferred sales charge of 1.00% upon redemption within 18 months. Effective after the close of business on June 30, 2009, Class B shares were closed to new accounts and additional purchases by existing shareholders. Class B shares are available for purchase only through (i) an exchange transaction in which Class B shares of another Evergreen fund are exchanged or (ii) the Fund’s dividend reinvestment program. Class B shares are sold without a front-end sales charge, but are subject to a contingent deferred sales charge that is payable upon redemption and decreases depending on how long the shares have been held. Class C shares are sold without a front-end sales charge, but are subject to a contingent deferred sales charge that is payable upon redemption within one year. Class I shares are sold without a front-end sales charge or contingent deferred sales charge. Each class of shares, except Class I shares, pays an ongoing distribution fee.
2. SIGNIFICANT ACCOUNTING POLICIES
The following is a summary of significant accounting policies consistently followed by the Fund in the preparation of its financial statements. The policies are in conformity with generally accepted accounting principles in the United States of America, which require management to make estimates and assumptions that affect amounts reported herein. Actual results could differ from these estimates. Management has considered the circumstances under which the Fund should recognize or make disclosures regarding events or transactions occurring subsequent to the balance sheet date through November 24, 2009 which represents the date the financial statements are issued. Adjustments or additional disclosures, if any, have been included in these financial statements.
a. Valuation of investments
Listed equity securities are usually valued at the last sales price or official closing price on the national securities exchange where the securities are principally traded. If there has been no sale, the securities are valued at the mean between bid and asked prices.
Portfolio debt securities acquired with more than 60 days to maturity are fair valued using matrix pricing methods determined by an independent pricing service which takes into consideration such factors as similar security prices, yields, maturities, liquidity and ratings. Securities for which valuations are not readily available from an independent pricing service may be valued by brokers which use prices provided by market makers or estimates of fair
23
NOTES TO FINANCIAL STATEMENTS continued
market value obtained from yield data relating to investments or securities with similar characteristics.
Short-term securities of sufficient credit quality with remaining maturities of 60 days or less at the time of purchase are valued at amortized cost, which approximates fair value.
Investments in open-end mutual funds are valued at net asset value. Securities for which market quotations are not readily available or not reflective of current fair value are valued at fair value as determined by the investment advisor in good faith, according to procedures approved by the Board of Trustees.
The valuation techniques used by the Fund to measure fair value are consistent with the market approach, income approach and/or cost approach, where applicable, for each security type.
b. Repurchase agreements
Securities pledged as collateral for repurchase agreements are held by the custodian bank or in a segregated account in the Fund’s name until the agreements mature. Collateral for certain tri-party repurchase agreements is held at the counterparty’s custodian in a segregated account for the benefit of the Fund and the counterparty. Each agreement requires that the market value of the collateral be sufficient to cover payments of interest and principal. However, in the event of default or bankruptcy by the other party to the agreement, retention of the collateral may be subject to legal proceedings. The Fund will only enter into repurchase agreements with banks and other financial institutions, which are deemed by the investment advisor to be creditworthy pursuant to guidelines established by the Board of Trustees. In certain instances, the Fund’s securities lending agent may provide collateral in the form of repurchase agreements.
c. Securities lending
The Fund may lend its securities to certain qualified brokers in order to earn additional income. The Fund receives compensation in the form of fees or interest earned on the investment of any cash collateral received. The Fund also continues to receive interest and dividends on the securities loaned. The Fund receives collateral in the form of cash or securities with a market value at least equal to the market value of the securities on loan. In the event of default or bankruptcy by the borrower, the Fund could experience delays and costs in recovering the loaned securities or in gaining access to the collateral. In addition, the investment of any cash collateral received may lose all or part of its value. The Fund has the right under the lending agreement to recover the securities from the borrower on demand.
d. Security transactions and investment income
Security transactions are recorded on trade date. Realized gains and losses are computed using the specific cost of the security sold. Dividend income is recorded on the ex-dividend date.
24
NOTES TO FINANCIAL STATEMENTS continued
e. Federal and other taxes
The Fund intends to continue to qualify as a regulated investment company and distribute all of its taxable income, including any net capital gains (which have already been offset by available capital loss carryovers). Accordingly, no provision for federal taxes is required. The Fund’s income and excise tax returns and all financial records supporting those returns for the prior three fiscal years are subject to examination by the federal, Massachusetts and Delaware revenue authorities.
f. Distributions
Distributions to shareholders from net investment income and net realized gains, if any, are recorded on the ex-dividend date. Such distributions are determined in conformity with income tax regulations, which may differ from generally accepted accounting principles.
Reclassifications have been made to the Fund’s components of net assets to reflect income and gains available for distribution (or available capital loss carryovers, as applicable) under income tax regulations. During the year ended September 30, 2009, the following amounts were reclassified:
|
|
|
| |
Undistributed net investment income | | $ | (105,309 | ) |
Accumulated net realized losses on investments | | | 105,309 | |
|
|
|
| |
g. Class allocations
Income, common expenses and realized and unrealized gains and losses are allocated to the classes based on the relative net assets of each class. Distribution fees, if any, are calculated daily at the class level based on the appropriate net assets of each class and the specific expense rates applicable to each class.
3. ADVISORY FEE AND OTHER TRANSACTIONS WITH AFFILIATES
Evergreen Investment Management Company, LLC (“EIMC”), a subsidiary of Wells Fargo & Company (“Wells Fargo”), is the investment advisor to the Fund and is paid an annual fee starting at 0.51% and declining to 0.26% as average daily net assets increase. For the year ended September 30, 2009, the advisory fee was equivalent to an annual rate of 0.51% of the Fund’s average daily net assets.
On October 3, 2008, Wells Fargo and Wachovia Corporation (“Wachovia”) announced that Wells Fargo agreed to acquire Wachovia in a whole company transaction that would include all of Wachovia’s banking and other businesses. In connection with this transaction, Wachovia issued preferred shares to Wells Fargo representing approximately a 40% voting interest in Wachovia. Due to its ownership of preferred shares, Wells Fargo may have been deemed to control EIMC. If Wells Fargo was deemed to control EIMC, then the existing advisory agreement between the Fund and EIMC would have terminated automatically in connection with the issuance of preferred shares. To address this possibility, on October 20, 2008 the Board of Trustees approved an interim advisory agreement with EIMC with the same terms and conditions as the existing agreement which
25
NOTES TO FINANCIAL STATEMENTS continued
became effective upon the issuance of the preferred shares. EIMC’s receipt of the advisory fees under the interim advisory agreement was subject to the approval by shareholders of the Fund of a new advisory agreement with EIMC.
On December 31, 2008, Wachovia merged with and into Wells Fargo and as a result of the merger, EIMC, Evergreen Investment Services, Inc. (“EIS”) and Evergreen Service Company, LLC (“ESC”) became subsidiaries of Wells Fargo. After the merger, a new interim advisory agreement with the same terms and conditions between the Fund and EIMC went into effect.
Shareholders approved the new advisory agreement between the Fund and EIMC on February 12, 2009.
From time to time, EIMC may voluntarily or contractually waive its fee and/or reimburse expenses in order to limit operating expenses. During the year ended September 30, 2009, EIMC voluntarily waived its advisory fee in the amount of $305,252.
The Fund may invest in money market funds which are advised by EIMC. Income earned on these investments is included in income from affiliated issuers on the Statement of Operations.
EIMC also serves as the administrator to the Fund providing the Fund with facilities, equipment and personnel. EIMC is paid an annual rate determined by applying percentage rates to the aggregate average daily net assets of the Evergreen funds (excluding money market funds) starting at 0.10% and declining to 0.05% as the aggregate average daily net assets of the Evergreen funds (excluding money market funds) increase. For the year ended September 30, 2009, the administrative services fee was equivalent to an annual rate of 0.10% of the Fund’s average daily net assets.
ESC, an affiliate of EIMC and a subsidiary of Wells Fargo, is the transfer and dividend disbursing agent for the Fund. ESC receives account fees that vary based on the type of account held by the shareholders in the Fund. For the year ended September 30, 2009, the transfer agent fees were equivalent to an annual rate of 0.21% of the Fund’s average daily net assets.
Wachovia Bank NA, a subsidiary of Wells Fargo and an affiliate of EIMC, through its securities lending division, Wachovia Global Securities Lending, acts as the securities lending agent for the Fund (see Note 5).
The Fund has placed a portion of its portfolio transactions with brokerage firms that are affiliates of Wells Fargo. During the year ended September 30, 2009, the Fund paid brokerage commissions of $23,583 to broker-dealers affiliated with Wells Fargo.
26
NOTES TO FINANCIAL STATEMENTS continued
4. DISTRIBUTION PLANS
EIS, an affiliate of EIMC and a subsidiary of Wells Fargo, serves as distributor of the Fund’s shares. The Fund has adopted Distribution Plans, as allowed by Rule 12b-1 of the 1940 Act, for each class of shares, except Class I. Under the Distribution Plans, the Fund is permitted to pay distribution fees at an annual rate of up to 0.75% of the average daily net assets for Class A shares and up to 1.00% of the average daily net assets for each of Class B and Class C shares. However, currently the distribution fees for Class A shares are limited to 0.25% of the average daily net assets of the class.
For the year ended September 30, 2009, EIS received $3,167 from the sale of Class A shares and $36, $16,029 and $91 in contingent deferred sales charges from redemptions of Class A, Class B and Class C shares, respectively.
5. INVESTMENT TRANSACTIONS
Cost of purchases and proceeds from sales of investment securities (excluding short-term securities) were $125,205,450 and $186,596,126, respectively, for the year ended September 30, 2009.
Fair value measurements are determined within a framework that has established a fair value hierarchy based upon the various data inputs utilized in determining the value of the Fund’s investments. These inputs are summarized into three broad levels as follows:
Level 1 – quoted prices in active markets for identical securities Level 2 – other significant observable inputs (including quoted prices for similar securities, interest rates, prepayment speeds, credit risk, etc.) Level 3 – significant unobservable inputs (including the Fund’s own assumptions in determining the fair value of investments) |
The inputs or methodologies used for valuing securities are not necessarily an indication of the risk associated with investing in those securities.
As of September 30, 2009, the inputs used in valuing the Fund’s assets, which are carried at fair value, were as follows:
Investments in Securities | | Quoted Prices
(Level 1) | | Significant
Other
Observable
Inputs
(Level 2) | | Significant
Unobservable
Inputs
(Level 3) | | Total |
|
|
|
|
|
|
|
|
| |
Equity securities | | | | | | | | | | | | | | | | |
Common stocks | | $ | 324,986,636 | | | $ | 0 | | | $ | 0 | | | $ | 324,986,636 | |
Short-term investments | | | 24,883,637 | | | | 0 | | | | 0 | | | | 24,883,637 | |
|
|
|
|
|
|
|
|
|
|
|
|
|
|
|
| |
| | $ | 349,870,273 | | | $ | 0 | | | $ | 0 | | | $ | 349,870,273 | |
|
|
|
|
|
|
|
|
|
|
|
|
|
|
|
| |
Further details on the major security types listed above can be found in the Schedule of Investments.
27
NOTES TO FINANCIAL STATEMENTS continued
During the year ended September 30, 2009, the Fund loaned securities to certain brokers and earned $406,597, net of $44,064 paid to Wachovia Global Securities Lending as the securities lending agent. At September 30, 2009, the value of securities on loan and the total value of collateral received for securities loaned (including segregated cash) amounted to $15,646,818 and $16,892,372, respectively.
On September 30, 2009, the aggregate cost of securities for federal income tax purposes was $341,723,231. The gross unrealized appreciation and depreciation on securities based on tax cost was $42,640,004 and $34,492,962, respectively, with a net unrealized appreciation of $8,147,042.
As of September 30, 2009, the Fund had $11,082,219 in capital loss carryovers for federal income tax purposes expiring in 2017.
For income tax purposes, capital losses incurred after October 31 within the Fund’s fiscal year are deemed to arise on the first business day of the following fiscal year. As of September 30, 2009, the Fund incurred and will elect to defer post-October losses of $85,279,067.
6. INTERFUND LENDING
Pursuant to an Exemptive Order issued by the SEC, the Fund may participate in an interfund lending program with certain funds in the Evergreen fund family. This program allows the Fund to borrow from, or lend money to, other participating funds. During the year ended September 30, 2009, the Fund did not participate in the interfund lending program.
7. DISTRIBUTIONS TO SHAREHOLDERS
As of September 30, 2009, the components of distributable earnings on a tax basis were as follows:
| | Capital Loss | |
Undistributed | | Carryovers and | Temporary |
Ordinary | Unrealized | Post-October | Book/Tax |
Income | Appreciation | Losses | Differences |
|
|
|
|
$49,264 | $8,147,042 | $96,361,286 | $(40,395) |
|
|
|
|
The differences between the components of distributable earnings on a tax basis and the amounts reflected in the Statement of Assets and Liabilities are primarily due to wash sales. The temporary book/tax differences are a result of timing differences between book and tax recognition of income and/or expenses.
The tax character of distributions paid was as follows:
| | Year Ended Septemeber 30, |
| |
|
| | | 2009 | | | 2008 |
|
|
|
|
|
|
|
Ordinary Income | | $ | 4,126,147 | | $ | 9,099,305 |
Long-term Capital Gain | | | 2,266,063 | | | 17,325,109 |
|
|
|
|
|
|
|
28
NOTES TO FINANCIAL STATEMENTS continued
8. EXPENSE REDUCTIONS
Through expense offset arrangements with ESC and the Fund’s custodian, a portion of fund expenses has been reduced.
9. DEFERRED TRUSTEES’ FEES
Each Trustee of the Fund may defer any or all compensation related to performance of his or her duties as a Trustee. The Trustees’ deferred balances are allocated to deferral accounts, which are included in the accrued expenses for the Fund. The investment performance of the deferral accounts is based on the investment performance of certain Evergreen funds. Any gains earned or losses incurred in the deferral accounts are reported in the Fund’s Trustees’ fees and expenses. At the election of the Trustees, the deferral account will be paid either in one lump sum or in quarterly installments for up to ten years.
10. FINANCING AGREEMENT
The Fund and certain other Evergreen funds share in a $100 million unsecured revolving credit commitment for temporary and emergency purposes, including the funding of redemptions, as permitted by each participating fund’s borrowing restrictions. Borrowings under this facility bear interest at the higher of the Federal Funds rate plus 1.25% or LIBOR plus 1.25%. Prior to June 26, 2009, the interest rate was 0.50% per annum above the Federal Funds rate. All of the participating funds are charged an annual commitment fee of 0.145% on the unused balance, which is allocated pro rata. Prior to June 26, 2009, the annual commitment fee was 0.09%. During the year ended September 30, 2009, the Fund had no borrowings.
11. REGULATORY MATTERS AND LEGAL PROCEEDINGS
The Evergreen funds, EIMC and certain of EIMC’s affiliates are involved in various legal actions, including private litigation and class action lawsuits, and are and may in the future be subject to regulatory inquiries and investigations.
EIMC and EIS have reached final settlements with the Securities and Exchange Commission (“SEC”) and the Securities Division of the Secretary of the Commonwealth of Massachusetts (“Commonwealth”) primarily relating to the liquidation of Evergreen Ultra Short Opportunities Fund (“Ultra Short Fund”). The claims settled include the following: first, that during the period February 2007 through Ultra Short Fund’s liquidation on June 18, 2008, Ultra Short Fund’s former portfolio management team failed to properly take into account readily-available information in valuing certain nonagency residential mortgage-backed securities held by the Ultra Short Fund, resulting in the Ultra Short Fund’s net asset value (“NAV”) being overstated during the period; second, that EIMC and EIS acted inappropriately when, in an effort to explain the decline in Ultra Short Fund’s NAV, certain information regarding the decline was communicated to some, but not all, shareholders and financial intermediaries; third, that the Ultra Short Fund portfolio management team did not adhere to regulatory requirements for affiliated cross
29
NOTES TO FINANCIAL STATEMENTS continued
trades in executing trades with other Evergreen funds; and finally, that from at least September 2007 to August 2008, EIS did not preserve certain text and instant messages transmitted via personal digital assistant devices. In settling these matters, EIMC and EIS have agreed to payments totaling $41,125,000, up to $40,125,000 of which will be distributed to eligible shareholders of Ultra Short Fund pursuant to a methodology and plan approved by the regulators. EIMC and EIS neither admitted nor denied the regulators’ conclusions.
Three purported class actions have also been filed in the U.S. District Court for the District of Massachusetts relating to the same events; defendants include various Evergreen entities, including EIMC and EIS, and Evergreen Fixed Income Trust and its Trustees. The cases generally allege that investors in the Ultra Short Fund suffered losses as a result of (i) misleading statements in Ultra Short Fund’s registration statement and prospectus, (ii) the failure to accurately price securities in the Ultra Short Fund at different points in time and (iii) the failure of the Ultra Short Fund’s risk disclosures and description of its investment strategy to inform investors adequately of the actual risks of the fund.
EIMC does not expect that any of the legal actions, inquiries or settlement of regulatory matters will have a material adverse impact on the financial position or operations of the Fund to which these financial statements relate. Any publicity surrounding or resulting from any legal actions or regulatory inquiries involving EIMC or its affiliates or any of the Evergreen Funds could result in reduced sales or increased redemptions of Evergreen fund shares, which could increase Evergreen fund transaction costs or operating expenses or have other adverse consequences on the Evergreen funds, including the Fund.
30
REPORT OF INDEPENDENT REGISTERED PUBLIC ACCOUNTING FIRM
Board of Trustees and Shareholders
Evergreen Equity Trust
We have audited the accompanying statement of assets and liabilities, including the schedule of investments, of the Evergreen Mid Cap Growth Fund, a series of the Evergreen Equity Trust, as of September 30, 2009 and the related statement of operations for the year then ended, statements of changes in net assets for each of the years in the two-year period then ended and the financial highlights for each of the years in the five-year period then ended. These financial statements and financial highlights are the responsibility of the Fund’s management. Our responsibility is to express an opinion on these financial statements and financial highlights based on our audits.
We conducted our audits in accordance with the standards of the Public Company Accounting Oversight Board (United States). Those standards require that we plan and perform the audit to obtain reasonable assurance about whether the financial statements and financial highlights are free of material misstatement. An audit includes examining, on a test basis, evidence supporting the amounts and disclosures in the financial statements. Our procedures included confirmation of securities owned as of September 30, 2009 by correspondence with the custodian and brokers. An audit also includes assessing the accounting principles used and significant estimates made by management, as well as evaluating the overall financial statement presentation. We believe that our audits provide a reasonable basis for our opinion.
In our opinion, the financial statements and financial highlights referred to above present fairly, in all material respects, the financial position of the Evergreen Mid Cap Growth Fund as of September 30, 2009, the results of its operations, changes in its net assets and financial highlights for each of the years described above, in conformity with U.S. generally accepted accounting principles.

Boston, Massachusetts
November 24, 2009
31
ADDITIONAL INFORMATION (unaudited)
FEDERAL TAX DISTRIBUTIONS
Pursuant to Section 852 of the Internal Revenue Code, the Fund has designated long-term capital gain distributions of $2,266,063 for the fiscal year ended September 30, 2009.
For corporate shareholders, 35.11% of ordinary income dividends paid during the fiscal year ended September 30, 2009 qualified for the dividends received deduction.
With respect to dividends paid from investment company taxable income during the fiscal year ended September 30, 2009, the Fund designates 64.27% of ordinary income and any short-term capital gain distributions as Qualified Dividend Income in accordance with the Internal Revenue Code. Complete 2009 year-end tax information will be reported on your 2009 Form 1099-DIV, which shall be provided to you in early 2010.
32
ADDITIONAL INFORMATION (unaudited) continued
INFORMATION ABOUT THE REVIEW AND APPROVAL OF THE FUND’S INVESTMENT ADVISORY AGREEMENT
Each year, as required by law, the Fund’s Board of Trustees determines whether to approve the continuation of the Fund’s investment advisory agreements. At an in person meeting on September 23-24, 2009, the Trustees, including a majority of the Trustees who are not “interested persons” (as that term is defined in the 1940 Act) of the Fund or EIMC (the “independent Trustees”), approved the continuation of the Fund’s investment advisory agreements. (References below to the “Fund” are to Evergreen Mid Cap Growth Fund; references to the “funds” are to the Evergreen funds generally.)
At the same time, the Trustees considered the continuation of the investment advisory agreements for all of the Evergreen funds. The description below refers in many cases to the Trustees’ process for considering, and conclusions regarding, all of the funds’ agreements. In all of their deliberations, the Board of Trustees and the independent Trustees were advised by independent counsel to the independent Trustees and counsel to the funds.
The review process. In connection with its review of the funds’ investment advisory agreements, the Board of Trustees requests and evaluates, and EIMC and any sub-advisors are required to furnish, such information as the Trustees consider to be reasonably necessary in the circumstances. Over the course of the year preceding their September 2009 meeting, the Trustees regularly reviewed information regarding the investment performance of all of the funds. As part of their ongoing review of investment performance, the Trustees monitored for changes in performance and for the results of any changes in a fund’s investment process or investment team. The Trustees paid particular attention to funds whose performance since September 2008 (when the Trustees completed their 2008 review of the funds’ investment advisory agreements) indicated short-term or longer-term performance issues and to funds that they had identified during their 2008 review process as having short- or longer-term performance issues.
In spring 2009, a committee of the Board of Trustees (the “Committee”), working with EIMC management, determined generally the types of information the Trustees would review as part of the 2009 review process and set a timeline detailing the information required and the dates for its delivery to the Trustees. The Board engaged the independent data provider Keil Fiduciary Strategies LLC (“Keil”) to provide fund-specific and industry-wide data containing information of a nature and in a format generally prescribed by the Committee, and the Committee worked with Keil and EIMC to develop appropriate groups of peer funds for each fund. The Committee also identified a number of expense, performance, and other areas of review and requested specific information as to those areas of review.
The Trustees formed small groups to review individual funds in greater detail. They reviewed, with the assistance of an independent industry consultant that they retained, the
33
ADDITIONAL INFORMATION (unaudited) continued
information that EIMC and Keil provided. In addition, the Trustees considered information regarding, among other things, the funds’ brokerage practices, the funds’ use of derivatives, analyst and research support available to the portfolio management teams, risk management practices, and certain fall-out benefits received directly and indirectly by EIMC and its affiliates from the funds. The Trustees requested and received additional information following that review.
In December 2008 Wells Fargo & Company (“Wells Fargo”) acquired Wachovia Corporation (“Wachovia”), EIMC’s parent company. Wells Fargo and EIMC have taken steps to combine the operations of Wells Fargo’s investment management affiliates and EIMC during the past year and have proposed to the Trustees the combination of the mutual fund families managed by them. During the course of the year, and during their review, the Trustees requested and received information about Wells Fargo and its advisory and broker-dealer operations, the status of efforts to combine the Wells Fargo and Evergreen investment management operations, and the effects on the funds and on the services provided by EIMC and its affiliates to the funds. In their deliberations, the Trustees were mindful that it was possible that the proposed combination of the two fund families might be effected during the coming 12-month period.
The Committee met several times by telephone during the 2009 review process to consider the information provided to it. The Committee then met with representatives of EIMC and its affiliates, including Wells Fargo. In addition, during the course of their review, the Trustees discussed the continuation of the funds’ advisory agreements with representatives of EIMC, and in meetings with independent legal counsel in multiple private sessions at which no personnel of EIMC were present. At a meeting of the full Board of Trustees held on September 23-24, 2009, the Committee reported the results of its discussions with EIMC. The full Board met with representatives of EIMC and its affiliates and engaged in further review of the materials provided to it, after which the independent Trustees and the full Board approved the continuation of each of the advisory and sub-advisory agreements.
The Trustees’ determination to approve the continuation of the advisory and sub-advisory agreements was based on a comprehensive evaluation of all of the information provided to them. In considering the continuation of the agreements, the Trustees did not identify any particular information or consideration that was all-important or controlling, and each Trustee attributed different weights to various factors. The Trustees evaluated information provided to them both in terms of the funds generally and with respect to each fund, including the Fund, specifically as they considered appropriate. Although the Trustees considered the continuation of the agreements for each of the funds as part of the larger process of considering the continuation of the advisory contracts for all of the funds, their determination to continue the advisory agreements for each of the funds was ultimately made on a fund-by-fund basis.
34
ADDITIONAL INFORMATION (unaudited) continued
This summary describes a number of the most important, but not necessarily all, of the factors considered by the Board and the independent Trustees.
Information reviewed. The Board of Trustees and committees of the Board of Trustees met periodically during the course of the year. EIMC presented a wide variety of information at those meetings regarding the services it provides for the funds, the investment performance of the funds, and other aspects of the business and operations of the funds. At those meetings, and in the process of considering the continuation of the agreements, the Trustees considered information regarding, for example, the funds’ investment results; the portfolio management teams for the funds and the experience of the members of the teams, and any recent changes in the membership of the teams; portfolio trading practices; compliance by the funds and EIMC with applicable laws and regulations and with the funds’ and EIMC’s compliance policies and procedures; risk evaluation and oversight procedures at EIMC; services provided by affiliates of EIMC to the funds and shareholders of the funds; and other information relating to the nature, extent, and quality of services provided by EIMC. The Trustees considered a number of changes in portfolio management personnel at EIMC and its advisory affiliates in the year since September 2008. The Trustees also considered changes in personnel at the funds and EIMC, including the appointment of a new President of the funds, who also serves as President and Chief Operating Officer of EIMC, and a new Chief Investment Officer of EIMC in August of 2008.
The Trustees considered the rates at which the funds pay investment advisory fees, and the efforts generally by EIMC and its affiliates as sponsors of the funds. The data provided by Keil showed the management fees paid by each fund in comparison to the management fees of other peer mutual funds, in addition to data regarding the investment performance of the funds in comparison to other peer mutual funds. The Trustees were assisted by an independent industry consultant in reviewing the information presented to them.
The Trustees noted that, in certain cases, EIMC and/or its affiliates provide advisory services to other clients that are comparable to the advisory services they provide to certain funds. The Trustees considered the information EIMC provided regarding the rates at which those other clients pay advisory fees to EIMC. Fees charged to those other clients were generally lower than those charged to the respective funds. In respect of these other accounts, EIMC noted that the compliance, reporting, and other legal burdens of providing investment advice to mutual funds generally exceed those required to provide advisory services to non-mutual fund clients such as retirement or pension plans.
The Trustees considered the transfer agency fees paid by the funds to an affiliate of EIMC. They reviewed information presented to them showing that the transfer agency fees charged to the funds were generally consistent with industry norms.
35
ADDITIONAL INFORMATION (unaudited) continued
The Trustees also considered that EIMC serves as administrator to the funds and receives a fee for its services as administrator. In their comparison of fees paid by the funds with those paid by other mutual funds, the Trustees considered administrative fees paid by the funds and those other mutual funds. They considered that EIS, an affiliate of EIMC, would serve as distributor to the funds until January 3, 2010, and that Wells Fargo Funds Distributor, LLC, also an affiliate of EIMC, would serve as distributor to the funds beginning on January 4, 2010, and noted that the distributor receives fees from the funds for those services. The Trustees also considered other so-called “fall-out” benefits to EIMC and its affiliates due to their other relationships with the funds, including, for example, soft-dollar services received by EIMC attributable to transactions entered into by EIMC on behalf of the funds and brokerage commissions received by Wells Fargo Advisors, LLC (“Wells Fargo Advisors”) (formerly Wachovia Securities, LLC), an affiliate of EIMC, from transactions effected by it for the funds. The Trustees noted that the funds pay sub-transfer agency fees to various financial institutions, including Wells Fargo Advisors and its affiliates, that hold fund shares in omnibus accounts, and that an affiliate of EIMC receives fees for administering the sub-transfer agency payment program. In reviewing the services provided by an affiliate of EIMC, the Trustees noted that the affiliate of EIMC that provides transfer agency services to the funds had won recognition from Dalbar customer service each year since 1998, and also won recognition from National Quality Review for customer service and for accuracy in processing transactions in 2008. They also considered that Wells Fargo Advisors and its affiliates receive distribution-related fees and shareholder servicing payments (including amounts derived from payments under the funds’ Rule 12b-1 plans) in respect of shares sold or held through them and that an affiliate of EIMC receives compensation for serving as a securities lending agent for a number of the funds.
The Trustees considered regulatory actions taken against EIMC or its affiliates in the past year, and on-going reviews of the operations of EIMC and its affiliates as they might affect the funds. They considered the findings of the regulators, the cooperation of EIMC and its affiliates with those regulators and with the Trustees in respect of those actions and reviews, and the remedial steps EIMC and its affiliates have taken in response. They also considered the scope and nature of on-going reviews being conducted by EIMC and its affiliates, and communications to the Trustees relating to those reviews.
Nature and quality of the services provided. The Trustees considered that EIMC and its affiliates generally provide a comprehensive investment management service to the funds. They noted that EIMC formulates and implements an investment program for the Fund. They noted that EIMC makes its personnel available to serve as officers of the funds, and concluded that the reporting and management functions provided by EIMC with respect to the funds were generally satisfactory. The Trustees considered the investment philosophy of the Fund’s portfolio management team and the in-house research
36
ADDITIONAL INFORMATION (unaudited) continued
capabilities of EIMC and its affiliates, as well as other resources available to EIMC, including research services available to it from third parties.
The Trustees considered the managerial and financial resources available to EIMC and its affiliates and the commitment that the Evergreen/Wells Fargo organization has made to the funds generally. They considered assurances from representatives of Wells Fargo that the merger of Wells Fargo and Wachovia and the integration of those firms’ advisory and broker-dealer operations was not expected to result in any adverse effect on the funds, on the quality and level of services that EIMC provides to the funds, or on the resources available to the funds and to EIMC, and that Wells Fargo is committed to continue providing the funds with high-quality services.
The Trustees noted the resources EIMC and its affiliates have committed to the regulatory, compliance, accounting, tax and oversight of tax reporting, and shareholder servicing functions, and the number and quality of staff committed to those functions, which they concluded were appropriate and generally in line with EIMC’s responsibilities to the Fund and to the funds generally. The Board and the independent Trustees concluded, within the context of their overall conclusions regarding the funds’ advisory agreements, that they were generally satisfied with the nature, extent, and quality of the services provided by EIMC, including services provided by EIMC under its administrative services agreements with the funds. They determined that the nature and scope of the services provided by EIMC were consistent with EIMC’s duties under the investment advisory agreements and appropriate and consistent with the investment programs and best interests of the funds.
Investment performance. The Trustees considered the investment performance of each fund, both by comparison to other comparable mutual funds and to broad market indices. Although the Trustees considered the performance of all share classes, the Trustees noted that, for the three- and ten-year periods ended December 31, 2008, the Fund’s Class A shares had outperformed the Fund’s benchmark index, the Russell Midcap Growth Index, and had underperformed the Fund’s benchmark index for the one- and five-year periods ended December 31, 2008. The Trustees also noted that the Fund’s Class A shares’ performance was in the third quintile for the one-, three-, and ten-year periods ended December 31, 2008, and in the fourth quintile for the five-year period ended December 31, 2008, of the mutual funds against which the Trustees compared the Fund’s performance.
The Trustees discussed each fund’s performance with representatives of EIMC. In each instance where a fund experienced a substantial period of underperformance relative to its benchmark index and/or the non-Evergreen fund peers against which the Trustees compared the fund’s performance, the Trustees considered EIMC’s explanation of the reasons for the relative underperformance and the steps being taken to address the relative underperformance. The Trustees emphasized that the continuation of the investment
37
ADDITIONAL INFORMATION (unaudited) continued
advisory agreement for a fund should not be taken as any indication that the Trustees did not believe investment performance for any specific fund might not be improved, and they noted that they would continue to monitor closely the investment performance of the funds going forward.
Advisory and administrative fees. The Trustees recognized that EIMC does not seek to provide the lowest cost investment advisory service, but to provide a high quality, full-service investment management product at a reasonable price. They also noted that EIMC has in many cases sought to set its investment advisory fees at levels consistent with industry norms. The Trustees noted that, in certain cases, a fund’s management fees were higher than many or most other mutual funds in the same Keil peer group. However, in each case, the Trustees determined on the basis of the information presented that the level of management fees was not excessive. The Trustees noted that the management fee paid by the Fund was lower than the management fees paid by most of the other mutual funds against which the Trustees compared the Fund’s management fee, and that the level of profitability realized by EIMC in respect of the fee did not appear excessive.
Economies of scale. The Trustees noted the possibility that economies of scale would be achieved by EIMC in managing the funds as the funds grow. They reviewed the breakpoints in the Fund’s advisory fee structure, which operate generally to reduce the effective management fee rate of the Fund (as a percentage of Fund assets) as the Fund grows in size. They considered that, as a fund shrinks in size, breakpoints result in increasing fee levels. The Trustees noted that they would continue to review the appropriate levels of breakpoints in the future, and concluded that the breakpoints as implemented appeared to be a reasonable step toward the realization of economies of scale by the Fund.
Profitability. The Trustees considered information provided to them regarding the profitability to the EIMC organization of the investment advisory, administration, and transfer agency (with respect to the open-end funds only) fees paid to EIMC and its affiliates by each of the funds. They considered that the information provided to them was necessarily estimated, and that the profitability information provided to them, especially on a fund-by-fund basis, did not necessarily provide a definitive tool for evaluating the appropriateness of each fund’s advisory fee. They noted that the levels of profitability of the funds to EIMC varied widely, depending on, among other things, the size and type of fund. They considered the profitability of the funds in light of such factors as, for example, the information they had received regarding the relation of the fees paid by the funds to those paid by other mutual funds, the investment performance of the funds, and the amount of revenues involved. In light of these factors, the Trustees concluded that the profitability to EIMC of the services provided to any of the funds, individually or in the aggregate, should not prevent the Trustees from approving the continuation of the agreements.
38
This page left intentionally blank
39
TRUSTEES AND OFFICERS
TRUSTEES1 | |
Charles A. Austin III
Trustee
DOB: 10/23/1934
Term of office since: 1991
Other directorships: None | Investment Counselor, Anchor Capital Advisors, LLC. (investment advice); Director, The Andover Companies (insurance); Trustee, Arthritis Foundation of New England; Former Director, The Francis Ouimet Society (scholarship program); Former Director, Executive Vice President and Treasurer, State Street Research & Management Company (investment advice) |
|
|
K. Dun Gifford
Trustee
DOB: 10/23/1938
Term of office since: 1974
Other directorships: None | Chairman and President, Oldways Preservation and Exchange Trust (education); Trustee, Member of the Executive Committee, Former Chairman of the Finance Committee, and Former Treasurer, Cambridge College |
|
|
Dr. Leroy Keith, Jr.
Trustee
DOB: 2/14/1939
Term of office since: 1983
Other directorships: Trustee,
Phoenix Fund Complex
(consisting of 50 portfolios
as of 12/31/2008) | Managing Director, Almanac Capital Management (commodities firm); Trustee, Phoenix Fund Complex; Director, Diversapack Co. (packaging company); Former Partner, Stonington Partners, Inc. (private equity fund); Former Director, Obagi Medical Products Co.; Former Director, Lincoln Educational Services |
|
|
Carol A. Kosel
Trustee
DOB: 12/25/1963
Term of office since: 2008
Other directorships: None | Former Consultant to the Evergreen Boards of Trustees; Former Vice President and Senior Vice President, Evergreen Investments, Inc.; Former Treasurer, Evergreen Funds; Former Treasurer, Vestaur Securities Fund |
|
|
Gerald M. McDonnell
Trustee
DOB: 7/14/1939
Term of office since: 1988
Other directorships: None | Former Manager of Commercial Operations, CMC Steel (steel producer) |
|
|
Patricia B. Norris
Trustee
DOB: 4/9/1948
Term of office since: 2006
Other directorships: None | President and Director of Buckleys of Kezar Lake, Inc. (real estate company); Former President and Director of Phillips Pond Homes Association (home community); Former Partner, PricewaterhouseCoopers, LLP (independent registered public accounting firm) |
|
|
William Walt Pettit2
Trustee
DOB: 8/26/1955
Term of office since: 1988
Other directorships: None | Partner and Vice President, Kellam & Pettit, P.A. (law firm); Director, Superior Packaging Corp. (packaging company); Member, Superior Land, LLC (real estate holding company), Member, K&P Development, LLC (real estate development); Former Director, National Kidney Foundation of North Carolina, Inc. (non-profit organization) |
|
|
David M. Richardson
Trustee
DOB: 9/19/1941
Term of office since: 1982
Other directorships: None | President, Richardson, Runden LLC (executive recruitment advisory services); Director, J&M Cumming Paper Co. (paper merchandising); Former Trustee, NDI Technologies, LLP (communications); Former Consultant, AESC (The Association of Executive Search Consultants) |
|
|
Russell A. Salton III, MD
Trustee
DOB: 6/2/1947
Term of office since: 1984
Other directorships: None | President/CEO, AccessOne MedCard, Inc. |
|
|
40
TRUSTEES AND OFFICERS continued
Michael S. Scofield
Trustee
DOB: 2/20/1943
Term of office since: 1984
Other directorships: None | Retired Attorney, Law Offices of Michael S. Scofield; Former Director and Chairman, Branded Media Corporation (multi-media branding company) |
|
|
Richard J. Shima
Trustee
DOB: 8/11/1939
Term of office since: 1993
Other directorships: None | Independent Consultant; Director, Hartford Hospital; Trustee, Greater Hartford YMCA; Former Director, Trust Company of CT; Former Trustee, Saint Joseph College (CT) |
|
|
Richard K. Wagoner, CFA3
Trustee
DOB: 12/12/1937
Term of office since: 1999
Other directorships: None | Member and Former President, North Carolina Securities Traders Association; Member, Financial Analysts Society |
|
|
OFFICERS | |
W. Douglas Munn4
President
DOB: 4/21/1963
Term of office since: 2009 | Principal occupations: Chief Operating Officer, Wells Fargo Funds Management, LLC; President and Chief Operating Officer, Evergreen Investment Company, Inc. |
|
|
Jeremy DePalma4
Treasurer
DOB: 2/5/1974
Term of office since: 2005 | Principal occupations: Senior Vice President, Evergreen Investment Management Company, LLC; Former Vice President, Evergreen Investment Services, Inc.; Former Assistant Vice President, Evergreen Investment Services, Inc. |
|
|
Michael H. Koonce4
Secretary
DOB: 4/20/1960
Term of office since: 2000 | Principal occupations: Senior Vice President and General Counsel, Evergreen Investment Services, Inc.; Secretary, Senior Vice President and General Counsel, Evergreen Investment Management Company, LLC and Evergreen Service Company, LLC |
|
|
Robert Guerin4
Chief Compliance Officer
DOB: 9/20/1965
Term of office since: 2007 | Principal occupations: Chief Compliance Officer, Evergreen Funds and Senior Vice President of Evergreen Investment Company, Inc.; Former Managing Director and Senior Compliance Officer, Babson Capital Management LLC; Former Principal and Director, Compliance and Risk Management, State Street Global Advisors; Former Vice President and Manager, Sales Practice Compliance, Deutsche Asset Management |
|
|
1 | Each Trustee serves until a successor is duly elected or qualified or until his or her death, resignation, retirement or removal from office. Each Trustee oversaw 77 Evergreen funds as of December 31, 2008. Correspondence for each Trustee may be sent to Evergreen Board of Trustees, P.O. Box 20083, Charlotte, NC 28202. |
2 | It is possible that Mr. Pettit may be viewed as an “interested person” of the Evergreen funds, as defined in the 1940 Act, because of his law firm’s previous representation of affiliates of Wells Fargo & Company (“Wells Fargo”), the parent to the Evergreen funds’ investment advisor, EIMC. The Trustees are treating Mr. Pettit as an interested trustee for the time being. |
3 | Mr. Wagoner is an “interested person” of the Evergreen funds because of his ownership of shares in Wells Fargo & Company, the parent to the Evergreen funds’ investment advisor. |
4 | The address of the Officer is 200 Berkeley Street, Boston, MA 02116. |
Additional information about the Fund’s Board of Trustees and Officers can be found in the Statement of Additional Information (SAI) and is available upon request without charge by calling 800.343.2898.
41

563825 rv5 11/2009
Evergreen Omega Fund
| | table of contents |
1 | | LETTER TO SHAREHOLDERS |
4 | | FUND AT A GLANCE |
6 | | PORTFOLIO MANAGER COMMENTARY |
13 | | ABOUT YOUR FUND’S EXPENSES |
14 | | FINANCIAL HIGHLIGHTS |
19 | | SCHEDULE OF INVESTMENTS |
22 | | STATEMENT OF ASSETS AND LIABILITIES |
23 | | STATEMENT OF OPERATIONS |
24 | | STATEMENTS OF CHANGES IN NET ASSETS |
25 | | NOTES TO FINANCIAL STATEMENTS |
33 | | REPORT OF INDEPENDENT REGISTERED PUBLIC ACCOUNTING FIRM |
40 | | TRUSTEES AND OFFICERS |
This annual report must be preceded or accompanied by a prospectus of the Evergreen fund contained herein. The prospectus contains more complete information, including fees and expenses, and should be read carefully before investing or sending money.
The fund will file its complete schedule of portfolio holdings with the SEC for the first and third quarters of each fiscal year on Form N-Q. The fund’s Form N-Q will be available on the SEC’s Web site at http://www.sec.gov. In addition, the fund’s Form N-Q may be reviewed and copied at the SEC’s Public Reference Room in Washington, D.C. Information on the operation of the Public Reference Room may be obtained by calling 800.SEC.0330.
A description of the fund’s proxy voting policies and procedures, as well as information regarding how the fund voted proxies relating to portfolio securities during the most recent 12-month period ended June 30, is available by visiting our Web site at EvergreenInvestments.com or by visiting the SEC’s Web site at http://www.sec.gov. The fund’s proxy voting policies and procedures are also available without charge, upon request, by calling 800.343.2898.
Mutual Funds:
| NOT FDIC INSURED | MAY LOSE VALUE | NOT BANK GUARANTEED |
Evergreen InvestmentsSM is a service mark of Evergreen Investment Management Company, LLC. Copyright 2009, Evergreen Investment Management Company, LLC.
Evergreen Investment Management Company, LLC is a subsidiary of Wells Fargo & Company and is an affiliate of Wells Fargo & Company’s other Broker Dealer subsidiaries.
Evergreen mutual funds are distributed by Evergreen Investment Services, Inc. 200 Berkeley Street, Boston, MA 02116
LETTER TO SHAREHOLDERS
November 2009

W. Douglas Munn
President and Chief Executive Officer
Dear Shareholder:
We are pleased to provide the Annual Report for Evergreen Omega Fund for the twelve-month period ended September 30, 2009 (the “period”).
Capital markets throughout the globe continued to experience extreme pressure during the period. Home prices fell and job losses persisted. The collapse of Lehman Brothers in September 2008 led to collateral damage in the ensuing weeks as venerable financial institutions both in the United States and Europe fell like dominos. Distrust prevailed, and counter-party risk, whether real or imagined, escalated. Inter-bank lending ceased to exist, and the credit markets froze. In response, the Federal Reserve Board (the “Fed”), the U.S. Treasury, the Federal Deposit Insurance Corporation, and the Securities and Exchange Commission took a series of dramatic and innovative steps to help the economy and the financial markets emerge from this crisis. In October 2008, Congress rushed through a $700 billion rescue plan designed to address the capital inadequacy of banks. Meanwhile, in a further effort to re-stimulate lending activity, the Fed twice slashed the key fed funds rate in October 2008, bringing the influential overnight lending rate to just 1.00%. The Fed slashed rates again in December to near zero, where it stayed during the remainder of the period. Overseas, other major central banks also cut short-term rates to inject liquidity into the financial markets. At the same time, foreign governments took other measures to buttress financial institutions and forestall the possibility of a global recession.
Early in 2009, the fixed-income markets worried about deflation, as evidenced by investor willingness to accept virtually nothing for short-term loans to the government. Concerns about federal spending also increased with the $787 billion American Recovery and Reinvestment Act of 2009, signed into law in February. Yields climbed for longer-term U.S. Treasuries during the first quarter of 2009. International markets were hit hard, as economies in both developed and emerging countries struggled. Equity markets were affected by the weakness in economic data and corporate profits, although stocks rallied off their March 9th lows, with international and small cap stocks leading the gains. Signs of stability emerged in the corporate credit markets, as both issuance and performance improved. The price of oil surged in the second quarter of 2009, pulling most commodities higher, as the dollar weakened and gold gave back earlier gains. However, gold surged at the end of the fiscal year, and stocks finished a banner third quarter 2009, with all major market indexes climbing by approximately 15%, as investor sentiment was buoyed by signs of improvement in the economy and corporate
1
LETTER TO SHAREHOLDERS continued
earnings. In international markets, most major equity indexes doubled in the developing world from their lows of last year, while the market gains in developed economies have been somewhat more muted.
While recent data reflect an economy that is managing to climb from the depths reached in March, we question whether the fundamentals are in place for sustainable growth, given that economic reports continue to display data that is simply “less bad” than it was earlier in the fiscal year. Until we see stabilization in home prices and employment, it is unlikely that activity will exceed anything beyond what is considered to be “below potential” for any period of time.
During a volatile and challenging period in the capital markets, the investment managers of Evergreen’s growth-oriented equity funds focused on managing risk and finding potential opportunities while maintaining the goal of seeking long-term capital appreciation. Managers of Evergreen Large Company Growth Fund and Evergreen Omega Fund focused on bottom-up, fundamental analysis in making individual stock selections. The management teams supervising Evergreen Mid Cap Growth Fund and Evergreen Small-Mid Growth Fund, meanwhile, sought out growing companies with strong fundamentals and reasonable valuations. At the same time, managers of Evergreen Growth Fund concentrated on opportunities among small cap growth companies with above-average earnings prospects and reasonable stock prices. The team supervising Evergreen Strategic Growth Fund, meanwhile, focused on large cap companies offering superior long-term growth potential.
We believe the changing conditions in the investment environment over the period have underscored the value of a well-diversified, long-term investment strategy that seeks to help soften the effects of volatility in any one market or asset class. As always, we encourage investors to maintain diversified investment portfolios in pursuit of their long-term investment goals.
Please visit us at EvergreenInvestments.com for more information about our funds and other investment products available to you. Thank you for your continued support of Evergreen Investments.
Sincerely,

W. Douglas Munn
President and Chief Executive Officer
Evergreen Funds
2
LETTER TO SHAREHOLDERS continued
Notice to Shareholders:
Effective after the close of business on June 30, 2009, Class B shares of the Fund were closed to new accounts and additional purchases by existing shareholders. Existing shareholders of Class B shares of the Fund may continue to exchange their Class B shares for Class B shares of other Evergreen Funds subject to the limitations described in each fund’s prospectus and may also continue to add to their accounts through dividend reinvestment. All other Class B share features and attributes, including, but not limited to, the 12b-1 fee, contingent deferred sales charge and conversion after a number of years to Class A shares, remain unchanged. Shareholders of the Fund may continue to redeem Fund shares in the manner described in the Fund’s prospectus.
3
FUND AT A GLANCE
as of September 30, 2009
MANAGEMENT TEAM
Investment Advisor:
Evergreen Investment Management Company, LLC
Portfolio Manager:
Aziz Hamzaogullari, CFA
CURRENT INVESTMENT STYLE

Source: Morningstar, Inc.
Morningstar’s style box is based on a portfolio date as of 9/30/2009.
The Equity style box placement is based on 10 growth and valuation measures for each fund holding and the median size of the companies in which the fund invests.
PERFORMANCE AND RETURNS
Portfolio inception date: 4/29/1968
| Class A | Class B | Class C | Class I | Class R |
Class inception date | 4/29/1968 | 8/2/1993 | 8/2/1993 | 1/13/1997 | 10/10/2003 |
|
|
|
|
|
|
Nasdaq symbol | EKOAX | EKOBX | EKOCX | EOMYX | EKORX |
|
|
|
|
|
|
Average annual return* | | | | | |
|
|
|
|
|
|
1-year with sales charge | -1.67% | -1.44% | 2.55% | N/A | N/A |
|
|
|
|
|
|
1-year w/o sales charge | 4.33% | 3.56% | 3.55% | 4.59% | 4.08% |
|
|
|
|
|
|
5-year | 3.11% | 3.24% | 3.58% | 4.63% | 4.11% |
|
|
|
|
|
|
10-year | 0.84% | 0.70% | 0.71% | 1.72% | 1.32% |
|
|
|
|
|
|
Maximum sales charge | 5.75% | 5.00% | 1.00% | N/A | N/A |
| Front-end | CDSC | CDSC | | |
|
|
|
|
|
|
* | Adjusted for maximum applicable sales charge, unless noted. |
Past performance is no guarantee of future results. The performance quoted represents past performance and current performance may be lower or higher. The investment return and principal value of an investment will fluctuate so that investors’ shares, when redeemed, may be worth more or less than their original cost. To obtain performance information current to the most recent month-end for Classes A, B, C or I, please go to EvergreenInvestments.com/fundperformance. Please call 1.800.847.5397 for the most recent month-end performance information for Class R. The performance of each class may vary based on differences in loads, fees and expenses paid by the shareholders investing in each class. Performance includes the reinvestment of income dividends and capital gain distributions. Performance shown does not reflect the deduction of taxes that a shareholder would pay on fund distributions or the redemption of fund shares.
Historical performance shown for Class R prior to its inception is based on the performance of Class A, the original class offered. The historical returns for Class R have not been adjusted to reflect the effect of its 12b-1 fee. The fund incurs a 12b-1 fee of 0.25% for Class A, 0.50% for Class R and 1.00% for Classes B and C. Class I does not pay a 12b-1 fee. If these fees had been reflected, returns for Class R would have been lower.
The returns shown for Class B shares do not reflect the conversion of Class B shares to Class A shares after eight years.
Class B shares are closed to new investments by new and existing shareholders.
Returns reflect expense limits previously in effect, without which returns would have been lower.
4
FUND AT A GLANCE continued
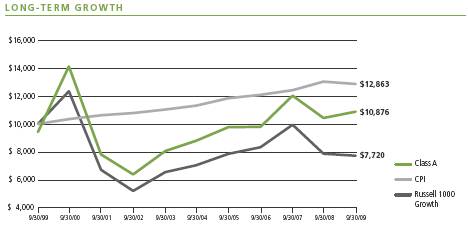
Comparison of a $10,000 investment in the Evergreen Omega Fund Class A shares versus a similar investment in the Russell 1000 Growth Index (Russell 1000 Growth) and the Consumer Price Index (CPI).
The Russell 1000 Growth is an unmanaged market index and does not include transaction costs associated with buying and selling securities, any mutual fund fees or expenses or any taxes. The CPI is a commonly used measure of inflation and does not represent an investment return. It is not possible to invest directly in an index.
Class I shares are only offered, subject to the minimum initial purchase requirements, in the following manner: (1) to investment advisory clients of EIMC (or its advisory affiliates), (2) to employer- or state-sponsored benefit plans, including but not limited to, retirement plans, defined benefit plans, deferred compensation plans, or savings plans, (3) to fee-based mutual fund wrap accounts, (4) through arrangements entered into on behalf of the Evergreen funds with certain financial services firms, (5) to certain institutional investors, and (6) to persons who owned Class Y shares in registered name in an Evergreen fund on or before December 31, 1994 or who owned shares of any SouthTrust fund in registered name as of March 18, 2005 or who owned shares of Vestaur Securities Fund as of May 20, 2005.
Class I shares are only available to institutional shareholders with a minimum of $1 million investment, which may be waived in certain situations.
Class R shares generally are available only to 401(k) plans, 457 plans, employer-sponsored 403(b) plans, profit sharing and money purchase pension plans, defined benefit plans and non-qualified deferred compensation plans.
The fund’s investment objective may be changed without a vote of the fund’s shareholders.
Foreign investments may contain more risk due to the inherent risks associated with changing political climates, foreign market instability and foreign currency fluctuations.
Small and mid cap securities may be subject to special risks associated with narrower product lines and limited financial resources compared to their large cap counterparts, and, as a result, small and mid cap securities may decline significantly in market downturns and may be more volatile than those of larger companies due to the higher risk of failure.
All data is as of September 30, 2009, and subject to change.
5
PORTFOLIO MANAGER COMMENTARY
The fund’s Class A shares returned 4.33% for the twelve-month period ended September 30, 2009, excluding any applicable sales charges. During the same period, the Russell 1000 Growth returned -1.85% and the Lipper Multi-Cap Growth Funds Category had a median return of -2.97%.
The fund’s objective is to seek long-term capital growth.
Investment process
As the portfolio manager for Evergreen Omega Fund, I am a strong believer in the importance of a disciplined, well-defined investment process for seeking to achieve superior long-term investment results. Our investment philosophy centers on fundamental, bottom-up, disciplined investing for the long-term. Our ultimate goal is to invest in what we believe are structurally good businesses with sustainable competitive advantages and the ability to grow profitably on a secular basis.
We follow a focused strategy where we tend to pursue a small number of companies that we believe can sustain above-average growth of long-term cash flows and sell at a discount to our estimate of the intrinsic value for the business. Because we are long-term investors, we anticipate that the fund’s portfolio turnover may be relatively low. Our sector weighting decisions will be byproducts of our bottom-up, fundamental analysis of companies, as we refrain from trying to determine macro variables such as interest rates, employment growth and inflation. Our long-term intrinsic value models incorporate assumptions that serve as fundamental milestones along a company’s growth trajectory. We invest in companies where we believe the risk-reward profile is favorable and when one of the following factors exists: growth potential is underestimated; investors overreact to short-term concerns; companies are priced below private market value; or valuation is low relative to normalized cash flow power. We reduce or sell portfolio holdings when an assumption has proved to be flawed; a stock fully reflects fair value; unfavorable structural change takes place in the business; or better risk-reward opportunities are identified.
During the fiscal year, I invested in only three new companies. The bear market that started in 2008 gave us the opportunity last year to buy several very high-quality businesses with potentially sustainable competitive positioning, secular growth drivers, great managements and attractive valuations. Therefore, I’ve made fewer changes in the portfolio this year, as I felt I had already built what I consider a long-term portfolio consisting of a group of high-quality businesses at attractive prices. New purchases were MSCI Inc, American Express and SEI Investments. Taking advantage of lower prices over the course of the fiscal year, I also increased positions in Biogen, Blue Nile, Expeditors International of Washington, FactSet, Google, Legg Mason, McCormick, Novartis, Schlumberger, SEI Investments, United Parcel Services (UPS), Visa, and Zimmer Holdings.
To fund these purchases, I sold several holdings and decreased several positions during the fiscal year. I sold small positions in Whole Foods, Best Buy, St. Jude Medical, Tyco
6
PORTFOLIO MANAGER COMMENTARY continued
International, Texas Instruments, KLA-Tencor and Carnival Corp. I decreased positions in Amgen, Bristol Myers, Clorox, Marsh & McLennan, Procter and Gamble, Conoco Phillips, Chevron and Wellpoint. I also decreased the top position in Amazon slightly, which was the second best performing investment in the portfolio. Despite the sale of a small stake in Amazon, the company represented a higher percentage of the portfolio at the end of the fiscal year versus the beginning, given price appreciation. Also, I sold the stake in Bankrate after it agreed to be acquired by Apax Partners, a global private equity firm.
My investment decisions during the fiscal year had the following impact on our sector weights relative to the benchmark. We continued to be overweight in Consumer Discretionary, increased our overweight in Financials and went from an underweight position to a slight overweight position in Energy. We are overweight in Health Care and Information Technology, but at a lower level than last year. We have increased the underweight in Consumer Staples and while we have increased the holdings in Industrials, we still maintain an overall underweight position versus the benchmark. We continue to own no positions in the Materials sector.
Also, it is important to note that, during the fiscal year, the Russell 1000 Growth index was reconstituted, with decreased weights in Energy. As a result of investments in the Energy sector and the index reconstitution, as mentioned before we went from an Energy underweight in September 2008 to a slight overweight in September 2009. I would like to take this opportunity to explain our sector weighting decisions and risk management approach.
As mentioned before, our sector weighting decisions are byproducts of our bottom-up fundamental analysis of companies. We invest in businesses strictly based on our bottom-up company analysis. As a result, we do not change sector positions based on how the index is structured at any given time. If anything, we believe active risk management requires us to look at risk at the security level rather than top-down, based on relative index positioning. As we are active portfolio managers, we are also active risk managers. Generally, the neutral or passive risk strategy requires constructing portfolios with characteristics similar to their benchmark so that risk may be measured on a relative basis. One of the ways this can be achieved is by constraining the amounts by which stocks in the portfolio vary from the benchmark sector holdings. In this neutral or passive risk strategy, there are times when certain sectors may become underpriced or overpriced. For us, on the other hand, risk management starts at the security level. We seek to maximize absolute returns and limit the probability of permanent capital loss by investing in firms where, in our opinion, the downside risk is minimal (i.e., where a margin of safety exists). Managing a portfolio’s sector weights to specific ranges as compared to the benchmark can reduce the volatility of returns versus the benchmark but may not necessarily effectively manage the volatility of absolute (or systematic) returns.
7
PORTFOLIO MANAGER COMMENTARY continued
Consider the bubble in Energy stock prices during 2007 and early 2008. The result was an enormous increase in market capitalization of this sector and an inherent increase in the Energy sector’s weight in the benchmark. Maintaining a strict relative position in this sector, according to our fundamental research and intrinsic value methodology, would have meant taking on excessive absolute investment risk, even though we would have had little risk in this sector relative to the benchmark. In 2003, Energy comprised less than 2% of the Russell 1000 Growth Index. By June 2008, driven by price appreciation and benchmark reconstitution, Energy comprised more than 13% of this index. At that point we had only a 1.5% position in the sector, as we found only two positions that were attractive and the rest of the sector, in our opinion, was overpriced because of very high expectations embedded in the stock prices. By March 2009, Energy was 7.8% of the index; with reconstitution, Energy comprised just over 4% of this index by September 2009. In the meantime, we increased our Energy weight from 1.5% in June 2008 to around 5% in September 2009, as prices corrected significantly, creating investing opportunities for us.
Of our new investments, I would like to highlight MSCI and SEI Investments to give you insights into our investment process. MSCI (MXB) is a leading global provider of investment decision support tools to investment institutions. MSCI has two major business segments: Equity Indices (including index subscription and asset-based fees), representing 54% of revenue; and Barra (including equity and multi-asset class portfolio analytics), representing 40% of revenue. The company has a long history, with its first international indices created in 1969 by Capital Group/Capital International, and Barra’s equity analytics products created in 1975. MSCI acquired Barra in 2004. The company’s products are used in multiple areas of the investment process, including portfolio construction and optimization, performance benchmarking, attribution analysis, risk analysis, asset allocation, index-linked investment product creation, investment manager selection, and investment research.
MSCI’s brand, proprietary content, standardization, and the mission-critical nature of its products create significant competitive barriers to entry, high switching costs for its customers, and pricing power for the company. MSCI has an attractive subscription-based model, with over 95% of its revenue coming from recurring sources. In fact, 85% of the revenue is subscription-based, with a normalized retention rate of over 90%. In addition, 15% is of its revenue is based on long-term contracts, and fluctuates with assets under management (AUM). Also important, close to 90% of the subscription pricing is content rather than user-based pricing, making the revenue stream more predictable. MSCI is focused on providing clients with long-term solutions that are industry standard-bearers (like the company’s MSCI indices). This focus has led to high client loyalty or “stickiness.” We believe all aforementioned competitive advantages are sustainable and difficult to duplicate.
8
PORTFOLIO MANAGER COMMENTARY continued
From a competitive analysis perspective, the company has a leading share in most of its focused markets. In its core equity index business (39% of revenue), MSCI provides 120,000 daily indices covering over 70 countries. In addition, it estimates that over $3 trillion of worldwide AUM are benchmarked against their indices, including over 90% of U.S.-managed investments in international equity. The company’s market share in global exchange-traded fund (ETF) assets (16% of the company’s total revenue) grew from 19% in 2005 to 23% in 2008, making MSCI the number-two player behind S&P, which has 32% share. S&P dominates U.S. domestic index-based ETFs, while MSCI dominates international index-based ETFs. In the equity risk analytics markets, MSCI’s Barra Equity Analytics (31% of revenue) has a 50% market share and is the clear market leader; as the closest competitor, FactSet/Northfield has 13% market share. In multi asset class risk analytics (8% of company revenue), MSCI has an estimated 18% market share, behind the number-one player, Risk Metrics, which has over 80% market share.
From a balance sheet and business model perspective, MSCI has an attractive subscription-based model. The company also has high client retention and high incremental returns as shown by around 45% EBITDA (earnings before interest, taxes, depreciation, and amortization) margins in 2008. The company has strong cash flow generation capability and a strong balance sheet. MSCI generates free cash flow above net income due to its subscription-based model and low capital requirements. We currently believe the company has the potential to generate returns on capital well above its cost of capital because we expect its operating margins to improve over our investment horizon as MSCI benefits from high incremental returns. A good portion of its marginal cost is related to the cost of selling the product, which is generally recognized in the first year of a subscription. MSCI is led by a management team with a strong history at the company and at the Barra division. We like the management’s entrepreneurial style and long-term focus. They also champion vested ownership, as insiders own around 2.7% of the shares, including CEO Henry Fernandez, who has a meaningful stake in the business.
We also believe the company has several secular growth drivers that we estimate may result in double-digit revenue and a higher cash flow growth over our long-term investment horizon. These structural and secular drivers, from an industry perspective, are driven by growth of the asset management industry, international investing, and passive investment management, as well as increased use of risk management. From a company perspective, we believe revenue growth will be driven by the following factors: (1) new client growth; (2) cross-selling existing clients; (3) up-selling existing clients; (4) introduction of new products; (5) pricing increases; and (6) acquisitions.
At the time of our purchase, we believed the macro concerns regarding the financial markets and MSCI’s customers had created a long-term buying opportunity for us, where we believed the stock price was well below our estimate of the company’s intrinsic value, creating a margin of safety. We also believed the company had low embedded expectations versus our own key long-term assumptions in growth, margins and returns.
9
PORTFOLIO MANAGER COMMENTARY continued
SEI Investments is a leading global provider of investment and fund processing management and operations for financial clients. The company was founded in 1968, focusing on loan-based computer simulations for bank loan officers, and has grown organically throughout the years. SEI held its IPO in 1981, and now provides three major services of investment processing, investment management and fund processing in five segments. As of December 31, 2008, SEI administered $379.6 billion in assets under management (AUM) and managed $134.3 billion in AUM. SEI’s focused strategy of providing full outsourcing solutions result in high client-switching costs and barriers to entry for competition. SEI also benefits from its brand, client relationships, and innovative management team. The company has operated for over 40 years, and its understanding of client needs and long-term focus have positioned it well. Once a company becomes SEI’s client, the switching costs to another provider are high as the services and products SEI offers become an essential part of the customer’s overall business. In fact, SEI’s client retention rate runs above 90%.
SEI has secular and sustainable growth drivers, as the company is in very large and growing markets that are still under-penetrated. Ultimately, continued adoption of outsourced solutions for its core financial service will drive the company’s growth, in our opinion. We believe that each of SEI’s segments provides for large and growing markets because SEI’s current penetration level relative to the addressable market is small (estimated to be less than 10%). In addition, SEI may also benefit from financial market appreciation in the long-term, in our opinion, as around 75% of its revenue is linked to AUM.
We believe the company has the potential to grow its revenue at double-digit rates—and free cash flow at a faster clip than revenue—as the company expands its margins. SEI has leading market share within its targets areas for each of its segments. It is focusing its business on those clients who are looking to fully outsource solutions. SEI has a very attractive financial model and balance sheet. We believe the company will continue to attain high free cash flow growth, margins, and returns on capital that are well above its cost of capital. We expect the returns to improve over current levels, which are depressed due to revenue and margins impacted by financial market declines and large investments in its global wealth platform. SEI has high visibility, with around 85% of revenue recurring in nature. The balance sheet is strong, with little debt. We believe SEI has an excellent management team, with a long tenure (top key executives average over 20+ years), vested ownership (25% ownership), a long-term vision, strong business strategy, and a history of returning excess capital to shareholders. In fact, very few management teams have the long-term focus that this team has, anticipating client needs and willing to invest with a 10-year horizon.
Given the recent uncertainty in the financial markets, and lower company margins due to the significant investments in the global wealth platform, and negative sentiment surrounding the company, the company’s shares are trading at a significant discount to
10
PORTFOLIO MANAGER COMMENTARY continued
our estimate of their intrinsic value. This created a buying opportunity for us. I took an initial position in SEI Investments during the second quarter 2009 and increased our holdings during the third quarter. SEI Investments has been an important contributor to results during this fiscal year.
Contributors to performance
Like last fiscal year, the fund’s outperformance relative to the Russell 1000 Growth during the period was mostly driven by stock selection, especially in the Consumer Discretionary and Health Care sectors. In Consumer Discretionary, the fund’s position in Blue Nile, purchased in early 2008, was a top contributor along with the fund’s long-time position in Amazon. In Health Care, the major contributors were Bristol-Myers Squibb and Biogen Idec. The fund’s long-time positions in Google and Visa in the Information Technology sector were also major contributors, along with FactSet Research, which was purchased in early 2008. The portfolio’s new position this year in MSCI in the Financials sector was another important contributor. American Express in Financials and QUALCOMM and Oracle in Information Technology were also top contributors.
Detractors from performance
Major detractors in order were ConocoPhillips, Medtronic, Marsh & McLennan and Legg Mason. I added to the Legg Mason position, maintained holdings in Medtronic and March & McLennan and trimmed the position in ConocoPhillips.
I would like to highlight Legg Mason among the underperforming investments to explain why we still like its long-term prospects and why we added to the fund’s holdings.
At Legg Mason, recent performance issues at some of its major equity and fixed income managers and resulting outflows for its products, coupled with the company’s exposure to structured investment vehicles (SIVs) in liquidity funds, weighed down its stock. We increased our position, as we believe the issues facing the company are temporary rather than structural. The empirical data shows that even the best managers in terms of track records underperform their peers from time to time, sometimes for a prolonged period. Historically, this usually results in outflows. We believe this recent negative backdrop created a great investment opportunity in this franchise. As of September 30, 2009, Legg Mason is one of the largest independent asset managers in the world, by assets under management (AUM). Legg Mason has a collection of strong brands across a variety of asset classes. We currently believe Legg Mason is a company with significant competitive advantages in a structurally attractive industry in terms of margins and returns on capital. The first big differentiator and source of competitive advantage for the company is its culture, which encourages a focus on independent investment processes and long-term results, which we believe are the key drivers for long-term above average investment performance. This has also been a key driver for the company’s ability to attract good investment talent and distinguished investment organizations through acquisitions. Second, the company institutionalized processes and incentive structures for a long-term sustainable investment organization, which we believe is a key element in a human
11
PORTFOLIO MANAGER COMMENTARY continued
capital-intensive business. Lastly, the company has built scale and a distribution footprint that would be difficult to replicate successfully. We believe the key drivers for growth for the company are expanded distribution capabilities, building a global footprint, alternative investments and leveraging of current investment expertise through expanding and growing into institutional and retail channels. The company currently has a strong balance sheet and cash flow generation capabilities. The managers are strong operators and have extensive tenure with the company, with a focus on long-term value creation. Lastly, we believe the current embedded expectations are too pessimistic versus our own key assumptions in growth, margins and returns. Therefore, we believe the business is selling at a discount to our estimated intrinsic value.
Portfolio management outlook
Our investment process is guided by my steadfast commitment to the long-term. A byproduct of such a process and philosophy has been a relatively low portfolio turnover ratio, even though the fund does not have a stated goal of maintaining a specified level of portfolio turnover. At the end of this fiscal year, the portfolio turnover ratio was 26%, a lower turnover than last year when I sought to take advantage of bargains in the market and extreme volatility. Between June 30, 2006, when I became the portfolio manager of the fund, and September 30, 2009, the estimated annualized portfolio turnover was 29.5%. While shifting market conditions may warrant additional portfolio transactions and a higher turnover ratio, we remain committed to a philosophy of investing for the long-term. I thank you for your investment in Evergreen Omega Fund.
Aziz V. Hamzaogullari, CFA
This commentary reflects the views and opinions of the fund’s portfolio manager(s) on the date indicated and may include statements that constitute “forward-looking statements” under the U.S. Securities laws. Forward-looking statements include, among other things, projections, estimates and information about possible or future results related to the fund, markets, or regulatory developments. The views expressed above are not guarantees of future performance or economic results and involve certain risks, uncertainties and assumptions that could cause actual outcomes and results to differ materially from the views expressed herein. The views expressed above are subject to change at any time based upon economic, market, or other conditions and Evergreen undertakes no obligation to update the views expressed herein. Any discussions of specific securities should not be considered a recommendation to buy or sell those securities. The views expressed herein (including any forward-looking statements) may not be relied upon as investment advice or as an indication of the fund’s trading intent.
12
ABOUT YOUR FUND’S EXPENSES
The Example below is intended to describe the fees and expenses borne by shareholders and the impact of those costs on your investment.
Example
As a shareholder of the fund, you incur two types of costs: (1) transaction costs, including sales charges (loads), redemption fees and exchange fees; and (2) ongoing costs, including management fees, distribution (12b-1) fees and other fund expenses. This Example is intended to help you understand your ongoing costs (in dollars) of investing in the fund and to compare these costs with the ongoing costs of investing in other mutual funds. The Example is based on an investment of $1,000 invested at the beginning of the period and held for the entire period from April 1, 2009 to September 30, 2009.
The example illustrates your fund’s costs in two ways:
• Actual expenses
The section in the table under the heading “Actual” provides information about actual account values and actual expenses. You may use the information in these columns, together with the amount you invested, to estimate the expenses that you paid over the period. Simply divide your account value by $1,000 (for example, an $8,600 account value divided by $1,000 = 8.6), then multiply the result by the number in the appropriate column for your share class, in the column entitled “Expenses Paid During Period” to estimate the expenses you paid on your account during this period.
• Hypothetical example for comparison purposes
The section in the table under the heading “Hypothetical (5% return before expenses)” provides information about hypothetical account values and hypothetical expenses based on the fund’s actual expense ratio and an assumed rate of return of 5% per year before expenses, which is not the fund’s actual return. The hypothetical account values and expenses may not be used to estimate the actual ending account balance or expenses you paid for the period. You may use this information to compare the ongoing costs of investing in the fund and other funds. To do so, compare this 5% hypothetical example with the 5% hypothetical examples that appear in the shareholder reports of the other funds.
Please note that the expenses shown in the table are meant to highlight your ongoing costs only and do not reflect any transactional costs, such as sales charges (loads), redemption fees or exchange fees. Therefore, the section in the table under the heading “Hypothetical (5% return before expenses)” is useful in comparing ongoing costs only, and will not help you determine the relative total costs of owning different funds. In addition, if these transactional costs were included, your costs would have been higher.
| Beginning | Ending | |
| Account Value | Account Value | Expenses Paid |
| 4/1/2009 | 9/30/2009 | During Period* |
|
|
|
|
Actual | | | |
Class A | $1,000.00 | $1,303.99 | $ 8.14 |
Class B | $1,000.00 | $1,298.99 | $12.45 |
Class C | $1,000.00 | $1,299.26 | $12.45 |
Class I | $1,000.00 | $1,305.64 | $ 6.70 |
Class R | $1,000.00 | $1,302.27 | $ 9.64 |
Hypothetical | | | |
(5% return before expenses) | | | |
Class A | $1,000.00 | $1,018.00 | $ 7.13 |
Class B | $1,000.00 | $1,014.24 | $10.91 |
Class C | $1,000.00 | $1,014.24 | $10.91 |
Class I | $1,000.00 | $1,019.25 | $ 5.87 |
Class R | $1,000.00 | $1,016.70 | $ 8.44 |
|
|
|
|
* | For each class of the fund, expenses are equal to the annualized expense ratio of each class (1.41% for Class A, 2.16% for Class B, 2.16% for Class C, 1.16% for Class I and 1.67% for Class R), multiplied by the average account value over the period, multiplied by 183 / 365 days. |
13
FINANCIAL HIGHLIGHTS
(For a share outstanding throughout each period)
| | Year Ended September 30, | |
| |
| |
CLASS A | | 2009 | | 2008 | | 2007 | | 2006 | | 2005 | |
|
|
|
|
|
|
|
|
|
|
| |
Net asset value, beginning of period | | $ | 27.26 | | $ | 31.44 | | $ | 25.60 | | $ | 25.54 | | $ | 23.00 | |
|
|
|
|
|
|
|
|
|
|
|
|
|
|
|
| |
Income from investment operations | | | | | | | | | | | | | | | | |
Net investment income (loss) | | | 0.18 | 1 | | 0.05 | 1 | | (0.11 | )1 | | (0.15 | )1 | | (0.12 | )1 |
Net realized and unrealized gains or losses on investments | | | 1.00 | | | (4.23 | ) | | 5.95 | | | 0.21 | | | 2.66 | |
| |
|
|
|
|
|
|
|
|
|
|
|
|
|
| |
Total from investment operations | | | 1.18 | | | (4.18 | ) | | 5.84 | | | 0.06 | | | 2.54 | |
|
|
|
|
|
|
|
|
|
|
|
|
|
|
|
| |
Net asset value, end of period | | $ | 28.44 | | $ | 27.26 | | $ | 31.44 | | $ | 25.60 | | $ | 25.54 | |
|
|
|
|
|
|
|
|
|
|
|
|
|
|
|
| |
Total return2 | | | 4.33 | % | | (13.30 | )% | | 22.81 | % | | 0.23 | % | | 11.04 | % |
|
|
|
|
|
|
|
|
|
|
|
|
|
|
|
| |
Ratios and supplemental data | | | | | | | | | | | | | | | | |
Net assets, end of period (thousands) | | $ | 460,082 | | $ | 465,952 | | $ | 595,296 | | $ | 520,421 | | $ | 449,639 | |
Ratios to average net assets | | | | | | | | | | | | | | | | |
Expenses including waivers/reimbursements but excluding expense reductions | | | 1.39 | % | | 1.37 | % | | 1.40 | % | | 1.42 | % | | 1.44 | % |
Expenses excluding waivers/reimbursements and expense reductions | | | 1.48 | % | | 1.44 | % | | 1.46 | % | | 1.51 | % | | 1.48 | % |
Net investment income (loss) | | | 0.79 | % | | 0.16 | % | | (0.38 | )% | | (0.57 | )% | | (0.49 | )% |
Portfolio turnover rate | | | 26 | % | | 44 | % | | 23 | % | | 128 | % | | 134 | % |
|
|
|
|
|
|
|
|
|
|
|
|
|
|
|
| |
1 | Per share amount is based on average shares outstanding during the period. |
2 | Excluding applicable sales charges |
See Notes to Financial Statements
14
FINANCIAL HIGHLIGHTS
(For a share outstanding throughout each period)
| | Year Ended September 30, | |
| |
| |
CLASS B | | 2009 | | 2008 | | 2007 | | 2006 | | 2005 | |
|
|
|
|
|
|
|
|
|
|
| |
Net asset value, beginning of period | | $ | 23.62 | | $ | 27.45 | | $ | 22.51 | | $ | 22.62 | | $ | 20.51 | |
|
|
|
|
|
|
|
|
|
|
|
|
|
|
|
| |
Income from investment operations | | | | | | | | | | | | | | | | |
Net investment income (loss) | | | 0.02 | 1 | | (0.15 | )1 | | (0.27 | )1 | | (0.29 | )1 | | (0.25 | )1 |
Net realized and unrealized gains or losses on investments | | | 0.82 | | | (3.68 | ) | | 5.21 | | | 0.18 | | | 2.36 | |
| |
|
|
|
|
|
|
|
|
|
|
|
|
|
| |
Total from investment operations | | | 0.84 | | | (3.83 | ) | | 4.94 | | | (0.11 | ) | | 2.11 | |
|
|
|
|
|
|
|
|
|
|
|
|
|
|
|
| |
Net asset value, end of period | | $ | 24.46 | | $ | 23.62 | | $ | 27.45 | | $ | 22.51 | | $ | 22.62 | |
|
|
|
|
|
|
|
|
|
|
|
|
|
|
|
| |
Total return2 | | | 3.56 | % | | (13.95 | )% | | 21.95 | % | | (0.49 | )% | | 10.29 | % |
|
|
|
|
|
|
|
|
|
|
|
|
|
|
|
| |
Ratios and supplemental data | | | | | | | | | | | | | | | | |
Net assets, end of period (thousands) | | $ | 51,984 | | $ | 85,008 | | $ | 183,129 | | $ | 311,011 | | $ | 437,122 | |
Ratios to average net assets | | | | | | | | | | | | | | | | |
Expenses including waivers/reimbursements but excluding expense reductions | | | 2.13 | % | | 2.11 | % | | 2.11 | % | | 2.12 | % | | 2.14 | % |
Expenses excluding waivers/reimbursements and expense reductions | | | 2.22 | % | | 2.16 | % | | 2.15 | % | | 2.21 | % | | 2.18 | % |
Net investment income (loss) | | | 0.10 | % | | (0.61 | )% | | (1.08 | )% | | (1.27 | )% | | (1.17 | )% |
Portfolio turnover rate | | | 26 | % | | 44 | % | | 23 | % | | 128 | % | | 134 | % |
|
|
|
|
|
|
|
|
|
|
|
|
|
|
|
| |
1 | Per share amount is based on average shares outstanding during the period. |
2 | Excluding applicable sales charges |
See Notes to Financial Statements
15
FINANCIAL HIGHLIGHTS
(For a share outstanding throughout each period)
| | Year Ended September 30, | |
| |
| |
CLASS C | | 2009 | | 2008 | | 2007 | | 2006 | | 2005 | |
|
|
|
|
|
|
|
|
|
|
| |
Net asset value, beginning of period | | $ | 23.69 | | $ | 27.52 | | $ | 22.57 | | $ | 22.67 | | $ | 20.57 | |
|
|
|
|
|
|
|
|
|
|
|
|
|
|
|
| |
Income from investment operations | | | | | | | | | | | | | | | | |
Net investment income (loss) | | | 0 | 1 | | (0.15 | )1 | | (0.27 | )1 | | (0.29 | )1 | | (0.25 | )1 |
Net realized and unrealized gains or losses on investments | | | 0.84 | | | (3.68 | ) | | 5.22 | | | 0.19 | | | 2.35 | |
| |
|
|
|
|
|
|
|
|
|
|
|
|
|
| |
Total from investment operations | | | 0.84 | | | (3.83 | ) | | 4.95 | | | (0.10 | ) | | 2.10 | |
|
|
|
|
|
|
|
|
|
|
|
|
|
|
|
| |
Net asset value, end of period | | $ | 24.53 | | $ | 23.69 | | $ | 27.52 | | $ | 22.57 | | $ | 22.67 | |
|
|
|
|
|
|
|
|
|
|
|
|
|
|
|
| |
Total return2 | | | 3.55 | % | | (13.92 | )% | | 21.93 | % | | (0.44 | )% | | 10.21 | % |
|
|
|
|
|
|
|
|
|
|
|
|
|
|
|
| |
Ratios and supplemental data | | | | | | | | | | | | | | | | |
Net assets, end of period (thousands) | | $ | 43,806 | | $ | 40,829 | | $ | 54,982 | | $ | 64,042 | | $ | 92,223 | |
Ratios to average net assets | | | | | | | | | | | | | | | | |
Expenses including waivers/reimbursements but excluding expense reductions | | | 2.14 | % | | 2.11 | % | | 2.11 | % | | 2.12 | % | | 2.14 | % |
Expenses excluding waivers/reimbursements and expense reductions | | | 2.23 | % | | 2.16 | % | | 2.15 | % | | 2.21 | % | | 2.18 | % |
Net investment income (loss) | | | 0.02 | % | | (0.58 | )% | | (1.09 | )% | | (1.27 | )% | | (1.15 | )% |
Portfolio turnover rate | | | 26 | % | | 44 | % | | 23 | % | | 128 | % | | 134 | % |
|
|
|
|
|
|
|
|
|
|
|
|
|
|
|
| |
1 | Per share amount is based on average shares outstanding during the period. |
2 | Excluding applicable sales charges |
See Notes to Financial Statements
16
FINANCIAL HIGHLIGHTS
(For a share outstanding throughout each period)
| | Year Ended September 30, | |
| |
| |
CLASS I | | 2009 | | 2008 | | 2007 | | 2006 | | 2005 | |
|
|
|
|
|
|
|
|
|
|
| |
Net asset value, beginning of period | | $ | 28.10 | | $ | 32.32 | | $ | 26.25 | | $ | 26.10 | | $ | 23.44 | |
|
|
|
|
|
|
|
|
|
|
|
|
|
|
|
| |
Income from investment operations | | | | | | | | | | | | | | | | |
Net investment income (loss) | | | 0.24 | 1 | | 0.13 | 1 | | (0.03 | )1 | | (0.08 | )1 | | (0.04 | )1 |
Net realized and unrealized gains or losses on investments | | | 1.05 | | | (4.35 | ) | | 6.10 | | | 0.23 | | | 2.70 | |
| |
|
|
|
|
|
|
|
|
|
|
|
|
|
| |
Total from investment operations | | | 1.29 | | | (4.22 | ) | | 6.07 | | | 0.15 | | | 2.66 | |
|
|
|
|
|
|
|
|
|
|
|
|
|
|
|
| |
Net asset value, end of period | | $ | 29.39 | | $ | 28.10 | | $ | 32.32 | | $ | 26.25 | | $ | 26.10 | |
|
|
|
|
|
|
|
|
|
|
|
|
|
|
|
| |
Total return | | | 4.59 | % | | (13.06 | )% | | 23.12 | % | | 0.57 | % | | 11.35 | % |
|
|
|
|
|
|
|
|
|
|
|
|
|
|
|
| |
Ratios and supplemental data | | | | | | | | | | | | | | | | |
Net assets, end of period (thousands) | | $ | 32,437 | | $ | 23,910 | | $ | 16,503 | | $ | 16,344 | | $ | 10,526 | |
Ratios to average net assets | | | | | | | | | | | | | | | | |
Expenses including waivers/reimbursements but excluding expense reductions | | | 1.14 | % | | 1.12 | % | | 1.11 | % | | 1.12 | % | | 1.14 | % |
Expenses excluding waivers/reimbursements and expense reductions | | | 1.23 | % | | 1.17 | % | | 1.15 | % | | 1.21 | % | | 1.18 | % |
Net investment income (loss) | | | 1.00 | % | | 0.42 | % | | (0.09 | )% | | (0.30 | )% | | (0.15 | )% |
Portfolio turnover rate | | | 26 | % | | 44 | % | | 23 | % | | 128 | % | | 134 | % |
|
|
|
|
|
|
|
|
|
|
|
|
|
|
|
| |
1 | Per share amount is based on average shares outstanding during the period. |
See Notes to Financial Statements
17
FINANCIAL HIGHLIGHTS
(For a share outstanding throughout each period)
| | Year Ended September 30, | |
| |
| |
CLASS R | | 2009 | | 2008 | | 2007 | | 2006 | | 2005 | |
|
|
|
|
|
|
|
|
|
|
| |
Net asset value, beginning of period | | $ | 26.99 | | $ | 31.20 | | $ | 25.47 | | $ | 25.46 | | $ | 22.97 | |
|
|
|
|
|
|
|
|
|
|
|
|
|
|
|
| |
Income from investment operations | | | | | | | | | | | | | | | | |
Net investment income (loss) | | | 0.08 | 1 | | (0.02 | )1 | | (0.14 | )1 | | (0.19 | )1 | | (0.24 | )1 |
Net realized and unrealized gains or losses on investments | | | 1.02 | | | (4.19 | ) | | 5.87 | | | 0.20 | | | 2.73 | |
| |
|
|
|
|
|
|
|
|
|
|
|
|
|
| |
Total from investment operations | | | 1.10 | | | (4.21 | ) | | 5.73 | | | 0.01 | | | 2.49 | |
|
|
|
|
|
|
|
|
|
|
|
|
|
|
|
| |
Net asset value, end of period | | $ | 28.09 | | $ | 26.99 | | $ | 31.20 | | $ | 25.47 | | $ | 25.46 | |
|
|
|
|
|
|
|
|
|
|
|
|
|
|
|
| |
Total return | | | 4.08 | % | | (13.49 | )% | | 22.50 | % | | 0.04 | % | | 10.84 | % |
|
|
|
|
|
|
|
|
|
|
|
|
|
|
|
| |
Ratios and supplemental data | | | | | | | | | | | | | | | | |
Net assets, end of period (thousands) | | $ | 838 | | $ | 84 | | $ | 63 | | $ | 445 | | $ | 385 | |
Ratios to average net assets | | | | | | | | | | | | | | | | |
Expenses including waivers/reimbursements but excluding expense reductions | | | 1.67 | % | | 1.61 | % | | 1.61 | % | | 1.62 | % | | 1.63 | % |
Expenses excluding waivers/reimbursements and expense reductions | | | 1.76 | % | | 1.66 | % | | 1.65 | % | | 1.71 | % | | 1.67 | % |
Net investment income (loss) | | | 0.35 | % | | (0.08 | )% | | (0.53 | )% | | (0.75 | )% | | (0.98 | )% |
Portfolio turnover rate | | | 26 | % | | 44 | % | | 23 | % | | 128 | % | | 134 | % |
|
|
|
|
|
|
|
|
|
|
|
|
|
|
|
| |
1 | Per share amount is based on average shares outstanding during the period. |
See Notes to Financial Statements
18
SCHEDULE OF INVESTMENTS
September 30, 2009
| | | Shares | | | Value | |
|
|
|
|
|
|
| |
COMMON STOCKS 99.0% | | | | | | | |
CONSUMER DISCRETIONARY 17.1% | | | | | | | |
Internet & Catalog Retail 11.1% | | | | | | | |
Amazon.com, Inc. * ρ | | | 366,429 | | $ | 34,209,811 | |
Blue Nile, Inc. * ρ | | | 502,884 | | | 31,239,154 | |
| | | | |
|
| |
| | | | | | 65,448,965 | |
| | | | |
|
| |
Media 1.9% | | | | | | | |
Omnicom Group, Inc. | | | 307,690 | | | 11,366,069 | |
| | | | |
|
| |
Multiline Retail 0.8% | | | | | | | |
Target Corp. | | | 102,202 | | | 4,770,789 | |
| | | | |
|
| |
Specialty Retail 0.8% | | | | | | | |
Home Depot, Inc. | | | 176,250 | | | 4,695,300 | |
| | | | |
|
| |
Textiles, Apparel & Luxury Goods 2.5% | | | | | | | |
Timberland Co., Class A * | | | 1,049,950 | | | 14,615,304 | |
| | | | |
|
| |
CONSUMER STAPLES 5.9% | | | | | | | |
Beverages 0.9% | | | | | | | |
Coca-Cola Co. | | | 95,139 | | | 5,108,965 | |
| | | | |
|
| |
Food Products 2.5% | | | | | | | |
McCormick & Co., Inc. ρ | | | 438,750 | | | 14,891,175 | |
| | | | |
|
| |
Household Products 2.5% | | | | | | | |
Clorox Co. | | | 168,919 | | | 9,935,815 | |
Procter & Gamble Co. | | | 78,792 | | | 4,563,633 | |
| | | | |
|
| |
| | | | | | 14,499,448 | |
| | | | |
|
| |
ENERGY 5.1% | | | | | | | |
Energy Equipment & Services 4.1% | | | | | | | |
Schlumberger, Ltd. | | | 296,718 | | | 17,684,393 | |
Weatherford International, Ltd. * | | | 316,800 | | | 6,567,264 | |
| | | | |
|
| |
| | | | | | 24,251,657 | |
| | | | |
|
| |
Oil, Gas & Consumable Fuels 1.0% | | | | | | | |
Chevron Corp. | | | 39,868 | | | 2,807,903 | |
ConocoPhillips | | | 61,692 | | | 2,786,011 | |
| | | | |
|
| |
| | | | | | 5,593,914 | |
| | | | |
|
| |
FINANCIALS 17.7% | | | | | | | |
Capital Markets 7.5% | | | | | | | |
Legg Mason, Inc. ρ | | | 643,167 | | | 19,957,472 | |
SEI Investments Co. | | | 1,212,300 | | | 23,858,064 | |
| | | | |
|
| |
| | | | | | 43,815,536 | |
| | | | |
|
|
|
Consumer Finance 7.1% | | | | | | | |
American Express Co. | | | 368,000 | | | 12,475,200 | |
Visa, Inc., Class A ρ | | | 424,800 | | | 29,357,928 | |
| | | | |
|
| |
| | | | | | 41,833,128 | |
| | | | |
|
| |
See Notes to Financial Statements
19
SCHEDULE OF INVESTMENTS continued
September 30, 2009
| | | Shares | | | Value | |
|
|
|
|
|
|
| |
COMMON STOCKS continued | | | | | | | |
FINANCIALS continued | | | | | | | |
Diversified Financial Services 2.1% | | | | | | | |
MSCI, Inc., Class A * | | | 419,100 | | $ | 12,413,742 | |
| | | | |
|
| |
Insurance 1.0% | | | | | | | |
Marsh & McLennan Cos. | | | 245,687 | | | 6,075,839 | |
| | | | |
|
| |
HEALTH CARE 18.2% | | | | | | | |
Biotechnology 7.0% | | | | | | | |
Amgen, Inc. * | | | 246,206 | | | 14,828,987 | |
Biogen Idec, Inc. * | | | 522,763 | | | 26,409,987 | |
| | | | |
|
| |
| | | | | | 41,238,974 | |
| | | | |
|
| |
Health Care Equipment & Supplies 4.9% | | | | | | | |
Medtronic, Inc. | | | 233,118 | | | 8,578,743 | |
Zimmer Holdings, Inc. * | | | 381,543 | | | 20,393,473 | |
| | | | |
|
| |
| | | | | | 28,972,216 | |
| | | | |
|
| |
Health Care Providers & Services 0.4% | | | | | | | |
WellPoint, Inc. * | | | 52,407 | | | 2,481,995 | |
| | | | |
|
| |
Pharmaceuticals 5.9% | | | | | | | |
Bristol-Myers Squibb Co. | | | 193,227 | | | 4,351,472 | |
Merck & Co., Inc. | | | 310,084 | | | 9,807,957 | |
Novartis AG, ADR | | | 410,763 | | | 20,694,240 | |
| | | | |
|
| |
| | | | | | 34,853,669 | |
| | | | |
|
| |
INDUSTRIALS 7.1% | | | | | | | |
Air Freight & Logistics 7.1% | | | | | | | |
Expeditors International of Washington, Inc. ρ | | | 760,461 | | | 26,730,204 | |
United Parcel Service, Inc., Class B | | | 264,100 | | | 14,913,727 | |
| | | | |
|
| |
| | | | | | 41,643,931 | |
| | | | |
|
| |
INFORMATION TECHNOLOGY 27.9% | | | | | | | |
Communications Equipment 5.0% | | | | | | | |
Cisco Systems, Inc. * | | | 503,315 | | | 11,848,035 | |
QUALCOMM, Inc. | | | 392,484 | | | 17,653,930 | |
| | | | |
|
| |
| | | | | | 29,501,965 | |
| | | | |
|
| |
Internet Software & Services 5.3% | | | | | | | |
Google, Inc., Class A * | | | 62,435 | | | 30,958,395 | |
| | | | |
|
| |
IT Services 1.2% | | | | | | | |
Automatic Data Processing, Inc. | | | 184,747 | | | 7,260,557 | |
| | | | |
|
| |
Semiconductors & Semiconductor Equipment 6.1% | | | | | | | |
Altera Corp. | | | 1,314,074 | | | 26,951,658 | |
Linear Technology Corp. ρ | | | 321,600 | | | 8,885,808 | |
| | | | |
|
| |
| | | | | | 35,837,466 | |
| | | | |
|
| |
See Notes to Financial Statements
20
SCHEDULE OF INVESTMENTS continued
September 30, 2009
| | | Shares | | | Value | |
|
|
|
|
|
|
| |
COMMON STOCKS continued | | | | | | | |
INFORMATION TECHNOLOGY continued | | | | | | | |
Software 10.3% | | | | | | | |
FactSet Research Systems, Inc. ρ | | | 404,500 | | $ | 26,794,080 | |
Microsoft Corp. | | �� | 451,185 | | | 11,681,180 | |
Oracle Corp. | | | 1,076,631 | | | 22,436,990 | |
| | | | |
|
| |
| | | | | | 60,912,250 | |
| | | | |
|
| |
Total Common Stocks (cost $531,901,764) | | | | | | 583,041,249 | |
| | | | |
|
| |
SHORT-TERM INVESTMENTS 18.0% | | | | | | | |
MUTUAL FUND SHARES 18.0% | | | | | | | |
BGI Prime Money Market Fund, Premium Shares, 0.19% ρρ q | | | 8,331 | | | 8,331 | |
BlackRock Liquidity TempFund, Institutional Class, 0.22% ρρ q | | | 24,611,851 | | | 24,611,851 | |
Evergreen Institutional Money Market Fund, Class I, 0.13% ρρ q ø | | | 72,541,558 | | | 72,541,558 | |
Evergreen Institutional U.S. Government Money Market Fund, Class I, 0.01% q ø | | | 5,404,013 | | | 5,404,013 | |
Morgan Stanley Institutional Liquidity Fund Money Market Portfolio, Institutional Class, 0.16% ρρ q | | | 3,672,013 | | | 3,672,013 | |
| | | | |
|
| |
Total Short-Term Investments (cost $106,237,766) | | | | | | 106,237,766 | |
| | | | |
|
| |
Total Investments (cost $638,139,530) 117.0% | | | | | | 689,279,015 | |
Other Assets and Liabilities (17.0%) | | | | | | (100,130,808 | ) |
| | | | |
|
| |
Net Assets 100.0% | | | | | $ | 589,148,207 | |
| | | | |
|
| |
* | Non-income producing security |
ρ | All or a portion of this security is on loan. |
q | Rate shown is the 7-day annualized yield at period end. |
ρρ | All or a portion of this security represents investment of cash collateral received from securities on loan. |
ø | Evergreen Investment Management Company, LLC is the investment advisor to both the Fund and the money market fund. |
Summary of Abbreviations |
ADR | American Depository Receipt |
The following table shows the percent of total long-term investments by sector as of September 30, 2009:
Information Technology | | 28.3 | % |
Health Care | | 18.4 | % |
Financials | | 17.9 | % |
Consumer Discretionary | | 17.3 | % |
Industrials | | 7.1 | % |
Consumer Staples | | 5.9 | % |
Energy | | 5.1 | % |
| |
| |
| | 100.0 | % |
| |
| |
See Notes to Financial Statements
21
STATEMENT OF ASSETS AND LIABILITIES
September 30, 2009
Assets | | | | |
Investments in unaffiliated issuers, at value (cost $560,193,959) including $98,320,419 of securities loaned | | $ | 611,333,444 | |
Investments in affiliated issuers, at value (cost $77,945,571) | | | 77,945,571 | |
|
|
|
| |
Total investments | | | 689,279,015 | |
Segregated cash | | | 21,593 | |
Receivable for Fund shares sold | | | 867,593 | |
Dividends receivable | | | 583,265 | |
Receivable for securities lending income | | | 34,681 | |
Prepaid expenses and other assets | | | 33,204 | |
|
|
|
| |
Total assets | | | 690,819,351 | |
|
|
|
| |
Liabilities | | | | |
Payable for Fund shares redeemed | | | 651,074 | |
Payable for securities on loan | | | 100,855,346 | |
Advisory fee payable | | | 8,428 | |
Distribution Plan expenses payable | | | 5,812 | |
Due to other related parties | | | 4,274 | |
Trustees’ fees and expenses payable | | | 40,243 | |
Printing and postage expenses payable | | | 69,687 | |
Accrued expenses and other liabilities | | | 36,280 | |
|
|
|
| |
Total liabilities | | | 101,671,144 | |
|
|
|
| |
Net assets | | $ | 589,148,207 | |
|
|
|
| |
Net assets represented by | | | | |
Paid-in capital | | $ | 968,731,716 | |
Undistributed net investment income | | | 3,259,162 | |
Accumulated net realized losses on investments | | | (433,982,156 | ) |
Net unrealized gains on investments | | | 51,139,485 | |
|
|
|
| |
Total net assets | | $ | 589,148,207 | |
|
|
|
| |
Net assets consists of | | | | |
Class A | | $ | 460,082,301 | |
Class B | | | 51,983,915 | |
Class C | | | 43,806,409 | |
Class I | | | 32,437,260 | |
Class R | | | 838,322 | |
|
|
|
| |
Total net assets | | $ | 589,148,207 | |
|
|
|
| |
Shares outstanding (unlimited number of shares authorized) | | | | |
Class A | | | 16,176,446 | |
Class B | | | 2,125,219 | |
Class C | | | 1,785,969 | |
Class I | | | 1,103,744 | |
Class R | | | 29,842 | |
|
|
|
| |
Net asset value per share | | | | |
Class A | | $ | 28.44 | |
Class A — Offering price (based on sales charge of 5.75%) | | $ | 30.18 | |
Class B | | $ | 24.46 | |
Class C | | $ | 24.53 | |
Class I | | $ | 29.39 | |
Class R | | $ | 28.09 | |
|
|
|
| |
See Notes to Financial Statements
22
STATEMENT OF OPERATIONS
Year Ended September 30, 2009
Investment income | | | | |
Dividends (net of foreign withholding taxes of $100,564) | | $ | 7,675,604 | |
Securities lending | | | 3,079,792 | |
Income from affiliated issuers | | | 16,586 | |
|
|
|
| |
Total investment income | | | 10,771,982 | |
|
|
|
| |
Expenses | | | | |
Advisory fee | | | 2,571,350 | |
Distribution Plan expenses | | | | |
Class A | | | 952,114 | |
Class B | | | 552,187 | |
Class C | | | 341,293 | |
Class R | | | 2,937 | |
Administrative services fee | | | 494,490 | |
Transfer agent fees | | | 2,630,324 | |
Trustees’ fees and expenses | | | 11,108 | |
Printing and postage expenses | | | 150,533 | |
Custodian and accounting fees | | | 111,259 | |
Registration and filing fees | | | 43,473 | |
Professional fees | | | 52,517 | |
Other | | | 10,161 | |
|
|
|
| |
Total expenses | | | 7,923,746 | |
Less: Expense reductions | | | (539 | ) |
Fee waivers | | | (453,797 | ) |
|
|
|
| |
Net expenses | | | 7,469,410 | |
|
|
|
| |
Net investment income | | | 3,302,572 | |
|
|
|
| |
Net realized and unrealized gains or losses on investments | | | | |
Net realized losses on securities in unaffiliated issuers | | | (37,534,588 | ) |
Net change in unrealized gains or losses on securities in unaffiliated issuers | | | 47,129,070 | |
|
|
|
| |
Net realized and unrealized gains or losses on investments | | | 9,594,482 | |
|
|
|
| |
Net increase in net assets resulting from operations | | $ | 12,897,054 | |
|
|
|
| |
See Notes to Financial Statements
23
STATEMENTS OF CHANGES IN NET ASSETS
| | Year Ended September 30, | |
| |
| |
| | 2009 | | 2008 | |
|
|
|
|
| |
Operations | | | | | | | | | | | | | |
Net investment income (loss) | | | | | $ | 3,302,572 | | | | | $ | (98,735 | ) |
Net realized gains or losses on investments | | | | | | (37,534,588 | ) | | | | | 53,154,751 | |
Net change in unrealized gains or losses on investments | | | | | | 47,129,070 | | | | | | (158,872,973 | ) |
|
|
|
|
|
|
|
|
|
|
|
|
| |
Net increase (decrease) in net assets resulting from operations | | | | | | 12,897,054 | | | | | | (105,816,957 | ) |
|
|
|
|
|
|
|
|
|
|
|
|
| |
| | | Shares | | | | | | Shares | | | | |
|
|
|
|
|
|
|
|
|
|
|
|
| |
Capital share transactions | | | | | | | | | | | | | |
Proceeds from shares sold | | | | | | | | | | | | | |
Class A | | | 1,147,772 | | | 27,740,191 | | | 657,857 | | | 19,173,347 | |
Class B | | | 181,477 | | | 3,496,619 | | | 185,447 | | | 4,672,471 | |
Class C | | | 412,479 | | | 8,601,221 | | | 135,707 | | | 3,398,754 | |
Class I | | | 448,507 | | | 11,306,125 | | | 437,971 | | | 12,749,066 | |
Class R | | | 102,631 | | | 2,415,251 | | | 1,441 | | | 40,346 | |
|
|
|
|
|
|
|
|
|
|
|
|
| |
| | | | | | 53,559,407 | | | | | | 40,033,984 | |
|
|
|
|
|
|
|
|
|
|
|
|
| |
Automatic conversion of Class B shares to Class A shares | | | | | | | | | | | | | |
Class A | | | 826,492 | | | 18,988,798 | | | 1,774,811 | | | 52,181,962 | |
Class B | | | (957,225 | ) | | (18,988,798 | ) | | (2,038,327 | ) | | (52,181,962 | ) |
|
|
|
|
|
|
|
|
|
|
|
|
| |
| | | | | | 0 | | | | | | 0 | |
|
|
|
|
|
|
|
|
|
|
|
|
| |
Payment for shares redeemed | | | | | | | | | | | | | |
Class A | | | (2,889,525 | ) | | (65,971,047 | ) | | (4,277,673 | ) | | (124,234,805 | ) |
Class B | | | (697,389 | ) | | (13,569,375 | ) | | (1,220,607 | ) | | (30,910,292 | ) |
Class C | | | (350,181 | ) | | (6,917,725 | ) | | (410,037 | ) | | (10,349,294 | ) |
Class I | | | (195,688 | ) | | (4,830,031 | ) | | (97,637 | ) | | (2,902,103 | ) |
Class R | | | (75,911 | ) | | (1,804,408 | ) | | (341 | ) | | (9,490 | ) |
|
|
|
|
|
|
|
|
|
|
|
|
| |
| | | | | | (93,092,586 | ) | | | | | (168,405,984 | ) |
|
|
|
|
|
|
|
|
|
|
|
|
| |
Net decrease in net assets resulting from capital share transactions | | | | | | (39,533,179 | ) | | | | | (128,372,000 | ) |
|
|
|
|
|
|
|
|
|
|
|
|
| |
Total decrease in net assets | | | | | | (26,636,125 | ) | | | | | (234,188,957 | ) |
Net assets | | | | | | | | | | | | | |
Beginning of period | | | | | | 615,784,332 | | | | | | 849,973,289 | |
|
|
|
|
|
|
|
|
|
|
|
|
| |
End of period | | | | | $ | 589,148,207 | | | | | $ | 615,784,332 | |
|
|
|
|
|
|
|
|
|
|
|
|
| |
Undistributed net investment income (loss) | | | | | $ | 3,259,162 | | | | | $ | (43,410 | ) |
|
|
|
|
|
|
|
|
|
|
|
|
| |
See Notes to Financial Statements
24
NOTES TO FINANCIAL STATEMENTS
1. ORGANIZATION
Evergreen Omega Fund (the “Fund”) is a diversified series of Evergreen Equity Trust (the “Trust”), a Delaware statutory trust organized on September 18, 1997. The Trust is an open-end management investment company registered under the Investment Company Act of 1940, as amended (the “1940 Act”).
The Fund offers Class A, Class B, Class C, Class I and Class R shares. Class A shares are sold with a front-end sales charge. However, Class A share investments of $1 million or more are not subject to a front-end sales charge, but are subject to a contingent deferred sales charge of 1.00% upon redemption within 18 months. Effective after the close of business on June 30, 2009, Class B shares were closed to new accounts and additional purchases by existing shareholders. Class B shares are available for purchase only through (i) an exchange transaction in which Class B shares of another Evergreen fund are exchanged or (ii) the Fund’s dividend reinvestment program. Class B shares are sold without a front-end sales charge, but are subject to a contingent deferred sales charge that is payable upon redemption and decreases depending on how long the shares had been held. Class C shares are sold without a front-end sales charge, but are subject to a contingent deferred sales charge that is payable upon redemption within one year. Class I shares are sold without a front-end sales charge or contingent deferred sales charge. Class R shares are only available to participants in certain retirement plans and are sold without a front-end sales charge or contingent deferred sales charge. Each class of shares, except Class I shares, pays an ongoing distribution fee.
2. SIGNIFICANT ACCOUNTING POLICIES
The following is a summary of significant accounting policies consistently followed by the Fund in the preparation of its financial statements. The policies are in conformity with generally accepted accounting principles in the United States of America, which require management to make estimates and assumptions that affect amounts reported herein. Actual results could differ from these estimates. Management has considered the circumstances under which the Fund should recognize or make disclosures regarding events or transactions occurring subsequent to the balance sheet date through November 24, 2009 which represents the date the financial statements are issued. Adjustments or additional disclosures, if any, have been included in these financial statements.
a. Valuation of investments
Listed equity securities are usually valued at the last sales price or official closing price on the national securities exchange where the securities are principally traded. If there has been no sale, the securities are valued at the mean between bid and asked prices.
Short-term securities of sufficient credit quality with remaining maturities of 60 days or less at the time of purchase are valued at amortized cost, which approximates fair value.
Investments in open-end mutual funds are valued at net asset value. Securities for which market quotations are not readily available or not reflective of current fair value are valued
25
NOTES TO FINANCIAL STATEMENTS continued
at fair value as determined by the investment advisor in good faith, according to procedures approved by the Board of Trustees.
The valuation techniques used by the Fund to measure fair value are consistent with the market approach, income approach and/or cost approach, where applicable, for each security type.
b. Repurchase agreements
Securities pledged as collateral for repurchase agreements are held by the custodian bank or in a segregated account in the Fund’s name until the agreements mature. Collateral for certain tri-party repurchase agreements is held at the counterparty’s custodian in a segregated account for the benefit of the Fund and the counterparty. Each agreement requires that the market value of the collateral be sufficient to cover payments of interest and principal. However, in the event of default or bankruptcy by the other party to the agreement, retention of the collateral may be subject to legal proceedings. The Fund will enter into repurchase agreements with banks and other financial institutions, which are deemed by the investment advisor to be creditworthy pursuant to guidelines established by the Board of Trustees. In certain instances, the Fund’s securities lending agent may provide collateral in the form of repurchase agreements.
c. Securities lending
The Fund may lend its securities to certain qualified brokers in order to earn additional income. The Fund receives compensation in the form of fees or interest earned on the investment of any cash collateral received. The Fund also continues to receive interest and dividends on the securities loaned. The Fund receives collateral in the form of cash or securities with a market value at least equal to the market value of the securities on loan. In the event of default or bankruptcy by the borrower, the Fund could experience delays and costs in recovering the loaned securities or in gaining access to the collateral. In addition, the investment of any cash collateral received may lose all or part of its value. The Fund has the right under the lending agreement to recover the securities from the borrower on demand.
d. Security transactions and investment income
Security transactions are recorded on trade date. Realized gains and losses are computed using the specific cost of the security sold. Dividend income is recorded on the ex-dividend date. Foreign income and capital gains realized on some securities may be subject to foreign taxes, which are accrued as applicable.
e. Federal and other taxes
The Fund intends to continue to qualify as a regulated investment company and distribute all of its taxable income, including any net capital gains (which have already been offset by available capital loss carryovers). Accordingly, no provision for federal taxes is required. The Fund’s income and excise tax returns and all financial records supporting
26
NOTES TO FINANCIAL STATEMENTS continued
those returns for the prior three fiscal years are subject to examination by the federal, Massachusetts and Delaware revenue authorities.
f. Distributions
Distributions to shareholders from net investment income and net realized gains, if any, are recorded on the ex-dividend date. Such distributions are determined in conformity with income tax regulations, which may differ from generally accepted accounting principles.
Reclassifications have been made to the Fund’s components of net assets to reflect income and gains available for distribution (or available capital loss carryovers, as applicable) under income tax regulations. The primary permanent differences causing such reclassifications are due to expiration of capital loss carryovers. During the year ended September 30, 2009, the following amounts were reclassified:
|
|
|
|
Paid-in capital | $ | (7,956,060 | ) |
Accumulated net realized losses on investments | | 7,956,060 | |
|
|
|
|
g. Class allocations
Income, common expenses and realized and unrealized gains and losses are allocated to the classes based on the relative net assets of each class. Distribution fees, if any, are calculated daily at the class level based on the appropriate net assets of each class and the specific expense rates applicable to each class.
3. ADVISORY FEE AND OTHER TRANSACTIONS WITH AFFILIATES
Evergreen Investment Management Company, LLC (“EIMC”), a subsidiary of Wells Fargo & Company (“Wells Fargo”), is the investment advisor to the Fund and is paid an annual fee starting at 0.52% and declining to 0.41% as average daily net assets increase. For the year ended September 30, 2009, the advisory fee was equivalent to an annual rate of 0.52% of the Fund’s average daily net assets.
On October 3, 2008, Wells Fargo and Wachovia Corporation (“Wachovia”) announced that Wells Fargo agreed to acquire Wachovia in a whole company transaction that would include all of Wachovia’s banking and other businesses. In connection with this transaction, Wachovia issued preferred shares to Wells Fargo representing approximately a 40% voting interest in Wachovia. Due to its ownership of preferred shares, Wells Fargo may have been deemed to control EIMC. If Wells Fargo was deemed to control EIMC, then the existing advisory agreement between the Fund and EIMC would have terminated automatically in connection with the issuance of preferred shares. To address this possibility, on October 20, 2008 the Board of Trustees approved an interim advisory agreement with EIMC with the same terms and conditions as the existing agreement which became effective upon the issuance of the preferred shares. EIMC’s receipt of the advisory fees under the interim advisory agreement was subject to the approval by shareholders of the Fund of a new advisory agreement with EIMC.
27
NOTES TO FINANCIAL STATEMENTS continued
On December 31, 2008, Wachovia merged with and into Wells Fargo and as a result of the merger, EIMC, Evergreen Investment Services, Inc. (“EIS”) and Evergreen Service Company, LLC (“ESC”) became subsidiaries of Wells Fargo. After the merger, a new interim advisory agreement with the same terms and conditions between the Fund and EIMC went into effect.
Shareholders approved the new advisory agreement between the Fund and EIMC on March 12, 2009.
From time to time, EIMC may voluntarily or contractually waive its fee and/or reimburse expenses in order to limit operating expenses. During the year ended September 30, 2009, EIMC voluntarily waived its advisory fee in the amount of $453,797.
The Fund may invest in money market funds which are advised by EIMC. Income earned on these investments is included in income from affiliated issuers on the Statement of Operations.
EIMC also serves as the administrator to the Fund providing the Fund with facilities, equipment and personnel. EIMC is paid an annual rate determined by applying percentage rates to the aggregate average daily net assets of the Evergreen funds (excluding money market funds) starting at 0.10% and declining to 0.05% as the aggregate average daily net assets of the Evergreen funds (excluding money market funds) increase. For the year ended September 30, 2009, the administrative services fee was equivalent to an annual rate of 0.10% of the Fund’s average daily net assets.
ESC, an affiliate of EIMC and a subsidiary of Wells Fargo, is the transfer and dividend disbursing agent for the Fund. ESC receives account fees that vary based on the type of account held by the shareholders in the Fund. For the year ended September 30, 2009, the transfer agent fees were equivalent to an annual rate of 0.53% of the Fund’s average daily net assets.
Wachovia Bank NA, a subsidiary of Wells Fargo and an affiliate of EIMC, through its securities lending division, Wachovia Global Securities Lending, acts as the securities lending agent for the Fund (see Note 5).
The Fund has placed a portion of its portfolio transactions with brokerage firms that are affiliates of Wells Fargo. During the year ended September 30, 2009, the Fund paid brokerage commissions of $10,256 to broker-dealers affiliated with Wells Fargo.
4. DISTRIBUTION PLANS
EIS, an affiliate of EIMC and a subsidiary of Wells Fargo, serves as distributor of the Fund’s shares. The Fund has adopted Distribution Plans, as allowed by Rule 12b-1 of the 1940 Act, for each class of shares, except Class I. Under the Distribution Plans, the Fund is permitted to pay distribution fees at an annual rate of up to 0.75% of the average daily net assets for each of Class A shares and up to 1.00% of the average daily net assets for
28
NOTES TO FINANCIAL STATEMENTS continued
each of Class B, Class C and Class R shares. However, currently the distribution fees for Class A shares are limited to 0.25% of the average daily net assets of the class and the distribution fees for Class R shares are limited to 0.50% of the average daily net assets of Class R shares.
For the year ended September 30, 2009, EIS received $19,908 from the sale of Class A shares and $559, $135,835 and $1,655 in contingent deferred sales charges from redemptions of Class A, Class B and Class C shares, respectively.
5. INVESTMENT TRANSACTIONS
Cost of purchases and proceeds from sales of investment securities (excluding short-term securities) were $130,933,416 and $168,864,476, respectively, for the year ended September 30, 2009.
Fair value measurements are determined within a framework that has established a fair value hierarchy based upon the various data inputs utilized in determining the value of the Fund’s investments. These inputs are summarized into three broad levels as follows:
Level 1 – quoted prices in active markets for identical securities Level 2 – other significant observable inputs (including quoted prices for similar securities, interest rates, prepayment speeds, credit risk, etc.) Level 3 – significant unobservable inputs (including the Fund’s own assumptions in determining the fair value of investments) |
The inputs or methodologies used for valuing securities are not necessarily an indication of the risk associated with investing in those securities.
As of September 30, 2009, the inputs used in valuing the Fund’s assets, which are carried at fair value, were as follows:
Investments in Securities | | Quoted Prices
(Level 1) | | Significant
Other
Observable
Inputs
(Level 2) | | Significant
Unobservable
Inputs
(Level 3) | | Total | |
|
|
|
|
|
|
|
|
| |
Equity securities | | | | | | | | | | | | | | | | | |
Common stocks | | $ | 583,041,249 | | | $ | 0 | | | | $ | 0 | | | $ | 583,041,249 | |
Short-term investments | | | 106,237,766 | | | | 0 | | | | | 0 | | | | 106,237,766 | |
|
|
|
|
|
|
|
|
|
|
|
|
|
|
|
|
| |
| | $ | 689,279,015 | | | $ | 0 | | | | $ | 0 | | | $ | 689,279,015 | |
|
|
|
|
|
|
|
|
|
|
|
|
|
|
|
|
| |
Further details on the major security types listed above can be found in the Schedule of Investments.
During the year ended September 30, 2009, the Fund loaned securities to certain brokers and earned $3,079,792, net of $341,970 paid to Wachovia Global Securities Lending as the securities lending agent. At September 30, 2009, the value of securities on loan and the total value of collateral received for securities loaned (including segregated cash) amounted to $98,320,419 and $100,855,346, respectively.
29
NOTES TO FINANCIAL STATEMENTS continued
On September 30, 2009, the aggregate cost of securities for federal income tax purposes was $639,824,373. The gross unrealized appreciation and depreciation on securities based on tax cost was $93,820,689 and $44,366,047, respectively, with a net unrealized appreciation of $49,454,642.
As of September 30, 2009, the Fund had $400,398,111 in capital loss carryovers for federal income tax purposes with $196,908,105 expiring in 2010, $199,421,027 expiring in 2011 and $4,068,979 expiring in 2017. Certain portions of the capital loss carryovers of the Fund were assumed as a result of acquisitions. These losses are subject to certain limitations prescribed by the Internal Revenue Code.
For income tax purposes, capital losses incurred after October 31 within the Fund’s fiscal year are deemed to arise on the first business day of the following fiscal year. As of September 30, 2009, the Fund incurred and will elect to defer post-October losses of $31,899,202.
6. INTERFUND LENDING
Pursuant to an Exemptive Order issued by the SEC, the Fund may participate in an interfund lending program with certain funds in the Evergreen fund family. This program allows the Fund to borrow from, or lend money to, other participating funds. During the year ended September 30, 2009, the Fund did not participate in the interfund lending program.
7. DISTRIBUTIONS TO SHAREHOLDERS
As of September 30, 2009, the components of distributable earnings on a tax basis were as follows:
Undistributed
Ordinary
Income | Unrealized
Appreciation | Capital Loss
Carryovers and
Post-October
Losses | Temporary
Book/Tax
Differences |
|
|
|
|
$3,301,484 | $49,454,642 | $432,297,313 | $(42,322) |
|
|
|
|
The differences between the components of distributable earnings on a tax basis and the amounts reflected in the Statement of Assets and Liabilities are primarily due to wash sales. The temporary book/tax differences are a result of timing differences between book and tax recognition of income and/or expenses.
8. EXPENSE REDUCTIONS
Through expense offset arrangements with ESC and the Fund’s custodian, a portion of fund expenses has been reduced.
9. DEFERRED TRUSTEES’ FEES
Each Trustee of the Fund may defer any or all compensation related to performance of his or her duties as a Trustee. The Trustees’ deferred balances are allocated to deferral
30
NOTES TO FINANCIAL STATEMENTS continued
accounts, which are included in the accrued expenses for the Fund. The investment performance of the deferral accounts is based on the investment performance of certain Evergreen funds. Any gains earned or losses incurred in the deferral accounts are reported in the Fund’s Trustees’ fees and expenses. At the election of the Trustees, the deferral account will be paid either in one lump sum or in quarterly installments for up to ten years.
10. FINANCING AGREEMENT
The Fund and certain other Evergreen funds share in a $100 million unsecured revolving credit commitment for temporary and emergency purposes, including the funding of redemptions, as permitted by each participating fund’s borrowing restrictions. Borrowings under this facility bear interest at the higher of the Federal Funds rate plus 1.25% or LIBOR plus 1.25%. Prior to June 26, 2009, the interest rate was 0.50% per annum above the Federal Funds rate. All of the participating funds are charged an annual commitment fee of 0.145% on the unused balance, which is allocated pro rata. Prior to June 26, 2009, the annual commitment fee was 0.09%. During the year ended September 30, 2009, the Fund had no borrowings under this agreement.
11. REGULATORY MATTERS AND LEGAL PROCEEDINGS
The Evergreen funds, EIMC and certain of EIMC’s affiliates are involved in various legal actions, including private litigation and class action lawsuits, and are and may in the future be subject to regulatory inquiries and investigations.
EIMC and EIS have reached final settlements with the Securities and Exchange Commission (“SEC”) and the Securities Division of the Secretary of the Commonwealth of Massachusetts (“Commonwealth”) primarily relating to the liquidation of Evergreen Ultra Short Opportunities Fund (“Ultra Short Fund”). The claims settled include the following: first, that during the period February 2007 through Ultra Short Fund’s liquidation on June 18, 2008, Ultra Short Fund’s former portfolio management team failed to properly take into account readily-available information in valuing certain non-agency residential mortgage-backed securities held by the Ultra Short Fund, resulting in the Ultra Short Fund’s net asset value (“NAV”) being overstated during the period; second, that EIMC and EIS acted inappropriately when, in an effort to explain the decline in Ultra Short Fund’s NAV, certain information regarding the decline was communicated to some, but not all, shareholders and financial intermediaries; third, that the Ultra Short Fund portfolio management team did not adhere to regulatory requirements for affiliated cross trades in executing trades with other Evergreen funds; and finally, that from at least September 2007 to August 2008, EIS did not preserve certain text and instant messages transmitted via personal digital assistant devices. In settling these matters, EIMC and EIS have agreed to payments totaling $41,125,000, up to $40,125,000 of which will be distributed to eligible shareholders of Ultra Short Fund pursuant to a methodology and
31
NOTES TO FINANCIAL STATEMENTS continued
plan approved by the regulators. EIMC and EIS neither admitted nor denied the regulators’ conclusions.
Three purported class actions have also been filed in the U.S. District Court for the District of Massachusetts relating to the same events; defendants include various Evergreen entities, including EIMC and EIS, and Evergreen Fixed Income Trust and its Trustees. The cases generally allege that investors in the Ultra Short Fund suffered losses as a result of (i) misleading statements in Ultra Short Fund’s registration statement and prospectus, (ii) the failure to accurately price securities in the Ultra Short Fund at different points in time and (iii) the failure of the Ultra Short Fund’s risk disclosures and description of its investment strategy to inform investors adequately of the actual risks of the fund.
EIMC does not expect that any of the legal actions, inquiries or settlement of regulatory matters will have a material adverse impact on the financial position or operations of the Fund to which these financial statements relate. Any publicity surrounding or resulting from any legal actions or regulatory inquiries involving EIMC or its affiliates or any of the Evergreen Funds could result in reduced sales or increased redemptions of Evergreen fund shares, which could increase Evergreen fund transaction costs or operating expenses or have other adverse consequences on the Evergreen funds, including the Fund.
32
REPORT OF INDEPENDENT REGISTERED PUBLIC ACCOUNTING FIRM
Board of Trustees and Shareholders
Evergreen Equity Trust
We have audited the accompanying statement of assets and liabilities, including the schedule of investments, of the Evergreen Omega Fund, a series of the Evergreen Equity Trust, as of September 30, 2009 and the related statement of operations for the year then ended, statements of changes in net assets for each of the years in the two-year period then ended and the financial highlights for each of the years in the five-year period then ended. These financial statements and financial highlights are the responsibility of the Fund’s management. Our responsibility is to express an opinion on these financial statements and financial highlights based on our audits.
We conducted our audits in accordance with the standards of the Public Company Accounting Oversight Board (United States). Those standards require that we plan and perform the audit to obtain reasonable assurance about whether the financial statements and financial highlights are free of material misstatement. An audit includes examining, on a test basis, evidence supporting the amounts and disclosures in the financial statements. Our procedures included confirmation of securities owned as of September 30, 2009 by correspondence with the custodian and brokers. An audit also includes assessing the accounting principles used and significant estimates made by management, as well as evaluating the overall financial statement presentation. We believe that our audits provide a reasonable basis for our opinion.
In our opinion, the financial statements and financial highlights referred to above present fairly, in all material respects, the financial position of the Evergreen Omega Fund as of September 30, 2009, the results of its operations, changes in its net assets and financial highlights for each of the years described above, in conformity with U.S. generally accepted accounting principles.

Boston, Massachusetts
November 24, 2009
33
ADDITIONAL INFORMATION (unaudited)
INFORMATION ABOUT THE REVIEW AND APPROVAL OF THE FUND’S INVESTMENT ADVISORY AGREEMENT
Each year, as required by law, the Fund’s Board of Trustees determines whether to approve the continuation of the Fund’s investment advisory agreements. At an in person meeting on September 23-24, 2009, the Trustees, including a majority of the Trustees who are not “interested persons” (as that term is defined in the 1940 Act) of the Fund or EIMC (the “independent Trustees”), approved the continuation of the Fund’s investment advisory agreements. (References below to the “Fund” are to Evergreen Omega Fund; references to the “funds” are to the Evergreen funds generally.)
At the same time, the Trustees considered the continuation of the investment advisory agreements for all of the Evergreen funds. The description below refers in many cases to the Trustees’ process for considering, and conclusions regarding, all of the funds’ agreements. In all of their deliberations, the Board of Trustees and the independent Trustees were advised by independent counsel to the independent Trustees and counsel to the funds.
The review process. In connection with its review of the funds’ investment advisory agreements, the Board of Trustees requests and evaluates, and EIMC and any sub-advisors are required to furnish, such information as the Trustees consider to be reasonably necessary in the circumstances. Over the course of the year preceding their September 2009 meeting, the Trustees regularly reviewed information regarding the investment performance of all of the funds. As part of their ongoing review of investment performance, the Trustees monitored for changes in performance and for the results of any changes in a fund’s investment process or investment team. The Trustees paid particular attention to funds whose performance since September 2008 (when the Trustees completed their 2008 review of the funds’ investment advisory agreements) indicated short-term or longer-te rm performance issues and to funds that they had identified during their 2008 review process as having short- or longer-term performance issues.
In spring 2009, a committee of the Board of Trustees (the “Committee”), working with EIMC management, determined generally the types of information the Trustees would review as part of the 2009 review process and set a timeline detailing the information required and the dates for its delivery to the Trustees. The Board engaged the independent data provider Keil Fiduciary Strategies LLC (“Keil”) to provide fund-specific and industry-wide data containing information of a nature and in a format generally prescribed by the Committee, and the Committee worked with Keil and EIMC to develop appropriate groups of peer funds for each fund. The Committee also identified a number of expense, performance, and other areas of review and requested specific information as to those areas of review.
The Trustees formed small groups to review individual funds in greater detail. They reviewed, with the assistance of an independent industry consultant that they retained, the
34
ADDITIONAL INFORMATION (unaudited) continued
information that EIMC and Keil provided. In addition, the Trustees considered information regarding, among other things, the funds’ brokerage practices, the funds’ use of derivatives, analyst and research support available to the portfolio management teams, risk management practices, and certain fall-out benefits received directly and indirectly by EIMC and its affiliates from the funds. The Trustees requested and received additional information following that review.
In December 2008 Wells Fargo & Company (“Wells Fargo”) acquired Wachovia Corporation (“Wachovia”), EIMC’s parent company. Wells Fargo and EIMC have taken steps to combine the operations of Wells Fargo’s investment management affiliates and EIMC during the past year and have proposed to the Trustees the combination of the mutual fund families managed by them. During the course of the year, and during their review, the Trustees requested and received information about Wells Fargo and its advisory and broker-dealer operations, the status of efforts to combine the Wells Fargo and Evergreen investment management operations, and the effects on the funds and on the services provided by EIMC and its affiliates to the funds. In their deliberations, the Trustees were mindful that it was possible that the proposed combination of the two fund families might be effected during the coming 12-month period.
The Committee met several times by telephone during the 2009 review process to consider the information provided to it. The Committee then met with representatives of EIMC and its affiliates, including Wells Fargo. In addition, during the course of their review, the Trustees discussed the continuation of the funds’ advisory agreements with representatives of EIMC, and in meetings with independent legal counsel in multiple private sessions at which no personnel of EIMC were present. At a meeting of the full Board of Trustees held on September 23-24, 2009, the Committee reported the results of its discussions with EIMC. The full Board met with representatives of EIMC and its affiliates and engaged in further review of the materials provided to it, after which the independent Trustees and the full Board approved the continuation of each of the advisory and sub-advisory agreements.
The Trustees’ determination to approve the continuation of the advisory and sub-advisory agreements was based on a comprehensive evaluation of all of the information provided to them. In considering the continuation of the agreements, the Trustees did not identify any particular information or consideration that was all-important or controlling, and each Trustee attributed different weights to various factors. The Trustees evaluated information provided to them both in terms of the funds generally and with respect to each fund, including the Fund, specifically as they considered appropriate. Although the Trustees considered the continuation of the agreements for each of the funds as part of the larger process of considering the continuation of the advisory contracts for all of the funds, their determination to continue the advisory agreements for each of the funds was ultimately made on a fund-by-fund basis.
35
ADDITIONAL INFORMATION (unaudited) continued
This summary describes a number of the most important, but not necessarily all, of the factors considered by the Board and the independent Trustees.
Information reviewed. The Board of Trustees and committees of the Board of Trustees met periodically during the course of the year. EIMC presented a wide variety of information at those meetings regarding the services it provides for the funds, the investment performance of the funds, and other aspects of the business and operations of the funds. At those meetings, and in the process of considering the continuation of the agreements, the Trustees considered information regarding, for example, the funds’ investment results; the portfolio management teams for the funds and the experience of the members of the teams, and any recent changes in the membership of the teams; portfolio trading practices; compliance by the funds and EIMC with applicable laws and regulations and with the funds’ and EIMC’s compliance policies and procedures; risk evaluation and ove rsight procedures at EIMC; services provided by affiliates of EIMC to the funds and shareholders of the funds; and other information relating to the nature, extent, and quality of services provided by EIMC. The Trustees considered a number of changes in portfolio management personnel at EIMC and its advisory affiliates in the year since September 2008. The Trustees also considered changes in personnel at the funds and EIMC, including the appointment of a new President of the funds, who also serves as President and Chief Operating Officer of EIMC, and a new Chief Investment Officer of EIMC in August of 2008.
The Trustees considered the rates at which the funds pay investment advisory fees, and the efforts generally by EIMC and its affiliates as sponsors of the funds. The data provided by Keil showed the management fees paid by each fund in comparison to the management fees of other peer mutual funds, in addition to data regarding the investment performance of the funds in comparison to other peer mutual funds. The Trustees were assisted by an independent industry consultant in reviewing the information presented to them.
The Trustees noted that, in certain cases, EIMC and/or its affiliates provide advisory services to other clients that are comparable to the advisory services they provide to certain funds. The Trustees considered the information EIMC provided regarding the rates at which those other clients pay advisory fees to EIMC. Fees charged to those other clients were generally lower than those charged to the respective funds. In respect of these other accounts, EIMC noted that the compliance, reporting, and other legal burdens of providing investment advice to mutual funds generally exceed those required to provide advisory services to non-mutual fund clients such as retirement or pension plans.
The Trustees considered the transfer agency fees paid by the funds to an affiliate of EIMC. They reviewed information presented to them showing that the transfer agency fees charged to the funds were generally consistent with industry norms.
36
ADDITIONAL INFORMATION (unaudited) continued
The Trustees also considered that EIMC serves as administrator to the funds and receives a fee for its services as administrator. In their comparison of fees paid by the funds with those paid by other mutual funds, the Trustees considered administrative fees paid by the funds and those other mutual funds. They considered that EIS, an affiliate of EIMC, would serve as distributor to the funds until January 3, 2010, and that Wells Fargo Funds Distributor, LLC, also an affiliate of EIMC, would serve as distributor to the funds beginning on January 4, 2010, and noted that the distributor receives fees from the funds for those services. The Trustees also considered other so-called “fall-out” benefits to EIMC and its affiliates due to their other relationships with the funds, including, for example, soft-dollar services received by EIMC attributable to transactions entered into by EIMC on behalf of the funds and brokerage commissions received by Wells Fargo Advisors, LLC (“Wells Fargo Advisors”) (formerly Wachovia Securities, LLC), an affiliate of EIMC, from transactions effected by it for the funds. The Trustees noted that the funds pay sub-transfer agency fees to various financial institutions, including Wells Fargo Advisors and its affiliates, that hold fund shares in omnibus accounts, and that an affiliate of EIMC receives fees for administering the sub-transfer agency payment program. In reviewing the services provided by an affiliate of EIMC, the Trustees noted that the affiliate of EIMC that provides transfer agency services to the funds had won recognition from Dalbar customer service each year since 1998, and also won recognition from National Quality Review for customer service and for accuracy in processing transactions in 2008. They also considered that Wells Fargo Advisors and its affiliates receive distribution-related fees and shareholder servicing payments (including amounts derived from payments under the funds’ Rule 12b-1 plans) in respect of shares sold or held through them and that an affiliate of EIMC receives compensation for serving as a securities lending agent for a number of the funds.
The Trustees considered regulatory actions taken against EIMC or its affiliates in the past year, and on-going reviews of the operations of EIMC and its affiliates as they might affect the funds. They considered the findings of the regulators, the cooperation of EIMC and its affiliates with those regulators and with the Trustees in respect of those actions and reviews, and the remedial steps EIMC and its affiliates have taken in response. They also considered the scope and nature of on-going reviews being conducted by EIMC and its affiliates, and communications to the Trustees relating to those reviews.
Nature and quality of the services provided. The Trustees considered that EIMC and its affiliates generally provide a comprehensive investment management service to the funds. They noted that EIMC formulates and implements an investment program for the Fund. They noted that EIMC makes its personnel available to serve as officers of the funds, and concluded that the reporting and management functions provided by EIMC with respect to the funds were generally satisfactory. The Trustees considered the investment philosophy of the Fund’s portfolio management team and the in-house research
37
ADDITIONAL INFORMATION (unaudited) continued
capabilities of EIMC and its affiliates, as well as other resources available to EIMC, including research services available to it from third parties.
The Trustees considered the managerial and financial resources available to EIMC and its affiliates and the commitment that the Evergreen/Wells Fargo organization has made to the funds generally. They considered assurances from representatives of Wells Fargo that the merger of Wells Fargo and Wachovia and the integration of those firms’ advisory and broker-dealer operations was not expected to result in any adverse effect on the funds, on the quality and level of services that EIMC provides to the funds, or on the resources available to the funds and to EIMC, and that Wells Fargo is committed to continue providing the funds with high-quality services.
The Trustees noted the resources EIMC and its affiliates have committed to the regulatory, compliance, accounting, tax and oversight of tax reporting, and shareholder servicing functions, and the number and quality of staff committed to those functions, which they concluded were appropriate and generally in line with EIMC’s responsibilities to the Fund and to the funds generally. The Board and the independent Trustees concluded, within the context of their overall conclusions regarding the funds’ advisory agreements, that they were generally satisfied with the nature, extent, and quality of the services provided by EIMC, including services provided by EIMC under its administrative services agreements with the funds. They determined that the nature and scope of the services provided by EIMC were consistent with EIMC’s duties under the investment advisory agreements and appropriate and consistent with the investment programs and best interests of the funds.
Investment performance. The Trustees considered the investment performance of each fund, both by comparison to other comparable mutual funds and to broad market indices. Although the Trustees considered the performance of all share classes, the Trustees noted that, for the one-, three-, five-, and ten-year periods ended December 31, 2008, the Fund’s Class A shares had outperformed the Fund’s benchmark index, the Russell 1000 Growth Index. The Trustees also noted that the Fund’s Class A shares’ performance was in the first quintile for the one- and three-year periods ended December 31, 2008, and in the second quintile for the five- and ten-year periods ended December 31, 2008, of the mutual funds against which the Trustees compared the Fund’s performance.
The Trustees discussed each fund’s performance with representatives of EIMC. In each instance where a fund experienced a substantial period of underperformance relative to its benchmark index and/or the non-Evergreen fund peers against which the Trustees compared the fund’s performance, the Trustees considered EIMC’s explanation of the reasons for the relative underperformance and the steps being taken to address the relative underperformance. The Trustees emphasized that the continuation of the investment advisory agreement for a fund should not be taken as any indication that the Trustees did not believe investment performance for any specific fund might not be improved, and
38
ADDITIONAL INFORMATION (unaudited) continued
they noted that they would continue to monitor closely the investment performance of the funds going forward.
Advisory and administrative fees. The Trustees recognized that EIMC does not seek to provide the lowest cost investment advisory service, but to provide a high quality, full-service investment management product at a reasonable price. They also noted that EIMC has in many cases sought to set its investment advisory fees at levels consistent with industry norms. The Trustees noted that, in certain cases, a fund’s management fees were higher than many or most other mutual funds in the same Keil peer group. However, in each case, the Trustees determined on the basis of the information presented that the level of management fees was not excessive. The Trustees noted that the management fee paid by the Fund was lower than the management fees paid by most of the other mutual funds against which the Trustees compared the Fund’s management fee, and that the level of profitability realized by EIMC in respect of the fee did not appear excessive.
Economies of scale. The Trustees noted the possibility that economies of scale would be achieved by EIMC in managing the funds as the funds grow. They reviewed the breakpoints in the Fund’s advisory fee structure, which operate generally to reduce the effective management fee rate of the Fund (as a percentage of Fund assets) as the Fund grows in size. They considered that, as a fund shrinks in size, breakpoints result in increasing fee levels. The Trustees noted that they would continue to review the appropriate levels of breakpoints in the future, and concluded that the breakpoints as implemented appeared to be a reasonable step toward the realization of economies of scale by the Fund.
Profitability. The Trustees considered information provided to them regarding the profitability to the EIMC organization of the investment advisory, administration, and transfer agency (with respect to the open-end funds only) fees paid to EIMC and its affiliates by each of the funds. They considered that the information provided to them was necessarily estimated, and that the profitability information provided to them, especially on a fund-by-fund basis, did not necessarily provide a definitive tool for evaluating the appropriateness of each fund’s advisory fee. They noted that the levels of profitability of the funds to EIMC varied widely, depending on, among other things, the size and type of fund. They considered the profitability of the funds in light of such factors as, for example, the information they had received regarding the relation of the fees paid by the funds to those paid by other mutual funds, the investment performance of the funds, and the amount of revenues involved. In light of these factors, the Trustees concluded that the profitability to EIMC of the services provided to any of the funds, individually or in the aggregate, should not prevent the Trustees from approving the continuation of the agreements.
39
TRUSTEES AND OFFICERS
TRUSTEES1 | |
Charles A. Austin III
Trustee
DOB: 10/23/1934
Term of office since: 1991
Other directorships: None | Investment Counselor, Anchor Capital Advisors, LLC. (investment advice); Director, The Andover Companies (insurance); Trustee, Arthritis Foundation of New England; Former Director, The Francis Ouimet Society (scholarship program); Former Director, Executive Vice President and Treasurer, State Street Research & Management Company (investment advice) |
|
|
K. Dun Gifford
Trustee
DOB: 10/23/1938
Term of office since: 1974
Other directorships: None | Chairman and President, Oldways Preservation and Exchange Trust (education); Trustee, Member of the Executive Committee, Former Chairman of the Finance Committee, and Former Treasurer, Cambridge College |
|
|
Dr. Leroy Keith, Jr.
Trustee
DOB: 2/14/1939
Term of office since: 1983
Other directorships: Trustee,
Phoenix Fund Complex
(consisting of 50 portfolios
as of 12/31/2008) | Managing Director, Almanac Capital Management (commodities firm); Trustee, Phoenix Fund Complex; Director, Diversapack Co. (packaging company); Former Partner, Stonington Partners, Inc. (private equity fund); Former Director, Obagi Medical Products Co.; Former Director, Lincoln Educational Services |
|
|
Carol A. Kosel
Trustee
DOB: 12/25/1963
Term of office since: 2008
Other directorships: None | Former Consultant to the Evergreen Boards of Trustees; Former Vice President and Senior Vice President, Evergreen Investments, Inc.; Former Treasurer, Evergreen Funds; Former Treasurer, Vestaur Securities Fund |
|
|
Gerald M. McDonnell
Trustee
DOB: 7/14/1939
Term of office since: 1988
Other directorships: None | Former Manager of Commercial Operations, CMC Steel (steel producer) |
|
|
Patricia B. Norris
Trustee
DOB: 4/9/1948
Term of office since: 2006
Other directorships: None | President and Director of Buckleys of Kezar Lake, Inc. (real estate company); Former President and Director of Phillips Pond Homes Association (home community); Former Partner, PricewaterhouseCoopers, LLP (independent registered public accounting firm) |
|
|
William Walt Pettit2
Trustee
DOB: 8/26/1955
Term of office since: 1988
Other directorships: None | Partner and Vice President, Kellam & Pettit, P.A. (law firm); Director, Superior Packaging Corp. (packaging company); Member, Superior Land, LLC (real estate holding company), Member, K&P Development, LLC (real estate development); Former Director, National Kidney Foundation of North Carolina, Inc. (non-profit organization) |
|
|
David M. Richardson
Trustee
DOB: 9/19/1941
Term of office since: 1982
Other directorships: None | President, Richardson, Runden LLC (executive recruitment advisory services); Director, J&M Cumming Paper Co. (paper merchandising); Former Trustee, NDI Technologies, LLP (communications); Former Consultant, AESC (The Association of Executive Search Consultants) |
|
|
Russell A. Salton III, MD
Trustee
DOB: 6/2/1947
Term of office since: 1984
Other directorships: None | President/CEO, AccessOne MedCard, Inc. |
|
|
40
TRUSTEES AND OFFICERS continued
Michael S. Scofield
Trustee
DOB: 2/20/1943
Term of office since: 1984
Other directorships: None | Retired Attorney, Law Offices of Michael S. Scofield; Former Director and Chairman, Branded Media Corporation (multi-media branding company) |
|
|
Richard J. Shima
Trustee
DOB: 8/11/1939
Term of office since: 1993
Other directorships: None | Independent Consultant; Director, Hartford Hospital; Trustee, Greater Hartford YMCA; Former Director, Trust Company of CT; Former Trustee, Saint Joseph College (CT) |
|
|
Richard K. Wagoner, CFA3
Trustee
DOB: 12/12/1937
Term of office since: 1999
Other directorships: None | Member and Former President, North Carolina Securities Traders Association; Member, Financial Analysts Society |
|
|
OFFICERS | |
W. Douglas Munn4
President
DOB: 4/21/1963
Term of office since: 2009 | Principal occupations: Chief Operating Officer, Wells Fargo Funds Management, LLC; President and Chief Operating Officer, Evergreen Investment Company, Inc. |
|
|
Jeremy DePalma4
Treasurer
DOB: 2/5/1974
Term of office since: 2005 | Principal occupations: Senior Vice President, Evergreen Investment Management Company, LLC; Former Vice President, Evergreen Investment Services, Inc.; Former Assistant Vice President, Evergreen Investment Services, Inc. |
|
|
Michael H. Koonce4
Secretary
DOB: 4/20/1960
Term of office since: 2000 | Principal occupations: Senior Vice President and General Counsel, Evergreen Investment Services, Inc.; Secretary, Senior Vice President and General Counsel, Evergreen Investment Management Company, LLC and Evergreen Service Company, LLC |
|
|
Robert Guerin4
Chief Compliance Officer
DOB: 9/20/1965
Term of office since: 2007 | Principal occupations: Chief Compliance Officer, Evergreen Funds and Senior Vice President of Evergreen Investment Company, Inc.; Former Managing Director and Senior Compliance Officer, Babson Capital Management LLC; Former Principal and Director, Compliance and Risk Management, State Street Global Advisors; Former Vice President and Manager, Sales Practice Compliance, Deutsche Asset Management |
|
|
1 | Each Trustee serves until a successor is duly elected or qualified or until his or her death, resignation, retirement or removal from office. Each Trustee oversaw 77 Evergreen funds as of December 31, 2008. Correspondence for each Trustee may be sent to Evergreen Board of Trustees, P.O. Box 20083, Charlotte, NC 28202. |
2 | It is possible that Mr. Pettit may be viewed as an “interested person” of the Evergreen funds, as defined in the 1940 Act, because of his law firm’s previous representation of affiliates of Wells Fargo & Company (“Wells Fargo”), the parent to the Evergreen funds’ investment advisor, EIMC. The Trustees are treating Mr. Pettit as an interested trustee for the time being. |
3 | Mr. Wagoner is an “interested person” of the Evergreen funds because of his ownership of shares in Wells Fargo & Company, the parent to the Evergreen funds’ investment advisor. |
4 | The address of the Officer is 200 Berkeley Street, Boston, MA 02116. |
Additional information about the Fund’s Board of Trustees and Officers can be found in the Statement of Additional Information (SAI) and is available upon request without charge by calling 800.343.2898.
41

563830 rv7 11/2009
Evergreen Small-Mid Growth Fund

This annual report must be preceded or accompanied by a prospectus of the Evergreen fund contained herein. The prospectus contains more complete information, including fees and expenses, and should be read carefully before investing or sending money.
The fund will file its complete schedule of portfolio holdings with the SEC for the first and third quarters of each fiscal year on Form N-Q. The fund’s Form N-Q will be available on the SEC’s Web site at http://www.sec.gov. In addition, the fund’s Form N-Q may be reviewed and copied at the SEC’s Public Reference Room in Washington, D.C. Information on the operation of the Public Reference Room may be obtained by calling 800.SEC.0330.
A description of the fund’s proxy voting policies and procedures, as well as information regarding how the fund voted proxies relating to portfolio securities during the most recent 12-month period ended June 30, is available by visiting our Web site at EvergreenInvestments.com or by visiting the SEC’s Web site at http://www.sec.gov. The fund’s proxy voting policies and procedures are also available without charge, upon request, by calling 800.343.2898.
Mutual Funds:
| NOT FDIC INSURED | MAY LOSE VALUE | NOT BANK GUARANTEED |
Evergreen InvestmentsSM is a service mark of Evergreen Investment Management Company, LLC. Copyright 2009, Evergreen Investment Management Company, LLC.
Evergreen Investment Management Company, LLC is a subsidiary of Wells Fargo & Company and is an affiliate of Wells Fargo & Company’s other Broker Dealer subsidiaries.
Evergreen mutual funds are distributed by Evergreen Investment Services, Inc. 200 Berkeley Street, Boston, MA 02116
| | table of contents |
2 | | LETTER TO SHAREHOLDERS |
4 | | FUND AT A GLANCE |
6 | | PORTFOLIO MANAGER COMMENTARY |
10 | | ABOUT YOUR FUND’S EXPENSES |
11 | | FINANCIAL HIGHLIGHTS |
13 | | SCHEDULE OF INVESTMENTS |
17 | | STATEMENT OF ASSETS AND LIABILITIES |
18 | | STATEMENT OF OPERATIONS |
19 | | STATEMENTS OF CHANGES IN NET ASSETS |
20 | | NOTES TO FINANCIAL STATEMENTS |
28 | | REPORT OF INDEPENDENT REGISTERED PUBLIC ACCOUNTING FIRM |
29 | | ADDITIONAL INFORMATION |
36 | | TRUSTEES AND OFFICERS |
1
LETTER TO SHAREHOLDERS
November 2009

W. Douglas Munn
President and Chief Executive Officer
Dear Shareholder:
We are pleased to provide the Annual Report for Evergreen Small-Mid Growth Fund for the twelve-month period ended September 30, 2009 (the “period”).
Capital markets throughout the globe continued to experience extreme pressure during the period. Home prices fell and job losses persisted. The collapse of Lehman Brothers in September 2008 led to collateral damage in the ensuing weeks as venerable financial institutions both in the United States and Europe fell like dominos. Distrust prevailed, and counter-party risk, whether real or imagined, escalated. Inter-bank lending ceased to exist, and the credit markets froze. In response, the Federal Reserve Board (the “Fed”), the U.S. Treasury, the Federal Deposit Insurance Corporation, and the Securities and Exchange Commission took a series of dramatic and innovative steps to help the economy and the financial markets emerge from this crisis. In October 2008, Congress rushed through a $700 billion rescue plan designed to address the capital inadequacy of banks. Meanwhile, in a further effort to re-stimulate lending activity, the Fed twice slashed the key fed funds rate in October 2008, bringing the influential overnight lending rate to just 1.00%. The Fed slashed rates again in December to near zero, where it stayed during the remainder of the period. Overseas, other major central banks also cut short-term rates to inject liquidity into the financial markets. At the same time, foreign governments took other measures to buttress financial institutions and forestall the possibility of a global recession.
Early in 2009, the fixed-income markets worried about deflation, as evidenced by investor willingness to accept virtually nothing for short-term loans to the government. Concerns about federal spending also increased with the $787 billion American Recovery and Reinvestment Act of 2009, signed into law in February. Yields climbed for longer-term U.S. Treasuries during the first quarter of 2009. International markets were hit hard, as economies in both developed and emerging countries struggled. Equity markets were affected by the weakness in economic data and corporate profits, although stocks rallied off their March 9th lows, with international and small cap stocks leading the gains. Signs of stability emerged in the corporate credit markets, as both issuance and performance improved. The price of oil surged in the second quarter of 2009, pulling most commodities higher, as the dollar weakened and gold gave back earlier gains. However, gold surged at the end of the fiscal year, and stocks finished a banner third quarter 2009, with all major market indexes climbing by approximately 15%, as investor sentiment was buoyed by signs of improvement in the economy and corporate
2
LETTER TO SHAREHOLDERS continued
earnings. In international markets, most major equity indexes doubled in the developing world from their lows of last year, while the market gains in developed economies have been somewhat more muted.
While recent data reflect an economy that is managing to climb from the depths reached in March, we question whether the fundamentals are in place for sustainable growth, given that economic reports continue to display data that is simply “less bad” than it was earlier in the fiscal year. Until we see stabilization in home prices and employment, it is unlikely that activity will exceed anything beyond what is considered to be “below potential” for any period of time.
During a volatile and challenging period in the capital markets, the investment managers of Evergreen’s growth-oriented equity funds focused on managing risk and finding potential opportunities while maintaining the goal of seeking long-term capital appreciation. Managers of Evergreen Large Company Growth Fund and Evergreen Omega Fund focused on bottom-up, fundamental analysis in making individual stock selections. The management teams supervising Evergreen Mid Cap Growth Fund and Evergreen Small-Mid Growth Fund, meanwhile, sought out growing companies with strong fundamentals and reasonable valuations. At the same time, managers of Evergreen Growth Fund concentrated on opportunities among small cap growth companies with above-average earnings prospects and reasonable stock prices. The team supervising Evergreen Strategic Growth Fund, meanwhile, focused on large cap companies offering superior long-term growth potential.
We believe the changing conditions in the investment environment over the period have underscored the value of a well-diversified, long-term investment strategy that seeks to help soften the effects of volatility in any one market or asset class. As always, we encourage investors to maintain diversified investment portfolios in pursuit of their long-term investment goals.
Please visit us at EvergreenInvestments.com for more information about our funds and other investment products available to you. Thank you for your continued support of Evergreen Investments.
Sincerely,

W. Douglas Munn
President and Chief Executive Officer
Evergreen Funds
3
FUND AT A GLANCE
as of September 30, 2009
MANAGEMENT TEAM
Investment Advisor:
Evergreen Investment Management Company, LLC
Portfolio Managers:
Robert C. Junkin, CPA; Lori S. Evans; Julian J. Johnson
CURRENT INVESTMENT STYLE

Source: Morningstar, Inc.
Morningstar’s style box is based on a portfolio date as of 9/30/2009.
The Equity style box placement is based on 10 growth and valuation measures for each fund holding and the median size of the companies in which the fund invests.
PERFORMANCE AND RETURNS
Portfolio inception date: 10/11/2005
| Class A | Class I |
Class inception date | 10/11/2005 | 10/11/2005 |
|
|
|
Nasdaq symbol | ESMGX | ESMIX |
|
|
|
Average annual return* | | |
|
|
|
1-year with sales charge | -5.76% | N/A |
|
|
|
1-year w/o sales charge | 0.00% | 0.19% |
|
|
|
Since portfolio inception | 2.68% | 4.46% |
|
|
|
Maximum sales charge | 5.75% | N/A |
| Front-end | |
|
|
|
* | Adjusted for maximum applicable sales charge, unless noted. |
Past performance is no guarantee of future results. The performance quoted represents past performance and current performance may be lower or higher. The investment return and principal value of an investment will fluctuate so that investors’ shares, when redeemed, may be worth more or less than their original cost. To obtain performance information current to the most recent month-end for Classes A or I, please go to EvergreenInvestments.com/fundperformance. The performance of each class may vary based on differences in loads, fees and expenses paid by the shareholders investing in each class. Performance includes the reinvestment of income dividends and capital gain distributions. Performance shown does not reflect the deduction of taxes that a shareholder would pay on fund distributions or the redemption of fund shares.
The fund incurs a 12b-1 fee of 0.25% for Class A. Class I does not pay a 12b-1 fee.
The advisor is waiving a portion of its advisory fee. Had the fee not been waived, returns would have been lower. Returns reflect expense limits previously in effect for Class A, without which returns for Class A would have been lower.
Class I shares are only offered, subject to the minimum initial purchase requirements, in the following manner: (1) to investment advisory clients of EIMC (or its advisory affiliates), (2) to employer- or state-sponsored benefit plans, including but not limited to, retirement plans, defined benefit plans, deferred compensation plans, or savings plans, (3) to fee-based mutual fund wrap accounts, (4) through arrangements entered into on behalf of the Evergreen funds with certain financial services firms, (5) to certain institutional investors, and (6) to persons who owned Class Y shares in registered name in an Evergreen fund on or before December 31, 1994 or who owned shares of any SouthTrust fund in registered name as of March 18, 2005 or who owned shares of Vestaur Securities Fund as of May 20, 2005.
4
FUND AT A GLANCE continued
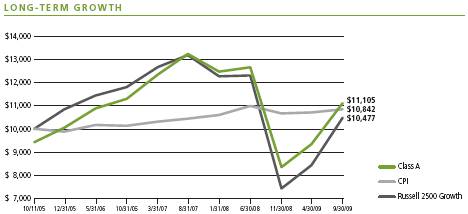
Comparison of a $10,000 investment in the Evergreen Small-Mid Growth Fund Class A shares versus a similar investment in the Russell 2500 Growth Index (Russell 2500 Growth) and the Consumer Price Index (CPI).
The Russell 2500 Growth is an unmanaged market index and does not include transaction costs associated with buying and selling securities, any mutual fund fees or expenses or any taxes. The CPI is a commonly used measure of inflation and does not represent an investment return. It is not possible to invest directly in an index.
Class I shares are only available to institutional shareholders with a minimum of $1 million investment, which may be waived in certain situations.
The fund’s investment objective may be changed without a vote of the fund’s shareholders.
Small and mid cap securities may be subject to special risks associated with narrower product lines and limited financial resources compared to their large cap counterparts, and, as a result, small and mid cap securities may decline significantly in market downturns and may be more volatile than those of larger companies due to the higher risk of failure.
All data is as of September 30, 2009, and subject to change.
5
PORTFOLIO MANAGER COMMENTARY
The fund’s Class A shares returned 0.00% for the twelve-month period ended September 30, 2009, excluding any applicable sales charges. During the same period, the Russell 2500 Growth returned -3.08%.
The fund’s objective is to seek long-term capital growth.
Investment process
During the fiscal year ended September 30, 2009, the stock market experienced a roller-coaster ride, as the near collapse of the financial system caused a mass exodus from the market. The subsequent muted recovery, as the market limped into 2009, was then met with a substantial drop, culminating in a bottoming in March, which has since been followed by a massive recovery rally into September. Throughout this “Great Recession,” commodity prices plummeted, unemployment soared, and many banks failed. The governments of the world scrambled to cobble together stimulus packages to inject liquidity and support the floundering financial system. Numerous financial and non-financial companies received government bailouts to remain solvent. As we have progressed through 2009, signs of stabilization emerged, despite persistently high unemployment and a weak housing market.
The U.S. equity markets continued to rise throughout 2009 along with expectations that the deep recession could be bottoming. International indexes have maintained their upward trajectory from the first quarter. While investors continued to drive equity prices higher, consumers continued to retrench, as the unemployment picture remained cloudy. However, China’s growth became a bright spot globally as its stimulus efforts have lead to resurging economic expansion there. This growth helped drive demand for commodities worldwide. The price of oil and many other commodities have continued to move up. This, in turn, has driven up the prices of industrial, energy, and materials companies. Additionally, technology and financial stocks have rallied as well.
During the year, we lowered exposure to Industrials, Consumer Staples, Health Care, and Financials, while adding to the Information Technology, Energy, Consumer Discretionary, and Materials sectors. A portion of these changes was driven by a Russell 2500 Growth Index rebalance that took place in June of 2009. In Industrials, we eliminated JA Solar and Landstar Systems on weakening expectations for margins and earnings and Titan International on lowered growth in its end markets. We also removed Watson Wyatt on concerns about its exposure to the shrinking financial services business. Within the consumer area, we deleted Ralcorp Holdings and Warnaco in Consumer Staples and Consumer Discretionary, respectively. In Consumer Discretionary, the fund added new positions in O’Reilly Automotive, Guess? Inc. and PetSmart. Within Energy, we eliminated the fund’s holdings in Atwood Oceanics, Tesoro Corp., Ion Geophysical, Atlas Energy, and Cabot Oil & Gas in an effort to focus our investments on oil-focused producers. Regarding the Financials sector, we added asset manager Invesco and eliminated PrivateBancorp. In Health Care, we added clinical research leader Charles
6
PORTFOLIO MANAGER COMMENTARY continued
River Labs as well as Myriad Genetics and Shire Pharmaceuticals. We believe these companies offer sustainable growth prospects at reasonable valuations. In Information Technology, we added touch-screen leader Synaptics and networking player NetLogic Microsystems. Finally, we added consumer lawn product leader Scotts Miracle-Gro in the Materials sector.
Contributors to performance
The majority of the fund’s performance results in 2009 came from stock selection. Positive stock contributions came from Consumer Discretionary, Industrials, Energy, and Information Technology. Post-secondary education provider Capella Education and Priceline.com were two stocks that generated positive contributions during the period. Capella Education, a long-term holding, offered investors not only a perceived safe haven in the volatile market environment due to its sustainable growth characteristics and competitive advantages but also strong revenue and earnings growth. Priceline.com, a leader in Internet travel auctions, was a strong performer as the global economy began to recover and the consumer desire to travel returned. The Industrials sector performed, as its cyclically leveraged constituents benefited from the nascent global recovery, and several of our stock selections in the area outperformed substantially. Many of these companies have benefited from global exposure, with strong growth in end markets, in addition to the weak dollar. Global cable manufacturer, General Cable, led the recovery, as demand for its products expanded rapidly. One of the best-performing stocks in the sector was Corrections Corp. of America, an owner and manager of prisons and other correctional facilities throughout the United States. The company has been reporting better-than-forecasted revenues, operating margins, and earnings. In Energy, our overweight benefited the fund, as our strong stock performers, such as Southwest Energy, were beneficiaries of rising natural gas prices and new production. In addition, oil-focused Continental Resources was also an outperformer. Other strong stocks included Syntel, an information technology outsourcing company that beat expectations on both the top and bottom line. Lower pricing pressure and tighter cost controls contributed to the strong results. Continued strength in the core outsourcing business and increased margins led to a significant increase in forward guidance. Communications equipment manufacturer F5 Networks saw its shares rise after it continued to report strong earnings results, as expected, but with higher margins due to reduced costs. Management indicated that new business closure rates have improved during the year, creating potential for further margin expansion. F5 continues to hold a dominant position in the application delivery controller market, especially on the high end, and the fund maintained its position in the shares. Quality Systems, a health care information systems provider, benefitted from solid earnings and the prospect of new business from efforts to reform the health care system.
Detractors from performance
The worst detractors from performance in the fiscal year were the fund’s stock selections in the Health Care, Financials, and Telecommunication Services sectors. In Health Care,
7
PORTFOLIO MANAGER COMMENTARY continued
some of the fund’s underperformance was due to lack of exposure to small biotech companies, many of which rose strongly during the recovery rally. Psychiatric Solutions reported disappointing earnings and disclosed an investigation into one of its facilities. We have since sold the stock. OSI Pharmaceuticals disclosed new data about its lead drug Tarceva at the American Society of Clinical Onclogy recently. The data was positive for Tarceva’s use in certain cancer treatment regimens but was perceived as disappointing by the investment community. In Financials, Private Bancorp suffered dramatically as the financial crisis unfolded. Due to our concerns about the small financial services provider’s exposure to the commercial real estate market, we eliminated our position. Finally, in the Telecommunication Services sector, NII Holdings, a Latin American wireless service provider, experienced difficult operating conditions during the global recession. We now believe that growth in Latin America has resumed and the company may benefit going forward.
Portfolio management outlook
Despite the strong market moves seen over the past six months, we currently expect the positive momentum to decelerate over the next several months. Pent-up demand due to excess cash levels and risk aversion appear to have been put to work in anticipation of an inventory re-build, driving economic growth in the second half of 2009. Market moves based on economic data that is “less bad” than it had typically been may prove to be of short duration. Based on fundamentals, such as historically low interest rates and inflation as well as historically high cash levels in investment portfolios and on corporate balance sheets, we don’t see the market dropping to previous crisis-induced levels. The Fall is historically a more challenging period for the market in general, and considering the rapid appreciation of the global markets, a pause, however brief, may unfold in the short-term. We believe there are positives developing on the earnings horizon and that next year will likely show gains, but that remains to be seen. Given the uncertainties surrounding home prices, distressed assets on bank balance sheets, unemployment, federal spending, credit availability, and auto bankruptcies, a volatile market environment is expected to continue for the remainder of 2009. We continue to emphasize companies with good growth potential, strong cash flow generation, and attractive valuation.
We believe today’s environment has created attractive opportunities for the long-term investor, and we believe we are currently positioned to take advantage of the potential growth and valuation opportunities across several sectors. We continue to seek strong companies in the more cyclical areas, including Information Technology, Energy, Consumer Discretionary, and Industrials. We have been focusing our research on companies with strong franchise and global growth components, as these characteristics, in conjunction with attractive valuations, historically have yielded solid potential additions to the portfolio. Consumer Staples, a typically defensive sector, appears to be widely owned and at risk for earnings disappointments due to weakening demand
8
PORTFOLIO MANAGER COMMENTARY continued
coupled with high expectations. Overall, we view the risk-reward as negatively skewed in this sector for investors with a one- to two-year horizon, and presently we are positioning the fund accordingly.
This commentary reflects the views and opinions of the fund’s portfolio manager(s) on the date indicated and may include statements that constitute “forward-looking statements” under the U.S. Securities laws. Forward-looking statements include, among other things, projections, estimates and information about possible or future results related to the fund, markets, or regulatory developments. The views expressed above are not guarantees of future performance or economic results and involve certain risks, uncertainties and assumptions that could cause actual outcomes and results to differ materially from the views expressed herein. The views expressed above are subject to change at any time based upon economic, market, or other conditions and Evergreen undertakes no obligation to update the views expressed herein. Any discussions of specific securities should not be considered a recommendation to buy or sell those securities. The views expressed herein (including any forward-looking statements) may not be relied upon as investment advice or as an indication of the fund’s trading intent.
9
ABOUT YOUR FUND’S EXPENSES
The Example below is intended to describe the fees and expenses borne by shareholders and the impact of those costs on your investment.
Example
As a shareholder of the fund, you incur two types of costs: (1) transaction costs, including sales charges (loads), redemption fees and exchange fees; and (2) ongoing costs, including management fees, distribution (12b-1) fees and other fund expenses. This Example is intended to help you understand your ongoing costs (in dollars) of investing in the fund and to compare these costs with the ongoing costs of investing in other mutual funds. The Example is based on an investment of $1,000 invested at the beginning of the period and held for the entire period from April 1, 2009 to September 30, 2009.
The example illustrates your fund’s costs in two ways:
• Actual expenses
The section in the table under the heading “Actual” provides information about actual account values and actual expenses. You may use the information in these columns, together with the amount you invested, to estimate the expenses that you paid over the period. Simply divide your account value by $1,000 (for example, an $8,600 account value divided by $1,000 = 8.6), then multiply the result by the number in the appropriate column for your share class, in the column entitled “Expenses Paid During Period” to estimate the expenses you paid on your account during this period.
• Hypothetical example for comparison purposes
The section in the table under the heading “Hypothetical (5% return before expenses)” provides information about hypothetical account values and hypothetical expenses based on the fund’s actual expense ratio and an assumed rate of return of 5% per year before expenses, which is not the fund’s actual return. The hypothetical account values and expenses may not be used to estimate the actual ending account balance or expenses you paid for the period. You may use this information to compare the ongoing costs of investing in the fund and other funds. To do so, compare this 5% hypothetical example with the 5% hypothetical examples that appear in the shareholder reports of the other funds.
Please note that the expenses shown in the table are meant to highlight your ongoing costs only and do not reflect any transactional costs, such as sales charges (loads), redemption fees or exchange fees. Therefore, the section in the table under the heading “Hypothetical (5% return before expenses)” is useful in comparing ongoing costs only, and will not help you determine the relative total costs of owning different funds. In addition, if these transactional costs were included, your costs would have been higher.
| Beginning | Ending | |
| Account Value | Account Value | Expenses Paid |
| 4/1/2009 | 9/30/2009 | During Period* |
|
|
|
|
Actual | | | |
Class A | $1,000.00 | $1,330.00 | $7.13 |
Class I | $1,000.00 | $1,332.92 | $5.67 |
Hypothetical | | | |
(5% return before expenses) | | | |
Class A | $1,000.00 | $1,018.95 | $6.17 |
Class I | $1,000.00 | $1,020.21 | $4.91 |
|
|
|
|
* | For each class of the fund, expenses are equal to the annualized expense ratio of each class (1.22% for Class A and 0.97% for Class I), multiplied by the average account value over the period, multiplied by 183 / 365 days. |
10
FINANCIAL HIGHLIGHTS
(For a share outstanding throughout each period)
| | Year Ended September 30, | |
| |
| |
CLASS A | | 2009 | | 2008 | | 2007 | | 20061 | |
|
|
|
|
|
|
|
|
| |
Net asset value, beginning of period | | $ | 10.64 | | $ | 14.73 | | $ | 11.53 | | $ | 10.00 | |
|
|
|
|
|
|
|
|
|
|
|
|
| |
Income from investment operations | | | | | | | | | | | | | |
Net investment loss | | | (0.05 | ) | | (0.08 | ) | | (0.11 | )2 | | (0.05 | ) |
Net realized and unrealized gains or losses on investments | | | 0.05 | | | (2.59 | ) | | 3.31 | | | 1.58 | |
| |
|
|
|
|
|
|
|
|
|
|
| |
Total from investment operations | | | 0 | | | (2.67 | ) | | 3.20 | | | 1.53 | |
|
|
|
|
|
|
|
|
|
|
|
|
| |
Distributions to shareholders from | | | | | | | | | | | | | |
Net realized gains | | | 0 | | | (1.36 | ) | | 0 | | | 0 | |
Tax basis return of capital | | | 0 | | | (0.06 | ) | | 0 | | | 0 | |
| |
|
|
|
|
|
|
|
|
|
|
| |
Total distributions to shareholders | | | 0 | | | (1.42 | ) | | 0 | | | 0 | |
|
|
|
|
|
|
|
|
|
|
|
|
| |
Net asset value, end of period | | $ | 10.64 | | $ | 10.64 | | $ | 14.73 | | $ | 11.53 | |
|
|
|
|
|
|
|
|
|
|
|
|
| |
Total return3 | | | 0.00 | % | | (20.01 | )% | | 27.75 | % | | 15.30 | % |
|
|
|
|
|
|
|
|
|
|
|
|
| |
Ratios and supplemental data | | | | | | | | | | | | | |
Net assets, end of period (thousands) | | $ | 24,441 | | $ | 26,497 | | $ | 45,706 | | $ | 3 | |
Ratios to average net assets | | | | | | | | | | | | | |
Expenses including waivers/reimbursements but excluding expense reductions | | | 1.22 | % | | 1.18 | % | | 1.17 | % | | 1.18 | %4, 5 |
Expenses excluding waivers/reimbursements and expense reductions | | | 1.69 | % | | 1.33 | % | | 1.28 | % | | 1.99 | %4 |
Net investment loss | | | (0.55 | )% | | (0.48 | )% | | (0.79 | )% | | (0.66 | )%4 |
Portfolio turnover rate | | | 69 | % | | 129 | % | | 192 | % | | 132 | % |
|
|
|
|
|
|
|
|
|
|
|
|
| |
1 | For the period from October 11, 2005 (commencement of class operations), to September 30, 2006. |
2 | Per share amount is based on average shares outstanding during the period. |
3 | Excluding applicable sales charges |
5 | Including the expense reductions, the ratio would be 1.17%. |
See Notes to Financial Statements
11
FINANCIAL HIGHLIGHTS
(For a share outstanding throughout each period)
| | Year Ended September 30, | |
| |
| |
CLASS I | | 2009 | | 2008 | | 2007 | | 20061 | |
|
|
|
|
|
|
|
|
| |
Net asset value, beginning of period | | $ | 10.71 | | $ | 14.77 | | $ | 11.54 | | $ | 10.00 | |
|
|
|
|
|
|
|
|
|
|
|
|
| |
Income from investment operations | | | | | | | | | | | | | |
Net investment loss | | | (0.04 | ) | | (0.03 | )2 | | (0.06 | )2 | | (0.02 | ) |
Net realized and unrealized gains or losses on investments | | | 0.06 | | | (2.61 | ) | | 3.30 | | | 1.56 | |
| |
|
|
|
|
|
|
|
|
|
|
| |
Total from investment operations | | | 0.02 | | | (2.64 | ) | | 3.24 | | | 1.54 | |
|
|
|
|
|
|
|
|
|
|
|
|
| |
Distributions to shareholders from | | | | | | | | | | | | | |
Net investment income | | | 0 | | | 0 | | | (0.01 | ) | | 0 | |
Net realized gains | | | 0 | | | (1.36 | ) | | 0 | | | 0 | |
Tax basis return of capital | | | 0 | | | (0.06 | ) | | 0 | | | 0 | |
| |
|
|
|
|
|
|
|
|
|
|
| |
Total distributions to shareholders | | | 0 | | | (1.42 | ) | | (0.01 | ) | | 0 | |
|
|
|
|
|
|
|
|
|
|
|
|
| |
Net asset value, end of period | | $ | 10.73 | | $ | 10.71 | | $ | 14.77 | | $ | 11.54 | |
|
|
|
|
|
|
|
|
|
|
|
|
| |
Total return | | | 0.19 | % | | (19.72 | )% | | 28.11 | % | | 15.40 | % |
|
|
|
|
|
|
|
|
|
|
|
|
| |
Ratios and supplemental data | | | | | | | | | | | | | |
Net assets, end of period (thousands) | | $ | 24,710 | | $ | 17,489 | | $ | 140,931 | | $ | 22,429 | |
Ratios to average net assets | | | | | | | | | | | | | |
Expenses including waivers/reimbursements but excluding expense reductions | | | 0.97 | % | | 0.92 | % | | 0.92 | % | | 0.93 | %3, 4 |
Expenses excluding waivers/reimbursements and expense reductions | | | 1.44 | % | | 1.04 | % | | 0.98 | % | | 1.74 | %3 |
Net investment loss | | | (0.35 | )% | | (0.27 | )% | | (0.42 | )% | | (0.37 | )%3 |
Portfolio turnover rate | | | 69 | % | | 129 | % | | 192 | % | | 132 | % |
|
|
|
|
|
|
|
|
|
|
|
|
| |
1 | For the period from October 11, 2005 (commencement of class operations), to September 30, 2006. |
2 | Per share amount is based on average shares outstanding during the period. |
4 | Including the expense reductions, the ratio would be 0.92% |
See Notes to Financial Statements
12
SCHEDULE OF INVESTMENTS
September 30, 2009
| | | Shares | | | Value | |
|
|
|
|
|
|
| |
COMMON STOCKS 96.2% | | | | | | | |
CONSUMER DISCRETIONARY 20.4% | | | | | | | |
Diversified Consumer Services 4.2% | | | | | | | |
Capella Education Co. * | | | 17,357 | | $ | 1,168,821 | |
Strayer Education, Inc. | | | 4,100 | | | 892,488 | |
| | | | |
|
| |
| | | | | | 2,061,309 | |
| | | | |
|
| |
Hotels, Restaurants & Leisure 3.7% | | | | | | | |
Buffalo Wild Wings, Inc. * ρ | | | 25,948 | | | 1,079,696 | |
Penn National Gaming, Inc. * | | | 26,100 | | | 721,926 | |
| | | | |
|
| |
| | | | | | 1,801,622 | |
| | | | |
|
| |
Internet & Catalog Retail 1.8% | | | | | | | |
priceline.com, Inc. * | | | 5,500 | | | 912,010 | |
| | | | |
|
| |
Specialty Retail 8.2% | | | | | | | |
Aeropostale, Inc. * | | | 24,900 | | | 1,082,403 | |
GameStop Corp., Class A * | | | 20,000 | | | 529,400 | |
Guess?, Inc. | | | 27,200 | | | 1,007,488 | |
O’Reilly Automotive, Inc. * | | | 17,000 | | | 614,380 | |
PetSmart, Inc. | | | 35,700 | | | 776,475 | |
| | | | |
|
| |
| | | | | | 4,010,146 | |
| | | | |
|
| |
Textiles, Apparel & Luxury Goods 2.5% | | | | | | | |
Hanesbrands, Inc. * | | | 57,400 | | | 1,228,360 | |
| | | | |
|
| |
CONSUMER STAPLES 3.1% | | | | | | | |
Food Products 0.9% | | | | | | | |
Hain Celestial Group, Inc. * | | | 23,400 | | | 448,578 | |
| | | | |
|
| |
Personal Products 2.2% | | | | | | | |
Alberto-Culver Co. | | | 39,500 | | | 1,093,360 | |
| | | | |
|
| |
ENERGY 6.5% | | | | | | | |
Oil, Gas & Consumable Fuels 6.5% | | | | | | | |
Continental Resources, Inc. * | | | 31,400 | | | 1,229,938 | |
Denbury Resources, Inc. * | | | 52,177 | | | 789,438 | |
Southwestern Energy Co. * | | | 28,156 | | | 1,201,698 | |
| | | | |
|
| |
| | | | | | 3,221,074 | |
| | | | |
|
| |
FINANCIALS 3.6% | | | �� | | | | |
Capital Markets 1.8% | | | | | | | |
INVESCO, Ltd. | | | 37,600 | | | 855,776 | |
| | | | |
|
| |
Commercial Banks 0.5% | | | | | | | |
Associated Banc-Corp. | | | 23,100 | | | 263,802 | |
| | | | |
|
| |
Thrifts & Mortgage Finance 1.3% | | | | | | | |
NewAlliance Bancshares, Inc. | | | 59,800 | | | 639,860 | |
| | | | |
|
| |
See Notes to Financial Statements
13
SCHEDULE OF INVESTMENTS continued
September 30, 2009
| | | Shares | | | Value | |
|
|
|
|
|
|
| |
COMMON STOCKS continued | | | | | | | |
HEALTH CARE 17.0% | | | | | | | |
Biotechnology 5.0% | | | | | | | |
Alexion Pharmaceuticals, Inc. * | | | 17,300 | | $ | 770,542 | |
Cephalon, Inc. * | | | 18,240 | | | 1,062,298 | |
Myriad Genetics, Inc. * | | | 23,000 | | | 630,200 | |
| | | | |
|
| |
| | | | | | 2,463,040 | |
| | | | |
|
| |
Health Care Equipment & Supplies 1.9% | | | | | | | |
ResMed, Inc. * | | | 20,400 | | | 922,080 | |
| | | | |
|
| |
Life Sciences Tools & Services 7.9% | | | | | | | |
AMAG Pharmaceuticals, Inc. * | | | 20,400 | | | 891,072 | |
Charles River Laboratories International, Inc. * | | | 20,200 | | | 746,996 | |
Life Technologies Corp. * | | | 25,200 | | | 1,173,060 | |
Qiagen NV * | | | 49,200 | | | 1,046,976 | |
| | | | |
|
| |
| | | | | | 3,858,104 | |
| | | | |
|
| |
Pharmaceuticals 2.2% | | | | | | | |
Shire, Ltd., ADS | | | 21,000 | | | 1,098,090 | |
| | | | |
|
| |
INDUSTRIALS 13.1% | | | | | | | |
Commercial Services & Supplies 2.1% | | | | | | | |
Corrections Corporation of America * | | | 46,300 | | | 1,048,695 | |
| | | | |
|
| |
Electrical Equipment 6.2% | | | | | | | |
EnerSys, Inc. * | | | 51,300 | | | 1,134,756 | |
General Cable Corp. * | | | 24,300 | | | 951,345 | |
Roper Industries, Inc. | | | 18,940 | | | 965,561 | |
| | | | |
|
| |
| | | | | | 3,051,662 | |
| | | | |
|
| |
Machinery 1.4% | | | | | | | |
Wabtec | | | 18,300 | | | 686,799 | |
| | | | |
|
| |
Professional Services 1.5% | | | | | | | |
FTI Consulting, Inc. * | | | 16,938 | | | 721,728 | |
| | | | |
|
| |
Trading Companies & Distributors 1.9% | | | | | | | |
MSC Industrial Direct Co., Class A | | | 21,125 | | | 920,628 | |
| | | | |
|
| |
INFORMATION TECHNOLOGY 24.9% | | | | | | | |
Communications Equipment 4.9% | | | | | | | |
F5 Networks, Inc. * | | | 31,557 | | | 1,250,604 | |
NICE-Systems, Ltd., ADS * | | | 38,108 | | | 1,160,007 | |
| | | | |
|
| |
| | | | | | 2,410,611 | |
| | | | |
|
| |
Computers & Peripherals 1.2% | | | | | | | |
Synaptics, Inc. * ρ | | | 22,500 | | | 567,000 | |
| | | | |
|
| |
See Notes to Financial Statements
14
SCHEDULE OF INVESTMENTS continued
September 30, 2009
| | | Shares | | | Value | |
|
|
|
|
|
|
| |
COMMON STOCKS continued | | | | | | | |
INFORMATION TECHNOLOGY continued | | | | | | | |
Electronic Equipment, Instruments & Components 3.9% | | | | | | | |
Flir Systems, Inc. * | | | 34,000 | | $ | 950,980 | |
Itron, Inc. * | | | 15,332 | | | 983,395 | |
| | | | |
|
| |
| | | | | | 1,934,375 | |
| | | | |
|
| |
Internet Software & Services 1.7% | | | | | | | |
VistaPrint, Ltd. * ρ | | | 16,800 | | | 852,600 | |
| | | | |
|
| |
IT Services 3.6% | | | | | | | |
Syntel, Inc. ρ | | | 36,969 | | | 1,764,530 | |
| | | | |
|
| |
Semiconductors & Semiconductor Equipment 7.3% | | | | | | | |
Monolithic Power Systems, Inc. * | | | 40,894 | | | 958,964 | |
NetLogic Microsystems, Inc. * | | | 29,100 | | | 1,309,500 | |
Power Integrations, Inc. * | | | 39,300 | | | 1,309,869 | |
| | | | |
|
| |
| | | | | | 3,578,333 | |
| | | | |
|
| |
Software 2.3% | | | | | | | |
Ansys, Inc. * | | | 30,700 | | | 1,150,329 | |
| | | | |
|
| |
MATERIALS 4.7% | | | | | | | |
Chemicals 3.8% | | | | | | | |
CF Industries Holdings, Inc. | | | 10,900 | | | 939,907 | |
Scotts Miracle-Gro Co., Class A | | | 21,900 | | | 940,605 | |
| | | | |
|
| |
| | | | | | 1,880,512 | |
| | | | |
|
| |
Metals & Mining 0.9% | | | | | | | |
Steel Dynamics, Inc. | | | 28,600 | | | 438,724 | |
| | | | |
|
| |
TELECOMMUNICATION SERVICES 2.9% | | | | | | | |
Wireless Telecommunication Services 2.9% | | | | | | | |
NII Holdings, Inc. * | | | 24,500 | | | 737,919 | |
Syniverse Holdings, Inc. * | | | 38,400 | | | 672,000 | |
| | | | |
|
| |
| | | | | | 1,409,919 | |
| | | | |
|
| |
Total Common Stocks (cost $39,973,522) | | | | | | 47,293,656 | |
| | | | |
|
| |
EXCHANGE TRADED FUND 0.1% | | | | | | | |
iShares Russell 2000 Growth Index Fund (cost $36,806) | | | 747 | | | 48,936 | |
| | | | |
|
| |
SHORT-TERM INVESTMENTS 7.8% | | | | | | | |
MUTUAL FUND SHARES 7.8% | | | | | | | |
BGI Prime Money Market Fund, Premium Shares, 0.19% q ρρ | | | 220 | | | 220 | |
BlackRock Liquidity TempFund, Institutional Class, 0.22% q ρρ | | | 648,547 | | | 648,547 | |
Evergreen Institutional Money Market Fund, Class I, 0.13% q ρρ ø | | | 3,064,022 | | | 3,064,022 | |
Morgan Stanley Institutional Liquidity Fund Money Market Portfolio, Institutional Class, 0.16% q ρρ | | | 96,762 | | | 96,762 | |
| | | | |
|
| |
Total Short-Term Investments (cost $3,809,551) | | | | | | 3,809,551 | |
| | | | |
|
| |
See Notes to Financial Statements
15
SCHEDULE OF INVESTMENTS continued
September 30, 2009
| | | | | | Value | |
|
|
|
|
|
|
| |
Total Investments (cost $43,819,879) 104.1% | | | | | $ | 51,152,143 | |
Other Assets and Liabilities (4.1%) | | | | | | (2,000,365 | ) |
| | | | |
|
| |
Net Assets 100.0% | | | | | $ | 49,151,778 | |
| | | | |
|
| |
* | Non-income producing security |
ρ | All or a portion of this security is on loan. |
q | Rate shown is the 7-day annualized yield at period end. |
ρρ | All or a portion of this security represents investment of cash collateral received from securities on loan. |
ø | Evergreen Investment Management Company, LLC is the investment advisor to both the Fund and the money market fund. |
Summary of Abbreviations |
ADS | American Depository Shares |
The following table shows the percent of total long-term investments by sector as of September 30, 2009:
Information Technology | | 25.9 | % |
Consumer Discretionary | | 21.1 | % |
Health Care | | 17.6 | % |
Industrials | | 13.6 | % |
Energy | | 6.8 | % |
Materials | | 4.9 | % |
Financials | | 3.7 | % |
Consumer Staples | | 3.3 | % |
Telecommunication Services | | 3.0 | % |
Other | | 0.1 | % |
| |
| |
| | 100.0 | % |
| |
| |
See Notes to Financial Statements
16
STATEMENT OF ASSETS AND LIABILITIES
September 30, 2009
Assets | | | | |
Investments in unaffiliated issuers, at value (cost $40,755,857) including $2,783,663 of securities loaned | | $ | 48,088,121 | |
Investments in affiliated issuers, at value (cost $3,064,022) | | | 3,064,022 | |
|
|
|
| |
Total investments | | | 51,152,143 | |
Receivable for securities sold | | | 1,484,093 | |
Receivable for Fund shares sold | | | 133,591 | |
Dividends receivable | | | 5,958 | |
Receivable for securities lending income | | | 9,306 | |
Prepaid expenses and other assets | | | 18,278 | |
|
|
|
| |
Total assets | | | 52,803,369 | |
|
|
|
| |
Liabilities | | | | |
Payable for securities purchased | | | 737,919 | |
Payable for Fund shares redeemed | | | 21,195 | |
Payable for securities on loan | | | 2,874,361 | |
Advisory fee payable | | | 636 | |
Distribution Plan expenses payable | | | 167 | |
Due to other related parties | | | 1,011 | |
Accrued expenses and other liabilities | | | 16,302 | |
|
|
|
| |
Total liabilities | | | 3,651,591 | |
|
|
|
| |
Net assets | | $ | 49,151,778 | |
|
|
|
| |
Net assets represented by | | | | |
Paid-in capital | | $ | 51,724,600 | |
Undistributed net investment loss | | | (539 | ) |
Accumulated net realized losses on investments | | | (9,904,547 | ) |
Net unrealized gains on investments | | | 7,332,264 | |
|
|
|
| |
Total net assets | | $ | 49,151,778 | |
|
|
|
| |
Net assets consists of | | | | |
Class A | | $ | 24,441,473 | |
Class I | | | 24,710,305 | |
|
|
|
| |
Total net assets | | $ | 49,151,778 | |
|
|
|
| |
Shares outstanding (unlimited number of shares authorized) | | | | |
Class A | | | 2,297,597 | |
Class I | | | 2,302,477 | |
|
|
|
| |
Net asset value per share | | | | |
Class A | | $ | 10.64 | |
Class A — Offering price (based on sales charge of 5.75%) | | $ | 11.29 | |
Class I | | $ | 10.73 | |
|
|
|
| |
See Notes to Financial Statements
17
STATEMENT OF OPERATIONS
Year Ended September 30, 2009
Investment income | | | | |
Dividends | | $ | 157,399 | |
Securities lending | | | 64,884 | |
Income from affiliated issuers | | | 16,617 | |
|
|
|
| |
Total investment income | | | 238,900 | |
|
|
|
| |
Expenses | | | | |
Advisory fee | | | 258,278 | |
Distribution Plan expenses | | | 49,597 | |
Administrative services fee | | | 36,897 | |
Transfer agent fees | | | 126,669 | |
Trustees’ fees and expenses | | | 1,020 | |
Printing and postage expenses | | | 21,590 | |
Custodian and accounting fees | | | 16,065 | |
Registration and filing fees | | | 44,353 | |
Professional fees | | | 25,423 | |
Other | | | 2,061 | |
|
|
|
| |
Total expenses | | | 581,953 | |
Less: Expense reductions | | | (41 | ) |
Fee waivers | | | (174,415 | ) |
|
|
|
| |
Net expenses | | | 407,497 | |
|
|
|
| |
Net investment loss | | | (168,597 | ) |
|
|
|
| |
Net realized and unrealized gains or losses on investments | | | | |
Net realized losses on securities in unaffiliated issuers | | | (8,924,992 | ) |
Net change in unrealized gains or losses on securities in unaffiliated issuers | | | 10,080,296 | |
|
|
|
| |
Net realized and unrealized gains or losses on investments | | | 1,155,304 | |
|
|
|
| |
Net increase in net assets resulting from operations | | $ | 986,707 | |
|
|
|
| |
See Notes to Financial Statements
18
STATEMENTS OF CHANGES IN NET ASSETS
| | Year Ended September 30, | |
| |
| |
| | 2009 | | 2008 | |
|
|
|
|
| |
Operations | | | | | | | | | | | |
Net investment loss | | | | $ | (168,597 | ) | | | $ | (431,682 | ) |
Net realized gains or losses on investments | | | | | (8,924,992 | ) | | | | 1,925,332 | |
Net change in unrealized gains or losses on investments | | | | | 10,080,296 | | | | | (23,866,131 | ) |
|
|
|
|
|
|
|
|
|
|
| |
Net increase (decrease) in net assets resulting from operations | | | | | 986,707 | | | | | (22,372,481 | ) |
|
|
|
|
|
|
|
|
|
|
| |
Distributions to shareholders from | | | | | | | | | | | |
Net realized gains | | | | | | | | | | | |
Class A | | | | | 0 | | | | | (4,210,289 | ) |
Class I | | | | | 0 | | | | | (14,249,012 | ) |
Tax basis return of capital | | | | | | | | | | | |
Class A | | | | | 0 | | | | | (68,740 | ) |
Class I | | | | | 0 | | | | | (174,955 | ) |
|
|
|
|
|
|
|
|
|
|
| |
Total distributions to shareholders | | | | | 0 | | | | | (18,702,996 | ) |
|
|
|
|
|
|
|
|
|
|
| |
| | Shares | | | | | Shares | | | | |
|
|
|
|
|
|
|
|
|
|
| |
Capital share transactions | | | | | | | | | | | |
Proceeds from shares sold | | | | | | | | | | | |
Class A | | 338,880 | | | 3,116,497 | | 159,103 | | | 2,085,642 | |
Class I | | 1,457,647 | | | 12,523,625 | | 3,137,908 | | | 41,105,310 | |
|
|
|
|
|
|
|
|
|
|
| |
| | | | | 15,640,122 | | | | | 43,190,952 | |
|
|
|
|
|
|
|
|
|
|
| |
Net asset value of shares issued in reinvestment of distributions | | | | | | | | | | | |
Class A | | 0 | | | 0 | | 320,456 | | | 4,246,043 | |
Class I | | 0 | | | 0 | | 974,366 | | | 12,949,320 | |
|
|
|
|
|
|
|
|
|
|
| |
| | | | | 0 | | | | | 17,195,363 | |
|
|
|
|
|
|
|
|
|
|
| |
Payment for shares redeemed | | | | | | | | | | | |
Class A | | (531,015 | ) | | (4,498,432 | ) | (1,092,637 | ) | | (13,550,494 | ) |
Class I | | (788,731 | ) | | (6,962,493 | ) | (12,020,039 | ) | | (148,410,747 | ) |
|
|
|
|
|
|
|
|
|
|
| |
| | | | | (11,460,925 | ) | | | | (161,961,241 | ) |
|
|
|
|
|
|
|
|
|
|
| |
Net increase (decrease) in net assets resulting from capital share transactions | | | | | 4,179,197 | | | | | (101,574,926 | ) |
|
|
|
|
|
|
|
|
|
|
| |
Total increase (decrease) in net assets | | | | | 5,165,904 | | | | | (142,650,403 | ) |
Net assets | | | | | | | | | | | |
Beginning of period | | | | | 43,985,874 | | | | | 186,636,277 | |
|
|
|
|
|
|
|
|
|
|
| |
End of period | | | | $ | 49,151,778 | | | | $ | 43,985,874 | |
|
|
|
|
|
|
|
|
|
|
| |
Undistributed net investment loss | | | | $ | (539 | ) | | | $ | (427 | ) |
|
|
|
|
|
|
|
|
|
|
| |
See Notes to Financial Statements
19
NOTES TO FINANCIAL STATEMENTS
1. ORGANIZATION
Evergreen Small-Mid Growth Fund (the “Fund”) is a diversified series of Evergreen Equity Trust (the “Trust”), a Delaware statutory trust organized on September 18, 1997. The Trust is an open-end management investment company registered under the Investment Company Act of 1940, as amended (the “1940 Act”).
The Fund offers Class A and Class I shares. Class A shares are sold with a front-end sales charge. However, Class A share investments of $1 million or more are not subject to a front-end sales charge but are subject to a contingent deferred sales charge of 1.00% upon redemption within 18 months. Class I shares are sold without a front-end sales charge or contingent deferred sales charge. Class A shares pay an ongoing distribution fee.
2. SIGNIFICANT ACCOUNTING POLICIES
The following is a summary of significant accounting policies consistently followed by the Fund in the preparation of its financial statements. The policies are in conformity with generally accepted accounting principles in the United States of America, which require management to make estimates and assumptions that affect amounts reported herein. Actual results could differ from these estimates. Management has considered the circumstances under which the Fund should recognize or make disclosures regarding events or transactions occurring subsequent to the balance sheet date through November 24, 2009 which represents the date the financial statements are issued. Adjustments or additional disclosures, if any, have been included in these financial statements.
a. Valuation of investments
Listed equity securities are usually valued at the last sales price or official closing price on the national securities exchange where the securities are principally traded. If there has been no sale, the securities are valued at the mean between bid and asked prices.
Short-term securities of sufficient credit quality with remaining maturities of 60 days or less at the time of purchase are valued at amortized cost, which approximates fair value.
Investments in open-end mutual funds are valued at net asset value. Securities for which market quotations are not readily available or not reflective of current fair value are valued at fair value as determined by the investment advisor in good faith, according to procedures approved by the Board of Trustees.
The valuation techniques used by the Fund to measure fair value are consistent with the market approach, income approach and/or cost approach, where applicable, for each security type.
b. Repurchase agreements
Securities pledged as collateral for repurchase agreements are held by the custodian bank or in a segregated account in the Fund’s name until the agreements mature. Collateral for
20
NOTES TO FINANCIAL STATEMENTS continued
certain tri-party repurchase agreements is held at the counterparty’s custodian in a segregated account for the benefit of the Fund and the counterparty. Each agreement requires that the market value of the collateral be sufficient to cover payments of interest and principal. However, in the event of default or bankruptcy by the other party to the agreement, retention of the collateral may be subject to legal proceedings. The Fund will only enter into repurchase agreements with banks and other financial institutions, which are deemed by the investment advisor to be creditworthy pursuant to guidelines established by the Board of Trustees. In certain instances, the Fund’s securities lending agent may provide collateral in the form of repurchase agreements.
c. Securities lending
The Fund may lend its securities to certain qualified brokers in order to earn additional income. The Fund receives compensation in the form of fees or interest earned on the investment of any cash collateral received. The Fund also continues to receive interest and dividends on the securities loaned. The Fund receives collateral in the form of cash or securities with a market value at least equal to the market value of the securities on loan. In the event of default or bankruptcy by the borrower, the Fund could experience delays and costs in recovering the loaned securities or in gaining access to the collateral. In addition, the investment of any cash collateral received may lose all or part of its value. The Fund has the right under the lending agreement to recover the securities from the borrower on demand.
d. Security transactions and investment income
Security transactions are recorded on trade date. Realized gains and losses are computed using the specific cost of the security sold. Dividend income is recorded on the ex-dividend date.
e. Federal and other taxes
The Fund intends to continue to qualify as a regulated investment company and distribute all of its taxable income, including any net capital gains (which have already been offset by available capital loss carryovers). Accordingly, no provision for federal taxes is required. The Fund’s income and excise tax returns and all financial records supporting those returns for the prior three fiscal years are subject to examination by the federal, Massachusetts and Delaware revenue authorities.
f. Distributions
Distributions to shareholders from net investment income and net realized gains, if any, are recorded on the ex-dividend date. Such distributions are determined in conformity with income tax regulations, which may differ from generally accepted accounting principles.
21
NOTES TO FINANCIAL STATEMENTS continued
Reclassifications have been made to the Fund’s components of net assets to reflect income and gains available for distribution (or available capital loss carryovers, as applicable) under income tax regulations. The primary permanent differences causing such reclassifications are due to net operating losses and partnership investments. During the year ended September 30, 2009, the following amounts were reclassified:
|
|
| |
Paid-in capital | $ | (194,141 | ) |
Undistributed net investment loss | | 168,485 | |
Accumulated net realized losses on investments | | 25,656 | |
|
|
| |
g. Class allocations
Income, common expenses and realized and unrealized gains and losses are allocated to the classes based on the relative net assets of each class. Distribution fees, if any, are calculated daily at the class level based on the appropriate net assets of each class and the specific expense rates applicable to each class.
3. ADVISORY FEE AND OTHER TRANSACTIONS WITH AFFILIATES
Evergreen Investment Management Company, LLC (“EIMC”), a subsidiary of Wells Fargo & Company (“Wells Fargo”), is the investment advisor to the Fund and is paid an annual fee starting at 0.70% and declining to 0.65% as average daily net assets increase. For the year ended September 30, 2009, the advisory fee was equivalent to an annual rate of 0.70% of the Fund’s average daily net assets.
On October 3, 2008, Wells Fargo and Wachovia Corporation (“Wachovia”) announced that Wells Fargo agreed to acquire Wachovia in a whole company transaction that would include all of Wachovia’s banking and other businesses. In connection with this transaction, Wachovia issued preferred shares to Wells Fargo representing approximately a 40% voting interest in Wachovia. Due to its ownership of preferred shares, Wells Fargo may have been deemed to control EIMC. If Wells Fargo was deemed to control EIMC, then the existing advisory agreement between the Fund and EIMC would have terminated automatically in connection with the issuance of preferred shares. To address this possibility, on October 20, 2008 the Board of Trustees approved an interim advisory agreement with EIMC with the same terms and conditions as the existing agreement which became effective upon the issuance of the preferred shares. EIMC’s receipt of the advisory fees under the interim advisory agreement was subject to the approval by shareholders of the Fund of a new advisory agreement with EIMC.
On December 31, 2008, Wachovia merged with and into Wells Fargo and as a result of the merger, EIMC, Evergreen Investment Services, Inc. (“EIS”) and Evergreen Service Company, LLC (“ESC”) became subsidiaries of Wells Fargo. After the merger, a new interim advisory agreement with the same terms and conditions between the Fund and EIMC went into effect.
22
NOTES TO FINANCIAL STATEMENTS continued
Shareholders approved the new advisory agreement between the Fund and EIMC on February 12, 2009.
From time to time, EIMC may voluntarily or contractually waive its fee and/or reimburse expenses in order to limit operating expenses. During the year ended September 30, 2009, EIMC voluntarily waived its advisory fee in the amount of $174,415.
The Fund may invest in money market funds which are advised by EIMC. Income earned on these investments is included in income from affiliated issuers on the Statement of Operations.
EIMC also serves as the administrator to the Fund providing the Fund with facilities, equipment and personnel. EIMC is paid an annual rate determined by applying percentage rates to the aggregate average daily net assets of the Evergreen funds (excluding money market funds) starting at 0.10% and declining to 0.05% as the aggregate average daily net assets of the Evergreen funds (excluding money market funds) increase. For the year ended September 30, 2009, the administrative services fee was equivalent to an annual rate of 0.10% of the Fund’s average daily net assets.
ESC, an affiliate of EIMC and a subsidiary of Wells Fargo, is the transfer and dividend disbursing agent for the Fund. ESC receives account fees that vary based on the type of account held by the shareholders in the Fund. For the year ended September 30, 2009, the transfer agent fees were equivalent to an annual rate of 0.34% of the Fund’s average daily net assets.
Wachovia Bank NA, a subsidiary of Wells Fargo and an affiliate of EIMC, through its securities lending division, Wachovia Global Securities Lending, acts as the securities lending agent for the Fund (see Note 5).
The Fund has placed a portion of its portfolio transactions with brokerage firms that are affiliates of Wells Fargo. During the year ended September 30, 2009, the Fund paid brokerage commissions of $3,405 to broker-dealers affiliated with Wells Fargo.
4. DISTRIBUTION PLAN
EIS, an affiliate of EIMC and a subsidiary of Wells Fargo, serves as distributor of the Fund’s shares. The Fund has adopted a Distribution Plan, as allowed by Rule 12b-1 of the 1940 Act, for Class A shares. Under the Distribution Plan, the Fund is permitted to pay distribution fees at an annual rate of up to 0.75% of the average daily net assets for Class A shares. However, currently the distribution fees for Class A shares are limited to 0.25% of the average daily net assets of the class.
For the year ended September 30, 2009, EIS received $3,460 from the sale of Class A shares and $63 in contingent deferred sales charges from redemptions of Class A shares.
23
NOTES TO FINANCIAL STATEMENTS continued
5. INVESTMENT TRANSACTIONS
Cost of purchases and proceeds from sales of investment securities (excluding short-term securities) were $30,012,075 and $24,992,146, respectively, for the year ended September 30, 2009.
Fair value measurements are determined within a framework that has established a fair value hierarchy based upon the various data inputs utilized in determining the value of the Fund’s investments. These inputs are summarized into three broad levels as follows:
Level 1 – quoted prices in active markets for identical securities Level 2 – other significant observable inputs (including quoted prices for similar securities, interest rates, prepayment speeds, credit risk, etc.) Level 3 – significant unobservable inputs (including the Fund’s own assumptions in determining the fair value of investments) |
The inputs or methodologies used for valuing securities are not necessarily an indication of the risk associated with investing in those securities.
As of September 30, 2009, the inputs used in valuing the Fund’s assets, which are carried at fair value, were as follows:
Investments in Securities | | Quoted Prices
(Level 1) | | Significant
Other
Observable
Inputs
(Level 2) | | Significant
Unobservable
Inputs
(Level 3) | | Total |
|
|
|
|
|
|
|
|
| |
Equity securities | | | | | | | | | | | | | | | | |
Common stocks | | $ | 47,293,656 | | | $ | 0 | | | $ | 0 | | | $ | 47,293,656 | |
Other | | | 48,936 | | | | 0 | | | | 0 | | | | 48,936 | |
Short-term investments | | | 3,809,551 | | | | 0 | | | | 0 | | | | 3,809,551 | |
|
|
|
|
|
|
|
|
| |
| | $ | 51,152,143 | | | $ | 0 | | | $ | 0 | | | $ | 51,152,143 | |
|
|
|
|
|
|
|
|
| |
Further details on the major security types listed above can be found in the Schedule of Investments.
During the year ended September 30, 2009, the Fund loaned securities to certain brokers and earned $64,884, net of $7,082 paid to Wachovia Global Securities Lending as the securities lending agent. At September 30, 2009, the value of securities on loan and the total value of collateral received for securities loaned amounted to $2,783,663 and $2,874,361, respectively.
On September 30, 2009, the aggregate cost of securities for federal income tax purposes was $44,892,896. The gross unrealized appreciation and depreciation on securities based on tax cost was $8,406,242 and $2,146,995, respectively, with a net unrealized appreciation of $6,259,247.
24
NOTES TO FINANCIAL STATEMENTS continued
As of September 30, 2009, the Fund had $1,578,401 in capital loss carryovers for federal income tax purposes expiring in 2017.
For income tax purposes, capital losses incurred after October 31 within the Fund’s fiscal year are deemed to arise on the first business day of the following fiscal year. As of September 30, 2009, the Fund incurred and will elect to defer post-October losses of $7,253,129.
6. INTERFUND LENDING
Pursuant to an Exemptive Order issued by the SEC, the Fund may participate in an interfund lending program with certain funds in the Evergreen fund family. This program allows the Fund to borrow from, or lend money to, other participating funds. During the year ended September 30, 2009, the Fund did not participate in the interfund lending program.
7. DISTRIBUTIONS TO SHAREHOLDERS
As of September 30, 2009, the components of distributable earnings on a tax basis were as follows:
| Capital Loss | |
| Carryovers | |
| and | Temporary |
Unrealized | Post-October | Book/Tax |
Appreciation | Losses | Differences |
|
|
|
$6,259,247 | $8,831,530 | $(539) |
|
|
|
The differences between the components of distributable earnings on a tax basis and the amounts reflected in the Statement of Assets and Liabilities are primarily due to wash sales. The temporary book/tax differences are a result of timing differences between book and tax recognition of income and/or expenses.
The tax character of distributions paid was as follows:
| | Year Ended September 30, | |
| |
| |
| | | 2009 | | | | 2008 | |
|
|
|
|
|
|
|
| |
Ordinary Income | | | $0 | | | | $10,787,717 | |
Long-term Capital Gain | | | 0 | | | | 7,671,584 | |
Return of Capital | | | 0 | | | | 243,695 | |
|
|
|
|
|
|
|
| |
8. EXPENSE REDUCTIONS
Through expense offset arrangements with ESC and the Fund’s custodian, a portion of fund expenses has been reduced.
25
NOTES TO FINANCIAL STATEMENTS continued
9. DEFERRED TRUSTEES’ FEES
Each Trustee of the Fund may defer any or all compensation related to performance of his or her duties as a Trustee. The Trustees’ deferred balances are allocated to deferral accounts, which are included in the accrued expenses for the Fund. The investment performance of the deferral accounts is based on the investment performance of certain Evergreen funds. Any gains earned or losses incurred in the deferral accounts are reported in the Fund’s Trustees’ fees and expenses. At the election of the Trustees, the deferral account will be paid either in one lump sum or in quarterly installments for up to ten years.
10. FINANCING AGREEMENT
The Fund and certain other Evergreen funds share in a $100 million unsecured revolving credit commitment for temporary and emergency purposes, including the funding of redemptions, as permitted by each participating fund’s borrowing restrictions. Borrowings under this facility bear interest at the higher of the Federal Funds rate plus 1.25% or LIBOR plus 1.25%. Prior to June 26, 2009, the interest rate was 0.50% per annum above the Federal Funds rate. All of the participating funds are charged an annual commitment fee of 0.145% on the unused balance, which is allocated pro rata. Prior to June 26, 2009, the annual commitment fee was 0.09%. During the year ended September 30, 2009, the Fund had no borrowings.
11. REGULATORY MATTERS AND LEGAL PROCEEDINGS
The Evergreen funds, EIMC and certain of EIMC’s affiliates are involved in various legal actions, including private litigation and class action lawsuits, and are and may in the future be subject to regulatory inquiries and investigations.
EIMC and EIS have reached final settlements with the Securities and Exchange Commission (“SEC”) and the Securities Division of the Secretary of the Commonwealth of Massachusetts (“Commonwealth”) primarily relating to the liquidation of Evergreen Ultra Short Opportunities Fund (“Ultra Short Fund”). The claims settled include the following: first, that during the period February 2007 through Ultra Short Fund’s liquidation on June 18, 2008, Ultra Short Fund’s former portfolio management team failed to properly take into account readily-available information in valuing certain non-agency residential mortgage-backed securities held by the Ultra Short Fund, resulting in the Ultra Short Fund’s net asset value (“NAV”) being overstated during the period; second, that EIMC and EIS acted inappropriately when, in an effort to explain the decline in Ultra Short Fund’s NAV, certain information regarding the decline was communicated to some, but not all, shareholders and financial intermediaries; third, that the Ultra Short Fund portfolio management team did not adhere to regulatory requirements for affiliated cross trades in executing trades with other Evergreen funds; and finally, that from at least September 2007 to August 2008, EIS did not preserve certain text and instant messages transmitted via personal digital assistant devices. In settling these matters, EIMC and EIS
26
NOTES TO FINANCIAL STATEMENTS continued
have agreed to payments totaling $41,125,000, up to $40,125,000 of which will be distributed to eligible shareholders of Ultra Short Fund pursuant to a methodology and plan approved by the regulators. EIMC and EIS neither admitted nor denied the regulators’ conclusions.
Three purported class actions have also been filed in the U.S. District Court for the District of Massachusetts relating to the same events; defendants include various Evergreen entities, including EIMC and EIS, and Evergreen Fixed Income Trust and its Trustees. The cases generally allege that investors in the Ultra Short Fund suffered losses as a result of (i) misleading statements in Ultra Short Fund’s registration statement and prospectus, (ii) the failure to accurately price securities in the Ultra Short Fund at different points in time and (iii) the failure of the Ultra Short Fund’s risk disclosures and description of its investment strategy to inform investors adequately of the actual risks of the fund.
EIMC does not expect that any of the legal actions, inquiries or settlement of regulatory matters will have a material adverse impact on the financial position or operations of the Fund to which these financial statements relate. Any publicity surrounding or resulting from any legal actions or regulatory inquiries involving EIMC or its affiliates or any of the Evergreen Funds could result in reduced sales or increased redemptions of Evergreen fund shares, which could increase Evergreen fund transaction costs or operating expenses or have other adverse consequences on the Evergreen funds, including the Fund.
27
REPORT OF INDEPENDENT REGISTERED PUBLIC ACCOUNTING FIRM
Board of Trustees and Shareholders
Evergreen Equity Trust
We have audited the accompanying statement of assets and liabilities, including the schedule of investments, of the Evergreen Small-Mid Growth Fund, a series of the Evergreen Equity Trust, as of September 30, 2009 and the related statement of operations for the year then ended, statements of changes in net assets for each of the years in the two-year period then ended and the financial highlights for each of the years in the three-year period then ended and for the period from October 11, 2005 (commencement of operations) to September 30, 2006. These financial statements and financial highlights are the responsibility of the Fund’s management. Our responsibility is to express an opinion on these financial statements and financial highlights based on our audits.
We conducted our audits in accordance with the standards of the Public Company Accounting Oversight Board (United States). Those standards require that we plan and perform the audit to obtain reasonable assurance about whether the financial statements and financial highlights are free of material misstatement. An audit includes examining, on a test basis, evidence supporting the amounts and disclosures in the financial statements. Our procedures included confirmation of securities owned as of September 30, 2009 by correspondence with the custodian and brokers, or by other appropriate auditing procedures where replies from brokers were not received. An audit also includes assessing the accounting principles used and significant estimates made by management, as well as evaluating the overall financial statement presentation. We believe that our audits provide a reasonable basis for our opinion.
In our opinion, the financial statements and financial highlights referred to above present fairly, in all material respects, the financial position of the Evergreen Small-Mid Growth Fund as of September 30, 2009, the results of its operations, changes in its net assets and financial highlights for each of the periods described above, in conformity with U.S. generally accepted accounting principles.

Boston, Massachusetts
November 24, 2009
28
ADDITIONAL INFORMATION (unaudited)
INFORMATION ABOUT THE REVIEW AND APPROVAL OF THE FUND’S INVESTMENT ADVISORY AGREEMENT
Each year, as required by law, the Fund’s Board of Trustees determines whether to approve the continuation of the Fund’s investment advisory agreements. At an in person meeting on September 23-24, 2009, the Trustees, including a majority of the Trustees who are not “interested persons” (as that term is defined in the 1940 Act) of the Fund or EIMC (the “independent Trustees”), approved the continuation of the Fund’s investment advisory agreements. (References below to the “Fund” are to Evergreen Small-Mid Growth Fund; references to the “funds” are to the Evergreen funds generally.)
At the same time, the Trustees considered the continuation of the investment advisory agreements for all of the Evergreen funds. The description below refers in many cases to the Trustees’ process for considering, and conclusions regarding, all of the funds’ agreements. In all of their deliberations, the Board of Trustees and the independent Trustees were advised by independent counsel to the independent Trustees and counsel to the funds.
The review process. In connection with its review of the funds’ investment advisory agreements, the Board of Trustees requests and evaluates, and EIMC and any sub-advisors are required to furnish, such information as the Trustees consider to be reasonably necessary in the circumstances. Over the course of the year preceding their September 2009 meeting, the Trustees regularly reviewed information regarding the investment performance of all of the funds. As part of their ongoing review of investment performance, the Trustees monitored for changes in performance and for the results of any changes in a fund’s investment process or investment team. The Trustees paid particular attention to funds whose performance since September 2008 (when the Trustees completed their 2008 review of the funds’ investment advisory agreements) indicated short-term or longer-term performance issues and to funds that they had identified during their 2008 review process as having short- or longer-term performance issues.
In spring 2009, a committee of the Board of Trustees (the “Committee”), working with EIMC management, determined generally the types of information the Trustees would review as part of the 2009 review process and set a timeline detailing the information required and the dates for its delivery to the Trustees. The Board engaged the independent data provider Keil Fiduciary Strategies LLC (“Keil”) to provide fund-specific and industry-wide data containing information of a nature and in a format generally prescribed by the Committee, and the Committee worked with Keil and EIMC to develop appropriate groups of peer funds for each fund. The Committee also identified a number of expense, performance, and other areas of review and requested specific information as to those areas of review.
The Trustees formed small groups to review individual funds in greater detail. They reviewed, with the assistance of an independent industry consultant that they retained, the
29
ADDITIONAL INFORMATION (unaudited) continued
information that EIMC and Keil provided. In addition, the Trustees considered information regarding, among other things, the funds’ brokerage practices, the funds’ use of derivatives, analyst and research support available to the portfolio management teams, risk management practices, and certain fall-out benefits received directly and indirectly by EIMC and its affiliates from the funds. The Trustees requested and received additional information following that review.
In December 2008 Wells Fargo & Company (“Wells Fargo”) acquired Wachovia Corporation (“Wachovia”), EIMC’s parent company. Wells Fargo and EIMC have taken steps to combine the operations of Wells Fargo’s investment management affiliates and EIMC during the past year and have proposed to the Trustees the combination of the mutual fund families managed by them. During the course of the year, and during their review, the Trustees requested and received information about Wells Fargo and its advisory and broker-dealer operations, the status of efforts to combine the Wells Fargo and Evergreen investment management operations, and the effects on the funds and on the services provided by EIMC and its affiliates to the funds. In their deliberations, the Trustees were mindful that it was possible that the proposed combination of the two fund families might be effected during the coming 12-month period.
The Committee met several times by telephone during the 2009 review process to consider the information provided to it. The Committee then met with representatives of EIMC and its affiliates, including Wells Fargo. In addition, during the course of their review, the Trustees discussed the continuation of the funds’ advisory agreements with representatives of EIMC, and in meetings with independent legal counsel in multiple private sessions at which no personnel of EIMC were present. At a meeting of the full Board of Trustees held on September 23-24, 2009, the Committee reported the results of its discussions with EIMC. The full Board met with representatives of EIMC and its affiliates and engaged in further review of the materials provided to it, after which the independent Trustees and the full Board approved the continuation of each of the advisory and sub-advisory agreements.
The Trustees’ determination to approve the continuation of the advisory and sub-advisory agreements was based on a comprehensive evaluation of all of the information provided to them. In considering the continuation of the agreements, the Trustees did not identify any particular information or consideration that was all-important or controlling, and each Trustee attributed different weights to various factors. The Trustees evaluated information provided to them both in terms of the funds generally and with respect to each fund, including the Fund, specifically as they considered appropriate. Although the Trustees considered the continuation of the agreements for each of the funds as part of the larger process of considering the continuation of the advisory contracts for all of the funds, their determination to continue the advisory agreements for each of the funds was ultimately made on a fund-by-fund basis.
30
ADDITIONAL INFORMATION (unaudited) continued
This summary describes a number of the most important, but not necessarily all, of the factors considered by the Board and the independent Trustees.
Information reviewed. The Board of Trustees and committees of the Board of Trustees met periodically during the course of the year. EIMC presented a wide variety of information at those meetings regarding the services it provides for the funds, the investment performance of the funds, and other aspects of the business and operations of the funds. At those meetings, and in the process of considering the continuation of the agreements, the Trustees considered information regarding, for example, the funds’ investment results; the portfolio management teams for the funds and the experience of the members of the teams, and any recent changes in the membership of the teams; portfolio trading practices; compliance by the funds and EIMC with applicable laws and regulations and with the funds’ and EIMC’s compliance policies and procedures; risk evaluation and oversight procedures at EIMC; services provided by affiliates of EIMC to the funds and shareholders of the funds; and other information relating to the nature, extent, and quality of services provided by EIMC. The Trustees considered a number of changes in portfolio management personnel at EIMC and its advisory affiliates in the year since September 2008. The Trustees also considered changes in personnel at the funds and EIMC, including the appointment of a new President of the funds, who also serves as President and Chief Operating Officer of EIMC, and a new Chief Investment Officer of EIMC in August of 2008.
The Trustees considered the rates at which the funds pay investment advisory fees, and the efforts generally by EIMC and its affiliates as sponsors of the funds. The data provided by Keil showed the management fees paid by each fund in comparison to the management fees of other peer mutual funds, in addition to data regarding the investment performance of the funds in comparison to other peer mutual funds. The Trustees were assisted by an independent industry consultant in reviewing the information presented to them.
The Trustees noted that, in certain cases, EIMC and/or its affiliates provide advisory services to other clients that are comparable to the advisory services they provide to certain funds. The Trustees considered the information EIMC provided regarding the rates at which those other clients pay advisory fees to EIMC. Fees charged to those other clients were generally lower than those charged to the respective funds. In respect of these other accounts, EIMC noted that the compliance, reporting, and other legal burdens of providing investment advice to mutual funds generally exceed those required to provide advisory services to non-mutual fund clients such as retirement or pension plans.
The Trustees considered the transfer agency fees paid by the funds to an affiliate of EIMC. They reviewed information presented to them showing that the transfer agency fees charged to the funds were generally consistent with industry norms.
31
ADDITIONAL INFORMATION (unaudited) continued
The Trustees also considered that EIMC serves as administrator to the funds and receives a fee for its services as administrator. In their comparison of fees paid by the funds with those paid by other mutual funds, the Trustees considered administrative fees paid by the funds and those other mutual funds. They considered that EIS, an affiliate of EIMC, would serve as distributor to the funds until January 3, 2010, and that Wells Fargo Funds Distributor, LLC, also an affiliate of EIMC, would serve as distributor to the funds beginning on January 4, 2010, and noted that the distributor receives fees from the funds for those services. The Trustees also considered other so-called “fall-out” benefits to EIMC and its affiliates due to their other relationships with the funds, including, for example, soft-dollar services received by EIMC attributable to transactions entered into by EIMC on behalf of the funds and brokerage commissions received by Wells Fargo Advisors, LLC (“Wells Fargo Advisors”) (formerly Wachovia Securities, LLC), an affiliate of EIMC, from transactions effected by it for the funds. The Trustees noted that the funds pay sub-transfer agency fees to various financial institutions, including Wells Fargo Advisors and its affiliates, that hold fund shares in omnibus accounts, and that an affiliate of EIMC receives fees for administering the sub-transfer agency payment program. In reviewing the services provided by an affiliate of EIMC, the Trustees noted that the affiliate of EIMC that provides transfer agency services to the funds had won recognition from Dalbar customer service each year since 1998, and also won recognition from National Quality Review for customer service and for accuracy in processing transactions in 2008. They also considered that Wells Fargo Advisors and its affiliates receive distribution-related fees and shareholder servicing payments (including amounts derived from payments under the funds’ Rule 12b-1 plans) in respect of shares sold or held through them and that an affiliate of EIMC receives compensation for serving as a securities lending agent for a number of the funds.
The Trustees considered regulatory actions taken against EIMC or its affiliates in the past year, and on-going reviews of the operations of EIMC and its affiliates as they might affect the funds. They considered the findings of the regulators, the cooperation of EIMC and its affiliates with those regulators and with the Trustees in respect of those actions and reviews, and the remedial steps EIMC and its affiliates have taken in response. They also considered the scope and nature of on-going reviews being conducted by EIMC and its affiliates, and communications to the Trustees relating to those reviews.
Nature and quality of the services provided. The Trustees considered that EIMC and its affiliates generally provide a comprehensive investment management service to the funds. They noted that EIMC formulates and implements an investment program for the Fund. They noted that EIMC makes its personnel available to serve as officers of the funds, and concluded that the reporting and management functions provided by EIMC with respect to the funds were generally satisfactory. The Trustees considered the investment philosophy of the Fund’s portfolio management team and the in-house research
32
ADDITIONAL INFORMATION (unaudited) continued
capabilities of EIMC and its affiliates, as well as other resources available to EIMC, including research services available to it from third parties.
The Trustees considered the managerial and financial resources available to EIMC and its affiliates and the commitment that the Evergreen/Wells Fargo organization has made to the funds generally. They considered assurances from representatives of Wells Fargo that the merger of Wells Fargo and Wachovia and the integration of those firms’ advisory and broker-dealer operations was not expected to result in any adverse effect on the funds, on the quality and level of services that EIMC provides to the funds, or on the resources available to the funds and to EIMC, and that Wells Fargo is committed to continue providing the funds with high-quality services.
The Trustees noted the resources EIMC and its affiliates have committed to the regulatory, compliance, accounting, tax and oversight of tax reporting, and shareholder servicing functions, and the number and quality of staff committed to those functions, which they concluded were appropriate and generally in line with EIMC’s responsibilities to the Fund and to the funds generally. The Board and the independent Trustees concluded, within the context of their overall conclusions regarding the funds’ advisory agreements, that they were generally satisfied with the nature, extent, and quality of the services provided by EIMC, including services provided by EIMC under its administrative services agreements with the funds. They determined that the nature and scope of the services provided by EIMC were consistent with EIMC’s duties under the investment advisory agreements and appropriate and consistent with the investment programs and best interests of the funds.
Investment performance. The Trustees considered the investment performance of each fund, both by comparison to other comparable mutual funds and to broad market indices. Although the Trustees considered the performance of all share classes, the Trustees noted that, for the one- and three-year periods ended December 31, 2008, the Fund’s Class A shares had outperformed the Fund’s benchmark index, the Russell 2500 Growth Index, and performed in the first quintile of the mutual funds against which the Trustees compared the Fund’s performance for the same periods.
The Trustees discussed each fund’s performance with representatives of EIMC. In each instance where a fund experienced a substantial period of underperformance relative to its benchmark index and/or the non-Evergreen fund peers against which the Trustees compared the fund’s performance, the Trustees considered EIMC’s explanation of the reasons for the relative underperformance and the steps being taken to address the relative underperformance. The Trustees emphasized that the continuation of the investment advisory agreement for a fund should not be taken as any indication that the Trustees did not believe investment performance for any specific fund might not be improved, and they noted that they would continue to monitor closely the investment performance of the funds going forward.
33
ADDITIONAL INFORMATION (unaudited) continued
Advisory and administrative fees. The Trustees recognized that EIMC does not seek to provide the lowest cost investment advisory service, but to provide a high quality, full-service investment management product at a reasonable price. They also noted that EIMC has in many cases sought to set its investment advisory fees at levels consistent with industry norms. The Trustees noted that, in certain cases, a fund’s management fees were higher than many or most other mutual funds in the same Keil peer group. However, in each case, the Trustees determined on the basis of the information presented that the level of management fees was not excessive. The Trustees noted that the management fee paid by the Fund was lower than the management fees paid by a majority of the mutual funds against which the Trustees compared the Fund’s management fee, and that the level of profitability realized by EIMC in respect of the fee did not appear excessive.
Economies of scale. The Trustees noted the possibility that economies of scale would be achieved by EIMC in managing the funds as the funds grow. They reviewed the breakpoints in the Fund’s advisory fee structure, which operate generally to reduce the effective management fee rate of the Fund (as a percentage of Fund assets) as the Fund grows in size. They considered that, as a fund shrinks in size, breakpoints result in increasing fee levels. The Trustees noted that they would continue to review the appropriate levels of breakpoints in the future, and concluded that the breakpoints as implemented appeared to be a reasonable step toward the realization of economies of scale by the Fund.
Profitability. The Trustees considered information provided to them regarding the profitability to the EIMC organization of the investment advisory, administration, and transfer agency (with respect to the open-end funds only) fees paid to EIMC and its affiliates by each of the funds. They considered that the information provided to them was necessarily estimated, and that the profitability information provided to them, especially on a fund-by-fund basis, did not necessarily provide a definitive tool for evaluating the appropriateness of each fund’s advisory fee. They noted that the levels of profitability of the funds to EIMC varied widely, depending on, among other things, the size and type of fund. They considered the profitability of the funds in light of such factors as, for example, the information they had received regarding the relation of the fees paid by the funds to those paid by other mutual funds, the investment performance of the funds, and the amount of revenues involved. In light of these factors, the Trustees concluded that the profitability to EIMC of the services provided to any of the funds, individually or in the aggregate, should not prevent the Trustees from approving the continuation of the agreements.
34
This page left intentionally blank
35
TRUSTEES AND OFFICERS
TRUSTEES1 | |
Charles A. Austin III
Trustee
DOB: 10/23/1934
Term of office since: 1991
Other directorships: None | Investment Counselor, Anchor Capital Advisors, LLC. (investment advice); Director, The Andover Companies (insurance); Trustee, Arthritis Foundation of New England; Former Director, The Francis Ouimet Society (scholarship program); Former Director, Executive Vice President and Treasurer, State Street Research & Management Company (investment advice) |
|
|
K. Dun Gifford
Trustee
DOB: 10/23/1938
Term of office since: 1974
Other directorships: None | Chairman and President, Oldways Preservation and Exchange Trust (education); Trustee, Member of the Executive Committee, Former Chairman of the Finance Committee, and Former Treasurer, Cambridge College |
|
|
Dr. Leroy Keith, Jr.
Trustee
DOB: 2/14/1939
Term of office since: 1983
Other directorships: Trustee,
Phoenix Fund Complex
(consisting of 50 portfolios
as of 12/31/2008) | Managing Director, Almanac Capital Management (commodities firm); Trustee, Phoenix Fund Complex; Director, Diversapack Co. (packaging company); Former Partner, Stonington Partners, Inc. (private equity fund); Former Director, Obagi Medical Products Co.; Former Director, Lincoln Educational Services |
|
|
Carol A. Kosel
Trustee
DOB: 12/25/1963
Term of office since: 2008
Other directorships: None | Former Consultant to the Evergreen Boards of Trustees; Former Vice President and Senior Vice President, Evergreen Investments, Inc.; Former Treasurer, Evergreen Funds; Former Treasurer, Vestaur Securities Fund |
|
|
Gerald M. McDonnell
Trustee
DOB: 7/14/1939
Term of office since: 1988
Other directorships: None | Former Manager of Commercial Operations, CMC Steel (steel producer) |
|
|
Patricia B. Norris
Trustee
DOB: 4/9/1948
Term of office since: 2006
Other directorships: None | President and Director of Buckleys of Kezar Lake, Inc. (real estate company); Former President and Director of Phillips Pond Homes Association (home community); Former Partner, PricewaterhouseCoopers, LLP (independent registered public accounting firm) |
|
|
William Walt Pettit2
Trustee
DOB: 8/26/1955
Term of office since: 1988
Other directorships: None | Partner and Vice President, Kellam & Pettit, P.A. (law firm); Director, Superior Packaging Corp. (packaging company); Member, Superior Land, LLC (real estate holding company), Member, K&P Development, LLC (real estate development); Former Director, National Kidney Foundation of North Carolina, Inc. (non-profit organization) |
|
|
David M. Richardson
Trustee
DOB: 9/19/1941
Term of office since: 1982
Other directorships: None | President, Richardson, Runden LLC (executive recruitment advisory services); Director, J&M Cumming Paper Co. (paper merchandising); Former Trustee, NDI Technologies, LLP (communications); Former Consultant, AESC (The Association of Executive Search Consultants) |
|
|
Russell A. Salton III, MD
Trustee
DOB: 6/2/1947
Term of office since: 1984
Other directorships: None | President/CEO, AccessOne MedCard, Inc. |
|
|
36
TRUSTEES AND OFFICERS continued
Michael S. Scofield
Trustee
DOB: 2/20/1943
Term of office since: 1984
Other directorships: None | Retired Attorney, Law Offices of Michael S. Scofield; Former Director and Chairman, Branded Media Corporation (multi-media branding company) |
|
|
Richard J. Shima
Trustee
DOB: 8/11/1939
Term of office since: 1993
Other directorships: None | Independent Consultant; Director, Hartford Hospital; Trustee, Greater Hartford YMCA; Former Director, Trust Company of CT; Former Trustee, Saint Joseph College (CT) |
|
|
Richard K. Wagoner, CFA3
Trustee
DOB: 12/12/1937
Term of office since: 1999
Other directorships: None | Member and Former President, North Carolina Securities Traders Association; Member, Financial Analysts Society |
|
|
OFFICERS | |
W. Douglas Munn4
President
DOB: 4/21/1963
Term of office since: 2009 | Principal occupations: Chief Operating Officer, Wells Fargo Funds Management, LLC; President and Chief Operating Officer, Evergreen Investment Company, Inc. |
|
|
Jeremy DePalma4
Treasurer
DOB: 2/5/1974
Term of office since: 2005 | Principal occupations: Senior Vice President, Evergreen Investment Management Company, LLC; Former Vice President, Evergreen Investment Services, Inc.; Former Assistant Vice President, Evergreen Investment Services, Inc. |
|
|
Michael H. Koonce4
Secretary
DOB: 4/20/1960
Term of office since: 2000 | Principal occupations: Senior Vice President and General Counsel, Evergreen Investment Services, Inc.; Secretary, Senior Vice President and General Counsel, Evergreen Investment Management Company, LLC and Evergreen Service Company, LLC |
|
|
Robert Guerin4
Chief Compliance Officer
DOB: 9/20/1965
Term of office since: 2007 | Principal occupations: Chief Compliance Officer, Evergreen Funds and Senior Vice President of Evergreen Investment Company, Inc.; Former Managing Director and Senior Compliance Officer, Babson Capital Management LLC; Former Principal and Director, Compliance and Risk Management, State Street Global Advisors; Former Vice President and Manager, Sales Practice Compliance, Deutsche Asset Management |
|
|
1 | Each Trustee serves until a successor is duly elected or qualified or until his or her death, resignation, retirement or removal from office. Each Trustee oversaw 77 Evergreen funds as of December 31, 2008. Correspondence for each Trustee may be sent to Evergreen Board of Trustees, P.O. Box 20083, Charlotte, NC 28202. |
2 | It is possible that Mr. Pettit may be viewed as an “interested person” of the Evergreen funds, as defined in the 1940 Act, because of his law firm’s previous representation of affiliates of Wells Fargo & Company (“Wells Fargo”), the parent to the Evergreen funds’ investment advisor, EIMC. The Trustees are treating Mr. Pettit as an interested trustee for the time being. |
3 | Mr. Wagoner is an “interested person” of the Evergreen funds because of his ownership of shares in Wells Fargo & Company, the parent to the Evergreen funds’ investment advisor. |
4 | The address of the Officer is 200 Berkeley Street, Boston, MA 02116. |
Additional information about the Fund’s Board of Trustees and Officers can be found in the Statement of Additional Information (SAI) and is available upon request without charge by calling 800.343.2898.
37
576003 rv3 11/2009
Item 2 – Code of Ethics
(a) The Registrant has adopted a code of ethics that applies to the Registrant’s principal executive officer and principal financial officer.
(b) During the period covered by this report, there were no amendments to the provisions of the code of ethics adopted in 2.(a) above.
(c) During the period covered by this report, there were no implicit or explicit waivers to the provisions of the code of ethics adopted in 2.(a) above.
Item 3 – Audit Committee Financial Expert
Charles A. Austin III and Patricia B. Norris have been determined by the Registrant’s Board of Trustees to be audit committee financial experts within the meaning of Section 407 of the Sarbanes-Oxley Act. These financial experts are independent of management.
Items 4 – Principal Accountant Fees and Services
The following table represents fees for professional audit services rendered by KPMG LLP, for the audits of each of the five series of the Registrant’s annual financial statements for the fiscal years ended September 30, 2009 and September 30, 2008, and fees billed for other services rendered by KPMG LLP.
| | 2009 | | 2008 | |
| |
| |
| |
Audit fees | | $ | 134,400 | | $ | 126,900 | |
Audit-related fees (1) | | $ | 0 | | $ | 1,000 | |
Tax fees (2) | | $ | 0 | | $ | 7,500 | |
Non-audit fees (3) | | $ | 520,000 | | $ | 862,374 | |
All other fees | | $ | 0 | | $ | 0 | |
(1) | Audit-related fees consists principally of fees for any merger related activity. |
(2) | Tax fees consists of fees for tax consultation, tax compliance and tax review. |
(3) | Non-audit fees consists of the aggregate fees for non-audit services rendered to the Fund, EIMC (not including any sub-advisor whose role is primarily portfolio management and is subcontracted with or overseen by another investment advisor) and EIS. |
Evergreen Funds
Evergreen Global Dividend Opportunity Fund
Evergreen Income Advantage Fund
Evergreen International Balanced Income Fund
Evergreen Multi-Sector Income Fund
Evergreen Utilities and High Income Fund
Audit and Non-Audit Services Pre-Approval Policy
I. Statement of Principles
Under the Sarbanes-Oxley Act of 2002 (the “Act”), the Audit Committee of the Board of Trustees/Directors is responsible for the appointment, compensation and oversight of the work of the independent auditor. As part of this responsibility, the Audit Committee is required to pre-approve the audit and non-audit services performed by the independent auditor for the Funds, as well as non-audit services performed by the independent auditor for the Funds’ investment adviser or any of its control affiliates that relates directly to the Funds’ operations and financial reporting, in order to assure that they do not impair the auditor’s independence from the Funds. To implement these provisions of the Act, the Securities and Exchange Commission (the “SEC”) has issued rules specifying the types of services that an independent
auditor may not provide to its audit client, as well as regarding the audit committee’s administration of the engagement of the independent auditor. Accordingly, the Audit Committee has adopted, and the Board of Trustees has ratified, the Audit and Non-Audit Services Pre Approval Policy (the “Policy”), which sets forth the procedures and the conditions pursuant to which services proposed to be performed by the independent auditor may be pre-approved.
The SEC’s rules establish two different approaches to pre-approving services, which the SEC considers to be equally valid. Proposed services either: may be pre-approved by the Audit Committee pursuant to detailed pre-approval policies and procedures that describe the types of services for which the independent auditor may be engaged (“general pre-approval”); or may be expressly pre-approved by the Audit Committee (“specific pre-approval”). The Audit Committee believes that the combination of these two approaches expressed in this Policy will result in an effective and efficient procedure to pre-approve services performed by the independent auditor. As set forth in this Policy, unless a type of service has received general pre-approval, it will require specific pre-approval by the Audit Committee if it is to be provided by the independent auditor.
For both types of pre-approval, the Audit Committee will consider whether such services are consistent with the SEC’s rules on auditor independence. The Audit Committee will also consider whether the independent auditor is best positioned to provide the most effective and efficient service, for reasons such as its familiarity with the Funds’ business people, culture, accounting systems, risk profile and other factors, and whether the service might enhance the Funds’ ability to manage or control risk or improve audit quality. All such factors will be considered as a whole, and no one factor should necessarily be determinative.
The Audit Committee is also mindful of the relationship between fees for audit and non-audit services in deciding whether to pre-approve any such services and may determine, for each fiscal year, the ratio between the total amount of fees for Audit, Audit-related and Tax services and the total amount of fees for certain permissible non-audit services classified as All Other services.
The appendices to this Policy describe the Audit, Audit-related, Tax and All Other services that have the general pre-approval of the Audit Committee. The term of any general pre-approval is 12 months from the date of pre-approval, unless the Audit Committee considers a different period and states otherwise. The Audit Committee will annually review and pre-approve the services that may be provided by the independent auditor without obtaining specific pre-approval from the Audit Committee. The Audit Committee will add or subtract to the list of general pre-approved services from time to time, based on subsequent determinations.
The purpose of this Policy is to set forth the procedures by which the Audit Committee intends to fulfill its responsibilities. It does not delegate the Audit Committee’s responsibilities to pre-approve services performed by the independent auditor to management.
The independent auditor has reviewed this Policy and believes that implementation of the policy will not adversely affect the auditor’s independence.
II. Delegation
As provided in the Act and the SEC’s rules, the Audit Committee may delegate either type of pre-approval authority to one or more of its members. The member to whom such authority is delegated must report, for informational purposes only, any pre-approval decisions to the Audit Committee at its next scheduled meeting.
III. Audit Services
The annual Audit services engagement terms and fees will be subject to the specific pre-approval of the Audit Committee. Audit services include the annual financial statement audit and other procedures required to be performed by the independent auditor to be able to form an opinion on the Funds’ financial statements. These other procedures include information systems and procedural reviews and testing performed in order to understand and place reliance on the systems of internal control, and consultations
relating to the audit. Audit services also include the attestation engagement for the independent auditor’s report on management’s report on internal controls for financial reporting. The Audit Committee will monitor the Audit services engagement as necessary, but on no less than on a quarterly basis, and will also approve, if necessary, any changes in terms, conditions and fees resulting from changes in audit scope, Fund service providers or other items.
In addition to the annual Audit services engagement approved by the Audit Committee, the Audit Committee may grant general pre-approval for other Audit services, which are those services that only the independent auditor reasonably can provide. Other Audit services may include services associated with SEC registration statements, periodic reports and other documents filed with the SEC or other documents issued in connection with mergers or acquisitions.
The Audit Committee has pre-approved the Audit services in Appendix A. All other audit services not listed in Appendix A must be specifically pre-approved by the Audit Committee.
IV. Audit-related Services
Audit-related services are assurance and related services that are reasonably related to the performance of the audit or review of the Funds’ financial statements or that are traditionally performed by the independent auditor. Because the Audit Committee believes that the provision of Audit-related services does not impair the independence of the auditor and is consistent with SEC’s rules on auditor independence, the Audit Committee may grant general pre-approval for Audit-related services. Audit-related services include, among others, due diligence services pertaining to potential business acquisitions/dispositions; accounting consultations related to accounting, financial reporting or disclosure matters not classified as “Audit services”; assistance with understanding and implementing new accounting and financial reporting guidance from rulemaking authorities; agreed-upon or expanded audit procedures related to accounting records required to respond to or comply with financial, accounting or regulatory reporting matters; and assistance with internal control reporting requirements.
The Audit Committee has pre-approved the Audit-related services in Appendix B. All other Audit-related services not listed in appendix B must be specifically pre-approved by the Audit Committee.
V. Tax Services
The Audit Committee believes that the independent auditor can provide Tax services to the Funds such as tax compliance, tax planning and tax advice without impairing the auditor’s independence, and the SEC has stated that the independent auditor may provide such services. Hence, the Audit Committee believes it may grant general pre-approval to those Tax services that have historically been provided by the auditor, that the Audit Committee has reviewed and believes would not impair the independence of the auditor, and that are consistent with the SEC’s rules on auditor independence. The Audit Committee will not permit the retention of the independent auditor in connection with a transaction initially recommended by the independent auditor, the sole business purpose of which may be tax avoidance and the tax treatment of which may not be supported in the Internal Revenue Code and related regulations. The Audit Committee will consult with the Director of Fund Administration, the Senior Vice President of Tax Services or outside counsel to determine that the tax planning and reporting positions are consistent with this policy.
Pursuant to the preceding paragraph, the Audit Committee has pre-approved the Tax services in Appendix C. All Tax services involving large and complex transactions not listed in Appendix C must be specifically pre-approved by the Audit Committee, including: tax services proposed to be provide by the independent auditor to any executive officer or director of the Funds, in his or her individual capacity, where such services are paid for by the Funds or the investment advisor.
VI. All Other Services
The Audit Committee believes, based on the SEC’s rules prohibiting the independent auditor from providing specific non-audit services, that other types of non-audit services are permitted. Accordingly, the Audit Committee believes it may grant general pre-approval to those permissible non-audit services classified as All Other services that it believes are routine and recurring services, would not impair the independence of the auditor and are consistent with the SEC’s rules on auditor independence.
The Audit Committee has pre-approved the All Other services in Appendix C. Permissible All Other services not listed in Appendix C must be specifically pre-approved by the Audit Committee.
A list of the SEC’s prohibited non-audit services is attached to this policy as Exhibit 1. The SEC’s rules and relevant guidance should be consulted to determine the precise definitions of these services and the applicability of exceptions to certain of the prohibitions.
VII. Pre-Approval Fee Levels or Budgeted Amounts
Fee levels or budgeted amounts for all services to be provided by the independent auditor subject to general pre-approval will be established annually by the Audit Committee. Fee levels or budgeted amounts for services to be provided by the independent auditor subject to specific pre-approval will be established at the time of the specific pre-approval. Any proposed fees exceeding these levels or amounts will require specific pre-approval by the Audit Committee. The Audit Committee is mindful of the overall relationship of fees for audit and non-audit services in determining whether to pre-approve any such services. For each fiscal year, the Audit Committee may determine to ratio between the total amount of fees for Audit, Audit-related and Tax services, and the total amount of fees for services classified as All Other services.
VIII. Procedures
All requests or applications for services to be provided by the independent auditor that do not require specific approval by the Audit Committee will be submitted to the Director of Fund Administration or Assistant Director of Fund Administration and must include a detailed description of the services to be rendered. The Director/Assistant Director of Fund Administration will determine whether such services are included within the list of services that have received the general pre-approval of the Audit Committee. The Audit Committee will be informed on a quarterly basis (or more frequent if requested by the Audit Committee) of any such services rendered by the independent auditor.
Requests or applications to provide services that require specific approval by the Audit Committee will be submitted to the Audit Committee by both the independent auditor and the Director/Assistant Director of Fund Administration, and must include a joint statement as to whether, in their view, the request or application is consistent with the SEC’s rules on auditor independence.
The Director/Assistant Director of Fund Administration will report to the Audit Committee at each of its regular meetings regarding all services provided by the independent auditor that are subject to this policy since the last such report was rendered, including: (1) a general description of the services; (2) actual billed and projected fees; and (3) the means by which such services were pre-approved by the Audit Committee, as well as the date of approval and any related fee level or budgeted amount to which the services are subject.
The Audit Committee has designated the Chief Compliance Officer to monitor the performance of all services provided by the independent auditor and to determine whether such services are in compliance with this policy. The Chief Compliance Officer will report to the Audit Committee on a periodic basis on the results of its monitoring. Both the Chief Compliance Officer and management will immediately report to the chairman of the Audit Committee any breach of this policy that comes to the attention of the Chief Compliance Officer or any member of management.
IX. Additional Requirements
The Audit Committee has determined to take additional measures on an annual basis to meet its responsibility to oversee the work of the independent auditor and to assure the auditor’s independence from the Funds, such as reviewing a formal written statement from the independent auditor delineating all relationships between the independent auditor and the Funds, the Funds’ investment advisor and related parties of the investment advisor, consistent with Independence Standards Board Standard No. 1, and discussing with the independent auditor its methods and procedures for ensuring independence.
Items 5 – Audit Committee of Listed Registrants
On January 1, 2009, Patricia B. Norris replaced Charles A. Austin III as chair of the Audit Committee.
Item 6 – Schedule of Investments
Please see schedule of investments contained in the Report to Stockholders included under Item 1 of this Form N-CSR.
Item 7 – Disclosure of Proxy Voting Policies and Procedures for Closed-End Management Investment Companies.
Not applicable.
Item 8 – Portfolio Managers of Closed-End Management Investment Companies.
Not applicable.
Item 9 – Purchases of Equity Securities by Closed-End Management Investment Company and Affiliated Purchasers.
Not applicable.
Item 10 – Submission of Matters to a Vote of Security Holders
There have been no material changes to the procedures by which shareholders may recommend nominees to the Registrant’s board of trustees that have been implemented since the Registrant last provided disclosure in response to the requirements of this Item.
Item 11 – Controls and Procedures
(a) | The Registrant’s principal executive officer and principal financial officer have evaluated the Registrant’s disclosure controls and procedures (as defined in Rule 30a-3(c) under the Investment Company Act of 1940) within 90 days of this filing and have concluded that the Registrant’s disclosure controls and procedures were effective, as of that date, in ensuring that information required to be disclosed by the Registrant in this Form N-CSR was recorded, processed, summarized, and reported timely. |
(b) | There has been no changes in the Registrant’s internal controls over financial reporting (as defined in Rule 30a-3(d) under the Investment Company Act of 1940) that occurred during the second fiscal quarter of the period covered by this report that has materially affected, or is reasonably likely to affect, the Registrant’s internal control over financial reporting. |
Item 12 – Exhibits
File the exhibits listed below as part of this Form. Letter or number the exhibits in the sequence indicated.
(a) | Any code of ethics, or amendment thereto, that is the subject of the disclosure required by Item 2, to the extent that the Registrant intends to satisfy the Item 2 requirements through filing of an exhibit. |
(b)(1) | Separate certifications for the Registrant’s principal executive officer and principal financial officer, as required by Section 302 of the Sarbanes-Oxley Act of 2002 and Rule 30a-2(a) under the Investment Company Act of 1940, are attached as EX99.CERT. |
(b)(2) | Separate certifications for the Registrant’s principal executive officer and principal financial officer, as required by Section 1350 of Title 18 of United States Code, as adopted pursuant to Section 906 of the Sarbanes-Oxley Act of 2002, and Rule 30a-2(b) under the Investment Company Act of 1940, are attached as EX99.906CERT. The certifications furnished pursuant to this paragraph are not deemed to be “filed” for purposes of Section 18 of the Securities Exchange Act of 1934, or otherwise subject to the liability of that section. Such certifications are not deemed to be incorporated by reference into any filing under the Securities Act of 1933 or the Securities Exchange Act of 1934, except to the extent that the Registrant specifically incorporates them by reference. |
Pursuant to the requirements of the Securities Exchange Act of 1934 and the Investment Company Act of 1940, the Registrant has duly caused this report to be signed on its behalf by the undersigned, thereunto duly authorized.
Evergreen Equity Trust | | | |
By: |
/s/ W. Douglas Munn
| | | |
|
| | | |
| W. Douglas Munn
Principal Executive Officer | | | |
Date: November 27, 2009
Pursuant to the requirements of the Securities Exchange Act of 1934 and the Investment Company Act of 1940, this report has been signed below by the following persons on behalf of the Registrant and in the capacities and on the dates indicated.
By: |
/s/ W. Douglas Munn
| | | |
|
| | | |
| W. Douglas Munn
Principal Executive Officer | | | |
Date: November 27, 2009
By: |
/s/ Jeremy DePalma
| | | |
|
| | | |
| Jeremy DePalma
Principal Financial Officer | | | |
Date: November 27, 2009