On October 3, 2008, Wells Fargo and Wachovia Corporation (“Wachovia”) announced that Wells Fargo agreed to acquire Wachovia in a whole company transaction that would include all of Wachovia’s banking and other businesses. In connection with this transaction, Wachovia issued preferred shares to Wells Fargo representing approximately a 40% voting interest in Wachovia. Due to its ownership of preferred shares, Wells Fargo may have been deemed to control EIMC. If Wells Fargo was deemed to control EIMC, then the existing advisory agreement between the Fund and EIMC and the sub-advisory agreement between EIMC and the Fund’s sub-advisor would have terminated automatically in connection with the issuance of preferred shares. To address this possibility, on October 20, 2008 the Board of Trustees approved an interim advisory agreement with EIMC and an interim sub-advisory agreement with the sub-advisor with the same terms and conditions as the existing agreements, which became effective upon the issuance of the preferred shares. EIMC’s receipt of the advisory fees under the interim advisory agreement was subject to the approval by shareholders of the Fund of a new advisory agreement with EIMC.
On December 31, 2008, Wachovia merged with and into Wells Fargo and as a result of the merger, EIMC, Evergreen Investment Services, Inc. (“EIS”) and Evergreen Service Company, LLC (“ESC”) became subsidiaries of Wells Fargo. After the merger, a new interim advisory agreement with the same terms and conditions between the Fund and EIMC went into effect. In addition, a new interim sub-advisory agreement with the same terms and conditions became effective with the sub-advisor to the Fund.
Shareholders approved the new advisory agreement between the Fund and EIMC on March 12, 2009.
From time to time, EIMC may voluntarily or contractually waive its fee and/or reimburse expenses in order to limit operating expenses. During the year ended July 31, 2009, EIMC contractually and voluntarily waived its advisory fee in the amounts of $211,253 and $14,728, respectively, and contractually reimbursed other expenses in the amount of $15,050.
The Fund may invest in money market funds which are advised by EIMC. Income earned on these investments is included in income from affiliated issuers on the Statement of Operations.
EIMC also serves as the administrator to the Fund providing the Fund with facilities, equipment and personnel. EIMC is paid an annual rate determined by applying percentage rates to the aggregate average daily net assets of the Evergreen funds (excluding money market funds) starting at 0.10% and declining to 0.05% as the aggregate average daily net assets of the Evergreen funds (excluding money market funds) increase. For the year ended July 31, 2009, the administrative services fee was equivalent to an annual rate of 0.10% of the Fund’s average daily net assets.
NOTES TO FINANCIAL STATEMENTS continued
ESC, an affiliate of EIMC and a subsidiary of Wells Fargo, is the transfer and dividend disbursing agent for the Fund. ESC receives account fees that vary based on the type of account held by the shareholders in the Fund. For the year ended July 31, 2009, the transfer agent fees were equivalent to an annual rate of 0.65% of the Fund’s average daily net assets.
4. DISTRIBUTION PLANS
EIS, an affiliate of EIMC and a subsidiary of Wells Fargo, serves as distributor of the Fund’s shares. The Fund has adopted Distribution Plans, as allowed by Rule 12b-1 of the 1940 Act, for each class of shares, except Class I. Under the Distribution Plans, the Fund is permitted to pay distribution fees at an annual rate of up to 0.75% of the average daily net assets for Class A shares and up to 1.00% of the average daily net assets for each of Class B and Class C shares. However, currently the distribution fees for Class A shares are limited to 0.25% of the average daily net assets of the class.
For the year ended July 31, 2009, EIS received $289 from the sale of Class A shares and $9,701 and $733 in contingent deferred sales charges from redemptions of Class B and Class C shares, respectively.
5. ACQUISITION
Effective at the close of business on September 19, 2008, the Fund acquired the net assets of Evergreen Special Equity Fund in a tax-free exchange for Class A, Class B, Class C, and Class I shares of the Fund. Shares were issued to Class A, Class B, Class C, Class I and Class IS shareholders of Evergreen Special Equity Fund at an exchange ratio of 1.22, 1.14, 1.14, 1.28 and 1.23 for Class A, Class B, Class C, Class I and Class A shares, respectively, of the Fund. The acquired net assets consisted primarily of portfolio securities with unrealized depreciation of $1,641,682. The aggregate net assets of the Fund and Special Equity Fund immediately prior to the acquisition were $4,929,372 and $54,052,596, respectively. The aggregate net assets of the Fund immediately after the acquisition were $58,981,968.
6. INVESTMENT TRANSACTIONS
Cost of purchases and proceeds from sales of investment securities (excluding short-term securities) were $64,269,918 and $72,142,535, respectively, for the year ended July 31, 2009.
Statement of Financial Accounting Standards No. 157, Fair Value Measurements (“FAS 157”) establishes a single authoritative definition of fair value, establishes a framework for measuring fair value and expands disclosures about fair value measurements. FAS 157 establishes a fair value hierarchy based upon the various inputs used in determining the value of the Fund’s investments. These inputs are summarized into three broad levels as follows:
23
NOTES TO FINANCIAL STATEMENTS continued
Level 1 – quoted prices in active markets for identical securities Level 2 – other significant observable inputs (including quoted prices for similar securities, interest rates, prepayment speeds, credit risk, etc.) Level 3 – significant unobservable inputs (including the Fund’s own assumptions in determining the fair value of investments) |
The inputs or methodologies used for valuing securities are not necessarily an indication of the risk associated with investing in those securities.
As of July 31, 2009, the inputs used in valuing the Fund’s assets, which are carried at fair value, were as follows:
| | | | Significant Other | | Significant | | |
| | | | Observable | | Unobservable | | |
| | Quoted Prices | | Inputs | | Inputs | | |
Investments in Securities | | (Level 1) | | (Level 2) | | (Level 3) | | Total |
|
|
|
|
|
|
|
|
|
Equity securities | | | | | | | | | | | | | | | | |
Common stocks | | $ | 30,709,786 | | | $ | 0 | | | $ | 0 | | | $ | 30,709,786 | |
Short-term Investments | | | 456,126 | | | | 0 | | | | 0 | | | | 456,126 | |
|
|
|
|
|
|
|
|
|
|
|
|
|
|
|
|
|
| | $ | 31,165,912 | | | $ | 0 | | | $ | 0 | | | $ | 31,165,912 | |
|
|
|
|
|
|
|
|
|
|
|
|
|
|
|
|
|
Further details on the major security types listed above can be found in the Schedule of Investments.
On July 31, 2009, the aggregate cost of securities for federal income tax purposes was $34,121,499. The gross unrealized appreciation and depreciation on securities based on tax cost was $2,004,482 and $4,960,069, respectively, with a net unrealized depreciation of $2,955,587.
As of July 31, 2009, the Fund had $13,638,891 in capital loss carryovers for federal income tax purposes expiring in 2017.
For income tax purposes, capital losses incurred after October 31 within the Fund’s fiscal year are deemed to arise on the first business day of the following fiscal year. As of July 31, 2009, the Fund incurred and will elect to defer post-October losses of $13,011,255.
7. INTERFUND LENDING
Pursuant to an Exemptive Order issued by the SEC, the Fund may participate in an interfund lending program with certain funds in the Evergreen fund family. This program allows the Fund to borrow from, or lend money to, other participating funds. During the year ended July 31, 2009, the Fund did not participate in the interfund lending program.
24
NOTES TO FINANCIAL STATEMENTS continued
8. DISTRIBUTIONS TO SHAREHOLDERS
As of July 31, 2009, the components of distributable earnings on a tax basis were as follows:
| Capital Loss | |
| Carryovers | |
| and | Temporary |
Unrealized | Post-October | Book/Tax |
Depreciation | Losses | Differences |
|
|
|
$2,955,587 | $26,650,146 | $(7,273) |
|
|
|
The temporary book/tax differences are a result of timing differences between book and tax recognition of income and/or expenses.
9. EXPENSE REDUCTIONS
Through expense offset arrangements with ESC and the Fund’s custodian, a portion of fund expenses has been reduced.
10. DEFERRED TRUSTEES’ FEES
Each Trustee of the Fund may defer any or all compensation related to performance of his or her duties as a Trustee. The Trustees’ deferred balances are allocated to deferral accounts, which are included in the accrued expenses for the Fund. The investment performance of the deferral accounts is based on the investment performance of certain Evergreen funds. Any gains earned or losses incurred in the deferral accounts are reported in the Fund’s Trustees’ fees and expenses. At the election of the Trustees, the deferral account will be paid either in one lump sum or in quarterly installments for up to ten years.
11. FINANCING AGREEMENT
The Fund and certain other Evergreen funds share in a $100 million unsecured revolving credit commitment for temporary and emergency purposes, including the funding of redemptions, as permitted by each participating fund’s borrowing restrictions. Borrowings under this facility bear interest at the higher of the Federal Funds rate plus 1.25% or LIBOR plus 1.25%. Prior to June 26, 2009, the interest rate was 0.50% per annum above the Federal Funds rate. All of the participating funds are charged an annual commitment fee of 0.145% on the unused balance, which is allocated pro rata. Prior to June 26, 2009, the annual commitment fee was 0.09%. During the year ended July 31, 2009, the Fund had no borrowings.
12. REGULATORY MATTERS AND LEGAL PROCEEDINGS
The Evergreen funds, EIMC and certain of EIMC’s affiliates are involved in various legal actions, including private litigation and class action lawsuits, and are and may in the future be subject to regulatory inquiries and investigations.
25
NOTES TO FINANCIAL STATEMENTS continued
EIMC and EIS have reached final settlements with the Securities and Exchange Commission (“SEC”) and the Securities Division of the Secretary of the Commonwealth of Massachusetts (“Commonwealth”) primarily relating to the liquidation of Evergreen Ultra Short Opportunities Fund (“Ultra Short Fund”). The claims settled include the following: first, that during the period February 2007 through Ultra Short Fund’s liquidation on June 18, 2008, Ultra Short Fund’s former portfolio management team failed to properly take into account readily-available information in valuing certain non-agency residential mortgage-backed securities held by the Ultra Short Fund, resulting in the Ultra Short Fund’s net asset value (“NAV”) being overstated during the period; second, that EIMC and EIS acted inappropriately when, in an effort to explain the decline in Ultra Short Fund’s NAV, certain information regarding the decline was communicated to some, but not all, shareholders and financial intermediaries; third, that the Ultra Short Fund portfolio management team did not adhere to regulatory requirements for affiliated cross trades in executing trades with other Evergreen funds; and finally, that from at least September 2007 to August 2008, EIS did not preserve certain text and instant messages transmitted via personal digital assistant devices. In settling these matters, EIMC and EIS have agreed to payments totaling $41,125,000, up to $40,125,000 of which will be distributed to eligible shareholders of Ultra Short Fund pursuant to a methodology and plan approved by the regulators. EIMC and EIS neither admitted nor denied the regulators’ conclusions.
Three purported class actions have also been filed in the U.S. District Court for the District of Massachusetts relating to the same events; defendants include various Evergreen entities, including EIMC and EIS, and Evergreen Fixed Income Trust and its Trustees. The cases generally allege that investors in the Ultra Short Fund suffered losses as a result of (i) misleading statements in Ultra Short Fund’s registration statement and prospectus, (ii) the failure to accurately price securities in the Ultra Short Fund at different points in time and (iii) the failure of the Ultra Short Fund’s risk disclosures and description of its investment strategy to inform investors adequately of the actual risks of the fund.
EIMC does not expect that any of the legal actions, inquiries or settlement of regulatory matters will have a material adverse impact on the financial position or operations of the Fund to which these financial statements relate. Any publicity surrounding or resulting from any legal actions or regulatory inquiries involving EIMC or its affiliates or any of the Evergreen Funds could result in reduced sales or increased redemptions of Evergreen fund shares, which could increase Evergreen fund transaction costs or operating expenses or have other adverse consequences on the Evergreen funds, including the Fund.
26
REPORT OF INDEPENDENT REGISTERED PUBLIC ACCOUNTING FIRM
Board of Trustees and Shareholders
Evergreen Equity Trust
We have audited the accompanying statement of assets and liabilities, including the schedule of investments, of the Evergreen Golden Core Opportunities Fund, a series of the Evergreen Equity Trust, as of July 31, 2009 and the related statement of operations for the year then ended, statements of changes in net assets and the financial highlights for the year ended July 31, 2009 and the period from December 17, 2007 (commencement of operations) to July 31, 2008. These financial statements and financial highlights are the responsibility of the Fund’s management. Our responsibility is to express an opinion on these financial statements and financial highlights based on our audits.
We conducted our audits in accordance with the standards of the Public Company Accounting Oversight Board (United States). Those standards require that we plan and perform the audit to obtain reasonable assurance about whether the financial statements and financial highlights are free of material misstatement. An audit includes examining, on a test basis, evidence supporting the amounts and disclosures in the financial statements. Our procedures included confirmation of securities owned as of July 31, 2009 by correspondence with the custodian. An audit also includes assessing the accounting principles used and significant estimates made by management, as well as evaluating the overall financial statement presentation. We believe that our audits provide a reasonable basis for our opinion.
In our opinion, the financial statements and financial highlights referred to above present fairly, in all material respects, the financial position of the Evergreen Golden Core Opportunities Fund as of July 31, 2009, the results of its operations, changes in its net assets and financial highlights for each of the years or periods described above, in conformity with U.S. generally accepted accounting principles.

Boston, Massachusetts
September 24, 2009
27
TRUSTEES AND OFFICERS
TRUSTEES1 | |
Charles A. Austin III
Trustee
DOB: 10/23/1934
Term of office since: 1991
Other directorships: None | Investment Counselor, Anchor Capital Advisors, LLC. (investment advice); Director, The Andover Companies (insurance); Trustee, Arthritis Foundation of New England; Former Director, The Francis Ouimet Society (scholarship program); Former Director, Executive Vice President and Treasurer, State Street Research & Management Company (investment advice) |
|
|
K. Dun Gifford
Trustee
DOB: 10/23/1938
Term of office since: 1974
Other directorships: None | Chairman and President, Oldways Preservation and Exchange Trust (education); Trustee, Member of the Executive Committee, Former Chairman of the Finance Committee, and Former Treasurer, Cambridge College |
|
|
Dr. Leroy Keith, Jr.
Trustee
DOB: 2/14/1939
Term of office since: 1983
Other directorships: Trustee,
Phoenix Fund Complex
(consisting of 50 portfolios
as of 12/31/2008) | Managing Director, Almanac Capital Management (commodities firm); Trustee, Phoenix Fund Complex; Director, Diversapack Co. (packaging company); Former Partner, Stonington Partners, Inc. (private equity fund); Former Director, Obagi Medical Products Co.; Former Director, Lincoln Educational Services |
|
|
Carol A. Kosel
Trustee
DOB: 12/25/1963
Term of office since: 2008
Other directorships: None | Former Consultant to the Evergreen Boards of Trustees; Former Vice President and Senior Vice President, Evergreen Investments, Inc.; Former Treasurer, Evergreen Funds; Former Treasurer, Vestaur Securities Fund |
|
|
Gerald M. McDonnell
Trustee
DOB: 7/14/1939
Term of office since: 1988
Other directorships: None | Former Manager of Commercial Operations, CMC Steel (steel producer) |
|
|
Patricia B. Norris
Trustee
DOB: 4/9/1948
Term of office since: 2006
Other directorships: None | President and Director of Buckleys of Kezar Lake, Inc. (real estate company); Former President and Director of Phillips Pond Homes Association (home community); Former Partner, PricewaterhouseCoopers, LLP (independent registered public accounting firm) |
|
|
William Walt Pettit2
Trustee
DOB: 8/26/1955
Term of office since: 1988
Other directorships: None | Partner and Vice President, Kellam & Pettit, P.A. (law firm); Director, Superior Packaging Corp. (packaging company); Member, Superior Land, LLC (real estate holding company), Member, K&P Development, LLC (real estate development); Former Director, National Kidney Foundation of North Carolina, Inc. (non-profit organization) |
|
|
David M. Richardson
Trustee
DOB: 9/19/1941
Term of office since: 1982
Other directorships: None | President, Richardson, Runden LLC (executive recruitment advisory services); Director, J&M Cumming Paper Co. (paper merchandising); Former Trustee, NDI Technologies, LLP (communications); Former Consultant, AESC (The Association of Executive Search Consultants) |
|
|
Russell A. Salton III, MD
Trustee
DOB: 6/2/1947
Term of office since: 1984
Other directorships: None | President/CEO, AccessOne MedCard, Inc. |
|
|
28
TRUSTEES AND OFFICERS continued
Michael S. Scofield
Trustee
DOB: 2/20/1943
Term of office since: 1984
Other directorships: None | Retired Attorney, Law Offices of Michael S. Scofield; Former Director and Chairman, Branded Media Corporation (multi-media branding company) |
|
|
Richard J. Shima
Trustee
DOB: 8/11/1939
Term of office since: 1993
Other directorships: None | Independent Consultant; Director, Hartford Hospital; Trustee, Greater Hartford YMCA; Former Director, Trust Company of CT; Former Trustee, Saint Joseph College (CT) |
|
|
Richard K. Wagoner, CFA3
Trustee
DOB: 12/12/1937
Term of office since: 1999
Other directorships: None | Member and Former President, North Carolina Securities Traders Association; Member, Financial Analysts Society |
|
|
OFFICERS | |
W. Douglas Munn4
President
DOB: 4/21/1963
Term of office since: 2009 | Principal occupations: Chief Operating Officer, Wells Fargo Funds Management, LLC; President and Chief Operating Officer, Evergreen Investment Company, Inc. |
|
|
Jeremy DePalma4
Treasurer
DOB: 2/5/1974
Term of office since: 2005 | Principal occupations: Senior Vice President, Evergreen Investment Management Company, LLC; Former Vice President, Evergreen Investment Services, Inc.; Former Assistant Vice President, Evergreen Investment Services, Inc. |
|
|
Michael H. Koonce4
Secretary
DOB: 4/20/1960
Term of office since: 2000 | Principal occupations: Senior Vice President and General Counsel, Evergreen Investment Services, Inc.; Secretary, Senior Vice President and General Counsel, Evergreen Investment Management Company, LLC and Evergreen Service Company, LLC |
|
|
Robert Guerin4
Chief Compliance Officer
DOB: 9/20/1965
Term of office since: 2007 | Principal occupations: Chief Compliance Officer, Evergreen Funds and Senior Vice President of Evergreen Investment Company, Inc.; Former Managing Director and Senior Compliance Officer, Babson Capital Management LLC; Former Principal and Director, Compliance and Risk Management, State Street Global Advisors; Former Vice President and Manager, Sales Practice Compliance, Deutsche Asset Management |
|
|
1 | Each Trustee serves until a successor is duly elected or qualified or until his or her death, resignation, retirement or removal from office. Each Trustee oversaw 77 Evergreen funds as of December 31, 2008. Correspondence for each Trustee may be sent to Evergreen Board of Trustees, P.O. Box 20083, Charlotte, NC 28202. |
2 | It is possible that Mr. Pettit may be viewed as an “interested person” of the Evergreen funds, as defined in the 1940 Act, because of his law firm’s previous representation of affiliates of Wells Fargo & Company (“Wells Fargo”), the parent to the Evergreen funds’ investment advisor, EIMC. The Trustees are treating Mr. Pettit as an interested trustee for the time being. |
3 | Mr. Wagoner is an “interested person” of the Evergreen funds because of his ownership of shares in Wells Fargo & Company, the parent to the Evergreen funds’ investment advisor. |
4 | The address of the Officer is 200 Berkeley Street, Boston, MA 02116. |
Additional information about the Fund’s Board of Trustees and Officers can be found in the Statement of Additional Information (SAI) and is available upon request without charge by calling 800.343.2898.
29

581817 rv1 09/2009
Evergreen Golden Large Cap Core Fund
| | table of contents |
1 | | LETTER TO SHAREHOLDERS |
4 | | FUND AT A GLANCE |
6 | | PORTFOLIO MANAGER COMMENTARY |
8 | | ABOUT YOUR FUND’S EXPENSES |
9 | | FINANCIAL HIGHLIGHTS |
13 | | SCHEDULE OF INVESTMENTS |
17 | | STATEMENT OF ASSETS AND LIABILITIES |
18 | | STATEMENT OF OPERATIONS |
19 | | STATEMENTS OF CHANGES IN NET ASSETS |
20 | | NOTES TO FINANCIAL STATEMENTS |
27 | | REPORT OF INDEPENDENT REGISTERED PUBLIC ACCOUNTING FIRM |
28 | | ADDITIONAL INFORMATION |
32 | | TRUSTEES AND OFFICERS |
This annual report must be preceded or accompanied by a prospectus of the Evergreen fund contained herein. The prospectus contains more complete information, including fees and expenses, and should be read carefully before investing or sending money.
The fund will file its complete schedule of portfolio holdings with the SEC for the first and third quarters of each fiscal year on Form N-Q. The fund’s Form N-Q will be available on the SEC’s Web site at http://www.sec.gov. In addition, the fund’s Form N-Q may be reviewed and copied at the SEC’s Public Reference Room in Washington, D.C. Information on the operation of the Public Reference Room may be obtained by calling 800.SEC.0330.
A description of the fund’s proxy voting policies and procedures, as well as information regarding how the fund voted proxies relating to portfolio securities during the most recent 12-month period ended June 30, is available by visiting our Web site at EvergreenInvestments.com or by visiting the SEC’s Web site at http://www.sec.gov. The fund’s proxy voting policies and procedures are also available without charge, upon request, by calling 800.343.2898.
Mutual Funds:
| NOT FDIC INSURED | MAY LOSE VALUE | NOT BANK GUARANTEED |
Evergreen InvestmentsSM is a service mark of Evergreen Investment Management Company, LLC. Copyright 2009, Evergreen Investment Management Company, LLC.
Evergreen Investment Management Company, LLC is a subsidiary of Wells Fargo & Company and is an affiliate of Wells Fargo & Company’s other Broker Dealer subsidiaries.
Evergreen mutual funds are distributed by Evergreen Investment Services, Inc. 200 Berkeley Street, Boston, MA 02116
LETTER TO SHAREHOLDERS
September 2009

W. Douglas Munn
President and Chief Executive Officer
Dear Shareholder:
We are pleased to provide the Annual Report for Evergreen Golden Large Cap Core Fund for the twelve-month period ended July 31, 2009 (the “period”).
Capital markets throughout the globe continued to experience extreme pressure during the period. Home prices continued to fall and job losses persisted. In September 2008, federal officials allowed for the collapse of Lehman Brothers, and the collateral damage from this event led to further collapse. Venerable financial institutions fell like dominos in the ensuing weeks as distrust prevailed and counter-party risk, whether real or imagined, escalated. Inter-bank lending ceased to exist, and the credit markets froze. Early in 2009, the fixed income markets worried about deflation, evidenced by investor willingness to accept virtually nothing for short-term loans to the government. Concerns about federal spending also increased, with yields climbing for longer-term U.S. Treasuries during the first quarter of 2009. International markets were hit hard as economies in both developed and emerging countries struggled. Equity markets were affected by the weakness in economic data and corporate profits, although during April 2009, stocks rallied off their March 9th lows, with international and small cap stocks leading the gains. Signs of stability emerged in the corporate credit markets, though, as both issuance and performance improved. The price of oil surged in the second quarter of 2009, pulling most commodities higher, as gold gave back earlier gains and the dollar weakened. While recent data reflects an economy that is managing to climb from the depths of the past two quarters, we question whether the fundamentals are in place for sustainable growth, given the still unresolved issues of credit availability, rising unemployment, declining home values, auto bankruptcies, and the possibility for more bank re-capitalizations.
Due to prospects for “below-trend” growth, we consider the growing inflation fears to be overdone. Global growth is receding, oil prices remain 50% lower than last summer, and domestic home prices continue their descent. Rather, as massive global stimulus seeks areas that may hold their intrinsic value (hard assets such as gold), signs of “reflation” may continue. Yet with wages representing the largest costs for businesses and an unemployment rate headed toward 10%, it is improbable that true inflationary pressures are poised to develop until well into 2010.
1
LETTER TO SHAREHOLDERS continued
It appears that the Federal Reserve Board may agree with this assessment. At the conclusion of their meeting on June 24th, monetary policy makers decided to leave their target for the benchmark federal funds rate near zero “for an extended period” as inflation is expected to remain “subdued for some time.” In addition, the central bank reiterated its commitment to the asset purchase program announced in March 2009, whereby policy makers pledged to purchase up to $300 billion in long-term U.S. Treasury bonds and up to $1.25 trillion in mortgage-backed securities. The goal of this program is to drive prices up and yields down, in order to lower the rates borrowers must pay on a variety of loans to help improve demand and economic activity.
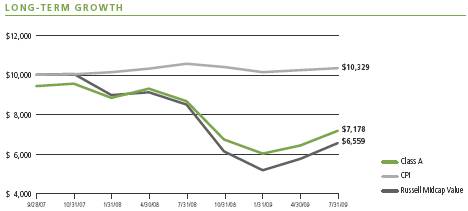
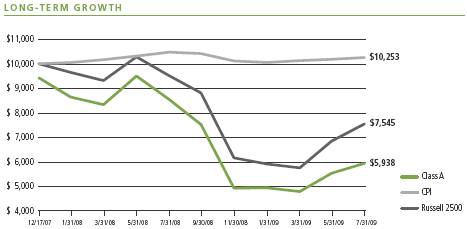
During a volatile and challenging period in the stock market, the Golden fund management teams pursued strategies based on each fund’s objective. Evergreen Golden Large Cap Core Fund sought undervalued large cap companies likely to meet or exceed earnings expectations. Evergreen Golden Mid Cap Core Fund sought undervalued, mid cap companies similar to those found in the Russell Midcap Index. Evergreen Golden Core Opportunities Fund sought undervalued stocks of small to mid cap companies similar to those found in the Russell 2500 Index.
We believe the changing conditions in the investment environment over the period have underscored the value of a well-diversified, long-term investment strategy to help soften the effects of volatility in any one market or asset class. As always, we encourage investors to maintain diversified investment portfolios in pursuit of their long-term investment goals.
Please visit us at EvergreenInvestments.com for more information about our funds and other investment products available to you. Thank you for your continued support of Evergreen Investments.
Sincerely,

W. Douglas Munn
President and Chief Executive Officer
Evergreen Funds
2
LETTER TO SHAREHOLDERS continued
Notice to Shareholders:
Effective after the close of business on June 30, 2009, Class B shares of the Fund was closed to new accounts and additional purchases by existing shareholders. Existing shareholders of Class B shares of the Fund may continue to exchange their Class B shares for Class B shares of other Evergreen Funds subject to the limitations described in each fund’s prospectus and may also continue to add to their accounts through dividend reinvestment. All other Class B share features and attributes, including, but not limited to, the 12b-1 fee, contingent deferred sales charge and conversion after a number of years to Class A shares, remain unchanged. Shareholders of the Fund may continue to redeem Fund shares in the manner described in the Fund’s prospectus.
3
FUND AT A GLANCE
as of July 31, 2009
MANAGEMENT TEAM
Investment Advisor:
Evergreen Investment Management Company, LLC
Sub-Advisor:
Golden Capital Management, LLC
Portfolio Manager:
Jeff C. Moser, CFA
CURRENT INVESTMENT STYLE

Source: Morningstar, Inc.
Morningstar’s style box is based on a portfolio date as of 6/30/2009.
The Equity style box placement is based on 10 growth and valuation measures for each fund holding and the median size of the companies in which the fund invests.
PERFORMANCE AND RETURNS
Portfolio inception date: 12/17/2007
| Class A | Class B | Class C | Class I |
Class inception date | 12/17/2007 | 12/17/2007 | 12/17/2007 | 12/17/2007 |
|
|
|
|
|
Nasdaq symbol | EGOAX | EGOBX | EGOCX | EGOIX |
|
|
|
|
|
Average annual return* | | | | |
|
|
|
|
|
1-year with sales charge | -24.44% | -24.38% | -21.12% | N/A |
|
|
|
|
|
1-year w/o sales charge | -19.78% | -20.40% | -20.33% | -19.61% |
|
|
|
|
|
Since portfolio inception | -22.38% | -21.98% | -19.95% | -19.27% |
|
|
|
|
|
Maximum sales charge | 5.75% | 5.00% | 1.00% | N/A |
| Front-end | CDSC | CDSC | |
|
|
|
|
|
* | Adjusted for maximum applicable sales charge, unless noted. |
Past performance is no guarantee of future results. The performance quoted represents past performance and current performance may be lower or higher. The investment return and principal value of an investment will fluctuate so that investors’ shares, when redeemed, may be worth more or less than their original cost. To obtain performance information current to the most recent month-end for Classes A, B, C or I, please go to EvergreenInvestments.com/fundperformance. The performance of each class may vary based on differences in loads, fees and expenses paid by the shareholders investing in each class. Performance includes the reinvestment of income dividends and capital gain distributions. Performance shown does not reflect the deduction of taxes that a shareholder would pay on fund distributions or the redemption of fund shares.
The fund incurs a 12b-1 fee of 0.25% for Class A and 1.00% for Classes B and C. Class I does not pay a 12b-1 fee.
Class B shares are closed to new investments by new and existing shareholders.
The advisor is waiving its advisory fee and reimbursing the fund for a portion of other expenses. Had the fee not been waived and expenses not reimbursed, returns would have been lower.
4
FUND AT A GLANCE continued
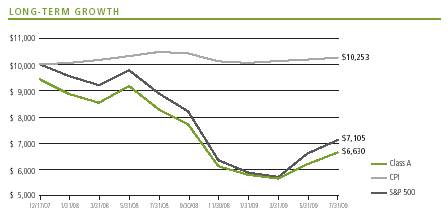
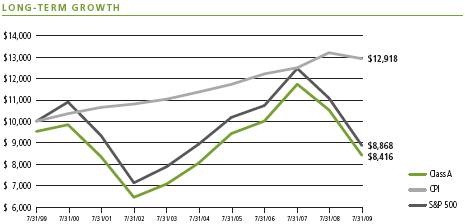
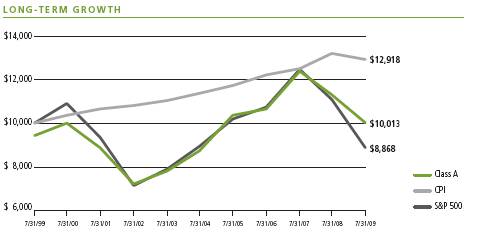
Comparison of a $10,000 investment in the Evergreen Golden Large Cap Core Fund Class A shares versus a similar investment in the S&P 500 Index (S&P 500) and the Consumer Price Index (CPI).
The S&P 500 is an unmanaged market index and does not include transaction costs associated with buying and selling securities, any mutual fund fees or expenses or any taxes. The CPI is a commonly used measure of inflation and does not represent an investment return. It is not possible to invest directly in an index.
Class I shares are only offered, subject to the minimum initial purchase requirements, in the following manner: (1) to investment advisory clients of EIMC (or its advisory affiliates), (2) to employer- or state-sponsored benefit plans, including but not limited to, retirement plans, defined benefit plans, deferred compensation plans, or savings plans, (3) to fee-based mutual fund wrap accounts, (4) through arrangements entered into on behalf of the Evergreen funds with certain financial services firms, (5) to certain institutional investors, and (6) to persons who owned Class Y shares in registered name in an Evergreen fund on or before December 31, 1994 or who owned shares of any SouthTrust fund in registered name as of March 18, 2005 or who owned shares of Vestaur Securities Fund as of May 20, 2005.
Class I shares are only available to institutional shareholders with a minimum of $1 million investment, which may be waived in certain situations.
The fund’s investment objective may be changed without a vote of the fund’s shareholders.
Since the fund tends to invest in a smaller number of stocks than many similar mutual funds, changes in the value of individual stocks may have a larger impact on its net asset value than such fluctuations would if the fund were more broadly invested.
Small and mid cap securities may be subject to special risks associated with narrower product lines and limited financial resources compared to their large cap counterparts, and, as a result, small and mid cap securities may decline significantly in market downturns and may be more volatile than those of larger companies due to the higher risk of failure.
All data is as of July 31, 2009, and subject to change.
5
PORTFOLIO MANAGER COMMENTARY
The fund’s Class A shares returned -19.78% for the twelve-month period ended July 31, 2009, excluding any applicable sales charges. During the same period, the S&P 500 returned -19.96%.
The fund’s objective is to seek long-term capital growth.
Investment process
The year included one of the steepest declines in overall equity returns when the real estate and credit crisis caused liquidity and solvency problems at some of our nation’s largest financial institutions, precipitating a dramatic drop in economic activity. Fortunately, the last five months of the fiscal year also included a sizable rebound in stock prices when emergency measures to support the financial and economic markets proved at least partly successful.
The fund is managed with the goal of long-term capital growth and seeks to outperform the S&P 500 Index, a common benchmark for large-cap stock investing, over time. The portfolio manager utilizes a combination of quantitative methods and fundamental analysis to select a core portfolio of companies that he believes exhibit the likelihood to meet or exceed future earnings expectations. The portfolio manager uses proprietary valuation, earnings surprise and trading momentum models to rank securities in terms of their valuation, potential for delivering future earnings in excess of current analyst expectations and overall attractiveness.
Contributors to performance
In general, the market environment that existed over the course of the fiscal year was not favorable for our fundamentally-focused investment process. While we primarily focus on individual companies’ fundamentals (e.g. balance sheet, cash flows, earnings growth, earnings quality, relative valuations), the markets were focused on liquidity shocks, a credit crisis, macroeconomic themes, and dramatic shifts in risk aversion. As a result, our stock ranking models did not work as expected over the course of the fiscal year.
Although the Financials sector was the worst performing sector for the year, it is where the fund gained its largest relative performance advantage versus the index. Both industry weighting and stock selection decisions within the Financials sector contributed to the relative outperformance. Specifically, as compared to the index, the fund had less exposure to mortgage companies, diversified financials, and regional and large banks. Companies in these industries were among those that were the most negatively impacted by the credit crunch, and they had some of the largest share price declines in the period leading up to early March 2009. In contrast, the fund had relatively more exposure to the insurance industry, a group that generally held up better through the downturn. Among the holdings that contributed to the fund’s positive relative performance were ACE Ltd., Chubb Corp. and Aon Corp. Notably absent from the fund during the period was American International Group (AIG), an Index constituent that was sold by the fund in April 2008, prior to its severe price decline.
6
PORTFOLIO MANAGER COMMENTARY continued
Another bright spot for the fund was in the Consumer Discretionary sector. The fund’s holdings within this sector showed relatively better price resiliency during the period, owing in part, we believe, to their high franchise value and/or their appeal to the “discount” or “value” customer. Fund holdings in this sector included Nike Inc., Home Depot, Inc., McDonalds Corp. and Ross Stores, Inc.
Detractors from performance
When the stock market began its strong rally off of its early March lows, previously out-of-favor, distressed, cyclical companies led the rally. This is because investors began to anticipate an end to the rate of economic decline and the potential for recovery. In the latter part of the period, many of the companies that had experienced significant stock price declines earlier in the period were among the market’s better performers. When the rally kicked off, the fund still had many of the defensive characteristics that had contributed to relative outperformance during the market decline. As noted above, the fund was underweight in its exposure to large banks. In the latter part of the period, the shares of large banks rose sharply, as investors apparently came to see that the fears of bank nationalizations were overblown. Similarly, in the period before the rally, the fund had sold some of the smaller cyclical companies such as Corning Inc. and Applied Materials Inc. in the Information Technology sector, and Celanese Corp. and Owens-Illinois, Inc. in the Materials sector, all of which had detracted from the fund’s performance. In hindsight, these dispositions did not help performance, as the stocks rebounded when the rally in cyclical, more speculative investments took off. Similarly, in December and January the fund sold its holdings in Financials sector companies Goldman Sachs Group (December) and Bank of America Corp. (January); both these stocks rallied strongly in the latter part of the period. Fortunately, the fund had purchased State Street Corp. in December, and it, along with JPMorgan Chase & Co., gave the fund two strong participants in the financial stock rally.
This commentary reflects the views and opinions of the fund’s portfolio manager(s) on the date indicated and may include statements that constitute “forward-looking statements” under the U.S. Securities laws. Forward-looking statements include, among other things, projections, estimates and information about possible or future results related to the fund, markets, or regulatory developments. The views expressed above are not guarantees of future performance or economic results and involve certain risks, uncertainties and assumptions that could cause actual outcomes and results to differ materially from the views expressed herein. The views expressed above are subject to change at any time based upon economic, market, or other conditions and Evergreen undertakes no obligation to update the views expressed herein. Any discussions of specific securities should not be considered a recommendation to buy or sell those securities. The views expressed herein (including any forward-looking statements) may not be relied upon as investment advice or as an indication of the fund’s trading intent.
7
ABOUT YOUR FUND’S EXPENSES
The Example below is intended to describe the fees and expenses borne by shareholders and the impact of those costs on your investment.
Example
As a shareholder of the fund, you incur two types of costs: (1) transaction costs, including sales charges (loads), redemption fees and exchange fees; and (2) ongoing costs, including management fees, distribution (12b-1) fees and other fund expenses. This Example is intended to help you understand your ongoing costs (in dollars) of investing in the fund and to compare these costs with the ongoing costs of investing in other mutual funds. The Example is based on an investment of $1,000 invested at the beginning of the period and held for the entire period from February 1, 2009 to July 31, 2009.
The example illustrates your fund’s costs in two ways:
• Actual expenses
The section in the table under the heading “Actual” provides information about actual account values and actual expenses. You may use the information in these columns, together with the amount you invested, to estimate the expenses that you paid over the period. Simply divide your account value by $1,000 (for example, an $8,600 account value divided by $1,000 = 8.6), then multiply the result by the number in the appropriate column for your share class, in the column entitled “Expenses Paid During Period” to estimate the expenses you paid on your account during this period.
• Hypothetical example for comparison purposes
The section in the table under the heading “Hypothetical (5% return before expenses)” provides information about hypothetical account values and hypothetical expenses based on the fund’s actual expense ratio and an assumed rate of return of 5% per year before expenses, which is not the fund’s actual return. The hypothetical account values and expenses may not be used to estimate the actual ending account balance or expenses you paid for the period. You may use this information to compare the ongoing costs of investing in the fund and other funds. To do so, compare this 5% hypothetical example with the 5% hypothetical examples that appear in the shareholder reports of the other funds.
Please note that the expenses shown in the table are meant to highlight your ongoing costs only and do not reflect any transactional costs, such as sales charges (loads), redemption fees or exchange fees. Therefore, the section in the table under the heading “Hypothetical (5% return before expenses)” is useful in comparing ongoing costs only, and will not help you determine the relative total costs of owning different funds. In addition, if these transactional costs were included, your costs would have been higher.