Security transactions are recorded on trade date. Realized gains and losses are computed using the specific cost of the security sold. Dividend income is recorded on the ex-dividend date.
The Fund intends to continue to qualify as a regulated investment company and distribute all of its taxable income, including any net capital gains (which have already been offset by available capital loss carryovers). Accordingly, no provision for federal taxes is required. The Fund’s income and excise tax returns and all financial records supporting those returns are subject to examination by the federal, Massachusetts and Delaware revenue authorities for all taxable years since the commencement of operations.
Distributions to shareholders from net investment income and net realized gains, if any, are recorded on the ex-dividend date. Such distributions are determined in conformity with income tax regulations, which may differ from generally accepted accounting principles.
Income, common expenses and realized and unrealized gains and losses are allocated to the classes based on the relative net assets of each class. Distribution fees, if any, are calculated daily at the class level based on the appropriate net assets of each class and the specific expense rates applicable to each class.
Evergreen Investment Management Company, LLC (“EIMC”), a subsidiary of Wells Fargo & Company (“Wells Fargo”), is the investment advisor to the Fund and is paid an annual fee starting at 0.80% and declining to 0.70% as average daily net assets increase. For the six months ended January 31, 2010, the advisory fee was equivalent to an annual rate of 0.80% of the Fund’s average daily net assets.
Golden Capital Management, LLC (“Golden Capital”) is the investment sub-advisor to the Fund and is paid by EIMC for its services to the Fund. Wachovia Alternative Strategies, Inc., an affiliate of EIMC and a subsidiary of Wells Fargo, owns an approximately 45% minority interest in Golden Capital.
From time to time, EIMC may voluntarily or contractually waive its fee and/or reimburse expenses in order to limit operating expenses. During the six months ended January 31, 2010, EIMC contractually waived its advisory fee in the amount of $114,754.
The Fund may invest in money market funds which are advised by EIMC. Income earned on these investments is included in income from affiliated issuers on the Statement of Operations.
NOTES TO FINANCIAL STATEMENTS (unaudited) continued
EIMC also serves as the administrator to the Fund providing the Fund with facilities, equipment and personnel. EIMC is paid an annual rate determined by applying percentage rates to the aggregate average daily net assets of the Evergreen funds (excluding money market funds) starting at 0.10% and declining to 0.05% as the aggregate average daily net assets of the Evergreen funds (excluding money market funds) increase. For the six months ended January 31, 2010, the administrative services fee was equivalent to an annual rate of 0.10% of the Fund’s average daily net assets.
Evergreen Service Company, LLC (“ESC”), an affiliate of EIMC and a subsidiary of Wells Fargo, is the transfer and dividend disbursing agent for the Fund. ESC receives account fees that vary based on the type of account held by the shareholders in the Fund. For the six months ended January 31, 2010, the transfer agent fees were equivalent to an annual rate of 0.70% of the Fund’s average daily net assets.
4. DISTRIBUTION PLANS
Wells Fargo Funds Distributor, LLC (“WFFD”), a wholly-owned subsidiary of Wells Fargo serves as distributor of the Fund’s shares. Prior to January 4, 2010, Evergreen Investment Services, Inc. (“EIS”), an affiliate of EIMC and a subsidiary of Wells Fargo, served as distributor of the Fund’s shares. The Fund has adopted Distribution Plans, as allowed by Rule 12b-1 of the 1940 Act, for each class of shares, except Class I. Under the Distribution Plans, the Fund is permitted to pay distribution fees at an annual rate of up to 0.75% of the average daily net assets for Class A shares and up to 1.00% of the average daily net assets for each of Class B and Class C shares. However, currently the distribution fees for Class A shares are limited to 0.25% of the average daily net assets of the class.
For the six months ended January 31, 2010, EIS received $261 from the sale of Class A shares and $13, $2,443 and $62 in contingent deferred sales charges from redemptions of Class A, Class B and Class C shares, respectively.
5. ACQUISITION
Effective at the close of business on September 19, 2008, the Fund acquired the net assets of Evergreen Special Equity Fund in a tax-free exchange for Class A, Class B, Class C, and Class I shares of the Fund. Shares were issued to Class A, Class B, Class C, Class I and Class IS shareholders of Evergreen Special Equity Fund at an exchange ratio of 1.22, 1.14, 1.14, 1.28 and 1.23 for Class A, Class B, Class C, Class I and Class A shares, respectively, of the Fund. The acquired net assets consisted primarily of portfolio securities with unrealized depreciation of $1,641,682. The aggregate net assets of the Fund and Special Equity Fund immediately prior to the acquisition were $4,929,372 and $54,052,596, respectively. The aggregate net assets of the Fund immediately after the acquisition were $58,981,968.
20
NOTES TO FINANCIAL STATEMENTS (unaudited) continued
6. INVESTMENT TRANSACTIONS
Cost of purchases and proceeds from sales of investment securities (excluding short-term securities) were $3,282,789 and $10,246,232, respectively, for the six months ended January 31, 2010.
Fair value measurements of investments are determined within a framework that has established a fair value hierarchy based upon the various data inputs utilized in determining the value of the Fund’s investments. These inputs are summarized into three broad levels as follows:
Level 1 – quoted prices in active markets for identical securities Level 2 – other significant observable inputs (including quoted prices for similar securities, interest rates, prepayment speeds, credit risk, etc.) Level 3 – significant unobservable inputs (including the Fund’s own assumptions in determining the fair value of investments) |
The inputs or methodologies used for valuing securities are not necessarily an indication of the risk associated with investing in those securities.
As of January 31, 2010, the inputs used in valuing the Fund’s assets, which are carried at fair value, were as follows:
Investments in Securities | | Quoted Prices
(Level 1) | | Significant
Other
Observable
Inputs
(Level 2) | | Significant
Unobservable
Inputs
(Level 3) | | Total | |
|
|
|
|
|
|
|
|
| |
Equity securities | | | | | | | | | | | | | |
Common stocks | | $ | 26,074,890 | | $ | 0 | | $ | 0 | | $ | 26,074,890 | |
Short-term investments | | | 323,791 | | | 0 | | | 0 | | | 323,791 | |
|
|
|
|
|
|
|
|
|
|
|
|
| |
| | $ | 26,398,681 | | $ | 0 | | $ | 0 | | $ | 26,398,681 | |
|
|
|
|
|
|
|
|
|
|
|
|
| |
Further details on the major security types listed above can be found in the Schedule of Investments.
On January 31, 2010, the aggregate cost of securities for federal income tax purposes was $26,254,492. The gross unrealized appreciation and depreciation on securities based on tax cost was $2,385,580 and $2,241,391, respectively, with a net unrealized appreciation of $144,189.
As of July 31, 2009, the Fund had $13,638,891 in capital loss carryovers for federal income tax purposes expiring in 2017.
For income tax purposes, capital losses incurred after October 31 within the Fund’s fiscal year are deemed to arise on the first business day of the following fiscal year. As of July 31, 2009, the Fund incurred and elected to defer post-October losses of $13,011,255.
21
NOTES TO FINANCIAL STATEMENTS (unaudited) continued
7. INTERFUND LENDING
Pursuant to an Exemptive Order issued by the SEC, the Fund may participate in an interfund lending program with certain funds in the Evergreen fund family. This program allows the Fund to borrow from, or lend money to, other participating funds. During the six months ended January 31, 2010, the Fund did not participate in the interfund lending program.
8. EXPENSE REDUCTIONS
Through expense offset arrangements with ESC and the Fund’s custodian, a portion of fund expenses has been reduced.
9. DEFERRED TRUSTEES’ FEES
Each Trustee of the Fund may defer any or all compensation related to performance of his or her duties as a Trustee. The Trustees’ deferred balances are allocated to deferral accounts, which are included in the accrued expenses for the Fund. The investment performance of the deferral accounts is based on the investment performance of certain Evergreen funds. Any gains earned or losses incurred in the deferral accounts are reported in the Fund’s Trustees’ fees and expenses. At the election of the Trustees, the deferral account will be paid either in one lump sum or in quarterly installments for up to ten years.
10. FINANCING AGREEMENT
The Fund and certain other Evergreen funds share in a $100 million unsecured revolving credit commitment for temporary and emergency purposes, including the funding of redemptions, as permitted by each participating fund’s borrowing restrictions. Borrowings under this facility bear interest at the higher of the Federal Funds rate plus 1.25% or LIBOR plus 1.25%. All of the participating funds are charged an annual commitment fee of 0.145% on the unused balance, which is allocated pro rata.
During the six months ended January 31, 2010, the Fund had average borrowings outstanding of $42,162 (on an annualized basis) at an average rate of 1.48% and paid interest of $624.
11. REGULATORY MATTERS AND LEGAL PROCEEDINGS
The Evergreen funds, EIMC and certain of EIMC’s affiliates are involved in various legal actions, including private litigation and class action lawsuits, and are and may in the future be subject to regulatory inquiries and investigations.
EIMC and EIS have reached final settlements with the Securities and Exchange Commission (“SEC”) and the Securities Division of the Secretary of the Commonwealth of Massachusetts (“Commonwealth”) primarily relating to the liquidation of Evergreen Ultra Short Opportunities Fund (“Ultra Short Fund”). The claims settled include the following: first, that during the period February 2007 through Ultra Short Fund’s
22
NOTES TO FINANCIAL STATEMENTS (unaudited) continued
liquidation on June 18, 2008, Ultra Short Fund’s former portfolio management team failed to properly take into account readily-available information in valuing certain non-agency residential mortgage-backed securities held by the Ultra Short Fund, resulting in the Ultra Short Fund’s net asset value (“NAV”) being overstated during the period; second, that EIMC and EIS acted inappropriately when, in an effort to explain the decline in Ultra Short Fund’s NAV, certain information regarding the decline was communicated to some, but not all, shareholders and financial intermediaries; third, that the Ultra Short Fund portfolio management team did not adhere to regulatory requirements for affiliated cross trades in executing trades with other Evergreen funds; and finally, that from at least September 2007 to August 2008, EIS did not preserve certain text and instant messages transmitted via personal digital assistant devices. In settling these matters, EIMC and EIS have agreed to payments totaling $41,125,000, up to $40,125,000 of which will be distributed to eligible shareholders of Ultra Short Fund pursuant to a methodology and plan approved by the regulators. EIMC and EIS neither admitted nor denied the regulators’ conclusions.
Three purported class actions have also been filed in the U.S. District Court for the District of Massachusetts relating to the same events; defendants include various Evergreen entities, including EIMC and EIS, and Evergreen Fixed Income Trust and its Trustees. The cases generally allege that investors in the Ultra Short Fund suffered losses as a result of (i) misleading statements in Ultra Short Fund’s registration statement and prospectus, (ii) the failure to accurately price securities in the Ultra Short Fund at different points in time and (iii) the failure of the Ultra Short Fund’s risk disclosures and description of its investment strategy to inform investors adequately of the actual risks of the fund.
EIMC does not expect that any of the legal actions, inquiries or settlement of regulatory matters will have a material adverse impact on the financial position or operations of the Fund to which these financial statements relate. Any publicity surrounding or resulting from any legal actions or regulatory inquiries involving EIMC or its affiliates or any of the Evergreen Funds could result in reduced sales or increased redemptions of Evergreen fund shares, which could increase Evergreen fund transaction costs or operating expenses or have other adverse consequences on the Evergreen funds, including the Fund.
12. NEW ACCOUNTING PRONOUNCEMENT
In January 2010, the Financial Accounting Standards Board (“FASB”) issued an Accounting Standards Update on “Improving Disclosures about Fair Value Measurements” which will require reporting entities to make new disclosures about the amount and reasons for significant transfers into and out of Level 1 and Level 2 fair value measurements, the input and valuation techniques used to measure fair value for both recurring and nonrecurring fair value measurements and information on purchases, sales, issuances, and settlements on a gross basis in the reconciliation of Level 3 fair value measurements.
23
NOTES TO FINANCIAL STATEMENTS (unaudited) continued
Except for the detailed Level 3 roll forward disclosures, the disclosures are effective for annual and interim reporting periods beginning after December 15, 2009. The new disclosures about purchases, sales, issuances, and settlements in the roll forward activity for Level 3 fair value measurements are effective for interim and annual reporting periods beginning after December 15, 2010. Management of the Fund is currently evaluating the implications of this Accounting Standards Update and any impacts on the financial statements.
13. REORGANIZATION
At a meeting of the Board of Trustees held on December 30, 2009, the Trustees of the Fund approved a Plan of Reorganization (the “Plan”). Under the Plan, Wells Fargo Advantage Small Mid Cap Core Fund, which will be a series of Wells Fargo Funds Trust created in order to receive the assets of the Fund upon completion of the reorganization, will acquire the assets and assume the liabilities of the Fund in exchange for shares of Wells Fargo Advantage Small Mid Cap Core Fund.
A special meeting of shareholders of the Fund will be held in June 2010 to consider and vote on the Plan. In April 2010, materials for this meeting will be mailed to shareholders of record on March 10, 2010. If approved by the shareholders at this meeting, the reorganization will take place in July 2010.
24
ADDITIONAL INFORMATION (unaudited)
INFORMATION ABOUT THE REVIEW AND APPROVAL OF THE FUND’S INVESTMENT ADVISORY AGREEMENT
Each year, as required by law, the Fund’s Board of Trustees determines whether to approve the continuation of the Fund’s investment advisory agreements. At an in person meeting on September 23-24, 2009, the Trustees, including a majority of the Trustees who are not “interested persons” (as that term is defined in the 1940 Act) of the Fund, Golden Capital Management, LLC (the “Sub-Advisor”), or EIMC (the “independent Trustees”), approved the continuation of the Fund’s investment advisory agreements. (References below to the “Fund” are to Evergreen Golden Core Opportunities Fund; references to the “funds” are to the Evergreen funds generally.)
At the same time, the Trustees considered the continuation of the investment advisory agreements for all of the Evergreen funds. The description below refers in many cases to the Trustees’ process for considering, and conclusions regarding, all of the funds’ agreements. In all of their deliberations, the Board of Trustees and the independent Trustees were advised by independent counsel to the independent Trustees and counsel to the funds.
The review process. In connection with its review of the funds’ investment advisory agreements, the Board of Trustees requests and evaluates, and EIMC and any sub-advisors are required to furnish, such information as the Trustees consider to be reasonably necessary in the circumstances. Over the course of the year preceding their September 2009 meeting, the Trustees regularly reviewed information regarding the investment performance of all of the funds. As part of their ongoing review of investment performance, the Trustees monitored for changes in performance and for the results of any changes in a fund’s investment process or investment team. The Trustees paid particular attention to funds whose performance since September 2008 (when the Trustees completed their 2008 review of the funds’ investment advisory agreements) indicated short-term or longer-term performance issues and to funds that they had identified during their 2008 review process as having short- or longer-term performance issues.
In spring 2009, a committee of the Board of Trustees (the “Committee”), working with EIMC management, determined generally the types of information the Trustees would review as part of the 2009 review process and set a timeline detailing the information required and the dates for its delivery to the Trustees. The Board engaged the independent data provider Keil Fiduciary Strategies LLC (“Keil”) to provide fund-specific and industry-wide data containing information of a nature and in a format generally prescribed by the Committee, and the Committee worked with Keil and EIMC to develop appropriate groups of peer funds for each fund. The Committee also identified a number of expense, performance, and other areas of review and requested specific information as to those areas of review.
The Trustees formed small groups to review individual funds in greater detail. They reviewed, with the assistance of an independent industry consultant that they retained, the
25
ADDITIONAL INFORMATION (unaudited) continued
information that EIMC, the Sub-Advisor, and Keil provided. In addition, the Trustees considered information regarding, among other things, the funds’ brokerage practices, the funds’ use of derivatives, analyst and research support available to the portfolio management teams, risk management practices, and certain fall-out benefits received directly and indirectly by EIMC and its affiliates from the funds. The Trustees requested and received additional information following that review.
In December 2008 Wells Fargo & Company (“Wells Fargo”) acquired Wachovia Corporation (“Wachovia”), EIMC’s parent company. Wells Fargo and EIMC have taken steps to combine the operations of Wells Fargo’s investment management affiliates and EIMC during the past year and have proposed to the Trustees the combination of the mutual fund families managed by them. During the course of the year, and during their review, the Trustees requested and received information about Wells Fargo and its advisory and broker-dealer operations, the status of efforts to combine the Wells Fargo and Evergreen investment management operations, and the effects on the funds and on the services provided by EIMC and its affiliates to the funds. In their deliberations, the Trustees were mindful that it was possible that the proposed combination of the two fund families might be effected during the coming 12-month period.
The Committee met several times by telephone during the 2009 review process to consider the information provided to it. The Committee then met with representatives of EIMC and its affiliates, including Wells Fargo. In addition, during the course of their review, the Trustees discussed the continuation of the funds’ advisory agreements with representatives of EIMC, and in meetings with independent legal counsel in multiple private sessions at which no personnel of EIMC were present. At a meeting of the full Board of Trustees held on September 23-24, 2009, the Committee reported the results of its discussions with EIMC. The full Board met with representatives of EIMC and its affiliates and engaged in further review of the materials provided to it, after which the independent Trustees and the full Board approved the continuation of each of the advisory and sub-advisory agreements.
The Trustees’ determination to approve the continuation of the advisory and sub-advisory agreements was based on a comprehensive evaluation of all of the information provided to them. In considering the continuation of the agreements, the Trustees did not identify any particular information or consideration that was all-important or controlling, and each Trustee attributed different weights to various factors. The Trustees evaluated information provided to them both in terms of the funds generally and with respect to each fund, including the Fund, specifically as they considered appropriate. Although the Trustees considered the continuation of the agreements for each of the funds as part of the larger process of considering the continuation of the advisory contracts for all of the funds, their determination to continue the advisory agreements for each of the funds was ultimately made on a fund-by-fund basis.
26
ADDITIONAL INFORMATION (unaudited) continued
This summary describes a number of the most important, but not necessarily all, of the factors considered by the Board and the independent Trustees.
Information reviewed. The Board of Trustees and committees of the Board of Trustees met periodically during the course of the year. EIMC presented a wide variety of information at those meetings regarding the services it provides for the funds, the investment performance of the funds, and other aspects of the business and operations of the funds. At those meetings, and in the process of considering the continuation of the agreements, the Trustees considered information regarding, for example, the funds’ investment results; the portfolio management teams for the funds and the experience of the members of the teams, and any recent changes in the membership of the teams; portfolio trading practices; compliance by the funds, EIMC, and the Sub-Advisor with applicable laws and regulations and with the funds’ and EIMC’s compliance policies and procedures; risk evaluation and oversight procedures at EIMC; services provided by affiliates of EIMC to the funds and shareholders of the funds; and other information relating to the nature, extent, and quality of services provided by EIMC and the Sub-Advisor. The Trustees considered a number of changes in portfolio management personnel at EIMC and its advisory affiliates in the year since September 2008. The Trustees also considered changes in personnel at the funds and EIMC, including the appointment of a new President of the funds, who also serves as President and Chief Operating Officer of EIMC, and a new Chief Investment Officer of EIMC in August of 2008.
The Trustees considered the rates at which the funds pay investment advisory fees, and the efforts generally by EIMC and its affiliates as sponsors of the funds. The data provided by Keil showed the management fees paid by each fund in comparison to the management fees of other peer mutual funds, in addition to data regarding the investment performance of the funds in comparison to other peer mutual funds. The Trustees were assisted by an independent industry consultant in reviewing the information presented to them.
The Trustees noted that, in certain cases, EIMC and/or its affiliates provide advisory services to other clients that are comparable to the advisory services they provide to certain funds. The Trustees considered the information EIMC provided regarding the rates at which those other clients pay advisory fees to EIMC. Fees charged to those other clients were generally lower than those charged to the respective funds. In respect of these other accounts, EIMC noted that the compliance, reporting, and other legal burdens of providing investment advice to mutual funds generally exceed those required to provide advisory services to non-mutual fund clients such as retirement or pension plans.
The Trustees considered the transfer agency fees paid by the funds to an affiliate of EIMC. They reviewed information presented to them showing that the transfer agency fees charged to the funds were generally consistent with industry norms.
27
ADDITIONAL INFORMATION (unaudited) continued
The Trustees also considered that EIMC serves as administrator to the funds and receives a fee for its services as administrator. In their comparison of fees paid by the funds with those paid by other mutual funds, the Trustees considered administrative fees paid by the funds and those other mutual funds. They considered that EIS, an affiliate of EIMC, would serve as distributor to the funds until January 3, 2010, and that Wells Fargo Funds Distributor, LLC, also an affiliate of EIMC, would serve as distributor to the funds beginning on January 4, 2010, and noted that the distributor receives fees from the funds for those services. The Trustees also considered other so-called “fall-out” benefits to EIMC and its affiliates due to their other relationships with the funds, including, for example, soft-dollar services received by EIMC attributable to transactions entered into by EIMC on behalf of the funds and brokerage commissions received by Wells Fargo Advisors, LLC (“Wells Fargo Advisors”) (formerly Wachovia Securities, LLC), an affiliate of EIMC, from transactions effected by it for the funds. The Trustees noted that the funds pay sub-transfer agency fees to various financial institutions, including Wells Fargo Advisors and its affiliates, that hold fund shares in omnibus accounts, and that an affiliate of EIMC receives fees for administering the sub-transfer agency payment program. In reviewing the services provided by an affiliate of EIMC, the Trustees noted that the affiliate of EIMC that provides transfer agency services to the funds had won recognition from Dalbar for customer service each year since 1998, and also won recognition from National Quality Review for customer service and for accuracy in processing transactions in 2008. They also considered that Wells Fargo Advisors and its affiliates receive distribution-related fees and shareholder servicing payments (inclu ding amounts derived from payments under the funds’ Rule 12b-1 plans) in respect of shares sold or held through them and that an affiliate of EIMC receives compensation for serving as a securities lending agent for a number of the funds.
The Trustees considered regulatory actions taken against EIMC or its affiliates in the past year, and on-going reviews of the operations of EIMC and its affiliates as they might affect the funds. They considered the findings of the regulators, the cooperation of EIMC and its affiliates with those regulators and with the Trustees in respect of those actions and reviews, and the remedial steps EIMC and its affiliates have taken in response. They also considered the scope and nature of on-going reviews being conducted by EIMC and its affiliates, and communications to the Trustees relating to those reviews.
Nature and quality of the services provided. The Trustees considered that EIMC and its affiliates generally provide a comprehensive investment management service to the funds. They noted that EIMC and the Sub-Advisor formulate and implement an investment program for the Fund. They noted that EIMC makes its personnel available to serve as officers of the funds, and concluded that the reporting and management functions provided by EIMC with respect to the funds were generally satisfactory. The Trustees considered the investment philosophy of the Fund’s portfolio management team and the in-house research capabilities of EIMC and its affiliates, as well as other resources available to EIMC, including research services available to it from third parties.
28
ADDITIONAL INFORMATION (unaudited) continued
The Trustees considered the managerial and financial resources available to EIMC and its affiliates and the commitment that the Evergreen/Wells Fargo organization has made to the funds generally. They considered assurances from representatives of Wells Fargo that the merger of Wells Fargo and Wachovia and the integration of those firms’ advisory and broker-dealer operations was not expected to result in any adverse effect on the funds, on the quality and level of services that EIMC provides to the funds, or on the resources available to the funds and to EIMC, and that Wells Fargo is committed to continue providing the funds with high-quality services.
The Trustees noted the resources EIMC and its affiliates have committed to the regulatory, compliance, accounting, tax and oversight of tax reporting, and shareholder servicing functions, and the number and quality of staff committed to those functions, which they concluded were appropriate and generally in line with EIMC’s responsibilities to the Fund and to the funds generally. The Board and the independent Trustees concluded, within the context of their overall conclusions regarding the funds’ advisory agreements, that they were generally satisfied with the nature, extent, and quality of the services provided by the Sub-Advisor and EIMC, including services provided by EIMC under its administrative services agreements with the funds. They determined that the nature and scope of the services provided by EIMC and the Sub-Advisor were consistent with EIMC’s and the Sub-Advisor’s respective duties under the investment advisory agreements and appropriate and consistent with the investment programs and best interests of the funds.
Investment performance. The Trustees considered the investment performance of each fund, both by comparison to other comparable mutual funds and to broad market indices. Although the Trustees considered the performance of all share classes, the Trustees noted that, for the one-year period ended December 31, 2008, the Fund’s Class A shares had underperformed the Fund’s benchmark index, the Russell 2500 Index, and had performed in the fifth quintile of the mutual funds against which the Trustees compared the Fund’s performance. The Trustees noted that the Fund had recently commenced operations and had a relatively short track record of performance that limited their ability to draw meaningful conclusions about the Fund’s performance.
The Trustees discussed each fund’s performance with representatives of EIMC. In each instance where a fund experienced a substantial period of underperformance relative to its benchmark index and/or the non-Evergreen fund peers against which the Trustees compared the fund’s performance, the Trustees considered EIMC’s explanation of the reasons for the relative underperformance and the steps being taken to address the relative underperformance. The Trustees emphasized that the continuation of the investment advisory agreement for a fund should not be taken as any indication that the Trustees did not believe investment performance for any specific fund might not be improved, and they noted that they would continue to monitor closely the investment performance of the funds going forward.
29
ADDITIONAL INFORMATION (unaudited) continued
Advisory and administrative fees. The Trustees recognized that EIMC does not seek to provide the lowest cost investment advisory service, but to provide a high quality, full-service investment management product at a reasonable price. They also noted that EIMC has in many cases sought to set its investment advisory fees at levels consistent with industry norms. The Trustees noted that, in certain cases, a fund’s management fees were higher than many or most other mutual funds in the same Keil peer group. However, in each case, the Trustees determined on the basis of the information presented that the level of management fees was not excessive. The Trustees noted that the management fee paid by the Fund was lower than the management fees paid by the other mutual funds against which the Trustees compared the Fund’s management fee due in large part to a fee waiver by EIMC, and that the level of profitability realized by EIMC in respect of the fee did not appear excessive. The Trustees also considered the management fee the Fund would have paid absent the fee waiver.
Economies of scale. The Trustees noted the possibility that economies of scale would be achieved by EIMC in managing the funds as the funds grow. They reviewed the breakpoints in the Fund’s advisory fee structure, which operate generally to reduce the effective management fee rate of the Fund (as a percentage of Fund assets) as the Fund grows in size. They considered that, as a fund shrinks in size, breakpoints result in increasing fee levels. The Trustees noted that they would continue to review the appropriate levels of breakpoints in the future, and concluded that the breakpoints as implemented appeared to be a reasonable step toward the realization of economies of scale by the Fund.
Profitability. The Trustees considered information provided to them regarding the profitability to the EIMC organization of the investment advisory, administration, and transfer agency (with respect to the open-end funds only) fees paid to EIMC and its affiliates by each of the funds. They considered that the information provided to them was necessarily estimated, and that the profitability information provided to them, especially on a fund-by-fund basis, did not necessarily provide a definitive tool for evaluating the appropriateness of each fund’s advisory fee. They noted that the levels of profitability of the funds to EIMC varied widely, depending on, among other things, the size and type of fund. They considered the profitability of the funds in light of such factors as, for example, the information they had received regarding the relation of the fees paid by the funds to those paid by other mutual funds, the investment performance of the funds, and the amount of revenues involved. In light of these factors, the Trustees concluded that the profitability to EIMC of the services provided to any of the funds, individually or in the aggregate, should not prevent the Trustees from approving the continuation of the agreements.
30
This page left intentionally blank
31
TRUSTEES AND OFFICERS
TRUSTEES1 | |
K. Dun Gifford
Trustee
DOB: 10/23/1938
Term of office since: 1974
Other directorships: None | Chairman and President, Oldways Preservation and Exchange Trust (education); Trustee, Member of the Executive Committee, Former Chairman of the Finance Committee, and Former Treasurer, Cambridge College |
|
|
Dr. Leroy Keith, Jr.
Trustee
DOB: 2/14/1939
Term of office since: 1983
Other directorships: Trustee,
Phoenix Fund Complex
(consisting of 46 portfolios
as of 12/31/2009) | Chairman, Bloc Global Services (development and construction); Former Managing Director, Almanac Capital Management (commodities firm); Trustee, Phoenix Fund Complex; Director, Diversapack Co. (packaging company); Former Partner, Stonington Partners, Inc. (private equity fund); Former Director, Obagi Medical Products Co. |
|
|
Carol A. Kosel
Trustee
DOB: 12/25/1963
Term of office since: 2008
Other directorships: None | Former Consultant to the Evergreen Boards of Trustees; Former Vice President and Senior Vice President, Evergreen Investments, Inc.; Former Treasurer, Evergreen Funds; Former Treasurer, Vestaur Securities Fund |
|
|
Gerald M. McDonnell
Trustee
DOB: 7/14/1939
Term of office since: 1988
Other directorships: None | Consultant, Rock Hill Metals Consultants LLC (Metals Consultant to steel industry); Former Manager of Commercial Operations, CMC Steel (steel producer) |
|
|
Patricia B. Norris
Trustee
DOB: 4/9/1948
Term of office since: 2006
Other directorships: None | President and Director of Buckleys of Kezar Lake, Inc. (real estate company); Former President and Director of Phillips Pond Homes Association (home community); Former Partner, PricewaterhouseCoopers, LLP (independent registered public accounting firm) |
|
|
William Walt Pettit2
Trustee
DOB: 8/26/1955
Term of office since: 1988
Other directorships: None | Director, Rogers, Townsend & Thomas, PC (law firm); Director, Superior Packaging Corp. (packaging company); Member, Superior Land, LLC (real estate holding company), Member, K&P Development, LLC (real estate development); Former Vice President, Kellam & Pettit, P.A. (law firm); Former Director, National Kidney Foundation of North Carolina, Inc. (non-profit organization) |
|
|
David M. Richardson
Trustee
DOB: 9/19/1941
Term of office since: 1982
Other directorships: None | President, Richardson, Runden LLC (executive recruitment advisory services); Director, J&M Cumming Paper Co. (paper merchandising); Former Trustee, NDI Technologies, LLP (communications); Former Consultant, AESC (The Association of Executive Search Consultants) |
|
|
Russell A. Salton III, MD
Trustee
DOB: 6/2/1947
Term of office since: 1984
Other directorships: None | President/CEO, AccessOne MedCard, Inc. |
|
|
Michael S. Scofield
Trustee
DOB: 2/20/1943
Term of office since: 1984
Other directorships: None | Retired Attorney, Law Offices of Michael S. Scofield; Former Director and Chairman, Branded Media Corporation (multi-media branding company) |
|
|
32
TRUSTEES AND OFFICERS continued
Richard J. Shima
Trustee
DOB: 8/11/1939
Term of office since: 1993
Other directorships: None | Independent Consultant; Director, Hartford Hospital; Trustee, Greater Hartford YMCA; Former Director, Trust Company of CT; Former Trustee, Saint Joseph College (CT) |
|
|
Richard K. Wagoner, CFA3
Trustee
DOB: 12/12/1937
Term of office since: 1999
Other directorships: None | Member and Former President, North Carolina Securities Traders Association; Member, Financial Analysts Society |
|
|
OFFICERS | |
W. Douglas Munn4
President
DOB: 4/21/1963
Term of office since: 2009 | Principal occupations: President and Chief Executive Officer, Evergreen Investment Company, Inc.; Chief Operating Officer, Wells Fargo Funds Management, LLC; Former Chief Operating Officer, Evergreen Investment Company, Inc. |
|
|
Jeremy DePalma4
Treasurer
DOB: 2/5/1974
Term of office since: 2005 | Principal occupations: Senior Vice President, Evergreen Investment Management Company, LLC; Assistant Treasurer, Wells Fargo Advantage Funds; Former Vice President, Evergreen Investment Services, Inc.; Former Assistant Vice President, Evergreen Investment Services, Inc. |
|
|
Michael H. Koonce4
Secretary
DOB: 4/20/1960
Term of office since: 2000 | Principal occupations: Managing Counsel, Wells Fargo & Company; Secretary and Senior Vice President, Alternative Strategies Brokerage Services, Inc.; Evergreen Investment Services, Inc.; Secretary and Senior Vice President, Evergreen Investment Management Company, LLC and Evergreen Service Company, LLC |
|
|
Robert Guerin4
Chief Compliance Officer
DOB: 9/20/1965
Term of office since: 2007 | Principal occupations: Chief Compliance Officer, Evergreen Funds and Senior Vice President of Evergreen Investment Company, Inc.; Compliance Manager, Wells Fargo Funds Management Group; Former Managing Director and Senior Compliance Officer, Babson Capital Management LLC; Former Principal and Director, Compliance and Risk Management, State Street Global Advisors; Former Vice President and Manager, Sales Practice Compliance, Deutsche Asset Management |
|
|
1 | Each Trustee serves until a successor is duly elected or qualified or until his or her death, resignation, retirement or removal from office. Each Trustee oversaw 74 Evergreen funds as of December 31, 2009. Correspondence for each Trustee may be sent to Evergreen Board of Trustees, P.O. Box 20083, Charlotte, NC 28202. |
2 | It is possible that Mr. Pettit may be viewed as an “interested person” of the Evergreen funds, as defined in the 1940 Act, because of his law firm’s previous representation of affiliates of Wells Fargo & Company (“Wells Fargo”), the parent to the Evergreen funds’ investment advisor, EIMC. The Trustees are treating Mr. Pettit as an interested trustee for the time being. |
3 | Mr. Wagoner is an “interested person” of the Evergreen funds because of his ownership of shares in Wells Fargo & Company, the parent to the Evergreen funds’ investment advisor. |
4 | The address of the Officer is 200 Berkeley Street, Boston, MA 02116. |
Additional information about the Fund’s Board of Trustees and Officers can be found in the Statement of Additional Information (SAI) and is available upon request without charge by calling 800.343.2898.
33
120965 581816 rv2 03/2010
Evergreen Golden Large Cap Core Fund

| | table of contents |
1 | | LETTER TO SHAREHOLDERS |
4 | | FUND AT A GLANCE |
6 | | ABOUT YOUR FUND’S EXPENSES |
7 | | FINANCIAL HIGHLIGHTS |
11 | | SCHEDULE OF INVESTMENTS |
15 | | STATEMENT OF ASSETS AND LIABILITIES |
16 | | STATEMENT OF OPERATIONS |
17 | | STATEMENTS OF CHANGES IN NET ASSETS |
18 | | NOTES TO FINANCIAL STATEMENTS |
24 | | ADDITIONAL INFORMATION |
32 | | TRUSTEES AND OFFICERS |
This semiannual report must be preceded or accompanied by a prospectus of the Evergreen fund contained herein. The prospectus contains more complete information, including fees and expenses, and should be read carefully before investing or sending money.
The fund will file its complete schedule of portfolio holdings with the SEC for the first and third quarters of each fiscal year on Form N-Q. The fund’s Form N-Q will be available on the SEC’s Web site at http://www.sec.gov. In addition, the fund’s Form N-Q may be reviewed and copied at the SEC’s Public Reference Room in Washington, D.C. Information on the operation of the Public Reference Room may be obtained by calling 800.SEC.0330.
A description of the fund’s proxy voting policies and procedures, as well as information regarding how the fund voted proxies relating to portfolio securities during the most recent 12-month period ended June 30, is available by visiting our Web site at EvergreenInvestments.com or by visiting the SEC’s Web site at http://www.sec.gov. The fund’s proxy voting policies and procedures are also available without charge, upon request, by calling 800.343.2898.
Mutual Funds:
| NOT FDIC INSURED | MAY LOSE VALUE | NOT BANK GUARANTEED |
Evergreen InvestmentsSM is a service mark of Evergreen Investment Management Company, LLC. Copyright 2010, Evergreen Investment Management Company, LLC.
Evergreen Investment Management Company, LLC, is a subsidiary of Wells Fargo & Company and is an affiliate of Wells Fargo & Company’s broker/dealer subsidiaries. Evergreen mutual funds are distributed by Wells Fargo Funds Distributor, LLC, Member FINRA/SIPC, an affiliate of Wells Fargo & Company.
LETTER TO SHAREHOLDERS
March 2010

W. Douglas Munn
President and Chief Executive Officer
Dear Shareholder:
We are pleased to provide the Semiannual Report for Evergreen Golden Large Cap Core Fund for the six-month period ended January 31, 2010 (the “period”).
The period brought welcome signs of economic improvement, supporting a strong rally in the financial markets after a streak of six consecutive quarterly declines. Gross domestic product (“GDP”) growth was 2.2% for the third quarter of 2009 and 5.7% for the fourth quarter, the strongest since 2003. The consensus among economists was that the recession that began in December 2007 had likely ended during the summer of 2009. However, with much of the growth attributable to government stimulus, questions remained over the sustainability of the recovery. By the end of the period, the National Bureau of Economic Research had not declared an official end to the recession.
The unemployment rate rose but appeared to plateau during the period. Unemployment climbed to 10.1% in October 2009—its highest level in more than 25 years—before edging down to close the period at 9.7%. The pace of job losses had slowed as the period came to a close. The Labor Department reported that 20,000 jobs were lost in January 2010, a significant improvement from the monthly job losses of approximately 700,000 at the height of the recession. Other encouraging news in January included increases in temporary jobs, average hours worked, hourly earnings, and manufacturing employment. Still, since the start of the recession, more than 8 million jobs had been lost by the end of the period.
Other economic statistics also began to show signs of improvement. Industrial production, manufacturing, and consumer sentiment had all improved as the period ended. Retail sales improved in the latter months of the period, helped in part by the “cash-for-clunkers” program that temporarily boosted auto sales. Home sales and prices also stabilized and began to show signs of improvement in many areas of the country, spurred in part by the government’s $8,000 tax credit for first-time home buyers.
Despite extensive quantitative easing measures by the Federal Reserve Board (the “Fed”), bank lending did not expand during the period. This indicates that the trillions of dollars of government stimulus that were added to the monetary system might not have an inflationary impact in the near term. During the period, however, debate began to escalate over the need for the Fed to outline an “exit strategy” from its stimulus programs. Despite that debate, the Federal Open Market Committee (the “FOMC”) held the federal funds rate at the range of 0% to 0.25% that it first targeted in
1
LETTER TO SHAREHOLDERS continued
December 2008. The Fed concluded its purchases of longer-term Treasuries in October 2009 but continued to buy mortgage-backed securities, with that program slated to end in March 2010. In its final statement during the period, the FOMC noted the signs of economic improvement but reiterated that it was likely to keep the federal funds rate at exceptionally low levels for an extended period because of the continued substantial economic slack.
After a significant rally in the spring and early summer of 2009, stocks continued to advance throughout most of the period before staging a moderate pullback in the final weeks of January 2010. The markets saw slight corrections during October 2009 and January 2010 as volatility returned due to questions about the sustainability of the economic improvement. The broad market, as represented by the S&P 500 Index, rose more than 26% for all of 2009, with a gain of nearly 65% from the March 9th low through year-end.
During the period, the Golden Fund management teams pursued strategies based on each Fund’s objective. Evergreen Golden Large Cap Core Fund sought undervalued large cap companies likely to meet or exceed earnings expectations. Evergreen Golden Mid Cap Core Fund sought undervalued, mid-cap companies similar to those found in the Russell Midcap Index. Evergreen Golden Core Opportunities Fund sought undervalued stocks of small to mid cap companies similar to those found in the Russell 2500 Index.
We believe that the significant recovery during the period, following an extended period of weakness, underscores the importance of maintaining a disciplined, long-term investment strategy. Although periods of volatility can be challenging for investors, staying focused on a long-term strategy based on individual goals and risk tolerance can help avoid missing potential periods of strong recovery.
Please visit us at EvergreenInvestments.com for more information about our funds and other investment products available to you. Thank you for your continued support of Evergreen Investments.
Sincerely,

W. Douglas Munn
President and Chief Executive Officer
Evergreen Funds
2
LETTER TO SHAREHOLDERS continued
Notice to Shareholders:
The Evergreen Funds’ Board of Trustees has unanimously approved the reorganizations of the Evergreen Funds, including the Fund in this report, into Wells Fargo Advantage Funds®. Each reorganization is subject to the satisfaction of a number of conditions, including approval by the Evergreen Fund’s shareholders at a meeting expected to be held in June 2010. It is anticipated that the reorganizations, if they are approved by shareholders and all conditions to the closing are satisfied, will occur in July 2010. Additional information, including a description of the applicable reorganization and information about fees, expenses, and risk factors, will be provided to shareholders of each Evergreen Fund in a Prospectus/Proxy Statement that is expected to be mailed in April, 2010.
The foregoing is not an offer to sell, nor is it a solicitation of an offer to buy, shares of any Wells Fargo Advantage Fund, nor is it a solicitation of any proxy. For more information, or to receive a free copy of the Prospectus/Proxy Statement once a registration statement relating to a proposed reorganization has been filed with the Securities and Exchange Commission and becomes effective, please call 1.800.343.2898 or visit Evergreeninvestments.com. The Prospectus/Proxy Statement will also be available for free on the Securities and Exchange Commission’s website (www.sec.gov). Please read the Prospectus/Proxy Statement carefully before making any investment decisions.
3
FUND AT A GLANCE
as of January 31, 2010
MANAGEMENT TEAM
Investment Advisor:
Evergreen Investment Management Company, LLC
Sub-Advisor:
Golden Capital Management, LLC
Portfolio Manager:
Jeff C. Moser, CFA
CURRENT INVESTMENT STYLE

Source: Morningstar, Inc.
Morningstar’s style box is based on a portfolio date as of 12/31/2009.
The Equity style box placement is based on 10 growth and valuation measures for each fund holding and the median size of the companies in which the fund invests.
PERFORMANCE AND RETURNS
Portfolio inception date: 12/17/2007
| Class A | Class B | Class C | Class I |
Class inception date | 12/17/2007 | 12/17/2007 | 12/17/2007 | 12/17/2007 |
|
|
|
|
|
Nasdaq symbol | EGOAX | EGOBX | EGOCX | EGOIX |
|
|
|
|
|
6-month return with sales charge | 0.64% | 1.30% | 5.25% | N/A |
|
|
|
|
|
6-month return w/o sales charge | 6.72% | 6.30% | 6.25% | 6.79% |
|
|
|
|
|
Average annual return* | | | | |
|
|
|
|
|
1-year with sales charge | 15.51% | 16.48% | 20.68% | N/A |
|
|
|
|
|
1-year w/o sales charge | 22.56% | 21.48% | 21.68% | 22.83% |
|
|
|
|
|
Since portfolio inception | -15.03% | -14.43% | -13.18% | -12.42% |
|
|
|
|
|
Maximum sales charge | 5.75% | 5.00% | 1.00% | N/A |
| Front-end | CDSC | CDSC | |
|
|
|
|
|
* | Adjusted for maximum applicable sales charge, unless noted. |
Past performance is no guarantee of future results. The performance quoted represents past performance and current performance may be lower or higher. The investment return and principal value of an investment will fluctuate so that investors’ shares, when redeemed, may be worth more or less than their original cost. To obtain performance information current to the most recent month-end for Classes A, B, C or I, please go to EvergreenInvestments.com/fundperformance. The performance of each class may vary based on differences in loads, fees and expenses paid by the shareholders investing in each class. Performance includes the reinvestment of income dividends and capital gain distributions. Performance shown does not reflect the deduction of taxes that a shareholder would pay on fund distributions or the redemption of fund shares.
The fund incurs a 12b-1 fee of 0.25% for Class A and 1.00% for Classes B and C. Class I does not pay a 12b-1 fee.
Class B shares are closed to new investments by new and existing shareholders.
The advisor is waiving its advisory fee and reimbursing the fund for a portion of other expenses. Had the fee not been waived and expenses not reimbursed, returns would have been lower.
4
FUND AT A GLANCE continued
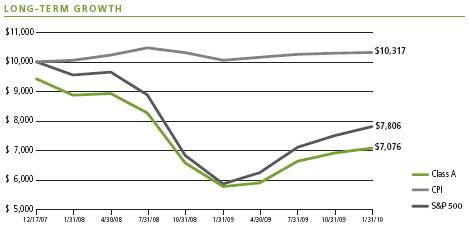
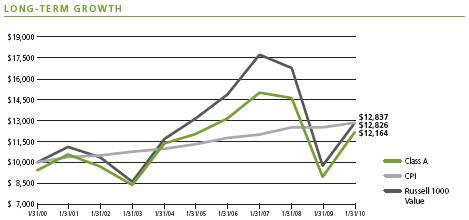
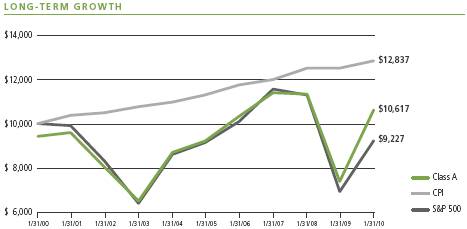
Comparison of a $10,000 investment in the Evergreen Golden Large Cap Core Fund Class A shares versus a similar investment in the S&P 500 Index (S&P 500) and the Consumer Price Index (CPI).
The S&P 500 is an unmanaged market index and does not include transaction costs associated with buying and selling securities, any mutual fund fees or expenses or any taxes. The CPI is a commonly used measure of inflation and does not represent an investment return. It is not possible to invest directly in an index.
Class I shares are only offered, subject to the minimum initial purchase requirements, in the following manner: (1) to investment advisory clients of EIMC (or its advisory affiliates), (2) to employer- or state-sponsored benefit plans, including but not limited to, retirement plans, defined benefit plans, deferred compensation plans, or savings plans, (3) to fee-based mutual fund wrap accounts, (4) through arrangements entered into on behalf of the Evergreen funds with certain financial services firms, (5) to certain institutional investors, and (6) to persons who owned Class Y shares in registered name in an Evergreen fund on or before December 31, 1994 or who owned shares of any SouthTrust fund in registered name as of March 18, 2005 or who owned shares of Vestaur Securities Fund as of May 20, 2005.
Class I shares are only available to institutional shareholders with a minimum of $1 million investment, which may be waived in certain situations.
The fund’s investment objective may be changed without a vote of the fund’s shareholders.
Since the fund tends to invest in a smaller number of stocks than many similar mutual funds, changes in the value of individual stocks may have a larger impact on its net asset value than such fluctuations would if the fund were more broadly invested.
Small and mid cap securities may be subject to special risks associated with narrower product lines and limited financial resources compared to their large cap counterparts, and, as a result, small and mid cap securities may decline significantly in market downturns and may be more volatile than those of larger companies due to the higher risk of failure.
The market value of convertible securities tends to decline as interest rates increase and may be affected by changes in the price of the underlying security.
All data is as of January 31, 2010, and subject to change.
5
ABOUT YOUR FUND’S EXPENSES
The Example below is intended to describe the fees and expenses borne by shareholders and the impact of those costs on your investment.
Example
As a shareholder of the fund, you incur two types of costs: (1) transaction costs, including sales charges (loads), redemption fees and exchange fees; and (2) ongoing costs, including management fees, distribution (12b-1) fees and other fund expenses. This Example is intended to help you understand your ongoing costs (in dollars) of investing in the fund and to compare these costs with the ongoing costs of investing in other mutual funds. The Example is based on an investment of $1,000 invested at the beginning of the period and held for the entire period from August 1, 2009 to January 31, 2010.
The example illustrates your fund’s costs in two ways:
• Actual expenses
The section in the table under the heading “Actual” provides information about actual account values and actual expenses. You may use the information in these columns, together with the amount you invested, to estimate the expenses that you paid over the period. Simply divide your account value by $1,000 (for example, an $8,600 account value divided by $1,000 = 8.6), then multiply the result by the number in the appropriate column for your share class, in the column entitled “Expenses Paid During Period” to estimate the expenses you paid on your account during this period.
• Hypothetical example for comparison purposes
The section in the table under the heading “Hypothetical (5% return before expenses)” provides information about hypothetical account values and hypothetical expenses based on the fund’s actual expense ratio and an assumed rate of return of 5% per year before expenses, which is not the fund’s actual return. The hypothetical account values and expenses may not be used to estimate the actual ending account balance or expenses you paid for the period. You may use this information to compare the ongoing costs of investing in the fund and other funds. To do so, compare this 5% hypothetical example with the 5% hypothetical examples that appear in the shareholder reports of the other funds.
Please note that the expenses shown in the table are meant to highlight your ongoing costs only and do not reflect any transactional costs, such as sales charges (loads), redemption fees or exchange fees. Therefore, the section in the table under the heading “Hypothetical (5% return before expenses)” is useful in comparing ongoing costs only, and will not help you determine the relative total costs of owning different funds. In addition, if these transactional costs were included, your costs would have been higher.
| Beginning
Account Value
8/1/2009 | Ending
Account Value
1/31/2010 | Expenses Paid
During Period* |
|
|
|
|
Actual | | | |
Class A | $1,000.00 | $1,067.16 | $5.99 |
Class B | $1,000.00 | $1,062.98 | $9.88 |
Class C | $1,000.00 | $1,062.49 | $9.88 |
Class I | $1,000.00 | $1,067.90 | $4.69 |
Hypothetical | | | |
(5% return before expenses) | | | |
Class A | $1,000.00 | $1,019.41 | $5.85 |
Class B | $1,000.00 | $1,015.63 | $9.65 |
Class C | $1,000.00 | $1,015.63 | $9.65 |
Class I | $1,000.00 | $1,020.67 | $4.58 |
|
|
|
|
* | For each class of the fund, expenses are equal to the annualized expense ratio of each class (1.15% for Class A, 1.90% for Class B, 1.90% for Class C and 0.90% for Class I), multiplied by the average account value over the period, multiplied by 184 / 365 days. |
6
FINANCIAL HIGHLIGHTS
(For a share outstanding throughout each period)