The Fund may lend its securities to certain qualified brokers in order to earn additional income. The Fund receives compensation in the form of fees or interest earned on the investment of any cash collateral received. The Fund also continues to receive interest and dividends on the securities loaned. The Fund receives collateral in the form of cash or securities with a market value at least equal to the market value of the securities on loan. In the event of default or bankruptcy by the borrower, the Fund could experience delays and costs in recovering the loaned securities or in gaining access to the collateral. In addition, the investment of any cash collateral received may lose all or part of its value. The Fund has the right under the lending agreement to recover the securities from the borrower on demand.
Security transactions are recorded on trade date. Realized gains and losses are computed using the specific cost of the security sold. Dividend income is recorded on the ex-dividend date.
The Fund intends to continue to qualify as a regulated investment company and distribute all of its taxable income, including any net capital gains (which have already been offset by available capital loss carryovers). Accordingly, no provision for federal taxes is required. The Fund’s income and excise tax returns and all financial records supporting those returns for the prior three fiscal years are subject to examination by the federal, Massachusetts and Delaware revenue authorities.
Distributions to shareholders from net investment income and net realized gains, if any, are recorded on the ex-dividend date. Such distributions are determined in conformity with income tax regulations, which may differ from generally accepted accounting principles.
Income, common expenses and realized and unrealized gains and losses are allocated to the classes based on the relative net assets of each class. Distribution fees, if any, are calculated daily at the class level based on the appropriate net assets of each class and the specific expense rates applicable to each class.
Evergreen Investment Management Company, LLC (“EIMC”), a subsidiary of Wells Fargo & Company (“Wells Fargo”), is the investment advisor to the Fund and is paid an annual fee starting at 0.51% and declining to 0.26% as average daily net assets increase. For the six months ended March 31, 2010, the advisory fee was equivalent to an annual rate of 0.51% of the Fund’s average daily net assets.
NOTES TO FINANCIAL STATEMENTS (unaudited) continued
The Fund may invest in money market funds which are advised by EIMC. Income earned on these investments is included in income from affiliated issuers on the Statement of Operations.
EIMC also serves as the administrator to the Fund providing the Fund with facilities, equipment and personnel. EIMC is paid an annual rate determined by applying percentage rates to the aggregate average daily net assets of the Evergreen funds (excluding money market funds) starting at 0.10% and declining to 0.05% as the aggregate average daily net assets of the Evergreen funds (excluding money market funds) increase. For the six months ended March 31, 2010, the administrative services fee was equivalent to an annual rate of 0.10% of the Fund’s average daily net assets.
Evergreen Service Company, LLC (“ESC”), an affiliate of EIMC and a subsidiary of Wells Fargo, is the transfer and dividend disbursing agent for the Fund. ESC receives account fees that vary based on the type of account held by the shareholders in the Fund. For the six months ended March 31, 2010, the transfer agent fees were equivalent to an annual rate of 0.18% of the Fund’s average daily net assets.
Wachovia Bank NA, a subsidiary of Wells Fargo and an affiliate of EIMC, through its securities lending division, Wachovia Global Securities Lending, acts as the securities lending agent for the Fund (see Note 5).
4. DISTRIBUTION PLANS
Wells Fargo Funds Distributor, LLC (“WFFD”), a wholly-owned subsidiary of Wells Fargo serves as distributor of the Fund’s shares. Prior to January 4, 2010, Evergreen Investment Services, Inc. (“EIS”), an affiliate of EIMC and a subsidiary of Wells Fargo, served as distributor of the Fund’s shares. The Fund has adopted Distribution Plans, as allowed by Rule 12b-1 of the 1940 Act, for each class of shares, except Class I. Under the Distribution Plans, the Fund is permitted to pay distribution fees at an annual rate of up to 0.75% of the average daily net assets for Class A shares and up to 1.00% of the average daily net assets for each of Class B and Class C shares. However, currently the distribution fees for Class A shares are limited to 0.25% of the average daily net assets of the class.
For the six months ended March 31, 2010, EIS received $1,334 from the sale of Class A shares and $5,641 and $280 in contingent deferred sales charges from redemptions of Class B and Class C shares, respectively.
5. INVESTMENT TRANSACTIONS
Cost of purchases and proceeds from sales of investment securities (excluding short-term securities) were $117,680,171 and $128,623,167, respectively, for the six months ended March 31, 2010.
Fair value measurements of investments are determined within a framework that has established a fair value hierarchy based upon the various data inputs utilized in
21
NOTES TO FINANCIAL STATEMENTS (unaudited) continued
determining the value of the Fund’s investments. These inputs are summarized into three broad levels as follows:
Level 1 – quoted prices in active markets for identical securities Level 2 – other significant observable inputs (including quoted prices for similar securities, interest rates, prepayment speeds, credit risk, etc.) Level 3 – significant unobservable inputs (including the Fund’s own assumptions in determining the fair value of investments) |
The inputs or methodologies used for valuing securities are not necessarily an indication of the risk associated with investing in those securities.
As of March 31, 2010, the inputs used in valuing the Fund’s assets, which are carried at fair value, were as follows:
Investments in Securities | | Quoted Prices
(Level 1) | | Significant
Other
Observable
Inputs
(Level 2) | | Significant
Unobservable
Inputs
(Level 3) | | Total | |
|
|
|
|
|
|
|
|
| |
Equity securities | | | | | | | | | | | | | |
Common stocks | | $ | 351,054,536 | | $ | 0 | | $ | 0 | | $ | 351,054,536 | |
Short-term investments | | | 17,934,016 | | | 0 | | | 0 | | | 17,934,016 | |
|
|
|
|
|
|
|
|
|
|
|
|
| |
| | $ | 368,988,552 | | $ | 0 | | $ | 0 | | $ | 368,988,552 | |
|
|
|
|
|
|
|
|
|
|
|
|
| |
Further details on the major security types listed above can be found in the Schedule of Investments.
During the six months ended March 31, 2010, the Fund loaned securities to certain brokers and earned $18,908, net of $2,142 paid to Wachovia Global Securities Lending as the securities lending agent. At March 31, 2010, the value of securities on loan and the total value of collateral received for securities loaned (including segregated cash) amounted to $10,733,568 and $11,787,378, respectively.
On March 31, 2010, the aggregate cost of securities for federal income tax purposes was $311,912,279. The gross unrealized appreciation and depreciation on securities based on tax cost was $65,285,510 and $8,209,237, respectively, with a net unrealized appreciation of $57,076,273.
As of September 30, 2009, the Fund had $11,082,219 in capital loss carryovers for federal income tax purposes expiring in 2017.
For income tax purposes, capital losses incurred after October 31 within the Fund’s fiscal year are deemed to arise on the first business day of the following fiscal year. As of September 30, 2009, the Fund incurred and elected to defer post-October losses of $85,279,067.
22
NOTES TO FINANCIAL STATEMENTS (unaudited) continued
6. INTERFUND LENDING
Pursuant to an Exemptive Order issued by the SEC, the Fund may participate in an interfund lending program with certain funds in the Evergreen fund family. This program allows the Fund to borrow from, or lend money to, other participating funds. During the six months ended March 31, 2010, the Fund did not participate in the interfund lending program.
7. EXPENSE REDUCTIONS
Through expense offset arrangements with ESC and the Fund’s custodian, a portion of fund expenses has been reduced.
8. DEFERRED TRUSTEES’ FEES
Each Trustee of the Fund may defer any or all compensation related to performance of his or her duties as a Trustee. The Trustees’ deferred balances are allocated to deferral accounts, which are included in the accrued expenses for the Fund. The investment performance of the deferral accounts is based on the investment performance of certain Evergreen funds. Any gains earned or losses incurred in the deferral accounts are reported in the Fund’s Trustees’ fees and expenses. At the election of the Trustees, the deferral account will be paid either in one lump sum or in quarterly installments for up to ten years.
9. FINANCING AGREEMENT
The Fund and certain other Evergreen funds share in a $100 million unsecured revolving credit commitment for temporary and emergency purposes, including the funding of redemptions, as permitted by each participating fund’s borrowing restrictions. Borrowings under this facility bear interest at the higher of the Federal Funds rate plus 1.25% or LIBOR plus 1.25%. All of the participating funds are charged an annual commitment fee of 0.145% on the unused balance, which is allocated pro rata. During the six months ended March 31, 2010, the Fund had no borrowings under this agreement.
10. REGULATORY MATTERS AND LEGAL PROCEEDINGS
The Evergreen funds, EIMC and certain of EIMC’s affiliates are involved in various legal actions, including private litigation and class action lawsuits, and are and may in the future be subject to regulatory inquiries and investigations.
EIMC and EIS have reached final settlements with the Securities and Exchange Commission (“SEC”) and the Securities Division of the Secretary of the Commonwealth of Massachusetts (“Commonwealth”) primarily relating to the liquidation of Evergreen Ultra Short Opportunities Fund (“Ultra Short Fund”). The claims settled include the following: first, that during the period February 2007 through Ultra Short Fund’s liquidation on June 18, 2008, Ultra Short Fund’s former portfolio management team failed to properly take into account readily-available information in valuing certain non-agency
23
NOTES TO FINANCIAL STATEMENTS (unaudited) continued
residential mortgage-backed securities held by the Ultra Short Fund, resulting in the Ultra Short Fund’s net asset value (“NAV”) being overstated during the period; second, that EIMC and EIS acted inappropriately when, in an effort to explain the decline in Ultra Short Fund’s NAV, certain information regarding the decline was communicated to some, but not all, shareholders and financial intermediaries; third, that the Ultra Short Fund portfolio management team did not adhere to regulatory requirements for affiliated cross trades in executing trades with other Evergreen funds; and finally, that from at least September 2007 to August 2008, EIS did not preserve certain text and instant messages transmitted via personal digital assistant devices. In settling these matters, EIMC and EIS have agreed to payments totaling $41,125,000, up to $40,125,000 of which will be distributed to eligible shareholders of Ultra Short Fund pursuant to a methodology and plan approved by the regulators. EIMC and EIS neither admitted nor denied the regulators’ conclusions.
Three purported class actions have also been filed in the U.S. District Court for the District of Massachusetts relating to the same events; defendants include various Evergreen entities, including EIMC and EIS, and Evergreen Fixed Income Trust and its Trustees. The cases generally allege that investors in the Ultra Short Fund suffered losses as a result of (i) misleading statements in Ultra Short Fund’s registration statement and prospectus, (ii) the failure to accurately price securities in the Ultra Short Fund at different points in time and (iii) the failure of the Ultra Short Fund’s risk disclosures and description of its investment strategy to inform investors adequately of the actual risks of the fund.
EIMC does not expect that any of the legal actions, inquiries or settlement of regulatory matters will have a material adverse impact on the financial position or operations of the Fund to which these financial statements relate. Any publicity surrounding or resulting from any legal actions or regulatory inquiries involving EIMC or its affiliates or any of the Evergreen Funds could result in reduced sales or increased redemptions of Evergreen fund shares, which could increase Evergreen fund transaction costs or operating expenses or have other adverse consequences on the Evergreen funds, including the Fund.
11. REORGANIZATION
At a meeting of the Board of Trustees held on December 30, 2009, the Trustees of the Fund approved a Plan of Reorganization (the “Plan”). Under the Plan, Wells Fargo Advantage Mid Cap Growth Fund, a series of Wells Fargo Funds Trust, will acquire the assets and assume the liabilities of the Fund in exchange for shares of Wells Fargo Advantage Mid Cap Growth Fund.
A special meeting of shareholders of the Fund will be held in June 2010 to consider and vote on the Plan. In April 2010, materials for this meeting were mailed to shareholders of record on March 10, 2010. If approved by the shareholders at this meeting, the reorganization will take place in July 2010.
24
This page left intentionally blank
25
This page left intentionally blank
26
This page left intentionally blank
27
TRUSTEES AND OFFICERS
TRUSTEES1 | |
Dr. Leroy Keith, Jr.
Trustee
DOB: 2/14/1939
Term of office since: 1983
Other directorships: Trustee,
Phoenix Fund Complex
(consisting of 46 portfolios
as of 12/31/2009) | Chairman, Bloc Global Services (development and construction); Former Managing Director, Almanac Capital Management (commodities firm); Trustee, Phoenix Fund Complex; Director, Diversapack Co. (packaging company); Former Partner, Stonington Partners, Inc. (private equity fund); Former Director, Obagi Medical Products Co. |
|
|
Carol A. Kosel
Trustee
DOB: 12/25/1963
Term of office since: 2008
Other directorships: None | Former Consultant to the Evergreen Boards of Trustees; Former Vice President and Senior Vice President, Evergreen Investments, Inc.; Former Treasurer, Evergreen Funds; Former Treasurer, Vestaur Securities Fund |
|
|
Gerald M. McDonnell
Trustee
DOB: 7/14/1939
Term of office since: 1988
Other directorships: None | Consultant, Rock Hill Metals Consultants LLC (Metals Consultant to steel industry); Former Manager of Commercial Operations, CMC Steel (steel producer) |
|
|
Patricia B. Norris
Trustee
DOB: 4/9/1948
Term of office since: 2006
Other directorships: None | President and Director of Buckleys of Kezar Lake, Inc. (real estate company); Former President and Director of Phillips Pond Homes Association (home community); Former Partner, PricewaterhouseCoopers, LLP (independent registered public accounting firm) |
|
|
William Walt Pettit2
Trustee
DOB: 8/26/1955
Term of office since: 1988
Other directorships: None | Director, Rogers, Townsend & Thomas, PC (law firm); Director, Superior Packaging Corp. (packaging company); Member, Superior Land, LLC (real estate holding company), Member, K&P Development, LLC (real estate development); Former Vice President, Kellam & Pettit, P.A. (law firm); Former Director, National Kidney Foundation of North Carolina, Inc. (non-profit organization) |
|
|
David M. Richardson
Trustee
DOB: 9/19/1941
Term of office since: 1982
Other directorships: None | President, Richardson, Runden LLC (executive recruitment advisory services); Director, J&M Cumming Paper Co. (paper merchandising); Former Trustee, NDI Technologies, LLP (communications); Former Consultant, AESC (The Association of Executive Search Consultants) |
|
|
Russell A. Salton III, MD
Trustee
DOB: 6/2/1947
Term of office since: 1984
Other directorships: None | President/CEO, AccessOne MedCard, Inc. |
|
|
Michael S. Scofield
Trustee
DOB: 2/20/1943
Term of office since: 1984
Other directorships: None | Retired Attorney, Law Offices of Michael S. Scofield; Former Director and Chairman, Branded Media Corporation (multi-media branding company) |
|
|
Richard J. Shima
Trustee
DOB: 8/11/1939
Term of office since: 1993
Other directorships: None | Independent Consultant; Director, Hartford Hospital; Trustee, Greater Hartford YMCA; Former Director,Trust Company of CT; Former Trustee, Saint Joseph College (CT) |
|
|
28
TRUSTEES AND OFFICERS continued
Richard K. Wagoner, CFA3
Trustee
DOB: 12/12/1937
Term of office since: 1999
Other directorships: None | Member and Former President, North Carolina Securities Traders Association; Member, Financial Analysts Society |
|
|
OFFICERS | |
W. Douglas Munn4
President
DOB: 4/21/1963
Term of office since: 2009 | Principal occupations: President and Chief Executive Officer, Evergreen Investment Company, Inc.; Chief Operating Officer, Wells Fargo Funds Management, LLC; Former Chief Operating Officer, Evergreen Investment Company, Inc. |
|
|
Jeremy DePalma4
Treasurer
DOB: 2/5/1974
Term of office since: 2005 | Principal occupations: Senior Vice President, Evergreen Investment Management Company, LLC; Assistant Treasurer, Wells Fargo Advantage Funds; Former Vice President, Evergreen Investment Services, Inc.; Former Assistant Vice President, Evergreen Investment Services, Inc. |
|
|
Michael H. Koonce4
Secretary
DOB: 4/20/1960
Term of office since: 2000 | Principal occupations: Managing Counsel, Wells Fargo & Company; Secretary and Senior Vice President, Alternative Strategies Brokerage Services, Inc.; Evergreen Investment Services, Inc.; Secretary and Senior Vice President, Evergreen Investment Management Company, LLC and Evergreen Service Company, LLC |
|
|
Robert Guerin4
Chief Compliance Officer
DOB: 9/20/1965
Term of office since: 2007 | Principal occupations: Chief Compliance Officer, Evergreen Funds and Senior Vice President of Evergreen Investment Company, Inc.; Compliance Manager, Wells Fargo Funds Management Group; Former Managing Director and Senior Compliance Officer, Babson Capital Management LLC; Former Principal and Director, Compliance and Risk Management, State Street Global Advisors; Former Vice President and Manager, Sales Practice Compliance, Deutsche Asset Management |
|
|
1 | Each Trustee serves until a successor is duly elected or qualified or until his or her death, resignation, retirement or removal from office. Each Trustee oversaw 74 Evergreen funds as of December 31, 2009. Correspondence for each Trustee may be sent to Evergreen Board of Trustees, P.O. Box 20083, Charlotte, NC 28202. |
2 | It is possible that Mr. Pettit may be viewed as an “interested person” of the Evergreen funds, as defined in the 1940 Act, because of his law firm’s previous representation of affiliates of Wells Fargo & Company (“Wells Fargo”), the parent to the Evergreen funds’ investment advisor, EIMC. The Trustees are treating Mr. Pettit as an interested trustee for the time being. |
3 | Mr. Wagoner is an “interested person” of the Evergreen funds because of his ownership of shares in Wells Fargo & Company, the parent to the Evergreen funds’ investment advisor. |
4 | The address of the Officer is 200 Berkeley Street, Boston, MA 02116. |
Additional information about the Fund’s Board of Trustees and Officers can be found in the Statement of Additional Information (SAI) and is available upon request without charge by calling 800.343.2898.
29

122769 569842 rv6 05/2010
Evergreen Omega Fund
| | table of contents |
1 | | LETTER TO SHAREHOLDERS |
4 | | FUND AT A GLANCE |
6 | | ABOUT YOUR FUND’S EXPENSES |
7 | | FINANCIAL HIGHLIGHTS |
12 | | SCHEDULE OF INVESTMENTS |
15 | | STATEMENT OF ASSETS AND LIABILITIES |
16 | | STATEMENT OF OPERATIONS |
17 | | STATEMENTS OF CHANGES IN NET ASSETS |
18 | | NOTES TO FINANCIAL STATEMENTS |
28 | | TRUSTEES AND OFFICERS |
This semiannual report must be preceded or accompanied by a prospectus of the Evergreen fund contained herein. The prospectus contains more complete information, including fees and expenses, and should be read carefully before investing or sending money.
The fund will file its complete schedule of portfolio holdings with the SEC for the first and third quarters of each fiscal year on Form N-Q. The fund’s Form N-Q will be available on the SEC’s Web site at http://www.sec.gov. In addition, the fund’s Form N-Q may be reviewed and copied at the SEC’s Public Reference Room in Washington, D.C. Information on the operation of the Public Reference Room may be obtained by calling 800.SEC.0330.
A description of the fund’s proxy voting policies and procedures, as well as information regarding how the fund voted proxies relating to portfolio securities during the most recent 12-month period ended June 30, is available by visiting our Web site at EvergreenInvestments.com or by visiting the SEC’s Web site at http://www.sec.gov. The fund’s proxy voting policies and procedures are also available without charge, upon request, by calling 800.343.2898.
Mutual Funds:
| NOT FDIC INSURED | MAY LOSE VALUE | NOT BANK GUARANTEED |
Evergreen InvestmentsSM is a service mark of Evergreen Investment Management Company, LLC. Copyright 2010, Evergreen Investment Management Company, LLC.
Evergreen Investment Management Company, LLC, is a subsidiary of Wells Fargo & Company and is an affiliate of Wells Fargo & Company’s broker/dealer subsidiaries. Evergreen mutual funds are distributed by Wells Fargo Funds Distributor, LLC, Member FINRA/SIPC, an affiliate of Wells Fargo & Company.
LETTER TO SHAREHOLDERS
May 2010

W. Douglas Munn
President and Chief Executive Officer
Dear Valued Shareholder:
We are pleased to provide you with this semiannual report for Evergreen Omega Fund for the six-month period ended March 31, 2010 (the “period”).
Economic growth was strong throughout the period as the economic recovery appeared to gain momentum. Gross domestic product returned to positive growth in the third quarter of 2009, following four consecutive quarters of contraction for the first time in at least 60 years. The consensus among economists was that the recession that began in December 2007 had likely ended during the summer of 2009. However, with much of the growth attributable to government stimulus, questions remained over the sustainability of the recovery. By the end of the period, the National Bureau of Economic Research had not declared an official end to the recession.
Employment data turned positive during the period, a welcome sign that the economic recovery appeared to be moving toward self-sustainability. U.S. employers added 162,000 jobs in March 2010, the most in three years. The unemployment rate edged down to 9.7% in the final months of the period, after having peaked at 10.1% in October 2009—its highest level in more than 25 years. Other encouraging news in March included increases in temporary jobs, average hours worked, and manufacturing employment. Still, more than 8 million jobs were lost during the recession and the number of long-term unemployed—those out of work for 27 weeks or longer—continued to increase, ending the period at 6.5 million.
Other economic data continued to show additional signs of improvement. Industrial production, manufacturing, and consumer sentiment had all improved significantly as the period came to a close. Retail sales strengthened significantly during the period, with particular strength in March 2010. Although housing inventory and foreclosure rates remained elevated, home sales and prices began to show signs of improvement in many areas of the country—spurred in part by the government’s $8,000 tax credit for first-time home buyers, which was extended through the end of April 2010.
Despite extensive quantitative easing measures by the Federal Reserve Board (the “Fed”), bank lending remained constrained during the period. This indicates that the trillions of dollars of government stimulus that were added to the monetary system might not have an inflationary impact in the near term. Throughout the period, the Federal Open Market Committee (the “FOMC”) held the federal funds rate at the range of 0% to 0.25% that it first targeted in December 2008. The Fed did, however, begin to remove some of its unconventional stimulus measures. It concluded its purchases of longer-term Treasuries in October 2009 and mortgage-backed securities in March 2010.
1
LETTER TO SHAREHOLDERS continued
The FOMC’s final statement during the period noted that economic activity continued to strengthen, the labor market was stabilizing, business spending had risen significantly, and inflation remained subdued. However, the committee also noted that unemployment remained high and credit continued to be tight, reiterating that it was likely to keep the federal funds rate at exceptionally low levels for an extended period because of the continued substantial economic slack.
The strong rally in the equity markets continued during the period. The advance was interrupted only briefly by modest corrections in October 2009 and January 2010 due primarily to concerns about sovereign debt, with particular focus on Greece. The euro weakened significantly against the U.S. dollar as the European Union continued to debate potential support plans for Greece throughout the period.
Despite the macroeconomic concerns, strong corporate earnings reports throughout the period provided support for the equity markets to continue to move higher. Companies in the S&P 500® Index exceeded analysts’ earnings estimates at a pace of nearly 80% in the third quarter of 2009 and more than 70% in the fourth quarter of 2009. Other than brief spikes in market volatility in late October and early January, volatility, as measured by the Chicago Board Options Exchange Volatility Index (VIX), declined over the course of the period, ending at its lowest level since early 2008. Among major stock-market indices, the S&P 500® Index gained 10.6% during the period, and the Dow Jones Industrial Average rose 11.8%. The tech-heavy Nasdaq Composite Index advanced 12.9%, as the information technology sector remained one of the strongest-performing sectors.
Over the period, mid cap stocks outpaced both large cap and small cap stocks, which had similar returns, as measured by the Russell indices. The Russell Midcap Index rose 14.6%, while the Russell 1000 Index of large cap stocks advanced 11.7% and the Russell 2000 Index of small cap stocks gained 11.9%. Performance leadership between the growth and value investment styles was mixed according to market capitalization during the period. Among large cap stocks, the growth style significantly outpaced value. Conversely, value modestly outpaced growth among small cap stocks.
During the period, the management teams of Evergreen’s growth-oriented equity funds maintained their pursuit of capital appreciation, focusing on bottom-up, fundamental analysis in making individual stock selections consistent with the investment discipline and style of each fund. The manager of Evergreen Large Company Growth Fund and Evergreen Omega Fund pursued a small number of companies with the potential to sustain above-average growth for long-term cash flows. The management of Evergreen Strategic Growth Fund sought large cap companies offering superior long-term growth potential. The portfolio managers of Evergreen Mid Cap Growth Fund and Evergreen Small-Mid Growth Fund aimed to balance each portfolio with exposure both to
2
LETTER TO SHAREHOLDERS continued
consistent growth companies and to companies offering attractive intrinsic value. At the same time, managers of Evergreen Growth Fund concentrated on opportunities among small cap growth companies with above-average earnings prospects and reasonable stock valuations.
We believe the changing conditions in the investment environment over the period have underscored the value of a well-diversified, long-term investment strategy to help soften the effects of volatility in any one market or asset class. As always, we encourage investors to maintain diversified investment portfolios in pursuit of their long-term investment goals.
Please visit us at EvergreenInvestments.com for more information about our funds and other investment products available to you. Thank you for your continued support of Evergreen Investments.
Sincerely,

W. Douglas Munn
President and Chief Executive Officer
Evergreen Funds
Notice to Shareholders:
The Evergreen Funds’ Board of Trustees has unanimously approved the reorganizations of the Evergreen Funds, including the Fund in this report, into Wells Fargo Advantage Funds®. Each reorganization is subject to the satisfaction of a number of conditions, including approval by the Evergreen Fund’s shareholders at a meeting expected to be held in June 2010. It is anticipated that the reorganizations, if they are approved by shareholders and all conditions to the closing are satisfied, will occur in July 2010. Additional information, including a description of the applicable reorganization and information about fees, expenses, and risk factors, will be provided to shareholders of each Evergreen Fund in a Prospectus/Proxy Statement that was mailed in April 2010.
The foregoing is not an offer to sell, nor is it a solicitation of an offer to buy, shares of any Wells Fargo Advantage Fund, nor is it a solicitation of any proxy. For more information, or to receive a free copy of the Prospectus/Proxy Statement once a registration statement relating to a proposed reorganization has been filed with the Securities and Exchange Commission and becomes effective, please call 1.800.343.2898 or visit Evergreeninvestments.com. The Prospectus/Proxy Statement will also be available for free on the Securities and Exchange Commission’s website (www.sec.gov). Please read the Prospectus/Proxy Statement carefully before making any investment decisions.
3
FUND AT A GLANCE
as of March 31, 2010
MANAGEMENT TEAM
Investment Advisor:
Evergreen Investment Management Company, LLC
Portfolio Manager:
Aziz Hamzaogullari, CFA
CURRENT INVESTMENT STYLE

Source: Morningstar, Inc.
Morningstar’s style box is based on a portfolio date as of 3/31/2010.
The Equity style box placement is based on 10 growth and valuation measures for each fund holding and the median size of the companies in which the fund invests.
PERFORMANCE AND RETURNS
Portfolio inception date: 4/29/1968
| Class A | Class B | Class C | Class I | Class R |
Class inception date | 4/29/1968 | 8/2/1993 | 8/2/1993 | 1/13/1997 | 10/10/2003 |
|
|
|
|
|
|
Nasdaq symbol | EKOAX | EKOBX | EKOCX | EOMYX | EKORX |
|
|
|
|
|
|
6-month return with sales charge | 7.04% | 8.12% | 12.14% | N/A | N/A |
|
|
|
|
|
|
6-month return w/o sales charge | 13.57% | 13.12% | 13.14% | 13.71% | 13.42% |
|
|
|
|
|
|
Average annual return* | | | | | |
|
|
|
|
|
|
1-year with sales charge | 39.58% | 41.95% | 46.00% | N/A | N/A |
|
|
|
|
|
|
1-year w/o sales charge | 48.09% | 46.95% | 47.00% | 48.47% | 47.70% |
|
|
|
|
|
|
5-year | 4.98% | 5.13% | 5.46% | 6.52% | 5.99% |
|
|
|
|
|
|
10-year | -2.30% | -2.44% | -2.43% | -1.45% | -1.85% |
|
|
|
|
|
|
Maximum sales charge | 5.75% | 5.00% | 1.00% | N/A | N/A |
| Front-end | CDSC | CDSC | | |
|
|
|
|
|
|
* | Adjusted for maximum applicable sales charge, unless noted. |
Past performance is no guarantee of future results. The performance quoted represents past performance and current performance may be lower or higher. The investment return and principal value of an investment will fluctuate so that investors’ shares, when redeemed, may be worth more or less than their original cost. To obtain performance information current to the most recent month-end for Classes A, B, C or I, please go to EvergreenInvestments.com/fundperformance. Please call 1.800.847.5397 for the most recent month-end performance information for Class R. The performance of each class may vary based on differences in loads, fees and expenses paid by the shareholders investing in each class. Performance includes the reinvestment of income dividends and capital gain distributions. Performance shown does not reflect the deduction of taxes that a shareholder would pay on fund distributions or the redemption of fund shares.
Please keep in mind that high double-digit returns were primarily achieved during favorable market conditions. You should not expect that such favorable returns can be consistently achieved. A Fund’s performance, especially for very short time periods, should not be the sole factor in making your investment decision.
Historical performance shown for Class R prior to its inception is based on the performance of Class A, the original class offered. The historical returns for Class R have not been adjusted to reflect the effect of its 12b-1 fee. The fund incurs a 12b-1 fee of 0.25% for Class A, 0.50% for Class R and 1.00% for Classes B and C. Class I does not pay a 12b-1 fee. If these fees had been reflected, returns for Class R would have been lower.
4
FUND AT A GLANCE continued
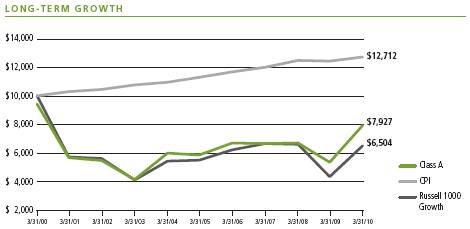
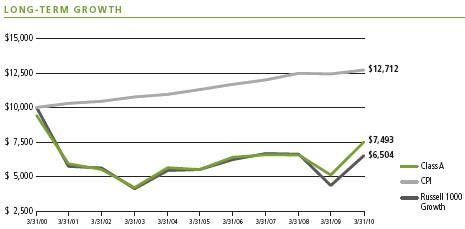
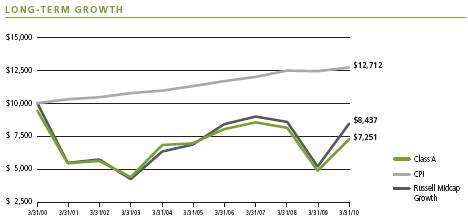
Comparison of a $10,000 investment in the Evergreen Omega Fund Class A shares, reflective of maximum applicable sales charge, versus a similar investment in the Russell 1000 Growth Index (Russell 1000 Growth) and the Consumer Price Index (CPI).
The Russell 1000 Growth is an unmanaged market index and does not include transaction costs associated with buying and selling securities, any mutual fund fees or expenses or any taxes. The CPI is a commonly used measure of inflation and does not represent an investment return. It is not possible to invest directly in an index.
The returns shown for Class B shares do not reflect the conversion of Class B shares to Class A shares after eight years.
Class B shares are closed to new investments by new and existing shareholders.
Returns reflect expense limits previously in effect, without which returns would have been lower.
Class I shares are only offered, subject to the minimum initial purchase requirements, in the following manner: (1) to investment advisory clients of EIMC (or its advisory affiliates), (2) to employer- or state-sponsored benefit plans, including but not limited to, retirement plans, defined benefit plans, deferred compensation plans, or savings plans, (3) to fee-based mutual fund wrap accounts, (4) through arrangements entered into on behalf of the Evergreen funds with certain financial services firms, (5) to certain institutional investors, and (6) to persons who owned Class Y shares in registered name in an Evergreen fund on or before December 31, 1994 or who owned shares of any SouthTrust fund in registered name as of March 18, 2005 or who owned shares of Vestaur Securities Fund as of May 20, 2005.
Class I shares are only available to institutional shareholders with a minimum of $1 million investment, which may be waived in certain situations.
Class R shares generally are available only to 401(k) plans, 457 plans, employer-sponsored 403(b) plans, profit sharing and money purchase pension plans, defined benefit plans and non-qualified deferred compensation plans.
The fund’s investment objective may be changed without a vote of the fund’s shareholders.
Foreign investments may contain more risk due to the inherent risks associated with changing political climates, foreign market instability and foreign currency fluctuations.
Small and mid cap securities may be subject to special risks associated with narrower product lines and limited financial resources compared to their large cap counterparts, and, as a result, small and mid cap securities may decline significantly in market downturns and may be more volatile than those of larger companies due to the higher risk of failure.
All data is as of March 31, 2010, and subject to change.
5
ABOUT YOUR FUND’S EXPENSES
The Example below is intended to describe the fees and expenses borne by shareholders and the impact of those costs on your investment.
Example
As a shareholder of the fund, you incur two types of costs: (1) transaction costs, including sales charges (loads), redemption fees and exchange fees; and (2) ongoing costs, including management fees, distribution (12b-1) fees and other fund expenses. This Example is intended to help you understand your ongoing costs (in dollars) of investing in the fund and to compare these costs with the ongoing costs of investing in other mutual funds. The Example is based on an investment of $1,000 invested at the beginning of the period and held for the entire period from October 1, 2009 to March 31, 2010.
The example illustrates your fund’s costs in two ways:
• Actual expenses
The section in the table under the heading “Actual” provides information about actual account values and actual expenses. You may use the information in these columns, together with the amount you invested, to estimate the expenses that you paid over the period. Simply divide your account value by $1,000 (for example, an $8,600 account value divided by $1,000 = 8.6), then multiply the result by the number in the appropriate column for your share class, in the column entitled “Expenses Paid During Period” to estimate the expenses you paid on your account during this period.
• Hypothetical example for comparison purposes
The section in the table under the heading “Hypothetical (5% return before expenses)” provides information about hypothetical account values and hypothetical expenses based on the fund’s actual expense ratio and an assumed rate of return of 5% per year before expenses, which is not the fund’s actual return. The hypothetical account values and expenses may not be used to estimate the actual ending account balance or expenses you paid for the period. You may use this information to compare the ongoing costs of investing in the fund and other funds. To do so, compare this 5% hypothetical example with the 5% hypothetical examples that appear in the shareholder reports of the other funds.
Please note that the expenses shown in the table are meant to highlight your ongoing costs only and do not reflect any transactional costs, such as sales charges (loads), redemption fees or exchange fees. Therefore, the section in the table under the heading “Hypothetical (5% return before expenses)” is useful in comparing ongoing costs only, and will not help you determine the relative total costs of owning different funds. In addition, if these transactional costs were included, your costs would have been higher.
| | Beginning
Account Value
10/1/2009 | | Ending
Account Value
3/31/2010 | | Expenses Paid
During Period* | |
|
|
|
|
|
|
| |
Actual | | | | | | | | | |
Class A | | $1,000.00 | | $1,135.70 | | $ | 7.13 | | |
Class B | | $1,000.00 | | $1,131.23 | | $ | 11.05 | | |
Class C | | $1,000.00 | | $1,131.38 | | $ | 11.11 | | |
Class I | | $1,000.00 | | $1,137.12 | | $ | 5.81 | | |
Class R | | $1,000.00 | | $1,134.16 | | $ | 8.46 | | |
Hypothetical | | | | | | | | | |
(5% return before expenses) | | | | | | | | | |
Class A | | $1,000.00 | | $1,018.25 | | $ | 6.74 | | |
Class B | | $1,000.00 | | $1,014.56 | | $ | 10.45 | | |
Class C | | $1,000.00 | | $1,014.51 | | $ | 10.50 | | |
Class I | | $1,000.00 | | $1,019.50 | | $ | 5.49 | | |
Class R | | $1,000.00 | | $1,017.00 | | $ | 8.00 | | |
|
|
|
|
|
|
|
|
| |
* | For each class of the fund, expenses are equal to the annualized expense ratio of each class (1.34% for Class A, 2.08% for Class B, 2.09% for Class C, 1.09% for Class I and 1.59% for Class R), multiplied by the average account value over the period, multiplied by 182 / 365 days. |
6
FINANCIAL HIGHLIGHTS
(For a share outstanding throughout each period)
| | Six Months Ended | | Year Ended September 30, | |
| | March 31, 2010 | |
| |
CLASS A | | (unaudited) | | 2009 | | 2008 | | 2007 | | 2006 | | 2005 | |
|
|
|
|
|
|
|
|
|
|
|
|
| |
Net asset value, beginning of period | | $ | 28.44 | | $ | 27.26 | | $ | 31.44 | | $ | 25.60 | | $ | 25.54 | | $ | 23.00 | |
|
|
|
|
|
|
|
|
|
|
|
|
|
|
|
|
|
|
| |
Income from investment operations | | | | | | | | | | | | | | | | | | | |
Net investment income (loss) | | | (0.02 | )1 | | 0.18 | 1 | | 0.05 | 1 | | (0.11 | )1 | | (0.15 | )1 | | (0.12 | )1 |
Net realized and unrealized gains or losses on investments | | | 3.87 | | | 1.00 | | | (4.23 | ) | | 5.95 | | | 0.21 | | | 2.66 | |
| |
|
|
|
|
|
|
|
|
|
|
|
|
|
|
|
|
| |
Total from investment operations | | | 3.85 | | | 1.18 | | | (4.18 | ) | | 5.84 | | | 0.06 | | | 2.54 | |
|
|
|
|
|
|
|
|
|
|
|
|
|
|
|
|
|
|
| |
Distributions to shareholders from | | | | | | | | | | | | | | | | | | | |
Net investment income | | | (0.19 | ) | | 0 | | | 0 | | | 0 | | | 0 | | | 0 | |
|
|
|
|
|
|
|
|
|
|
|
|
|
|
|
|
|
|
| |
Net asset value, end of period | | $ | 32.10 | | $ | 28.44 | | $ | 27.26 | | $ | 31.44 | | $ | 25.60 | | $ | 25.54 | |
|
|
|
|
|
|
|
|
|
|
|
|
|
|
|
|
|
|
| |
Total return2 | | | 13.57 | % | | 4.33 | % | | (13.30 | )% | | 22.81 | % | | 0.23 | % | | 11.04 | % |
|
|
|
|
|
|
|
|
|
|
|
|
|
|
|
|
|
|
| |
Ratios and supplemental data | | | | | | | | | | | | | | | | | | | |
Net assets, end of period (thousands) | | $ | 511,173 | | $ | 460,082 | | $ | 465,952 | | $ | 595,296 | | $ | 520,421 | | $ | 449,639 | |
Ratios to average net assets | | | | | | | | | | | | | | | | | | | |
Expenses including waivers/reimbursements but excluding expense reductions | | | 1.34 | %3 | | 1.39 | % | | 1.37 | % | | 1.40 | % | | 1.42 | % | | 1.44 | % |
Expenses excluding waivers/reimbursements and expense reductions | | | 1.34 | %3 | | 1.48 | % | | 1.44 | % | | 1.46 | % | | 1.51 | % | | 1.48 | % |
Net investment income (loss) | | | (0.14 | )%3 | | 0.79 | % | | 0.16 | % | | (0.38 | )% | | (0.57 | )% | | (0.49 | )% |
Portfolio turnover rate | | | 5 | % | | 26 | % | | 44 | % | | 23 | % | | 128 | % | | 134 | % |
|
|
|
|
|
|
|
|
|
|
|
|
|
|
|
|
|
|
| |
1 | Per share amount is based on average shares outstanding during the period. |
2 | Excluding applicable sales charges |
See Notes to Financial Statements
7
FINANCIAL HIGHLIGHTS
(For a share outstanding throughout each period)
| | Six Months Ended | | Year Ended September 30, | |
| | March 31, 2010 | |
| |
CLASS B | | (unaudited) | | 2009 | | 2008 | | 2007 | | 2006 | | 2005 | |
|
|
|
|
|
|
|
|
|
|
|
|
| |
Net asset value, beginning of period | | $ | 24.46 | | $ | 23.62 | | $ | 27.45 | | $ | 22.51 | | $ | 22.62 | | $ | 20.51 | |
|
|
|
|
|
|
|
|
|
|
|
|
|
|
|
|
|
|
| |
Income from investment operations | | | | | | | | | | | | | | | | | | | |
Net investment income (loss) | | | (0.12 | )1 | | 0.02 | 1 | | (0.15 | )1 | | (0.27 | )1 | | (0.29 | )1 | | (0.25 | )1 |
Net realized and unrealized gains or losses on investments | | | 3.33 | | | 0.82 | | | (3.68 | ) | | 5.21 | | | 0.18 | | | 2.36 | |
| |
|
|
|
|
|
|
|
|
|
|
|
|
|
|
|
|
| |
Total from investment operations | | | 3.21 | | | 0.84 | | | (3.83 | ) | | 4.94 | | | (0.11 | ) | | 2.11 | |
|
|
|
|
|
|
|
|
|
|
|
|
|
|
|
|
|
|
| |
Net asset value, end of period | | $ | 27.67 | | $ | 24.46 | | $ | 23.62 | | $ | 27.45 | | $ | 22.51 | | $ | 22.62 | |
|
|
|
|
|
|
|
|
|
|
|
|
|
|
|
|
|
|
| |
Total return2 | | | 13.12 | % | | 3.56 | % | | (13.95 | )% | | 21.95 | % | | (0.49 | )% | | 10.29 | % |
|
|
|
|
|
|
|
|
|
|
|
|
|
|
|
|
|
|
| |
Ratios and supplemental data | | | | | | | | | | | | | | | | | | | |
Net assets, end of period (thousands) | | $ | 52,167 | | $ | 51,984 | | $ | 85,008 | | $ | 183,129 | | $ | 311,011 | | $ | 437,122 | |
Ratios to average net assets | | | | | | | | | | | | | | | | | | | |
Expenses including waivers/reimbursements but excluding expense reductions | | | 2.08 | %3 | | 2.13 | % | | 2.11 | % | | 2.11 | % | | 2.12 | % | | 2.14 | % |
Expenses excluding waivers/reimbursements and expense reductions | | | 2.08 | %3 | | 2.22 | % | | 2.16 | % | | 2.15 | % | | 2.21 | % | | 2.18 | % |
Net investment income (loss) | | | (0.90 | )%3 | | 0.10 | % | | (0.61 | )% | | (1.08 | )% | | (1.27 | )% | | (1.17 | )% |
Portfolio turnover rate | | | 5 | % | | 26 | % | | 44 | % | | 23 | % | | 128 | % | | 134 | % |
|
|
|
|
|
|
|
|
|
|
|
|
|
|
|
|
|
|
| |
1 | Per share amount is based on average shares outstanding during the period. |
2 | Excluding applicable sales charges |
See Notes to Financial Statements
8
FINANCIAL HIGHLIGHTS
(For a share outstanding throughout each period)
| | Six Months Ended | | Year Ended September 30, | |
| | March 31, 2010 | |
| |
CLASS C | | (unaudited) | | 2009 | | 2008 | | 2007 | | 2006 | | 2005 | |
|
|
|
|
|
|
|
|
|
|
|
|
| |
Net asset value, beginning of period | | $ | 24.53 | | $ | 23.69 | | $ | 27.52 | | $ | 22.57 | | $ | 22.67 | | $ | 20.57 | |
|
|
|
|
|
|
|
|
|
|
|
|
|
|
|
|
|
|
| |
Income from investment operations | | | | | | | | | | | | | | | | | | | |
Net investment income (loss) | | | (0.12 | ) | | 0 | 1 | | (0.15 | )1 | | (0.27 | )1 | | (0.29 | )1 | | (0.25 | )1 |
Net realized and unrealized gains or losses on investments | | | 3.34 | | | 0.84 | | | (3.68 | ) | | 5.22 | | | 0.19 | | | 2.35 | |
| |
|
|
|
|
|
|
|
|
|
|
|
|
|
|
|
|
| |
Total from investment operations | | | 3.22 | | | 0.84 | | | (3.83 | ) | | 4.95 | | | (0.10 | ) | | 2.10 | |
|
|
|
|
|
|
|
|
|
|
|
|
|
|
|
|
|
|
| |
Distributions to shareholders from | | | | | | | | | | | | | | | | | | | |
Net investment income | | | (0.02 | ) | | 0 | | | 0 | | | 0 | | | 0 | | | 0 | |
|
|
|
|
|
|
|
|
|
|
|
|
|
|
|
|
|
|
| |
Net asset value, end of period | | $ | 27.73 | | $ | 24.53 | | $ | 23.69 | | $ | 27.52 | | $ | 22.57 | | $ | 22.67 | |
|
|
|
|
|
|
|
|
|
|
|
|
|
|
|
|
|
|
| |
Total return2 | | | 13.14 | % | | 3.55 | % | | (13.92 | )% | | 21.93 | % | | (0.44 | )% | | 10.21 | % |
|
|
|
|
|
|
|
|
|
|
|
|
|
|
|
|
|
|
| |
Ratios and supplemental data | | | | | | | | | | | | | | | | | | | |
Net assets, end of period (thousands) | | $ | 49,536 | | $ | 43,806 | | $ | 40,829 | | $ | 54,982 | | $ | 64,042 | | $ | 92,223 | |
Ratios to average net assets | | | | | | | | | | | | | | | | | | | |
Expenses including waivers/reimbursements but excluding expense reductions | | | 2.09 | %3 | | 2.14 | % | | 2.11 | % | | 2.11 | % | | 2.12 | % | | 2.14 | % |
Expenses excluding waivers/reimbursements and expense reductions | | | 2.09 | %3 | | 2.23 | % | | 2.16 | % | | 2.15 | % | | 2.21 | % | | 2.18 | % |
Net investment income (loss) | | | (0.89 | )%3 | | 0.02 | % | | (0.58 | )% | | (1.09 | )% | | (1.27 | )% | | (1.15 | )% |
Portfolio turnover rate | | | 5 | % | | 26 | % | | 44 | % | | 23 | % | | 128 | % | | 134 | % |
|
|
|
|
|
|
|
|
|
|
|
|
|
|
|
|
|
|
| |
1 | Per share amount is based on average shares outstanding during the period. |
2 | Excluding applicable sales charges |
See Notes to Financial Statements
9
FINANCIAL HIGHLIGHTS
(For a share outstanding throughout each period)
| | Six Months Ended | | Year Ended September 30, | |
| | March 31, 2010 | |
| |
CLASS I | | (unaudited) | | 2009 | | 2008 | | 2007 | | 2006 | | 2005 | |
|
|
|
|
|
|
|
|
|
|
|
|
| |
Net asset value, beginning of period | | $ | 29.39 | | $ | 28.10 | | $ | 32.32 | | $ | 26.25 | | $ | 26.10 | | $ | 23.44 | |
|
|
|
|
|
|
|
|
|
|
|
|
|
|
|
|
|
|
| |
Income from investment operations | | | | | | | | | | | | | | | | | | | |
Net investment income (loss) | | | 0.21 | | | 0.24 | 1 | | 0.13 | 1 | | (0.03 | )1 | | (0.08 | )1 | | (0.04 | )1 |
Net realized and unrealized gains or losses on investments | | | 3.80 | | | 1.05 | | | (4.35 | ) | | 6.10 | | | 0.23 | | | 2.70 | |
| |
|
|
|
|
|
|
|
|
|
|
|
|
|
|
|
|
| |
Total from investment operations | | | 4.01 | | | 1.29 | | | (4.22 | ) | | 6.07 | | | 0.15 | | | 2.66 | |
|
|
|
|
|
|
|
|
|
|
|
|
|
|
|
|
|
|
| |
Distributions to shareholders from | | | | | | | | | | | | | | | | | | | |
Net investment income | | | (0.25 | ) | | 0 | | | 0 | | | 0 | | | 0 | | | 0 | |
|
|
|
|
|
|
|
|
|
|
|
|
|
|
|
|
|
|
| |
Net asset value, end of period | | $ | 33.15 | | $ | 29.39 | | $ | 28.10 | | $ | 32.32 | | $ | 26.25 | | $ | 26.10 | |
|
|
|
|
|
|
|
|
|
|
|
|
|
|
|
|
|
|
| |
Total return | | | 13.71 | % | | 4.59 | % | | (13.06 | )% | | 23.12 | % | | 0.57 | % | | 11.35 | % |
|
|
|
|
|
|
|
|
|
|
|
|
|
|
|
|
|
|
| |
Ratios and supplemental data | | | | | | | | | | | | | | | | | | | |
Net assets, end of period (thousands) | | $ | 31,220 | | $ | 32,437 | | $ | 23,910 | | $ | 16,503 | | $ | 16,344 | | $ | 10,526 | |
Ratios to average net assets | | | | | | | | | | | | | | | | | | | |
Expenses including waivers/reimbursements but excluding expense reductions | | | 1.09 | %2 | | 1.14 | % | | 1.12 | % | | 1.11 | % | | 1.12 | % | | 1.14 | % |
Expenses excluding waivers/reimbursements and expense reductions | | | 1.09 | %2 | | 1.23 | % | | 1.17 | % | | 1.15 | % | | 1.21 | % | | 1.18 | % |
Net investment income (loss) | | | 0.12 | %2 | | 1.00 | % | | 0.42 | % | | (0.09 | )% | | (0.30 | )% | | (0.15 | )% |
Portfolio turnover rate | | | 5 | % | | 26 | % | | 44 | % | | 23 | % | | 128 | % | | 134 | % |
|
|
|
|
|
|
|
|
|
|
|
|
|
|
|
|
|
|
| |
1 | Per share amount is based on average shares outstanding during the period. |
See Notes to Financial Statements
10
FINANCIAL HIGHLIGHTS
(For a share outstanding throughout each period)
| | Six Months Ended | | Year Ended September 30, | |
| | March 31, 2010 | |
| |
CLASS R | | (unaudited) | | 2009 | | 2008 | | 2007 | | 2006 | | 2005 | |
|
|
|
|
|
|
|
|
|
|
|
|
| |
Net asset value, beginning of period | | $ | 28.09 | | $ | 26.99 | | $ | 31.20 | | $ | 25.47 | | $ | 25.46 | | $ | 22.97 | |
|
|
|
|
|
|
|
|
|
|
|
|
|
|
|
|
|
|
| |
Income from investment operations | | | | | | | | | | | | | | | | | | | |
Net investment income (loss) | | | (0.06 | ) | | 0.08 | 1 | | (0.02 | )1 | | (0.14 | )1 | | (0.19 | )1 | | (0.24 | )1 |
Net realized and unrealized gains or losses on investments | | | 3.82 | | | 1.02 | | | (4.19 | ) | | 5.87 | | | 0.20 | | | 2.73 | |
| |
|
|
|
|
|
|
|
|
|
|
|
|
|
|
|
|
| |
Total from investment operations | | | 3.76 | | | 1.10 | | | (4.21 | ) | | 5.73 | | | 0.01 | | | 2.49 | |
|
|
|
|
|
|
|
|
|
|
|
|
|
|
|
|
|
|
| |
Distributions to shareholders from | | | | | | | | | | | | | | | | | | | |
Net investment income | | | (0.18 | ) | | 0 | | | 0 | | | 0 | | | 0 | | | 0 | |
|
|
|
|
|
|
|
|
|
|
|
|
|
|
|
|
|
|
| |
Net asset value, end of period | | $ | 31.67 | | $ | 28.09 | | $ | 26.99 | | $ | 31.20 | | $ | 25.47 | | $ | 25.46 | |
|
|
|
|
|
|
|
|
|
|
|
|
|
|
|
|
|
|
| |
Total return | | | 13.42 | % | | 4.08 | % | | (13.49 | )% | | 22.50 | % | | 0.04 | % | | 10.84 | % |
|
|
|
|
|
|
|
|
|
|
|
|
|
|
|
|
|
|
| |
Ratios and supplemental data | | | | | | | | | | | | | | | | | | | |
Net assets, end of period (thousands) | | $ | 1,604 | | $ | 838 | | $ | 84 | | $ | 63 | | $ | 445 | | $ | 385 | |
Ratios to average net assets | | | | | | | | | | | | | | | | | | | |
Expenses including waivers/reimbursements but excluding expense reductions | | | 1.59 | %2 | | 1.67 | % | | 1.61 | % | | 1.61 | % | | 1.62 | % | | 1.63 | % |
Expenses excluding waivers/reimbursements and expense reductions | | | 1.59 | %2 | | 1.76 | % | | 1.66 | % | | 1.65 | % | | 1.71 | % | | 1.67 | % |
Net investment income (loss) | | | (0.33 | )%2 | | 0.35 | % | | (0.08 | )% | | (0.53 | )% | | (0.75 | )% | | (0.98 | )% |
Portfolio turnover rate | | | 5 | % | | 26 | % | | 44 | % | | 23 | % | | 128 | % | | 134 | % |
|
|
|
|
|
|
|
|
|
|
|
|
|
|
|
|
|
|
| |
1 | Per share amount is based on average shares outstanding during the period. |
See Notes to Financial Statements
11
SCHEDULE OF INVESTMENTS
March 31, 2010 (unaudited)
| | |
Shares
| | |
Value
| |
|
|
|
|
|
|
| |
COMMON STOCKS 99.5% | | | | | | | |
CONSUMER DISCRETIONARY 17.3% | | | | | | | |
Internet & Catalog Retail 10.7% | | | | | | | |
Amazon.com, Inc. * | | | 331,529 | | $ | 44,998,432 | |
Blue Nile, Inc. * ρ | | | 438,584 | | | 24,130,892 | |
| | | | |
|
| |
| | | | | | 69,129,324 | |
| | | | |
|
| |
Media 1.7% | | | | | | | |
Omnicom Group, Inc. | | | 288,690 | | | 11,204,059 | |
| | | | |
|
| |
Multiline Retail 0.8% | | | | | | | |
Target Corp. | | | 96,002 | | | 5,049,705 | |
| | | | |
|
| |
Specialty Retail 0.8% | | | | | | | |
Home Depot, Inc. | | | 165,450 | | | 5,352,307 | |
| | | | |
|
| |
Textiles, Apparel & Luxury Goods 3.3% | | | | | | | |
Timberland Co., Class A * | | | 984,650 | | | 21,012,431 | |
| | | | |
|
| |
CONSUMER STAPLES 5.5% | | | | | | | |
Beverages 0.8% | | | | | | | |
Coca-Cola Co. | | | 89,239 | | | 4,908,145 | |
| | | | |
|
| |
Food Products 2.4% | | | | | | | |
McCormick & Co., Inc. | | | 411,550 | | | 15,787,058 | |
| | | | |
|
| |
Household Products 2.3% | | | | | | | |
Clorox Co. | | | 158,519 | | | 10,167,408 | |
Procter & Gamble Co. | | | 73,992 | | | 4,681,474 | |
| | | | |
|
| |
| | | | | | 14,848,882 | |
| | | | |
|
| |
ENERGY 3.7% | | | | | | | |
Energy Equipment & Services 3.5% | | | | | | | |
Schlumberger, Ltd. | | | 278,218 | | | 17,655,714 | |
Weatherford International, Ltd. * | | | 297,200 | | | 4,713,592 | |
| | | | |
|
| |
| | | | | | 22,369,306 | |
| | | | |
|
| |
Oil, Gas & Consumable Fuels 0.2% | | | | | | | |
Chevron Corp. | | | 8,092 | | | 613,616 | |
ConocoPhillips | | | 12,033 | | | 615,729 | |
| | | | |
|
| |
| | | | | | 1,229,345 | |
| | | | |
|
| |
FINANCIALS 19.4% | | | | | | | |
Capital Markets 7.4% | | | | | | | |
Legg Mason, Inc. | | | 603,267 | | | 17,295,665 | |
SEI Investments Co. | | | 1,386,655 | | | 30,464,810 | |
| | | | |
|
| |
| | | | | | 47,760,475 | |
| | | | |
|
| |
Consumer Finance 7.8% | | | | | | | |
American Express Co. | | | 351,000 | | | 14,482,260 | |
Visa, Inc., Class A | | | 398,400 | | | 36,266,352 | |
| | | | |
|
| |
| | | | | | 50,748,612 | |
| | | | |
|
| |
See Notes to Financial Statements
12
SCHEDULE OF INVESTMENTS continued
March 31, 2010 (unaudited)
| | |
Shares
| | |
Value
| |
|
|
|
|
|
|
| |
COMMON STOCKS continued | | | | | | | |
FINANCIALS continued | | | | | | | |
Diversified Financial Services 3.3% | | | | | | | |
MSCI, Inc., Class A * | | | 588,100 | | $ | 21,230,410 | |
| | | | |
|
| |
Insurance 0.9% | | | | | | | |
Marsh & McLennan Cos. | | | 230,487 | | | 5,628,493 | |
| | | | |
|
| |
HEALTH CARE 17.0% | | | | | | | |
Biotechnology 7.5% | | | | | | | |
Amgen, Inc. * | | | 324,506 | | | 19,392,478 | |
Biogen Idec, Inc. * | | | 503,363 | | | 28,872,902 | |
| | | | |
|
| |
| | | | | | 48,265,380 | |
| | | | |
|
| |
Health Care Equipment & Supplies 4.8% | | | | | | | |
Medtronic, Inc. | | | 218,618 | | | 9,844,368 | |
Zimmer Holdings, Inc. * | | | 357,743 | | | 21,178,386 | |
| | | | |
|
| |
| | | | | | 31,022,754 | |
| | | | |
|
| |
Health Care Providers & Services 0.2% | | | | | | | |
WellPoint, Inc. * | | | 22,907 | | | 1,474,753 | |
| | | | |
|
| |
Pharmaceuticals 4.5% | | | | | | | |
Merck & Co., Inc. | | | 290,884 | | | 10,864,518 | |
Novartis AG, ADR ρ | | | 330,263 | | | 17,867,228 | |
| | | | |
|
| |
| | | | | | 28,731,746 | |
| | | | |
|
| |
INDUSTRIALS 8.6% | | | | | | | |
Air Freight & Logistics 7.1% | | | | | | | |
Expeditors International of Washington, Inc. | | | 817,861 | | | 30,195,428 | |
United Parcel Service, Inc., Class B | | | 247,700 | | | 15,954,357 | |
| | | | |
|
| |
| | | | | | 46,149,785 | |
| | | | |
|
| |
Professional Services 1.5% | | | | | | | |
CoStar Group, Inc. * | | | 155,500 | | | 6,456,360 | |
Verisk Analytics, Inc., Class A * | | | 111,722 | | | 3,150,561 | |
| | | | |
|
| |
| | | | | | 9,606,921 | |
| | | | |
|
| |
INFORMATION TECHNOLOGY 28.0% | | | | | | | |
Communications Equipment 4.4% | | | | | | | |
Cisco Systems, Inc. * | | | 472,215 | | | 12,291,757 | |
QUALCOMM, Inc. | | | 388,784 | | | 16,325,040 | |
| | | | |
|
| |
| | | | | | 28,616,797 | |
| | | | |
|
| |
Internet Software & Services 5.1% | | | | | | | |
Google, Inc., Class A * | | | 58,435 | | | 33,133,229 | |
| | | | |
|
| |
IT Services 1.2% | | | | | | | |
Automatic Data Processing, Inc. | | | 173,347 | | | 7,708,741 | |
| | | | |
|
| |
See Notes to Financial Statements
13
SCHEDULE OF INVESTMENTS continued
March 31, 2010 (unaudited)
| | |
Shares
| | |
Value
| |
|
|
|
|
|
|
| |
COMMON STOCKS continued | | | | | | | |
INFORMATION TECHNOLOGY continued | | | | | | | |
Semiconductors & Semiconductor Equipment 6.9% | | | | | | | |
Altera Corp. | | | 1,232,374 | | $ | 29,959,012 | |
Analog Devices, Inc. | | | 209,000 | | | 6,023,380 | |
Linear Technology Corp. ρ | | | 301,600 | | | 8,529,248 | |
| | | | |
|
| |
| | | | | | 44,511,640 | |
| | | | |
|
| |
Software 10.4% | | | | | | | |
FactSet Research Systems, Inc. ρ | | | 385,800 | | | 28,306,146 | |
Microsoft Corp. | | | 423,385 | | | 12,392,479 | |
Oracle Corp. | | | 1,027,031 | | | 26,384,426 | |
| | | | |
|
| |
| | | | | | 67,083,051 | |
| | | | |
|
| |
Total Common Stocks (cost $513,133,082) | | | | | | 642,563,349 | |
| | | | |
|
| |
SHORT-TERM INVESTMENTS 6.8% | | | | | | | |
MUTUAL FUND SHARES 6.8% | | | | | | | |
BlackRock Liquidity TempFund, Institutional Class, 0.12% q ρρ | | | 17,651,521 | | | 17,651,521 | |
Evergreen Institutional Money Market Fund, Class I, 0.01% q ø ρρ | | | 6,763,291 | | | 6,763,291 | |
Evergreen Institutional U.S. Government Money Market Fund, Class I, 0.01% q ø | | | 1,987,511 | | | 1,987,511 | |
Morgan Stanley Institutional Liquidity Fund Money Market Portfolio, Institutional Class, 0.12% q ρρ | | | 17,443,682 | | | 17,443,682 | |
| | | | |
|
| |
Total Short-Term Investments (cost $43,846,005) | | | | | | 43,846,005 | |
| | | | |
|
| |
Total Investments (cost $556,979,087) 106.3% | | | | | | 686,409,354 | |
Other Assets and Liabilities (6.3%) | | | | | | (40,710,144 | ) |
| | | | |
|
| |
Net Assets 100.0% | | | | | $ | 645,699,210 | |
| | | | |
|
| |
* | Non-income producing security |
ρ | All or a portion of this security is on loan. |
q | Rate shown is the 7-day annualized yield at period end. |
ρρ | All or a portion of this security represents investment of cash collateral received from securities on loan. |
ø | Evergreen Investment Management Company, LLC is the investment advisor to both the Fund and the money market fund. |
Summary of Abbreviations |
ADR | American Depository Receipt |
The following table shows the percent of total long-term investments by sector as of March 31, 2010:
Information Technology | | 28.2 | % |
Financials | | 19.5 | % |
Consumer Discretionary | | 17.4 | % |
Health Care | | 17.0 | % |
Industrials | | 8.7 | % |
Consumer Staples | | 5.5 | % |
Energy | | 3.7 | % |
| |
| |
| | 100.0 | % |
| |
| |
See Notes to Financial Statements
14
STATEMENT OF ASSETS AND LIABILITIES
March 31, 2010 (unaudited)
Assets | | | | |
Investments in unaffiliated issuers, at value (cost $548,228,285) including $40,591,198 of securities loaned | | $ | 677,658,552 | |
Investments in affiliated issuers, at value (cost $8,750,802) | | | 8,750,802 | |
|
|
|
| |
Total investments | | | 686,409,354 | |
Segregated cash | | | 14,232 | |
Receivable for Fund shares sold | | | 1,325,453 | |
Dividends receivable | | | 1,018,357 | |
Receivable for securities lending income | | | 20,352 | |
Prepaid expenses and other assets | | | 71,760 | |
|
|
|
| |
Total assets | | | 688,859,508 | |
|
|
|
| |
Liabilities | | | | |
Payable for Fund shares redeemed | | | 1,174,267 | |
Payable for securities on loan | | | 41,872,726 | |
Advisory fee payable | | | 9,241 | |
Distribution Plan expenses payable | | | 6,338 | |
Due to other related parties | | | 5,723 | |
Accrued expenses and other liabilities | | | 92,003 | |
|
|
|
| |
Total liabilities | | | 43,160,298 | |
|
|
|
| |
Net assets | | $ | 645,699,210 | |
|
|
|
| |
Net assets represented by | | | | |
Paid-in capital | | $ | 950,721,088 | |
Overdistributed net investment loss | | | (819,870 | ) |
Accumulated net realized losses on investments | | | (433,632,275 | ) |
Net unrealized gains on investments | | | 129,430,267 | |
|
|
|
| |
Total net assets | | $ | 645,699,210 | |
|
|
|
| |
Net assets consists of | | | | |
Class A | | $ | 511,172,917 | |
Class B | | | 52,166,649 | |
Class C | | | 49,535,733 | |
Class I | | | 31,220,313 | |
Class R | | | 1,603,598 | |
|
|
|
| |
Total net assets | | $ | 645,699,210 | |
|
|
|
| |
Shares outstanding (unlimited number of shares authorized) | | | | |
Class A | | | 15,924,436 | |
Class B | | | 1,885,019 | |
Class C | | | 1,786,475 | |
Class I | | | 941,901 | |
Class R | | | 50,628 | |
|
|
|
| |
Net asset value per share | | | | |
Class A | | $ | 32.10 | |
Class A — Offering price (based on sales charge of 5.75%) | | $ | 34.06 | |
Class B | | $ | 27.67 | |
Class C | | $ | 27.73 | |
Class I | | $ | 33.15 | |
Class R | | $ | 31.67 | |
|
|
|
| |
See Notes to Financial Statements
15
STATEMENT OF OPERATIONS
Six Months Ended March 31, 2010 (unaudited)
Investment income | | | | |
Dividends (net of foreign withholding taxes of $99,605) | | $ | 3,616,644 | |
Securities lending | | | 42,434 | |
Income from affiliated issuers | | | 1,196 | |
|
|
|
| |
Total investment income | | | 3,660,274 | |
|
|
|
| |
Expenses | | | | |
Advisory fee | | | 1,598,495 | |
Distribution Plan expenses | | | | |
Class A | | | 609,217 | |
Class B | | | 255,722 | |
Class C | | | 233,851 | |
Class R | | | 3,117 | |
Administrative services fee | | | 307,403 | |
Transfer agent fees | | | 1,199,752 | |
Trustees’ fees and expenses | | | 6,634 | |
Printing and postage expenses | | | 69,005 | |
Custodian and accounting fees | | | 72,791 | |
Registration and filing fees | | | 43,813 | |
Professional fees | | | 26,018 | |
Interest expense | | | 48 | |
Other | | | 11,643 | |
|
|
|
| |
Total expenses | | | 4,437,509 | |
Less: Expense reductions | | | (65 | ) |
|
|
|
| |
Net expenses | | | 4,437,444 | |
|
|
|
| |
Net investment loss | | | (777,170 | ) |
|
|
|
| |
Net realized and unrealized gains or losses on investments | | | | |
Net realized gains on securities in unaffiliated issuers | | | 349,881 | |
Net change in unrealized gains or losses on securities in unaffiliated issuers | | | 78,290,782 | |
|
|
|
| |
Net realized and unrealized gains or losses on investments | | | 78,640,663 | |
|
|
|
| |
Net increase in net assets resulting from operations | | $ | 77,863,493 | |
|
|
|
| |
See Notes to Financial Statements
16
STATEMENTS OF CHANGES IN NET ASSETS
| | Six Months Ended | | | |
| | March 31, 2010 | | Year Ended | |
| | (unaudited) | | September 30, 2009 | |
|
|
|
|
| |
Operations | | | | | | | | | | | |
Net investment income (loss) | | | | $ | (777,170 | ) | | | $ | 3,302,572 | |
Net realized gains or losses on investments | | | | | 349,881 | | | | | (37,534,588 | ) |
Net change in unrealized gains or losses on investments | | | | | 78,290,782 | | | | | 47,129,070 | |
|
|
|
|
|
|
|
|
|
|
| |
Net increase in net assets resulting from operations | | | | | 77,863,493 | | | | | 12,897,054 | |
|
|
|
|
|
|
|
|
|
|
| |
Distributions to shareholders from | | | | | | | | | | | |
Net investment income | | | | | | | | | | | |
Class A | | | | | (3,039,350 | ) | | | | 0 | |
Class C | | | | | (38,379 | ) | | | | 0 | |
Class I | | | | | (216,128 | ) | | | | 0 | |
Class R | | | | | (8,005 | ) | | | | 0 | |
|
|
|
|
|
|
|
|
|
|
| |
Total distributions to shareholders | | | | | (3,301,862 | ) | | | | 0 | |
|
|
|
|
|
|
|
|
|
|
| |
| | Shares | | | | | Shares | | | | |
|
|
|
|
|
|
|
|
|
|
| |
Capital share transactions | | | | | | | | | | | |
Proceeds from shares sold | | | | | | | | | | | |
Class A | | 854,710 | | | 25,972,168 | | 1,147,772 | | | 27,740,191 | |
Class B | | 18,337 | | | 485,303 | | 181,477 | | | 3,496,619 | |
Class C | | 146,305 | | | 3,826,974 | | 412,479 | | | 8,601,221 | |
Class I | | 412,422 | | | 12,654,944 | | 448,507 | | | 11,306,125 | |
Class R | | 30,964 | | | 919,370 | | 102,631 | | | 2,415,251 | |
|
|
|
|
|
|
|
|
|
|
| |
| | | | | 43,858,759 | | | | | 53,559,407 | |
|
|
|
|
|
|
|
|
|
|
| |
Net asset value of shares issued in reinvestment of distributions | | | | | | | | | | | |
Class A | | 92,412 | | | 2,785,288 | | 0 | | | 0 | |
Class C | | 1,150 | | | 30,010 | | 0 | | | 0 | |
Class I | | 6,244 | | | 194,202 | | 0 | | | 0 | |
Class R | | 169 | | | 5,026 | | 0 | | | 0 | |
|
|
|
|
|
|
|
|
|
|
| |
| | | | | 3,014,526 | | | | | 0 | |
|
|
|
|
|
|
|
|
|
|
| |
Automatic conversion of Class B shares to Class A shares | | | | | | | | | | | |
Class A | | 79,937 | | | 2,327,970 | | 826,492 | | | 18,988,798 | |
Class B | | (92,988 | ) | | (2,327,970 | ) | (957,225 | ) | | (18,988,798 | ) |
|
|
|
|
|
|
|
|
|
|
| |
| | | | | 0 | | | | | 0 | |
|
|
|
|
|
|
|
|
|
|
| |
Payment for shares redeemed | | | | | | | | | | | |
Class A | | (1,279,069 | ) | | (38,792,061 | ) | (2,889,525 | ) | | (65,971,047 | ) |
Class B | | (165,549 | ) | | (4,299,294 | ) | (697,389 | ) | | (13,569,375 | ) |
Class C | | (146,949 | ) | | (3,853,574 | ) | (350,181 | ) | | (6,917,725 | ) |
Class I | | (580,509 | ) | | (17,624,562 | ) | (195,688 | ) | | (4,830,031 | ) |
Class R | | (10,347 | ) | | (314,422 | ) | (75,911 | ) | | (1,804,408 | ) |
|
|
|
|
|
|
|
|
|
|
| |
| | | | | (64,883,913 | ) | | | | (93,092,586 | ) |
|
|
|
|
|
|
|
|
|
|
| |
Net decrease in net assets resulting from capital share transactions | | | | | (18,010,628 | ) | | | | (39,533,179 | ) |
|
|
|
|
|
|
|
|
|
|
| |
Total increase (decrease) in net assets | | | | | 56,551,003 | | | | | (26,636,125 | ) |
Net assets | | | | | | | | | | | |
Beginning of period | | | | | 589,148,207 | | | | | 615,784,332 | |
|
|
|
|
|
|
|
|
|
|
| |
End of period | | | | $ | 645,699,210 | | | | $ | 589,148,207 | |
|
|
|
|
|
|
|
|
|
|
| |
Undistributed (overdistributed) net investment income (loss) | | | | $ | (819,870 | ) | | | $ | 3,259,162 | |
|
|
|
|
|
|
|
|
|
|
| |
See Notes to Financial Statements
17
NOTES TO FINANCIAL STATEMENTS (unaudited)
1. ORGANIZATION
Evergreen Omega Fund (the “Fund”) is a diversified series of Evergreen Equity Trust (the “Trust”), a Delaware statutory trust organized on September 18, 1997. The Trust is an open-end management investment company registered under the Investment Company Act of 1940, as amended (the “1940 Act”).
The Fund offers Class A, Class B, Class C, Class I and Class R shares. Class A shares are sold with a front-end sales charge. However, Class A share investments of $1 million or more are not subject to a front-end sales charge, but are subject to a contingent deferred sales charge of 1.00% upon redemption within 18 months. Class B shares are available for purchase only through (i) an exchange transaction in which Class B shares of another Evergreen fund are exchanged or (ii) the Fund’s dividend reinvestment program. Class B shares are sold without a front-end sales charge, but are subject to a contingent deferred sales charge that is payable upon redemption and decreases depending on how long the shares had been held. Class C shares are sold without a front-end sales charge, but are subject to a contingent deferred sales charge that is payable upon redemption within one year. Class I shares are sold without a front-end sales charge or contingent deferred sales charge. Class R shares are only available to participants in certain retirement plans and are sold without a front-end sales charge or contingent deferred sales charge. Each class of shares, except Class I shares, pays an ongoing distribution fee.
2. SIGNIFICANT ACCOUNTING POLICIES
The following is a summary of significant accounting policies consistently followed by the Fund in the preparation of its financial statements. The policies are in conformity with generally accepted accounting principles in the United States of America, which require management to make estimates and assumptions that affect amounts reported herein. Actual results could differ from these estimates. Management has considered the circumstances under which the Fund should recognize or make disclosures regarding events or transactions occurring subsequent to the balance sheet date through the date the financial statements are issued. Adjustments or additional disclosures, if any, have been included in these financial statements.
a. Valuation of investments
Listed equity securities are usually valued at the last sales price or official closing price on the national securities exchange where the securities are principally traded. If there has been no sale, the securities are valued at the mean between bid and asked prices.
Investments in open-end mutual funds are valued at net asset value. Securities for which market quotations are not readily available or not reflective of current fair value are valued at fair value as determined by the investment advisor in good faith, according to procedures approved by the Board of Trustees.
18
NOTES TO FINANCIAL STATEMENTS (unaudited) continued
The valuation techniques used by the Fund to measure fair value are consistent with the market approach, income approach and/or cost approach, where applicable, for each security type.
b. Securities lending
The Fund may lend its securities to certain qualified brokers in order to earn additional income. The Fund receives compensation in the form of fees or interest earned on the investment of any cash collateral received. The Fund also continues to receive interest and dividends on the securities loaned. The Fund receives collateral in the form of cash or securities with a market value at least equal to the market value of the securities on loan. In the event of default or bankruptcy by the borrower, the Fund could experience delays and costs in recovering the loaned securities or in gaining access to the collateral. In addition, the investment of any cash collateral received may lose all or part of its value. The Fund has the right under the lending agreement to recover the securities from the borrower on demand.
c. Security transactions and investment income
Security transactions are recorded on trade date. Realized gains and losses are computed using the specific cost of the security sold. Dividend income is recorded on the ex-dividend date. Foreign income and capital gains realized on some securities may be subject to foreign taxes, which are accrued as applicable.
d. Federal and other taxes
The Fund intends to continue to qualify as a regulated investment company and distribute all of its taxable income, including any net capital gains (which have already been offset by available capital loss carryovers). Accordingly, no provision for federal taxes is required. The Fund’s income and excise tax returns and all financial records supporting those returns for the prior three fiscal years are subject to examination by the federal, Massachusetts and Delaware revenue authorities.
e. Distributions
Distributions to shareholders from net investment income and net realized gains, if any, are recorded on the ex-dividend date. Such distributions are determined in conformity with income tax regulations, which may differ from generally accepted accounting principles.
f. Class allocations
Income, common expenses and realized and unrealized gains and losses are allocated to the classes based on the relative net assets of each class. Distribution fees, if any, are calculated daily at the class level based on the appropriate net assets of each class and the specific expense rates applicable to each class.
3. ADVISORY FEE AND OTHER TRANSACTIONS WITH AFFILIATES
Evergreen Investment Management Company, LLC (“EIMC”), a subsidiary of Wells Fargo & Company (“Wells Fargo”), is the investment advisor to the Fund and is paid an
19
NOTES TO FINANCIAL STATEMENTS (unaudited) continued
annual fee starting at 0.52% and declining to 0.41% as the aggregate average daily net assets of the Fund and its variable annuity counterpart, Evergreen VA Omega Fund, increase. For the six months ended March 31, 2010, the advisory fee was equivalent to an annual rate of 0.52% of the Fund’s average daily net assets.
The Fund may invest in money market funds which are advised by EIMC. Income earned on these investments is included in income from affiliated issuers on the Statement of Operations.
EIMC also serves as the administrator to the Fund providing the Fund with facilities, equipment and personnel. EIMC is paid an annual rate determined by applying percentage rates to the aggregate average daily net assets of the Evergreen funds (excluding money market funds) starting at 0.10% and declining to 0.05% as the aggregate average daily net assets of the Evergreen funds (excluding money market funds) increase. For the six months ended March 31, 2010, the administrative services fee was equivalent to an annual rate of 0.10% of the Fund’s average daily net assets.
Evergreen Service Company, LLC (“ESC”), an affiliate of EIMC and a subsidiary of Wells Fargo, is the transfer and dividend disbursing agent for the Fund. ESC receives account fees that vary based on the type of account held by the shareholders in the Fund. For the six months ended March 31, 2010, the transfer agent fees were equivalent to an annual rate of 0.39% of the Fund’s average daily net assets.
Wachovia Bank NA, a subsidiary of Wells Fargo and an affiliate of EIMC, through its securities lending division, Wachovia Global Securities Lending, acts as the securities lending agent for the Fund (see Note 5).
4. DISTRIBUTION PLANS
Wells Fargo Funds Distributor, LLC (“WFFD”), a wholly-owned subsidiary of Wells Fargo serves as distributor of the Fund’s shares. Prior to January 4, 2010, Evergreen Investment Services, Inc. (“EIS”), an affiliate of EIMC and a subsidiary of Wells Fargo, served as distributor of the Fund’s shares. The Fund has adopted Distribution Plans, as allowed by Rule 12b-1 of the 1940 Act, for each class of shares, except Class I. Under the Distribution Plans, the Fund is permitted to pay distribution fees at an annual rate of up to 0.75% of the average daily net assets for Class A shares and up to 1.00% of the average daily net assets for each of Class B, Class C and Class R shares. However, currently the distribution fees for Class A shares are limited to 0.25% of the average daily net assets of the class and the distribution fees for Class R shares are limited to 0.50% of the average daily net assets of Class R shares.
For the six months ended March 31, 2010, EIS received $17,763 from the sale of Class A shares and $1,882, $36,681 and $1,745 in contingent deferred sales charges from redemptions of Class A, Class B and Class C shares, respectively.
20
NOTES TO FINANCIAL STATEMENTS (unaudited) continued
5. INVESTMENT TRANSACTIONS
Cost of purchases and proceeds from sales of investment securities (excluding short-term securities) were $31,576,724 and $50,668,712, respectively, for the six months ended March 31, 2010.
Fair value measurements of investments are determined within a framework that has established a fair value hierarchy based upon the various data inputs utilized in determining the value of the Fund’s investments. These inputs are summarized into three broad levels as follows:
Level 1 – quoted prices in active markets for identical securities Level 2 – other significant observable inputs (including quoted prices for similar securities, interest rates, prepayment speeds, credit risk, etc.) Level 3 – significant unobservable inputs (including the Fund’s own assumptions in determining the fair value of investments) |
The inputs or methodologies used for valuing securities are not necessarily an indication of the risk associated with investing in those securities.
As of March 31, 2010, the inputs used in valuing the Fund’s assets, which are carried at fair value, were as follows:
Investments in Securities | | Quoted Prices
(Level 1) | | Significant
Other
Observable
Inputs
(Level 2) | | Significant
Unobservable
Inputs
(Level 3) | | Total | |
|
|
|
|
|
|
|
|
| |
Equity securities | | | | | | | | | | | |
Common stocks | | $ | 642,563,349 | | $0 | | $0 | | $ | 642,563,349 | |
Short-term investments | | | 43,846,005 | | 0 | | 0 | | | 43,846,005 | |
|
|
|
|
|
|
|
|
|
|
| |
| | $ | 686,409,354 | | $0 | | $0 | | $ | 686,409,354 | |
|
|
|
|
|
|
|
|
|
|
| |
Further details on the major security types listed above can be found in the Schedule of Investments.
During the six months ended March 31, 2010, the Fund loaned securities to certain brokers and earned $42,434, net of $4,800 paid to Wachovia Global Securities Lending as the securities lending agent. At March 31, 2010, the value of securities on loan and the total value of collateral received for securities loaned (including segregated cash) amounted to $40,591,198 and $41,872,726, respectively.
On March 31, 2010, the aggregate cost of securities for federal income tax purposes was $558,753,761. The gross unrealized appreciation and depreciation on securities based on tax cost was $153,176,197 and $25,520,604, respectively, with a net unrealized appreciation of $127,655,593.
21
NOTES TO FINANCIAL STATEMENTS (unaudited) continued
As of September 30, 2009, the Fund had $400,398,111 in capital loss carryovers for federal income tax purposes with $196,908,105 expiring in 2010, $199,421,027 expiring in 2011 and $4,068,979 expiring in 2017. Certain portions of the capital loss carryovers of the Fund were assumed as a result of acquisitions. These losses are subject to certain limitations prescribed by the Internal Revenue Code.
For income tax purposes, capital losses incurred after October 31 within the Fund’s fiscal year are deemed to arise on the first business day of the following fiscal year. As of September 30, 2009, the Fund incurred and elected to defer post-October losses of $31,899,202.
6. INTERFUND LENDING
Pursuant to an Exemptive Order issued by the SEC, the Fund may participate in an interfund lending program with certain funds in the Evergreen fund family. This program allows the Fund to borrow from, or lend money to, other participating funds. During the six months ended March 31, 2010, the Fund did not participate in the interfund lending program.
7. EXPENSE REDUCTIONS
Through expense offset arrangements with ESC and the Fund’s custodian, a portion of fund expenses has been reduced.
8. DEFERRED TRUSTEES’ FEES
Each Trustee of the Fund may defer any or all compensation related to performance of his or her duties as a Trustee. The Trustees’ deferred balances are allocated to deferral accounts, which are included in the accrued expenses for the Fund. The investment performance of the deferral accounts is based on the investment performance of certain Evergreen funds. Any gains earned or losses incurred in the deferral accounts are reported in the Fund’s Trustees’ fees and expenses. At the election of the Trustees, the deferral account will be paid either in one lump sum or in quarterly installments for up to ten years.
9. FINANCING AGREEMENT
The Fund and certain other Evergreen funds share in a $100 million unsecured revolving credit commitment for temporary and emergency purposes, including the funding of redemptions, as permitted by each participating fund’s borrowing restrictions. Borrowings under this facility bear interest at the higher of the Federal Funds rate plus 1.25% or LIBOR plus 1.25%. All of the participating funds are charged an annual commitment fee of 0.145% on the unused balance, which is allocated pro rata.
During the six months ended March 31, 2010, the Fund had average borrowings outstanding of $3,288 (on an annualized basis) at a rate of 1.46% and paid interest of $48.
22
NOTES TO FINANCIAL STATEMENTS (unaudited) continued
10. REGULATORY MATTERS AND LEGAL PROCEEDINGS
The Evergreen funds, EIMC and certain of EIMC’s affiliates are involved in various legal actions, including private litigation and class action lawsuits, and are and may in the future be subject to regulatory inquiries and investigations.
EIMC and EIS have reached final settlements with the Securities and Exchange Commission (“SEC”) and the Securities Division of the Secretary of the Commonwealth of Massachusetts (“Commonwealth”) primarily relating to the liquidation of Evergreen Ultra Short Opportunities Fund (“Ultra Short Fund”). The claims settled include the following: first, that during the period February 2007 through Ultra Short Fund’s liquidation on June 18, 2008, Ultra Short Fund’s former portfolio management team failed to properly take into account readily-available information in valuing certain non-agency residential mortgage-backed securities held by the Ultra Short Fund, resulting in the Ultra Short Fund’s net asset value (“NAV”) being overstated during the period; second, that EIMC and EIS acted inappropriately when, in an effort to explain the decline in Ultra Short Fund’s NAV, certain information regarding the decline was communicated to some, but not all, shareholders and financial intermediaries; third, that the Ultra Short Fund portfolio management team did not adhere to regulatory requirements for affiliated cross trades in executing trades with other Evergreen funds; and finally, that from at least September 2007 to August 2008, EIS did not preserve certain text and instant messages transmitted via personal digital assistant devices. In settling these matters, EIMC and EIS have agreed to payments totaling $41,125,000, up to $40,125,000 of which will be distributed to eligible shareholders of Ultra Short Fund pursuant to a methodology and plan approved by the regulators. EIMC and EIS neither admitted nor denied the regulators’ conclusions.
Three purported class actions have also been filed in the U.S. District Court for the District of Massachusetts relating to the same events; defendants include various Evergreen entities, including EIMC and EIS, and Evergreen Fixed Income Trust and its Trustees. The cases generally allege that investors in the Ultra Short Fund suffered losses as a result of (i) misleading statements in Ultra Short Fund’s registration statement and prospectus, (ii) the failure to accurately price securities in the Ultra Short Fund at different points in time and (iii) the failure of the Ultra Short Fund’s risk disclosures and description of its investment strategy to inform investors adequately of the actual risks of the fund.
EIMC does not expect that any of the legal actions, inquiries or settlement of regulatory matters will have a material adverse impact on the financial position or operations of the Fund to which these financial statements relate. Any publicity surrounding or resulting from any legal actions or regulatory inquiries involving EIMC or its affiliates or any of the Evergreen Funds could result in reduced sales or increased redemptions of Evergreen fund shares, which could increase Evergreen fund transaction costs or operating expenses or have other adverse consequences on the Evergreen funds, including the Fund.
23
NOTES TO FINANCIAL STATEMENTS (unaudited) continued
11. REORGANIZATION
At a meeting of the Board of Trustees held on December 30, 2009, the Trustees of the Fund approved a Plan of Reorganization (the “Plan”). Under the Plan, Wells Fargo Advantage Omega Growth Fund, which will be a series of Wells Fargo Funds Trust created in order to receive the assets of the Fund upon completion of the reorganization, will acquire the assets and assume the liabilities of the Fund in exchange for shares of Wells Fargo Advantage Omega Growth Fund.
A special meeting of shareholders of the Fund will be held in June 2010 to consider and vote on the Plan. In April 2010, materials for this meeting were mailed to shareholders of record on March 10, 2010. If approved by the shareholders at this meeting, the reorganization will take place in July 2010.
24
This page left intentionally blank
25
This page left intentionally blank
26
This page left intentionally blank
27
TRUSTEES AND OFFICERS
TRUSTEES1 | |
Dr. Leroy Keith, Jr.
Trustee
DOB: 2/14/1939
Term of office since: 1983
Other directorships: Trustee,
Phoenix Fund Complex
(consisting of 46 portfolios
as of 12/31/2009) | Chairman, Bloc Global Services (development and construction); Former Managing Director, Almanac Capital Management (commodities firm); Trustee, Phoenix Fund Complex; Director, Diversapack Co. (packaging company); Former Partner, Stonington Partners, Inc. (private equity fund); Former Director, Obagi Medical Products Co. |
|
|
Carol A. Kosel
Trustee
DOB: 12/25/1963
Term of office since: 2008
Other directorships: None | Former Consultant to the Evergreen Boards of Trustees; Former Vice President and Senior Vice President, Evergreen Investments, Inc.; Former Treasurer, Evergreen Funds; Former Treasurer, Vestaur Securities Fund |
|
|
Gerald M. McDonnell
Trustee
DOB: 7/14/1939
Term of office since: 1988
Other directorships: None | Consultant, Rock Hill Metals Consultants LLC (Metals Consultant to steel industry); Former Manager of Commercial Operations, CMC Steel (steel producer) |
|
|
Patricia B. Norris
Trustee
DOB: 4/9/1948
Term of office since: 2006
Other directorships: None | President and Director of Buckleys of Kezar Lake, Inc. (real estate company); Former President and Director of Phillips Pond Homes Association (home community); Former Partner, PricewaterhouseCoopers, LLP (independent registered public accounting firm) |
|
|
William Walt Pettit2
Trustee
DOB: 8/26/1955
Term of office since: 1988
Other directorships: None | Director, Rogers, Townsend & Thomas, PC (law firm); Director, Superior Packaging Corp. (packaging company); Member, Superior Land, LLC (real estate holding company), Member, K&P Development, LLC (real estate development); Former Vice President, Kellam & Pettit, P.A. (law firm); Former Director, National Kidney Foundation of North Carolina, Inc. (non-profit organization) |
|
|
David M. Richardson
Trustee
DOB: 9/19/1941
Term of office since: 1982
Other directorships: None | President, Richardson, Runden LLC (executive recruitment advisory services); Director, J&M Cumming Paper Co. (paper merchandising); Former Trustee, NDI Technologies, LLP (communications); Former Consultant, AESC (The Association of Executive Search Consultants) |
|
|
Russell A. Salton III, MD
Trustee
DOB: 6/2/1947
Term of office since: 1984
Other directorships: None | President/CEO, AccessOne MedCard, Inc. |
|
|
Michael S. Scofield
Trustee
DOB: 2/20/1943
Term of office since: 1984
Other directorships: None | Retired Attorney, Law Offices of Michael S. Scofield; Former Director and Chairman, Branded Media Corporation (multi-media branding company) |
|
|
Richard J. Shima
Trustee
DOB: 8/11/1939
Term of office since: 1993
Other directorships: None | Independent Consultant; Director, Hartford Hospital; Trustee, Greater Hartford YMCA; Former Director,Trust Company of CT; Former Trustee, Saint Joseph College (CT) |
|
|
28
TRUSTEES AND OFFICERS continued
Richard K. Wagoner, CFA3
Trustee
DOB: 12/12/1937
Term of office since: 1999
Other directorships: None | Member and Former President, North Carolina Securities Traders Association; Member, Financial Analysts Society |
|
|
OFFICERS | |
W. Douglas Munn4
President
DOB: 4/21/1963
Term of office since: 2009 | Principal occupations: President and Chief Executive Officer, Evergreen Investment Company, Inc.; Chief Operating Officer, Wells Fargo Funds Management, LLC; Former Chief Operating Officer, Evergreen Investment Company, Inc. |
|
|
Jeremy DePalma4
Treasurer
DOB: 2/5/1974
Term of office since: 2005 | Principal occupations: Senior Vice President, Evergreen Investment Management Company, LLC; Assistant Treasurer, Wells Fargo Advantage Funds; Former Vice President, Evergreen Investment Services, Inc.; Former Assistant Vice President, Evergreen Investment Services, Inc. |
|
|
Michael H. Koonce4
Secretary
DOB: 4/20/1960
Term of office since: 2000 | Principal occupations: Managing Counsel, Wells Fargo & Company; Secretary and Senior Vice President, Alternative Strategies Brokerage Services, Inc.; Evergreen Investment Services, Inc.; Secretary and Senior Vice President, Evergreen Investment Management Company, LLC and Evergreen Service Company, LLC |
|
|
Robert Guerin4
Chief Compliance Officer
DOB: 9/20/1965
Term of office since: 2007 | Principal occupations: Chief Compliance Officer, Evergreen Funds and Senior Vice President of Evergreen Investment Company, Inc.; Compliance Manager, Wells Fargo Funds Management Group; Former Managing Director and Senior Compliance Officer, Babson Capital Management LLC; Former Principal and Director, Compliance and Risk Management, State Street Global Advisors; Former Vice President and Manager, Sales Practice Compliance, Deutsche Asset Management |
|
|
1 | Each Trustee serves until a successor is duly elected or qualified or until his or her death, resignation, retirement or removal from office. Each Trustee oversaw 74 Evergreen funds as of December 31, 2009. Correspondence for each Trustee may be sent to Evergreen Board of Trustees, P.O. Box 20083, Charlotte, NC 28202. |
2 | It is possible that Mr. Pettit may be viewed as an “interested person” of the Evergreen funds, as defined in the 1940 Act, because of his law firm’s previous representation of affiliates of Wells Fargo & Company (“Wells Fargo”), the parent to the Evergreen funds’ investment advisor, EIMC. The Trustees are treating Mr. Pettit as an interested trustee for the time being. |
3 | Mr. Wagoner is an “interested person” of the Evergreen funds because of his ownership of shares in Wells Fargo & Company, the parent to the Evergreen funds’ investment advisor. |
4 | The address of the Officer is 200 Berkeley Street, Boston, MA 02116. |
Additional information about the Fund’s Board of Trustees and Officers can be found in the Statement of Additional Information (SAI) and is available upon request without charge by calling 800.343.2898.
29
122770 566382 rv7 05/2010
Evergreen Small-Mid Growth Fund
| | table of contents |
1 | | LETTER TO SHAREHOLDERS |
4 | | FUND AT A GLANCE |
6 | | ABOUT YOUR FUND’S EXPENSES |
7 | | FINANCIAL HIGHLIGHTS |
9 | | SCHEDULE OF INVESTMENTS |
13 | | STATEMENT OF ASSETS AND LIABILITIES |
14 | | STATEMENT OF OPERATIONS |
15 | | STATEMENTS OF CHANGES IN NET ASSETS |
16 | | NOTES TO FINANCIAL STATEMENTS |
24 | | TRUSTEES AND OFFICERS |
This semiannual report must be preceded or accompanied by a prospectus of the Evergreen fund contained herein. The prospectus contains more complete information, including fees and expenses, and should be read carefully before investing or sending money.
The fund will file its complete schedule of portfolio holdings with the SEC for the first and third quarters of each fiscal year on Form N-Q. The fund’s Form N-Q will be available on the SEC’s Web site at http://www.sec.gov. In addition, the fund’s Form N-Q may be reviewed and copied at the SEC’s Public Reference Room in Washington, D.C. Information on the operation of the Public Reference Room may be obtained by calling 800.SEC.0330.
A description of the fund’s proxy voting policies and procedures, as well as information regarding how the fund voted proxies relating to portfolio securities during the most recent 12-month period ended June 30, is available by visiting our Web site at EvergreenInvestments.com or by visiting the SEC’s Web site at http://www.sec.gov. The fund’s proxy voting policies and procedures are also available without charge, upon request, by calling 800.343.2898.
Mutual Funds:
| NOT FDIC INSURED | MAY LOSE VALUE | NOT BANK GUARANTEED |
Evergreen InvestmentsSM is a service mark of Evergreen Investment Management Company, LLC. Copyright 2010, Evergreen Investment Management Company, LLC.
Evergreen Investment Management Company, LLC, is a subsidiary of Wells Fargo & Company and is an affiliate of Wells Fargo & Company’s broker/dealer subsidiaries. Evergreen mutual funds are distributed by Wells Fargo Funds Distributor, LLC, Member FINRA/SIPC, an affiliate of Wells Fargo & Company.
LETTER TO SHAREHOLDERS
May 2010

W. Douglas Munn
President and Chief Executive Officer
Dear Valued Shareholder:
We are pleased to provide you with this semiannual report for Evergreen Small-Mid Growth Fund for the six-month period ended March 31, 2010 (the “period”).
Economic growth was strong throughout the period as the economic recovery appeared to gain momentum. Gross domestic product returned to positive growth in the third quarter of 2009, following four consecutive quarters of contraction for the first time in at least 60 years. The consensus among economists was that the recession that began in December 2007 had likely ended during the summer of 2009. However, with much of the growth attributable to government stimulus, questions remained over the sustainability of the recovery. By the end of the period, the National Bureau of Economic Research had not declared an official end to the recession.
Employment data turned positive during the period, a welcome sign that the economic recovery appeared to be moving toward self-sustainability. U.S. employers added 162,000 jobs in March 2010, the most in three years. The unemployment rate edged down to 9.7% in the final months of the period, after having peaked at 10.1% in October 2009—its highest level in more than 25 years. Other encouraging news in March included increases in temporary jobs, average hours worked, and manufacturing employment. Still, more than 8 million jobs were lost during the recession and the number of long-term unemployed—those out of work for 27 weeks or longer—continued to increase, ending the period at 6.5 million.
Other economic data continued to show additional signs of improvement. Industrial production, manufacturing, and consumer sentiment had all improved significantly as the period came to a close. Retail sales strengthened significantly during the period, with particular strength in March 2010. Although housing inventory and foreclosure rates remained elevated, home sales and prices began to show signs of improvement in many areas of the country—spurred in part by the government’s $8,000 tax credit for first-time home buyers, which was extended through the end of April 2010.
Despite extensive quantitative easing measures by the Federal Reserve Board (the “Fed”), bank lending remained constrained during the period. This indicates that the trillions of dollars of government stimulus that were added to the monetary system might not have an inflationary impact in the near term. Throughout the period, the Federal Open Market Committee (the “FOMC”) held the federal funds rate at the range of 0% to 0.25% that it first targeted in December 2008. The Fed did, however, begin to remove some of its unconventional stimulus measures. It concluded its purchases of longer-term Treasuries in October 2009 and mortgage-backed securities in March 2010.
1
LETTER TO SHAREHOLDERS continued
The FOMC’s final statement during the period noted that economic activity continued to strengthen, the labor market was stabilizing, business spending had risen significantly, and inflation remained subdued. However, the committee also noted that unemployment remained high and credit continued to be tight, reiterating that it was likely to keep the federal funds rate at exceptionally low levels for an extended period because of the continued substantial economic slack.
The strong rally in the equity markets continued during the period. The advance was interrupted only briefly by modest corrections in October 2009 and January 2010 due primarily to concerns about sovereign debt, with particular focus on Greece. The euro weakened significantly against the U.S. dollar as the European Union continued to debate potential support plans for Greece throughout the period.
Despite the macroeconomic concerns, strong corporate earnings reports throughout the period provided support for the equity markets to continue to move higher. Companies in the S&P 500® Index exceeded analysts’ earnings estimates at a pace of nearly 80% in the third quarter of 2009 and more than 70% in the fourth quarter of 2009. Other than brief spikes in market volatility in late October and early January, volatility, as measured by the Chicago Board Options Exchange Volatility Index (VIX), declined over the course of the period, ending at its lowest level since early 2008. Among major stock-market indices, the S&P 500® Index gained 10.6% during the period, and the Dow Jones Industrial Average rose 11.8%. The tech-heavy Nasdaq Composite Index advanced 12.9%, as the information technology sector remained one of the strongest-performing sectors.
Over the period, mid cap stocks outpaced both large cap and small cap stocks, which had similar returns, as measured by the Russell indices. The Russell Midcap Index rose 14.6%, while the Russell 1000 Index of large cap stocks advanced 11.7% and the Russell 2000 Index of small cap stocks gained 11.9%. Performance leadership between the growth and value investment styles was mixed according to market capitalization during the period. Among large cap stocks, the growth style significantly outpaced value. Conversely, value modestly outpaced growth among small cap stocks.
During the period, the management teams of Evergreen’s growth-oriented equity funds maintained their pursuit of capital appreciation, focusing on bottom-up, fundamental analysis in making individual stock selections consistent with the investment discipline and style of each fund. The manager of Evergreen Large Company Growth Fund and Evergreen Omega Fund pursued a small number of companies with the potential to sustain above-average growth for long-term cash flows. The management of Evergreen Strategic Growth Fund sought large cap companies offering superior long-term growth potential. The portfolio managers of Evergreen Mid Cap Growth Fund and Evergreen Small-Mid Growth Fund aimed to balance each portfolio with exposure both to
2
LETTER TO SHAREHOLDERS continued
consistent growth companies and to companies offering attractive intrinsic value. At the same time, managers of Evergreen Growth Fund concentrated on opportunities among small cap growth companies with above-average earnings prospects and reasonable stock valuations.
We believe the changing conditions in the investment environment over the period have underscored the value of a well-diversified, long-term investment strategy to help soften the effects of volatility in any one market or asset class. As always, we encourage investors to maintain diversified investment portfolios in pursuit of their long-term investment goals.
Please visit us at EvergreenInvestments.com for more information about our funds and other investment products available to you. Thank you for your continued support of Evergreen Investments.
Sincerely,

W. Douglas Munn
President and Chief Executive Officer
Evergreen Funds
Notice to Shareholders:
The Evergreen Funds’ Board of Trustees has unanimously approved the reorganizations of the Evergreen Funds, including the Fund in this report, into Wells Fargo Advantage Funds®. Each reorganization is subject to the satisfaction of a number of conditions, including approval by the Evergreen Fund’s shareholders at a meeting expected to be held in June 2010. It is anticipated that the reorganizations, if they are approved by shareholders and all conditions to the closing are satisfied, will occur in July 2010. Additional information, including a description of the applicable reorganization and information about fees, expenses, and risk factors, will be provided to shareholders of each Evergreen Fund in a Prospectus/Proxy Statement that was mailed in April 2010.
The foregoing is not an offer to sell, nor is it a solicitation of an offer to buy, shares of any Wells Fargo Advantage Fund, nor is it a solicitation of any proxy. For more information, or to receive a free copy of the Prospectus/Proxy Statement once a registration statement relating to a proposed reorganization has been filed with the Securities and Exchange Commission and becomes effective, please call 1.800.343.2898 or visit Evergreeninvestments.com. The Prospectus/Proxy Statement will also be available for free on the Securities and Exchange Commission’s website (www.sec.gov). Please read the Prospectus/Proxy Statement carefully before making any investment decisions.
3
FUND AT A GLANCE
as of March 31, 2010
MANAGEMENT TEAM
Investment Advisor:
Evergreen Investment Management Company, LLC
Portfolio Managers:
Robert C. Junkin, CPA; Lori S. Evans; Julian J. Johnson
CURRENT INVESTMENT STYLE

Source: Morningstar, Inc.
Morningstar’s style box is based on a portfolio date as of 3/31/2010.
The Equity style box placement is based on 10 growth and valuation measures for each fund holding and the median size of the companies in which the fund invests.
PERFORMANCE AND RETURNS
Portfolio inception date: 10/11/2005
| Class A | Class I |
Class inception date | 10/11/2005 | 10/11/2005 |
|
|
|
Nasdaq symbol | ESMGX | ESMIX |
|
|
|
6-month return with sales charge | 4.96% | N/A |
|
|
|
6-month return w/o sales charge | 11.37% | 11.56% |
|
|
|
Average annual return* | | |
|
|
|
1-year with sales charge | 39.58% | N/A |
|
|
|
1-year w/o sales charge | 48.13% | 48.70% |
|
|
|
Since portfolio inception | 4.87% | 6.53% |
|
|
|
Maximum sales charge | 5.75% | N/A |
| Front-end | |
|
|
|
* | Adjusted for maximum applicable sales charge, unless noted. |
Past performance is no guarantee of future results. The performance quoted represents past performance and current performance may be lower or higher. The investment return and principal value of an investment will fluctuate so that investors’ shares, when redeemed, may be worth more or less than their original cost. To obtain performance information current to the most recent month-end for Classes A or I, please go to EvergreenInvestments.com/fundperformance. The performance of each class may vary based on differences in loads, fees and expenses paid by the shareholders investing in each class. Performance includes the reinvestment of income dividends and capital gain distributions. Performance shown does not reflect the deduction of taxes that a shareholder would pay on fund distributions or the redemption of fund shares.
Please keep in mind that high double-digit returns were primarily achieved during favorable market conditions. You should not expect that such favorable returns can be consistently achieved. A Fund’s performance, especially for very short time periods, should not be the sole factor in making your investment decision.
The fund incurs a 12b-1 fee of 0.25% for Class A. Class I does not pay a 12b-1 fee.
The advisor is waiving a portion of its advisory fee. Had the fee not been waived, returns would have been lower. Returns reflect expense limits previously in effect for Class A, without which returns for Class A would have been lower.
4
FUND AT A GLANCE continued
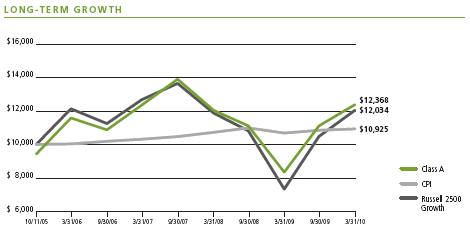
Comparison of a $10,000 investment in the Evergreen Small-Mid Growth Fund Class A shares, reflective of maximum applicable sales charge, versus a similar investment in the Russell 2500 Growth Index (Russell 2500 Growth) and the Consumer Price Index (CPI).
The Russell 2500 Growth is an unmanaged market index and does not include transaction costs associated with buying and selling securities, any mutual fund fees or expenses or any taxes. The CPI is a commonly used measure of inflation and does not represent an investment return. It is not possible to invest directly in an index.
Class I shares are only offered, subject to the minimum initial purchase requirements, in the following manner: (1) to investment advisory clients of EIMC (or its advisory affiliates), (2) to employer- or state-sponsored benefit plans, including but not limited to, retirement plans, defined benefit plans, deferred compensation plans, or savings plans, (3) to fee-based mutual fund wrap accounts, (4) through arrangements entered into on behalf of the Evergreen funds with certain financial services firms, (5) to certain institutional investors, and (6) to persons who owned Class Y shares in registered name in an Evergreen fund on or before December 31, 1994 or who owned shares of any SouthTrust fund in registered name as of March 18, 2005 or who owned shares of Vestaur Securities Fund as of May 20, 2005.
Class I shares are only available to institutional shareholders with a minimum of $1 million investment, which may be waived in certain situations.
The fund’s investment objective may be changed without a vote of the fund’s shareholders.
Small and mid cap securities may be subject to special risks associated with narrower product lines and limited financial resources compared to their large cap counterparts, and, as a result, small and mid cap securities may decline significantly in market downturns and may be more volatile than those of larger companies due to the higher risk of failure.
All data is as of March 31, 2010, and subject to change.
5
ABOUT YOUR FUND’S EXPENSES
The Example below is intended to describe the fees and expenses borne by shareholders and the impact of those costs on your investment.
Example
As a shareholder of the fund, you incur two types of costs: (1) transaction costs, including sales charges (loads), redemption fees and exchange fees; and (2) ongoing costs, including management fees, distribution (12b-1) fees and other fund expenses. This Example is intended to help you understand your ongoing costs (in dollars) of investing in the fund and to compare these costs with the ongoing costs of investing in other mutual funds. The Example is based on an investment of $1,000 invested at the beginning of the period and held for the entire period from October 1, 2009 to March 31, 2010.
The example illustrates your fund’s costs in two ways:
• Actual expenses
The section in the table under the heading “Actual” provides information about actual account values and actual expenses. You may use the information in these columns, together with the amount you invested, to estimate the expenses that you paid over the period. Simply divide your account value by $1,000 (for example, an $8,600 account value divided by $1,000 = 8.6), then multiply the result by the number in the appropriate column for your share class, in the column entitled “Expenses Paid During Period” to estimate the expenses you paid on your account during this period.
• Hypothetical example for comparison purposes
The section in the table under the heading “Hypothetical (5% return before expenses)” provides information about hypothetical account values and hypothetical expenses based on the fund’s actual expense ratio and an assumed rate of return of 5% per year before expenses, which is not the fund’s actual return. The hypothetical account values and expenses may not be used to estimate the actual ending account balance or expenses you paid for the period. You may use this information to compare the ongoing costs of investing in the fund and other funds. To do so, compare this 5% hypothetical example with the 5% hypothetical examples that appear in the shareholder reports of the other funds.
Please note that the expenses shown in the table are meant to highlight your ongoing costs only and do not reflect any transactional costs, such as sales charges (loads), redemption fees or exchange fees. Therefore, the section in the table under the heading “Hypothetical (5% return before expenses)” is useful in comparing ongoing costs only, and will not help you determine the relative total costs of owning different funds. In addition, if these transactional costs were included, your costs would have been higher.
| Beginning
Account Value
10/1/2009 | Ending
Account Value
3/31/2010 | Expenses Paid
During Period* |
|
|
|
|
Actual | | | |
Class A | $1,000.00 | $1,113.72 | $6.43 |
Class I | $1,000.00 | $1,115.56 | $5.12 |
Hypothetical | | | |
(5% return before expenses) | | | |
Class A | $1,000.00 | $1,018.85 | $6.14 |
Class I | $1,000.00 | $1,020.09 | $4.89 |
|
|
|
|
* | For each class of the fund, expenses are equal to the annualized expense ratio of each class (1.22% for Class A and 0.97% for Class I), multiplied by the average account value over the period, multiplied by 182 / 365 days. |
6
FINANCIAL HIGHLIGHTS
(For a share outstanding throughout each period)
| | Six Months Ended | | Year Ended September 30, | |
| | March 31, 2010 | |
| |
CLASS A | | (unaudited) | | 2009 | | 2008 | | 2007 | | 20061 | |
|
|
|
|
|
|
|
|
|
|
| |
Net asset value, beginning of period | | $ | 10.64 | | $ | 10.64 | | $ | 14.73 | | $ | 11.53 | | $ | 10.00 | |
|
|
|
|
|
|
|
|
|
|
|
|
|
|
|
| |
Income from investment operations | | | | | | | | | | | | | | | | |
Net investment loss | | | (0.04 | ) | | (0.05 | ) | | (0.08 | ) | | (0.11 | )2 | | (0.05 | ) |
Net realized and unrealized gains or losses on investments | | | 1.25 | | | 0.05 | | | (2.59 | ) | | 3.31 | | | 1.58 | |
| |
|
|
|
|
|
|
|
|
|
|
|
|
|
| |
Total from investment operations | | | 1.21 | | | 0 | | | (2.67 | ) | | 3.20 | | | 1.53 | |
|
|
|
|
|
|
|
|
|
|
|
|
|
|
|
| |
Distributions to shareholders from | | | | | | | | | | | | | | | | |
Net realized gains | | | 0 | | | 0 | | | (1.36 | ) | | 0 | | | 0 | |
Tax basis return of capital | | | 0 | | | 0 | | | (0.06 | ) | | 0 | | | 0 | |
| |
|
|
|
|
|
|
|
|
|
|
|
|
|
| |
Total distributions to shareholders | | | 0 | | | 0 | | | (1.42 | ) | | 0 | | | 0 | |
|
|
|
|
|
|
|
|
|
|
|
|
|
|
|
| |
Net asset value, end of period | | $ | 11.85 | | $ | 10.64 | | $ | 10.64 | | $ | 14.73 | | $ | 11.53 | |
|
|
|
|
|
|
|
|
|
|
|
|
|
|
|
| |
Total return3 | | | 11.37 | % | | 0 | % | | (20.01 | )% | | 27.75 | % | | 15.30 | % |
|
|
|
|
|
|
|
|
|
|
|
|
|
|
|
| |
Ratios and supplemental data | | | | | | | | | | | | | | | | |
Net assets, end of period (thousands) | | $ | 26,597 | | $ | 24,441 | | $ | 26,497 | | $ | 45,706 | | $ | 3 | |
Ratios to average net assets | | | | | | | | | | | | | | | | |
Expenses including waivers/reimbursements but excluding expense reductions | | | 1.22 | %4 | | 1.22 | % | | 1.18 | % | | 1.17 | % | | 1.18 | %4, 5 |
Expenses excluding waivers/reimbursements and expense reductions | | | 1.50 | %4 | | 1.69 | % | | 1.33 | % | | 1.28 | % | | 1.99 | %4 |
Net investment loss | | | (0.67 | )%4 | | (0.55 | )% | | (0.48 | )% | | (0.79 | )% | | (0.66 | )%4 |
Portfolio turnover rate | | | 26 | % | | 69 | % | | 129 | % | | 192 | % | | 132 | % |
|
|
|
|
|
|
|
|
|
|
|
|
|
|
|
| |
1 | For the period from October 11, 2005 (commencement of class operations), to September 30, 2006. |
2 | Per share amount is based on average shares outstanding during the period. |
3 | Excluding applicable sales charges |
5 | Including the expense reductions, the ratio would be 1.17%. |
See Notes to Financial Statements
7
FINANCIAL HIGHLIGHTS
(For a share outstanding throughout each period)
| | Six Months Ended | | Year Ended September 30, | |
| | March 31, 2010 | |
| |
CLASS I | | (unaudited) | | 2009 | | 2008 | | 2007 | | 20061 | |
|
|
|
|
|
|
|
|
|
|
| |
Net asset value, beginning of period | | $ | 10.73 | | $ | 10.71 | | $ | 14.77 | | $ | 11.54 | | $ | 10.00 | |
|
|
|
|
|
|
|
|
|
|
|
|
|
|
|
| |
Income from investment operations | | | | | | | | | | | | | | | | |
Net investment loss | | | (0.02 | )2 | | (0.04 | ) | | (0.03 | )2 | | (0.06 | )2 | | (0.02 | ) |
Net realized and unrealized gains or losses on investments | | | 1.26 | | | 0.06 | | | (2.61 | ) | | 3.30 | | | 1.56 | |
| |
|
|
|
|
|
|
|
|
|
|
|
|
|
| |
Total from investment operations | | | 1.24 | | | 0.02 | | | (2.64 | ) | | 3.24 | | | 1.54 | |
|
|
|
|
|
|
|
|
|
|
|
|
|
|
|
| |
Distributions to shareholders from | | | | | | | | | | | | | | | | |
Net investment income | | | 0 | | | 0 | | | 0 | | | (0.01 | ) | | 0 | |
Net realized gains | | | 0 | | | 0 | | | (1.36 | ) | | 0 | | | 0 | |
Tax basis return of capital | | | 0 | | | 0 | | | (0.06 | ) | | 0 | | | 0 | |
| |
|
|
|
|
|
|
|
|
|
|
|
|
|
| |
Total distributions to shareholders | | | 0 | | | 0 | | | (1.42 | ) | | (0.01 | ) | | 0 | |
|
|
|
|
|
|
|
|
|
|
|
|
|
|
|
| |
Net asset value, end of period | | $ | 11.97 | | $ | 10.73 | | $ | 10.71 | | $ | 14.77 | | $ | 11.54 | |
|
|
|
|
|
|
|
|
|
|
|
|
|
|
|
| |
Total return | | | 11.56 | % | | 0.19 | % | | (19.72 | )% | | 28.11 | % | | 15.40 | % |
|
|
|
|
|
|
|
|
|
|
|
|
|
|
|
| |
Ratios and supplemental data | | | | | | | | | | | | | | | | |
Net assets, end of period (thousands) | | $ | 16,365 | | $ | 24,710 | | $ | 17,489 | | $ | 140,931 | | $ | 22,429 | |
Ratios to average net assets | | | | | | | | | | | | | | | | |
Expenses including waivers/reimbursements but excluding expense reductions | | | 0.97 | %3 | | 0.97 | % | | 0.92 | % | | 0.92 | % | | 0.93 | %3, 4 |
Expenses excluding waivers/reimbursements and expense reductions | | | 1.25 | %3 | | 1.44 | % | | 1.04 | % | | 0.98 | % | | 1.74 | %3 |
Net investment loss | | | (0.42 | )%3 | | (0.35 | )% | | (0.27 | )% | | (0.42 | )% | | (0.37 | )%3 |
Portfolio turnover rate | | | 26 | % | | 69 | % | | 129 | % | | 192 | % | | 132 | % |
|
|
|
|
|
|
|
|
|
|
|
|
|
|
|
| |
1 | For the period from October, 11, 2005 (commencement of class operations), to September 30, 2006. |
2 | Per share amount is based on average shares outstanding during the period. |
4 | Including the expense reductions, the ratio would be 0.92%. |
See Notes to Financial Statements
8
SCHEDULE OF INVESTMENTS
March 31, 2010 (unaudited)
| | |
Shares
| | |
Value
| |
|
|
|
|
|
|
| |
COMMON STOCKS 94.8% | | | | | | | |
CONSUMER DISCRETIONARY 23.6% | | | | | | | |
Diversified Consumer Services 4.2% | | | | | | | |
Capella Education Co. * | | | 10,857 | | $ | 1,007,964 | |
Strayer Education, Inc. ρ | | | 3,200 | | | 779,264 | |
| | | | |
|
| |
| | | | | | 1,787,228 | |
| | | | |
|
| |
Hotels, Restaurants & Leisure 3.6% | | | | | | | |
Buffalo Wild Wings, Inc. * | | | 20,148 | | | 969,320 | |
Penn National Gaming, Inc. * | | | 20,300 | | | 564,340 | |
| | | | |
|
| |
| | | | | | 1,533,660 | |
| | | | |
|
| |
Internet & Catalog Retail 2.5% | | | | | | | |
priceline.com, Inc. * | | | 4,300 | | | 1,096,500 | |
| | | | |
|
| |
Specialty Retail 7.6% | | | | | | | |
Aeropostale, Inc. * | | | 29,000 | | | 836,070 | |
Chico’s FAS, Inc. * | | | 61,200 | | | 882,504 | |
Guess?, Inc. | | | 21,200 | | | 995,976 | |
O’Reilly Automotive, Inc. * | | | 13,200 | | | 550,572 | |
| | | | |
|
| |
| | | | | | 3,265,122 | |
| | | | |
|
| |
Textiles, Apparel & Luxury Goods 5.7% | | | | | | | |
Hanesbrands, Inc. * | | | 44,500 | | | 1,237,990 | |
Lululemon Athletica, Inc ρ * | | | 29,000 | | | 1,203,500 | |
| | | | |
|
| |
| | | | | | 2,441,490 | |
| | | | |
|
| |
CONSUMER STAPLES 1.9% | | | | | | | |
Personal Products 1.9% | | | | | | | |
Alberto-Culver Co. | | | 30,600 | | | 800,190 | |
| | | | |
|
| |
ENERGY 6.1% | | | | | | | |
Oil, Gas & Consumable Fuels 6.1% | | | | | | | |
Continental Resources, Inc. * | | | 24,400 | | | 1,038,220 | |
Denbury Resources, Inc. * | | | 40,477 | | | 682,847 | |
Southwestern Energy Co. * | | | 21,756 | | | 885,904 | |
| | | | |
|
| |
| | | | | | 2,606,971 | |
| | | | |
|
| |
FINANCIALS 3.4% | | | | | | | |
Capital Markets 2.1% | | | | | | | |
INVESCO, Ltd. | | | 40,900 | | | 896,119 | |
| | | | |
|
| |
Thrifts & Mortgage Finance 1.3% | | | | | | | |
NewAlliance Bancshares, Inc. | | | 46,600 | | | 588,092 | |
| | | | |
|
| |
HEALTH CARE 16.7% | | | | | | | |
Biotechnology 4.0% | | | | | | | |
Alexion Pharmaceuticals, Inc. * | | | 13,400 | | | 728,558 | |
Cephalon, Inc. * | | | 8,200 | | | 555,796 | |
Myriad Genetics, Inc. * | | | 17,900 | | | 430,495 | |
| | | | |
|
| |
| | | | | | 1,714,849 | |
| | | | |
|
| |
See Notes to Financial Statements
9
SCHEDULE OF INVESTMENTS continued
March 31, 2010 (unaudited)
| | |
Shares
| | |
Value
| |
|
|
|
|
|
|
| |
COMMON STOCKS continued | | | | | | | |
HEALTH CARE continued | | | | | | | |
Health Care Equipment & Supplies 3.1% | | | | | | | |
ArthroCare Corp. * | | | 15,500 | | $ | 460,660 | |
ResMed, Inc. * | | | 13,800 | | | 878,370 | |
| | | | |
|
| |
| | | | | | 1,339,030 | |
| | | | |
|
| |
Life Sciences Tools & Services 3.6% | | | | | | | |
AMAG Pharmaceuticals, Inc. * ρ | | | 9,800 | | | 342,118 | |
Life Technologies Corp. * | | | 8,200 | | | 428,614 | |
Qiagen NV * ρ | | | 33,700 | | | 774,763 | |
| | | | |
|
| |
| | | | | | 1,545,495 | |
| | | | |
|
| |
Pharmaceuticals 6.0% | | | | | | | |
King Pharmaceuticals, Inc. * | | | 52,800 | | | 620,928 | |
MAP Pharmaceuticals, Inc. * | | | 28,600 | | | 454,454 | |
Shire, Ltd., ADS | | | 11,500 | | | 758,540 | |
Warner Chilcott plc * | | | 28,900 | | | 738,395 | |
| | | | |
|
| |
| | | | | | 2,572,317 | |
| | | | |
|
| |
INDUSTRIALS 12.9% | | | | | | | |
Commercial Services & Supplies 1.0% | | | | | | | |
EnerNOC, Inc. * ρ | | | 14,100 | | | 418,488 | |
| | | | |
|
| |
Electrical Equipment 5.3% | | | | | | | |
EnerSys, Inc. * | | | 17,300 | | | 426,618 | |
General Cable Corp. * | | | 22,200 | | | 599,400 | |
GrafTech International, Ltd. * | | | 30,600 | | | 418,302 | |
Roper Industries, Inc. | | | 14,740 | | | 852,562 | |
| | | | |
|
| |
| | | | | | 2,296,882 | |
| | | | |
|
| |
Machinery 3.5% | | | | | | | |
Manitowoc Co. | | | 68,300 | | | 887,900 | |
Wabtec | | | 14,300 | | | 602,316 | |
| | | | |
|
| |
| | | | | | 1,490,216 | |
| | | | |
|
| |
Professional Services 1.2% | | | | | | | |
Dun & Bradstreet Corp. | | | 7,100 | | | 528,382 | |
| | | | |
|
| |
Trading Companies & Distributors 1.9% | | | | | | | |
MSC Industrial Direct Co., Class A | | | 16,325 | | | 828,004 | |
| | | | |
|
| |
INFORMATION TECHNOLOGY 24.3% | | | | | | | |
Communications Equipment 4.4% | | | | | | | |
F5 Networks, Inc. * | | | 17,957 | | | 1,104,535 | |
NICE-Systems, Ltd., ADS * | | | 25,108 | | | 797,179 | |
| | | | |
|
| |
| | | | | | 1,901,714 | |
| | | | |
|
| |
See Notes to Financial Statements
10
SCHEDULE OF INVESTMENTS continued
March 31, 2010 (unaudited)
| | |
Shares
| | |
Value
| |
|
|
|
|
|
|
| |
COMMON STOCKS continued | | | | | | | |
INFORMATION TECHNOLOGY continued | | | | | | | |
Computers & Peripherals 2.6% | | | | | | | |
Quantum Corp. * | | | 235,600 | | $ | 619,628 | |
Synaptics, Inc. * ρ | | | 17,500 | | | 483,175 | |
| | | | |
|
| |
| | | | | | 1,102,803 | |
| | | | |
|
| |
Electronic Equipment, Instruments & Components 3.7% | | | | | | | |
Flir Systems, Inc. * | | | 26,400 | | | 744,480 | |
Itron, Inc. * | | | 11,832 | | | 858,648 | |
| | | | |
|
| |
| | | | | | 1,603,128 | |
| | | | |
|
| |
Internet Software & Services 1.4% | | | | | | | |
VistaPrint, Ltd. * | | | 10,100 | | | 578,225 | |
| | | | |
|
| |
IT Services 2.1% | | | | | | | |
Syntel, Inc. | | | 23,369 | | | 899,006 | |
| | | | |
|
| |
Semiconductors & Semiconductor Equipment 7.7% | | | | | | | |
Monolithic Power Systems, Inc. * | | | 31,894 | | | 711,236 | |
NetLogic Microsystems, Inc. * | | | 45,800 | | | 1,347,894 | |
Power Integrations, Inc. * | | | 30,500 | | | 1,256,600 | |
| | | | |
|
| |
| | | | | | 3,315,730 | |
| | | | |
|
| |
Software 2.4% | | | | | | | |
Ansys, Inc. * | | | 23,800 | | | 1,026,732 | |
| | | | |
|
| |
MATERIALS 4.1% | | | | | | | |
Chemicals 3.2% | | | | | | | |
CF Industries Holdings, Inc. | | | 6,500 | | | 592,670 | |
Scotts Miracle-Gro Co., Class A | | | 17,000 | | | 787,950 | |
| | | | |
|
| |
| | | | | | 1,380,620 | |
| | | | |
|
| |
Metals & Mining 0.9% | | | | | | | |
Steel Dynamics, Inc. | | | 22,100 | | | 386,087 | |
| | | | |
|
| |
TELECOMMUNICATION SERVICES 1.8% | | | | | | | |
Wireless Telecommunication Services 1.8% | | | | | | | |
NII Holdings, Inc. * | | | 19,000 | | | 791,540 | |
| | | | |
|
| |
Total Common Stocks (cost $30,335,341) | | | | | | 40,734,620 | |
| | | | |
|
| |
EXCHANGE TRADED FUND 3.5% | | | | | | | |
iShares Russell 2000 Growth Index Fund ρ (cost $1,366,874) | | | 20,657 | | | 1,512,919 | |
| | | | |
|
| |
SHORT-TERM INVESTMENTS 14.3% | | | | | | | |
MUTUAL FUND SHARES 14.3% | | | | | | | |
BlackRock Liquidity TempFund, Institutional Class, 0.12% q ρρ | | | 2,189,599 | | | 2,189,599 | |
Evergreen Institutional Money Market Fund, Class I , 0.01% q ρρ ø | | | 1,793,972 | | | 1,793,972 | |
Morgan Stanley Institutional Liquidity Fund Money Market Portfolio, Institutional Class, 0.12% q ρρ | | | 2,163,817 | | | 2,163,817 | |
| | | | |
|
| |
Total Short-Term Investments (cost $6,147,388) | | | | | | 6,147,388 | |
| | | | |
|
| |
See Notes to Financial Statements
11
SCHEDULE OF INVESTMENTS continued
March 31, 2010 (unaudited)
| | | | | |
Value
| |
|
|
|
|
|
|
| |
Total Investments (cost $37,849,603) 112.6% | | | | | $ | 48,394,927 | |
Other Assets and Liabilities (12.6%) | | | | | | (5,432,674 | ) |
| | | | |
|
| |
Net Assets 100.0% | | | | | $ | 42,962,253 | |
| | | | |
|
| |
* | Non-income producing security |
ρ | All or a portion of this security is on loan. |
q | Rate shown is the 7-day annualized yield at period end. |
ρρ | All or a portion of this security represents investment of cash collateral received from securities on loan. |
ø | Evergreen Investment Management Company, LLC is the investment advisor to both the Fund and the money market fund. |
Summary of Abbreviations |
ADS | American Depository Shares |
The following table shows the percent of total long-term investments by sector as of March 31, 2010:
Information Technology | | 24.7 | % |
Consumer Discretionary | | 23.9 | % |
Health Care | | 17.0 | % |
Industrials | | 13.2 | % |
Energy | | 6.2 | % |
Materials | | 4.2 | % |
Financials | | 3.5 | % |
Consumer Staples | | 1.9 | % |
Telecommunication Services | | 1.8 | % |
Other | | 3.6 | % |
| |
| |
| | 100.0 | % |
| |
| |
See Notes to Financial Statements
12
STATEMENT OF ASSETS AND LIABILITIES
March 31, 2010 (unaudited)
Assets | | | | |
Investments in unaffiliated issuers, at value (cost $36,055,631) including $5,022,760 of securities loaned | | $ | 46,600,955 | |
Investments in affiliated issuers, at value (cost $1,793,972) | | | 1,793,972 | |
|
|
|
| |
Total investments | | | 48,394,927 | |
Cash | | | 26,737 | |
Segregated cash | | | 1,766 | |
Receivable for Fund shares sold | | | 10,559 | |
Dividends receivable | | | 10,664 | |
Receivable for securities lending income | | | 6,548 | |
Prepaid expenses and other assets | | | 30,061 | |
|
|
|
| |
Total assets | | | 48,481,262 | |
|
|
|
| |
Liabilities | | | | |
Payable for Fund shares redeemed | | | 301,717 | |
Payable for securities on loan | | | 5,194,141 | |
Advisory fee payable | | | 535 | |
Distribution Plan expenses payable | | | 183 | |
Due to other related parties | | | 684 | |
Accrued expenses and other liabilities | | | 21,749 | |
|
|
|
| |
Total liabilities | | | 5,519,009 | |
|
|
|
| |
Net assets | | $ | 42,962,253 | |
|
|
|
| |
Net assets represented by | | | | |
Paid-in capital | | $ | 40,217,513 | |
Undistributed net investment loss | | | (132,736 | ) |
Accumulated net realized losses on investments | | | (7,667,848 | ) |
Net unrealized gains on investments | | | 10,545,324 | |
|
|
|
| |
Total net assets | | $ | 42,962,253 | |
|
|
|
| |
Net assets consists of | | | | |
Class A | | $ | 26,596,900 | |
Class I | | | 16,365,353 | |
|
|
|
| |
Total net assets | | $ | 42,962,253 | |
|
|
|
| |
Shares outstanding (unlimited number of shares authorized) | | | | |
Class A | | | 2,244,222 | |
Class I | | | 1,367,039 | |
|
|
|
| |
Net asset value per share | | | | |
Class A | | $ | 11.85 | |
Class A — Offering price (based on sales charge of 5.75%) | | $ | 12.57 | |
Class I | | $ | 11.97 | |
|
|
|
| |
See Notes to Financial Statements
13
STATEMENT OF OPERATIONS
Six Months Ended March 31, 2010 (unaudited)
Investment income | | | | |
Dividends | | $ | 83,931 | |
Securities lending | | | 47,985 | |
Income from affiliated issuers | | | 288 | |
|
|
|
| |
Total investment income | | | 132,204 | |
|
|
|
| |
Expenses | | | | |
Advisory fee | | | 168,144 | |
Distribution Plan expenses | | | 31,282 | |
Administrative services fee | | | 24,020 | |
Transfer agent fees | | | 49,937 | |
Trustees’ fees and expenses | | | 1,327 | |
Printing and postage expenses | | | 10,768 | |
Custodian and accounting fees | | | 8,869 | |
Registration and filing fees | | | 24,245 | |
Professional fees | | | 12,119 | |
Interest expense | | | 120 | |
Other | | | 565 | |
|
|
|
| |
Total expenses | | | 331,396 | |
Less: Expense reductions | | | (5 | ) |
Fee waivers | | | (66,990 | ) |
|
|
|
| |
Net expenses | | | 264,401 | |
|
|
|
| |
Net investment loss | | | (132,197 | ) |
|
|
|
| |
Net realized and unrealized gains or losses on investments | | | | |
Net realized gains on securities in unaffiliated issuers | | | 2,236,699 | |
Net change in unrealized gains or losses on securities in unaffiliated issuers | | | 3,213,060 | |
|
|
|
| |
Net realized and unrealized gains or losses on investments | | | 5,449,759 | |
|
|
|
| |
Net increase in net assets resulting from operations | | $ | 5,317,562 | |
|
|
|
| |
See Notes to Financial Statements
14
STATEMENTS OF CHANGES IN NET ASSETS
| | Six Months Ended | | | |
| | March 31, 2010 | | Year Ended | |
| | (unaudited) | | September 30, 2009 | |
|
|
|
|
| |
Operations | | | | | | | | | | | |
Net investment loss | | | | $ | (132,197 | ) | | | $ | (168,597 | ) |
Net realized gains or losses on investments | | | | | 2,236,699 | | | | | (8,924,992 | ) |
Net change in unrealized gains or losses on investments | | | | | 3,213,060 | | | | | 10,080,296 | |
|
|
|
|
|
|
|
|
|
|
| |
Net increase in net assets resulting from operations | | | | | 5,317,562 | | | | | 986,707 | |
|
|
|
|
|
|
|
|
|
|
| |
| | Shares | | | | | Shares | | | | |
|
|
|
|
|
|
|
|
|
|
| |
Capital share transactions | | | | | | | | | | | |
Proceeds from shares sold | | | | | | | | | | | |
Class A | | 157,066 | | | 1,733,594 | | 338,880 | | | 3,116,497 | |
Class I | | 212,637 | | | 2,319,753 | | 1,457,647 | | | 12,523,625 | |
|
|
|
|
|
|
|
|
|
|
| |
| | | | | 4,053,347 | | | | | 15,640,122 | |
|
|
|
|
|
|
|
|
|
|
| |
Payment for shares redeemed | | | | | | | | | | | |
Class A | | (210,441 | ) | | (2,320,809 | ) | (531,015 | ) | | (4,498,432 | ) |
Class I | | (1,148,075 | ) | | (13,239,625 | ) | (788,731 | ) | | (6,962,493 | ) |
|
|
|
|
|
|
|
|
|
|
| |
| | | | | (15,560,434 | ) | | | | (11,460,925 | ) |
|
|
|
|
|
|
|
|
|
|
| |
Net increase (decrease) in net assets resulting from capital share transactions | | | | | (11,507,087 | ) | | | | 4,179,197 | |
|
|
|
|
|
|
|
|
|
|
| |
Total increase (decrease) in net assets | | | | | (6,189,525 | ) | | | | 5,165,904 | |
Net assets | | | | | | | | | | | |
Beginning of period | | | | | 49,151,778 | | | | | 43,985,874 | |
|
|
|
|
|
|
|
|
|
|
| |
End of period | | | | $ | 42,962,253 | | | | $ | 49,151,778 | |
|
|
|
|
|
|
|
|
|
|
| |
Undistributed net investment loss | | | | $ | (132,736 | ) | | | $ | (539 | ) |
|
|
|
|
|
|
|
|
|
|
| |
See Notes to Financial Statements
15
NOTES TO FINANCIAL STATEMENTS (unaudited)
1. ORGANIZATION
Evergreen Small-Mid Growth Fund (the “Fund”) is a diversified series of Evergreen Equity Trust (the “Trust”), a Delaware statutory trust organized on September 18, 1997. The Trust is an open-end management investment company registered under the Investment Company Act of 1940, as amended (the “1940 Act”).
The Fund offers Class A and Class I shares. Class A shares are sold with a front-end sales charge. However, Class A share investments of $1 million or more are not subject to a front-end sales charge but are subject to a contingent deferred sales charge of 1.00% upon redemption within 18 months. Class I shares are sold without a front-end sales charge or contingent deferred sales charge. Class A shares pay an ongoing distribution fee.
2. SIGNIFICANT ACCOUNTING POLICIES
The following is a summary of significant accounting policies consistently followed by the Fund in the preparation of its financial statements. The policies are in conformity with generally accepted accounting principles in the United States of America, which require management to make estimates and assumptions that affect amounts reported herein. Actual results could differ from these estimates. Management has considered the circumstances under which the Fund should recognize or make disclosures regarding events or transactions occurring subsequent to the balance sheet date through the date the financial statements are issued. Adjustments or additional disclosures, if any, have been included in these financial statements.
a. Valuation of investments
Listed equity securities are usually valued at the last sales price or official closing price on the national securities exchange where the securities are principally traded. If there has been no sale, the securities are valued at the mean between bid and asked prices.
Investments in open-end mutual funds are valued at net asset value. Securities for which market quotations are not readily available or not reflective of current fair value are valued at fair value as determined by the investment advisor in good faith, according to procedures approved by the Board of Trustees.
The valuation techniques used by the Fund to measure fair value are consistent with the market approach, income approach and/or cost approach, where applicable, for each security type.
b. Securities lending
The Fund may lend its securities to certain qualified brokers in order to earn additional income. The Fund receives compensation in the form of fees or interest earned on the investment of any cash collateral received. The Fund also continues to receive interest and dividends on the securities loaned. The Fund receives collateral in the form of cash or securities with a market value at least equal to the market value of the securities on loan. In the event of default or bankruptcy by the borrower, the Fund could experience delays
16
NOTES TO FINANCIAL STATEMENTS (unaudited) continued
and costs in recovering the loaned securities or in gaining access to the collateral. In addition, the investment of any cash collateral received may lose all or part of its value. The Fund has the right under the lending agreement to recover the securities from the borrower on demand.
c. Security transactions and investment income
Security transactions are recorded on trade date. Realized gains and losses are computed using the specific cost of the security sold. Dividend income is recorded on the ex-dividend date.
d. Federal and other taxes
The Fund intends to continue to qualify as a regulated investment company and distribute all of its taxable income, including any net capital gains (which have already been offset by available capital loss carryovers). Accordingly, no provision for federal taxes is required. The Fund’s income and excise tax returns and all financial records supporting those returns for the prior three fiscal years are subject to examination by the federal, Massachusetts and Delaware revenue authorities.
e. Distributions
Distributions to shareholders from net investment income and net realized gains, if any, are recorded on the ex-dividend date. Such distributions are determined in conformity with income tax regulations, which may differ from generally accepted accounting principles.
f. Class allocations
Income, common expenses and realized and unrealized gains and losses are allocated to the classes based on the relative net assets of each class. Distribution fees, if any, are calculated daily at the class level based on the appropriate net assets of each class and the specific expense rates applicable to each class.
3. ADVISORY FEE AND OTHER TRANSACTIONS WITH AFFILIATES
Evergreen Investment Management Company, LLC (“EIMC”), a subsidiary of Wells Fargo & Company (“Wells Fargo”), is the investment advisor to the Fund and is paid an annual fee starting at 0.70% and declining to 0.65% as average daily net assets increase. For the six months ended March 31, 2010, the advisory fee was equivalent to an annual rate of 0.70% of the Fund’s average daily net assets.
From time to time, EIMC may voluntarily or contractually waive its fee and/or reimburse expenses in order to limit operating expenses. During the six months ended March 31, 2010, EIMC voluntarily waived its advisory fee in the amount of $66,990.
The Fund may invest in money market funds which are advised by EIMC. Income earned on these investments is included in income from affiliated issuers on the Statement of Operations.
17
NOTES TO FINANCIAL STATEMENTS (unaudited) continued
EIMC also serves as the administrator to the Fund providing the Fund with facilities, equipment and personnel. EIMC is paid an annual rate determined by applying percentage rates to the aggregate average daily net assets of the Evergreen funds (excluding money market funds) starting at 0.10% and declining to 0.05% as the aggregate average daily net assets of the Evergreen funds (excluding money market funds) increase. For the six months ended March 31, 2010, the administrative services fee was equivalent to an annual rate of 0.10% of the Fund’s average daily net assets.
Evergreen Service Company, LLC (“ESC”), an affiliate of EIMC and a subsidiary of Wells Fargo, is the transfer and dividend disbursing agent for the Fund. ESC receives account fees that vary based on the type of account held by the shareholders in the Fund. For the six months ended March 31, 2010, the transfer agent fees were equivalent to an annual rate of 0.21% of the Fund’s average daily net assets.
Wachovia Bank NA, a subsidiary of Wells Fargo and an affiliate of EIMC, through its securities lending division, Wachovia Global Securities Lending, acts as the securities lending agent for the Fund (see Note 5).
4. DISTRIBUTION PLAN
Wells Fargo Funds Distributor, LLC (“WFFD”), a wholly-owned subsidiary of Wells Fargo serves as distributor of the Fund’s shares. Prior to January 4, 2010, Evergreen Investment Services, Inc. (“EIS”), an affiliate of EIMC and a subsidiary of Wells Fargo, served as distributor of the Fund’s shares. The Fund has adopted a Distribution Plan, as allowed by Rule 12b-1 of the 1940 Act, for Class A shares. Under the Distribution Plan, the Fund is permitted to pay distribution fees at an annual rate of up to 0.75% of the average daily net assets for Class A shares. However, currently the distribution fees for Class A shares are limited to 0.25% of the average daily net assets of the class.
For the six months ended March 31, 2010, EIS received $2,660 from the sale of Class A shares and $4,205 in contingent deferred sales charges from redemptions of Class A shares.
5. INVESTMENT TRANSACTIONS
Cost of purchases and proceeds from sales of investment securities (excluding short-term securities) were $11,615,223 and $22,155,768, respectively, for the six months ended March 31, 2010.
Fair value measurements of investments are determined within a framework that has established a fair value hierarchy based upon the various data inputs utilized in determining the value of the Fund’s investments. These inputs are summarized into three broad levels as follows:
18
NOTES TO FINANCIAL STATEMENTS (unaudited) continued
Level 1 – quoted prices in active markets for identical securities Level 2 – other significant observable inputs (including quoted prices for similar securities, interest rates, prepayment speeds, credit risk, etc.) Level 3 – significant unobservable inputs (including the Fund’s own assumptions in determining the fair value of investments) |
The inputs or methodologies used for valuing securities are not necessarily an indication of the risk associated with investing in those securities.
As of March 31, 2010, the inputs used in valuing the Fund’s assets, which are carried at fair value, were as follows:
Investments in Securities | | Quoted Prices
(Level 1) | | Significant
Other
Observable
Inputs
(Level 2) | | Significant
Unobservable
Inputs
(Level 3) | | Total | |
|
|
|
|
|
|
|
|
| |
Equity securities | | | | | | | | | | | | | |
Common stocks | | $ | 40,734,620 | | $ | 0 | | $ | 0 | | $ | 40,734,620 | |
Exchange traded funds | | | 1,512,919 | | | 0 | | | 0 | | | 1,512,919 | |
Short-term investments | | | 6,147,388 | | | 0 | | | 0 | | | 6,147,388 | |
|
|
|
|
|
|
|
|
|
|
|
|
| |
| | $ | 48,394,927 | | $ | 0 | | $ | 0 | | $ | 48,394,927 | |
|
|
|
|
|
|
|
|
|
|
|
|
| |
Further details on the major security types listed above can be found in the Schedule of Investments.
During the six months ended March 31, 2010, the Fund loaned securities to certain brokers and earned $47,985, net of $5,275 paid to Wachovia Global Securities Lending as the securities lending agent. At March 31, 2010, the value of securities on loan and the total value of collateral received for securities loaned (including segregated cash) amounted to $5,022,760 and $5,194,141, respectively.
On March 31, 2010, the aggregate cost of securities for federal income tax purposes was $38,533,264. The gross unrealized appreciation and depreciation on securities based on tax cost was $10,818,514 and $956,851, respectively, with a net unrealized appreciation of $9,861,663.
As of September 30, 2009, the Fund had $1,578,401 in capital loss carryovers for federal income tax purposes expiring in 2017.
For income tax purposes, capital losses incurred after October 31 within the Fund’s fiscal year are deemed to arise on the first business day of the following fiscal year. As of September 30, 2009, the Fund incurred and elected to defer post-October losses of $7,253,129.
6. INTERFUND LENDING
Pursuant to an Exemptive Order issued by the SEC, the Fund may participate in an interfund lending program with certain funds in the Evergreen fund family. This program
19
NOTES TO FINANCIAL STATEMENTS (unaudited) continued
allows the Fund to borrow from, or lend money to, other participating funds. During the six months ended March 31, 2010, the Fund did not participate in the interfund lending program.
7. EXPENSE REDUCTIONS
Through expense offset arrangements with ESC and the Fund’s custodian, a portion of fund expenses has been reduced.
8. DEFERRED TRUSTEES’ FEES
Each Trustee of the Fund may defer any or all compensation related to performance of his or her duties as a Trustee. The Trustees’ deferred balances are allocated to deferral accounts, which are included in the accrued expenses for the Fund. The investment performance of the deferral accounts is based on the investment performance of certain Evergreen funds. Any gains earned or losses incurred in the deferral accounts are reported in the Fund’s Trustees’ fees and expenses. At the election of the Trustees, the deferral account will be paid either in one lump sum or in quarterly installments for up to ten years.
9. FINANCING AGREEMENT
The Fund and certain other Evergreen funds share in a $100 million unsecured revolving credit commitment for temporary and emergency purposes, including the funding of redemptions, as permitted by each participating fund’s borrowing restrictions. Borrowings under this facility bear interest at the higher of the Federal Funds rate plus 1.25% or LIBOR plus 1.25%. All of the participating funds are charged an annual commitment fee of 0.145% on the unused balance, which is allocated pro rata.
During the six months ended March 31, 2010, the Fund had average borrowings outstanding of $8,274 (on an annualized basis) at an average rate of 1.45% and paid interest of $120.
10. REGULATORY MATTERS AND LEGAL PROCEEDINGS
The Evergreen funds, EIMC and certain of EIMC’s affiliates are involved in various legal actions, including private litigation and class action lawsuits, and are and may in the future be subject to regulatory inquiries and investigations.
EIMC and EIS have reached final settlements with the Securities and Exchange Commission (“SEC”) and the Securities Division of the Secretary of the Commonwealth of Massachusetts (“Commonwealth”) primarily relating to the liquidation of Evergreen Ultra Short Opportunities Fund (“Ultra Short Fund”). The claims settled include the following: first, that during the period February 2007 through Ultra Short Fund’s liquidation on June 18, 2008, Ultra Short Fund’s former portfolio management team failed to properly take into account readily-available information in valuing certain non-agency residential mortgage-backed securities held by the Ultra Short Fund, resulting in the Ultra
20
NOTES TO FINANCIAL STATEMENTS (unaudited) continued
Short Fund’s net asset value (“NAV”) being overstated during the period; second, that EIMC and EIS acted inappropriately when, in an effort to explain the decline in Ultra Short Fund’s NAV, certain information regarding the decline was communicated to some, but not all, shareholders and financial intermediaries; third, that the Ultra Short Fund portfolio management team did not adhere to regulatory requirements for affiliated cross trades in executing trades with other Evergreen funds; and finally, that from at least September 2007 to August 2008, EIS did not preserve certain text and instant messages transmitted via personal digital assistant devices. In settling these matters, EIMC and EIS have agreed to payments totaling $41,125,000, up to $40,125,000 of which will be distributed to eligible shareholders of Ultra Short Fund pursuant to a methodology and plan approved by the regulators. EIMC and EIS neither admitted nor denied the regulators’ conclusions.
Three purported class actions have also been filed in the U.S. District Court for the District of Massachusetts relating to the same events; defendants include various Evergreen entities, including EIMC and EIS, and Evergreen Fixed Income Trust and its Trustees. The cases generally allege that investors in the Ultra Short Fund suffered losses as a result of (i) misleading statements in Ultra Short Fund’s registration statement and prospectus, (ii) the failure to accurately price securities in the Ultra Short Fund at different points in time and (iii) the failure of the Ultra Short Fund’s risk disclosures and description of its investment strategy to inform investors adequately of the actual risks of the fund.
EIMC does not expect that any of the legal actions, inquiries or settlement of regulatory matters will have a material adverse impact on the financial position or operations of the Fund to which these financial statements relate. Any publicity surrounding or resulting from any legal actions or regulatory inquiries involving EIMC or its affiliates or any of the Evergreen Funds could result in reduced sales or increased redemptions of Evergreen fund shares, which could increase Evergreen fund transaction costs or operating expenses or have other adverse consequences on the Evergreen funds, including the Fund.
11. REORGANIZATION
At a meeting of the Board of Trustees held on December 30, 2009, the Trustees of the Fund approved a Plan of Reorganization (the “Plan”). Under the Plan, Wells Fargo Advantage Growth Opportunities Fund, which will be a series of Wells Fargo Funds Trust created in order to receive the assets of the Fund upon completion of the reorganization, will acquire the assets and assume the liabilities of the Fund in exchange for shares of Wells Fargo Advantage Growth Opportunities Fund.
A special meeting of shareholders of the Fund will be held in June 2010 to consider and vote on the Plan. In April 2010, materials for this meeting were mailed to shareholders of record on March 10, 2010. If approved by the shareholders at this meeting, the reorganization will take place in July 2010.
21
This page left intentionally blank
22
This page left intentionally blank
23
TRUSTEES AND OFFICERS
TRUSTEES1 | |
Dr. Leroy Keith, Jr.
Trustee
DOB: 2/14/1939
Term of office since: 1983
Other directorships: Trustee,
Phoenix Fund Complex
(consisting of 46 portfolios
as of 12/31/2009) | Chairman, Bloc Global Services (development and construction); Former Managing Director, Almanac Capital Management (commodities firm); Trustee, Phoenix Fund Complex; Director, Diversapack Co. (packaging company); Former Partner, Stonington Partners, Inc. (private equity fund); Former Director, Obagi Medical Products Co. |
|
|
Carol A. Kosel
Trustee
DOB: 12/25/1963
Term of office since: 2008
Other directorships: None | Former Consultant to the Evergreen Boards of Trustees; Former Vice President and Senior Vice President, Evergreen Investments, Inc.; Former Treasurer, Evergreen Funds; Former Treasurer, Vestaur Securities Fund |
|
|
Gerald M. McDonnell
Trustee
DOB: 7/14/1939
Term of office since: 1988
Other directorships: None | Consultant, Rock Hill Metals Consultants LLC (Metals Consultant to steel industry); Former Manager of Commercial Operations, CMC Steel (steel producer) |
|
|
Patricia B. Norris
Trustee
DOB: 4/9/1948
Term of office since: 2006
Other directorships: None | President and Director of Buckleys of Kezar Lake, Inc. (real estate company); Former President and Director of Phillips Pond Homes Association (home community); Former Partner, PricewaterhouseCoopers, LLP (independent registered public accounting firm) |
|
|
William Walt Pettit2
Trustee
DOB: 8/26/1955
Term of office since: 1988
Other directorships: None | Director, Rogers, Townsend & Thomas, PC (law firm); Director, Superior Packaging Corp. (packaging company); Member, Superior Land, LLC (real estate holding company), Member, K&P Development, LLC (real estate development); Former Vice President, Kellam & Pettit, P.A. (law firm); Former Director, National Kidney Foundation of North Carolina, Inc. (non-profit organization) |
|
|
David M. Richardson
Trustee
DOB: 9/19/1941
Term of office since: 1982
Other directorships: None | President, Richardson, Runden LLC (executive recruitment advisory services); Director, J&M Cumming Paper Co. (paper merchandising); Former Trustee, NDI Technologies, LLP (communications); Former Consultant, AESC (The Association of Executive Search Consultants) |
|
|
Russell A. Salton III, MD
Trustee
DOB: 6/2/1947
Term of office since: 1984
Other directorships: None | President/CEO, AccessOne MedCard, Inc. |
|
|
Michael S. Scofield
Trustee
DOB: 2/20/1943
Term of office since: 1984
Other directorships: None | Retired Attorney, Law Offices of Michael S. Scofield; Former Director and Chairman, Branded Media Corporation (multi-media branding company) |
|
|
Richard J. Shima
Trustee
DOB: 8/11/1939
Term of office since: 1993
Other directorships: None | Independent Consultant; Director, Hartford Hospital; Trustee, Greater Hartford YMCA; Former Director,Trust Company of CT; Former Trustee, Saint Joseph College (CT) |
|
|
24
TRUSTEES AND OFFICERS continued
Richard K. Wagoner, CFA3
Trustee
DOB: 12/12/1937
Term of office since: 1999
Other directorships: None | Member and Former President, North Carolina Securities Traders Association; Member, Financial Analysts Society |
|
|
OFFICERS | |
W. Douglas Munn4
President
DOB: 4/21/1963
Term of office since: 2009 | Principal occupations: President and Chief Executive Officer, Evergreen Investment Company, Inc.; Chief Operating Officer, Wells Fargo Funds Management, LLC; Former Chief Operating Officer, Evergreen Investment Company, Inc. |
|
|
Jeremy DePalma4
Treasurer
DOB: 2/5/1974
Term of office since: 2005 | Principal occupations: Senior Vice President, Evergreen Investment Management Company, LLC; Assistant Treasurer, Wells Fargo Advantage Funds; Former Vice President, Evergreen Investment Services, Inc.; Former Assistant Vice President, Evergreen Investment Services, Inc. |
|
|
Michael H. Koonce4
Secretary
DOB: 4/20/1960
Term of office since: 2000 | Principal occupations: Managing Counsel, Wells Fargo & Company; Secretary and Senior Vice President, Alternative Strategies Brokerage Services, Inc.; Evergreen Investment Services, Inc.; Secretary and Senior Vice President, Evergreen Investment Management Company, LLC and Evergreen Service Company, LLC |
|
|
Robert Guerin4
Chief Compliance Officer
DOB: 9/20/1965
Term of office since: 2007 | Principal occupations: Chief Compliance Officer, Evergreen Funds and Senior Vice President of Evergreen Investment Company, Inc.; Compliance Manager, Wells Fargo Funds Management Group; Former Managing Director and Senior Compliance Officer, Babson Capital Management LLC; Former Principal and Director, Compliance and Risk Management, State Street Global Advisors; Former Vice President and Manager, Sales Practice Compliance, Deutsche Asset Management |
|
|
1 | Each Trustee serves until a successor is duly elected or qualified or until his or her death, resignation, retirement or removal from office. Each Trustee oversaw 74 Evergreen funds as of December 31, 2009. Correspondence for each Trustee may be sent to Evergreen Board of Trustees, P.O. Box 20083, Charlotte, NC 28202. |
2 | It is possible that Mr. Pettit may be viewed as an “interested person” of the Evergreen funds, as defined in the 1940 Act, because of his law firm’s previous representation of affiliates of Wells Fargo & Company (“Wells Fargo”), the parent to the Evergreen funds’ investment advisor, EIMC. The Trustees are treating Mr. Pettit as an interested trustee for the time being. |
3 | Mr. Wagoner is an “interested person” of the Evergreen funds because of his ownership of shares in Wells Fargo & Company, the parent to the Evergreen funds’ investment advisor. |
4 | The address of the Officer is 200 Berkeley Street, Boston, MA 02116. |
Additional information about the Fund’s Board of Trustees and Officers can be found in the Statement of Additional Information (SAI) and is available upon request without charge by calling 800.343.2898.
25
122771 576004 rv4 05/2010
Item 2 - Code of Ethics
Not required for this semi-annual filing.
Item 3 - Audit Committee Financial Expert
Not required for this semi-annual filing.
Items 4 – Principal Accountant Fees and Services
Not required for this semi-annual filing.
Items 5 – Audit Committee of Listed Registrants
Not applicable.
Item 6 – Schedule of Investments
Please see schedule of investments contained in the Report to Stockholders included under Item 1 of this Form N-CSR.
Item 7 – Disclosure of Proxy Voting Policies and Procedures for Closed-End Management Investment Companies.
Not applicable.
Item 8 – Portfolio Managers of Closed-End Management Investment Companies.
Not applicable.
Item 9 – Purchases of Equity Securities by Closed-End Management Investment Company and Affiliated Purchasers.
Not applicable.
Item 10 – Submission of Matters to a Vote of Security Holders
There have been no material changes to the procedures by which shareholders may recommend nominees to the Registrant’s board of trustees that have been implemented since the Registrant last provided disclosure in response to the requirements of this Item.
Item 11 - Controls and Procedures
(a) | The Registrant’s principal executive officer and principal financial officer have evaluated the Registrant’s disclosure controls and procedures (as defined in Rule 30a-3(c) under the Investment Company Act of 1940) within 90 days of this filing and have concluded that the Registrant’s disclosure controls and procedures were effective, as of that date, in ensuring that information required to be disclosed by the Registrant in this Form N-CSR was recorded, processed, summarized, and reported timely. |
(b) | There has been no changes in the Registrant’s internal controls over financial reporting (as defined in Rule 30a-3(d) under the Investment Company Act of 1940) that occurred during the second fiscal quarter of the period covered by this report that has materially affected, or is reasonably likely to affect, the Registrant’s internal control over financial reporting. |
Item 12 - Exhibits
File the exhibits listed below as part of this Form. Letter or number the exhibits in the sequence indicated.
(a) | Any code of ethics, or amendment thereto, that is the subject of the disclosure required by Item 2, to the extent that the Registrant intends to satisfy the Item 2 requirements through filing of an exhibit. |
(b)(1) | Separate certifications for the Registrant’s principal executive officer and principal financial officer, as required by Section 302 of the Sarbanes-Oxley Act of 2002 and Rule 30a-2(a) under the Investment Company Act of 1940, are attached as EX99.CERT. |
(b)(2) | Separate certifications for the Registrant’s principal executive officer and principal financial officer, as required by Section 1350 of Title 18 of United States Code, as adopted pursuant to Section 906 of the Sarbanes-Oxley Act of 2002, and Rule 30a-2(b) under the Investment Company Act of 1940, are attached as EX99.906CERT. The certifications furnished pursuant to this paragraph are not deemed to be “filed” for purposes of Section 18 of the Securities Exchange Act of 1934, or otherwise subject to the liability of that section. Such certifications are not deemed to be incorporated by reference into any filing under the Securities Act of 1933 or the Securities Exchange Act of 1934, except to the extent that the Registrant specifically incorporates them by reference. |
Pursuant to the requirements of the Securities Exchange Act of 1934 and the Investment Company Act of 1940, the Registrant has duly caused this report to be signed on its behalf by the undersigned, thereunto duly authorized.
Evergreen Equity Trust | | | |
By: |
/s/ W. Douglas Munn
| | | |
|
| | | |
| W. Douglas Munn
Principal Executive Officer | | | |
Date: May 28, 2010
Pursuant to the requirements of the Securities Exchange Act of 1934 and the Investment Company Act of 1940, this report has been signed below by the following persons on behalf of the Registrant and in the capacities and on the dates indicated.
By: |
/s/ W. Douglas Munn
| | | |
|
| | | |
| W. Douglas Munn
Principal Executive Officer | | | |
Date: May 28, 2010
By: |
/s/ Jeremy DePalma
| | | |
|
| | | |
| Jeremy DePalma
Principal Financial Officer | | | |
Date: May 28, 2010