Exhibit (c)(3)
Project Ryan PRELIMINARY DISCUSSION MATERIALS FOR THE SPECIAL COMMITTEE OF THE BOARD OF DIRECTORS OF REALNET WORKS, INC. MARCH 1,2022 | CONFIDENTIAL – PRELIMINARY DRAFT – SUBJECT TO FURTHER REVIEW
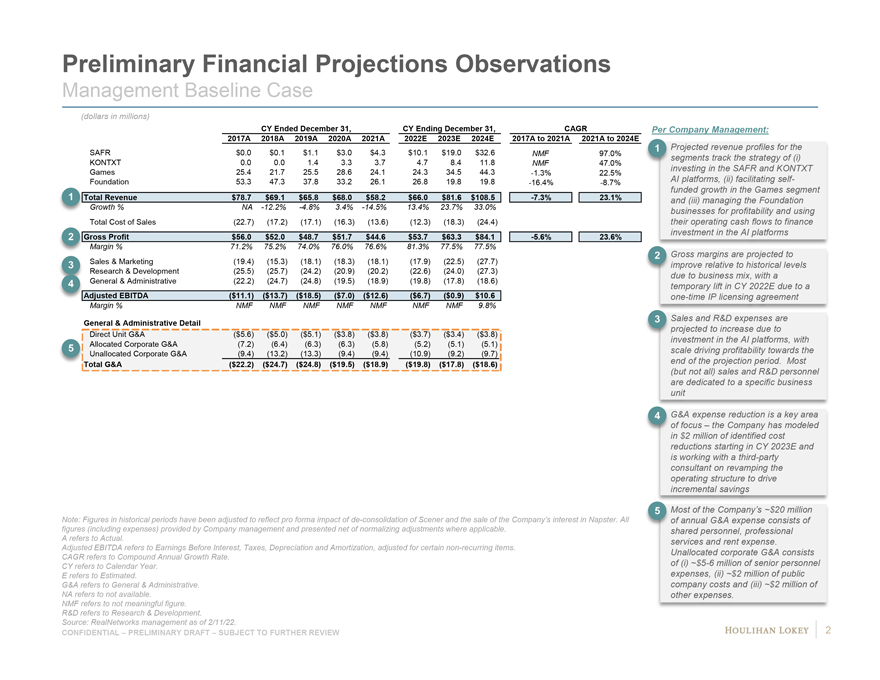
Preliminary Financial Projections Observations Management Baseline Case (dollars in millions) CY Ended December 31, CY Ending December 31, CAGR Per Company Management: 2017A 2018A 2019A 2020A 2021A 2022E 2023E 2024E 2017A to 2021A 2021A to 2024E 1 Projected revenue profiles for the SAFR $0.0 $0.1 $1.1 $3.0 $4.3 $10.1 $19.0 $32.6 NMF 97.0% segments track the strategy of (i) KONTXT 0.0 0.0 1.4 3.3 3.7 4.7 8.4 11.8 NMF 47.0% Games 25.4 21.7 25.5 28.6 24.1 24.3 34.5 44.3 -1.3% 22.5% investing in the SAFR and KONTXT Foundation 53.3 47.3 37.8 33.2 26.1 26.8 19.8 19.8 -16.4% -8.7% AI platforms, (ii) facilitating self- funded growth in the Games segment 1 Total Revenue $78.7 $69.1 $65.8 $68.0 $58.2 $66.0 $81.6 $108.5 -7.3% 23.1% and (iii) managing the Foundation Growth % NA -12.2% -4.8% 3.4% -14.5% 13.4% 23.7% 33.0% businesses for profitability and using Total Cost of Sales (22.7) (17.2) (17.1) (16.3) (13.6) (12.3) (18.3) (24.4) their operating cash flows to finance 2 Gross Profit $56.0 $52.0 $48.7 $51.7 $44.6 $53.7 $63.3 $84.1 -5.6% 23.6% investment in the AI platforms Margin % 71.2% 75.2% 74.0% 76.0% 76.6% 81.3% 77.5% 77.5% Sales & Marketing (19.4) (15.3) (18.1) (18.3) (18.1) (17.9) (22.5) (27.7) 2 Gross margins are projected to 3 improve relative to historical levels Research & Development (25.5) (25.7) (24.2) (20.9) (20.2) (22.6) (24.0) (27.3) due to business mix, with a 4 General & Administrative (22.2) (24.7) (24.8) (19.5) (18.9) (19.8) (17.8) (18.6) temporary lift in CY 2022E due to a Adjusted EBITDA ($11.1) ($13.7) ($18.5) ($7.0) ($12.6) ($6.7) ($0.9) $10.6 one-time IP licensing agreement Margin % NMF NMF NMF NMF NMF NMF NMF 9.8% General & Administrative Detail 3 Sales and R&D expenses are projected to increase due to Direct Unit G&A ($5.6) ($5.0) ($5.1) ($3.8) ($3.8) ($3.7) ($3.4) ($3.8) investment in the AI platforms, with 5 Allocated Corporate G&A (7.2) (6.4) (6.3) (6.3) (5.8) (5.2) (5.1) (5.1) scale driving profitability towards the Unallocated Corporate G&A (9.4) (13.2) (13.3) (9.4) (9.4) (10.9) (9.2) (9.7) Total G&A ($22.2) ($24.7) ($24.8) ($19.5) ($18.9) ($19.8) ($17.8) ($18.6) end of the projection period. Most (but not all) sales and R&D personnel are dedicated to a specific business unit 4 G&A expense reduction is a key area of focus – the Company has modeled in $2 million of identified cost reductions starting in CY 2023E and is working with a third-party consultant on revamping the operating structure to drive incremental savings 5 Most of the Company’s ~$20 million Note: Figures in historical periods have been adjusted to reflect pro forma impact of de-consolidation of Scener and the sale of the Company’s interest in Napster. All of annual G&A expense consists of figures (including expenses) provided by Company management and presented net of normalizing adjustments where applicable. shared personnel, professional A refers to Actual. services and rent expense. Adjusted EBITDA refers to Earnings Before Interest, Taxes, Depreciation and Amortization, adjusted for certain non-recurring items. Unallocated corporate G&A consists CAGR refers to Compound Annual Growth Rate. CY refers to Calendar Year. of (i) ~$5-6 million of senior personnel E refers to Estimated. expenses, (ii) ~$2 million of public G&A refers to General & Administrative. company costs and (iii) ~$2 million of NA refers to not available. other expenses. NMF refers to not meaningful figure. R&D refers to Research & Development. Source: RealNetworks management as of 2/11/22. CONFIDENTIAL – PRELIMINARY DRAFT – SUBJECT TO FURTHER REVIEW 2
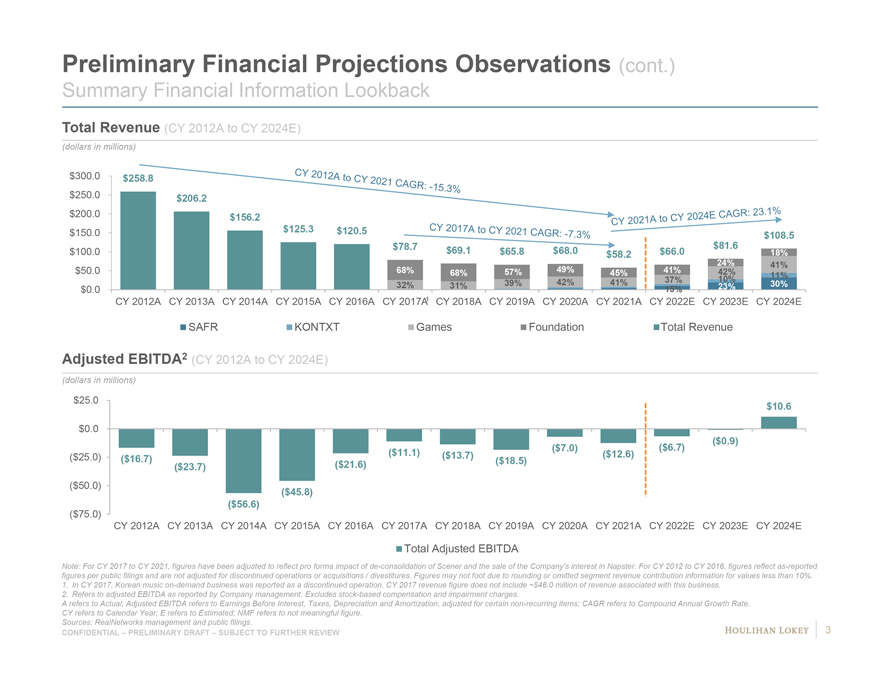
Preliminary Financial Projections Observations (cont.) Summary Financial Information Lookback Total Revenue (CY 2012A to CY 2024E) Adjusted EBITDA2 (CY 2012A to CY 2024E) (dollars in millions) Note: For CY 2017 to CY 2021, figures have been adjusted to reflect pro forma impact of de-consolidation of Scener and the sale of the Company’s interest in Napster. For CY 2012 to CY 2016, figures reflect as-reported figures per public filings and are not adjusted for discontinued operations or acquisitions / divestitures. Figures may not foot due to rounding or omitted segment revenue contribution information for values less than 10%. 1. In CY 2017, Korean music on-demand business was reported as a discontinued operation. CY 2017 revenue figure does not include ~$46.0 million of revenue associated with this business. 2. Refers to adjusted EBITDA as reported by Company management. Excludes stock-based compensation and impairment charges. A refers to Actual; Adjusted EBITDA refers to Earnings Before Interest, Taxes, Depreciation and Amortization, adjusted for certain non-recurring items; CAGR refers to Compound Annual Growth Rate. CY refers to Calendar Year; E refers to Estimated; NMF refers to not meaningful figure. Sources: RealNetworks management and public filings. 3 CONFIDENTIAL – PRELIMINARY DRAFT – SUBJECT TO FURTHER REVIEW
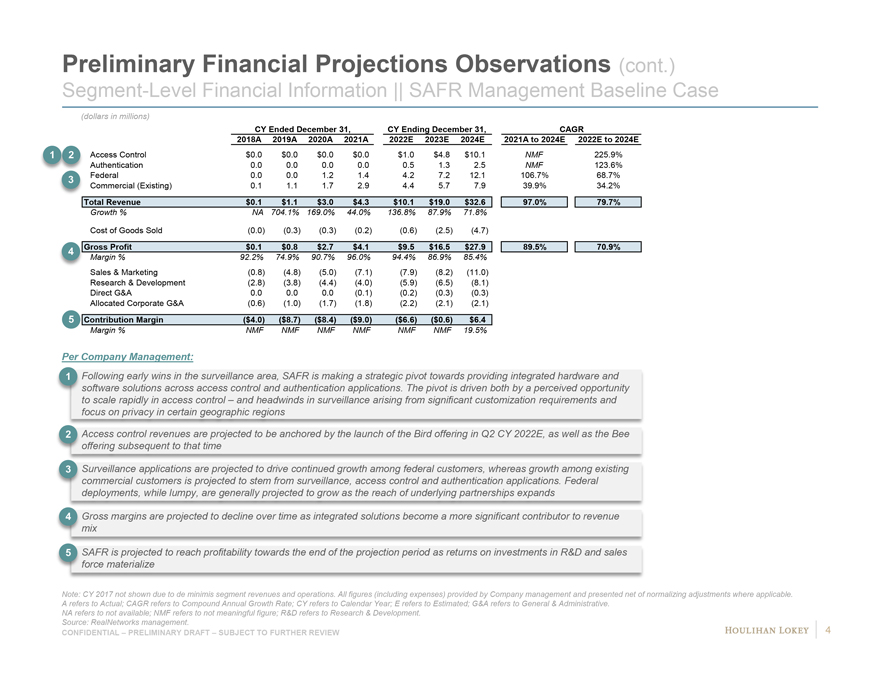
Preliminary Financial Projections Observations (cont.) Segment-Level Financial Information || SAFR Management Baseline Case (dollars in millions) CY Ended December 31, CY Ending December 31, CAGR 2018A 2019A 2020A 2021A 2022E 2023E 2024E 2021A to 2024E 2022E to 2024E 1 2 Access Control $0.0 $0.0 $0.0 $0.0 $1.0 $4.8 $10.1 NMF 225.9% Authentication 0.0 0.0 0.0 0.0 0.5 1.3 2.5 NMF 123.6% 3 Federal 0.0 0.0 1.2 1.4 4.2 7.2 12.1 106.7% 68.7% Commercial (Existing) 0.1 1.1 1.7 2.9 4.4 5.7 7.9 39.9% 34.2% Total Revenue $0.1 $1.1 $3.0 $4.3 $10.1 $19.0 $32.6 97.0% 79.7% Growth % NA 704.1% 169.0% 44.0% 136.8% 87.9% 71.8% Cost of Goods Sold (0.0) (0.3) (0.3) (0.2) (0.6) (2.5) (4.7) 4 Gross Profit $0.1 $0.8 $2.7 $4.1 $9.5 $16.5 $27.9 89.5% 70.9% Margin % 92.2% 74.9% 90.7% 96.0% 94.4% 86.9% 85.4% Sales & Marketing (0.8) (4.8) (5.0) (7.1) (7.9) (8.2) (11.0) Research & Development (2.8) (3.8) (4.4) (4.0) (5.9) (6.5) (8.1) Direct G&A 0.0 0.0 0.0 (0.1) (0.2) (0.3) (0.3) Allocated Corporate G&A (0.6) (1.0) (1.7) (1.8) (2.2) (2.1) (2.1) 5 Contribution Margin ($4.0) ($8.7) ($8.4) ($9.0) ($6.6) ($0.6) $6.4 Margin % NMF NMF NMF NMF NMF NMF 19.5% Per Company Management: 1 Following early wins in the surveillance area, SAFR is making a strategic pivot towards providing integrated hardware and software solutions across access control and authentication applications. The pivot is driven both by a perceived opportunity to scale rapidly in access control – and headwinds in surveillance arising from significant customization requirements and focus on privacy in certain geographic regions 2 Access control revenues are projected to be anchored by the launch of the Bird offering in Q2 CY 2022E, as well as the Bee offering subsequent to that time 3 Surveillance applications are projected to drive continued growth among federal customers, whereas growth among existing commercial customers is projected to stem from surveillance, access control and authentication applications. Federal deployments, while lumpy, are generally projected to grow as the reach of underlying partnerships expands 4 Gross margins are projected to decline over time as integrated solutions become a more significant contributor to revenue mix 5 SAFR is projected to reach profitability towards the end of the projection period as returns on investments in R&D and sales force materialize Note: CY 2017 not shown due to de minimis segment revenues and operations. All figures (including expenses) provided by Company management and presented net of normalizing adjustments where applicable. A refers to Actual; CAGR refers to Compound Annual Growth Rate; CY refers to Calendar Year; E refers to Estimated; G&A refers to General & Administrative. NA refers to not available; NMF refers to not meaningful figure; R&D refers to Research & Development. Source: RealNetworks management. CONFIDENTIAL – PRELIMINARY DRAFT – SUBJECT TO FURTHER REVIEW 4
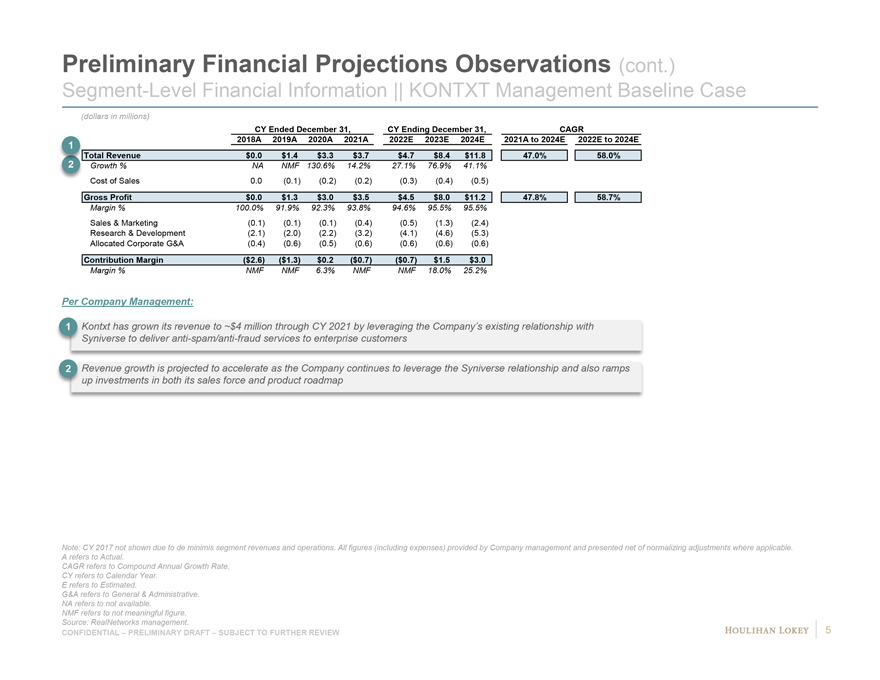
Preliminary Financial Projections Observations (cont.) Segment-Level Financial Information || KONTXT Management Baseline Case (dollars in millions) CY Ended December 31, CY Ending December 31, CAGR 1 2018A 2019A 2020A 2021A 2022E 2023E 2024E 2021A to 2024E 2022E to 2024E Total Revenue $0.0 $1.4 $3.3 $3.7 $4.7 $8.4 $11.8 47.0% 58.0% Growth % NA NMF 130.6% 14.2% 27.1% 76.9% 41.1% Cost of Sales 0.0 (0.1) (0.2) (0.2) (0.3) (0.4) (0.5) Gross Profit $0.0 $1.3 $3.0 $3.5 $4.5 $8.0 $11.2 47.8% 58.7% Margin % 100.0% 91.9% 92.3% 93.8% 94.6% 95.5% 95.5% Sales & Marketing (0.1) (0.1) (0.1) (0.4) (0.5) (1.3) (2.4) Research & Development (2.1) (2.0) (2.2) (3.2) (4.1) (4.6) (5.3) Allocated Corporate G&A (0.4) (0.6) (0.5) (0.6) (0.6) (0.6) (0.6) Contribution Margin ($2.6) ($1.3) $0.2 ($0.7) ($0.7) $1.5 $3.0 Margin % NMF NMF 6.3% NMF NMF 18.0% 25.2% Per Company Management: 1 Kontxt has grown its revenue to ~$4 million through CY 2021 by leveraging the Company’s existing relationship with Syniverse to deliver anti-spam/anti-fraud services to enterprise customers 2 Revenue growth is projected to accelerate as the Company continues to leverage the Syniverse relationship and also ramps up investments in both its sales force and product roadmap Note: CY 2017 not shown due to de minimis segment revenues and operations. All figures (including expenses) provided by Company management and presented net of normalizing adjustments where applicable. A refers to Actual. CAGR refers to Compound Annual Growth Rate. CY refers to Calendar Year. E refers to Estimated. G&A refers to General & Administrative. NA refers to not available. NMF refers to not meaningful figure. Source: RealNetworks management. 5 CONFIDENTIAL – PRELIMINARY DRAFT – SUBJECT TO FURTHER REVIEW
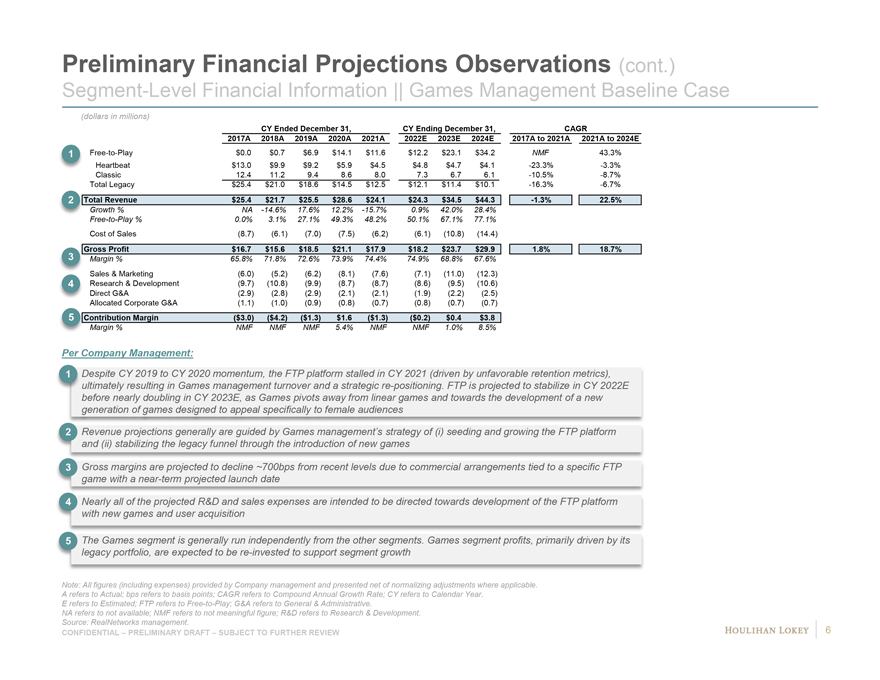
Preliminary Financial Projections Observations (cont.) Segment-Level Financial Information || Games Management Baseline Case (dollars in millions) CY Ended December 31, CY Ending December 31, CAGR 2017A 2018A 2019A 2020A 2021A 2022E 2023E 2024E 2017A to 2021A 2021A to 2024E 1 Free-to-Play $0.0 $0.7 $6.9 $14.1 $11.6 $12.2 $23.1 $34.2 NMF 43.3% Heartbeat $13.0 $9.9 $9.2 $5.9 $4.5 $4.8 $4.7 $4.1 -23.3% -3.3% Classic 12.4 11.2 9.4 8.6 8.0 7.3 6.7 6.1 -10.5% -8.7% Total Legacy $25.4 $21.0 $18.6 $14.5 $12.5 $12.1 $11.4 $10.1 -16.3% -6.7% 2 Total Revenue $25.4 $21.7 $25.5 $28.6 $24.1 $24.3 $34.5 $44.3 -1.3% 22.5% Growth % NA -14.6% 17.6% 12.2% -15.7% 0.9% 42.0% 28.4% Free-to-Play % 0.0% 3.1% 27.1% 49.3% 48.2% 50.1% 67.1% 77.1% Cost of Sales (8.7) (6.1) (7.0) (7.5) (6.2) (6.1) (10.8) (14.4) Gross Profit $16.7 $15.6 $18.5 $21.1 $17.9 $18.2 $23.7 $29.9 1.8% 18.7% 3 Margin % 65.8% 71.8% 72.6% 73.9% 74.4% 74.9% 68.8% 67.6% Sales & Marketing (6.0) (5.2) (6.2) (8.1) (7.6) (7.1) (11.0) (12.3) 4 Research & Development (9.7) (10.8) (9.9) (8.7) (8.7) (8.6) (9.5) (10.6) Direct G&A (2.9) (2.8) (2.9) (2.1) (2.1) (1.9) (2.2) (2.5) Allocated Corporate G&A (1.1) (1.0) (0.9) (0.8) (0.7) (0.8) (0.7) (0.7) 5 Contribution Margin ($3.0) ($4.2) ($1.3) $1.6 ($1.3) ($0.2) $0.4 $3.8 Margin % NMF NMF NMF 5.4% NMF NMF 1.0% 8.5% Per Company Management: 1 Despite CY 2019 to CY 2020 momentum, the FTP platform stalled in CY 2021 (driven by unfavorable retention metrics), ultimately resulting in Games management turnover and a strategic re-positioning. FTP is projected to stabilize in CY 2022E before nearly doubling in CY 2023E, as Games pivots away from linear games and towards the development of a new generation of games designed to appeal specifically to female audiences 2 Revenue projections generally are guided by Games management’s strategy of (i) seeding and growing the FTP platform and (ii) stabilizing the legacy funnel through the introduction of new games 3 Gross margins are projected to decline ~700bps from recent levels due to commercial arrangements tied to a specific FTP game with a near-term projected launch date 4 Nearly all of the projected R&D and sales expenses are intended to be directed towards development of the FTP platform with new games and user acquisition 5 The Games segment is generally run independently from the other segments. Games segment profits, primarily driven by its legacy portfolio, are expected to be re-invested to support segment growth Note: All figures (including expenses) provided by Company management and presented net of normalizing adjustments where applicable. A refers to Actual; bps refers to basis points; CAGR refers to Compound Annual Growth Rate; CY refers to Calendar Year. E refers to Estimated; FTP refers to Free-to-Play; G&A refers to General & Administrative. NA refers to not available; NMF refers to not meaningful figure; R&D refers to Research & Development. Source: RealNetworks management. 6 CONFIDENTIAL – PRELIMINARY DRAFT – SUBJECT TO FURTHER REVIEW
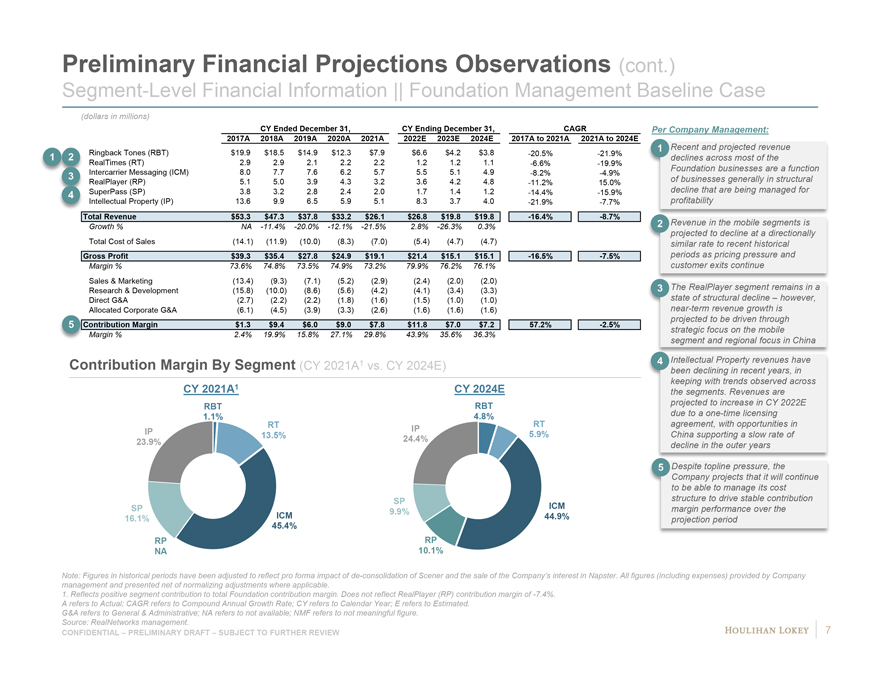
Preliminary Financial Projections Observations (cont.) Segment-Level Financial Information || Foundation Management Baseline Case (dollars in millions) CY Ended December 31, CY Ending December 31, CAGR 2017A 2018A 2019A 2020A 2021A 2022E 2023E 2024E 2017A to 2021A 2021A to 2024E 1 2 Ringback Tones (RBT) $19.9 $18.5 $14.9 $12.3 $7.9 $6.6 $4.2 $3.8 -20.5% -21.9% RealTimes (RT) 2.9 2.9 2.1 2.2 2.2 1.2 1.2 1.1 -6.6% -19.9% 3 Intercarrier Messaging (ICM) 8.0 7.7 7.6 6.2 5.7 5.5 5.1 4.9 -8.2% -4.9% RealPlayer (RP) 5.1 5.0 3.9 4.3 3.2 3.6 4.2 4.8 -11.2% 15.0% 4 SuperPass (SP) 3.8 3.2 2.8 2.4 2.0 1.7 1.4 1.2 -14.4% -15.9% Intellectual Property (IP) 13.6 9.9 6.5 5.9 5.1 8.3 3.7 4.0 -21.9% -7.7% Total Revenue $53.3 $47.3 $37.8 $33.2 $26.1 $26.8 $19.8 $19.8 -16.4% -8.7% Growth % NA -11.4% -20.0% -12.1% -21.5% 2.8% -26.3% 0.3% Total Cost of Sales (14.1) (11.9) (10.0) (8.3) (7.0) (5.4) (4.7) (4.7) Gross Profit $39.3 $35.4 $27.8 $24.9 $19.1 $21.4 $15.1 $15.1 -16.5% -7.5% Margin % 73.6% 74.8% 73.5% 74.9% 73.2% 79.9% 76.2% 76.1% Sales & Marketing (13.4) (9.3) (7.1) (5.2) (2.9) (2.4) (2.0) (2.0) Research & Development (15.8) (10.0) (8.6) (5.6) (4.2) (4.1) (3.4) (3.3) Direct G&A (2.7) (2.2) (2.2) (1.8) (1.6) (1.5) (1.0) (1.0) Allocated Corporate G&A (6.1) (4.5) (3.9) (3.3) (2.6) (1.6) (1.6) (1.6) 5 Contribution Margin $1.3 $9.4 $6.0 $9.0 $7.8 $11.8 $7.0 $7.2 57.2% -2.5% Margin % 2.4% 19.9% 15.8% 27.1% 29.8% 43.9% 35.6% 36.3% Per Company Management: 1 Recent and projected revenue declines across most of the Foundation businesses are a function of businesses generally in structural decline that are being managed for profitability 2 Revenue in the mobile segments is projected to decline at a directionally similar rate to recent historical periods as pricing pressure and customer exits continue 3 The RealPlayer segment remains in a state of structural decline – however, near-term revenue growth is projected to be driven through strategic focus on the mobile segment and regional focus in China 4 Intellectual Property revenues have been declining in recent years, in keeping with trends observed across the segments. Revenues are projected to increase in CY 2022E due to a one-time licensing agreement, with opportunities in China supporting a slow rate of decline in the outer years 5 Despite topline pressure, the Company projects that it will continue to be able to manage its cost structure to drive stable contribution margin performance over the projection period Note: Figures in historical periods have been adjusted to reflect pro forma impact of de-consolidation of Scener and the sale of the Company’s interest in Napster. All figures (including expenses) provided by Company management and presented net of normalizing adjustments where applicable. 1. Reflects positive segment contribution to total Foundation contribution margin. Does not reflect RealPlayer (RP) contribution margin of -7.4%. A refers to Actual; CAGR refers to Compound Annual Growth Rate; CY refers to Calendar Year; E refers to Estimated. G&A refers to General & Administrative; NA refers to not available; NMF refers to not meaningful figure. Source: RealNetworks management. 7 CONFIDENTIAL – PRELIMINARY DRAFT – SUBJECT TO FURTHER REVIEW
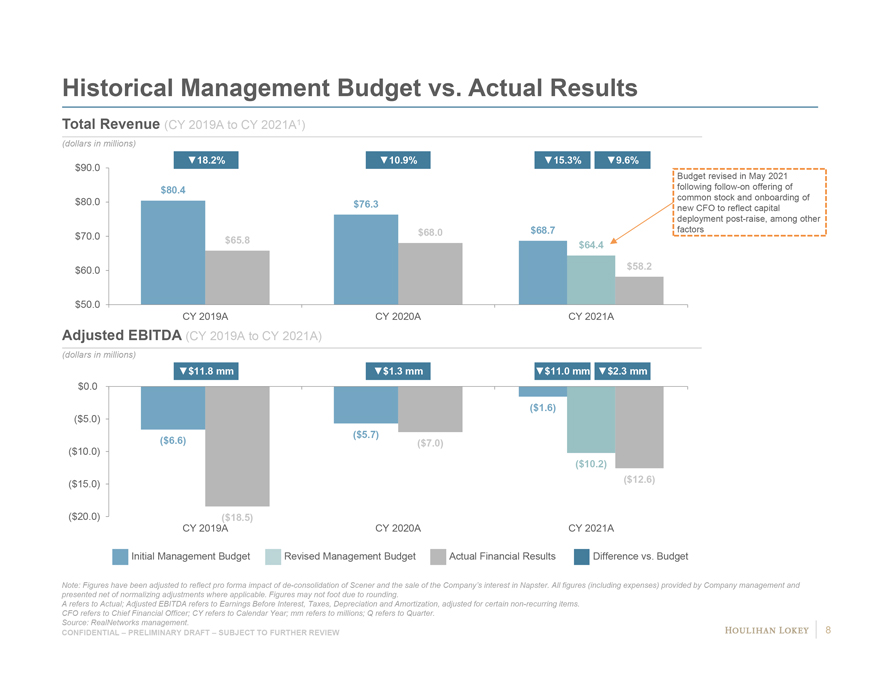
Historical Management Budget vs. Actual Results Total Revenue (CY 2019A to CY 2021A1) (dollars in millions) Note: Figures have been adjusted to reflect pro forma impact of de-consolidation of Scener and the sale of the Company’s interest in Napster. All figures (including expenses) provided by Company management and presented net of normalizing adjustments where applicable. Figures may not foot due to rounding. A refers to Actual; Adjusted EBITDA refers to Earnings Before Interest, Taxes, Depreciation and Amortization, adjusted for certain non-recurring items. CFO refers to Chief Financial Officer; CY refers to Calendar Year; mm refers to millions; Q refers to Quarter. Source: RealNetworks management. CONFIDENTIAL – PRELIMINARY DRAFT – SUBJECT TO FURTHER REVIEW 8
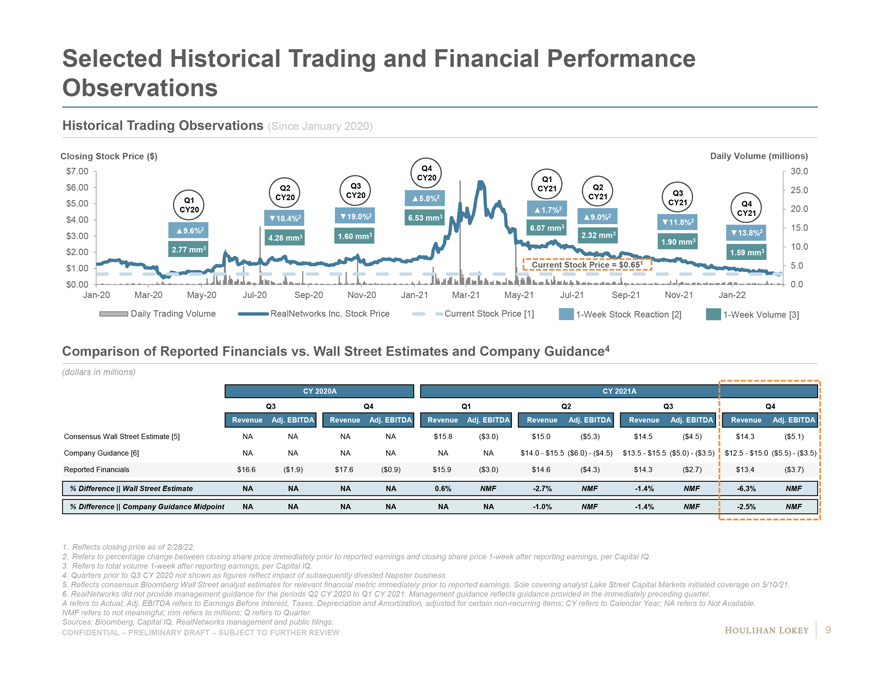
Selected Historical Trading and Financial Performance Observations Historical Trading Observations (Since January 2020) Comparison of Reported Financials vs. Wall Street Estimates and Company Guidance4 (dollars in millions) CY 2020A CY 2021A Q3 Q4 Q1 Q2 Q3 Q4 Revenue Adj. EBITDA Revenue Adj. EBITDA Revenue Adj. EBITDA Revenue Adj. EBITDA Revenue Adj. EBITDA Revenue Adj. EBITDA Consensus Wall Street Estimate [5] NA NA NA NA $15.8 ($3.0) $15.0 ($5.3) $14.5 ($4.5) $14.3 ($5.1) Company Guidance [6] NA NA NA NA NA NA $14.0—$15.5 ($6.0)—($4.5) $13.5—$15.5 ($5.0)—($ 3.5) $12.5—$15.0 ($5.5)—($ 3.5) Reported Financials $16.6 ($1.9) $17.6 ($0.9) $15.9 ($3.0) $14.6 ($4.3) $14.3 ($2.7) $13.4 ($3.7) % Difference || Wall Street Estimate NA NA NA NA 0.6% NMF -2.7% NMF -1.4% NMF -6.3% NMF % Difference || Company Guidance Midpoint NA NA NA NA NA NA -1.0% NMF -1.4% NMF -2.5% NMF 1. Reflects closing price as of 2/28/22. 2. Refers to percentage change between closing share price immediately prior to reported earnings and closing share price 1-week after reporting earnings, per Capital IQ. 3. Refers to total volume 1-week after reporting earnings, per Capital IQ. 4. Quarters prior to Q3 CY 2020 not shown as figures reflect impact of subsequently divested Napster business. 5. Reflects consensus Bloomberg Wall Street analyst estimates for relevant financial metric immediately prior to reported earnings. Sole covering analyst Lake Street Capital Markets initiated coverage on 5/10/21. 6. RealNetworks did not provide management guidance for the periods Q2 CY 2020 to Q1 CY 2021. Management guidance reflects guidance provided in the immediately preceding quarter. A refers to Actual; Adj. EBITDA refers to Earnings Before Interest, Taxes, Depreciation and Amortization, adjusted for certain non-recurring items; CY refers to Calendar Year; NA refers to Not Available. NMF refers to not meaningful; mm refers to millions; Q refers to Quarter. Sources: Bloomberg, Capital IQ, RealNetworks management and public filings. 9 CONFIDENTIAL – PRELIMINARY DRAFT – SUBJECT TO FURTHER REVIEW
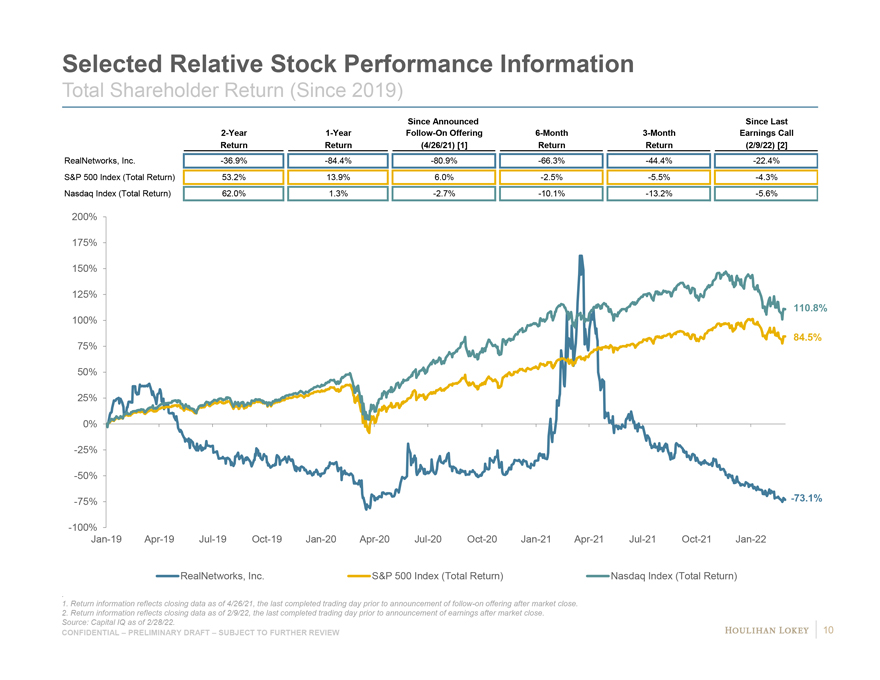
Selected Relative Stock Performance Information Total Shareholder Return (Since 2019) Since Announced Since Last 2-Year 1-Year Follow-On Offering 6-Month 3-Month Earnings Call Return Return (4/26/21) [1] Return Return (2/9/22) [2] RealNetworks, Inc. -36.9% -84.4% -80.9% -66.3% -44.4% -22.4% S&P 500 Index (Total Return) 53.2% 13.9% 6.0% -2.5% -5.5% -4.3% Nasdaq Index (Total Return) 62.0% 1.3% -2.7% -10.1% -13.2% -5.6% 1. Return information reflects closing data as of 4/26/21, the last completed trading day prior to announcement of follow-on offering after market close. 2. Return information reflects closing data as of 2/9/22, the last completed trading day prior to announcement of earnings after market close. Source: Capital IQ as of 2/28/22. 10 CONFIDENTIAL – PRELIMINARY DRAFT – SUBJECT TO FURTHER REVIEW
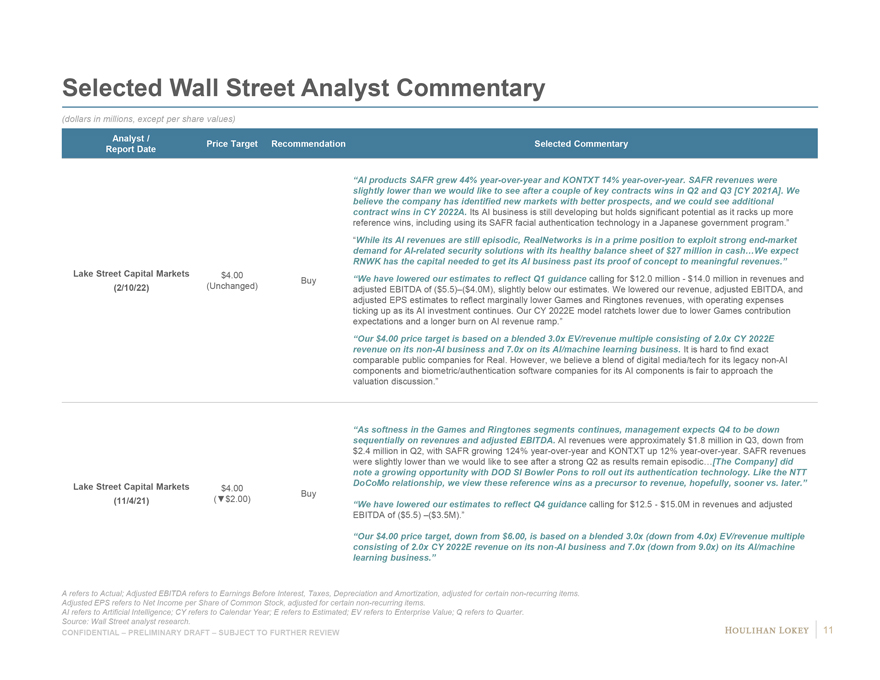
Selected Wall Street Analyst Commentary (dollars in millions, except per share values) Analyst / Price Target Recommendation Selected Commentary Report Date “AI products SAFR grew 44% year-over-year and KONTXT 14% year-over-year. SAFR revenues were slightly lower than we would like to see after a couple of key contracts wins in Q2 and Q3 [CY 2021A]. We believe the company has identified new markets with better prospects, and we could see additional contract wins in CY 2022A. Its AI business is still developing but holds significant potential as it racks up more reference wins, including using its SAFR facial authentication technology in a Japanese government program.” “While its AI revenues are still episodic, RealNetworks is in a prime position to exploit strong end-market demand for AI-related security solutions with its healthy balance sheet of $27 million in cash…We expect RNWK has the capital needed to get its AI business past its proof of concept to meaningful revenues.” Lake Street Capital Markets $4.00 Buy “We have lowered our estimates to reflect Q1 guidance calling for $12.0 million—$14.0 million in revenues and (2/10/22) (Unchanged) adjusted EBITDA of ($5.5)–($4.0M), slightly below our estimates. We lowered our revenue, adjusted EBITDA, and adjusted EPS estimates to reflect marginally lower Games and Ringtones revenues, with operating expenses ticking up as its AI investment continues. Our CY 2022E model ratchets lower due to lower Games contribution expectations and a longer burn on AI revenue ramp.” “Our $4.00 price target is based on a blended 3.0x EV/revenue multiple consisting of 2.0x CY 2022E revenue on its non-AI business and 7.0x on its AI/machine learning business. It is hard to find exact comparable public companies for Real. However, we believe a blend of digital media/tech for its legacy non-AI components and biometric/authentication software companies for its AI components is fair to approach the valuation discussion.” “As softness in the Games and Ringtones segments continues, management expects Q4 to be down sequentially on revenues and adjusted EBITDA. AI revenues were approximately $1.8 million in Q3, down from $2.4 million in Q2, with SAFR growing 124% year-over-year and KONTXT up 12% year-over-year. SAFR revenues were slightly lower than we would like to see after a strong Q2 as results remain episodic…[The Company] did note a growing opportunity with DOD SI Bowler Pons to roll out its authentication technology. Like the NTT Lake Street Capital Markets $4.00 DoCoMo relationship, we view these reference wins as a precursor to revenue, hopefully, sooner vs. later.” Buy (11/4/21) (â–¼$2.00) “We have lowered our estimates to reflect Q4 guidance calling for $12.5—$15.0M in revenues and adjusted EBITDA of ($5.5) –($3.5M).” “Our $4.00 price target, down from $6.00, is based on a blended 3.0x (down from 4.0x) EV/revenue multiple consisting of 2.0x CY 2022E revenue on its non-AI business and 7.0x (down from 9.0x) on its AI/machine learning business.” A refers to Actual; Adjusted EBITDA refers to Earnings Before Interest, Taxes, Depreciation and Amortization, adjusted for certain non-recurring items. Adjusted EPS refers to Net Income per Share of Common Stock, adjusted for certain non-recurring items. AI refers to Artificial Intelligence; CY refers to Calendar Year; E refers to Estimated; EV refers to Enterprise Value; Q refers to Quarter. Source: Wall Street analyst research. 11 CONFIDENTIAL – PRELIMINARY DRAFT – SUBJECT TO FURTHER REVIEW
Appendix Preliminary Financial Projections Observations || Management Baseline Case and Illustrative Investment Case Bridge
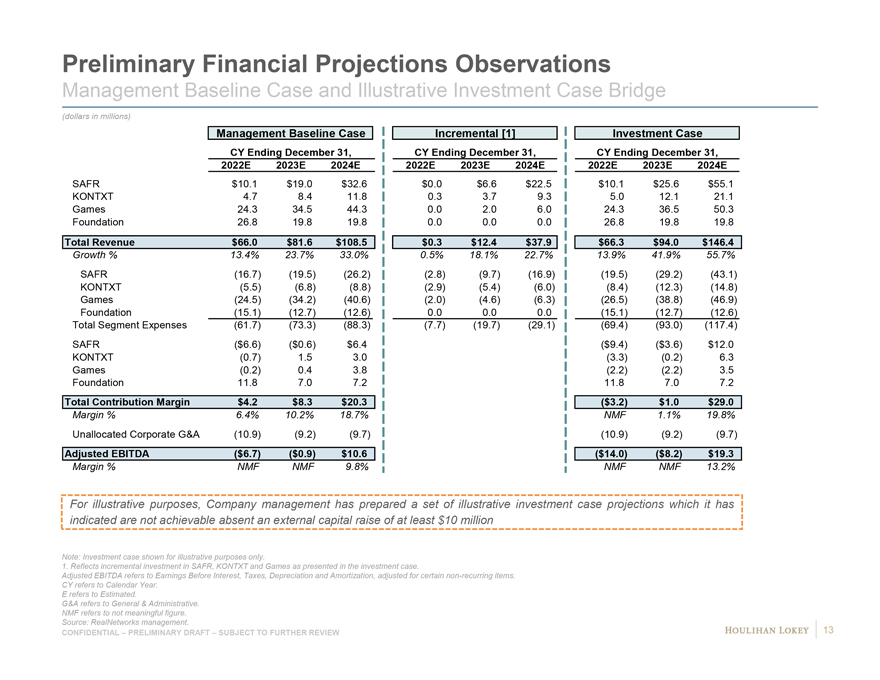
Preliminary Financial Projections Observations Management Baseline Case and Illustrative Investment Case Bridge (dollars in millions) Management Baseline Case Incremental [1] Investment Case CY Ending December 31, CY Ending December 31, CY Ending December 31, 2022E 2023E 2024E 2022E 2023E 2024E 2022E 2023E 2024E SAFR $10.1 $19.0 $32.6 $ 0.0 $6.6 $ 22.5 $10.1 $25.6 $55.1 KONTXT 4.7 8.4 11.8 0.3 3.7 9.3 5.0 12.1 21.1 Games 24.3 34.5 44.3 0.0 2.0 6.0 24.3 36.5 50.3 Foundation 26.8 19.8 19.8 0.0 0.0 0.0 26.8 19.8 19.8 Total Revenue $66.0 $81.6 $108.5 $ 0.3 $12.4 $ 37.9 $66.3 $94.0 $146.4 Growth % 13.4% 23.7% 33.0% 0.5% 18.1% 22.7% 13.9% 41.9% 55.7% SAFR (16.7) (19.5) (26.2) (2.8) (9.7) (16.9) (19.5) (29.2) (43.1) KONTXT (5.5) (6.8) (8.8) (2.9) (5.4) (6.0) (8.4) (12.3) (14.8) Games (24.5) (34.2) (40.6) (2.0) (4.6) (6.3) (26.5) (38.8) (46.9) Foundation (15.1) (12.7) (12.6) 0.0 0.0 0.0 (15.1) (12.7) (12.6) Total Segment Expenses (61.7) (73.3) (88.3) (7.7) (19.7) (29.1) (69.4) (93.0) (117.4) SAFR ($6.6) ($0.6) $6.4 ($9.4) ($3.6) $12.0 KONTXT (0.7) 1.5 3.0 (3.3) (0.2) 6.3 Games (0.2) 0.4 3.8 (2.2) (2.2) 3.5 Foundation 11.8 7.0 7.2 11.8 7.0 7.2 Total Contribution Margin $4.2 $8.3 $20.3 ($3.2) $1.0 $29.0 Margin % 6.4% 10.2% 18.7% NMF 1.1% 19.8% Unallocated Corporate G&A (10.9) (9.2) (9.7) (10.9) (9.2) (9.7) Adjusted EBITDA ($6.7) ($0.9) $10.6 ($14.0) ($8.2) $19.3 Margin % NMF NMF 9.8% NMF NMF 13.2% For illustrative purposes, Company management has prepared a set of illustrative investment case projections which it has indicated are not achievable absent an external capital raise of at least $10 million Note: Investment case shown for illustrative purposes only. 1. Reflects incremental investment in SAFR, KONTXT and Games as presented in the investment case. Adjusted EBITDA refers to Earnings Before Interest, Taxes, Depreciation and Amortization, adjusted for certain non-recurring items. CY refers to Calendar Year. E refers to Estimated. G&A refers to General & Administrative. NMF refers to not meaningful figure. Source: RealNetworks management. 13 CONFIDENTIAL – PRELIMINARY DRAFT – SUBJECT TO FURTHER REVIEW
Disclaimer This presentation, and any supplemental information (written or oral) or other documents provided in connection therewith (collectively, the “materials”), are provided solely for the information of the Special Committee (the “Committee”) of the Board of Directors (the “Board”) of RealNetworks, Inc. (“RealNetworks” or the “Company”) by Houlihan Lokey in connection with the Committee’s consideration of a potential transaction (the “Transaction”) involving the Company. This presentation is incomplete without reference to, and should be considered in conjunction with, any supplemental information provided by and discussions with Houlihan Lokey in connection therewith. Any defined terms used herein shall have the meanings set forth herein, even if such defined terms have been given different meanings elsewhere in the materials. ï,¡ The materials are for discussion purposes only. Houlihan Lokey expressly disclaims any and all liability, whether direct or indirect, in contract or tort or otherwise, to any person in connection with the materials. The materials were prepared for specific persons familiar with the business and affairs of the Company for use in a specific context and were not prepared with a view to public disclosure or to conform with any disclosure standards under any state, federal or international securities laws or other laws, rules or regulations, and none of the Committee, the Company or Houlihan Lokey takes any responsibility for the use of the materials by persons other than the Committee. The materials are provided on a confidential basis solely for the information of the Committee and may not be disclosed, summarized, reproduced, disseminated or quoted or otherwise referred to, in whole or in part, without Houlihan Lokey’s express prior written consent. ï,¡ Notwithstanding any other provision herein, the Company (and each employee, representative or other agent of the Company) may disclose to any and all persons without limitation of any kind, the tax treatment and tax structure of any transaction and all materials of any kind (including opinions or other tax analyses, if any) that are provided to the Company relating to such tax treatment and structure. However, any information relating to the tax treatment and tax structure shall remain confidential (and the foregoing sentence shall not apply) to the extent necessary to enable any person to comply with securities laws. For this purpose, the tax treatment of a transaction is the purported or claimed U.S. income or franchise tax treatment of the transaction and the tax structure of a transaction is any fact that may be relevant to understanding the purported or claimed U.S. income or franchise tax treatment of the transaction. If the Company plans to disclose information pursuant to the first sentence of this paragraph, the Company shall inform those to whom it discloses any such information that they may not rely upon such information for any purpose without Houlihan Lokey’s prior written consent. Houlihan Lokey is not an expert on, and nothing contained in the materials should be construed as advice with regard to, legal, accounting, regulatory, insurance, tax or other specialist matters. Houlihan Lokey’s role in reviewing any information was limited solely to performing such a review as it deemed necessary to support its own advice and analysis and was not on behalf of the Committee. ï,¡ The materials necessarily are based on financial, economic, market and other conditions as in effect on, and the information available to Houlihan Lokey as of, the date of the materials. Although subsequent developments may affect the contents of the materials, Houlihan Lokey has not undertaken, and is under no obligation, to update, revise or reaffirm the materials, except as may be expressly contemplated by Houlihan Lokey’s engagement letter. The materials are not intended to provide the sole basis for evaluation of the Transaction and do not purport to contain all information that may be required. The materials do not address the underlying business decision of the Company or any other party to proceed with or effect the Transaction, or the relative merits of the Transaction as compared to any alternative business strategies or transactions that might be available for the Company or any other party. The materials do not constitute any opinion, nor do the materials constitute a recommendation to the Board, the Committee, the Company, any security holder of the Company or any other party as to how to vote or act with respect to any matter relating to the Transaction or otherwise or whether to buy or sell any assets or securities of any company. Houlihan Lokey’s only opinion is the opinion, if any, that is actually delivered to the Committee. In preparing the materials Houlihan Lokey has acted as an independent contractor and nothing in the materials is intended to create or shall be construed as creating a fiduciary or other relationship between Houlihan Lokey and any party. The materials may not reflect information known to other professionals in other business areas of Houlihan Lokey and its affiliates. ï,¡ The preparation of the materials was a complex process involving quantitative and qualitative judgments and determinations with respect to the financial, comparative and other analytic methods employed and the adaption and application of these methods to the unique facts and circumstances presented and, therefore, is not readily susceptible to partial analysis or summary description. Furthermore, Houlihan Lokey did not attribute any particular weight to any analysis or factor considered by it, but rather made qualitative judgments as to the significance and relevance of each analysis and factor. Each analytical technique has inherent strengths and weaknesses, and the nature of the available information may further affect the value of particular techniques. Accordingly, the analyses contained in the materials must be considered as a whole. Selecting portions of the analyses, analytic methods and factors without considering all analyses and factors could create a misleading or incomplete view. The materials reflect judgments and assumptions with regard to industry performance, general business, economic, regulatory, market and financial conditions and other matters, many of which are beyond the control of the participants in the Transaction. Any estimates of value contained in the materials are not necessarily indicative of actual value or predictive of future results or values, which may be significantly more or less favorable. Any analyses relating to the value of assets, businesses or securities do not purport to be appraisals or to reflect the prices at which any assets, businesses or securities may actually be sold. The materials do not constitute a valuation opinion or credit rating. The materials do not address the consideration to be paid or received in, the terms of any arrangements, understandings, agreements or documents related to, or the form, structure or any other portion or aspect of, the Transaction or otherwise. Furthermore, the materials do not address the fairness of any portion or aspect of the Transaction to any party. In preparing the materials, Houlihan Lokey has not conducted any physical inspection or independent appraisal or evaluation of any of the assets, properties or liabilities (contingent or otherwise) of the Company or any other party and has no obligation to evaluate the solvency of the Company or any other party under any law. CONFIDENTIAL – PRELIMINARY DRAFT – SUBJECT TO FURTHER REVIEW 14
Disclaimer (cont.) All budgets, projections, estimates, financial analyses, reports and other information with respect to operations (including, without limitation, estimates of potential cost savings and synergies) reflected in the materials have been prepared by management of the relevant party or are derived from such budgets, projections, estimates, financial analyses, reports and other information or from other sources, which involve numerous and significant subjective determinations made by management of the relevant party and/or which such management has reviewed and found reasonable. The budgets, projections and estimates (including, without limitation, estimates of potential cost savings and synergies) contained in the materials may or may not be achieved and differences between projected results and those actually achieved may be material. Houlihan Lokey has relied upon representations made by management of the Company and other participants in the Transaction that such budgets, projections and estimates have been reasonably prepared in good faith on bases reflecting the best currently available estimates and judgments of such management (or, with respect to information obtained from public sources, represent reasonable estimates), and Houlihan Lokey expresses no opinion with respect to such budgets, projections or estimates or the assumptions on which they are based. The scope of the financial analysis contained herein is based on discussions with the Company (including, without limitation, regarding the methodologies to be utilized), and Houlihan Lokey does not make any representation, express or implied, as to the sufficiency or adequacy of such financial analysis or the scope thereof for any particular purpose. ï,¡ Houlihan Lokey has assumed and relied upon the accuracy and completeness of the financial and other information provided to, discussed with or reviewed by it without (and without assuming responsibility for) independent verification of such information, makes no representation or warranty (express or implied) in respect of the accuracy or completeness of such information and has further relied upon the assurances of the Company and other participants in the Transaction that they are not aware of any facts or circumstances that would make such information inaccurate or misleading. In addition, Houlihan Lokey has relied upon and assumed, without independent verification, that there has been no change in the business, assets, liabilities, financial condition, results of operations, cash flows or prospects of the Company or any other participant in the Transaction since the respective dates of the most recent financial statements and other information, financial or otherwise, provided to, discussed with or reviewed by Houlihan Lokey that would be material to its analyses, and that the final forms of any draft documents reviewed by Houlihan Lokey will not differ in any material respect from such draft documents. ï,¡ The materials are not an offer to sell or a solicitation of an indication of interest to purchase any security, option, commodity, future, loan or currency. The materials do not constitute a commitment by Houlihan Lokey or any of its affiliates to underwrite, subscribe for or place any securities, to extend or arrange credit, or to provide any other services. In the ordinary course of business, certain of Houlihan Lokey’s affiliates and employees, as well as investment funds in which they may have financial interests or with which they may co-invest, may acquire, hold or sell, long or short positions, or trade or otherwise effect transactions, in debt, equity, and other securities and financial instruments (including loans and other obligations) of, or investments in, the Company, any Transaction counterparty, any other Transaction participant, any other financially interested party with respect to any transaction, other entities or parties that are mentioned in the materials, or any of the foregoing entities’ or parties’ respective affiliates, subsidiaries, investment funds, portfolio companies and representatives (collectively, the “Interested Parties”), or any currency or commodity that may be involved in the Transaction. Houlihan Lokey provides mergers and acquisitions, restructuring and other advisory and consulting services to clients, which may have in the past included, or may currently or in the future include, one or more Interested Parties, for which services Houlihan Lokey has received, and may receive, compensation. Although Houlihan Lokey in the course of such activities and relationships or otherwise may have acquired, or may in the future acquire, information about one or more Interested Parties or the Transaction, or that otherwise may be of interest to the Board, the Committee, or the Company, Houlihan Lokey shall have no obligation to, and may not be contractually permitted to, disclose such information, or the fact that Houlihan Lokey is in possession of such information, to the Board, the Committee, or the Company or to use such information on behalf of the Board, the Committee, or the Company. Houlihan Lokey’s personnel may make statements or provide advice that is contrary to information contained in the materials. CONFIDENTIAL – PRELIMINARY DRAFT – SUBJECT TO FURTHER REVIEW 15

CORPORATE FINANCE FINANCIAL RESTRUCTURING FINANCIAL AND VALUATION ADVISORY HL.com