- RNWK Dashboard
- Financials
- Filings
-
Holdings
- Transcripts
-
ETFs
- Insider
- Institutional
- Shorts
-
SC 13E3 Filing
Realnetworks (RNWK) SC 13E3Going private transaction
Filed: 19 Sep 22, 7:07am
Exhibit (c)(5)
Project Blue PRELIMINARY DISCUSSION MATERIALS FOR THE SPECIAL COMMITTEE OF THE BOARD OF DIRECTORS JUNE 3, 2022 | CONFIDENTIAL – PRELIMINARY DRAFT – SUBJECT TO FURTHER REVIEW
Table of Contents Page 1. Executive Summary 3 2. Preliminary Illustrative Unfunded Status Quo Case Financial Analyses 11 3. Preliminary Considerations Related to Proposal 26 4. Appendix 37 Supplemental Historical Financial Information 38 Supplemental Illustrative Financial Analysis Information 43 5. Disclaimer 46
Page 1. Executive Summary 3 2. Preliminary Illustrative Unfunded Status Quo Case Financial Analyses 11 3. Preliminary Considerations Related to Proposal 26 4. Appendix 37 5. Disclaimer 46
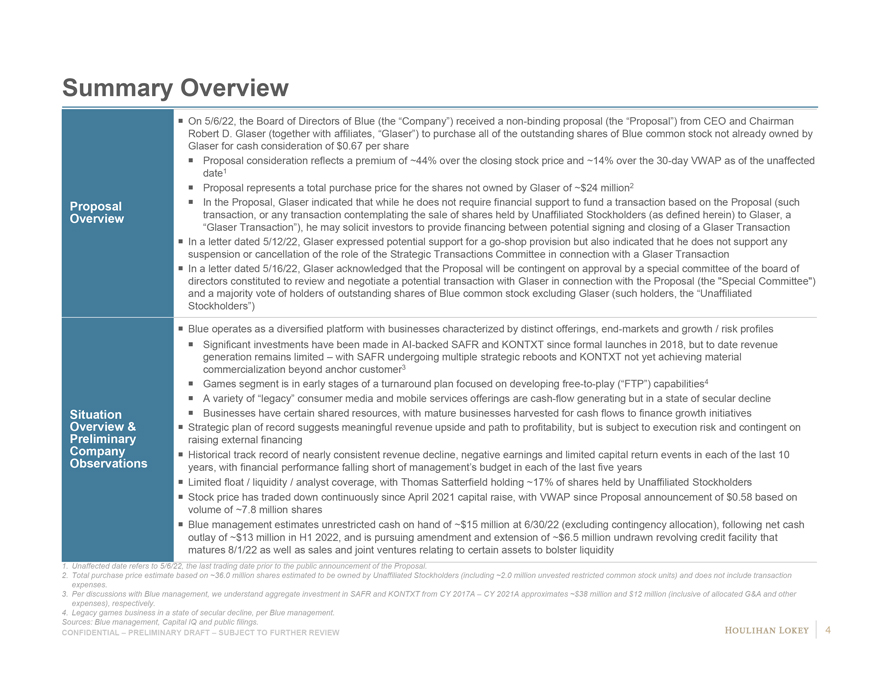
Summary Overview On 5/6/22, the Board of Directors of Blue (the Company ) received a non-binding proposal (the Proposal ) from CEO and Chairman Robert D. Glaser (together with affiliates, Glaser ) to purchase all of the outstanding shares of Blue common stock not already owned by Glaser for cash consideration of $0.67 per share Proposal consideration reflects a premium of ~44% over the closing stock price and ~14% over the 30-day VWAP as of the unaffected date1 Proposal represents a total purchase price for the shares not owned by Glaser of ~$24 million2 Proposal In the Proposal, Glaser indicated that while he does not require financial support to fund a transaction based on the Proposal (such Overview transaction, or any transaction contemplating the sale of shares held by Unaffiliated Stockholders (as defined herein) to Glaser, a Glaser Transaction ), he may solicit investors to provide financing between potential signing and closing of a Glaser Transaction In a letter dated 5/12/22, Glaser expressed potential support for a go-shop provision but also indicated that he does not support any suspension or cancellation of the role of the Strategic Transactions Committee in connection with a Glaser Transaction In a letter dated 5/16/22, Glaser acknowledged that the Proposal will be contingent on approval by a special committee of the board of directors constituted to review and negotiate a potential transaction with Glaser in connection with the Proposal (the “Special Committee”) and a majority vote of holders of outstanding shares of Blue common stock excluding Glaser (such holders, the Unaffiliated Stockholders ) Blue operates as a diversified platform with businesses characterized by distinct offerings, end-markets and growth / risk profiles Significant investments have been made in AI-backed SAFR and KONTXT since formal launches in 2018, but to date revenue generation remains limited with SAFR undergoing multiple strategic reboots and KONTXT not yet achieving material commercialization beyond anchor customer3 Games segment is in early stages of a turnaround plan focused on developing free-to-play ( FTP ) capabilities4 A variety of legacy consumer media and mobile services offerings are cash-flow generating but in a state of secular decline Situation Businesses have certain shared resources, with mature businesses harvested for cash flows to finance growth initiatives Overview & Strategic plan of record suggests meaningful revenue upside and path to profitability, but is subject to execution risk and contingent on Preliminary raising external financing Company Historical track record of nearly consistent revenue decline, negative earnings and limited capital return events in each of the last 10 Observations years, with financial performance falling short of management s budget in each of the last five years Limited float / liquidity / analyst coverage, with Thomas Satterfield holding ~17% of shares held by Unaffiliated Stockholders Stock price has traded down continuously since April 2021 capital raise, with VWAP since Proposal announcement of $0.58 based on volume of ~7.8 million shares Blue management estimates unrestricted cash on hand of ~$15 million at 6/30/22 (excluding contingency allocation), following net cash outlay of ~$13 million in H1 2022, and is pursuing amendment and extension of ~$6.5 million undrawn revolving credit facility that matures 8/1/22 as well as sales and joint ventures relating to certain assets to bolster liquidity 1. Unaffected date refers to 5/6/22, the last trading date prior to the public announcement of the Proposal. 2. Total purchase price estimate based on ~36.0 million shares estimated to be owned by Unaffiliated Stockholders (including ~2.0 million unvested restricted common stock units) and does not include transaction expenses. 3. Per discussions with Blue management, we understand aggregate investment in SAFR and KONTXT from CY 2017A CY 2021A approximates ~$38 million and $12 million (inclusive of allocated G&A and other expenses), respectively. 4. Legacy games business in a state of secular decline, per Blue management. Sources: Blue management, Capital IQ and public filings. 4 CONFIDENTIAL PRELIMINARY DRAFT SUBJECT TO FURTHER REVIEW
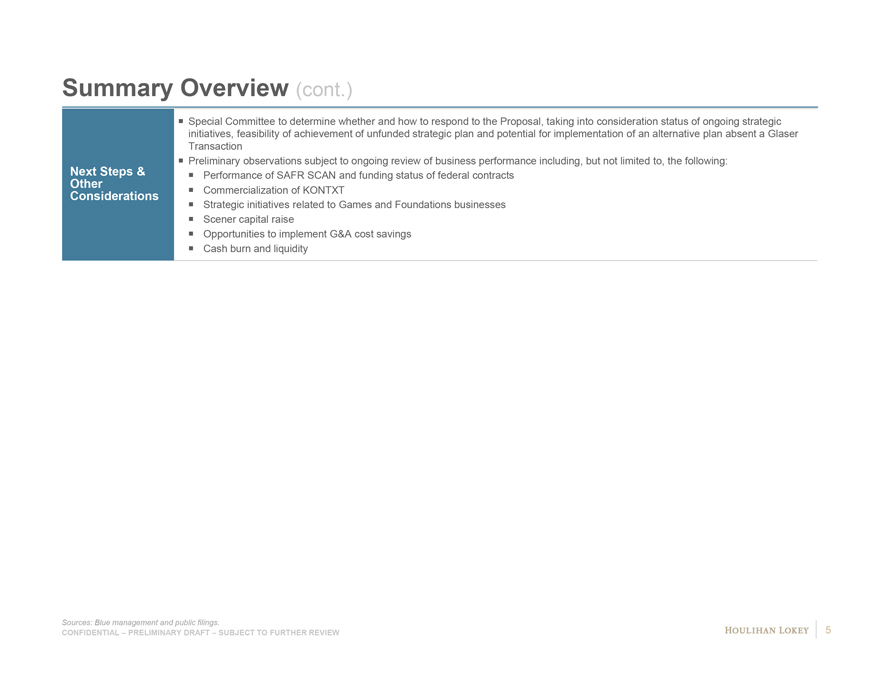
Summary Overview (cont.) Special Committee to determine whether and how to respond to the Proposal, taking into consideration status of ongoing strategic initiatives, feasibility of achievement of unfunded strategic plan and potential for implementation of an alternative plan absent a Glaser Transaction Next Steps & Preliminary observations subject to ongoing review of business performance including, but not limited to, the following: Performance of SAFR SCAN and funding status of federal contracts Other Commercialization of KONTXT Considerations Strategic initiatives related to Games and Foundations businesses Scener capital raise Opportunities to implement G&A cost savings Cash burn and liquidity Sources: Blue management and public filings. CONFIDENTIAL – PRELIMINARY DRAFT – SUBJECT TO FURTHER REVIEW 5
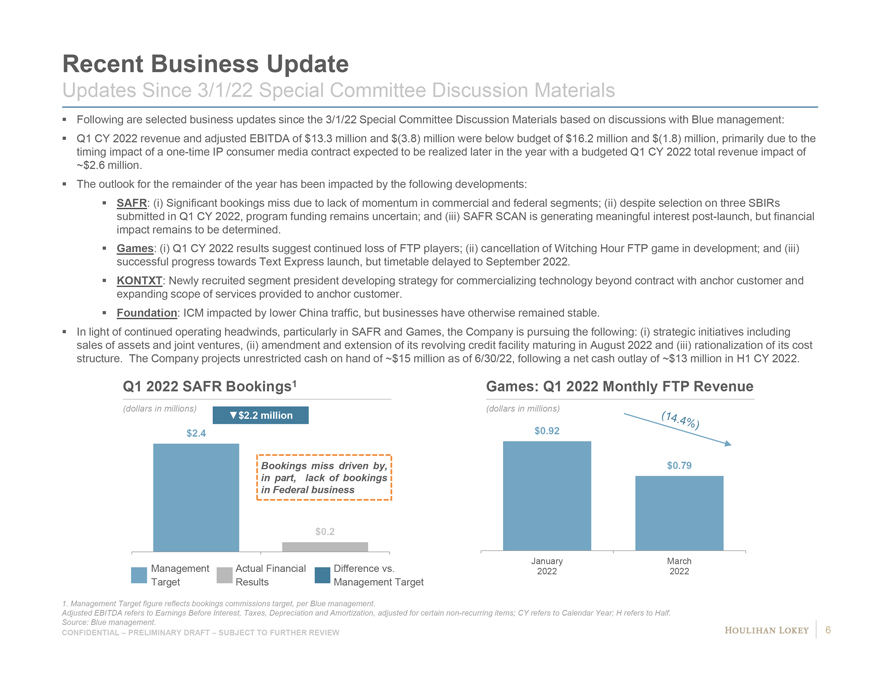
Recent Business Update Updates Since 3/1/22 Special Committee Discussion Materials Following are selected business updates since the 3/1/22 Special Committee Discussion Materials based on discussions with Blue management: Q1 CY 2022 revenue and adjusted EBITDA of $13.3 million and $(3.8) million were below budget of $16.2 million and $(1.8) million, primarily due to the timing impact of a one-time IP consumer media contract expected to be realized later in the year with a budgeted Q1 CY 2022 total revenue impact of ~$2.6 million. The outlook for the remainder of the year has been impacted by the following developments: SAFR: (i) Significant bookings miss due to lack of momentum in commercial and federal segments; (ii) despite selection on three SBIRs submitted in Q1 CY 2022, program funding remains uncertain; and (iii) SAFR SCAN is generating meaningful interest post-launch, but financial impact remains to be determined. Games: (i) Q1 CY 2022 results suggest continued loss of FTP players; (ii) cancellation of Witching Hour FTP game in development; and (iii) successful progress towards Text Express launch, but timetable delayed to September 2022. KONTXT: Newly recruited segment president developing strategy for commercializing technology beyond contract with anchor customer and expanding scope of services provided to anchor customer. Foundation: ICM impacted by lower China traffic, but businesses have otherwise remained stable. In light of continued operating headwinds, particularly in SAFR and Games, the Company is pursuing the following: (i) strategic initiatives including sales of assets and joint ventures, (ii) amendment and extension of its revolving credit facility maturing in August 2022 and (iii) rationalization of its cost structure. The Company projects unrestricted cash on hand of ~$15 million as of 6/30/22, following a net cash outlay of ~$13 million in H1 CY 2022. Q1 2022 SAFR Bookings1 Games: Q1 2022 Monthly FTP Revenue (dollars in millions) (dollars in millions) $2.2 million $2.4 $0.92 Bookings miss driven by, $0.79 in part, lack of bookings in Federal business $0.2 January March Management Actual Financial Difference vs. 2022 2022 Target Results Management Target 1. Management Target figure reflects bookings commissions target, per Blue management. Adjusted EBITDA refers to Earnings Before Interest, Taxes, Depreciation and Amortization, adjusted for certain non-recurring items; CY refers to Calendar Year; H refers to Half. Source: Blue management. 6 CONFIDENTIAL – PRELIMINARY DRAFT – SUBJECT TO FURTHER REVIEW
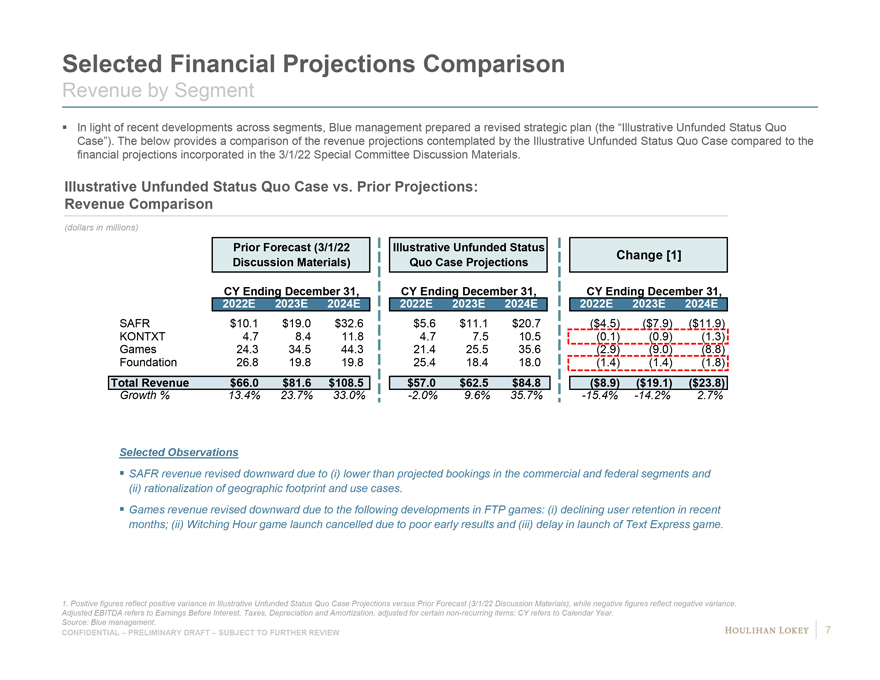
Selected Financial Projections Comparison Revenue by Segment In light of recent developments across segments, Blue management prepared a revised strategic plan (the “Illustrative Unfunded Status Quo Case”). The below provides a comparison of the revenue projections contemplated by the Illustrative Unfunded Status Quo Case compared to the financial projections incorporated in the 3/1/22 Special Committee Discussion Materials. Illustrative Unfunded Status Quo Case vs. Prior Projections: Revenue Comparison (dollars in millions) Prior Forecast (3/1/22 Illustrative Unfunded Status Change [1] Discussion Materials) Quo Case Projections CY Ending December 31, CY Ending December 31, CY Ending December 31, 2022E 2023E 2024E 2022E 2023E 2024E 2022E 2023E 2024E SAFR $10.1 $19.0 $32.6 $5.6 $11.1 $20.7 ($4.5) ($7.9) ($11.9) KONTXT 4.7 8.4 11.8 4.7 7.5 10.5 (0.1) (0.9) (1.3) Games 24.3 34.5 44.3 21.4 25.5 35.6 (2.9) (9.0) (8.8) Foundation 26.8 19.8 19.8 25.4 18.4 18.0 (1.4) (1.4) (1.8) Total Revenue $66.0 $81.6 $108.5 $57.0 $62.5 $84.8 ($8.9) ($19.1) ($23.8) Growth % 13.4% 23.7% 33.0% -2.0% 9.6% 35.7% -15.4% -14.2% 2.7% Selected Observations SAFR revenue revised downward due to (i) lower than projected bookings in the commercial and federal segments and (ii) rationalization of geographic footprint and use cases. Games revenue revised downward due to the following developments in FTP games: (i) declining user retention in recent months; (ii) Witching Hour game launch cancelled due to poor early results and (iii) delay in launch of Text Express game. 1. Positive figures reflect positive variance in Illustrative Unfunded Status Quo Case Projections versus Prior Forecast (3/1/22 Discussion Materials), while negative figures reflect negative variance. Adjusted EBITDA refers to Earnings Before Interest, Taxes, Depreciation and Amortization, adjusted for certain non-recurring items; CY refers to Calendar Year. Source: Blue management. 7 CONFIDENTIAL – PRELIMINARY DRAFT – SUBJECT TO FURTHER REVIEW
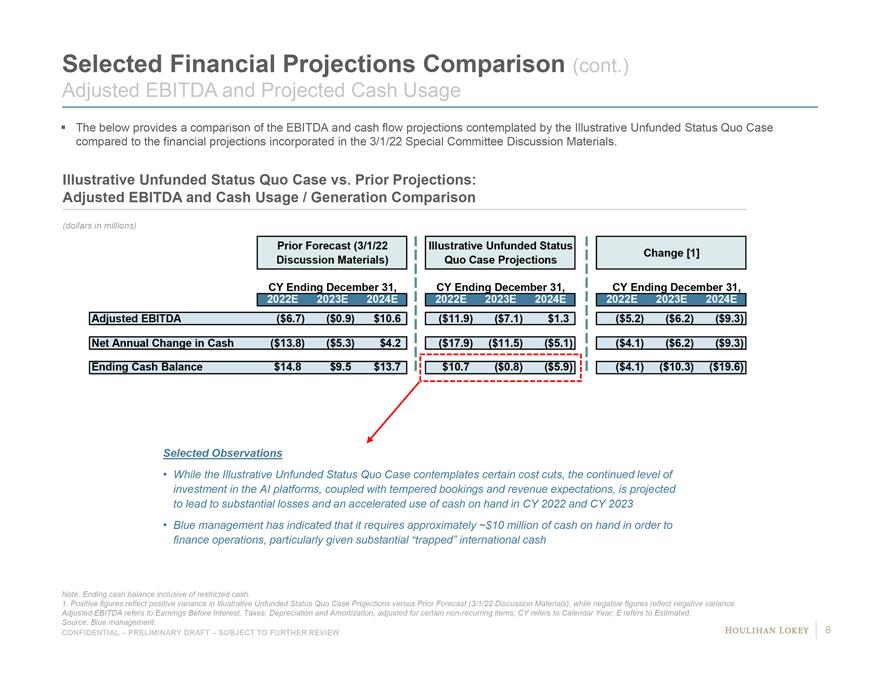
Selected Financial Projections Comparison (cont.) Adjusted EBITDA and Projected Cash Usage The below provides a comparison of the EBITDA and cash flow projections contemplated by the Illustrative Unfunded Status Quo Case compared to the financial projections incorporated in the 3/1/22 Special Committee Discussion Materials. Illustrative Unfunded Status Quo Case vs. Prior Projections: Adjusted EBITDA and Cash Usage / Generation Comparison (dollars in millions) Prior Forecast (3/1/22 Illustrative Unfunded Status Change [1] Discussion Materials) Quo Case Projections CY Ending December 31, CY Ending December 31, CY Ending December 31, 2022E 2023E 2024E 2022E 2023E 2024E 2022E 2023E 2024E Adjusted EBITDA ($6.7) ($0.9) $10.6 ($11.9) ($7.1) $1.3 ($5.2) ($6.2) ($9.3) Net Annual Change in Cash ($13.8) ($5.3) $4.2 ($17.9) ($11.5) ($5.1) ($4.1) ($6.2) ($9.3) Ending Cash Balance $14.8 $9.5 $13.7 $10.7 ($0.8) ($5.9) ($4.1) ($10.3) ($19.6) Selected Observations • While the Illustrative Unfunded Status Quo Case contemplates certain cost cuts, the continued level of investment in the AI platforms, coupled with tempered bookings and revenue expectations, is projected to lead to substantial losses and an accelerated use of cash on hand in CY 2022 and CY 2023 • Blue management has indicated that it requires approximately ~$10 million of cash on hand in order to finance operations, particularly given substantial “trapped” international cash Note: Ending cash balance inclusive of restricted cash. 1. Positive figures reflect positive variance in Illustrative Unfunded Status Quo Case Projections versus Prior Forecast (3/1/22 Discussion Materials), while negative figures reflect negative variance. Adjusted EBITDA refers to Earnings Before Interest, Taxes, Depreciation and Amortization, adjusted for certain non-recurring items; CY refers to Calendar Year; E refers to Estimated. Source: Blue management. 8 CONFIDENTIAL – PRELIMINARY DRAFT – SUBJECT TO FURTHER REVIEW
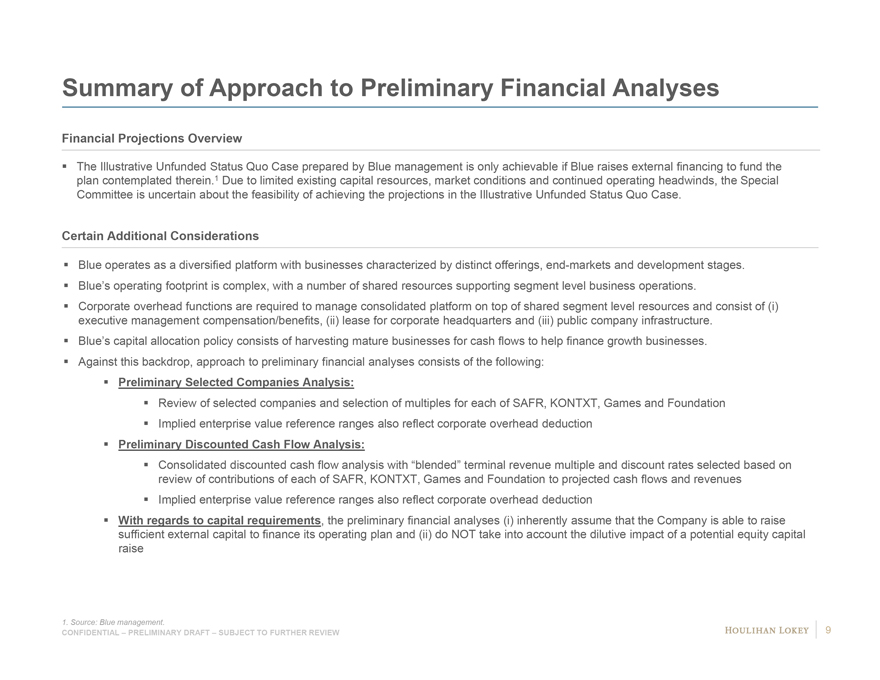
Summary of Approach to Preliminary Financial Analyses Financial Projections Overview The Illustrative Unfunded Status Quo Case prepared by Blue management is only achievable if Blue raises external financing to fund the plan contemplated therein.1 Due to limited existing capital resources, market conditions and continued operating headwinds, the Special Committee is uncertain about the feasibility of achieving the projections in the Illustrative Unfunded Status Quo Case. Certain Additional Considerations Blue operates as a diversified platform with businesses characterized by distinct offerings, end-markets and development stages. Blue’s operating footprint is complex, with a number of shared resources supporting segment level business operations. Corporate overhead functions are required to manage consolidated platform on top of shared segment level resources and consist of (i) executive management compensation/benefits, (ii) lease for corporate headquarters and (iii) public company infrastructure. Blue’s capital allocation policy consists of harvesting mature businesses for cash flows to help finance growth businesses. Against this backdrop, approach to preliminary financial analyses consists of the following: Preliminary Selected Companies Analysis: Review of selected companies and selection of multiples for each of SAFR, KONTXT, Games and Foundation Implied enterprise value reference ranges also reflect corporate overhead deduction Preliminary Discounted Cash Flow Analysis: Consolidated discounted cash flow analysis with “blended” terminal revenue multiple and discount rates selected based on review of contributions of each of SAFR, KONTXT, Games and Foundation to projected cash flows and revenues Implied enterprise value reference ranges also reflect corporate overhead deduction With regards to capital requirements, the preliminary financial analyses (i) inherently assume that the Company is able to raise sufficient external capital to finance its operating plan and (ii) do NOT take into account the dilutive impact of a potential equity capital raise 1. Source: Blue management. 9 CONFIDENTIAL – PRELIMINARY DRAFT – SUBJECT TO FURTHER REVIEW
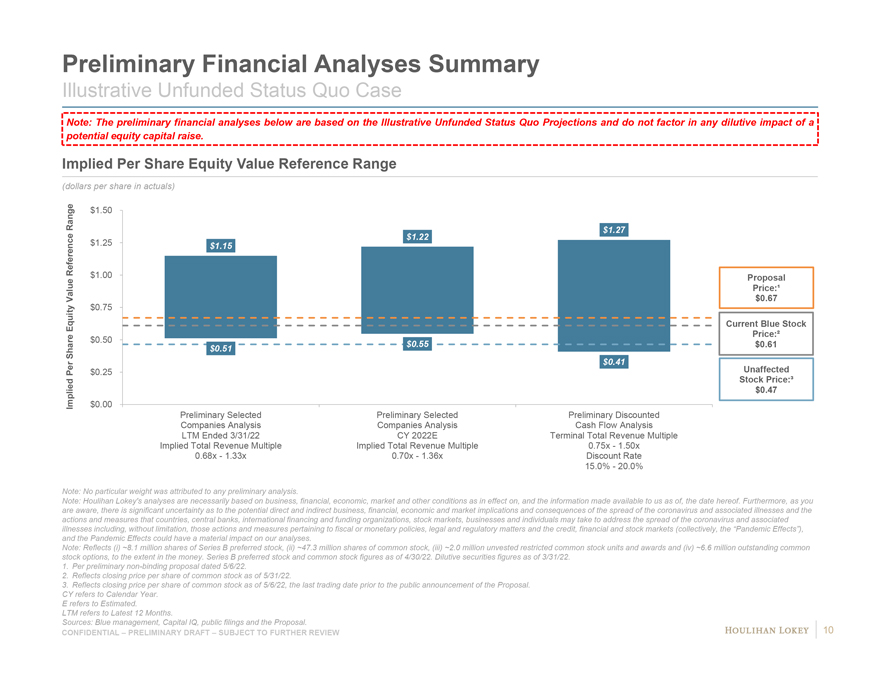
Preliminary Financial Analyses Summary Illustrative Unfunded Status Quo Case Note: The preliminary financial analyses below are based on the Illustrative Unfunded Status Quo Projections and do not factor in any dilutive impact of a potential equity capital raise. Implied Per Share Equity Value Reference Range (dollars per share in actuals) Range $1.50 $1.27 $1.22 Reference $1.25 $1.15 $1.00 Proposal Price:ą Value $0.67 $0.75 Equity Current Blue Stock $0.50 Price:² $0.55 $0.61 Share $0.51 $0.41 Per $0.25 Unaffected Stock Price:ł $0.47 Implied $0.00 Preliminary Selected Preliminary Selected Preliminary Discounted Companies Analysis Companies Analysis Cash Flow Analysis LTM Ended 3/31/22 CY 2022E Terminal Total Revenue Multiple Implied Total Revenue Multiple Implied Total Revenue Multiple 0.75x—1.50x 0.68x—1.33x 0.70x—1.36x Discount Rate 15.0%—20.0% Note: No particular weight was attributed to any preliminary analysis. Note: Houlihan Lokey’s analyses are necessarily based on business, financial, economic, market and other conditions as in effect on, and the information made available to us as of, the date hereof. Furthermore, as you are aware, there is significant uncertainty as to the potential direct and indirect business, financial, economic and market implications and consequences of the spread of the coronavirus and associated illnesses and the actions and measures that countries, central banks, international financing and funding organizations, stock markets, businesses and individuals may take to address the spread of the coronavirus and associated illnesses including, without limitation, those actions and measures pertaining to fiscal or monetary policies, legal and regulatory matters and the credit, financial and stock markets (collectively, the “Pandemic Effects”), and the Pandemic Effects could have a material impact on our analyses. Note: Reflects (i) ~8.1 million shares of Series B preferred stock, (ii) ~47.3 million shares of common stock, (iii) ~2.0 million unvested restricted common stock units and awards and (iv) ~6.6 million outstanding common stock options, to the extent in the money. Series B preferred stock and common stock figures as of 4/30/22. Dilutive securities figures as of 3/31/22. 1. Per preliminary non-binding proposal dated 5/6/22. 2. Reflects closing price per share of common stock as of 5/31/22. 3. Reflects closing price per share of common stock as of 5/6/22, the last trading date prior to the public announcement of the Proposal. CY refers to Calendar Year. E refers to Estimated. LTM refers to Latest 12 Months. Sources: Blue management, Capital IQ, public filings and the Proposal. 10 CONFIDENTIAL – PRELIMINARY DRAFT – SUBJECT TO FURTHER REVIEW
Page 1. Executive Summary 3 2. Preliminary Illustrative Unfunded Status Quo Case Financial Analyses 11 3. Preliminary Considerations Related to Proposal 26 4. Appendix 37 5. Disclaimer 46
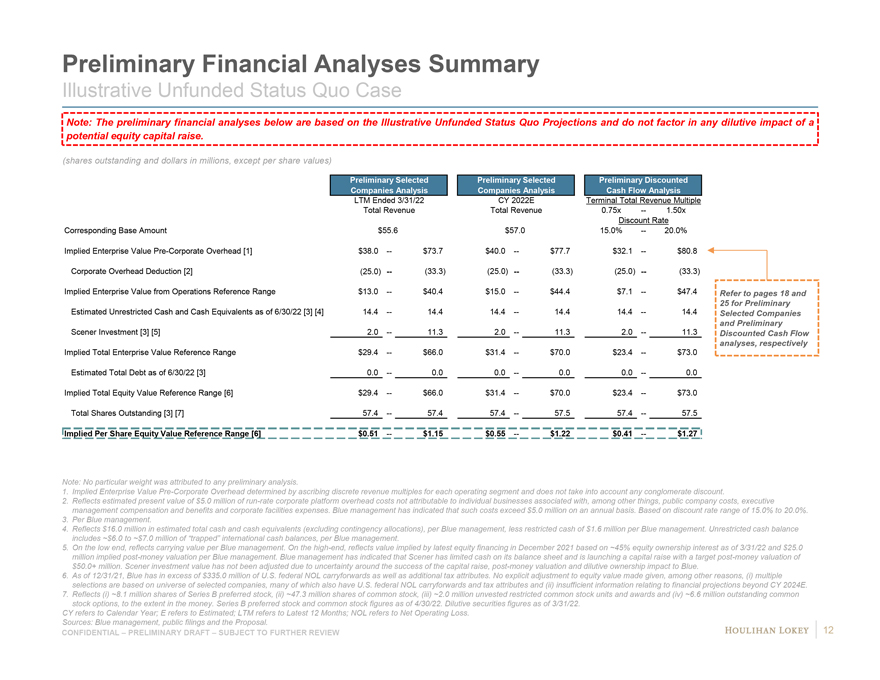
Preliminary Financial Analyses Summary Illustrative Unfunded Status Quo Case Note: The preliminary financial analyses below are based on the Illustrative Unfunded Status Quo Projections and do not factor in any dilutive impact of a potential equity capital raise. (shares outstanding and dollars in millions, except per share values) Preliminary Selected Preliminary Selected Preliminary Discounted Companies Analysis Companies Analysis Cash Flow Analysis LTM Ended 3/31/22 CY 2022E Terminal Total Revenue Multiple Total Revenue Total Revenue 0.75x — 1.50x Discount Rate Corresponding Base Amount $55.6 $57.0 15.0% — 20.0% Implied Enterprise Value Pre-Corporate Overhead [1] $38.0 — $73.7 $40.0 — $77.7 $32.1 — $80.8 Corporate Overhead Deduction [2] (25.0) — (33.3) (25.0) — (33.3) (25.0) — (33.3) Implied Enterprise Value from Operations Reference Range $13.0 — $40.4 $15.0 — $44.4 $7.1 — $47.4 Refer to pages 18 and 25 for Preliminary Estimated Unrestricted Cash and Cash Equivalents as of 6/30/22 [3] [4] 14.4 — 14.4 14.4 — 14.4 14.4 — 14.4 Selected Companies and Preliminary Scener Investment [3] [5] 2.0 — 11.3 2.0 — 11.3 2.0 — 11.3 Discounted Cash Flow analyses, respectively Implied Total Enterprise Value Reference Range $29.4 — $66.0 $31.4 — $70.0 $23.4 — $73.0 Estimated Total Debt as of 6/30/22 [3] 0.0 — 0.0 0.0 — 0.0 0.0 — 0.0 Implied Total Equity Value Reference Range [6] $29.4 — $66.0 $31.4 — $70.0 $23.4 — $73.0 Total Shares Outstanding [3] [7] 57.4 — 57.4 57.4 — 57.5 57.4 — 57.5 Implied Per Share Equity Value Reference Range [6] $0.51 — $1.15 $0.55 — $1.22 $0.41 — $1.27 Note: No particular weight was attributed to any preliminary analysis. 1. Implied Enterprise Value Pre-Corporate Overhead determined by ascribing discrete revenue multiples for each operating segment and does not take into account any conglomerate discount. 2. Reflects estimated present value of $5.0 million of run-rate corporate platform overhead costs not attributable to individual businesses associated with, among other things, public company costs, executive management compensation and benefits and corporate facilities expenses. Blue management has indicated that such costs exceed $5.0 million on an annual basis. Based on discount rate range of 15.0% to 20.0%. 3. Per Blue management. 4. Reflects $16.0 million in estimated total cash and cash equivalents (excluding contingency allocations), per Blue management, less restricted cash of $1.6 million per Blue management. Unrestricted cash balance includes ~$6.0 to ~$7.0 million of “trapped” international cash balances, per Blue management. 5. On the low end, reflects carrying value per Blue management. On the high-end, reflects value implied by latest equity financing in December 2021 based on ~45% equity ownership interest as of 3/31/22 and $25.0 million implied post-money valuation per Blue management. Blue management has indicated that Scener has limited cash on its balance sheet and is launching a capital raise with a target post-money valuation of $50.0+ million. Scener investment value has not been adjusted due to uncertainty around the success of the capital raise, post-money valuation and dilutive ownership impact to Blue. 6. As of 12/31/21, Blue has in excess of $335.0 million of U.S. federal NOL carryforwards as well as additional tax attributes. No explicit adjustment to equity value made given, among other reasons, (i) multiple selections are based on universe of selected companies, many of which also have U.S. federal NOL carryforwards and tax attributes and (ii) insufficient information relating to financial projections beyond CY 2024E. 7. Reflects (i) ~8.1 million shares of Series B preferred stock, (ii) ~47.3 million shares of common stock, (iii) ~2.0 million unvested restricted common stock units and awards and (iv) ~6.6 million outstanding common stock options, to the extent in the money. Series B preferred stock and common stock figures as of 4/30/22. Dilutive securities figures as of 3/31/22. CY refers to Calendar Year; E refers to Estimated; LTM refers to Latest 12 Months; NOL refers to Net Operating Loss. Sources: Blue management, public filings and the Proposal. 12 CONFIDENTIAL – PRELIMINARY DRAFT – SUBJECT TO FURTHER REVIEW
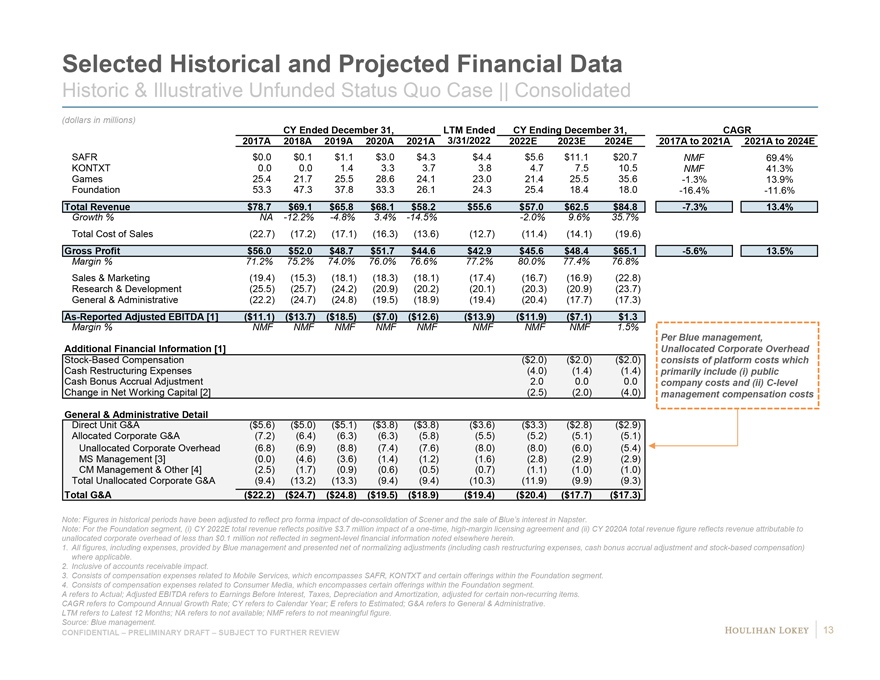
Selected Historical and Projected Financial Data Historic & Illustrative Unfunded Status Quo Case || Consolidated (dollars in millions) CY Ended December 31, LTM Ended CY Ending December 31, CAGR 2017A 2018A 2019A 2020A 2021A 3/31/2022 2022E 2023E 2024E 2017A to 2021A 2021A to 2024E SAFR $0.0 $0.1 $1.1 $3.0 $4.3 $4.4 $5.6 $11.1 $20.7 NMF 69.4% KONTXT 0.0 0.0 1.4 3.3 3.7 3.8 4.7 7.5 10.5 NMF 41.3% Games 25.4 21.7 25.5 28.6 24.1 23.0 21.4 25.5 35.6 -1.3% 13.9% Foundation 53.3 47.3 37.8 33.3 26.1 24.3 25.4 18.4 18.0 -16.4% -11.6% Total Revenue $78.7 $69.1 $65.8 $68.1 $58.2 $55.6 $57.0 $62.5 $84.8 -7.3% 13.4% Growth % NA -12.2% -4.8% 3.4% -14.5% -2.0% 9.6% 35.7% Total Cost of Sales (22.7) (17.2) (17.1) (16.3) (13.6) (12.7) (11.4) (14.1) (19.6) Gross Profit $56.0 $52.0 $48.7 $51.7 $44.6 $42.9 $45.6 $48.4 $65.1 -5.6% 13.5% Margin % 71.2% 75.2% 74.0% 76.0% 76.6% 77.2% 80.0% 77.4% 76.8% Sales & Marketing (19.4) (15.3) (18.1) (18.3) (18.1) (17.4) (16.7) (16.9) (22.8) Research & Development (25.5) (25.7) (24.2) (20.9) (20.2) (20.1) (20.3) (20.9) (23.7) General & Administrative (22.2) (24.7) (24.8) (19.5) (18.9) (19.4) (20.4) (17.7) (17.3) As-Reported Adjusted EBITDA [1] ($11.1) ($13.7) ($18.5) ($7.0) ($12.6) ($13.9) ($11.9) ($7.1) $1.3 Margin % NMF NMF NMF NMF NMF NMF NMF NMF 1.5% Per Blue management, Additional Financial Information [1] Unallocated Corporate Overhead Stock-Based Compensation ($2.0) ($2.0) ($2.0) consists of platform costs which Cash Restructuring Expenses (4.0) (1.4) (1.4) primarily include (i) public Cash Bonus Accrual Adjustment 2.0 0.0 0.0 company costs and (ii) C-level Change in Net Working Capital [2] (2.5) (2.0) (4.0) management compensation costs General & Administrative Detail Direct Unit G&A ($5.6) ($5.0) ($5.1) ($3.8) ($3.8) ($3.6) ($3.3) ($2.8) ($2.9) Allocated Corporate G&A (7.2) (6.4) (6.3) (6.3) (5.8) (5.5) (5.2) (5.1) (5.1) Unallocated Corporate Overhead (6.8) (6.9) (8.8) (7.4) (7.6) (8.0) (8.0) (6.0) (5.4) MS Management [3] (0.0) (4.6) (3.6) (1.4) (1.2) (1.6) (2.8) (2.9) (2.9) CM Management & Other [4] (2.5) (1.7) (0.9) (0.6) (0.5) (0.7) (1.1) (1.0) (1.0) Total Unallocated Corporate G&A (9.4) (13.2) (13.3) (9.4) (9.4) (10.3) (11.9) (9.9) (9.3) Total G&A ($22.2) ($24.7) ($24.8) ($19.5) ($18.9) ($19.4) ($20.4) ($17.7) ($17.3) Note: Figures in historical periods have been adjusted to reflect pro forma impact of de-consolidation of Scener and the sale of Blue’s interest in Napster. Note: For the Foundation segment, (i) CY 2022E total revenue reflects positive $3.7 million impact of a one-time, high-margin licensing agreement and (ii) CY 2020A total revenue figure reflects revenue attributable to unallocated corporate overhead of less than $0.1 million not reflected in segment-level financial information noted elsewhere herein. 1. All figures, including expenses, provided by Blue management and presented net of normalizing adjustments (including cash restructuring expenses, cash bonus accrual adjustment and stock-based compensation) where applicable. 2. Inclusive of accounts receivable impact. 3. Consists of compensation expenses related to Mobile Services, which encompasses SAFR, KONTXT and certain offerings within the Foundation segment. 4. Consists of compensation expenses related to Consumer Media, which encompasses certain offerings within the Foundation segment. A refers to Actual; Adjusted EBITDA refers to Earnings Before Interest, Taxes, Depreciation and Amortization, adjusted for certain non-recurring items. CAGR refers to Compound Annual Growth Rate; CY refers to Calendar Year; E refers to Estimated; G&A refers to General & Administrative. LTM refers to Latest 12 Months; NA refers to not available; NMF refers to not meaningful figure. Source: Blue management. 13 CONFIDENTIAL – PRELIMINARY DRAFT – SUBJECT TO FURTHER REVIEW
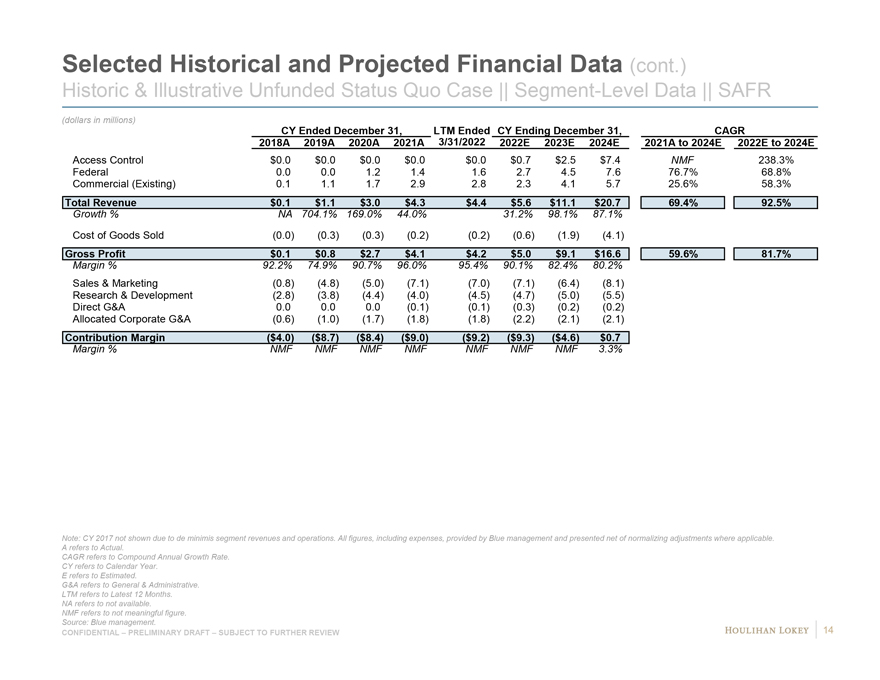
Selected Historical and Projected Financial Data (cont.) Historic & Illustrative Unfunded Status Quo Case || Segment-Level Data || SAFR (dollars in millions) CY Ended December 31, LTM Ended CY Ending December 31, CAGR 2018A 2019A 2020A 2021A 3/31/2022 2022E 2023E 2024E 2021A to 2024E 2022E to 2024E Access Control $0.0 $0.0 $0.0 $0.0 $0.0 $0.7 $2.5 $7.4 NMF 238.3% Federal 0.0 0.0 1.2 1.4 1.6 2.7 4.5 7.6 76.7% 68.8% Commercial (Existing) 0.1 1.1 1.7 2.9 2.8 2.3 4.1 5.7 25.6% 58.3% Total Revenue $0.1 $1.1 $3.0 $4.3 $4.4 $5.6 $11.1 $20.7 69.4% 92.5% Growth % NA 704.1% 169.0% 44.0% 31.2% 98.1% 87.1% Cost of Goods Sold (0.0) (0.3) (0.3) (0.2) (0.2) (0.6) (1.9) (4.1) Gross Profit $0.1 $0.8 $2.7 $4.1 $4.2 $5.0 $9.1 $16.6 59.6% 81.7% Margin % 92.2% 74.9% 90.7% 96.0% 95.4% 90.1% 82.4% 80.2% Sales & Marketing (0.8) (4.8) (5.0) (7.1) (7.0) (7.1) (6.4) (8.1) Research & Development (2.8) (3.8) (4.4) (4.0) (4.5) (4.7) (5.0) (5.5) Direct G&A 0.0 0.0 0.0 (0.1) (0.1) (0.3) (0.2) (0.2) Allocated Corporate G&A (0.6) (1.0) (1.7) (1.8) (1.8) (2.2) (2.1) (2.1) Contribution Margin ($4.0) ($8.7) ($8.4) ($9.0) ($9.2) ($9.3) ($4.6) $0.7 Margin % NMF NMF NMF NMF NMF NMF NMF 3.3% Note: CY 2017 not shown due to de minimis segment revenues and operations. All figures, including expenses, provided by Blue management and presented net of normalizing adjustments where applicable. A refers to Actual. CAGR refers to Compound Annual Growth Rate. CY refers to Calendar Year. E refers to Estimated. G&A refers to General & Administrative. LTM refers to Latest 12 Months. NA refers to not available. NMF refers to not meaningful figure. Source: Blue management. 14 CONFIDENTIAL – PRELIMINARY DRAFT – SUBJECT TO FURTHER REVIEW
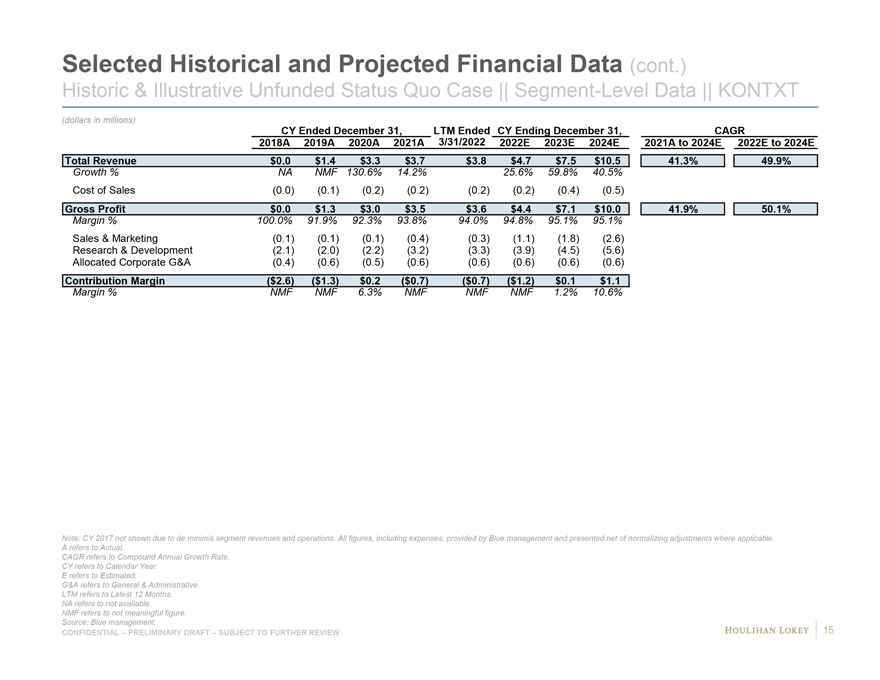
Selected Historical and Projected Financial Data (cont.) Historic & Illustrative Unfunded Status Quo Case || Segment-Level Data || KONTXT (dollars in millions) CY Ended December 31, LTM Ended CY Ending December 31, CAGR 2018A 2019A 2020A 2021A 3/31/2022 2022E 2023E 2024E 2021A to 2024E 2022E to 2024E Total Revenue $0.0 $1.4 $3.3 $3.7 $3.8 $4.7 $7.5 $10.5 41.3% 49.9% Growth % NA NMF 130.6% 14.2% 25.6% 59.8% 40.5% Cost of Sales (0.0) (0.1) (0.2) (0.2) (0.2) (0.2) (0.4) (0.5) Gross Profit $0.0 $1.3 $3.0 $3.5 $3.6 $4.4 $7.1 $10.0 41.9% 50.1% Margin % 100.0% 91.9% 92.3% 93.8% 94.0% 94.8% 95.1% 95.1% Sales & Marketing (0.1) (0.1) (0.1) (0.4) (0.3) (1.1) (1.8) (2.6) Research & Development (2.1) (2.0) (2.2) (3.2) (3.3) (3.9) (4.5) (5.6) Allocated Corporate G&A (0.4) (0.6) (0.5) (0.6) (0.6) (0.6) (0.6) (0.6) Contribution Margin ($2.6) ($1.3) $0.2 ($0.7) ($0.7) ($1.2) $0.1 $1.1 Margin % NMF NMF 6.3% NMF NMF NMF 1.2% 10.6% Note: CY 2017 not shown due to de minimis segment revenues and operations. All figures, including expenses, provided by Blue management and presented net of normalizing adjustments where applicable. A refers to Actual. CAGR refers to Compound Annual Growth Rate. CY refers to Calendar Year. E refers to Estimated. G&A refers to General & Administrative. LTM refers to Latest 12 Months. NA refers to not available. NMF refers to not meaningful figure. Source: Blue management. 15 CONFIDENTIAL – PRELIMINARY DRAFT – SUBJECT TO FURTHER REVIEW
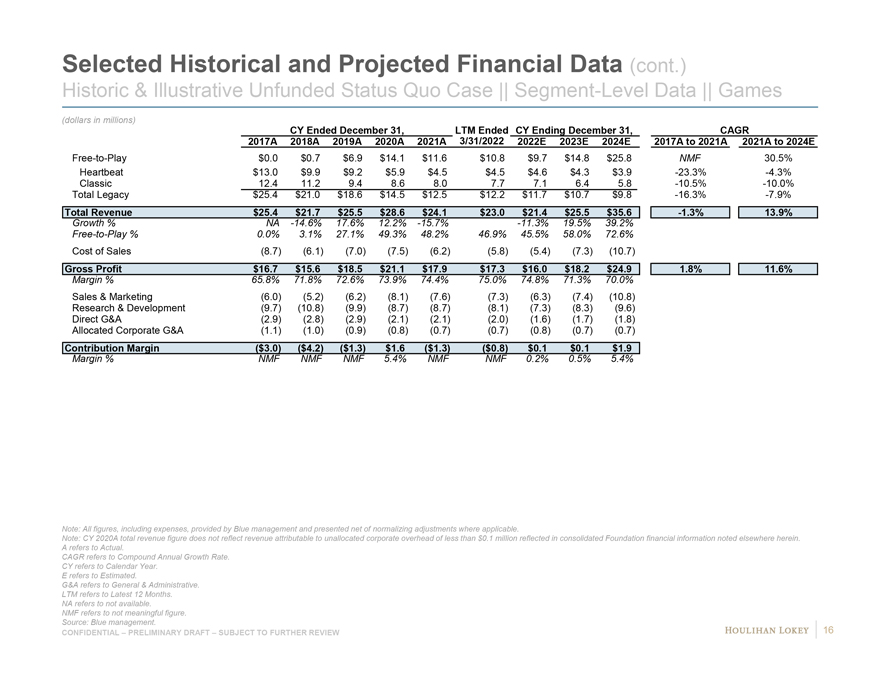
Selected Historical and Projected Financial Data (cont.) Historic & Illustrative Unfunded Status Quo Case || Segment-Level Data || Games (dollars in millions) CY Ended December 31, LTM Ended CY Ending December 31, CAGR 2017A 2018A 2019A 2020A 2021A 3/31/2022 2022E 2023E 2024E 2017A to 2021A 2021A to 2024E Free-to-Play $0.0 $0.7 $6.9 $14.1 $11.6 $10.8 $9.7 $14.8 $25.8 NMF 30.5% Heartbeat $13.0 $9.9 $9.2 $5.9 $4.5 $4.5 $4.6 $4.3 $3.9 -23.3% -4.3% Classic 12.4 11.2 9.4 8.6 8.0 7.7 7.1 6.4 5.8 -10.5% -10.0% Total Legacy $25.4 $21.0 $18.6 $14.5 $12.5 $12.2 $11.7 $10.7 $9.8 -16.3% -7.9% Total Revenue $25.4 $21.7 $25.5 $28.6 $24.1 $23.0 $21.4 $25.5 $35.6 -1.3% 13.9% Growth % NA -14.6% 17.6% 12.2% -15.7% -11.3% 19.5% 39.2% Free-to-Play % 0.0% 3.1% 27.1% 49.3% 48.2% 46.9% 45.5% 58.0% 72.6% Cost of Sales (8.7) (6.1) (7.0) (7.5) (6.2) (5.8) (5.4) (7.3) (10.7) Gross Profit $16.7 $15.6 $18.5 $21.1 $17.9 $17.3 $16.0 $18.2 $24.9 1.8% 11.6% Margin % 65.8% 71.8% 72.6% 73.9% 74.4% 75.0% 74.8% 71.3% 70.0% Sales & Marketing (6.0) (5.2) (6.2) (8.1) (7.6) (7.3) (6.3) (7.4) (10.8) Research & Development (9.7) (10.8) (9.9) (8.7) (8.7) (8.1) (7.3) (8.3) (9.6) Direct G&A (2.9) (2.8) (2.9) (2.1) (2.1) (2.0) (1.6) (1.7) (1.8) Allocated Corporate G&A (1.1) (1.0) (0.9) (0.8) (0.7) (0.7) (0.8) (0.7) (0.7) Contribution Margin ($3.0) ($4.2) ($1.3) $1.6 ($1.3) ($0.8) $0.1 $0.1 $1.9 Margin % NMF NMF NMF 5.4% NMF NMF 0.2% 0.5% 5.4% Note: All figures, including expenses, provided by Blue management and presented net of normalizing adjustments where applicable. Note: CY 2020A total revenue figure does not reflect revenue attributable to unallocated corporate overhead of less than $0.1 million reflected in consolidated Foundation financial information noted elsewhere herein. A refers to Actual. CAGR refers to Compound Annual Growth Rate. CY refers to Calendar Year. E refers to Estimated. G&A refers to General & Administrative. LTM refers to Latest 12 Months. NA refers to not available. NMF refers to not meaningful figure. Source: Blue management. 16 CONFIDENTIAL – PRELIMINARY DRAFT – SUBJECT TO FURTHER REVIEW
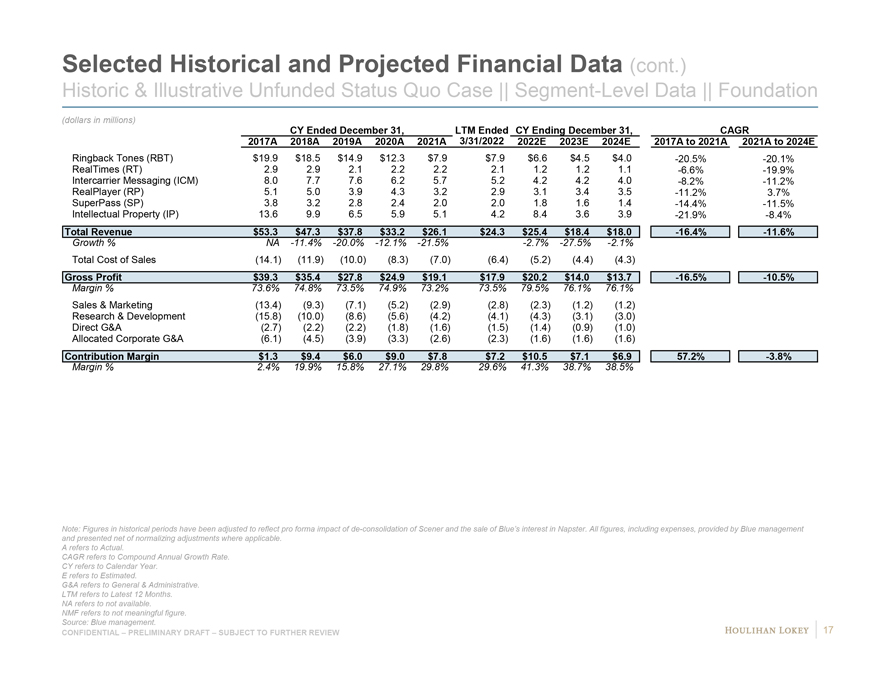
Selected Historical and Projected Financial Data (cont.) Historic & Illustrative Unfunded Status Quo Case || Segment-Level Data || Foundation (dollars in millions) CY Ended December 31, LTM Ended CY Ending December 31, CAGR 2017A 2018A 2019A 2020A 2021A 3/31/2022 2022E 2023E 2024E 2017A to 2021A 2021A to 2024E Ringback Tones (RBT) $19.9 $18.5 $14.9 $12.3 $7.9 $7.9 $6.6 $4.5 $4.0 -20.5% -20.1% RealTimes (RT) 2.9 2.9 2.1 2.2 2.2 2.1 1.2 1.2 1.1 -6.6% -19.9% Intercarrier Messaging (ICM) 8.0 7.7 7.6 6.2 5.7 5.2 4.2 4.2 4.0 -8.2% -11.2% RealPlayer (RP) 5.1 5.0 3.9 4.3 3.2 2.9 3.1 3.4 3.5 -11.2% 3.7% SuperPass (SP) 3.8 3.2 2.8 2.4 2.0 2.0 1.8 1.6 1.4 -14.4% -11.5% Intellectual Property (IP) 13.6 9.9 6.5 5.9 5.1 4.2 8.4 3.6 3.9 -21.9% -8.4% Total Revenue $53.3 $47.3 $37.8 $33.2 $26.1 $24.3 $25.4 $18.4 $18.0 -16.4% -11.6% Growth % NA -11.4% -20.0% -12.1% -21.5% -2.7% -27.5% -2.1% Total Cost of Sales (14.1) (11.9) (10.0) (8.3) (7.0) (6.4) (5.2) (4.4) (4.3) Gross Profit $39.3 $35.4 $27.8 $24.9 $19.1 $17.9 $20.2 $14.0 $13.7 -16.5% -10.5% Margin % 73.6% 74.8% 73.5% 74.9% 73.2% 73.5% 79.5% 76.1% 76.1% Sales & Marketing (13.4) (9.3) (7.1) (5.2) (2.9) (2.8) (2.3) (1.2) (1.2) Research & Development (15.8) (10.0) (8.6) (5.6) (4.2) (4.1) (4.3) (3.1) (3.0) Direct G&A (2.7) (2.2) (2.2) (1.8) (1.6) (1.5) (1.4) (0.9) (1.0) Allocated Corporate G&A (6.1) (4.5) (3.9) (3.3) (2.6) (2.3) (1.6) (1.6) (1.6) Contribution Margin $1.3 $9.4 $6.0 $9.0 $7.8 $7.2 $10.5 $7.1 $6.9 57.2% -3.8% Margin % 2.4% 19.9% 15.8% 27.1% 29.8% 29.6% 41.3% 38.7% 38.5% Note: Figures in historical periods have been adjusted to reflect pro forma impact of de-consolidation of Scener and the sale of Blue’s interest in Napster. All figures, including expenses, provided by Blue management and presented net of normalizing adjustments where applicable. A refers to Actual. CAGR refers to Compound Annual Growth Rate. CY refers to Calendar Year. E refers to Estimated. G&A refers to General & Administrative. LTM refers to Latest 12 Months. NA refers to not available. NMF refers to not meaningful figure. Source: Blue management. 17 CONFIDENTIAL – PRELIMINARY DRAFT – SUBJECT TO FURTHER REVIEW
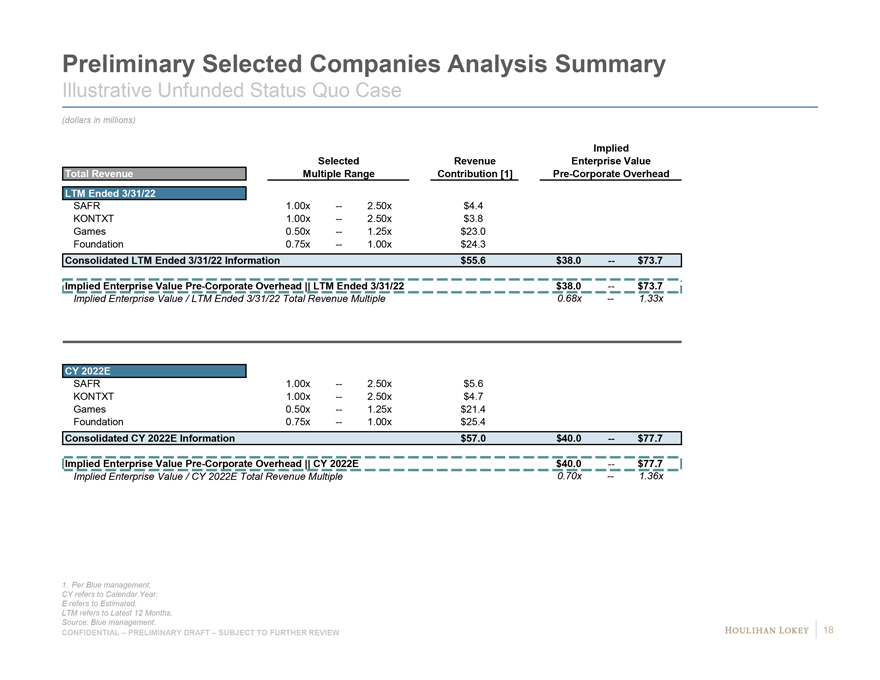
Preliminary Selected Companies Analysis Summary Illustrative Unfunded Status Quo Case (dollars in millions) Implied Selected Revenue Enterprise Value Total Revenue Multiple Range Contribution [1] Pre-Corporate Overhead LTM Ended 3/31/22 SAFR 1.00x — 2.50x $4.4 KONTXT 1.00x — 2.50x $3.8 Games 0.50x — 1.25x $23.0 Foundation 0.75x — 1.00x $24.3 Consolidated LTM Ended 3/31/22 Information $55.6 $38.0 — $73.7 Implied Enterprise Value Pre-Corporate Overhead || LTM Ended 3/31/22 $38.0 — $73.7 Implied Enterprise Value / LTM Ended 3/31/22 Total Revenue Multiple 0.68x — 1.33x CY 2022E SAFR 1.00x — 2.50x $5.6 KONTXT 1.00x — 2.50x $4.7 Games 0.50x — 1.25x $21.4 Foundation 0.75x — 1.00x $25.4 Consolidated CY 2022E Information $57.0 $40.0 — $77.7 Implied Enterprise Value Pre-Corporate Overhead || CY 2022E $40.0 — $77.7 Implied Enterprise Value / CY 2022E Total Revenue Multiple 0.70x — 1.36x 1. Per Blue management. CY refers to Calendar Year. E refers to Estimated. LTM refers to Latest 12 Months. Source: Blue management. 18 CONFIDENTIAL – PRELIMINARY DRAFT – SUBJECT TO FURTHER REVIEW
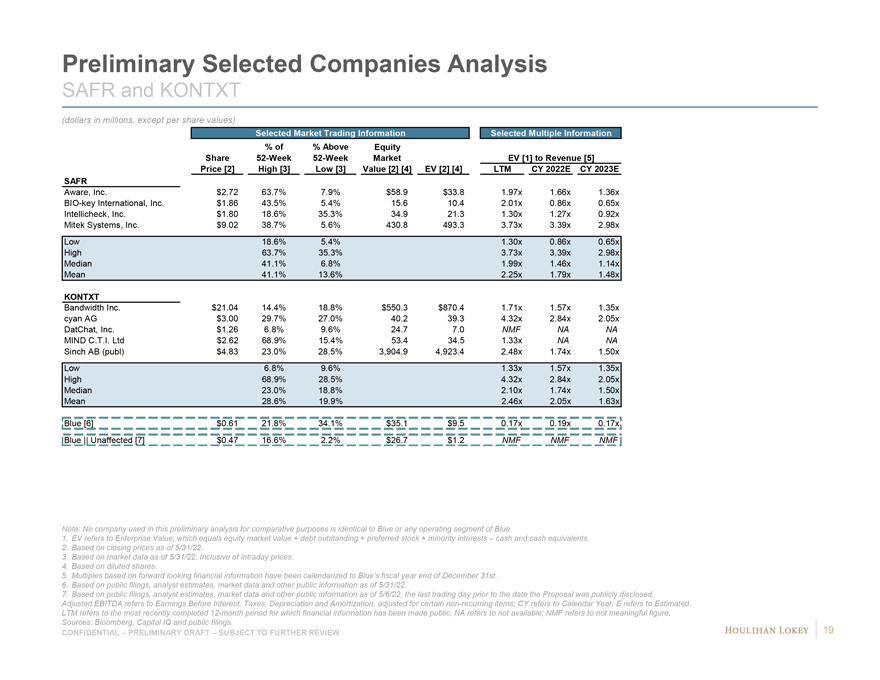
Preliminary Selected Companies Analysis SAFR and KONTXT (dollars in millions, except per share values) Selected Market Trading Information Selected Multiple Information % of % Above Equity Share 52-Week 52-Week Market EV [1] to Revenue [5] Selected Company Price [2] High [3] Low [3] Value [2] [4] EV [2] [4] LTM CY 2022E CY 2023E SAFR Aware, Inc. $2.72 63.7% 7.9% $58.9 $33.8 1.97x 1.66x 1.36x BIO-key International, Inc. $1.86 43.5% 5.4% 15.6 10.4 2.01x 0.86x 0.65x Intellicheck, Inc. $1.80 18.6% 35.3% 34.9 21.3 1.30x 1.27x 0.92x Mitek Systems, Inc. $9.02 38.7% 5.6% 430.8 493.3 3.73x 3.39x 2.98x Low 18.6% 5.4% 1.30x 0.86x 0.65x High 63.7% 35.3% 3.73x 3.39x 2.98x Median 41.1% 6.8% 1.99x 1.46x 1.14x Mean 41.1% 13.6% 2.25x 1.79x 1.48x KONTXT Bandwidth Inc. $21.04 14.4% 18.8% $550.3 $870.4 1.71x 1.57x 1.35x cyan AG $3.00 29.7% 27.0% 40.2 39.3 4.32x 2.84x 2.05x DatChat, Inc. $1.26 6.8% 9.6% 24.7 7.0 NMF NA NA MIND C.T.I. Ltd $2.62 68.9% 15.4% 53.4 34.5 1.33x NA NA Sinch AB (publ) $4.83 23.0% 28.5% 3,904.9 4,923.4 2.48x 1.74x 1.50x Low 6.8% 9.6% 1.33x 1.57x 1.35x High 68.9% 28.5% 4.32x 2.84x 2.05x Median 23.0% 18.8% 2.10x 1.74x 1.50x Mean 28.6% 19.9% 2.46x 2.05x 1.63x Blue [6] $0.61 21.8% 34.1% $35.1 $9.5 0.17x 0.19x 0.17x Blue || Unaffected [7] $0.47 16.6% 2.2% $26.7 $1.2 NMF NMF NMF Note: No company used in this preliminary analysis for comparative purposes is identical to Blue or any operating segment of Blue. 1. EV refers to Enterprise Value, which equals equity market value + debt outstanding + preferred stock + minority interests – cash and cash equivalents. 2. Based on closing prices as of 5/31/22. 3. Based on market data as of 5/31/22. Inclusive of intraday prices. 4. Based on diluted shares. 5. Multiples based on forward looking financial information have been calendarized to Blue’s fiscal year end of December 31st. 6. Based on public filings, analyst estimates, market data and other public information as of 5/31/22. 7. Based on public filings, analyst estimates, market data and other public information as of 5/6/22, the last trading day prior to the date the Proposal was publicly disclosed. Adjusted EBITDA refers to Earnings Before Interest, Taxes, Depreciation and Amortization, adjusted for certain non-recurring items; CY refers to Calendar Year; E refers to Estimated. LTM refers to the most recently completed 12-month period for which financial information has been made public; NA refers to not available; NMF refers to not meaningful figure. Sources: Bloomberg, Capital IQ and public filings. 19 CONFIDENTIAL – PRELIMINARY DRAFT – SUBJECT TO FURTHER REVIEW
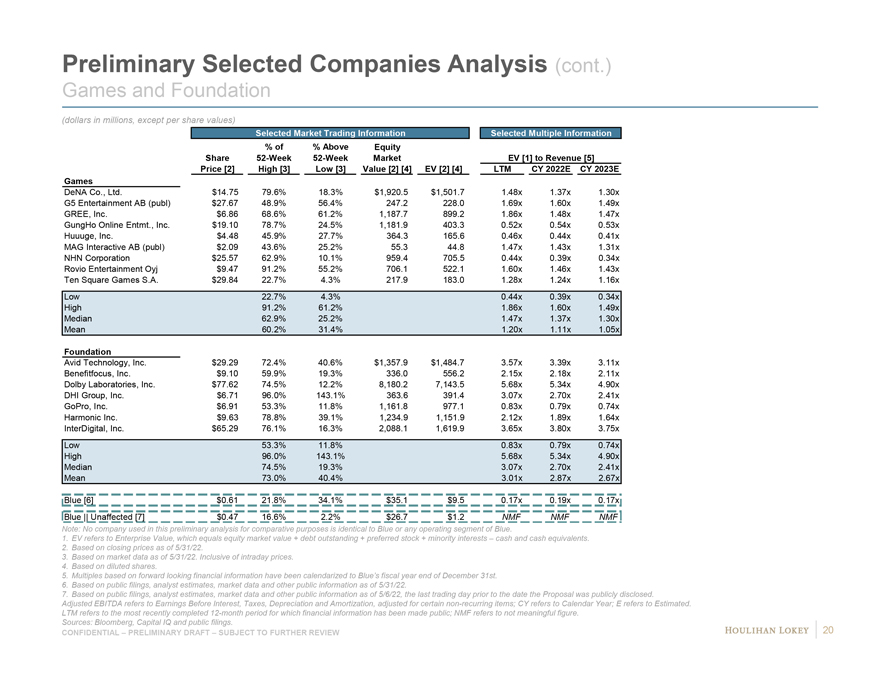
Preliminary Selected Companies Analysis (cont.) Games and Foundation (dollars in millions, except per share values) Selected Market Trading Information Selected Multiple Information % of % Above Equity Share 52-Week 52-Week Market EV [1] to Revenue [5] Price [2] High [3] Low [3] Value [2] [4] EV [2] [4] LTM CY 2022E CY 2023E Games DeNA Co., Ltd. $14.75 79.6% 18.3% $1,920.5 $1,501.7 1.48x 1.37x 1.30x G5 Entertainment AB (publ) $27.67 48.9% 56.4% 247.2 228.0 1.69x 1.60x 1.49x GREE, Inc. $6.86 68.6% 61.2% 1,187.7 899.2 1.86x 1.48x 1.47x GungHo Online Entmt., Inc. $19.10 78.7% 24.5% 1,181.9 403.3 0.52x 0.54x 0.53x Huuuge, Inc. $4.48 45.9% 27.7% 364.3 165.6 0.46x 0.44x 0.41x MAG Interactive AB (publ) $2.09 43.6% 25.2% 55.3 44.8 1.47x 1.43x 1.31x NHN Corporation $25.57 62.9% 10.1% 959.4 705.5 0.44x 0.39x 0.34x Rovio Entertainment Oyj $9.47 91.2% 55.2% 706.1 522.1 1.60x 1.46x 1.43x Ten Square Games S.A. $29.84 22.7% 4.3% 217.9 183.0 1.28x 1.24x 1.16x Low 22.7% 4.3% 0.44x 0.39x 0.34x High 91.2% 61.2% 1.86x 1.60x 1.49x Median 62.9% 25.2% 1.47x 1.37x 1.30x Mean 60.2% 31.4% 1.20x 1.11x 1.05x Foundation Avid Technology, Inc. $29.29 72.4% 40.6% $1,357.9 $1,484.7 3.57x 3.39x 3.11x Benefitfocus, Inc. $9.10 59.9% 19.3% 336.0 556.2 2.15x 2.18x 2.11x Dolby Laboratories, Inc. $77.62 74.5% 12.2% 8,180.2 7,143.5 5.68x 5.34x 4.90x DHI Group, Inc. $6.71 96.0% 143.1% 363.6 391.4 3.07x 2.70x 2.41x GoPro, Inc. $6.91 53.3% 11.8% 1,161.8 977.1 0.83x 0.79x 0.74x Harmonic Inc. $9.63 78.8% 39.1% 1,234.9 1,151.9 2.12x 1.89x 1.64x InterDigital, Inc. $65.29 76.1% 16.3% 2,088.1 1,619.9 3.65x 3.80x 3.75x Low 53.3% 11.8% 0.83x 0.79x 0.74x High 96.0% 143.1% 5.68x 5.34x 4.90x Median 74.5% 19.3% 3.07x 2.70x 2.41x Mean 73.0% 40.4% 3.01x 2.87x 2.67x Blue [6] $0.61 21.8% 34.1% $35.1 $9.5 0.17x 0.19x 0.17x Blue || Unaffected [7] $0.47 16.6% 2.2% $26.7 $1.2 NMF NMF NMF Note: No company used in this preliminary analysis for comparative purposes is identical to Blue or any operating segment of Blue. 1. EV refers to Enterprise Value, which equals equity market value + debt outstanding + preferred stock + minority interests – cash and cash equivalents. 2. Based on closing prices as of 5/31/22. 3. Based on market data as of 5/31/22. Inclusive of intraday prices. 4. Based on diluted shares. 5. Multiples based on forward looking financial information have been calendarized to Blue’s fiscal year end of December 31st. 6. Based on public filings, analyst estimates, market data and other public information as of 5/31/22. 7. Based on public filings, analyst estimates, market data and other public information as of 5/6/22, the last trading day prior to the date the Proposal was publicly disclosed. Adjusted EBITDA refers to Earnings Before Interest, Taxes, Depreciation and Amortization, adjusted for certain non-recurring items; CY refers to Calendar Year; E refers to Estimated. LTM refers to the most recently completed 12-month period for which financial information has been made public; NMF refers to not meaningful figure. Sources: Bloomberg, Capital IQ and public filings. 20 CONFIDENTIAL – PRELIMINARY DRAFT – SUBJECT TO FURTHER REVIEW
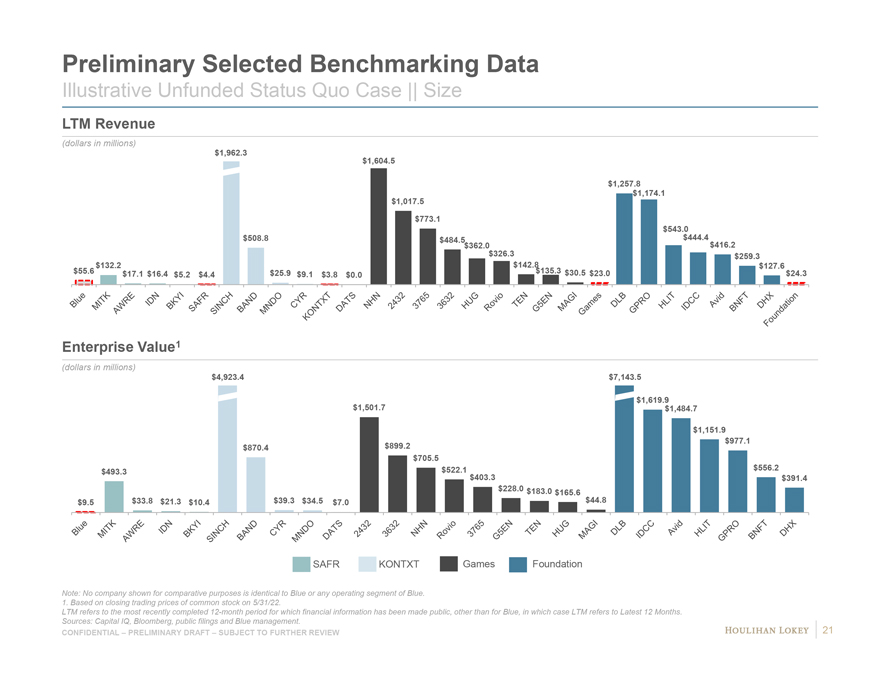
Preliminary Selected Benchmarking Data Illustrative Unfunded Status Quo Case || Size LTM Revenue (dollars in millions) $1,962.3 1 $1,604.5 $1,257.8 $1,174.1 $1,017.5 $773.1 $543.0 $508.8 $484.5$ 362.0 $444.4 $416.2 $326.3 $259.3 $132.2 $142.8 $127.6 $55.6 $17.1 $16.4 $25.9 $9.1 $135.3 $30.5 $23.0 $24.3 $5.2 $4.4 $3.8 $0.0 Enterprise Value1 (dollars in millions) $4,923.4 $7,143.5 1 $1,501.7 $1,619.9 $1,484.7 $1,151.9 $977.1 $870.4 $899.2 $705.5 $522.1 $556.2 $493.3 $403.3 $391.4 $228.0 $183.0 $39.3 $165.6 $44.8 $9.5 $33.8 $21.3 $10.4 $34.5 $7.0 SAFR KONTXT Games Foundation Note: No company shown for comparative purposes is identical to Blue or any operating segment of Blue. 1. Based on closing trading prices of common stock on 5/31/22. LTM refers to the most recently completed 12-month period for which financial information has been made public, other than for Blue, in which case LTM refers to Latest 12 Months. Sources: Capital IQ, Bloomberg, public filings and Blue management. 21 CONFIDENTIAL – PRELIMINARY DRAFT – SUBJECT TO FURTHER REVIEW
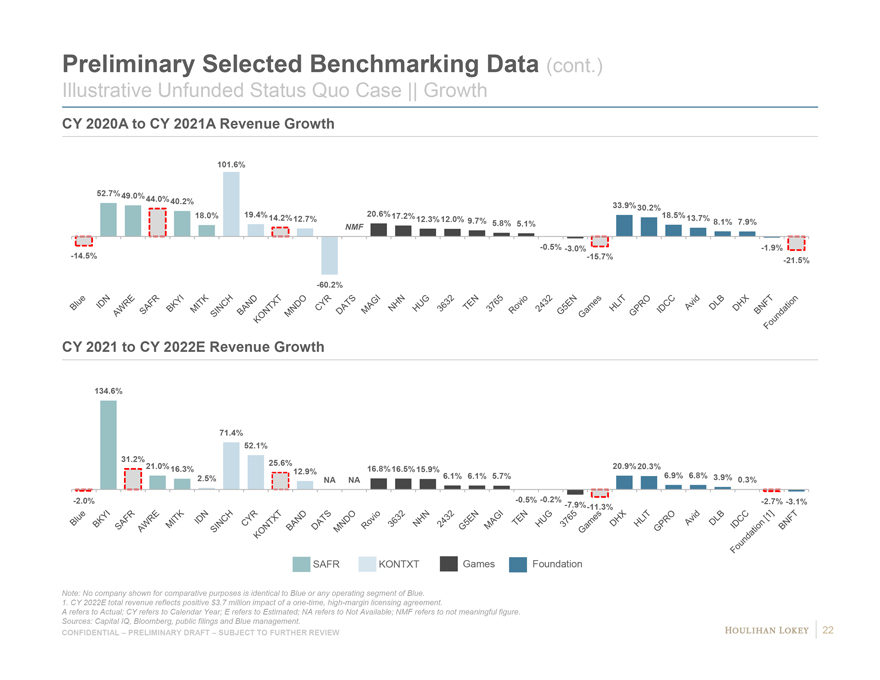
Preliminary Selected Benchmarking Data (cont.) Illustrative Unfunded Status Quo Case || Growth CY 2020A to CY 2021A Revenue Growth 1 101.6% 52.7%49.0% 44.0%40.2% 33.9%30.2% 18.0% 19.4% 20.6%17.2% 18.5% 14.2%12.7% 12.3%12.0% 9.7% 13.7% 5.8% 5.1% 8.1% 7.9% NMF -0.5% -3.0% -1.9% -14.5% -15.7% -21.5% -60.2% CY 2021 to CY 2022E Revenue Growth 1 134.6% 71.4% 52.1% 31.2% 25.6% 21.0%16.3% 16.8%16.5%15.9% 20.9%20.3% 12.9% 2.5% 6.1% 6.1% 5.7% 6.9% 6.8% 3.9% NA NA 0.3% -2.0% -0.5% -0.2% -2.7% -3.1% -7.9%-11.3% SAFR KONTXT Games Foundation Note: No company shown for comparative purposes is identical to Blue or any operating segment of Blue. 1. CY 2022E total revenue reflects positive $3.7 million impact of a one-time, high-margin licensing agreement. A refers to Actual; CY refers to Calendar Year; E refers to Estimated; NA refers to Not Available; NMF refers to not meaningful figure. Sources: Capital IQ, Bloomberg, public filings and Blue management. 22 CONFIDENTIAL – PRELIMINARY DRAFT – SUBJECT TO FURTHER REVIEW
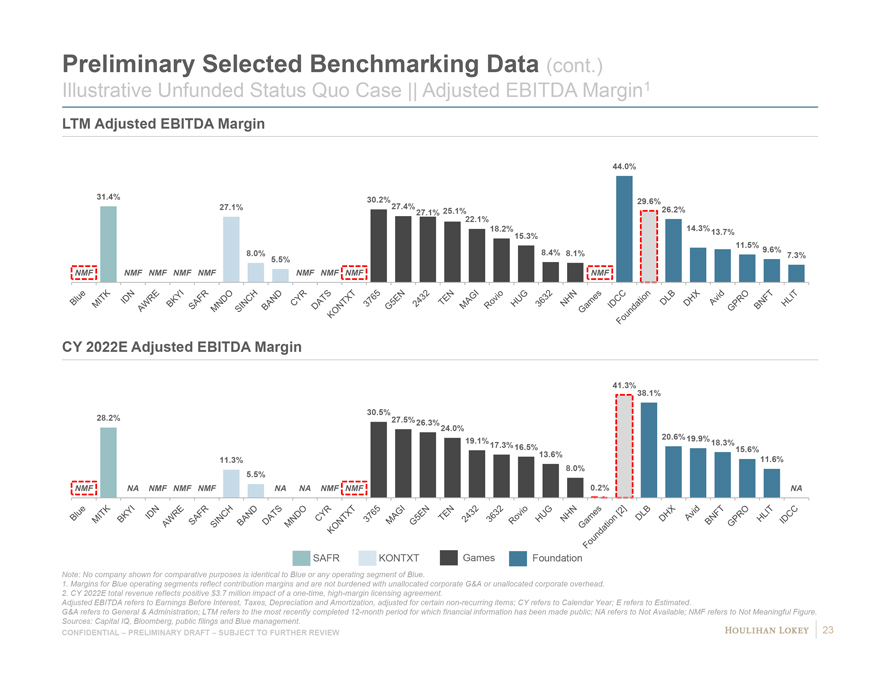
Preliminary Selected Benchmarking Data (cont.) Illustrative Unfunded Status Quo Case || Adjusted EBITDA Margin1 LTM Adjusted EBITDA Margin 1 44.0% 31.4% 30.2% 29.6% 27.1% 27.4% 26.2% 27.1% 25.1% 22.1% 18.2% 14.3% 13.7% 15.3% 11.5% 8.4% 9.6% 8.0% 8.1% 7.3% 5.5% NMF NMF NMF NMF NMF NMF NMF NMF NMF CY 2022E Adjusted EBITDA Margin 1 41.3%38.1% 30.5% 28.2% 27.5% 26.3% 24.0% 20.6%19.9% 19.1% 18.3% 17.3%16.5% 15.6% 13.6% 11.3% 11.6% 8.0% 5.5% NMF NA NMF NMF NMF NA NA NMF NMF 0.2% NA SAFR KONTXT Games Foundation Note: No company shown for comparative purposes is identical to Blue or any operating segment of Blue. 1. Margins for Blue operating segments reflect contribution margins and are not burdened with unallocated corporate G&A or unallocated corporate overhead. 2. CY 2022E total revenue reflects positive $3.7 million impact of a one-time, high-margin licensing agreement. Adjusted EBITDA refers to Earnings Before Interest, Taxes, Depreciation and Amortization, adjusted for certain non-recurring items; CY refers to Calendar Year; E refers to Estimated. G&A refers to General & Administration; LTM refers to the most recently completed 12-month period for which financial information has been made public; NA refers to Not Available; NMF refers to Not Meaningful Figure. Sources: Capital IQ, Bloomberg, public filings and Blue management. 23 CONFIDENTIAL – PRELIMINARY DRAFT – SUBJECT TO FURTHER REVIEW
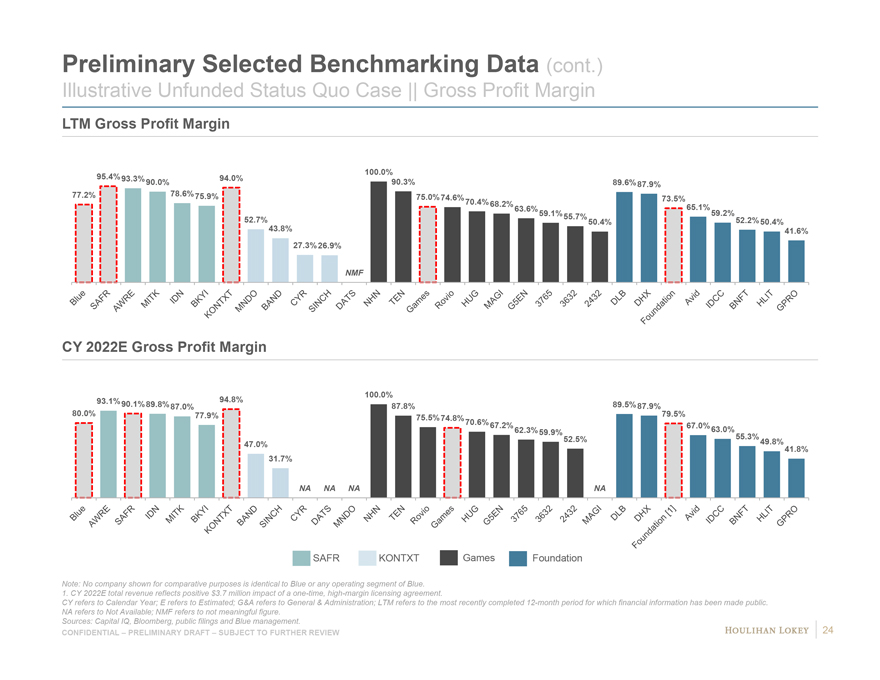
Preliminary Selected Benchmarking Data (cont.) Illustrative Unfunded Status Quo Case || Gross Profit Margin LTM Gross Profit Margin 1 100.0% 95.4%93.3% 94.0% 90.0% 90.3% 89.6%87.9% 77.2% 78.6%75.9% 75.0% 74.6% 73.5% 70.4%68.2% 63.6% 65.1% 59.1%55.7% 59.2% 52.7% 50.4% 52.2%50.4% 43.8% 41.6% 27.3%26.9% NMF CY 2022E Gross Profit Margin 1 100.0% 93.1% 94.8% 90.1%89.8%87.0% 87.8% 89.5%87.9% 80.0% 77.9% 79.5% 75.5%74.8% 70.6%67.2%62.3% 67.0%63.0% 59.9% 52.5% 55.3% 47.0% 49.8%41.8% 31.7% NA NA NA NA SAFR KONTXT Games Foundation Note: No company shown for comparative purposes is identical to Blue or any operating segment of Blue. 1. CY 2022E total revenue reflects positive $3.7 million impact of a one-time, high-margin licensing agreement. CY refers to Calendar Year; E refers to Estimated; G&A refers to General & Administration; LTM refers to the most recently completed 12-month period for which financial information has been made public. NA refers to Not Available; NMF refers to not meaningful figure. Sources: Capital IQ, Bloomberg, public filings and Blue management. 24 CONFIDENTIAL – PRELIMINARY DRAFT – SUBJECT TO FURTHER REVIEW
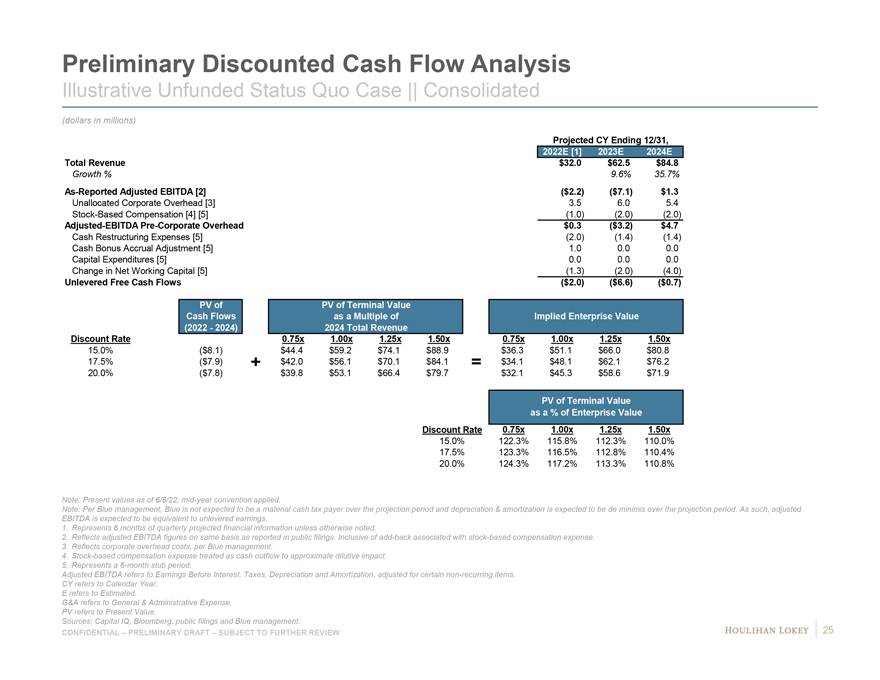
Preliminary Discounted Cash Flow Analysis Illustrative Unfunded Status Quo Case || Consolidated (dollars in millions) Projected CY Ending 12/31, 2022E [1] 2023E 2024E Total Revenue $32.0 $62.5 $84.8 Growth % 9.6% 35.7% As-Reported Adjusted EBITDA [2] ($2.2) ($7.1) $1.3 Unallocated Corporate Overhead [3] 3.5 6.0 5.4 Stock-Based Compensation [4] [5] (1.0) (2.0) (2.0) Adjusted-EBITDA Pre-Corporate Overhead $0.3 ($3.2) $4.7 Cash Restructuring Expenses [5] (2.0) (1.4) (1.4) Cash Bonus Accrual Adjustment [5] 1.0 0.0 0.0 Capital Expenditures [5] 0.0 0.0 0.0 Change in Net Working Capital [5] (1.3) (2.0) (4.0) Unlevered Free Cash Flows ($2.0) ($6.6) ($0.7) PV of PV of Terminal Value Cash Flows as a Multiple of Implied Enterprise Value (2022—2024) 2024 Total Revenue Discount Rate 0.75x 1.00x 1.25x 1.50x 0.75x 1.00x 1.25x 1.50x 15.0% ($8.1) $44.4 $59.2 $74.1 $88.9 $36.3 $51.1 $66.0 $80.8 17.5% ($7.9) + $42.0 $56.1 $70.1 $84.1 = $34.1 $48.1 $62.1 $76.2 20.0% ($7.8) $39.8 $53.1 $66.4 $79.7 $32.1 $45.3 $58.6 $71.9 PV of Terminal Value as a % of Enterprise Value Discount Rate 0.75x 1.00x 1.25x 1.50x 15.0% 122.3% 115.8% 112.3% 110.0% 17.5% 123.3% 116.5% 112.8% 110.4% 20.0% 124.3% 117.2% 113.3% 110.8% Note: Present values as of 6/8/22; mid-year convention applied. Note: Per Blue management, Blue is not expected to be a material cash tax payer over the projection period and depreciation & amortization is expected to be de minimis over the projection period. As such, adjusted EBITDA is expected to be equivalent to unlevered earnings. 1. Represents 6 months of quarterly projected financial information unless otherwise noted. 2. Reflects adjusted EBITDA figures on same basis as reported in public filings. Inclusive of add-back associated with stock-based compensation expense. 3. Reflects corporate overhead costs, per Blue management. 4. Stock-based compensation expense treated as cash outflow to approximate dilutive impact. 5. Represents a 6-month stub period. Adjusted EBITDA refers to Earnings Before Interest, Taxes, Depreciation and Amortization, adjusted for certain non-recurring items. CY refers to Calendar Year. E refers to Estimated. G&A refers to General & Administrative Expense. PV refers to Present Value. Sources: Capital IQ, Bloomberg, public filings and Blue management. 25 CONFIDENTIAL – PRELIMINARY DRAFT – SUBJECT TO FURTHER REVIEW
Page 1. Executive Summary 3 2. Preliminary Illustrative Unfunded Status Quo Case Financial Analyses 11 3. Preliminary Considerations Related to Proposal 26 4. Appendix 37 5. Disclaimer 46
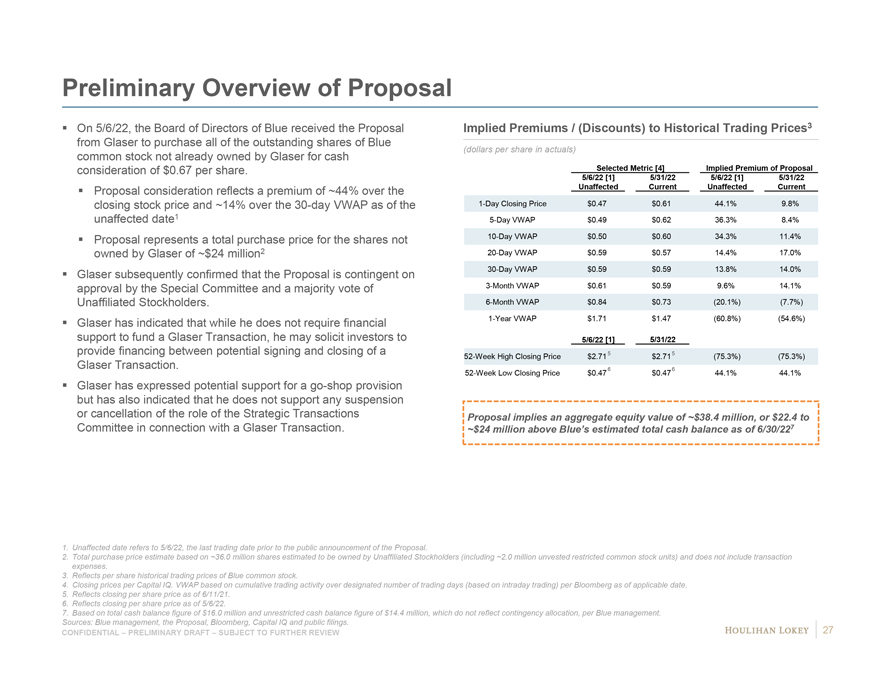
Preliminary Overview of Proposal On 5/6/22, the Board of Directors of Blue received the Proposal from Glaser to purchase all of the outstanding shares of Blue common stock not already owned by Glaser for cash consideration of $0.67 per share. Proposal consideration reflects a premium of ~44% over the closing stock price and ~14% over the 30-day VWAP as of the unaffected date1 Proposal represents a total purchase price for the shares not owned by Glaser of ~$24 million2 Glaser subsequently confirmed that the Proposal is contingent on approval by the Special Committee and a majority vote of Unaffiliated Stockholders. Glaser has indicated that while he does not require financial support to fund a Glaser Transaction, he may solicit investors to provide financing between potential signing and closing of a Glaser Transaction. Glaser has expressed potential support for a go-shop provision but has also indicated that he does not support any suspension or cancellation of the role of the Strategic Transactions Committee in connection with a Glaser Transaction. Implied Premiums / (Discounts) to Historical Trading Prices3 (dollars per share in actuals) Selected Metric [4] Implied Premium of Proposal 5/6/22 [1] 5/31/22 5/6/22 [1] 5/31/22 Unaffected Current Unaffected Current 1-Day Closing Price $0.47 $0.61 44.1% 9.8% 5-Day VWAP $0.49 $0.62 36.3% 8.4% 10-Day VWAP $0.50 $0.60 34.3% 11.4% 20-Day VWAP $0.59 $0.57 14.4% 17.0% 30-Day VWAP $0.59 $0.59 13.8% 14.0% 3-Month VWAP $0.61 $0.59 9.6% 14.1% 6-Month VWAP $0.84 $0.73 (20.1%) (7.7%) 1-Year VWAP $1.71 $1.47 (60.8%) (54.6%) 5/6/22 [1] 5/31/22 52-Week High Closing Price $2.715 $2.715 (75.3%) (75.3%) 52-Week Low Closing Price $0.476 $0.476 44.1% 44.1% Proposal implies an aggregate equity value of ~$38.4 million, or $22.4 to ~$24 million above Blue’s estimated total cash balance as of 6/30/227 1. Unaffected date refers to 5/6/22, the last trading date prior to the public announcement of the Proposal. 2. Total purchase price estimate based on ~36.0 million shares estimated to be owned by Unaffiliated Stockholders (including ~2.0 million unvested restricted common stock units) and does not include transaction expenses. 3. Reflects per share historical trading prices of Blue common stock. 4. Closing prices per Capital IQ. VWAP based on cumulative trading activity over designated number of trading days (based on intraday trading) per Bloomberg as of applicable date. 5. Reflects closing per share price as of 6/11/21. 6. Reflects closing per share price as of 5/6/22. 7. Based on total cash balance figure of $16.0 million and unrestricted cash balance figure of $14.4 million, which do not reflect contingency allocation, per Blue management. Sources: Blue management, the Proposal, Bloomberg, Capital IQ and public filings. 27 CONFIDENTIAL – PRELIMINARY DRAFT – SUBJECT TO FURTHER REVIEW
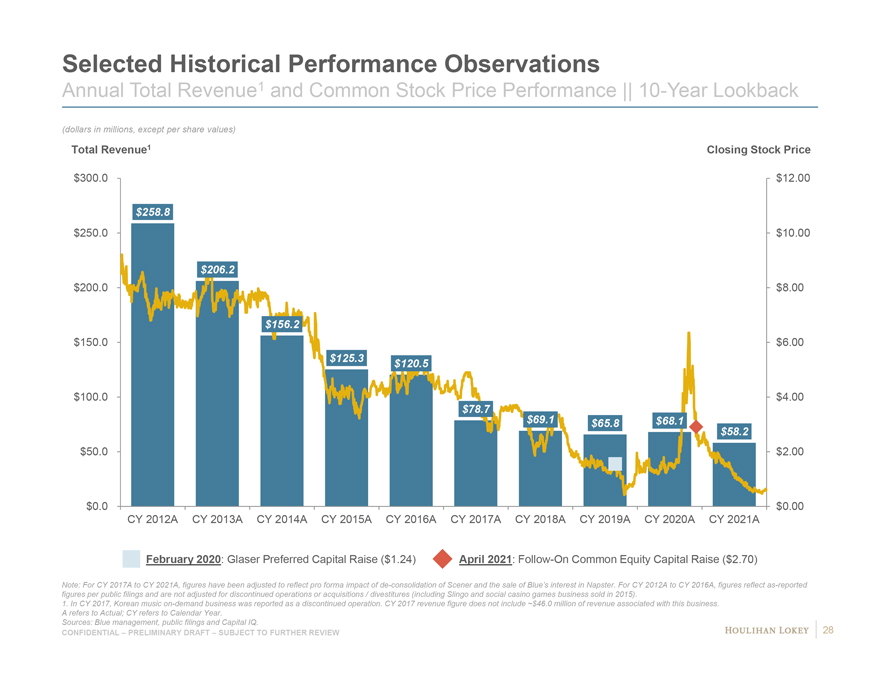
Selected Historical Performance Observations Annual Total Revenue1 and Common Stock Price Performance || 10-Year Lookback (dollars in millions, except per share values) Total Revenue1 Closing Stock Price 5/31/12 5/31/13 5/31/14 5/31/15 5/31/16 5/31/17 5/31/18 5/31/19 5/31/20 5/31/21 5/31/22 $300.0 $12.00 $258.8 $250.0 $10.00 $206.2 $200.0 $8.00 $156.2 $150.0 $6.00 $125.3 $120.5 $100.0 $4.00 $78.7 $69.1 $65.8 $68.1 $58.2 $50.0 $2.00 $0.0 $0.00 CY 2012A CY 2013A CY 2014A CY 2015A CY 2016A CY 2017A CY 2018A CY 2019A CY 2020A CY 2021A February 2020: Glaser Preferred Capital Raise ($1.24) April 2021: Follow-On Common Equity Capital Raise ($2.70) Note: For CY 2017A to CY 2021A, figures have been adjusted to reflect pro forma impact of de-consolidation of Scener and the sale of Blue’s interest in Napster. For CY 2012A to CY 2016A, figures reflect as-reported figures per public filings and are not adjusted for discontinued operations or acquisitions / divestitures (including Slingo and social casino games business sold in 2015). 1. In CY 2017, Korean music on-demand business was reported as a discontinued operation. CY 2017 revenue figure does not include ~$46.0 million of revenue associated with this business. A refers to Actual; CY refers to Calendar Year. Sources: Blue management, public filings and Capital IQ. 28 CONFIDENTIAL – PRELIMINARY DRAFT – SUBJECT TO FURTHER REVIEW
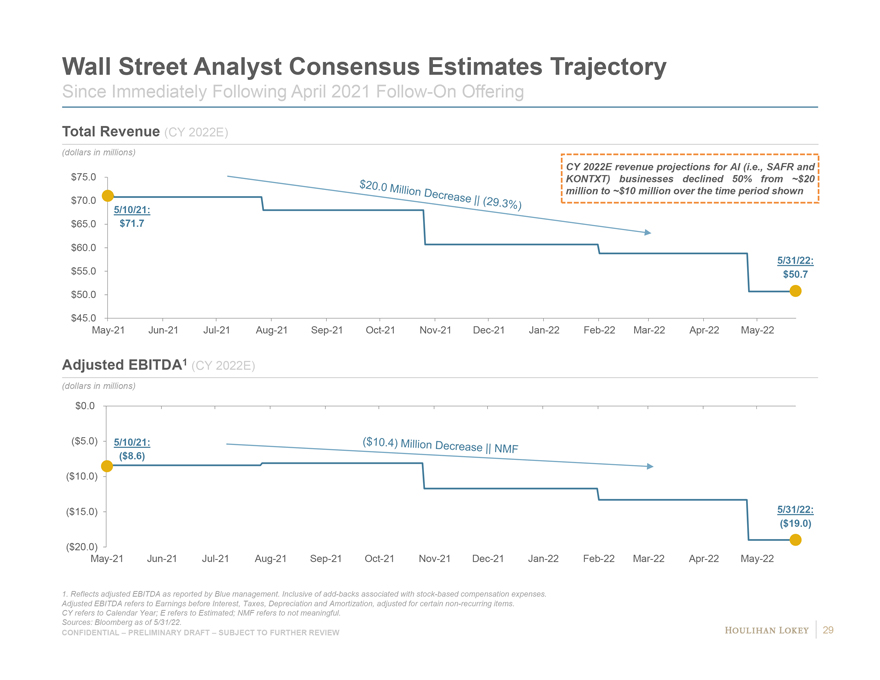
Wall Street Analyst Consensus Estimates Trajectory Since Immediately Following April 2021 Follow-On Offering Total Revenue (CY 2022E) (dollars in millions) CY 2022E revenue projections for AI (i.e., SAFR and $75.0 KONTXT) businesses declined 50% from ~$20 million to ~$10 million over the time period shown $70.0 5/10/21: $65.0 $71.7 $60.0 5/31/22: $55.0 $50.7 $50.0 $45.0 May-21 Jun-21 Jul-21 Aug-21 Sep-21 Oct-21 Nov-21 Dec-21 Jan-22 Feb-22 Mar-22 Apr-22 May-22 Adjusted EBITDA1 (CY 2022E) (dollars in millions) $0.0 ($5.0) 5/10/21: ($8.6) ($10.0) ($15.0) 5/31/22: ($19.0) ($20.0) May-21 Jun-21 Jul-21 Aug-21 Sep-21 Oct-21 Nov-21 Dec-21 Jan-22 Feb-22 Mar-22 Apr-22 May-22 1. Reflects adjusted EBITDA as reported by Blue management. Inclusive of add-backs associated with stock-based compensation expenses. Adjusted EBITDA refers to Earnings before Interest, Taxes, Depreciation and Amortization, adjusted for certain non-recurring items. CY refers to Calendar Year; E refers to Estimated; NMF refers to not meaningful. Sources: Bloomberg as of 5/31/22. 29 CONFIDENTIAL – PRELIMINARY DRAFT – SUBJECT TO FURTHER REVIEW
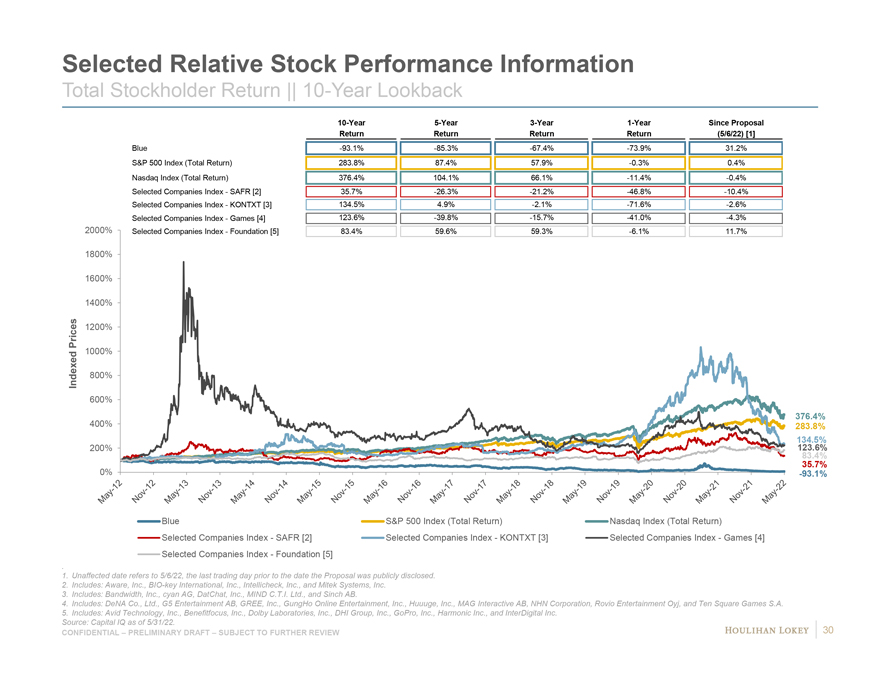
Selected Relative Stock Performance Information Total Stockholder Return || 10-Year Lookback 10-Year 5-Year 3-Year 1-Year Since Proposal Return Return Return Return (5/6/22) [1] Blue -93.1% -85.3% -67.4% -73.9% 31.2% S&P 500 Index (Total Return) 283.8% 87.4% 57.9% -0.3% 0.4% Nasdaq Index (Total Return) 376.4% 104.1% 66.1% -11.4% -0.4% Selected Companies Index—SAFR [2] 35.7% -26.3% -21.2% -46.8% -10.4% Selected Companies Index—KONTXT [3] 134.5% 4.9% -2.1% -71.6% -2.6% Selected Companies Index—Games [4] 123.6% -39.8% -15.7% -41.0% -4.3% 2000% Selected Companies Index—Foundation [5] 83.4% 59.6% 59.3% -6.1% 11.7% 1800% 1600% 1400% Prices 1200% 1000% Indexed 800% 600% 376.4% 400% 283.8% 200% 134 123.5% 6% 83.4% 0% 35.7% -93.1% Blue S&P 500 Index (Total Return) Nasdaq Index (Total Return) Selected Companies Index—SAFR [2] Selected Companies Index—KONTXT [3] Selected Companies Index—Games [4] Selected Companies Index—Foundation [5] . 1. Unaffected date refers to 5/6/22, the last trading day prior to the date the Proposal was publicly disclosed. 2. Includes: Aware, Inc., BIO-key International, Inc., Intellicheck, Inc., and Mitek Systems, Inc. 3. Includes: Bandwidth, Inc., cyan AG, DatChat, Inc., MIND C.T.I. Ltd., and Sinch AB. 4. Includes: DeNA Co., Ltd., G5 Entertainment AB, GREE, Inc., GungHo Online Entertainment, Inc., Huuuge, Inc., MAG Interactive AB, NHN Corporation, Rovio Entertainment Oyj, and Ten Square Games S.A. 5. Includes: Avid Technology, Inc., Benefitfocus, Inc., Dolby Laboratories, Inc., DHI Group, Inc., GoPro, Inc., Harmonic Inc., and InterDigital Inc. Source: Capital IQ as of 5/31/22. 30 CONFIDENTIAL – PRELIMINARY DRAFT – SUBJECT TO FURTHER REVIEW
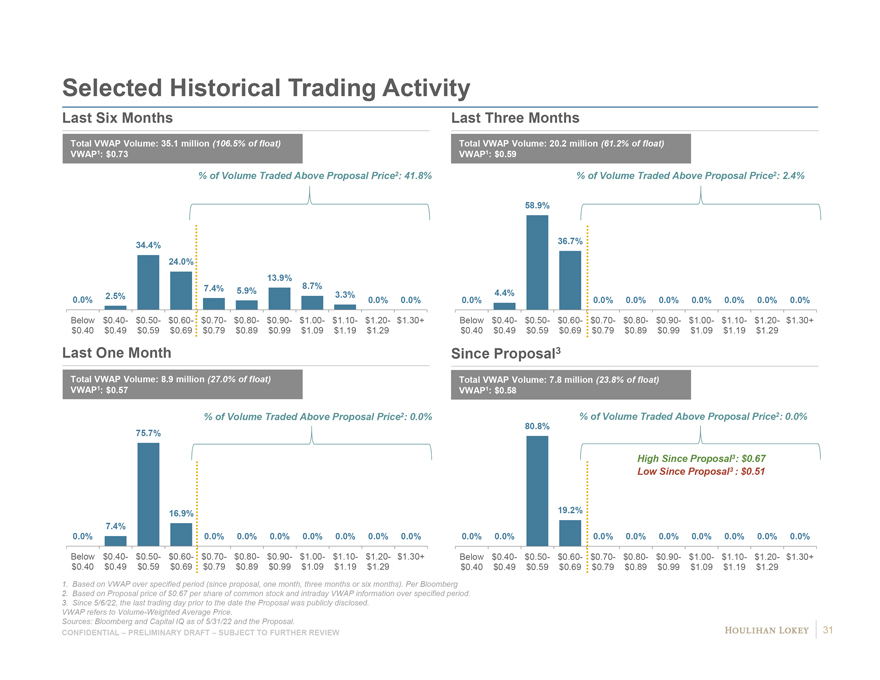
Selected Historical Trading Activity Last Six Months Last Three Months Total VWAP Volume: 35.1 million (106.5% of float) Total VWAP Volume: 20.2 million (61.2% of float) VWAP1: $0.73 VWAP1: $0.59 % of Volume Traded Above Proposal Price2: 41.8% % of Volume Traded Above Proposal Price2: 2.4% 58.9% 36.7% 34.4% 24.0% 13.9% 8.7% 7.4% 5.9% 2.5% 3.3% 4.4% 0.0% 0.0% 0.0% 0.0% 0.0% 0.0% 0.0% 0.0% 0.0% 0.0% 0.0% Below $0.40- $0.50- $0.60- $0.70- $0.80- $0.90- $1.00- $1.10- $1.20- $1.30+ Below $0.40- $0.50- $0.60- $0.70- $0.80- $0.90- $1.00- $1.10- $1.20- $1.30+ $0.40 $0.49 $0.59 $0.69 $0.79 $0.89 $0.99 $1.09 $1.19 $1.29 $0.40 $0.49 $0.59 $0.69 $0.79 $0.89 $0.99 $1.09 $1.19 $1.29 Last One Month Since Proposal3 Total VWAP Volume: 8.9 million (27.0% of float) Total VWAP Volume: 7.8 million (23.8% of float) VWAP1: $0.57 VWAP1: $0.58 % of Volume Traded Above Proposal Price2: 0.0% % of Volume Traded Above Proposal Price2: 0.0% 80.8% 75.7% High Since Proposal3: $0.67 Low Since Proposal3 : $0.51 16.9% 19.2% 7.4% 0.0% 0.0% 0.0% 0.0% 0.0% 0.0% 0.0% 0.0% 0.0% 0.0% 0.0% 0.0% 0.0% 0.0% 0.0% 0.0% 0.0% Below $0.40- $0.50- $0.60- $0.70- $0.80- $0.90- $1.00- $1.10- $1.20- $1.30+ Below $0.40- $0.50- $0.60- $0.70- $0.80- $0.90- $1.00- $1.10- $1.20- $1.30+ $0.40 $0.49 $0.59 $0.69 $0.79 $0.89 $0.99 $1.09 $1.19 $1.29 $0.40 $0.49 $0.59 $0.69 $0.79 $0.89 $0.99 $1.09 $1.19 $1.29 1. Based on VWAP over specified period (since proposal, one month, three months or six months). Per Bloomberg 2. Based on Proposal price of $0.67 per share of common stock and intraday VWAP information over specified period. 3. Since 5/6/22, the last trading day prior to the date the Proposal was publicly disclosed. VWAP refers to Volume-Weighted Average Price. Sources: Bloomberg and Capital IQ as of 5/31/22 and the Proposal. 31 CONFIDENTIAL – PRELIMINARY DRAFT – SUBJECT TO FURTHER REVIEW
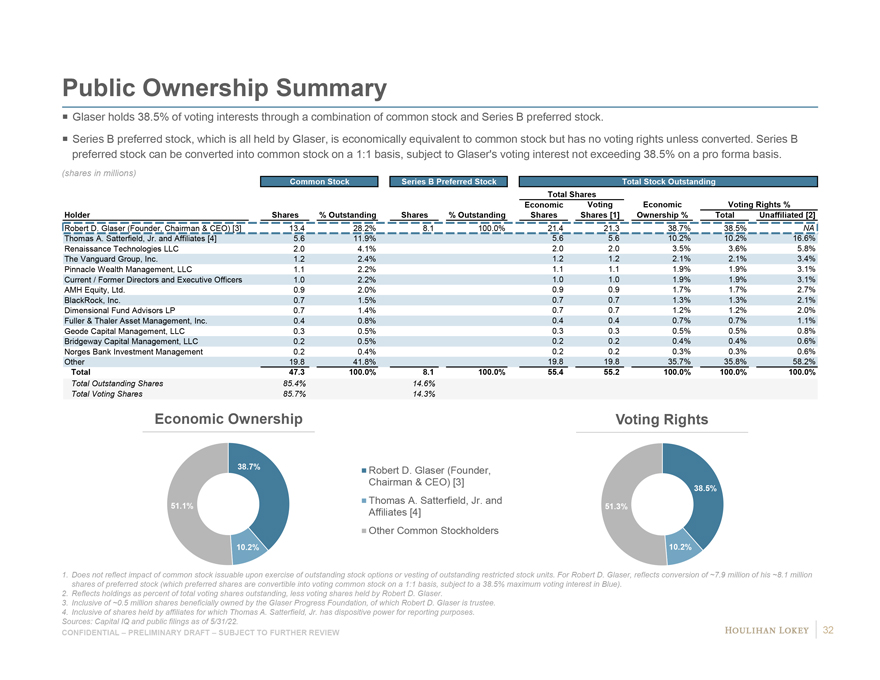
Public Ownership Summary Glaser holds 38.5% of voting interests through a combination of common stock and Series B preferred stock. Series B preferred stock, which is all held by Glaser, is economically equivalent to common stock but has no voting rights unless converted. Series B preferred stock can be converted into common stock on a 1:1 basis, subject to Glaser’s voting interest not exceeding 38.5% on a pro forma basis. (shares in millions) Common Stock Series B Preferred Stock Total Stock Outstanding Total Shares Economic Voting Economic Voting Rights % Holder Shares % Outstanding Shares % Outstanding Shares Shares [1] Ownership % Total Unaffiliated [2] Robert D. Glaser (Founder, Chairman & CEO) [3] 13.4 28.2% 8.1 100.0% 21.4 21.3 38.7% 38.5% NA Thomas A. Satterfield, Jr. and Affiliates [4] 5.6 11.9% 5.6 5.6 10.2% 10.2% 16.6% Renaissance Technologies LLC 2.0 4.1% 2.0 2.0 3.5% 3.6% 5.8% The Vanguard Group, Inc. 1.2 2.4% 1.2 1.2 2.1% 2.1% 3.4% Pinnacle Wealth Management, LLC 1.1 2.2% 1.1 1.1 1.9% 1.9% 3.1% Current / Former Directors and Executive Officers 1.0 2.2% 1.0 1.0 1.9% 1.9% 3.1% AMH Equity, Ltd. 0.9 2.0% 0.9 0.9 1.7% 1.7% 2.7% BlackRock, Inc. 0.7 1.5% 0.7 0.7 1.3% 1.3% 2.1% Dimensional Fund Advisors LP 0.7 1.4% 0.7 0.7 1.2% 1.2% 2.0% Fuller & Thaler Asset Management, Inc. 0.4 0.8% 0.4 0.4 0.7% 0.7% 1.1% Geode Capital Management, LLC 0.3 0.5% 0.3 0.3 0.5% 0.5% 0.8% Bridgeway Capital Management, LLC 0.2 0.5% 0.2 0.2 0.4% 0.4% 0.6% Norges Bank Investment Management 0.2 0.4% 0.2 0.2 0.3% 0.3% 0.6% Other 19.8 41.8% 19.8 19.8 35.7% 35.8% 58.2% Total 47.3 100.0% 8.1 100.0% 55.4 55.2 100.0% 100.0% 100.0% Total Outstanding Shares 85.4% 14.6% Total Voting Shares 85.7% 14.3% Economic Ownership Voting Rights 38.7% Robert D. Glaser (Founder, Chairman & CEO) [3] 38.5% Thomas A. Satterfield, Jr. and 51.1% 51.3% Affiliates [4] Other Common Stockholders 10.2% 10.2% 1. Does not reflect impact of common stock issuable upon exercise of outstanding stock options or vesting of outstanding restricted stock units. For Robert D. Glaser, reflects conversion of ~7.9 million of his ~8.1 million shares of preferred stock (which preferred shares are convertible into voting common stock on a 1:1 basis, subject to a 38.5% maximum voting interest in Blue). 2. Reflects holdings as percent of total voting shares outstanding, less voting shares held by Robert D. Glaser. 3. Inclusive of ~0.5 million shares beneficially owned by the Glaser Progress Foundation, of which Robert D. Glaser is trustee. 4. Inclusive of shares held by affiliates for which Thomas A. Satterfield, Jr. has dispositive power for reporting purposes. Sources: Capital IQ and public filings as of 5/31/22. 32 CONFIDENTIAL – PRELIMINARY DRAFT – SUBJECT TO FURTHER REVIEW
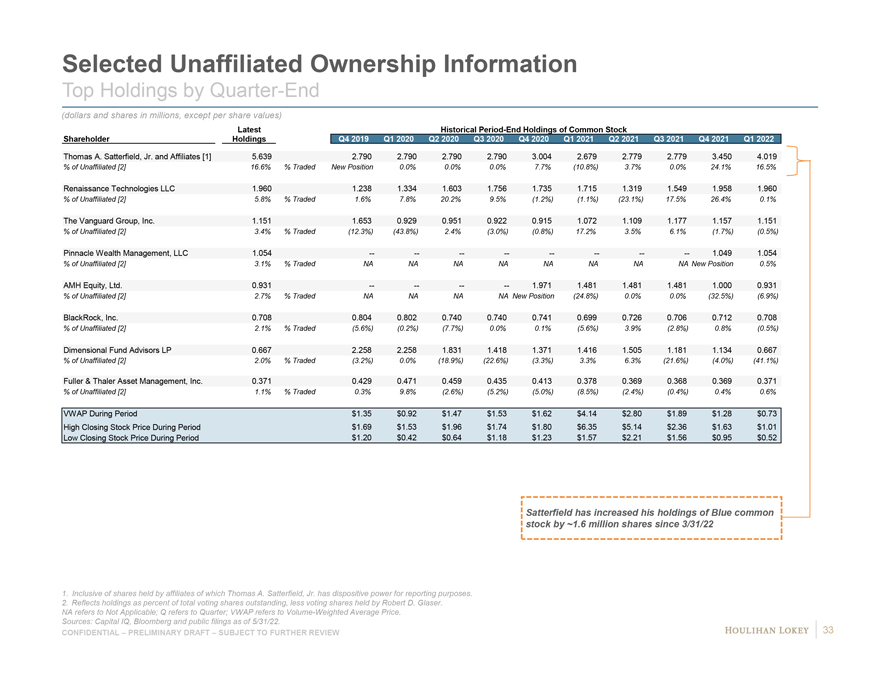
Selected Unaffiliated Ownership Information Top Holdings by Quarter-End (dollars and shares in millions, except per share values) Latest Historical Period-End Holdings of Common Stock Shareholder Holdings Q4 2019 Q1 2020 Q2 2020 Q3 2020 Q4 2020 Q1 2021 Q2 2021 Q3 2021 Q4 2021 Q1 2022 Thomas A. Satterfield, Jr. and Affiliates [1] 5.639 2.790 2.790 2.790 2.790 3.004 2.679 2.779 2.779 3.450 4.019 % of Unaffiliated [2] 16.6% % Traded New Position 0.0% 0.0% 0.0% 7.7% (10.8%) 3.7% 0.0% 24.1% 16.5% Renaissance Technologies LLC 1.960 1.238 1.334 1.603 1.756 1.735 1.715 1.319 1.549 1.958 1.960 % of Unaffiliated [2] 5.8% % Traded 1.6% 7.8% 20.2% 9.5% (1.2%) (1.1%) (23.1%) 17.5% 26.4% 0.1% The Vanguard Group, Inc. 1.151 1.653 0.929 0.951 0.922 0.915 1.072 1.109 1.177 1.157 1.151 % of Unaffiliated [2] 3.4% % Traded (12.3%) (43.8%) 2.4% (3.0%) (0.8%) 17.2% 3.5% 6.1% (1.7%) (0.5%) Pinnacle Wealth Management, LLC 1.054 — — — — — — — — 1.049 1.054 % of Unaffiliated [2] 3.1% % Traded NA NA NA NA NA NA NA NA New Position 0.5% AMH Equity, Ltd. 0.931 — — — — 1.971 1.481 1.481 1.481 1.000 0.931 % of Unaffiliated [2] 2.7% % Traded NA NA NA NA New Position (24.8%) 0.0% 0.0% (32.5%) (6.9%) BlackRock, Inc. 0.708 0.804 0.802 0.740 0.740 0.741 0.699 0.726 0.706 0.712 0.708 % of Unaffiliated [2] 2.1% % Traded (5.6%) (0.2%) (7.7%) 0.0% 0.1% (5.6%) 3.9% (2.8%) 0.8% (0.5%) Dimensional Fund Advisors LP 0.667 2.258 2.258 1.831 1.418 1.371 1.416 1.505 1.181 1.134 0.667 % of Unaffiliated [2] 2.0% % Traded (3.2%) 0.0% (18.9%) (22.6%) (3.3%) 3.3% 6.3% (21.6%) (4.0%) (41.1%) Fuller & Thaler Asset Management, Inc. 0.371 0.429 0.471 0.459 0.435 0.413 0.378 0.369 0.368 0.369 0.371 % of Unaffiliated [2] 1.1% % Traded 0.3% 9.8% (2.6%) (5.2%) (5.0%) (8.5%) (2.4%) (0.4%) 0.4% 0.6% VWAP During Period $1.35 $0.92 $1.47 $1.53 $1.62 $4.14 $2.80 $1.89 $1.28 $0.73 High Closing Stock Price During Period $1.69 $1.53 $1.96 $1.74 $1.80 $6.35 $5.14 $2.36 $1.63 $1.01 Low Closing Stock Price During Period $1.20 $0.42 $0.64 $1.18 $1.23 $1.57 $2.21 $1.56 $0.95 $0.52 Satterfield has increased his holdings of Blue common stock by ~1.6 million shares since 3/31/22 1. Inclusive of shares held by affiliates of which Thomas A. Satterfield, Jr. has dispositive power for reporting purposes. 2. Reflects holdings as percent of total voting shares outstanding, less voting shares held by Robert D. Glaser. NA refers to Not Applicable; Q refers to Quarter; VWAP refers to Volume-Weighted Average Price. Sources: Capital IQ, Bloomberg and public filings as of 5/31/22. 33 CONFIDENTIAL – PRELIMINARY DRAFT – SUBJECT TO FURTHER REVIEW
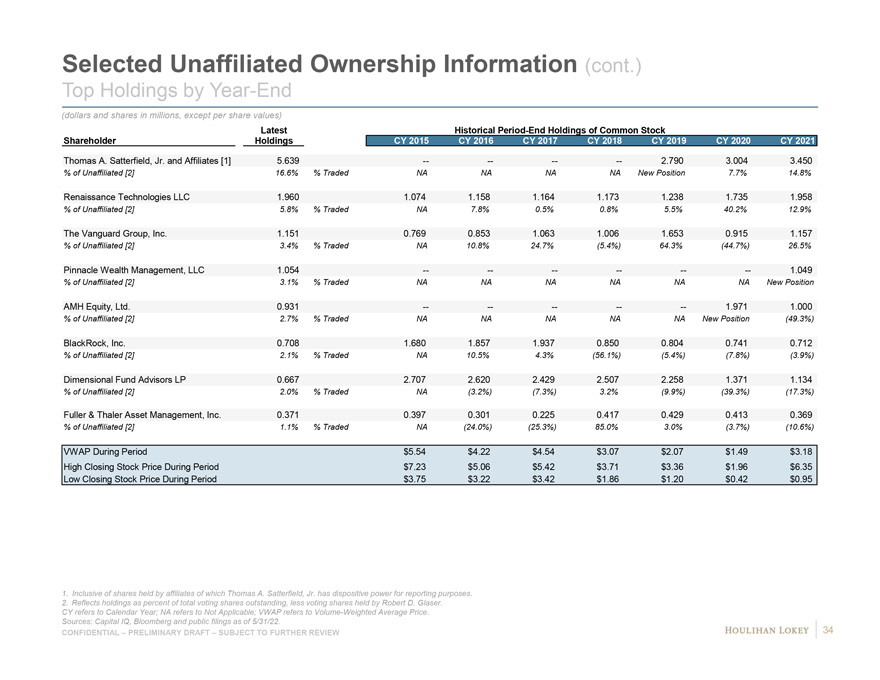
Selected Unaffiliated Ownership Information (cont.) Top Holdings by Year-End (dollars and shares in millions, except per share values) Latest Historical Period-End Holdings of Common Stock Shareholder Holdings CY 2015 CY 2016 CY 2017 CY 2018 CY 2019 CY 2020 CY 2021 Thomas A. Satterfield, Jr. and Affiliates [1] 5.639 — — — — 2.790 3.004 3.450 % of Unaffiliated [2] 16.6% % Traded NA NA NA NA New Position 7.7% 14.8% Renaissance Technologies LLC 1.960 1.074 1.158 1.164 1.173 1.238 1.735 1.958 % of Unaffiliated [2] 5.8% % Traded NA 7.8% 0.5% 0.8% 5.5% 40.2% 12.9% The Vanguard Group, Inc. 1.151 0.769 0.853 1.063 1.006 1.653 0.915 1.157 % of Unaffiliated [2] 3.4% % Traded NA 10.8% 24.7% (5.4%) 64.3% (44.7%) 26.5% Pinnacle Wealth Management, LLC 1.054 — — — — — — 1.049 % of Unaffiliated [2] 3.1% % Traded NA NA NA NA NA NA New Position AMH Equity, Ltd. 0.931 — — — — — 1.971 1.000 % of Unaffiliated [2] 2.7% % Traded NA NA NA NA NA New Position (49.3%) BlackRock, Inc. 0.708 1.680 1.857 1.937 0.850 0.804 0.741 0.712 % of Unaffiliated [2] 2.1% % Traded NA 10.5% 4.3% (56.1%) (5.4%) (7.8%) (3.9%) Dimensional Fund Advisors LP 0.667 2.707 2.620 2.429 2.507 2.258 1.371 1.134 % of Unaffiliated [2] 2.0% % Traded NA (3.2%) (7.3%) 3.2% (9.9%) (39.3%) (17.3%) Fuller & Thaler Asset Management, Inc. 0.371 0.397 0.301 0.225 0.417 0.429 0.413 0.369 % of Unaffiliated [2] 1.1% % Traded NA (24.0%) (25.3%) 85.0% 3.0% (3.7%) (10.6%) VWAP During Period $5.54 $4.22 $4.54 $3.07 $2.07 $1.49 $3.18 High Closing Stock Price During Period $7.23 $5.06 $5.42 $3.71 $3.36 $1.96 $6.35 Low Closing Stock Price During Period $3.75 $3.22 $3.42 $1.86 $1.20 $0.42 $0.95 1. Inclusive of shares held by affiliates of which Thomas A. Satterfield, Jr. has dispositive power for reporting purposes. 2. Reflects holdings as percent of total voting shares outstanding, less voting shares held by Robert D. Glaser. CY refers to Calendar Year; NA refers to Not Applicable; VWAP refers to Volume-Weighted Average Price. Sources: Capital IQ, Bloomberg and public filings as of 5/31/22. 34 CONFIDENTIAL – PRELIMINARY DRAFT – SUBJECT TO FURTHER REVIEW
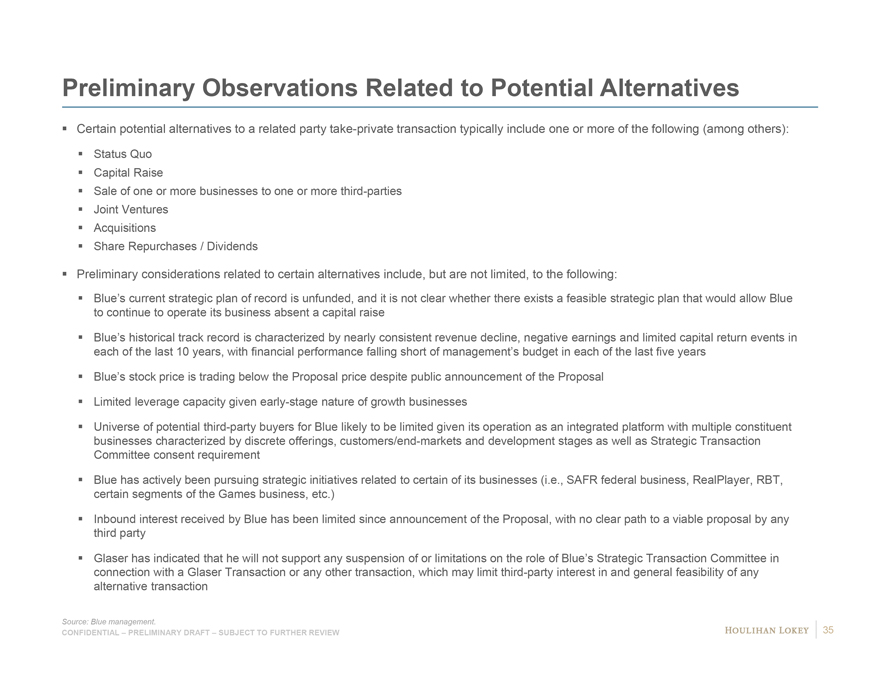
Preliminary Observations Related to Potential Alternatives Certain potential alternatives to a related party take-private transaction typically include one or more of the following (among others): Status Quo Capital Raise Sale of one or more businesses to one or more third-parties Joint Ventures Acquisitions Share Repurchases / Dividends Preliminary considerations related to certain alternatives include, but are not limited, to the following: Blue’s current strategic plan of record is unfunded, and it is not clear whether there exists a feasible strategic plan that would allow Blue to continue to operate its business absent a capital raise Blue’s historical track record is characterized by nearly consistent revenue decline, negative earnings and limited capital return events in each of the last 10 years, with financial performance falling short of management’s budget in each of the last five years Blue’s stock price is trading below the Proposal price despite public announcement of the Proposal Limited leverage capacity given early-stage nature of growth businesses Universe of potential third-party buyers for Blue likely to be limited given its operation as an integrated platform with multiple constituent businesses characterized by discrete offerings, customers/end-markets and development stages as well as Strategic Transaction Committee consent requirement Blue has actively been pursuing strategic initiatives related to certain of its businesses (i.e., SAFR federal business, RealPlayer, RBT, certain segments of the Games business, etc.) Inbound interest received by Blue has been limited since announcement of the Proposal, with no clear path to a viable proposal by any third party Glaser has indicated that he will not support any suspension of or limitations on the role of Blue’s Strategic Transaction Committee in connection with a Glaser Transaction or any other transaction, which may limit third-party interest in and general feasibility of any alternative transaction Source: Blue management. 35 CONFIDENTIAL – PRELIMINARY DRAFT – SUBJECT TO FURTHER REVIEW
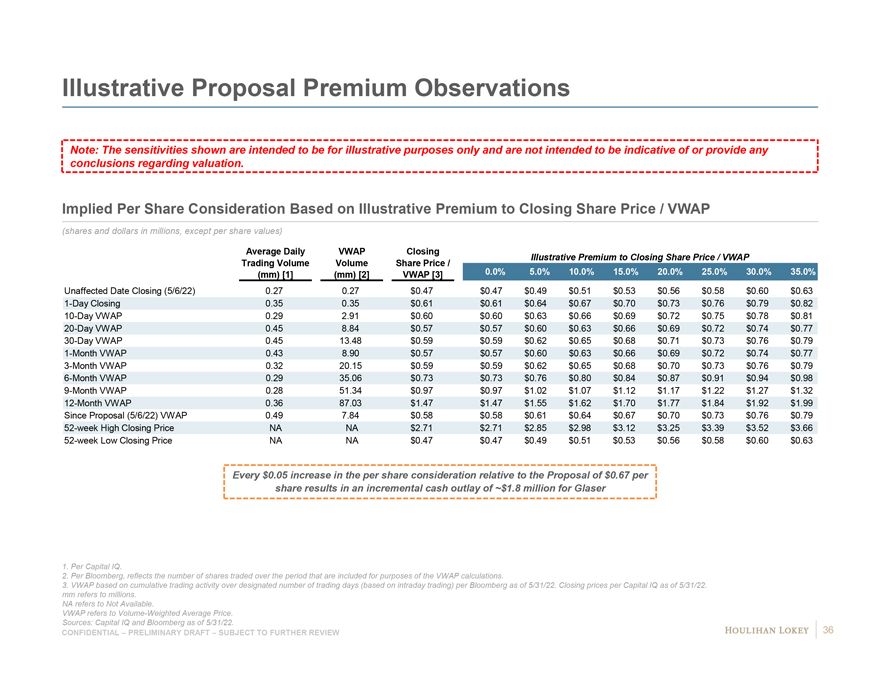
Illustrative Proposal Premium Observations Note: The sensitivities shown are intended to be for illustrative purposes only and are not intended to be indicative of or provide any conclusions regarding valuation. Implied Per Share Consideration Based on Illustrative Premium to Closing Share Price / VWAP (shares and dollars in millions, except per share values) Average Daily VWAP Closing Illustrative Premium to Closing Share Price / VWAP Trading Volume Volume Share Price / (mm) [1] (mm) [2] VWAP [3] 0.0% 5.0% 10.0% 15.0% 20.0% 25.0% 30.0% 35.0% Unaffected Date Closing (5/6/22) 0.27 0.27 $0.47 $0.47 $0.49 $0.51 $0.53 $0.56 $0.58 $0.60 $0.63 1-Day Closing 0.35 0.35 $0.61 $0.61 $0.64 $0.67 $0.70 $0.73 $0.76 $0.79 $0.82 10-Day VWAP 0.29 2.91 $0.60 $0.60 $0.63 $0.66 $0.69 $0.72 $0.75 $0.78 $0.81 20-Day VWAP 0.45 8.84 $0.57 $0.57 $0.60 $0.63 $0.66 $0.69 $0.72 $0.74 $0.77 30-Day VWAP 0.45 13.48 $0.59 $0.59 $0.62 $0.65 $0.68 $0.71 $0.73 $0.76 $0.79 1-Month VWAP 0.43 8.90 $0.57 $0.57 $0.60 $0.63 $0.66 $0.69 $0.72 $0.74 $0.77 3-Month VWAP 0.32 20.15 $0.59 $0.59 $0.62 $0.65 $0.68 $0.70 $0.73 $0.76 $0.79 6-Month VWAP 0.29 35.06 $0.73 $0.73 $0.76 $0.80 $0.84 $0.87 $0.91 $0.94 $0.98 9-Month VWAP 0.28 51.34 $0.97 $0.97 $1.02 $1.07 $1.12 $1.17 $1.22 $1.27 $1.32 12-Month VWAP 0.36 87.03 $1.47 $1.47 $1.55 $1.62 $1.70 $1.77 $1.84 $1.92 $1.99 Since Proposal (5/6/22) VWAP 0.49 7.84 $0.58 $0.58 $0.61 $0.64 $0.67 $0.70 $0.73 $0.76 $0.79 52-week High Closing Price NA NA $2.71 $2.71 $2.85 $2.98 $3.12 $3.25 $3.39 $3.52 $3.66 52-week Low Closing Price NA NA $0.47 $0.47 $0.49 $0.51 $0.53 $0.56 $0.58 $0.60 $0.63 Every $0.05 increase in the per share consideration relative to the Proposal of $0.67 per share results in an incremental cash outlay of ~$1.8 million for Glaser 1. Per Capital IQ. 2. Per Bloomberg, reflects the number of shares traded over the period that are included for purposes of the VWAP calculations. 3. VWAP based on cumulative trading activity over designated number of trading days (based on intraday trading) per Bloomberg as of 5/31/22. Closing prices per Capital IQ as of 5/31/22. mm refers to millions. NA refers to Not Available. VWAP refers to Volume-Weighted Average Price. Sources: Capital IQ and Bloomberg as of 5/31/22. CONFIDENTIAL – PRELIMINARY DRAFT – SUBJECT TO FURTHER REVIEW 36
Page 1. Executive Summary 3 2. Preliminary Illustrative Unfunded Status Quo Case Financial Analyses 11 3. Preliminary Considerations Related to Proposal 26 4. Appendix 37 Supplemental Historical Financial Information 38 Supplemental Illustrative Financial Analysis Information 43 5. Disclaimer 46
Page 1. Executive Summary 3 2. Preliminary Illustrative Unfunded Status Quo Case Financial Analyses 11 3. Preliminary Considerations Related to Proposal 26 4. Appendix 37 Supplemental Historical Financial Information 38 Supplemental Illustrative Financial Analysis Information 43 5. Disclaimer 46
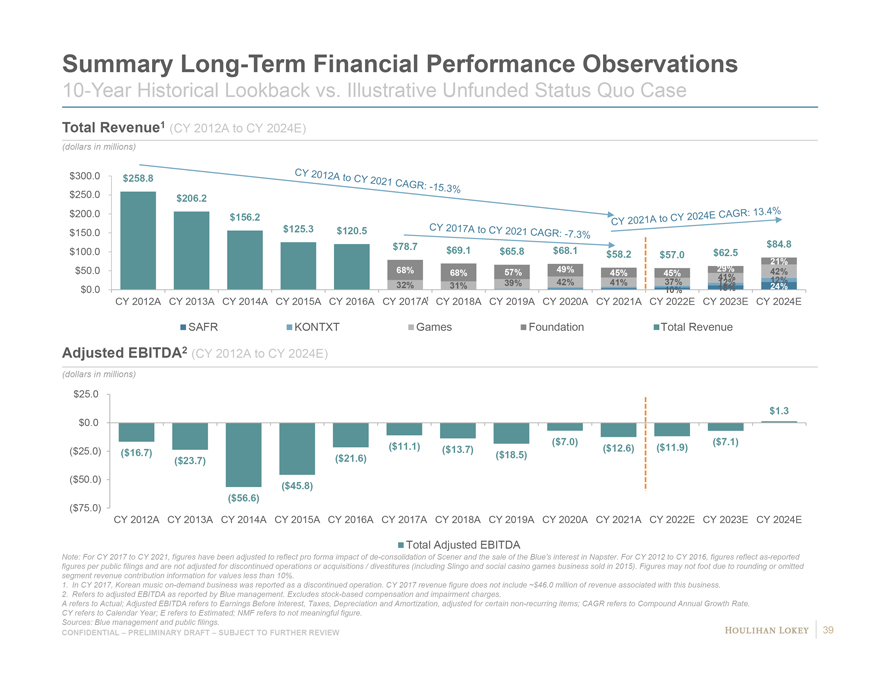
Summary Long-Term Financial Performance Observations 10-Year Historical Lookback vs. Illustrative Unfunded Status Quo Case Total Revenue1 (CY 2012A to CY 2024E) (dollars in millions) $300.0 $258.8 $250.0 $206.2 $200.0 $156.2 $150.0 $125.3 $120.5 $78.7 $84.8 $100.0 $69.1 $65.8 $68.1 $58.2 $62.5 $57.0 21% $50.0 68% 57% 49% 29% 42% 68% 45% 45% 41% 12% 32% 31% 39% 42% 41% 37% 12% $0.0 10% 18% 24% CY 2012A CY 2013A CY 2014A CY 2015A CY 2016A CY 2017A1 CY 2018A CY 2019A CY 2020A CY 2021A CY 2022E CY 2023E CY 2024E SAFR KONTXT Games Foundation Total Revenue Adjusted EBITDA2 (CY 2012A to CY 2024E) (dollars in millions) $25.0 $1.3 $0.0 ($7.0) ($7.1) ($11.1) ($13.7) ($12.6) ($11.9) ($25.0) ($16.7) ($18.5) ($23.7) ($21.6) ($50.0) ($45.8) ($56.6) ($75.0) CY 2012A CY 2013A CY 2014A CY 2015A CY 2016A CY 2017A CY 2018A CY 2019A CY 2020A CY 2021A CY 2022E CY 2023E CY 2024E Total Adjusted EBITDA Note: For CY 2017 to CY 2021, figures have been adjusted to reflect pro forma impact of de-consolidation of Scener and the sale of the Blue’s interest in Napster. For CY 2012 to CY 2016, figures reflect as-reported figures per public filings and are not adjusted for discontinued operations or acquisitions / divestitures (including Slingo and social casino games business sold in 2015). Figures may not foot due to rounding or omitted segment revenue contribution information for values less than 10%. 1. In CY 2017, Korean music on-demand business was reported as a discontinued operation. CY 2017 revenue figure does not include ~$46.0 million of revenue associated with this business. 2. Refers to adjusted EBITDA as reported by Blue management. Excludes stock-based compensation and impairment charges. A refers to Actual; Adjusted EBITDA refers to Earnings Before Interest, Taxes, Depreciation and Amortization, adjusted for certain non-recurring items; CAGR refers to Compound Annual Growth Rate. CY refers to Calendar Year; E refers to Estimated; NMF refers to not meaningful figure. Sources: Blue management and public filings. 39 CONFIDENTIAL – PRELIMINARY DRAFT – SUBJECT TO FURTHER REVIEW
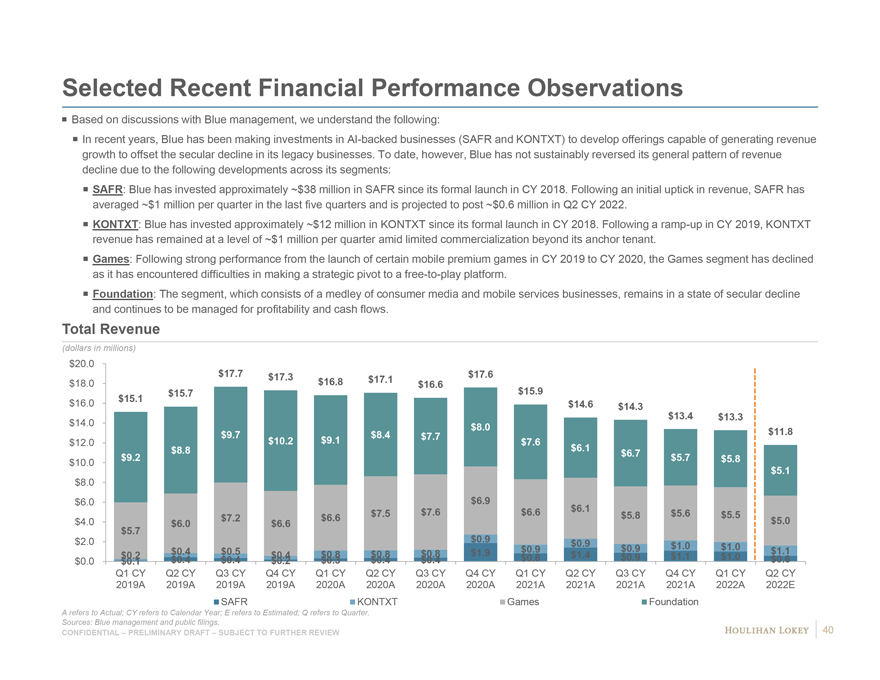
Selected Recent Financial Performance Observations Based on discussions with Blue management, we understand the following: In recent years, Blue has been making investments in AI-backed businesses (SAFR and KONTXT) to develop offerings capable of generating revenue growth to offset the secular decline in its legacy businesses. To date, however, Blue has not sustainably reversed its general pattern of revenue decline due to the following developments across its segments: SAFR: Blue has invested approximately ~$38 million in SAFR since its formal launch in CY 2018. Following an initial uptick in revenue, SAFR has averaged ~$1 million per quarter in the last five quarters and is projected to post ~$0.6 million in Q2 CY 2022. KONTXT: Blue has invested approximately ~$12 million in KONTXT since its formal launch in CY 2018. Following a ramp-up in CY 2019, KONTXT revenue has remained at a level of ~$1 million per quarter amid limited commercialization beyond its anchor tenant. Games: Following strong performance from the launch of certain mobile premium games in CY 2019 to CY 2020, the Games segment has declined as it has encountered difficulties in making a strategic pivot to a free-to-play platform. Foundation: The segment, which consists of a medley of consumer media and mobile services businesses, remains in a state of secular decline and continues to be managed for profitability and cash flows. Total Revenue (dollars in millions) $20.0 $17.7 $17.3 $17.6 $18.0 $16.8 $17.1 $16.6 $15.7 $15.9 $16.0 $15.1 $14.6 $14.3 $13.4 $13.3 $14.0 $8.0 $11.8 $9.7 $8.4 $7.7 $12.0 $10.2 $9.1 $7.6 $8.8 $6.1 $9.2 $6.7 $5.7 $10.0 $5.8 $5.1 $8.0 $6.0 $6.9 $7.6 $6.6 $6.1 $7.5 $5.8 $5.6 $5.5 $4.0 $7.2 $6.6 $5.0 $6.0 $6.6 $5.7 $2.0 $0.9 $0.9 $0.9 $0.9 $1.0 $1.0 $0.4 $0.5 $0.4 $0.8 $0.8 $0.8 $1.9 $1.4 $1.1 $0.2 $0.4 $0.4 $0.4 $0.4 $0.8 $0.9 $1.1 $1.0 $0.6 $0.0 $0.1 $0.2 $0.3 Q1 CY Q2 CY Q3 CY Q4 CY Q1 CY Q2 CY Q3 CY Q4 CY Q1 CY Q2 CY Q3 CY Q4 CY Q1 CY Q2 CY 2019A 2019A 2019A 2019A 2020A 2020A 2020A 2020A 2021A 2021A 2021A 2021A 2022A 2022E SAFR KONTXT Games Foundation A refers to Actual; CY refers to Calendar Year; E refers to Estimated; Q refers to Quarter. Sources: Blue management and public filings. 40 CONFIDENTIAL – PRELIMINARY DRAFT – SUBJECT TO FURTHER REVIEW
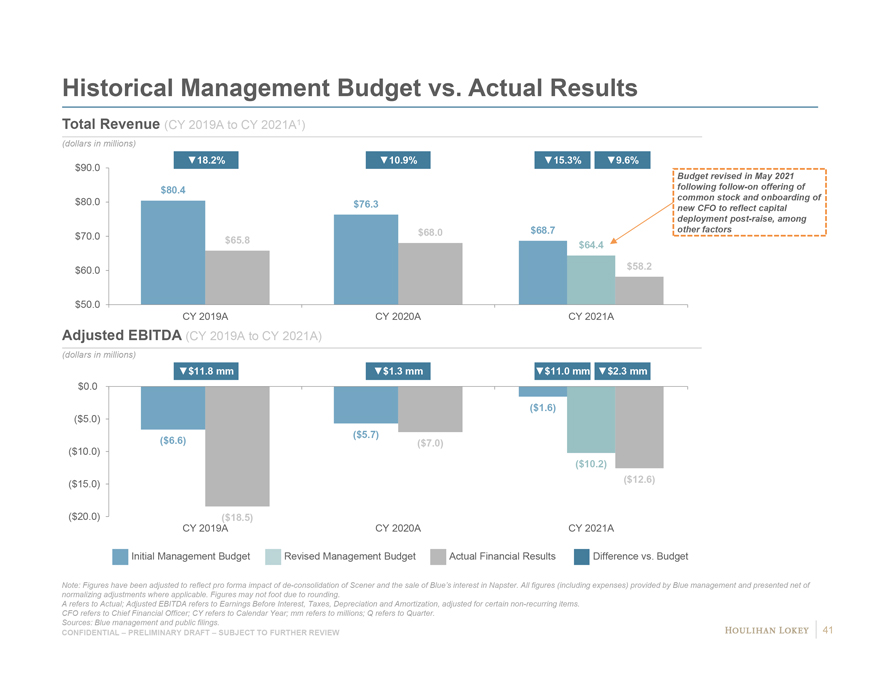
Historical Management Budget vs. Actual Results Total Revenue (CY 2019A to CY 2021A1) (dollars in millions) 18.2% 10.9% 15.3% 9.6% $90.0 Budget revised in May 2021 $80.4 following follow-on offering of $80.0 common stock and onboarding of $76.3 new CFO to reflect capital deployment post-raise, among $68.0 $68.7 other factors $70.0 $65.8 $64.4 $60.0 $58.2 $50.0 CY 2019A CY 2020A CY 2021A Adjusted EBITDA (CY 2019A to CY 2021A) (dollars in millions) $11.8 mm $1.3 mm $11.0 mm $2.3 mm $0.0 ($1.6) ($5.0) ($5.7) ($6.6) ($7.0) ($10.0) ($10.2) ($12.6) ($15.0) ($20.0) ($18.5) CY 2019A CY 2020A CY 2021A Initial Management Budget Revised Management Budget Actual Financial Results Difference vs. Budget Note: Figures have been adjusted to reflect pro forma impact of de-consolidation of Scener and the sale of Blue’s interest in Napster. All figures (including expenses) provided by Blue management and presented net of normalizing adjustments where applicable. Figures may not foot due to rounding. A refers to Actual; Adjusted EBITDA refers to Earnings Before Interest, Taxes, Depreciation and Amortization, adjusted for certain non-recurring items. CFO refers to Chief Financial Officer; CY refers to Calendar Year; mm refers to millions; Q refers to Quarter. Sources: Blue management and public filings. CONFIDENTIAL – PRELIMINARY DRAFT – SUBJECT TO FURTHER REVIEW 41
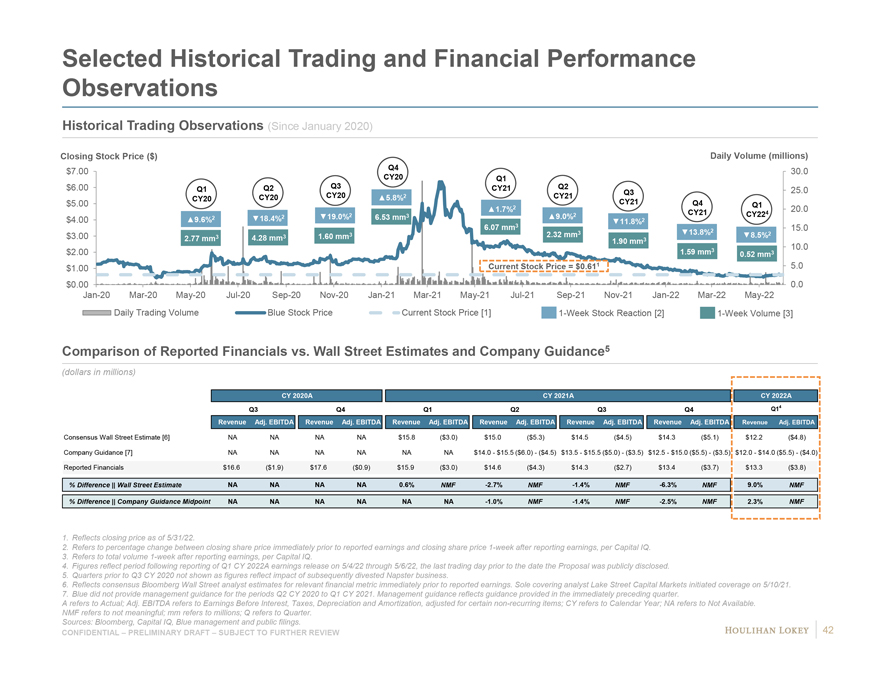
Selected Historical Trading and Financial Performance Observations Historical Trading Observations (Since January 2020) Closing Stock Price ($) Daily Volume (millions) $7.00 Q4 30.0 CY20 Q1 $6.00 Q1 Q2 Q3 CY21 Q2 25.0 CY20 Q3 CY20 CY20 5.8%2 CY21 $5.00 2 CY21 Q4 Q1 1.7% 20.0 2 CY21 CY224 2 19.0%2 3 9.0% $4.00 9.6%2 18.4% 6.53 mm 11.8%2 6.07 mm3 2 15.0 3 2.32 mm3 13.8% 8.5%2 $3.00 2.77 mm3 4.28 mm3 1.60 mm 1.90 mm3 10.0 $2.00 1.59 mm3 0.52 mm3 $1.00 Current Stock Price = $0.611 5.0 $0.00 0.0 Jan-20 Mar-20 May-20 Jul-20 Sep-20 Nov-20 Jan-21 Mar-21 May-21 Jul-21 Sep-21 Nov-21 Jan-22 Mar-22 May-22 Daily Trading Volume Blue Stock Price Current Stock Price [1] 1-Week Stock Reaction [2] 1-Week Volume [3] Comparison of Reported Financials vs. Wall Street Estimates and Company Guidance5 (dollars in millions) CY 2020A CY 2021A CY 2022A Q3 Q4 Q1 Q2 Q3 Q4 Q14 Revenue Adj. EBITDA Revenue Adj. EBITDA Revenue Adj. EBITDA Revenue Adj. EBITDA Revenue Adj. EBITDA Revenue Adj. EBITDA Revenue Adj. EBITDA Consensus Wall Street Estimate [6] NA NA NA NA $15.8 ($3.0) $15.0 ($5.3) $14.5 ($4.5) $14.3 ($5.1) $12.2 ($4.8) Company Guidance [7] NA NA NA NA NA NA $14.0—$15.5 ($6.0)—($4.5) $13.5—$15.5 ($5.0)—($3.5) $12.5—$15.0 ($5.5)—($3.5) $12.0—$14.0 ($5.5)—($4.0) Reported Financials $16.6 ($1.9) $17.6 ($0.9) $15.9 ($3.0) $14.6 ($4.3) $14.3 ($2.7) $13.4 ($3.7) $13.3 ($3.8) % Difference || Wall Street Estimate NA NA NA NA 0.6% NMF -2.7% NMF -1.4% NMF -6.3% NMF 9.0% NMF % Difference || Company Guidance Midpoint NA NA NA NA NA NA -1.0% NMF -1.4% NMF -2.5% NMF 2.3% NMF 1. Reflects closing price as of 5/31/22. 2. Refers to percentage change between closing share price immediately prior to reported earnings and closing share price 1-week after reporting earnings, per Capital IQ. 3. Refers to total volume 1-week after reporting earnings, per Capital IQ. 4. Figures reflect period following reporting of Q1 CY 2022A earnings release on 5/4/22 through 5/6/22, the last trading day prior to the date the Proposal was publicly disclosed. 5. Quarters prior to Q3 CY 2020 not shown as figures reflect impact of subsequently divested Napster business. 6. Reflects consensus Bloomberg Wall Street analyst estimates for relevant financial metric immediately prior to reported earnings. Sole covering analyst Lake Street Capital Markets initiated coverage on 5/10/21. 7. Blue did not provide management guidance for the periods Q2 CY 2020 to Q1 CY 2021. Management guidance reflects guidance provided in the immediately preceding quarter. A refers to Actual; Adj. EBITDA refers to Earnings Before Interest, Taxes, Depreciation and Amortization, adjusted for certain non-recurring items; CY refers to Calendar Year; NA refers to Not Available. NMF refers to not meaningful; mm refers to millions; Q refers to Quarter. Sources: Bloomberg, Capital IQ, Blue management and public filings. 42 CONFIDENTIAL – PRELIMINARY DRAFT – SUBJECT TO FURTHER REVIEW
Page 1. Executive Summary 3 2. Preliminary Illustrative Unfunded Status Quo Case Financial Analyses 11 3. Preliminary Considerations Related to Proposal 26 4. Appendix 37 Supplemental Historical Financial Information 38 Supplemental Illustrative Financial Analysis Information 43 5. Disclaimer 46
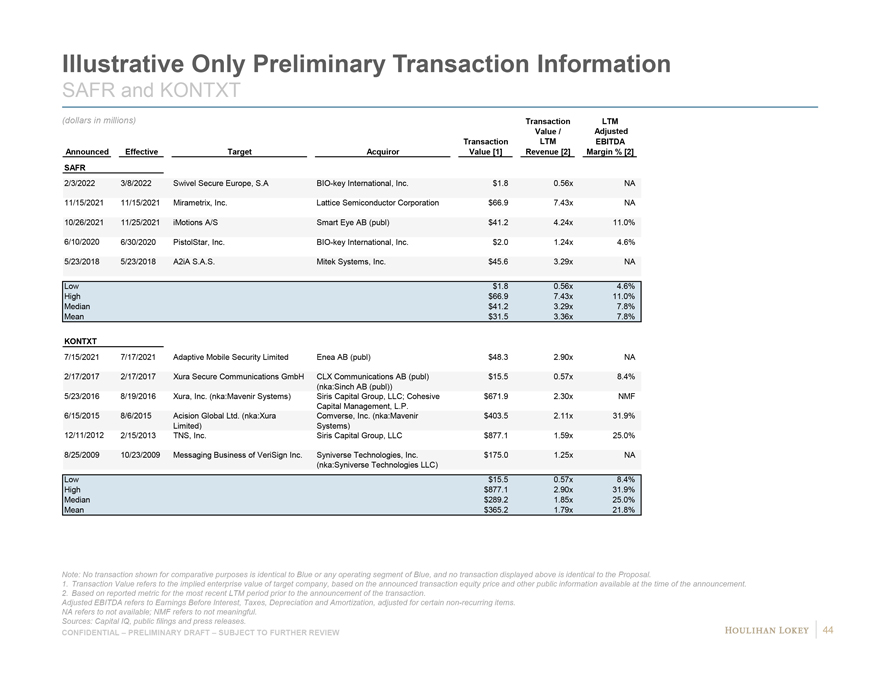
Illustrative Only Preliminary Transaction Information SAFR and KONTXT (dollars in millions) Transaction LTM Value / Adjusted Transaction LTM EBITDA Announced Effective Target Acquiror Value [1] Revenue [2] Margin % [2] SAFR 2/3/2022 3/8/2022 Swivel Secure Europe, S.A BIO-key International, Inc. $1.8 0.56x NA 11/15/2021 11/15/2021 Mirametrix, Inc. Lattice Semiconductor Corporation $66.9 7.43x NA 10/26/2021 11/25/2021 iMotions A/S Smart Eye AB (publ) $41.2 4.24x 11.0% 6/10/2020 6/30/2020 PistolStar, Inc. BIO-key International, Inc. $2.0 1.24x 4.6% 5/23/2018 5/23/2018 A2iA S.A.S. Mitek Systems, Inc. $45.6 3.29x NA Low $1.8 0.56x 4.6% High $66.9 7.43x 11.0% Median $41.2 3.29x 7.8% Mean $31.5 3.36x 7.8% KONTXT 7/15/2021 7/17/2021 Adaptive Mobile Security Limited Enea AB (publ) $48.3 2.90x NA 2/17/2017 2/17/2017 Xura Secure Communications GmbH CLX Communications AB (publ) $15.5 0.57x 8.4% (nka:Sinch AB (publ)) 5/23/2016 8/19/2016 Xura, Inc. (nka:Mavenir Systems) Siris Capital Group, LLC; Cohesive $671.9 2.30x NMF Capital Management, L.P. 6/15/2015 8/6/2015 Acision Global Ltd. (nka:Xura Comverse, Inc. (nka:Mavenir $403.5 2.11x 31.9% Limited) Systems) 12/11/2012 2/15/2013 TNS, Inc. Siris Capital Group, LLC $877.1 1.59x 25.0% 8/25/2009 10/23/2009 Messaging Business of VeriSign Inc. Syniverse Technologies, Inc. $175.0 1.25x NA (nka:Syniverse Technologies LLC) Low $15.5 0.57x 8.4% High $877.1 2.90x 31.9% Median $289.2 1.85x 25.0% Mean $365.2 1.79x 21.8% Note: No transaction shown for comparative purposes is identical to Blue or any operating segment of Blue, and no transaction displayed above is identical to the Proposal. 1. Transaction Value refers to the implied enterprise value of target company, based on the announced transaction equity price and other public information available at the time of the announcement. 2. Based on reported metric for the most recent LTM period prior to the announcement of the transaction. Adjusted EBITDA refers to Earnings Before Interest, Taxes, Depreciation and Amortization, adjusted for certain non-recurring items. NA refers to not available; NMF refers to not meaningful. Sources: Capital IQ, public filings and press releases. 44 CONFIDENTIAL – PRELIMINARY DRAFT – SUBJECT TO FURTHER REVIEW
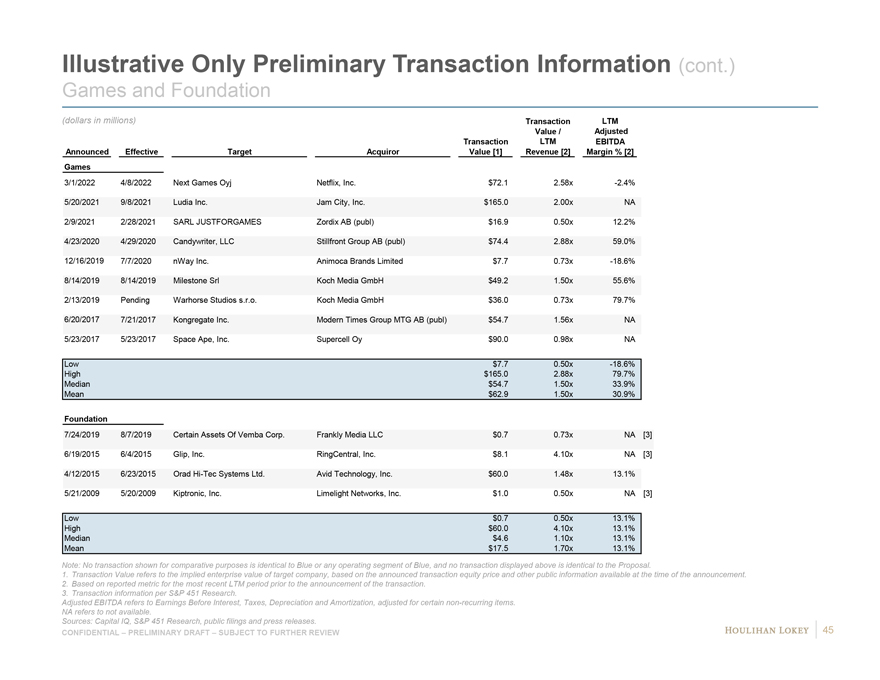
Illustrative Only Preliminary Transaction Information (cont.) Games and Foundation (dollars in millions) Transaction LTM Value / Adjusted Transaction LTM EBITDA Announced Effective Target Acquiror Value [1] Revenue [2] Margin % [2] Games 3/1/2022 4/8/2022 Next Games Oyj Netflix, Inc. $72.1 2.58x -2.4% 5/20/2021 9/8/2021 Ludia Inc. Jam City, Inc. $165.0 2.00x NA 2/9/2021 2/28/2021 SARL JUSTFORGAMES Zordix AB (publ) $16.9 0.50x 12.2% 4/23/2020 4/29/2020 Candywriter, LLC Stillfront Group AB (publ) $74.4 2.88x 59.0% 12/16/2019 7/7/2020 nWay Inc. Animoca Brands Limited $7.7 0.73x -18.6% 8/14/2019 8/14/2019 Milestone Srl Koch Media GmbH $49.2 1.50x 55.6% 2/13/2019 Pending Warhorse Studios s.r.o. Koch Media GmbH $36.0 0.73x 79.7% 6/20/2017 7/21/2017 Kongregate Inc. Modern Times Group MTG AB (publ) $54.7 1.56x NA 5/23/2017 5/23/2017 Space Ape, Inc. Supercell Oy $90.0 0.98x NA Low $7.7 0.50x -18.6% High $165.0 2.88x 79.7% Median $54.7 1.50x 33.9% Mean $62.9 1.50x 30.9% Foundation 7/24/2019 8/7/2019 Certain Assets Of Vemba Corp. Frankly Media LLC $0.7 0.73x NA [3] 6/19/2015 6/4/2015 Glip, Inc. RingCentral, Inc. $8.1 4.10x NA [3] 4/12/2015 6/23/2015 Orad Hi-Tec Systems Ltd. Avid Technology, Inc. $60.0 1.48x 13.1% 5/21/2009 5/20/2009 Kiptronic, Inc. Limelight Networks, Inc. $1.0 0.50x NA [3] Low $0.7 0.50x 13.1% High $60.0 4.10x 13.1% Median $4.6 1.10x 13.1% Mean $17.5 1.70x 13.1% Note: No transaction shown for comparative purposes is identical to Blue or any operating segment of Blue, and no transaction displayed above is identical to the Proposal. 1. Transaction Value refers to the implied enterprise value of target company, based on the announced transaction equity price and other public information available at the time of the announcement. 2. Based on reported metric for the most recent LTM period prior to the announcement of the transaction. 3. Transaction information per S&P 451 Research. Adjusted EBITDA refers to Earnings Before Interest, Taxes, Depreciation and Amortization, adjusted for certain non-recurring items. NA refers to not available. Sources: Capital IQ, S&P 451 Research, public filings and press releases. 45 CONFIDENTIAL – PRELIMINARY DRAFT – SUBJECT TO FURTHER REVIEW
Page 1. Executive Summary 3 2. Preliminary Illustrative Unfunded Status Quo Case Financial Analyses 11 3. Preliminary Considerations Related to Proposal 26 4. Appendix 37 5. Disclaimer 46
Disclaimer This presentation, and any supplemental information (written or oral) or other documents provided in connection therewith (collectively, the “materials”), are provided solely for the information of the Special Committee (the “Committee”) of the Board of Directors (the “Board”) of RealNetworks, Inc. (“Blue”, “RealNetworks” or the “Company”) by Houlihan Lokey in connection with the Committee’s consideration of a potential transaction (the “Transaction”) involving the Company. This presentation is incomplete without reference to, and should be considered in conjunction with, any supplemental information provided by and discussions with Houlihan Lokey in connection therewith. Any defined terms used herein shall have the meanings set forth herein, even if such defined terms have been given different meanings elsewhere in the materials. The materials are for discussion purposes only. Houlihan Lokey expressly disclaims any and all liability, whether direct or indirect, in contract or tort or otherwise, to any person in connection with the materials. The materials were prepared for specific persons familiar with the business and affairs of the Company for use in a specific context and were not prepared with a view to public disclosure or to conform with any disclosure standards under any state, federal or international securities laws or other laws, rules or regulations, and none of the Committee, the Company or Houlihan Lokey takes any responsibility for the use of the materials by persons other than the Committee. The materials are provided on a confidential basis solely for the information of the Committee and may not be disclosed, summarized, reproduced, disseminated or quoted or otherwise referred to, in whole or in part, without Houlihan Lokey’s express prior written consent. Notwithstanding any other provision herein, the Company (and each employee, representative or other agent of the Company) may disclose to any and all persons without limitation of any kind, the tax treatment and tax structure of any transaction and all materials of any kind (including opinions or other tax analyses, if any) that are provided to the Company relating to such tax treatment and structure. However, any information relating to the tax treatment and tax structure shall remain confidential (and the foregoing sentence shall not apply) to the extent necessary to enable any person to comply with securities laws. For this purpose, the tax treatment of a transaction is the purported or claimed U.S. income or franchise tax treatment of the transaction and the tax structure of a transaction is any fact that may be relevant to understanding the purported or claimed U.S. income or franchise tax treatment of the transaction. If the Company plans to disclose information pursuant to the first sentence of this paragraph, the Company shall inform those to whom it discloses any such information that they may not rely upon such information for any purpose without Houlihan Lokey’s prior written consent. Houlihan Lokey is not an expert on, and nothing contained in the materials should be construed as advice with regard to, legal, accounting, regulatory, insurance, tax or other specialist matters. Houlihan Lokey’s role in reviewing any information was limited solely to performing such a review as it deemed necessary to support its own advice and analysis and was not on behalf of the Committee. The materials necessarily are based on financial, economic, market and other conditions as in effect on, and the information available to Houlihan Lokey as of, the date of the materials. Although subsequent developments may affect the contents of the materials, Houlihan Lokey has not undertaken, and is under no obligation, to update, revise or reaffirm the materials, except as may be expressly contemplated by Houlihan Lokey’s engagement letter. The materials are not intended to provide the sole basis for evaluation of the Transaction and do not purport to contain all information that may be required. The materials do not address the underlying business decision of the Company or any other party to proceed with or effect the Transaction, or the relative merits of the Transaction as compared to any alternative business strategies or transactions that might be available for the Company or any other party. The materials do not constitute any opinion, nor do the materials constitute a recommendation to the Board, the Committee, the Company, any security holder of the Company or any other party as to how to vote or act with respect to any matter relating to the Transaction or otherwise or whether to buy or sell any assets or securities of any company. Houlihan Lokey’s only opinion is the opinion, if any, that is actually delivered to the Committee. In preparing the materials Houlihan Lokey has acted as an independent contractor and nothing in the materials is intended to create or shall be construed as creating a fiduciary or other relationship between Houlihan Lokey and any party. The materials may not reflect information known to other professionals in other business areas of Houlihan Lokey and its affiliates. The preparation of the materials was a complex process involving quantitative and qualitative judgments and determinations with respect to the financial, comparative and other analytic methods employed and the adaption and application of these methods to the unique facts and circumstances presented and, therefore, is not readily susceptible to partial analysis or summary description. Furthermore, Houlihan Lokey did not attribute any particular weight to any analysis or factor considered by it, but rather made qualitative judgments as to the significance and relevance of each analysis and factor. Each analytical technique has inherent strengths and weaknesses, and the nature of the available information may further affect the value of particular techniques. Accordingly, the analyses contained in the materials must be considered as a whole. Selecting portions of the analyses, analytic methods and factors without considering all analyses and factors could create a misleading or incomplete view. The materials reflect judgments and assumptions with regard to industry performance, general business, economic, regulatory, market and financial conditions and other matters, many of which are beyond the control of the participants in the Transaction. Any estimates of value contained in the materials are not necessarily indicative of actual value or predictive of future results or values, which may be significantly more or less favorable. Any analyses relating to the value of assets, businesses or securities do not purport to be appraisals or to reflect the prices at which any assets, businesses or securities may actually be sold. The materials do not constitute a valuation opinion or credit rating. The materials do not address the consideration to be paid or received in, the terms of any arrangements, understandings, agreements or documents related to, or the form, structure or any other portion or aspect of, the Transaction or otherwise. Furthermore, the materials do not address the fairness of any portion or aspect of the Transaction to any party. In preparing the materials, Houlihan Lokey has not conducted any physical inspection or independent appraisal or evaluation of any of the assets, properties or liabilities (contingent or otherwise) of the Company or any other party and has no obligation to evaluate the solvency of the Company or any other party under any law. CONFIDENTIAL – PRELIMINARY DRAFT – SUBJECT TO FURTHER REVIEW 47
Disclaimer (cont.) All budgets, projections, estimates, financial analyses, reports and other information with respect to operations (including, without limitation, estimates of potential cost savings and synergies) reflected in the materials have been prepared by management of the relevant party or are derived from such budgets, projections, estimates, financial analyses, reports and other information or from other sources, which involve numerous and significant subjective determinations made by management of the relevant party and/or which such management has reviewed and found reasonable. The budgets, projections and estimates (including, without limitation, estimates of potential cost savings and synergies) contained in the materials may or may not be achieved and differences between projected results and those actually achieved may be material. Houlihan Lokey has relied upon representations made by management of the Company and other participants in the Transaction that such budgets, projections and estimates have been reasonably prepared in good faith on bases reflecting the best currently available estimates and judgments of such management (or, with respect to information obtained from public sources, represent reasonable estimates), and Houlihan Lokey expresses no opinion with respect to such budgets, projections or estimates or the assumptions on which they are based. The scope of the financial analysis contained herein is based on discussions with the Company (including, without limitation, regarding the methodologies to be utilized), and Houlihan Lokey does not make any representation, express or implied, as to the sufficiency or adequacy of such financial analysis or the scope thereof for any particular purpose. Houlihan Lokey has assumed and relied upon the accuracy and completeness of the financial and other information provided to, discussed with or reviewed by it without (and without assuming responsibility for) independent verification of such information, makes no representation or warranty (express or implied) in respect of the accuracy or completeness of such information and has further relied upon the assurances of the Company and other participants in the Transaction that they are not aware of any facts or circumstances that would make such information inaccurate or misleading. In addition, Houlihan Lokey has relied upon and assumed, without independent verification, that there has been no change in the business, assets, liabilities, financial condition, results of operations, cash flows or prospects of the Company or any other participant in the Transaction since the respective dates of the most recent financial statements and other information, financial or otherwise, provided to, discussed with or reviewed by Houlihan Lokey that would be material to its analyses, and that the final forms of any draft documents reviewed by Houlihan Lokey will not differ in any material respect from such draft documents. The materials are not an offer to sell or a solicitation of an indication of interest to purchase any security, option, commodity, future, loan or currency. The materials do not constitute a commitment by Houlihan Lokey or any of its affiliates to underwrite, subscribe for or place any securities, to extend or arrange credit, or to provide any other services. In the ordinary course of business, certain of Houlihan Lokey’s affiliates and employees, as well as investment funds in which they may have financial interests or with which they may co-invest, may acquire, hold or sell, long or short positions, or trade or otherwise effect transactions, in debt, equity, and other securities and financial instruments (including loans and other obligations) of, or investments in, the Company, any Transaction counterparty, any other Transaction participant, any other financially interested party with respect to any transaction, other entities or parties that are mentioned in the materials, or any of the foregoing entities’ or parties’ respective affiliates, subsidiaries, investment funds, portfolio companies and representatives (collectively, the “Interested Parties”), or any currency or commodity that may be involved in the Transaction. Houlihan Lokey provides mergers and acquisitions, restructuring and other advisory and consulting services to clients, which may have in the past included, or may currently or in the future include, one or more Interested Parties, for which services Houlihan Lokey has received, and may receive, compensation. Although Houlihan Lokey in the course of such activities and relationships or otherwise may have acquired, or may in the future acquire, information about one or more Interested Parties or the Transaction, or that otherwise may be of interest to the Board, the Committee, or the Company, Houlihan Lokey shall have no obligation to, and may not be contractually permitted to, disclose such information, or the fact that Houlihan Lokey is in possession of such information, to the Board, the Committee, or the Company or to use such information on behalf of the Board, the Committee, or the Company. Houlihan Lokey’s personnel may make statements or provide advice that is contrary to information contained in the materials. CONFIDENTIAL – PRELIMINARY DRAFT – SUBJECT TO FURTHER REVIEW 48

CORPORATE FINANCE FINANCIAL RESTRUCTURING FINANCIAL AND VALUATION ADVISORY HL.com