The accompanying notes are an integral part of these consolidated financial statements.
Building Materials Holding Corporation
(thousands)
(unaudited)
| | | | | | | | | | | | | | | |
| | | | | | | | | | | | Accumulated Other Comprehensive Income (Loss) | | | |
| | | | | | | | | | | | Net Unrealized Gain (Loss) From | | | |
| | | | | Common Shares | | Additional Paid-In | | Unearned | | Retained | Interest Rate Swap | Marketable | | | |
| | | | | Shares | | | Amount | | Capital | | Compensation | | Earnings | | Contracts | | Securities | | Total |
Balance at December 31, 2004 | 27,705 | | $ | 28 | | $ | 124,580 | | $ | (1,383) | | $ | 205,812 | | $ | (1,362) | | $ | 3 | | $ | 327,678 |
| | | | | | | | | | | | | | | | | | | | | | | |
| Net income | | | | — | | | — | | | — | | | 54,462 | | | — | | | — | | | 54,462 |
| Unrealized gain | | | | — | | | — | | | — | | | — | | | 834 | | | — | | | 834 |
| Taxes for unrealized gain | | | | — | | | — | | | — | | | — | | | (328) | | | — | | | (328) |
| Unrealized loss | | | | — | | | — | | | — | | | — | | | — | | | (96) | | | (96) |
| Tax benefit for unrealized loss | | | | — | | | — | | | — | | | — | | | — | | | 37 | | | 37 |
Comprehensive income | | | | | | | | | | | | | | | | | | | | | | 54,909 |
| | | | | | | | | | | | | | | | | | | | | | | | | | |
| Issuance of restricted shares | 116 | | | — | | | 2,653 | | | (2,653) | | | — | | | — | | | — | | | ― |
| Earned compensation expense | | | | — | | | — | | | 619 | | | — | | | — | | | — | | | 619 |
| Share options exercised | 575 | | | — | | | 3,167 | | | — | | | — | | | — | | | — | | | 3,167 |
| Tax benefit for share options exercised | | | | — | | | 4,697 | | | — | | | — | | | — | | | — | | | 4,697 |
| Shares issued from Director Plan | 14 | | | — | | | 380 | | | — | | | — | | | — | | | — | | | 380 |
| Shares issued from Employee Plan | 18 | | | — | | | 432 | | | — | | | — | | | — | | | — | | | 432 |
| Shares issued for acquisition | 34 | | | — | | | 1,000 | | | — | | | — | | | — | | | — | | | 1,000 |
| Cash dividends on common shares | | | | — | | | — | | | — | | | (2,543) | | | — | | | — | | | (2,543) |
Balance at June 30, 2005 | 28,462 | | $ | 28 | | $ | 136,909 | | $ | (3,417) | | $ | 257,731 | | $ | (856) | | $ | (56) | | $ | 390,339 |
| | | | | | | | | | | | | | | | | | | | | | | |
| | | | | | | | | | | | | | | | | | | | | | | |
Balance at December 31, 2005 | 28,759 | | $ | 29 | | $ | 143,780 | | $ | (2,698) | | $ | 328,463 | | $ | 736 | | $ | (249) | | $ | 470,061 |
| | | | | | | | | | | | | | | | | | | | | | | |
| Net income | | | | — | | | — | | | — | | | 62,244 | | | — | | | — | | | 62,244 |
| Unrealized gain | | | | — | | | — | | | — | | | — | | | 1,822 | | | — | | | 1,822 |
| Taxes for unrealized gain | | | | — | | | — | | | — | | | — | | | (701) | | | — | | | (701) |
| Unrealized loss | | | | — | | | — | | | — | | | — | | | — | | | (165) | | | (165) |
| Tax benefit for unrealized loss | | | | — | | | — | | | — | | | — | | | — | | | 49 | | | 49 |
Comprehensive income | | | | | | | | | | | | | | | | | | | | | | 63,249 |
| | | | | | | | | | | | | | | | | | | | | | | | | | |
Reclassify unearned compensation - restricted shares | | | | — | | | (2,698) | | | 2,698 | | | — | | | — | | | — | | | — |
| Earned compensation - options | | | | — | | | 3,340 | | | — | | | — | | | — | | | — | | | 3,340 |
Earned compensation - restricted shares | | | | — | | | 1,518 | | | — | | | — | | | — | | | — | | | 1,518 |
| Issuance of restricted shares | 138 | | | — | | | — | | | — | | | — | | | — | | | — | | | |
| Share options exercised | 62 | | | — | | | 576 | | | — | | | — | | | — | | | — | | | 576 |
| Tax benefit for share options exercised | | | | — | | | 605 | | | — | | | — | | | — | | | — | | | 605 |
| Shares issued from Director Plan | 12 | | | — | | | 415 | | | — | | | — | | | — | | | — | | | 415 |
| Shares issued from Employee Plan | 25 | | | — | | | 862 | | | — | | | — | | | — | | | — | | | 862 |
| Cash dividends on common shares | | | | — | | | — | | | — | | | (5,793) | | | — | | | — | | | (5,793) |
Balance at June 30, 2006 | 28,996 | | $ | 29 | | $ | 148,398 | | $ | — | | $ | 384,914 | | $ | 1,857 | | $ | (365) | | $ | 534,833 |
The accompanying notes are an integral part of these consolidated financial statements.Building Materials Holding Corporation (thousands)
(unaudited)
| | |
| | Six Months Ended |
| | June 30 |
Operating Activities | 2006 | | 2005 |
| Net income | $ | 62,244 | | $ | 54,462 |
| Items in net income not using (providing) cash: | | | | | |
| Minority interests, net | | 6,074 | | | 6,809 |
| Depreciation and amortization | | 21,308 | | | 11,585 |
| Impairment of assets | | 2,237 | | | 463 |
| Share-based compensation | | 5,401 | | | 1,064 |
| (Gain) Loss on sale of assets, net | | (91) | | | 33 |
| Deferred income taxes | | 33 | | | (2,401) |
| Tax benefit for share options | | — | | | 4,697 |
Changes in assets and liabilities, net of effects of acquisitions and sales of business units: | | | | | |
| Receivables, net | | (11,659) | | | (38,945) |
| Inventory | | (18,096) | | | (28,650) |
| Unbilled receivables | | (18,784) | | | (2,942) |
| Prepaid expenses and other current assets | | (2,549) | | | 4,339 |
| Accounts payable | | 25,340 | | | 29,763 |
| Accrued compensation | | (8,029) | | | 13,013 |
| Insurance deductible reserves | | 11,203 | | | 7,557 |
| Other accrued liabilities | | 13,033 | | | 5,687 |
| Billings in excess of costs and estimated earnings | | 8,842 | | | 10,329 |
| Other long-term assets and liabilities | | (3,001) | | | 3,566 |
| Other, net | | (470) | | | (100) |
| Cash flows provided by operating activities | | 93,036 | | | 80,329 |
| | | | | | |
Investing Activities | | | | | |
| Purchases of property and equipment | | (28,731) | | | (17,202) |
| Acquisitions and investments in businesses, net of cash acquired | | (100,097) | | | (27,088) |
| Proceeds from dispositions of property and equipment | | 738 | | | 300 |
| Purchase of marketable securities | | (4,410) | | | (4,224) |
| Other, net | | (3,308) | | | 760 |
| Cash flows used by investing activities | | (135,808) | | | (47,454) |
| | | | | | |
Financing Activities | | | | | |
| Net borrowings (payments) under revolver | | 65,500 | | | (81,200) |
| Borrowings under term note | | — | | | 75,000 |
| Principal payments on term note | | (625) | | | (626) |
| Net payments on other notes payable | | (330) | | | (4,096) |
| Decrease in book overdrafts | | (5,369) | | | (4,443) |
| Proceeds from share options exercised | | 576 | | | 3,167 |
| Tax benefit for share options | | 605 | | | — |
| Dividends paid | | (5,051) | | | (2,230) |
| Deferred financing costs | | (1,498) | | | (2,193) |
| Distributions to minority interests | | (3,221) | | | (849) |
| Other, net | | (8) | | | 54 |
| Cash flows provided (used) by financing activities | | 50,579 | | | (17,416) |
| | | | | | |
Increase in Cash and Cash Equivalents | | 7,807 | | | 15,459 |
| | | | | | |
| Cash and cash equivalents, beginning of period | | 30,078 | | | 19,496 |
| Cash and cash equivalents, end of period | $ | 37,885 | | $ | 34,955 |
| | | | | | |
Supplemental Disclosure of Cash Flow Information | | | | | |
| Accrued but unpaid dividends | $ | 2,900 | | $ | 1,421 |
| Cash paid for interest | $ | 11,159 | | $ | 6,480 |
| Cash paid for income taxes | $ | 46,157 | | $ | 26,057 |
| | | | | | |
Supplemental Disclosure of Non-cash Investing Activities | | | | | |
| Fair value of assets acquired | $ | 149,461 | | $ | 52,184 |
| Liabilities assumed | $ | 49,364 | | $ | 25,096 |
| Cash paid for acquisitions and investments in businesses, net of cash acquired | $ | 100,097 | | $ | 27,088 |
The accompanying notes are an integral part of these consolidated financial statements.
These consolidated financial statements have been prepared pursuant to the rules and regulations of the Securities and Exchange Commission. Certain information and disclosures normally included in financial statements prepared in accordance with accounting principles generally accepted in the United States have been condensed or omitted pursuant to those rules and regulations. These consolidated financial statements should be read in conjunction with the consolidated financial statements and the accompanying notes included in our Annual Report on Form 10-K for the year ended December 31, 2005.
These consolidated financial statements have not been audited by independent registered public accountants. However, in the opinion of management, all adjustments necessary, including those of a normal and recurring nature, to present fairly the results for the periods have been included. The preparation of these consolidated financial statements required estimates and assumptions. Actual results may differ from those estimates.
The term quarter refers to the three month period whereas period refers to the six month period. Certain reclassifications have been made to amounts reported in prior periods, none of which affected financial position, results of operations or cash flows.
Common Share Split
On February 14, 2006, our Board of Directors approved a two for one split of our outstanding common shares. Shareholders as of February 28, 2006 received a stock dividend of one additional common share for every common share they owned. All share and per share information for all prior periods presented has been retroactively adjusted to reflect this share split.
Net income per share was determined using the following information (thousands, except per share data):
| | Three Months Ended June 30 | | Six Months Ended June 30 |
| | | 2006 | | | 2005 | | | 2006 | | | 2005 |
| Net income | $ | 34,175 | | $ | 33,314 | | $ | 62,244 | | $ | 54,462 |
| | | | | | | | | | | | |
Weighted average shares used to determine basic net income per share | | 28,578 | | | 27,995 | | | 28,551 | | | 27,813 |
Net effect of dilutive stock options and restricted stock (1) | | 1,004 | | | 1,297 | | | 1,027 | | | 1,246 |
Weighted average shares used to determine diluted net income per share | | 29,582 | | | 29,252 | | | 29,578 | | | 29,059 |
| | | | | | | | | | | | |
| Net income per share: | | | | | | | | | | | |
| Basic | | $1.20 | | | $1.19 | | | $2.18 | | | $1.96 |
| Diluted | | $1.16 | | | $1.14 | | | $2.10 | | | $1.87 |
| | | | | | | | | | | | |
Cash dividends declared per share for the period | | $0.10 | | | $0.05 | | | $0.20 | | | $0.09 |
| | (1) | Options to purchase shares of 405,100 for the second quarter of 2006 as well as 405,100 and 4,000 for the six months ended June 30, 2006 and 2005 respectively were not dilutive and therefore excluded from the computation of net income per diluted share. Options categorized as not dilutive were defined on the basis of the exercise price being greater than the average market value of the common shares in the periods presented. |
3. | Accounting for Share-Based Compensation |
On January 1, 2006, we adopted the fair value recognition provisions of Statement of Financial Accounting Standards No. 123 (Revised 2004), Share-Based Payment. This statement required the measurement and recognition of share-based payments to employees at fair value. Compensation cost is based on the fair value of those shares on the grant date. Compensation cost for share-based awards is recognized as the requisite service is rendered in the same financial statement line as cash compensation. Additionally, tax benefits for share-based compensation payments are reported as a financing activity, rather than as an operating cash flow.
Previously, we did not recognize expense for grants of share options if the exercise price was at least equal to the fair value of the shares on the date of grant. In accordance with the modified prospective method of transition, compensation expense is recognized over the requisite service period for all share-based compensation granted after the date of adoption as well as grants unvested on the date of adoption. Prior periods are not revised for comparative purposes. Share-based compensation expense included restricted shares and share awards and will now include share options.
The fair value of compensation expense recognized for vested options was $2.8 million whereas the compensation expense for non-vested options due to early retirement eligibility was $0.6 million for the period ended June 30, 2006. As this compensation does not require the payment of cash, this is reflected as a non-cash item in the statement of cash flows.
Share-based compensation expense is included in selling, general and administrative since it is incentive compensation issued primarily to our executives. Share-based compensation expense for options, restricted shares and share awards was $4.8 million for the period ended June 30, 2006. Share-based compensation expense for restricted shares and share awards was $0.9 million for the period ended June 30, 2005 and $1.6 million for 2005.
As of June 30, 2006 there was $15.6 million of unrecognized compensation expense related to non-vested share-based compensation arrangements granted under our plans. This expense will be recognized as the requisite services are rendered and is expected to be recognized over the next 5 years.
Pro Forma Information for the Period Prior to January 1, 2006
Financial information for prior periods has not been restated to reflect this change in accounting principle. The following table illustrates the effect on net income and income per share if the fair value recognition provisions of Statement of Financial Accounting Standards No. 123, Accounting for Stock-Based Compensation, were applied to share options for the prior period (thousands, except per share data):
| | Three Months Ended | | Six Months Ended |
| | June 30 | | June 30 |
| 2005 | | 2005 |
| Net income, as reported | $ | 33,314 | | $ | 54,462 |
Add: Share-based employee compensation expense determined under APB 25, net of related tax effects | | 208 | | | 346 |
Deduct: Share-based employee compensation expense determined under fair value method for all awards, net of related tax effects | | (746) | | | (1,321) |
| Pro forma net income | $ | 32,758 | | $ | 53,487 |
| | | | | | |
| | | | | | |
| Diluted net income per share: | | | | | |
| As reported | | $1.14 | | | $1.87 |
| Pro forma | | $1.12 | | | $1.84 |
Our estimate of the fair values of our share-based compensation is based on the modified Black-Scholes-Merton model. In order to meet the fair value measurement objective, we are required to develop estimates regarding expected exercise patterns, share price volatility, dividend yield and risk-free interest rate. These assumptions are based principally on historical experience. The expected term was based on the average of the vesting term and the term of the option. Volatility was based on daily trading data of our common shares over a term consistent with the term of the option. Expected dividend yield is based on historical dividend payments. Risk free interest rate reflects the yield on the zero coupon U.S. Treasury for the remaining term of the options. When circumstances indicate the availability of new or different information that would be useful in estimating these assumptions, revisions will be made and reflected in the period such revisions are determined. Due to uncertainties inherent in these assumptions, it is possible that actual share-based compensation may vary from this estimate.
Long-lived assets such as property, equipment and intangibles are evaluated for impairment whenever events or changes in circumstances indicate the carrying amount may not be recoverable. An impairment for these assets is recognized if the carrying amount is more than the estimated future operating cash flows on an undiscounted basis. Similarly, goodwill is evaluated for impairment in the fourth quarter and whenever events and circumstances indicate the carrying amount may not be recoverable. An impairment for goodwill is recognized if the carrying amount is more than the estimated future operating cash flows as measured by fair value techniques.
As a result of changes in specific markets, impairments of $1.8 million for the carrying amount of goodwill and $0.4 million for the carrying amount of certain customer relationships were recognized for SelectBuild in the second quarter of 2006.
As a result of changes in specific markets, impairments of $0.8 million for the carrying amount of goodwill and $0.5 million for the carrying amount of certain customer relationships were recognized for SelectBuild in 2005.
5. | Acquisitions and Minority Interests |
Acquisitions are accounted for under the purchase method of accounting. The purchase price is allocated to the assets acquired, including intangible assets, and liabilities assumed based on their estimated fair values at the date of acquisition. Subsequent to the initial allocation of purchase price, adjustments may be made to reflect the fair value of working capital and tangible assets. Any excess of the purchase price over the estimated fair value of the identifiable assets and liabilities acquired is recorded as goodwill. Operating results of acquired businesses are included in the consolidated statements of income from the date of acquisition.
| | · | In June 2006, BMC West acquired a building materials distribution and truss manufacturing business in Eastern Idaho for approximately $5.1 million in cash of which $0.1 million has been retained for the settlement period. This purchase price is subject to working capital adjustment. Information required to complete the purchase price is not yet available. Final allocation of the purchase price will be completed as soon as this information is available. |
| | · | In April 2006, SelectBuild acquired a concrete services business in Northern Arizona for approximately $1.5 million in cash of which $0.2 million has been retained for the settlement period. This purchase price is subject to working capital adjustment. Information required to complete the purchase price is not yet available. Final allocation of the purchase price will be completed as soon as this information is available. |
| | · | In April 2006, SelectBuild acquired a wall panel and truss manufacturing business in Palm Springs, California for $6.7 million in cash of which $0.7 million has been retained for the settlement period. Information required to complete the purchase price is not yet available. Final allocation of the purchase price will be completed as soon as this information is available. |
| | · | In February 2006, BMC West acquired three facilities providing building materials distribution and millwork services in Houston, Texas for $20.6 million in cash of which $0.2 million has been retained for the settlement period. Information required to complete the purchase price is not yet available. Final allocation of the purchase price will be completed as soon as this information is available. |
| | · | In January 2006, SelectBuild acquired framing businesses in Palm Springs, California and Reno, Nevada for $57.1 million in cash of which $11.4 million has been retained for the settlement period. Information required to complete the purchase price is not yet available. Final allocation of the purchase price will be completed as soon as this information is available. |
| | · | In October 2005, SelectBuild acquired a framing services business in San Diego, California for $72.6 million in cash. An additional cash payment may be required based on operating performance through September 2009. |
| | · | In September 2005, SelectBuild acquired a concrete and plumbing services business in Las Vegas, Nevada and Southern California for $85.6 million in cash. |
| | · | In September 2005, BMC West acquired a truss manufacturing business in McCall, Idaho for $1.3 million in cash. |
| | · | In June 2005, SelectBuild acquired a stucco business in Las Vegas, Nevada for $5.9 million in cash. |
Minority interest reflects the other owners’ proportionate share in the assets and liabilities of business ventures as of the date of purchase, adjusted by the proportionate share of post-acquisition income or loss. As the operating results of entities with minority interest are consolidated, minority interests income represents the income or loss attributable to the other owners.
| | · | In January 2006, SelectBuild acquired the remaining 20% interest in WBC Construction, LLC for $31.4 million in cash of which $28.8 million is payable in December 2006. An additional cash payment may be required based on operating performance through December 2006. Information required to complete the purchase price allocation is not yet available. Final allocation of the purchase price will be completed as soon as this information is available. |
In August 2005, SelectBuild acquired an additional 20% interest in WBC Construction, LLC for $24.8 million in cash. WBC Construction provides concrete block masonry and concrete services to high-volume production homebuilders in Florida.
| | · | In July 2005, SelectBuild acquired a 51% interest in BBP Companies for $9.4 million in cash and $1 million of common shares. The remaining 49% is owned by BBP Concrete and is recognized as minority interest. BBP Companies provide concrete services to high-volume production homebuilders in Arizona. |
| | · | In July 2005, SelectBuild acquired an additional 13% interest in Riggs Plumbing, LLC (Riggs Plumbing) for $1.4 million in cash. In April 2005, we acquired an initial 60% interest for $17.8 million in cash. The remaining 27% is owned by Riggs & Associates, LLC and is recognized as minority interest. Riggs Plumbing provides plumbing services to high-volume production builders in the Phoenix and Tucson markets. |
| | · | In January 2005, SelectBuild acquired a 51% interest in RCI Construction, LLC (RCI Construction) for $4.9 million in cash. The remaining 49% is owned by Residential Carpentry, Inc. and is recognized as minority interest. RCI Construction provides framing services to high-volume production builders in the greater Chicago area. |
Assets and liabilities acquired in these acquisitions included (thousands):
| | June 30 | December 31 | | | June 30 | December 31 |
| | 2006 | | 2005 | | | 2006 | | 2005 |
| Cash and cash equivalents | $ | ― | | $ | 1,644 | | Accounts payable | $ | 10,172 | | $ | 46,078 |
| Receivables | | 29,505 | | | 106,407 | | Accrued compensation | | 1,187 | | | 7,385 |
| Inventory | | 12,468 | | | 11,559 | | Insurance deductible reserves | | ― | | | 3,192 |
| Unbilled receivables | | 7,783 | | | 30,554 | | Other accrued liabilities | | 24,784 | | | 30,014 |
| Deferred income taxes | | ― | | | (6,527) | | Billings in excess of costs and | | | | | |
| Prepaid expenses and other | | 105 | | | 4,057 | | estimated earnings | | 11,080 | | | 24,436 |
| | | | | | | | Current portion of long-term debt | | ― | | | 5,605 |
| Total current assets | | 49,861 | | | 147,694 | | Total current liabilities | | 47,223 | | | 116,710 |
| | | | | | | | | | | | | |
| Property and equipment | | 14,313 | | | 33,406 | | Deferred income taxes | | (1,746) | | | 8,528 |
| Other long-term assets | | 28 | | | 18 | | Long-term debt | | ― | | | 10,048 |
| Other intangibles, net | | 26,461 | | | 46,824 | | Other long-term liabilities | | 9,000 | | | ― |
| Goodwill | | 58,798 | | | 109,982 | | Total liabilities | | 54,477 | | | 135,286 |
| | | | | | | | | | | | | |
| | | | | | | | Minority interests | | (5,113) | | | (3,172) |
| Total assets | $ | 149,461 | | $ | 337,924 | | Total liabilities and minority interests | $ | 49,364 | | $ | 132,114 |
The following summarizes pro forma results of operations assuming the acquisitions occurred as of the beginning of 2005. Due to uncertainties in these assumptions, the pro forma data does not purport to be indicative of the results of operations that would have resulted had the acquisitions been consummated at the beginning of the period presented, or that may occur in the future (thousands, except per share data):
| | Three Months Ended | | Six Months Ended |
| | June 30 | | June 30 |
| | 2006 | | | 2005 | | | 2006 | | | 2005 |
| Sales | | | | | | | | | | | |
| As reported | $ | 921,992 | | $ | 701,521 | | $ | 1,806,549 | | $ | 1,274,449 |
| Pro forma | $ | 922,236 | | $ | 908,470 | | $ | 1,823,718 | | $ | 1,700,053 |
| | | | | | | | | | | | |
| Net income | | | | | | | | | | | |
| As reported | $ | 34,175 | | $ | 33,314 | | $ | 62,244 | | $ | 54,462 |
| Pro forma | $ | 34,927 | | $ | 40,227 | | $ | 64,980 | | $ | 67,644 |
| | | | | | | | | | | | |
| Diluted net income per share: | | | | | | | | | | | |
| As reported | | $1.16 | | | $1.14 | | | $2.10 | | | $1.87 |
| Pro forma | | $1.18 | | | $1.37 | | | $2.20 | | | $2.32 |
Subsequent to June 30, 2006
| | · | In July 2006, SelectBuild acquired a framing services business in Southern California for approximately $75.0 million in cash. |
We have call and put obligations associated with our interests in BBP Companies, Riggs Plumbing, RCI Construction, A-1 Truss and WBC Mid-Atlantic. Under the purchase agreements, we have the right to purchase the other owners’ remaining portions during certain periods or if certain conditions are met. Likewise, the other owners have the option to require us to purchase their remaining portions during certain periods. The purchase price for the remaining portions will be based generally on a multiple of historical earnings. The following table summarizes the timing of these call and put obligations:
| | Call Options | | Put Options |
| BBP Companies | July 2008 through June 2015 | | July 2008 through June 2015 |
| Riggs Plumbing | April 2008 through March 2013 | | April 2008 through March 2013 |
| RCI Construction | January 2008 through January 2012 | | January 2008 through January 2012 |
| A-1 Truss | September 2004 through August 2014 | September 2009 through August 2014 |
| WBC Mid-Atlantic | October 2003 through September 2010 | December 2006 through December 2008 |
Investments in marketable securities consist of debt securities held by our captive insurance subsidiary and are considered available-for-sale and recorded at fair value. Unrealized gains and losses are recorded as a component of accumulated other comprehensive income, net, a component of shareholders’ equity. There were no significant unrealized losses.
The fair value of these marketable securities were as follows (thousands):
| | | June 30 | | | December 31 |
| | 2006 | | | 2005 |
| Money market funds | $ | ― | | $ | 415 |
| U.S. government and agencies | | 12,752 | | | 7,838 |
| Asset backed securities | | 13,789 | | | 13,391 |
| Corporate securities | | 10,100 | | | 10,876 |
| | $ | 36,641 | | $ | 32,520 |
Contractual maturities were as follows (thousands):
| | | June 30 | | | December 31 |
| | 2006 | | | 2005 |
| Less than one year | $ | 1,917 | | $ | 3,645 |
| One to two years | | 12,035 | | | 9,893 |
| Two to five years | | 22,689 | | | 18,982 |
| | $ | 36,641 | | $ | 32,520 |
| 7. | Intangible Assets and Goodwill |
Intangible assets represent the values assigned to customer relationships, covenants not to compete and trade names. Intangible assets are amortized on a straight-line basis over their expected useful lives. Customer relationships are amortized over three to seventeen years, covenants not to compete over two to five years and trade names over three years. Intangible amortization expense was $6.1 million for the period ended June 30, 2006 and $4.7 million in 2005. Intangible assets consist of the following (thousands):
| | June 30, 2006 |
| | Gross Carrying Amount | | Accumulated Amortization | | Net Carrying Amount |
| Customer relationships | $ | 83,645 | | $ | (14,541) | | $ | 69,104 |
| Covenants not to compete | | 9,193 | | | (3,314) | | | 5,879 |
| Trade names | | 204 | | | (125) | | | 79 |
| Other | | 146 | | | (46) | | | 100 |
| | $ | 93,188 | | $ | (18,026) | | $ | 75,162 |
| | December 31, 2005 |
| | Gross Carrying Amount | | Accumulated Amortization | | Net Carrying Amount |
| Customer relationships | $ | 58,926 | | $ | (9,165) | | $ | 49,761 |
| Covenants not to compete | | 7,541 | | | (2,307) | | | 5,234 |
| Trade names | | 204 | | | (91) | | | 113 |
| Other | | 146 | | | (27) | | | 119 |
| | $ | 66,817 | | $ | (11,590) | | $ | 55,227 |
Estimated amortization expense for intangible assets is $6.1 million for the remainder of 2006, $11.5 million for 2007, $10.1 million for 2008, $9.9 million for 2009, $9.1 million for 2010 and $28.5 million thereafter.
Goodwill represents the excess of the purchase price over the fair value of net tangible and identifiable intangible assets of acquired businesses. Adjustments to amounts previously reported as goodwill occur as a result of completing the purchase price allocation to the assets acquired, including intangible assets, and liabilities assumed based on their estimated fair values at the date of acquisition.
An annual assessment for impairment is completed in the fourth quarter and whenever events and circumstances indicate the carrying amount may not be recoverable. An impairment is recognized at the reporting unit if the carrying amount is more than the estimated future operating cash flows as measured by fair value techniques.
Changes in the carrying amount of goodwill by business segment were as follows (thousands):
| | | | | | |
| | SelectBuild | | BMC West | | Total |
| Balance at December 31, 2005 | $ | 167,268 | | $ | 20,202 | | $ | 187,470 |
| Purchase price adjustment | | (530) | | | — | | | (530) |
| Impairment | | (1,839) | | | — | | | (1,839) |
| Goodwill acquired | | 58,331 | | | 993 | | | 59,324 |
| Balance at June 30, 2006 | $ | 223,230 | | $ | 21,195 | | $ | 244,425 |
Long-term debt consists of the following (thousands):
As of June 30, 2006 | | Stated Interest Rate | | Notional Amount of Interest Rate Swaps | | Effective Interest Rate |
| | | Balance | | | | Average for Quarter | As of June 30 |
| Revolver | $ | 143,000 | | LIBOR plus 0.75% or Prime plus 0.00% | | $ | ― | | 6.29% | | 6.25% |
| Term note | | 75,000 | | LIBOR plus 0.75% or Prime plus 0.00% | | | ― | | 5.73% | | 5.73% |
| Term note | | 121,250 | | LIBOR plus 1.75% | | | 100,000 | | 6.26% | | 6.95% |
| Other | | 13,777 | | Various | | | ― | | | | |
| | | | 353,027 | | | | $ | 100,000 | | | | |
| | | | | | | | | | | | | |
| Less: Current portion | | 13,804 | | | | | | | | | |
| | | $ | 339,223 | | | | | | | | | |
As of December 31, 2005 | | Stated Interest Rate | | Notional Amount of Interest Rate Swaps | | Effective Interest Rate |
| | | Balance | | | | Average for Year | | As of December 31 |
| Revolver | $ | 77,500 | | LIBOR plus 0.75% or Prime plus 0.00% | | $ | ― | | 5.37% | | 6.08% |
| Term note | | 75,000 | | LIBOR plus 0.75% or Prime plus 0.00% | | | ― | | 4.52% | | 5.28% |
| Term note | | 121,875 | | LIBOR plus 1.75% | | | 100,000 | | 6.23% | | 6.17% |
| Other | | 13,925 | | Various | | | ― | | ― | | ― |
| | | | 288,300 | | | | $ | 100,000 | | | | |
| | | | | | | | | | | | | |
| Less: Current portion | | 10,131 | | | | | | | | | |
| | | $ | 278,169 | | | | | | | | | |
Revolver
In June 2005, we entered into an amended $300 million revolver with a group of lenders. In April 2006, we exercised an existing option to add another $150 million in borrowing capacity to our revolver which increased our borrowing capacity under the revolver to $450 million. The revolver matures in June 2010. The revolver consists of both LIBOR and Prime based borrowings. Interest rates are subject to quarterly adjustment based on operating performance and range from LIBOR plus 0.75% to 2.00%, or Prime plus 0.00% to 0.75%. Interest is paid quarterly. As of June 30, 2006, $143 million was outstanding under the revolver.
Term Notes
In June 2005, we also entered into a $75 million term note with a group of lenders. The term note matures in June 2010 with 10% of the initial principal payable for each of the two years commencing September 2006, 20% of the initial principal payable for one year commencing September 2008 and the remaining principal balance due June 2010. Interest rates are subject to quarterly adjustment based on operating performance and range from LIBOR plus 0.75% to 2.00%, or Prime plus 0.00% to 0.75%. Interest is paid quarterly. As of June 30, 2006, $75 million was outstanding under this term note.
In August 2003, we entered into a $125 million term note with a group of lenders. The term note matures in June 2010 and is payable in quarterly installments for the first six years in amounts equal to 1% of the initial principal amount per year and equal quarterly installments for the remaining principal balance during year seven. The interest rate for the term note is LIBOR plus 1.75%, or Prime plus 1.00%. Interest is paid quarterly. As of June 30, 2006, $121.3 million was outstanding under this term note.
Other
Other long-term debt of $13.8 million consists of term notes, equipment notes and capital leases for equipment. Interest rates vary and dates of maturity are through March 2021.
Covenants and Maturities
The credit facility consists of the revolver and term notes. The credit facility is collateralized by tangible and intangible property of our wholly-owned subsidiaries, except the assets of our captive insurance subsidiary. The credit facility contains covenants and conditions requiring the maintenance of certain financial ratios. At June 30, 2006, we were in compliance with these covenants and conditions.
Scheduled maturities of long-term debt are as follows (thousands):
| | | | |
| 2006 | | $ | 8,252 | |
| 2007 | | | 13,978 | |
| 2008 | | | 14,130 | |
| 2009 | | | 77,830 | |
| 2010 | | | 237,408 | |
| Thereafter | | | 1,429 | |
| | | $ | 353,027 | |
As of June 30, 2006 and December 31, 2005 there were $73.8 million and $75.9 million, respectively of letters of credit outstanding that guaranteed performance or payment to third parties. These letters of credit reduce borrowing availability under the revolver.
Hedging Activities
Derivative and hedging activities are recorded on the balance sheet at their fair values. In June 2004, we entered into interest rate swap contracts that effectively convert a portion of the floating rate borrowings of the $121.3 million term note to a fixed interest rate through June 2009, thus reducing the impact of increases in interest rates on future interest expense. Approximately 82% of the outstanding floating rate borrowings of the term note as of June 30, 2006 have been hedged through the designation of interest rate swap contracts accounted for as cash flow hedges. As a result, the interest rate on $100 million of the $121.3 million floating rate borrowings outstanding at June 30, 2006 was fixed at an average rate of 6.14%. After giving effect to the interest rate swap contracts, total borrowings were 32% fixed and 68% floating.
The fair value of derivative instruments is based on pricing models using current market rates. The fair value of the interest rate swap contracts was a long-term asset of $3.0 million as of June 30, 2006. The effective portion was recorded in accumulated other comprehensive income, net, a separate component of shareholders’ equity, and is subsequently reclassified into earnings in the same financial statement line item, interest expense, in the same period during which the hedged transaction is recognized in earnings. A corresponding deferred tax liability of $1.2 million was also recorded in accumulated other comprehensive income, net for the income tax related to the estimated fair value of the interest rate swap contracts. The ineffective portion of the change in the value of the interest rate swap contracts is immediately recognized as a component of interest expense. Hedge ineffectiveness for the period ended June 30, 2006 was not significant. Management may choose not to swap floating debt to a fixed rate or may terminate a previously executed swap if the floating rate positions are more beneficial.
Preferred Shares
We are authorized to issue 2 million preferred shares, however none of these shares are issued. Under the terms of our Restated Certificate of Incorporation, the Board of Directors is authorized to determine or alter the rights, preferences, privileges and restrictions of the preferred shares.
Common Shares
Our common shares have a par value of $0.001. We have 50 million shares authorized of which approximately 29 million are issued and outstanding as of June 30, 2006.
Of the unissued shares, 850,636 shares were reserved for the following:
| | Unissued Shares | |
| Employee Stock Purchase Plan | | | 114,070 | |
| 2004 Incentive and Performance Plan | | | 736,566 | |
Shareholders’ Rights Plan
In September 1997, our Board of Directors adopted a shareholder rights plan. If a person acquires 15% or more of our common shares or makes a tender offer or other offer to do so without the approval of the Board of Directors, our shareholders would have the right to purchase our common shares or the shares of the acquiring company at a significant discount. The Board of Directors has the right to redeem these rights for a nominal amount, to extend the period before the rights may be exercised or to take other actions as defined. The plan is intended to encourage any person seeking to acquire us to negotiate with the Board of Directors. The plan expires in September 2007.
Dividends
During 2006, cash dividends per common share were as follows:
| | · | $0.10 per share in the second quarter |
| | · | $0.10 per share in the first quarter |
On July 28, 2006, our Board of Directors approved a quarterly cash dividend of $0.10 per common share. The dividend is payable to shareholders of record as of September 22, 2006 and will be paid on or about October 12, 2006.
10. | Employee Benefit Plans |
Retirement Plans
We provide a savings and retirement plan for salaried and certain hourly employees whereby eligible employees may contribute a percentage of their earnings to a trust. Matching contributions of $2.6 million for the period ended June 30, 2006, $1.8 million for the period ended June 30, 2005 and $3.9 million for 2005 were made to the trusts based on a percentage of the contributions made by the participating employees.
Additionally, there is a supplemental retirement plan for eligible participants. Contributions are based on achieving certain operating performance and certain participants receive a guaranteed return ranging from zero to 9% based on years of service. Contributions were $3.4 million for the period ended June 30, 2006, $3.5 million for the period ended June 30, 2005 and $7.5 million in 2005. The plan’s investments are principally company-owned life insurance policies. Payments are made to the participants or their beneficiaries over a 5, 10 or 15-year period.
Cash Equity Plan
In April 1999, our Board of Directors adopted the Cash Equity Plan. Employees were eligible to receive awards at the discretion of the Compensation Committee of the Board of Directors. Awards are common share equivalent units that may be exchanged for the market value of those shares. The number of units available for grant, including those units outstanding and unexercised, cannot exceed two percent of the common shares outstanding at any given time. The awards are restricted from sale or transfer, vest after three years from the date of grant and expire after five years. No units have been awarded since February 2002. Compensation expense is recognized on a straight-line basis over the respective vesting period with periodic adjustments to compensation expense based on changes in the market value of the common shares. The related compensation expense for this plan was not significant for the period ended June 30, 2006, $0.3 million for the period ended June 30, 2005 and $0.3 million in 2005. Common share equivalent units of 7,700 remain outstanding and unexercised at June 30, 2006. No further grants or awards will be made under this plan.
Employee Stock Purchase Plan
In September 2000, our Board of Directors adopted the Employee Stock Purchase Plan, which our shareholders approved in May 2001. The plan permits eligible employees to purchase common shares through payroll deductions of up to 10% of an employee’s compensation limited to $25,000 each year. The purchase price of the shares is 85% of the market price on the last day of each month. There were 400,000 common shares authorized under this plan and there were 114,070 shares available for future purchase as of June 30, 2006. Compensation expense recognized was $0.1 million for the period ended June 30, 2006, $0.1 million for the period ended June 30, 2005 and $0.2 million in 2005.
2004 Incentive and Performance Plan
In February 2004, our Board of Directors adopted the 2004 Incentive and Performance Plan, which our shareholders approved in May 2004. A total of 2.4 million shares are reserved for issuance under the plan. Employees and non-employee directors are eligible to receive awards at the discretion of the Compensation Committee. Options, appreciation rights, restricted shares, other share-based awards and non-discretionary awards may be granted under this plan.
Options
| | · | In the period ended June 30, 2006, we granted 407,100 options to employees. These options vest ratably over three years from the date of grant and expire after seven years if unexercised. These options were awarded with exercise prices equal to the fair value of the shares on the date of grant. |
| | · | In 2005, we granted 424,000 options to employees. These options vest ratably over three years from the date of grant and expire after seven years if unexercised. These options were awarded with exercise prices equal to the fair value of the shares on the date of grant. |
| | · | In 2004, we granted 402,000 options to employees. These options vest ratably over three years from the date of grant and expire after seven years if unexercised. These options were awarded with exercise prices equal to the fair value of the shares on the date of grant. |
| | · | In 2004, we granted 207,000 options to employees under the 2000 Stock Incentive Plan. These options vest ratably over three years from the date of grant and expire after seven years if unexercised. These options were awarded with exercise prices equal to the fair value of the shares on the date of grant. |
| | · | In 2003, we granted 371,500 options to employees under the 2000 Stock Incentive Plan. These options vest ratably over four years from the date of grant and expire after seven years if unexercised. These options were awarded with exercise prices equal to the fair value of the shares on the date of grant. |
| | · | In February 1997, the Board of Directors authorized issuance of 100,000 options as an additional incentive to attract a member of senior management. These options vested in February 2002 and expire after ten years if unexercised. These options were awarded with exercise prices equal to the fair value of the shares on the date of grant. |
The following table summarizes information regarding options outstanding at June 30, 2006:
| | | Options Outstanding | | Options Exercisable |
Range of Exercise Prices | | Options Outstanding | | Weighted Average Contractual Life (Years) | | Weighted Average Exercise Price | | Options Exercisable | | Weighted Average Exercise Price |
| $4.84 to $5.97 | | 555,000 | | 3.96 | | $4.94 | | 555,000 | | $4.94 |
| $6.00 to $6.97 | | 452,154 | | 5.20 | | $6.78 | | 364,030 | | $6.73 |
| $7.00 to $7.88 | | 471,312 | | 6.43 | | $7.38 | | 367,816 | | $7.23 |
| $8.70 to $9.75 | | 337,994 | | 4.84 | | $8.70 | | 211,998 | | $8.70 |
| $22.77 to $28.36 | | 413,998 | | 5.63 | | $22.88 | | 134,011 | | $22.88 |
| $37.93 to $38.16 | | 405,100 | | 6.55 | | $37.93 | | ― | | ― |
| $4.84 to $38.16 | | 2,635,558 | | 5.39 | | $14.06 | | 1,632,855 | | $7.82 |
As a result of the adoption of Statement of Financial Accounting Standard No. 123 (Revised 2004), Share-Based Payment, compensation expense is recognized over the requisite service period for all share-based compensation granted after as well as unvested on January 1, 2006. No expense is recognized for awards vested in periods prior to January 1, 2006. The fair value of compensation expense recognized for vested options was $2.8 million whereas the compensation expense for non-vested options due to early retirement eligibility was $0.6 million for the period ended June 30, 2006. Options are not included in the calculation of basic income per share, however options are included in the calculation of diluted income per share.
The fair value of each option is estimated on the date of grant using the Black-Scholes option pricing model with the following key assumptions:
Grant Year | | Grant Date | | Expected Term (Years) | | Expected Volatility | | Expected Dividend Yield | | Risk Free Interest Rate | | Grant Date Fair Value |
| 2006 | | January 2006 | | 5.94 | | 48.58% | | 0.70% | | 3.77% | | $37.93 |
| 2005 | | May 2005 | | 7.00 | | 54.16% | | 0.68% | | 4.29% | | $28.36 |
| 2005 | | February 2005 | | 6.84 | | 54.16% | | 0.84% | | 4.10% | | $22.77 |
| 2004 | | May 2004 | | 7.00 | | 54.25% | | 1.45% | | 4.56% | | $8.50 |
| 2004 | | February 2004 | | 7.50 | | 54.68% | | 1.45% | | 4.09% | | $7.88 |
| 2003 | | April 2003 | | 8.50 | | 55.42% | | 1.33% | | 3.94% | | $6.97 |
These assumptions are based principally on historical experience. When circumstances indicate the availability of new or different information that would be useful in estimating these assumptions, revisions will be made and reflected in the period such revisions are determined. Due to uncertainties inherent in these assumptions, it is possible that actual share-based compensation may vary from the estimate of the fair value of these options.
As of June 30, 2006, there was $9.2 million of unrecognized compensation expense related to these options. This is recognized as the requisite services are rendered and is expected to be recognized over the next 3 years.
Restricted Shares
| | · | In the period ended June 30, 2006, we issued 138,400 restricted shares to employees. The weighted-average fair value of the restricted shares granted was $37.88 per share. |
| | · | In 2005, we issued 118,000 restricted shares to employees. The weighted-average fair value of the restricted shares granted was $23.19 per share. |
| | · | In 2004, we issued 149,000 restricted shares to employees. The weighted-average fair value of the restricted shares granted was $10.89 per share. |
These restricted shares vest over periods through 2011, however under certain circumstances some or all of the restricted shares may vest earlier. There were 500 restricted shares forfeited in the period ended June 30, 2006, no restricted shares forfeited in the period ended June 30, 2005 and 9,500 restricted shares forfeited in 2005. Compensation expense is recognized over the vesting period. Compensation expense recognized was $1.5 million for the period ended June 30, 2006, $0.6 million for the period ended June 30, 2005 and $1.3 million in 2005.
As of June 30, 2006, there was $6.4 million of unrecognized compensation expense related to these restricted shares. This is recognized as the requisite services are rendered and is expected to be recognized over the next 5 years. Restricted shares are not included in the calculation of basic income per share, however restricted shares are included in the calculation of diluted income per share.
Shares
| | · | In the period ended June 30, 2006, we issued 12,000 shares to non-employee directors and recognized compensation expense of $0.4 million. These shares vest immediately, however trading is restricted for one year from the date of grant. |
| | · | In 2005, we issued 14,000 shares to non-employee directors and recognized compensation expense of $0.4 million. These shares vest immediately, however trading is restricted for one year from the date of grant. |
The following table summarizes activity for share-based awards:
| | | June 30 | | December 31 |
| | | 2006 | | 2005 |
| | Shares | | Weighted Average Exercise Price | | Shares | | Weighted Average Exercise Price |
| Outstanding at beginning of the period | | 2,557,412 | | $8.75 | | 2,904,796 | | $6.11 |
| Granted | | 545,500 | | $28.31 | | 542,000 | | $17.90 |
| Exercised | | (61,738) | | $9.33 | | (861,384) | | $5.70 |
| Forfeited | | (10,216) | | $17.78 | | (28,000) | | $5.56 |
| Outstanding at end of the period | | 3,030,958 | | $12.23 | | 2,557,412 | | $8.75 |
| | | | | | | | | |
| Options exercisable at end of the period | | 1,632,855 | | $7.82 | | 1,425,300 | | $6.32 |
Weighted average fair value of options granted at fair value for the period | | $37.93 | | | | $22.88 | | |
The following table summarizes equity compensation information as of June 30, 2006:
| | Number of Securities to be Issued Upon Exercise of Outstanding Options, Warrants and Rights | | Weighted Average Exercise Price of Outstanding Options, Warrants and Rights | | Number of Securities Remaining Available for Future Issuance Under Equity Compensation Plans |
Equity compensation plans approved by security holders | | 2,930,958 | | $12.43 | | 736,566 |
Equity compensation plans not approved by security holders | | 100,000 | | $6.25 | | ― |
| Total | | 3,030,958 | | $12.23 | | 736,566 |
| | | | | | | |
The asset and liability method is used to account for income taxes. Under this method, deferred tax assets and liabilities are recognized for tax credits and for the future tax consequences attributable to differences between the financial statement carrying amounts of existing assets and liabilities and their tax bases. Deferred tax assets and liabilities are measured using enacted tax rates expected to apply to taxable income in the years in which those temporary differences are expected to be recovered or settled. A valuation allowance is recorded to reduce the carrying amounts of deferred tax assets unless it is more likely than not that such assets will be realized.
Income taxes associated with the other owner’s proportionate share of BBP Companies, acquired in July 2005, were $1.3 million for the period ended June 30, 2006 and $1.2 million in 2005. We are required to recognize income taxes for all of the earnings of this 51% interest due to its C Corporation status. While these income taxes are recognized in income taxes, the portion of income taxes associated with the other owner's proportionate share of earnings are eliminated through minority interest.
The tax benefit associated with non-statutory options exercised by employees under the various share plans reduced taxes payable by approximately $0.6 million for the period ended June 30, 2006, $4.7 million for the period ended June 30, 2005 and $9.1 million in 2005. These tax benefits are recognized in additional paid-in capital, a component of shareholders’ equity.
We are involved in litigation and other legal matters arising in the normal course of business. In the opinion of management the recovery or liability, if any, under any of these matters will not have a material effect on our consolidated financial position, results of operations or cash flows.
The consolidated financial statements include operations from two reportable segments: SelectBuild and BMC West. These segments represent businesses that are managed separately. Each of these businesses requires distinct marketing and operating strategies. Management reviews financial performance based on these operating segments.
SelectBuild provides construction services to high-volume homebuilders. These services include wood framing or concrete block masonry, concrete services, plumbing and other services. Construction services include managing labor and construction schedules as well as sourcing materials.
BMC West markets and sells building products, manufactures building components and provides construction services. Products include structural lumber and building materials purchased from other manufacturers as well as manufactured building components including millwork, trusses and wall panels. Construction services include framing and installation of miscellaneous building products. Building products and construction services are sold principally to professional builders and contractors.
The financial performance for these reporting segments is based on income from operations before interest expense, income taxes and minority interests. These segments follow the accounting principles described in the Summary of Significant Accounting Policies included in our Annual Report on Form 10-K for the year ended December 31, 2005. Sales between segments are recognized at market prices and no single customer accounts for more than 10% of sales.
Selected financial information by segment is as follows (thousands):
| | Sales | Income (Loss) Before Taxes and Minority Interests | Depreciation and Amortization | Capital (1) Expenditures | Assets |
Segment | Inter- Segment | Trade |
| | | |
Three Months Ended June 30, 2006 | | | | | |
| SelectBuild | $503,342 | $(1,411) | $501,931 | $47,098 | $ 6,050 | $15,024 | $ 760,561 |
| BMC West | 420,637 | (576) | 420,061 | 39,178 | 3,939 | 6,375 | 503,709 |
| Corporate | ― | ― | ― | (21,959) | 929 | 2,630 | 114,724 |
| | $923,979 | $(1,987) | $921,992 | 64,317 | $10,918 | $24,029 | $1,378,994 |
| Interest Expense | | | 6,465 | | | |
| | | | $57,852 | | | |
| | | | | | |
Three Months Ended June 30, 2005 | | | | | |
| SelectBuild | $303,648 | $ (13) | $303,635 | $36,756 | $2,486 | $ 8,337 | $341,395 |
| BMC West | 398,230 | (344) | 397,886 | 41,030 | 2,795 | 5,032 | 479,824 |
| Corporate | ― | ― | ― | (16,894) | 734 | 440 | 70,689 |
| | $701,878 | $(357) | $701,521 | 60,892 | $6,015 | $13,809 | $891,908 |
| Interest Expense | | | 3,350 | | | |
| | | | $57,542 | | | |
| | | | | |
Six Months Ended June 30, 2006 | | | | | |
| SelectBuild | $1,001,672 | $(1,443) | $1,000,229 | $ 93,173 | $11,951 | $29,256 | $ 760,561 |
| BMC West | 807,513 | (1,193) | 806,320 | 69,724 | 7,560 | 10,498 | 503,709 |
| Corporate | ― | ― | ― | (44,194) | 1,797 | 3,290 | 114,724 |
| | $1,809,185 | $(2,636) | $1,806,549 | 118,703 | $21,308 | $43,044 | $1,378,994 |
| Interest Expense | | | 12,055 | | | |
| | | | $106,648 | | | |
| | | | | | |
Six Months Ended June 30, 2005 | | | | | |
| SelectBuild | $ 546,149 | $(272) | $ 545,877 | $ 65,288 | $ 4,527 | $11,691 | $341,395 |
| BMC West | 729,049 | (477) | 728,572 | 69,905 | 5,545 | 10,350 | 479,824 |
| Corporate | ― | ― | ― | (33,993) | 1,513 | 877 | 70,689 |
| | $1,275,198 | $(749) | $1,274,449 | 101,200 | $11,585 | $22,918 | $891,908 |
| Interest Expense | | | 6,548 | | | |
| | | | $ 94,652 | | | |
| | (1) | Property and equipment from acquisitions are included as capital expenditures. |
Business Environment and Executive Overview
We are one of the largest providers of residential construction services and building products in the United States, with a focus in western and southern states. We provide construction services and building products in 16 of the top 25 single-family residential construction markets through our two subsidiaries, SelectBuild and BMC West. SelectBuild provides construction services to high-volume homebuilders in key growth markets. BMC West distributes building materials, manufactures building components and provides construction services to professional builders and contractors through a network of 40 distribution facilities and 57 manufacturing facilities.
We grow our business through acquisitions as well as strategically expanding the breadth of our services and products offered to professional builders and contractors. In particular, we believe high-volume homebuilders are seeking quality, reliable and cost effective solutions to meet their construction needs. In 2005 and the first six months of 2006, we completed several acquisitions to expand our construction services offered to homebuilders. Our services include framing, concrete, plumbing and other construction services as well as building product distribution and manufactured building components including trusses, millwork and wall panels.
For the homebuilding industry, the U.S. Department of Commerce reported single-family housing starts declined 6.5% from May to June to a seasonally adjusted annual rate of 1.5 million. This represents a 13.8% decline from June 2005. Additionally, single-family building permits for the U.S. were down 6.3% from May to June to a seasonally adjusted pace of 1.4 million. Although housing starts and permits have slowed, they remain comparable to historic averages. While interest rates have risen, other key fundamentals influencing the homebuilding industry such as consumer confidence and job formation remain positive.
In our markets, we are also experiencing a slowdown in single-family homebuilding from the historic highs of 2005. Given our geographic diversity, we encountered softness in certain regions offset by continued strength in other regions. Overall, contract starts and building permits in our markets reflect lower construction activity relative to last year’s high levels. Although the changing marketplace is providing new challenges for us, we are confident in our strategy of serving high-volume homebuilders and professional builders with services and products. Additionally, our ability to adjust to changes in the marketplace with an experienced management team as well as our financial strength, cause us to remain optimistic about our long-term growth opportunities.
Our strategy includes expanding the breadth of our services and products offered to professional builders and contractors. Acquisitions completed in 2006 include the following:
| | · | framing services in Palm Springs, California and Reno, Nevada (January 2006) |
| | · | remaining 20% interest in our existing business providing concrete block masonry and concrete services in Florida (January 2006) |
| | · | building materials distributor and millwork services in Houston, Texas (February 2006) |
| | · | concrete services in Northern Arizona (April 2006) |
| | · | wall panel and truss manufacturer in Palm Springs, California (April 2006) |
| | · | building materials distributor and truss manufacturer in Eastern Idaho (June 2006) |
| | · | framing services in Southern California (July 2006) |
We evaluate our results of operations including and excluding acquisitions. We believe a presentation of sales and income from operations excluding acquisitions not present in the same period enhances an understanding of the acquisitions as well as comparable operations for the respective periods. In the discussion of the quarter and six months ended June 30, 2006 and 2005, a reconciliation of sales and income from operations excluding acquisitions has been provided.
The following tables and subsequent discussions should be read in conjunction with the consolidated financial statements and the related notes in this Form 10-Q and our most recent Annual Report on Form 10-K.
RESULTS OF OPERATIONS
Second Quarter of 2006 Compared to 2005
The amounts and percentage relationship to sales of certain costs, expenses and income items are as follows (millions):
| | Three Months Ended June 30 |
| 2006 | | 2005 |
Sales | | | | | | | |
| Construction services | $ | 560.3 | 60.8% | | $ | 356.9 | 50.9% |
| Building products | | 361.7 | 39.2 | | | 344.6 | 49.1 |
Total sales | | 922.0 | 100.0 | | | 701.5 | 100.0 |
| | | | | | | | |
Costs and operating expenses | | | | | | | |
| Cost of goods sold | | | | | | | |
| Construction services | | 452.5 | 80.8 | | | 289.9 | 81.2 |
| Building products | | 264.4 | 73.1 | | | 253.8 | 73.7 |
| Total cost of goods sold | | 716.9 | 77.7 | | | 543.7 | 77.5 |
| Impairment of assets | | 2.2 | 0.2 | | | 0.5 | 0.1 |
Selling, general and administrative expenses | | 139.1 | 15.1 | | | 97.3 | 13.9 |
| Other income, net | | (0.5) | ― | | | (0.9) | (0.2) |
Total costs and operating expenses | | 857.7 | 93.0 | | | 640.6 | 91.3 |
| | | | | | | | |
Income from operations | $ | 64.3 | 7.0% | | $ | 60.9 | 8.7% |
| | | | | | | | |
Net income | $ | 34.2 | 3.7% | | $ | 33.3 | 4.7% |
| | | | | | | | |
Income per diluted share | | $1.16 | | | | $1.14 | |
Consolidated Financial Results
Selected financial results are as follows (millions):
| | 2006 | | 2005 | | $ Change | % Change |
Sales | | | | | | |
| Construction services | $ 560 | | $ 357 | | $ 203 | 57% |
| Building products | 362 | | 344 | | 18 | 5% |
| | $ 922 | | $ 701 | | $ 221 | 32% |
| | | | | | | |
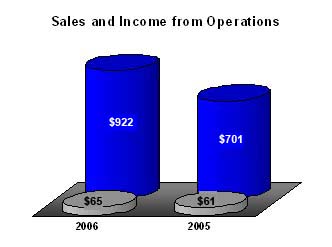
Income from operations | $ 65 | | $ 61 | | $ 4 | 7% |
Sales increased 32% to $922 million due to the acquisition of construction service businesses not present in the second quarter of 2005. Sales from construction service acquisitions were $215 million. Sales from comparable operations in our geographically diverse markets were 2% lower than the same quarter a year ago. Our California, Florida and Colorado markets experienced lower sales while other markets improved. This is consistent with single-family building permits which varied in our markets and were down 9.7% overall, while permits were down 8% for the U.S. overall.
Income from operations increased to $65 million from $61 million in the second quarter of the prior year. Gross margins were 22.3%, down from 22.5% in the second quarter of 2005. This decline was due to the growing portion of the sales mix represented by our SelectBuild segment. SelectBuild represented 54% compared to 43% of sales in the same quarter last year. Gross margins improved at both our SelectBuild and BMC West segments for the quarter.
Selling, general and administrative expenses increased $41.8 million and were 15.1% of sales, up 1.2% from 13.9% in the same quarter a year ago. Acquisitions accounted for over half or $23 million of the increase. Excluding acquisitions, the increase in selling, general and administrative expenses was due to:
| | · | integration costs at SelectBuild, including the costs of transitioning private companies to a public-company environment, |
| | · | costs associated with reorganizing SelectBuild into regions and |
| | · | compensation and other costs at BMC West to support higher volume. |
Business Segments
Sales and income from operations by business segment are as follows (millions):
| | 2006 | | 2005 |
| Sales | | Income from Operations | | Sales | | Income from Operations |
| SelectBuild | $ 501 | | $ 47 | | $ 304 | | $ 37 |
| BMC West | 421 | | 40 | | 397 | | 41 |
| Corporate | ― | | (22) | | ― | | (17) |
| | $ 922 | | $ 65 | | $ 701 | | $ 61 |
SelectBuild
Selected financial results are as follows (millions):
| 2006 | | 2005 | | $ Change | % Change |
Sales | $ 501 | | $ 304 | | $ 197 | 65% |
| Less: Acquisitions | (215) | | ― | | (215) | ― |
| | $ 286 | | $ 304 | | $ (18) | (6%) |
| | | | | | | |
Income from operations | $ 47 | | $ 37 | | $ 10 | 27% |
| Less: Acquisitions | (18) | | ― | | (18) | ― |
| | $ 29 | | $ 37 | | $ (8) | (22%) |
Sales increased 65% to $501 million due to $215 million from acquisitions not present in the same quarter a year ago. Sales from comparable operations reported a 6% decrease in sales, principally in the Southeast and Pacific regions. Contract starts and building permits in our markets reflected slower homebuilding activity for the quarter.
Income from operations increased $10 million to $47 million, up 27% from the same quarter of the prior year. The increase was due to acquisitions as comparable income from operations was down 22%. Although gross margins improved, the decrease in comparable income from operations was primarily a result of higher selling, general and administrative expenses for compensation and other costs related to the integration of acquisitions and reorganizing operating units into regions.
BMC West
Selected financial results are as follows (millions):
| 2006 | | 2005 | | $ Change | % Change |
Sales | $ 421 | | $ 397 | | $ 24 | 6% |
| Less: Acquisitions | (16) | | ― | | (16) | ― |
| | $ 405 | | $ 397 | | $ 8 | 2% |
| | | | | | | |
Income from operations | $ 40 | | $ 41 | | $ (1) | (2%) |
| Less: Acquisitions | ― | | ― | | ― | ― |
| | $ 40 | | $ 41 | | $ (1) | (2%) |
Sales increased 6% to $421 million from $397 million in the same quarter a year ago. The increase was primarily due to acquisitions not present in the same quarter of 2005. Sales from comparable operations edged higher, up 2%, despite decreases in commodity wood product prices. Solid sales increases occurred in the Intermountain, Texas and Northwest regions and offset declines in the Southwest. Single-family building permits in our markets were up slightly compared to the same quarter a year ago.
Income from operations decreased to $40 million from $41 million in the second quarter of the prior year. Gross margins improved to 25.6% from 25.1% in the same quarter a year ago. However selling, general and administrative expenses were 16.4% of sales, up 1.5%, from 14.9% of sales in the same quarter a year ago. These expenses were higher due to compensation expenses for additional personnel and other costs to support increased volume.
Corporate
Corporate represents expenses to support the operations of our business segments, SelectBuild and BMC West. These costs include executive and senior management, information systems, administrative functions for reporting, accounts payable and human resources, professional fees for regulatory compliance as well as certain incentive compensation. These costs are not allocated to our business segments.
Selected financial results are as follows (millions):
| 2006 | | 2005 | | $ Change | % Change |
Corporate general and administrative expenses | $ 22 | | $ 17 | | $ 5 | 29% |
Corporate expenses were $5 million higher than the same quarter a year ago due to compensation expenses for additional personnel to support our expanding operations, including the integration of acquisitions. However, as a percent of sales these expenses were 2.4% in both quarters.
Six Months of 2006 Compared to 2005
The amounts and percentage relationship to sales of certain costs, expenses and income items are as follows (millions):
| | Six Months Ended June 30 |
| 2006 | | 2005 |
Sales | | | | | | | |
| Construction services | $ | 1,109.1 | 61.4% | | $ | 636.9 | 50.0% |
| Building products | | 697.4 | 38.6 | | | 637.5 | 50.0 |
Total sales | | 1,806.5 | 100.0 | | | 1,274.4 | 100.0 |
| | | | | | | | |
Costs and operating expenses | | | | | | | |
| Cost of goods sold | | | | | | | |
| Construction services | | 900.7 | 81.2 | | | 517.4 | 81.2 |
| Building products | | 511.2 | 73.3 | | | 469.4 | 73.6 |
| Total cost of goods sold | | 1,411.9 | 78.2 | | | 986.8 | 77.4 |
| Impairment of assets | | 2.2 | 0.1 | | | 0.5 | ― |
Selling, general and administrative expenses | | 276.0 | 15.3 | | | 187.3 | 14.7 |
| Other income, net | | (2.3) | (0.2) | | | (1.4) | ― |
Total costs and operating expenses | | 1,687.8 | 93.4 | | | 1,173.2 | 92.1 |
| | | | | | | | |
Income from operations | $ | 118.7 | 6.6% | | $ | 101.2 | 7.9% |
| | | | | | | | |
Net income | $ | 62.2 | 3.4% | | $ | 54.5 | 4.3% |
| | | | | | | | |
Income per diluted share | | $2.10 | | | | $1.87 | |
Consolidated Financial Results
Selected financial results are as follows (millions):
| 2006 | | 2005 | | $ Change | % Change |
Sales | | | | | | |
| Construction services | $ 1,109 | | $ 637 | | $ 472 | 74% |
| Building products | 698 | | 637 | | 61 | 10% |
| | $ 1,807 | | $ 1,274 | | $ 533 | 42% |
| | | | | | | |
Income from operations | $ 119 | | $ 101 | | $ 18 | 18% |
Sales increased 42% to $1.8 billion from $1.3 billion due to the acquisition of construction service businesses not present in the same period of the prior year. Sales from construction service acquisitions were $439 million. Sales from comparable operations were 5% higher than the same period a year ago despite a 6% decrease in single-family building permits in our markets. Our Texas, Intermountain and Southwest markets experienced higher sales and offset declines in other markets, particularly building products in California and construction services in Florida.
Income from operations increased to $119 million from $101 million in the prior year. The improvement was due to acquisitions which offset declines at comparable operations. Income from operations for comparable operations declined approximately $18 million or 18% relative to the same period in 2005.
Gross margins were 21.8%, down 0.8%, from 22.6% in the same period a year ago. This decline was due to the growing portion of construction services from our SelectBuild business segment as we continue to pursue our acquisition strategy of expanding these services. Gross margins at our SelectBuild and BMC West segments were approximately the same for both periods.
Selling, general and administrative expenses increased $88.7 million and represented 15.3% of sales compared to 14.7% in the same period a year ago. Acquisitions accounted for approximately half of the increase. Excluding acquisitions, the increase in selling, general and administrative expenses were primarily related to integration costs associated with acquisitions, reorganization of SelectBuild into regions as well as compensation and other costs at BMC West to support higher volume.
Business Segments
Sales and income from operations by business segment are as follows (millions):
| | 2006 | | 2005 |
| Sales | | Income from Operations | | Sales | | Income from Operations |
| SelectBuild | $ 1,000 | | $ 93 | | $ 546 | | $ 65 |
| BMC West | 807 | | 70 | | 728 | | 70 |
| Corporate | ― | | (44) | | ― | | (34) |
| | $ 1,807 | | $ 119 | | $ 1,274 | | $ 101 |
SelectBuild
Selected financial results are as follows (millions):
| 2006 | | 2005 | | $ Change | % Change |
Sales | $ 1,000 | | $ 546 | | $ 454 | 83% |
| Less: Acquisitions | (439) | | ― | | (439) | ― |
| | $ 561 | | $ 546 | | $ 15 | 3% |
| | | | | | | |
Income from operations | $ 93 | | $ 65 | | $ 28 | 43% |
| Less: Acquisitions | (36) | | ― | | (36) | ― |
| | $ 57 | | $ 65 | | $ (8) | (12%) |
Sales increased 83% to $1 billion from $546 million in the same period a year ago. Sales of $439 million from acquisitions not present in the same period a year ago accounted for the increase. Sales from comparable operations were 3% higher, most notably in our Southwest region. Contract starts and building permits were down, reflecting slower homebuilding in our markets.
Income from operations was $93 million, up 43% from $65 million in the same period a year ago. The increase was due to acquisitions not present in the same period a year ago. Income from operations for comparable operations was down approximately 12%. This decrease was the result of higher selling, general and administrative expenses related to compensation and other costs associated with the integration of acquisitions and reorganizing operating units into regions.
BMC West
Selected financial results are as follows (millions):
| 2006 | | 2005 | | $ Change | % Change |
Sales | $ 807 | | $ 728 | | $ 79 | 11% |
| Less: Acquisitions | (24) | | ― | | (24) | ― |
| | $ 783 | | $ 728 | | $ 55 | 8% |
| | | | | | | |
Income from operations | $ 70 | | $ 70 | | ― | ― |
| Less: Acquisitions | ― | | ― | | ― | ― |
| | $ 70 | | $ 70 | | ― | ― |
Sales increased 11% to $807 million from $728 million in the same period a year ago. Sales from comparable operations increased 8% and were particularly strong in our Texas, Intermountain and Northwest regions, offsetting declines in California and Colorado. Single-family building permits in our markets were up 4.7% compared to the same period a year ago.
Income from operations of $70 million was the same for both periods. Gross margins at 25.2% were consistent for both periods. However selling, general and administrative expenses were up 1.0% to 16.7% of sales from 15.7% in the same period a year ago. These expenses were higher due to compensation expenses for additional personnel and other costs to support increased volume.
Corporate
Corporate represents expenses to support the operations of our business segments, SelectBuild and BMC West. These costs include executive and senior management, information systems, administrative functions for reporting, accounts payable and human resources, professional fees for regulatory compliance as well as certain incentive compensation. These costs are not allocated to our business segments.
Selected financial results are as follows (millions):
| 2006 | | 2005 | | $ Change | % Change |
Corporate general and administrative expenses | $ 44 | | $ 34 | | $ 10 | 29% |
Corporate expenses were $10 million higher than the same period a year ago due to compensation expenses for additional personnel to support our expanding operations. However, these expenses improved as a percent of sales to 2.4% from 2.7% in the same period a year ago.
LIQUIDITY AND CAPITAL RESOURCES
Cash Flows
Our primary need for capital resources is to fund working capital and acquisitions as well as finance capital expenditures. Capital resources have primarily consisted of cash flows from operations and additional debt. For the period ended June 30, 2006, cash was provided by operations and borrowed to purchase acquisitions.
Operations
Cash provided by operating activities was $93.0 million compared to $80.3 million in the same period a year ago. Cash from operating activities increased $20.5 million due to acquisitions not present in the same period of 2005. Changes in cash used for working capital requirements were not significant as cash used was $0.7 million compared to cash provided of $0.2 million in the same period a year ago. Cash requirements for receivables, inventory, unbilled receivables and compensation costs were offset by accounts payable, timing of insurance premiums and other accrued liabilities. Days sales outstanding increased, however this was offset by improvement in inventory turns and an increase in days payable outstanding.
Capital Investments and Acquisitions
Cash used in investing activities was $135.8 million or $88.3 million more than $47.5 million for the same period a year ago. Cash use included $100.1 million for the acquisition of:
| | · | businesses providing framing services in Palm Springs, California and Reno, Nevada, |
| | · | the remaining 20% interest in WBC Construction, LLC, |
| | · | three facilities providing building materials distribution and millwork services in Houston, Texas, |
| | · | wall panel and truss manufacturing business in Palm Springs, California, |
| | · | building materials distribution and truss manufacturing business in Eastern Idaho and |
| | · | concrete services business in Northern Arizona. |
Net cash used for investing activities in the same period a year ago was used primarily for the acquisition of a plumbing service business in Phoenix and Tucson, Arizona, a stucco business in Las Vegas, Nevada and a framing services business in Chicago, Illinois as well as the purchase of property and equipment.
Financing
Cash provided by financing activities was $50.6 million compared to cash used of $17.4 million in the same period a year ago. Debt was borrowed to finance five acquisitions, purchase the remaining portion of a minority interest and purchases of property and equipment whereas in the same period a year ago, debt was repaid from operating cash flows and refinanced as a term note.
Credit Facility
Revolver
In June 2005, we entered into an amended $300 million revolver with a group of lenders. In April 2006, we exercised an existing option to add another $150 million in borrowing capacity to our revolver which increased our borrowing capacity under the revolver to $450 million. The revolver matures in June 2010. The revolver consists of both LIBOR and Prime based borrowings. Interest rates are subject to quarterly adjustment based on operating performance and range from LIBOR plus 0.75% to 2.00%, or Prime plus 0.00% to 0.75%. Interest is paid quarterly. As of June 30, 2006, $143 million was outstanding under the revolver.
Term Notes
In June 2005, we also entered into a $75 million term note with a group of lenders. The term note matures in June 2010 with 10% of the initial principal payable for each of the two years commencing September 2006, 20% of the initial principal payable for one year commencing September 2008 and the remaining principal balance due June 2010. Interest rates are subject to quarterly adjustment based on operating performance and range from LIBOR plus 0.75% to 2.00%, or Prime plus 0.00% to 0.75%. Interest is paid quarterly. As of June 30, 2006, $75 million was outstanding under this term note.
In August 2003, we entered into a $125 million term note with a group of lenders. The term note matures in June 2010 and is payable in quarterly installments for the first six years in amounts equal to 1% of the initial principal amount per year and equal quarterly installments for the remaining principal balance during year seven. The interest rate for the term note is LIBOR plus 1.75%, or Prime plus 1.00%. Interest is paid quarterly. As of June 30, 2006, $121.3 million was outstanding under this term note.
Other
Other long-term debt of $13.8 million consists of term notes, equipment notes and capital leases for equipment. Interest rates vary and dates of maturity are through March 2021.
Covenants and Maturities
The credit facility consists of the revolver and term notes. The credit facility is collateralized by tangible and intangible property of our wholly-owned subsidiaries, except the assets of our captive insurance subsidiary. The credit facility contains covenants and conditions requiring the maintenance of certain financial ratios. At June 30, 2006, we were in compliance with these covenants and conditions.
Scheduled maturities of long-term debt are as follows (thousands):
| | | | |
| 2006 | | $ | 8,252 | |
| 2007 | | | 13,978 | |
| 2008 | | | 14,130 | |
| 2009 | | | 77,830 | |
| 2010 | | | 237,408 | |
| Thereafter | | | 1,429 | |
| | | $ | 353,027 | |
As of June 30, 2006 and December 31, 2005 there were $73.8 million and $75.9 million, respectively of letters of credit outstanding that guaranteed performance or payment to third parties. These letters of credit reduce borrowing availability under the revolver.
Hedging Activities
Derivative and hedging activities are recorded on the balance sheet at their fair values. In June 2004, we entered into interest rate swap contracts that effectively convert a portion of the floating rate borrowings of the $121.3 million term note to a fixed interest rate through June 2009, thus reducing the impact of increases in interest rates on future interest expense. Approximately 82% of the outstanding floating rate borrowings of the term note as of June 30, 2006 have been hedged through the designation of interest rate swap contracts accounted for as cash flow hedges. As a result, the interest rate on $100 million of the $121.3 million floating rate borrowings outstanding at June 30, 2006 was fixed at an average rate of 6.14%. After giving effect to the interest rate swap contracts, total borrowings were 32% fixed and 68% floating.
The fair value of derivative instruments is based on pricing models using current market rates. The fair value of the interest rate swap contracts was a long-term asset of $3.0 million as of June 30, 2006. The effective portion was recorded in accumulated other comprehensive income, net, a separate component of shareholders’ equity, and is subsequently reclassified into earnings in the same financial statement line item, interest expense, in the same period during which the hedged transaction is recognized in earnings. A corresponding deferred tax liability of $1.2 million was also recorded in accumulated other comprehensive income, net for the income tax related to the estimated fair value of the interest rate swap contracts. The ineffective portion of the change in the value of the interest rate swap contracts is immediately recognized as a component of interest expense. Hedge ineffectiveness for the period ended June 30, 2006 was not significant. Management may choose not to swap floating debt to a fixed rate or may terminate a previously executed swap if the floating rate positions are more beneficial.
Equity
Preferred Shares
We are authorized to issue 2 million preferred shares, however none of these shares are issued. Under the terms of our Restated Certificate of Incorporation, the Board of Directors is authorized to determine or alter the rights, preferences, privileges and restrictions of the authorized but unissued shares of preferred stock.
Common Shares
Our common shares have a par value of $0.001. We have 50 million shares authorized of which approximately 29 million are issued and outstanding as of June 30, 2006.
On February 14, 2006, our Board of Directors approved a two for one split of our outstanding common shares. Shareholders as of February 28, 2006 received a stock dividend of one additional common share for every common share they owned. All share and per share information for all periods presented has been retroactively adjusted to reflect this share split.
Shelf Registration
In the third quarter of 1998, a shelf registration was filed with the Securities and Exchange Commission to register 4 million common shares. We may issue these shares in connection with future business acquisitions, combinations or mergers. Shares have been issued from this registration statement for a portion of the purchase price for acquisitions. There are approximately 3.7 million shares remaining and available under this shelf registration.
Our principal sources of funds are anticipated to be cash flows from operating activities and available borrowings under our credit facility. Based on our historical ability to generate cash flows from operations, borrowing capacity under the credit facility and access to debt and equity markets, we believe we have sufficient liquidity and capital resources to meet our current and future financial obligations, including our scheduled principal and interest payments as well as provide funds for working capital, acquisitions and other anticipated needs.
OFF-BALANCE SHEET ARRANGEMENTS
As part of our on-going business, we do not participate in transactions that generate relationships with unconsolidated entities or financial partnerships. These entities are often referred to as structured finance or special purpose entities which might be established to facilitate off-balance sheet arrangements or other contractually narrow or limited purposes. As of June 30, 2006, we are not involved in any transactions with unconsolidated entities.
CRITICAL ACCOUNTING ESTIMATES
Preparing financial statements requires management to make estimates and assumptions that affect the reported amounts of assets, liabilities, revenues and expenses. These estimates and assumptions include critical accounting estimates that are defined by the Securities and Exchange Commission as those that are the most important to the portrayal of our financial condition, results of operations or cash flows. These estimates require management’s subjective and complex judgments often as a result of the need to estimate matters that are inherently uncertain. We review the development, selection and disclosure of these estimates with our Audit Committee. Our critical accounting estimates are:
| | · | revenue recognition for construction services |
| | · | estimated losses on uncompleted contracts and changes in contract estimates |
| | · | insurance deductible reserves |
| | · | share-based compensation |
Management believes the estimates utilized are reasonable under the circumstances, however actual results could differ from these estimates and may require adjustment in future periods. There have been no significant changes during the six months ended June 30, 2006 to the critical accounting estimates disclosed in Management’s Discussion and Analysis in our Annual Report on Form 10-K for the year ended December 31, 2005.
BUSINESS RISKS AND FORWARD-LOOKING STATEMENTS
There are a number of business risks and uncertainties that affect our operations and therefore could cause future results to differ from past performance or expected results. Additional information regarding business risks and uncertainties is contained in Item 1A of Part II of this Form 10-Q. These risks and uncertainties may include, however are not limited to:
| | · | demand for single-family homes which is influenced by changes in the overall condition of the U.S. economy, including interest rates, job formation, consumer confidence and other important factors; |
| | · | integration of acquired businesses may not result in anticipated cost savings and revenue synergies being fully realized or may take longer to realize than expected; |
| | · | our ability to identify and acquire suitable acquisition candidates; |
| | · | availability of and our ability to attract, train and retain qualified individuals; |
| | · | implementation of cost structures that align with revenue growth; |
| | · | changes in the business models of our customers; |
| | · | fluctuations in our costs and availability of sourcing channels for commodity wood products, concrete, steel and other building materials; |
| | · | weather conditions, including natural catastrophic events; |
| | · | construction defect and product liability claims as well as other legal proceedings; |
| | · | disruptions in our information systems; |
| | · | actual and perceived vulnerabilities as a result of terrorist activities and armed conflict; |
| | · | changes to various federal, state and other regulations; and |
| | · | numerous other matters of a local and regional scale, including those of a political, economic, business, competitive or regulatory nature. |
Risks related to our shares include, however are not limited to:
| | · | share price fluctuations and |
| | · | potential share price limitations due to anti-takeover defenses in our governing documents and certain provisions under Delaware law. |
Certain statements made in this Form 10-Q constitute forward-looking statements within the meaning of the Private Securities Litigation Reform Act of 1995. Statements that are not historical or current facts, including statements about our expectations, anticipated financial results and future business prospects are forward-looking statements. While these statements represent our current judgment on what the future may hold and we believe these judgments are reasonable, these statements involve risks and uncertainties that could cause our actual results to differ materially from those in forward-looking statements. These factors include, however are not limited to the risks and uncertainties cited in the above paragraph. Undue reliance should not be placed on such forward-looking statements, as such statements speak only as of the date of this Form 10-Q. We undertake no obligation to update forward-looking statements.
Commodity Risk
Prices of commodity wood products, which are subject to significant volatility, may adversely impact operating income when prices rapidly rise or fall within a relatively short period of time. The frequency at which inventory is sold and the short-term duration of our construction contracts reduces the risk of gross margin erosion caused by rapid changes in commodity wood product prices. We do not use derivative financial instruments to hedge commodity wood product prices.
Interest Rate Risk
Changes in interest expense occur when market interest rates change. Changes in the carrying amount of debt could also increase interest rate risks. Interest rate swap contracts are currently utilized to hedge interest rate risks. Approximately 82% of the outstanding floating rate borrowings of the $121.3 million term note as of June 30, 2006 have been hedged through the designation of interest rate swap contracts accounted for as cash flow hedges. After giving effect to the interest rate swap contracts, total borrowings are 32% fixed and 68% floating. Based on debt outstanding as of June 30, 2006, a 0.25% increase in interest rates would result in approximately $0.6 million of additional interest expense annually.
Evaluation of Disclosure Controls and Procedures
As of the end of the period covered by this report, management carried out an evaluation, under the supervision and with the participation of the Chief Executive Officer and Chief Financial Officer, of the design and operation of our disclosure controls and procedures. This evaluation was conducted to determine whether the disclosure controls and procedures were effective and timely in bringing material information to the attention of senior management and are designed to provide reasonable assurance regarding the reliability of financial reporting and the preparation of our financial statements in accordance with generally accepted accounting principles. Based on that evaluation, the Chief Executive Officer and Chief Financial Officer concluded that our disclosure controls and procedures are effective in ensuring information required to be disclosed in reports filed under the Securities and Exchange Act of 1934 is recorded, processed, summarized and reported within the time periods specified in the Securities and Exchange Commission’s rules and forms and is accumulated and communicated to our Chief Executive Officer and Chief Financial Officer to allow timely decisions regarding required disclosure.
Changes in Internal Controls Over Financial Reporting
Our disclosure controls and procedures and internal controls over financial reporting are routinely evaluated and tested for effectiveness. These evaluations are discussed with management and the Audit Committee. As a result of these evaluations, revisions and corrective actions are made to ensure the effectiveness of our disclosure controls and procedures and internal controls over financial reporting. During the quarterly period covered by this report, we identified deficiencies in the design or operation of our internal controls, however revisions and corrective actions are being made to ensure the effectiveness of our disclosure controls and procedures and internal controls over financial reporting. None of these deficiencies have been considered a material weakness and there were no changes in the design or operation of our internal controls over financial reporting that have materially affected, or are reasonably likely to materially affect, our internal control over financial reporting.
We are involved in litigation and other legal matters arising in the normal course of business. In the opinion of management the recovery or liability, if any, under any of these matters will not have a material effect on our consolidated financial position, results of operations or cash flows.
Risks Related to Our Business
There are a number of business risks and uncertainties that affect our operations and therefore could cause future results to differ from past performance or expected results. These risks or uncertainties may include, but are not limited to the following factors:
Our business is dependent on demand for single-family homes which is influenced by changes in the overall condition of the U.S. economy, including interest rates, job formation, consumer confidence and other important factors.
The residential construction services and building products industry is highly dependent on demand for single-family homes which is influenced by several factors. These factors include economic changes nationally and locally, mortgage and other interest rates, tax policy, job formation, consumer confidence, demographic trends, inflation and building permit activity as well as other factors. The construction of new homes may also experience declines due to the availability and affordability of land in attractive metropolitan areas, shortages of qualified trades people, shortages of materials and regulations that impose restrictive zoning and density requirements. Also, changes to housing patterns may occur, such as an increase in consumer demand for urban living rather than single-family suburban neighborhoods. All of these factors could limit demand for home construction and may adversely impact our financial condition, results of operations or cash flows.
There are risks associated with our business model.
Our business model seeks the strategic growth of construction services and distribution of building products in an effort to provide a comprehensive solution to high-volume and other homebuilders. Providing these services and products includes the risks of availability and cost of qualified labor and claims for construction defects, product liability and workers compensation as well as the timely sourcing and availability of building products. Additionally, there is no guarantee that our efforts to offer these comprehensive solutions will continue to be accepted by the marketplace.
The integration of acquired businesses may not result in anticipated cost savings and revenue synergies being fully realized or may take longer to realize than expected.
Our growth over the past several years has been largely due to acquisitions and we intend to continue this strategy. The integration of acquired businesses may not result in anticipated cost savings and revenue synergies being fully realized or may take longer to realize than expected. The management and acquisition of businesses involves substantial risks including:
| | · | the uncertainty that an acquired business will achieve anticipated operating results; |
| | · | significant expenses to integrate; |
| | · | diversion of management attention; |
| | · | departure of key personnel from the acquired business; |
| | · | effectively managing entrepreneurial spirit and decision-making; |
| | · | integration of different information systems; |
| | · | managing new construction service trades; |
| | · | unanticipated costs and exposure to unforeseen liabilities; and |
Our growth is dependent upon our ability to identify suitable acquisition candidates.
Our growth over the past several years has been largely due to acquisitions and we intend to continue this strategy. Failure to identify and acquire suitable acquisition candidates could have an adverse effect on our growth. Also, the increasing level of consolidation occurring in the construction services and building products distribution industry may limit the availability and suitability of acquisition candidates.
Our success is dependent upon the availability of and our ability to attract, train and retain qualified individuals.
Competition for employees is especially intense in both construction services and building products distribution. In markets with strong housing demand, we may experience shortages in qualified labor and key personnel, which may limit our ability to complete contracts as well as obtain additional contracts with builders. Changes to immigration policies, including the enforcement of existing laws, could also limit the availability of qualified labor. We have been successful in recruiting and retaining qualified employees, however we cannot guarantee that we will continue to be successful in the future.
An inability to implement and maintain cost structures that align with revenue growth may have an adverse impact on our operating results.
When we experience slower periods of homebuilding activity, acquire new businesses or expand existing operations, we may experience inefficiencies in our cost structures. Our evaluation and changes to expenses in response to declining sales may not occur in a timely manner, leading to higher costs and lower returns on sales.
Changes in the business models of customers may limit our ability to provide construction services and building products required by our customers.
As the business models of our customers evolve, our existing construction service and building product offerings may not meet the needs of certain homebuilders. Homebuilders may decide to no longer outsource construction services. If we do not assess shifts in customer expectations, preferences and demands in a timely manner, our financial condition, results of operations or cash flows could be adversely affected.
Our operating results are affected by fluctuations in our costs and the availability of sourcing channels for commodity wood products, concrete, steel and other building materials.
Prices of commodity wood products, concrete, steel and other building products are historically volatile and are subject to fluctuations arising from changes in domestic and international supply and demand, labor costs, competition, market speculation, government regulations and periodic delays in delivery. Rapid and significant changes in product prices may affect sales as well as margins due to a limited ability to pass on short-term price changes. We do not use derivative financial instruments to hedge commodity price changes.
Generally, our products are obtainable from various sources and in sufficient quantities. However, we may experience shortages of building products as a result of unexpected demand or production difficulties as well as transportation limitations. Any disruption in our sources of supply for key building products could negatively impact our financial condition, results of operations or cash flows.
Our business is subject to intense competition.
We experience competition across all markets for our construction services and building products. Recently, there has been increased consolidation within the construction services and building materials distribution industry. As the industry consolidates, other building materials distributors, including large retail distributors focused on consumers, may aggressively pursue our target market of professional builders and contractors. These competitive factors may lead to pricing pressures and cause reductions in sales or margins, increases in operating costs and may limit acquisition opportunities. Loss of significant market share due to competition could result in the closure of facilities.
Weather conditions, including natural catastrophic events, may cause our operating results to fluctuate each quarter.
Our first and fourth quarters historically have been, and are expected to continue to be, adversely affected by weather conditions in some of our markets, causing decreases in operating results due to slower homebuilding activity. In addition, natural catastrophic events may cause our operating results to fluctuate.
The nature of our business exposes us to construction defect and product liability claims as well as other legal proceedings.
We are involved in construction defect and product liability claims relating to our various construction trades and the products we distribute and manufacture. We also operate a large fleet of trucks and other vehicles and therefore face some risk of accidents. Although we believe we maintain adequate insurance, we may not be able to maintain such insurance on acceptable terms or such insurance may not provide adequate protection against potential liabilities. Current or future claims may adversely affect our financial condition, results of operations or cash flows.
We may be adversely affected by disruptions in our information systems.
Our operations are dependent upon information for decision-making and the related information systems. A substantial disruption in our information systems for a prolonged period could result in delays in our services and products and adversely affect our ability to complete contracts and fulfill customer demands. Such delays, problems or costs may have an adverse effect on our financial condition, results of operations or cash flows.
Actual and perceived vulnerabilities as a result of terrorist activities and armed conflict may adversely impact consumer confidence and our business.
Instability in the economy and financial markets as a result of terrorism or war may impact consumer confidence and result in a decrease in homebuilding in our markets. Terrorist attacks may also directly impact our ability to maintain operations and services and may have an adverse effect on our business.
Federal, state and other regulations could impose substantial costs and/or restrictions on our business.
We are subject to various federal, state, local and other regulations, including among other things, work safety regulations promulgated by the Department of Labor’s Occupational Safety and Health Administration, transportation regulations promulgated by the Department of Transportation, employment regulations promulgated by the United States Equal Employment Opportunity Commission and state and local zoning restrictions and building codes. More burdensome regulatory requirements in these or other areas may increase our costs and have an adverse effect on our financial condition, results of operations or cash flows.
Numerous other matters of a local and regional scale, including those of a political, economic, business, competitive or regulatory nature may have an adverse impact on our business.
Many factors shape the homebuilding industry and our business. In addition to the factors previously cited, there are other matters of a local and regional scale, including those of a political, economic, business, competitive or regulatory nature that may have an adverse effect on our business.
Risks Related to Our Shares
Risks related to our shares include, however are not limited to:
Our share price may fluctuate significantly, which may make it difficult for shareholders to sell our shares when desired or at attractive prices.
The market price of our shares is subject to significant changes as a result of our operating performance and the other factors discussed above as well as perceptions and events that are beyond our control. Price and trading volume fluctuations for our shares may be unrelated or disproportionate to our operating performance. Additionally, our share price could fluctuate based on the expectations and performance of other publicly traded companies in the construction services and building products distribution industry.
Anti-takeover defenses in our governing documents and certain provisions under Delaware law could prevent an acquisition of our company or limit the price that investors might be willing to pay for our shares.
Our governing documents and certain provisions of Delaware law that apply to us could make it difficult for another company to acquire control of our company. For example, we have a rights plan, commonly known as a “poison pill,” which would make it difficult for someone to acquire our company without the approval of our Board of Directors. Also, our certificate of incorporation allows our Board of Directors to issue, at any time and without shareholder approval, preferred shares with such terms as it may determine. These provisions and others could delay, prevent or allow our Board of Directors to resist an acquisition of our company, even if a majority of our shareholders favored the proposed transaction.
None.
None.
Election of Board of Directors
Our annual meeting of shareholders was held on May 2, 2006. A total of 14,464,233 common shares were outstanding at the date of record and entitled to vote at the meeting. Of the total outstanding, 11,885,349 shares were represented at the meeting, while 2,578,884 were not voted.
In accordance with Delaware corporate law and our bylaws, directors are elected by a plurality of the votes, with the nominees receiving the highest number of affirmative votes being elected as directors. As there were no votes cast for other candidates, each of the nominees below were elected as directors with terms expiring in 2007.
| | For | | Withheld |
| Robert E. Mellor | | 11,747,168 | | 138,181 |
| Sara L. Beckman | | 11,864,380 | | 20,969 |
| Eric S. Belsky | | 11,862,236 | | 23,113 |
| James K. Jennings, Jr. | | 11,865,029 | | 20,320 |
| Norman J. Metcalfe | | 11,861,271 | | 24,078 |
| David M. Moffett | | 11,858,421 | | 26,928 |
| R. Scott Morrison, Jr. | | 11,860,184 | | 25,165 |
| Peter S. O’Neill | | 11,612,598 | | 272,751 |
| Richard G. Reiten | | 11,668,145 | | 217,204 |
Ratification of Independent Registered Public Accountants
Our shareholders ratified the selection of KPMG LLP as our independent registered public accountants at the annual meeting and votes were cast as follows:
For | | Withheld | | Abstain | | Not Voted |
| 11,834,032 | | 34,646 | | 16,671 | | ― |
None.
| (a) | | Exhibits | | |
| | | | |
| | Number | | Description |
| | | | |
| | 10.40 | | Building Materials Holding Corporation 2006 Annual Incentive Program BMHC Officers |
| | | | | |
| | | 10.41 | | Building Materials Holding Corporation 2006 Annual Incentive Program SelectBuild Construction Participants |
| | | | | |
| | 10.42 | | Building Materials Holding Corporation 2006 Annual Incentive Program BMC West Officers and Key Staff |
| | | | | |
| | | 10.45 | | Building Materials Holding Corporation General Terms and Conditions BMHC Officers and BMHC Key Management 2006 Long-Term Cash Incentive Plan |
| | | | | |
| | | 10.70 | | Severance Plan for Certain Executive Officers, Senior Management and Key Employees of the Company and its Subsidiaries |
| | | | | |
| | | 10.90 | | Employment Agreement by and between Robert E. Mellor and Building Materials Holding Corporation as of June 28, 2006 |
| | | | | |
| | | 10.91 | | Employment Agreement by and between William M. Smartt and Building Materials Holding Corporation as of April 1, 2006 |
| | | | | |
| | | 11.0 | | Statement regarding computation of earnings per share (see Note 2) |
| | | | | |
| | | 31.1 | | Section 302 Certification |
| | | | | |
| | | 31.2 | | Section 302 Certification |
| | | | | |
| | | 32.0 | | Section 906 Certifications |
Pursuant to the requirements of the Securities Exchange Act of 1934, the registrant has duly caused this report to be signed on its behalf by the undersigned thereunto duly authorized.
| | BUILDING MATERIALS HOLDING CORPORATION |
| | | |
| | | |
| Date: August 1, 2006 | /s/ Robert E. Mellor | |
| | Robert E. Mellor Chairman of the Board, President and Chief Executive Officer (Principal Executive Officer) |
| | | |
| | | |
| Date: August 1, 2006 | /s/ William M. Smartt | |
| | William M. Smartt Senior Vice President and Chief Financial Officer (Principal Financial Officer) |