UNITED STATES
SECURITIES AND EXCHANGE COMMISSION
Washington, D.C. 20549
FORM 10-Q
þ QUARTERLY REPORT PURSUANT TO SECTION 13 OR 15(d) OF THE SECURITIES
EXCHANGE ACT OF 1934
For the quarterly period ended June 30, 2008
OR
¨ TRANSITION REPORT PURSUANT TO SECTION 13 OR 15(d) OF THE SECURITIES
EXCHANGE ACT OF 1934
For the transition period from _________ to _________
Commission file number 001-33192
www.bmhc.com
Building Materials Holding Corporation
Delaware | | 91-1834269 |
| (State of incorporation) | | (I.R.S. Employer Identification No.) |
Four Embarcadero Center, Suite 3200, San Francisco, CA 94111
(415) 627-9100
N/A
(Former name, former address and former fiscal year, if changed since last report)
Indicate by check mark whether the registrant (1) has filed all reports required to be filed by Section 13 or 15(d) of the Securities Exchange Act of 1934 during the preceding 12 months (or for such shorter period that the registrant was required to file such reports), and (2) has been subject to such filing requirements for the past 90 days.
Yes þ No ¨
Indicate by check mark whether the registrant is a large accelerated filer, an accelerated filer, or a non-accelerated filer.
Large accelerated filer ¨ Accelerated filer þ Non-accelerated filer ¨
Indicate by check mark whether the registrant is a shell company (as defined in Rule 12b-2 of the Exchange Act).
Yes ¨ No þ
The number of shares outstanding of the registrant’s common stock as of August 13, 2008 was 29,457,917.
BUILDING MATERIALS HOLDING CORPORATION
FORM 10-Q
For the Period Ended June 30, 2008
| | | Page Number | |
| | | | | |
PART I - FINANCIAL INFORMATION | | | | |
| | | | | |
Item 1 - Financial Statements (unaudited) | | | 2 | |
| | | | | |
Consolidated Statements of Operations for the Three and Six Months Ended June 30, 2008 and 2007 | | | 2 | |
| | | | | |
| Consolidated Balance Sheets as of June 30, 2008 and December 31, 2007 | | | 3 | |
| | | | | |
Consolidated Statements of Shareholders’ Equity for the Six Months Ended June 30, 2008 and 2007 | | | 4 | |
| | | | | |
Consolidated Statements of Comprehensive (Loss) Income for Six Months Ended June 30, 2008 and 2007 | | | 5 | |
| | | | | |
| Consolidated Statements of Cash Flows for the Six Months Ended June 30, 2008 and 2007 | | | 6 | |
| | | | | |
| Notes to Consolidated Financial Statements | | | 7 | |
| | | | | |
Item 2 - Management's Discussion and Analysis of Financial Condition and Results of Operations | | | 40 | |
| | | | | |
Item 3 - Quantitative and Qualitative Disclosures about Market Risk | | | 56 | |
| | | | | |
Item 4 - Controls and Procedures | | | 57 | |
| | | | | |
| | | | | |
PART II - OTHER INFORMATION | | | | |
| | | | | |
Item 1 - Legal Proceedings | | | 58 | |
| | | | | |
Item 1A - Risk Factors | | | 59 | |
| | | | | |
Item 2 - Unregistered Sales of Equity Securities and Use of Proceeds | | | 64 | |
| | | | | |
Item 3 - Defaults Upon Senior Securities | | | 65 | |
| | | | | |
Item 4 - Submission of Matters to a Vote of Security Holders | | | 66 | |
| | | | | |
Item 5 - Other Information | | | 68 | |
| | | | | |
Item 6 - Exhibits | | | 69 | |
| | | | | |
SIGNATURES | | | 70 | |
Item 1. Financial Statements
Building Materials Holding Corporation
Consolidated Statements of Operations
(thousands, except per share data)
(unaudited)
| | | Three Months Ended June 30 | | Six Months Ended June 30 | | Year Ended December 31 | |
| | | 2008 | | 2007 | | | | 2007 | | 2007 | |
Sales | | | | | | | | | | | |
| Building products | | $ | 198,309 | | $ | 278,978 | | $ | 377,873 | | $ | 519,726 | | $ | 997,035 | |
| Construction services | | | 186,311 | | | 377,022 | | | 349,695 | | | 662,448 | | | 1,182,038 | |
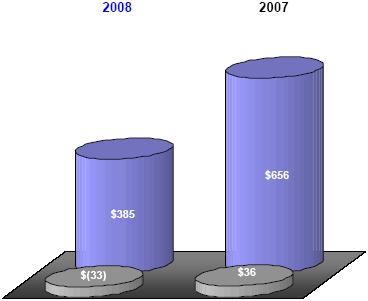
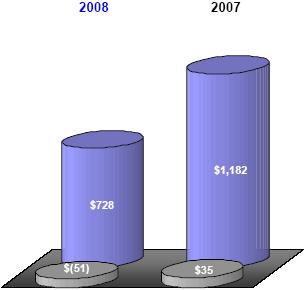
Total sales | | | 384,620 | | | 656,000 | | | 727,568 | | | 1,182,174 | | | 2,179,073 | |
| | | | | | | | | | | | | | | | | |
Costs and operating expenses | | | | | | | | | | | | | | | | |
| Cost of goods sold | | | | | | | | | | | | | | | | |
| Building products | | | 145,814 | | | 202,588 | | | 276,497 | | | 376,802 | | | 722,786 | |
| Construction services | | | 166,491 | | | 320,548 | | | 317,286 | | | 567,991 | | | 1,027,796 | |
| Impairment of assets | | | 8,469 | | | — | | | 8,469 | | | — | | | 272,152 | |
Selling, general and administrative expenses | | | 98,693 | | | 107,199 | | | 182,949 | | | 214,794 | | | 422,694 | |
| Other income, net | | | (2,286 | ) | | (10,201 | ) | | (6,716 | ) | | (12,042 | ) | | (9,971 | ) |
| Total costs and operating expenses | | | 417,181 | | | 620,134 | | | 778,485 | | | 1,147,545 | | | 2,435,457 | |
| | | | | | | | | | | | | | | | | |
(Loss) income from operations | | | (32,561 | ) | | 35,866 | | | (50,917 | ) | | 34,629 | | | (256,384 | ) |
| | | | | | | | | | | | | | | | | |
| Interest expense | | | 9,246 | | | 9,501 | | | 20,884 | | | 17,719 | | | 33,800 | |
| | | | | | | | | | | | | | | | | |
(Loss) income from continuing operations before income taxes and minority interests | | | (41,807 | ) | | 26,365 | | | (71,801 | ) | | 16,910 | | | (290,184 | ) |
| | | | | | | | | | | | | | | | | |
| Income tax benefit (expense) | | | 457 | | | (8,325 | ) | | (3,392 | ) | | (4,783 | ) | | 25,670 | |
| Minority interests loss (income) | | | 24 | | | (156 | ) | | 63 | | | (641 | ) | | (1,253 | ) |
(Loss) income from continuing operations | | | (41,326 | ) | | 17,884 | | | (75,130 | ) | | 11,486 | | | (265,767 | ) |
| | | | | | | | | | | | | | | | | |
(Loss) income from discontinued operations prior to sale | | | (2,195 | ) | | 2,471 | | | (5,708 | ) | | 4,778 | | | 2,937 | |
| Impairment of assets | | | 6,212 | | | — | | | 6,212 | | | — | | | 64,922 | |
| Gain on sale of discontinued operations | | | — | | | — | | | — | | | — | | | 20,029 | |
| Income tax benefit (expense) | | | 17,792 | | | (938 | ) | | 21,248 | | | (1,813 | ) | | (4,990 | ) |
Income (loss) from discontinued operations | | | 9,385 | | | 1,533 | | | 9,328 | | | 2,965 | | | (46,946 | ) |
| | | | | | | | | | | | | | | | | |
Net (loss) income | | | (31,941 | ) | | 19,417 | | $ | (65,802 | ) | $ | 14,451 | | $ | (312,713 | ) |
| | | | | | | | | | | | | | | | | |
Net (loss) income per share: | | | | | | | | | | | | | | | | |
| Continuing operations | | | $(1.42 | ) | | $0.62 | | | $(2.59 | ) | | $0.40 | | | $ (9.23 | ) |
| Discontinued operations | | | 0.32 | | | 0.05 | | | 0.32 | | | 0.10 | | | (1.63 | ) |
| Basic | | | $(1.10 | ) | | $0.67 | | | $(2.27 | ) | | $0.50 | | | $(10.86 | ) |
| | | | | | | | | | | | | | | | | |
| Continuing operations | | | $(1.42 | ) | | $0.61 | | | $(2.59 | ) | | $0.39 | | | $ (9.23 | ) |
| Discontinued operations | | | 0.32 | | | 0.05 | | | 0.32 | | | 0.10 | | | (1.63 | ) |
| Diluted | | | $(1.10 | ) | | $0.66 | | | $(2.27 | ) | | $0.49 | | | $(10.86 | ) |
The accompanying notes are an integral part of these consolidated financial statements.
Building Materials Holding Corporation
Consolidated Balance Sheets
(thousands)
(unaudited)
| | | June 30 | | | December 31 | | | | June 30 | | | December 31 |
| | | 2008 | | | 2007 | | | | 2008 | | | 2007 |
Assets | | | | | | | Liabilities, Minority Interests and Shareholders’ Equity | | | | | |
| Cash and cash equivalents | $ | 56,192 | | $ | 60,587 | | | | | | | |
| Marketable securities | | 787 | | | 1,872 | | | | | | | |
| Receivables, net of allowances | | | | | | | Accounts payable | $ | 68,289 | | $ | 74,025 |
| of $8,652 and $4,656 | | 195,346 | | | 200,995 | | Accrued compensation | | 28,224 | | | 31,537 |
| Inventory | | 104,307 | | | 115,524 | | Insurance deductible reserves | | 23,082 | | | 27,189 |
| Unbilled receivables | | 34,793 | | | 39,189 | | Other accrued liabilities | | 42,431 | | | 28,989 |
| Income tax receivable | | 49,894 | | | 9,812 | | Billings in excess of costs and estimated | | | | | |
| Deferred income taxes | | — | | | 11,470 | | earnings | | 29,119 | | | 20,977 |
| Prepaid expenses and other | | 8,200 | | | 8,973 | | Current portion of long-term debt | | 379,991 | | | 4,923 |
| Assets of discontinued operations | | 16,492 | | | 10,492 | | Liabilities of discontinued operations | | 7,854 | | | 8,533 |
Current assets | | 466,011 | | | 458,914 | | Current liabilities | | 578,990 | | | 196,173 |
| | | | | | | | | | | | | |
| Property and equipment | | | | | | | Insurance deductible reserves | | 25,439 | | | 27,898 |
| Land | | 40,711 | | | 60,052 | | Long-term debt | | 1,246 | | | 343,937 |
| Buildings and improvements | | 129,596 | | | 135,009 | | Other long-term liabilities | | 40,575 | | | 44,503 |
| Equipment | | 178,182 | | | 185,958 | | | | | | | |
| Construction in progress | | 19,855 | | | 16,134 | | Minority interests | | — | | | 8,591 |
| Accumulated depreciation | | (158,732) | | | (155,083) | | | | | | | |
| Assets held for sale | | 23,968 | | | — | | Commitments and contingent liabilities | | — | | | — |
| Marketable securities | | 38,882 | | | 40,039 | | | | | | | |
| Deferred income taxes | | — | | | 11,269 | | Shareholders’ equity | | | | | |
| Deferred loan costs | | 6,087 | | | 4,358 | | Common shares, $0.001 par value: | | | | | |
| Other long-term assets | | 27,821 | | | 30,956 | | authorized 50 million shares; issued and | | | | | |
| Other intangibles, net | | 47,320 | | | 58,310 | | outstanding 29.5 and 29.2 million shares | | 29 | | | 29 |
| Goodwill | | 13,886 | | | 14,196 | | Additional paid-in capital | | 166,642 | | | 164,043 |
| Assets of discontinued operations | | — | | | 14,732 | | Deferred compensation common shares obligation | | 1,309 | | | 1,427 |
| | $ | 833,587 | | $ | 874,844 | | Deferred compensation common shares | | (1,309) | | | (1,427) |
| | | | | | | | Retained earnings | | 28,680 | | | 94,482 |
| | | | | | | | Accumulated other comprehensive loss, net | | (8,014) | | | (4,812) |
| | | | | | | | Shareholders’ equity | | 187,337 | | | 253,742 |
| | | | | | | | | $ | 833,587 | | $ | 874,844 |
The accompanying notes are an integral part of these consolidated financial statements.
Building Materials Holding Corporation
Consolidated Statements of Shareholders’ Equity
(thousands)
(unaudited)
| | | | Six Months Ended June 30 | | | Year Ended December 31 | |
| | | | 2008 | | | 2007 | | | 2007 | |
| Common shares - beginning balance | | $ | 29 | | $ | 29 | | $ | 29 | |
| Shares issued from Incentive and Performance Plans | | | — | | | — | | | — | |
Common Shares | | $ | 29 | | $ | 29 | | $ | 29 | |
| | | | | | | | | | | |
| | | | | | | | | | | |
| Additional paid-in capital - beginning balance | | $ | 164,043 | | $ | 154,405 | | $ | 154,405 | |
| Shares issued from Incentive and Performance Plans | | | | | | | | | | |
| Options exercised - Management | | | 9 | | | 163 | | | 203 | |
| (Taxes) tax benefit for share options exercised | | | (69 | ) | | 94 | | | 29 | |
| Restricted shares - Management | | | 294 | | | 3,014 | | | 2,614 | |
| Unearned compensation | | | (294 | ) | | (3,014 | ) | | (2,614 | ) |
| Tax benefit for dividends on restricted shares | | | — | | | — | | | 63 | |
| Shares - Directors | | | 402 | | | 405 | | | 405 | |
| Earned compensation | | | | | | | | | | |
| Options - Management | | | 1,768 | | | 2,565 | | | 5,177 | |
| Restricted shares - Management | | | 1,212 | | | 1,730 | | | 3,317 | |
| (Taxes) tax benefit for vested restricted shares | | | (723 | ) | | 158 | | | 167 | |
| Shares issued from Employee Stock Purchase Plan | | | — | | | 277 | | | 277 | |
Additional paid-in capital | | $ | 166,642 | | $ | 159,797 | | $ | 164,043 | |
| | | | | | | | | | | |
| | | | | | | | | | | |
Deferred compensation common shares obligation - beginning balance | | $ | 1,427 | | $ | 1,200 | | $ | 1,200 | |
| Shares purchased with deferred compensation | | | 261 | | | 336 | | | 364 | |
| Shares purchased with dividends | | | 11 | | | 18 | | | 38 | |
| Distributions | | | (390 | ) | | (22 | ) | | (175 | ) |
Deferred compensation common shares obligation | | $ | 1,309 | | $ | 1,532 | | $ | 1,427 | |
| | | | | | | | | | | |
| | | | | | | | | | | |
Deferred compensation common shares - beginning balance | | $ | (1,427 | ) | $ | (1,200 | ) | $ | (1,200 | ) |
| Shares purchased with deferred compensation and dividends | | | (272 | ) | | (354 | ) | | (402 | ) |
| Distributions | | | 390 | | | 22 | | | 175 | |
Deferred compensation common shares | | $ | (1,309 | ) | $ | (1,532 | ) | $ | (1,427 | ) |
| | | | | | | | | | | |
| | | | | | | | | | | |
| Retained earnings - beginning balance | | $ | 94,482 | | $ | 418,927 | | $ | 418,927 | |
| Net (loss) income | | | (65,802 | ) | | 14,451 | | | (312,713 | ) |
| Cash dividends on common shares | | | — | | | (5,856 | ) | | (11,732 | ) |
Retained earnings | | $ | 28,680 | | $ | 427,522 | | $ | 94,482 | |
| | | | | | | | | | | |
| | | | | | | | | | | |
Accumulated other comprehensive (loss) income, net - beginning balance | | $ | (4,812 | ) | $ | (732 | ) | $ | (732 | ) |
| Interest rate swap contracts: | | | | | | | | | | |
| Unrealized gain (loss) | | | 446 | | | 3,691 | | | (7,673 | ) |
| (Taxes) tax benefit for unrealized gain (loss) | | | (3,266 | ) | | (1,393 | ) | | 2,933 | |
| Marketable securities: | | | | | | | | | | |
| Unrealized (loss) gain | | | (579 | ) | | (177 | ) | | 1,000 | |
| Tax benefit (taxes) for unrealized (loss) gain | | | 197 | | | 60 | | | (340 | ) |
Accumulated other comprehensive (loss) income, net | | $ | (8,014 | ) | $ | 1,449 | | $ | (4,812 | ) |
| | | | | | | | | | | |
Shareholders’ Equity | | $ | 187,337 | | $ | 588,797 | | $ | 253,742 | |
The accompanying notes are an integral part of these consolidated financial statements.
Building Materials Holding Corporation
Consolidated Statements of Comprehensive (Loss) Income
(thousands)
(unaudited)
| | | | Six Months Ended June 30 | | | Year Ended December 31 | |
| | | | 2008 | | | 2007 | | | 2007 | |
| | | | | | | | | | | |
| Net (loss) income | | $ | (65,802 | ) | $ | 14,451 | | $ | (312,713 | ) |
| | | | | | | | | | | |
| Unrealized gain (loss) on interest rate swap contracts: | | | | | | | | | | |
| Unrealized gain (loss) | | $ | 446 | | $ | 3,691 | | $ | (7,673 | ) |
| (Taxes) tax benefit for unrealized gain (loss) | | | (3,266 | ) | | (1,393 | ) | | 2,933 | |
| | | $ | (2,820 | ) | $ | 2,298 | | $ | (4,740 | ) |
| Unrealized (loss) gain on marketable securities: | | | | | | | | | | |
| Unrealized (loss) gain | | $ | (579 | ) | $ | (177 | ) | $ | 1,000 | |
| Tax benefit (taxes) for unrealized (loss) gain | | | 197 | | | 60 | | | (340 | ) |
| | | $ | (382 | ) | $ | (117 | ) | $ | 660 | |
| | | | | | | | | | | |
Comprehensive (loss) income | | $ | (69,004 | ) | $ | 16,632 | | $ | (316,793 | ) |
The accompanying notes are an integral part of these consolidated financial statements.
Building Materials Holding Corporation
Consolidated Statements of Cash Flows
(thousands)
(unaudited)
| | | Six Months Ended June 30 | | Year Ended December 31 | |
| | | 2008 | | 2007 | | 2007 | |
Operating Activities | | | | | | | |
| Net (loss) income | | $ | (65,802 | ) | $ | 14,451 | | $ | (312,713 | ) |
| Items in net (loss) income not using (providing) cash: | | | | | | | | | | |
| Minority interests (loss) income, net | | | (63 | ) | | 376 | | | 853 | |
| Depreciation and amortization | | | 20,525 | | | 24,111 | | | 48,781 | |
| Deferred loan cost amortization | | | 3,188 | | | 561 | | | 1,123 | |
| Impairment of assets | | | 14,681 | | | — | | | 337,074 | |
| Share-based compensation | | | 3,267 | | | 4,542 | | | 8,944 | |
| Gain on sale of discontinued operations | | | — | | | — | | | (20,029 | ) |
| Gain on sale of assets, net | | | (4,778 | ) | | (8,700 | ) | | (8,789 | ) |
| Realized (gain) loss on marketable securities | | | (419 | ) | | 7 | | | (408 | ) |
| Deferred income taxes | | | 19,671 | | | 2,485 | | | (19,452 | ) |
| Accrued loss for acquisition purchase obligation | | | — | | | — | | | 5,500 | |
Changes in assets and liabilities, net of effects of acquisitions and divestitures of business units: | | | | | | | | | | |
| Receivables, net | | | (363 | ) | | (49,128 | ) | | 68,385 | |
| Inventory | | | 11,049 | | | (12,341 | ) | | 24,599 | |
| Unbilled receivables | | | 4,526 | | | (28,664 | ) | | 3,610 | |
| Income tax receivable | | | (40,082 | ) | | 674 | | | (7,304 | ) |
| Prepaid expenses and other current assets | | | 901 | | | (183 | ) | | (454 | ) |
| Accounts payable | | | 4,047 | | | 27,746 | | | (22,621 | ) |
| Accrued compensation | | | (3,708 | ) | | (7,827 | ) | | (16,536 | ) |
| Insurance deductible reserves | | | (5,202 | ) | | 2,785 | | | 3,557 | |
| Other accrued liabilities | | | (3,689 | ) | | (6,032 | ) | | (13,033 | ) |
| Billings in excess of costs and estimated earnings | | | 7,984 | | | 8,211 | | | (3,843 | ) |
| Other long-term assets and liabilities | | | 17,009 | | | (9,254 | ) | | (12,560 | ) |
| Other, net | | | (3,068 | ) | | (1,332 | ) | | 2,595 | |
Cash flows (used) provided by operating activities | | | (20,326 | ) | | (37,512 | ) | | 67,279 | |
| | | | | | | | | | | |
Investing Activities | | | | | | | | | | |
| Purchases of property and equipment | | | (11,150 | ) | | (15,992 | ) | | (32,995 | ) |
| Acquisitions and investments in businesses, net of cash acquired | | | (2,600 | ) | | (72,214 | ) | | (80,961 | ) |
| Proceeds from dispositions of property and equipment | | | 8,238 | | | 16,154 | | | 16,905 | |
| Proceeds from sale of discontinued operations | | | — | | | — | | | 27,176 | |
| Purchase of marketable securities | | | (26,691 | ) | | (17,764 | ) | | (35,239 | ) |
| Proceeds from sales of marketable securities | | | 28,696 | | | 17,414 | | | 52,650 | |
| Other, net | | | (2,452 | ) | | (1,509 | ) | | (628 | ) |
Cash flows used by investing activities | | | (5,959 | ) | | (73,911 | ) | | (53,092 | ) |
| | | | | | | | | | | |
Financing Activities | | | | | | | | | | |
| Net borrowings under revolver | | | 39,000 | | | 87,000 | | | — | |
| Principal payments on term notes | | | (5,806 | ) | | (1,750 | ) | | (3,500 | ) |
| Net payments on other notes | | | (988 | ) | | (4,108 | ) | | (4,505 | ) |
| Decrease in book overdrafts | | | (1,678 | ) | | (1,182 | ) | | (7,609 | ) |
| Proceeds from share options exercised | | | 9 | | | 163 | | | 203 | |
| (Taxes) tax benefit for share-based compensation | | | (792 | ) | | 253 | | | 259 | |
| Dividends paid | | | (2,938 | ) | | (5,832 | ) | | (11,709 | ) |
| Deferred financing costs | | | (4,917 | ) | | — | | | — | |
| Distributions to minority interests | | | — | | | (2,203 | ) | | (1,223 | ) |
| Other, net | | | — | | | 211 | | | 212 | |
Cash flows provided (used) by financing activities | | | 21,890 | | | 72,552 | | | (27,872 | ) |
| | | | | | | | | | | |
Decrease in Cash and Cash Equivalents | | | (4,395 | ) | | (38,871 | ) | | (13,685 | ) |
| | | | | | | | | | | |
| Cash and cash equivalents, beginning of period | | | 60,587 | | | 74,272 | | | 74,272 | |
| Cash and cash equivalents, end of period | | $ | 56,192 | | $ | 35,401 | | $ | 60,587 | |
| | | | | | | | | | | |
Supplemental Disclosure of Cash Flow Information | | | | | | | | | | |
| Accrued but unpaid dividends | | $ | — | | $ | 2,939 | | $ | 2,938 | |
| Cash paid for interest | | $ | 17,667 | | $ | 16,812 | | $ | 32,827 | |
| Cash paid for income taxes | | $ | 952 | | $ | 1,899 | | $ | 7,233 | |
| | | | | | | | | | | |
Supplemental Schedule of Investing Activities | | | | | | | | | | |
| Fair value of assets acquired | | $ | — | | $ | 9,805 | | $ | 12,999 | |
| Liabilities of acquisitions (extinguished) | | $ | (2,600 | ) | $ | (1,271 | ) | $ | (3,680 | ) |
| Cash paid for acquisitions made this period | | $ | 2,600 | | $ | 11,076 | | $ | 16,679 | |
| Cash paid for acquisitions made in prior period | | $ | — | | $ | 61,138 | | $ | 64,282 | |
The accompanying notes are an integral part of these consolidated financial statements.
Notes to Consolidated Financial Statements
1. Summary of Significant Accounting Policies
Basis of Presentation
These consolidated financial statements have been prepared pursuant to the rules and regulations of the Securities and Exchange Commission. Certain information and disclosures normally included in financial statements prepared in accordance with accounting principles generally accepted in the United States have been condensed or omitted pursuant to those rules and regulations. These consolidated financial statements should be read in conjunction with the consolidated financial statements and the accompanying notes included in our most recent Annual Report on Form 10-K.
These consolidated financial statements present separately the financial information for discontinued operations as follows:
| · | concrete block masonry, concrete services and truss manufacturing in Florida (June 2008), |
| · | framing services in Virginia (March 2008) and |
| · | three building materials distribution businesses in Western Colorado (September 2007). |
As a result of these transactions:
| · | the operating results of these operations are presented separately from continuing operations within the caption of discontinued operations and |
| · | related assets and liabilities are separately classified in the consolidated balance sheet. |
These consolidated financial statements refer to three months as a quarter and six months as a period.
These consolidated financial statements have not been audited by independent registered public accountants. However, in the opinion of management, all adjustments, including those of a normal and recurring nature, necessary to present fairly the results for the periods have been included. The preparation of these consolidated financial statements required estimates and assumptions. Actual results may differ from those estimates.
Financial Covenants
Liquidity is essential to our business. We fund working capital requirements and necessary capital expenditures with cash flow from operations and seasonal borrowings under our credit facility. Should we experience a substantial deterioration in operating performance, our ability to obtain funding from operations or our credit facility could be impacted.
Our credit facility requires quarterly compliance with financial covenants including minimum net worth and minimum earnings before interest, taxes, depreciation and amortization as well as annual compliance with minimum interest coverage ratio. Operating results, particularly net income, are a primary factor for these covenants and our ability to comply with these covenants depends on our operating performance. The significant and ongoing correction in single-family housing starts has negatively impacted our operating performance.
Due to lower than planned operating performance, as of June 2008 we were not in compliance with the financial covenants of our credit facility. Similarly due to operating losses and impairments, as of December 2007 we were not in compliance with these financial covenants. Temporary waivers for these financial covenants were obtained in August 2008 and February 2008. The August 2008 waiver agreement temporarily waives financial covenants until September 30, 2008 and limits borrowings under the revolver to $60 million. As of August 11, 2008, $29.2 million was outstanding under the revolver.
We are currently in negotiations with our lenders regarding a potential amendment to the terms of the credit facility. Negotiations include establishing financial covenants consistent with the current and foreseeable housing market conditions. There is no assurance these negotiations will result in an amendment acceptable to us and the lenders.
If the waiver period terminates without an amendment to these financial covenants, or if we fail to comply with existing or new covenants, we may be in default and the lenders may have the right to cause all amounts borrowed to become due and payable immediately. Reduced operating cash flow and revolver borrowing base limitations may adversely affect our ability to finance operations or capital needs.
Nature of Operations
Building Materials Holding Corporation (BMHC) provides building products and construction services to professional homebuilders and contractors in western and southern regions of the United States. We distribute building materials, manufacture building components (millwork, floor and roof trusses and wall panels) and provide construction services to professional builders and contractors through a network of 37 distribution facilities, 52 manufacturing facilities and 5 regional construction services facilities. According to the National Association of Home Builders and as measured by building permit activity, we provide building products and construction services in 10 of the top 25 single-family construction markets.
Principles of Consolidation
The consolidated financial statements include the accounts of BMHC and its subsidiaries. All significant intercompany balances and transactions are eliminated.
Use of Estimates
The preparation of financial statements in conformity with U.S. generally accepted accounting principles requires management to make estimates and assumptions that affect the reported amounts of assets and liabilities and contingent assets and liabilities at the date of the financial statements as well as the reported amounts of sales and expenses during the reporting period. Actual amounts may differ materially from those estimates. The following critical accounting estimates often require our subjective and complex judgment as a result of the need to estimate matters that are inherently uncertain:
· Revenue Recognition for Construction Services
The percentage-of-completion method is used to recognize revenue for construction services. Periodic estimates of our progress towards completion are made based on a comparison of labor costs incurred to date with total estimated contract costs for labor. The percentage-of-completion method requires the use of various estimates, including among others, the extent of progress towards completion, contract revenues and contract completion costs. Contract revenues and contract costs to be recognized are dependent on the accuracy of estimates, including quantities of materials, labor productivity and other cost estimates. We have a history of making reasonable estimates of the extent of progress towards completion, contract revenues and contract completion costs. However, due to uncertainties inherent in the estimation process, it is possible that actual contract revenues and completion costs may vary from estimates. Revisions of contract revenues and cost estimates as well as provisions for estimated losses on uncompleted contracts are recognized in the period such revisions are known.
· Estimated Losses on Uncompleted Contracts and Changes in Contract Estimates
Estimated losses on uncompleted contracts and changes in contract estimates are established by assessing estimated costs to complete, change orders and claims for uncompleted contracts. Revisions of estimated losses are recognized in the period such revisions are known.
Goodwill represents the excess of purchase price over the fair values of net tangible and identifiable intangible assets of acquired businesses. An annual assessment for impairment is completed in the fourth quarter and whenever events and circumstances indicate the carrying amount may not be recoverable. An impairment is recognized if the carrying amount is more than the estimated future operating cash flows as measured by fair value techniques.
· Insurance Deductible Reserves
The estimated cost of automobile, general liability and workers’ compensation claims is determined by actuarial methods. Claims in excess of insurance deductibles are insured with third-party insurance carriers. Insurance deductible reserves for claims are recognized based on the estimated costs of these claims as limited by the deductibles of the applicable insurance policies. Revisions to insurance deductible reserves for estimated claims are recognized in the period such revisions are known.
· Warranties
The estimated cost of warranties for certain construction services is based on the nature and frequency of claims, anticipated claims and cost per claim. Claims in excess of insurance deductibles are insured with third-party insurance carriers. Estimated costs for warranties are recognized when the revenue associated with the service is recognized. Revisions of estimated warranties are recognized in the period such revisions are known.
· Share-based Compensation
Our estimates of the fair values of our share-based payment transactions are based on the modified Black-Scholes-Merton model. In order to meet the fair value measurement objective, we are required to develop estimates regarding expected exercise patterns, share price volatility, forfeiture rates, risk-free interest rate and dividend yield. These assumptions are based principally on historical experience. When circumstances indicate the availability of new or different information that would be useful in estimating these assumptions, revisions are recognized in the period such revisions are known. Due to uncertainties inherent in these assumptions, it is possible that actual share-based compensation may vary from this estimate.
Cash and Cash Equivalents
Cash and cash equivalents consist of short-term investments that have a maturity of three months or less at the date of purchase.
Receivables
Receivables consist primarily of amounts due from customers and are net of an allowance for doubtful accounts. The allowance for doubtful accounts reflects our best estimate of probable losses inherent in the accounts receivable balance. We determine the allowance based on known troubled accounts, historical experience and other available evidence.
Inventory Valuation
Inventory consists principally of building materials purchased for resale and is valued at the lower of average cost or market. We participate in vendor rebate programs under which rebates are earned by attaining certain purchase volumes. Volume rebates are accrued as earned. These volume rebates are recorded as a reduction in inventory and recognized in cost of goods sold when the related product is sold.
Unbilled Receivables and Billings in Excess of Costs and Estimated Earnings
The percentage-of-completion method results in recognizing costs incurred and estimated revenues on uncompleted contracts. Unbilled receivables represent revenues recognized for construction services performed, however not yet billed. Billings in excess of costs and estimated earnings represent billings made in excess of estimated revenues recognized. These billings are deferred until the actual progress towards completion indicates recognition is appropriate. Costs include direct labor and materials as well as equipment costs related to contract performance.
Property and Equipment
Property and equipment are recorded at cost. Cost includes expenditures for major improvements and replacements that extend useful life. Certain costs of software are capitalized provided those costs are not research and development and certain other criteria are met. Capitalized interest was $0.6 million for the period ended June 30, 2008, $0.1 million for the period ended June 30, 2007 and $0.3 million for 2007. Expenditures for other maintenance and repairs are expensed as incurred. Gains and losses from sales and retirements are included in income as they occur. Depreciation is calculated using the straight-line method over the economic useful lives of the assets. The estimated useful lives of depreciable assets are generally:
· ten to thirty years for buildings and improvements,
· seven to ten years for machinery and fixtures,
· three to ten years for handling and delivery equipment and
· three to ten years for software development costs.
To improve financial returns, we periodically evaluate our investments in property and equipment. As a result, property and equipment may be consolidated, leased or sold. For continuing operations, we recognized a gain of $4.7 million for the period ended June 30, 2008, a gain of $8.4 million for the period ended June 30, 2007 and a gain of $8.4 million for 2007 from the sales of property and equipment.
Property Held for Sale
Property held for sale is measured at the lower of its carrying amount or fair value less costs to sell and is no longer depreciated. These assets are being actively marketed for sale at a price that is reasonable in relation to their carrying amounts and sale within one year is probable. Any gain or loss arising from the sale of these assets is included in Other income, net. Assets held for sale are as follows (thousands):
| | | | June 30 | |
| | | | 2008 | |
| Property and equipment | | | | |
| Land | | $ | 18,852 | |
| Buildings and improvements | | | 4,801 | |
| Equipment | | | 315 | |
| | | $ | 23,968 | |
Long-lived Assets
Long-lived assets such as property, equipment and intangibles with useful lives are evaluated for impairment whenever events and circumstances indicate the carrying amount may not be recoverable. An impairment is recognized if the carrying amount exceeds its fair value and when the carrying amount is not recoverable based on the estimated future operating cash flows on an undiscounted basis.
Derivative Instruments and Hedging Activities
We are exposed to certain risks related to business operations some of which we may seek to manage with derivative instruments and hedging activities. The primary risk managed with derivative instruments is interest rate risk. Interest rate swap contracts are entered into to manage interest rate risk associated with variable-rate borrowings. These interest rate swap contracts are accounted for as cash flow hedges.
The fair value of derivative instruments is based on pricing models using current market rates. The fair value of interest rate swap contracts is recorded as an asset or liability and the effective portion of the gain or loss is recorded as a component of Accumulated other comprehensive(loss) income, net, a separate component of shareholders’ equity, and is subsequently reclassified into Interest expense as interest expense is recognized on the term note. The ineffective portion, if any, of the change in the value of the interest rate swap contracts is immediately recognized as a component of interest expense.
Derivative financial instruments are not utilized to hedge other risks or for speculative or trading purposes.
Revenue Recognition
Revenues for building products are recognized when title to the goods and risk of loss pass to the buyer, which is at the time of delivery. The percentage-of-completion method is used to recognize revenue for construction services. Taxes assessed by governmental authorities that are directly imposed on our revenue-producing transactions are excluded from sales.
Shipping and Handling
Shipping and handling costs for manufactured building components and construction services are included as a component of cost of goods sold. Shipping and handling costs for building products are included as a component of selling, general and administrative expenses and were $29.6 million for the period ended June 30, 2008, $35.0 million for the period ended June 30, 2007 and $69.7 million for 2007.
Reclassifications
Certain reclassifications, none of which affected previously reported consolidated results of operations, cash flows or shareholders’ equity, have been made to amounts reported in prior periods to conform to the current period presentation.
Recent Accounting Principles
In May 2008, the Financial Accounting Standards Board issued Statement of Financial Accounting Standards No. 162, The Hierarchy of Generally Accepted Accounting Principles. This accounting principle identifies a consistent framework, or hierarchy, for selecting accounting principles to be used in preparing financial statements that are presented in conformity with U.S. generally accepted accounting principles (GAAP) for nongovernmental entities. This accounting principle was adopted June 2008 and had no impact on consolidated financial position, results of operations or cash flows.
In March 2008, the Financial Accounting Standards Board issued Statement of Financial Accounting Standards No. 161, Disclosures about Derivative Instruments and Hedging Activities. This accounting principle enhances disclosure for derivative instruments and hedging activities and their effects on consolidated financial position, results of operations and cash flows. Specifically, enhanced disclosures will include objectives and strategies for using derivatives, including underlying risk and accounting designation, as well as fair values, gains and losses. This accounting principle was adopted June 2008 and had no impact on consolidated financial position, results of operations or cash flows.
In December 2007, the Financial Accounting Standards Board issued Statement of Financial Accounting Standards No. 160, Noncontrolling Interests in Consolidated Financial Statements. This accounting principle eliminates noncomparable accounting for minority interests. Specifically, minority interests are presented as a component of shareholders’ equity; consolidated net income includes amounts attributable to both the parent and minority interest and is disclosed on the face of the income statement; changes in the ownership interest are accounted for as equity transactions if ownership remains controlling; purchase accounting for acquisitions of noncontrolling interests and acquisitions of additional interests is eliminated; and deconsolidated controlling interests are recognized based on fair value consistent with Statement of Financial Accounting Standards No. 141 (revised 2007), Business Combinations. This accounting principle will be adopted January 2009. The accounting requirements will be adopted prospectively, however presentation and disclosure will be adopted retrospectively for all periods presented. Earlier adoption is prohibited. Adoption is not expected to have an impact on consolidated financial position, results of operations or cash flows.
In December 2007, the Financial Accounting Standards Board issued Statement of Financial Accounting Standards No. 141 (revised 2007), Business Combinations. This accounting principle requires acquisition accounting (purchase accounting) be applied to all business combinations in which control is obtained regardless of consideration and for an acquirer to be identified for each business combination. Additionally, this accounting principle requires acquisition-related costs and restructuring costs at the date of acquisition to be expensed rather than allocated to the assets acquired and the liabilities assumed; minority interests, including goodwill, to be recorded at fair value at the acquisition date; recognition of the fair value of assets and liabilities arising from contractual contingencies and contingent consideration (payments conditioned on the outcome of future events) at the acquisition date; recognition of bargain purchase (acquisition-date fair value exceeds consideration plus any noncontrolling interest) as a gain; and recognition of changes in deferred taxes. This accounting principle will be adopted January 2009. The accounting requirements will be adopted prospectively. Earlier adoption is prohibited. Adoption is not expected to have an impact on consolidated financial position, results of operations or cash flows.
In May 2008, we initiated a comprehensive analysis of our businesses operations to improve cash flow and profitability as well as rationalize our operations for the current conditions of the homebuilding industry. The plan places a priority on efficient use of capital and higher returns and focuses on closing and consolidating underperforming business units as well as improving business processes. As a result, by the fourth quarter of 2008 we expect to:
| · | close 19 underperforming units, |
| · | consolidate 9 underperforming units with other business units and |
| · | consolidate administrative functions of information systems, reporting, accounts payable and human resources. |
Our restructuring plans do not include formal severance plans for employees affected by the closures and consolidations of underperforming business units or enhancements to administrative functions.
As of June 30, 2008, the estimated charges expected to be incurred and recognized in (loss) from continuing operations were as follows (thousands):
| | | | Estimated Charges | | | | | Recognized Six Months Ended June 30 2008 | | | Total Remaining | |
| Impairment of assets | | $ | 1,958 | | | | $ | 1,958 | | $ | — | |
| Operating lease obligations | | | 4,148 | | | | | 4,148 | | | | |
| | | $ | 6,106 | | | | $ | 6,106 | | $ | | |
Impairments of assets were determined based on available market data and are recognized in Impairment of assets. Operating lease obligations represent the present value of contractual rental payments offset by estimated sublease income and are recognized in Selling, general and administrative expenses.
Activity related to restructuring plans for the period ended June 30, 2008 was as follows (thousands):
| | | | Recognized Six Months Ended June 30 2008 | | | Cash Payments | | | Non-cash Charges | | | Reserve Balance at June 30 2008 | |
| Impairment of assets | | $ | 1,958 | | $ | | | $ | 1,958 | | $ | | |
| Operating lease obligations | | | 4,148 | | | | | | | | | 4,148 | |
| | | $ | 6,106 | | $ | | | $ | 1,958 | | $ | 4,148 | |
Due to uncertainties in the markets of certain business units and inherent in the estimation process, it is possible the actual costs of restructuring may vary from estimates. Revisions of these costs are recognized in the period such revisions are known.
Long-lived assets such as property, equipment and intangibles are evaluated for impairment whenever events and circumstances indicate the carrying amount may not be recoverable. An impairment for these assets is recognized if the carrying amount exceeds its fair value and when the carrying amount is not recoverable based on the estimated future operating cash flows on an undiscounted basis.
Similarly, goodwill is evaluated for impairment in the fourth quarter and whenever events and circumstances indicate the carrying amount may not be recoverable. An impairment for goodwill is recognized if the carrying amount is more than the estimated future operating cash flows as measured by fair value techniques.
As a result of our ongoing evaluations of underperforming business units, property and equipment, intangibles and goodwill specific to these business units were identified as impaired. The following impairments were recognized in (loss) from continuing operations for the second quarter of 2008:
| · | $6.2 million for certain customer relationships and covenants not to compete, |
| · | $1.3 million for leasehold improvements, |
| · | $0.7 million for certain property and equipment held for sale and |
| · | $0.3 million for goodwill. |
During the later portion of the fourth quarter of 2007, the leading sources of economic and housing data forecasted sharper reductions in housing starts. The rapid deterioration in housing forecasts and our operating performance resulted in significant revisions of our operating expectations underpinning the assumptions of recoverability of the carrying amount of customer relationships and goodwill. Additionally, our enterprise value reflected a significant reduction as investors considered negative perceptions of the future of the housing market and depressed the share values of housing related companies. For impairment testing, the fair values were determined based on estimates of enterprise value as well as the present value of estimated future operating cash flows. As a result, we determined the carrying amount of certain customer relationships and goodwill exceeded their respective estimated fair values and recognized the following impairments in (loss) from continuing operations for the fourth quarter of 2007:
| · | $30.0 million for certain customer relationships, |
| · | $242.0 million for goodwill and |
| · | $0.2 million for certain equipment. |
Continued deterioration in our markets could result in additional impairments of the carrying amount of intangibles and goodwill.
4. Discontinued Operations
The results of operations and financial position of discontinued operations are separately reported for all periods presented as a result of the following transactions:
| · | In June 2008, we discontinued concrete block masonry, concrete services and truss manufacturing in Florida. These business units represented approximately 6% of sales. |
| · | In March 2008, we discontinued framing services in Virginia. This business unit represented less than 1% of sales. |
| · | In September 2007, we sold three building materials distribution businesses in Western Colorado. The businesses were sold for $11.4 million consisting of $9.6 million cash and a $1.8 million note receivable and resulted in recognition of an initial gain of $3.7 million. In December 2007, the remaining real estate for one of these operations was sold for $17.6 million cash and resulted in recognition of a gain of $16.3 million. These business units represented approximately 1% of sales. |
Assets, liabilities, sales and income for these operations are separately reported from continuing operations and were as follows (thousands):
| | | June 30 | | December 31 | |
| | | 2008 | | 2007 | |
| Assets | | $ | 16,492 | | $ | 25,224 | |
| Liabilities | | $ | 7,854 | | $ | 8,533 | |
| | | Three Months Ended June 30 | | | | Year Ended December 31 | |
| | | 2008 | | 2007 | | 2008 | | 2007 | | 2007 | |
| Sales | | | | | | | | | | | |
| Building products | | $ | 792 | | $ | 12,060 | | $ | 1,278 | | $ | 21,408 | | $ | 33,955 | |
| Construction services | | $ | 13,068 | | $ | 28,967 | | $ | 25,274 | | $ | 62,549 | | $ | 101,649 | |
| | | | | | | | | | | | | | | | | |
Income (loss) from discontinued operations | | $ | 9,385 | | $ | 1,533 | | $ | 9,328 | | $ | 2,965 | | $ | (46,946 | ) |
5. Net (Loss) Income Per Share
Net (loss) income per share was determined using the following information (thousands, except per share data):
| | | Three Months Ended June 30 | | Six Months Ended June 30 | | Year Ended December 31 | |
| | | 2008 | | 2007 | | 2008 | | 2007 | | 2007 | |
| (Loss) income from continuing operations | | $ | (41,326 | ) | $ | 17,884 | | $ | (75,130 | ) | $ | 11,486 | | $ | (265,767 | ) |
| Income (loss) from discontinued operations | | | 9,385 | | | 1,533 | | | 9,328 | | | 2,965 | | | (46,946 | ) |
| Net (loss) income | | $ | (31,941 | ) | $ | 19,417 | | $ | (65,802 | ) | $ | 14,451 | | $ | (312,713 | ) |
| | | | | | | | | | | | | | | | | |
| Weighted average shares - basic | | | 29,135 | | | 28,807 | | | 28,998 | | | 28,788 | | | 28,807 | |
| Effect of dilutive: | | | | | | | | | | | | | | | | |
| Share options | | | — | | | 574 | | | — | | | 641 | | | — | |
| Restricted shares | | | — | | | 135 | | | — | | | 163 | | | — | |
Weighted average shares - assuming dilution | | | 29,135 | | | 29,516 | | | 28,998 | | | 29,592 | | | 28,807 | |
| | | | | | | | | | | | | | | | | |
| Net (loss) income per share: | | | | | | | | | | | | | | | | |
| Continuing operations | | | $(1.42 | ) | | $0.62 | | | $(2.59 | ) | | $0.40 | | | $ (9.23 | ) |
| Discontinued operations | | | 0.32 | | | 0.05 | | | 0.32 | | | 0.10 | | | (1.63 | ) |
| Basic | | | $(1.10 | ) | | $0.67 | | | $(2.27 | ) | | $0.50 | | | $(10.86 | ) |
| | | | | | | | | | | | | | | | | |
| Continuing operations | | | $(1.42 | ) | | $0.61 | | | $(2.59 | ) | | $0.39 | | | $ (9.23 | ) |
| Discontinued operations | | | 0.32 | | | 0.05 | | | 0.32 | | | 0.10 | | | (1.63 | ) |
| Diluted | | | $(1.10 | ) | | $0.66 | | | $(2.27 | ) | | $0.49 | | | $(10.86 | ) |
| | | | | | | | | | | | | | | | | |
| Cash dividends declared per share | | | $ — | | | $0.10 | | | $ — | | | $0.20 | | | $ 0.40 | |
Certain share options and restricted shares are excluded from the computation of diluted net (loss) income per share:
| · | options with exercise prices greater than the average market value of the common shares (options out-of-the-money) and |
| · | unrecognized compensation expense for restricted shares with after-tax proceeds greater than the average market value of the common shares. |
Options and restricted shares excluded from the computation of diluted net (loss) income per share will change based on additional grants as well as the average market value of the common shares for the period. These options and restricted shares that are not dilutive and therefore excluded from the computation of diluted net (loss) income per share were as follows (thousands, except share price data):
| | | | Three Months Ended June 30 | | | Six Months Ended June 30 | | | Year Ended December 31 | |
| | | | 2008 | | | 2007 | | | 2008 | | | 2007 | | | 2007 | |
| Average market value of shares | | | $3 | | | $15 | | | $4 | | | $18 | | | $14 | |
| Share options: | | | | | | | | | | | | | | | | |
| Exercise price range | | | $5 to $38 | | | $15 to $38 | | | $5 to $38 | | | $15 to $38 | | | $15 to $38 | |
| Not dilutive | | | 2,954 | | | 1,356 | | | 2,954 | | | 1,356 | | | 1,312 | |
| Restricted shares: | | | | | | | | | | | | | | | | |
| Grant price range | | | $15 to $42 | | | $17 to $42 | | | $15 to $42 | | | $34 to $42 | | | $34 | |
| Not dilutive | | | 289 | | | 309 | | | 289 | | | 137 | | | 2 | |
6. Acquisitions and Minority Interests
Acquisitions are accounted for under the purchase method of accounting. The purchase price is allocated to the assets acquired, including intangible assets, and liabilities assumed based on their estimated fair values at the date of acquisition. Subsequent to the initial allocation of purchase price, adjustments may be made to reflect the fair value of working capital and tangible assets. Any excess of the purchase price over the estimated fair value of the identifiable assets and liabilities acquired is recorded as goodwill. Operating results of acquired businesses are included in the consolidated statements of operations from the date of acquisition.
| · | In March 2007, we acquired a concrete services business in Fresno, California for approximately $0.7 million in cash. |
Minority interests reflects the other owners’ proportionate share in the assets and liabilities of business ventures as of the date of purchase, adjusted by the proportionate share of post-acquisition income or loss. As the operating results of entities with minority interests are consolidated, minority interests income represents the income or loss attributable to the other owners.
| · | In June 2008, we acquired the remaining 40% interest in SelectBuild Mechanical for $0.2 million in cash. In October 2004, we formed this venture for an initial 60% interest for $0.3 million in cash. SelectBuild Mechanical provides heating, ventilation and air conditioning services in Las Vegas, Nevada. |
| · | In January 2008, we were required to purchase the remaining 49% interest in SelectBuild Illinois (RCI Construction) for $8.3 million in cash of which $2.4 million was paid in January 2008 and $5.9 million was paid in July 2008. The fair value of SelectBuild Illinois does not exceed its net book value. As a result, the $5.5 million excess of the purchase price for the minority interest over the recorded amount for the minority interest in SelectBuild Illinois was recognized as an expense in Other income, net in December 2007. In January 2005, we acquired an initial 51% interest for $4.9 million in cash. SelectBuild Illinois provides framing services to production homebuilders in the greater Chicago area. |
| · | In September 2007, we acquired the remaining 49% interest in SelectBuild Trim for $0.5 million in cash. In January 2007, we formed this venture for an initial 51% interest for $0.5 million in cash. SelectBuild Trim provides door and molding installation services in Las Vegas, Nevada. |
| · | In September 2007, we acquired the remaining 49% interest in A-1 Building Components, LLC (A-1 Truss) for $5.0 million in cash. In September 2004, we acquired an initial 51% interest for $2.3 million in cash. A-1 Truss manufactures trusses in Fort Pierce, Florida. |
| · | In May 2007, we acquired the remaining 33% interest in SelectBuild Mid-Atlantic (WBC Mid-Atlantic) for no consideration pursuant to the operating agreement. In October 2003, we acquired an initial 67% interest for $5.1 million in cash and $0.2 million of our common shares. SelectBuild Mid-Atlantic provided framing services to production homebuilders in Delaware, Maryland and Virginia. |
| · | In April 2007, we acquired the remaining 27% interest in Riggs Plumbing for $10.5 million in cash. In July 2005, we acquired an additional 13% interest for $1.4 million in cash and in April 2005, acquired an initial 60% interest for $17.8 million in cash. Riggs Plumbing provides plumbing services to production homebuilders in the Phoenix and Tucson markets. |
Assets and liabilities acquired in acquisitions made in 2008 and 2007, including payments of amounts retained for settlement periods, were as follows (thousands):
| | | June 30 | | | December 31 | | | | June 30 | | | December 31 |
| | | 2008 | | | 2007 | | | | 2008 | | | 2007 |
| Receivables | $ | — | | $ | (21) | | Other accrued liabilities | $ | 5,928 | | $ | (60,787) |
| Prepaid expenses and other | | — | | | 18 | | | | | | | |
Current assets | | — | | | (3) | | Current liabilities | | 5,928 | | | (60,787) |
| | | | | | | | | | | | | |
| Property and equipment | | — | | | 216 | | Deferred income taxes | | — | | | (917) |
| Other intangibles, net | | — | | | 2,287 | | Minority interests | | (8,528) | | | (3,680) |
| Goodwill | | — | | | 13,077 | | | | | | | |
| | $ | — | | $ | 15,577 | | | $ | (2,600) | | $ | (65,384) |
Had the SelectBuild Mechanical acquisition in June 2008 and the SelectBuild Illinois acquisition in January 2008 taken place as of the beginning of 2007, pro forma results of operations would not have been significantly different from reported amounts.
7. Marketable Securities
Investments in marketable securities consist of debt securities held by our captive insurance subsidiary and are considered available-for-sale and recorded at fair value. Fair value is based on market quotes. Realized gains and losses are recognized in Other income, net based on specific identification. Unrealized gains and losses, net of deferred taxes, are recorded as a component of Accumulated other comprehensive loss, net, a component of shareholders’ equity. There were no significant unrealized losses.
The fair values of these marketable securities were as follows (thousands):
| | | June 30 | | December 31 | |
| | | 2008 | | 2007 | |
| U.S. government and agencies | | $ | 14,548 | | $ | 18,380 | |
| Asset backed securities | | | 10,975 | | | 9,798 | |
| Corporate securities | | | 14,146 | | | 13,733 | |
| | | $ | 39,669 | | $ | 41,911 | |
Contractual maturities were as follows (thousands):
| | | June 30 | | December 31 | |
| | | 2008 | | 2007 | |
| Less than 1 year | | $ | 787 | | $ | 1,872 | |
| Due in 1 to 2 years | | | 10,595 | | | 12,683 | |
| Due in 2 to 5 years | | | 28,287 | | | 27,356 | |
| | | $ | 39,669 | | $ | 41,911 | |
8. Intangible Assets and Goodwill
Intangible assets represent the values assigned to customer relationships, covenants not to compete, trade names and favorable leases. Intangible assets are amortized on a straight-line basis over their expected useful lives. Customer relationships are amortized over 3 to 10 years, covenants not to compete over 3 to 5 years and favorable leases over 2 to 5 years. Amortization expense for intangible assets was $5.4 million for the period ended June 30, 2008, $8.1 million for the period ended June 30, 2007 and $16.5 million for 2007. Intangible assets consist of the following (thousands):
| | | June 30, 2008 | |
| | | Gross Carrying Amount | | Accumulated Amortization | | Net Carrying Amount | |
| Customer relationships | | $ | 70,481 | | $ | (26,807 | ) | $ | 43,674 | |
| Covenants not to compete | | | 9,352 | | | (6,138 | ) | | 3,214 | |
| Favorable leases | | | 780 | | | (348 | ) | | 432 | |
| | | $ | 80,613 | | $ | (33,293 | ) | $ | 47,320 | |
| | | December 31, 2007 | |
| | | Gross Carrying Amount | | Accumulated Amortization | | Net Carrying Amount | |
| Customer relationships | | $ | 80,495 | | $ | (27,271 | ) | $ | 53,224 | |
| Covenants not to compete | | | 10,611 | | | (6,057 | ) | | 4,554 | |
| Trade names | | | 204 | | | (204 | ) | | — | |
| Favorable leases | | | 780 | | | (248 | ) | | 532 | |
| | | $ | 92,090 | | $ | (33,780 | ) | $ | 58,310 | |
Estimated amortization expense for intangible assets is $4.2 million for the remainder of 2008, $8.2 million for 2009, $7.5 million for 2010, $6.7 million for 2011, $6.4 million for 2012 and $14.3 million thereafter.
Goodwill represents the excess of the purchase price over the fair value of net tangible and identifiable intangible assets of acquired businesses. Adjustments to amounts previously reported as goodwill may occur as a result of completing the purchase price allocation to the assets acquired, including intangible assets, and liabilities assumed based on their estimated fair values at the date of acquisition.
An annual assessment for impairment is completed in the fourth quarter and whenever events and circumstances indicate the carrying amount may not be recoverable. An impairment is recognized at the reporting unit if the carrying amount is more than the estimated future operating cash flows as measured by fair value techniques.
Changes in the carrying amount of goodwill were as follows:
| | | | June 30 | | | December 31 | |
| | | | 2008 | | | 2007 | |
| Balance at beginning of period | | $ | 14,196 | | $ | 308,000 | |
| Purchase price adjustment | | | — | | | (182 | ) |
| Goodwill acquired | | | — | | | 13,259 | |
| Impairment | | | (310 | ) | | (306,881 | ) |
| Balance at end of period | | $ | 13,886 | | $ | 14,196 | |
While goodwill is tested for impairment annually and not amortized for financial statement purposes, goodwill may be deductible for income tax purposes. Certain goodwill is non-deductible. Changes to non-deductible goodwill were as follows (thousands):
| | | | June 30 | | | December 31 | |
| | | | 2008 | | | 2007 | |
| Balance at beginning of period | | $ | 3,460 | | $ | 41,362 | |
| Goodwill acquired | | | — | | | (4,656 | ) |
| Impairment | | | — | | | (33,246 | ) |
| Balance at end of period | | $ | 3,460 | | $ | 3,460 | |
9. Debt
Long-term debt consists of the following (thousands):
| As of June 30, 2008 | | | | | | | | | Notional | | | Effective Interest Rate | |
| | | | Balance | | | Stated Interest Rate | | | Amount of Interest Rate Swaps | | | Average for Quarter | | | As of June 30 | |
| Revolver | | $ | 39,000 | | | LIBOR plus 4.50% or Prime plus 2.50% and 0.50% commitment fee | | $ | — | | | 9.9 | % | | 8.3 | % |
| | | | | | | | | | | | | | | | | |
| Term note | | | 339,819 | | | LIBOR plus 4.50% or Prime plus 2.50% | | | 200,000 | | | 8.8 | % | | 8.9 | % |
| | | | | | | | | | | | | | | | | |
| Other | | | 2,418 | | | Various | | | — | | | — | | | — | |
| | | | 381,237 | | | | | $ | 200,000 | | | | | | | |
| | | | | | | | | | | | | | | | | |
| Less: Current portion | | | 379,991 | | | | | | | | | | | | | |
| | | $ | 1,246 | | | | | | | | | | | | | |
As of December 31, 2007 | | | | | | | | | Notional | | | Effective Interest Rate | |
| | | | Balance | | | Stated Interest Rate | | | Amount of Interest Rate Swaps | | | Average for Year | | | As of December 31 | |
| Revolver | | $ | — | | | LIBOR plus 1.50% or Prime plus 0.25% and 0.25% commitment fee | | $ | — | | | 8.8 | % | | n/a | |
| | | | | | | | | | | | | | | | | |
| Term note | | | 345,625 | | | LIBOR plus 2.50% or Prime plus 1.25% | | | 200,000 | | | 7.7 | % | | 7.5 | % |
| | | | | | | | | | | | | | | | | |
| Other | | | 3,235 | | | Various | | | — | | | — | | | — | |
| | | | 348,860 | | | | | $ | 200,000 | | | | | | | |
| | | | | | | | | | | | | | | | | |
| Less: Current portion | | | 4,923 | | | | | | | | | | | | | |
| | | $ | 343,937 | | | | | | | | | | | | | |
In February 2008, we entered into an amended credit facility with a group of lenders. The credit facility consists of a $200 million revolver and $350 million term note.
The $200 million revolver subject to borrowing base limitations matures in November 2011. The revolver consists of both LIBOR and Prime based borrowings. The variable interest rate for the revolver is LIBOR plus 4.50% or Prime plus 2.50%. Additionally, a commitment fee for the unused portion is 0.50%. Interest is paid quarterly. As of June 30, 2008, $39.0 million was outstanding under the revolver.
The effective interest rate is based on interest rates for the period as well as the commitment fee for the unused portion of the revolver.
Letters of credit outstanding that guaranteed performance or payment to third parties were $99.4 million as of June 30, 2008 and $106.7 million as of December 31, 2007. These letters of credit reduce the $200 million revolver committment. Borrowings under the revolver are limited to the lesser of:
| · | $84.3 million as determined by a borrowing base of certain accounts receivable less 50% of outstanding surety bonds, multiplied by 50%. |
Surety performance bonds guarantee performance to customers and vendors. As of June 30, 2008, the borrowing base available under the revolver was $84.3 million.
The $350 million term note matures in November 2011 and is payable in:
| · | quarterly installments of $0.9 million, |
| · | any net proceeds of more than $1 million resulting from certain dispositions and |
| · | remaining principal due in November 2011. |
The variable interest rate for the term note is LIBOR plus 4.50% or Prime plus 2.50%. Interest is paid quarterly. As of June 30, 2008, $339.8 million was outstanding under this term note.
Other long-term debt consists of term notes, equipment notes and capital leases for equipment. Interest rates vary and dates of maturity are through March 2021. As of June 30, 2008, other long-term debt was $2.4 million.
Covenants and Maturities
The February 2008 amended credit facility requires quarterly compliance with financial covenants including minimum net worth and minimum earnings before interest, taxes, depreciation and amortization as well as annual compliance with minimum interest coverage ratio. Operating results, particularly net income, are a primary factor for these covenants and our ability to comply with these covenants depends on our operating performance. The significant and ongoing correction in single-family housing starts has negatively impacted our operating performance.
Due to lower than planned operating performance, as of June 2008 we were not in compliance with the requirements for minimum net worth and minimum earnings before interest, taxes, depreciation and amortization. We obtained a temporary waiver of these financial covenants in August 2008 from our credit facility lenders. The agreement temporarily waives financial covenants until September 30, 2008 and limits borrowings under the revolver to $60 million. As of August 11, 2008, $29.2 million was outstanding under the revolver. Each lender approving the waiver was paid a waiver fee of 0.25% of their revolver commitment and their portion of the outstanding principal amount of the term note.
We are currently in negotiations with our lenders regarding a potential amendment to the terms of the credit facility. Negotiations include establishing financial covenants consistent with the current and foreseeable housing market conditions. There is no assurance these negotiations will result in an amendment acceptable to us and the lenders.
As the waiver for these financial covenants is less than a year and it is probable we will lack compliance with these financial covenants within the next year and given there is no amendment or other financing agreement currently in place, the revolver, term note and certain other debt are classified as a current liability in the consolidated balance sheet.
The February 2008 amended credit facility restricts our ability to incur additional indebtedness, pay dividends, repurchase shares, enter into mergers or acquisitions, use proceeds from equity offerings, make capital expenditures and sell assets. The amended credit facility is secured by all assets of our wholly-owned subsidiaries, except the assets of our captive insurance subsidiary.
In connection with the February 2008 amendment, 60% or $2.4 million of unamortized deferred loan costs related to the previous revolver were recognized as interest expense in the first quarter of 2008. We also incurred approximately $4.9 million of fees in connection with the amendment and these costs will be amortized over the remaining term of our credit facility.
An amendment of our credit facility or alternate financing may result in the recognition of certain unamortized deferred loan costs in the period an agreement is reached. Fees incurred in connection with an amendment or alternate financing will be amortized over the remaining term of the financing arrangement.
Scheduled maturities of long-term debt are as follows (thousands):
| 2008 | | $ | 379,809 | |
| 2009 | | | 326 | |
| 2010 | | | 228 | |
| 2011 | | | 62 | |
| 2012 | | | 65 | |
| Thereafter | | | 747 | |
| | | $ | 381,237 | |
Hedging Activities
In November 2006, we entered into interest rate swap contracts that effectively convert $200 million of variable rate borrowings to a fixed interest rate of 9.6% through November 2012, thus reducing the impact of increases in interest rates on future interest expense. Approximately 59% of the outstanding variable rate borrowings have been hedged through the designation of interest rate swap contracts accounted for as cash flow hedges. After giving effect to the interest rate swap contracts, total borrowings were 53% fixed and 47% variable. Management may choose not to swap variable rates to fixed rates or may terminate a previously executed swap if the variable rate positions are more beneficial.
The fair value of the interest rate swap contracts was a liability of $8.1 million and no corresponding deferred tax asset was recorded as of June 30, 2008. A corresponding deferred tax asset for the fair value of the interest rate swap liability was not recorded as there may be an inability to utilize this deferred tax asset.
The interest rate swap contracts contain provisions that require compliance with the credit facility. In the event there is a lack of compliance with these provisions, the counterparties to the interest rate swap contracts may request immediate payment of liability positions. As we were not in compliance with the financial covenant requirements of the amended credit facility for the period ended June 30, 2008, the fair value of the interest rate swap contracts of $8.1 million was classified as a current liability in the consolidated balance sheet.
The fair value and gains and losses on interest rate swap contracts are as follows (thousands):
| | | June 30, 2008 | | December 31, 2007 | |
| | | Balance sheet Classification | | Fair Value | | Balance sheet Classification | | Fair Value | |
Interest rate swap contracts | | | Other accrued liabilities | | $ | 8,108 | | | Other long-term liabilities | | $ | 8,553 | |
The effect of interest rate swap contracts on the consolidated statement of operations is as follows (thousands):
| | | Gain (Loss) Recognized in Accumulated Other Comprehensive Income (Loss), Net | |
| | | Three Months Ended June 30 | | Six Months Ended June 30 | | Year Ended December 31 | |
| | | 2008 | | 2007 | | 2008 | | 2007 | | 2007 | |
| Cash Flow Hedging Relationships: | | | | | | | | | | | |
| Interest rate swap contracts | | $ | 8,866 | | $ | 4,542 | | $ | 446 | | $ | 3,691 | | $ | (7,673 | ) |
| | | Loss (Gain) Reclassified from Accumulated Other Comprehensive Income (Loss), Net | |
| | | Three Months Ended June 30 | | Six Months Ended June 30 | | Year Ended December 31 | |
| | | 2008 | | 2007 | | 2008 | | 2007 | | 2007 | |
| Statement of Operations Location: | | | | | | | | | | | |
| Interest expense | | $ | 1,208 | | $ | (134 | ) | $ | 1,349 | | $ | (272 | ) | $ | (465 | ) |
10. Shareholders’ Equity
Preferred Shares
We are authorized to issue 2 million preferred shares, however none of these shares are issued. Under the terms of our Restated Certificate of Incorporation, the Board of Directors is authorized to determine or alter the rights, preferences, privileges and restrictions of the preferred shares.
Common Shares
Our common shares have a par value of $0.001. We have 50 million shares authorized of which 29.5 million are issued and outstanding as of June 30, 2008.
Of the unissued shares, 3.5 million shares were reserved for the following:
| Employee Stock Purchase Plan | | | 1.6 million | |
| 2008 Stock Incentive Plan | | | 1.9 million | |
Dividends
Cash dividends per common share were as follows:
| | | 2008 | | 2007 | |
| First quarter | | | $— | | | $0.10 | |
| Second quarter | | | — | | | 0.10 | |
| Third quarter | | | — | | | 0.10 | |
| Fourth quarter | | | — | | | 0.10 | |
| | | | $— | | | $0.40 | |
Our credit facility, amended in February 2008, prohibits the payment of cash dividends on our common shares. The determination of future dividend payments (cash or shares) will depend on many factors, including credit facility restrictions, financial position, results of operations and cash flows.
Repurchase Program
In March 2007, our Board of Directors authorized the repurchase of up to $25 million of our common shares through March 2008. The repurchase program expired in March 2008 with no repurchases.
Our credit facility, amended in February 2008, prohibits the repurchase of our common shares. The determination of future share repurchases will depend on many factors, including credit facility restrictions, financial position, results of operations and cash flows.
11. Employee Benefit Plans
Retirement Plans
· Savings and Retirement Plan
We provide a savings and retirement plan for salaried and certain hourly employees whereby eligible employees may contribute a percentage of their earnings to a trust. Participants may defer 1% to 50% of their eligible compensation (base salary, annual incentive and long-term incentives) subject to the limitations imposed under the Internal Revenue Code.
Our matching contributions range from 50% of the first 6% to 25% of the first 4% of the participant’s contribution. Matching contributions are established at the discretion of the Compensation Committee of our Board of Directors in the first quarter. Vesting in matching contributions occurs at the rate of 20% per year of service, upon reaching age 65, or upon death, disability or certain other circumstances. Matching contributions of $1.7 million for the period ended June 30, 2008, $2.4 million for the period ended June 30, 2007 and $4.5 million for 2007 were made to the trusts based on a percentage of the contributions made by participants.
Participants may direct their contributions and matching contributions through any of the investment options offered, including self-directed brokerage accounts. Investment options are reviewed and may be revised quarterly by an Investment Committee comprised of management and advised by consultants.
· Executive Deferred Compensation
We provide a deferred compensation plan for directors, executives and key employees. The objective of the plan is to provide executives and key employees with an additional opportunity to save for their retirement. Executive and key employee participants may defer up to 80% of their eligible compensation (base salary, annual incentive and medium term incentives). Director participants may defer 100% of their compensation.
There are no minimum or guaranteed returns. Participants may elect distribution upon reaching a specific age, number of years or separation of service. Distributions may be a lump sum payment or monthly installments over 5 to 10 years.
Matching contributions are the same as the savings and retirement plan matching contribution percentage. Matching contributions are established at the discretion of the Compensation Committee of our Board of Directors in the first quarter. Matching contributions of an insignificant amount for the period ended June 30, 2008, $0.2 million for the period ended June 30, 2007 and $0.4 million for 2007 were made to the trust based on a percentage of the contributions made by participants.
Investments of the deferred compensation plan are held in a custodial account and the assets are subject to the claims of general creditors. Participants may elect to invest their deferred compensation through any of the investment options offered, including our common shares. Investment options are reviewed and may be revised quarterly by an Investment Committee comprised of management and advised by consultants.
| · | Compensation deferred and invested in third-party investment options is recorded in Other long-term assets and Other long-term liabilities. As the investment is settled for the value of the underlying investments, changes in the fair value of the investments are recognized in Other income and changes in the fair value of the liability are recognized in Selling, general and administrative expenses. Fair value is based on market quotes. The fair value of these investments was $8.2 million at June 30, 2008 and $13.5 million at December 31, 2007. |
| · | Compensation deferred and invested in our common shares is recorded as a component of shareholders’ equity. As the investment is settled for the fixed number of common shares purchased, changes in fair value are not recognized. Rather purchases and distributions of the common shares are recorded at historical cost. The historical cost of these common shares was $1.3 million or 131,976 common shares at June 30, 2008 and $1.4 million or 105,189 common shares at December 31, 2007. |
· Supplemental Retirement
Additionally, there is a supplemental retirement plan for executives and key employees. The objective of the plan is to provide a supplemental retirement benefit that enables participants to retire at age 65 with 30 years of service at an income level of at least 60% of pre-retirement base salary after considering deferred compensation, predecessor retirement and social security benefits.
Contributions have typically been 5.5% of net income. Contributions are allocated proportionately to participants based on their base salaries and limited to 30% of a participant’s base salary.
| · | 65% of the contributions are invested in company-owned life insurance polices for certain participants. |
| · | 35% of the contributions are made in our common shares and distributed to the savings and retirement plans of certain participants. |
Active participants invested in company-owned life insurance policies receive a return based on long-term corporate bond yields. This return has been approximately 6% and may vary based on changes to this yield. Inactive participants receive a return of 0% to 9% based on their years of service and payment elections. Participants receiving our common shares receive a return of any related dividend.
Contributions and the return are established at the discretion of the Compensation Committee of our Board of Directors in the first quarter. Participants are immediately vested in the contribution. Other than the contributions required by employment agreements of certain executives, the Compensation Committee decided to make no contributions to participants for 2007. Contributions required by employment agreements as well as the return, were insignificant for the period ended June 30, 2008, $1.9 million for the period ended June 30, 2007 and $2.7 million for 2007.
The cash surrender value of the company-owned life insurance policies approximates the obligation, however the returns, if any, are not fully funded as these returns are dependent upon years of service and payment elections. These life insurance policies fund the obligation to the participants or their beneficiaries over a 5, 10 or 15-year period.
· Management Retention Compensation
In February 2008, the Compensation Committee of our Board of Directors approved management retention agreements for certain executives and key employees. Participants receive common share equivalent units which may be exchanged for the market value of those shares upon vesting two years from the date of grant. Compensation expense recognized for these agreements was $0.1 million for the period ended June 30, 2008.
Employee Stock Purchase Plan
In February 2008, our Board of Directors adopted the Employee Stock Purchase Plan, as approved by our shareholders in May 2008. The plan amended an employee share purchase plan originally effective October 2000. The plan permits eligible employees to purchase common shares through payroll deductions of up to 10% of an employee’s compensation limited to $25,000 each year. The purchase price of the shares is 85% or more of the lowest market price on either the first or last day of each three month period ending January, April, July and October. A total of 2 million shares were authorized for issuance, however 0.4 million shares were issued under the previous employee share purchase plan resulting in 1.6 million shares remaining available for this plan. Compensation expense recognized was insignificant for the period ended June 30, 2008, $0.1 million for the period ended June 30, 2007 and $0.2 million for 2007.
Incentive and Performance Plans
In February 2008, our Board of Directors adopted the 2008 Stock Incentive Plan, as approved by our shareholders in May 2008. A total of 2 million shares were reserved for issuance under the plan. Unissued shares were 1.9 million as of June 30, 2008.
Employees and non-employee directors are eligible to receive awards at the discretion of the Compensation Committee. Options, appreciation rights, restricted shares, other share-based awards and non-discretionary awards may be granted under these plans.
Options
| · | Grants of options under the 2008 Stock Incentive Plan vest ratably over a maximum of 5 years from the date of grant and expire after 10 years if unexercised. Under certain circumstances, some or all of the options may vest earlier. Options are to be awarded with exercise prices equal to the closing share price of our common shares on the date of grant. |
| · | Grants of options under the 2004 Incentive and Performance Plan vest ratably over 3 to 4 years from the date of grant and expire after 7 years if unexercised. Under certain circumstances, some or all of the options may vest earlier. Options were awarded with exercise prices equal to the closing share price of our common shares on the date of grant. No further grants will be made under this plan. |
| · | Grants of options under the 2000 Stock Incentive Plan vest ratably through the end of the fourth year from the date of grant and expire after 10 years if unexercised. Under certain circumstances, some or all of the options may vest earlier. Options were awarded with exercise prices equal to the closing share price of our common shares on the date of grant. No further grants will be made under this plan. |
With the adoption of Statement of Financial Accounting Standards No. 123 (Revised 2004), Share-Based Payment, in 2006, compensation expense is recognized over the requisite service period for all share-based awards granted after the date of adoption as well as awards unvested on the date of adoption. Additionally, tax benefits for share-based compensation payments are reported as a financing activity. Share-based compensation expense includes the fair value of share options, restricted shares and share awards.
The fair value of each option was estimated on the date of grant using the modified Black-Scholes-Merton model. The following table presents the weighted average assumptions used in the valuation and the resulting fair value:
| | Six Months Ended June 30 | | Year Ended December 31 |
| | 2008 | | 2007 | | 2007 |
| Expected term (years) | — | | 5.2 | | 5.2 |
| Expected volatility | — | | 54.5% | | 54.5% |
| Expected dividend yield | — | | 2.0% | | 2.0% |
| Risk-free interest rate | — | | 4.5% | | 4.5% |
| Exercise price | — | | $18 | | $18 |
| Weighted average fair value | — | | $8 | | $8 |
These assumptions are based principally on historical experience. Due to uncertainties inherent in these assumptions, it is possible that actual share-based compensation may vary from the estimate of the fair value of these options.
Activity for option awards was as follows (thousands, except per share data):
| | | Six Months Ended June 30 | | Six Months Ended June 30 | | Year Ended December 31 | |
| | | 2008 | | 2007 | | 2007 | |
| | | Shares | | Weighted Average Exercise Price | | Weighted Average Remaining Contractual Term (years) | | Shares | | Weighted Average Exercise Price | | Shares | | Weighted Average Exercise Price | |
Outstanding at beginning of the period | | | 2,978 | | $15 | | | 4.5 | | | 2,521 | | $14 | | | 2,521 | | $14 | |
| Granted | | | — | | $— | | | | | | 541 | | $18 | | | 541 | | $18 | |
| Exercised | | | (1 | ) | $6 | | | | | | (26 | ) | $6 | | | (33 | ) | $6 | |
| Forfeited | | | (23 | ) | $29 | | | | | | (5 | ) | $29 | | | (51 | ) | $28 | |
Outstanding at end of the period | | | 2,954 | | $15 | | | 4.0 | | | 3,031 | | $15 | | | 2,978 | | $15 | |
| | | | | | | | | | | | | | | | | | | | |
Exercisable at end of the period | | | 2,454 | | $13 | | | 3.6 | | | 2,034 | | $11 | | | 2,079 | | $11 | |
| | | Six Months Ended June 30 | | Year Ended December 31 | |
| | | 2008 | | 2007 | | 2007 | |
| Weighted average grant-date fair value | | | $— | | | $8 | | | $8 | |
| Intrinsic value of options exercised | | | $1 | | | $276 | | | $299 | |
| Fair value of options vested | | | $4,505 | | | $4,505 | | | $4,665 | |
The intrinsic value (the difference between our share price on the date of exercise and the exercise price) for options exercised represents the value received by option holders that exercised their options.
As of June 30, 2008, option awards outstanding and exercisable were as follows (thousands, except per share data):
| | | Options Outstanding | | Options Exercisable | |
Exercise Price | | Shares | | Weighted Average Exercise Price | | Intrinsic Value | | Weighted Average Remaining Contractual Life (years) | | Shares | | Weighted Average Exercise Price | | Intrinsic Value | |
| $5 | | | 534 | | | $5 | | | | | | 2.0 | | | 534 | | | $5 | | | | |
| $7 | | | 597 | | | $7 | | | | | | 4.2 | | | 597 | | | $7 | | | | |
| $8 | | | 200 | | | $8 | | | | | | 5.6 | | | 200 | | | $8 | | | | |
| $9 | | | 332 | | | $9 | | | | | | 2.8 | | | 332 | | | $9 | | | | |
| $17 to $18 | | | 520 | | | $18 | | | | | | 5.7 | | | 135 | | | $18 | | | | |
| $23 | | | 409 | | | $23 | | | | | | 3.6 | | | 409 | | | $23 | | | | |
| $38 | | | 362 | | | $38 | | | | | | 4.4 | | | 247 | | | $38 | | | | |
| | | | 2,954 | | | $15 | | | | | | | | | 2,454 | | | $13 | | | | |
| In-the-money: | | | | | | | | | | | | | | | | | | | | | | |
| Outstanding | | | — | | | | | | $— | | | | | | | | | | | | | |
| Exercisable | | | | | | | | | | | | | | | — | | | | | | $— | |
The intrinsic value (the difference between our share price on the last day of trading in June 2008 and the exercise price) for in-the-money options, represents the value that would have been received by option holders had they exercised their options. These values change based on the fair market value of our shares.
The fair value of compensation expense recognized for options was $1.8 million for the period ended June 30, 2008, $2.6 million for the period ended June 30, 2007 and $5.2 million for 2007. Options are not included in the calculation of basic income per share, however options are included in the calculation of diluted income per share.
As of June 30, 2008, there was $4.0 million of unrecognized compensation expense related to these options. This is recognized as the requisite services are rendered and is expected to be recognized ratably through March 2011.
Options exercised are settled with newly issued common shares.
Restricted Shares
Grants of restricted shares vest 3 years from the date of grant. Under certain circumstances, some or all of the restricted shares may vest earlier. The fair value of restricted shares is the closing share price of our common shares on the date of grant. Compensation expense is recognized over the vesting period.
Activity for restricted share awards was as follows (thousands, except per share data):
| | | Six Months Ended June 30 | | Year Ended December 31 | |
| | | 2008 | | 2007 | | 2007 | |
| | | Shares | | Weighted Average Grant Date Fair Value | | Shares | | Weighted Average Grant Date Fair Value | | Shares | | Weighted Average Grant Date Fair Value | |
Nonvested at beginning of the period | | | 410 | | | $26 | | | 396 | | | $24 | | | 396 | | | $24 | |
| Granted | | | — | | | $— | | | 172 | | | $18 | | | 172 | | | $18 | |
| Vested | | | (112 | ) | | $23 | | | (122 | ) | | $11 | | | (142 | ) | | $11 | |
| Forfeited | | | (9 | ) | | $33 | | | (2 | ) | | $38 | | | (16 | ) | | $30 | |
Nonvested at end of the period | | | 289 | | | $27 | | | 444 | | | $25 | | | 410 | | | $26 | |
| | | Six Months Ended June 30 | | Year Ended December 31 | |
| | | 2008 | | 2007 | | 2007 | |
| Weighted average grant-date fair value | | | $— | | | $18 | | | $18 | |
| Fair value of restricted shares granted | | | $— | | | $3,087 | | | $3,005 | |
| Fair value of restricted shares vested | | | $2,573 | | | $1,316 | | | $1,556 | |
The fair value of compensation expense recognized for restricted shares was $1.2 million for the period ended June 30, 2008, $1.7 million for the period ended June 30, 2007 and $3.3 million for 2007. Restricted shares are not included in the calculation of basic income per share until these shares vest, however restricted shares are included in the calculation of diluted income per share.
As of June 30, 2008, there was $2.6 million of unrecognized compensation expense related to these restricted shares. This is recognized as the requisite services are rendered and is expected to be recognized ratably through March 2010.
Shares
We issue shares to non-employee directors of our Board of Directors for their services. These shares vest immediately, however trading is restricted for 1 year from the date of grant. We issued 99,200 shares in May 2008 and recognized compensation expense of $0.2 million for the period ended June 30, 2008, $0.2 million for the period ended June 30, 2007 and $0.4 million for 2007.
The following table summarizes equity compensation information as of June 30, 2008 (thousands, except per share data):
| | | Number of Securities to be Issued Upon Exercise of Outstanding Options, Warrants and Rights | | Weighted Average Exercise Price of Outstanding Options, Warrants and Rights | | Number of Securities Remaining Available for Future Issuance Under Equity Compensation Plans | |
Equity compensation plans approved by security holders | | | 3,243 | | | $13 | | | 1,901 | |
Equity compensation plans not approved by security holders | | | — | | | — | | | — | |
| Total | | | 3,243 | | | $13 | | | 1,901 | |
Share-based compensation expense is included in Selling, general and administrative expenses since it is incentive compensation issued primarily to our executives and senior management. Share-based compensation expense for options, restricted shares and share awards was $3.3 million for the period ended June 30, 2008, $4.5 million for the period ended June 30, 2007 and $8.9 million for 2007.
12. Income Taxes
The asset and liability method is used to account for income taxes. Under this method, deferred tax assets and liabilities are recognized for tax credits and for the future tax consequences attributable to differences between the financial statement carrying amounts of existing assets and liabilities and their tax bases. Deferred tax assets and liabilities are measured using enacted tax rates expected to apply to taxable income in the years in which those temporary differences are expected to be recovered or settled. A valuation allowance is recognized to reduce the carrying amounts of deferred tax assets unless it is more likely than not these assets will be realized.
Our income tax compliance is periodically examined by various taxing authorities. Our tax returns for 2005 are under examination and 2007 through 2003 are open for future examination. We believe the ultimate results of examinations, if any, will not have an adverse affect on our financial condition, results of operations or cash flows. Revisions of estimated tax liabilities are reflected in the period such revisions are known.
Income tax (expense) benefit and effective rates were as follows (in thousands):
| | | Six Months Ended June 30 | | Year Ended December 31 | |
| | | 2008 | | 2007 | | 2007 | |
| | | | | Effective Rate | | | | Effective Rate | | | | Effective Rate | |
| Continuing operations: | | | | | | | | | | | | | |
| Income tax (expense) benefit | | $ | (3,392 | ) | | (4.7 | )% | $ | (4,783 | ) | | (29.4 | )% | $ | 25,670 | | | 8.8 | % |
| Discontinued operations: | | | | | | | | | | | | | | | | | | | |
| Income tax benefit (expense) | | $ | 21,248 | | | 178.3 | % | $ | (1,813 | ) | | (37.9 | )% | $ | (4,990 | ) | | (11.9 | )% |
The significant change in our effective tax rate for continuing operations was the result of uncertainty of our ability to realize deferred tax assets. Deferred tax assets resulted from operating losses and impairments, however valuation allowances were recognized due to the potential inability to realize these deferred tax assets. In assessing the ability to realize deferred tax assets, management considers whether it is more likely than not that some portion or all of the deferred tax assets will not be realized. The ultimate realization of deferred tax assets is dependent upon the generation of future taxable income during the periods in which those temporary differences become deductible. The scheduled reversal of deferred tax liabilities, loss carryback and carryforward abilities, projected future taxable income, tax planning strategies, cumulative earnings and our industry are considered in making this assessment.
Our ability to realize the deferred tax assets could change if estimates of future taxable income change. To the extent taxable income is generated in future periods, these tax benefits will be realized and reduce our future effective tax rate.
A significant income tax benefit was recognized for discontinued operations for the period ended June 30, 2008 as closure of these operations resulted in realization of the tax benefit of the discontinued operation’s impairment recognized in prior periods as well as a tax benefit for the taxable loss from operations.
The tax benefit associated with exercised options and vested restricted shares increased taxes receivable $0.3 million for the period ended June 30, 2008, reduced taxes payable $0.8 million for the period ended June 30, 2007 and increased taxes receivable $0.9 million for 2007. The tax impact for the difference between the fair value and the exercised value for options exercised and the difference between the grant-date value and vest-date value for vested restricted shares is recognized in additional paid-in capital, a component of shareholders’ equity.
13. Financial Instruments
The estimated fair values of cash and cash equivalents, receivables, unbilled receivables, accounts payable and accruals are the same as their carrying amounts due to their short-term nature. After giving effect to the interest rate swap contracts, the interest for our debt is 53% fixed and 47% variable. Based on current interest rates for similar obligations with like maturities, the estimated market value of our debt was:
| · | $7.5 million more than the amount of debt reported on the consolidated balance sheet at June 30, 2008 and |
| · | $7.7 million more than the amount of debt reported on the consolidated balance sheet at December 31, 2007. |
Changes in interest rates expose us to financial market risk. We currently utilize interest rate swap contracts to hedge variable interest rates. The interest rate swap contracts effectively convert $200 million of variable rate debt to a fixed interest rate of 9.6% through November 2012. Changes in the fair value of the interest rate swap contracts are recorded as Accumulated other comprehensive loss, net, a separate component of shareholders’ equity, and are subsequently reclassified into interest expense as interest expense is recognized on the term note.
Derivative financial instruments are not utilized to hedge other risks or for speculative or trading purposes.
14. Commitments and Contingencies
Legal Proceedings
We are involved in litigation and other legal matters arising in the normal course of business. In the opinion of management, the recovery or liability, if any, under any of these matters will not have a material effect on our financial position, results of operations or cash flows.
Operating Leases
We lease certain real property, vehicles and office equipment under operating leases. Expense for these operating leases was $15.0 million for the period ended June 30, 2008, $14.4 million for the period ended June 30, 2007 and $29.6 million for 2007.
Warranties
We provide limited warranties for certain construction services. Specific terms and conditions for warranties vary from 1 year to 10 years and are based on geographic market and state regulations. Factors for determining estimates of warranties include the nature and frequency of claims, anticipated claims and cost per claim. Estimated costs for warranties are recognized when the revenue associated with the service is recognized. Revisions of estimated warranties are reflected in the period such revisions are determined. Warranty activity is as follows (thousands):
| | | Three Months Ended June 30 | | Six Months Ended June 30 | | Year Ended December 31 | |
| | | 2008 | | 2007 | | 2008 | | 2007 | | 2007 | |
| Balance at beginning of the period | | $ | 6,517 | | $ | 6,988 | | $ | 6,805 | | $ | 7,081 | | $ | 7,081 | |
| Provision for warranties | | | 157 | | | 245 | | | 477 | | | 347 | | | 694 | |
| Warranty charges | | | (233 | ) | | (303 | ) | | (841 | ) | | (498 | ) | | (970 | ) |
| Balance at end of the period | | $ | 6,441 | | $ | 6,930 | | $ | 6,441 | | $ | 6,930 | | $ | 6,805 | |
15. Fair Values of Assets and Liabilities
Our assets and liabilities measured at fair value are grouped into three levels. The levels are based on the markets in which the assets and liabilities are traded and the reliability of the assumptions used to determine fair value. These levels are:
| · | Quoted Prices in Active Markets for Identical Assets - valuations for assets and liabilities traded in active exchange markets, such as the New York Stock Exchange. |
| · | Significant Other Observable Inputs - valuations for assets and liabilities traded in less active dealer or broker markets. For example, an interest rate swap contract is valued based on a model whose inputs are observable forward interest rate curves. Valuations are obtained from third party pricing services for identical or comparable assets or liabilities. |
| · | Significant Unobservable Inputs - valuations for assets and liabilities that are derived from other valuation methodologies, including discounted cash flow models and similar techniques, and are not based on market exchange, dealer, or broker traded transactions. Valuations incorporate certain assumptions and projections in determining fair value assigned to such assets or liabilities. |
The following assets and liabilities are measured at fair value on a recurring basis during the period (thousands):
| | | | | Fair Value Measurements at Reporting Date Using | |
| | | June 30 2008 | | Quoted Prices in Active Markets for Identical Assets | | Significant Other Observable Inputs | | Significant Unobservable Inputs | |
| Marketable securities | | $ | 39,669 | | $ | 39,669 | | $ | — | | $ | — | |
| Interest rate swap contracts | | | (8,108 | ) | | — | | | (8,108 | ) | | — | |
| | | $ | 31,561 | | $ | 39,669 | | $ | (8,108 | ) | $ | — | |
| | | | | Fair Value Measurements at Reporting Date Using | |
| | | December 31 2007 | | Quoted Prices in Active Markets for Identical Assets | | Significant Other Observable Inputs | | Significant Unobservable Inputs | |
| Marketable securities | | $ | 41,911 | | $ | 41,911 | | $ | — | | $ | — | |
| Interest rate swap contracts | | | (8,553 | ) | | — | | | (8,553 | ) | | — | |
| | | $ | 33,358 | | $ | 41,911 | | $ | (8,553 | ) | $ | — | |
Also, from time to time we may be required to measure certain other assets at fair value on a nonrecurring basis. These adjustments to fair value usually result from application of lower-of-cost or market accounting or write-downs of individual assets. For assets measured at fair value on a nonrecurring basis, the following table provides the amount, level of valuation assumptions used to determine each adjustment and the related realized losses (thousands):
| | | | | | | Fair Value Measurements Using | | | | |
| | | | December 31 2007 | | | Quoted Prices in Active Markets for Identical Assets | | | Significant Other Observable Inputs | | | Significant Unobservable Inputs | | | Year Ended December 31 2007 Gains (Losses) | |
| Other intangibles, net | | $ | 58,310 | | $ | — | | $ | — | | $ | 58,310 | | $ | (30,007 | ) |
| Goodwill | | | 14,196 | | | — | | | — | | | 14,196 | | | (241,958 | ) |
| | | $ | 72,506 | | $ | — | | $ | — | | $ | 72,506 | | $ | (271,965 | ) |
Other intangibles, net are evaluated for impairment whenever events and circumstances indicate the carrying amount may not be recoverable. An impairment for intangibles with finite useful lives is recognized if the carrying amount is not recoverable based on the estimated future operating cash flows on an undiscounted basis. Our intangibles are principally customer relationships. The present value of estimated future operating cash flows is utilized to determine fair value. Retention rates, margins and discount rates are significant inputs for determining the present value of estimated future cash flows.
| · | Other intangibles with a carrying amount of $88.3 million were written down to their implied fair value of $58.3 million, resulting in an impairment charge of $30.0 million in the fourth quarter of 2007. |
Goodwill is evaluated for impairment whenever events and circumstances indicate the carrying amount may not be recoverable. An impairment for goodwill is recognized if the carrying amount is more than the estimated future operating cash flows as measured by fair value techniques. The fair value techniques of enterprise value as well as the present value of estimated future operating cash flows are utilized. Market capitalization based on average common share price, debt and cash are significant inputs for determining enterprise value. An estimate of our weighted average cost of financing sources and future operating cash flows as derived from estimates of revenues, operating expenses and income taxes as well as working capital requirements and capital expenditures are significant inputs for determining the present value of estimated future operating cash flows.
| · | Goodwill with a carrying amount of $256.2 million was written down to its implied fair value of $14.2 million, resulting in an impairment charge of $242.0 million in the fourth quarter of 2007. |
16. Segment Information
The consolidated financial statements include operations from our six regional operating segments - Texas, California/Northern Nevada, Intermountain, Southwest, Northwest and Illinois. Each of these regions markets and sells building products, manufactures building components and provides construction services to professional builders and contractors. As a result and effective April 2008, these regional operations were aggregated and are one reportable segment. The current period presentation of one reportable segment does not require restatement of prior periods.
17. Quarterly Results of Operations
Operating results by quarter for 2008 and 2007 were as follows (thousands, except per share data):
| | | First | | Second | | Third | | Fourth | |
2008 | | | | | | | | | |
| Sales | | $ | 342,948 | | $ | 384,620 | | $ | — | | $ | — | |
| | | | | | | | | | | | | | |
Loss from continuing operations(1) | | $ | (33,804 | ) | $ | (41,326 | ) | $ | — | | $ | — | |
(Loss) income from discontinued operations(1) (2) | | | (57 | ) | | 9,385 | | | — | | | — | |
| Net loss | | $ | (33,861 | ) | $ | (31,941 | ) | $ | — | | $ | — | |
| | | | | | | | | | | | | | |
| Net (loss) income per share: | | | | | | | | | | | | | |
| Continuing operations | | | $(1.17 | ) | | $(1.42 | ) | | $— | | | $— | |
| Discontinued operations | | | — | | | 0.32 | | | — | | | — | |
| Diluted | | | $(1.17 | ) | | $(1.10 | ) | | $— | | | $— | |
| | | | | | | | | | | | | | |
| Common share prices: | | | | | | | | | | | | | |
| High | | | $7 | | | $5 | | | $— | | | $— | |
| Low | | | $4 | | | $2 | | | $— | | | $— | |
| | | | | | | | | | | | | | |
| Cash dividends declared per share | | | $— | | | $— | | | $— | | | $— | |
| | | | | | | | | | | | | | |
2007 | | | | | | | | | | | | | |
| Sales | | $ | 526,174 | | $ | 656,000 | | $ | 594,039 | | $ | 402,860 | |
| | | | | | | | | | | | | | |
(Loss) income from continuing operations(1) | | $ | (6,398 | ) | $ | 17,884 | | $ | 1,571 | | $ | (278,824 | ) |
Income (loss) from discontinued operations(1) (2) | | | 1,432 | | | 1,533 | | | 2,597 | | | (52,508 | ) |
| Net (loss) income | | $ | (4,966 | ) | $ | 19,417 | | $ | 4,168 | | $ | (331,332 | ) |
| | | | | | | | | | | | | | |
| Net (loss) income per share: | | | | | | | | | | | | | |
| Continuing operations | | | $(0.22 | ) | | $0.61 | | | $0.05 | | | $(9.63 | ) |
| Discontinued operations | | | 0.05 | | | 0.05 | | | 0.09 | | | (1.81 | ) |
| Diluted | | | $(0.17 | ) | | $0.66 | | | $0.14 | | | $(11.44 | ) |
| | | | | | | | | | | | | | |
| Common share prices: | | | | | | | | | | | | | |
| High | | | $25 | | | $18 | | | $15 | | | $12 | |
| Low | | | $18 | | | $13 | | | $11 | | | $5 | |
| | | | | | | | | | | | | | |
| Cash dividends declared per share | | | $0.10 | | | $0.10 | | | $0.10 | | | $0.10 | |
(1) Includes the following impairments:
| | | First | | Second | | Third | | Fourth | |
2008 | | | | | | | | | |
| Continuing operations | | | $— | | | $ 8,469 | | | $— | | | $— | |
| Discontinued operations | | | $— | | | $ 6,212 | | | $— | | | $— | |
| 2007 | | | | | | | | | | | | | |
| Continuing operations | | | $— | | | $— | | | $— | | | $272,152 | |
| Discontinued operations | | | $— | | | $— | | | $— | | | $ 64,922 | |
(2) Discontinued operations were as follows:
| · | concrete block masonry and concrete services in Florida in June 2008, |
| · | framing services in Virginia in March 2008 and |
| · | three Western Colorado building materials distribution businesses sold in September 2007. |
Item 2. Management’s Discussion and Analysis of Financial Condition and Results of Operations
Our Business
We are one of the largest providers of residential building products and construction services in the United States. Under the brand names of BMC West and SelectBuild, we serve the homebuilding industry through six regional operations: Texas, California/Northern Nevada, Intermountain, Southwest, Northwest and Illinois. In each of these regions we market and sell building products, manufacture building components and provide construction services to professional builders and contractors.
Our operations are located in metropolitan areas that have historically outpaced U.S. averages for residential building permit activity. We believe we are in homebuilding markets supported by positive long-term population growth, household formation and demographic trends.
Business Environment and Executive Overview
The national slump in the homebuilding industry experienced little relief in the second quarter of 2008. According to the U.S. Census Bureau, starts for single-family homes in June 2008 declined 5.3% from the preceding month to a seasonally adjusted annual rate of 647,000. Excluding the boom years of 2003-2006, single-family housing starts have averaged 1.1 million units per year since 1990.
The housing market is currently plagued by several negative factors including excess inventory levels, weak buyer demand, falling home prices, tighter lending standards and declining consumer confidence. To help bolster and provide stimulus to the contracting housing market, the federal government has recently passed legislation designed to increase confidence and stability in the housing and financial markets. The legislation is specifically targeted to provide relief to existing homeowners, incentives to first-time buyers, guidance to lenders and financial backing to vital government-sponsored lending institutions, such as Fannie Mae and Freddie Mac.
In response to these challenging economic and industry conditions, we have initiated the following changes within our organization:
| · | appointment of a chief operating officer to assume responsibility for the operations of our building product and construction service offerings, |
| · | streamlining of our organizational structure by reducing the previous 13 regions into 6 as well as realigning management functions, |
| · | closure and consolidation of the following underperforming business units: |
| o | discontinued framing services in Virginia, |
| o | discontinued block masonry, concrete services and truss manufacturing in Florida, |
| o | closure of millwork and building materials distribution facilities in Merced and Bakersfield, CA, |
| o | closure of concrete and framing services in Tucson, AZ, |
| o | closure of various underperforming trades within our operating regions and |
| o | exiting various facility operating leases. |
| · | integration and centralization of administrative functions at construction services facilities into our existing administrative support operations and |
| · | a 45% reduction in employees compared to the same period a year ago. |
Credit Facility
Due to lower than planned operating performance, as of June 2008 we were not in compliance with the financial covenants of our credit facility. Operating results, particularly net income, are a primary factor for these covenants and our ability to comply with these covenants depends on our operating performance. The significant and ongoing correction in single-family housing starts has negatively impacted our operating performance.
We obtained a temporary waiver of these financial covenants in August 2008 from our credit facility lenders. The agreement temporarily waives financial covenants until September 30, 2008 and limits borrowings under the revolver to $60 million. We are currently in negotiations with our lenders regarding a potential amendment to the terms of the credit facility. Negotiations include establishing financial covenants consistent with the current and foreseeable housing market conditions. There is no assurance these negotiations will result in an amendment acceptable to us and the lenders.
As we look ahead, it is difficult to predict the depth and duration of the current cyclical downturn in the homebuilding industry. We anticipate our financial condition, results of operations and cash flows will continue to be adversely affected during the downturn. However, we believe stabilization and recovery in the homebuilding industry will occur when the current supply imbalance is corrected and prospective buyer demand strengthens. In the near term, we are modifying our operations in an effort to improve profitability, minimize the financial impact during the downturn and position ourselves for growth when the industry recovers.
The following tables and subsequent discussions should be read in conjunction with the consolidated financial statements and the related notes in this Form 10-Q and our most recent Annual Report on Form 10-K.
RESULTS OF OPERATIONS
SECOND QUARTER OF 2008 COMPARED TO 2007
The following table sets forth the amounts and percentage relationship to sales of certain costs, expenses and income items (millions, except per share data):
| | | Three Months Ended June 30 | |
| | | 2008 | | 2007 | |
Sales | | | | | | | | | |
| Building products | | $ | 198 | | | 51.4 | % | $ | 279 | | | 42.5 | % |
| Construction services | | | 187 | | | 48.6 | | | 377 | | | 57.5 | |
Total sales | | | 385 | | | 100.0 | | | 656 | | | 100.0 | |
| | | | | | | | | | | | | | |
Costs and operating expenses | | | | | | | | | | | | | |
| Cost of goods sold | | | | | | | | | | | | | |
| Building products | | | 146 | | | 73.7 | | | 203 | | | 72.8 | |
| Construction services | | | 167 | | | 89.3 | | | 320 | | | 84.9 | |
| Impairment of assets | | | 8 | | | 2.1 | | | — | | | — | |
| Selling, general and administrative expenses | | | 99 | | | 25.7 | | | 107 | | | 16.3 | |
| Other income, net | | | (2 | ) | | (0.5 | ) | | (10 | ) | | (1.5 | ) |
| Total costs and operating expenses | | | 418 | | | 108.6 | | | 620 | | | 94.5 | |
| | | | | | | | | | | | | | |
(Loss) income from operations | | | (33 | ) | | (8.6 | ) | | 36 | | | 5.5 | |
| | | | | | | | | | | | | | |
| Interest expense | | | 9 | | | 2.3 | | | 10 | | | 1.5 | |
| | | | | | | | | | | | | | |
(Loss) income from continuing operations before income taxes and minority interests | | | (42 | ) | | (10.9 | ) | | 26 | | | 4.0 | |
| | | | | | | | | | | | | | |
| Income tax benefit (expense) | | | 1 | | | 0.3 | | | (8 | ) | | (1.3 | ) |
| Minority interests loss | | | — | | | — | | | — | | | — | |
(Loss) income from continuing operations | | | (41 | ) | | (10.6 | ) | | 18 | | | 2.7 | |
| | | | | | | | | | | | | | |
(Loss) income from discontinued operations prior to sale | | | (2 | ) | | (0.5 | ) | | 2 | | | 0.3 | |
| Impairment of assets | | | 6 | | | 1.6 | | | — | | | — | |
| Income tax benefit (expense) | | | 17 | | | 4.4 | | | (1 | ) | | (0.1 | ) |
Income from discontinued operations | | | 9 | | | 2.3 | | | 1 | | | 0.2 | |
| | | | | | | | | | | | | | |
Net (loss) income | | $ | (32 | ) | | (8.3 | )% | $ | 19 | | | 2.9 | % |
| | | | | | | | | | | | | | |
Net (loss) income per share: | | | | | | | | | | | | | |
| Continuing operations | | | $(1.42 | ) | | | | | $0.61 | | | | |
| Discontinued operations | | | 0.32 | | | | | | 0.05 | | | | |
| Diluted | | | $(1.10 | ) | | | | | $0.66 | | | | |
Consolidated Financial Results
Selected financial results were as follows (millions):
Sales and (Loss) Income from Operations
| | | 2008 | | 2007 | | % Change | |
Sales | | | | | | | |
| Building products | | $ | 198 | | $ | 279 | | | (29)% | |
| Construction services | | | 187 | | | 377 | | | (50)% | |
| | | $ | 385 | | $ | 656 | | | (41)% | |
| | | | | | | | | | | |
(Loss) income from operations | | $ | (33 | ) | $ | 36 | | | n/m | |
Sales decreased 41% to $385 million from $656 million in the same quarter a year ago. Sales of construction services were particularly lower. Consistent with the national weakness in new home construction, sales were lower in all our regions, especially California/Northern Nevada and the Southwest. According to the U.S. Census Bureau, single-family permits in our markets were down 49% whereas the U.S. overall was down 43% relative to the same quarter a year ago.
Loss from operations was $33 million compared to income of $36 million in the same quarter a year ago. The loss from operations was due to lower sales.
| · | Gross margins declined to 18.7% of sales from 20.3% in the same quarter a year ago. Margins for building products were slightly lower, while construction services declined 5.0%. Construction services margins were lower due to competitive market conditions resulting from a sharp decline in available contracts. |
| · | We recognized asset impairments of $8 million for customer relationships and leasehold improvements associated with the closure and consolidation of underperforming business units. |
| · | Selling, general and administrative expenses decreased 7% or $8 million from the same quarter a year ago. These expenses were lower due to a 26% reduction in employees and related expenses. Also included in selling, general and administrative expenses were $6 million in costs associated with exiting certain operating leases and other charges related to the closure and consolidation of underperforming business units. |
| · | As a percent of sales, selling, general and administrative expenses increased 9.4% to 25.7%. The increase was attributable to a sharp drop in construction services sales volume and a change in the sales mix to building products which carry higher selling, general and administrative expenses as well as costs associated with exiting certain operating leases and other charges related to the closure and consolidation of underperforming business units. |
| · | Other income was $8 million lower than the same quarter a year ago. The second quarter of 2007 included a pre-tax gain of $8 million for the sale of certain real estate associated with the relocation of a building materials operation in Texas. |
Income Taxes
Income tax benefit of $1 million was realized for continuing operations compared to an income tax expense of $8 million in the same quarter a year ago. The significant change in our effective tax rate for continuing operations was the result of uncertainty as to our ability to realize deferred tax assets. To the extent taxable income is generated in future periods, additional tax benefits may be realized and reduce our effective tax rate.
Discontinued Operations
In June 2008, and as a consequence of the significant and on-going correction in single-family home construction, we discontinued our concrete block masonry and concrete services business as well as our truss manufacturing business in Florida. Impairment of $6 million for customer relationships was also recognized. Closure of these operations resulted in the realization of a tax benefit of $17 million for intangible asset impairments recognized in the current and prior periods. These operations represented approximately 6% of sales.
SIX MONTHS OF 2008 COMPARED TO 2007
The following table sets forth the amounts and percentage relationship to sales of certain costs, expenses and income items (millions, except per share data):
| | | Six Months Ended June 30 | |
| | | 2008 | | 2007 | |
Sales | | | | | | | | | |
| Building products | | $ | 378 | | | 51.9 | % | $ | 520 | | | 44.0 | % |
| Construction services | | | 350 | | | 48.1 | | | 662 | | | 56.0 | |
Total sales | | | 728 | | | 100.0 | | | 1,182 | | | 100.0 | |
| | | | | | | | | | | | | | |
Costs and operating expenses | | | | | | | | | | | | | |
| Cost of goods sold | | | | | | | | | | | | | |
| Building products | | | 277 | | | 73.3 | | | 376 | | | 72.3 | |
| Construction services | | | 317 | | | 90.6 | | | 568 | | | 85.8 | |
| Impairment of assets | | | 8 | | | 1.1 | | | — | | | — | |
| Selling, general and administrative expenses | | | 183 | | | 25.1 | | | 215 | | | 18.2 | |
| Other income, net | | | (6 | ) | | (0.8 | ) | | (12 | ) | | (1.0 | ) |
| Total costs and operating expenses | | | 779 | | | 107.0 | | | 1,147 | | | 97.0 | |
| | | | | | | | | | | | | | |
(Loss) income from operations | | | (51 | ) | | (7.0 | ) | | 35 | | | 3.0 | |
| | | | | | | | | | | | | | |
| Interest expense | | | 21 | | | 2.9 | | | 18 | | | 1.6 | |
| | | | | | | | | | | | | | |
(Loss) income from continuing operations before income taxes and minority interests | | | (72 | ) | | (9.9 | ) | | 17 | | | 1.4 | |
| | | | | | | | | | | | | | |
| Income tax expense | | | 3 | | | 0.4 | | | 5 | | | 0.4 | |
| Minority interests income | | | — | | | — | | | (1 | ) | | (0.1 | ) |
(Loss) income from continuing operations | | | (75 | ) | | (10.3 | ) | | 11 | | | 0.9 | |
| | | | | | | | | | | | | | |
(Loss) income from discontinued operations prior to sale | | | (6 | ) | | (0.8 | ) | | 5 | | | 0.4 | |
| Impairment of assets | | | 6 | | | 0.8 | | | — | | | — | |
| Income tax benefit (expense) | | | 21 | | | 2.8 | | | (2 | ) | | (0.1 | ) |
Income from discontinued operations | | | 9 | | | 1.2 | | | 3 | | | 0.3 | |
| | | | | | | | | | | | | | |
Net (loss) income | | $ | (66 | ) | | (9.1 | )% | $ | 14 | | | 1.2 | % |
| | | | | | | | | | | | | | |
Net (loss) income per share: | | | | | | | | | | | | | |
| Continuing operations | | | $(2.59 | ) | | | | | $0.39 | | | | |
| Discontinued operations | | | 0.32 | | | | | | 0.10 | | | | |
| Diluted | | | $(2.27 | ) | | | | | $0.49 | | | | |
Consolidated Financial Results
Selected financial results were as follows (millions):
Sales and (Loss) Income from Operations
| | | 2008 | | 2007 | | % Change | |
Sales | | | | | | | |
| Building products | | $ | 378 | | $ | 520 | | | (27)% | |
| Construction services | | | 350 | | | 662 | | | (47)% | |
| | | $ | 728 | | $ | 1,182 | | | (38)% | |
| | | | | | | | | | | |
(Loss) income from operations | | $ | (51 | ) | $ | 35 | | | n/m | |
Sales decreased 38% to $728 million from $1.2 billion in the same period a year ago. Sales of construction services were particularly lower, declining 47% or $312 million. Sales were lower in all our regions, especially the Southwest and California/Northern Nevada. Building permits and contract starts in our markets were consistent with a 42% decline in single-family permits in the U.S. relative to the same period in 2007.
Loss from operations was $51 million compared to income of $35 million in the same period a year ago. The loss from operations was principally attributable to lower sales.
| · | Gross margins declined to 18.4% of sales from 20.1% in the same period a year ago. Lower gross margins resulted from competitive market conditions as construction services margins declined 5.2%. Building product margins were slightly lower than the same period a year ago. |
| · | We recognized asset impairments of $8 million for customer relationships and leasehold improvements associated with the closure and consolidation of underperforming business units. |
| · | Partially offsetting lower gross margins, selling, general and administrative expenses decreased 15% or $32 million from the same period a year ago. These expenses were lower due to reductions in employees and related expenses, including incentives. Also included in selling, general and administrative expenses were $6 million in costs associated with exiting certain operating leases and other charges related to the closure and consolidation of underperforming business units. |
| · | As a percent of sales, selling, general and administrative expenses increased 6.9% to 25.1%. The increase was a result of a substantial decline in sales volume and a change in the sales mix to building products which carry higher selling, general and administrative expenses as well as costs associated with exiting certain operating leases and other charges related to the closure and consolidation of underperforming business units. |
Interest Expense
Interest expense was 17% or $3 million more than the same period a year ago. The increase was principally due to the recognition of unamortized deferred loan costs in connection with the amendment of our credit facility in February 2008.
Income Taxes
Despite a loss from continuing operations compared to income in the same period a year ago, income tax expense was only $2 million less than 2007. This was due to a significant change in our effective tax rate for continuing operations as a result of uncertainty as to our ability to realize deferred tax assets. To the extent taxable income is generated in future periods, additional tax benefits may be realized and reduce our effective tax rate.
Discontinued Operations
In June 2008, and as a consequence of the significant and on-going correction in single-family home construction, we discontinued our concrete block masonry and concrete services business as well as our truss manufacturing business in Florida. Impairment of $6 million for customer relationships was also recognized. Closure of these operations resulted in the realization of a tax benefit of $17 million for intangible asset impairments recognized in the current and prior periods. These operations represented approximately 6% of sales.
In March 2008, we discontinued framing services in Virginia. These operations represented less than 1% of sales.
LIQUIDITY AND CAPITAL RESOURCES
Cash Flows
Historically, our primary need for capital resources was to fund working capital and acquisitions as well as finance capital expenditures. In the future we expect to fund working capital requirements and necessary capital expenditures with cash flow from operations and seasonal borrowings under our credit facility.
Due to lower than planned operating performance, as of June 2008 we were not in compliance with the financial covenants of our credit facility. Operating results, particularly net income, are a primary factor for these covenants and our ability to comply with these covenants depends on our operating performance. The significant and ongoing correction in single-family housing starts has negatively impacted our operating performance.
We obtained a temporary waiver of these financial covenants in August 2008. The agreement temporarily waives financial covenants until September 30, 2008 and limits borrowings under the revolver to $60 million. We are currently in negotiations with our lenders regarding a potential amendment to the terms of the credit facility. Negotiations include establishing financial covenants consistent with the current and foreseeable housing market conditions. There is no assurance these negotiations will result in an amendment acceptable to us and the lenders.
For the period ended June 30, 2008, cash was used for working capital requirements, capital expenditures, payments on the term note and financing costs. The sections that follow discuss in more detail our operating, investing and financing activities as well as our financing arrangements.
Operations
Operating activities used $20 million of cash compared to $38 million used in the same period a year ago. Net loss adjusted for non-cash items increased $48 million from the same period a year ago due to lower sales and reduced profitability as the result of the continued contraction of home construction. Our working capital requirements were $40 million less than the same period a year ago. Cash used for working capital requirements was $25 million compared to $65 million as working capital turnover declined and our cash conversion cycle extended from the same period a year ago as days sales outstanding increased, inventory turns slowed and days payable outstanding decreased.
Capital Investment and Acquisitions
Cash used in investing activities was $6 million or $68 million less than $74 million used in the same period a year ago. Cash used for investing activities reflected a $70 million reduction in acquisition expenditures. An initial installment of $3 million was paid for an $8 million purchase of a remaining minority interest in a framing services operation. Cash of $8 million was provided principally from the sale of building materials distribution facilities in Boulder, Colorado and Bakersfield, California as well as other equipment. Cash used for investing activities also included capital expenditures of $11 million or $5 million less than the same period a year ago. Capital expenditures were principally for relocation and expansion of materials distribution and component manufacturing facilities in Texas. Cash of $2 million net was provided from marketable securities pursuant to the statutory funding requirements of our captive insurance subsidiary.
Financing
Cash provided by financing activities was $22 million or $51 million less than $73 million provided in the same period a year ago. Borrowings under the revolver were $48 million less than the same period a year ago as cash for working capital requirements, capital expenditures, payments on the term note and financing costs for the amended credit facility were funded by proceeds from dispositions and existing cash.
Financing Arrangements
Our debt structure consists of a revolver, term note and other borrowings.
In February 2008, we entered into an amended credit facility with a group of lenders. The credit facility consists of a $200 million revolver and $350 million term note.
The $200 million revolver subject to borrowing base limitations matures in November 2011. The revolver consists of both LIBOR and Prime based borrowings. The variable interest rate for the revolver is LIBOR plus 4.50% or Prime plus 2.50%. Additionally, a commitment fee for the unused portion is 0.50%. Interest is paid quarterly. As of June 30, 2008, $39.0 million was outstanding under the revolver.
The effective interest rate is based on interest rates for the period as well as the commitment fee for the unused portion of the revolver.
Letters of credit outstanding that guaranteed performance or payment to third parties were $99.4 million as of June 30, 2008 and $106.7 million as of December 31, 2007. These letters of credit reduce the $200 million revolver committment. Borrowings under the revolver are limited to the lesser of:
| · | $84.3 million as determined by a borrowing base of certain accounts receivable less 50% of outstanding surety bonds, multiplied by 50%. |
Surety performance bonds guarantee performance to customers and vendors. As of June 30, 2008, the borrowing base available under the revolver was $84.3 million.
The $350 million term note matures in November 2011 and is payable in:
| · | quarterly installments of $0.9 million, |
| · | any net proceeds of more than $1 million resulting from certain dispositions and |
| · | remaining principal due in November 2011. |
The variable interest rate for the term note is LIBOR plus 4.50% or Prime plus 2.50%. Interest is paid quarterly. As of June 30, 2008, $339.8 million was outstanding under this term note.
Other long-term debt consists of term notes, equipment notes and capital leases for equipment. Interest rates vary and dates of maturity are through March 2021. As of June 30, 2008, other long-term debt was $2.4 million.
Covenants and Maturities
The February 2008 amended credit facility requires quarterly compliance with financial covenants including minimum net worth and minimum earnings before interest, taxes, depreciation and amortization as well as annual compliance with minimum interest coverage ratio. Operating results, particularly net income, are a primary factor for these covenants and our ability to comply with these covenants depends on our operating performance. The significant and ongoing correction in single-family housing starts has negatively impacted our operating performance.
Due to lower than planned operating performance, as of June 2008 we were not in compliance with the requirements for minimum net worth and minimum earnings before interest, taxes, depreciation and amortization. We obtained a temporary waiver of these financial covenants in August 2008 from our credit facility lenders. The agreement temporarily waives financial covenants until September 30, 2008 and limits borrowings under the revolver to $60 million. As of August 11, 2008, $29.2 million was outstanding under the revolver. Each lender approving the waiver was paid a waiver fee of 0.25% of their revolver commitment and their portion of the outstanding principal amount of the term note.
We are currently in negotiations with our lenders regarding a potential amendment to the terms of the credit facility. Negotiations include establishing financial covenants consistent with the current and foreseeable housing market conditions. There is no assurance these negotiations will result in an amendment acceptable to us and the lenders.
As the waiver for these financial covenants is less than a year and it is probable we will lack compliance with these financial covenants within the next year and given there is no amendment or other financing agreement currently in place, the revolver, term note and certain other debt are classified as a current liability in the consolidated balance sheet.
The February 2008 amended credit facility restricts our ability to incur additional indebtedness, pay dividends, repurchase shares, enter into mergers or acquisitions, use proceeds from equity offerings, make capital expenditures and sell assets. The amended credit facility is secured by all assets of our wholly-owned subsidiaries, except the assets of our captive insurance subsidiary.
In connection with the February 2008 amendment, 60% or $2.4 million of unamortized deferred loan costs related to the previous revolver were recognized as interest expense in the first quarter of 2008. We also incurred approximately $4.9 million of fees in connection with the amendment and these costs will be amortized over the remaining term of our credit facility.
An amendment of our credit facility or alternate financing may result in the recognition of certain unamortized deferred loan costs in the period an agreement is reached. Fees in connection with an amendment or alternate financing will be amortized over the remaining term of the financing arrangement.
Scheduled maturities of long-term debt are as follows (thousands):
| 2008 | | $ | 379,809 | |
| 2009 | | | 326 | |
| 2010 | | | 228 | |
| 2011 | | | 62 | |
| 2012 | | | 65 | |
| Thereafter | | | 747 | |
| | | $ | 381,237 | |
Hedging Activities
In November 2006, we entered into interest rate swap contracts that effectively convert $200 million of variable rate borrowings to a fixed interest rate of 9.6% through November 2012, thus reducing the impact of increases in interest rates on future interest expense. Approximately 59% of the outstanding variable rate borrowings have been hedged through the designation of interest rate swap contracts accounted for as cash flow hedges. After giving effect to the interest rate swap contracts, total borrowings were 53% fixed and 47% variable. Management may choose not to swap variable rates to fixed rates or may terminate a previously executed swap if the variable rate positions are more beneficial.
The fair value of the interest rate swap contracts was a liability of $8.1 million and no corresponding deferred tax asset was recorded as of June 30, 2008. A corresponding deferred tax asset for the fair value of the interest rate swap liability was not recorded as there may be an inability to utilize this deferred tax asset.
The interest rate swap contracts contain provisions that require compliance with the credit facility. In the event there is a lack of compliance with these provisions, the counterparties to the interest rate swap contracts may request immediate payment of liability positions. As we were not in compliance with the financial covenant requirements of the amended credit facility for the period ended June 30, 2008, the fair value of the interest rate swap contracts of $8.1 million was classified as a current liability in the consolidated balance sheet.
Equity
Repurchase Program
In March 2007, our Board of Directors authorized the repurchase of up to $25 million of our common shares through March 2008. The repurchase program expired in March 2008 with no repurchases.
Our credit facility amended in February 2008 prohibits the repurchase of our common shares. The determination of future share repurchases will depend on many factors, including credit facility restrictions, financial position, results of operations and cash flows.
OFF-BALANCE SHEET ARRANGEMENTS
As part of our ongoing business, we do not participate in transactions that generate relationships with unconsolidated entities or financial partnerships often referred to as structured finance or special purpose entities which might be established to facilitate off-balance sheet arrangements or other contractually narrow or limited purposes. As of June 30, 2008, we are not involved in any transactions with unconsolidated entities.
DISCLOSURES OF CONTRACTUAL OBLIGATIONS AND COMMERCIAL COMMITMENTS
Accelerated repayment of our revolver and term note may occur if certain financial conditions or warranties and representations are not met. The credit facility consists of the revolver and term note. The credit facility is secured by all the assets of our wholly-owned subsidiaries, except assets of our captive insurance subsidiary. Financial covenants under the credit facility require the maintenance of a minimum net worth, a minimum interest coverage ratio and minimum earnings before interest, taxes, depreciation and amortization. Lack of compliance with these covenants may accelerate the related scheduled maturities.
Due to lower than planned operating performance, as of June 2008 we were not in compliance with the financial covenants of our credit facility. We obtained a temporary waiver of these financial covenants in August 2008 from our credit facility lenders. The agreement temporarily waives financial covenants until September 30, 2008 and limits borrowings under the revolver to $60 million.
We are currently in negotiations with our lenders regarding a potential amendment to the terms of the credit facility. Negotiations include establishing financial covenants consistent with the current and foreseeable housing market conditions. There is no assurance these negotiations will result in an amendment acceptable to us and the lenders.
We have $99.4 million in letters of credit outstanding principally for the deductible portion of automobile, general liability and workers’ compensation claims. These obligations are not required to be recorded as liabilities on our balance sheet and renew automatically on their various anniversary dates or until released by their respective beneficiaries.
CRITICAL ACCOUNTING ESTIMATES
Preparing financial statements requires management to make estimates and assumptions that affect the reported amounts of assets, liabilities, revenues and expenses. These estimates and assumptions include critical accounting estimates which are defined by the Securities and Exchange Commission as those that are the most important to the portrayal of our financial condition, results of operations or cash flows. These estimates require management’s subjective and complex judgments often as a result of the need to estimate matters that are inherently uncertain. We review the development, selection and disclosure of these estimates with our Audit Committee. Management believes the estimates utilized are reasonable under the circumstances, however actual results could differ from these estimates and may require adjustment in future periods. Our critical accounting estimates are:
· Revenue Recognition for Construction Services
The percentage-of-completion method is used to recognize revenue for construction services. Periodic estimates of our progress towards completion are made based on a comparison of labor costs incurred to date with total estimated contract costs for labor. The percentage-of-completion method requires the use of various estimates, including among others, the extent of progress towards completion, contract revenues and contract completion costs. Contract revenues and contract costs to be recognized are dependent on the accuracy of estimates, including quantities of materials, labor productivity and other cost estimates. We have a history of making reasonable estimates of the extent of progress towards completion, contract revenues and contract completion costs. However, due to uncertainties inherent in the estimation process, it is possible that actual contract revenues and completion costs may vary from estimates. Revisions of contract revenues and cost estimates as well as provisions for estimated losses on uncompleted contracts are recognized in the period such revisions are known.
· Estimated Losses on Uncompleted Contracts and Changes in Contract Estimates
Estimated losses on uncompleted contracts and changes in contract estimates are established by assessing estimated costs to complete, change orders and claims for uncompleted contracts. Revisions of estimated losses are recognized in the period such revisions are known.
At June 30, 2008, the reserve for these estimated losses was $0.2 million. These reserves are established by assessing estimated costs to complete, change orders and claims. Assumptions for estimated costs to complete include material prices, labor costs, labor productivity and contract claims. Such estimates are inherently uncertain and therefore it is possible that actual completion costs may vary from these estimates. We have a history of making reasonable estimates of the extent of progress towards completion, contract revenue and contract completion costs. However, due to uncertainties inherent in the estimation process, it is possible that actual completion costs may vary from estimates.
· Goodwill
Goodwill represents the excess of purchase price over the fair values of net tangible and identifiable intangible assets of acquired businesses. An annual assessment for impairment is completed in the fourth quarter and whenever events and circumstances indicate the carrying amount may not be recoverable. An impairment is recognized if the carrying amount is more than the estimated future operating cash flows as measured by fair value techniques.
At June 30, 2008, goodwill was $13.9 million. The impairment assessment includes determining the estimated fair value of reporting units based on discounting the future operating cash flows using a discount rate reflecting our estimated average cost of funds. Future operating cash flows are derived from our annual plan and forecast information, which includes assumptions of future volumes, pricing of commodity products and labor costs. Prices for commodity products are inherently volatile. Due to the variables associated with prices of commodity products and the effects of changes in circumstances, both the precision and reliability of the estimates of future operating cash flows are subject to uncertainty. As additional information becomes known, we may change our estimates.
· Insurance Deductible Reserves
The estimated cost of automobile liability, general liability and workers’ compensation claims is determined by actuarial methods. Claims in excess of insurance deductibles are insured with third-party insurance carriers. Insurance deductible reserves for claims are recognized based on the estimated costs of these claims as limited by deductibles of the applicable insurance policies. Revisions to insurance deductible reserves for estimated claims are recognized in the period such revisions are known.
At June 30, 2008, the reserve for automobile, general liability and workers’ compensation claims was $48.5 million. The actuarial assessment includes determining the estimated cost of claims. The reserve for these claims is susceptible to change based on the estimated cost of the claims. Actual loss experience may differ substantially from the actuarial assumptions. Future reserves are subject to the nature and frequency of claims, medical cost inflation and changes in the insurance deductibles of the applicable insurance policies.
· Warranties
The estimated cost of warranties for certain construction services is based on the nature and frequency of claims, anticipated claims and cost per claim. Claims in excess of insurance deductibles are insured with third-party insurance carriers. Estimated costs for warranties are recognized when the revenue associated with the service is recognized. Revisions of estimated warranties are recognized in the period such revisions are known.
At June 30, 2008, the reserve for warranties was $6.4 million. Specific terms and conditions for warranties vary from one year to ten years and are based on geographic market and state regulations. The reserve for these claims is susceptible to change based on the estimated cost of the claim. We have a history of making reasonable estimates of warranties. However, due to uncertainties inherent in the estimation process, it is possible that actual warranty costs may vary from estimates. Revisions of estimated warranties are recognized in the period such revisions are known.
· Share-based Compensation
Our estimates of the fair values of our share-based payment transactions are based on the modified Black-Scholes-Merton model. In order to meet the fair value measurement objective, we are required to develop estimates regarding expected exercise patterns, share price volatility, forfeiture rates, risk-free interest rate and dividend yield. These assumptions are based principally on historical experience. When circumstances indicate the availability of new or different information that would be useful in estimating these assumptions, revisions are recognized in the periods such revisions are known. Due to uncertainties inherent in these assumptions, it is possible that actual share-based compensation may vary from this estimate.
RECENT ACCOUNTING PRINCIPLES
In May 2008, the Financial Accounting Standards Board issued Statement of Financial Accounting Standards No. 162, The Hierarchy of Generally Accepted Accounting Principles. This accounting principle identifies a consistent framework, or hierarchy, for selecting accounting principles to be used in preparing financial statements that are presented in conformity with U.S. generally accepted accounting principles (GAAP) for nongovernmental entities. This accounting principle was adopted June 2008 and had no impact on consolidated financial position, results of operations or cash flows.
In March 2008, the Financial Accounting Standards Board issued Statement of Financial Accounting Standards No. 161, Disclosures about Derivative Instruments and Hedging Activities. This accounting principle enhances disclosure for derivative instruments and hedging activities and their effects on consolidated financial position, results of operations and cash flows. Specifically, enhanced disclosures will include objectives and strategies for using derivatives, including underlying risk and accounting designation, as well as fair values, gains and losses. This accounting principle was adopted June 2008 and had no impact on consolidated financial position, results of operations or cash flows.
In December 2007, the Financial Accounting Standards Board issued Statement of Financial Accounting Standards No. 160, Noncontrolling Interests in Consolidated Financial Statements. This accounting principle eliminates noncomparable accounting for minority interests. Specifically, minority interests are presented as a component of shareholders’ equity; consolidated net income includes amounts attributable to both the parent and minority interest and is disclosed on the face of the income statement; changes in the ownership interest are accounted for as equity transactions if ownership remains controlling; purchase accounting for acquisitions of noncontrolling interests and acquisitions of additional interests is eliminated; and deconsolidated controlling interests are recognized based on fair value consistent with Statement of Financial Accounting Standards No. 141 (revised 2007), Business Combinations. This accounting principle will be adopted January 2009. The accounting requirements will be adopted prospectively, however presentation and disclosure will be adopted retrospectively for all periods presented. Earlier adoption is prohibited. Adoption is not expected to have an impact on consolidated financial position, results of operations or cash flows.
In December 2007, the Financial Accounting Standards Board issued Statement of Financial Accounting Standards No. 141 (revised 2007), Business Combinations. This accounting principle requires acquisition accounting (purchase accounting) be applied to all business combinations in which control is obtained regardless of consideration and for an acquirer to be identified for each business combination. Additionally, this accounting principle requires acquisition-related costs and restructuring costs at the date of acquisition to be expensed rather than allocated to the assets acquired and the liabilities assumed; minority interests, including goodwill, to be recorded at fair value at the acquisition date; recognition of the fair value of assets and liabilities arising from contractual contingencies and contingent consideration (payments conditioned on the outcome of future events) at the acquisition date; recognition of bargain purchase (acquisition-date fair value exceeds consideration plus any noncontrolling interest) as a gain; and recognition of changes in deferred taxes. This accounting principle will be adopted January 2009. The accounting requirements will be adopted prospectively. Earlier adoption is prohibited. Adoption is not expected to have an impact on consolidated financial position, results of operations or cash flows.
BUSINESS RISKS AND FORWARD-LOOKING STATEMENTS
There are a number of business risks and uncertainties that affect our operations and therefore could cause future results to differ from past performance or expected results. Additional information regarding business risks and uncertainties is contained in Part II Item 1A of this Form 10-Q. These risks and uncertainties may include, however are not limited to:
| · | demand for and supply of single-family homes which is influenced by changes in the overall condition of the U.S. economy, including interest rates, consumer confidence, job formation and other important factors; |
| · | our ability to implement and maintain cost structures that align with revenue trends; |
| · | our liquidity is dependent on operating performance, compliance with financial covenants and cash resources; |
| · | changes in the business models of our customers may limit our ability to provide building products and construction services required by our customers; |
| · | the integration of acquired businesses may not result in anticipated cost savings and revenue synergies being fully realized or may take longer to realize than expected; |
| · | losses of and changes in customers; |
| · | availability of and our ability to attract, train and retain qualified individuals; |
| · | fluctuations in our costs and availability of sourcing channels for commodity wood products, concrete, steel and other building materials; |
| · | weather conditions including natural catastrophic events; |
| · | exposure to construction defect and product liability claims as well as other legal proceedings; |
| · | disruptions in our information systems; |
| · | actual and perceived vulnerabilities as a result of terrorist activities and armed conflict; |
| · | costs and/or restrictions associated with federal, state and other regulations; and |
| · | numerous other matters of a local and regional scale, including those of a political, economic, business, competitive or regulatory nature. |
Risks related to our shares may include, however are not limited to:
| · | price for our shares may fluctuate significantly; and |
| · | anti-takeover defenses and certain provisions could prevent an acquisition of our company or limit share price. |
Certain statements in the Annual Report to Shareholders including those related to expectations about homebuilding activity in our markets, demographic trends supporting homebuilding and anticipated sales and operating income are forward-looking statements within the meaning of the Private Securities Litigation Reform Act of 1995. Statements that are not historical or current facts, including statements about our expectations, anticipated financial results and future business prospects are forward-looking statements. While these statements represent our current judgment on what the future may hold and we believe these judgments are reasonable, these statements involve risks and uncertainties that are important factors that could cause our actual results to differ materially from those in forward-looking statements. These factors include, however are not limited to the risks and uncertainties cited in the above paragraph. Undue reliance should not be placed on such forward-looking statements, as such statements speak only as of the date of the filing of this Form 10-Q. We undertake no obligation to update forward-looking statements.
Item 3. Quantitative and Qualitative Disclosures About Market Risk
Inventory Price Risk
Prices of commodity wood products, which are subject to significant volatility, may adversely impact operating income when prices rapidly rise or fall within a relatively short period of time. We do not use derivative financial instruments to hedge commodity wood product prices.
Interest Rate Risk
Changes in interest expense occur when market interest rates change. Changes in the amount of debt could also increase interest rate risks. We use interest rate swap contracts to hedge interest rate risks. Approximately 59% of the outstanding variable rate borrowings have been hedged through the designation of interest rate swap contracts accounted for as cash flow hedges. After giving effect to the interest rate swap contracts, total borrowings are 53% fixed and 47% variable. Based on debt outstanding as of June 30, 2008, a 0.25% increase in interest rates would result in approximately $0.4 million of additional interest expense annually.
Item 4. Controls and Procedures
Evaluation of Disclosure Controls and Procedures
As of the end of the period covered by this report, management carried out an evaluation, under the supervision and with the participation of the Chief Executive Officer and Chief Financial Officer, of the design and operation of our disclosure controls and procedures. This evaluation was conducted to determine whether the disclosure controls and procedures are effective and timely in bringing material information to the attention of senior management and are designed to provide reasonable assurance regarding the reliability of financial reporting and the preparation of our financial statements in accordance with generally accepted accounting principles. Based on that evaluation, the Chief Executive Officer and Chief Financial Officer concluded that our disclosure controls and procedures are effective in ensuring information required to be disclosed in reports filed under the Securities and Exchange Act of 1934 is recorded, processed, summarized and reported within the time periods specified in the Securities and Exchange Commission’s rules and forms and is accumulated and communicated to our Chief Executive Officer and Chief Financial Officer to allow timely decisions regarding required disclosure.
Changes in Internal Controls Over Financial Reporting
Our disclosure controls and procedures and internal controls over financial reporting are routinely evaluated and tested for effectiveness. These evaluations are discussed with management and the Audit Committee of the Board of Directors. As a result of these evaluations, revisions and corrective actions are made to ensure the continuing effectiveness of our disclosure controls and procedures and internal controls over financial reporting.
During the period covered by this report, we identified deficiencies in the design or operation of our internal controls, however revisions and corrective actions are being made to ensure the effectiveness of our disclosure controls and procedures and internal controls over financial reporting. None of these deficiencies have been considered a material weakness and there were no changes in the design or operation of our internal controls over financial reporting that have materially affected, or are reasonably likely to materially affect, our internal controls over financial reporting.
PART II - OTHER INFORMATION
Item 1. Legal Proceedings
We are involved in litigation and other legal matters arising in the normal course of business. In the opinion of management the recovery or liability, if any, under any of these matters will not have a material effect on our consolidated financial position, results of operations or cash flows.
Item 1A. Risk Factors
Risks Related to Our Business
There are a number of business risks and uncertainties that affect our operations and therefore could cause future results to differ from past performance or expected results. These risks or uncertainties may include, but are not limited to the following factors:
Our business is dependent on demand for and supply of single-family homes which is influenced by changes in the overall condition of the U.S. economy, including interest rates, consumer confidence, job formation and other important factors.
The residential building products and construction services industry is highly dependent on demand for single-family homes, which is influenced by several factors. These factors include economic changes nationally and locally, mortgage and other interest rates, consumer confidence, job formation, demographic trends, inflation, building permit activity and availability of credit as well as other factors. The construction of new homes may experience decline due to excess unsold home inventory levels, lack of availability of credit, the unavailability and unaffordability of land in attractive metropolitan areas, shortages of qualified tradespeople, shortages of materials and regulations that impose restrictive zoning and density requirements. Also, changes to housing patterns may occur, such as an increase in consumer demand for urban living rather than single-family suburban neighborhoods.
The U.S. homebuilding industry experienced a sharp contraction in the production of single-family homes in 2007. Following a slowdown in production in 2006, the housing market was negatively impacted by an excess inventory of unsold homes, deteriorating consumer confidence, declining affordability, tightening lending standards, reduced availability of credit and economic concerns. Single-family building permits for the U.S. were down 40% for the twelve months ended June 2008 and 29% for 2007.
In our markets, single-family building permits declined 49% for the first half of 2008 and 35% for 2007. The decline was widespread across all our markets for both building products and construction services. Lower sales from weakening buyer demand and increased competition for fewer contracts led to declines in our margins, particularly for construction services. We expect market conditions will continue to be challenging and may apply further pressure to our sales, margins and operating results.
All of these factors could limit demand for home construction and may result in lower sales of our building products and construction services as well as lower operating results due to our inability to align our cost structure with these sales trends.
There are risks associated with our business model.
Our business model seeks the strategic growth of construction services and distribution of building products in an effort to provide a comprehensive solution to builders. Providing these services and products includes the risks of availability and cost of qualified labor and claims for construction defects, product liability and workers’ compensation as well as the timely sourcing and availability of building products. Additionally, there is no guarantee that our efforts to offer these comprehensive solutions will continue to be accepted by the marketplace.
An inability to implement and maintain cost structures that align with revenue trends may have an adverse impact on our operating results.
When we experience slower periods of homebuilding activity, acquire new businesses or expand existing operations, we may experience inefficiencies in our cost structures. In response to the current challenging economic and industry conditions, we have implemented restructuring plans that include closure or consolidation of underperforming business units and consolidation of certain administrative functions. Our evaluation of and changes to expenses in response to declining sales may not be realized or timely, leading to higher costs and lower returns on sales.
Our liquidity is dependent on operating performance, compliance with financial covenants and cash resources.
Liquidity is essential to our business. We fund working capital requirements and necessary capital expenditures with cash flow from operations and seasonal borrowings under our credit facility. Should we experience a substantial deterioration in operating performance, our ability to obtain funding from operations or our credit facility could be impacted.
Our credit facility requires quarterly compliance with financial covenants including minimum net worth and minimum earnings before interest, taxes, depreciation and amortization as well as annual compliance with minimum interest coverage ratio. Operating results, particularly net income, are a primary factor for these covenants and our ability to comply with these covenants depends on our operating performance. The significant and ongoing correction in single-family housing starts has negatively impacted our operating performance.
Due to lower than planned operating performance, as of June 2008 we were not in compliance with the financial covenants of our credit facility. Similarly due to operating losses and impairments, as of December 2007 we were not in compliance with these financial covenants. Temporary waivers for these financial covenants were obtained in August 2008 and February 2008. The August 2008 waiver agreement temporarily waives financial covenants until September 30, 2008 and limits borrowings under the revolver to $60 million. As of August 11, 2008, $29.2 million was outstanding under the revolver.
We are currently in negotiations with our lenders regarding a potential amendment to the terms of the credit facility. Negotiations include establishing financial covenants consistent with the current and foreseeable housing market conditions. There is no assurance these negotiations will result in an amendment acceptable to us and the lenders.
If the waiver period terminates without an amendment to these financial covenants, or if we fail to comply with existing or new covenants, we may be in default and the lenders may have the right to cause all amounts borrowed to become due and payable immediately. Reduced operating cash flow and revolver borrowing base limitations may adversely affect our ability to finance operations or capital needs.
Changes in or perceptions of our liquidity or the liquidity of our suppliers and customers may adversely affect our cash flows and compound other risks. Suppliers of building products as well as customers of our building products and construction services we depend on may experience or perceive uncertain liquidity and cause changes in our liquidity. For example, vendors may disrupt supply with changes in terms such as credit and quantity limitations, pricing or payment. Similarly, customers may disrupt demand with changes in purchasing habits.
Our credit ratings are important to our liquidity. A reduction in our credit ratings could adversely affect our liquidity and competitive position, increase borrowing costs, limit our access to capital markets or trigger unfavorable contractual obligations.
Increases in interest rates and the credit risk premium assigned to us as well as changes in the amount of debt will increase our interest expense. Higher interest expense may adversely impact our financial position, results of operations or cash flows for operating needs.
Changes in the business models of customers may limit our ability to provide building products and construction services required by our customers.
As the business models of our customers evolve, our existing building products and construction service offerings may not meet the needs of certain homebuilders. Homebuilders may decide to no longer outsource construction services or may purchase construction services and building products from separate suppliers. If we do not timely assess shifts in customer expectations, preferences and demands, our financial condition, results of operations or cash flows could be adversely affected.
The integration of acquired businesses may not result in anticipated cost savings and revenue synergies being fully realized or may take longer to realize than expected.
Our past growth has been largely due to acquisitions. As we manage our business through the current industry downturn, we do not intend to pursue acquisitions and our focus will be on enhancing existing operations. The integration of previously acquired businesses may not result in anticipated cost savings and revenue synergies being fully realized or may take longer to realize than expected. The management and acquisition of businesses involves substantial risks including:
| · | the uncertainty that an acquired business will achieve anticipated operating results; |
| · | significant expenses to integrate; |
| · | diversion of management attention; |
| · | departure of key personnel from the acquired business; |
| · | effectively managing entrepreneurial spirit and decision-making; |
| · | integration of different information systems; |
| · | managing new construction service trades; |
| · | unanticipated costs and exposure to unforeseen liabilities; and |
Losses of and changes in customers may have an adverse impact on our operating results.
We are exposed to the risk of loss arising from the failure of a customer. Although amounts due from our customers are typically secured by liens on their construction projects, in the event a customer cannot meet its payment obligations to us, there is a risk that the value of their underlying project will not be sufficient to recover the amounts owed to us. Estimated credit losses are considered in the valuation of amounts due from our customers, however the entire carrying amount is generally at risk.
While economic and regulatory changes seek to reduce excess unsold home inventory and stabilize housing affordability, we may experience losses of and changes in customers. Our 5 largest customers represent 17% of consolidated sales. Additionally, diversification of our sales to more products and services for multi-family and light commercial projects may result in changes in our customer mix. The loss of one or more of our significant customers and changes in customer mix may adversely affect our financial condition, results of operations or cash flows.
Our success is dependent upon the availability of and our ability to attract, train and retain qualified individuals.
Competition for employees is especially intense in both building products distribution and construction services. Weak operating results may limit our ability to offer competitive compensation and benefits and may result in shortages of qualified labor and key personnel and limit our ability to complete contracts as well as obtain additional contracts with builders. Additional employment and eligibility requirements as well as enhanced and perceived enforcement from state and federal authorities could also limit the availability of qualified labor. We cannot guarantee that we will be successful in recruiting and retaining qualified employees in the future.
Our operating results are affected by fluctuations in our costs and the availability of sourcing channels for commodity wood products, concrete, steel and other building products.
Prices of commodity wood products, concrete, steel and other building products are historically volatile and are subject to fluctuations arising from changes in domestic and international supply and demand, labor costs, competition, market speculation, government regulations and periodic delays in delivery. Rapid and significant changes in product prices may affect sales as well as margins due to a limited ability to pass on short-term price changes. We do not use derivative financial instruments to hedge commodity price changes.
We may experience shortages of building products as a result of unexpected demand or production difficulties as well as transportation limitations. Any disruption in our sources of supply for key building products could negatively impact our financial condition, results of operations or cash flows.
Our business is subject to intense competition.
We experience competition across all markets for our building products and construction services. Recently, there has been increased consolidation within the building materials distribution and construction services industry. As the industry consolidates, other building materials distributors, including large retail distributors focused on consumers, may aggressively pursue production homebuilders as well as other professional builders and contractors. These competitive factors may lead to pricing pressures and cause reductions in sales or margins as well as increases in operating costs. Loss of significant market share due to competition could result in the closure of facilities.
Weather conditions, including natural catastrophic events, may cause our operating results to fluctuate each quarter.
Our first and fourth quarters historically have been, and are expected to continue to be, adversely affected by weather conditions in some of our markets, causing decreases in operating results due to slower homebuilding activity. In addition, natural catastrophic events may cause our operating results to fluctuate.
The nature of our business exposes us to construction defect and product liability claims as well as other legal proceedings.
We are involved in construction defect and product liability claims relating to our various construction trades and the products we distribute and manufacture. We also operate a large fleet of trucks and other vehicles and therefore face some risk of accidents. Although we believe we maintain adequate insurance, we may not be able to maintain such insurance on acceptable terms or such insurance may not provide adequate protection against potential liabilities. Current or future claims may adversely affect our financial condition, results of operations or cash flows.
We may be adversely affected by disruptions in our information systems.
Our operations are dependent upon information for decision-making and the related information systems. A substantial disruption in our information systems for a prolonged period could result in delays in our services and products and adversely affect our ability to complete contracts and fulfill customer demands. Such delays, problems or costs may have an adverse effect on our financial condition, results of operations or cash flows.
Actual and perceived vulnerabilities as a result of terrorist activities and armed conflict may adversely impact consumer confidence and our business.
Instability in the economy and financial markets as a result of terrorism or war may impact consumer confidence and result in a decrease in homebuilding in our markets. Terrorist attacks may also directly impact our ability to maintain operations and services and may have an adverse effect on our business.
Federal, state and other regulations could impose substantial costs and/or restrictions on our business.
We are subject to various federal, state, local and other regulations, including among other things, work safety regulations promulgated by the Department of Labor’s Occupational Safety and Health Administration, transportation regulations promulgated by the Department of Transportation, employment regulations promulgated by the Department of Homeland Security and the United States Equal Employment Opportunity Commission and state and local zoning restrictions and building codes. More burdensome regulatory requirements in these or other areas may increase our costs and have an adverse effect on our financial condition, results of operations or cash flows.
Numerous other matters of a local and regional scale, including those of a political, economic, business, competitive or regulatory nature may have an adverse impact on our business.
Many factors shape the homebuilding industry and our business. In addition to the factors previously cited, there are other matters of a local and regional scale, including those of a political, economic, business, competitive or regulatory nature that may have an adverse effect on our business.
Risks Related to Our Shares
Risks related to our shares may include, however are not limited to:
Our share price may fluctuate significantly, which may make it difficult for shareholders to trade our shares when desired or at attractive prices.
The market price of our shares is subject to significant changes as a result of our operating performance and the other factors discussed above as well as perceptions and events that are beyond our control. Price and trading volume fluctuations for our shares may be unrelated or disproportionate to our operating performance. Additionally, our share price could fluctuate based on the expectations and performance of other publicly traded companies in the construction services and building products distribution industry.
Anti-takeover defenses in our governing documents and certain provisions under Delaware law could prevent an acquisition of our company or limit the price that investors might be willing to pay for our shares.
Our governing documents and certain provisions of Delaware law that apply to us could make it difficult for another company to acquire control of our company. For example, our certificate of incorporation allows our Board of Directors to issue, at any time and without shareholder approval, preferred shares with such terms as it may determine. Also, our certificate of incorporation provides that during certain types of transactions that could affect control, including the acquisition of 15% or more of our common shares, affiliates of any party to the transaction and persons having a material financial interest in the transaction may not be elected to the Board of Directors. These provisions and others could delay, prevent or allow our Board of Directors to resist an acquisition of our company, even if a majority of our shareholders favored the proposed transaction.
Item 2. Unregistered Sales of Equity Securities and Use of Proceeds
In June 2007, our Board of Directors authorized the repurchase of up to $25 million of our common shares through March 2008. The repurchase program expired in March 2008 with no repurchases.
Item 3. Defaults Upon Senior Securities
None.
Item 4. Submission of Matters to a Vote of Security Holders
Our annual meeting of shareholders was held on May 6, 2008. A total of 29,381,760 common shares were outstanding at the date of record and entitled to vote at the meeting. Of the total outstanding, 25,174,833 shares were represented at the meeting, while 4,206,927 were not voted.
Election of Board of Directors
In accordance with Delaware corporate law and our bylaws, directors are elected by a plurality of the votes, with the nominees receiving the highest number of affirmative votes being elected as directors. As there were no votes cast for other candidates, each of the nominees below were elected as directors with terms expiring in May 2009.
| | | For | | Withheld |
| Robert E. Mellor | | 22,111,446 | | 3,063,387 |
| Sara L. Beckman | | 22,143,078 | | 3,031,755 |
| James K. Jennings, Jr. | | 22,149,511 | | 3,025,322 |
| Norman J. Metcalfe | | 22,158,058 | | 3,016,775 |
| David M. Moffett | | 22,156,502 | | 3,018,331 |
| R. Scott Morrison, Jr. | | 22,143,628 | | 3,031,205 |
| Peter S. O’Neill | | 22,139,095 | | 3,035,738 |
| Richard G. Reiten | | 22,166,545 | | 3,008,288 |
| Norman R. Walker | | 22,153,011 | | 3,021,822 |
2008 Stock Incentive Plan
Employees and non-employee directors are eligible to receive awards at the discretion of the Compensation Committee. Options, appreciation rights, restricted shares, other share-based awards and non-discretionary awards may be granted under this plan. A total of 2.0 million shares were reserved for issuance under the plan. This plan represents approximately 6.2% of outstanding shares, including unexercised option awards and unvested restricted share awards.
Unissued shares remaining under other share award plans will not be issued. In addition, outstanding options will not be amended and new awards will not be made as substitutes for outstanding options. Awards will not be made at grant prices below the fair market value on the date of grant. The 2.0 million shares are expected to be sufficient for incentive awards for the next 2 years.
Our shareholders approved the 2008 Stock Incentive Plan and votes were cast as follows:
For | | Withheld | | Abstain | | Not Voted |
| 10,428,254 | | 3,380,120 | | 112,825 | | 11,253,634 |
Amended and Restated Employee Stock Purchase Plan
The plan permits eligible employees to purchase common shares through payroll deductions of up to 10% of an employee’s compensation limited to $25,000 each year. The purchase price of the shares is established by the Compensation Committee and may range from 95% to 85% of the market price on January 31, April 30, July 31 and October 31. A total of 2.0 million shares were reserved for purchase under the plan. As approximately 400,000 shares were previously issued, a total of 1.6 million shares are available for purchase. This plan represents approximately 4.9% of outstanding shares, including unexercised option awards and unvested restricted share awards.
Our shareholders approved the Amended and Restated Employee Stock Purchase Plan and votes were cast as follows:
For | | Withheld | | Abstain | | Not Voted |
| 11,063,205 | | 2,780,860 | | 77,134 | | 11,253,634 |
Ratification of Independent Registered Public Accountants
Our shareholders ratified the selection of KPMG LLP as our independent registered public accountants at the annual meeting and votes were cast as follows:
For | | Withheld | | Abstain | | Not Voted |
| 22,875,750 | | 2,178,008 | | 121,075 | | 0 |
Item 5. Other Information
None.
Item 6. Exhibits
| (a) | | Exhibits | | |
| | | | | |
| | | Number | | Description |
| | | | | |
| | | 10.10.2 | | Limited Waiver Agreement Dated as of xMonth xDate, 2008 |
| | | | | |
| | | 31.1 | | Section 302 Certification |
| | | | | |
| | | 31.2 | | Section 302 Certification |
| | | | | |
| | | 32.0 | | Section 906 Certifications |
SIGNATURES
Pursuant to the requirements of the Securities Exchange Act of 1934, the registrant has duly caused this report to be signed on its behalf by the undersigned thereunto duly authorized.
| | BUILDING MATERIALS HOLDING CORPORATION |
| Date: August 14, 2008 | /s/ Robert E. Mellor | |
| | Robert E. Mellor Chairman of the Board and Chief Executive Officer (Principal Executive Officer) |
| | |
| Date: August 14, 2008 | /s/ William M. Smartt | |
| | William M. Smartt Senior Vice President and Chief Financial Officer (Principal Financial Officer) |