UNITED STATES
SECURITIES AND EXCHANGE COMMISSION
Washington, D.C. 20549
SOLICITATION/RECOMMENDATION STATEMENT UNDER
SECTION 14(d)(4) OF THE SECURITIES EXCHANGE ACT OF 1934
ENDESA, S.A.
(Name of Subject Company)
ENDESA, S.A.
(Name of Person Filing Statement) |
Ordinary shares, nominal value €1.20 each
American Depositary Shares, each representing the right to receive one ordinary share
(Title of Class of Securities)
00029274F1
(CUSIP Number of Class of Securities) |
Álvaro Pérez de Lema
Authorized Representative of Endesa, S.A.
410 Park Avenue, Suite 410
New York, NY 10022
(212) 750-7200
(Name, address and telephone number of person
authorized to receive notices and communications on
behalf of the person filing statement) |
With a Copy to:
Joseph B. Frumkin
Sergio J. Galvis
Richard A. Pollack
Angel L. Saad
Sullivan & Cromwell LLP
125 Broad Street
New York, NY 10004
(212) 558-4000 |
S Check the box if the filing relates solely to preliminary communications made before the commencement of a tender offer.
| IMPORTANT LEGAL INFORMATION |
This document has been made available to shareholders of Endesa, S.A. (the "Company" or "Endesa"). Investors are urged to read Endesa’s Solicitation/Recommendation Statement on Schedule 14D-9, which will be filed by the Company with the U.S. Securities and Exchange Commission (the "SEC”), as it contains important information. The Solicitation/Recommendation Statement and other public filings made from time to time by the Company with the SEC will be available without charge from the SEC's website at www.sec.gov and at the Company’s principal executive offices in Madrid, Spain.
Statements in this document other than factual or historical information are “forward-looking statements”. Forward-looking statements regarding Endesa’s anticipated financial and operating results and statistics are not guarantees of future performance and are subject to material risks, uncertainties, changes and other factors which may be beyond Endesa’s control or may be difficult to predict. No assurances can be given that the forward-looking statements in this document will be realized.
Forward-looking statements may include, but are not limited to, statements regarding: (1) estimated future earnings; (2) anticipated increases in wind and CCGTs generation and market share; (3) expected increases in demand for gas and gas sourcing; (4) management strategy and goals; (5) estimated cost reductions and increased efficiency; (6) anticipated developments affecting tariffs, pricing structures and other regulatory matters; (7) anticipated growth in Italy, France and elsewhere in Europe; (8) estimated capital expenditures and other investments; (9) expected asset disposals; (10) estimated increases in capacity and output and changes in capacity mix; (11) repowering of capacity; and (12) macroeconomic conditions.
The following important factors, in addition to those discussed elsewhere in this document, could cause actual financial and operating results and statistics to differ materially from those expressed in our forward-looking statements:
- Economic and Industry Conditions: Materially adverse changes in economic or industry conditions generally or in our markets; the effect of existing regulations and regulatory changes; tariff reductions; the impact of any fluctuations in interest rates; the impact of fluctuations in exchange rates; natural disasters; the impact of more stringent environmental regulations and the inherent environmental risks relating to our business operations; and the potential liabilities relating to our nuclear facilities.
- Transaction or Commercial Factors: Any delays in or failure to obtain necessary regulatory, antitrust and other approvals for our proposed acquisitions or asset disposals, or any conditions imposed in connection with such approvals; our ability to integrate acquired businesses successfully; the challenges inherent in diverting management's focus and resources from other strategic opportunities and from operational matters during the process of integrating acquired businesses; the outcome of any negotiations with partners and governments; any delays in or failure to obtain necessary regulatory approvals (including environmental) to construct new facilities or repower or enhance our existing facilities; shortages or changes in the price of equipment, materials or labor; opposition of political and ethnic groups; adverse changes in the political and regulatory environment in the countries where we and our related companies operate; adverse weather conditions, which may delay the completion of power plants or substations, or natural disasters, accidents or other unforeseen events; and the inability to obtain financing at rates that are satisfactory to us.
- Political/Governmental Factors: Political conditions in Latin America and changes in Spanish, European and foreign laws, regulations and taxes.
- Operating Factors: Technical difficulties; changes in operating conditions and costs; the ability to
| | | implement cost reduction plans; the ability to maintain a stable supply of coal, fuel and gas and theimpact of fluctuations on fuel and gas prices; acquisitions or restructurings; and the ability toimplement an international and diversification strategy successfully. |
| | Ÿ | Competitive Factors: the actions of competitors; changes in competition and pricing environments; and the entry of new competitors in our markets. |
Further information about the reasons why actual results and developments may differ materially from the expectations disclosed or implied by our forward-looking statements can be found under “Risk Factors” in our annual report on Form 20-F for the year ended December 31, 2005.
Except as may be required by applicable law, Endesa disclaims any obligation to revise or update any forward-looking statements in this document.
ENDESA LATIN AMERICAVALENCIA, 25 JUNE, 2007
AGENDA Unique business platform in Latin America capable of capturing market growth and minimizing risk. Robust macroeconomic environment in the region. Strong outlook for our electricity markets. Significant opportunities ahead for profitable growth. 2009 targets clearly achievable. 1
AGENDA Unique business platform in Latin America capable of capturing market growth and minimising risk. Robust macroeconomic environment in the region. Strong outlook for our electricity markets. Significant opportunities ahead for profitable growth. 2009 targets clearly achievable. 2
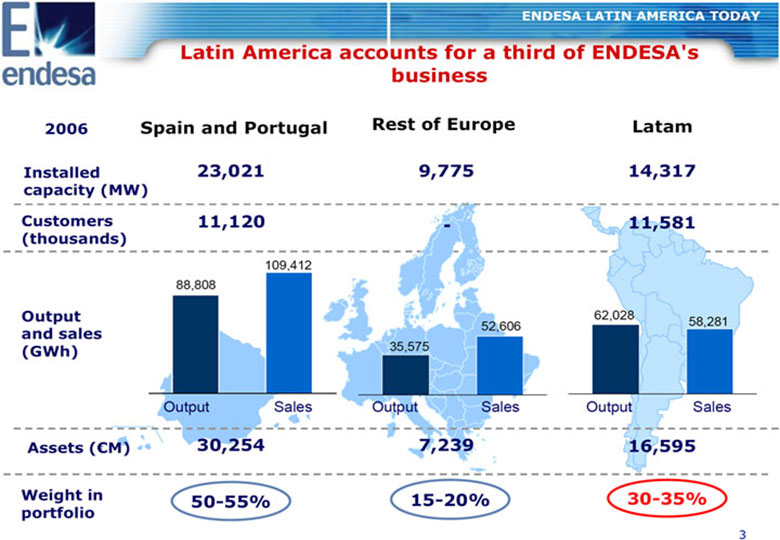
ENDESA LATIN AMERICA TODAY LATIN AMERICA ACCOUNTS FOR A THIRD OF ENDESA'S BUSINESS 2006 SPAIN AND PORTUGAL REST OF EUROPE LATAM INSTALLED 23,021 9,775 14,317 CAPACITY (MW) CUSTOMERS 11,120 - 11,581 (THOUSANDS) 109,412 88,808 OUTPUT 62,028 52,606 58,281 AND SALES (GWH) 35,575 Output Sales Output Sales Output Sales ASSETS ((EURO)M) 30,254 7,239 16,595 WEIGHT IN 50-55% 15-20% 30-35% PORTFOLIO 3
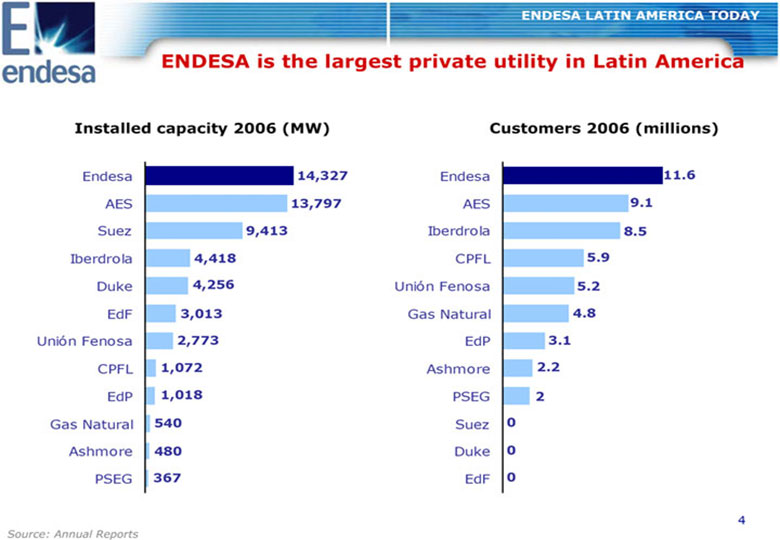
ENDESA LATIN AMERICA TODAY ENDESA IS THE LARGEST PRIVATE UTILITY IN LATIN AMERICA INSTALLED CAPACITY 2006 (MW) CUSTOMERS 2006 (MILLIONS) Endesa 14,327 Endesa 11.6 AES 13,797 AES 9.1 Suez 9,413Iberdrola 8.5 Iberdrola 4,418 CPFL 5.9 Duke 4,256 Union Fenosa 5.2 EdF 3,013 . Gas Natural 4.8 Union Fenosa 2,773 . EdP3.1 CPFL 1,072Ashmore 2.2 EdP 1,018 PSEG 2 Gas Natural 540 Suez 0 Ashmore 480 Duke 0 PSEG 367 EdF 0 4
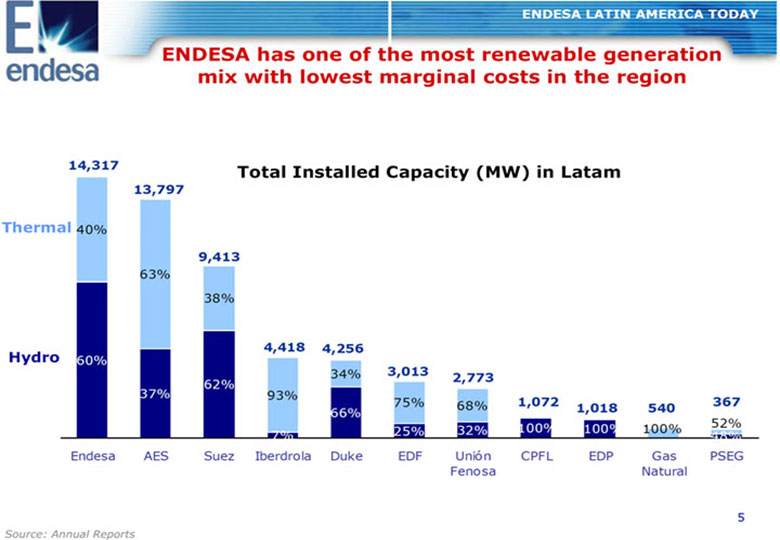
SOURCE: ANNUAL REPORTS ENDESA LATIN AMERICA TODAY ENDESA HAS ONE OF THE MOST RENEWABLE GENERATION MIX WITH LOWEST MARGINAL COSTS IN THE REGION 14,317 TOTAL INSTALLED CAPACITY (MW) IN LATAM 13,797 THERMAL 40% 9,413 63% 38% 4,418 4,256 HYDRO 60% 34% 3,013 2,773 62% 37% 93% 75% 68% 1,072 1,018 540 367 66% 100% 100% 100% 52% 7% 25% 32% 48% Endesa AES Suez Iberdrola Duke EDF Union CPFL EDP Gas PSEG Fenosa Natural 5
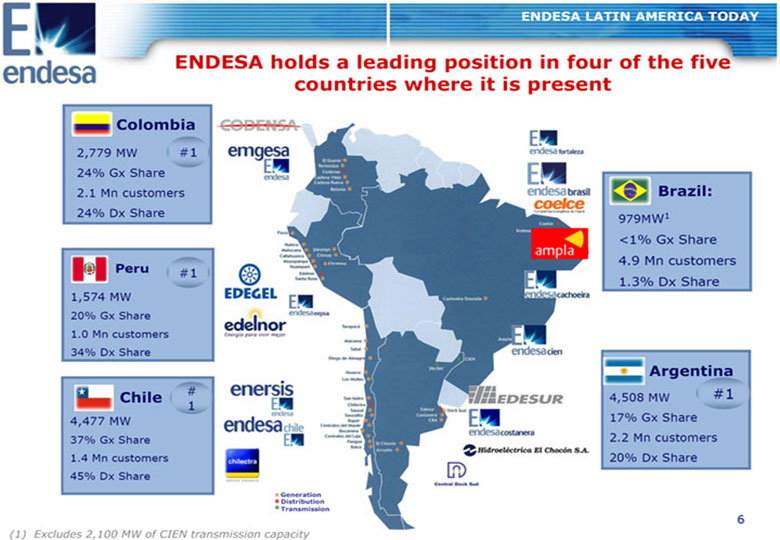
SOURCE: ANNUAL REPORTS ENDESA LATIN AMERICA TODAY ENDESA HOLDS A LEADING POSITION IN FOUR OF THE FIVE COUNTRIES WHERE IT IS PRESENT COLOMBIA 2,779 MW #1 24% Gx Share 2.1 Mn customers BRAZIL: 24% Dx Share 979MW(1) ‹1% Gx Share 4.9 Mn customers PERU #1 1.3% Dx Share 1,574 MW 20% Gx Share 1.0 Mn customers 34% Dx Share ARGENTINA # #1 CHILE 4,508 MW 1 4,477 MW 17% Gx Share 37% Gx Share 2.2 Mn customers 1.4 Mn customers 20% Dx Share 45% Dx Share GENERATION DISTRIBUTION TRANSMISSION (1) Excludes 2,100 MW OF CIEN transmission capacity 6
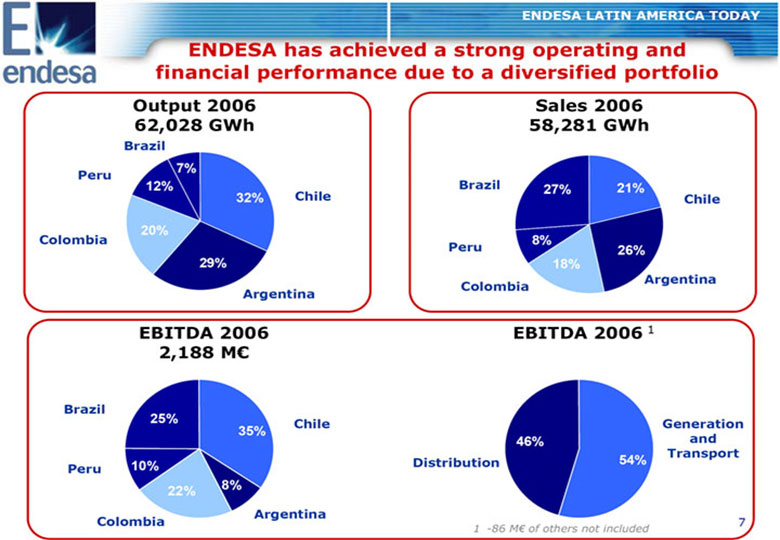
(1) EXCLUDES 2,100 MW OF CIEN TRANSMISSION CAPACITY ENDESA LATIN AMERICA TODAY ENDESA HAS ACHIEVED A STRONG OPERATING AND FINANCIAL PERFORMANCE DUE TO A DIVERSIFIED PORTFOLIO OUTPUT 2006 SALES 2006 62,028 GWH 58,281 GWH BRAZIL 7% PERU 12% BRAZIL 27% 21% 32% CHILE CHILE 20% COLOMBIA 8% PERU 26% 29% 18% ARGENTINA COLOMBIA ARGENTINA EBITDA 2006 EBITDA 2006 1 2,188 M(EURO) BRAZIL 25% CHILE GENERATION 35% 46% AND TRANSPORT 10% DISTRIBUTION 54% PERU 22% 8% ARGENTINA COLOMBIA 1 - 86 M€ of others not included 7
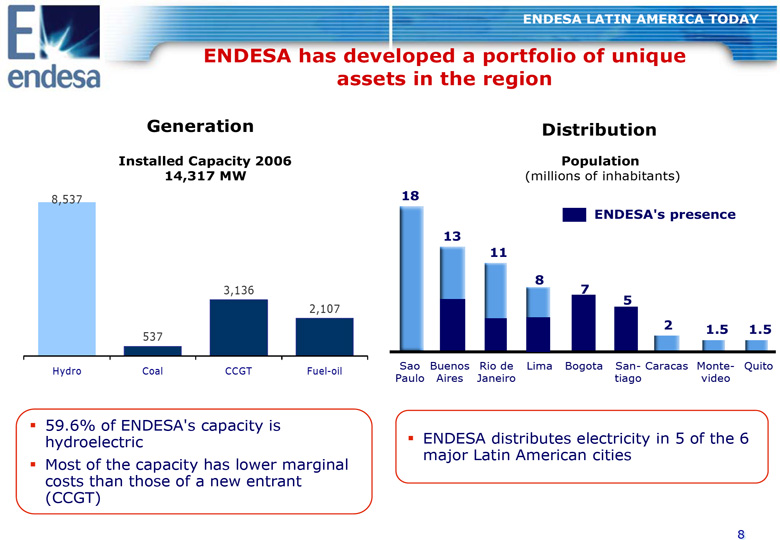
1 -86 M(EURO) OF OTHERS NOT INCLUDED ENDESA LATIN AMERICA TODAY ENDESA HAS DEVELOPED A PORTFOLIO OF UNIQUE ASSETS IN THE REGION GENERATION DISTRIBUTION INSTALLED CAPACITY 2006 POPULATION 14,317 MW(millions of inhabitants) 8,537 18 ENDESA'S PRESENCE 13 11 8 3,136 7 5 2,107 2 1.5 1.5 537 Sao Buenos Rio de Lima Bogota San- Caracas Monte- Quito Hydro Coal CCGT Fuel-oil Paulo Aires Janeiro tiago video 59.6% of ENDESA's capacity is hydroelectric ENDESA distributes electricity in 5 of the 6 major Latin American cities Most of the capacity has lower marginal costs than those of a new entrant (CCGT) 8
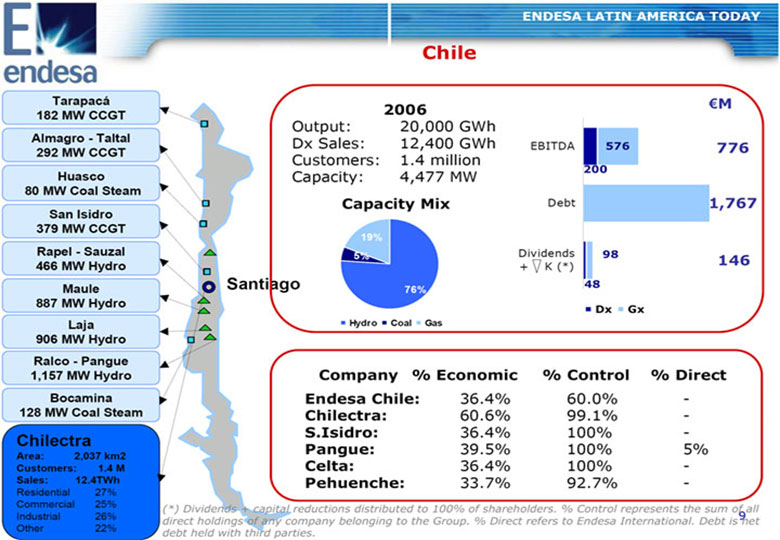
ENDESA LATIN AMERICA TODAY CHILE TARAPACA (EURO)M 182 MW CCGT 2006 Output: 20,000 GWh ALMAGRO - TALTAL Dx Sales: 12,400 GWh EBITDA 576 776 292 MW CCGT Customers: 1.4 million 200 HUASCO Capacity: 4,477 MW 80 MW COAL STEAM CAPACITY MIX Debt 1,767 SAN ISIDRO 379 MW CCGT 19% RAPEL - SAUZAL 5% Dividends 98 466 MW HYDRO + K (*) 146 MAULE SANTIAGO 48 76% 887 MW HYDRO DX GX LAJA HYDRO COAL GAS 906 MW HYDRO RALCO - PANGUE 1,157 MW HYDRO COMPANY % ECONOMIC % CONTROL % DIRECT BOCAMINA ENDESA CHILE: 36.4% 60.0% - 128 MW COAL STEAM CHILECTRA: 60.6% 99.1% - S.ISIDRO: 36.4% 100% - CHILECTRA PANGUE: 39.5% 100% 5% AREA: 2,037 KM2 CUSTOMERS: 1.4 M CELTA: 36.4% 100% -SALES: 12.4TWH PEHUENCHE: 33.7% 92.7% - Residential 27% Commercial 25% (*) DIVIDENDS + CAPITAL REDUCTIONS DISTRIBUTED TO 100% OF SHAREHOLDERS. % CONTROL REPRESENTS THE SUM OF ALL Industrial 26% DIRECT HOLDINGS OF ANY COMPANY BELONGING TO THE GROUP. % DIRECT REFERS TO ENDESA INTERNATIONAL. DEBT IS NET9 Other 22% DEBT HELD WITH THIRD PARTIES.

ENDESA LATIN AMERICA TODAY BRAZIL 2006 (EURO)M FORTALEZA 321 MW CCGT Output: 4,500 GWh Dx Sales: 15,300 GWh EBITDA 422 159 581 FORTALEZA Customers: 4.9 million CACHOEIRA DOURADA 658 MW HYDRO Capacity: 979 MW CAPACITY MIX Debt 518 176 694 CIEN 2,100 MW INTERCONNECTION 33% Dividends 181 51 (130) + K (*) 67% COELCE DX GX AREA: 146,817 KM(2) HYDRO FUEL GAS CUSTOMERS: 2.5 M SALES: 6.7 TWH Residential 36% Commercial 20% COMPANY % ECONOMIC % CONTROL % DIRECT Industrial 19% RIO DE Other 25% JANEIRO CACHOEIRA 59.3% 99.6% - FORTALEZA: 59.5% 100% - AMPLA L1 AMPLA: 55.1% 91.9% - AREA: 31,784 KM2 L2 CIEN: 59.5% 100% - CUSTOMERS: 2.4 M COELCE: 34.1% 58.9% -SALES: 8.6TWH Residential 46% Commercial 23% (*) DIVIDENDS + CAPITAL REDUCTIONS DISTRIBUTED TO 100% OF SHAREHOLDERS. % CONTROL REPRESENTS THE SUM OF ALL Industrial 13% DIRECT HOLDINGS OF ANY COMPANY BELONGING TO THE GROUP. % DIRECT REFERS TO ENDESA INTERNATIONAL. DEBT IS NET10 Other 18% DEBT HELD WITH THIRD PARTIES.
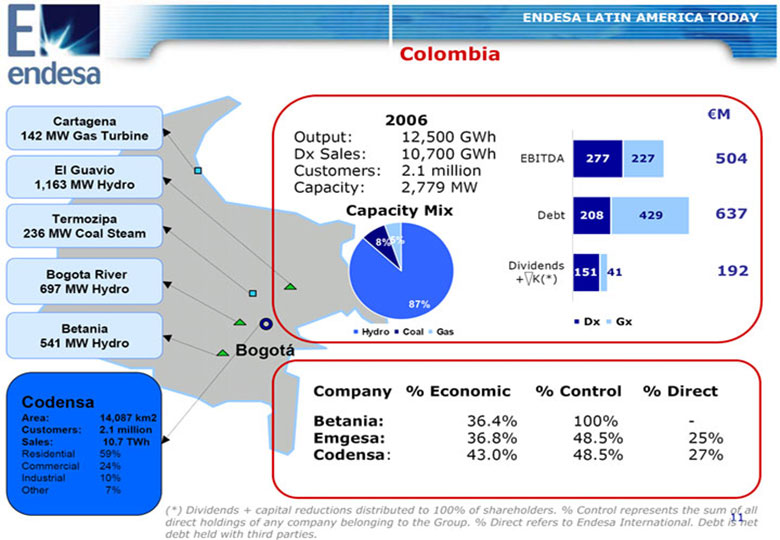
ENDESA LATIN AMERICA TODAY COLOMBIA 2006 (EURO)M CARTAGENA 142 MW GAS TURBINE Output: 12,500 GWh Dx Sales: 10,700 GWh EBITDA 277 227 504 EL GUAVIO Customers: 2.1 million 1,163 MW HYDRO Capacity: 2,779 MW CAPACITY MIX Debt 208 429 637 TERMOZIPA 236 MW COAL STEAM 8% 5% Dividends 192 BOGOTA RIVER 151 41 + K(*) 697 MW HYDRO 87% DX GX BETANIA HYDRO COAL GAS 541 MW HYDRO BOGOTA COMPANY % ECONOMIC % CONTROL % DIRECT CODENSA AREA: 14,087 KM2 BETANIA: 36.4% 100% -CUSTOMERS: 2.1 MILLION SALES: 10.7 TWH EMGESA: 36.8% 48.5% 25% Residential 59% CODENSA: 43.0% 48.5% 27% Commercial 24% Industrial 10% Other 7% (*) DIVIDENDS + CAPITAL REDUCTIONS DISTRIBUTED TO 100% OF SHAREHOLDERS. % CONTROL REPRESENTS THE SUM OF ALL DIRECT HOLDINGS OF ANY COMPANY BELONGING TO THE GROUP. % DIRECT REFERS TO ENDESA INTERNATIONAL. DEBT IS NET11 DEBT HELD WITH THIRD PARTIES.
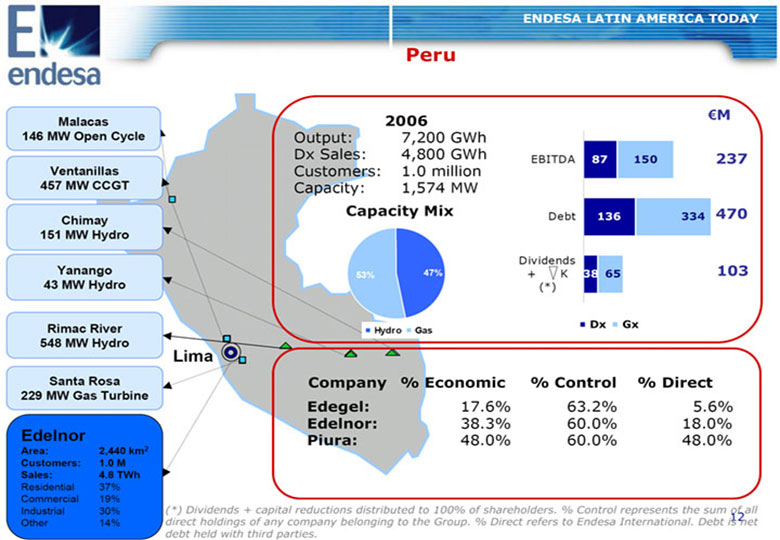
ENDESA LATIN AMERICA TODAY PERU 2006 (EURO)M MALACAS 146 MW OPEN CYCLE Output: 7,200 GWh Dx Sales: 4,800 GWh EBITDA 87 150 237 VENTANILLAS Customers: 1.0 million 457 MW CCGT Capacity: 1,574 MW CAPACITY MIX Debt 136 334 470 CHIMAY 151 MW HYDRO Dividends YANANGO 53% 47% + K 38 65 103 43 MW HYDRO (*) RIMAC RIVER DX GX HYDRO GAS 548 MW HYDRO LIMA SANTA ROSA COMPANY % ECONOMIC % CONTROL % DIRECT 229 MW GAS TURBINE EDEGEL: 17.6% 63.2% 5.6% EDELNOR: 38.3% 60.0% 18.0% EDELNOR PIURA: 48.0% 60.0% 48.0% AREA: 2,440 KM2 CUSTOMERS: 1.0 M SALES: 4.8 TWH Residential 37% Commercial 19% Industrial 30% (*) DIVIDENDS + CAPITAL REDUCTIONS DISTRIBUTED TO 100% OF SHAREHOLDERS. % CONTROL REPRESENTS THE SUM OF ALL DIRECT HOLDINGS OF ANY COMPANY BELONGING TO THE GROUP. % DIRECT REFERS TO ENDESA INTERNATIONAL. DEBT IS NET12 Other 14% DEBT HELD WITH THIRD PARTIES.
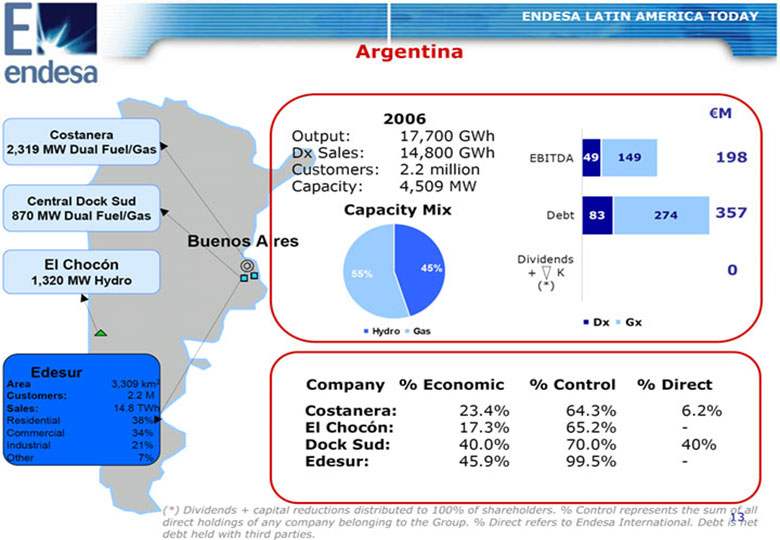
ENDESA LATIN AMERICA TODAY ARGENTINA 2006 (EURO)M COSTANERA Output: 17,700 GWh 2,319 MW DUAL FUEL/GAS Dx Sales: 14,800 GWh EBITDA 49 149 198 Customers: 2.2 million Capacity: 4,509 MW CENTRAL DOCK SUD 870 MW DUAL FUEL/GAS CAPACITY MIX Debt 83 274 357 BUENOS AIRES EL CHOCON Dividends 45% + K 0 55% 1,320 MW HYDRO (*) DX GX HYDRO GAS EDESUR AREA 3,309 km(2) COMPANY % ECONOMIC % CONTROL % DIRECT CUSTOMERS: 2.2 M SALES: 14.8 TWh COSTANERA: 23.4% 64.3% 6.2% Residential 38% EL CHOCON: 17.3% 65.2% -Commercial 34% Industrial 21% DOCK SUD: 40.0% 70.0% 40% Other 7% EDESUR: 45.9% 99.5% - (*) DIVIDENDS + CAPITAL REDUCTIONS DISTRIBUTED TO 100% OF SHAREHOLDERS. % CONTROL REPRESENTS THE SUM OF ALL DIRECT HOLDINGS OF ANY COMPANY BELONGING TO THE GROUP. % DIRECT REFERS TO ENDESA INTERNATIONAL. DEBT IS NET13 DEBT HELD WITH THIRD PARTIES.
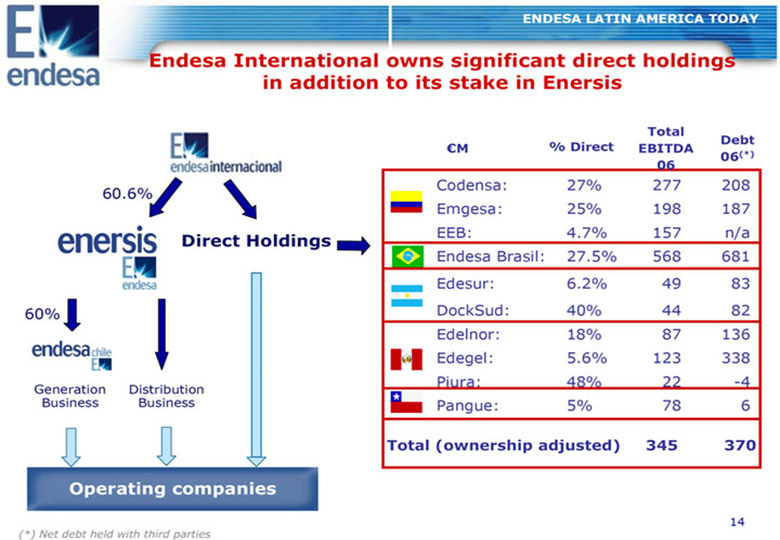
ENDESA LATIN AMERICA TODAY ENDESA INTERNATIONAL OWNS SIGNIFICANT DIRECT HOLDINGS IN ADDITION TO ITS STAKE IN ENERSIS TOTAL DEBT (EURO)M % DIRECT EBITDA 06 (*) 06 Codensa: 27% 277 208 60.6% Emgesa: 25% 198 187 DIRECT HOLDINGS EEB: 4.7% 157 n/a Endesa Brasil: 27.5% 568 681 Edesur: 6.2% 49 83 60% DockSud: 40% 44 82 Edelnor: 18% 87 136 Edegel: 5.6% 123 338 Piura: 48% 22 -4 Generation Distribution Business Business Pangue: 5% 78 6 TOTAL (OWNERSHIP ADJUSTED) 345 370 OPERATING COMPANIES 14 (*) NET DEBT HELD WITH THIRD PARTIES
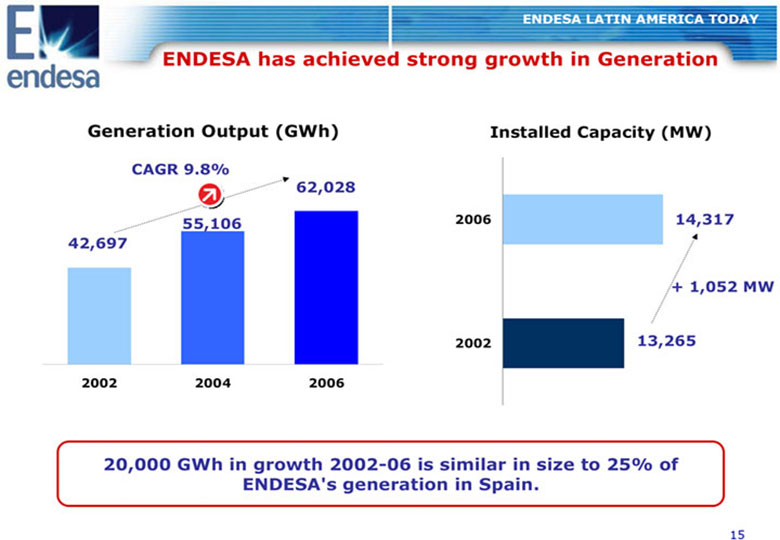
ENDESA LATIN AMERICA TODAY ENDESA HAS ACHIEVED STRONG GROWTH IN GENERATION GENERATION OUTPUT (GWH) INSTALLED CAPACITY (MW) CAGR 9.8% 62,028 55,106 2006 14,317 42,697 + 1,052 MW 2002 13,265 2002 2004 2006 20,000 GWH IN GROWTH 2002-06 IS SIMILAR IN SIZE TO 25% OF ENDESA'S GENERATION IN SPAIN. 15
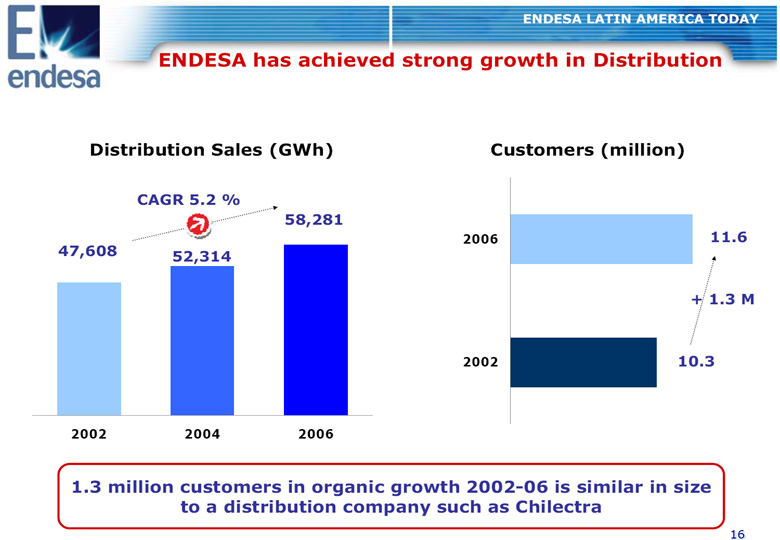
ENDESA LATIN AMERICA TODAY ENDESA HAS ACHIEVED STRONG GROWTH IN DISTRIBUTION DISTRIBUTION SALES (GWH) CUSTOMERS (MILLION) CAGR 5.2 % 58,281 2006 11.6 47,608 52,314 + 1.3 M 2002 10.3 2002 2004 2006 1.3 MILLION CUSTOMERS IN ORGANIC GROWTH 2002-06 IS SIMILAR IN SIZE87% TO A DISTRIBUTION COMPANY SUCH AS CHILECTRA 16
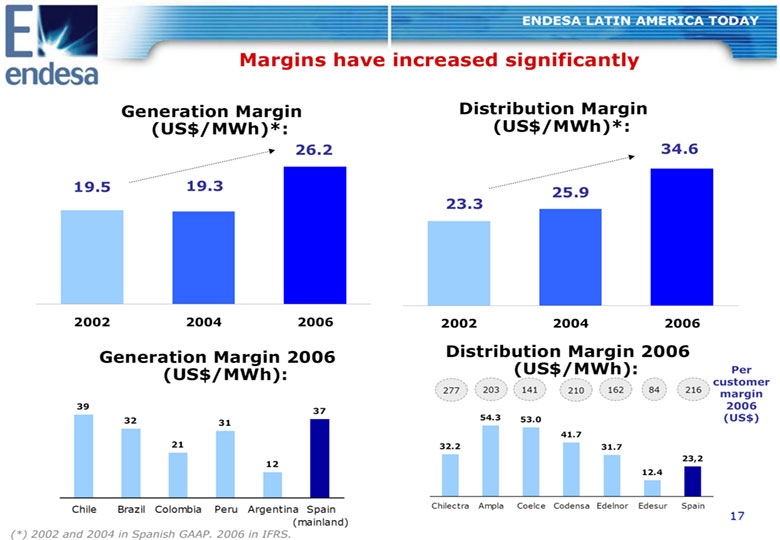
ENDESA LATIN AMERICA TODAY MARGINS HAVE INCREASED SIGNIFICANTLY GENERATION MARGIN DISTRIBUTION MARGIN (US$/MWH)*: (US$/MWH)*: 30.0 26.2 40.0 34.6 35.0 25.0 19.5 19.3 30.0 25.9 20.0 23.3 25.0 15.0 20.0 15.0 10.0 10.0 5.05.0 2002 2004 2006 2002 2004 2006 GENERATION MARGIN 2006 DISTRIBUTION MARGIN 2006 (US$/MWH): (US$/MWH): PER CUSTOMER 277 203 141 210 162 84 216 MARGIN 39 2006 37 32 54.3 53.0 (US$) 31 41.7 21 32.2 31.7 23,2 12 12.4 Chile Brazil Colombia Peru Argentina Spain Chilectra Ampla Coelce Codensa Edelnor Edesur Spain 17 (mainland) (*) 2002 AND 2004 IN SPANISH GAAP. 2006 IN IFRS.
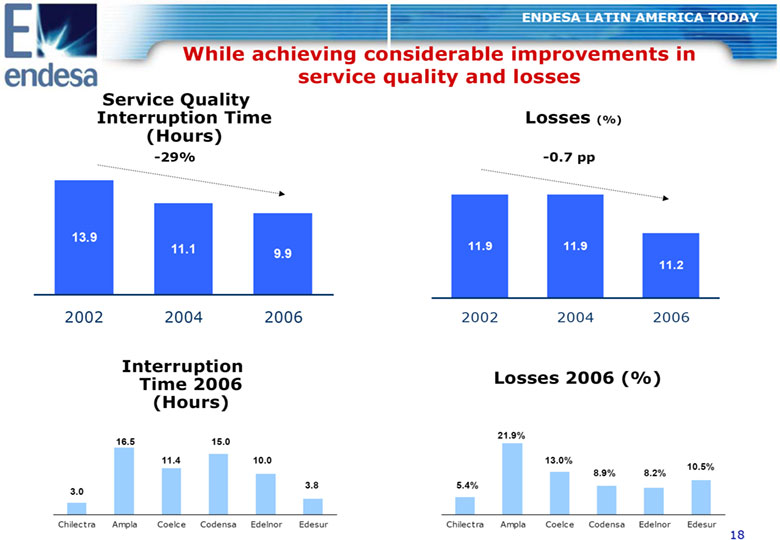
ENDESA LATIN AMERICA TODAY WHILE ACHIEVING CONSIDERABLE IMPROVEMENTS IN SERVICE QUALITY AND LOSSES SERVICE QUALITY INTERRUPTION TIME LOSSES (%) (HOURS) -29% - -0.7 PP 13.9 11.1 11.9 11.9 9.9 11.2 2002 2004 2006 2002 2004 2006 INTERRUPTION TIME 2006 LOSSES 2006 (%) (HOURS) 21.9% 16.5 15.0 11.4 10.0 13.0% 10.5% 8.9% 8.2% 3.8 5.4% 3.0 Chilectra Ampla Coelce Codensa Edelnor Edesur Chilectra Ampla Coelce Codensa Edelnor Edesur 18
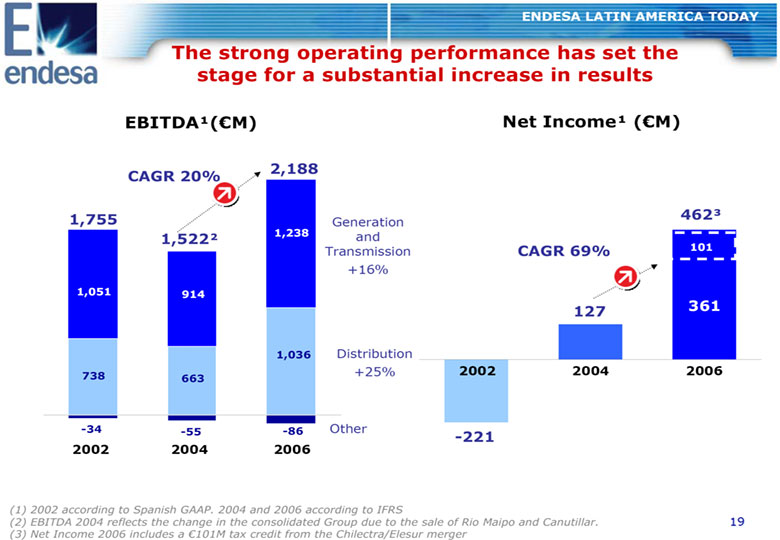
ENDESA LATIN AMERICA TODAY THE STRONG OPERATING PERFORMANCE HAS SET THE STAGE FOR A SUBSTANTIAL INCREASE IN RESULTS EBITDA(1)((EURO)M) NET INCOME(1) ((EURO)M) 2,188 CAGR 20% 1,755 462(3) Generation 1,522(2) 1,238 and Transmission CAGR 69% 101 +16% 1,051 914 127 361 1,036 Distribution 738 +25% 2002 2004 2006 663 -34 - -55 -86 Other -221 2002 2004 2006 (1) 2002 ACCORDING TO SPANISH GAAP. 2004 AND 2006 ACCORDING TO IFRS (2) EBITDA 2004 REFLECTS THE CHANGE IN THE CONSOLIDATED GROUP DUE TO THE SALE OF RIO MAIPO AND CANUTILLAR. 19 (3) NET INCOME 2006 INCLUDES A (EURO)101M TAX CREDIT FROM THE CHILECTRA/ELESUR MERGER
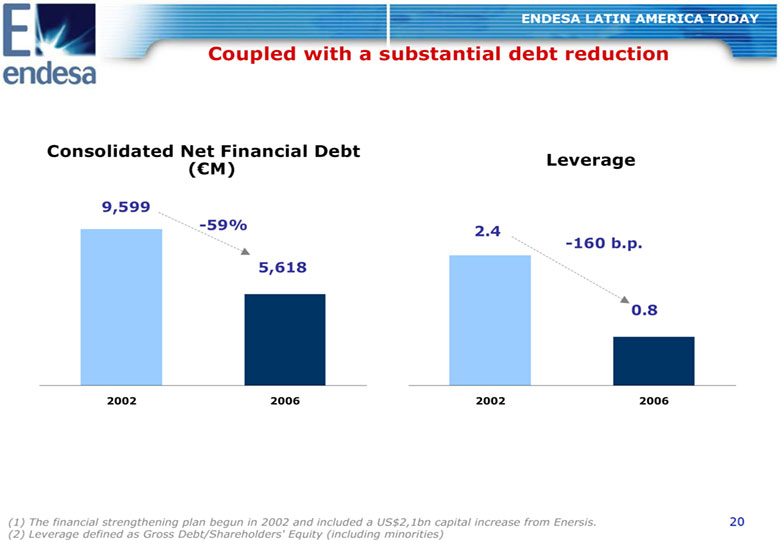
ENDESA LATIN AMERICA TODAY COUPLED WITH A SUBSTANTIAL DEBT REDUCTION CONSOLIDATED NET FINANCIAL DEBT LEVERAGE ((EURO)M) 9,599 -59% 2.4 -160 B.P. 5,618 0.8 2002 2006 2002 2006 (1) THE FINANCIAL STRENGTHENING PLAN BEGUN IN 2002 AND INCLUDED A US$2,1BN CAPITAL INCREASE FROM ENERSIS. 20 (2) LEVERAGE DEFINED AS GROSS DEBT/SHAREHOLDERS' EQUITY (INCLUDING MINORITIES)
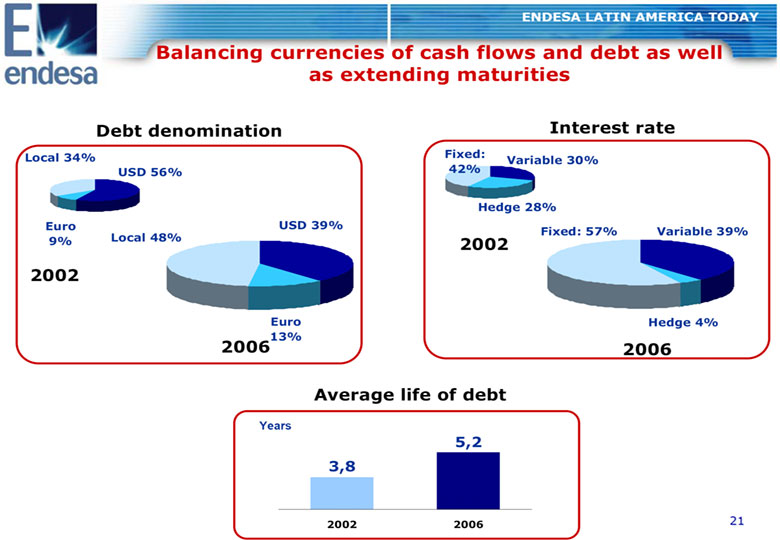
ENDESA LATIN AMERICA TODAY BALANCING CURRENCIES OF CASH FLOWS AND DEBT AS WELL AS EXTENDING MATURITIES DEBT DENOMINATION INTEREST RATE LOCAL 34% FIXED: VARIABLE 30% USD 56% 42% HEDGE 28% EURO USD 39% FIXED: 57% VARIABLE 39% 9% LOCAL 48% 2002 2002 EURO HEDGE 4% 13% 2006 2006 AVERAGE LIFE OF DEBT YEARS 5,2 3,8 2002 2006 21
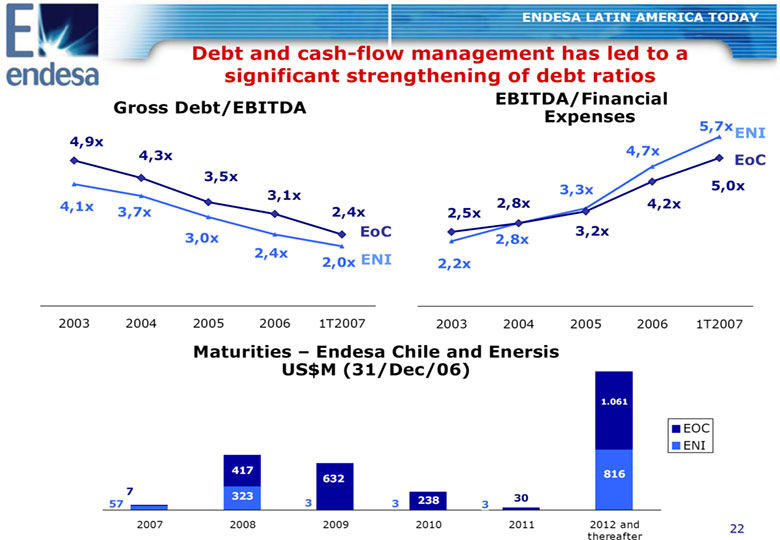
ENDESA LATIN AMERICA TODAY DEBT AND CASH-FLOW MANAGEMENT HAS LED TO A SIGNIFICANT STRENGTHENING OF DEBT RATIOS EBITDA/FINANCIAL GROSS DEBT/EBITDA EXPENSES 6 6 5,7XENI 4,9X 4,7X 5 4,3X 5 EOC 3,5X 4 4 3,3X 5,0X 3,1X 4,1X 2,8X 4,2X 3 3,7X 2,4X 3 2,5X EOC 3,2X 3,0X 2,8X 2 2,4X 2 2,0X ENI 2,2X 1 1 0 0 2003 2004 2005 2006 1T2007 2003 2004 2005 2006 1T2007 MATURITIES - ENDESA CHILE AND ENERSIS 2000 US$M (31/DEC/06) 1800 1600 1.061 1400 1200 EOC 1000 800 ENI 600 417 632 816 400 200 7 323 3 238 30 57 3 3 0 2007 2008 2009 2010 2011 2012 and 22 thereafter
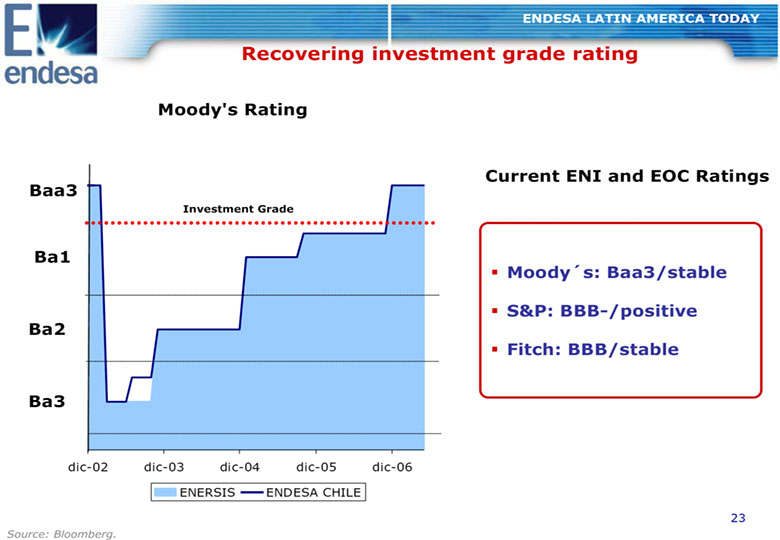
ENDESA LATIN AMERICA TODAY RECOVERING INVESTMENT GRADE RATING MOODY’S RATING 12 CURRENT ENI AND EOC RATINGS BAA311 10 INVESTMENT GRADE 9 BA1 8 MOODYS: BAA3/STABLE 7 6 S&P: BBB-/POSITIVE BA2 5 4 FITCH: BBB/STABLE 3 BA3 2 1 0 dic-02 dic-03 dic-04 dic-05 dic-06 ENERSIS ENDESA CHILE 23 SOURCE: BLOOMBERG.

ENDESA LATIN AMERICA TODAY CREATING VALUE FOR SHAREHOLDERS STOCK MARKET PERFORMANCE STOCK MARKET MARKET CAP INCREASE (US$M) LAST 5 YEARS ENDESA Record CHILE +520% 13.566 high (ADR) ENERSIS +223% 12.943 6 year (ADR) high JUN-02 JUN-03 JUN-04 JUN-05 JUN-06 JUN-07 STOCK MARKET PERFORMANCE SHOWS FAVOURABLE PERSPECTIVES FOR OUR LATIN AMERICAN SUBSIDIARIES 24 SOURCE: BLOOMBERG FROM 20 JUNE 02 TO 20 JUNE 07
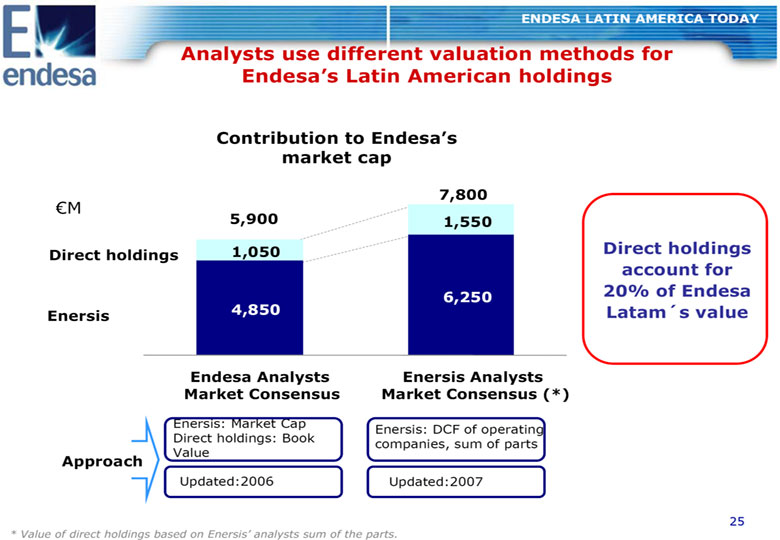
ENDESA LATIN AMERICA TODAY ANALYSTS USE DIFFERENT VALUATION METHODS FOR ENDESA'S LATIN AMERICAN HOLDINGS CONTRIBUTION TO ENDESA'S MARKET CAP 7,800 (euro)M 5,900 1,550 DIRECT HOLDINGS 1,050 DIRECT HOLDINGS ACCOUNT FOR 6,250 20% OF ENDESA ENERSIS 4,850 LATAMS VALUE ENDESA ANALYSTS ENERSIS ANALYSTS MARKET CONSENSUS MARKET CONSENSUS (*) Enersis: Market Cap Enersis: DCF of operating Direct holdings: Book companies, sum of parts Value APPROACH Updated:2006 Updated:2007 25 * VALUE OF DIRECT HOLDINGS BASED ON ENERSIS' ANALYSTS SUM OF THE PARTS.
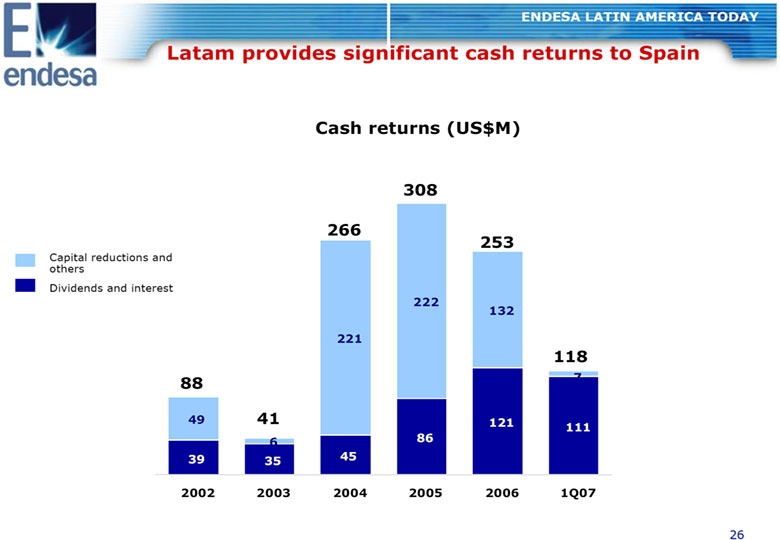
ENDESA LATIN AMERICA TODAY LATAM PROVIDES SIGNIFICANT CASH RETURNS TO SPAIN CASH RETURNS (US$M) 308 266 253 Capital reductions and others Dividends and interest 222 132 221 118 88 7 49 41 121 111 6 86 39 35 45 2002 2003 2004 2005 2006 1Q07 10,1 (87%) 26
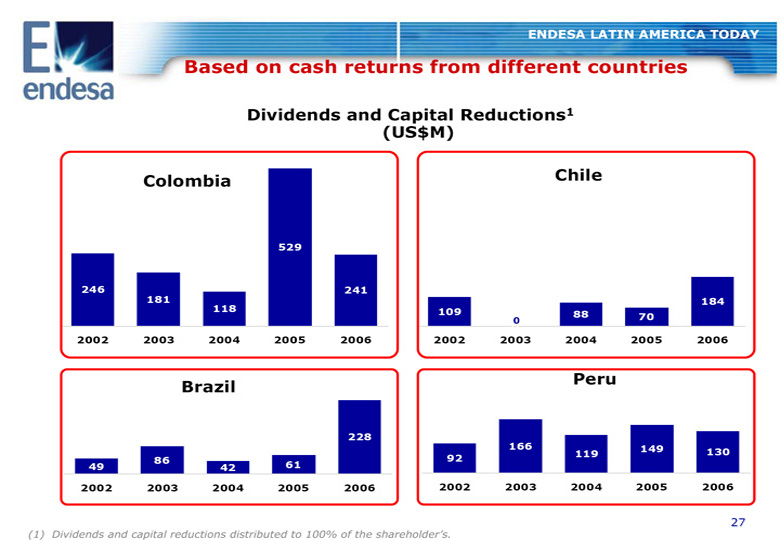
ENDESA LATIN AMERICA TODAY BASED ON CASH RETURNS FROM DIFFERENT COUNTRIES DIVIDENDS AND CAPITAL REDUCTIONS1 (US$M) COLOMBIA CHILE 529 246 241 181 184 118 109 88 70 0 0 2002 2003 2004 2005 2006 2002 2003 2004 2005 2006 BRAZIL PERU 228 166 149 119 130 86 92 49 42 61 2002 2003 2004 2005 2006 2002 2003 2004 2005 2006 27 (1) DIVIDENDS AND CAPITAL REDUCTIONS DISTRIBUTED TO 100% OF THE SHAREHOLDER'S.
AGENDA Unique business platform in Latin America capable of capturing market growth and minimising risk. Robust macroeconomic environment in the region. Strong outlook for our electricity markets. Significant opportunities ahead for profitable growth. 2009 targets clearly achievable. 28
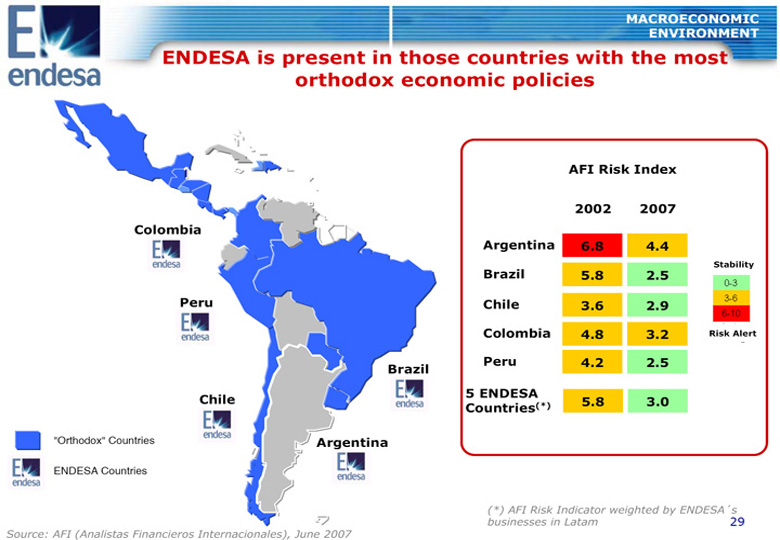
MACROECONOMIC ENVIRONMENT ENDESA IS PRESENT IN THOSE COUNTRIES WITH THE MOST ORTHODOX ECONOMIC POLICIES AFI RISK INDEX 2002 2007 COLOMBIA ARGENTINA 6.8 4.4 STABILITY BRAZIL 5.8 2.5 PERU CHILE 3.6 2.9 COLOMBIA 4.8 3.2 RISK ALERT PERU 4.2 2.5 BRAZIL CHILE 5 ENDESA 5.8 3.0 COUNTRIES(*) "Orthodox" Countries ARGENTINA ENDESA Countries (*) AFI RISK INDICATOR WEIGHTED BY ENDESAS BUSINESSES IN LATAM 29 SOURCE: AFI (ANALISTAS FINANCIEROS INTERNACIONALES), JUNE 2007
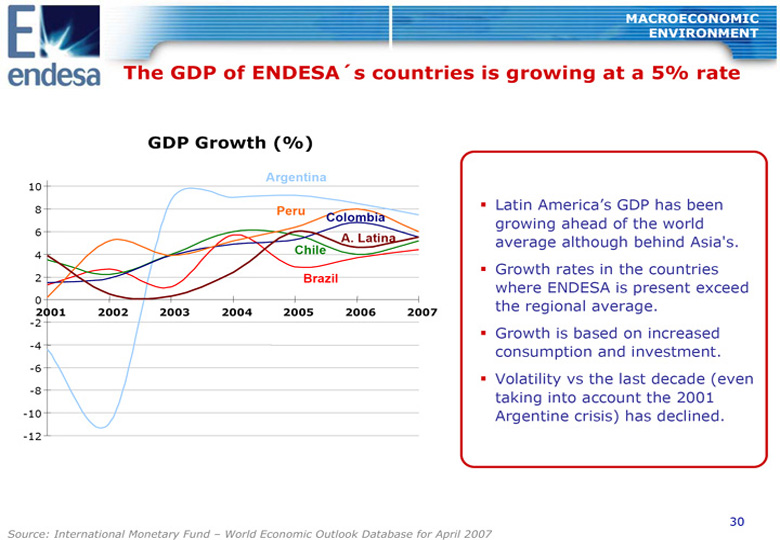
MACROECONOMIC ENVIRONMENT THE GDP OF ENDESAS COUNTRIES IS GROWING AT A 5% RATE GDP GROWTH (%) ARGENTINA 10 8 PERU Latin America's GDP has been COLOMBIA growing ahead of the world 6 A. LATINA average although behind Asia's. 4 CHILE Growth rates in the countries 2 BRAZIL where ENDESA is present exceed 0 the regional average. 2001 2002 2003 2004 2005 2006 2007 -2 Growth is based on increased -4 consumption and investment. -6 Volatility vs the last decade (even -8 taking into account the 2001 -10 Argentine crisis) has declined. -12 30 SOURCE: INTERNATIONAL MONETARY FUND - WORLD ECONOMIC OUTLOOK DATABASE FOR APRIL 2007
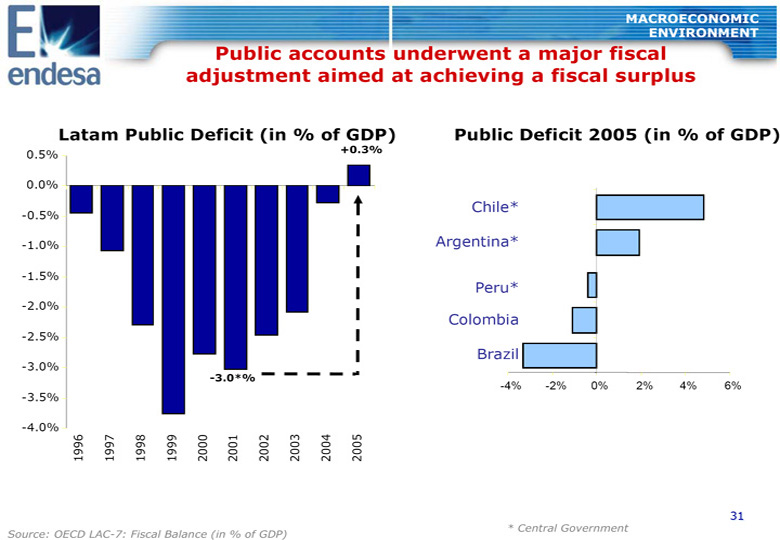
MACROECONOMIC ENVIRONMENT PUBLIC ACCOUNTS UNDERWENT A MAJOR FISCAL ADJUSTMENT AIMED AT ACHIEVING A FISCAL SURPLUS LATAM PUBLIC DEFICIT (IN % OF GDP) PUBLIC DEFICIT 2005 (IN % OF GDP) 0.5% +0.3% 0.0% Chile* -0.5% -1.0% Argentina* -1.5% Peru* -2.0% Colombia -2.5% Brazil -3.0% -3.0*% -4% -2% 0% 2% 4% 6% -3.5% -4.0% 1996 1997 1998 1999 2000 2001 2002 2003 2004 2005 31 * CENTRAL GOVERNMENT SOURCE: OECD LAC-7: FISCAL BALANCE (IN % OF GDP)
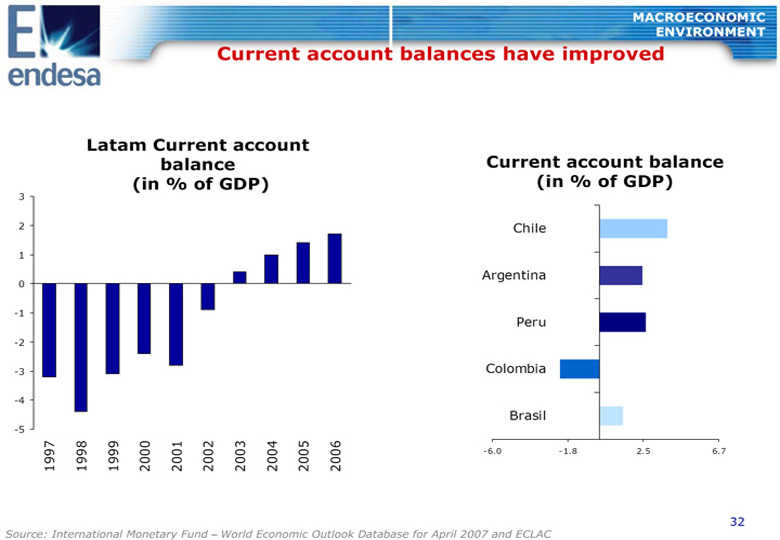
MACROECONOMIC ENVIRONMENT CURRENT ACCOUNT BALANCES HAVE IMPROVED LATAM CURRENT ACCOUNT BALANCE CURRENT ACCOUNT BALANCE (IN % OF GDP) (IN % OF GDP) 3 2 Chile 1 Argentina 0 -1 Peru -2 -3 Colombia -4 Brasil -5 1997 1998 1999 2000 2001 2002 2003 2004 2005 2006 -6.0 -1.8 2.5 6.7 32 SOURCE: INTERNATIONAL MONETARY FUND - WORLD ECONOMIC OUTLOOK DATABASE FOR APRIL 2007 AND ECLAC
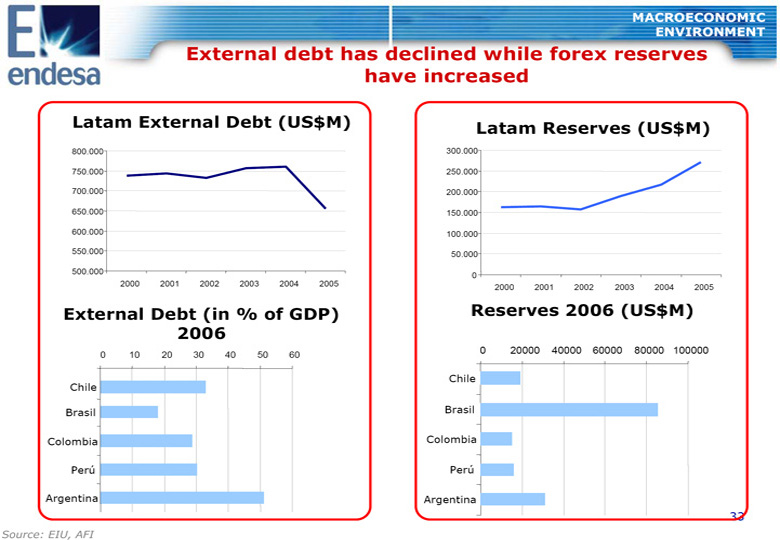
MACROECONOMIC ENVIRONMENT EXTERNAL DEBT HAS DECLINED WHILE FOREX RESERVES HAVE INCREASED LATAM EXTERNAL DEBT (US$M) LATAM RESERVES (US$M) 800.000 300.000 750.000 250.000 700.000 200.000 650.000 150.000 600.000 100.000 550.000 50.000 500.000 0 2000 2001 2002 2003 2004 2005 2000 2001 2002 2003 2004 2005 EXTERNAL DEBT (IN % OF GDP) RESERVES 2006 (US$M) 2006 0 20000 40000 60000 80000 100000 0 10 20 30 40 50 60 Chile Chile Brasil Brasil Colombia Colombia Peru Peru Argentina Argentina 33 SOURCE: EIU, AFI
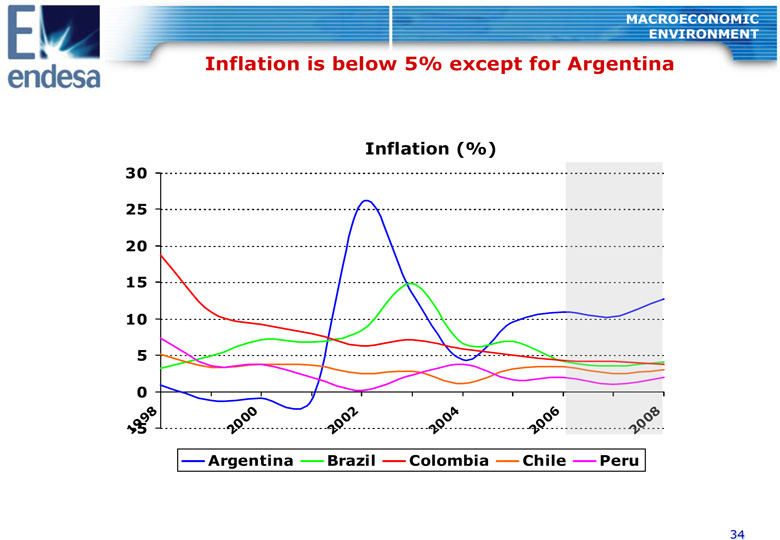
MACROECONOMIC ENVIRONMENT INFLATION IS BELOW 5% EXCEPT FOR ARGENTINA INFLATION (%) 30 25 20 15 10 5 0 8 0 2 4 6 8 (9) (0) (0) (0) (0) 0 -5 (9) (0) (0) (0) (0) (0) (1) (2) (2) (2) (2) (2) ARGENTINA BRAZIL COLOMBIA CHILE PERU 34
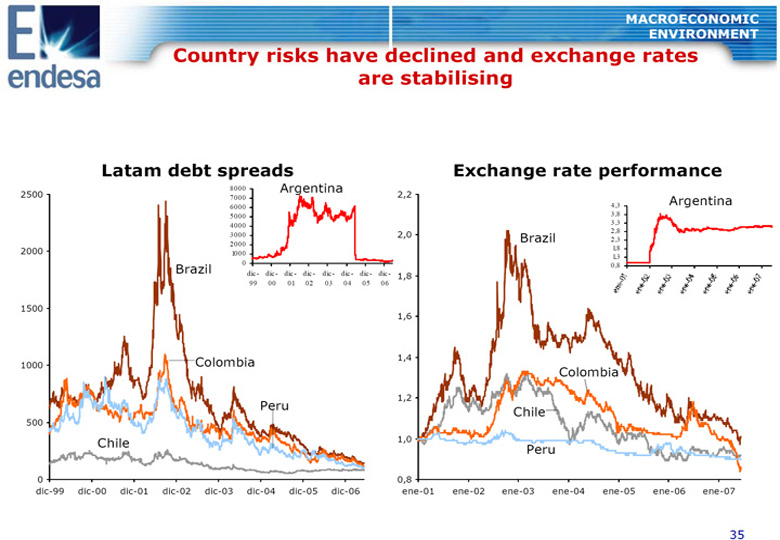
MACROECONOMIC ENVIRONMENT COUNTRY RISKS HAVE DECLINED AND EXCHANGE RATES ARE STABILISING LATAM DEBT SPREADS EXCHANGE RATE PERFORMANCE 8000 Argentina 2500 7000 2,2 Argentina 6000 4,3 5000 3,8 4000 3,3 2,8 3000 2,0 Brazil 2,3 2000 2000 1,8 1000 1,3 Brazil 0 0,8 dic - dic- dic - dic- dic- dic - dic- dic - 1,8 99 00 01 02 03 04 05 06 1500 1,6 Colombia 1,4 1000 Colombia 1,2 Peru Chile 500 Chile 1,0 Peru 0 0,8 dic-99 dic-00 dic-01 dic-02 dic-03 dic-04 dic-05 dic-06 ene-01 ene-02 ene-03 ene-04 ene-05 ene-06 ene-07 35
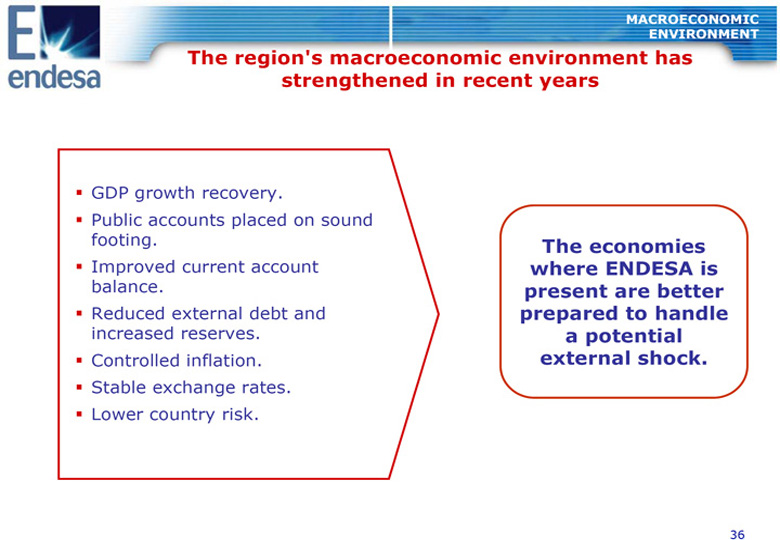
MACROECONOMIC ENVIRONMENT THE REGION'S MACROECONOMIC ENVIRONMENT HAS STRENGTHENED IN RECENT YEARS GDP growth recovery. Public accounts placed on sound footing. THE ECONOMIES Improved current account WHERE ENDESA IS balance. PRESENT ARE BETTER Reduced external debt and PREPARED TO HANDLE increased reserves. A POTENTIAL Controlled inflation. EXTERNAL SHOCK. Stable exchange rates. Lower country risk. 36
AGENDA Unique business platform in Latin America capable of capturing market growth and minimising risk. Robust macroeconomic environment in the region. Strong outlook for our electricity markets. Significant opportunities ahead for profitable growth. 2009 targets clearly achievable. 37
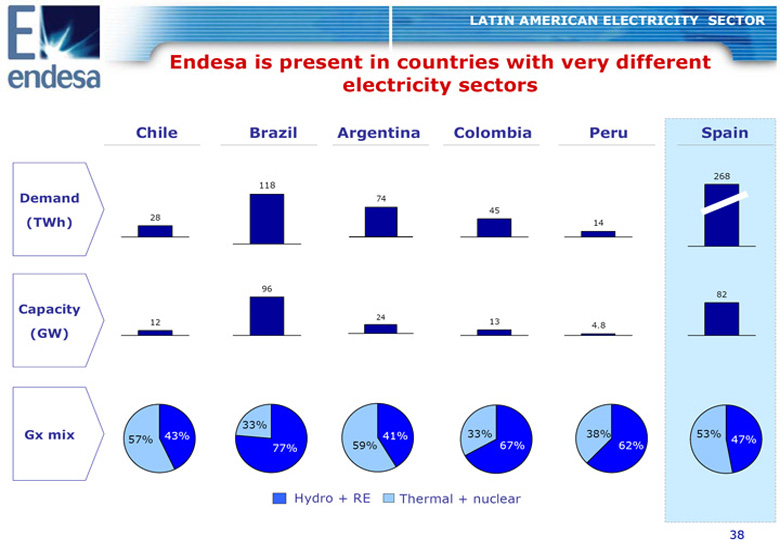
LATIN AMERICAN ELECTRICITY SECTOR ENDESA IS PRESENT IN COUNTRIES WITH VERY DIFFERENT ELECTRICITY SECTORS CHILE BRAZIL ARGENTINA COLOMBIA PERU SPAIN 268 118 DEMAND 74 45 28 (TWH) 14 96 82 CAPACITY 24 12 13 4.8 (GW) 33% GX MIX 43% 33% 38% 57% 53% 47% 77% 59% 41% 67% 62% Hydro + RE Thermal + nuclear 38
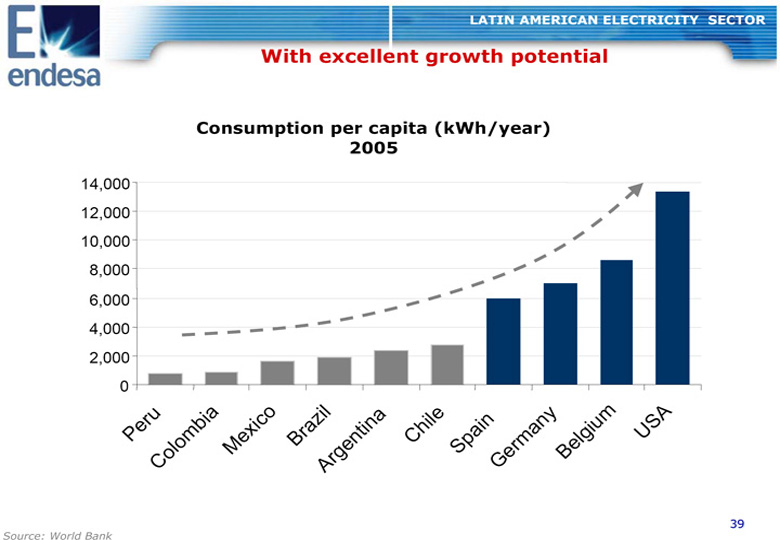
LATIN AMERICAN ELECTRICITY SECTOR WITH EXCELLENT GROWTH POTENTIAL CONSUMPTION PER CAPITA (KWH/YEAR) 2005 14,000 12,000 10,000 8,000 6,000 4,000 2,000 0 PERU A E USA COLOMBIAMEXICO BRAZIL ARGENTIN CHILSPAIN GERMANY BELGIUM 39 SOURCE: WORLD BANK
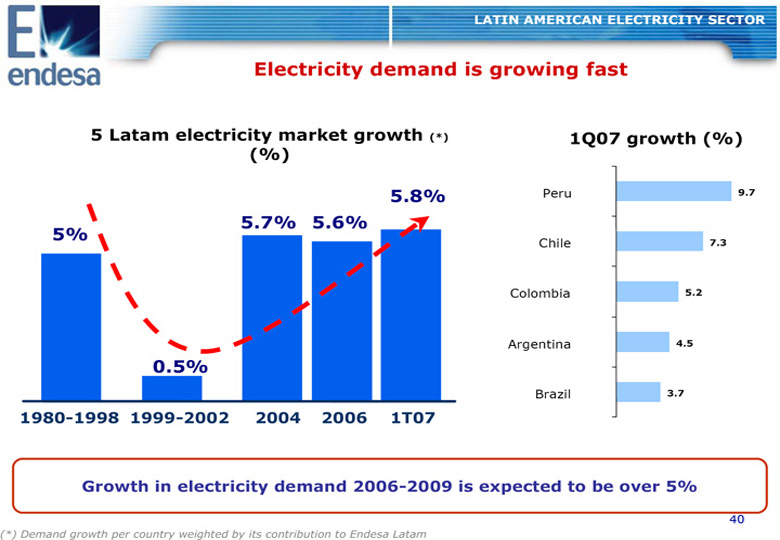
LATIN AMERICAN ELECTRICITY SECTOR ELECTRICITY DEMAND IS GROWING FAST 5 LATAM ELECTRICITY MARKET GROWTH (*) 1Q07 GROWTH (%) (%) 5.8% Peru 9.7 5.7% 5.6% 5% Chile 7.3 Colombia 5.2 Argentina 4.5 0.5% Brazil 3.7 1980-1998 1999-2002 2004 2006 1T07 GROWTH IN ELECTRICITY DEMAND 2006-2009 IS EXPECTED TO BE OVER 5% 40 (*) DEMAND GROWTH PER COUNTRY WEIGHTED BY ITS CONTRIBUTION TO ENDESA LATAM
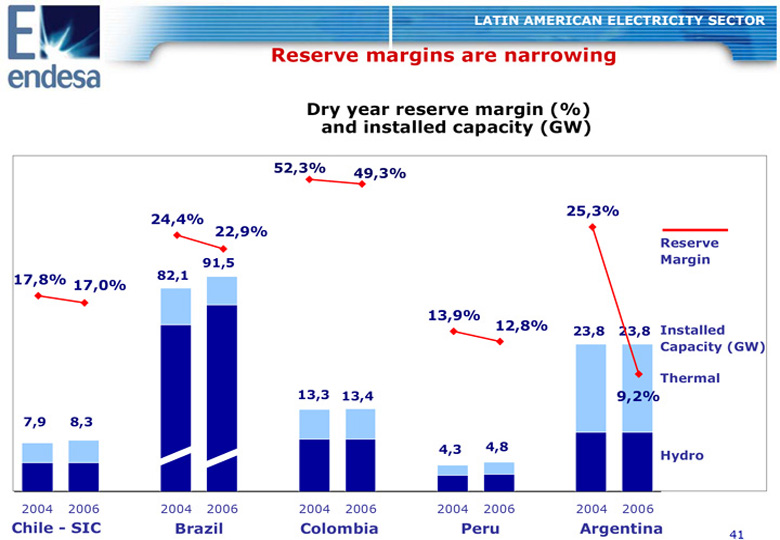
LATIN AMERICAN ELECTRICITY SECTOR RESERVE MARGINS ARE NARROWING DRY YEAR RESERVE MARGIN (%) AND INSTALLED CAPACITY (GW) 52,3% 49,3% 25,3% 24,4% 22,9% RESERVE 91,5 MARGIN 17,8% 82,1 17,0% 13,9% 12,8% 23,8 23,8 INSTALLED CAPACITY (GW) THERMAL 13,3 13,4 9,2% 7,9 8,3 4,3 4,8 HYDRO 2004 2006 2004 2006 2004 2006 2004 2006 2004 2006 CHILE - SIC BRAZIL COLOMBIA PERU ARGENTINA 41
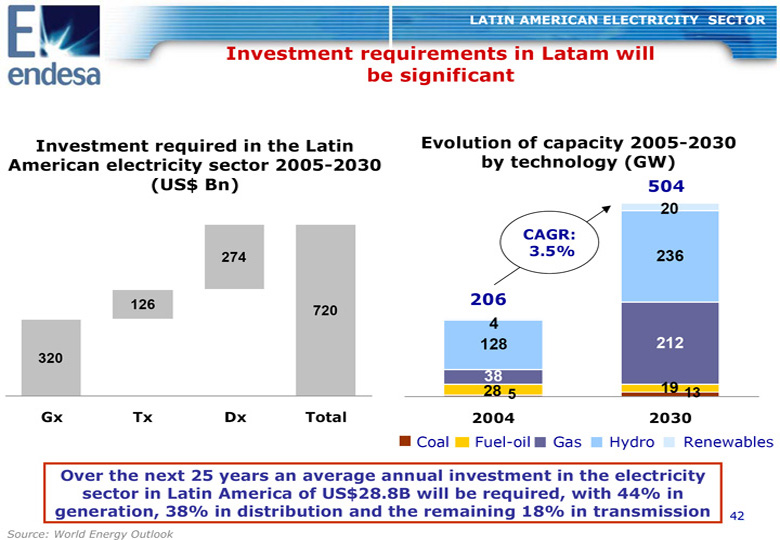
LATIN AMERICAN ELECTRICITY SECTOR INVESTMENT REQUIREMENTS IN LATAM WILL BE SIGNIFICANT INVESTMENT REQUIRED IN THE LATIN EVOLUTION OF CAPACITY 2005-2030 AMERICAN ELECTRICITY SECTOR 2005-2030 BY TECHNOLOGY (GW) (US$ BN) 504 20 CAGR: 274 3.5% 236 126 206 720 4 128 212 320 38 28 5 19 13 GX TX DX TOTAL 2004 2030 Coal Fuel-oil Gas Hydro Renewables OVER THE NEXT 25 YEARS AN AVERAGE ANNUAL INVESTMENT IN THE ELECTRICITY SECTOR IN LATIN AMERICA OF US$28.8B WILL BE REQUIRED, WITH 44% IN GENERATION, 38% IN DISTRIBUTION AND THE REMAINING 18% IN TRANSMISSION 42 SOURCE: WORLD ENERGY OUTLOOK
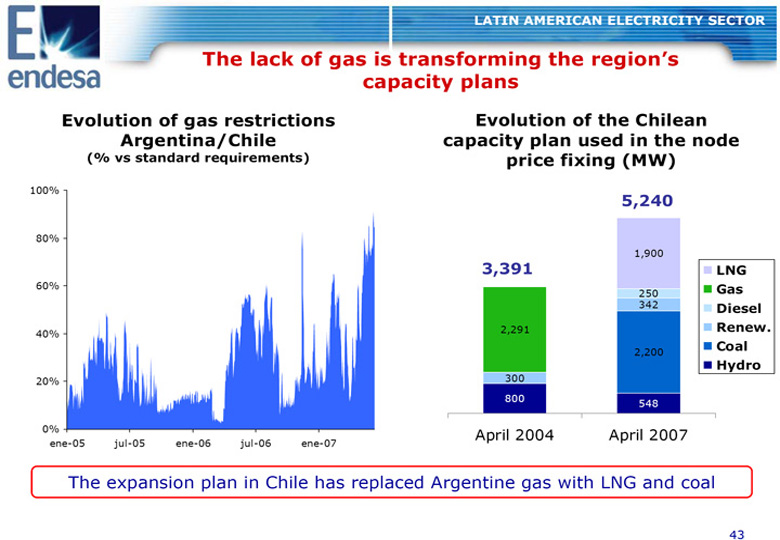
LATIN AMERICAN ELECTRICITY SECTOR THE LACK OF GAS IS TRANSFORMING THE REGION'S CAPACITY PLANS EVOLUTION OF GAS RESTRICTIONS EVOLUTION OF THE CHILEAN ARGENTINA/CHILE CAPACITY PLAN USED IN THE NODE (% VS STANDARD REQUIREMENTS) PRICE FIXING (MW) 100% 5,240 80% 1,900 3,391 LNG 60% GAS 250 342 DIESEL 2,291 RENEW. 40% COAL 2,200 HYDRO 20% 300 800 548 0% April 2004 April 2007 ene-05 jul-05 ene-06 jul-06 ene-07 The expansion plan in Chile has replaced Argentine gas with LNG and coal 43
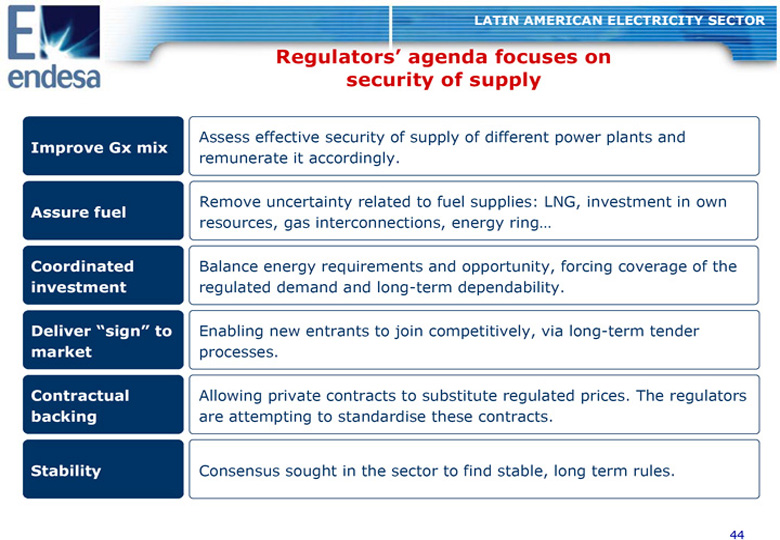
LATIN AMERICAN ELECTRICITY SECTOR REGULATORS' AGENDA FOCUSES ON SECURITY OF SUPPLY Assess effective security of supply of different power plants and IMPROVE GX MIX remunerate it accordingly. Remove uncertainty related to fuel supplies: LNG, investment in own ASSURE FUEL resources, gas interconnections, energy ring... COORDINATED Balance energy requirements and opportunity, forcing coverage of the INVESTMENT regulated demand and long-term dependability. DELIVER "SIGN" TO Enabling new entrants to join competitively, via long-term tender MARKET processes. CONTRACTUAL Allowing private contracts to substitute regulated prices. The regulators BACKING are attempting to standardise these contracts. STABILITY Consensus sought in the sector to find stable, long term rules. 44
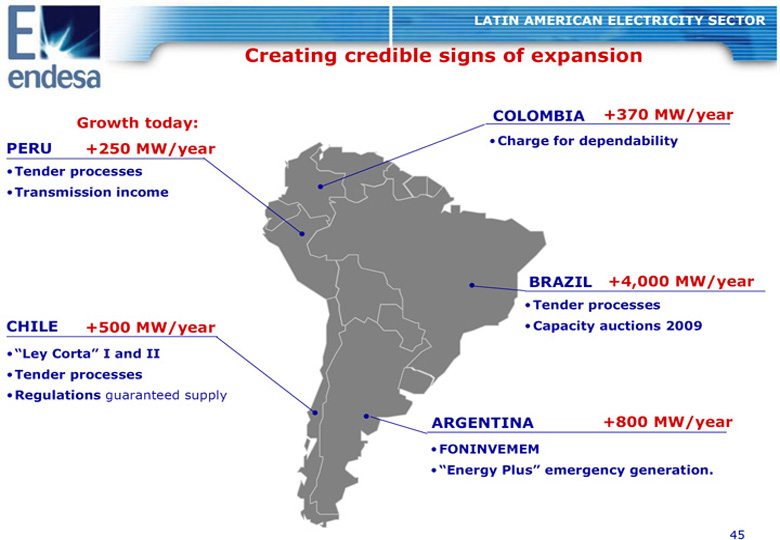
LATIN AMERICAN ELECTRICITY SECTOR CREATING CREDIBLE SIGNS OF EXPANSION COLOMBIA +370 MW/YEAR GROWTH TODAY: PERU oCHARGE FOR DEPENDABILITY +250 MW/YEAR oTENDER PROCESSES oTRANSMISSION INCOME BRAZIL +4,000 MW/YEAR oTENDER PROCESSES CHILE +500 MW/YEAR oCAPACITY AUCTIONS 2009 o"LEY CORTA" I AND II oTENDER PROCESSES oREGULATIONS guaranteed supply ARGENTINA +800 MW/YEAR oFONINVEMEM o"ENERGY PLUS" EMERGENCY GENERATION. 45
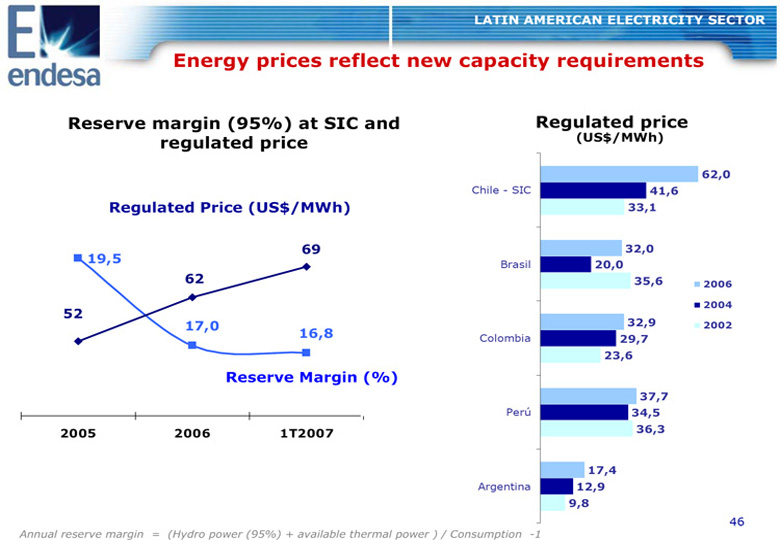
LATIN AMERICAN ELECTRICITY SECTOR ENERGY PRICES REFLECT NEW CAPACITY REQUIREMENTS RESERVE MARGIN (95%) AT SIC AND REGULATED PRICE REGULATED PRICE (US$/MWH) 62,0 Chile - SIC 41,6 REGULATED PRICE (US$/MWH) 33,1 20 75 69 32,0 19,5 19,5 70 Brasil 20,0 19 62 65 35,6 2006 18,5 60 2004 18 52 17,0 32,9 2002 17,5 16,8 55 Colombia 29,7 17 50 23,6 16,5 RESERVE MARGIN (%) 45 16 40 37,7 15,5 15 35 Peru 34,5 2005 2006 1T2007 36,3 17,4 Argentina 12,9 9,8 46 ANNUAL RESERVE MARGIN = (HYDRO POWER (95%) + AVAILABLE THERMAL POWER ) / CONSUMPTION -1
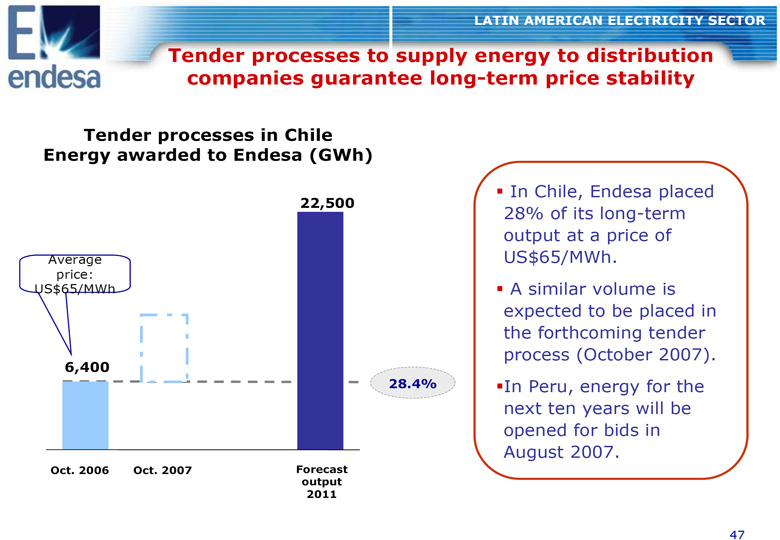
LATIN AMERICAN ELECTRICITY SECTOR TENDER PROCESSES TO SUPPLY ENERGY TO DISTRIBUTION COMPANIES GUARANTEE LONG-TERM PRICE STABILITY TENDER PROCESSES IN CHILE ENERGY AWARDED TO ENDESA (GWH) In Chile, Endesa placed 22,500 28% of its long-term output at a price of Average US$65/MWh. price: US$65/MWh A similar volume is expected to be placed in the forthcoming tender process (October 2007). 6,400 28.4% In Peru, energy for the next ten years will be opened for bids in August 2007. OCT. 2006 OCT. 2007 FORECAST OUTPUT 2011 47
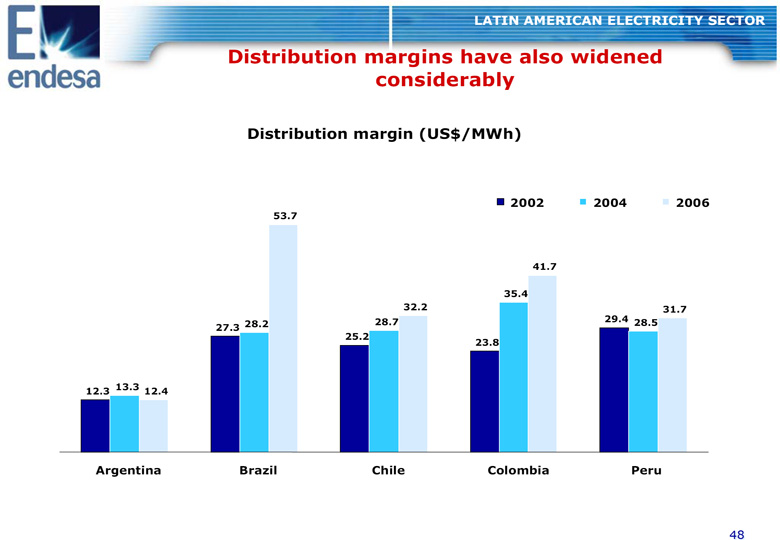
LATIN AMERICAN ELECTRICITY SECTOR DISTRIBUTION MARGINS HAVE ALSO WIDENED CONSIDERABLY DISTRIBUTION MARGIN (US$/MWH) 2002 2004 2006 53.7 41.7 35.4 32.2 31.7 28.7 29.4 28.5 27.3 28.2 25.2 23.8 12.3 13.3 12.4 ARGENTINA BRAZIL CHILE COLOMBIA PERU 48
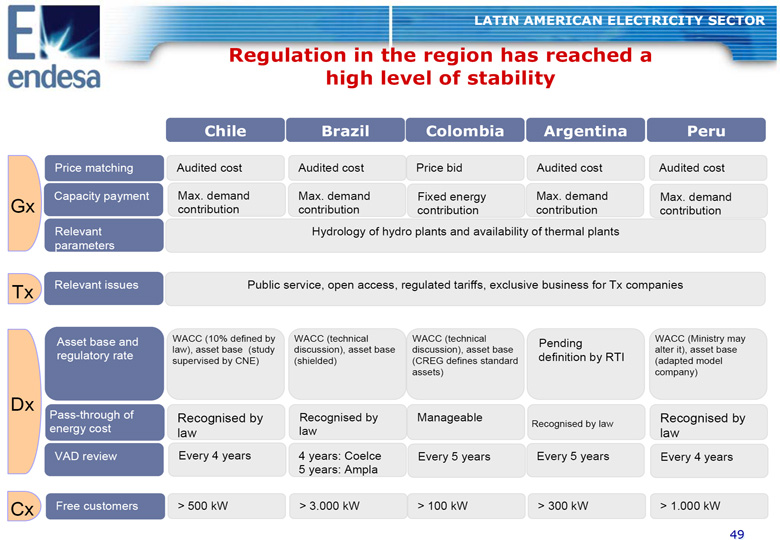
LATIN AMERICAN ELECTRICITY SECTOR REGULATION IN THE REGION HAS REACHED A HIGH LEVEL OF STABILITY CHILE BRAZIL COLOMBIA ARGENTINA PERU Price matching Audited cost Audited cost Price bid Audited cost Audited cost Capacity payment Max. demand Max. demand Fixed energy Max. demand Max. demand Gx contribution contribution contribution contribution contribution Relevant Hydrology of hydro plants and availability of thermal plants parameters Tx Relevant issues Public service, open access, regulated tariffs, exclusive business for Tx companies Asset base and WACC (10% defined by WACC (technical WACC (technical Pending WACC (Ministry may law), asset base (study discussion), asset base discussion), asset base alter it), asset base regulatory rate definition by RTI supervised by CNE) (shielded) (CREG defines standard (adapted model assets) company) Dx Pass-through of Recognised by Recognised by Manageable Recognised by energy cost Recognised by law law law law VAD review Every 4 years 4 years: Coelce Every 5 years Every 5 years Every 4 years 5 years: Ampla Cx Free customers > 500 kW > 3.000 kW > 100 kW > 300 kW > 1.000 kW 49
AGENDA Unique business platform in Latin America capable of capturing market growth and minimising risk. Robust macroeconomic environment in the region. Strong outlook for our electricity markets. Significant opportunities ahead for profitable growth. 2009 targets clearly achievable. 50
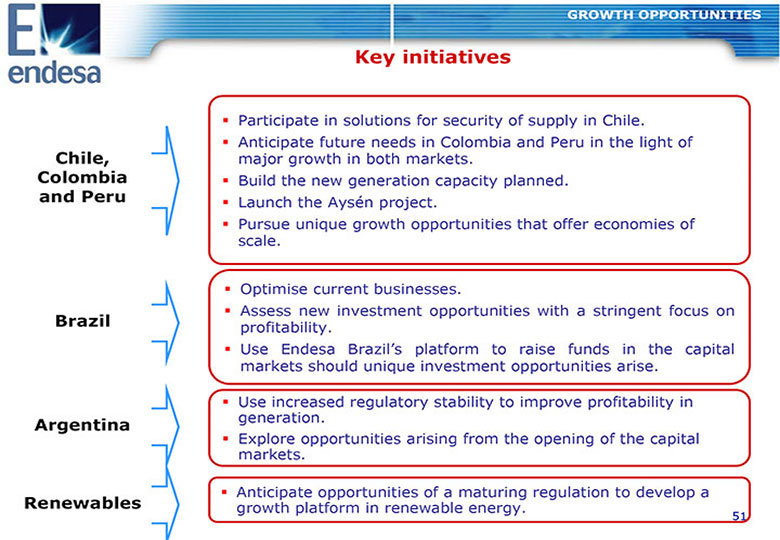
GROWTH OPPORTUNITIES KEY INITIATIVES Participate in solutions for security of supply in Chile. Anticipate future needs in Colombia and Peru in the light of CHILE, major growth in both markets. COLOMBIA Build the new generation capacity planned. AND PERU Launch the Aysen project. Pursue unique growth opportunities that offer economies of scale. Optimise current businesses. Assess new investment opportunities with a stringent focus on BRAZIL profitability. Use Endesa Brazil's platform to raise funds in the capital markets should unique investment opportunities arise. Use increased regulatory stability to improve profitability in ARGENTINA generation. Explore opportunities arising from the opening of the capital markets. Anticipate opportunities of a maturing regulation to develop a RENEWABLES growth platform in renewable energy. 51
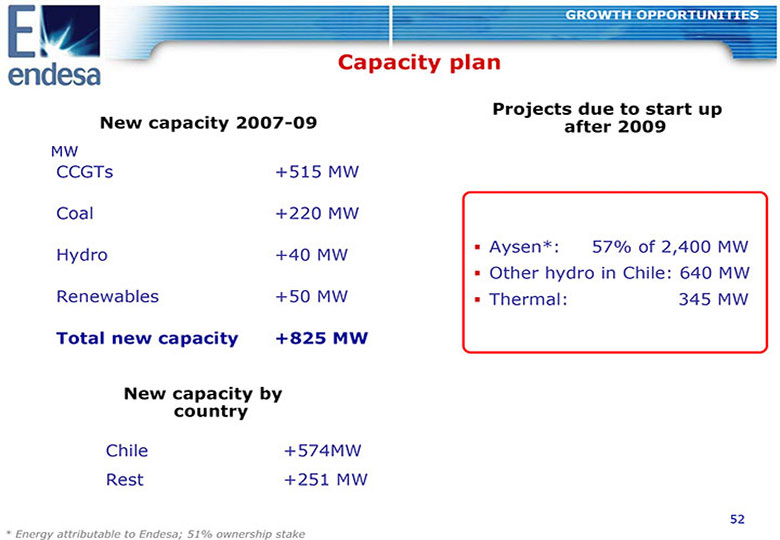
GROWTH OPPORTUNITIES CAPACITY PLAN PROJECTS DUE TO START UP NEW CAPACITY 2007-09 AFTER 2009 MW CCGTs +515 MW Coal +220 MW Hydro +40 MW Aysen*: 57% of 2,400 MW Other hydro in Chile: 640 MW Renewables +50 MW Thermal: 345 MW TOTAL NEW CAPACITY +825 MW NEW CAPACITY BY COUNTRY Chile +574MW Rest +251 MW 52 * ENERGY ATTRIBUTABLE TO ENDESA; 51% OWNERSHIP STAKE
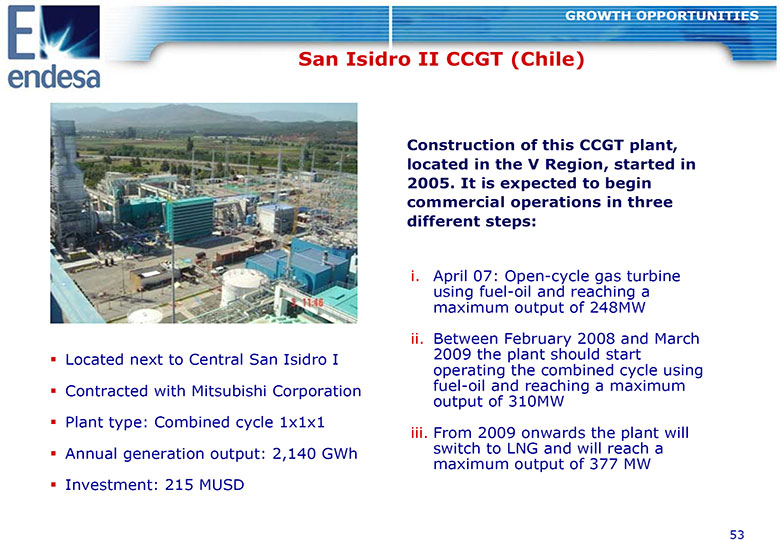
GROWTH OPPORTUNITIES SAN ISIDRO II CCGT (CHILE) CONSTRUCTION OF THIS CCGT PLANT, LOCATED IN THE V REGION, STARTED IN 2005. IT IS EXPECTED TO BEGIN. COMMERCIAL OPERATIONS IN THREE DIFFERENT STEPS: i. i. April 07: Open-cycle gas turbine - using fuel-oil and reaching a - a maximum output of 248MW ii. ii. Between February 2008 and March Located next to Central San Isidro I 2009 the plant should start I operating the combined cycle using Contracted with Mitsubishi Corporation fuel-oil and reaching a maximum- a output of 310MW Plant type: Combined cycle 1x1x1 iii..From 2009 onwards the plant will Annual generation output: 2,140 GWh switch to LNG and will reach a a maximum output of 377 MW Investment: 215 MUSD 53
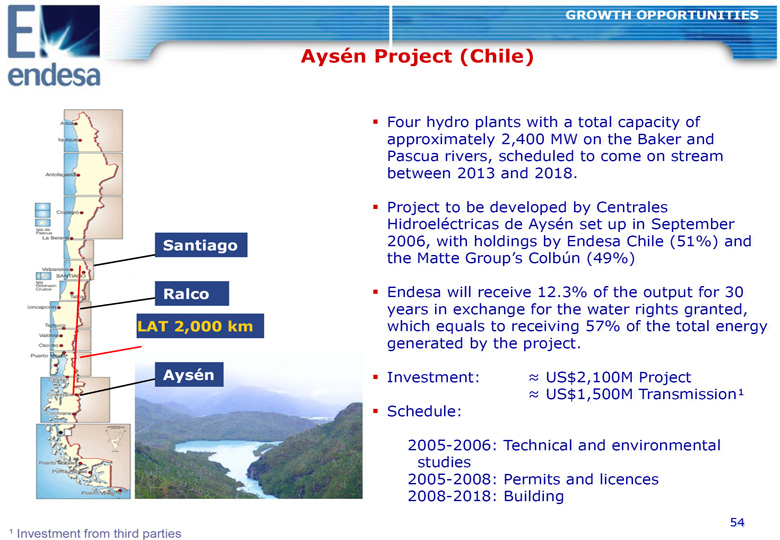
GROWTH OPPORTUNITIES AYSEN PROJECT (CHILE) Four hydro plants with a total capacity of a approximately 2,400 MW on the Baker and Pascua rivers, scheduled to come on stream between 2013 and 2018. . Project to be developed by Centrales Hidroelectricas de Aysen set up in September SANTIAGO 2006, with holdings by Endesa Chile (51%) and the Matte Group's Colbun (49%) RALCO Endesa will receive 12.3% of the output for 30 . years in exchange for the water rights granted, e LAT 2,000 KM which equals to receiving 57% of the total energy g y generated by the project. . AYSEN Investment: US$2,100M Project US$1,500M Transmission(1) Schedule: 2005-2006: Technical and environmental- studies 2005-2008: Permits and licences - 2008-2018: Building - 54 (1)Investment from third parties
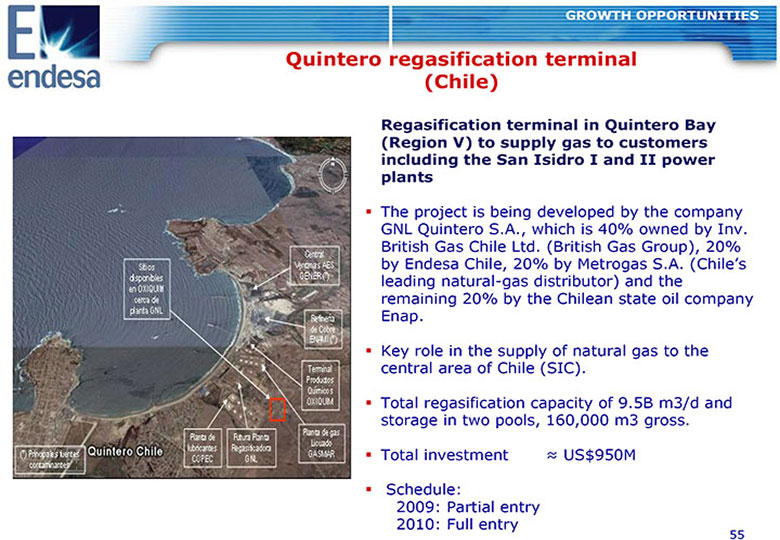
GROWTH OPPORTUNITIES QUINTERO REGASIFICATION TERMINAL (CHILE) REGASIFICATION TERMINAL IN QUINTERO BAY (REGION V) TO SUPPLY GAS TO CUSTOMERS INCLUDING THE SAN ISIDRO I AND II POWER I PLANTS The project is being developed by the company GNL Quintero S.A., which is 40% owned by Inv. . ., . British Gas Chile Ltd. (British Gas Group), 20% . by Endesa Chile, 20% by Metrogas S.A. (Chile's. . leading natural-gas distributor) and the - remaining 20% by the Chilean state oil company Enap.. Key role in the supply of natural gas to the central area of Chile (SIC). . Total regasification capacity of 9.5B m3/d and . storage in two pools, 160,000 m3 gross. . Total investment US$950M Schedule: 2009: Partial entry 2010: Full entry 55
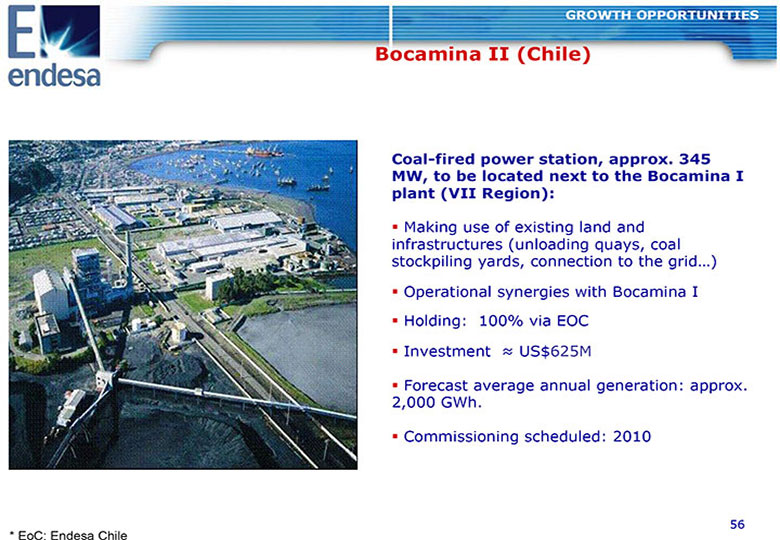
GROWTH OPPORTUNITIES BOCAMINA II (CHILE) COAL-FIRED POWER STATION, APPROX. 345- .. MW, TO BE LOCATED NEXT TO THE BOCAMINA II PLANT (VII REGION): Making use of existing land and infrastructures (unloading quays, coal stockpiling yards, connection to the grid...) ) Operational synergies with Bocamina II Holding: 100% via EOC Investment US$625M US$625M Forecast average annual generation: approx. . 2,000 GWh. . Commissioning scheduled: 2010 56 * EoC: Endesa Chile
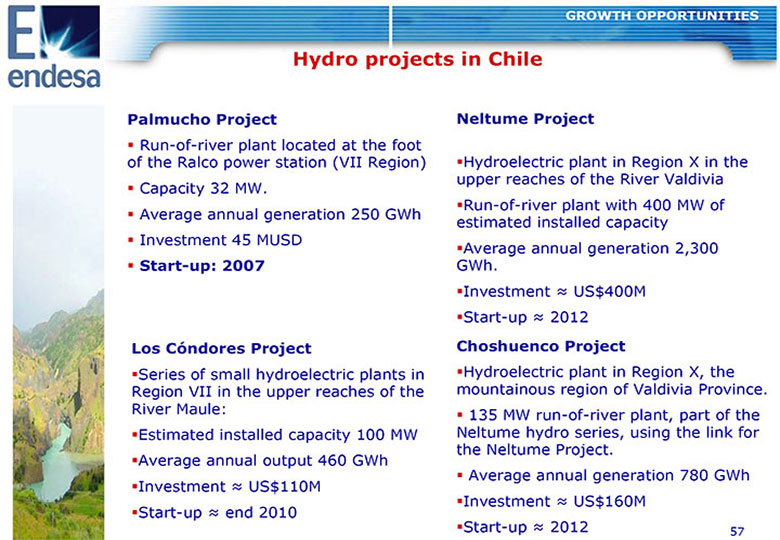
GROWTH OPPORTUNITIES HYDRO PROJECTS IN CHILE PALMUCHO PROJECT NELTUME PROJECT Run-of-river plant located at the foot of the Ralco power station (VII Region) Hydroelectric plant in Region X in the upper reaches of the River Valdivia Capacity 32 MW. Run-of-river plant with 400 MW of Average annual generation 250 GWh estimated installed capacity Investment 45 MUSD Average annual generation 2,300 START-UP: 2007 GWh. Investment US$400M Start-up 2012 LOS CONDORES PROJECT CHOSHUENCO PROJECT Series of small hydroelectric plants in Hydroelectric plant in Region X, the Region VII in the upper reaches of the mountainous region of Valdivia Province. River Maule: 135 MW run-of-river plant, part of the Estimated installed capacity 100 MW Neltume hydro series, using the link for the Neltume Project. Average annual output 460 GWh Average annual generation 780 GWh Investment US$110M Investment US$160M Start-up end 2010 Start-up 2012 57

GROWTH OPPORTUNITIES RENEWABLES: TAKING THE FIRST STEPS BEFORE THE REGULATION COMPLETES ITS MATURING PROCESS CURRENT SITUATION The development of renewable energies in the region is still at an early Develop projects stage and little diversified. according to the regulations' degree of Legislation aimed at development (incentives), developing renewable focusing mainly on Chile energies is already in place and Brazil. in all the countries, but for the time being offers Guarantee the limited incentives. development of future projects by seeking and The development of identifying today sites of renewable energies follows greatest value. Endesa's principle of commitment to society and environment. 58
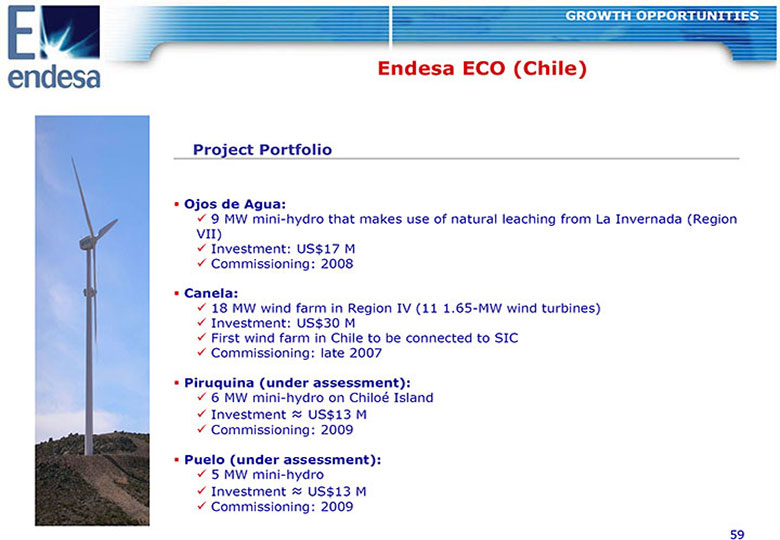
GROWTH OPPORTUNITIES ENDESA ECO (CHILE) PROJECT PORTFOLIO OJOS DE AGUA: 9 MW mini-hydro that makes use of natural leaching from La Invernada 9 - (Region VII) Investment: US$17 M Commissioning: 2008 CANELA: 18 MW wind farm in Region IV (11 1.65-MW wind turbines) 1. - Investment: US$30 M First wind farm in Chile to be connected to SIC Commissioning: late 2007 PIRUQUINA (UNDER ASSESSMENT): 6 MW mini-hydro on Chiloe 6 - Island Investment US$13 M Commissioning: 2009 PUELO (UNDER ASSESSMENT): 5 MW mini-hydro 5 - Investment US$13 M Commissioning: 2009 59
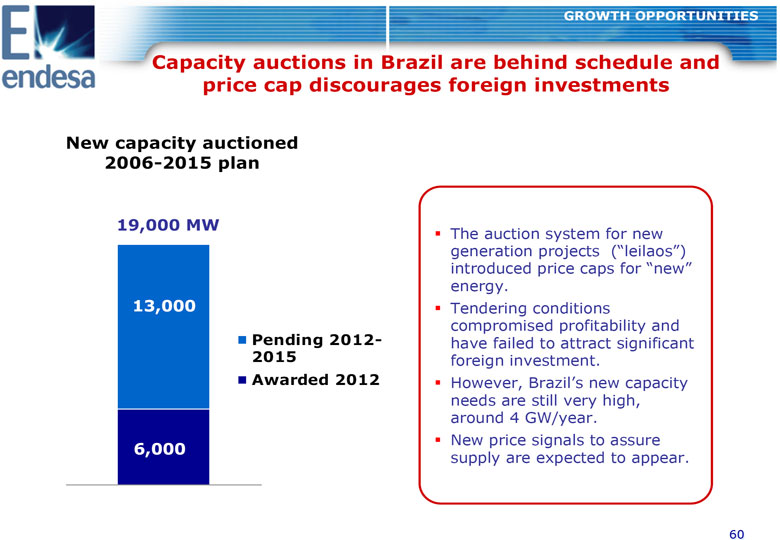
GROWTH OPPORTUNITIES CAPACITY AUCTIONS IN BRAZIL ARE BEHIND SCHEDULE AND PRICE CAP DISCOURAGES FOREIGN INVESTMENTS NEW CAPACITY AUCTIONED 2006-2015 PLAN 19,000 MW The auction system for new generation projects ("leilaos") introduced price caps for "new" energy. 13,000 Tendering conditions compromised profitability and PENDING 2012- have failed to attract significant 2015 foreign investment. AWARDED 2012 However, Brazil's new capacity needs are still very high, around 4 GW/year. 6,000 New price signals to assure supply are expected to appear. 60
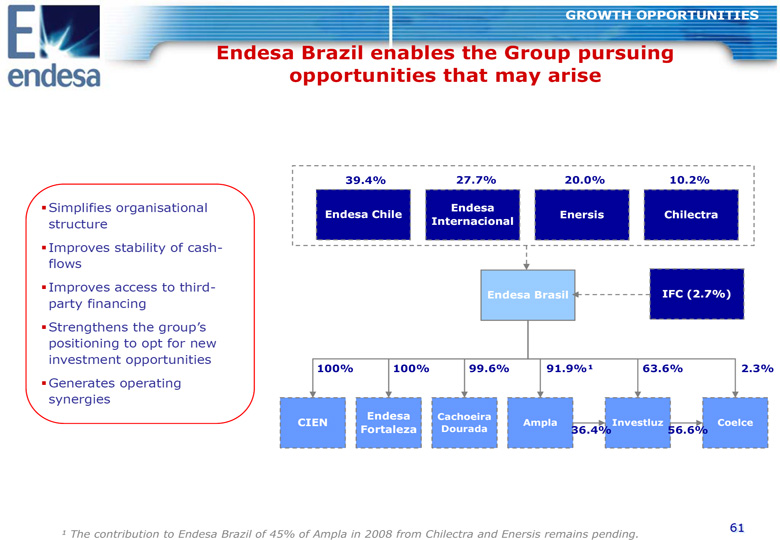
GROWTH OPPORTUNITIES ENDESA BRAZIL ENABLES THE GROUP PURSUING OPPORTUNITIES THAT MAY ARISE 39.4% 27.7% 20.0% 10.2% Simplifies organisational ENDESA ENDESA CHILE ENERSIS CHILECTRA structure INTERNACIONAL Improves stability of cash-flows Improves access to third- ENDESA BRASIL IFC (2.7%) party financing Strengthens the group's positioning to opt for new investment opportunities 100% 100% 99.6% 91.9%(1) 63.6% 2.3% Generates operating synergies ENDESA CACHOEIRA CIEN AMPLA INVESTLUZ COELCE FORTALEZA DOURADA 36.4% 56.6% 61
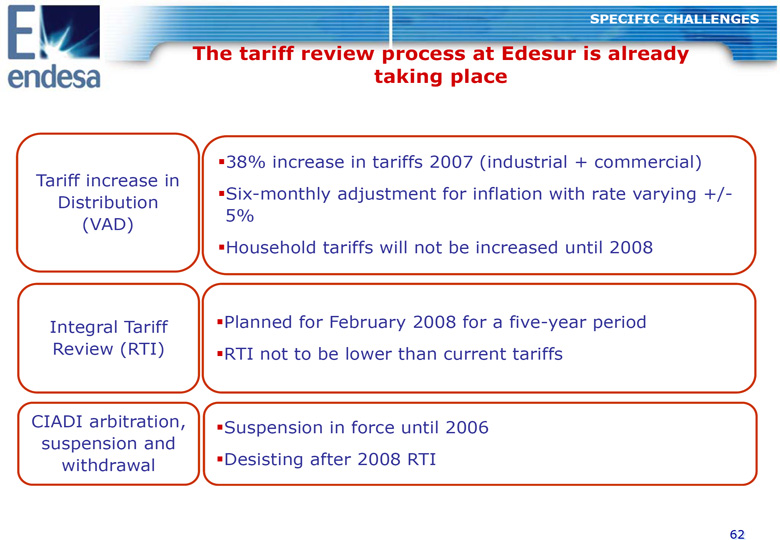
(1) THE CONTRIBUTION TO ENDESA BRAZIL OF 45% OF AMPLA IN 2008 FROM CHILECTRA AND ENERSIS REMAINS PENDING. SPECIFIC CHALLENGES THE TARIFF REVIEW PROCESS AT EDESUR IS ALREADY TAKING PLACE 38% increase in tariffs 2007 (industrial + commercial) Tariff increase in Six-monthly adjustment for inflation with rate varying +/-Distribution 5% (VAD) Household tariffs will not be increased until 2008 Integral Tariff Planned for February 2008 for a five-year period Review (RTI) RTI not to be lower than current tariffs CIADI arbitration, Suspension in force until 2006 suspension and Desisting after 2008 RTI withdrawal 62
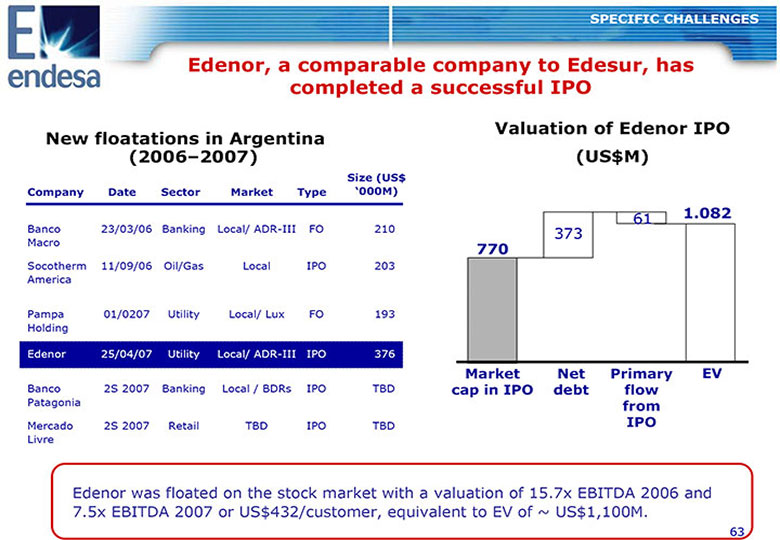
SPECIFIC CHALLENGES EDENOR, A COMPARABLE COMPANY TO EDESUR, HAS COMPLETED A SUCCESSFUL IPO VALUATION OF EDENOR IPO NEW FLOATATIONS IN ARGENTINA (2006-2007) (US$M) SIZE (US$ COMPANY DATE SECTOR MARKET TYPE `000M) 61 1.082 Banco 23/03/06 Banking Local/ ADR-III FO 210 373 Macro 770 Socotherm 11/09/06 Oil/GasLocal IPO 203 America Pampa 01/0207 Utility Local/ Lux FO 193 Holding Edenor 25/04/07 Utility Local/ ADR-III IPO 376 MARKET NET PRIMARY EV Banco 2S 2007 Banking Local / BDRs IPO TBD CAP IN IPO DEBT FLOW Patagonia FROM Mercado 2S 2007 Retail TBD IPO TBD IPO Livre Edenor was floated on the stock market with a valuation of 15.7x EBITDA 2006 and 7.5x EBITDA 2007 or US$432/customer, equivalent to EV of ~ US$1,100M. 63
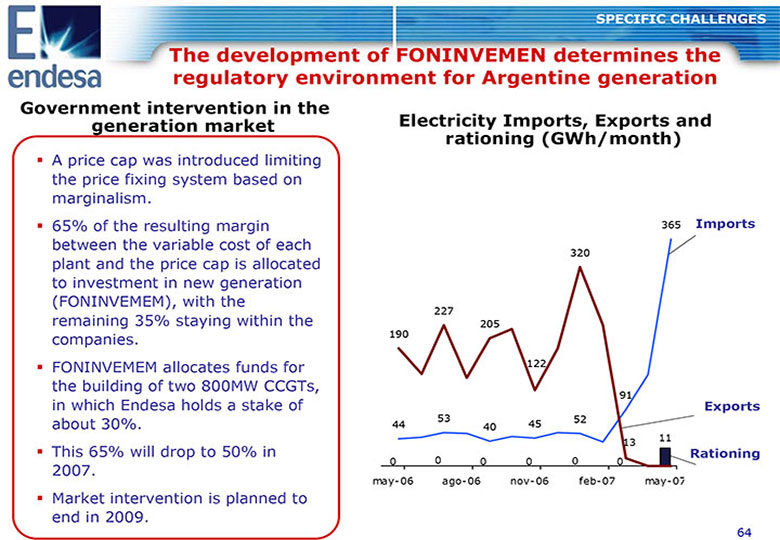
SPECIFIC CHALLENGES THE DEVELOPMENT OF FONINVEMEN DETERMINES THE REGULATORY ENVIRONMENT FOR ARGENTINE GENERATION GOVERNMENT INTERVENTION IN THE GENERATION MARKET ELECTRICITY IMPORTS, EXPORTS AND RATIONING (GWH/MONTH) A price cap was introduced limiting the price fixing system based on marginalism. 65% of the resulting margin 365 IMPORTS between the variable cost of each 320 plant and the price cap is allocated to investment in new generation (FONINVEMEM), with the 227 remaining 35% staying within the 205 companies. 190 FONINVEMEM allocates funds for 122 the building of two 800MW CCGTs, 91 in which Endesa holds a stake of EXPORTS 53 52 about 30%. 44 40 45 13 11 This 65% will drop to 50% in RATIONING 0 0 0 0 0 0 2007. may-06 ago-06 nov-06 feb-07 may-07 Market intervention is planned to end in 2009. 64
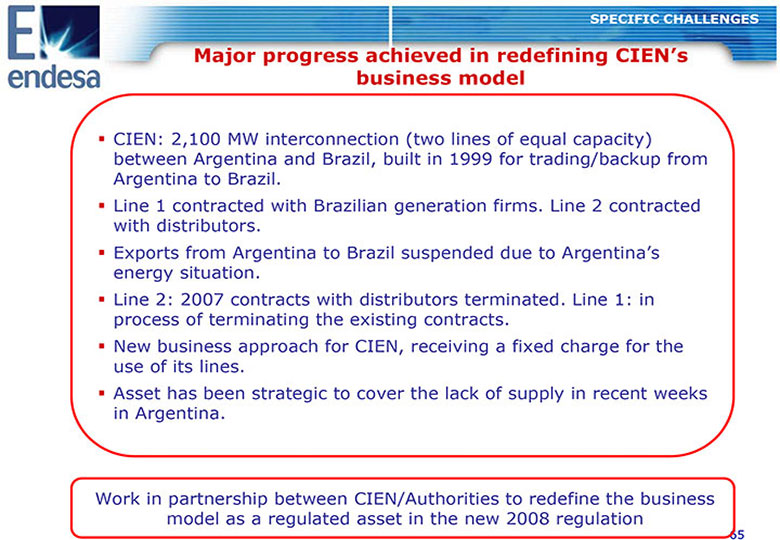
SPECIFIC CHALLENGES MAJOR PROGRESS ACHIEVED IN REDEFINING CIEN'S BUSINESS MODEL CIEN: 2,100 MW interconnection (two lines of equal capacity) between Argentina and Brazil, built in 1999 for trading/backup from Argentina to Brazil. Line 1 contracted with Brazilian generation firms. Line 2 contracted with distributors. Exports from Argentina to Brazil suspended due to Argentina's energy situation. Line 2: 2007 contracts with distributors terminated. Line 1: in process of terminating the existing contracts. New business approach for CIEN, receiving a fixed charge for the use of its lines. Asset has been strategic to cover the lack of supply in recent weeks in Argentina. Work in partnership between CIEN/Authorities to redefine the business model as a regulated asset in the new 2008 regulation 65
AGENDA Unique business platform in Latin America capable of capturing market growth and minimising risk. Robust macroeconomic environment in the region. Strong outlook for our electricity markets. Significant opportunities ahead for profitable growth. 2009 targets clearly achievable. 66
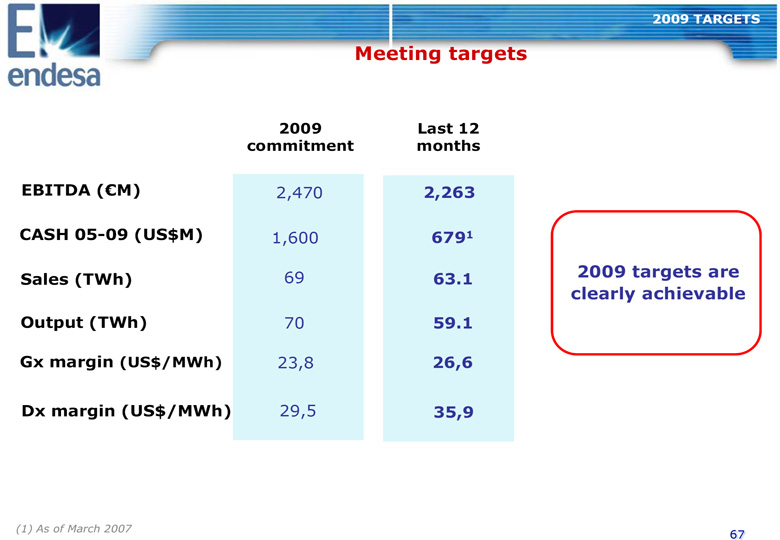
2009 TARGETS MEETING TARGETS 2009 LAST 12 COMMITMENT MONTHS EBITDA ((EURO)M) 2,470 2,263 CASH 05-09 (US$M) 1,600 679(1) SALES (TWH) 69 63.1 2009 TARGETS ARE CLEARLY ACHIEVABLE OUTPUT (TWH) 70 59.1 GX MARGIN (US$/MWH) 23,8 26,6 DX MARGIN (US$/MWH) 29,5 35,9 (1) AS OF MARCH 2007 67
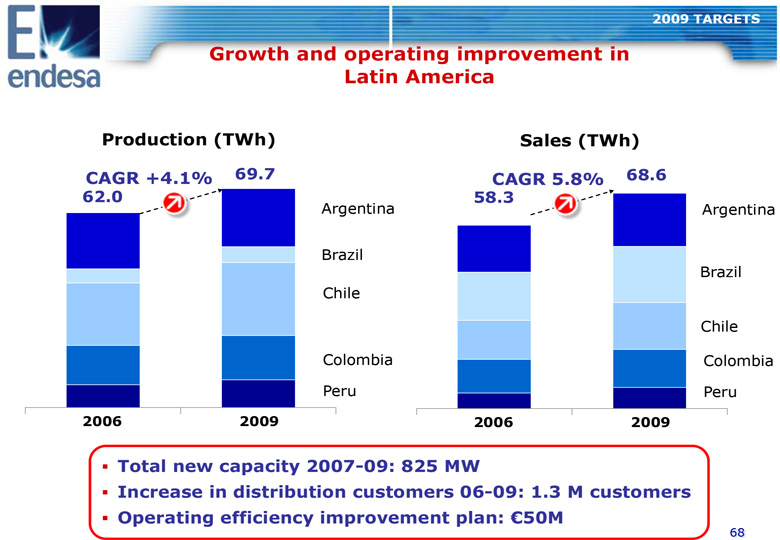
2009 TARGETS GROWTH AND OPERATING IMPROVEMENT IN LATIN AMERICA PRODUCTION (TWH) SALES (TWH) CAGR +4.1% 69.7CAGR 5.8% 68.6 62.058.3 Argentina Argentina Brazil Brazil Chile Chile Colombia Colombia Peru Peru 2006 2009 2006 2009 TOTAL NEW CAPACITY 2007-09: 825 MW INCREASE IN DISTRIBUTION CUSTOMERS 06-09: 1.3 M CUSTOMERS OPERATING EFFICIENCY IMPROVEMENT PLAN: (EURO)50M 68
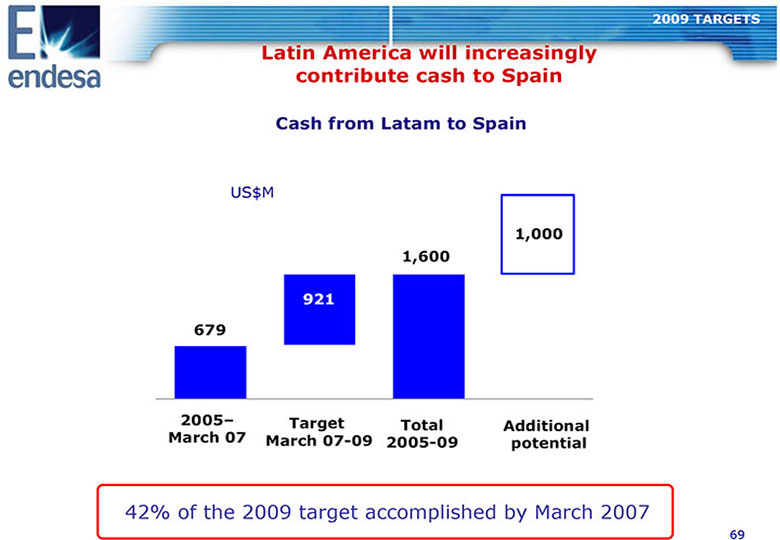
2009 TARGETS LATIN AMERICA WILL INCREASINGLY CONTRIBUTE CASH TO SPAIN CASH FROM LATAM TO SPAIN US$M 1,000 1,600 921 679 2005- TARGET TOTAL ADDITIONAL MARCH 07 MARCH 07-09 2005-09 POTENTIAL 42% of the 2009 target accomplished by March 2007 69
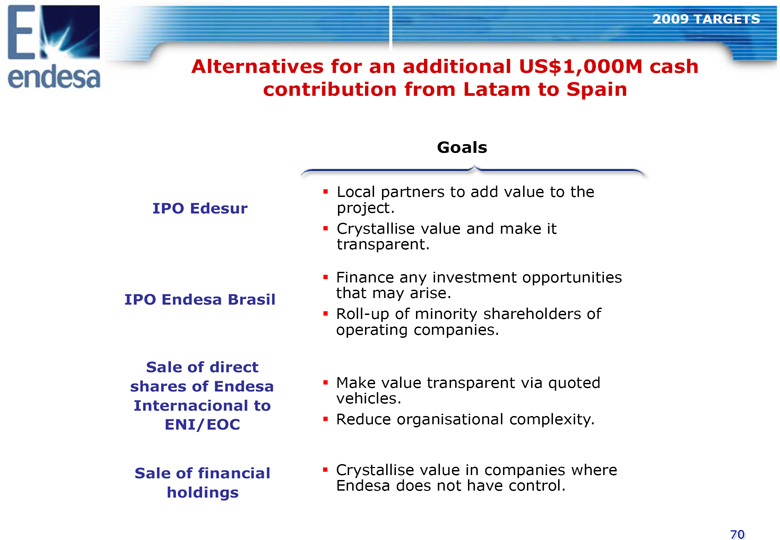
2009 TARGETS ALTERNATIVES FOR AN ADDITIONAL US$1,000M CASH CONTRIBUTION FROM LATAM TO SPAIN GOALS Local partners to add value to the IPO EDESUR project. Crystallise value and make it transparent. Finance any investment opportunities that may arise. IPO ENDESA BRASIL Roll-up of minority shareholders of operating companies. SALE OF DIRECT SHARES OF ENDESA Make value transparent via quoted vehicles. INTERNACIONAL TO ENI/EOC Reduce organisational complexity. SALE OF FINANCIAL Crystallise value in companies where Endesa does not have control. HOLDINGS 70
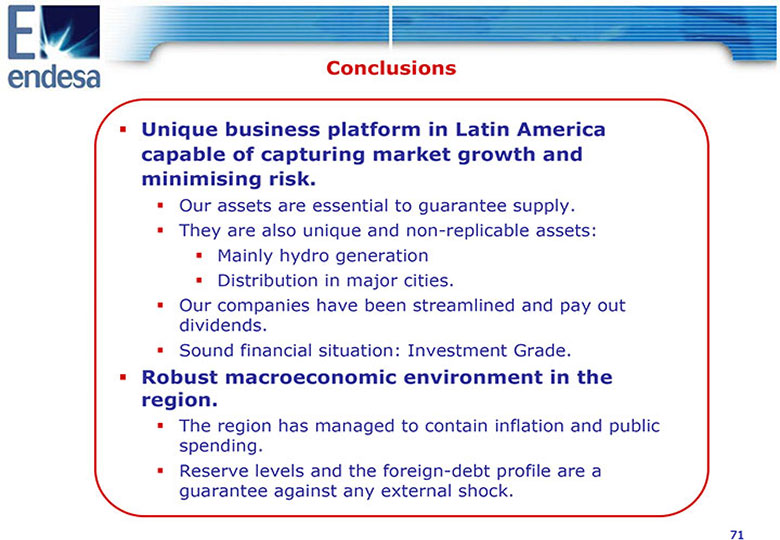
CONCLUSIONS UNIQUE BUSINESS PLATFORM IN LATIN AMERICA CAPABLE OF CAPTURING MARKET GROWTH AND MINIMISING RISK. Our assets are essential to guarantee supply. They are also unique and non-replicable assets: Mainly hydro generation Distribution in major cities. Our companies have been streamlined and pay out dividends. Sound financial situation: Investment Grade. ROBUST MACROECONOMIC ENVIRONMENT IN THE REGION. The region has managed to contain inflation and public spending. Reserve levels and the foreign-debt profile are a guarantee against any external shock. 71
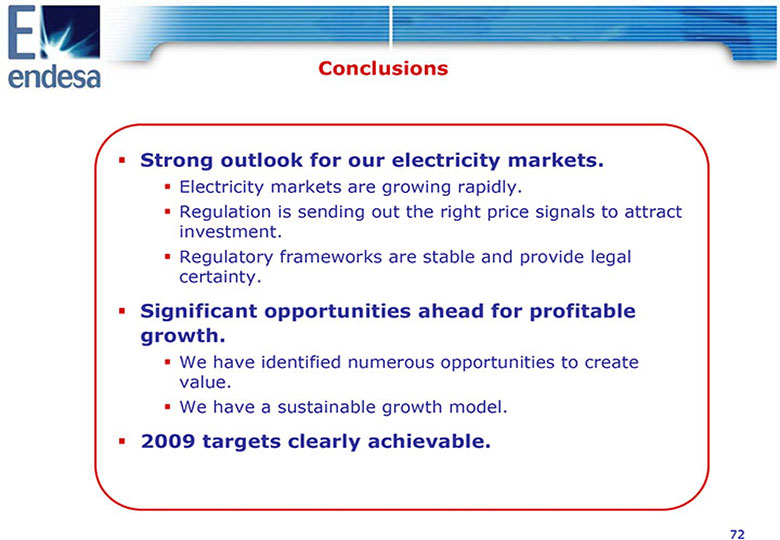
CONCLUSIONS STRONG OUTLOOK FOR OUR ELECTRICITY MARKETS. Electricity markets are growing rapidly. Regulation is sending out the right price signals to attract investment. Regulatory frameworks are stable and provide legal certainty. SIGNIFICANT OPPORTUNITIES AHEAD FOR PROFITABLE GROWTH. We have identified numerous opportunities to create value. We have a sustainable growth model. 2009 TARGETS CLEARLY ACHIEVABLE. 72
APPENDIX 73
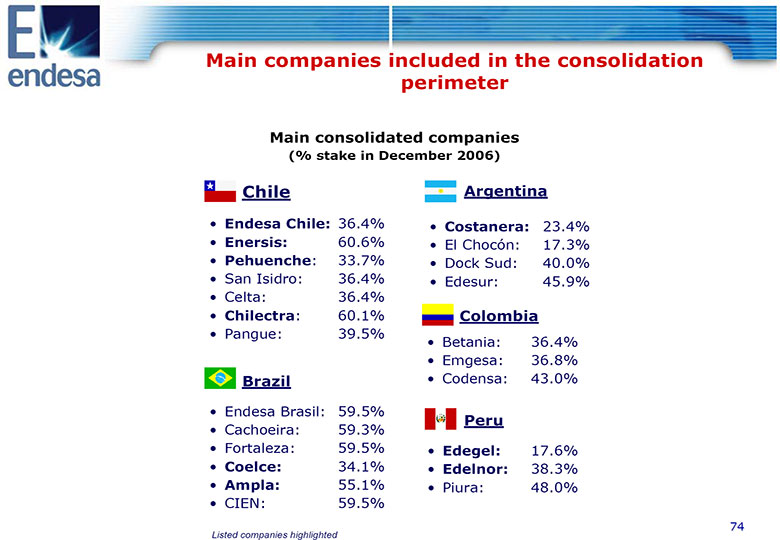
MAIN COMPANIES INCLUDED IN THE CONSOLIDATION PERIMETER MAIN CONSOLIDATED COMPANIES (% STAKE IN DECEMBER 2006) CHILE ARGENTINA o ENDESA CHILE: 36.4% o COSTANERA: 23.4% o ENERSIS: 60.6% o El Chocon: 17.3% o PEHUENCHE: 33.7% o Dock Sud: 40.0% o San Isidro: 36.4% o Edesur: 45.9% o Celta: 36.4% o CHILECTRA: 60.1% COLOMBIA o Pangue: 39.5% o Betania: 36.4% o Emgesa: 36.8% BRAZIL o Codensa: 43.0% o Endesa Brasil: 59.5% PERU o Cachoeira: 59.3% o Fortaleza: 59.5% o EDEGEL: 17.6% o COELCE: 34.1% o EDELNOR: 38.3% o AMPLA: 55.1% o Piura: 48.0% o CIEN: 59.5% 74
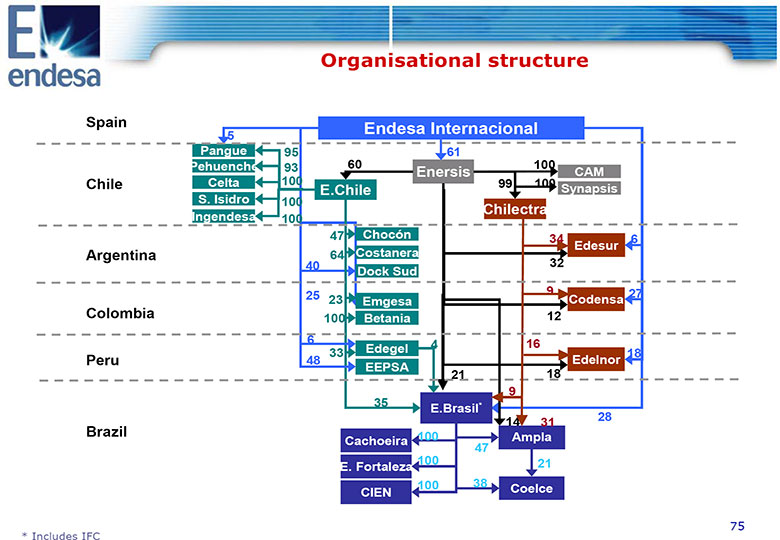
LISTED COMPANIES HIGHLIGHTED ORGANISATIONAL STRUCTURE SPAIN ENDESA INTERNACIONAL 5 PANGUE 95 61 PEHUENCHE 93 60 100 ENERSIS CAM CHILE CELTA 100 99 100 E.CHILE SYNAPSIS S. ISIDRO 100 CHILECTRA INGENDESA 100 47 CHOCON 34 6 EDESUR ARGENTINA 64 COSTANERA 40 32 DOCK SUD 25 9 27 23 EMGESA CODENSA COLOMBIA 100 BETANIA 12 6 4 16 33 EDEGEL 18 PERU 48 EDELNOR EEPSA 21 18 9 35 E.BRASIL* 14 31 28 BRAZIL 100 AMPLA CACHOEIRA 47 100 21 E. FORTALEZA 100 38 COELCE CIEN 75 * Includes IFC

LEGAL INFORMATION This document was made available to shareholders of Endesa, S.A.. In relation with the announced joint offer by ENEL SpA and Acciona, S.A., Endesa shareholders are urged to read the report of Endesa's board of directors when it is filed by the Company with the Comision Nacional del Mercado de Valores (the "CNMV"), as well as Endesa's Solicitation/Recommendation Statement on Schedule 14D-9 when it is filed by the Company with the U.S. Securities and Exchange Commission (the "SEC"), as it will contain important information. Such documents and other public filings made from time to time by Endesa with the CNMV or the SEC are available without charge from the Endesa's website at WWW.ENDESA.ES, from the the CNMV's website at WWW.CNMV.ES and from the SEC's website at WWW.SEC.GOV and at Endesa's principal executive offices in Madrid, Spain. This presentation contains certain "forward-looking" statements regarding anticipated financial and operating results and statistics and other future events. These statements are not guarantees of future performance and they are subject to material risks, uncertainties, changes and other factors that may be beyond ENDESA's control or may be difficult to predict. Forward-looking statements include, but are not limited to, information regarding: estimated future earnings; anticipated increases in wind and CCGTs generation and market share; expected increases in demand for gas and gas sourcing; management strategy and goals; estimated cost reductions; tariffs and pricing structure; estimated capital expenditures and other investments; estimated asset disposals; estimated increases in capacity and output and changes in capacity mix; repowering of capacity and macroeconomic conditions. For example, the investment plan for 2007-2009 included in this presentation are forward-looking statements and are based on certain assumptions which may or may not prove correct. The main assumptions on which these expectations and targets are based are related to the regulatory setting, exchange rates, divestments, increases in production and installed capacity in markets where ENDESA operates, increases in demand in these markets, assigning of production amongst different technologies, increases in costs associated with higher activity that do not exceed certain limits, electricity prices not below certain levels, the cost of CCGT plants, and the availability and cost of the gas, coal, fuel oil and emission rights necessary to run our business at the desired levels. In these statements we avail ourselves of the protection provided by the Private Securities Litigation Reform Act of 1995 of the United States of America with respect to forward-looking statements. The following important factors, in addition to those discussed elsewhere in this presentation, could cause actual financial and operating results and statistics to differ materially from those expressed in our forward-looking statements: Economic and industry conditions: significant adverse changes in the conditions of the industry, the general economy or our markets; the effect of the prevailing regulations or changes in them; tariff reductions; the impact of interest rate fluctuations; the impact of exchange rate fluctuations; natural disasters; the impact of more restrictive environmental regulations and the environmental risks inherent to our activity; potential liabilities relating to our nuclear facilities. Transaction or commercial factors: any delays in or failure to obtain necessary regulatory, antitrust and other approvals for our proposed acquisitions or asset disposals, or any conditions imposed in connection with such approvals; our ability to integrate acquired businesses successfully; the challenges inherent in diverting management's focus and resources from other strategic opportunities and from operational matters during the process of integrating acquired businesses; the outcome of any negotiations with partners and governments. Delays in or impossibility of obtaining the pertinent permits and rezoning orders in relation to real estate assets. Delays in or impossibility of obtaining regulatory authorisation, including that related to the environment, for the construction of new facilities, repowering or improvement of existing facilities; shortage of or changes in the price of equipment, material or labour; opposition of political or ethnic groups; adverse changes of a political or regulatory nature in the countries where we or our companies operate; adverse weather conditions, natural disasters, accidents or other unforeseen events, and the impossibility of obtaining financing at what we consider satisfactory interest rates. Political/governmental factors: political conditions in Latin America; changes in Spanish, European and foreign laws, regulations and taxes. Operating factors: technical problems; changes in operating conditions and costs; capacity to execute cost-reduction plans; capacity to maintain a stable supply of coal, fuel and gas and the impact of the price fluctuations of coal, fuel and gas; acquisitions or restructuring; capacity to successfully execute a strategy of internationalisation and diversification. Competitive factors: the actions of competitors; changes in competition and pricing environments; the entry of new competitors in our markets. Further details on the factors that may cause actual results and other developments to differ significantly from the expectations implied or explicitly contained in the presentation are given in the Risk Factors section of Form 20-F filed with the SEC and in the ENDESA Share Registration Statement filed with the Comision Nacional del Mercado de Valores (the Spanish securities regulator or the "CNMV" for its initials in Spanish).No assurance can be given that the forward-looking statements in this document will be realised. Except as may be required by applicable law, neither Endesa nor any of its affiliates intends to update these forward-looking statements. 76
ENDESA LATIN AMERICA VALENCIA, 25TH JUNE, 2007