
UNITED STATES
SECURITIES AND EXCHANGE COMMISSION
Washington, D.C. 20549
FORM N-CSR
CERTIFIED SHAREHOLDER REPORT OF REGISTERED MANAGEMENT INVESTMENT COMPANIES
Investment Company Act file number 811-08397
The Marsico Investment Fund
(Exact name of Registrant as specified in charter)
1200 17th Street, Suite 1600
Denver, Colorado 80202
(Address of principal executive offices) (Zip code)
Christopher J. Marsico
The Marsico Investment Fund
1200 17th Street, Suite 1600
Denver, Colorado 80202
(Name and address of agent for service)
Copies to:
Sander M. Bieber, Esq.
Dechert LLP
1775 I Street, N.W.
Washington, D.C. 20006
Registrant's telephone number, including area code: (303) 454-5600
| Date of fiscal year end: September 30 |
| Date of reporting period: March 31, 2007 |
Item 1. Reports to Stockholders


DEAR SHAREHOLDER:
Enclosed is your semi-annual report for The Marsico Investment Fund encompassing the six-month fiscal period from October 1, 2006 to March 31, 2007. |
The purpose of this report is to provide a retrospective for the Marsico Funds’ six-month investment results by discussing what we believe were the main areas that impacted performance – including the macroeconomic environment, sector positioning, industry allocations, and stock selection – as compared to the Funds’ performance benchmark indexes. Certain sector or industry classifications used in the discussion and review portions of the semi-annual report may be broader or narrower than those used in Fund Overviews, Schedules of Investments, or elsewhere in this report. For our updated commentary regarding the market environment and the Funds’ overall investment posture, please refer to the Funds’ most recent quarterly shareholder update available on the Funds’ website at www.marsicofunds.com. |
Market Enviroment | 4 | |
Investment Review for Focus Fund and Growth Fund | 6 | |
| | |
MARSICO FOCUS FUND | | |
| | |
Fund Overview | 8 | |
Schedule of Investments | 9 | |
Statement of Assets and Liabilities | 11 | |
Statement of Operations | 11 | |
Statements of Changes in Net Assets | 12 | |
Financial Highlights | 13 | |
| | |
MARSICO GROWTH FUND | | |
| | |
Fund Overview | 14 | |
Schedule of Investments | 15 | |
Statement of Assets and Liabilities | 17 | |
Statement of Operations | 17 | |
Statements of Changes in Net Assets | 18 | |
Financial Highlights | 19 | |
| | |
MARSICO 21ST CENTURY FUND | | |
| | |
Investment Review for 21st Century Fund | 20 | |
Fund Overview | 22 | |
Schedule of Investments | 23 | |
Statement of Assets and Liabilities | 25 | |
Statement of Operations | 25 | |
Statements of Changes in Net Assets | 26 | |
Financial Highlights | 27 | |
| | |
MARSICO INTERNATIONAL OPPORTUNITES FUND | | |
| | |
Investment Review for International Opportunities Fund | 28 | |
Fund Overview | 30 | |
Schedule of Investments | 31 | |
Statement of Assets and Liabilities | 34 | |
Statement of Operations | 34 | |
Statements of Changes in Net Assets | 35 | |
Financial Highlights | 36 | |
| | |
MARSICO FLEXIBLE CAPITAL FUND | | |
| | |
Investment Review for Flexible Capital Fund | 37 | |
Fund Overview | 39 | |
Schedule of Investments | 40 | |
Statement of Assets and Liabilities | 42 | |
Statement of Operations | 42 | |
Statements of Changes in Net Assets | 43 | |
Financial Highlights | 44 | |
| | |
NOTES TO FINANCIAL STATEMENTS | 45 | |
| | |
EXPENSE EXAMPLE | 51 | |
| | |
CONSIDERATION OF | | |
INVESTMENT ADVISORY AGREEMENTS | 53 | |
| | |
OTHER INFORMATION | 56 | |
MARKET ENVIRONMENT: OCTOBER 2006-MARCH 2007 (UNAUDITED)
In assessing the Funds’ performance over the six-month period ended March 31, 2007, it may be helpful to review the performance of broader equity markets during this period. Equities around the world posted solid gains in the six-month period. A recap of global stock market performance using several well-known benchmark indexes is provided below:
Index Name | Universe of | Six Month |
| Equities Represented | Total Return |
US | | | |
| | | |
S&P 500 | US large | | |
| capitalization equities | 7.38 | % |
| | | |
Russell 3000 | US publicly-traded | | |
| equities of all sizes | 8.49 | % |
| | | |
Russell 2000 | US small | | |
| capitalization equities | 11.02 | % |
| | | |
Russell Mid-Cap | US medium | | |
| capitalization equities | 12.38 | % |
| | | |
International | | | |
| | | |
MSCI EAFE | Companies in developed | | |
| international equity markets, | | |
| including Japan, Western | | |
| Europe, and Australasia | 14.85 | % |
As shown above, US small- and medium-capitalization and international equities were strong performers during the reporting period, substantially outperforming US large capitalization companies.
US LARGE CAPITALIZATION EQUITIES
US large-cap stocks moved higher during the six-month period ended March 31, 2007, weathering a variety of challenges including interest rate and inflation concerns, rising energy prices, housing market weakness, and geopolitical tensions in the process. Nearly all of the S&P 500 Index’s six-month gain was achieved in the fourth quarter of 2006; the Index rose 6.70% over that time. During the first quarter of 2007, large-cap returns were considerably more tepid amid resurfacing inflation-related concerns and mounting worries regarding a substantial economic slowdown.
Regarding sector performance, larger US stocks in economic sectors defined under the Global Industry Classification Standard (“GICS”) (using the S&P 500 Index as a reference) exhibited strength and breadth during the reporting period, although there was somewhat of a defensive orientation (i.e., higher dividend yield, lower risk) in terms of market leadership. All ten GICS sectors in the S&P 500 Index were in positive territory, with leading performance provided by certain sectors such as Materials (+21%), Utilities (+19%), Telecommunications Services (+17%), and Energy (+14%). Other major sectors in the S&P 500 Index – including Financials, Information Technology, and Health Care – also had gains, but those increases were considerably more modest in nature – 5% or less. Industry-level results also demonstrated widespread strength. The top-performing GICS industry groups represented a diverse mix, including Real Estate, Consumer Durables & Apparel, Consumer Services, and Media. Only two industries were in negative territory during the reporting period: Semiconductors & Semi-equipment and Pharmaceuticals, Biotechnology & Life Sciences.
US ALL-CAPITALIZATION EQUITIES
The performance of the broad US equity market, which encompasses companies of all sizes, was modestly better than results in the large-cap arena alone for the six-month period ended March 31, 2007. That was primarily attributable to the strength of medium- and small-capitalization companies, as noted above. To a significant extent, we think that the outperformance of these market segments, as compared to larger capitalization companies, was a result of escalated merger and acquisition activity that took place in these areas, with the latter fueled largely by capital provided or borrowed by private equity funds.
INTERNATIONAL EQUITIES
International equities in both “developed” and so-called “emerging” markets posted strong gains for the six-month period ended March 31, 2007, substantially outperforming their US equity counterparts. Within the EAFE Index, every individual constituent country had a positive return. Performance was particularly strong in countries such as Australia, Germany, United Kingdom, and France, which comprise a significant portion of the Index. Japan, which has been saddled for some time with concerns regarding its economy and growth potential, managed to rise 9%.
From a GICS economic sector perspective, international equity market strength was widespread during the reporting period. All ten GICS sectors in the EAFE Index had gains, led by robust increases in Materials (+26%), Industrials (+24%), Utilities (+20%), and Telecommunications Services (+19%).
At an industry level, international equity performance results were similarly strong. Every GICS industry group in the EAFE Index had a positive return. The top-performing areas included Real Estate (+27%), Capital Goods (+26%), Consumer Services (+24%), Automobiles & Components (+22%), Transportation (+21%), and Food & Staples Retailing (+20%). Many other industry groups, however, also had impressive gains, particularly those residing within the Consumer Staples, Consumer Discretionary, and Financials sectors.
THE MARSICO INVESTMENT TEAM
MARSICO FOCUS FUND & MARSICO GROWTH FUND |
INVESTMENT REVIEW BY TOM MARSICO (UNAUDITED)
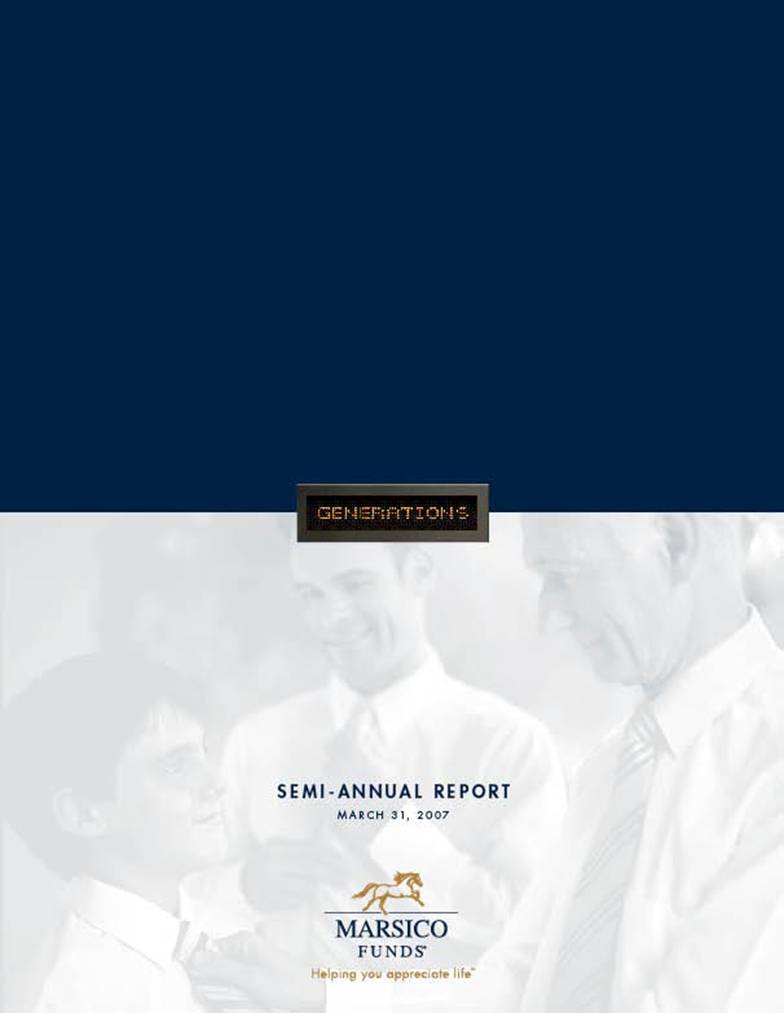
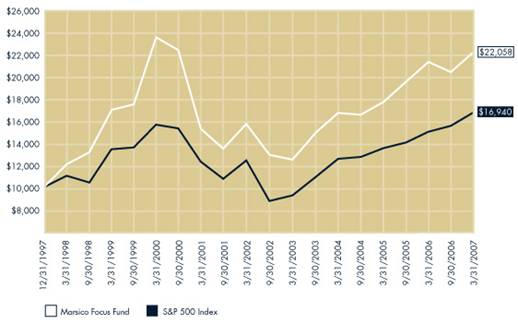
The Focus Fund and Growth Fund had total returns of 7.99% and 8.44%, respectively, for the six-month period ended March 31, 2007, modestly outperforming their primary benchmark index. For comparative purposes, the S&P 500 Index – which we consider to be the Funds’ primary benchmark index – had a total six-month return of 7.38%. Please see the Funds’ Overviews for more detailed information about each Fund’s longer-term performance for various time periods ended March 31, 2007.
The performance data for the Funds quoted here represent past performance, and past performance is not a guarantee of future results. Investment return and principal value of an investment will fluctuate so that an investor’s shares, when redeemed, may be worth more or less than their original cost. Current performance may be lower or higher than the performance information quoted. To obtain performance information current to the most recent month-end, please call 888-860-8686 or visit www.marsicofunds.com.(1)
This review highlights Fund performance over a single six-month period. Shareholders should keep in mind that the Funds are intended for long-term investors who hold their shares for substantially longer periods of time. You should also keep in mind that our views on all investments discussed in this report are subject to change at any time. References to specific securities, industries, and sectors discussed in this report are not recommendations to buy or sell such securities or related investments, and the Funds may not necessarily hold these securities or investments today. Please see the accompanying Schedule of Investments for the percentage of each Fund's portfolio represented by the securities mentioned in this report.
FOCUS FUND
There were several primary factors that contributed to the Focus Fund’s outperformance for the semi-annual period ended March 31, 2007 (as compared with the S&P 500 Index):
| • | Consumer Discretionary Positions: Various Focus Fund holdings within this sector, which together comprised on average the Fund’s largest position within a single sector during the reporting period, were decisively the most important positive contributors to the Fund’s performance. The Fund’s positions in this sector generated a collective return of 21% - which was more than double the S&P 500 Index’s return of 10% within the same sector. In particular, hotel/casino operators had strong results, including MGM Mirage (+77%), Wynn Resorts, Ltd. (+40%), and Las Vegas Sands Corp. (+27%). In addition, Toyota Motor Corp. (+18%), Lowe’s Cos. (+12%), and Four Seasons Hotels (+26%) were material positive contributors to performance. |
| • | Financials: The Focus Fund had significant investments in this sector during the reporting period, averaging nearly a 22% allocation. Although the sector was among the S&P 500 Index’s lowest-performing areas with a benchmark return of 4%, the Fund’s positions in this sector substantially outperformed the Index’s sector return, gaining nearly 9% in aggregate, led by Banking and Diversified Financials holdings. Specifically, Goldman Sachs Group, Inc. (+22%), Industrial and Commercial Bank of China Ltd. (+23%), and Prologis (+14%), a REIT-structured operator of industrial distribution facilities in North America, Europe and Asia, helped buoy performance. |
The primary negative performance factors for the Focus Fund over the six-month period were stock selection in the Information Technology and Health Care sectors, and underweighted postures in Energy, Utilities, and Telecommunications Services, which were among the benchmark index’s best-performing constituents. Regarding the technology-related holdings, the Fund was hampered mainly by positions in Texas Instruments, Inc. and Motorola, Inc. which fell -15% and -14%, respectively, prior to being sold. With respect to Health Care, the Fund’s performance was negatively impacted by a position in biotechnology company Genzyme Corp. (-11% prior to being sold).
GROWTH FUND
The Growth Fund shared quite a few of the Focus Fund’s performance characteristics. On the positive side:
| • | Consumer Discretionary: Similar to the Focus Fund, the Growth Fund’s Consumer Discretionary positions, which were a significant area of emphasis, performed well during the reporting period, posting a collective gain of 21%. Hotel/casino operator positions were the main contributors, including MGM Mirage (+76%), Wynn Resorts, Ltd. (+40%), Las Vegas Sands Corp. (+27%), and Station Casinos, Inc. (+50%). Other individual holdings within the sector that performed well were Toyota Motor Corp. (+18%) and Lowe’s Cos. (+12%). |
| • | Financials: The Fund’s holdings in the Financials sector had a collective return of 8% during the reporting period, which doubled the S&P 500 Index’s benchmark return in this sector. A major underlying source of this gain was provided by the Fund’s positions in Goldman Sachs Group, Inc. and Industrial and Commercial Bank of China Ltd., which surged 22% and 35%, respectively. |
There were several areas of weakness for the Fund during the reporting period. Stock selection in the Health Care and Information Technology sectors detracted from performance, as did underweighted postures in the Utilities and Energy sectors which were among the equity markets’ top-performing areas. In Health Care, performance was hampered by positions in Amylin Pharmaceuticals (-15%) and Genzyme Corp. (-11%). With regard to Information Technology, three holdings had significant sub-par returns: Texas Instruments (-15% prior to being sold), Intel Corp. (-11%), and Motorola, Inc. (-14% prior to being sold).
In terms of economic sector positioning, as of March 31, 2007 the Focus Fund’s and Growth Fund’s primary sector allocations were in Consumer Discretionary, Health Care, Financials, and Industrials. The Funds had little or no investments in areas such as Telecommunications Services, Energy, and Utilities and were substantially underweighted (compared to the S&P 500 Index) in Information Technology.
As you know, the Focus Fund and Growth Fund often invest in similar growth companies. Their performance may differ at times, however, because of a variety of factors. Among other factors, the Focus Fund is a non-diversified mutual fund that may invest in a more concentrated portfolio and may hold the securities of fewer issuers than the Growth Fund. As a result, the Focus Fund may hold some securities that are different from those held by the Growth Fund, and may be more exposed to individual stock volatility than the Growth Fund or other mutual funds that invest in a larger number of securities.
With regard to the modest differential in performance between the two Funds during the reporting period (the Growth Fund outperformed the Focus Fund by 0.45%), the lion’s share of that was attributable to the Focus Fund’s having a larger average weighting in certain technology-related positions that did not perform well (e.g., Texas Instruments, Motorola). In addition, the Focus Fund had no positions in the Telecommunications Services sector, which was – as mentioned earlier – one of the top-performing areas of the equity markets. The Growth Fund also had a below-benchmark index allocation in the Telecommunications Services sector, but did own positions in America Movil and China Mobile Ltd. Each of these holdings performed well, which mitigated the opportunity cost of being underweighted in the sector.
Sincerely,
THOMAS F. MARSICO
PORTFOLIO MANAGER
| (1) | Total returns are based on net change in NAV assuming reinvestment of distributions. A redemption fee of 2% may be imposed on redemptions or exchanges of Fund shares owned for 30 days or less. Please see the prospectus for more information. |
FUND OVERVIEW MARCH 31, 2007 (UNAUDITED)
The Focus Fund invests primarily in the common stocks of large companies, normally a core position of 20–30 common stocks that are selected for their long-term growth potential. |
| One Year | Five Year Average Annual | Average Annual Since Inception | Total Annual |
| (4/1/06 – 3/31/07) | (4/1/02 – 3/31/07) | (12/31/97 – 3/31/07) | Operating Expenses* |
| | | | |
Marsico Focus Fund | 3.39% | 6.69% | 8.93% | 1.26% |
S&P 500 Index | 11.83% | 6.26% | 5.87% | N/A |
| | | | | |
NET ASSETS | | |
| | |
3/31/07 | $4,863,331,974 | |
NET ASSET value | | |
| | |
Net Asset Value Per Share | $19.15 | |
| | |
TOP FIVE HOLDINGS | | |
| | |
UnitedHealth Group, Inc. | 8.09 | % |
Genentech, Inc. | 5.17 | |
Toyota Motor | | |
Corporation Spon. ADR | 4.94 | |
The Goldman Sachs | | |
Group, Inc. | 4.47 | |
Comcast Corporation - Cl. A | 4.25 | |
| | |
SECTOR ALLOCATION(2) | | |
| | |
Consumer Cyclical | 24.44 | % |
Financials (includes REITs) | 22.27 | |
Consumer Non-Cyclical | 21.02 | |
Industrials | 15.95 | |
Communications | 10.15 | |
Basic Materials | 3.76 | |
Energy | 2.41 | |
| * | The Total Annual Operating Expenses are reflective of the information disclosed in the Funds’ prospectus dated February 1, 2007 and may differ from the expense ratios disclosed in this report. |
The performance data quoted here represent past performance, and past performance is not a guarantee of future results. Investment return and principal value of an investment will fluctuate so that an investor’s shares, when redeemed, may be worth more or less than their original cost. Current performance may be lower or higher than the performance information quoted. To obtain performance information current to the most recent month-end, please call 888-860-8686 or visit www.marsicofunds.com. A redemption fee may be imposed on redemptions or exchanges of Fund shares held for 30 days or less.
The performance included in the table and graph does not reflect the deduction of taxes on Fund distributions or the redemption of Fund shares.
| (1) | This chart assumes an initial investment of $10,000 made on December 31, 1997 (inception). Total returns are based on net change in NAV, assuming reinvestment of distributions. |
| (2) | Sector weightings represent the percentage of the Fund’s investments (excluding cash equivalents) in certain general sectors. These sectors may include more than one industry. The Fund’s portfolio composition is subject to change at any time. |
SCHEDULE OF INVESTMENTS MARCH 31, 2007 (UNAUDITED)
| Number | | Percent |
| of | | of Net |
| Shares | Value | Assets |
COMMON STOCKS | | | | | |
| | | | | |
Aerospace/Defense | | | | | |
General Dynamics Corporation | 1,097,113 | $83,819,433 | | 1.72 | % |
Lockheed Martin Corporation | 1,603,360 | 155,557,987 | | 3.20 | |
| | 239,377,420 | | 4.92 | |
| | | | | |
Aerospace/Defense - Equipment | | | | | |
United Technologies | | | | | |
Corporation | 426,743 | 27,738,295 | | 0.57 | |
| | | | | |
Agricultural Chemicals | | | | | |
Monsanto Company | 3,181,045 | 174,830,233 | | 3.59 | |
| | | | | |
Automotive - Cars/Light Trucks | | | | | |
Toyota Motor | | | | | |
Corporation Spon. ADR | 1,874,233 | 240,201,701 | | 4.94 | |
| | | | | |
Beverages - Non-Alcoholic | | | | | |
PepsiCo, Inc. | 2,105,853 | 133,848,017 | | 2.75 | |
| | | | | |
Cable TV | | | | | |
Comcast Corporation - Cl. A* | 7,965,249 | 206,698,211 | | 4.25 | |
| | | | | |
Casino Hotels | | | | | |
Las Vegas Sands Corp.* | 1,748,724 | 151,456,986 | | 3.11 | |
MGM MIRAGE* | 2,363,622 | 164,319,001 | | 3.38 | |
Wynn Resorts Ltd. | 1,633,932 | 154,994,789 | | 3.19 | |
| | 470,770,776 | | 9.68 | |
| | | | | |
Commercial Banks - Non-U.S. | | | | | |
Industrial and Commercial | | | | | |
Bank of China - Cl. H* | 325,509,000 | 182,470,010 | | 3.75 | |
| | | | | |
Cosmetics & Toiletries | | | | | |
The Procter & | | | | | |
Gamble Company | 3,156,641 | 199,373,446 | | 4.10 | |
| | | | | |
Diversified | | | | | |
Manufacturing Operations | | | | | |
General Electric Company | 2,278,678 | 80,574,054 | | 1.66 | |
| | | | | |
Finance - Investment | | | | | |
Banker/Broker | | | | | |
Citigroup, Inc. | 2,438,667 | 125,201,164 | | 2.57 | |
The Goldman Sachs | | | | | |
Group, Inc. | 1,050,993 | 217,166,684 | | 4.47 | |
Lehman Brothers | | | | | |
Holdings, Inc. | 2,081,690 | 145,864,018 | | 3.00 | |
UBS AG | 2,440,974 | 145,067,085 | | 2.98 | |
| | 633,298,951 | | 13.02 | |
| Number | | Percent |
| of | | of Net |
| Shares | Value | Assets |
COMMON STOCKS continued | | | | | |
| | | | | |
Hotels & Motels | | | | | |
Four Seasons Hotels, Inc. | 825,883 | $66,318,405 | | 1.36 | % |
| | | | | |
Medical - Biomedical/Genetic | | | | | |
Genentech, Inc.* | 3,063,682 | 251,589,566 | | 5.17 | |
| | | | | |
Medical - HMO | | | | | |
UnitedHealth Group, Inc. | 7,426,413 | 393,377,097 | | 8.09 | |
| | | | | |
Networking Products | | | | | |
Cisco Systems, Inc.* | 7,511,827 | 191,776,943 | | 3.94 | |
| | | | | |
Oil - Field Services | | | | | |
Schlumberger Ltd. | 1,625,497 | 112,321,843 | | 2.31 | |
| | | | | |
REITs - Warehouse/Industrial | | | | | |
ProLogis | 1,377,301 | 89,428,154 | | 1.84 | |
| | | | | |
Retail - Building Products | | | | | |
Lowe’s Companies, Inc. | 5,125,498 | 161,401,932 | | 3.32 | |
| | | | | |
Retail - Discount | | | | | |
Target Corporation | 1,540,220 | 91,273,437 | | 1.88 | |
| | | | | |
Retail - Restaurants | | | | | |
Starbucks Corporation* | 3,422,513 | 107,330,008 | | 2.21 | |
| | | | | |
Super-Regional Banks - U.S. | | | | | |
Wells Fargo & Company | 3,806,954 | 131,073,426 | | 2.70 | |
| | | | | |
Transportation - Rail | | | | | |
Burlington Northern | | | | | |
Santa Fe Corporation | 2,564,229 | 206,240,939 | | 4.24 | |
| | | | | |
Transportation - Services | | | | | |
FedEx Corporation | 1,753,268 | 188,353,581 | | 3.87 | |
| | | | | |
Web Portals/Internet | | | | | |
Service Providers | | | | | |
Google, Inc. - Cl. A* | 161,878 | 74,166,024 | | 1.53 | |
| | | | | |
Total Common Stocks | | | | | |
(cost $3,471,768,089) | | 4,653,832,469 | | 95.69 | |
| | | | | |
See notes to financial statements.
SCHEDULE OF INVESTMENTS MARCH 31, 2007 (UNAUDITED)
| Number | | Percent |
| of | | of Net |
| Shares | Value | Assets |
| | | | | |
| | | | | |
SHORT-TERM INVESTMENTS | | | | | |
| | | | | |
SSgA Money | | | | | |
Market Fund, 5.00% | 1 | $1 | | 0.00 | % |
SSgA Prime Money | | | | | |
Market Funds, 5.19% | 203,070,581 | 203,070,581 | | 4.18 | |
| | | | | |
Total Short-Term Investments | | | | | |
(cost $203,070,582) | | 203,070,582 | | 4.18 | |
| | | | | |
Total Investments | | | | | |
(cost $3,674,838,671) | | 4,856,903,051 | | 99.87 | |
| | | | | |
Cash and Other Assets | | | | | |
Less Liabilities | | 6,428,923 | | 0.13 | |
| | | | | |
NET ASSETS | | $4,863,331,974 | | 100.00 | % |
See notes to financial statements.
STATEMENT OF ASSETS AND LIABILITIES
MARCH 31, 2007 (UNAUDITED)
(Amounts in thousands)
ASSETS | | |
| | |
Investments, at value (cost $3,674,839) | $4,856,903 | |
Receivable for investments sold | 4,968 | |
Receivable for capital stock sold | 8,622 | |
Interest and dividends receivable | 1,923 | |
Prepaid expenses and other assets | 700 | |
Total Assets | 4,873,116 | |
| | |
LIABILITIES | | |
| | |
Payable for capital stock redeemed | 3,840 | |
Accrued investment advisory fee | 3,340 | |
Accrued distribution fee | 720 | |
Accrued trustees’ fees | 799 | |
Accrued transfer agent fees and expenses | 783 | |
Accrued expenses and other liabilities | 302 | |
Total Liabilities | 9,784 | |
| | |
NET ASSETS | $4,863,332 | |
| | |
NET ASSETS CONSIST OF | | |
| | |
Paid-in-capital | $3,675,151 | |
Accumulated net investment loss | (3,507 | ) |
Accumulated net realized gain on investments | | |
and foreign currency transactions | 9,477 | |
Net unrealized appreciation on investments | 1,182,211 | |
| | |
NET ASSETS | $4,863,332 | |
| | |
SHARES OUTSTANDING, $0.001 par value | | |
(Unlimited shares authorized) | 253,969 | |
| | |
NET ASSET VALUE, REDEMPTION PRICE, | | |
AND OFFERING PRICE PER SHARE | | |
(NET ASSETS/SHARES OUTSTANDING)* | $19.15 | |
| | |
STATEMENT OF OPERATIONS
FOR THE SIX MONTHS ENDED MARCH 31, 2007
(UNAUDITED)
(Amounts in thousands)
INVESTMENT INCOME | | |
| | |
Interest | $4,909 | |
Dividends (net of $0 of non-reclaimable | | |
foreign withholding taxes) | 27,281 | |
Miscellaneous income | 12 | |
Total Investment Income | 32,202 | |
| | |
EXPENSES | | |
| | |
Investment advisory fees | 19,851 | |
Distribution fees | 6,111 | |
Transfer agent fees and expenses | 2,703 | |
Printing and postage expenses | 342 | |
Custody and fund accounting fees | 289 | |
Fund administration fees | 196 | |
Miscellaneous | 121 | |
Trustees’ fees and expenses(1) | 120 | |
Professional fees | 114 | |
Federal and state registration fees | 71 | |
Total expenses | 29,918 | |
Less expenses paid indirectly | (121 | ) |
Net Expenses | 29,797 | |
| | |
NET INVESTMENT INCOME | 2,405 | |
| | |
REALIZED AND UNREALIZED GAIN | | |
| | |
Net realized gain on investments | 67,483 | |
Net realized gain on foreign | | |
currency transactions | 71 | |
Change in unrealized appreciation/ | | |
depreciation on investments and | | |
foreign currency translations | 297,528 | |
Net Gain on Investments | 365,082 | |
| | |
NET INCREASE IN NET ASSETS | | |
RESULTING FROM OPERATIONS | $367,487 | |
| (1) | Includes $77,661 for Trustees’ fees and expenses and $42,386 for the unrealized appreciation related to the mark to market of the shares in the Deferred Fee Plan during the period ended March 31, 2007. |
See notes to financial statements.
STATEMENTS OF CHANGES IN NET ASSETS
| Six Months | | Year |
| Ended 3/31/07 | | Ended |
(Amounts in thousands) | (Unaudited) | | 9/30/06 |
Net investment income (loss) | $2,405 | | $(5,610 | ) |
Net realized gain on investments | 67,483 | | 241,639 | |
Net realized gain on foreign currency transactions | 71 | | — | (1) |
Change in unrealized appreciation/depreciation | | | | |
on investments and foreign currency translations | 297,528 | | (83,235 | ) |
| | | | |
Net increase in net assets resulting from operations | 367,487 | | 152,794 | |
Net investment income | (5,110 | ) | — | |
Net realized gains | (118,228 | ) | — | |
| | | | |
Total distributions | (123,338 | ) | — | |
CAPITAL SHARE TRANSACTIONS | | |
Proceeds from sale of shares | 654,072 | | 1,548,292 | |
Proceeds from reinvestment of distributions | 120,582 | | — | |
Redemption fees | 23 | | 64 | |
Redemption of shares | (771,949 | ) | (824,886 | ) |
| | | | |
Net increase from capital share transactions | 2,728 | | 723,470 | |
| | | | |
TOTAL INCREASE IN NET ASSETS | 246,877 | | 876,264 | |
Beginning of period | 4,616,455 | | 3,740,191 | |
| | | | |
End of period | $4,863,332 | | $4,616,455 | |
| | | | |
Accumulated net investment loss | (3,507 | ) | (802 | ) |
Shares sold | 33,747 | | 85,019 | |
Shares issued in reinvestment of distributions | 6,311 | | — | |
Shares redeemed | (39,876 | ) | (45,617 | ) |
| | | | |
Net increase | 182 | | 39,402 | |
See notes to financial statements.
FINANCIAL HIGHLIGHTS
| Six Months | Year | Year | Year | Year | Year |
For a Fund Share Outstanding | Ended 3/31/07 | Ended | Ended | Ended | Ended | Ended |
Throughout the Period. | (Unaudited) | 9/30/06 | 9/30/05 | 9/30/04 | 9/30/03 | 9/30/02 |
NET ASSET VALUE, BEGINNING OF PERIOD | $18.19 | | $17.45 | | $14.83 | | $13.49 | | $11.68 | | $12.27 | |
INCOME FROM INVESTMENT OPERATIONS | | |
Net investment income (loss) | 0.01 | | (0.02 | ) | (0.03 | ) | (0.05 | ) | (0.03 | ) | (0.08 | ) |
Net realized and unrealized | | | | | | | | | | | | |
gains (losses) on investments | 1.44 | | 0.76 | | 2.65 | | 1.39 | | 1.84 | | (0.47 | ) |
Total from investment operations | 1.45 | | 0.74 | | 2.62 | | 1.34 | | 1.81 | | (0.55 | ) |
Net investment income | (0.02 | ) | — | | — | | — | | — | | — | |
Net realized gains | (0.47 | ) | — | | — | | — | | — | | — | |
Tax return of capital | — | | — | | — | | — | | — | | (0.04 | ) |
Redemption fees [See Note 2(i)] | — | (1) | — | (1) | — | (1) | — | (1) | — | | — | |
Total distributions & other | (0.49 | ) | — | | — | | — | | — | | (0.04 | ) |
| | | | | | | | | | | | |
NET ASSET VALUE, END OF PERIOD | $19.15 | | $18.19 | | $17.45 | | $14.83 | | $13.49 | | $11.68 | |
| | | | | | | | | | | | |
TOTAL RETURN | 7.99% | (3) | 4.24% | | 17.67% | | 9.93% | | 15.50% | | (4.50)% | |
SUPPLEMENTAL DATA AND RATIOS | | |
Net assets, end of period (000s) | $4,863,332 | | $4,616,455 | | $3,740,191 | | $2,895,322 | | $2,282,113 | | $1,274,068 | |
| | | | | | | | | | | | |
Ratio of expenses to average net assets, | | | | | | | | | | | | |
before expenses paid indirectly | 1.22% | (2) | 1.24% | | 1.25% | | 1.30% | | 1.34% | | 1.35% | |
| | | | | | | | | | | | |
Ratio of net investment income (loss) to | | | | | | | | | | | | |
average net assets, net of waivers and | | | | | | | | | | | | |
expenses paid indirectly | 0.10% | (2) | (0.13)% | | (0.18)% | | (0.36)% | | (0.54)% | | (0.64)% | |
| | | | | | | | | | | | |
Ratio of net investment income (loss) to | | | | | | | | | | | | |
average net assets, before waivers and | | | | | | | | | | | | |
expenses paid indirectly | 0.09% | (2) | (0.15)% | | (0.21)% | | (0.40)% | | (0.59)% | | (0.68)% | |
| | | | | | | | | | | | |
Portfolio turnover rate | 20% | (3) | 80% | | 84% | | 84% | | 90% | | 117% | |
| (3) | Not annualized for the six months ended March 31, 2007. |
See notes to financial statements.
FUND OVERVIEW MARCH 31, 2007 (UNAUDITED)
The Growth Fund invests primarily in the common stocks of large companies that are selected for their long-term growth potential. The Growth Fund will normally hold a core position of between 35 and 50 common stocks. |
| One Year | Five Year Average Annual | Average Annual Since Inception | Total Annual |
| (4/1/06 – 3/31/07) | (4/1/02 – 3/31/07) | (12/31/97 – 3/31/07) | Operating Expenses* |
Marsico Growth Fund | 3.59% | 6.69% | 8.44% | 1.27% |
S&P 500 Index | 11.83% | 6.26% | 5.87% | N/A |
NET ASSETS | | |
| | |
3/31/07 | $2,777,548,298 | |
NET ASSET VALUE | | |
| | |
Net Asset Value Per Share | $20.18 | |
| | |
TOP FIVE HOLDINGS | | |
| | |
UnitedHealth Group, Inc. | 7.30 | % |
Genentech, Inc. | 4.61 | |
Comcast Corporation - Cl. A | 3.97 | |
The Procter & Gamble | | |
Company | 3.93 | |
Burlington Northern | | |
Santa Fe Corporation | 3.77 | |
| | |
SECTOR ALLOCATION(2) | | |
| | |
Consumer Cyclical | 23.30 | % |
Consumer Non-Cyclical | 20.26 | |
Industrials | 18.53 | |
Financials (includes REITs) | 17.10 | |
Communications | 11.25 | |
Basic Materials | 3.71 | |
Technology | 3.23 | |
Energy | 1.99 | |
Utilities | 0.63 | |
| | | |
| * | The Total Annual Operating Expenses are reflective of the information disclosed in the Funds’ prospectus dated February 1, 2007 and may differ from the expense ratios disclosed in this report. |
The performance data quoted here represent past performance, and past performance is not a guarantee of future results. Investment return and principal value of an investment will fluctuate so that an investor’s shares, when redeemed, may be worth more or less than their original cost. Current performance may be lower or higher than the performance information quoted. To obtain performance information current to the most recent month-end, please call 888-860-8686 or visit www.marsicofunds.com. A redemption fee may be imposed on redemptions or exchanges of Fund shares owned for 30 days or less.
The performance included in the table and graph does not reflect the deduction of taxes on Fund distributions or the redemption of Fund shares.
| (1) | This chart assumes an initial investment of $10,000 made on December 31, 1997 (inception). Total returns are based on net change in NAV, assuming reinvestment of distributions. |
| (2) | Sector weightings represent the percentage of the Fund’s investments (excluding cash equivalents) in certain general sectors. These sectors may include more than one industry. The Fund’s portfolio composition is subject to change at any time. |
SCHEDULE OF INVESTMENTS MARCH 31, 2007 (UNAUDITED)
| Number | | Percent |
| of | | of Net |
| Shares | Value | Assets |
COMMON STOCKS | | | | |
| | | | |
Aerospace/Defense | | | | |
The Boeing Company | 591,242 | $52,567,326 | 1.89 | % |
General Dynamics Corporation | 1,095,705 | 83,711,862 | 3.01 | |
Lockheed Martin Corporation | 896,229 | 86,952,138 | 3.14 | |
| | 223,231,326 | 8.04 | |
| | | | |
Aerospace/Defense - Equipment | | | | |
United Technologies | | | | |
Corporation | 451,182 | 29,326,830 | 1.06 | |
| | | | |
Agricultural Chemicals | | | | |
Monsanto Company | 1,348,604 | 74,119,276 | 2.67 | |
| | | | |
Automotive - Cars/Light Trucks | | | | |
Toyota Motor | | | | |
Corporation Spon. ADR | 675,979 | 86,633,469 | 3.12 | |
| | | | |
Brewery | | | | |
Heineken N.V. ADR | 1,648,573 | 43,110,184 | 1.55 | |
| | | | |
Cable TV | | | | |
Comcast Corporation - Cl. A* | 4,251,421 | 110,324,375 | 3.97 | |
| | | | |
Casino Hotels | | | | |
Las Vegas Sands Corp.* | 851,582 | 73,755,517 | 2.65 | |
MGM MIRAGE* | 1,228,909 | 85,433,754 | 3.08 | |
Station Casinos, Inc. | 202,324 | 17,515,189 | 0.63 | |
Wynn Resorts Ltd. | 791,390 | 75,071,255 | 2.70 | |
| | 251,775,715 | 9.06 | |
| | | | |
Cellular Telecommunications | | | | |
America Movil S.A.B. | | | | |
de C.V. ADR Ser. L | 941,379 | 44,988,502 | 1.62 | |
China Mobile Ltd. | 4,495,500 | 40,907,410 | 1.47 | |
| | 85,895,912 | 3.09 | |
| | | | |
Commercial Banks - Non-U.S. | | | | |
China Merchants | | | | |
Bank Co., Ltd. - Cl. H* | 2,676,500 | 5,405,410 | 0.19 | |
Industrial and Commercial | | | | |
Bank of China - Cl. H* | 115,923,000 | 64,982,753 | 2.34 | |
| | 70,388,163 | 2.53 | |
| | | | |
Cosmetics & Toiletries | | | | |
The Procter & | | | | |
Gamble Company | 1,728,916 | 109,198,335 | 3.93 | |
| | | | |
Data Processing/Management | | | | |
MasterCard, Inc. - Cl. A | 482,768 | 51,289,272 | 1.85 | |
| | | | |
Electronic Components - | | | | |
Semiconductors | | | | |
Intel Corporation | 1,927,717 | 36,877,226 | 1.33 | |
| | | | |
| Number | | Percent |
| of | | of Net |
| Shares | Value | Assets |
COMMON STOCKS continued | | | | |
| | | | |
Finance - Investment | | | | |
Banker/Broker | | | | |
Citigroup, Inc. | 510,083 | $26,187,661 | 0.94 | % |
The Goldman Sachs | | | | |
Group, Inc. | 479,426 | 99,063,794 | 3.57 | |
Lehman Brothers | | | | |
Holdings, Inc. | 1,152,532 | 80,757,917 | 2.91 | |
UBS AG | 1,341,498 | 79,725,226 | 2.87 | |
| | 285,734,598 | 10.29 | |
| | | | |
Hotels & Motels | | | | |
Four Seasons Hotels, Inc. | 336,417 | 27,014,285 | 0.97 | |
| | | | |
Independent Power Producer | | | | |
NRG Energy, Inc.* | 237,905 | 17,138,676 | 0.62 | |
| | | | |
Industrial Gases | | | | |
Praxair, Inc. | 428,503 | 26,978,549 | 0.97 | |
| | | | |
Medical - Biomedical/Genetic | | | | |
Genentech, Inc.* | 1,561,111 | 128,198,435 | 4.61 | |
Genzyme Corporation* | 609,489 | 36,581,530 | 1.32 | |
| | 164,779,965 | 5.93 | |
| | | | |
Medical - HMO | | | | |
UnitedHealth Group, Inc. | 3,829,424 | 202,844,589 | 7.30 | |
| | | | |
Networking Products | | | | |
Cisco Systems, Inc.* | 2,394,869 | 61,141,006 | 2.20 | |
| | | | |
Oil - Field Services | | | | |
Schlumberger Ltd. | 785,481 | 54,276,737 | 1.95 | |
| | | | |
Real Estate | | | | |
Management/Services | | | | |
CB Richard | | | | |
Ellis Group, Inc. - Cl. A* | 242,588 | 8,291,658 | 0.30 | |
| | | | |
Real Estate | | | | |
Operating/Development | | | | |
The St. Joe Company | 317,602 | 16,613,761 | 0.60 | |
| | | | |
REITs - Mortgage | | | | |
KKR Financial Corporation | 436,404 | 11,970,562 | 0.43 | |
| | | | |
Retail - Building Products | | | | |
Lowe’s Companies, Inc. | 2,237,315 | 70,453,049 | 2.54 | |
| | | | |
Retail - Discount | | | | |
Target Corporation | 895,709 | 53,079,715 | 1.91 | |
| | | | |
Retail - Regional | | | | |
Department Stores | | | | |
Federated Department | | | | |
Stores, Inc. | 1,234,245 | 55,602,737 | 2.00 | |
| | | | |
See notes to financial statements.
SCHEDULE OF INVESTMENTS MARCH 31, 2007 (UNAUDITED)
| Number | | Percent |
| of | | of Net |
| Shares | Value | Assets |
COMMON STOCKS continued | | | | |
| | | | |
Retail - Restaurants | | | | |
Starbucks Corporation* | 1,176,747 | $36,902,786 | 1.33 | % |
Yum! Brands, Inc. | 930,820 | 53,764,163 | 1.93 | |
| | 90,666,949 | 3.26 | |
| | | | |
Super-Regional Banks - U.S. | | | | |
Wells Fargo & Company | 2,118,888 | 72,953,314 | 2.63 | |
| | | | |
Telephone - Integrated | | | | |
AT&T, Inc. | 592,513 | 23,362,788 | 0.84 | |
| | | | |
Therapeutics | | | | |
Amylin Pharmaceuticals, Inc.* | 866,156 | 32,359,588 | 1.17 | |
| | | | |
Transportation - Rail | | | | |
Burlington Northern | | | | |
Santa Fe Corporation | 1,301,365 | 104,668,787 | 3.77 | |
Union Pacific Corporation | 639,856 | 64,977,377 | 2.34 | |
| | 169,646,164 | 6.11 | |
| | | | |
Transportation - Services | | | | |
FedEx Corporation | 771,300 | 82,860,759 | 2.98 | |
| | | | |
Web Portals/Internet | | | | |
Service Providers | | | | |
Google, Inc. - Cl. A* | 56,269 | 25,780,205 | 0.93 | |
| | | | |
Total Common Stocks | | | | |
(cost $2,096,817,803) | | 2,725,719,737 | 98.13 | |
| Number | | Percent |
| of | | of Net |
| Shares | Value | Assets |
SHORT-TERM INVESTMENTS | | | | |
| | | | |
SSgA Money | | | | |
Market Fund, 5.00% | 1 | $1 | 0.00 | % |
SSgA Prime Money | | | | |
Market Funds, 5.19% | 27,154,840 | 27,154,840 | 0.98 | |
| | | | |
Total Short-Term Investments | | | | |
(cost $27,154,841) | | 27,154,841 | 0.98 | |
| | | | |
Total Investments | | | | |
(cost $2,123,972,644) | | 2,752,874,578 | 99.11 | |
| | | | |
Cash and Other | | | | |
Assets Less Liabilities | | 24,673,720 | 0.89 | |
| | | | |
NET ASSETS | | $2,777,548,298 | 100.00 | % |
See notes to financial statements.
STATEMENT OF ASSETS AND LIABILITIES
MARCH 31, 2007 (UNAUDITED)
(Amounts in thousands)
ASSETS | | |
| | |
Investments, at value (cost $2,123,973) | $2,752,875 | |
Receivable for investments sold | 24,213 | |
Receivable for capital stock sold | 4,224 | |
Interest and dividends receivable | 1,119 | |
Prepaid expenses and other assets | 364 | |
Total Assets | 2,782,795 | |
| | |
LIABILITIES | | |
| | |
Payable for capital stock redeemed | 1,602 | |
Accrued investment advisory fee | 1,992 | |
Accrued distribution fee | 651 | |
Accrued trustees’ fees | 429 | |
Accrued transfer agent fees and expenses | 351 | |
Accrued expenses and other liabilities | 222 | |
Total Liabilities | 5,247 | |
| | |
NET ASSETS | $2,777,548 | |
| | |
NET ASSETS CONSIST OF | | |
| | |
Paid-in-capital | $2,154,806 | |
Accumulated net investment loss | (503 | ) |
Accumulated net realized loss on investments and | | |
foreign currency transactions | (5,734 | ) |
Net unrealized appreciation on investments | | |
and foreign currency translations | 628,979 | |
| | |
NET ASSETS | $2,777,548 | |
| | |
SHARES OUTSTANDING, $0.001 par value | | |
(Unlimited shares authorized) | 137,658 | |
| | |
NET ASSET VALUE, REDEMPTION PRICE, | | |
AND OFFERING PRICE PER SHARE | | |
(NET ASSETS/SHARES OUTSTANDING)* | $20.18 | |
STATEMENT OF OPERATIONS
FOR THE SIX MONTHS ENDED MARCH 31, 2007
(UNAUDITED)
(Amounts in thousands)
Investment income | | |
| | |
Interest | $1,236 | |
Dividends (net of $0 of non-reclaimable | | |
foreign withholding taxes) | 15,559 | |
Total Investment Income | 16,795 | |
| | |
EXPENSES | | |
| | |
Investment advisory fees | 11,606 | |
Distribution fees | 3,414 | |
Transfer agent fees and expenses | 1,130 | |
Printing and postage expenses | 186 | |
Custody and fund accounting fees | 183 | |
Fund administration fees | 142 | |
Trustees’ fees and expenses(1) | 76 | |
Miscellaneous | 67 | |
Federal and state registration fees | 62 | |
Professional fees | 59 | |
Total expenses | 16,925 | |
Less expenses paid indirectly | (43 | ) |
Net Expenses | 16,882 | |
| | |
NET INVESTMENT LOSS | (87 | ) |
| | |
REALIZED AND UNREALIZED GAIN | | |
| | |
Net realized gain on investments | 20,880 | |
Net realized gain on foreign | | |
currency transactions | 20 | |
Change in unrealized appreciation/ | | |
depreciation on investments and | | |
foreign currency translations | 193,392 | |
Net Gain on Investments | 214,292 | |
| | |
NET INCREASE IN NET ASSETS | | |
RESULTING FROM OPERATIONS | $214,205 | |
| (1) | Includes $48,494 for Trustees’ fees and expenses and $27,236 for the unrealized appreciation related to the mark to market of the shares in the Deferred Fee Plan during the period ended March 31, 2007. |
See notes to financial statements.
STATEMENTS OF CHANGES IN NET ASSETS
| Six Months | | Year |
| Ended 3/31/07 | | Ended |
(Amounts in thousands) | (Unaudited) | | 9/30/06 |
Net investment loss | $(87 | ) | $(6,150 | ) |
Net realized gain on investments | 20,880 | | 93,450 | |
Net realized gain on foreign currency transactions | 20 | | — | (1) |
Change in unrealized appreciation/depreciation | | | | |
on investments and foreign currency translations | 193,392 | | (30,092 | ) |
| | | | |
Net increase in net assets resulting from operations | 214,205 | | 57,208 | |
| | | | |
CAPITAL SHARE TRANSACTIONS | | | | |
| | | | |
Proceeds from sale of shares | 389,104 | | 959,936 | |
Redemption fees | 18 | | 71 | |
Redemption of shares | (376,420 | ) | (592,242 | ) |
| | | | |
Net increase from capital share transactions | 12,702 | | 367,765 | |
| | | | |
TOTAL INCREASE IN NET ASSETS | 226,907 | | 424,973 | |
| | | | |
NET ASSETS | | | | |
| | | | |
Beginning of period | 2,550,641 | | 2,125,668 | |
| | | | |
End of period | $2,777,548 | | $2,550,641 | |
| | | | |
Accumulated net investment loss | (503 | ) | (416 | ) |
| | | | |
TRANSACTIONS IN SHARES | | | | |
| | | | |
Shares sold | 19,403 | | 51,358 | |
Shares redeemed | (18,802 | ) | (31,795 | ) |
| | | | |
Net increase | 601 | | 19,563 | |
| | | | |
See notes to financial statements.
FINANCIAL HIGHLIGHTS
| Six Months | Year | Year | Year | Year | Year |
For a Fund Share Outstanding | Ended 3/31/07 | Ended | Ended | Ended | Ended | Ended |
Throughout the Period. | (Unaudited) | 9/30/06 | 9/30/05 | 9/30/04 | 9/30/03 | 9/30/02 |
NET ASSET VALUE, BEGINNING OF PERIOD | $18.61 | | $18.09 | | $15.95 | | $14.09 | | $11.88 | | $12.71 | |
INCOME FROM INVESTMENT OPERATIONS | | |
Net investment income (loss) | — | (1) | (0.04 | ) | (0.02 | ) | (0.04 | ) | (0.07 | ) | (0.04 | ) |
Net realized and unrealized | | | | | | | | | | | | |
gains (losses) on investments | 1.57 | | 0.56 | | 2.16 | | 1.90 | | 2.28 | | (0.77 | ) |
Total from investment operations | 1.57 | | 0.52 | | 2.14 | | 1.86 | | 2.21 | | (0.81 | ) |
| | | | | | | | | | | | |
Net realized gains | — | | — | | — | | — | | — | | — | |
Tax return of capital | — | | — | | — | | — | | — | | (0.02 | ) |
Redemption fees [See Note 2(i)] | — | (1) | — | (1) | — | (1) | — | (1) | — | | — | |
Total distributions & other | — | | — | | — | | — | | — | | (0.02 | ) |
| | | | | | | | | | | | |
NET ASSET VALUE, END OF PERIOD | $20.18 | | $18.61 | | $18.09 | | $15.95 | | $14.09 | | $11.88 | |
| | | | | | | | | | | | |
TOTAL RETURN | 8.44% | (3) | 2.87% | | 13.42% | | 13.20% | | 18.60% | | (6.42)% | |
SUPPLEMENTAL DATA AND RATIOS | | |
| | | | | | | | | | | | |
Net assets, end of period (000s) | $2,777,548 | | $2,550,641 | | $2,125,668 | | $1,363,425 | | $789,220 | | $641,974 | |
| | | | | | | | | | | | |
Ratio of expenses to average net assets, | | | | | | | | | | | | |
before expenses paid indirectly | 1.24% | (2) | 1.26% | | 1.26% | | 1.30% | | 1.38% | | 1.37% | |
| | | | | | | | | | | | |
Ratio of net investment income (loss) to | | | | | | | | | | | | |
average net assets, net of expenses | | | | | | | | | | | | |
paid indirectly | (0.01)% | (2) | (0.26)% | | (0.14)% | | (0.34)% | | (0.62)% | | (0.49)% | |
| | | | | | | | | | | | |
Ratio of net investment income (loss) to | | | | | | | | | | | | |
average net assets, before expenses | | | | | | | | | | | | |
paid indirectly | (0.01)% | (2) | (0.27)% | | (0.16)% | | (0.38)% | | (0.67)% | | (0.52)% | |
| | | | | | | | | | | | |
Portfolio turnover rate | 18% | (3) | 59% | | 73% | | 73% | | 91% | | 111% | |
| (3) | Not annualized for the six months ended March 31, 2007. |
See notes to financial statements.
MARSICO 21ST CENTURY FUND |
INVESTMENT REVIEW BY CORY GILCHRIST (UNAUDITED)
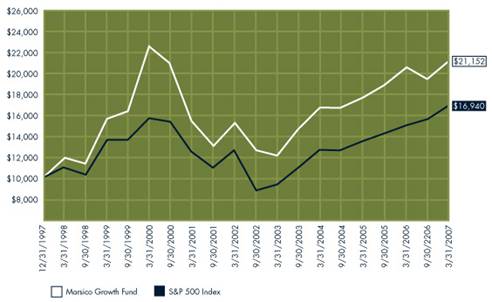
I am pleased to report that the 21st Century Fund posted a total return of 11.85% for the six-month period ended March 31, 2007, substantially outperforming the S&P 500 Index, the Fund’s primary benchmark index, which had a total return of 7.38%. For comparative purposes, the Russell 3000 Index, a proxy for the performance of all publicly-traded US equity securities including smaller capitalization companies, had a total return of 8.49%. Please see the Fund Overview for more detailed information about the Fund’s longer-term performance for various time periods ended March 31, 2007.
The performance data for the Fund quoted here represent past performance, and past performance is not a guarantee of future results. Investment return and principal value of an investment will fluctuate so that an investor’s shares, when redeemed, may be worth more or less than their original cost. Current performance may be lower or higher than the performance information quoted. To obtain performance information current to the most recent
month-end, please call 888-860-8686 or visit www.marsicofunds.com.(1)
This review highlights Fund performance over a single six-month period. Shareholders should keep in mind that the Fund is intended for long-term investors who hold their shares for substantially longer periods of time. You should also keep in mind that our views on all investments discussed in this report are subject to change at any time. References to specific securities, industries, and sectors discussed in this report are not recommendations to buy or sell such securities or related investments, and the Funds may not necessarily hold these securities or investments today. Please see the accompanying Schedule of Investments for the percentage of each Fund's portfolio represented by the securities mentioned in this report.
During the reporting period, the Fund’s results were buoyed primarily by the following specific factors:
| • | Consumer Discretionary: Stock selection within this sector was a major “plus” for performance, as the Fund’s aggregate holdings in this sector had a collective return of 31%. In fact, six out of the Fund’s top seven individual contributors were Consumer Discretionary holdings. Holdings in two industry groups within the sector – Consumer Services and Retailing – were particularly strong. With regard to Consumer Services, the Fund’s positions in hotel/casino operators performed well, including Station Casinos, Inc. (+50%), Wynn Resorts, Ltd. (+39%), and Las Vegas Sands Corp. (+28%). In the Retailing industry, Saks, Inc. (+10%) and Nordstrom, Inc. (+19% prior to being sold) had solid gains. Another stock that performed well was Cablevision Systems Corp., which rose 27%. The Fund also benefited, relative to its benchmark index, by maintaining on average nearly twice the weighting in this sector compared to the sector’s weighting in the benchmark, resulting in a strong absolute return for the Fund. |
| • | Stock Selection in the Financials Sector: The Fund’s aggregate holdings in the Financials sector rose 12% during the reporting period, propelled primarily by CB Richard Ellis Group (+39%), a real estate holding and development company, Goldman Sachs Group, Inc. (+22%), and several foreign banking companies including Industrial and Commercial Bank of China Ltd. (+34%), China Merchants Bank Co. Ltd. (+36%), and Austria-based Erste Bank der Oesterreichischen Sparkassen (+25%). In addition, KKR Financial Corp., a multiple asset class investor that is currently structured as a real estate investment trust but is proposed to be reorganized as a limited liability company, gained 12%. |
The main areas that detracted materially from the Fund’s performance over the past six-months were our stock selections in the Consumer Durables & Apparel (namely, homebuilding-related holdings) and Pharmaceuticals, Biotechnology & Life Sciences industry groups. More specifically, Ryland Group, a California-based home construction company, sank -19% prior to being sold. Amylin Pharmaceuticals, Inc. (-15%) and Genzyme Corp.
(-11% prior to being sold) were also among the Fund’s weakest-performing individual holdings. Our decision to underweight the Energy and Telecommunications Services sectors also imposed a modest “opportunity” cost on the Fund, as these sectors were among the best-performing areas of the US equity market for the six-month period.
The 21st Century Fund has tended to have a relatively high portfolio turnover level because of its investment style. Although the Fund may hold core positions for some time, it may change its portfolio composition quickly to take advantage of new opportunities, or to address issues affecting particular holdings.
As of March 31, 2007 the Fund’s primary economic sector allocations were in the following areas: Financials, Consumer Discretionary, and Information Technology. The Fund had little or no exposure to Telecommunications Services or Energy.
Sincerely,
CORYDON J. GILCHRIST, CFA
PORTFOLIO MANAGER
| (1) | Total returns are based on net change in NAV assuming reinvestment of distributions. For the period prior to March 31, 2004, the performance returns for the 21st Century Fund reflect a fee waiver in effect; in the absence of such a waiver, the returns would have been reduced. For the period beginning April 1, 2004 through January 2005, performance returns for the Fund would have been higher but for the reimbursement of fees waived previously. A redemption fee of 2% may be imposed on redemptions or exchanges of Fund shares owned for 30 days or less. Please see the prospectus for more information. |
MARSICO 21ST CENTURY FUND |
FUND OVERVIEW MARCH 31, 2007 (UNAUDITED)
The 21st Century Fund invests primarily in common stocks that are selected for their long-term growth potential. The Fund may invest in companies of any size, and will normally hold a core position of between 35 and 50 common stocks. |
| One Year | Five Year Average Annual | Average Annual Since Inception | Total Annual |
| (4/1/06 – 3/31/07) | (4/1/02 – 3/31/07) | (2/1/00 – 3/31/07) | Operating Expenses* |
| | | | |
Marsico 21st Century Fund | 7.82% | 15.62%(1) | 6.35%(1) | 1.35% |
S&P 500 Index | 11.83% | 6.26% | 1.92% | N/A |
| | | | | |
NET ASSETS | | |
| | |
3/31/07 | $1,756,104,660 | |
NET ASSET VALUE | | |
| | |
Net Asset Value Per Share | $15.40 | |
| | |
TOP FIVE HOLDINGS | | |
| | |
MasterCard, Inc. - Cl. A | 5.15 | % |
Las Vegas Sands Corp. | 4.64 | |
Saks, Inc. | 3.89 | |
Moody’s Corporation | 3.74 | |
Heineken Holding N.V. | 3.69 | |
| | |
SECTOR ALLOCATION(3) | | |
| | |
Financials (includes REITs) | 28.17 | % |
Consumer Cyclical | 19.60 | |
Consumer Non-Cyclical | 18.22 | |
Communications | 9.18 | |
Industrials | 8.82 | |
Technology | 5.76 | |
Basic Materials | 5.03 | |
Utilities | 2.83 | |
Energy | 2.39 | |
| | | |
| * | The Total Annual Operating Expenses are reflective of the information disclosed in the Funds’ prospectus dated February 1, 2007 and may differ from the expense ratios disclosed in this report. |
The performance data quoted here represent past performance, and past performance is not a guarantee of future results. Investment return and principal value of an investment will fluctuate so that an investor’s shares, when redeemed, may be worth more or less than their original cost. Current performance may be lower or higher than the performance information quoted. To obtain performance information current to the most recent month-end, please call 888-860-8686 or visit www.marsicofunds.com. A redemption fee may be imposed on redemptions or exchanges of Fund shares owned for 30 days or less.
The performance included in the table and graph does not reflect the deduction of taxes on Fund distributions or the redemption of Fund shares.
| (1) | The performance returns for the 21st Century Fund (for the period prior to March 31, 2004) reflect a fee waiver in effect; in the absence of such a waiver, the returns would be reduced. For the period beginning April 2004 through January 2005, performance returns for the 21st Century Fund would be higher but for the reimbursement of fees waived previously. |
| (2) | This chart assumes an initial investment of $10,000 made on February 1, 2000 (inception). Total returns are based on net change in NAV, assuming reinvestment of distributions. |
| (3) | Sector weightings represent the percentage of the Fund’s investments (excluding cash equivalents) in certain general sectors. These sectors may include more than one industry. The Fund’s portfolio composition is subject to change at any time. |
SCHEDULE OF INVESTMENTS MARCH 31, 2007 (UNAUDITED)
| Number | | Percent |
| of | | of Net |
| Shares | Value | Assets |
COMMON STOCKS | | | | | |
| | | | | |
Aerospace/Defense - Equipment | | | | | |
DRS Technologies, Inc. | 905,791 | $47,255,116 | | 2.69 | % |
| | | | | |
Agricultural Chemicals | | | | | |
Monsanto Company | 872,107 | 47,931,001 | | 2.73 | |
| | | | | |
Brewery | | | | | |
Heineken Holding N.V. | 1,464,680 | 64,841,488 | | 3.69 | |
| | | | | |
Building Products - | | | | | |
Cement/Aggregates | | | | | |
Holcim Ltd. | 220,104 | 22,043,910 | | 1.25 | |
| | | | | |
Cable TV | | | | | |
Comcast Corporation - Cl. A* | 1,685,286 | 43,733,172 | | 2.49 | |
| | | | | |
Casino Hotels | | | | | |
Las Vegas Sands Corp.* | 940,524 | 81,458,784 | | 4.64 | |
MGM MIRAGE* | 606,671 | 42,175,768 | | 2.40 | |
Station Casinos, Inc. | 298,211 | 25,816,126 | | 1.47 | |
Wynn Resorts Ltd. | 434,256 | 41,193,524 | | 2.35 | |
| | 190,644,202 | | 10.86 | |
| | | | | |
Commercial Banks - Non-U.S. | | | | | |
Banco Itau Holding | | | | | |
Financeria S.A. ADR | 1,221,088 | 42,518,284 | | 2.42 | |
China Merchants Bank Co., | | | | | |
Ltd. - Cl. H* | 12,048,500 | 24,332,928 | | 1.39 | |
Erste Bank der oesterreichischen | | | | | |
Sparkassen AG | 458,028 | 35,671,248 | | 2.03 | |
Industrial and Commercial | | | | | |
Bank of China - Cl. H* | 45,642,000 | 25,585,456 | | 1.46 | |
| | 128,107,916 | | 7.30 | |
| | | | | |
Commercial Services/Finance | | | | | |
Moody’s Corporation | 1,057,912 | 65,654,019 | | 3.74 | |
| | | | | |
Data Processing/Management | | | | | |
MasterCard, Inc. - Cl. A | 851,553 | 90,468,991 | | 5.15 | |
| | | | | |
Finance - Investment | | | | | |
Banker/Broker | | | | | |
Evercore Partners, Inc. | 87,743 | 2,736,704 | | 0.16 | |
The Goldman Sachs Group, Inc. | 209,538 | 43,296,837 | | 2.47 | |
Jefferies Group, Inc. | 1,117,099 | 32,340,016 | | 1.84 | |
UBS AG | 754,213 | 44,812,722 | | 2.55 | |
| | 123,186,279 | | 7.02 | |
| | | | | |
Independent Power Producer | | | | | |
NRG Energy, Inc.* | 617,302 | 44,470,436 | | 2.53 | |
| | | | | |
| Number | | Percent |
| of | | of Net |
| Shares | Value | Assets |
COMMON STOCKS continued | | | | | |
| | | | | |
Medical - Biomedical/Genetic | | | | | |
Arena Pharmaceuticals, Inc.* | 583,944 | $6,341,632 | | 0.36 | % |
Diversa Corporation* | 894,371 | 6,985,038 | | 0.40 | |
Genentech, Inc.* | 205,063 | 16,839,773 | | 0.96 | |
| | 30,166,443 | | 1.72 | |
| | | | | |
Medical - HMO | | | | | |
UnitedHealth Group, Inc. | 1,088,356 | 57,650,217 | | 3.28 | |
| | | | | |
Medical - Products | | | | | |
Accuray, Inc.* | 356,848 | 7,936,300 | | 0.45 | |
| | | | | |
Metal Processors & Fabricators | | | | | |
Precision Castparts Corp. | 419,395 | 43,638,050 | | 2.48 | |
| | | | | |
Miscellaneous Manufacturing | | | | | |
American Railcar | | | | | |
Industries, Inc. | 392,258 | 11,693,211 | | 0.67 | |
| | | | | |
Networking Products | | | | | |
Cisco Systems, Inc.* | 2,217,449 | 56,611,473 | | 3.22 | |
| | | | | |
Oil - Field Services | | | | | |
Schlumberger Ltd. | 415,894 | 28,738,275 | | 1.64 | |
| | | | | |
Oil Companies - Integrated | | | | | |
Petroleo Brasileiro S.A. ADR | 88,583 | 8,814,894 | | 0.50 | |
| | | | | |
Paper & Related Products | | | | | |
Weyerhaeuser Company | 415,453 | 31,050,957 | | 1.77 | |
| | | | | |
Printing - Commercial | | | | | |
Consolidated Graphics, Inc.* | 136,104 | 10,078,501 | | 0.57 | |
| | | | | |
Real Estate | | | | | |
Management/Services | | | | | |
CB Richard Ellis | | | | | |
Group, Inc. - Cl. A* | 1,420,794 | 48,562,739 | | 2.77 | |
| | | | | |
Real Estate | | | | | |
Operating/Development | | | | | |
The St. Joe Company | 624,159 | 32,649,757 | | 1.86 | |
| | | | | |
REITs - Mortgage | | | | | |
Crystal River | | | | | |
Capital, Inc. 144A | 163,717 | 4,394,164 | | 0.25 | |
KKR Financial Corporation | 1,191,658 | 32,687,179 | | 1.86 | |
Redwood Trust, Inc. | 149,650 | 7,808,737 | | 0.44 | |
| | 44,890,080 | | 2.55 | |
See notes to financial statements.
MARSICO 21ST CENTURY FUND |
SCHEDULE OF INVESTMENTS MARCH 31, 2007 (UNAUDITED)
| Number | | Percent |
| of | | of Net |
| Shares | Value | Assets |
COMMON STOCKS continued | | | | | |
| | | | | |
REITs - Warehouse/Industrial | | | | | |
ProLogis | 158,837 | $10,313,286 | | 0.59 | % |
| | | | | |
Resorts/Theme Parks | | | | | |
Vail Resorts, Inc.* | 600,436 | 32,621,688 | | 1.86 | |
| | | | | |
Retail - Gardening Products | | | | | |
Tractor Supply Company* | 316,393 | 16,294,240 | | 0.93 | |
| | | | | |
Retail - Major | | | | | |
Department Store | | | | | |
Saks, Inc. | 3,277,793 | 68,309,206 | | 3.89 | |
| | | | | |
Super-Regional Banks - U.S. | | | | | |
Wells Fargo & Company | 1,588,896 | 54,705,689 | | 3.11 | |
| | | | | |
Therapeutics | | | | | |
Amylin Pharmaceuticals, Inc.* | 1,333,130 | 49,805,737 | | 2.84 | |
| | | | | |
Transportation - Rail | | | | | |
Genesee & | | | | | |
Wyoming, Inc. - Cl. A* | 520,795 | 13,858,355 | | 0.79 | |
| | | | | |
Web Portals/Internet | | | | | |
Service Providers | | | | | |
Google, Inc. - Cl. A* | 95,724 | 43,856,908 | | 2.50 | |
| | | | | |
Total Common Stocks | | | | | |
(cost $1,429,763,786) | | 1,570,582,536 | | 89.44 | |
| Number | | Percent |
| of | | of Net |
| Shares | Value | Assets |
SHORT-TERM INVESTMENTS | | | | | |
| | | | | |
Federal Home Loan | | | | | |
Mortgage Discount | | | | | |
Notes, 4.97%, 4/2/07 | 16,200,000 | $16,197,764 | | 0.92 | % |
SSgA Money | | | | | |
Market Fund, 5.00% | 79,076,835 | 79,076,835 | | 4.50 | |
SSgA Prime Money | | | | | |
Market Funds, 5.19% | 79,117,148 | 79,117,148 | | 4.51 | |
| | | | | |
Total Short-Term Investments | | | | | |
(cost $174,391,747) | | 174,391,747 | | 9.93 | |
| | | | | |
Total Investments | | | | | |
(cost $1,604,155,533) | | 1,744,974,283 | | 99.37 | |
| | | | | |
Cash and Other | | | | | |
Assets Less Liabilities | | 11,130,377 | | 0.63 | |
| | | | | |
NET ASSETS | | $1,756,104,660 | | 100.00 | % |
See notes to financial statements.
STATEMENT OF ASSETS AND LIABILITIES
MARCH 31, 2007 (UNAUDITED)
(Amounts in thousands)
ASSETS | | |
| | |
Investments, at value (cost $1,604,156) | $1,744,974 | |
Receivable for investments sold | 18,491 | |
Receivable for capital stock sold | 3,234 | |
Interest and dividends receivable | 1,278 | |
Prepaid expenses and other assets | 350 | |
Total Assets | 1,768,327 | |
| | |
LIABILITIES | | |
| | |
Payable for investments purchased | 8,891 | |
Payable for capital stock redeemed | 730 | |
Accrued investment advisory fee | 1,242 | |
Accrued distribution fee | 748 | |
Accrued trustees’ fees | 321 | |
Accrued expenses and other liabilities | 290 | |
Total Liabilities | 12,222 | |
| | |
NET ASSETS | $1,756,105 | |
| | |
NET ASSETS CONSIST OF | | |
| | |
Paid-in-capital | $1,578,499 | |
Accumulated net investment income | 241 | |
Accumulated net realized gain on investments and | | |
foreign currency transactions | 36,475 | |
Net unrealized appreciation on investments | 140,890 | |
| | |
NET ASSETS | $1,756,105 | |
| | |
SHARES OUTSTANDING, $0.001 par value | | |
(Unlimited shares authorized) | 114,030 | |
| | |
NET ASSET VALUE, REDEMPTION PRICE, | | |
AND OFFERING PRICE PER SHARE | | |
(NET ASSETS/SHARES OUTSTANDING)* | $15.40 | |
| | |
STATEMENT OF OPERATIONS
FOR THE SIX MONTHS ENDED MARCH 31, 2007
(UNAUDITED)
(Amounts in thousands)
INVESTMENT INCOME | | |
| | |
Interest | $3,419 | |
Dividends (net of $3 of non-reclaimable | | |
foreign withholding taxes) | 15,907 | |
Total Investment Income | 19,326 | |
| | |
EXPENSES | | |
| | |
Investment advisory fees | 5,707 | |
Distribution fees | 1,679 | |
Transfer agent fees and expenses | 826 | |
Custody and fund accounting fees | 170 | |
Fund administration fees | 107 | |
Printing and postage expenses | 76 | |
Federal and state registration fees | 61 | |
Trustees’ fees and expenses(1) | 43 | |
Professional fees | 29 | |
Miscellaneous | 17 | |
Total expenses | 8,715 | |
Less expenses paid indirectly | (3 | ) |
Net Expenses | 8,712 | |
| | |
NET INVESTMENT INCOME | 10,614 | |
| | |
REALIZED AND UNREALIZED GAIN | | |
| | |
Net realized gain on investments | 39,448 | |
Net realized gain on foreign | | |
currency transactions | 888 | |
Change in unrealized appreciation/ | | |
depreciation on investments and | | |
foreign currency translations | 59,076 | |
Net Gain on Investments | 99,412 | |
| | |
NET INCREASE IN NET ASSETS | | |
RESULTING FROM OPERATIONS | $110,026 | |
| (1) | Includes $18,906 for Trustees’ fees and expenses and $23,998 for the unrealized appreciation related to the mark to market of the shares in the Deferred Fee Plan during the period ended March 31, 2007. |
See notes to financial statements.
MARSICO 21ST CENTURY FUND |
STATEMENTS OF CHANGES IN NET ASSETS
| Six Months | | Year |
| Ended 3/31/07 | | Ended |
(Amounts in thousands) | (Unaudited) | | 9/30/06 |
Net investment income | $10,614 | | $1,131 | |
Net realized gain on investments | 39,448 | | 32,726 | |
Net realized gain (loss) on foreign currency transactions | 888 | | (215 | ) |
Change in unrealized appreciation/depreciation | | | | |
on investments and foreign currency translations | 59,076 | | 26,623 | |
| | | | |
Net increase in net assets resulting from operations | 110,026 | | 60,265 | |
Net investment income | (10,725 | ) | (67 | ) |
| | | | |
Total distributions | (10,725 | ) | (67 | ) |
CAPITAL SHARE TRANSACTIONS | | | | |
Proceeds from sale of shares | 897,709 | | 586,063 | |
Proceeds from reinvestment of distributions | 10,081 | | 64 | |
Redemption fees | 72 | | 138 | |
Redemption of shares | (122,517 | ) | (154,332 | ) |
| | | | |
Net increase from capital share transactions | 785,345 | | 431,933 | |
| | | | |
TOTAL INCREASE IN NET ASSETS | 884,646 | | 492,131 | |
Beginning of period | 871,459 | | 379,328 | |
| | | | |
End of period | $1,756,105 | | $871,459 | |
| | | | |
Accumulated net investment income | 241 | | 352 | |
Shares sold | 58,683 | | 42,721 | |
Shares issued in reinvestment of distributions | 663 | | 5 | |
Shares redeemed | (8,046 | ) | (11,411 | ) |
| | | | |
Net increase | 51,300 | | 31,315 | |
See notes to financial statements.
FINANCIAL HIGHLIGHTS
| Six Months | Year | Year | Year | Year | Year |
For a Fund Share Outstanding | Ended 3/31/07 | Ended | Ended | Ended | Ended | Ended |
Throughout the Period. | (Unaudited) | 9/30/06 | 9/30/05 | 9/30/04 | 9/30/03 | 9/30/02 |
NET ASSET VALUE, BEGINNING OF PERIOD | $13.89 | | $12.07 | | $10.20 | | $8.74 | | $6.54 | | $6.26 | |
INCOME FROM INVESTMENT OPERATIONS | | |
Net investment income (loss) | 0.09 | | 0.02 | | (0.01 | ) | (0.04 | ) | (0.04 | ) | (0.08 | ) |
Net realized and unrealized | | | | | | | | | | | | |
gains on investments | 1.55 | | 1.80 | | 1.88 | | 1.50 | | 2.23 | | 0.36 | |
Total from investment operations | 1.64 | | 1.82 | | 1.87 | | 1.46 | | 2.19 | | 0.28 | |
Net investment income | (0.13 | ) | — | (1) | — | | — | | — | | — | |
Increase from payment by service provider | — | | — | | — | | — | | 0.01 | | — | |
Redemption fees [See Note 2(i)] | — | (1) | — | (1) | — | (1) | — | (1) | — | | — | |
Total distributions & other | (0.13 | ) | — | | — | | — | | 0.01 | | — | |
| | | | | | | | | | | | |
NET ASSET VALUE, END OF PERIOD | $15.40 | | $13.89 | | $12.07 | | $10.20 | | $8.74 | | $6.54 | |
| | | | | | | | | | | | |
TOTAL RETURN | 11.85% | (4) | 15.10% | | 18.33% | | 16.70% | | 33.64% | | 4.47% | |
SUPPLEMENTAL DATA AND RATIOS | | |
Net assets, end of period (000s) | $1,756,105 | | $871,459 | | $379,328 | | $216,228 | | $104,038 | | $56,021 | |
| | | | | | | | | | | | |
Ratio of expenses to average net assets, | | | | | | | | | | | | |
less waivers and before expenses | | | | | | | | | | | | |
paid indirectly, plus reimbursements of | | | | | | | | | | | | |
previously waived expenses | 1.30% | (3) | 1.33% | | 1.39% | | 1.50% | | 1.55% | (5) | 1.50% | |
| | | | | | | | | | | | |
Ratio of net investment income (loss) to | | | | | | | | | | | | |
average net assets, net of waivers, | | | | | | | | | | | | |
reimbursements of previously waived | | | | | | | | | | | | |
expenses and expenses paid indirectly | 1.56% | (3) | 0.20% | | (0.19)% | | (0.48)% | | (1.05)% | | (0.89)% | |
| | | | | | | | | | | | |
Ratio of expenses to average net assets, | | | | | | | | | | | | |
before waivers, reimbursements of | | | | | | | | | | | | |
previously waived expenses and | | | | | | | | | | | | |
expenses paid indirectly | 1.30% | (3) | 1.33% | | 1.36% | | 1.44% | | 1.65% | | 1.60% | |
| | | | | | | | | | | | |
Ratio of net investment income (loss) to | | | | | | | | | | | | |
average net assets, before waivers, | | | | | | | | | | | | |
reimbursements of previously waived | | | | | | | | | | | | |
expenses and expenses paid indirectly | 1.56% | (3) | 0.20% | | (0.22)% | | (0.42)% | | (1.15)% | | (0.99)% | |
| | | | | | | | | | | | |
Portfolio turnover rate(2) | 39% | (4) | 136% | | 175% | | 191% | | 236% | | 388% | |
| (2) | Portfolio turnover is greater than most funds due to the investment style of the Fund. |
| (4) | Not annualized for the six months ended March 31, 2007. |
| (5) | See Note 3 for information regarding the voluntary fee waiver. |
See notes to financial statements.
MARSICO INTERNATIONAL OPPORTURNITIES FUND |
INVESTMENT REVIEW BY JIM GENDELMAN (UNAUDITED)
The six-month period ended March 31, 2007 was another healthy period for international equities. The International Opportunities Fund had a total return of (US$) 11.87%. That was a solid absolute gain, but unfortunately it did not keep pace with the Fund’s primary benchmark index, the MSCI EAFE Index (“EAFE Index”), which had a stellar total return of 14.85% during the period. Please see the Fund Overview for more detailed information about the Fund’s longer-term performance for various periods ended March 31, 2007.
The performance data for the Fund quoted here represent past performance, and past performance is not a guarantee of future results. Investment return and principal value of an investment will fluctuate so that an investor’s shares, when redeemed, may be worth more or less than their original cost. Current performance may be lower or higher than the performance information quoted. To obtain performance information current to the most recent month-end, please call 888-860-8686 or visit www.marsicofunds.com.(1)
This review highlights Fund performance over a single six-month period. Shareholders should keep in mind that the Fund is intended for long-term investors who hold their shares for substantially longer periods of time. You should also keep in mind that our views on all investments discussed in this report are subject to change at any time. References to specific securities, industries, and sectors discussed in this report are not recommendations to buy or sell such securities or related investments, and the Funds may not necessarily hold these securities or investments today. Please see the accompanying Schedule of Investments for the percentage of each Fund's portfolio represented by the securities mentioned in this report.
The Fund’s performance shortfall during the reporting period, as compared to the EAFE Index, occurred entirely in the first calendar quarter of 2007, when the Fund had a total return of 0.41% and the EAFE Index had a total return of 4.08%. In fact, during the fourth calendar quarter of 2006, the Fund (which gained 11.41% over that period) outperformed the EAFE Index (which gained 10.35% in that quarter). There were three primary factors that contributed to the Fund’s underperformance as compared to its benchmark index during the latter part of the six-month period ended March 31, 2007:
| • | Stock Selection in the Consumer Discretionary Sector: The Fund’s holdings in the Consumer Discretionary sector had a collective return of 7% during the reporting period. That was a strong absolute return, but it lagged well behind the EAFE Index’s sector return of 17%. The Fund’s performance in this area was singed by disappointing performance in several positions, including amusement game manufacturer Sega Sammy Holdings, Inc. |
(-30% prior to being sold), hotel/casino operator Melco PBL Entertainment (Macau) Ltd.
(-17%), and computer and electronics retailer Yamada Denki Co., Ltd. (-7%).
| • | Stock Selection in the Information Technology Sector: The Fund’s holdings in this area fell -6% in aggregate, performing well below the EAFE Index’s return of +7% for this sector. The major “culprits” that contributed to the Fund’s performance shortfall in this sector were semiconductor-related companies, including positions in Samsung Electronics Co. Ltd. |
(-12% prior to being sold) and Tokyo-headquartered Advantest Corp. (-11%), which provides automated test equipment and services to the semiconductor industry. SAP AG, a Germany-based enterprise application software company, skidded -9% prior to being sold.
| • | Currency: Especially in the fourth calendar quarter of 2006, the US dollar weakened in relation to certain other major currencies, particularly the Euro. The Fund in general was underweighted (as compared to the EAFE Index) in securities priced in Euros and traded in countries that utilize the Euro, including France and Germany, meaning that a smaller portion of the Fund benefited from the Euro’s valuation increase. This had a modestly negative impact on the Fund’s performance compared to the EAFE Index. As a reminder, active currency management is not a central facet of the Fund’s investment process. |
The Fund did have a number of bright spots in terms of its six-month performance. Chief among them were holdings in the Health Care, Financials, and Materials sectors, as noted below:
| • | Health Care: The Fund’s holdings in this sector generated a collective return of 18%, far surpassing the EAFE Index’s sector return of 4%. A major contributor to this outperformance was a position in Australia-based pharmaceutical company CSL Ltd., which gained 64%. |
| • | Financials: Since this sector is a major constituent of the EAFE Index (30% of the Index as of March 31, 2007), its performance can be highly influential on the Index’s overall return and, therefore, is commonly a significant factor – either “plus” or “minus” -- in explaining the Fund’s relative return. The six-month period was no exception, as the Fund’s total holdings in this sector had a gain of 14%, which compared favorably to the EAFE Index’s sector return of 12%. Man Group PLC, the world’s largest publicly-traded hedge fund company, surged 30%. Several of the Fund’s banking companies performed well, including Macquarie Bank Ltd. (+30%), Industrial and Commercial Bank of China Ltd. (+34%), Erste Bank der Oesterreichischen Sparkassen (+25%), and Unibanco-Uniao de Bancos Brasileiros SA (+18%). Another position that produced a robust gain for the Fund was CapitaLand Ltd., a Singapore-based real estate holding and development company, which soared 65%. |
| • | Materials: The Fund’s two most significant individual performance contributors were Switzerland-headquartered companies in the Materials sector: Lonza Group AG (+38%), which develops value-added organic chemicals for the pharmaceutical and agrochemical industries, and Syngenta AG (+26%), a developer of agricultural products designed to improve crop yields and food quality. |
The International Opportunities Fund has tended to have a relatively high portfolio turnover level because of its investment style. Although the Fund may hold core positions for some time, it may change its portfolio composition quickly to take advantage of new opportunities, or to address issues affecting particular holdings.
As of March 31, 2007 the Fund’s primary economic sector allocations included Financials, Consumer Discretionary, Consumer Staples, and Industrials. In terms of country allocations, the Fund’s most significant weightings at period-end were the United Kingdom, Switzerland, Japan, France, Hong Kong, and Mexico. As mentioned in previous shareholder updates, country-level weightings generally should be considered a residual of the Fund’s “bottom-up” stock selection process rather than a major, proactive facet of its investment strategy.
Sincerely,
JAMES G. GENDELMAN
PORTFOLIO MANAGER
| (1) | Total returns are based on net change in NAV assuming reinvestment of distributions. For the period prior to September 30, 2004, the performance returns for the International Opportunities Fund reflect a fee waiver in effect; in the absence of such a waiver, the returns would have been reduced. For the period beginning October 2004 through December 2005, performance returns for the International Opportunities Fund would have been higher but for the reimbursement of fees waived previously. A redemption fee of 2% may be imposed on redemptions or exchanges of Fund shares owned for 30 days or less. Please see the prospectus for more information. |
The MSCI EAFE Index tracks the stocks of about 1,000 companies in Europe, Australasia, and the Far East (together referred to as “EAFE”). You cannot invest directly in an index. Foreign investments may present additional risks due to currency fluctuations, economic and political factors, lower liquidity, government regulations, differences in securities regulations and accounting standards, possible changes in taxation, limited public information, and other factors. These risks are magnified in countries with emerging markets, since these countries may have relatively unstable governments and less established markets and economies.
MARSICO INTERNATIONAL OPPORTURNITIES FUND |
FUND OVERVIEW MARCH 31, 2007 (UNAUDITED)
The International Opportunities Fund invests primarily in common stocks of foreign companies that are selected for their long term growth potential. The Fund may invest in companies of any size throughout the world. It normally invests in the securities of issuers that are economically tied to one or more foreign countries, and expects to be invested in various issuers or securities that together have ties to at least four different foreign countries. Some issuers or securities in the Fund’s portfolio may be based in or economically tied to the United States. The Fund will normally hold a core position of between 35 and 50 common stocks. |
| One Year | Five Year Average Annual | Average Annual Since Inception | Total Annual |
| (4/1/06 – 3/31/07) | (4/1/02 – 3/31/07) | (6/30/00 – 3/31/07) | Operating Expenses* |
| | | | |
Marsico International Opportunities Fund | 13.16% | 16.64%(1) | 9.49%(1) | 1.42% |
MSCI EAFE Index | 20.20% | 15.78% | 5.87% | N/A |
NET ASSETS | | |
| | |
3/31/07 | $713,283,609 | |
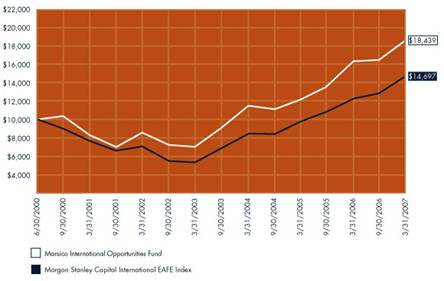
NET ASSET VALUE | | |
| | |
Net Asset Value Per Share | $16.98 | |
| | |
TOP FIVE HOLDINGS | | |
| | |
Tesco PLC | 4.05 | % |
Continental AG | 3.82 | |
Intesa Sanpaolo S.p.A. | 3.54 | |
Accor S.A. | 3.53 | |
Macquarie Bank, Ltd. | 3.14 | |
| | |
SECTOR ALLOCATION(3) | | |
| | |
Financials | 32.81 | % |
Consumer Cyclical | 19.30 | |
Consumer Non-Cyclical | 16.93 | |
Industrials | 12.18 | |
Communications | 9.19 | |
Basic Materials | 4.39 | |
Utilities | 2.44 | |
Energy | 1.67 | |
Diversified | 1.09 | |
| | | | |
| * | The Total Annual Operating Expenses are reflective of the information disclosed in the Funds’ prospectus dated February 1, 2007 and may differ from the expense ratios disclosed in this report. |
The performance included in the table and graph do not reflect the deduction of taxes on Fund distributions or the redemption of Fund shares.
The performance data quoted here represent past performance, and past performance is not a guarantee of future results. Investment return and principal value of an investment will fluctuate so that an investor’s shares, when redeemed, may be worth more or less than their original cost. Current performance may be lower or higher than the performance information quoted. To obtain performance information current to the most recent month-end, please call 888-860-8686 or visit www.marsicofunds.com. A redemption fee may be imposed on redemptions or exchanges of Fund shares owned for 30 days or less.
| (1) | The performance returns for the International Opportunities Fund (for the period prior to September 30, 2004) reflect a fee waiver in effect; in the absence of such a waiver, the returns would be reduced. For the period beginning October 1, 2004 through December 2005, performance returns for the International Opportunities Fund would be higher but for the reimbursement of fees waived previously. |
| (2) | This chart assumes an initial investment of $10,000 made on June 30, 2000 (inception). Total returns are based on net change in NAV, assuming reinvestment of distributions. |
| (3) | Sector weightings represent the percentage of the Fund’s investments (excluding cash equivalents) in certain general sectors. These sectors may include more than one industry. The Fund’s portfolio composition is subject to change at any time. |
The Morgan Stanley Capital International (MSCI) EAFE Index tracks the stocks of about 1,000 companies in Europe, Australasia, and the Far East (EAFE). You cannot invest directly in an index.
SCHEDULE OF INVESTMENTS MARCH 31, 2007 (UNAUDITED)
| Number | | Percent |
| of | | of Net |
| Shares | Value | Assets |
COMMON STOCKS | | | | | |
| | | | | |
Advertising Services | | | | | |
JC Decaux S.A. | 287,474 | $8,483,050 | | 1.19 | % |
| | | | | |
Aerospace/Defense | | | | | |
BAE Systems PLC | 1,980,702 | 17,929,526 | | 2.51 | |
| | | | | |
Agricultural Chemicals | | | | | |
Syngenta AG | 78,740 | 15,065,671 | | 2.11 | |
| | | | | |
Automotive - Cars/Light Trucks | | | | | |
Toyota Motor Corporation | 329,400 | 21,104,633 | | 2.96 | |
| | | | | |
Beverages - Wine/Spirits | | | | | |
Diageo PLC | 526,550 | 10,667,381 | | 1.50 | |
| | | | | |
Brewery | | | | | |
Formento Economico Mexicano, | | | | | |
S.A. de C.V. ADR | 69,777 | 7,702,683 | | 1.08 | |
| | | | | |
Broadcast | | | | | |
Services/Programming | | | | | |
Grupo Televisa, | | | | | |
S.A. Spon. ADR | 388,756 | 11,584,929 | | 1.62 | |
| | | | | |
Building - | | | | | |
Residential/Commercial | | | | | |
Gafisa S.A. | 303,481 | 3,829,785 | | 0.54 | |
| | | | | |
Building & Construction | | | | | |
Products - Miscellaneous | | | | | |
Compagnie de Saint-Gobain | 73,364 | 7,170,902 | | 1.01 | |
| | | | | |
Building Products - | | | | | |
Air & Heating | | | | | |
Daikin Industries, Ltd. | 227,573 | 7,917,934 | | 1.11 | |
| | | | | |
Building Products - | | | | | |
Cement/Aggregates | | | | | |
Cemex S.A. de C.V. ADR | 215,850 | 7,069,087 | | 0.99 | |
Holcim Ltd. | 106,344 | 10,650,590 | | 1.49 | |
| | 17,719,677 | | 2.48 | |
| | | | | |
Casino Hotels | | | | | |
Melco PBL Entertainment | | | | | |
(Macau) Ltd. ADR* | 611,050 | 9,862,347 | | 1.38 | |
| | | | | |
Cellular Telecommunications | | | | | |
America Movil | | | | | |
S.A. de C.V. ADR | 303,298 | 14,494,611 | | 2.03 | |
China Mobile Ltd. | 2,348,000 | 21,365,944 | | 3.00 | |
| | 35,860,555 | | 5.03 | |
| Number | | Percent |
| of | | of Net |
| Shares | Value | Assets |
COMMON STOCKS continued | | | | | |
| | | | | |
Chemicals - Specialty | | | | | |
Lonza Group AG | 156,037 | $14,998,248 | | 2.10 | % |
| | | | | |
Commercial Banks - Non-U.S. | | | | | |
Erste Bank der oesterreichischen | | | | | |
Sparkassen AG | 278,059 | 21,655,251 | | 3.04 | |
ICICI Bank Ltd. Spon. ADR | 220,739 | 8,112,158 | | 1.14 | |
Industrial and Commercial | | | | | |
Bank of China - Cl. H* | 12,647,000 | 7,089,507 | | 0.99 | |
Intesa Sanpaolo S.p.A. | 3,325,014 | 25,251,179 | | 3.54 | |
Mitsui Trust Holdings, Inc. | 978,000 | 9,643,890 | | 1.35 | |
Mizuho Financial Group, Inc. | 1,247 | 8,031,848 | | 1.13 | |
The Royal Bank of | | | | | |
Scotland Group PLC | 395,511 | 15,441,592 | | 2.16 | |
Unibanco Holdings GDR | 148,089 | 12,951,864 | | 1.82 | |
| | 108,177,289 | | 15.17 | |
| | | | | |
Distribution/Wholesale | | | | | |
Esprit Holdings, Ltd. | 964,500 | 11,270,090 | | 1.58 | |
| | | | | |
Diversified Operations | | | | | |
China Merchants Holdings | | | | | |
(International) Co., Ltd. | 1,768,000 | 7,467,076 | | 1.05 | |
| | | | | |
Electric - Integrated | | | | | |
Electricite de France | 19,441 | 1,629,894 | | 0.23 | |
| | | | | |
Electronic Components - | | | | | |
Miscellaneous | | | | | |
Nippon Electric | | | | | |
Glass Co., Ltd. | 213,000 | 3,732,561 | | 0.52 | |
| | | | | |
Electronic | | | | | |
Measuring Instruments | | | | | |
Advantest Corporation | 146,700 | 6,510,871 | | 0.91 | |
| | | | | |
Engineering/R&D Services | | | | | |
ABB Ltd. | 423,320 | 7,246,065 | | 1.01 | |
Linde AG | 39,607 | 4,267,112 | | 0.60 | |
| | 11,513,177 | | 1.61 | |
| | | | | |
Finance - Investment | | | | | |
Banker/Broker | | | | | |
Macquarie Bank, Ltd. | 334,302 | 22,382,532 | | 3.14 | |
UBS AG | 300,951 | 17,881,465 | | 2.51 | |
| | 40,263,997 | | 5.65 | |
| | | | | |
Finance - Other Services | | | | | |
Man Group PLC | 1,297,883 | 14,174,912 | | 1.99 | |
| | | | | |
Food - Miscellaneous/Diversified | | | | | |
Nestle S.A. | 41,507 | 16,165,237 | | 2.26 | |
See notes to financial statements.
MARSICO INTERNATIONAL OPPORTURNITIES FUND |
SCHEDULE OF INVESTMENTS MARCH 31, 2007 (UNAUDITED)
| Number | | Percent |
| of | | of Net |
| Shares | Value | Assets |
COMMON STOCKS continued | | | | | |
| | | | | |
Food - Retail | | | | | |
Tesco PLC | 3,303,995 | $28,884,087 | | 4.05 | % |
| | | | | |
Hotels & Motels | | | | | |
Accor S.A. | 263,828 | 25,213,175 | | 3.53 | |
Shangri-La Asia Ltd. | 2,969,003 | 7,333,686 | | 1.03 | |
| | 32,546,861 | | 4.56 | |
| | | | | |
Import/Export | | | | | |
Marubeni Corporation | 1,671,000 | 10,153,055 | | 1.42 | |
| | | | | |
Investment | | | | | |
Management Companies | | | | | |
Macquarie | | | | | |
Infrastructure Group | 1,773,305 | 5,509,560 | | 0.77 | |
| | | | | |
Machinery - General Industrial | | | | | |
AB Volvo - Cl. B | 46,746 | 3,936,336 | | 0.55 | |
| | | | | |
Medical - Drugs | | | | | |
Actelion Ltd.* | 15,653 | 3,648,695 | | 0.51 | |
Chugai Pharmaceutical Co., Ltd. | 621,400 | 15,714,291 | | 2.20 | |
CSL Ltd. | 113,352 | 7,554,409 | | 1.06 | |
Roche Holdings AG | 104,603 | 18,507,711 | | 2.60 | |
| | 45,425,106 | | 6.37 | |
| | | | | |
Mortgage Banks | | | | | |
Northern Rock PLC | 632,361 | 14,248,279 | | 2.00 | |
| | | | | |
Multi-line Insurance | | | | | |
AXA | 515,312 | 21,849,168 | | 3.06 | |
| | | | | |
Oil - Field Services | | | | | |
Schlumberger Ltd. | 49,586 | 3,426,393 | | 0.48 | |
| | | | | |
Oil Companies - | | | | | |
Exploration & Production | | | | | |
CNOOC Ltd. ADR | 78,163 | 6,849,424 | | 0.96 | |
| | | | | |
Oil Companies - Integrated | | | | | |
Petroleo Brasileiro S.A. ADR | 11,917 | 1,185,861 | | 0.17 | |
| | | | | |
Real Estate | | | | | |
Operating/Development | | | | | |
CapitaLand Ltd. | 1,887,000 | 9,950,236 | | 1.39 | |
| | | | | |
Reinsurance | | | | | |
Swiss Reinsurance Company | 117,221 | 10,707,757 | | 1.50 | |
| | | | | |
Retail - Consumer Electronics | | | | | |
Yamada Denki Company Ltd. | 96,100 | 8,954,328 | | 1.26 | |
| Number | | Percent |
| of | | of Net |
| Shares | Value | Assets |
COMMON STOCKS continued | | | | | |
| | | | | |
Retail - Drug Stores | | | | | |
Shoppers Drug | | | | | |
Mart Corporation | 165,461 | $7,330,732 | | 1.03 | % |
| | | | | |
Rubber - Tires | | | | | |
Continental AG | 210,622 | 27,224,337 | | 3.82 | |
| | | | | |
Soap & Cleaning Preparations | | | | | |
Reckitt Benckiser PLC | 138,485 | 7,210,816 | | 1.01 | |
| | | | | |
Television | | | | | |
British Sky Broadcasting | | | | | |
Group PLC | 635,215 | 7,050,042 | | 0.99 | |
| | | | | |
Transportation - Rail | | | | | |
Canadian National | | | | | |
Railway Co. | 159,999 | 7,062,356 | | 0.99 | |
| | | | | |
Water | | | | | |
Veolia Environment | 203,133 | 15,103,632 | | 2.12 | |
| | | | | |
Total Common Stocks | | | | | |
(cost $563,979,579) | | 685,410,791 | | 96.09 | |
See notes to financial statements.
SCHEDULE OF INVESTMENTS MARCH 31, 2007 (UNAUDITED)
| Number | | Percent |
| of | | of Net |
| Shares | Value | Assets |
SHORT-TERM INVESTMENTS | | | | | |
| | | | | |
SSgA Money | | | | | |
Market Fund, 5.00% | 1 | $1 | | 0.00 | % |
SSgA Prime Money | | | | | |
Market Funds, 5.19% | 31,058,894 | 31,058,894 | | 4.36 | |
| | | | | |
Total Short-Term Investments | | | | | |
(cost $31,058,895) | | 31,058,895 | | 4.36 | |
| | | | | |
Total Investments | | | | | |
(cost $595,038,474) | | 716,469,686 | | 100.45 | |
| | | | | |
Liabilities Less | | | | | |
Cash and Other Assets | | (3,186,077 | ) | (0.45 | ) |
| | | | | |
NET ASSETS | | $713,283,609 | | 100.00 | % |
SUMMARY OF INVESTMENTS BY COUNTRY |
| | Percent |
| | of |
| Market | Investment |
Country | Value | Securities |
Australia | $35,446,502 | 5.0 | % |
Austria | 21,655,251 | 3.0 | |
Brazil | 17,967,510 | 2.5 | |
Canada | 14,393,088 | 2.0 | |
China | 7,089,507 | 1.0 | |
France | 79,449,821 | 11.1 | |
Germany | 31,491,449 | 4.4 | |
Hong Kong | 64,148,567 | 9.0 | |
India | 8,112,158 | 1.1 | |
Italy | 25,251,179 | 3.5 | |
Japan | 91,763,411 | 12.8 | |
Mexico | 40,851,310 | 5.7 | |
Singapore | 9,950,236 | 1.4 | |
Sweden | 3,936,336 | 0.6 | |
Switzerland | 114,871,439 | 16.0 | |
United Kingdom | 115,606,634 | 16.1 | |
United States(1) | 34,485,288 | 4.8 | |
Total | $716,469,686 | 100.0 | % |
| (1) | Includes short-term securities. |
See notes to financial statements.
MARSICO INTERNATIONAL OPPORTURNITIES FUND |
STATEMENT OF ASSETS AND LIABILITIES
MARCH 31, 2007 (UNAUDITED)
(Amounts in thousands)
ASSETS | | |
| | |
Investments, at value (cost $595,038) | $716,470 | |
Receivable for investments sold | 6,498 | |
Receivable for capital stock sold | 984 | |
Interest and dividends receivable | 1,781 | |
Prepaid expenses and other assets | 205 | |
Total Assets | 725,938 | |
| | |
LIABILITIES | | |
| | |
Payable for investments purchased | 11,029 | |
Payable for capital stock redeemed | 441 | |
Accrued investment advisory fee | 502 | |
Accrued distribution fee | 304 | |
Accrued trustees’ fees | 245 | |
Accrued expenses and other liabilities | 133 | |
Total Liabilities | 12,654 | |
| | |
NET ASSETS | $713,284 | |
| | |
NET ASSETS CONSIST OF | | |
| | |
Paid-in-capital | $564,424 | |
Accumulated net investment loss | (727 | ) |
Accumulated net realized gain on investments and | | |
foreign currency transactions | 28,097 | |
Net unrealized appreciation on investments | 121,490 | |
| | |
NET ASSETS | $713,284 | |
| | |
SHARES OUTSTANDING, $0.001 par value | | |
(Unlimited shares authorized) | 41,998 | |
| | |
NET ASSET VALUE, REDEMPTION PRICE, | | |
AND OFFERING PRICE PER SHARE | | |
(NET ASSETS/SHARES OUTSTANDING)* | $16.98 | |
| | |
STATEMENT OF OPERATIONS
FOR THE SIX MONTHS ENDED MARCH 31, 2007
(UNAUDITED)
(Amounts in thousands)
INVESTMENT INCOME | | |
| | |
Interest | $590 | |
Dividends (net of $197 of non-reclaimable | | |
foreign withholding taxes) | 3,499 | |
Total Investment Income | 4,089 | |
| | |
EXPENSES | | |
| | |
Investment advisory fees | 2,778 | |
Distribution fees | 817 | |
Transfer agent fees and expenses | 332 | |
Custody and fund accounting fees | 264 | |
Fund administration fees | 100 | |
Printing and postage expenses | 46 | |
Federal and state registration fees | 31 | |
Trustees’ fees and expenses(1) | 22 | |
Professional fees | 17 | |
Miscellaneous | 11 | |
Total expenses | 4,418 | |
Less expenses paid indirectly | (1 | ) |
Net Expenses | 4,417 | |
| | |
NET INVESTMENT LOSS | (328) | |
| | |
REALIZED AND UNREALIZED GAIN | | |
| | |
Net realized gain on investments | 28,712 | |
Net realized gain on foreign | | |
currency transactions | 5,357 | |
Change in unrealized appreciation/ | | |
depreciation on investments and | | |
foreign currency translations | 36,802 | |
Net Gain on Investments | 70,871 | |
| | |
NET INCREASE IN NET ASSETS | | |
RESULTING FROM OPERATIONS | $70,543 | |
| (1) | Includes $11,361 for Trustees’ fees and expenses and $10,661 for the unrealized appreciation related to the mark to market of the shares in the Deferred Fee Plan during the period ended March 31, 2007. |
See notes to financial statements.
STATEMENTS OF CHANGES IN NET ASSETS
| Six Months | | Year |
| Ended 3/31/07 | | Ended |
(Amounts in thousands) | (Unaudited) | | 9/30/06 |
Net investment income (loss) | $(328 | ) | $1,388 | |
Net realized gain on investments | 28,712 | | 22,905 | |
Net realized gain (loss) on foreign currency transactions | 5,357 | | (832 | ) |
Change in unrealized appreciation/depreciation | | | | |
on investments and foreign currency translations | 36,802 | | 43,922 | |
| | | | | |
Net increase in net assets resulting from operations | 70,543 | | 67,383 | |
| | | | | | | | | |
Net investment income | (1,290) | | (2,078 | ) |
Net realized gains | (24,442) | | — | |
| | | | | |
Total distributions | (25,732) | | (2,078 | ) |
| | | | | | | | | |
CAPITAL SHARE TRANSACTIONS | | |
Proceeds from sale of shares | 153,586 | | 349,169 | |
Proceeds from reinvestment of distributions | 24,675 | | 1,980 | |
Redemption fees | 17 | | 73 | |
Redemption of shares | (81,489 | | (107,365 | ) |
| | | | |
Net increase from capital share transactions | 96,789 | | 243,857 | |
| | | | |
TOTAL INCREASE IN NET ASSETS | 141,600 | | 309,162 | |
| | | | | |
Beginning of period | 571,684 | | 262,522 | |
| | | | |
End of period | $713,284 | | $571,684 | |
| | | | |
Accumulated net investment income (loss) | (727 | ) | 891 | |
Shares sold | 9,225 | | 23,164 | |
Shares issued in reinvestment of distributions | 1,495 | | 141 | |
Shares redeemed | (4,892 | ) | (7,322 | ) |
| | | | |
Net increase | 5,828 | | 15,983 | |
See notes to financial statements.
MARSICO INTERNATIONAL OPPORTURNITIES FUND |
FINANCIAL HIGHLIGHTS
| Six Months | Year | Year | Year | Year | Year |
For a Fund Share Outstanding | Ended 3/31/07 | Ended | Ended | Ended | Ended | Ended |
Throughout the Period. | (Unaudited) | 9/30/06 | 9/30/05 | 9/30/04 | 9/30/03 | 9/30/02 |
NET ASSET VALUE, BEGINNING OF PERIOD | $15.81 | | $13.00 | | $10.63 | | $8.80 | | $7.00 | | $6.78 | |
INCOME FROM INVESTMENT OPERATIONS | | |
Net investment income (loss) | (0.01 | ) | 0.04 | | 0.12 | | 0.04 | | 0.02 | | (0.02 | ) |
Net realized and unrealized | | | | | | | | | | | | |
gains on investments | 1.86 | | 2.87 | | 2.25 | | 1.79 | | 1.78 | | 0.19 | |
Total from investment operations | 1.85 | | 2.91 | | 2.37 | | 1.83 | | 1.80 | | 0.17 | |
Net investment income | (0.03 | ) | (0.10) | | — | | — | | — | | (0.01 | ) |
Net realized gains | (0.65 | ) | — | | — | | — | | — | | — | |
Redemption fees [See Note 2(i)] | — | (1) | — | (1) | — | (1) | — | (1) | — | (1) | 0.05 | |
Payment by affiliate | — | | — | | — | | — | | — | | 0.01 | |
Total distributions & other | (0.68) | | (0.10 | ) | — | | — | | — | | 0.05 | |
| | | | | | | | | | | | |
NET ASSET VALUE, END OF PERIOD | $16.98 | | $15.81 | | $13.00 | | $10.63 | | $8.80 | | $7.00 | |
| | | | | | | | | | | | |
TOTAL RETURN | 11.87% | (4) | 22.46% | | 22.30% | | 20.80% | | 25.71% | | 3.37% | |
SUPPLEMENTAL DATA AND RATIOS | | |
Net assets, end of period (000s) | $713,284 | | $571,684 | | $262,522 | | $106,162 | | $28,409 | | $20,632 | |
| | | | | | | | | | | | |
Ratio of expenses to average net assets, | | | | | | | | | | | | |
less waivers and before expenses paid | | | | | | | | | | | | |
indirectly, plus reimbursements of previously | | | | | | | | | | | | |
waived expenses | 1.35% | (3) | 1.44% | | 1.60% | | 1.60% | | 1.68% | (5) | 1.60% | |
| | | | | | | | | | | | |
Ratio of net investment income (loss) to | | | | | | | | | | | | |
average net assets, net of waivers, | | | | | | | | | | | | |
reimbursements of previously waived | | | | | | | | | | | | |
expenses and expenses paid indirectly | (0.10)% | (3) | 0.33% | | 1.19% | | 0.07% | | 0.18% | | (0.25)% | |
| | | | | | | | | | | | |
Ratio of expenses to average net assets, | | | | | | | | | | | | |
before waivers, reimbursements of | | | | | | | | | | | | |
previously waived expenses and | | | | | | | | | | | | |
expenses paid indirectly | 1.35% | (3) | 1.41% | | 1.49% | | 1.68% | | 2.31% | | 2.07% | |
| | | | | | | | | | | | |
Ratio of net investment income (loss) to | | | | | | | | | | | | |
average net assets, before waivers, | | | | | | | | | | | | |
reimbursements of previously waived | | | | | | | | | | | | |
expenses and expenses paid indirectly | (0.10)% | (3) | 0.36% | | 1.30% | | 0.00% | | (0.45)% | | (0.73)% | |
| | | | | | | | | | | | |
Portfolio turnover rate(2) | 60% | (4) | 101% | | 156% | | 105% | | 211% | | 192% | |
| (2) | Portfolio turnover is greater than most funds due to the investment style of the Fund. |
| (4) | Not annualized for the six months ended March 31, 2007. |
| (5) | See Note 3 for information regarding the voluntary fee waiver. |
See notes to financial statements.
MARSICO FLEXIBLE CAPITAL FUND |
INVESTMENT REVIEW BY CORY GILCHRIST
(UNAUDITED) (DECEMBER 29, 2006 THROUGH MARCH 2007)
The Flexible Capital Fund officially debuted on December 29, 2006, in the middle of the six-month reporting period ended March 31, 2007. The first calendar quarter of 2007 represented the Fund’s first full three-month period of operations. The Fund recorded a total return of 3.10% for the period from December 29, 2006 through March 31, 2007. For comparative purposes over the same period, the Blended Index, an internally calculated secondary benchmark, had a total return of 1.64%. The Blended Index is composed of a 50% weighting in the S&P 500 Index, the Fund’s primary benchmark (which returned 0.64% over the same period), a 25% weighting in the Morgan Stanley Capital International All Country World Index ex-US, a secondary benchmark (which returned 3.76% over the same period), and a 25% weighting in the Lehman Brothers U.S. Aggregate Index, another secondary benchmark (which returned 1.50% over the same period). Please see the Fund Overview for more detailed information about the Fund’s performance for the period ended March 31, 2007.
The performance data for the Fund quoted here represent past performance, and past performance is not a guarantee of future results. Investment return and principal value of an investment will fluctuate so that an investor’s shares, when redeemed, may be worth more or less than their original cost. Current performance may be lower or higher than the performance information quoted. To obtain performance information current to the most recent month-end, please call 888-860-8686 or visit www.marsicofunds.com.(1)
This review highlights Fund performance over a single six-month period. Shareholders should keep in mind that the Fund is intended for long-term investors who hold their shares for substantially longer periods of time. You should also keep in mind that our views on all investments discussed in this report are subject to change at any time. References to specific securities, industries, and sectors discussed in this report are not recommendations to buy or sell such securities or related investments, and the Funds may not necessarily hold these securities or investments today. Please see the accompanying Schedule of Investments for the percentage of each Fund's portfolio represented by the securities mentioned in this report.
We chose the moniker “Flexible Capital Fund” to reflect a “bottom-up” security selection strategy that emphasizes research into particular securities (as well as “top down” research into broader economic issues) and that has the ability to invest in a wide array of instruments that offer long-term growth potential and/or current income. The Fund is a non-diversified portfolio, and typically will hold 20-50 securities or other investments. It invests primarily in a broad mix of US and non-US equity securities, fixed income or variable income securities. (That is why one of the Fund’s benchmarks incorporates three specific market segments.)
During the first calendar quarter of 2007 encompassing most of the period while the Fund has been operational, the Fund’s performance benefited primarily from investments in the Financials, Consumer Discretionary, and Industrials sector. More specifically:
| • | Financials: Several of the Fund’s positions in real estate investment trusts (more commonly referred to as “REITs”) performed well, including General Growth Properties, which rose 16% during the first calendar quarter of 2007. The company operates in two primary market segments: shopping centers and master planned communities. |
| • | Consumer Discretionary: Two of the Fund’s debt holdings performed well within this sector during the first calendar quarter of 2007. These included Station Casinos, Inc. (6.875% debenture due March 1, 2016), and WCI Communities, Inc. (9.125% debenture due May 1, 2012), each of which rose 6%. Apparel retailer Saks, Inc. surged nearly 16% during the quarter. |
| • | Industrials: Two transportation services holdings headquartered in Australia performed well for the Fund during the first calendar quarter of 2007. Macquarie |
MARSICO FLEXIBLE CAPITAL FUND |
Airports, which invests primarily in airport assets, gained 13%. Macquarie Infrastructure Group, which focuses on highway and rail track construction projects, was up 12%.
Several other individual securities had a substantial positive impact on the Fund’s performance during the first calendar quarter of 2007. These included Enterprise Products Partners, LP, a Texas-based oil and gas storage and transportation partnership (+10%) and a debenture of HCA Inc. (6.50%, due February 15, 2016), a corporate operator of hospitals and health systems in 21 states, England, and Switzerland that in November 2006 became a private company, which gained 7% during the quarter.
Despite the Fund’s significant allocation to financial services companies during the first calendar quarter of 2007, it managed to avoid much of the “downdraft” that occurred in that sector during February and March. However, performance was singed by a position in Redwood Trust, a REIT focused on mortgage finance, which skidded -9% during the quarter. Another holding that struggled during the quarter was Spectra Energy Corp., which also declined -9%. The company develops and operates pipelines, storage, and related infrastructure that connect natural gas sources to markets across North America.
As of the end of the first calendar quarter of 2007, the Fund’s primary economic sector allocations were in Financials (primarily REITs that offered attractive current income and diversified financial services companies), Consumer Discretionary, and Industrials. Sector and industry concentrations, given the Fund’s investment objectives, will typically be almost entirely a residual of the Fund’s bottom-up security selection process, as compared to a more “thematic”-driven investment rationale. Cash equivalents holdings comprised about 25% of the Fund’s net assets as of March 31, 2007. This was due to a combination of cash offering relatively attractive income, and our desire to keep a “buying reserve” on hand so that we could move speedily to invest Fund assets in new investment ideas.
Sincerely,
CORYDON J. GILCHRIST, CFA
PORTFOLIO MANAGER
| (1) | Total returns are based on net change in NAV assuming reinvestment of distributions. The performance returns for the Flexible Capital Fund reflect a fee waiver in effect; in the absence of such a waiver, the returns would have been reduced. A redemption fee of 2% may be imposed on redemptions or exchanges of Fund shares owned for 30 days or less. Please see the prospectus for more information. |
FUND OVERVIEW MARCH 31, 2007 (UNAUDITED)
The Flexible Capital Fund invests primarily in a broad mix of equity securities, fixed income or variable income securities, or other investments that are selected primarily for their long-term growth potential or current income. The Fund may invest in issuers of any size throughout the world, and will normally hold a core position of between 20 and 50 securities or other investments. |
PERFORMANCE COMPARISON | | |
| | |
| Cumulative Since Inception | Total Annual |
| (12/29/06 –3/31/07) | Operating Expenses* |
| | |
Marsico Flexible Capital Fund | 3.10%(1) | 1.60% |
Blended Index† | 1.64% | N/A |
S&P 500 Index | 0.64% | N/A |
Morgan Stanley Capital International All Country World Index ex-US†† (“MSCI ACWI ex US”) | 3.76% | N/A |
Lehman Brothers U.S. Aggregate Index (“Lehman US Aggregate”) ††† | 1.50% | N/A |
NET ASSETS | | |
| | |
3/31/07 | $27,290,065 | |
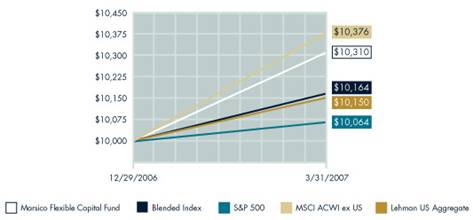
NET ASSET VALUE | | |
| | |
Net Asset Value Per Share | $10.31 | |
| | |
TOP FIVE HOLDINGS | | |
| | |
Redwood Trust, Inc. | 6.66 | % |
Transurban Group | 4.44 | |
Macquarie Airports | | |
Management, Ltd. | 4.11 | |
Weyerhaeuser Company | 3.92 | |
International Speedway | | |
Corporation - Cl. A | 3.91 | |
| | |
SECTOR ALLOCATION(3) | | |
| | |
Financials (includes REITs) | 49.10 | % |
Consumer Cyclical | 18.71 | |
Energy | 10.25 | |
Consumer Non-Cyclical | 8.90 | |
Industrials | 5.46 | |
Basic Materials | 5.20 | |
Communications | 2.38 | |
| | | |
| * | The Total Annual Operating Expenses are reflective of the information disclosed in the Funds’ Prospectus dated February 1, 2007 and may differ from the expense ratios disclosed in this report. |
| † | The Blended Index is a hypothetical combination of unmanaged indices. This internally calculated index combines the total returns from the S&P 500 Index (50%), MSCI ACWI ex US (25%), and Lehman US Aggregate (25%). |
| †† | The MSCI ACWI (All Country World Index) ex US Index is a free float-adjusted market capitalization index that is designed to measure equity performance in the global developed (excluding the US) and emerging markets. You cannot invest directly in an index. |
| ††† | The Lehman U.S. Aggregate Index is composed of securities from Lehman Brothers Government/Corporate Bond Index, Mortgage-Backed Securities Index, and the Asset-Backed Securities Index. The index’s total return consists of price appreciation/depreciation plus income as a percentage of the original investment. Indexes are rebalanced monthly by market capitalization. You cannot invest directly in an index. |
The performance included in the table and graph does not reflect the deduction of taxes on Fund distributions or the redemption of Fund shares.
The performance data quoted here represent past performance, and past performance is not a guarantee of future results. Investment return and principal value of an investment will fluctuate so that an investor’s shares, when redeemed, may be worth more or less than their original cost. Current performance may be lower or higher than the performance information quoted. To obtain performance information current to the most recent month-end, please call 888-860-8686 or visit www.marsicofunds.com. A redemption fee may be imposed on redemptions or exchanges of Fund shares owned for 30 days or less.
| (1) | The performance returns for the Flexible Capital Fund reflect a fee waiver in effect; in the absence of such a waiver, the returns would be reduced. |
| (2) | This chart assumes an initial investment of $10,000 made on December 29, 2006 (inception). Total returns are based on change in NAV, assuming reinvestment of distributions. |
| (3) | Sector weightings represent the percentage of the Fund’s investments (excluding cash equivalents) in certain general sectors. These sectors may include more than one industry. The Fund’s portfolio composition is subject to change at any time. |
MARSICO FLEXIBLE CAPITAL FUND |
SCHEDULE OF INVESTMENTS MARCH 31, 2007 (UNAUDITED)
| Number | | Percent |
| of | | of Net |
| Shares | Value | Assets |
COMMON STOCKS | | | | |
| | | | |
Airport Development/Maintenance | | | | |
Macquarie Airports | | | | |
Management, Ltd. | 347,455 | $1,121,692 | 4.11 | % |
| | | | |
Commercial Banks - Non-U.S. | | | | |
The Royal Bank of | | | | |
Scotland Group plc | 24,023 | 937,909 | 3.44 | |
| | | | |
Finance - Investment | | | | |
Banker/Broker | | | | |
UBS AG | 12,796 | 760,466 | 2.79 | |
| | | | |
Investment Management | | | | |
Companies | | | | |
American Capital | | | | |
Strategies, Ltd. | 14,433 | 639,526 | 2.34 | |
Macquarie | | | | |
Infrastructure Group | 341,054 | 1,059,636 | 3.88 | |
| | 1,699,162 | 6.22 | |
| | | | |
Paper & Related Products | | | | |
Weyerhaeuser Company | 14,319 | 1,070,202 | 3.92 | |
| | | | |
Pipelines | | | | |
AltaGas Income Trust | 29,842 | 632,253 | 2.32 | |
Spectra Energy Corp. | 19,142 | 502,860 | 1.84 | |
| | 1,135,113 | 4.16 | |
| | | | |
Public Thoroughfares | | | | |
Transurban Group | 193,140 | 1,212,652 | 4.44 | |
| | | | |
Racetracks | | | | |
International Speedway | | | | |
Corporation - Cl. A | 20,649 | 1,067,553 | 3.91 | |
| | | | |
Real Estate | | | | |
Operating/Development | | | | |
The St. Joe Company | 4,449 | 232,727 | 0.85 | |
| | | | |
REITs - Apartments | | | | |
AvalonBay Communities, Inc. | 6,801 | 884,130 | 3.24 | |
| | | | |
REITs - Diversified | | | | |
Rayonier, Inc. | 10,576 | 454,768 | 1.67 | |
| Number | | Percent |
| of | | of Net |
| Shares | Value | Assets |
COMMON STOCKS continued | | | | |
| | | | |
REITs - Mortgage | | | | |
Crystal River Capital, Inc. | 14,148 | $379,732 | 1.39 | % |
KKR Financial Corporation | 12,600 | 345,618 | 1.27 | |
Redwood Trust, Inc. | 34,825 | 1,817,169 | 6.66 | |
| | 2,542,519 | 9.32 | |
| | | | |
REITs - Regional Malls | | | | |
General Growth | | | | |
Properties, Inc. | 16,149 | 1,042,741 | 3.82 | |
| | | | |
REITs - Warehouse/Industrial | | | | |
ProLogis | 8,123 | 527,426 | 1.93 | |
| | | | |
Retail - Major | | | | |
Department Store | | | | |
Saks, Inc. | 15,810 | 329,480 | 1.21 | |
| | | | |
Retail - Regional | | | | |
Department Stores | | | | |
Federated Department | | | | |
Stores, Inc. | 13,669 | 615,789 | 2.26 | |
| | | | |
Wireless Equipment | | | | |
Crown Castle | | | | |
International Corp.* | 15,215 | 488,858 | 1.79 | |
| | | | |
Total Common Stocks | | | | |
(cost $15,994,562) | | 16,123,187 | 59.08 | |
| See notes to financial statements. |
SCHEDULE OF INVESTMENTS MARCH 31, 2007 (UNAUDITED)
| Number | | Percent |
| of | | of Net |
| Shares | Value | Assets |
LIMITED PARTNERSHIP INTERESTS | | | | |
| | | | |
Investment Management/ | | | | |
Advisory Services | | | | |
AllianceBernstein | | | | |
Holdings L.P. | 11,465 | $1,014,653 | 3.72 | % |
| | | | |
Pipelines | | | | |
Enterprise Products | | | | |
Partners L.P. | 30,579 | 972,412 | 3.56 | |
| | | | |
Total Limited Partnership Interests | | | | |
(cost $1,888,669) | | 1,987,065 | 7.28 | |
| | | | |
CORPORATE BONDS | | | | |
| | | | |
Building - | | | | |
Residential/Commercial | | | | |
WCI Communities, Inc., | | | | |
9.13%, 5/1/12 | 828,000 | 821,790 | 3.01 | |
| | | | |
Casino Hotels | | | | |
Station Casinos, Inc., | | | | |
6.88%, 3/1/16 | 1,105,000 | 1,012,457 | 3.71 | |
| | | | |
Medical - Hospitals | | | | |
HCA, Inc., | | | | |
6.50%, 2/15/16 | 725,000 | 617,156 | 2.26 | |
| | | | |
Total Corporate Bonds | | | | |
(cost $2,443,608) | | 2,451,403 | 8.98 | |
| Number | | Percent |
| of | | of Net |
| Shares | Value | Assets |
SHORT-TERM INVESTMENTS | | | | |
| | | | |
Federal Home Loan | | | | |
Mortgage Discount | | | | |
Notes, 5.00%, 4/2/07 | 6,500,000 | $6,499,097 | 23.82 | % |
SSgA Prime Money | | | | |
Market Funds, 5.19% | 1 | 1 | 0.00 | |
| | | | |
Total Short-Term Investments | | | | |
(cost $6,499,098) | | 6,499,098 | 23.82 | |
| | | | |
Total Investments | | | | |
(cost $26,825,937) | | 27,060,753 | 99.16 | |
| | | | |
Cash and Other Assets | | | | |
Less Liabilities | | 229,312 | 0.84 | |
| | | | |
NET ASSETS | | $27,290,065 | 100.00 | % |
See notes to financial statements.
MARSICO FLEXIBLE CAPITAL FUND |
STATEMENT OF ASSETS AND LIABILITIES
MARCH 31, 2007 (UNAUDITED)
(Amounts in thousands)
ASSETS | | |
| | |
Investments, at value (cost $26,826) | $27,061 | |
Cash | 44 | |
Receivable for capital stock sold | 84 | |
Interest and dividends receivable | 136 | |
Prepaid expenses and other assets | 60 | |
Total Assets | 27,385 | |
| | |
LIABILITIES | | |
| | |
Payable for capital stock redeemed | 7 | |
Accrued investment advisory fee | 21 | |
Accrued distribution fee | 10 | |
Accrued trustees’ fees | 32 | |
Accrued custody and fund accounting fees | 12 | |
Accrued expenses and other liabilities | 13 | |
Total Liabilities | 95 | |
| | |
NET ASSETS | $27,290 | |
| | |
NET ASSETS CONSIST OF | | |
| | |
Paid-in-capital | $26,992 | |
Accumulated net investment income | 178 | |
Accumulated net realized loss on investments and | | |
foreign currency transactions | (110 | ) |
Net unrealized appreciation on investments | 230 | |
| | |
NET ASSETS | $27,290 | |
| | |
SHARES OUTSTANDING, $0.001 par value | | |
(Unlimited shares authorized) | 2,647 | |
| | |
NET ASSET VALUE, REDEMPTION PRICE, | | |
AND OFFERING PRICE PER SHARE | | |
(NET ASSETS/SHARES OUTSTANDING)* | $10.31 | |
STATEMENT OF OPERATIONS
FOR THE PERIOD DECEMBER 29, 2006(1)
THROUGH MARCH 31, 2007 (UNAUDITED)
(Amounts in thousands)
INVESTMENT INCOME | | |
| | |
Interest | $94 | |
Dividends (net of $2 of non-reclaimable | | |
foreign withholding taxes) | 165 | |
Total Investment Income | 259 | |
| | |
EXPENSES | | |
| | |
Investment advisory fees | 43 | |
Distribution fees | 13 | |
Custody and fund accounting fees | 11 | |
Fund administration fees | 10 | |
Federal and state registration fees | 10 | |
Transfer agent fees and expenses | 9 | |
Professional fees | 7 | |
Printing and postage expenses | 2 | |
Miscellaneous | 1 | |
Trustees’ fees and expenses(2) | (5 | ) |
Total expenses | 101 | |
Less waiver of expenses and | | |
expenses paid indirectly | (20 | ) |
Net Expenses | 81 | |
| | |
NET INVESTMENT INCOME | 178 | |
| | |
REALIZED AND UNREALIZED GAIN | | |
| | |
Net realized loss on investments | (104 | ) |
Net realized loss on foreign | | |
currency transactions | (6 | ) |
Change in unrealized appreciation/ | | |
depreciation on investments and | | |
foreign currency translations | 230 | |
Net Gain on Investments | 120 | |
| | |
NET INCREASE IN NET ASSETS | | |
RESULTING FROM OPERATIONS | $298 | |
| (1) | Commencement of operations. |
| (2) | Includes $316 for Trustees’ fees and expenses and ($5,489) for the unrealized appreciation (depreciation) related to the mark to market of the shares in the Deferred Fee Plan during the period ended March 31, 2007. |
See notes to financial statements.
STATEMENTS OF CHANGES IN NET ASSETS
| 12/29/06(1) |
| to 3/31/07 |
(Amounts in thousands) | (Unaudited) |
Net investment income | $178 | |
Net realized loss on investments | (104 | ) |
Net realized loss on foreign currency transactions | (6 | ) |
Change in unrealized appreciation/depreciation | | |
on investments and foreign currency translations | 230 | |
| | |
Net increase in net assets resulting from operations | 298 | |
CAPITAL SHARE TRANSACTIONS | | |
Proceeds from sale of shares | 27,607 | |
Redemption fees | 1 | |
Redemption of shares | (616 | ) |
| | |
Net increase from capital share transactions | 26,992 | |
| | |
TOTAL INCREASE IN NET ASSETS | 27,290 | |
Beginning of period | — | |
| | |
End of period | $27,290 | |
| | |
Accumulated net investment income (loss) | 178 | |
Shares sold | 2,707 | |
Shares redeemed | (60 | ) |
| | |
Net increase | 2,647 | |
| (1) | Commencement of operations. |
See notes to financial statements.
MARSICO FLEXIBLE CAPITAL FUND |
FINANCIAL HIGHLIGHTS
| 12/29/06* | |
For a Fund Share Outstanding | to 3/31/07 | |
Throughout the Period. | (Unaudited) | |
NET ASSET VALUE, BEGINNING OF PERIOD | $10.00 | |
INCOME FROM INVESTMENT OPERATIONS | | |
Net investment income | 0.07 | |
Net realized and unrealized gains | | |
on investments | 0.24 | |
Total from investment operations | 0.31 | |
Net investment income | — | |
Net realized gains | — | |
Redemption fees [See Note 2(i)] | — | (1) |
Total distributions & other | — | |
| | |
NET ASSET VALUE, END OF PERIOD | $10.31 | |
| | |
TOTAL RETURN | 3.10% | (3) |
SUPPLEMENTAL DATA AND RATIOS | | |
Net assets, end of period (000s) | $27,290 | |
Ratio of expenses to average net assets, | | |
less waivers and before expenses paid indirectly, | | |
plus reimbursements of previously waived expenses | 1.60% | (2) |
Ratio of net investment income to average net assets, | | |
net of waivers, reimbursements of previously | | |
waived expenses and expenses paid indirectly | 3.52% | (2) |
Ratio of expenses to average net assets, before | | |
waivers, reimbursements of previously waived | | |
expenses and expenses paid indirectly | 1.99% | (2) |
Ratio of net investment income to average net assets, | | |
before waivers, reimbursements of previously | | |
waived expenses and expenses paid indirectly | 3.13% | (2) |
Portfolio turnover rate | 29% | (3) |
| * | Commencement of operations. |
| (3) | Not annualized for the period December 29, 2006 to March 31, 2007. |
See notes to financial statements.
NOTES TO FINANCIAL STATEMENTS MARCH 31, 2007 (UNAUDITED)
The Marsico Investment Fund (the “Trust”) was organized on October 1, 1997, as a Delaware Statutory Trust and is registered under the Investment Company Act of 1940 (the “1940 Act”) as an open-end management investment company. The Focus Fund, the Growth Fund, the 21st Century Fund, the International Opportunities Fund and the Flexible Capital Fund (collectively, the “Funds”) are separate investment portfolios of the Trust. The Focus Fund and the Flexible Capital Fund are non-diversified funds and the Growth Fund, the 21st Century Fund and the International Opportunities Fund are diversified funds. The Focus and Growth Funds commenced operations on December 31, 1997, the 21st Century Fund commenced operations on February 1, 2000, the International Opportunities Fund commenced operations on June 30, 2000 and the Flexible Capital Fund commenced operations on December 29, 2006. Affiliates of the Adviser hold approximately 36% of the Flexible Capital Fund as of March 31, 2007.
| 2. | Significant Accounting Policies |
The following is a summary of significant accounting policies consistently followed by the Funds in the preparation of their financial statements. These policies are in conformity with generally accepted accounting principles (“GAAP”) for investment companies. The presentation of financial statements in conformity with GAAP requires management to make estimates and assumptions that affect the reported amounts of assets and liabilities at the date of the financial statements and the reported amounts of income and expenses during the reporting period. Actual results could differ from those estimates. Certain prior year information has been reformatted to conform to the current year presentation.
| (a) | Investment Valuation—A security traded on a recognized stock exchange is valued at the last sale price prior to the closing of the principal exchange on which the security is traded. Securities traded on NASDAQ generally will be valued at the NASDAQ Official Closing Price. If no sale is reported on the valuation date, the most current bid price will generally be used. All other securities for which over-the-counter market quotations are readily available are valued at the last sale price. Debt securities that will mature in more than 60 days are generally valued at their bid prices furnished by a pricing service. Debt securities that will mature in 60 days or less are valued at amortized cost, if it approximates market value. Any securities for which market quotations are not readily available are valued at their fair value as determined in good faith by the Adviser in accordance with procedures established by, and under the general supervision of, the Funds’ Board of Trustees. The Funds may use pricing services to assist in determining market value. The Board of Trustees has authorized the use of a pricing service to assist the Funds in valuing certain equity securities listed or traded on foreign security exchanges in the Funds’ portfolios in certain circumstances where there is a significant change in the value of related U.S.- traded securities, as represented by the S&P 500 Index. |
| (b) | Expenses—The Funds are charged for those expenses that are directly attributable to each Fund, such as advisory and custodial fees. Expenses that are not directly attributable to a Fund are typically allocated among the Funds in proportion to their respective net assets. The Funds’ expenses may be reduced by voluntary advisory fee waivers, brokerage credits and uninvested cash balances earning interest or credits. Such credits are included in Waiver of Expenses and Expenses Paid Indirectly in the Statement of Operations. |
Brokerage commissions were paid to unaffiliated brokers which reduced certain transfer agent fees and expenses in the amount of $111,547, $38,019 and $738 for the Focus Fund, Growth Fund, and 21st Century Fund, respectively, for the six-months ended March 31, 2007. Also, the Funds received credits on certain custody account balances which reduced certain transfer agent fees and expenses in the amount of $8,807, $4,914, $2,416, $1,176 and $16 for the Focus Fund, Growth Fund, 21st Century Fund, International Opportunities Fund, and Flexible Capital Fund, respectively, for the six-months ended March 31, 2007. Brokerage commission credits and custody account earnings credits are included in Expenses Paid Indirectly on the Statements of Operations.
NOTES TO FINANCIAL STATEMENTS MARCH 31, 2007 (UNAUDITED) (CONTINUED)
| (c) | Federal Income Taxes—Each Fund intends to comply with the requirements of the Internal Revenue Code necessary to qualify as a regulated investment company and to make the requisite distributions of income to its shareholders which will be sufficient to relieve it from all or substantially all federal and state income and excise taxes. Certain Funds may utilize earnings and profits on redemption of shares as part of the dividends paid deduction. |
| (d) | Distributions to Shareholders—Dividends from net investment income and net realized capital gains, if any, will be declared and paid at least annually. Distributions to shareholders are recorded on the ex-dividend date. Each Fund may periodically make reclassifications among certain of its capital accounts as a result of the timing and characterization of certain income and capital gains determined in accordance with federal tax regulations, which may differ from GAAP. These reclassifications are due to differing treatment for items such as deferral of wash sales, foreign currency transactions, deferred trustees compensation, net operating losses and post-October capital losses. |
| (e) | Foreign Currency Translation—The accounting records of the Funds are maintained in U.S. dollars. Values of securities denominated in foreign currencies are translated into U.S. dollars at 4:00 p.m. ET. Amounts related to the purchase and sale of foreign securities and investment income are translated at the rates of exchange prevailing on the respective dates of such transactions. |
Reported realized gains on foreign currency transactions arise from sales of portfolio securities, forward currency contracts, currency gains or losses realized between the trade and settlement dates on securities transactions, the difference between the amounts of dividends, interest, and foreign withholding taxes recorded on the Funds’ books, and the U.S. dollar equivalent of the amounts actually received or paid.
The Funds do not isolate that portion of the results of operations resulting from changes in foreign exchange rates on investments from the fluctuations arising from changes in market prices of securities held at fiscal year-end. Net unrealized appreciation or depreciation on investments and foreign currency translations arise from changes in the value of assets and liabilities, including investments in securities at fiscal year-end, resulting from changes in the exchange rates and changes in market prices of securities held.
| (f) | Forward Currency Contracts and Futures Contracts—The Funds may enter into forward currency contracts to reduce their exposure to changes in foreign currency exchange rates on their foreign holdings and to lock in the U.S. dollar cost of firm purchase and sale commitments for securities denominated in foreign currencies. A forward currency contract is a commitment to purchase or sell a foreign currency at a future date at a negotiated forward rate. The gain or loss arising from the difference between the U.S. dollar cost of the original contract and the value of the foreign currency in U.S. dollars upon closing of such contract is included in net realized gain or loss from foreign currency transactions. |
Forward currency contracts held by the Funds are fully collateralized by other securities. If held by the Funds, such collateral would be in the possession of the Funds’ custodian. The collateral would be evaluated daily to ensure its market value equals or exceeds the current market value of the corresponding forward currency contracts.
Futures contracts are marked to market daily and the resultant variation margin is recorded as an unrealized gain or loss. When a contract is closed, a realized gain or loss is recorded equal to the difference between the opening and closing value of the contract. Generally, open forward and futures contracts are marked to market (i.e., treated as realized and subject to distribution) for federal income tax purposes at fiscal year-end.
Foreign-denominated assets and forward currency contracts may involve more risks than domestic transactions, including currency risk, political and economic risk, regulatory risk and market risk. Risks may arise from the potential inability of a
counterparty to meet the terms of a contract and from unanticipated movements in the value of foreign currencies relative to the U.S. dollar.
The Funds may enter into “futures contracts” and “options” on securities, financial indexes and foreign currencies, forward contracts, and interest rate swaps and swap-related products. The Funds intend to use such derivative instruments primarily to hedge or protect from adverse movements in securities prices, currency rates or interest rates. The use of futures contracts and options may involve risks such as the possibility of illiquid markets or imperfect correlation between the value of the contracts and the underlying securities, or that the counterparty will fail to perform its obligations. There were no outstanding futures, options, forward currency contracts, or swap-related products open as of March 31, 2007.
| (g) | Options Contracts—The Funds may purchase and write (sell) put and call options on foreign and domestic stock indices, foreign currencies and U.S. and foreign securities that are traded on U.S. and foreign securities exchanges and over-the-counter markets. These transactions are for hedging purposes or for the purpose of earning additional income. In addition, the Funds may enter into such transactions for cross-hedging purposes. |
The risk associated with purchasing an option is that the Fund pays a premium whether or not the option is exercised. Additionally, the Fund bears the risk of loss of premium and change in market value should the counterparty not perform under the contract. Put and call options purchased are accounted for in the same manner as portfolio securities. The cost of securities acquired through the exercise of call options is increased by premiums paid. The proceeds from securities sold through the exercise of put options are decreased by the premiums paid.
When the Fund writes an option, the premium received by the Fund is recorded as a liability and is subsequently adjusted to the current market value of the option written. Premiums received from writing options that expire are recorded by the Fund on the expiration date as realized gains from option transactions. The difference between the premium and the amount paid on effecting a closing purchase transaction, including brokerage commissions, is also treated as a realized gain, or if the premium is less than the amount paid for the closing purchase transaction, as a realized loss. If a call option is exercised, the premium is added to the proceeds from the sale of the underlying security or currency in determining whether the Fund has realized a gain or loss. If a put option is exercised, the premium reduces the cost basis of the security or currency purchased by the Fund. In writing an option, the Fund bears the market risk of an unfavorable change in the price of the security or currency underlying the written option. Exercise of an option written by the Fund could result in the Fund selling or buying a security or currency at a price different from the current market value.
| (h) | Trustees’ Compensation—Effective February 1, 2000, the Board of Trustees adopted the Marsico Investment Fund Deferred Fee Plan, amended and restated as of December 30, 2005 (the “Deferred Fee Plan”), which allows the independent Trustees to defer the receipt of all or a portion of the Trustees’ fees payable. The Trustees are deemed to be notionally invested in the Funds until distribution in accordance with the Deferred Fee Plan. Included in the Statement of Assets and Liabilities is the cumulative unrealized appreciation (depreciation) of $146,422, $76,756, $71,751, $58,277 and $(5,489), related to the mark-to-market of the shares of the Deferred Fee Plan for the Focus Fund, Growth Fund, 21st Century Fund, International Opportunities Fund and Flexible Capital Fund, respectively. |
| (i) | Redemption Fee—For shares purchased on or after January 30, 2004, a 2.00% redemption fee is retained by the Funds to offset transaction costs and other expenses associated with short-term investing. The fee is imposed on certain redemptions or exchanges of shares held 30 days or less from their purchase date. Prior to January 30, 2004, a 2.00% redemption fee was imposed on redemptions or exchanges of shares of the International |
NOTES TO FINANCIAL STATEMENTS MARCH 31, 2007 (UNAUDITED) (continued)
Opportunities Fund held three months or less from their purchase date. Redemption fees are recorded by the Funds as a reduction of shares redeemed and as a credit to paid-in-capital. For the period ended March 31, 2007, the Focus Fund, Growth Fund, 21st Century Fund, International Opportunities Fund and Flexible Capital Fund received $22,994, $18,448, $71,550, $16,677 and $676, respectively, in redemption fees.
| (j) | Other—Investment transactions are accounted for on a trade date basis. Each Fund determines the gain or loss realized from the investment transactions by comparing the original cost of the security lot sold with the net sale proceeds. Dividend income is recognized on the ex-dividend date. Certain dividends from foreign securities will be recorded as soon as the Trust is informed of the dividend if such information is obtained subsequent to the ex-dividend date. Interest income is recognized on an accrual basis. |
| (k) | Indemnifications—In the normal course of business, the Funds enter into contracts that contain provisions indemnifying other parties against specified potential liabilities. Each Fund’s maximum exposure under these arrangements is unknown as this would involve future claims that may be made against the Fund that have not yet occurred. However, based on experience, the Funds expect the risk of loss to be remote. |
| 3. | Investment Advisory Agreement and Transactions With Affiliates |
The Funds have an agreement with Marsico Capital Management, LLC (the “Adviser”) to furnish investment advisory services to the Funds. Under the terms of this agreement, the Adviser is compensated for managing the Focus Fund, and the Growth Fund at the rate of 0.85% per year of average daily net assets up to $3 billion in each Fund, and 0.75% per year of average daily net assets exceeding $3 billion in each Fund; and at a rate of 0.85% of the average daily net assets of the 21st Century Fund, the International Opportunities Fund, and the Flexible Capital Fund. Prior to November 11, 2004, the Adviser was compensated for managing the Focus Fund and the Growth Fund at a rate of 0.85% of average daily net assets of each Fund. The Adviser has voluntarily agreed to limit the total expenses of each Fund (excluding interest, taxes, acquired Fund fees and expenses, brokerage and extraordinary expenses) to an annual rate of 1.60% of the Focus, International Opportunities and Flexible Capital Funds’ average daily net assets and 1.50% of the Growth and 21st Century Funds’ average daily net assets until December 31, 2007. This fee waiver is voluntary and may be terminated at any time.
The voluntary waiver of expenses for the year ended September 30, 2003 excludes as an extraordinary item the unrealized appreciation of $30,090 and $17,937, respectively, for the 21st Century Fund and International Opportunities Fund related to the mark-to-market of the shares of the Deferred Fee Plan. As a result, the unrealized appreciation is retained by the Funds in accordance with the Deferred Fee Plan. For periods subsequent to September 30, 2003, unrealized appreciation/depreciation of Fund shares in the Deferred Fee Plan will be subject to the Funds’ expense reimbursement agreement with the Adviser.
The Adviser is entitled to reimbursement from a Fund of any fees waived pursuant to this arrangement if such reimbursements do not cause a Fund to exceed existing expense limitations and the reimbursement is made within three years after the year in which the Adviser incurred the expense. As of March 31, 2007 reimbursements that may potentially be made by the Flexible Capital Fund to the Adviser are $20,053 which expire in 2010.
Banc of America Securities is an affiliate of the Adviser and may be designated as an introductory broker on certain Fund transactions. For the period ended March 31, 2007, none of the Funds paid brokerage commissions to Banc of America Securities.
| 4. | Service and Distribution Plan |
The Funds have adopted a Service and Distribution Plan (the “Plan”) pursuant to Rule 12b-1 under the 1940 Act. The Plan authorizes payments by the Funds in connection with the distribution of their shares at an annual rate, as determined from time to time by the Board of Trustees, of up to 0.25% of a Fund’s average daily net assets.
| 5. | Investment Transactions |
The aggregate purchases and sales of securities, excluding short-term investments, for the Funds for the six-months ended March 31, 2007, were as follows:
| | | 21st | International | Flexible |
| Focus | Growth | Century | Opportunities | Capital |
(Amounts in thousands) | Fund | Fund | Fund | Fund | Fund |
Purchases | $985,785 | $578,671 | $1,137,769 | $446,800 | $25,871 |
Sales | $936,881 | $492,890 | $477,502 | $377,851 | $5,443 |
There were no purchases or sales of U.S. government securities.
| 6. | Federal Income Tax Information |
At March 31, 2007, gross unrealized appreciation and depreciation of investments, based on cost for federal income tax purposes, were as follows:
| | | 21st | International | Flexible |
| Focus | Growth | Century | Opportunities | Capital |
(Amounts in thousands) | Fund | Fund | Fund | Fund | Fund |
Cost of investments | $3,690,713 | | $2,120,793 | | $1,605,088 | | $597,091 | | $26,975 | |
Gross Unrealized | | | | | | | | | | |
Appreciation | $1,204,578 | | $652,996 | | $162,260 | | $123,900 | | $235 | |
Gross Unrealized | | | | | | | | | | |
Depreciation | (38,388 | ) | (20,914) | ) | (22,374 | ) | (4,521 | ) | (149 | ) |
Net Unrealized | | | | | | | | | | |
Appreciation | | | | | | | | | | |
on investments | $1,166,190 | | $632,082 | | $139,886 | | $119,379 | | $86 | |
The difference between cost amounts for financial statement and federal income tax purposes is due primarily to wash sale loss deferrals and foreign currency transactions.
The Focus, Growth, and International Opportunities Funds had realized currency losses (in thousands) from transactions between November 1, 2005 and September 30, 2006 of $0, $0 and $260, respectively. Post-October currency losses and capital losses are treated as arising in the Fund’s next fiscal year.
At September 30, 2006, the Growth and 21st Century Funds had accumulated capital loss carryforwards (in thousands) of $25,104 and $134, with $0 and $134 expiring in 2010 and $25,104 and $0 expiring in 2011, respectively. To the extent that a fund may realize future net capital gains, those gains will be offset by any of its unused capital loss carryforward.
The Focus, Growth, 21st Century and International Opportunities Funds utilized (in thousands) $173,667, $93,760, $36,323 and $1,519, respectively, of its capital loss carryforwards during the year ended September 30, 2006.
NOTES TO FINANCIAL STATEMENTS MARCH 31, 2007 (UNAUDITED) (CONTINUED)
As of September 30, 2006, the components of accumulated earnings (deficit) on a tax basis were as follows:
| | | 21st | International |
| Focus | Growth | Century | Opportunities |
(Amounts in thousands) | Fund | Fund | Fund | Fund |
Undistributed ordinary income (deficit) | $(647 | ) | $(340 | ) | $416 | | $8,677 |
Undistributed long-term capital gains | 85,766 | | — | | — | | 14,331 |
Tax accumulated earnings (deficit) | 85,119 | | (340 | ) | 416 | | 23,008 |
Accumulated capital and other losses | — | | (25,104 | ) | (134 | ) | — |
Unrealized appreciation on investments | 858,913 | | 433,980 | | 78,024 | | 81,041 |
Total accumulated earnings | $944,032 | | $408,536 | | $78,306 | | $104,049 |
Undistributed ordinary income (deficit) consists of net investment income, short-term capital gains and timing differences related to post-October currency losses and deferred Trustees’ compensation.
The 21st Century and International Opportunities Funds distributed to shareholders (in thousands) ordinary income of $67 and $2,078, respectively, for the fiscal year ended September 30, 2006. No distributions were made for the fiscal year ended September 30, 2005.
New Accounting Pronouncements
In July 2006, the Financial Accounting Standards Board issued Interpretation No. 48, “Accounting for Uncertainty in Income Taxes - an Interpretation of FASB Statement No. 109” (the “Interpretation”). The Interpretation establishes for all entities, including pass-through entities such as the Funds, a minimum threshold for financial statement recognition of the benefit of positions taken in filing tax returns (including whether an entity is taxable in a particular jurisdiction), and requires certain expanded tax disclosures. The Interpretation is effective for fiscal years beginning after December 15, 2006, and is to be applied to all open tax years as of the date of effectiveness. Management has recently begun to evaluate the application of the Interpretation to the Funds, and is not in a position at this time to estimate the significance of its impact, if any, on the Funds’ financial statements.
In September 2006, the Financial Accounting Standards Board issued Statement of Financial Accounting Standards No. 157, “Fair Value Measurements.” The Statement defines fair value, establishes a framework for measuring fair value in generally accepted accounting principles (GAAP), and expands disclosures about fair value measurements. The Statement establishes a fair value hierarchy that distinguishes between (1) market participant assumptions developed based on market data obtained from sources independent of the reporting entity (observable inputs) and (2) the reporting entity’s own assumptions about market participant assumptions developed based on the best information available in the circumstances (unobservable inputs). The Statement is effective for financial statements issued for fiscal years beginning after November 15, 2007, and is to be applied prospectively as of the beginning of the fiscal year in which this Statement is initially applied. Management has recently begun to evaluate the application of the Statement to the Funds, and is not in a position at this time to evaluate the significance of its impact, if any, on the Funds’ financial statements.
EXPENSE EXAMPLE FOR THE SIX MONTHS ENDED MARCH 31, 2007 (UNAUDITED)
As a shareholder of the Marsico Funds (the “Funds”), you incur two types of costs: (1) transaction costs, including redemption fees on certain redemptions; and (2) ongoing costs, including management fees; distribution (12b-1) fees, and other Fund expenses. This Example is intended to help you understand your ongoing costs (in dollars) of investing in the Funds and to compare these costs with the ongoing costs of investing in other mutual funds.
The Example is based on an investment of $1,000 invested at the beginning of the period and held for the entire period from October 1, 2006 to March 31, 2007 (the “period”).
Actual Expenses
The first line of the table below provides information about actual account values and actual expenses. You may use the information in this line, together with the amount you invested, to estimate the expenses you paid over the period. Simply divide your account value by $1,000 (for example, an $8,600 account value divided by $1,000 equals 8.6), then multiply the result by the number in the first line under the heading entitled “Expenses Paid During the Period” to estimate the expenses you paid on your account during the period.
Hypothetical Example for Comparison Purposes
The second line of the table below provides information about hypothetical account values and hypothetical expenses based on the Funds’ actual expense ratios and an assumed rate of return of 5% per year before expenses, which is not the actual return of any of the Funds. The hypothetical account values and expenses may not be used to estimate the actual ending account balance or expenses you paid for the period. You may use this information to compare the ongoing costs of investing in the Funds and other funds. To do so, compare this 5% hypothetical example with the 5% hypothetical examples that appear in the shareholder reports of other funds.
Please note that the expenses shown in the table are meant to highlight your ongoing costs only and do not reflect any transactional costs, such as redemption fees. Therefore, the second line of the table is useful in comparing the ongoing costs only, and will not help you determine the relative total costs of owning different funds. In addition, if these transactional costs were included, your costs could have been higher.
Expenses Paid During the Period
| | FOCUS FUND | |
| Beginning | Ending | Expenses paid for the |
| account value | account value | six-month period ended |
| October 1, 2006 | March 31, 2007 | March 31, 2007(1) |
Actual Example | $1,000.00 | $1,079.90 | $6.31 |
Hypothetical Example, | | | |
assuming a 5% return before expenses | $1,000.00 | $1,018.93 | $6.13 |
| | GROWTH FUND | |
| Beginning | Ending | Expenses paid for the |
| account value | account value | six-month period ended |
| October 1, 2006 | March 31, 2007 | March 31, 2007(1) |
Actual Example | $1,000.00 | $1,084.40 | $6.43 |
Hypothetical Example, | | | |
assuming a 5% return before expenses | $1,000.00 | $1,018.83 | $6.22 |
Expenses Paid During the Period (continued)
| 21ST CENTURY FUND |
| Beginning | Ending | Expenses paid for the |
| account value | account value | six-month period ended |
| October 1, 2006 | March 31, 2007 | March 31, 2007(1) |
Actual Example | $1,000.00 | $1,118.50 | $6.85 |
Hypothetical Example, | | | |
assuming a 5% return before expenses | $1,000.00 | $1,018.53 | $6.53 |
| INTERNATIONAL OPPORTUNITIES FUND |
| Beginning | Ending | Expenses paid for the |
| account value | account value | six-month period ended |
| October 1, 2006 | March 31, 2007 | March 31, 2007(1) |
Actual Example | $1,000.00 | $1,118.70 | $7.14 |
Hypothetical Example, | | | |
assuming a 5% return before expenses | $1,000.00 | $1,018.26 | $6.80 |
| FLEXIBLE CAPITAL FUND |
| Beginning | Ending | Expenses paid for the |
| account value | account value | period Dec. 29, 2006(2) — |
| December 29, 2006(2) | March 31, 2007 | March 31, 2007(3) |
Actual Example | $1,000.00 | $1,031.00 | $4.14 |
Hypothetical Example, | | | |
assuming a 5% return before expenses | $1,000.00 | $1,021.00 | $4.12 |
| (1) | Expenses are equal to the Funds’ annualized expense ratios (1.22% for the Focus Fund, 1.24% for the Growth Fund, 1.30% for the 21st Century Fund and 1.35% for the International Opportunities Fund), multiplied by the average account value over the period, multiplied by 182/365 (to reflect the six month period). |
| (2) | Commencement of operations. |
| (3) | Expenses are equal to the Flexible Capital Fund’s annualized expense ratio of 1.60% multiplied by the average account value from commencement of operations to March 31, 2007, multiplied by 93/365 (to reflect the period from commencement of operations to March 31, 2007). |
CONSIDERATION OF INVESTMENT
ADVISORY AGREEMENTS (UNAUDITED)
At a meeting of the Board of Trustees of the Trust that commenced on November 7, 2006 and concluded on November 8, 2006, the Trustees, by a unanimous vote (including a separate vote of those Trustees who are not “interested persons” (as the term is defined in the 1940 Act)) (the “Independent Trustees”), approved the renewal of the Investment Advisory Agreements for the Focus Fund, Growth Fund, 21st Century Fund, and International Opportunities Fund. Also at the meeting of the Board of Trustees of the Trust that commenced on November 7, 2006 and concluded on November 8, 2006, the Independent Trustees approved by a unanimous vote, the initial Investment Advisory Agreement for the Flexible Capital Fund. In advance of the meeting, the Independent Trustees requested and received extensive materials from the Adviser to assist them in considering the renewal of the agreements for the Focus, Growth, 21st Century and International Opportunities Funds and the initial approval of the agreement for the Flexible Capital Fund. The materials provided by the Adviser contained information with respect to the factors noted below, including detailed comparative information relating to the performance, advisory fees and other expenses of the Funds, other funds sub-advised by the Adviser and non-fund advisory accounts of the Adviser. The materials also included comparisons of the Funds with other funds and non-fund accounts of similar size and investment objectives in terms of performance, fees and other expenses, as well as the performance of each Fund versus its benchmark. In addition, the Adviser provided information regarding its overall expenses and profitability, as well as estimates of its costs and profitability relating to managing the Funds.
In addition to the materials prepared specifically for contract review analysis, on an ongoing basis the Trustees receive information and reports from the Adviser and other service providers to the Funds on investment performance as well as operational, compliance and other matters.
The Trustees engaged in a detailed discussion of the materials with management of the Adviser. The Independent Trustees then met separately with independent counsel to the Independent Trustees for a full review of the materials. Following this session, the full Board reconvened and approved the continuation of the Investment Advisory Agreements for the Focus, Growth, 21st Century and International Opportunities Funds and approved the Investment Advisory Agreement for the Flexible Capital Fund.
Discussion of Factors Considered
In connection with the consideration of these agreements, the Trustees, including the Independent Trustees, requested and received from the Adviser, and reviewed, a wide variety of information, including information about (1) the nature, extent, and quality of the services provided by the Adviser; (2) the investment performance of the Funds and the Adviser; (3) the costs of the services to be provided and profits realized by the Adviser and its affiliates from the relationship with the Funds; (4) the extent to which economies of scale may be realized as the Funds grow; and (5) whether fee levels reflect these economies of scale for the benefit of Fund investors; as well as other relevant considerations such as the management fees and expense ratios of each Fund; potential fall-out benefits to the Adviser from its relationship to each Fund; and other general information about the Adviser. For the Flexible Capital Fund, the Trustees took into account, among other things, the services provided to other Funds by the Adviser and estimates of cost and economies based on estimates of the size of the Fund. The following is a summary of the Board’s discussion and views regarding the five factors noted above:
| 1. | Nature, Extent, and Quality of Services. |
The Independent Trustees considered the nature, quality and extent of administrative and shareholder services performed by the Adviser, including portfolio management, supervision of Fund operations and compliance and regulatory filings and disclosures to shareholders, general oversight of other service providers, coordination of Fund marketing initiatives,
review of Fund legal issues, assisting the Trustees in that capacity and other services. The Independent Trustees concluded that the services are extensive in nature, that the Adviser effectively manages the outsourcing by the Funds to other service providers and that the Adviser consistently delivered a high level of service.
| 2. | Investment Performance of the Funds and Adviser. |
The Independent Trustees considered short-term and long-term investment performance for each Fund other than the Flexible Capital Fund over various periods of time as compared to both relevant equity indices and the performance of such Fund’s Lipper, Inc. peer group universe, and concluded that the Adviser was delivering satisfactory performance results consistent with the long-term investment strategies being pursued by the Funds. The Independent Trustees also noted that the investment performance delivered by the Adviser to these Funds appeared to be consistent with the performance delivered for other clients of the Adviser.
| 3. | Costs of Services and Profits Realized by the Adviser. |
| (a) | Costs of Services to Funds: Fees and Expenses. The Independent Trustees considered each Fund’s management fee rates and expense ratios relative to industry averages for such Fund’s benchmark category and the advisory fees charged by the Adviser to other sub-advised funds and non-fund clients, including information regarding expense limitation commitments from the Adviser, and the breakpoints for the Fund’s advisory services. The Independent Trustees noted that the mix of services under these agreements are much more extensive than those under the Adviser’s advisory agreements for sub-advised funds as well as non-fund clients. While the Independent Trustees noted that the investment advisory fees paid by the Funds are generally in the upper quartile of their peer groups, they concluded that those fees are acceptable based upon the qualifications, experience, reputation, and performance of the Adviser and the low-to-moderate overall expense ratios of the Funds. |
| (b) | Profitability and Costs of Services to the Adviser. The Independent Trustees considered the Adviser’s overall profitability and costs and a pro forma estimate of the Adviser’s profitability and costs if the Funds constituted the Adviser’s only assets under management. The Independent Trustees also considered whether the amount of profit is a fair entrepreneurial profit for the management of each Fund, and noted that the Adviser has substantially increased its resources devoted to Fund matters in response to regulatory requirements enacted during the last few years and Fund policies and procedures that were adopted or enhanced in late 2004 and thereafter. The Independent Trustees concluded that the Adviser’s profitability was at an acceptable level, particularly in light of the high quality of the services being provided to the Funds. |
| 4. | Extent of Economies of Scale as Funds Grow. |
The Independent Trustees considered whether there have been economies of scale with respect to the management of each Fund that has commenced operations and whether such Fund has appropriately benefited from any economies of scale. The Independent Trustees noted that economies of scale may develop for certain Funds as their assets increase and their Fund-level expenses decline as a percentage of assets, but that Fund-level economies of scale may not necessarily result in Adviser-level economies of scale. The Adviser had stated during the main meeting that the expenses incurred by the Adviser relating to management of the Funds have increased substantially in recent years as a percentage of management fees, rather than declining as might be anticipated as the assets of certain Funds increase. The Independent Trustees agreed that it was possible that Adviser-level expenses incurred in managing the Funds eventually may level off or decline as a percentage of management fees, especially if the assets of certain Funds continue to grow beyond certain thresholds.
| 5. | Whether Fee Levels Reflect Economies of Scale. |
The Independent Trustees also considered whether the management fee rate is reasonable in relation to the asset size of each Fund and any economies of scale that may exist. The Independent Trustees noted that, effective November 11, 2004, at the behest of the Independent Trustees, breakpoints had been introduced for the two larger Funds, the Focus Fund and the Growth Fund, for assets in excess of $3 billion in each Fund. Under the breakpoints, investment management fees are 0.85% per year of average daily net assets up to $3 billion in each of those two Funds, and 0.75% per year of average daily net assets exceeding $3 billion in each Fund. The Independent Trustees agreed to continue to monitor whether any additional breakpoints for any of the Funds may be appropriate in the future.
| 6. | Other Relevant Considerations. |
| (a) | Adviser Personnel and Methods. The Independent Trustees considered the size, education and experience of the Adviser’s staff. There was also a review of the Adviser’s ”top down” economic analysis with ”bottom up” stock selection. This two-pronged approach, considering both macro-economic factors, such as interest rates, inflation and the global competitive landscape, and seeking to identify individual companies with unique market presence and potential earnings growth that may not be recognized by the market at-large, was regarded by the Independent Trustees as providing an overall risk-managed approach to effective stock selection. This overall strategy and corporate culture was further viewed as facilitating the recruitment, training and retention of portfolio managers and other research and management personnel, and the Trustees concluded that in each of these areas the Adviser was structured in such a way to support the high level of services being provided to the Funds. |
| (b) | Other Benefits to the Adviser. The Independent Trustees also considered the character and amount of other incidental benefits received by the Adviser and its affiliates from its association with the Funds. The Independent Trustees concluded that potential “fall-out” benefits that the Adviser may receive, such as greater name recognition or increased ability to obtain research or brokerage services, appear to be reasonable, and may in some cases benefit the Funds. |
Conclusions
In considering these agreements, the Independent Trustees did not identify any factor as all-important or all-controlling and instead considered these factors collectively in light of each Fund’s surrounding circumstances. Based on this review, it was the judgment of the Independent Trustees that shareholders of Funds that had commenced operations had received very favorable absolute and relative performance at reasonable fees and, therefore, re-approval of these agreements was in the best interests of each such Fund and its shareholders. As a part of their decision-making process, the Independent Trustees noted that the Adviser has managed these Funds since their inception, and the Independent Trustees believe that a long-term relationship with a capable, conscientious adviser is in the best interests of the Funds. The Independent Trustees considered, generally, that shareholders invested in the operating Funds knowing that the Adviser managed that Fund and knowing its investment management fee schedule. As such, the Independent Trustees considered, in particular, whether the Adviser managed each of these Funds in accordance with its investment objectives and policies as disclosed to shareholders. The Independent Trustees concluded that each such Fund was managed by the Adviser consistent with its investment objectives and policies. Based on its review, it was the judgement of the Independent Trustees that the advisory agreement for the Flexible Capital Fund was in the best interest of the Fund and its shareholders.
Upon conclusion of their review and discussion, the Independent Trustees unanimously agreed the Investment Advisory and Management Agreements for each of the Funds were appropriate.
OTHER INFORMATION (UNAUDITED)
Proxy Voting Guidelines
The Funds exercise the voting rights associated with the securities held by the Funds under the proxy voting policy of the Funds. A description of those policies and procedures of the Fund and a record of the Funds’ proxy votes for the year ended June 30, 2006 are available without charge, upon request, by calling 888-860-8686. It is also available on the Securities and Exchange Commission’s website at www.sec.gov.
Quarterly Filing of Portfolio Holdings
The Funds will file their complete schedule of investments with the SEC for the first and third quarters of each fiscal year on Form N-Q. The Funds’ Form N-Q will be available (i) on the SEC’s website at www.sec.gov; (ii) at the SEC’s Public Reference Room and (iii) by calling 800-SEC-0330.

| Not applicable to semi-annual reports. |
Item 3. | Audit Committee Financial Expert |
| Not applicable to semi-annual reports. |
Item 4. | Principal Accountant Fees and Services |
| Not applicable to semi-annual reports. |
Item 5. | Audit Committee of Listed Registrants |
Item 6. | Schedule of Investments |
The schedule of investments in securities of unaffiliated issuers is included as part of the report to shareholders filed under Item 1.
Item 7. | Disclosure of Proxy Voting Policies and Procedures for Closed-End Management |
Investment Companies
Item 8. | Portfolio Managers of Closed-End Management Investment Companies |
Item 9. | Purchases of Equity Securities by Closed-End Management Investment Company and Affiliated |
Item 10. | Submission of Matters to a Vote of Security Holders |
Item 11 - Controls and Procedures.
(a) The registrant's principal executive officer and principal financial officer have concluded that the registrant's disclosure controls and procedures (as defined in Rule 30a-3(c) under the Investment Company Act of 1940, as amended) are effective based on their evaluation of these disclosure controls and procedures within 90 days of the filing date of this report on Form N-CSR.
(b) There were no changes in the registrant's internal control over financial reporting (as defined in Rule 30a-3(d) under the Investment Company Act of 1940, as amended) that occurred during the second fiscal quarter of the period covered by this report that has materially affected, or is reasonably likely to materially affect, the registrant's internal control over financial reporting.
Item 12. Exhibits
(a)(1) Code of Ethics
Not applicable to semi-annual reports.
(a)(2) Certification for each principal executive and principal financial officer of the registrant as required by Rule 30a-2(a) under the Act (17 CFR 270.30a-2(a)) (Exhibits (a) and (b)).
(a)(3) Any written solicitation to purchase securities under Rule 23c-1 under the Investment Company Act of 1940, as amended, that was sent or given during the period covered by the report by or on behalf of the registrant to 10 or more persons.
(b) Certifications required by Rule 30a-2(b) under the Act (17 CFR 270.30a-2(b)), Rule 13a-14(b) or Rule 15d-14(b) under the Exchange Act (17 CFR 240.13a-14(b) or 240.15d-14(b)), and Section 1350 of Chapter 63 of Title 18 of the United States Code (18 U.S.C. 1350) – Filed as an attachment to this filing (Exhibits (c) and (d)).
SIGNATURES
Pursuant to the requirements of the Securities Exchange Act of 1934 and the Investment Company Act of 1940, the registrant has duly caused this report to be signed on its behalf by the undersigned, thereunto duly authorized.
The Marsico Investment Fund
By: /s/ | Thomas F. Marsico |
| Thomas F. Marsico |
| President |
Pursuant to the requirements of the Securities Exchange Act of 1934 and the Investment Company Act of 1940, this report has been signed below by the following persons on behalf of the registrant and in the capacities and on the dates indicated.
By: /s/ | Thomas F. Marsico |
| Thomas F. Marsico |
| President |
By: /s/ | Christopher J. Marsico |
| Christopher J. Marsico |
| Vice President and Treasurer |
Date: May 31, 2007