FINANCIAL STATEMENTS
STATEMENTS OF CHANGES IN NET ASSETS
| | | MARSICO FOCUS FUND | | | MARSICO GROWTH FUND | |
| | | | | | | | | | | | | |
| | | Six-Months | | | Year | | | Six-Months | | | Year | |
| | | Ended | | | Ended | | | Ended | | | Ended | |
| | | 3/31/09 | | | 9/30/08 | | | 3/31/09 | | | 9/30/08 | |
| (Amounts in thousands) | | (Unaudited) | | | | | | (Unaudited) | | | | |
| | | | | | | | | | | | | |
| OPERATIONS: | | | | | | | | | | | | |
| Net investment income | | $ | 5,413 | | | $ | 18,084 | | | $ | 3,498 | | | $ | 9,333 | |
| Net realized gain (loss) on investments | | | (527,063 | ) | | | 42,492 | | | | (271,987 | ) | | | (150,107 | ) |
| Net realized loss on written option contracts | | | (573 | ) | | | — | | | | (333 | ) | | | — | |
| Net realized gain (loss) on foreign currency transactions | | | 265 | | | | 1,701 | | | | (3,386 | ) | | | (1,278 | ) |
| Change in unrealized appreciation/depreciation on investments and foreign currency translations | | | (512,692 | ) | | | (1,147,336 | ) | | | (357,638 | ) | | | (616,090 | ) |
| | | | | | | | | | | | | | | | | |
| Net decrease in net assets resulting from operations | | | (1,034,650 | ) | | | (1,085,059 | ) | | | (629,846 | ) | | | (758,142 | ) |
| | | | | | | | | | | | | | | | | |
| DISTRIBUTIONS: | | | | | | | | | | | | | | | | |
| Net investment income | | | (18,239 | ) | | | — | | | | (9,299 | ) | | | — | |
| Net realized gains | | | (2,822 | ) | | | (416,043 | ) | | | (634 | ) | | | (97,785 | ) |
| | | | | | | | | | | | | | | | | |
| Total distributions | | | (21,061 | ) | | | (416,043 | ) | | | (9,933 | ) | | | (97,785 | ) |
| | | | | | | | | | | | | | | | | |
| CAPITAL SHARE TRANSACTIONS: | | | | | | | | | | | | | | | | |
| Proceeds from sale of shares | | | 357,901 | | | | 1,108,792 | | | | 201,139 | | | | 694,634 | |
| Proceeds from reinvestment of distributions | | | 20,660 | | | | 407,742 | | | | 9,571 | | | | 92,101 | |
| Redemption fees | | | 18 | | | | 51 | | | | 60 | | | | 125 | |
| Redemption of shares | | | (877,203 | ) | | | (1,636,332 | ) | | | (608,921 | ) | | | (921,266 | ) |
| | | | | | | | | | | | | | | | | |
| Net increase (decrease) from capital share transactions | | | (498,624 | ) | | | (119,747 | ) | | | (398,151 | ) | | | (134,406 | ) |
| | | | | | | | | | | | | | | | | |
| TOTAL INCREASE (DECREASE) IN NET ASSETS | | | (1,554,335 | ) | | | (1,620,849 | ) | | | (1,037,930 | ) | | | (990,333 | ) |
| | | | | | | | | | | | | | | | | |
| NET ASSETS: | | | | | | | | | | | | | | | | |
| Beginning of period | | | 3,430,813 | | | | 5,051,662 | | | | 2,097,571 | | | | 3,087,904 | |
| | | | | | | | | | | | | | | | | |
| End of period | | $ | 1,876,478 | | | $ | 3,430,813 | | | $ | 1,059,641 | | | $ | 2,097,571 | |
| | | | | | | | | | | | | | | | | |
| Accumulated net investment income (loss) | | $ | 2,606 | | | $ | 15,432 | | | $ | 2,989 | | | $ | 8,790 | |
| | | | | | | | | | | | | | | | | |
| TRANSACTIONS IN SHARES: | | | | | | | | | | | | | | | | |
| Shares sold | | | 30,822 | | | | 59,309 | | | | 16,281 | | | | 33,382 | |
| Shares issued in reinvestment of distributions | | | 1,808 | | | | 20,326 | | | | 782 | | | | 4,123 | |
| Shares redeemed | | | (78,773 | ) | | | (89,520 | ) | | | (49,428 | ) | | | (45,970 | ) |
| | | | | | | | | | | | | | | | | |
| NET INCREASE (DECREASE) | | | (46,143 | ) | | | (9,885 | ) | | | (32,365 | ) | | | (8,465 | ) |
See notes to financial statements.
FINANCIAL STATEMENTS
MARSICO 21ST CENTURY FUND | | | MARSICO INTERNATIONAL OPPORTUNITIES FUND | | | MARSICO FLEXIBLE CAPITAL FUND | | | MARSICO GLOBAL FUND | |
| | | | | | | | | | | | | | | | | | | | | | | |
| Six-Months | | | Year | | | Six-Months | | | Year | | | Six-Months | | | Year | | | Six-Months | | | Year | |
| Ended | | | Ended | | | Ended | | | Ended | | | Ended | | | Ended | | | Ended | | | Ended | |
| 3/31/09 | | | 9/30/08 | | | 3/31/09 | | | 9/30/08 | | | 3/31/09 | | | 9/30/08 | | | 3/31/09 | | | 9/30/08 | |
| (Unaudited) | | | | | | (Unaudited) | | | | | | (Unaudited) | | | | | | (Unaudited) | | | | |
| | | | | | | | | | | | | | | | | | | | | | | |
| | | | | | | | | | | | | | | | | | | | | | | |
| $ | 2,556 | | | $ | 1,830 | | | $ | 109 | | | $ | 7,982 | | | $ | 90 | | | $ | 226 | | | $ | 315 | | | $ | 701 | |
| | (633,009 | ) | | | (260,968 | ) | | | (116,948 | ) | | | (82,082 | ) | | | (3,965 | ) | | | (2,633 | ) | | | (34,471 | ) | | | (15,861 | ) |
| | — | | | | — | | | | — | | | | — | | | | — | | | | — | | | | — | | | | — | |
| | (7,467 | ) | | | 13,996 | | | | (26,099 | ) | | | 28,951 | | | | (155 | ) | | | 477 | | | | (1,955 | ) | | | 686 | |
| | (36,852 | ) | | | (465,584 | ) | | | (53,765 | ) | | | (230,787 | ) | | | 189 | | | | (1,764 | ) | | | 2,569 | | | | (8,458 | ) |
| | | | | | | | | | | | | | | | | | | | | | | | | | | | | | | |
| | (674,772 | ) | | | (710,726 | ) | | | (196,703 | ) | | | (275,936 | ) | | | (3,841 | ) | | | (3,694 | ) | | | (33,542 | ) | | | (22,932 | ) |
| | | | | | | | | | | | | | | | | | | | | | | | | | | | | | | |
| | | | | | | | | | | | | | | | | | | | | | | | | | | | | | | |
| | (4,230 | ) | | | — | | | | (6,419 | ) | | | (7,301 | ) | | | (116 | ) | | | (633 | ) | | | (734 | ) | | | (236 | ) |
| | — | | | | (109,030 | ) | | | — | | | | (88,835 | ) | | | — | | | | (805 | ) | | | — | | | | (763 | ) |
| | | | | | | | | | | | | | | | | | | | | | | | | | | | | | | |
| | (4,230 | ) | | | (109,030 | ) | | | (6,419 | ) | | | (96,136 | ) | | | (116 | ) | | | (1,438 | ) | | | (734 | ) | | | (999 | ) |
| | | | | | | | | | | | | | | | | | | | | | | | | | | | | | | |
| | | | | | | | | | | | | | | | | | | | | | | | | | | | | | | |
| | 152,757 | | | | 1,038,877 | | | | 80,668 | | | | 357,381 | | | | 999 | | | | 6,769 | | | | 65,912 | | | | 115,046 | |
| | 4,133 | | | | 105,830 | | | | 6,240 | | | | 92,902 | | | | 114 | | | | 1,420 | | | | 728 | | | | 987 | |
| | 79 | | | | 172 | | | | 37 | | | | 96 | | | | — | | | | 5 | | | | 4 | | | | 33 | |
| | (499,567 | ) | | | (938,814 | ) | | | (160,301 | ) | | | (302,777 | ) | | | (3,014 | ) | | | (13,342 | ) | | | (35,657 | ) | | | (41,069 | ) |
| | | | | | | | | | | | | | | | | | | | | | | | | | | | | | | |
| | (342,598 | ) | | | 206,065 | | | | (73,356 | ) | | | 147,602 | | | | (1,901 | ) | | | (5,148 | ) | | | 30,987 | | | | 74,997 | |
| | | | | | | | | | | | | | | | | | | | | | | | | | | | | | | |
| | (1,021,600 | ) | | | (613,691 | ) | | | (276,478 | ) | | | (224,470 | ) | | | (5,858 | ) | | | (10,280 | ) | | | (3,289 | ) | | | 51,066 | |
| | | | | | | | | | | | | | | | | | | | | | | | | | | | | | | |
| | | | | | | | | | | | | | | | | | | | | | | | | | | | | | | |
| | 1,853,435 | | | | 2,467,126 | | | | 597,603 | | | | 822,073 | | | | 14,461 | | | | 24,741 | | | | 82,543 | | | | 31,477 | |
| | | | | | | | | | | | | | | | | | | | | | | | | | | | | | | |
| $ | 831,835 | | | $ | 1,853,435 | | | $ | 321,125 | | | $ | 597,603 | | | $ | 8,603 | | | $ | 14,461 | | | $ | 79,254 | | | $ | 82,543 | |
| | | | | | | | | | | | | | | | | | | | | | | | | | | | | | | |
| $ | (1,104 | ) | | $ | 570 | | | $ | (602 | ) | | $ | 5,708 | | | $ | 103 | | | $ | 129 | | | $ | 165 | | | $ | 584 | |
| | | | | | | | | | | | | | | | | | | | | | | | | | | | | | | |
| | | | | | | | | | | | | | | | | | | | | | | | | | | | | | | |
| | 16,450 | | | | 63,308 | | | | 9,541 | | | | 21,256 | | | | 148 | | | | 633 | | | | 9,926 | | | | 10,358 | |
| | 455 | | | | 6,051 | | | | 754 | | | | 5,225 | | | | 17 | | | | 133 | | | | 114 | | | | 84 | |
| | (56,478 | ) | | | (61,724 | ) | | | (18,965 | ) | | | (18,683 | ) | | | (454 | ) | | | (1,297 | ) | | | (5,659 | ) | | | (3,888 | ) |
| | | | | | | | | | | | | | | | | | | | | | | | | | | | | | | |
| | (39,573 | ) | | | 7,635 | | | | (8,670 | ) | | | 7,798 | | | | (289 | ) | | | (531 | ) | | | 4,381 | | | | 6,554 | |
FINANCIAL STATEMENTS
FINANCIAL HIGHLIGHTS
| | | MARSICO FOCUS FUND | |
| | | | | | | | | | | | | | | | | | | |
| | | Six-Months | | | Year | | | Year | | | Year | | | Year | | | Year | |
| | | Ended | | | Ended | | | Ended | | | Ended | | | Ended | | | Ended | |
| For a Fund Share Outstanding | | 3/31/09 | | | 9/30/08 | | | 9/30/07 | | | 9/30/06 | | | 9/30/05 | | | 9/30/04 | |
| Throughout the Period | | (Unaudited) | | | | | | | | | | | | | | | | |
| | | | | | | | | | | | | | | | | | | |
| Net Asset Value, Beginning of Period | | $ | 15.43 | | | $ | 21.75 | | | $ | 18.19 | | | $ | 17.45 | | | $ | 14.83 | | | $ | 13.49 | |
| | | | | | | | | | | | | | | | | | | | | | | | | |
| Income from Investment Operations: | | | | | | | | | | | | | | | | | | | | | | | | |
| Net investment income (loss) | | | 0.03 | | | | 0.08 | | | | (0.04 | ) | | | (0.02 | ) | | | (0.03 | ) | | | (0.05 | ) |
| Net realized and unrealized gains (losses) on investments | | | (4.71 | ) | | | (4.60 | ) | | | 4.09 | | | | 0.76 | | | | 2.65 | | | | 1.39 | |
| | | | | | | | | | | | | | | | | | | | | | | | | |
| Total from investment operations | | | (4.68 | ) | | | (4.52 | ) | | | 4.05 | | | | 0.74 | | | | 2.62 | | | | 1.34 | |
| | | | | | | | | | | | | | | | | | | | | | | | | |
| Distributions & Other: | | | | | | | | | | | | | | | | | | | | | | | | |
| Net investment income | | | (0.09 | ) | | | — | | | | (0.02 | ) | | | — | | | | — | | | | — | |
| Net realized gains | | | (0.01 | ) | | | (1.80 | ) | | | (0.47 | ) | | | — | | | | — | | | | — | |
| Redemption fees [See Note 2(i)] | | | — | (1) | | | — | (1) | | | — | (1) | | | — | (1) | | | — | (1) | | | — | (1) |
| | | | | | | | | | | | | | | | | | | | | | | | | |
| Total distributions and other | | | (0.10 | ) | | | (1.80 | ) | | | (0.49 | ) | | | — | | | | — | | | | — | |
| | | | | | | | | | | | | | | | | | | | | | | | | |
| Net Asset Value, End of Period | | $ | 10.65 | | | $ | 15.43 | | | $ | 21.75 | | | $ | 18.19 | | | $ | 17.45 | | | $ | 14.83 | |
| | | | | | | | | | | | | | | | | | | | | | | | | |
| Total Return | | | (30.37 | )%(2) | | | (22.69 | )% | | | 22.65 | % | | | 4.24 | % | | | 17.67 | % | | | 9.93 | % |
| | | | | | | | | | | | | | | | | | | | | | | | | |
| Supplemental Data and Ratios: | | | | | | | | | | | | | | | | | | | | | | | | |
| | | | | | | | | | | | | | | | | | | | | | | | | |
| Net assets, end of period (000s) | | $ | 1,876,478 | | | $ | 3,430,813 | | | $ | 5,051,662 | | | $ | 4,616,455 | | | $ | 3,740,191 | | | $ | 2,895,322 | |
| | | | | | | | | | | | | | | | | | | | | | | | | |
| Ratio of expenses to average net assets, less waivers and before expenses paid indirectly, plus reimbursements of previously waived expenses | | | 1.32 | %(3) | | | 1.21 | % | | | 1.23 | % | | | 1.24 | % | | | 1.25 | % | | | 1.30 | % |
| | | | | | | | | | | | | | | | | | | | | | | | | |
| Ratio of net investment income (loss) to average net assets, net of waivers, reimbursements of previously waived expenses and expenses paid indirectly | | | 0.46 | %(3) | | | 0.41 | % | | | (0.20 | )% | | | (0.13 | )% | | | (0.18 | )% | | | (0.36 | )% |
| | | | | | | | | | | | | | | | | | | | | | | | | |
| Ratio of expenses to average net assets, before waivers, reimbursements of previously waived expenses and expenses paid indirectly | | | 1.32 | %(3) | | | 1.21 | % | | | 1.23 | % | | | 1.24 | % | | | 1.25 | % | | | 1.30 | % |
| | | | | | | | | | | | | | | | | | | | | | | | | |
| Ratio of net investment income (loss) to average net assets, before waivers, reimbursements of previously waived expenses and expenses paid indirectly | | | 0.46 | %(3) | | | 0.41 | % | | | (0.21 | )% | | | (0.15 | )% | | | (0.21 | )% | | | (0.40 | )% |
| | | | | | | | | | | | | | | | | | | | | | | | | |
| Portfolio turnover rate | | | 53 | %(2) | | | 78 | % | | | 69 | % | | | 80 | % | | | 84 | % | | | 84 | % |
(1) Less than $0.01.
(2) Not annualized.
(3) Annualized.
(4) Portfolio turnover is greater than most funds due to the investment style of the Fund.
See notes to financial statements.
FINANCIAL STATEMENTS
MARSICO GROWTH FUND | | | MARSICO 21ST CENTURY FUND | |
| | | | | | | | | | | | | | | | | | | | | | | | | | | | | | | | | | | |
Six-Months | | | Year | | | Year | | | Year | | | Year | | | Year | | | Six-Months | | | Year | | | Year | | | Year | | | Year | | | Year | |
Ended | | | Ended | | | Ended | | | Ended | | | Ended | | | Ended | | | Ended | | | Ended | | | Ended | | | Ended | | | Ended | | | Ended | |
3/31/09 | | | 9/30/08 | | | 9/30/07 | | | 9/30/06 | | | 9/30/05 | | | 9/30/04 | | | 3/31/09 | | | 9/30/08 | | | 9/30/07 | | | 9/30/06 | | | 9/30/05 | | | 9/30/04 | |
(Unaudited) | | | | | | | | | | | | | | | | | | (Unaudited) | | | | | | | | | | | | | | | | |
| | | | | | | | | | | | | | | | | | | | | | | | | | | | | | | | | | | |
| $ | 16.73 | | | $ | 23.07 | | | $ | 18.61 | | | $ | 18.09 | | | $ | 15.95 | | | $ | 14.09 | | | $ | 12.86 | | | $ | 18.07 | | | $ | 13.89 | | | $ | 12.07 | | | $ | 10.20 | | | $ | 8.74 | |
| | | | | | | | | | | | | | | | | | | | | | | | | | | | | | | | | | | | | | | | | | | | | | | |
| | | | | | | | | | | | | | | | | | | | | | | | | | | | | | | | | | | | | | | | | | | | | | | |
| | 0.04 | | | | 0.07 | | | | (0.05 | ) | | | (0.04 | ) | | | (0.02 | ) | | | (0.04 | ) | | | 0.02 | | | | 0.01 | | | | 0.05 | | | | 0.02 | | | | (0.01 | ) | | | (0.04 | ) |
| | (5.28 | ) | | | (5.69 | ) | | | 4.51 | | | | 0.56 | | | | 2.16 | | | | 1.90 | | | | (4.89 | ) | | | (4.48 | ) | | | 4.26 | | | | 1.80 | | | | 1.88 | | | | 1.50 | |
| | | | | | | | | | | | | | | | | | | | | | | | | | | | | | | | | | | | | | | | | | | | | | | |
| | (5.24 | ) | | | (5.62 | ) | | | 4.46 | | | | 0.52 | | | | 2.14 | | | | 1.86 | | | | (4.87 | ) | | | (4.47 | ) | | | 4.31 | | | | 1.82 | | | | 1.87 | | | | 1.46 | |
| | | | | | | | | | | | | | | | | | | | | | | | | | | | | | | | | | | | | | | | | | | | | | | |
| | | | | | | | | | | | | | | | | | | | | | | | | | | | | | | | | | | | | | | | | | | | | | | |
| | (0.09 | ) | | | — | | | | — | | | | — | | | | — | | | | — | | | | (0.03 | ) | | | — | | | | (0.13 | ) | | | — | | | | — | | | | — | |
| | (0.01 | ) | | | (0.72 | ) | | | — | | | | — | | | | — | | | | — | | | | — | | | | (0.74 | ) | | | — | (1) | | | — | | | | — | | | | — | |
| | — | (1) | | | — | (1) | | | — | (1) | | | — | (1) | | | — | (1) | | | — | (1) | | | — | (1) | | | — | (1) | | | — | (1) | | | — | (1) | | | — | (1) | | | — | (1) |
| | | | | | | | | | | | | | | | | | | | | | | | | | | | | | | | | | | | | | | | | | | | | | | |
| | (0.10 | ) | | | (0.72 | ) | | | — | | | | — | | | | — | | | | — | | | | (0.03 | ) | | | (0.74 | ) | | | (0.13 | ) | | | — | | | | — | | | | — | |
| | | | | | | | | | | | | | | | | | | | | | | | | | | | | | | | | | | | | | | | | | | | | | | |
| $ | 11.39 | | | $ | 16.73 | | | $ | 23.07 | | | $ | 18.61 | | | $ | 18.09 | | | $ | 15.95 | | | $ | 7.96 | | | $ | 12.86 | | | $ | 18.07 | | | $ | 13.89 | | | $ | 12.07 | | | $ | 10.20 | |
| | | | | | | | | | | | | | | | | | | | | | | | | | | | | | | | | | | | | | | | | | | | | | | |
| | (31.40 | )%(2) | | | (25.14 | )% | | | 23.97 | % | | | 2.87 | % | | | 13.42 | % | | | 13.20 | % | | | (37.88 | )%(2) | | | (25.83 | )% | | | 31.25 | % | | | 15.10 | % | | | 18.33 | % | | | 16.70 | % |
| | | | | | | | | | | | | | | | | | | | | | | | | | | | | | | | | | | | | | | | | | | | | | | |
| | | | | | | | | | | | | | | | | | | | | | | | | | | | | | | | | | | | | | | | | | | | | | | |
| | | | | | | | | | | | | | | | | | | | | | | | | | | | | | | | | | | | | | | | | | | | | | | |
| $ | 1,059,641 | | | $ | 2,097,571 | | | $ | 3,087,904 | | | $ | 2,550,641 | | | $ | 2,125,668 | | | $ | 1,363,425 | | | $ | 831,835 | | | $ | 1,853,435 | | | $ | 2,467,126 | | | $ | 871,459 | | | $ | 379,328 | | | $ | 216,228 | |
| | | | | | | | | | | | | | | | | | | | | | | | | | | | | | | | | | | | | | | | | | | | | | | |
| | | | | | | | | | | | | | | | | | | | | | | | | | | | | | | | | | | | | | | | | | | | | | | |
| | | | | | | | | | | | | | | | | | | | | | | | | | | | | | | | | | | | | | | | | | | | | | | |
| | 1.33 | %(3) | | | 1.24 | % | | | 1.24 | % | | | 1.26 | % | | | 1.26 | % | | | 1.30 | % | | | 1.36 | %(3) | | | 1.29 | % | | | 1.31 | % | | | 1.33 | % | | | 1.39 | % | | | 1.50 | % |
| | | | | | | | | | | | | | | | | | | | | | | | | | | | | | | | | | | | | | | | | | | | | | | |
| | | | | | | | | | | | | | | | | | | | | | | | | | | | | | | | | | | | | | | | | | | | | | | |
| | | | | | | | | | | | | | | | | | | | | | | | | | | | | | | | | | | | | | | | | | | | | | | |
| | 0.54 | %(3) | | | 0.33 | % | | | (0.25 | )% | | | (0.26 | )% | | | (0.14 | )% | | | (0.34 | )% | | | 0.45 | %(3) | | | 0.07 | % | | | 0.43 | % | | | 0.20 | % | | | (0.19 | )% | | | (0.48 | )% |
| | | | | | | | | | | | | | | | | | | | | | | | | | | | | | | | | | | | | | | | | | | | | | | |
| | | | | | | | | | | | | | | | | | | | | | | | | | | | | | | | | | | | | | | | | | | | | | | |
| | | | | | | | | | | | | | | | | | | | | | | | | | | | | | | | | | | | | | | | | | | | | | | |
| | 1.33 | %(3) | | | 1.24 | % | | | 1.24 | % | | | 1.26 | % | | | 1.26 | % | | | 1.30 | % | | | 1.36 | %(3) | | | 1.29 | % | | | 1.31 | % | | | 1.33 | % | | | 1.36 | % | | | 1.44 | % |
| | | | | | | | | | | | | | | | | | | | | | | | | | | | | | | | | | | | | | | | | | | | | | | |
| | | | | | | | | | | | | | | | | | | | | | | | | | | | | | | | | | | | | | | | | | | | | | | |
| | | | | | | | | | | | | | | | | | | | | | | | | | | | | | | | | | | | | | | | | | | | | | | |
| | 0.54 | %(3) | | | 0.33 | % | | | (0.25 | )% | | | (0.27 | )% | | | (0.16 | )% | | | (0.38 | )% | | | 0.45 | %(3) | | | 0.07 | % | | | 0.43 | % | | | 0.20 | % | | | (0.22 | )% | | | (0.42 | )% |
| | | | | | | | | | | | | | | | | | | | | | | | | | | | | | | | | | | | | | | | | | | | | | | |
| | 40 | %(2) | | | 72 | % | | | 53 | % | | | 59 | % | | | 73 | % | | | 73 | % | | | 78 | %(2)(4) | | | 143 | %(4) | | | 105 | %(4) | | | 136 | %(4) | | | 175 | %(4) | | | 191 | %(4) |
FINANCIAL STATEMENTS
FINANCIAL HIGHLIGHTS
| | | MARSICO INTERNATIONAL OPPORTUNITIES FUND | |
| | | | | | | | | | | | | | | | | | | |
| | | Six-Months | | | Year | | | Year | | | Year | | | Year | | | Year | |
| | | Ended | | | Ended | | | Ended | | | Ended | | | Ended | | | Ended | |
| For a Fund Share Outstanding | | 3/31/09 | | | 9/30/08 | | | 9/30/07 | | | 9/30/06 | | | 9/30/05 | | | 9/30/04 | |
| Throughout the Period | | (Unaudited) | | | | | | | | | | | | | | | | |
| | | | | | | | | | | | | | | | | | | |
| Net Asset Value, Beginning of Period | | $ | 12.27 | | | $ | 20.10 | | | $ | 15.81 | | | $ | 13.00 | | | $ | 10.63 | | | $ | 8.80 | |
| | | | | | | | | | | | | | | | | | | | | | | | | |
| Income from Investment Operations: | | | | | | | | | | | | | | | | | | | | | | | | |
| Net investment income (loss) | | | — | (1) | | | 0.16 | | | | 0.16 | | | | 0.04 | | | | 0.12 | | | | 0.04 | |
| Net realized and unrealized gains (losses) on investments | | | (4.11 | ) | | | (5.66 | ) | | | 4.81 | | | | 2.87 | | | | 2.25 | | | | 1.79 | |
| | | | | | | | | | | | | | | | | | | | | | | | | |
| Total from investment operations | | | (4.11 | ) | | | (5.50 | ) | | | 4.97 | | | | 2.91 | | | | 2.37 | | | | 1.83 | |
| | | | | | | | | | | | | | | | | | | | | | | | | |
| Distributions & Other: | | | | | | | | | | | | | | | | | | | | | | | | |
| Net investment income | | | (0.14 | ) | | | (0.18 | ) | | | (0.03 | ) | | | (0.10 | ) | | | — | | | | — | |
| Net realized gains | | | — | | | | (2.15 | ) | | | (0.65 | ) | | | — | | | | — | | | | — | |
| Redemption fees [See Note 2(i)] | | | — | (1) | | | — | (1) | | | — | (1) | | | — | (1) | | | — | (1) | | | — | (1) |
| | | | | | | | | | | | | | | | | | | | | | | | | |
| Total distributions and other | | | (0.14 | ) | | | (2.33 | ) | | | (0.68 | ) | | | (0.10 | ) | | | — | | | | — | |
| | | | | | | | | | | | | | | | | | | | | | | | | |
| Net Asset Value, End of Period | | $ | 8.02 | | | $ | 12.27 | | | $ | 20.10 | | | $ | 15.81 | | | $ | 13.00 | | | $ | 10.63 | |
| | | | | | | | | | | | | | | | | | | | | | | | | |
| Total Return | | | (33.51 | )%(2) | | | (30.95 | )% | | | 32.42 | % | | | 22.46 | % | | | 22.30 | % | | | 20.80 | % |
| | | | | | | | | | | | | | | | | | | | | | | | | |
| Supplemental Data and Ratios: | | | | | | | | | | | | | | | | | | | | | | | | |
| | | | | | | | | | | | | | | | | | | | | | | | | |
| Net assets, end of period (000s) | | $ | 321,125 | | | $ | 597,603 | | | $ | 822,073 | | | $ | 571,684 | | | $ | 262,522 | | | $ | 106,162 | |
| | | | | | | | | | | | | | | | | | | | | | | | | |
| Ratio of expenses to average net assets, less waivers and before expenses paid indirectly, plus reimbursements of previously waived expenses | | | 1.48 | %(3) | | | 1.35 | % | | | 1.37 | % | | | 1.44 | % | | | 1.60 | % | | | 1.60 | % |
| | | | | | | | | | | | | | | | | | | | | | | | | |
| Ratio of net investment income (loss) to average net assets, net of waivers, reimbursements of previously waived expenses and expenses paid indirectly | | | 0.06 | %(3) | | | 1.00 | % | | | 0.92 | % | | | 0.33 | % | | | 1.19 | % | | | 0.07 | % |
| | | | | | | | | | | | | | | | | | | | | | | | | |
| Ratio of expenses to average net assets, before waivers, reimbursements of previously waived expenses and expenses paid indirectly | | | 1.48 | %(3) | | | 1.35 | % | | | 1.37 | % | | | 1.41 | % | | | 1.49 | % | | | 1.68 | % |
| | | | | | | | | | | | | | | | | | | | | | | | | |
| Ratio of net investment income (loss) to average net assets, before waivers, reimbursements of previously waived expenses and expenses paid indirectly | | | 0.06 | %(3) | | | 1.00 | % | | | 0.92 | % | | | 0.36 | % | | | 1.30 | % | | | 0.00 | % |
| | | | | | | | | | | | | | | | | | | | | | | | | |
| Portfolio turnover rate | | | 57 | %(2)(4) | | | 115 | %(4) | | | 125 | %(4) | | | 101 | %(4) | | | 156 | %(4) | | | 105 | %(4) |
* Commencement of operations.
(1) Less than $0.01.
(2) Not annualized.
(3) Annualized.
(4) Portfolio turnover is greater than most funds due to the investment style of the Fund.
See notes to financial statements.
FINANCIAL STATEMENTS
MARSICO FLEXIBLE CAPITAL FUND | | | MARSICO GLOBAL FUND | |
| | | | | | | | | | | | | | | | | |
| Six-Months | | | Year | | | 12/29/06* | | | Six-Months | | | Year | | | 6/29/07* | |
| Ended | | | Ended | | | to | | | Ended | | | Ended | | | to | |
| 3/31/09 | | | 9/30/08 | | | 9/30/07 | | | 3/31/09 | | | 9/30/08 | | | 9/30/07 | |
| (Unaudited) | | | | | | | | | (Unaudited) | | | | | | | |
| | | | | | | | | | | | | | | | | |
| $ | 8.74 | | | $ | 11.32 | | | $ | 10.00 | | | $ | 8.87 | | | $ | 11.46 | | | $ | 10.00 | |
| | | | | | | | | | | | | | | | | | | | | | | |
| | | | | | | | | | | | | | | | | | | | | | | |
| | 0.07 | | | | 0.14 | | | | 0.22 | | | | 0.02 | | | | 0.08 | | | | 0.02 | |
| | (2.43 | ) | | | (1.93 | ) | | | 1.10 | | | | (3.02 | ) | | | (2.46 | ) | | | 1.44 | |
| | | | | | | | | | | | | | | | | | | | | | | |
| | (2.36 | ) | | | (1.79 | ) | | | 1.32 | | | | (3.00 | ) | | | (2.38 | ) | | | 1.46 | |
| | | | | | | | | | | | | | | | | | | | | | | |
| | | | | | | | | | | | | | | | | | | | | | | |
| | (0.08 | ) | | | (0.35 | ) | | | — | | | | (0.08 | ) | | | (0.05 | ) | | | — | |
| | — | | | | (0.44 | ) | | | — | | | | — | | | | (0.17 | ) | | | — | |
| | — | (1) | | | — | (1) | | | — | (1) | | | — | (1) | | | 0.01 | | | | — | (1) |
| | | | | | | | | | | | | | | | | | | | | | | |
| | (0.08 | ) | | | (0.79 | ) | | | — | | | | (0.08 | ) | | | (0.21 | ) | | | — | |
| | | | | | | | | | | | | | | | | | | | | | | |
| $ | 6.30 | | | $ | 8.74 | | | $ | 11.32 | | | $ | 5.79 | | | $ | 8.87 | | | $ | 11.46 | |
| | | | | | | | | | | | | | | | | | | | | | | |
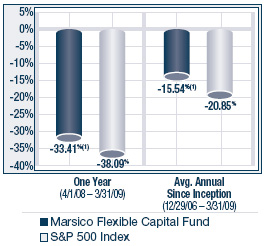
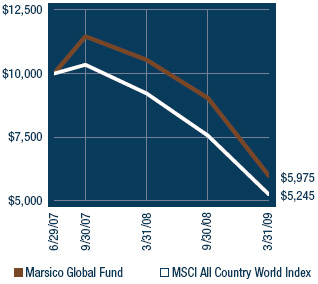
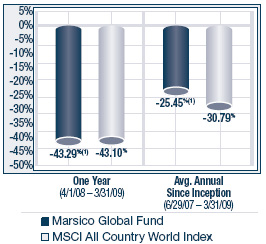
| | (27.09 | )%(2) | | | (17.10 | )% | | | 13.20 | %(2) | | | (33.90 | )%(2) | | | (21.13 | )% | | | 14.60 | %(2) |
| | | | | | | | | | | | | | | | | | | | | | | |
| | | | | | | | | | | | | | | | | | | | | | | |
| | | | | | | | | | | | | | | | | | | | | | | |
| $ | 8,603 | | | $ | 14,461 | | | $ | 24,741 | | | $ | 79,254 | | | $ | 82,543 | | | $ | 31,477 | |
| | | | | | | | | | | | | | | | | | | | | | | |
| | | | | | | | | | | | | | | | | | | | | | | |
| | | | | | | | | | | | | | | | | | | | | | | |
| | 0.75 | %(3) | | | 0.75 | % | | | 1.22 | %(3) | | | 1.22 | %(3) | | | 0.75 | % | | | 0.75 | %(3) |
| | | | | | | | | | | | | | | | | | | | | | | |
| | | | | | | | | | | | | | | | | | | | | | | |
| | | | | | | | | | | | | | | | | | | | | | | |
| | 1.80 | %(3) | | | 1.15 | % | | | 2.62 | %(3) | | | 0.81 | %(3) | | | 0.88 | % | | | 1.06 | %(3) |
| | | | | | | | | | | | | | | | | | | | | | | |
| | | | | | | | | | | | | | | | | | | | | | | |
| | | | | | | | | | | | | | | | | | | | | | | |
| | 1.98 | %(3) | | | 1.71 | % | | | 2.47 | %(3) | | | 1.56 | %(3) | | | 1.49 | % | | | 4.48 | %(3) |
| | | | | | | | | | | | | | | | | | | | | | | |
| | | | | | | | | | | | | | | | | | | | | | | |
| | | | | | | | | | | | | | | | | | | | | | | |
| | 0.57 | %(3) | | | 0.19 | % | | | 1.37 | %(3) | | | 0.47 | %(3) | | | 0.14 | % | | | (2.67 | )%(3) |
| | | | | | | | | | | | | | | | | | | | | | | |
| | 226 | %(2)(4) | | | 207 | %(4) | | | 237 | %(2)(4) | | | 108 | %(2)(4) | | | 201 | %(4) | | | 56 | %(2)(4) |
NOTES TO FINANCIAL STATEMENTS
NOTES TO FINANCIAL STATEMENTS March 31, 2009 (Unaudited)
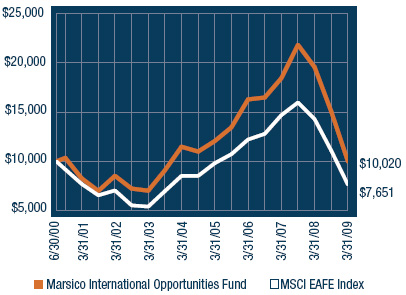
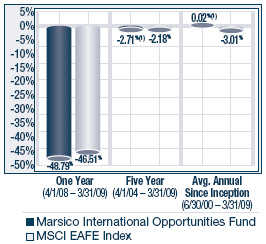
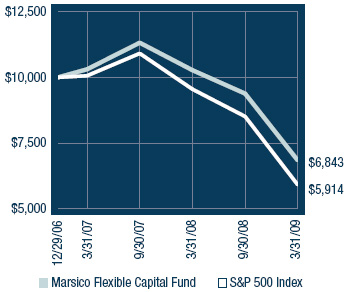
The Marsico Investment Fund (the “Trust”) was organized on October 1, 1997, as a Delaware Statutory Trust and is registered under the Investment Company Act of 1940 (the “1940 Act”) as an open-end management investment company. The Focus Fund, Growth Fund, 21st Century Fund, International Opportunities Fund, Flexible Capital Fund, and Global Fund (collectively, the “Funds”) are separate investment portfolios of the Trust. The Focus Fund and the Flexible Capital Fund are non-diversified funds and the Growth Fund, the 21st Century Fund, the International Opportunities Fund, and the Global Fund are diversified funds. The Focus and Growth Funds commenced operations on December 31, 1997, the 21st Century Fund commenced operations on February 1, 2000, the International Opportunities Fund commenced operations on June 30, 2000, the Flexible Capital Fund commenced operations on December 29, 2006, and the Global Fund commenced operations on June 29, 2007. Affiliates of Marsico Capital Management, LLC (the “Adviser”) hold approximately 46% of the Flexible Capital Fund’s outstanding shares as of March 31, 2009.
| 2. | Significant Accounting Policies |
The following is a summary of significant accounting policies consistently followed by the Funds in the preparation of their financial statements. These policies are in conformity with Generally Accepted Accounting Principles (“GAAP”) for investment companies. The presentation of financial statements in conformity with GAAP requires management to make estimates and assumptions that affect the reported amounts of assets and liabilities at the date of the financial statements and the reported amounts of income and expenses during the reporting period. Actual results could differ from those estimates.
| | (a) | Investment Valuation—A security traded on a recognized stock exchange is valued at the last sale price prior to the closing of the principal exchange on which the security is traded. Securities traded on NASDAQ generally will be valued at the NASDAQ Official Closing Price. If no sale price is reported on the valuation date, the most current bid price will generally be used. Other securities for which over-the-counter market quotations are readily available are generally valued at the last sale price. Debt securities that will mature in more than 60 days are generally valued at their bid prices furnished by a pricing service. Debt securities that will mature in 60 days or less are valued at amortized cost, if it approximates market value. Any securities for which market quotations are not readily available are valued at their fair value as determined in good faith by the Adviser in accordance with procedures established by, and under the general supervision of, the Funds’ Board of Trustees. The Funds may use pricing services to assist in determining market value. The Board of Trustees has authorized the use of a pricing service to assist the Funds in valuing certain equity securities listed or traded on foreign security exchanges in the Funds’ portfolios in certain circumstances where there is a significant change in the value of related U.S.- traded securities, as represented by the S&P 500 Index. |
In September 2006, the Financial Accounting Standards Board issued Statement of Financial Accounting Standards No. 157, “Fair Value Measurements” (“FAS 157”) effective for fiscal years beginning after November 15, 2007. FAS 157 defines fair value, establishes a framework for measuring fair value in GAAP, and expands disclosures about fair value measurements. The Trust adopted FAS 157 as of the beginning of its fiscal year on October 1, 2008. Under FAS 157, various inputs are used in determining the value of the Funds’ investments.
NOTES TO FINANCIAL STATEMENTS
These inputs are summarized into three broad levels and described below:
| | • | Level 1 – quoted prices in active markets for identical investments |
| | • | Level 2 – other significant observable inputs (including quoted prices for similar investments, interest rates, and evaluated quotations obtained from pricing services) |
| | • | Level 3 – significant unobservable inputs (including the Fund’s own assumptions in determining the fair value of investments) |
The inputs or methodology used for valuing investments are not an indication of the risk associated with investing in those investments. The following is a summary of the fair values of the Funds’ investments in each category as of March 31, 2009:
| Fund | | Level 1 | | | Level 2* | | | Level 3 | | | Total | |
| Focus Fund | | $ | 1,865,286,949 | | | $ | 23,700,000 | | | $ | — | | | $ | 1,888,986,949 | |
| Growth Fund | | $ | 1,061,245,663 | | | $ | — | | | | — | | | $ | 1,061,245,663 | |
| 21st Century Fund | | $ | 692,530,770 | | | $ | 129,341,437 | | | | — | | | $ | 821,872,207 | |
| International Opportunities Fund | | $ | 101,275,004 | | | $ | 224,557,342 | | | | — | | | $ | 325,832,346 | |
| Flexible Capital Fund | | $ | 6,106,066 | | | $ | 1,871,497 | | | | — | | | $ | 7,977,563 | |
| Global Fund | | $ | 46,715,816 | | | $ | 32,556,852 | | | | — | | | $ | 79,272,668 | |
| | * | In accordance with procedures established by, and under the general supervision of, the Funds’ Board of Trustees, the values of certain equity securities listed or traded on foreign security exchanges may be adjusted due to a significant change in the value of U.S.-traded securities, as measured by the S&P 500 Index. In this circumstance, such securities are included along with other securities categorized as Level 2. |
| | (b) | Expenses—The Funds are charged for those expenses that are directly attributable to each Fund, such as advisory and custodial fees. Expenses that are not directly attributable to a Fund are typically allocated among the Funds in proportion to their respective net assets and in some cases allocated based on other factors. The Funds’ expenses may be reduced by voluntary advisory fee waivers, brokerage credits and uninvested cash balances earning interest or credits. Such credits are included in “Less waiver of expenses and expenses paid indirectly” on the Statements of Operations. |
| | Brokerage commissions were paid to certain brokers which reduced certain transfer agent fees and expenses in the amount of $140 and $88 for the Focus Fund and Growth Fund, respectively, for the six-months ended March 31, 2009. The Funds also received earnings credits on certain cash account balances which reduced transfer agent fees and expenses in the amount of $1,423, $789, $693, $225, $6, and $47 for the Focus Fund, Growth Fund, 21st Century Fund, International Opportunities Fund, Flexible Capital Fund, and Global Fund respectively, for the six-months ended March 31, 2009. Brokerage commission credits and earnings credits are included in “Less waiver of expenses and expenses paid indirectly” on the Statements of Operations. |
NOTES TO FINANCIAL STATEMENTS
NOTES TO FINANCIAL STATEMENTS March 31, 2009 (Unaudited) (continued)
| | (c) | Federal Income Taxes—Each Fund intends to comply with the requirements of the Internal Revenue Code necessary to qualify as a regulated investment company and to make the requisite distributions of income to its shareholders which will be sufficient to relieve it from all or substantially all federal and state income taxes. Certain funds may utilize earnings and profits on redemption of shares as part of the dividends paid deduction. |
| | (d) | Distributions to Shareholders—Dividends from net investment income and net realized capital gains, if any, will be declared and paid at least annually. Distributions to shareholders are recorded on the ex-dividend date. Each Fund may periodically make reclassifications among certain of its capital accounts as a result of the timing and characterization of certain income and capital gains distributions determined in accordance with federal tax regulations, which may differ from GAAP. These reclassifications are due to differing treatment for items such as foreign currency transactions, net investment losses and investments in partnerships and REITs. |
| | (e) | Foreign Currency Translation—The accounting records of the Funds are maintained in U.S. dollars. Values of securities denominated in foreign currencies are translated into U.S. dollars at 4:00 p.m. ET. Amounts related to the purchase and sale of foreign securities and investment income are translated at the rates of exchange prevailing on the respective dates of such transactions. |
| | Reported realized gains on foreign currency transactions arise from sales of portfolio securities, forward currency contracts, currency gains or losses realized between the trade and settlement dates on securities transactions, the difference between the amounts of dividends, interest, and foreign withholding taxes recorded on the Funds’ books, and the U.S. dollar equivalent of the amounts actually received or paid. |
| | The Funds do not isolate that portion of the results of operations resulting from changes in foreign exchange rates on investments from the fluctuations arising from changes in market prices of securities held at fiscal year-end. Net unrealized appreciation or depreciation on investments and foreign currency translations arise from changes in the value of assets and liabilities, including investments in securities at fiscal year-end, resulting from changes in the exchange rates and changes in market prices of securities held. |
| | (f) | Forward Currency Contracts and Futures Contracts—The Funds may enter into forward currency contracts to reduce their exposure to changes in foreign currency exchange rates on their foreign holdings and to lock in the U.S. dollar cost of firm purchase and sale commitments for securities denominated in foreign currencies. A forward currency contract is a commitment to purchase or sell a foreign currency at a future date at a negotiated forward rate. The gain or loss arising from the difference between the U.S. dollar cost of the original contract and the value of the foreign currency in U.S. dollars upon closing of such contract is included in net realized gain or loss from foreign currency transactions. |
| | Forward currency contracts held by the Funds are fully collateralized by other securities. If held by the Funds, such collateral would be in the possession of the Funds’ custodian. The collateral would be evaluated daily to ensure its market value equals or exceeds the current market value of the corresponding forward currency contracts. |
| | Futures contracts are marked to market daily and the resultant variation margin is recorded as an unrealized gain or loss. When a contract is closed, a realized gain or loss is recorded equal to the difference between the opening and closing value of the contract. Generally, open forward and futures contracts are marked to market (i.e., treated as realized and subject to distribution) for federal income tax purposes at fiscal year-end. |
NOTES TO FINANCIAL STATEMENTS
| | Foreign-denominated assets and forward currency contracts may involve more risks than domestic transactions, including currency risk, political and economic risk, regulatory risk and market risk. Risks may arise from the potential inability of a counterparty to meet the terms of a contract and from unanticipated movements in the value of foreign currencies relative to the U.S. dollar. |
| | The Funds may enter into futures contracts and options on securities, financial indexes, foreign currencies, forward contracts, interest rate swaps and swap-related products. The Funds intend to use such derivative instruments primarily to hedge or protect from adverse movements in securities prices, currency rates or interest rates. The use of futures contracts and options may involve risks such as the possibility of illiquid markets or imperfect correlation between the value of the contracts and the underlying securities, or that the counterparty will fail to perform its obligations. There were no futures, forward currency contracts, or swap-related products open as of March 31, 2009. |
| | (g) | Options Contracts—The Funds may purchase and write (sell) put and call options on foreign and domestic stock indices, foreign currencies, and U.S. and foreign securities that are traded on a securities exchange or an over-the-counter market. These transactions are for hedging purposes or for the purpose of earning additional income. In addition, the Funds may enter into such transactions for cross-hedging purposes. |
| | The risk associated with purchasing an option is that the Fund pays a premium whether or not the option is exercised. Additionally, the Fund bears the risk of loss of premium and change in market value should the counterparty not perform under the contract. Put and call options purchased are accounted for in the same manner as portfolio securities. The cost of securities acquired through the exercise of call options is increased by premiums paid. The proceeds from securities sold through the exercise of put options are decreased by the premiums paid. |
| | When the Fund writes an option, the premium received by the Fund is recorded as a liability and is subsequently adjusted to the current market value of the option written. Premiums received from writing options that expire are recorded by the Fund on the expiration date as realized gains from option transactions. The difference between the premium and the amount paid on effecting a closing purchase transaction, including brokerage commissions, is also treated as a realized gain, or if the premium is less than the amount paid for the closing purchase transaction, as a realized loss. If a call option is exercised, the premium is added to the proceeds from the sale of the underlying security or currency in determining whether the Fund has realized a gain or loss. If a put option is exercised, the premium reduces the cost basis of the security or currency purchased by the Fund. In writing an option, the Fund bears the market risk of an unfavorable change in the price of the security or currency underlying the written option. Exercise of an option written by the Fund could result in the Fund selling or buying a security or currency at a price different from the current market value. Transactions in written option contracts for the six-months ended March 31, 2009 were as follows: |
| | | Focus Fund | | | Growth Fund | |
| | | Number of | | | Premium | | | Number of | | | Premium | |
| Put Options | | Contracts | | | Amount | | | Contracts | | | Amount | |
| Options outstanding at September 30, 2008 | | | — | | | $ | — | | | | — | | | $ | — | |
| Options written | | | 3,770 | | | | 2,264,136 | | | | 2,230 | | | | 1,339,264 | |
| Options closed | | | (3,770 | ) | | | (2,264,136 | ) | | | (2,230 | ) | | | (1,339,264 | ) |
| Options exercised | | | — | | | | — | | | | — | | | | — | |
| Options expired | | | — | | | | — | | | | — | | | | — | |
| Options outstanding at March 31, 2009 | | | — | | | $ | — | | | | — | | | $ | — | |
| | | | | | | | | | | | | | | | | |
| There were no option contracts open as of March 31, 2009. | | | | | |
NOTES TO FINANCIAL STATEMENTS
NOTES TO FINANCIAL STATEMENTS March 31, 2009 (Unaudited) (continued)
| | (h) | Trustees’ Deferred Fee Plan— Effective February 1, 2000, the Board of Trustees adopted the Marsico Investment Fund Deferred Fee Plan (the “Deferred Fee Plan”), amended and restated as of December 30, 2005, which allows the Trustees to defer the receipt of all or a portion of their compensation received from the Funds. Any deferred fees are credited to accounts established on behalf of the Trustees into the Funds as directed by each Trustee. The amounts credited to these accounts increase or decrease in accordance with the performance of the Funds selected by the Trustees. The market value of the deferred account balances as of March 31, 2009 is shown on the Statements of Assets and Liabilities as part of an asset account, “Prepaid expenses and other assets,” and a liability account, “Accrued trustees’ fees.” Additionally, the fluctuation of the account balances due to the Funds performance is recorded by the Funds as unrealized appreciation/(depreciation) which is shown as part of “Net unrealized appreciation (depreciation) on investments and foreign currency translations” on the Statements of Assets and Liabilities and as compensation expense which is shown as part of the expense account “Trustees’ fees and expenses” on the Statements of Operations. Fees earned and deferred by the Trustees for the six-months ended March 31, 2009 are also included in “Trustees’ fees and expenses” on the Statements of Operations. Amounts credited to the Deferred Fee Plan will be deferred until distributed in accordance with the Deferred Fee Plan. |
| | (i) | Redemption Fee—A 2.00% redemption fee is retained by the Funds to offset transaction costs and other expenses associated with short-term investing. The fee is imposed on certain redemptions or exchanges of shares held 30 days or less from their purchase date. Redemption fees are recorded by the Funds as a reduction of shares redeemed and as a credit to paid-in-capital. For the six-months ended March 31, 2009, the Focus Fund, Growth Fund, 21st Century Fund, International Opportunities Fund, Flexible Capital Fund, and Global Fund received $18,047, $60,297, $79,081, $36,702, $7, and $4,463, respectively, in redemption fees. |
| | (j) | Other—Investment transactions are accounted for on a trade date basis. Each Fund determines the gain or loss realized from the investment transactions by comparing the original cost of the security lot sold with the net sale proceeds. Dividend income is recognized on the ex-dividend date. Certain dividends from foreign securities will be recorded as soon as the Trust is informed of the dividend if such information is obtained subsequent to the ex-dividend date. Interest income is recognized on an accrual basis. |
| | (k) | Indemnifications—In the normal course of business, the Funds enter into contracts that contain provisions indemnifying other parties against specified potential liabilities. Each Fund’s maximum exposure under these arrangements is unknown as this would involve future claims that may be made against the Fund that have not yet occurred. However, based on experience, the Funds expect the risk of loss to be remote. |
| 3. | Investment Advisory Agreement and Transactions With Affiliates |
Each Fund has an agreement with the Adviser to furnish investment advisory services to the Funds. Under the terms of these agreements, the Adviser is compensated for managing the Focus Fund and the Growth Fund at the rate of 0.85% per year of average daily net assets up to $3 billion in each Fund, and 0.75% per year of average daily net assets exceeding $3 billion in each Fund; and at a rate of 0.85% of the average daily net assets of the 21st Century Fund, the International Opportunities Fund, the Flexible Capital Fund, and the Global Fund. The Adviser has voluntarily agreed to limit the total expenses of each Fund (excluding interest, taxes, acquired fund fees and expenses, litigation, brokerage and extraordinary expenses) to an annual rate of 1.60% of the average net assets of the Focus Fund, the International Opportunities Fund and the Global Fund, 1.50% of the average net assets of the Growth Fund and the 21st Century Fund,
NOTES TO FINANCIAL STATEMENTS
and 0.75% of the average net assets of the Flexible Capital Fund until December 31, 2009. This expense limitation and fee waiver agreement is voluntary and may be terminated at any time after December 31, 2009. Prior to January 1, 2009, the Adviser’s voluntary limitation agreement relating to the Global Fund limited total expenses of the Global Fund (excluding interest, taxes, acquired fund fees and expenses, litigation, brokerage and extraordinary expenses) to an annual rate of 0.75% of the Global Fund’s average net assets. Unrealized appreciation/depreciation of Fund shares held in the Deferred Fee Plan is subject to the Funds’ expense reimbursement agreement with the Adviser.
The Adviser is entitled to reimbursement from a Fund of any fees waived pursuant to this arrangement if such reimbursements do not cause a Fund to exceed existing expense limitations and the reimbursement is made within three years after the year in which the Adviser incurred the expense. As of March 31, 2009, reimbursements that may potentially be made by the Flexible Capital Fund and the Global Fund to the Adviser are $480,443 and $923,954, respectively, which expire between 2010 and 2012.
| 4. | Service and Distribution Plan |
The Funds have adopted a Service and Distribution Plan (the “Plan”) pursuant to Rule 12b-1 under the 1940 Act. The Plan authorizes payments by the Funds in connection with the distribution of their shares at an annual rate, as determined from time to time by the Board of Trustees, of up to 0.25% of a Fund’s average daily net assets.
| 5. | Investment Transactions |
The aggregate purchases and sales of securities, excluding short-term investments, for the Funds for the six-months ended March 31, 2009, were as follows:
| | | | | | | | | 21st | | | International | | | Flexible | | | | |
| | | Focus | | | Growth | | | Century | | | Opportunities | | | Capital | | | Global | |
| (Amounts in thousands) | | Fund | | | Fund | | | Fund | | | Fund | | | Fund | | | Fund | |
| Purchases | | $ | 1,186,795 | | | $ | 525,223 | | | $ | 846,129 | | | $ | 203,434 | | | $ | 20,839 | | | $ | 121,680 | |
| Sales | | $ | 1,396,817 | | | $ | 821,773 | | | $ | 904,160 | | | $ | 241,092 | | | $ | 20,760 | | | $ | 77,405 | |
There were no purchases or sales of U.S. government securities, excluding short-term investments.
| 6. | Federal Income Tax Information |
The Focus Fund, Growth Fund, 21st Century Fund and International Opportunities Fund adopted the provisions of Financial Accounting Standards Board Interpretation No. 48 (“FIN 48”), Accounting for Uncertainty in Income Taxes, on October 1, 2007. The Flexible Capital Fund and Global Fund adopted FIN 48 at their respective inception dates. FIN 48 requires an evaluation of tax positions taken (or expected to be taken) in the course of preparing a Fund’s tax returns to determine whether these positions meet a “more-likely-than-not” standard that, based on the technical merits, have a more than fifty percent likelihood of being sustained by a taxing authority upon examination. A tax position that meets the “more-likely-than-not” recognition threshold is measured to determine the amount of benefit to recognize in the financial statements. The Funds recognize interest and penalties, if any, related to unrecognized tax benefits as income tax expense in the Statements of Operations.
NOTES TO FINANCIAL STATEMENTS
NOTES TO FINANCIAL STATEMENTS March 31, 2009 (Unaudited) (continued)
FIN 48 requires management of the Funds to analyze all open tax years, fiscal years 2005-2007 as defined by IRS statute of limitations for all major jurisdictions, including federal tax authorities and certain state tax authorities. As of and during the year ended September 30, 2008, the Funds did not have a liability for any unrecognized tax benefits. As of and during the six-months ended March 31, 2009, the Funds did not have a liability for any unrecognized tax benefits. The Funds have no examination in progress and are not aware of any tax positions for which it is reasonably possible that the total amounts of unrecognized tax benefits will significantly change in the next twelve months.
At March 31, 2009 gross unrealized appreciation and depreciation of investments, based on cost for federal income tax purposes were as follows:
| | | | | | | | | 21st | | | International | | | Flexible | | | | |
| | | Focus | | | Growth | | | Century | | | Opportunities | | | Capital | | | Global | |
| (Amounts in thousands) | | Fund | | | Fund | | | Fund | | | Fund | | | Fund | | | Fund | |
| Cost of investments | | $ | 2,119,620 | | | $ | 1,139,735 | | | $ | 1,003,574 | | | $ | 448,571 | | | $ | 7,992 | | | $ | 89,981 | |
| | | | | | | | | | | | | | | | | | | | | | | | | |
| Gross Unrealized Appreciation | | $ | 111,485 | | | $ | 83,088 | | | $ | 44,771 | | | $ | 16,567 | | | $ | 483 | | | $ | 1,738 | |
| | | | | | | | | | | | | | | | | | | | | | | | | |
| Gross Unrealized Depreciation | | | (342,118 | ) | | | (161,577 | ) | | | (226,473 | ) | | | (138,798 | ) | | | (497 | ) | | | (12,446 | ) |
| | | | | | | | | | | | | | | | | | | | | | | | | |
Net Unrealized Appreciation (Depreciation) on investments | | $ | (230,633 | ) | | $ | (78,489 | ) | | $ | (181,702 | ) | | $ | (122,231 | ) | | $ | (14 | ) | | $ | (10,708 | ) |
The difference between cost amounts for financial statement and federal income tax purposes is due primarily to wash sale loss deferrals.
The Focus Fund, Growth Fund, 21st Century Fund, International Opportunities Fund, and Global Fund had realized currency losses (in thousands) from transactions between November 1, 2007 and September 30, 2008 of $686, $32, $337, $608, and $33, respectively. Post-October currency losses are treated as arising in the Fund’s next fiscal year.
The Focus Fund, Growth Fund, 21st Century Fund, International Opportunities Fund, Flexible Capital Fund, and Global Fund had realized capital losses (in thousands) from transactions between November 1, 2007 and September 30, 2008 of $43,626, $137,882, $205,993, $50,643, $2,269, and $13,809, respectively. Post-October capital losses are treated as arising in the Fund’s next fiscal year.
NOTES TO FINANCIAL STATEMENTS
As of September 30, 2008, the components of accumulated earnings (deficit) on a tax basis were as follows:
| | | | | | | | | 21st | | | International | | | Flexible | | | | |
| | | Focus | | | Growth | | | Century | | | Opportunities | | | Capital | | | Global | |
| (Amounts in thousands) | | Fund | | | Fund | | | Fund | | | Fund | | | Fund | | | Fund | |
| Undistributed ordinary income (deficit) | | $ | 18,542 | | | $ | 9,459 | | | $ | 903 | | | $ | 6,286 | | | $ | 88 | | | $ | 604 | |
| | | | | | | | | | | | | | | | | | | | | | | | | |
| Undistributed long-term capital gains | | | 364 | | | | — | | | | — | | | | — | | | | — | | | | — | |
| | | | | | | | | | | | | | | | | | | | | | | | | |
| Tax accumulated earnings | | | 18,906 | | | | 9,459 | | | | 903 | | | | 6,286 | | | | 88 | | | | 604 | |
| | | | | | | | | | | | | | | | | | | | | | | | | |
| Accumulated Capital and Other Losses | | | (44,312 | ) | | | (137,913 | ) | | | (207,490 | ) | | | (51,251 | ) | | | (2,269 | ) | | | (13,843 | ) |
| | | | | | | | | | | | | | | | | | | | | | | | | |
| Unrealized appreciation (depreciation) on investments | | | 337,732 | | | | 291,662 | | | | (105,918 | ) | | | (50,655 | ) | | | (359 | ) | | | (7,187 | ) |
| | | | | | | | | | | | | | | | | | | | | | | | | |
| Total accumulated earnings (deficit) | | $ | 312,326 | | | $ | 163,208 | | | $ | (312,505 | ) | | $ | (95,620 | ) | | $ | (2,540 | ) | | $ | (20,426 | ) |
Undistributed ordinary income (deficit) consists of net investment income, short-term capital gains and timing differences related to post-October currency losses and deferred Trustees’ compensation.
The Focus Fund, 21st Century Fund, International Opportunities Fund, Flexible Capital Fund, and Global Fund distributed to shareholders (in thousands) ordinary income of $43,537, $85,691, $42,800, $1,395, and $998, respectively, during the fiscal year ended September 30, 2008. The Focus Fund, Growth Fund, 21st Century Fund, International Opportunities Fund, Flexible Capital Fund, and Global Fund distributed to shareholders (in thousands) long term capital gains of $372,506, $97,785, $23,339, $53,336, $43, and $1, respectively, during the fiscal year ended September 30, 2008.
The Focus Fund, 21st Century Fund, and International Opportunities Fund distributed to shareholders (in thousands) ordinary income of $5,110, $10,724 and $9,321, respectively, during the fiscal year ended September 30, 2007. The Focus Fund and International Opportunities Fund distributed to shareholders (in thousands) long term capital gains of $118,229 and $16,411, respectively, during the fiscal year ended September 30, 2007.
The tax character of dividends paid may differ from that shown in the Statements of Changes in Net Assets due to short-term gains being treated as ordinary income for tax purposes.
| 7. | New Accounting Pronouncement |
In March 2008, the FASB issued Statement of Financial Accounting Standards No. 161, Disclosures about Derivative Instruments and Hedging Activities. The Statement is effective for fiscal years and interim periods beginning after November 15, 2008 and may require enhanced disclosures about the Funds’ derivative and hedging activities. Management is currently evaluating the impact the adoption of the Statement may have on the Funds’ financial statement disclosures.
EXPENSE EXAMPLE
EXPENSE EXAMPLE For the six-months ended March 31, 2009 (Unaudited)
As a shareholder of the Marsico Funds (the “Funds”), you incur two types of costs: (1) transaction costs, including redemption fees on certain redemptions; and (2) ongoing costs, including management fees, distribution (12b-1) fees, and other Fund expenses. This Example is intended to help you understand your ongoing costs (in dollars) of investing in the Funds and to compare these costs with the ongoing costs of investing in other mutual funds.
The Example is based on an investment of $1,000 invested at the beginning of the period and held for the entire period from October 1, 2008 to March 31, 2009 (the “period”).
Actual Expenses
The first line of the table below provides information about actual account values and actual expenses. You may use the information in this line, together with the amount you invested, to estimate the expenses you paid over the period. Simply divide your account value by $1,000 (for example, an $8,600 account value divided by $1,000 equals 8.6), then multiply the result by the number in the first line under the heading entitled “Expenses paid for the six-month period ended March 31, 2009” to estimate the expenses you paid on your account during the period.
Hypothetical Example for Comparison Purposes
The second line of the table below provides information about hypothetical account values and hypothetical expenses based on the Funds’ actual expense ratios and an assumed rate of return of 5% per year before expenses, which is not the actual return of any of the Funds. The hypothetical account values and expenses may not be used to estimate the actual ending account balance or expenses you paid for the period. You may use this information to compare the ongoing costs of investing in the Funds and other funds. To do so, compare this 5% hypothetical example with the 5% hypothetical examples that appear in the shareholder reports of other funds.
Please note that the expenses shown in the table are meant to highlight your ongoing costs only and do not reflect any transactional costs, such as redemption fees. Therefore, the second line of the table is useful in comparing the ongoing costs only, and will not help you determine the relative total costs of owning different funds. In addition, if these transactional costs were included, your costs could have been higher.
EXPENSE EXAMPLE
| Expenses Paid During the Period | | | |
| | FOCUS FUND |
| | Beginning | Ending | Expenses paid for the |
| | account value | account value | six-month period ended |
| | October 1, 2008 | March 31, 2009 | March 31, 2009(1) |
| Actual Example | $1,000.00 | $695.90 | $5.60 |
| | | | |
| Hypothetical Example, | | | |
| assuming a 5% return before expenses | $1,000.00 | $1,018.40 | $6.66 |
| | |
| | GROWTH FUND |
| | Beginning | Ending | Expenses paid for the |
| | account value | account value | six-month period ended |
| | October 1, 2008 | March 31, 2009 | March 31, 2009(1) |
| Actual Example | $1,000.00 | $686.00 | $5.60 |
| | | | |
| Hypothetical Example, | | | |
| assuming a 5% return before expenses | $1,000.00 | $1,018.36 | $6.70 |
| | | | |
| | 21st CENTURY FUND |
| | Beginning | Ending | Expenses paid for the |
| | account value | account value | six-month period ended |
| | October 1, 2008 | March 31, 2009 | March 31, 2009(1) |
| Actual Example | $1,000.00 | $620.70 | $5.51 |
| | | | |
| Hypothetical Example, | | | |
| assuming a 5% return before expenses | $1,000.00 | $1,018.20 | $6.86 |
| | |
| | INTERNATIONAL OPPORTUNITIES FUND |
| | Beginning | Ending | Expenses paid for the |
| | account value | account value | six-month period ended |
| | October 1, 2008 | March 31, 2009 | March 31, 2009(1) |
| Actual Example | $1,000.00 | $663.80 | $6.13 |
| | | | |
| Hypothetical Example, | | | |
| assuming a 5% return before expenses | $1,000.00 | $1,017.63 | $7.43 |
| (1) | Expenses are equal to the Funds’ annualized expense ratios (1.323% for the Focus Fund, 1.332% for the Growth Fund, 1.363% for the 21st Century Fund, 1.477% for the International Opportunities Fund, 0.750% for the Flexible Capital Fund, and 1.225% for the Global Fund), multiplied by the average account value over the period, multiplied by 182/365 (to reflect the six-month period). |
EXPENSE EXAMPLE
EXPENSE EXAMPLE For the six-months ended March 31, 2009 (Unaudited) (continued)
| | FLEXIBLE CAPITAL FUND |
| | Beginning | Ending | Expenses paid for the |
| | account value | account value | six-month period ended |
| | October 1, 2008 | March 31, 2009 | March 31, 2009(1) |
| Actual Example | $1,000.00 | $730.30 | $3.24 |
| | | | |
| Hypothetical Example, | | | |
| assuming a 5% return before expenses | $1,000.00 | $1,021.26 | $3.78 |
| | | | |
| | GLOBAL FUND |
| | Beginning | Ending | Expenses paid for the |
| | account value | account value | six-month period ended |
| | October 1, 2008 | March 31, 2009 | March 31, 2009(1) |
| Actual Example | $1,000.00 | $659.60 | $5.07 |
| | | | |
| Hypothetical Example, | | | |
| assuming a 5% return before expenses | $1,000.00 | $1,018.89 | $6.16 |
| (1) | Expenses are equal to the Funds’ annualized expense ratios (1.323% for the Focus Fund, 1.332% for the Growth Fund, 1.363% for the 21st Century Fund, 1.477% for the International Opportunities Fund, 0.750% for the Flexible Capital Fund, and 1.225% for the Global Fund), multiplied by the average account value over the period, multiplied by 182/365 (to reflect the six-month period). |
CONSIDERATION OF INVESTMENT ADVISORY AGREEMENTS
CONSIDERATION OF INVESTMENT ADVISORY AGREEMENTS (Unaudited)
At a meeting of the Board of Trustees of the Trust that commenced on November 12, 2008 and concluded on November 13, 2008, the Trustees, by a unanimous vote (including a separate vote of those Trustees who are not “interested persons” (as the term is defined in the 1940 Act) (the “Independent Trustees”), approved the renewal of the Investment Advisory and Management Agreements (the “Agreements”) for the Focus Fund, Growth Fund, 21st Century Fund, International Opportunities Fund, Flexible Capital Fund, and Global Fund. In advance of the meeting, the Independent Trustees requested and received extensive materials from the Adviser to assist them in considering the renewal of the agreements for the Focus Fund, Growth Fund, 21st Century Fund, International Opportunities Fund, Flexible Capital Fund, and Global Fund. The materials provided by the Adviser contained information with respect to the factors noted below, including detailed comparative information relating to the performance, advisory fees and other expenses of the Funds, other funds sub-advised by the Adviser and non-fund advisory accounts of the Adviser. The materials also included comparisons of the Funds with other funds and non-fund accounts of similar size and investment objectives in terms of performance, fees and other expenses, as well as the performance of each Fund versus its benchmark. In addition, the Adviser provided information regarding its overall expenses and profitability, as well as estimates of its costs and profitability relating to managing the Funds.
In addition to the materials prepared specifically for contract review analysis, on an ongoing basis the Trustees receive information and reports from the Adviser and other service providers to the Funds on investment performance as well as operational, compliance and other matters.
The Trustees engaged in a detailed discussion of the materials with management of the Adviser. The Independent Trustees then met separately with independent counsel to the Independent Trustees for a full review of the materials. Following this session, the full Board reconvened and approved the continuation of the Investment Advisory Agreements for the Focus Fund, Growth Fund, 21st Century Fund, International Opportunities Fund, Flexible Capital Fund, and Global Fund.
Discussion of Factors Considered
In connection with the consideration of these agreements, the Trustees, including the Independent Trustees, requested and received from the Adviser, and reviewed, a wide variety of information, including information about (1) the nature, extent, and quality of the services provided by the Adviser; (2) the investment performance of the Funds and the Adviser; (3) the costs of the services to be provided and profits realized by the Adviser and its affiliates from the relationship with the Funds; (4) the extent to which economies of scale may be realized as the Funds grow; and (5) whether fee levels reflect these economies of scale for the benefit of Fund investors; as well as other relevant considerations such as the management fees and expense ratios of each Fund; potential fall-out benefits to the Adviser from its relationship to each Fund; and other general information about the Adviser. The following is a summary of the Board’s discussion and views regarding these factors.
1. Nature, Extent, and Quality of Services. The Independent Trustees considered the nature, quality and extent of administrative and shareholder services performed by the Adviser, including portfolio management, supervision of Fund operations and compliance and regulatory filings and disclosures to shareholders, general oversight of other service providers, coordination of Fund marketing initiatives, review of Fund legal issues, assisting the Trustees in that capacity and other services. The Independent Trustees concluded that the services are extensive in nature, that the Adviser effectively manages the outsourcing by the Funds to other service providers and that the Adviser consistently delivered a high level of service.
CONSIDERATION OF INVESTMENT ADVISORY AGREEMENTS
CONSIDERATION OF INVESTMENT ADVISORY AGREEMENTS (Unaudited) (continued)
2. Investment Performance of the Funds and Adviser. The Independent Trustees considered short-term and long-term investment performance for each Fund over various periods of time as compared to both relevant equity indices and the performance of such Fund’s Lipper, Inc. peer group universe, and concluded that the Adviser was delivering satisfactory performance results consistent with the long-term investment strategies being pursued by the Funds. The Independent Trustees also noted that the satisfactory investment performance delivered by the Adviser to the Funds appeared to be consistent with the performance delivered for other clients of the Adviser.
3. Costs of Services and Profits Realized by the Adviser.
(a) Costs of Services to Funds: Fees and Expenses. The Independent Trustees considered each Fund’s management fee rates and expense ratios relative to industry averages for such Fund’s benchmark category and the advisory fees charged by the Adviser to other sub-advised funds and non-fund clients, including information regarding expense limitation commitments from the Adviser, and the breakpoints for the Fund’s advisory services. The Independent Trustees noted that the mix of services under the Agreements are much more extensive than those under the Adviser’s advisory agreements for sub-advised funds as well as non-fund clients. While the Independent Trustees noted that the investment advisory fees paid by the Funds are generally in the upper quartile of their peer groups, they concluded that those fees are acceptable based upon the qualifications, experience, reputation, and performance of the Adviser and the low-to-moderate overall expense ratios of the Funds.
(b) Profitability and Costs of Services to Adviser. The Independent Trustees considered the Adviser’s overall profitability and costs and a pro forma estimate of the Adviser’s profitability and costs if the Funds constituted the Adviser’s only assets under management. The Independent Trustees also considered whether the amount of profit is a fair entrepreneurial profit for the management of each Fund, and noted that the Adviser has substantially increased its resources devoted to Fund matters in response to regulatory requirements enacted during the last few years and Fund policies and procedures that were adopted or enhanced in late 2004 and thereafter. The Independent Trustees concluded that the Adviser’s profitability was at an acceptable level, particularly in light of the high quality of the services being provided to the Funds.
4. Extent of Economies of Scale as Funds Grow. The Independent Trustees considered whether there have been economies of scale with respect to the management of each Fund and whether such Fund has appropriately benefited from any economies of scale. The Independent Trustees noted that economies of scale may develop for certain Funds as their assets increase and their Fund-level expenses decline as a percentage of assets, but that Fund-level economies of scale may not necessarily result in Adviser-level economies of scale. The written materials presented to the Independent Trustees indicate that the expenses incurred by the Adviser relating to management of the Funds have increased substantially in recent years as a percentage of management fees, rather than declining as might be anticipated as the assets of certain Funds increase. The Independent Trustees agreed that it was possible that Adviser-level expenses incurred in managing the Funds eventually may level off or decline as a percentage of management fees, especially if the assets of certain Funds continue to grow beyond certain thresholds.
5. Whether Fee Levels Reflect Economies of Scale. The Independent Trustees also considered whether the management fee rate is reasonable in relation to the asset size of each Fund and any economies of scale that may exist. The Independent Trustees noted that, effective November 11, 2004, at the behest of the Independent Trustees, breakpoints had been introduced for the two larger Funds, the Focus Fund and the Growth Fund, for assets in excess of $3 billion in each Fund. Under the breakpoints, investment management fees are 0.85% per year of average daily net assets up to $3 billion in each of those two Funds, and 0.75% per year of average daily net assets exceeding $3 billion in each Fund. In performing their analysis, the Independent Trustees also took note of the small level of assets in the two most recently introduced Funds (the
CONSIDERATION OF INVESTMENT ADVISORY AGREEMENTS
Flexible Capital Fund and Global Fund), as well as the fee waivers adopted under which the Adviser voluntarily agreed to temporarily limit fund expenses including advisory fees for the Flexible Capital Fund to 0.75% on an annual basis until at least December 31, 2009, subject to possible future recoupment of previously waived fees or other expenses under certain conditions. The Independent Trustees agreed to continue to monitor whether any additional breakpoints for any of the Funds may be appropriate in the future.
6. Other Relevant Considerations.
(a) Adviser Personnel and Methods. The Independent Trustees considered information about the financial condition of the Adviser provided and the Adviser’s stated commitment to maintaining a high quality investment management operation, including in the areas of investment analysis, compliance, and operations. They also considered the size, education and experience of the Adviser’s staff. There was also a review of the Adviser’s “top down” economic analysis with “bottom up” stock selection. This two-pronged approach, considering both macro-economic factors, such as interest rates, inflation and the global competitive landscape, and seeking to identify individual companies with unique market presence and potential earnings growth that may not be recognized by the market at-large, was regarded by the Trustees as providing an overall risk-managed approach to effective stock selection. This overall strategy and corporate culture was further viewed as facilitating the recruitment, training and retention of portfolio managers and other research and management personnel, and the Trustees concluded that in each of these areas the Adviser was structured in such a way to support the high level of services being provided to the Funds.
(b) Other Benefits to the Adviser. The Independent Trustees also considered the character and amount of other incidental benefits received by the Adviser and its affiliates from its association with the Funds. The Independent Trustees concluded that potential “fall-out” benefits that the Adviser may receive, such as greater name recognition or increased ability to obtain research or brokerage services, appear to be reasonable, and may in some cases benefit the Funds.
Conclusions
In considering the Agreements, the Independent Trustees did not identify any factor as all-important or all-controlling and instead considered these factors collectively in light of each Fund’s surrounding circumstances. Based on this review, it was the judgment of the Independent Trustees that shareholders had received satisfactory absolute and relative performance at reasonable fees and, therefore, re-approval of the Agreements was in the best interests of each Fund and its shareholders. As a part of their decision-making process, the Independent Trustees noted that the Adviser has managed the Funds since their inception, and the Independent Trustees believe that a long-term relationship with a capable, conscientious adviser is in the best interests of the Funds and their shareholders. The Independent Trustees considered, generally, that shareholders invested in a Fund knowing that the Adviser managed that Fund and knowing its investment management fee schedule. As such, the Independent Trustees considered, in particular, whether the Adviser managed each Fund in accordance with its investment objectives and policies as disclosed to shareholders. The Independent Trustees concluded that each Fund was managed by the Adviser consistent with its investment objectives and policies. Additionally, as part of its deliberations, the Board also considered and relied upon the information about the Funds and the Adviser that had been provided to them throughout the year in connection with their regular Board meetings at which they engage in the ongoing oversight of the Funds and their operations.
Upon conclusion of their review and discussion, the Independent Trustees unanimously agreed the Investment Advisory and Management Agreements for each of the Funds were appropriate.
OTHER INFORMATION
OTHER INFORMATION (Unaudited)
Proxy Voting Guidelines
The Funds exercise the voting rights associated with the securities held by the Funds under the proxy voting policy of the Funds. A description of those policies and procedures of the Funds and a record of the Funds’ proxy votes for the one-year period ended June 30, 2008 are available without charge, upon request, by calling 888-860-8686. It is also available on the Securities and Exchange Commission’s website at www.sec.gov.
Quarterly Filing of Portfolio Holdings
The Funds file their complete schedule of investments with the SEC for the first and third quarters of each fiscal year on Form N-Q. The Funds’ Form N-Q is available (i) on the SEC’s Website at www.sec.gov; (ii) at the SEC’s Public Reference Room; and (iii) by calling 800-SEC-0330.
The Marsico Investment Fund
UMB Distribution Services, LLC, Distributor
P.O. Box 3210, Milwaukee, WI 53201-3210
www.marsicofunds.com • 888.860.8686
©2009 MARSICO CAPITAL MANAGEMENT, LLC
Not authorized for distribution unless preceded or accompanied by an effective Marsico Funds prospectus.
The ticker symbols on page one are fictitious and do not refer to existing securities.