Similarly, all industry groups had positive performance, though the results were wide-ranging. Technology Hardware & Equipment (+43%), Diversified Financials (+42%), and Banks (+41%) were the strongest-performing industry groups. Meanwhile, Household & Personal Products (+9%), and Commercial & Professional Services (+14%) were among the weakest-performing industry groups.
US ALL-CAPITALIZATION EQUITIES
For the six-month period ended March 31, 2012, performance of the broad US equity market, as measured by the Russell 3000 Index which encompasses publicly-traded companies of all sizes, was very strong. Sector- and industry-level performance was positive across the board within the Russell 3000 Index. Financials (+33%), Information Technology (+32%), Consumer Discretionary (+31%), Industrials (+31%), and Materials (+31%) were the best-performing sectors of the Russell 3000 Index. Utilities and Telecommunication Services sectors, often considered to be defensive sectors of the equity market, posted gains of just +7% and +11%, respectively.
Industry group-level performance painted a similar picture. Technology Hardware & Equipment (+42%), Diversified Financials (+41%), and Banks (+40%) were leading industry groups. Meanwhile, defensive industry groups such as Household & Personal Products (+11%), Food Beverage & Tobacco (+18%), and Food & Staples Retailing (+19%) posted more modest gains.
Small-capitalization US equities were comparatively stronger than large-capitalization equities. Smaller-capitalization equities sometimes outperform large-capitalization equities as investors’ risk appetite increases.
INTERNATIONAL EQUITIES
Developed market international equities posted solid returns for the six-month period ended March 31, 2012.
The MSCI EAFE Index’s ten GICS sectors each registered gains. Consumer Discretionary (+21%) and Energy (+20%) were the strongest-performing sectors of the Index. Industrials (+18%), Materials (+17%), Financials (+17%), Consumer Staples (+14%), Information Technology (+13%), and Health Care (+11%) also experienced double-digit gains. Utilities (+0.4%) and Telecommunication Services (+1%) were the weakest-performing sectors and just managed to eke out positive returns.
From a GICS industry group perspective, it was a similar story line. The MSCI EAFE Index industry groups with the most significant gains included: Consumer Services (+25%), Automobiles & Components (+24%), Semiconductors & Semiconductor Equipment (+23%), Commercial & Professional Services (+22%), and Insurance (+21%). A few industries posted muted gains, including Food & Staples Retailing (+4%), Technology Hardware & Equipment (+8%), and Health Care Equipment & Services (+10%).
Many of the MSCI EAFE Index’s country-level constituents posted positive returns for the period. Ireland (+34%), Denmark (+28%), Norway (+26%), Germany (+26%), and Sweden (+25%) were the strongest country-level performers. Greece (-18%), Portugal (-8%), and Spain (-4%), however, posted negative returns. All three of the latter countries were beleaguered by concerns regarding their respective sovereign debt levels. The United Kingdom and Japan, which together comprised approximately 44% of the MSCI EAFE Index, posted returns of +17% and +7%, respectively.
From a currency perspective, the US dollar and a number of foreign currencies experienced sizeable intra-period moves. For the full six-month period, however, US-based investors in developed market international equities experienced only a very small currency lift. The US dollar weakened as compared to certain major foreign currencies including the Australian dollar and British pound, thereby effectively increasing returns from certain foreign securities as expressed in US dollars. Almost all of this positive currency effect, however, was offset by the US dollar strength versus currencies such as the Japanese yen and, to a lesser extent, the euro.
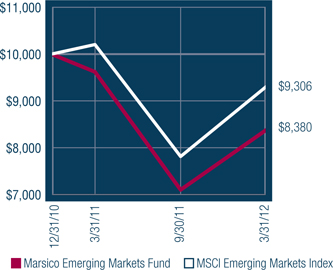
Emerging market equities posted sizeable gains and exceeded the return of developed-market equities. The MSCI Emerging Markets Index posted a six-month return of +19.13%, while developed international markets, as measured by the MSCI EAFE Index, gained +14.56%.
THE MARSICO INVESTMENT TEAM
| (1) | All indices are unmanaged, and investors cannot invest directly in an index. |
| (2) | The Global Industry Classification Standard (“GICS”) was developed by and is the exclusive property and service mark of MSCI Inc. (“MSCI”) and Standard & Poor’s (“S&P”) and is licensed for use by Marsico Capital Management, LLC (“MCM”). Neither MSCI, S&P, nor MCM or any third party involved in compiling GICS makes any express or implied warranties or representations with respect to such standard or classification (or the results from use thereof), and all such parties hereby expressly disclaim all warranties of originality, accuracy, completeness, merchantability and fitness for a particular purpose with respect to any such standard or classification. MSCI, S&P, MCM, and any of their affiliates or third parties involved in compiling GICS shall not have any liability for any direct, indirect, special, punitive, consequential or any other damages (including lost profits) even if notified of the possibility of such damages. |
INVESTMENT REVIEW BY TOM MARSICO, DOUG RAO AND CORALIE WITTER (UNAUDITED)
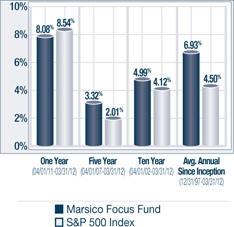
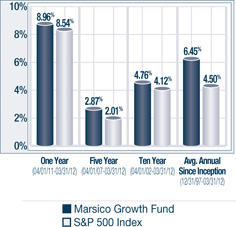
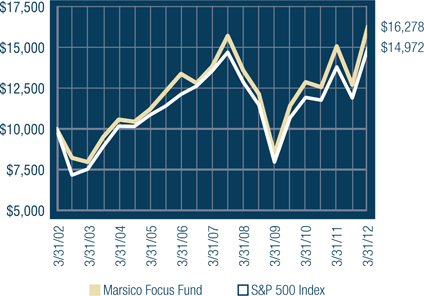
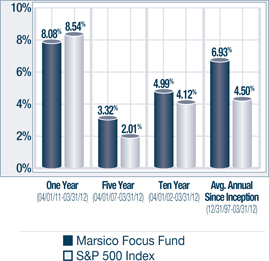
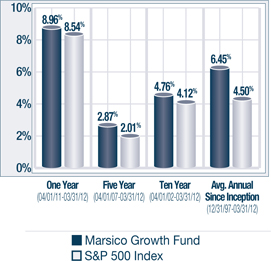
The Marsico Focus Fund and the Marsico Growth Fund outperformed their benchmark index for the six-month fiscal period ended March 31, 2012. The Marsico Focus Fund generated a total return of +28.18% and the Marsico Growth Fund posted a return of +27.59%. For comparative purposes, the S&P 500 Index – which we consider to be the Funds’ benchmark index – had a total return of +25.89% for the six-month period ended March 31, 2012. Please see the Funds’ Overviews for more detailed information about each Fund’s longer-term performance for various periods ended March 31, 2012.
The performance data for the Funds quoted here represent past performance, and past performance is not a guarantee of future results. Investment return and principal value of an investment will fluctuate so that an investor’s shares, when redeemed, may be worth more or less than their original cost. Current performance may be lower or higher than the performance information quoted. To obtain performance information current to the most recent month-end, please call 888-860-8686 or visit www.marsicofunds.com.(1)
This review highlights Fund performance over a six-month fiscal period. Shareholders should keep in mind that the Funds are intended for long-term investors who hold their shares for substantially longer periods of time. You should also keep in mind that our views on all investments discussed in this report are subject to change at any time. References to specific securities, industries, and sectors discussed in this report are not recommendations to buy or sell such securities or related investments, and the Funds may not necessarily hold these securities or investments today. Please see the accompanying Schedules of Investments for the percentage of each Fund’s portfolio represented by the securities mentioned in this report as of the end of the reporting period.
The Focus Fund is non-diversified and may hold fewer securities than a diversified fund. Holding fewer securities increases the risk that the value of the Fund could go down because of the poor performance of a single investment. Stocks and markets in which the Focus Fund and the Growth Fund invest may experience periods of turbulence and instability, and the general risk that domestic and global economies and stock markets may go through periods of decline and cyclical change.
The Focus Fund and the Growth Fund often invest in similar growth companies. Their performance may differ at times, however, because of a variety of factors. Among other factors, the Focus Fund is a non-diversified mutual fund that may invest in a more concentrated portfolio and may hold the securities of fewer issuers than the Growth Fund. As a result, the Focus Fund may hold some securities that are different from those held by the Growth Fund, and may be more exposed to individual stock volatility than the Growth Fund or other mutual funds that invest in a larger number of securities.
FOCUS FUND
The Marsico Focus Fund outperformed the S&P 500 Index for the six-month fiscal period ended March 31, 2012 as described above. The Fund’s performance benefitted from its holdings in economically-sensitive sectors of the global economy such as Materials, Industrials, and Energy. As sentiment brightened for the euro zone and global economic growth, many of the Fund’s holdings within these sectors propelled it higher. Materials and Industrials were strong-performing sectors of the S&P 500 Index and the Fund’s performance benefitted from having an overweight allocation, on average, to both sectors as compared to its benchmark index. Materials holdings were led by The Dow Chemical Company, a leading manufacturer of chemicals, polymers, and agricultural products, which soared +57%. Agricultural material company Monsanto Company gained +34%. Leading Industrials positions included engine manufacturer Cummins, Inc. (+48%) and railroad operator Union Pacific Corporation (+33%). Energy storage and pipeline company Kinder Morgan, Inc. rose +52% and had a material, positive effect on performance results.
A number of the Fund’s Information Technology holdings performed well. Leading holdings within the sector included Apple, Inc. (+57%), Baidu, Inc. Spon. ADR (+36%), a China-based website search engine, and financial transaction processor Visa, Inc. – Cl. A (+38%).
Consumer Discretionary was a strong-performing sector of the benchmark index and the Fund benefitted from having a significant portion of its net assets invested in the sector. In addition, certain of the Fund’s Consumer Discretionary holdings posted strong returns, including Starbucks Corporation (+51%) and online travel reservations retailer priceline.com, Inc. (+60%).
Finally, the Fund benefitted from having no or few investments in the Utilities, Telecommunication Services, and Consumer Staples sectors, which were the weakest-performing sectors of the S&P 500 Index.
There were several areas of weakness for the Focus Fund during the semi-annual period. The Fund had few investments in the Financials sector. This positioning hurt the Fund, as Financials was the strongest-performing sector of the benchmark index. Cash levels were slightly elevated at the start of the reporting period following the equity market downturn of third calendar quarter 2011. Fund repositioning also contributed to modestly higher cash levels at times throughout the period. This uninvested cash weighed on performance as the equity market rose sharply.
Several of the Fund’s Consumer Discretionary positions posted disappointing returns. Online retailer Amazon.com, Inc. slid -18% and was sold from the Fund. Media company British Sky Broadcasting Group PLC (+8% prior to being sold) and casino operator Wynn Resorts Ltd. (+14%) also posted returns that, while strong in absolute terms, lagged the overall return of the pertinent benchmark index sector.
During the period, the Fund reduced its exposure to the Industrials and Materials sectors while increasing its allocations to the Information Technology and Financials sectors.
GROWTH FUND
The Marsico Growth Fund also outperformed the S&P 500 Index as described above, and shared several of the Focus Fund’s performance attributes for the six-month fiscal period ended March 31, 2012. Like the Focus Fund, the Growth Fund’s sector allocations aided performance. More specifically, the Fund benefitted from having overweight allocations to the strong-performing Consumer Discretionary and Materials sectors, while having underweight allocations to the weak-performing Utilities, Telecommunication Services, Health Care, and Consumer Staples sectors.
Stock selection in the Energy sector was strong, led by a position in National Oilwell Varco, Inc. (+56%), a leading supplier of equipment to the oil and gas industry.
Similar to the Focus Fund, the Growth Fund benefitted from stock selection in the Materials sector. The Dow Chemical Company (+57%) and Monsanto Company (+34%) each registered strong stock price gains.
Certain of the Fund’s retailing positions fared well, including online travel reservations retailer priceline.com, Inc. (+60%) and discount retailer The TJX Companies, Inc. (+44%). Other leading individual holdings included Apple, Inc. (+57%) and Starbucks Corporation (+51%).
There were several offsets to the Fund’s positive performance contributors. The Fund’s performance was hampered by having few investments in the Financials sector, the strongest-performing sector of the benchmark index. Moreover, while the Fund’s financials-related investments posted positive returns, the collective return of the Fund’s holdings (+30%) trailed the benchmark index Financials sector return (+35%).
Similar to the Focus Fund, the Growth Fund held a slightly elevated level of cash, particularly at the start of the reporting period. The uninvested cash weighed on performance as the equity market posted gains.
Certain individual holdings adversely impacted results, including Amazon.com, Inc., Oracle Corporation, and Green Mountain Coffee Roasters, Inc. Oracle and Green Mountain Coffee Roasters were sold from the Fund in favor of investments we believe offer better earnings visibility.
The Fund increased its exposure to the Financials, Energy, and Information Technology sectors while paring its exposure to the Materials and Consumer Staples sectors.
Fiscal Period-End Investment Posture
At the end of the period, the Funds were positioned to balance the uncertainty in Europe against a more constructive scenario in which the euro zone stabilizes and global growth accelerates. Hence, a number of the Funds’ holdings are more defensive in nature, with business models that we believe are less susceptible to adverse macroeconomic conditions, and have the potential to generate solid top-line growth and dependable revenues. Another segment of the Funds is represented by companies geared more closely to economic activity levels, which should benefit as global growth pushes higher. As is typically the case, there also are a number of stocks held in the Funds based on a purely “bottom-up” or stock-specific perspective under which we view those stocks as unique stories and compelling investments.
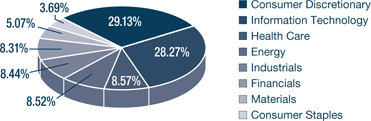
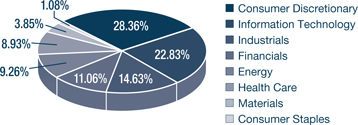
As of March 31, 2012, the Focus Fund’s and the Growth Fund’s largest sector allocations included Consumer Discretionary and Information Technology. The Funds had no exposure during the period to the Utilities and Telecommunication Services sectors, and had few investments in the Consumer Staples sector.
Sincerely,
THOMAS F. MARSICO
A. DOUGLAS RAO
CORALIE T. WITTER, CFA
PORTFOLIO MANAGERS
FOCUS FUND & GROWTH FUND
| (1) | Total returns are based on net change in net asset value assuming reinvestment of distributions. A redemption fee of 2% may be imposed on redemptions or exchanges of Fund shares owned for 30 days or less. Please see the Prospectus for more information. |
March 31, 2012 (Unaudited)
The Focus Fund invests primarily in the common stocks of large companies, normally a core position of 20–30 common stocks that are selected for their long-term growth potential.
| TOTAL ANNUAL OPERATING EXPENSES* 1.33% | NET ASSETS $1,116,932,243 | NET ASSET VALUE PER SHARE $20.47 |
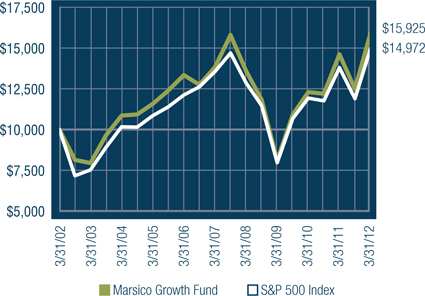
GROWTH OF $10,000(1) | PERFORMANCE COMPARISON |
| |
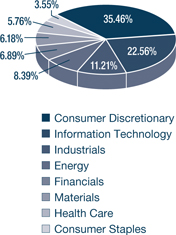
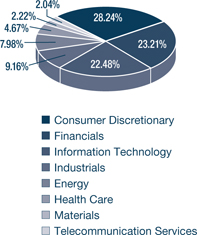
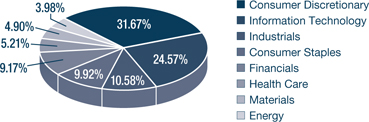
SECTOR ALLOCATION(2) | TOP FIVE HOLDINGS |
| | |
| APPLE, INC. | 9.84% |
| STARBUCKS CORPORATION | 4.15% |
| QUALCOMM, INC. | 4.09% |
| WELLS FARGO & COMPANY | 4.04% |
| PRICELINE.COM, INC. | 4.02% |
| | |
| * | The Total Annual Operating Expenses are reflective of the information disclosed in the Funds’ Prospectus dated February 1, 2012 and may differ from the expense ratio disclosed in this report. |
| | The performance data quoted here represent past performance, and past performance is not a guarantee of future results. Investment return and principal value of an investment will fluctuate so that an investor’s shares, when redeemed, may be worth more or less than their original cost. Current performance may be lower or higher than the performance information quoted. To obtain performance information current to the most recent month-end, please call 888-860-8686 or visit www.marsicofunds.com. A redemption fee may be imposed on redemptions or exchanges of Fund shares held for 30 days or less. |
| | The performance included in the chart and graph does not reflect the deduction of taxes on Fund distributions or the redemption of Fund shares. |
| | All indices are unmanaged and investors cannot invest directly in an index. |
| (1) | This chart assumes an initial investment of $10,000 made on March 31, 2002. Total returns are based on net change in NAV, assuming reinvestment of distributions. |
| (2) | Sector weightings represent the percentage of the Fund’s investments (excluding cash equivalents) in certain general sectors. These sectors may include more than one industry. The Fund’s portfolio composition is subject to change at any time. |
MARSICO FOCUS FUND
SCHEDULE OF INVESTMENTS
March 31, 2012 (Unaudited)
| | | Number of Shares | | | Value | | | Percent of Net Assets | |
| COMMON STOCKS | | | | | | | | | |
| Aerospace & Defense | | | | | | | | | |
| Precision Castparts Corp. | | | 153,387 | | | $ | 26,520,612 | | | | 2.37 | % |
| | | | | | | | | | | | | |
| Apparel Retail | | | | | | | | | | | | |
| The TJX Companies, Inc. | | | 365,589 | | | | 14,517,539 | | | | 1.30 | |
| | | | | | | | | | | | | |
| Automobile Manufacturers | | | | | | | | | |
| Tesla Motors, Inc.* | | | 466,316 | | | | 17,365,608 | | | | 1.55 | |
| | | | | | | | | | | | | |
| Biotechnology | | | | | | | | | | | | |
| Biogen Idec Inc.* | | | 277,588 | | | | 34,967,760 | | | | 3.13 | |
| | | | | | | | | | | | | |
| Casinos & Gaming | | | | | | | | | | | | |
| Wynn Resorts Ltd. | | | 327,315 | | | | 40,875,097 | | | | 3.66 | |
| | | | | | | | | | | | | |
| Communications Equipment | | | | | | | | | |
| QUALCOMM, Inc. | | | 671,647 | | | | 45,685,429 | | | | 4.09 | |
| | | | | | | | | | | | | |
| Computer Hardware | | | | | | | | | | | | |
| Apple, Inc.* | | | 183,399 | | | | 109,942,199 | | | | 9.84 | |
| | | | | | | | | | | | | |
| Construction & Farm Machinery & Heavy Trucks | | | | | |
| Cummins, Inc. | | | 287,857 | | | | 34,554,354 | | | | 3.09 | |
| | | | | | | | | | | | | |
| Consumer Finance | | | | | | | | | | | | |
| American Express Company | | | 295,816 | | | | 17,115,914 | | | | 1.53 | |
| | | | | | | | | | | | | |
| Data Processing & Outsourced Services | | | | | |
| Visa, Inc. - Cl. A | | | 364,046 | | | | 42,957,428 | | | | 3.85 | |
| | | | | | | | | | | | | |
| Diversified Banks | | | | | | | | | | | | |
| U.S. Bancorp | | | 887,477 | | | | 28,115,272 | | | | 2.52 | |
| Wells Fargo & Company | | | 1,323,094 | | | | 45,170,429 | | | | 4.04 | |
| | | | | | | | 73,285,701 | | | | 6.56 | |
| Diversified Chemicals | | | | | | | | | | | | |
| The Dow Chemical Company | | | 757,217 | | | | 26,229,997 | | | | 2.35 | |
| | | | | | | | | | | | | |
| Fertilizers & Agricultural Chemicals | | | | | | | | | |
| Monsanto Company | | | 362,455 | | | | 28,909,411 | | | | 2.59 | |
| | | | | | | | | | | | | |
| Footwear | | | | | | | | | | | | |
| NIKE, Inc. - Cl. B | | | 380,861 | | | | 41,300,567 | | | | 3.70 | |
| | | | | | | | | | | | | |
| General Merchandise Stores | | | | | | | | | |
| Dollar General Corporation* | | | 750,864 | | | | 34,689,917 | | | | 3.11 | |
| | | | | | | | | | | | | |
| Home Improvement Retail | | | | | | | | | | | | |
| The Home Depot, Inc. | | | 558,926 | | | | 28,119,567 | | | | 2.52 | |
| | | | | | | | | | | | | |
| Integrated Oil & Gas | | | | | | | | | | | | |
| Occidental Petroleum Corporation | | | 323,508 | | | | 30,807,667 | | | | 2.76 | |
| | | | | | | | | | | | | |
| Internet Retail | | | | | | | | | | | | |
| priceline.com, Inc.* | | | 62,667 | | | | 44,963,572 | | | | 4.02 | |
| | | | | | | | | | | | | |
COMMON STOCKS (continued) | | | | | | | | | |
| Internet Software & Services | | | | | | | | | |
| Baidu, Inc. Spon. ADR* | | | 280,625 | | | $ | 40,906,706 | | | | 3.66 | % |
| Google, Inc. - Cl. A* | | | 44,478 | | | | 28,521,073 | | | | 2.56 | |
| | | | | | | | 69,427,779 | | | | 6.22 | |
| IT Consulting & Other Services | | | | | | | | | |
| Accenture plc - Cl. A | | | 434,726 | | | | 28,039,827 | | | | 2.51 | |
| | | | | | | | | | | | | |
| Oil & Gas Equipment & Services | | | | | | | | | |
| Halliburton Company | | | 790,089 | | | | 26,223,054 | | | | 2.35 | |
| | | | | | | | | | | | | |
| Oil & Gas Exploration & Production | | | | | | | | | |
| Anadarko Petroleum Corporation | | | 144,113 | | | | 11,289,812 | | | | 1.01 | |
| | | | | | | | | | | | | |
| Oil & Gas Storage & Transportation | | | | | | | | | |
| Kinder Morgan, Inc. | | | 629,103 | | | | 24,314,831 | | | | 2.18 | |
| | | | | | | | | | | | | |
| Packaged Foods & Meats | | | | | | | | | | | | |
| Mead Johnson Nutrition Company | | | 487,140 | | | | 40,179,307 | | | | 3.60 | |
| | | | | | | | | | | | | |
| Pharmaceuticals | | | | | | | | | | | | |
| Allergan, Inc. | | | 392,983 | | | | 37,502,367 | | | | 3.36 | |
| Bristol-Myers Squibb Company | | | 613,801 | | | | 20,715,784 | | | | 1.85 | |
| | | | | | | | 58,218,151 | | | | 5.21 | |
| Railroads | | | | | | | | | | | | |
| Union Pacific Corporation | | | 286,365 | | | | 30,778,510 | | | | 2.75 | |
| | | | | | | | | | | | | |
| Restaurants | | | | | | | | | | | | |
| Chipotle Mexican Grill, Inc.* | | | 55,490 | | | | 23,194,820 | | | | 2.08 | |
| McDonald's Corporation | | | 259,709 | | | | 25,477,453 | | | | 2.28 | |
| Starbucks Corporation | | | 829,346 | | | | 46,352,148 | | | | 4.15 | |
| | | | | | | | 95,024,421 | | | | 8.51 | |
| Systems Software | | | | | | | | | | | | |
| VMware, Inc. - Cl. A* | | | 101,926 | | | | 11,453,425 | | | | 1.02 | |
| | | | | | | | | | | | | |
| TOTAL COMMON STOCKS | | | | | | | | | | | | |
| (Cost $768,977,757) | | | | | | | 1,087,757,456 | | | | 97.38 | |
| | | | | | | | | | | | | |
| SHORT-TERM INVESTMENTS | | | | | | | | | |
| State Street Institutional U.S. Government Money Market Fund, 0.002% | | | 4,190,130 | | | | 4,190,130 | | | | 0.38 | |
| | | | | | | | | | | | | |
| TOTAL SHORT-TERM INVESTMENTS | | | | | | | | | |
| (Cost $4,190,130) | | | | | | | 4,190,130 | | | | 0.38 | |
| | | | | | | | | | | | | |
| TOTAL INVESTMENTS | | | | | | | | | | | | |
| (Cost $773,167,887) | | | | | | | 1,091,947,586 | | | | 97.76 | |
| | | | | | | | | | | | | |
| Cash and Other Assets, Less Liabilities | | | | | | | 24,984,657 | | | | 2.24 | |
| | | | | | | | | | | | | |
| NET ASSETS | | | | | | $ | 1,116,932,243 | | | | 100.00 | % |
| | See notes to financial statements. |
March 31, 2012 (Unaudited)
The Growth Fund invests primarily in the common stocks of large companies that are selected for their long-term growth potential. The Growth Fund will normally hold a core position of between 35 and 50 common stocks.
| TOTAL ANNUAL OPERATING EXPENSES* 1.33% | NET ASSETS $766,262,843 | NET ASSET VALUE PER SHARE $22.23 |
GROWTH OF $10,000(1) | PERFORMANCE COMPARISON |
| |
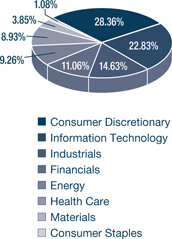
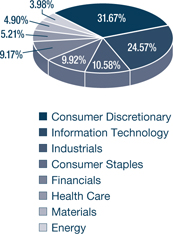
SECTOR ALLOCATION(2) | TOP FIVE HOLDINGS |
| | |
| APPLE, INC. | 6.37% |
| THE TJX COMPANIES, INC. | 4.66% |
| PRICELINE.COM, INC. | 3.46% |
| NIKE, INC. - CL. B | 3.27% |
| STARBUCKS CORPORATION | 3.09% |
| | |
| * | The Total Annual Operating Expenses are reflective of the information disclosed in the Funds’ Prospectus dated February 1, 2012 and may differ from the expense ratio disclosed in this report. |
| | The performance data quoted here represent past performance, and past performance is not a guarantee of future results. Investment return and principal value of an investment will fluctuate so that an investor’s shares, when redeemed, may be worth more or less than their original cost. Current performance may be lower or higher than the performance information quoted. To obtain performance information current to the most recent month-end, please call 888-860-8686 or visit www.marsicofunds.com. A redemption fee may be imposed on redemptions or exchanges of Fund shares held for 30 days or less. |
| | The performance included in the chart and graph does not reflect the deduction of taxes on Fund distributions or the redemption of Fund shares. |
| | All indices are unmanaged and investors cannot invest directly in an index. |
| (1) | This chart assumes an initial investment of $10,000 made on March 31, 2002. Total returns are based on net change in NAV, assuming reinvestment of distributions. |
| (2) | Sector weightings represent the percentage of the Fund’s investments (excluding cash equivalents) in certain general sectors. These sectors may include more than one industry. The Fund’s portfolio composition is subject to change at any time. |
MARSICO GROWTH FUND
SCHEDULE OF INVESTMENTS
March 31, 2012 (Unaudited)
| | | Number of Shares | | | Value | | | Percent of Net Assets | |
| COMMON STOCKS | | | | | | | | | |
| Aerospace & Defense | | | | | | | | | |
| Precision Castparts Corp. | | | 99,842 | | | $ | 17,262,682 | | | | 2.25 | % |
| | | | | | | | | | | | | |
| Apparel Retail | | | | | | | | | | | | |
| Limited Brands, Inc. | | | 159,188 | | | | 7,641,024 | | | | 1.00 | |
| The TJX Companies, Inc. | | | 900,562 | | | | 35,761,317 | | | | 4.66 | |
| | | | | | | | 43,402,341 | | | | 5.66 | |
| Apparel, Accessories & Luxury Goods | | | | | |
| Coach, Inc. | | | 199,595 | | | | 15,424,701 | | | | 2.01 | |
| Compagnie Financière Richemont SA ADR | | | 2,610,490 | | | | 16,237,248 | | | | 2.12 | |
| lululemon athletica, inc.* | | | 41,429 | | | | 3,093,918 | | | | 0.41 | |
| | | | | | | | 34,755,867 | | | | 4.54 | |
| Automotive Retail | | | | | | | | | | | | |
| AutoZone, Inc.* | | | 11,644 | | | | 4,329,239 | | | | 0.57 | |
| O'Reilly Automotive, Inc.* | | | 117,475 | | | | 10,731,341 | | | | 1.40 | |
| | | | | | | | 15,060,580 | | | | 1.97 | |
| Biotechnology | | | | | | | | | | | | |
| Biogen Idec Inc.* | | | 159,894 | | | | 20,141,847 | | | | 2.63 | |
| | | | | | | | | | | | | |
| Cable & Satellite | | | | | | | | | | | | |
| British Sky Broadcasting Group PLC | | | 382,245 | | | | 4,133,072 | | | | 0.54 | |
| | | | | | | | | | | | | |
| Casinos & Gaming | | | | | | | | | | | | |
| Wynn Resorts Ltd. | | | 169,178 | | | | 21,126,949 | | | | 2.76 | |
| | | | | | | | | | | | | |
| Communications Equipment | | | | | | | | | |
| QUALCOMM, Inc. | | | 235,522 | | | | 16,020,206 | | | | 2.09 | |
| | | | | | | | | | | | | |
| Computer Hardware | | | | | | | | | | | | |
| Apple, Inc.* | | | 81,483 | | | | 48,846,614 | | | | 6.37 | |
| | | | | | | | | | | | | |
| Construction & Farm Machinery & Heavy Trucks | | | | | |
| Cummins, Inc. | | | 105,939 | | | | 12,716,918 | | | | 1.66 | |
| | | | | | | | | | | | | |
| Data Processing & Outsourced Services | | | | | |
| Visa, Inc. - Cl. A | | | 200,000 | | | | 23,600,000 | | | | 3.08 | |
| | | | | | | | | | | | | |
| Distributors | | | | | | | | | | | | |
| Li & Fung Ltd. | | | 2,130,000 | | | | 4,887,819 | | | | 0.64 | |
| | | | | | | | | | | | | |
| Diversified Banks | | | | | | | | | | | | |
| U.S. Bancorp | | | 605,536 | | | | 19,183,380 | | | | 2.50 | |
| Wells Fargo & Company | | | 630,690 | | | | 21,531,757 | | | | 2.81 | |
| | | | | | | | 40,715,137 | | | | 5.31 | |
| Diversified Chemicals | | | | | | | | | | | | |
| The Dow Chemical Company | | | 268,165 | | | | 9,289,236 | | | | 1.21 | |
| | | | | | | | | | | | | |
| Electrical Components & Equipment | | | | | | | | | |
| Rockwell Automation, Inc. | | | 99,232 | | | | 7,908,790 | | | | 1.03 | |
| | | | | | | | | | | | | |
| Fertilizers & Agricultural Chemicals | | | | | | | | | |
| Monsanto Company | | | 219,891 | | | | 17,538,506 | | | | 2.29 | |
| | | | | | | | | | | | | |
COMMON STOCKS (continued) | | | | | | | | | |
| Footwear | | | | | | | | | | | | |
| Deckers Outdoor Corporation* | | | 56,571 | | | $ | 3,566,802 | | | | 0.47 | % |
| NIKE, Inc. - Cl. B | | | 231,360 | | | | 25,088,678 | | | | 3.27 | |
| | | | | | | | 28,655,480 | | | | 3.74 | |
| General Merchandise Stores | | | | | | | | | |
| Dollar Tree, Inc.* | | | 41,417 | | | | 3,913,492 | | | | 0.51 | |
| | | | | | | | | | | | | |
| Home Improvement Retail | | | | | | | | | | | | |
| The Home Depot, Inc. | | | 266,405 | | | | 13,402,836 | | | | 1.75 | |
| | | | | | | | | | | | | |
| Industrial Conglomerates | | | | | | | | | | | | |
| Danaher Corporation | | | 260,056 | | | | 14,563,136 | | | | 1.90 | |
| | | | | | | | | | | | | |
| Industrial Gases | | | | | | | | | | | | |
| Praxair, Inc. | | | 160,866 | | | | 18,441,678 | | | | 2.41 | |
| | | | | | | | | | | | | |
| Integrated Oil & Gas | | | | | | | | | | | | |
| Occidental Petroleum Corporation | | | 211,671 | | | | 20,157,429 | | | | 2.63 | |
| | | | | | | | | | | | | |
| Internet Retail | | | | | | | | | | | | |
| Amazon.com, Inc.* | | | 33,767 | | | | 6,838,155 | | | | 0.89 | |
| priceline.com, Inc.* | | | 36,908 | | | | 26,481,490 | | | | 3.46 | |
| | | | | | | | 33,319,645 | | | | 4.35 | |
| Internet Software & Services | | | | | | | | | |
| Baidu, Inc. Spon. ADR* | | | 152,573 | | | | 22,240,566 | | | | 2.90 | |
| Google, Inc. - Cl. A* | | | 24,124 | | | | 15,469,274 | | | | 2.02 | |
| LinkedIn Corporation - Cl. A* | | | 40,489 | | | | 4,129,473 | | | | 0.54 | |
| Youku.com, Inc. Spon. ADR* | | | 149,233 | | | | 3,281,634 | | | | 0.43 | |
| | | | | | | | 45,120,947 | | | | 5.89 | |
| IT Consulting & Other Services | | | | | | | | | |
| Accenture plc - Cl. A | | | 291,819 | | | | 18,822,326 | | | | 2.46 | |
| | | | | | | | | | | | | |
| Oil & Gas Equipment & Services | | | | | | | | | |
| Halliburton Company | | | 575,517 | | | | 19,101,409 | | | | 2.49 | |
| National Oilwell Varco, Inc. | | | 234,478 | | | | 18,633,967 | | | | 2.43 | |
| | | | | | | | 37,735,376 | | | | 4.92 | |
| Oil & Gas Exploration & Production | | | | | | | | | |
| Continental Resources, Inc.* | | | 42,061 | | | | 3,609,675 | | | | 0.47 | |
| | | | | | | | | | | | | |
| Packaged Foods & Meats | | | | | | | | | | | | |
| Mead Johnson Nutrition Company | | | 197,909 | | | | 16,323,534 | | | | 2.13 | |
| | | | | | | | | | | | | |
| Personal Products | | | | | | | | | | | | |
| The Estee Lauder Companies, Inc. - Cl. A | | | 156,208 | | | | 9,675,524 | | | | 1.26 | |
| | | | | | | | | | | | | |
| Pharmaceuticals | | | | | | | | | | | | |
| Allergan, Inc. | | | 118,851 | | | | 11,341,951 | | | | 1.48 | |
| Bristol-Myers Squibb Company | | | 316,775 | | | | 10,691,156 | | | | 1.39 | |
| | | | | | | | 22,033,107 | | | | 2.87 | |
| Railroads | | | | | | | | | | | | |
| Union Pacific Corporation | | | 196,701 | | | | 21,141,424 | | | | 2.76 | |
| | See notes to financial statements. |
MARSICO GROWTH FUND
SCHEDULE OF INVESTMENTS (continued)
March 31, 2012 (Unaudited)
| | | Number of Shares/Units | | | Value | | | Percent of Net Assets | |
COMMON STOCKS (continued) | | | | | | | |
| Restaurants | | | | | | | | | |
| McDonald's Corporation | | | 203,426 | | | $ | 19,956,090 | | | | 2.61 | % |
| Starbucks Corporation | | | 424,066 | | | | 23,701,049 | | | | 3.09 | |
| YUM! Brands, Inc. | | | 190,417 | | | | 13,553,882 | | | | 1.77 | |
| | | | | | | | 57,211,021 | | | | 7.47 | |
| Systems Software | | | | | | | | | | | | |
| Check Point Software Technologies Ltd.* | | | 157,354 | | | | 10,045,479 | | | | 1.31 | |
| VMware, Inc. - Cl. A* | | | 25,821 | | | | 2,901,506 | | | | 0.38 | |
| | | | | | | | 12,946,985 | | | | 1.69 | |
| TOTAL COMMON STOCKS | | | | | | | | | | | | |
| (Cost $482,483,399) | | | | | | | 714,480,179 | | | | 93.24 | |
| | | | | | | | | | | | | |
| PREFERRED STOCKS | | | | | | | | | | | | |
| Diversified Banks | | | | | | | | | | | | |
| Wells Fargo & Company, Series J Pref., 8.000% | | | 337,000 | | | | 9,793,220 | | | | 1.28 | |
| | | | | | | | | | | | | |
| TOTAL PREFERRED STOCKS | | | | | | | | | |
| (Cost $5,954,707) | | | | | | | 9,793,220 | | | | 1.28 | |
| | | | | | | | | | | | | |
| UNITS | | | | | | | | | | | | |
| Marine Ports & Services | | | | | | | | | | | | |
| Hutchison Port Holdings Trust - Cl. U | | | 11,140,000 | | | | 8,522,100 | | | | 1.11 | |
| | | | | | | | | | | | | |
| TOTAL UNITS | | | | | | | | | | | | |
| (Cost $11,195,875) | | | | | | | 8,522,100 | | | | 1.11 | |
| | | | | | | | | | | | | |
| SHORT-TERM INVESTMENTS | | | | | | | | | |
| State Street Institutional Treasury Money Market Fund, 0.000% | | | 37,123,266 | | | | 37,123,266 | | | | 4.85 | |
| State Street Institutional Treasury Plus Fund, 0.000% | | | 335,725 | | | | 335,725 | | | | 0.04 | |
| | | | | | | | | | | | | |
| TOTAL SHORT-TERM INVESTMENTS | | | | | | | | | |
| (Cost $37,458,991) | | | | | | | 37,458,991 | | | | 4.89 | |
| | | | | | | | | | | | | |
| TOTAL INVESTMENTS | | | | | | | | | | | | |
| (Cost $537,092,972) | | | | | | | 770,254,490 | | | | 100.52 | |
| | | | | | | | | | | | | |
| Liabilities, Less Cash and Other Assets | | | | | | | (3,991,647 | ) | | | (0.52 | ) |
| | | | | | | | | | | | | |
| NET ASSETS | | | | | | $ | 766,262,843 | | | | 100.00 | % |
| | See notes to financial statements. |
INVESTMENT REVIEW BY BRANDON GEISLER (UNAUDITED)
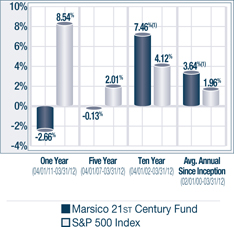
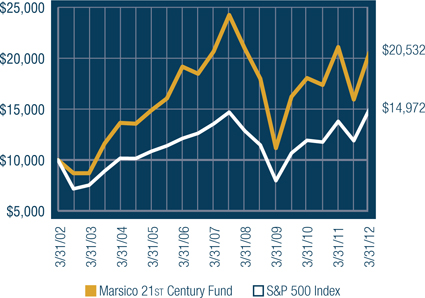
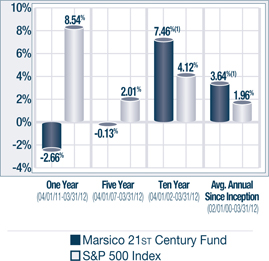
The Marsico 21st Century Fund posted a return of +28.79% for the six-month fiscal period ended March 31, 2012. The Fund outperformed the S&P 500 Index, which we consider to be the Fund’s primary benchmark index and which had a total return of +25.89% over the same time period. For comparative purposes, the Russell 3000 Index, a proxy for the performance of all publicly-traded US equity securities including smaller capitalization companies (which may be a useful representation of the Fund’s ability to invest across the entire market capitalization spectrum), had a total return of +26.55%. Please see the Fund Overview for more detailed information about the Fund’s longer-term performance for various time periods ended March 31, 2012.
The performance data for the Fund quoted here represent past performance, and past performance is not a guarantee of future results. Investment return and principal value of an investment will fluctuate so that an investor’s shares, when redeemed, may be worth more or less than their original cost. Current performance may be lower or higher than the performance information quoted. To obtain performance information current to the most recent month-end, please call 888-860-8686 or visit www.marsicofunds.com.(1)
This review highlights Fund performance over a six-month fiscal period. Shareholders should keep in mind that the Fund is intended for long-term investors who hold their shares for substantially longer periods of time. You should also keep in mind that our views on all investments discussed in this report are subject to change at any time. References to specific securities, industries, and sectors discussed in this report are not recommendations to buy or sell such securities or related investments, and the Fund may not necessarily hold these securities or investments today. Please see the accompanying Schedule of Investments for the percentage of the Fund’s portfolio represented by the securities mentioned in this report as of the end of the reporting period.
Stocks and markets in which the Fund invests may experience periods of turbulence and instability, and the general risk that domestic and global economies and stock markets may go through periods of decline and cyclical change.
The Fund’s six-month performance was primarily aided by stock selection and positioning in the Health Care and Consumer Discretionary sectors. Health care surgical systems manufacturer Intuitive Surgical, Inc. rose +48% and had a material, positive impact on performance. Consumer Discretionary holdings were led by discount retailer Ross Stores, Inc. (+48%), online travel reservations company priceline.com, Inc. (+60%), and restaurant operator Panera Bread Company – Cl. A (+46% prior to being sold).
From a sector allocation standpoint, the Fund’s performance was aided by having a significant portion of its net assets invested in the strong-performing Consumer Discretionary sector, while having an underweight posture in the Health Care and Consumer Staples sectors also helped, as these sectors’ performance results did not keep pace with the return of the overall benchmark index return. In addition, the Fund benefitted from having no exposure to the Utilities and Telecommunication Services sectors, which were the weakest-performing sectors of the S&P 500 Index.
Several of the Fund’s Energy and Information Technology holdings posted strong returns. National Oilwell Varco, Inc., a leading supplier of equipment to the oil and gas industry, and exploration and production company Occidental Petroleum Corporation rose +56% and +34%, respectively. Apple, Inc., maker of the iPhone and iPad, posted a return of +57%. As one of the Fund’s largest individual holdings, Apple had a significant positive effect on performance. Bankrate, Inc., which offers consumer finance websites, soared +63%.
As previously reported to shareholders, former portfolio manager Cory Gilchrist left Marsico Capital Management, LLC effective October 1, 2011, and Brandon Geisler was appointed portfolio manager of the Marsico 21st Century Fund. Under the Fund’s new portfolio manager, several steps were undertaken to reposition the Fund to add more breadth and diversification to its holdings. Specifically, the Fund’s allocation to the Financials and Consumer Discretionary sectors were significantly reduced. The Fund also increased its allocations to the Information Technology, Health Care, Materials, and Industrials sectors. During the transition period, the Fund held slightly elevated cash levels. The cash dampened performance results to some degree as the equity market rose sharply during the period.
There were a few areas of weakness for the Fund. Green Mountain Coffee Roasters, Inc. dropped -47% prior to being sold from the Fund during the period. The company was buffeted by concerns regarding higher-than-anticipated rates of warranty expense or sales returns announced during late-2011, and questions as to whether the company was capable of sustaining its very strong growth rate. Online retailer Amazon.com, Inc. dipped -6% and also detracted from performance results. Finally, the collective return of the Fund’s Industrials holdings (+21%), while strong in absolute terms, lagged the benchmark index sector return of +30%. Railroad operator CSX Corporation slid -4% and was a drag on performance.
Fiscal Period-End Investment Posture
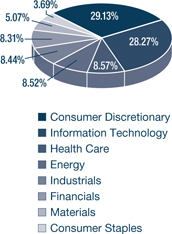
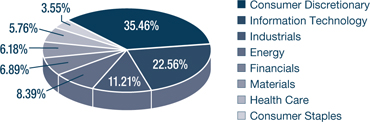
As of March 31, 2012, the Fund’s primary economic sector allocations included Consumer Discretionary, Information Technology, Industrials, and Financials. The Fund had no investments in the Utilities and Telecommunication Services sectors.
Sincerely,
BRANDON A. GEISLER
PORTFOLIO MANAGER
| (1) | Total returns are based on net change in net asset value assuming reinvestment of distributions. For the period prior to March 31, 2004, the performance returns for the 21st Century Fund reflect a fee waiver in effect; in the absence of such a waiver, the returns would have been reduced. For the period beginning April 2004 through January 2005, performance returns for the 21st Century Fund would have been higher but for the reimbursement of fees waived previously. A redemption fee of 2% may be imposed on redemptions or exchanges of Fund shares owned for 30 days or less. Please see the Prospectus for more information. |
| |
21st CENTURY FUND OVERVIEW |
| |
March 31, 2012 (Unaudited)
The 21st Century Fund invests primarily in common stocks that are selected for their long-term growth potential. The Fund may invest in companies of any size, and will normally hold a core position of between 35 and 50 common stocks.
| TOTAL ANNUAL OPERATING EXPENSES* 1.37% | NET ASSETS $456,651,703 | NET ASSET VALUE PER SHARE $14.63 |
GROWTH OF $10,000(1)(2) | PERFORMANCE COMPARISON |
| |
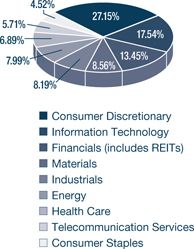
SECTOR ALLOCATION(3) | TOP FIVE HOLDINGS |
| | |
| APPLE, INC. | 6.55% |
| NATIONAL OILWELL VARCO, INC. | 3.81% |
| ROSS STORES, INC. | 3.33% |
| INTUITIVE SURGICAL, INC. | 3.22% |
| WYNN RESORTS LTD. | 3.01% |
| | |
| * | The Total Annual Operating Expenses are reflective of the information disclosed in the Funds’ Prospectus dated February 1, 2012 and may differ from the expense ratio disclosed in this report. |
| | The performance data quoted here represent past performance, and past performance is not a guarantee of future results. Investment return and principal value of an investment will fluctuate so that an investor’s shares, when redeemed, may be worth more or less than their original cost. Current performance may be lower or higher than the performance information quoted. To obtain performance information current to the most recent month-end, please call 888-860-8686 or visit www.marsicofunds.com. A redemption fee may be imposed on redemptions or exchanges of Fund shares held for 30 days or less. |
| | The performance included in the chart and graph does not reflect the deduction of taxes on Fund distributions or the redemption of Fund shares. |
| | All indices are unmanaged and investors cannot invest directly in an index. |
| (1) | The performance returns for the 21st Century Fund (for the period prior to March 31, 2004) reflect a fee waiver in effect; in the absence of such a waiver, the returns would be reduced. For the period beginning April 2004 through January 2005, performance returns for the 21st Century Fund would be higher but for the reimbursement of fees waived previously. |
| (2) | This chart assumes an initial investment of $10,000 made on March 31, 2002. Total returns are based on net change in NAV, assuming reinvestment of distributions. |
| (3) | Sector weightings represent the percentage of the Fund’s investments (excluding cash equivalents) in certain general sectors. These sectors may include more than one industry. The Fund’s portfolio composition is subject to change at any time. |
MARSICO 21st CENTURY FUND
SCHEDULE OF INVESTMENTS
March 31, 2012 (Unaudited)
| | | Number of Shares | | | Value | | | Percent of Net Assets | |
| COMMON STOCKS | | | | | | | | | |
| Aerospace & Defense | | | | | | | | | |
| Precision Castparts Corp. | | | 73,390 | | | $ | 12,689,131 | | | | 2.78 | % |
| TransDigm, Inc.* | | | 27,769 | | | | 3,214,539 | | | | 0.70 | |
| | | | | | | | 15,903,670 | | | | 3.48 | |
| Air Freight & Logistics | | | | | | | | | | | | |
| Expeditors International of Washington, Inc. | | | 105,176 | | | | 4,891,736 | | | | 1.07 | |
| | | | | | | | | | | | | |
| Airport Services | | | | | | | | | | | | |
| Wesco Aircraft Holdings, Inc.* | | | 153,857 | | | | 2,492,483 | | | | 0.55 | |
| | | | | | | | | | | | | |
| Apparel Retail | | | | | | | | | | | | |
| Limited Brands, Inc. | | | 96,720 | | | | 4,642,560 | | | | 1.02 | |
| Ross Stores, Inc. | | | 261,934 | | | | 15,218,365 | | | | 3.33 | |
| | | | | | | | 19,860,925 | | | | 4.35 | |
| Apparel, Accessories & Luxury Goods | | | | | |
| Ralph Lauren Corporation | | | 58,011 | | | | 10,113,058 | | | | 2.21 | |
| | | | | | | | | | | | | |
| Application Software | | | | | | | | | | | | |
| ANSYS, Inc.* | | | 160,789 | | | | 10,454,501 | | | | 2.29 | |
| Informatica Corporation* | | | 61,233 | | | | 3,239,225 | | | | 0.71 | |
| | | | | | | | 13,693,726 | | | | 3.00 | |
| Auto Parts & Equipment | | | | | | | | | | | | |
| BorgWarner, Inc.* | | | 54,531 | | | | 4,599,145 | | | | 1.01 | |
| | | | | | | | | | | | | |
| Automobile Manufacturers | | | | | | | | | | | | |
| Tesla Motors, Inc.* | | | 110,994 | | | | 4,133,417 | | | | 0.90 | |
| | | | | | | | | | | | | |
| Automotive Retail | | | | | | | | | | | | |
| CarMax, Inc.* | | | 210,754 | | | | 7,302,626 | | | | 1.60 | |
| O'Reilly Automotive, Inc.* | | | 56,486 | | | | 5,159,996 | | | | 1.13 | |
| | | | | | | | 12,462,622 | | | | 2.73 | |
| Biotechnology | | | | | | | | | | | | |
| Biogen Idec Inc.* | | | 109,102 | | | | 13,743,579 | | | | 3.01 | |
| | | | | | | | | | | | | |
| Casinos & Gaming | | | | | | | | | | | | |
| Wynn Resorts Ltd. | | | 110,074 | | | | 13,746,041 | | | | 3.01 | |
| | | | | | | | | | | | | |
| Computer Hardware | | | | | | | | | | | | |
| Apple, Inc.* | | | 49,877 | | | | 29,899,765 | | | | 6.55 | |
| | | | | | | | | | | | | |
| Computer Storage & Peripherals | | | | | | | | | |
| Fusion-io, Inc.* | | | 33,400 | | | | 948,894 | | | | 0.21 | |
| | | | | | | | | | | | | |
| Construction & Farm Machinery & Heavy Trucks | | | | | |
| Cummins, Inc. | | | 38,350 | | | | 4,603,534 | | | | 1.01 | |
| | | | | | | | | | | | | |
| Consumer Finance | | | | | | | | | | | | |
| Capital One Financial Corporation | | | 222,932 | | | | 12,426,230 | | | | 2.72 | |
| | | | | | | | | | | | | |
| Data Processing & Outsourced Services | | | | | |
| MasterCard, Inc. - Cl. A | | | 15,034 | | | | 6,322,398 | | | | 1.38 | |
| | | | | | | | | | | | | |
| Electrical Components & Equipment | | | | | | | | | |
| Sensata Technologies Holding N.V.* | | | 378,494 | | | | 12,671,979 | | | | 2.77 | |
| | | | | | | | | | | | | |
| Fertilizers & Agricultural Chemicals | | | | | | | | | |
| Monsanto Company | | | 125,354 | | | | 9,998,235 | | | | 2.19 | |
| | | | | | | | | | | | | |
COMMON STOCKS (continued) | | | | | | | | | |
| General Merchandise Stores | | | | | | | | | |
| Dollar Tree, Inc.* | | | 73,630 | | | $ | 6,957,299 | | | | 1.52 | % |
| | | | | | | | | | | | | |
| Health Care Equipment | | | | | | | | | | | | |
| Intuitive Surgical, Inc.* | | | 27,133 | | | | 14,699,303 | | | | 3.22 | |
| Varian Medical Systems, Inc.* | | | 60,171 | | | | 4,149,392 | | | | 0.91 | |
| | | | | | | | 18,848,695 | | | | 4.13 | |
| Industrial Machinery | | | | | | | | | | | | |
| Stanley Black & Decker, Inc. | | | 55,277 | | | | 4,254,118 | | | | 0.93 | |
| | | | | | | | | | | | | |
| Integrated Oil & Gas | | | | | | | | | | | | |
| Occidental Petroleum Corporation | | | 144,133 | | | | 13,725,786 | | | | 3.01 | |
| | | | | | | | | | | | | |
| Internet Retail | | | | | | | | | | | | |
| Amazon.com, Inc.* | | | 26,129 | | | | 5,291,384 | | | | 1.16 | |
| priceline.com, Inc.* | | | 17,706 | | | | 12,704,055 | | | | 2.78 | |
| | | | | | | | 17,995,439 | | | | 3.94 | |
| Internet Software & Services | | | | | | | | | |
| Bankrate, Inc.* | | | 299,824 | | | | 7,420,644 | | | | 1.63 | |
| Google, Inc. - Cl. A* | | | 11,913 | | | | 7,639,092 | | | | 1.67 | |
| LinkedIn Corporation - Cl. A* | | | 24,801 | | | | 2,529,454 | | | | 0.55 | |
| | | | | | | | 17,589,190 | | | | 3.85 | |
| IT Consulting & Other Services | | | | | | | | | |
| Accenture plc - Cl. A | | | 192,583 | | | | 12,421,603 | | | | 2.72 | |
| | | | | | | | | | | | | |
| Leisure Facilities | | | | | | | | | | | | |
| Vail Resorts, Inc. | | | 91,476 | | | | 3,956,337 | | | | 0.87 | |
| | | | | | | | | | | | | |
| Movies & Entertainment | | | | | | | | | | | | |
| Viacom, Inc. - Cl. B | | | 183,747 | | | | 8,720,633 | | | | 1.91 | |
| | | | | | | | | | | | | |
| Oil & Gas Equipment & Services | | | | | | | | | |
| Halliburton Company | | | 308,498 | | | | 10,239,049 | | | | 2.24 | |
| National Oilwell Varco, Inc. | | | 218,836 | | | | 17,390,897 | | | | 3.81 | |
| | | | | | | | 27,629,946 | | | | 6.05 | |
| Pharmaceuticals | | | | | | | | | | | | |
| Abbott Laboratories | | | 119,015 | | | | 7,294,429 | | | | 1.60 | |
| | | | | | | | | | | | | |
| Railroads | | | | | | | | | | | | |
| CSX Corporation | | | 579,957 | | | | 12,480,675 | | | | 2.73 | |
| | | | | | | | | | | | | |
| Real Estate Services | | | | | | | | | | | | |
| Jones Lang LaSalle, Inc. | | | 54,859 | | | | 4,570,303 | | | | 1.00 | |
| | | | | | | | | | | | | |
| Regional Banks | | | | | | | | | | | | |
| City National Corporation | | | 184,991 | | | | 9,706,478 | | | | 2.13 | |
| Columbia Banking System, Inc. | | | 213,564 | | | | 4,864,988 | | | | 1.06 | |
| First Horizon National Corporation | | | 491,279 | | | | 5,099,476 | | | | 1.12 | |
| The PNC Financial Services Group, Inc. | | | 197,130 | | | | 12,712,913 | | | | 2.78 | |
| | | | | | | | 32,383,855 | | | | 7.09 | |
| Research & Consulting Services | | | | | | | | | |
| Nielsen Holdings N.V. | | | 169,548 | | | | 5,110,177 | | | | 1.12 | |
| | | | | | | | | | | | | |
| Restaurants | | | | | | | | | | | | |
| Arcos Dorados Holdings, Inc. - Cl. A | | | 149,376 | | | | 2,702,212 | | | | 0.59 | |
| Chipotle Mexican Grill, Inc.* | | | 12,041 | | | | 5,033,138 | | | | 1.10 | |
| YUM! Brands, Inc. | | | 133,869 | | | | 9,528,795 | | | | 2.09 | |
| | | | | | | | 17,264,145 | | | | 3.78 | |
| | See notes to financial statements. |
| | | Number of Shares | | | Value | | | Percent of Net Assets | |
COMMON STOCKS (continued) | | | | | | | | | |
| Soft Drinks | | | | | | | | | | | | |
| Monster Beverage Corporation* | | | 77,373 | | | $ | 4,804,090 | | | | 1.05 | % |
| | | | | | | | | | | | | |
| Specialty Chemicals | | | | | | | | | | | | |
| LyondellBasell Industries N.V. - Cl. A | | | 164,311 | | | | 7,172,175 | | | | 1.57 | |
| | | | | | | | | | | | | |
| Specialty Stores | | | | | | | | | | | | |
| Ulta Salon, Cosmetics & Fragrance, Inc. | | | 73,027 | | | | 6,783,478 | | | | 1.49 | |
| | | | | | | | | | | | | |
| Systems Software | | | | | | | | | | | | |
| Check Point Software Technologies Ltd.* | | | 76,934 | | | | 4,911,467 | | | | 1.08 | |
| Red Hat, Inc.* | | | 110,959 | | | | 6,645,334 | | | | 1.45 | |
| VMware, Inc. - Cl. A* | | | 84,529 | | | | 9,498,524 | | | | 2.08 | |
| | | | | | | | 21,055,325 | | | | 4.61 | |
| Trading Companies & Distributors | | | | | | | | | |
| W.W. Grainger, Inc. | | | 13,432 | | | | 2,885,328 | | | | 0.63 | |
| | | | | | | | | | | | | |
| TOTAL COMMON STOCKS | | | | | | | | | | | | |
| (Cost $326,933,473) | | | | | | | 446,414,463 | | | | 97.75 | |
| | | | | | | | | | | | | |
| SHORT-TERM INVESTMENTS | | | | | | | | | |
| State Street Institutional Treasury Money Market Fund, 0.000% | | | 3,318,237 | | | | 3,318,237 | | | | 0.73 | |
| | | | | | | | | | | | | |
| TOTAL SHORT-TERM INVESTMENTS | | | | | | | | | |
| (Cost $3,318,237) | | | | | | | 3,318,237 | | | | 0.73 | |
| | | | | | | | | | | | | |
| TOTAL INVESTMENTS | | | | | | | | | | | | |
| (Cost $330,251,710) | | | | | | | 449,732,700 | | | | 98.48 | |
| | | | | | | | | | | | | |
| Cash and Other Assets, Less Liabilities | | | | | | | 6,919,003 | | | | 1.52 | |
| | | | | | | | | | | | | |
| NET ASSETS | | | | | | $ | 456,651,703 | | | | 100.00 | % |
| | See notes to financial statements. |
| |
| INTERNATIONAL OPPORTUNITIES FUND |
| |
INVESTMENT REVIEW BY JIM GENDELMAN AND MUNISH MALHOTRA (UNAUDITED)
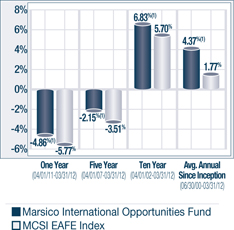
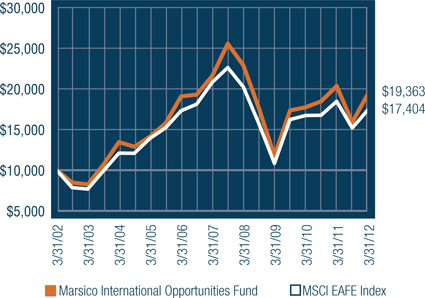
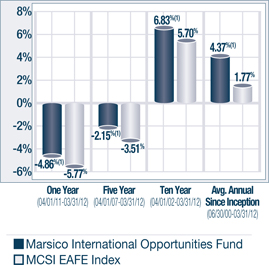
The Marsico International Opportunities Fund posted a total return of (US$) +21.87% for the six-month fiscal period ended March 31, 2012. The Fund significantly outperformed the MSCI EAFE Index, which we consider to be the Fund’s benchmark index and which had a total return of (US$) +14.56%. Please see the Fund Overview for more detailed information about the Fund’s longer-term performance for various time periods ended March 31, 2012.
The performance data for the Fund quoted here represent past performance, and past performance is not a guarantee of future results. Investment return and principal value of an investment will fluctuate so that an investor’s shares, when redeemed, may be worth more or less than their original cost. Current performance may be lower or higher than the performance information quoted. To obtain performance information current to the most recent month-end, please call 888-860-8686 or visit www.marsicofunds.com.(1)
This review highlights Fund performance over a six-month fiscal period. Shareholders should keep in mind that the Fund is intended for long-term investors who hold their shares for substantially longer periods of time. You should also keep in mind that our views on all investments discussed in this report are subject to change at any time. References to specific securities, industries, and sectors discussed in this report are not recommendations to buy or sell such securities or related investments, and the Fund may not necessarily hold these securities or investments today. Please see the accompanying Schedule of Investments for the percentage of the Fund’s portfolio represented by the securities mentioned in this report as of the end of the reporting period.
Foreign investments present additional risks due to currency fluctuations, economic and political factors, lower liquidity, differences in securities regulations and accounting standards, possible changes in taxation, limited public information, and other factors.
Stock selection in several sectors contributed positively to the Fund’s performance. A number of the Fund’s Information Technology holdings posted strong gains, including Latin American e-commerce company MercadoLibre, Inc. (+82%), Chinese Internet search company Baidu, Inc. Spon. ADR (+37%), and semiconductor positions ASML Holding N.V. (+43%) and Taiwan Semiconductor Manufacturing Co., Ltd. Spon. ADR. (+33%).
The Fund also benefitted from stock selection within the Consumer Staples, Industrials, Financials, and Energy sectors. Consumer Staples positions were led by Wal-Mart de Mexico S.A.B. de C.V. (+45%) and beverage company Anheuser-Busch InBev N.V. (+37%). Industrials holdings were led by jet engine manufacturer Rolls-Royce Group PLC (+41%). Strong Energy performers included oil and gas exploration firms OGX Petróleo e Gás Participações S.A. (+34%) and Pacific Rubiales Energy Corp. (+38%). The Fund’s Financials positions posted a collective return of +22%, surpassing the +17% return of the benchmark index’s Financials sector. Bank position Standard Chartered PLC (+27%) was a leading position in the sector. A specific Health Care holding, Novo Nordisk A/S – Cl. B, soared +40% and was a meaningful contributor to performance.
The Fund’s performance was buoyed by having a significant portion of its net assets invested in the strong-performing Consumer Discretionary sector, and by abstaining from investments in the weak-performing Utilities sector.
There were a few offsetting factors limiting investment results. Stock selection in the Telecommunication Services and Consumer Discretionary sectors negatively impacted performance. China Unicom Hong Kong Ltd., one of the world’s largest mobile providers, skidded -19% and was a material detractor. In the Consumer Discretionary sector, Arcos Dorados Holdings, Inc. – Cl. A, a Latin American McDonald’s restaurant franchisee, dropped -22%. Brazilian professional education company Anhanguera Educacional Participacoes S.A. and Japanese consumer electronics retailer Yamada-Denki Co., Ltd. declined -12% and -7%, respectively, prior to being sold from the Fund.
Although active currency management is not a central facet of the Fund’s investment process, currency fluctuations may at times affect the Fund’s performance. The Fund did well by having less exposure to securities denominated in the weaker Japanese yen than its benchmark index. Much of this positive effect, however, was offset by the Fund having no exposure to securities of companies denominated in the stronger Australian dollar. On an overall basis, currency effects did not significantly impact performance versus the benchmark.
| |
| INTERNATIONAL OPPORTUNITIES FUND |
| |
The International Opportunities Fund has tended to have a relatively high portfolio turnover level because of its investment style. Although the Fund may hold core positions for some time, it may change its portfolio composition quickly to take advantage of new opportunities, or to address issues affecting particular holdings.
Fiscal Period-End Investment Posture
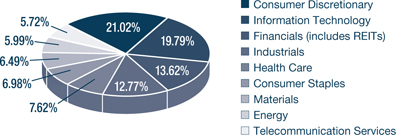
As of March 31, 2012, the Fund’s primary economic sector allocations included Consumer Discretionary, Information Technology, Financials, and Industrials. The Fund had no exposure to the Utilities sector.
In terms of country allocations, the Fund’s most significant weightings at period-end were Japan, Switzerland, the United Kingdom, and China/Hong Kong, although exposure to the United Kingdom and Japan represented underweighted postures relative to the benchmark index. Country-level weightings generally should be considered a residual of the Fund’s stock selection process rather than a major, proactive facet of its investment strategy.
Sincerely,
JAMES G. GENDELMAN
MUNISH MALHOTRA, CFA
PORTFOLIO MANAGERS
| (1) | Total returns are based on net change in net asset value assuming reinvestment of distributions. For the period prior to September 30, 2004 and from October 2011 through March 2012, the performance returns for the International Opportunities Fund reflect a fee waiver in effect; in the absence of such a waiver, the returns would have been reduced. For the period beginning October 2004 through December 2005, performance returns for the International Opportunities Fund would have been higher but for the reimbursement of fees waived previously. A redemption fee of 2% may be imposed on redemptions or exchanges of Fund shares owned for 30 days or less. Please see the Prospectus for more information. |
| |
INTERNATIONAL OPPORTUNITIES FUND OVERVIEW |
| |
March 31, 2012 (Unaudited)
The International Opportunities Fund invests primarily in common stocks of foreign companies that are selected for their long-term growth potential. The Fund may invest in companies of any size throughout the world. It normally invests in the securities of issuers that are economically tied to one or more foreign countries, and expects to be invested in various issuers or securities that together have ties to at least four different foreign countries. Some issuers or securities in the Fund’s portfolio may be based in or economically tied to the United States. The Fund may hold an unlimited number of common stocks.
| TOTAL ANNUAL OPERATING EXPENSES* 1.56% | NET ASSETS $151,015,440 | NET ASSET VALUE PER SHARE $12.93 |
GROWTH OF $10,000(1)(2) | PERFORMANCE COMPARISON |
| |
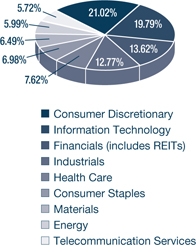
SECTOR ALLOCATION(3) | TOP FIVE HOLDINGS |
| | |
| NESTLÉ S.A. | 2.59% |
| MILLICOM INTERNATIONAL CELLULAR S.A. | 2.56% |
| JULIUS BAER GROUP LTD. | 2.54% |
| HONDA MOTOR CO., LTD. | 2.54% |
| STANDARD CHARTERED PLC | 2.52% |
| | |
| * | The Total Annual Operating Expenses are reflective of the information disclosed in the Funds’ Prospectus dated February 1, 2012 and may differ from the expense ratio disclosed in this report. |
| | The performance data quoted here represent past performance, and past performance is not a guarantee of future results. Investment return and principal value of an investment will fluctuate so that an investor’s shares, when redeemed, may be worth more or less than their original cost. Current performance may be lower or higher than the performance information quoted. To obtain performance information current to the most recent month-end, please call 888-860-8686 or visit www.marsicofunds.com. A redemption fee may be imposed on redemptions or exchanges of Fund shares held for 30 days or less. |
| | The performance included in the chart and graph does not reflect the deduction of taxes on Fund distributions or the redemption of Fund shares. |
| | All indices are unmanaged and investors cannot invest directly in an index. |
| (1) | The performance returns for the International Opportunities Fund (for the period prior to September 30, 2004 and from October 2011 through March 2012) reflect a fee waiver in effect; in the absence of such a waiver, the returns would be reduced. For the period beginning October 2004 through December 2005, performance returns for the International Opportunities Fund would be higher but for the reimbursement of fees waived previously. |
| (2) | This chart assumes an initial investment of $10,000 made on March 31, 2002. Total returns are based on net change in NAV, assuming reinvestment of distributions. |
| (3) | Sector weightings represent the percentage of the Fund’s investments (excluding cash equivalents) in certain general sectors. These sectors may include more than one industry. The Fund’s portfolio composition is subject to change at any time. |
| | The MSCI EAFE Index tracks the stocks of about 1,000 companies in Europe, Australasia, and the Far East (EAFE). |
MARSICO INTERNATIONAL OPPORTUNITIES FUND
SCHEDULE OF INVESTMENTS
March 31, 2012 (Unaudited)
| | | Number of Shares | | | Value | | | Percent of Net Assets | |
| COMMON STOCKS | | | | | | | | | |
| Advertising | | | | | | | | | |
| Publicis Groupe S.A. | | | 28,003 | | | $ | 1,543,763 | | | | 1.02 | % |
| | | | | | | | | | | | | |
| Aerospace & Defense | | | | | | | | | | | | |
| Rolls-Royce Group PLC* | | | 114,744 | | | | 1,490,289 | | | | 0.99 | |
| | | | | | | | | | | | | |
| Alternative Carriers | | | | | | | | | | | | |
| Ziggo N.V.* | | | 25,887 | | | | 807,551 | | | | 0.53 | |
| | | | | | | | | | | | | |
| Apparel Retail | | | | | | | | | | | | |
| Belle International Holdings Ltd. | | | 1,186,000 | | | | 2,122,889 | | | | 1.41 | |
| Industria de Diseno Textile S.A. (Inditex) | | | 25,879 | | | | 2,478,854 | | | | 1.64 | |
| | | | | | | | 4,601,743 | | | | 3.05 | |
| Apparel, Accessories & Luxury Goods | | | | | |
| Adidas A.G. | | | 28,910 | | | | 2,257,142 | | | | 1.50 | |
| Swatch Group AG | | | 6,401 | | | | 2,946,289 | | | | 1.95 | |
| | | | | | | | 5,203,431 | | | | 3.45 | |
| Asset Management & Custody Banks | | | | | |
| Julius Baer Group Ltd.* | | | 95,005 | | | | 3,835,142 | | | | 2.54 | |
| | | | | | | | | | | | | |
| Automobile Manufacturers | | | | | | | | | | | | |
| Bayerische Motoren Werke AG | | | 31,573 | | | | 2,839,403 | | | | 1.88 | |
| Honda Motor Co., Ltd. | | | 100,800 | | | | 3,830,083 | | | | 2.54 | |
| | | | | | | | 6,669,486 | | | | 4.42 | |
| Brewers | | | | | | | | | | | | |
| Anheuser-Busch InBev N.V. | | | 42,429 | | | | 3,099,866 | | | | 2.05 | |
| | | | | | | | | | | | | |
| Cable & Satellite | | | | | | | | | | | | |
| British Sky Broadcasting Group PLC | | | 344,339 | | | | 3,723,209 | | | | 2.47 | |
| | | | | | | | | | | | | |
| Casinos & Gaming | | | | | | | | | | | | |
| Wynn Resorts Ltd. | | | 23,684 | | | | 2,957,658 | | | | 1.96 | |
| | | | | | | | | | | | | |
| Construction Materials | | | | | | | | | | | | |
| CRH PLC | | | 110,091 | | | | 2,253,960 | | | | 1.49 | |
| | | | | | | | | | | | | |
| Distillers & Vintners | | | | | | | | | | | | |
| Pernod-Ricard S.A. | | | 15,237 | | | | 1,593,212 | | | | 1.05 | |
| | | | | | | | | | | | | |
| Diversified Banks | | | | | | | | | | | | |
| ICICI Bank Ltd. Spon. ADR | | | 37,845 | | | | 1,319,655 | | | | 0.88 | |
| Standard Chartered PLC | | | 152,589 | | | | 3,807,434 | | | | 2.52 | |
| | | | | | | | 5,127,089 | | | | 3.40 | |
| Diversified Metals & Mining | | | | | | | | | |
| Xstrata PLC | | | 160,595 | | | | 2,743,391 | | | | 1.82 | |
| | | | | | | | | | | | | |
| Diversified Real Estate Activities | | | | | | | | | |
| Hang Lung Properties Ltd. | | | 707,000 | | | | 2,594,729 | | | | 1.72 | |
| Sumitomo Realty & Development Co., Ltd. | | | 85,000 | | | | 2,048,750 | | | | 1.35 | |
| | | | | | | | 4,643,479 | | | | 3.07 | |
| Electrical Components & Equipment | | | | | | | | | |
| Schneider Electric S.A. | | | 34,778 | | | | 2,272,323 | | | | 1.50 | |
| Sensata Technologies Holding N.V.* | | | 90,613 | | | | 3,033,723 | | | | 2.01 | |
| | | | | | | | 5,306,046 | | | | 3.51 | |
| Electronic Components | | | | | | | | | | | | |
| HOYA CORPORATION | | | 66,000 | | | | 1,482,349 | | | | 0.98 | |
| | | | | | | | | | | | | |
COMMON STOCKS (continued) | | | | | | | | | |
| Health Care Equipment | | | | | | | | | | | | |
| Elekta AB - B Shares | | | 16,681 | | | $ | 844,413 | | | | 0.56 | % |
| | | | | | | | | | | | | |
| Hypermarkets & Super Centers | | | | | | | | | |
| Wal-Mart de Mexico S.A.B. de C.V. | | | 484,000 | | | | 1,624,077 | | | | 1.08 | |
| | | | | | | | | | | | | |
| Industrial Machinery | | | | | | | | | | | | |
| FANUC Corporation | | | 16,600 | | | | 2,944,158 | | | | 1.95 | |
| The Weir Group PLC | | | 59,999 | | | | 1,692,884 | | | | 1.12 | |
| | | | | | | | 4,637,042 | | | | 3.07 | |
| Integrated Telecommunication Services | | | | | |
| China Unicom Hong Kong Ltd. | | | 2,196,000 | | | | 3,704,515 | | | | 2.45 | |
| | | | | | | | | | | | | |
| Internet Retail | | | | | | | | | | | | |
| Rakuten, Inc. | | | 2,298 | | | | 2,407,111 | | | | 1.59 | |
| | | | | | | | | | | | | |
| Internet Software & Services | | | | | | | | | |
| Baidu, Inc. Spon. ADR* | | | 25,669 | | | | 3,741,770 | | | | 2.48 | |
| MercadoLibre, Inc. | | | 22,495 | | | | 2,199,786 | | | | 1.46 | |
| Yandex N.V. - Cl. A* | | | 48,505 | | | | 1,303,330 | | | | 0.86 | |
| | | | | | | | 7,244,886 | | | | 4.80 | |
| IT Consulting & Other Services | | | | | | | | | |
| Accenture plc - Cl. A | | | 48,663 | | | | 3,138,764 | | | | 2.08 | |
| | | | | | | | | | | | | |
| Movies & Entertainment | | | | | | | | | | | | |
| Imax Corporation* | | | 36,656 | | | | 895,873 | | | | 0.59 | |
| | | | | | | | | | | | | |
| Office Electronics | | | | | | | | | | | | |
| Canon, Inc. | | | 66,400 | | | | 3,136,692 | | | | 2.08 | |
| | | | | | | | | | | | | |
| Oil & Gas Exploration & Production | | | | | | | | | |
| CNOOC Ltd. | | | 673,800 | | | | 1,384,815 | | | | 0.92 | |
| OGX Petróleo e Gás Participações S.A.* | | | 328,600 | | | | 2,718,157 | | | | 1.80 | |
| Pacific Rubiales Energy Corp. | | | 49,887 | | | | 1,457,424 | | | | 0.97 | |
| Tullow Oil PLC | | | 131,977 | | | | 3,223,456 | | | | 2.13 | |
| | | | | | | | 8,783,852 | | | | 5.82 | |
| Other Diversified Financial Services | | | | | | | | | |
| Citigroup, Inc. | | | 70,402 | | | | 2,573,193 | | | | 1.70 | |
| | | | | | | | | | | | | |
| Packaged Foods & Meats | | | | | | | | | | | | |
| Nestlé S.A. | | | 62,201 | | | | 3,913,833 | | | | 2.59 | |
| | | | | | | | | | | | | |
| Pharmaceuticals | | | | | | | | | | | | |
| Novo Nordisk A/S - Cl. B | | | 21,622 | | | | 2,993,636 | | | | 1.98 | |
| Perrigo Company | | | 10,302 | | | | 1,064,300 | | | | 0.71 | |
| Roche Holding AG | | | 21,633 | | | | 3,764,866 | | | | 2.49 | |
| Shire PLC | | | 77,476 | | | | 2,503,243 | | | | 1.66 | |
| | | | | | | | 10,326,045 | | | | 6.84 | |
| Publishing | | | | | | | | | | | | |
| Reed Elsevier PLC | | | 171,295 | | | | 1,520,625 | | | | 1.01 | |
| | | | | | | | | | | | | |
| Railroads | | | | | | | | | | | | |
| Canadian National Railway Company | | | 46,640 | | | | 3,704,615 | | | | 2.45 | |
| | | | | | | | | | | | | |
| Real Estate Operating Companies | | | | | | | | | |
| BR Malls Participacoes S.A. | | | 170,100 | | | | 2,216,812 | | | | 1.47 | |
| | See notes to financial statements. |
MARSICO INTERNATIONAL OPPORTUNITIES FUND
SCHEDULE OF INVESTMENTS (continued)
March 31, 2012 (Unaudited)
| | | Number of Shares | | | Value | | | Percent of Net Assets | |
COMMON STOCKS (continued) | | | | | | | |
| Research & Consulting Services | | | | | | | |
| Experian PLC | | | 99,252 | | | $ | 1,547,055 | | | | 1.02 | % |
| | | | | | | | | | | | | |
| Restaurants | | | | | | | | | | | | |
| Arcos Dorados Holdings, Inc. - Cl. A | | | 70,340 | | | | 1,272,451 | | | | 0.84 | |
| | | | | | | | | | | | | |
| Retail REITs | | | | | | | | | | | | |
| Unibail-Rodamco S.E. | | | 7,801 | | | | 1,560,108 | | | | 1.03 | |
| | | | | | | | | | | | | |
| Semiconductor Equipment | | | | | | | | | | | | |
| ASML Holding N.V. | | | 48,985 | | | | 2,448,616 | | | | 1.62 | |
| | | | | | | | | | | | | |
| Semiconductors | | | | | | | | | | | | |
| ARM Holdings PLC | | | 175,663 | | | | 1,663,361 | | | | 1.10 | |
| Infineon Technologies AG | | | 155,178 | | | | 1,586,562 | | | | 1.05 | |
| Samsung Electronics Co., Ltd. | | | 2,906 | | | | 3,270,067 | | | | 2.16 | |
| Taiwan Semiconductor Manufacturing Co., Ltd. Spon. ADR | | | 203,363 | | | | 3,107,387 | | | | 2.06 | |
| | | | | | | | 9,627,377 | | | | 6.37 | |
| Specialty Chemicals | | | | | | | | | | | | |
| LyondellBasell Industries N.V. - Cl. A | | | 68,407 | | | | 2,985,965 | | | | 1.98 | |
| Novozymes A/S - B Shares | | | 52,259 | | | | 1,522,016 | | | | 1.01 | |
| | | | | | | | 4,507,981 | | | | 2.99 | |
| Systems Software | | | | | | | | | | | | |
| Check Point Software Technologies Ltd.* | | | 29,967 | | | | 1,913,093 | | | | 1.27 | |
| | | | | | | | | | | | | |
| Trading Companies & Distributors | | | | | | | | | |
| Marubeni Corporation | | | 280,000 | | | | 2,019,572 | | | | 1.34 | |
| | | | | | | | | | | | | |
| Wireless Telecommunication Services | | | | | |
| Millicom International Cellular S.A. | | | 34,093 | | | | 3,864,952 | | | | 2.56 | |
| | | | | | | | | | | | | |
| TOTAL COMMON STOCKS | | | | | | | | | | | | |
| (Cost $117,417,081) | | | | | | | 146,515,217 | | | | 97.02 | |
| | | | | | | | | | | | | |
| SHORT-TERM INVESTMENTS | | | | | | | | | |
| State Street Institutional Treasury Money Market Fund, 0.000% | | | 4,804,007 | | | | 4,804,007 | | | | 3.18 | |
| | | | | | | | | | | | | |
| TOTAL SHORT-TERM INVESTMENTS | | | | | | | | | |
| (Cost $4,804,007) | | | | | | | 4,804,007 | | | | 3.18 | |
| | | | | | | | | | | | | |
| TOTAL INVESTMENTS | | | | | | | | | | | | |
| (Cost $122,221,088) | | | | | | | 151,319,224 | | | | 100.20 | |
| | | | | | | | | | | | | |
| Liabilities, Less Cash and Other Assets | | | | | | | (303,784 | ) | | | (0.20 | ) |
| | | | | | | | | | | | | |
| NET ASSETS | | | | | | $ | 151,015,440 | | | | 100.00 | % |
| SUMMARY OF INVESTMENTS BY COUNTRY | |
| Country | | Market Value | | | Percent of Investment Securities | |
| Argentina | | $ | 3,472,237 | | | | 2.30 | % |
| Belgium | | | 3,099,866 | | | | 2.05 | |
| Brazil | | | 4,934,969 | | | | 3.26 | |
| Canada | | | 4,600,488 | | | | 3.04 | |
| China/Hong Kong | | | 13,548,718 | | | | 8.95 | |
| Colombia | | | 1,457,424 | | | | 0.96 | |
| Denmark | | | 4,515,652 | | | | 2.98 | |
| France | | | 6,969,406 | | | | 4.61 | |
| Germany | | | 6,683,107 | | | | 4.42 | |
| India | | | 1,319,655 | | | | 0.87 | |
| Ireland | | | 9,443,022 | | | | 6.24 | |
| Israel | | | 1,913,093 | | | | 1.26 | |
| Japan | | | 17,868,715 | | | | 11.81 | |
| Luxembourg | | | 3,864,952 | | | | 2.55 | |
| Mexico | | | 1,624,077 | | | | 1.07 | |
| Netherlands | | | 9,275,855 | | | | 6.13 | |
| Russia | | | 1,303,330 | | | | 0.86 | |
| South Korea | | | 3,270,067 | | | | 2.16 | |
| Spain | | | 2,478,854 | | | | 1.64 | |
| Sweden | | | 844,413 | | | | 0.56 | |
| Switzerland | | | 17,203,521 | | | | 11.37 | |
| Taiwan | | | 3,107,387 | | | | 2.06 | |
| United Kingdom | | | 17,121,258 | | | | 11.32 | |
United States(1) | | | 11,399,158 | | | | 7.53 | |
| | | $ | 151,319,224 | | | | 100.00 | % |
| (1) | Includes short-term securities. |
| | See notes to financial statements. |
INVESTMENT REVIEW BY DOUG RAO (UNAUDITED)
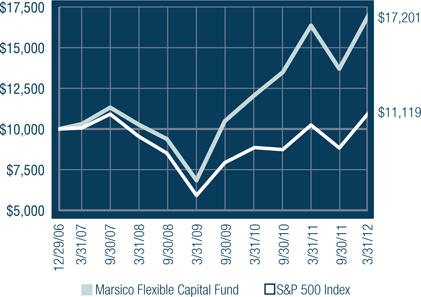
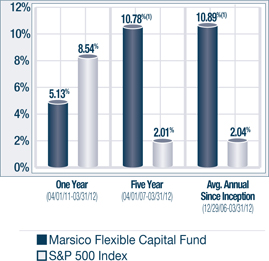
The Marsico Flexible Capital Fund posted a total return of +25.55% for the six-month fiscal period ended March 31, 2012. The Fund’s performance was in-line with the S&P 500 Index, which we consider to be the Fund’s benchmark index and which had a total return of +25.89%. Please see the Fund Overview for more detailed information about the Fund’s performance for various time periods ended March 31, 2012.
The performance data for the Fund quoted here represent past performance, and past performance is not a guarantee of future results. Investment return and principal value of an investment will fluctuate so that an investor’s shares, when redeemed, may be worth more or less than their original cost. Current performance may be lower or higher than the performance information quoted. To obtain performance information current to the most recent month-end, please call 888-860-8686 or visit www.marsicofunds.com.(1)
This review highlights Fund performance over a six-month fiscal period. Shareholders should keep in mind that the Fund is intended for long-term investors who hold their shares for substantially longer periods of time. You should also keep in mind that our views on all investments discussed in this report are subject to change at any time. References to specific securities, industries, and sectors discussed in this report are not recommendations to buy or sell such securities or related investments, and the Fund may not necessarily hold these securities or investments today. Please see the accompanying Schedule of Investments for the percentage of the Fund’s portfolio represented by the securities mentioned in this report as of the end of the reporting period.
Stocks and markets in which the Fund invests may experience periods of turbulence and instability, and the general risk that domestic and global economies and stock markets may go through periods of decline and cyclical change.
The Fund’s performance during the six-month fiscal period ended March 31, 2012 benefitted primarily from strong stock selection in the Information Technology sector. The Fund’s Information Technology holdings posted a collective return of +56%, while the S&P 500 Index Information Technology sector returned +32%. SolarWinds, Inc., a developer of network management tools, surged +76%. Apple, Inc. gained +57% and was another meaningful contributor to performance.
Stock selection in the Materials and Energy sectors also bolstered performance. Chemical materials manufacturer LyondellBasell Industries N.V. – Cl. A rose +80%. In the Energy sector, natural gas producer Targa Resources Corporation (+55%) enhanced performance.
Several other individual holdings, spanning a variety of industries, contributed positively to the Fund’s six-month return. These included discount retailer The TJX Companies, Inc. (+44%) and Netherlands-based global industrial technology firm Sensata Technologies Holding N.V. (+27%).
The Fund benefitted from having overweight allocations to the Consumer Discretionary and Financials sectors, as these were strong-performing sectors within the benchmark index. Underweight allocations to the weak-performing Utilities, Health Care, and Consumer Staples sectors also enhanced performance results.
The main detractor from the Fund’s performance was stock selection in the Consumer Discretionary sector. Deckers Outdoor Corporation, manufacturer of UGG and Teva-brand shoes, slid -45%. Vacation rental online services company HomeAway, Inc. (-30% prior to being sold) and media company British Sky Broadcasting Group PLC (+8%) each posted returns that were considerably lower than the benchmark index and significantly detracted from performance.
The Fund’s Industrials positions posted a collective return of +24%. Though the return was strong on an absolute basis, it trailed the performance of the benchmark Industrials sector, which gained +30%.
Green Mountain Coffee Roasters, Inc. dropped -52% prior to being sold from the Fund during the period. The company was buffeted by concerns regarding higher-than-anticipated rates of warranty expense or sales returns announced during late-2011, and questions as to whether the company was capable of sustaining its very strong growth rate.
The Fund’s cash position was elevated during portions of the reporting period. Cash and cash equivalents averaged approximately 6% of the Fund’s net assets during the six-month period. The Fund’s elevated cash and a modest allocation to fixed-income securities had a dampening effect to some degree on performance results during a time of generally stronger equity returns.
During the period, the Fund increased its allocations to the Financials and Information Technology sectors. Exposure to the Consumer Staples and Industrials sectors were reduced.
The Flexible Capital Fund has tended to have a relatively high portfolio turnover level. This is attributable in part to the Fund’s investment style. Although the Fund may hold core positions for some time, it may change its portfolio composition quickly to take advantage of new opportunities, preserve capital or to address issues affecting particular holdings.
Fiscal Period-End Investment Posture
As of March 31, 2012, the Fund’s primary economic sector allocations included Consumer Discretionary, Financials, and Information Technology. At period-end, the Fund had no exposure to the Utilities or Consumer Staples sectors. During the period, the Fund’s investments emphasized investments in equity securities of US and foreign securities that we considered to be attractively valued. The Fund also held a few investments in fixed-income and preferred securities that we believed to offer equity-like return potential.
Sincerely,
A. DOUGLAS RAO
PORTFOLIO MANAGER
| (1) | Total returns are based on net change in net asset value assuming reinvestment of distributions. For the period prior to February 1, 2011 the performance returns for the Flexible Capital Fund reflect a fee waiver in effect; in the absence of such a waiver, the returns would have been reduced. A redemption fee of 2% may be imposed on redemptions or exchanges of Fund shares owned for 30 days or less. Please see the Prospectus for more information. |
| |
FLEXIBLE CAPITAL FUND OVERVIEW |
| |
March 31, 2012 (Unaudited)
The Flexible Capital Fund invests primarily in equity securities and other investments that are selected primarily for their long-term growth potential. The Fund may invest in issuers of any size throughout the world, and will normally hold a core position of between 20 and 50 securities or other investments.
| TOTAL ANNUAL OPERATING EXPENSES* 1.41% | NET ASSETS $513,545,928 | NET ASSET VALUE PER SHARE $15.06 |
GROWTH OF $10,000(1)(2) | PERFORMANCE COMPARISON |
| |
SECTOR ALLOCATION(3) | TOP FIVE HOLDINGS |
| | |
| APPLE, INC. | 6.88% |
| THE TJX COMPANIES, INC. | 3.49% |
| CAPITAL ONE FINANCIAL CORPORATION | 3.39% |
| LOWE'S COMPANIES, INC. | 2.98% |
| SENSATA TECHNOLOGIES HOLDING N.V. | 2.93% |
| | |
| * | The Total Annual Operating Expenses are reflective of the information disclosed in the Funds’ Prospectus dated February 1, 2012 and may differ from the expense ratio disclosed in this report. |
| | The performance data quoted here represent past performance, and past performance is not a guarantee of future results. Investment return and principal value of an investment will fluctuate so that an investor’s shares, when redeemed, may be worth more or less than their original cost. Current performance may be lower or higher than the performance information quoted. To obtain performance information current to the most recent month-end, please call 888-860-8686 or visit www.marsicofunds.com. A redemption fee may be imposed on redemptions or exchanges of Fund shares owned for 30 days or less. |
| | The performance included in the chart and graph does not reflect the deduction of taxes on Fund distributions or the redemption of Fund shares. |
| | All indices are unmanaged and investors cannot invest directly in an index. |
| (1) | The performance returns for the Flexible Capital Fund (for the period prior to February 1, 2011) reflect a fee waiver in effect; in the absence of such a waiver, the returns would be reduced. |
| (2) | This chart assumes an initial investment of $10,000 made on December 29, 2006 (inception). Total returns are based on change in NAV, assuming reinvestment of distributions. |
| (3) | Sector weightings represent the percentage of the Fund’s investments (excluding cash equivalents) in certain general sectors. These sectors may include more than one industry. The Fund’s portfolio composition is subject to change at any time. |
MARSICO FLEXIBLE CAPITAL FUND
SCHEDULE OF INVESTMENTS
March 31, 2012 (Unaudited)
| | | Number of Shares | | | Value | | | Percent of Net Assets | |
| COMMON STOCKS | | | | | | | | | |
| Aerospace & Defense | | | | | | | | | |
| TransDigm, Inc.* | | | 62,949 | | | $ | 7,286,976 | | | | 1.42 | % |
| | | | | | | | | | | | | |
| Alternative Carriers | | | | | | | | | | | | |
| Ziggo N.V.* | | | 49,837 | | | | 1,554,677 | | | | 0.30 | |
| | | | | | | | | | | | | |
| Apparel Retail | | | | | | | | | | | | |
| The TJX Companies, Inc. | | | 450,806 | | | | 17,901,506 | | | | 3.49 | |
| | | | | | | | | | | | | |
| Apparel, Accessories & Luxury Goods | | | | | |
| Adidas A.G. | | | 121,939 | | | | 9,520,360 | | | | 1.85 | |
| PVH Corp. | | | 87,265 | | | | 7,795,383 | | | | 1.52 | |
| | | | | | | | 17,315,743 | | | | 3.37 | |
| Application Software | | | | | | | | | | | | |
| SolarWinds, Inc.* | | | 307,298 | | | | 11,877,068 | | | | 2.31 | |
| | | | | | | | | | | | | |
| Automobile Manufacturers | | | | | | | | | | | | |
| Tesla Motors, Inc.* | | | 117,221 | | | | 4,365,310 | | | | 0.85 | |
| | | | | | | | | | | | | |
| Automotive Retail | | | | | | | | | | | | |
| AutoZone, Inc.* | | | 33,475 | | | | 12,446,005 | | | | 2.42 | |
| | | | | | | | | | | | | |
| Cable & Satellite | | | | | | | | | | | | |
| British Sky Broadcasting Group PLC | | | 1,195,907 | | | | 12,930,895 | | | | 2.52 | |
| Liberty Global, Inc. - Cl. A* | | | 108,135 | | | | 5,415,401 | | | | 1.05 | |
| | | | | | | | 18,346,296 | | | | 3.57 | |
| Catalog Retail | | | | | | | | | | | | |
| Liberty Interactive Corporation - Cl. A* | | | 386,418 | | | | 7,376,720 | | | | 1.44 | |
| | | | | | | | | | | | | |
| Communications Equipment | | | | | | | | | |
| QUALCOMM, Inc. | | | 156,731 | | | | 10,660,843 | | | | 2.08 | |
| | | | | | | | | | | | | |
| Computer Hardware | | | | | | | | | | | | |
| Apple, Inc.* | | | 58,918 | | | | 35,319,573 | | | | 6.88 | |
| | | | | | | | | | | | | |
| Consumer Finance | | | | | | | | | | | | |
| Capital One Financial Corporation | | | 312,284 | | | | 17,406,710 | | | | 3.39 | |
| | | | | | | | | | | | | |
| Data Processing & Outsourced Services | | | | | |
| Visa, Inc. - Cl. A | | | 68,850 | | | | 8,124,300 | | | | 1.58 | |
| | | | | | | | | | | | | |
| Diversified Banks | | | | | | | | | | | | |
| Standard Chartered PLC | | | 196,060 | | | | 4,892,131 | | | | 0.95 | |
| U.S. Bancorp | | | 463,391 | | | | 14,680,227 | | | | 2.86 | |
| | | | | | | | 19,572,358 | | | | 3.81 | |
| Diversified Real Estate Activities | | | | | | | | | |
| Hang Lung Properties Ltd. | | | 1,434,000 | | | | 5,262,860 | | | | 1.02 | |
| | | | | | | | | | | | | |
| Electrical Components & Equipment | | | | | | | | | |
| Sensata Technologies Holding N.V.* | | | 449,631 | | | | 15,053,646 | | | | 2.93 | |
| | | | | | | | | | | | | |
| Footwear | | | | | | | | | | | | |
| Deckers Outdoor Corporation* | | | 85,917 | | | | 5,417,067 | | | | 1.05 | |
| | | | | | | | | | | | | |
| Home Improvement Retail | | | | | | | | | | | | |
| Lowe's Companies, Inc. | | | 487,046 | | | | 15,283,503 | | | | 2.98 | |
| | | | | | | | | | | | | |
COMMON STOCKS (continued) | | | | | | | | | |
| Hotels, Resorts & Cruise Lines | | | | | | | | | |
| Carnival Corporation | | | 173,780 | | | $ | 5,574,862 | | | | 1.09 | % |
| | | | | | | | | | | | | |
| Industrial Machinery | | | | | | | | | | | | |
| Stanley Black & Decker, Inc. | | | 125,124 | | | | 9,629,543 | | | | 1.88 | |
| | | | | | | | | | | | | |
| Internet Retail | | | | | | | | | | | | |
| Amazon.com, Inc.* | | | 18,634 | | | | 3,773,571 | | | | 0.73 | |
| | | | | | | | | | | | | |
| Internet Software & Services | | | | | | | | | |
| Baidu, Inc. Spon. ADR* | | | 69,046 | | | | 10,064,835 | | | | 1.96 | |
| Bankrate, Inc.* | | | 242,324 | | | | 5,997,519 | | | | 1.17 | |
| Google, Inc. - Cl. A* | | | 11,912 | | | | 7,638,451 | | | | 1.49 | |
| Youku.com, Inc. Spon. ADR* | | | 85,140 | | | | 1,872,229 | | | | 0.36 | |
| | | | | | | | 25,573,034 | | | | 4.98 | |
| Investment Banking & Brokerage | | | | | | | | | |
| Greenhill & Co., Inc. | | | 148,800 | | | | 6,493,632 | | | | 1.27 | |
| The Charles Schwab Corporation | | | 676,926 | | | | 9,727,427 | | | | 1.89 | |
| The Goldman Sachs Group, Inc. | | | 40,743 | | | | 5,067,207 | | | | 0.99 | |
| | | | | | | | 21,288,266 | | | | 4.15 | |
| IT Consulting & Other Services | | | | | | | | | |
| Accenture plc - Cl. A | | | 186,169 | | | | 12,007,900 | | | | 2.34 | |
| | | | | | | | | | | | | |
| Life & Health Insurance | | | | | | | | | | | | |
| AIA Group Ltd. | | | 2,102,200 | | | | 7,701,655 | | | | 1.50 | |
| | | | | | | | | | | | | |
| Managed Health Care | | | | | | | | | | | | |
| Odontoprev S.A. | | | 286,500 | | | | 4,865,376 | | | | 0.95 | |
| | | | | | | | | | | | | |
| Movies & Entertainment | | | | | | | | | | | | |
| Viacom, Inc. - Cl. B | | | 291,339 | | | | 13,826,949 | | | | 2.69 | |
| | | | | | | | | | | | | |
| Oil & Gas Equipment & Services | | | | | | | | | |
| Halliburton Company | | | 272,768 | | | | 9,053,170 | | | | 1.76 | |
| | | | | | | | | | | | | |
| Oil & Gas Exploration & Production | | | | | | | | | |
| Concho Resources, Inc.* | | | 75,240 | | | | 7,680,499 | | | | 1.50 | |
| | | | | | | | | | | | | |
| Oil & Gas Storage & Transportation | | | | | | | | | |
| El Paso Corporation | | | 343,727 | | | | 10,157,133 | | | | 1.98 | |
| Targa Resources Corporation | | | 216,960 | | | | 9,860,832 | | | | 1.92 | |
| | | | | | | | 20,017,965 | | | | 3.90 | |
| Pharmaceuticals | | | | | | | | | | | | |
| Abbott Laboratories | | | 148,513 | | | | 9,102,362 | | | | 1.77 | |
| Allergan, Inc. | | | 78,979 | | | | 7,536,966 | | | | 1.47 | |
| | | | | | | | 16,639,328 | | | | 3.24 | |
| Property & Casualty Insurance | | | | | | | | | |
| The Progressive Corporation | | | 643,149 | | | | 14,908,194 | | | | 2.90 | |
| | | | | | | | | | | | | |
| Regional Banks | | | | | | | | | | | | |
| First Horizon National Corporation | | | 489,817 | | | | 5,084,300 | | | | 0.99 | |
| Regions Financial Corporation | | | 531,274 | | | | 3,501,096 | | | | 0.68 | |
| | | | | | | | 8,585,396 | | | | 1.67 | |
| Specialty Chemicals | | | | | | | | | | | | |
| Celanese Corporation | | | 93,115 | | | | 4,300,051 | | | | 0.84 | |
| LyondellBasell Industries N.V. - Cl. A | | | 135,843 | | | | 5,929,547 | | | | 1.15 | |
| | | | | | | | 10,229,598 | | | | 1.99 | |
| TOTAL COMMON STOCKS | | | | | | | | | | | | |
| (Cost $339,802,665) | | | | | | | 421,926,467 | | | | 82.16 | |
| | See notes to financial statements. |
| | | Number of Shares/ Par Value | | | Value | | | Percent of Net Assets | |
| CORPORATE BONDS | | | | | | | | | |
| Aerospace & Defense | | | | | | | | | |
| TransDigm, Inc., 7.750%, 12/15/18 | | $ | 4,141,000 | | | $ | 4,482,633 | | | | 0.87 | % |
| | | | | | | | | | | | | |
| Diversified Support Services | | | | | | | | | |
| Aramark Corporation, 8.500%, 2/1/15 | | | 4,109,000 | | | | 4,211,766 | | | | 0.82 | |
| | | | | | | | | | | | | |
| Real Estate Services | | | | | | | | | | | | |
| CB Richard Ellis Services, Inc., 11.625%, 6/15/17 | | | 5,613,000 | | | | 6,370,755 | | | | 1.24 | |
| | | | | | | | | | | | | |
| Research & Consulting Services | | | | | | | | | |
| Nielsen Finance Co., 7.750%, 10/15/18 | | | 1,395,000 | | | | 1,537,988 | | | | 0.30 | |
| | | | | | | | | | | | | |
| Restaurants | | | | | | | | | | | | |
| The Wendy's Company, 10.000%, 7/15/16 | | | 7,770,000 | | | | 8,488,725 | | | | 1.66 | |
| | | | | | | | | | | | | |
| Wireless Telecommunication Services | | | | | |
| Crown Castle International Corp., 7.125%, 11/1/19 | | | 7,193,000 | | | | 7,858,352 | | | | 1.53 | |
| | | | | | | | | | | | | |
| TOTAL CORPORATE BONDS | | | | | | | | | |
| (Cost $31,726,453) | | | | | | | 32,950,219 | | | | 6.42 | |
| | | | | | | | | | | | | |
| PREFERRED STOCKS | | | | | | | | | | | | |
| Thrifts & Mortgage Finance | | | | | | | | | |
| First Niagara Financial Group, Inc., 8.625% | | | 212,799 | | | | 5,866,868 | | | | 1.14 | |
| | | | | | | | | | | | | |
| TOTAL PREFERRED STOCKS | | | | | | | | | |
| (Cost $5,319,975) | | | | | | | 5,866,868 | | | | 1.14 | |
| | | | | | | | | | | | | |
| SHORT-TERM INVESTMENTS | | | | | | | | | |
| State Street Institutional Treasury Money Market Fund, 0.000% | | | 52,907,554 | | | | 52,907,554 | | | | 10.30 | |
| | | | | | | | | | | | | |
| TOTAL SHORT-TERM INVESTMENTS | | | | | | | | | |
| (Cost $52,907,554) | | | | | | | 52,907,554 | | | | 10.30 | |
| | | | | | | | | | | | | |
| TOTAL INVESTMENTS | | | | | | | | | | | | |
| (Cost $429,756,647) | | | | | | | 513,651,108 | | | | 100.02 | |
| | | | | | | | | | | | | |
| Liabilities, Less Cash and Other Assets | | | | | | | (105,180 | ) | | | (0.02 | ) |
| | | | | | | | | | | | | |
| NET ASSETS | | | | | | $ | 513,545,928 | | | | 100.00 | % |
| SUMMARY OF INVESTMENTS BY COUNTRY | |
| Country | | Market Value | | | Percent of Investment Securities | |
| Brazil | | $ | 4,865,376 | | | | 0.95 | % |
| China/Hong Kong | | | 24,901,579 | | | | 4.85 | |
| Germany | | | 9,520,360 | | | | 1.85 | |
| Ireland | | | 12,007,900 | | | | 2.34 | |
| Netherlands | | | 22,537,870 | | | | 4.39 | |
| United Kingdom | | | 17,823,026 | | | | 3.47 | |
United States(1) | | | 421,994,997 | | | | 82.15 | |
| | | $ | 513,651,108 | | | | 100.00 | % |
| (1) | Includes short-term securities. |
| | See notes to financial statements. |
INVESTMENT REVIEW BY TOM MARSICO AND JIM GENDELMAN (UNAUDITED)
The Marsico Global Fund posted a total return of (US$) +29.80% for the six-month fiscal period ended March 31, 2012. The Fund’s return strongly surpassed that of the MSCI All Country World Index (“MSCI ACWI Index”), which we consider to be the Fund’s benchmark index and which had a total return of (US$) +19.91%. The MSCI ACWI Index measures equity market performance in the global developed and emerging markets. Please see the Fund Overview for more detailed information about the Fund’s performance for various time periods ended March 31, 2012.
The performance data for the Fund quoted here represent past performance, and past performance is not a guarantee of future results. Investment return and principal value of an investment will fluctuate so that an investor’s shares, when redeemed, may be worth more or less than their original cost. Current performance may be lower or higher than the performance information quoted. To obtain performance information current to the most recent month-end, please call 888-860-8686 or visit www.marsicofunds.com.(1)
This review highlights Fund performance over a six-month fiscal period. Shareholders should keep in mind that the Fund is intended for long-term investors who hold their shares for substantially longer periods of time. You should also keep in mind that our views on all investments discussed in this report are subject to change at any time. References to specific securities, industries, and sectors discussed in this report are not recommendations to buy or sell such securities or related investments, and the Fund may not necessarily hold these securities or investments today. Please see the accompanying Schedule of Investments for the percentage of the Fund’s portfolio represented by the securities mentioned in this report as of the end of the reporting period.
Foreign investments present additional risks due to currency fluctuations, economic and political factors, lower liquidity, differences in securities regulations and accounting standards, possible changes in taxation, limited public information, and other factors.
The Global Fund’s strong outperformance versus the MSCI ACWI Index for the six-month period was led by strong stock selection and positioning in the Information Technology sector. The Fund’s Information Technology holdings posted a collective return of +55%. Top-performing holdings within the sector included Latin American e-commerce platform MercadoLibre, Inc. (+82%), Apple, Inc. (+58%), and personal finance website company Bankrate, Inc. (+63%). The Fund purchased Millennial Media, Inc., a mobile advertising company, at its initial public offering. The position was sold from the Fund after the company’s stock price appreciated by nearly 100%. The Fund also benefitted from having an overweight posture in the Information Technology sector, as it was the strongest-performing sector of the benchmark index.
Similarly, the Fund was aided by stock selection and an overweight allocation to the Consumer Discretionary sector, which was another leading area of the benchmark index. Swiss luxury goods provider Compagnie Financière Richemont SA gained +39%. Online travel reservations company priceline.com, Inc. (+60%) and Starbucks Corporation (+48%) also appreciated sharply.
The Fund held several individual positions whose returns exceeded the returns of pertinent sectors or industries in the benchmark index. These included health care surgical systems manufacturer Intuitive Surgical, Inc. (+48%), beverage company Anheuser-Busch InBev N.V. (+24%), infant formula manufacturer Mead Johnson Nutrition Company (+23%), and bank The PNC Financial Services Group, Inc. (+26% prior to being sold).
Utilities and Telecommunication Services were poor performing sectors of the Fund’s benchmark index. The Fund did well by avoiding investments in both sectors.
Active currency management is not a central facet of the Fund’s investment process, but fluctuations in major world currencies can affect performance. During this six-month period, the Fund’s performance was dampened by having no exposure to companies whose securities trade in the Australian dollar, and few investments in securities denominated in the Canadian dollar, as both currencies strengthened. A portion of this negative impact was offset by having few investments in securities tied to the weaker Japanese yen.
The Fund, as is typically the case, held a modest level of cash during the period. Though the cash position averaged less than 5% of net assets, having even a modest amount of uninvested cash weighed on performance to a degree during the period of sharply higher equity returns.
Another area of weakness for the Fund’s performance over the past six months was stock selection in the Industrials sector. The Fund’s Industrials positions posted a collective return of +19%, a result that, although strong in absolute terms, trailed the +24% return of the benchmark index sector. Japanese automation company FANUC Corporation dipped -2%, and aerospace component company Precision Castparts Corp. gained +11%.
Certain individual positions struggled, notably online retailer Amazon.com, Inc. and media company British Sky Broadcasting Group PLC. The Fund sold both positions after their stock prices declined by -19% and -3%, respectively.
The Global Fund has tended to have a fairly high portfolio turnover level. This is mainly attributable to the Fund’s investment style. Although the Fund may hold core positions for some time, it may change its portfolio composition quickly to take advantage of new opportunities, or to address issues affecting particular holdings.
As previously reported to shareholders, effective October 1, 2011, Cory Gilchrist left Marsico Capital Management, LLC, and Tom Marsico and Jim Gendelman continue to serve as the Marsico Global Fund’s co-portfolio managers.
Fiscal Period-End Investment Posture
As of March 31, 2012, the Fund’s primary economic sector allocations were in the following areas: Consumer Discretionary, Information Technology, and Industrials. The Fund had no investments in the Utilities and Telecommunication Services sectors. The Fund’s most significant country allocations were the US (which represented more than 45% of the Fund’s average net assets during the period), China/Hong Kong, Switzerland, and South Korea.
Sincerely,
THOMAS F. MARSICO
JAMES G. GENDELMAN
PORTFOLIO MANAGERS
GLOBAL FUND
| (1) | Total returns are based on net change in net asset value assuming reinvestment of distributions. For the period prior to January 1, 2009, from April through May 2009, and from January through March 2012, the performance returns for the Global Fund reflect a fee waiver in effect; in the absence of such a waiver, the returns would have been reduced. For the one-month period of June 2009, performance returns for the Global Fund would have been higher but for the reimbursement of fees waived previously. A redemption fee of 2% may be imposed on redemptions or exchanges of Fund shares owned for 30 days or less. Please see the Prospectus for more information. |
March 31, 2012 (Unaudited)
The Global Fund invests primarily in common stocks that are selected for their long-term growth potential. The Fund invests in the securities of companies of any size that are economically tied to any countries or markets throughout the world, including the securities of companies economically tied to emerging markets. Under normal market conditions, the Fund will invest significantly (generally, at least 40% of its net assets) in the securities of issuers organized or located outside the US or doing business outside the US (unless market conditions are not deemed favorable by the Adviser, in which case the Fund generally will invest at least 30% of its assets in such foreign securities). The Fund will invest its assets in various regions and countries, including the US, that encompass not less than three different countries overall. The Fund may hold an unlimited number of common stocks.
| TOTAL ANNUAL OPERATING EXPENSES* 1.60% | NET ASSETS $53,573,446 | NET ASSET VALUE PER SHARE $11.76 |
GROWTH OF $10,000(1)(2) | PERFORMANCE COMPARISON |
| |
SECTOR ALLOCATION(3) | TOP FIVE HOLDINGS |
| | |
| APPLE, INC. | 7.68% |
| SAMSUNG ELECTRONICS CO., LTD. | 4.81% |
| COMPAGNIE FINANCIÈRE RICHEMONT SA | 4.25% |
| WYNN MACAU LTD. | 4.17% |
| INTUITIVE SURGICAL, INC. | 4.01% |
| | |
| * | The Total Annual Operating Expenses are reflective of the information disclosed in the Funds’ Prospectus dated February 1, 2012 and may differ from the expense ratio disclosed in this report. |
| | The performance data quoted here represent past performance, and past performance is not a guarantee of future results. Investment return and principal value of an investment will fluctuate so that an investor’s shares, when redeemed, may be worth more or less than their original cost. Current performance may be lower or higher than the performance information quoted. To obtain performance information current to the most recent month-end, please call 888-860-8686 or visit www.marsicofunds.com. A redemption fee may be imposed on redemptions or exchanges of Fund shares held for 30 days or less. |
| | The performance included in the chart and graph does not reflect the deduction of taxes on Fund distributions or the redemption of Fund shares. |
| | All indices are unmanaged and investors cannot invest directly in an index. |
| (1) | The performance returns for the Global Fund (for the period prior to January 1, 2009, from April through May 2009 and from January through March 2012) reflect a fee waiver in effect; in absence of such a waiver, the returns would be reduced. For the one-month period June 2009, performance returns for the Global Fund would have been higher but for reimbursement of fees waived previously. |
| (2) | This chart assumes an initial investment of $10,000 made on June 29, 2007 (inception). Total returns are based on change in NAV, assuming reinvestment of distributions. |
| (3) | Sector weightings represent the percentage of the Fund’s investments (excluding cash equivalents) in certain general sectors. These sectors may include more than one industry. The Fund’s portfolio composition is subject to change at any time. |
| | The MSCI ACWI (All Country World Index) Index is a free float-adjusted market capitalization index that is designed to measure equity market performance in the global developed and emerging markets. |
MARSICO GLOBAL FUND
SCHEDULE OF INVESTMENTS
March 31, 2012 (Unaudited)
| | | Number of Shares | | | Value | | | Percent of Net Assets | |
| COMMON STOCKS | | | | | | | | | |
| Aerospace & Defense | | | | | | | | | |
| Precision Castparts Corp. | | | 8,901 | | | $ | 1,538,983 | | | | 2.87 | % |
| | | | | | | | | | | | | |
| Apparel Retail | | | | | | | | | | | | |
| Industria de Diseno Textile S.A. (Inditex) | | | 14,510 | | | | 1,389,859 | | | | 2.59 | |
| | | | | | | | | | | | | |
| Apparel, Accessories & Luxury Goods | | | | | |
| Compagnie Financière Richemont SA | | | 36,298 | | | | 2,275,913 | | | | 4.25 | |
| lululemon athletica, inc.* | | | 16,358 | | | | 1,221,615 | | | | 2.28 | |
| Prada S.p.A.* | | | 277,200 | | | | 1,804,439 | | | | 3.37 | |
| | | | | | | | 5,301,967 | | | | 9.90 | |
| Automobile Manufacturers | | | | | | | | | | | | |
| Bayerische Motoren Werke AG | | | 5,990 | | | | 538,689 | | | | 1.00 | |
| Tesla Motors, Inc.* | | | 13,318 | | | | 495,962 | | | | 0.93 | |
| | | | | | | | 1,034,651 | | | | 1.93 | |
| Brewers | | | | | | | | | | | | |
| Anheuser-Busch InBev N.V. | | | 24,632 | | | | 1,799,616 | | | | 3.36 | |
| | | | | | | | | | | | | |
| Casinos & Gaming | | | | | | | | | | | | |
| Wynn Macau Ltd. | | | 758,675 | | | | 2,232,388 | | | | 4.17 | |
| | | | | | | | | | | | | |
| Computer Hardware | | | | | | | | | | | | |
| Apple, Inc.* | | | 6,860 | | | | 4,112,364 | | | | 7.68 | |
| | | | | | | | | | | | | |
| Construction & Farm Machinery & Heavy Trucks | | | | | |
| Cummins, Inc. | | | 7,721 | | | | 926,829 | | | | 1.73 | |
| | | | | | | | | | | | | |
| Distributors | | | | | | | | | | | | |
| Li & Fung Ltd. | | | 200,000 | | | | 458,950 | | | | 0.86 | |
| | | | | | | | | | | | | |
| Diversified Banks | | | | | | | | | | | | |
| Wells Fargo & Company | | | 46,252 | | | | 1,579,043 | | | | 2.95 | |
| | | | | | | | | | | | | |
| Diversified Chemicals | | | | | | | | | | | | |
| The Dow Chemical Company | | | 29,331 | | | | 1,016,026 | | | | 1.90 | |
| | | | | | | | | | | | | |
| Diversified Real Estate Activities | | | | | | | | | |
| Hang Lung Properties Ltd. | | | 288,000 | | | | 1,056,976 | | | | 1.97 | |
| | | | | | | | | | | | | |
| Electrical Components & Equipment | | | | | | | | | |
| Sensata Technologies Holding N.V.* | | | 39,721 | | | | 1,329,859 | | | | 2.48 | |
| | | | | | | | | | | | | |
| Health Care Equipment | | | | | | | | | | | | |
| Intuitive Surgical, Inc.* | | | 3,969 | | | | 2,150,206 | | | | 4.01 | |
| | | | | | | | | | | | | |
| Home Improvement Retail | | | | | | | | | | | | |
| The Home Depot, Inc. | | | 17,939 | | | | 902,511 | | | | 1.68 | |
| | | | | | | | | | | | | |
| Hotels, Resorts & Cruise Lines | | | | | | | | | |
| Starwood Hotels & Resorts Worldwide, Inc. | | | 7,642 | | | | 431,085 | | | | 0.81 | |
| | | | | | | | | | | | | |
| Hypermarkets & Super Centers | | | | | | | | | |
| PriceSmart, Inc. | | | 7,301 | | | | 531,586 | | | | 0.99 | |
| | | | | | | | | | | | | |
| Industrial Machinery | | | | | | | | | | | | |
| FANUC Corporation | | | 9,000 | | | | 1,596,231 | | | | 2.98 | |
| | | | | | | | | | | | | |
COMMON STOCKS (continued) | | | | | | | | | |
| Integrated Oil & Gas | | | | | | | | | | | | |
| Occidental Petroleum Corporation | | | 13,939 | | | $ | 1,327,411 | | | | 2.48 | % |
| | | | | | | | | | | | | |
| Internet Retail | | | | | | | | | | | | |
| priceline.com, Inc.* | | | 2,450 | | | | 1,757,875 | | | | 3.28 | |
| | | | | | | | | | | | | |
| Internet Software & Services | | | | | | | | | |
| Baidu, Inc. Spon. ADR* | | | 8,649 | | | | 1,260,764 | | | | 2.35 | |
| Bankrate, Inc.* | | | 31,132 | | | | 770,517 | | | | 1.44 | |
| Google, Inc. - Cl. A* | | | 949 | | | | 608,537 | | | | 1.13 | |
| MercadoLibre, Inc. | | | 10,882 | | | | 1,064,151 | | | | 1.99 | |
| | | | | | | | 3,703,969 | | | | 6.91 | |
| IT Consulting & Other Services | | | | | | | | | |
| Accenture plc - Cl. A | | | 24,658 | | | | 1,590,441 | | | | 2.97 | |
| | | | | | | | | | | | | |
| Oil & Gas Equipment & Services | | | | | | | | | |
| Halliburton Company | | | 21,068 | | | | 699,247 | | | | 1.31 | |
| | | | | | | | | | | | | |
| Other Diversified Financial Services | | | | | | | | | |
| Citigroup, Inc. | | | 24,828 | | | | 907,463 | | | | 1.69 | |
| | | | | | | | | | | | | |
| Packaged Foods & Meats | | | | | | | | | | | | |
| Mead Johnson Nutrition Company | | | 19,569 | | | | 1,614,051 | | | | 3.01 | |
| Nestlé S.A. | | | 17,676 | | | | 1,112,215 | | | | 2.08 | |
| | | | | | | | 2,726,266 | | | | 5.09 | |
| Pharmaceuticals | | | | | | | | | | | | |
| Roche Holding AG | | | 2,890 | | | | 502,957 | | | | 0.94 | |
| | | | | | | | | | | | | |
| Real Estate Operating Companies | | | | | | | | | |
| BR Malls Participacoes S.A. | | | 86,500 | | | | 1,127,303 | | | | 2.10 | |
| | | | | | | | | | | | | |
| Restaurants | | | | | | | | | | | | |
| Chipotle Mexican Grill, Inc.* | | | 1,706 | | | | 713,108 | | | | 1.33 | |
| Starbucks Corporation | | | 34,311 | | | | 1,917,642 | | | | 3.58 | |
| | | | | | | | 2,630,750 | | | | 4.91 | |
| Semiconductors | | | | | | | | | | | | |
| ARM Holdings PLC | | | 56,700 | | | | 536,895 | | | | 1.00 | |
| Samsung Electronics Co., Ltd. | | | 2,289 | | | | 2,575,769 | | | | 4.81 | |
| | | | | | | | 3,112,664 | | | | 5.81 | |
| Specialty Chemicals | | | | | | | | | | | | |
| Novozymes A/S - B Shares | | | 50,869 | | | | 1,481,533 | | | | 2.77 | |
| | | | | | | | | | | | | |
| TOTAL COMMON STOCKS | | | | | | | | | | | | |
| (Cost $33,122,883) | | | | | | | 50,957,009 | | | | 95.12 | |
| | | | | | | | | | | | | |
| SHORT-TERM INVESTMENTS | | | | | | | | | |
| State Street Institutional Treasury Money Market Fund, 0.000% | | | 32,558 | | | | 32,558 | | | | 0.06 | |
| | | | | | | | | | | | | |
| TOTAL SHORT-TERM INVESTMENTS | | | | | | | | | |
| (Cost $32,558) | | | | | | | 32,558 | | | | 0.06 | |
| | | | | | | | | | | | | |
| TOTAL INVESTMENTS | | | | | | | | | | | | |
| (Cost $33,155,441) | | | | | | | 50,989,567 | | | | 95.18 | |
| | | | | | | | | | | | | |
| Cash and Other Assets, Less Liabilities | | | | | | | 2,583,879 | | | | 4.82 | |
| | | | | | | | | | | | | |
| NET ASSETS | | | | | | $ | 53,573,446 | | | | 100.00 | % |
| | See notes to financial statements. |
MARSICO GLOBAL FUND
SCHEDULE OF INVESTMENTS (continued)
March 31, 2012 (Unaudited)
| SUMMARY OF INVESTMENTS BY COUNTRY | |
| Country | | Market Value | | | Percent of Investment Securities | |
| Argentina | | $ | 1,064,151 | | | | 2.09 | % |
| Belgium | | | 1,799,616 | | | | 3.53 | |
| Brazil | | | 1,127,303 | | | | 2.21 | |
| Canada | | | 1,221,615 | | | | 2.40 | |
| China/Hong Kong | | | 5,009,078 | | | | 9.82 | |
| Denmark | | | 1,481,533 | | | | 2.91 | |
| Germany | | | 538,689 | | | | 1.05 | |
| Ireland | | | 1,590,441 | | | | 3.12 | |
| Italy | | | 1,804,439 | | | | 3.54 | |
| Japan | | | 1,596,231 | | | | 3.13 | |
| Netherlands | | | 1,329,859 | | | | 2.61 | |
| South Korea | | | 2,575,769 | | | | 5.05 | |
| Spain | | | 1,389,859 | | | | 2.73 | |
| Switzerland | | | 3,891,085 | | | | 7.63 | |
| United Kingdom | | | 536,895 | | | | 1.05 | |
United States(1) | | | 24,033,004 | | | | 47.13 | |
| | | $ | 50,989,567 | | | | 100.00 | % |
| (1) | Includes short-term securities. |
| | See notes to financial statements. |
INVESTMENT REVIEW BY MUNISH MALHOTRA AND JOSH RUBIN (UNAUDITED)
The Marsico Emerging Markets Fund posted a total return of (US$) +18.03% for the six-month fiscal period ended March 31, 2012. The Fund’s return lagged its benchmark index, the MSCI Emerging Markets Index, which had a total return of (US$) +19.13%. The MSCI Emerging Markets Index measures the equity market performance of emerging markets. Please see the Fund Overview for more detailed information about the Fund’s performance for the six-month period ended March 31, 2012.
The performance data for the Fund quoted here represent past performance, and past performance is not a guarantee of future results. Investment return and principal value of an investment will fluctuate so that an investor’s shares, when redeemed, may be worth more or less than their original cost. Current performance may be lower or higher than the performance information quoted. To obtain performance information current to the most recent month-end, please call 888-860-8686 or visit www.marsicofunds.com.(1)
This review highlights Fund performance over a six-month period. Shareholders should keep in mind that the Fund is intended for long-term investors who hold their shares for substantially longer periods of time. You should also keep in mind that our views on all investments discussed in this report are subject to change at any time. References to specific securities, industries, and sectors discussed in this report are not recommendations to buy or sell such securities or related investments, and the Fund may not necessarily hold these securities or investments today. Please see the accompanying Schedule of Investments for the percentage of the Fund’s portfolio represented by the securities mentioned in this report as of the end of the reporting period.
Foreign investments present additional risks due to currency fluctuations, economic and political factors, lower liquidity, differences in securities regulations and accounting standards, possible changes in taxation, limited public information, and other factors. These risks may be greater in less-developed emerging markets.
During the six-month period, the Fund benefitted from strong stock selection across several sectors. Information Technology holdings performed well, including Latin American e-commerce platform MercadoLibre, Inc. (+83%) and consumer electronics company Apple, Inc. (+57%). Apple is growing sales of its products, including the iPhone, in international markets including China and Hong Kong. Other leading technology positions included Samsung Electronics Co., Ltd. (+46%) and Baidu, Inc. Spon. ADR (+37%), a China-based website search engine. Information Technology was the best-performing sector of the Fund’s benchmark index, and the Fund did well by having an overweight allocation to the sector.
Materials positions also bolstered returns. Chilean industrial chemical company Sociedad Quimica y Minera de Chile S.A. ADR rose +24% and petrochemical producer Petronas Chemicals Group Bhd gained +28%. Materials was a weaker-performing sector of the benchmark index, and the Fund benefitted from having an underweight allocation to the sector during the period.
Other leading individual Fund holdings included: oil and gas exploration company Pacific Rubiales Energy Corp. (+38%), Russian supermarket company Magnit OJSC Spon. GDR – 144A (+51%), Maltan television company Multiplus S.A. (+54%) and casino/resort operator MGM China Holdings Ltd. (+48%).
The Fund’s modest performance shortfall versus its benchmark index was attributable, in part, to its sector allocations. The Fund was unfavorably positioned in having an overweight allocation to the Consumer Discretionary sector, and an underweight allocation to the Consumer Staples sector.
Certain of the Fund’s holdings posted negative returns for the six-month period. Mexico-based pharmaceutical company Genomma Lab Internacional S.A.B. de C.V. – Cl. B slid -21%. China Unicom Hong Kong Ltd., one of the world’s largest mobile providers, dropped -20%. Hyundai Mobis, a parts and services provider for Hyundai Motor Company and Kia Motors, declined -17%. Russian food retailer X5 Retail Group N.V. – GDR – 144A skidded -20% prior to being sold from the Fund.
The Fund held a slightly elevated level of cash, particularly at the start of the reporting period. On average, the Fund held approximately 8% of its net assets in cash and cash equivalents. The uninvested cash weighed on performance as the equity market posted gains, and the Fund did not fully participate to a degree in the positive equity returns experienced by the benchmark index.
Active currency management is not a central facet of the Fund’s investment process, but fluctuations in major world currencies can sometimes affect performance. On an overall basis, the effect of currency translation did not significantly impact performance versus the benchmark.
The Emerging Markets Fund has tended to have a relatively high portfolio turnover level because of its investment style. Although the Fund may hold core positions for some time, it may change its portfolio composition quickly to take advantage of new opportunities, or to address issues affecting particular holdings.
Fiscal Period-End Investment Posture
As of period-end, the Fund’s most significant sector allocations included Consumer Discretionary, Information Technology, and Financials. The Fund’s largest country weights, excluding cash equivalents, were China/Hong Kong, Brazil, South Korea, and Russia.
Effective April 18, 2012, Charles Wilson no longer serves as co-manager of the Marsico Emerging Markets Fund. Munish Malhotra, CFA, and Joshua Rubin, who have served as co-managers of the Marsico Emerging Markets Fund since its inception, remain in those roles.
Sincerely,
MUNISH MALHOTRA, CFA
JOSHUA N. RUBIN
PORTFOLIO MANAGERS
| (1) | Total returns are based on net change in net asset value assuming reinvestment of distributions. The performance returns for the Emerging Markets Fund reflect a fee waiver in effect; in the absence of such a waiver, the returns would have been reduced. A redemption fee of 2% may be imposed on redemptions or exchanges of Fund shares owned for 30 days or less. Please see the Prospectus for more information. |
| |
EMERGING MARKETS FUND OVERVIEW |
| |
March 31, 2012 (Unaudited)
The Emerging Markets Fund seeks long-term growth of capital through a diversified portfolio. The Fund invests primarily (no less than 80% of net assets) in common stocks and other securities of issuers economically tied to emerging markets. The Fund may invest in the securities of an unlimited number of issuers of any size around the world.
TOTAL ANNUAL OPERATING EXPENSES* 5.75% NET EXPENSES*† 1.77% | NET ASSETS $5,470,495 | NET ASSET VALUE PER SHARE $8.38 |
GROWTH OF $10,000(1)(2) | PERFORMANCE COMPARISON |
| |
SECTOR ALLOCATION(3) | TOP FIVE HOLDINGS |
| | |
| APPLE, INC. | 2.71% |
| ANTOFAGASTA PLC | 2.43% |
| BAIDU, INC. SPON. ADR | 2.17% |
| MILLICOM INTERNATIONAL CELLULAR S.A. | 2.15% |
| BRAZIL PHARMA S.A. | 2.14% |
| | |
| * | The Total Annual Operating Expenses and Net Expenses are reflective of the information disclosed in the Funds’ Prospectus dated February 1, 2012 and may differ from the expense ratios disclosed in this report. |
| † | The Adviser has entered into a written expense limitation agreement under which it has agreed to limit the total expenses of the Fund (excluding interest, taxes, acquired fund fees and expenses, litigation, brokerage and extraordinary expenses) to an annual rate of 1.75% of the Emerging Markets Fund’s average net assets until January 31, 2013. This fee waiver may be terminated at any time after January 31, 2013. The Adviser may recoup any waived amount from the Fund pursuant to this arrangement if such reimbursement does not cause the Fund to exceed existing expense limitations and the reimbursement is made within three years after the year in which the Adviser incurred the expense. |
| | The performance data quoted here represent past performance, and past performance is not a guarantee of future results. Investment return and principal value of an investment will fluctuate so that an investor’s shares, when redeemed, may be worth more or less than their original cost. Current performance may be lower or higher than the performance information quoted. To obtain performance information current to the most recent month-end, please call 888-860-8686 or visit www.marsicofunds.com. A redemption fee may be imposed on redemptions or exchanges of Fund shares held for 30 days or less. |
| | The performance included in the chart and graph does not reflect the deduction of taxes on Fund distributions or the redemption of Fund shares. |
| | All indices are unmanaged and investors cannot invest directly in an index. |
| (1) | The performance returns for the Emerging Markets Fund reflect a fee waiver in effect; in absence of such a waiver, the returns would be reduced. |
| (2) | This chart assumes an initial investment of $10,000 made on December 31, 2010 (inception). Total returns are based on change in NAV, assuming reinvestment of distributions. |
| (3) | Sector weightings represent the percentage of the Fund’s investments (excluding cash equivalents) in certain general sectors. These sectors may include more than one industry. The Fund’s portfolio composition is subject to change at any time. |
| | The MSCI Emerging Markets Index is a free float-adjusted market capitalization index that is designed to measure equity market performance in the global emerging markets. |
MARSICO EMERGING MARKETS FUND
SCHEDULE OF INVESTMENTS
March 31, 2012 (Unaudited)
| | | Number of Shares | | | Value | | | Percent of Net Assets | |
| COMMON STOCKS | | | | | | | | | |
| Apparel Retail | | | | | | | | | |
| Belle International Holdings Ltd. | | | 63,000 | | | $ | 112,767 | | | | 2.06 | % |
| Mr Price Group Ltd. | | | 4,628 | | | | 56,917 | | | | 1.04 | |
| | | | | | | | 169,684 | | | | 3.10 | |
| Asset Management & Custody Banks | | | | | |
| CETIP S.A. - Balcao Organizado de Ativos e Derivativos | | | 5,800 | | | | 96,272 | | | | 1.76 | |
| | | | | | | | | | | | | |
| Auto Parts & Equipment | | | | | | | | | | | | |
| Hyundai Mobis | | | 341 | | | | 86,224 | | | | 1.58 | |
| | | | | | | | | | | | | |
| Automobile Manufacturers | | | | | | | | | | | | |
| Hyundai Motor Company | | | 436 | | | | 89,659 | | | | 1.64 | |
| | | | | | | | | | | | | |
| Broadcasting | | | | | | | | | | | | |
| Media Nusantara Citra Tbk PT | | | 257,500 | | | | 52,942 | | | | 0.97 | |
| | | | | | | | | | | | | |
| Cable & Satellite | | | | | | | | | | | | |
| Naspers Ltd. - Cl. N | | | 2,009 | | | | 112,877 | | | | 2.06 | |
| | | | | | | | | | | | | |
| Casinos & Gaming | | | | | | | | | | | | |
| Kangwon Land, Inc. | | | 2,130 | | | | 47,279 | | | | 0.87 | |
| MGM China Holdings Ltd. | | | 61,200 | | | | 111,752 | | | | 2.04 | |
| Wynn Macau Ltd. | | | 37,200 | | | | 109,460 | | | | 2.00 | |
| | | | | | | | 268,491 | | | | 4.91 | |
| Commodity Chemicals | | | | | | | | | | | | |
| Petronas Chemicals Group Bhd | | | 47,600 | | | | 104,725 | | | | 1.91 | |
| | | | | | | | | | | | | |
| Computer Hardware | | | | | | | | | | | | |
| Apple, Inc.* | | | 247 | | | | 148,069 | | | | 2.71 | |
| | | | | | | | | | | | | |
| Construction & Farm Machinery & Heavy Trucks | | | | | |
| Sany Heavy Equipment International Holdings Co., Ltd. | | | 120,000 | | | | 90,554 | | | | 1.65 | |
| | | | | | | | | | | | | |
| Department Stores | | | | | | | | | | | | |
| Golden Eagle Retail Group Ltd. | | | 41,000 | | | | 104,222 | | | | 1.90 | |
| S.A.C.I. Falabella | | | 11,008 | | | | 106,452 | | | | 1.95 | |
| | | | | | | | 210,674 | | | | 3.85 | |
| Diversified Banks | | | | | | | | | | | | |
| Credicorp Ltd. | | | 433 | | | | 57,078 | | | | 1.05 | |
| ICICI Bank Ltd. Spon. ADR | | | 1,635 | | | | 57,013 | | | | 1.04 | |
| PT Bank Rakyat Indonesia Persero Tbk | | | 72,000 | | | | 54,724 | | | | 1.00 | |
| Sberbank of Russia Spon. ADR* | | | 7,856 | | | | 105,192 | | | | 1.92 | |
| | | | | | | | 274,007 | | | | 5.01 | |
| Diversified Metals & Mining | | | | | | | | | |
| Antofagasta PLC | | | 7,209 | | | | 132,835 | | | | 2.43 | |
| | | | | | | | | | | | | |
| Diversified Real Estate Activities | | | | | | | | | |
| Hang Lung Properties Ltd. | | | 29,000 | | | | 106,432 | | | | 1.95 | |
| | | | | | | | | | | | | |
| Diversified Support Services | | | | | | | | | |
| Multiplus S.A. | | | 5,300 | | | | 109,168 | | | | 2.00 | |
| | | | | | | | | | | | | |
| Drug Retail | | | | | | | | | | | | |
| Brazil Pharma S.A.* | | | 20,000 | | | | 117,231 | | | | 2.14 | |
| | | | | | | | | | | | | |
COMMON STOCKS (continued) | | | | | | | | | |
| Education Services | | | | | | | | | | | | |
| Anhanguera Educacional Participacoes S.A. | | | 7,500 | | | $ | 90,389 | | | | 1.65 | % |
| New Oriental Education & Technology Group, Inc. Spon. ADR* | | | 3,040 | | | | 83,478 | | | | 1.53 | |
| | | | | | | | 173,867 | | | | 3.18 | |
| Fertilizers & Agricultural Chemicals | | | | | | | | | |
| Sociedad Quimica y Minera de Chile S.A. ADR | | | 1,744 | | | | 102,320 | | | | 1.87 | |
| | | | | | | | | | | | | |
| Food Retail | | | | | | | | | | | | |
| Magnit OJSC Spon. GDR - 144A | | | 3,705 | | | | 107,964 | | | | 1.97 | |
| | | | | | | | | | | | | |
| Health Care Equipment | | | | | | | | | | | | |
| Biosensors International Group Ltd.* | | | 93,000 | | | | 111,344 | | | | 2.04 | |
| | | | | | | | | | | | | |
| Hotels, Resorts & Cruise Lines | | | | | | | | | |
| Home Inns & Hotels Management, Inc. ADR* | | | 2,526 | | | | 64,438 | | | | 1.18 | |
| Shangri-La Asia Ltd. | | | 24,833 | | | | 54,172 | | | | 0.99 | |
| | | | | | | | 118,610 | | | | 2.17 | |
| Industrial Conglomerates | | | | | | | | | | | | |
| Alliance Global Group, Inc. | | | 202,400 | | | | 59,398 | | | | 1.09 | |
| | | | | | | | | | | | | |
| Industrial Machinery | | | | | | | | | | | | |
| Airtac International Group | | | 19,000 | | | | 98,816 | | | | 1.81 | |
| | | | | | | | | | | | | |
| Integrated Telecommunication Services | | | | | |
| China Unicom Hong Kong Ltd. | | | 38,000 | | | | 64,104 | | | | 1.17 | |
| | | | | | | | | | | | | |
| Internet Retail | | | | | | | | | | | | |
| MakeMyTrip Ltd.* | | | 2,055 | | | | 47,203 | | | | 0.86 | |
| Vipshop Holdings Ltd. Spon. ADR | | | 4,680 | | | | 20,545 | | | | 0.38 | |
| | | | | | | | 67,748 | | | | 1.24 | |
| Internet Software & Services | | | | | | | | | |
| Baidu, Inc. Spon. ADR* | | | 815 | | | | 118,803 | | | | 2.17 | |
| MercadoLibre, Inc. | | | 579 | | | | 56,620 | | | | 1.03 | |
| PChome Online, Inc. | | | 4,000 | | | | 22,565 | | | | 0.41 | |
| Yandex N.V. - Cl. A* | | | 2,372 | | | | 63,736 | | | | 1.17 | |
| Youku.com, Inc. Spon. ADR* | | | 1,296 | | | | 28,499 | | | | 0.52 | |
| | | | | | | | 290,223 | | | | 5.30 | |
| IT Consulting & Other Services | | | | | | | | | |
| Infosys Ltd. ADR | | | 909 | | | | 51,840 | | | | 0.95 | |
| | | | | | | | | | | | | |
| Managed Health Care | | | | | | | | | | | | |
| Odontoprev S.A. | | | 3,000 | | | | 50,946 | | | | 0.93 | |
| | | | | | | | | | | | | |
| Office REITs | | | | | | | | | | | | |
| Ascendas India Trust | | | 171,000 | | | | 112,907 | | | | 2.06 | |
| | | | | | | | | | | | | |
| Oil & Gas Exploration & Production | | | | | | | | | |
| Chariot Oil & Gas Ltd.* | | | 9,314 | | | | 29,498 | | | | 0.54 | |
| CNOOC Ltd. | | | 47,000 | | | | 96,596 | | | | 1.76 | |
| NovaTek OAO - Spon. GDR - 144A | | | 771 | | | | 104,470 | | | | 1.91 | |
| OGX Petróleo e Gás Participações S.A.* | | | 7,500 | | | | 62,039 | | | | 1.13 | |
| Pacific Rubiales Energy Corp. | | | 3,588 | | | | 104,822 | | | | 1.92 | |
| | | | | | | | 397,425 | | | | 7.26 | |
| | See notes to financial statements. |
| | | Number of Shares | | | Value | | | Percent of Net Assets | |
COMMON STOCKS (continued) | | | | | | | | | |
| Pharmaceuticals | | | | | | | | | | | | |
| Celltrion, Inc. | | | 2,467 | | | $ | 80,452 | | | | 1.47 | % |
| Genomma Lab Internacional S.A.B. de C.V. - Cl. B* | | | 54,600 | | | | 99,864 | | | | 1.83 | |
| | | | | | | | 180,316 | | | | 3.30 | |
| Precious Metals & Minerals | | | | | | | | | |
| African Minerals Ltd.* | | | 9,697 | | | | 85,927 | | | | 1.57 | |
| | | | | | | | | | | | | |
| Real Estate Operating Companies | | | | | | | | | |
| BR Malls Participacoes S.A. | | | 6,100 | | | | 79,498 | | | | 1.45 | |
| | | | | | | | | | | | | |
| Research & Consulting Services | | | | | | | | | |
| Qualicorp S.A.* | | | 5,800 | | | | 49,725 | | | | 0.91 | |
| | | | | | | | | | | | | |
| Semiconductors | | | | | | | | | | | | |
| Hynix Semiconductor, Inc.* | | | 2,030 | | | | 52,405 | | | | 0.96 | |
| Samsung Electronics Co., Ltd. | | | 98 | | | | 110,277 | | | | 2.02 | |
| Taiwan Semiconductor Manufacturing Co., Ltd. Spon. ADR | | | 7,178 | | | | 109,680 | | | | 2.00 | |
| | | | | | | | 272,362 | | | | 4.98 | |
| Systems Software | | | | | | | | | | | | |
| Totvs S.A. | | | 5,965 | | | | 110,121 | | | | 2.01 | |
| | | | | | | | | | | | | |
| Wireless Telecommunication Services | | | | | |
| Millicom International Cellular S.A. | | | 1,037 | | | | 117,559 | | | | 2.15 | |
| MTN Group Ltd. | | | 5,830 | | | | 102,616 | | | | 1.87 | |
| | | | | | | | 220,175 | | | | 4.02 | |
| TOTAL COMMON STOCKS | | | | | | | | | | | | |
| (Cost $4,610,869) | | | | | | | 4,975,480 | | | | 90.95 | |
| | | | | | | | | | | | | |
| SHORT-TERM INVESTMENTS | | | | | | | | | |
| State Street Institutional Treasury Money Market Fund, 0.000% | | | 475,523 | | | | 475,523 | | | | 8.69 | |
| | | | | | | | | | | | | |
| TOTAL SHORT-TERM INVESTMENTS | | | | | | | | | |
| (Cost $475,523) | | | | | | | 475,523 | | | | 8.69 | |
| | | | | | | | | | | | | |
| TOTAL INVESTMENTS | | | | | | | | | | | | |
| (Cost $5,086,392) | | | | | | | 5,451,003 | | | | 99.64 | |
| | | | | | | | | | | | | |
| Cash and Other Assets, Less Liabilities | | | | | | | 19,492 | | | | 0.36 | |
| | | | | | | | | | | | | |
| NET ASSETS | | | | | | $ | 5,470,495 | | | | 100.00 | % |
| SUMMARY OF INVESTMENTS BY COUNTRY | |
| Country | | Market Value | | | Percent of Investment Securities | |
| Argentina | | $ | 56,620 | | | | 1.04 | % |
| Brazil | | | 765,389 | | | | 14.04 | |
| Chile | | | 341,607 | | | | 6.27 | |
| China/Hong Kong | | | 1,264,638 | | | | 23.20 | |
| Colombia | | | 104,822 | | | | 1.92 | |
| India | | | 268,963 | | | | 4.93 | |
| Indonesia | | | 107,666 | | | | 1.97 | |
| Luxembourg | | | 117,559 | | | | 2.16 | |
| Malaysia | | | 104,725 | | | | 1.92 | |
| Mexico | | | 99,864 | | | | 1.83 | |
| Namibia | | | 29,498 | | | | 0.54 | |
| Peru | | | 57,078 | | | | 1.05 | |
| Philippines | | | 59,398 | | | | 1.09 | |
| Russia | | | 381,362 | | | | 7.00 | |
| Sierra Leone | | | 85,927 | | | | 1.58 | |
| Singapore | | | 111,344 | | | | 2.04 | |
| South Africa | | | 272,410 | | | | 5.00 | |
| South Korea | | | 466,296 | | | | 8.55 | |
| Taiwan | | | 132,245 | | | | 2.43 | |
United States(1) | | | 623,592 | | | | 11.44 | |
| | | $ | 5,451,003 | | | | 100.00 | % |
| (1) | Includes short-term securities. |
| | See notes to financial statements. |
STATEMENTS OF ASSETS AND LIABILITIES
March 31, 2012 (Unaudited)
| (Amounts in thousands) | | MARSICO FOCUS FUND | | | MARSICO GROWTH FUND | |
| | | | | | | |
| ASSETS | | | | | | |
| Investments, at value (cost $773,168, $537,093, $330,252, $122,221, $429,757, $33,155, and $5,086, respectively) | | $ | 1,091,948 | | | $ | 770,254 | |
| Cash | | | — | | | | — | |
| Foreign currency (cost $0, $0, $0, $39, $0, $0, and $4, respectively) | | | — | | | | — | |
| Receivable for investments sold | | | 33,275 | | | | 1,700 | |
| Receivable for capital stock sold | | | 473 | | | | 213 | |
| Interest and dividends receivable | | | 997 | | | | 726 | |
| Prepaid expenses and other assets | | | 775 | | | | 524 | |
| Total Assets | | | 1,127,468 | | | | 773,417 | |
| | | | | | | | | |
| LIABILITIES | | | | | | | | |
| Payable for investments purchased | | | 6,225 | | | | 3,354 | |
| Payable for capital stock redeemed | | | 915 | | | | 1,585 | |
| Payable to investment adviser | | | 796 | | | | 542 | |
| Accrued transfer agent fees and expenses | | | 174 | | | | 126 | |
| Accrued trustees' fees | | | 778 | | | | 508 | |
| Accrued printing expenses | | | 113 | | | | 70 | |
| Accrued distribution fee | | | 1,443 | | | | 903 | |
| Accrued professional fees | | | 56 | | | | 39 | |
| Accrued custody and fund accounting fees | | | 7 | | | | 5 | |
| Accrued expenses and other liabilities | | | 29 | | | | 22 | |
| Total Liabilities | | | 10,536 | | | | 7,154 | |
| | | | | | | | | |
| NET ASSETS | | $ | 1,116,932 | | | $ | 766,263 | |
| | | | | | | | | |
| NET ASSETS CONSIST OF | | | | | | | | |
| Paid-in-capital | | $ | 774,850 | | | $ | 562,018 | |
| Undistributed net investment income (accumulated net investment loss) | | | 399 | | | | 289 | |
| Accumulated net realized gain (loss) on investments, foreign currency transactions and forward foreign currency contracts | | | 22,729 | | | | (29,317 | ) |
| Net unrealized appreciation on investments and foreign currency translations | | | 318,954 | | | | 233,273 | |
| NET ASSETS | | $ | 1,116,932 | | | $ | 766,263 | |
| | | | | | | | | |
SHARES OUTSTANDING, $0.001 par value (Unlimited shares authorized) | | | 54,551 | | | | 34,477 | |
| | | | | | | | | |
NET ASSET VALUE, REDEMPTION PRICE, AND OFFERING PRICE PER SHARE (NET ASSETS/SHARES OUTSTANDING)* | | $ | 20.47 | | | $ | 22.23 | |
| * | Not in thousands, based on unrounded net assets and shares outstanding. |
| | See notes to financial statements. |
MARSICO 21st CENTURY FUND | | | MARSICO INTERNATIONAL OPPORTUNITIES FUND | | | MARSICO FLEXIBLE CAPITAL FUND | | | MARSICO GLOBAL FUND | | | MARSICO EMERGING MARKETS FUND | |
| | | | | | | | | | | | | | |
| | | | | | | | | | | | | | |
| $ | 449,733 | | | $ | 151,319 | | | $ | 513,651 | | | $ | 50,990 | | | $ | 5,451 | |
| | — | | | | 16 | | | | — | | | | — | | | | 27 | |
| | — | | | | 38 | | | | — | | | | — | | | | 4 | |
| | 8,269 | | | | 117 | | | | — | | | | 3,828 | | | | 42 | |
| | 23 | | | | 25 | | | | 917 | | | | — | | | | — | |
| | 257 | | | | 367 | | | | 1,387 | | | | 82 | | | | 10 | |
| | 495 | | | | 352 | | | | 756 | | | | 422 | | | | 95 | |
| | 458,777 | | | | 152,234 | | | | 516,711 | | | | 55,322 | | | | 5,629 | |
| | | | | | | | | | | | | | | | | | | |
| | | | | | | | | | | | | | | | | | | |
| | — | | | | 475 | | | | — | | | | 1,182 | | | | 55 | |
| | 639 | | | | 82 | | | | 1,677 | | | | 9 | | | | — | |
| | 331 | | | | 103 | | | | 361 | | | | 3 | | | | 3 | |
| | 89 | | | | 47 | | | | 86 | | | | 21 | | | | 4 | |
| | 483 | | | | 338 | | | | 721 | | | | 410 | | | | 80 | |
| | 44 | | | | 14 | | | | 36 | | | | 13 | | | | 1 | |
| | 456 | | | | 121 | | | | 237 | | | | 86 | | | | 4 | |
| | 30 | | | | 11 | | | | 22 | | | | 6 | | | | — | |
| | 13 | | | | 14 | | | | 15 | | | | 10 | | | | 11 | |
| | 40 | | | | 14 | | | | 10 | | | | 9 | | | | 1 | |
| | 2,125 | | | | 1,219 | | | | 3,165 | | | | 1,749 | | | | 159 | |
| | | | | | | | | | | | | | | | | | | |
| $ | 456,652 | | | $ | 151,015 | | | $ | 513,546 | | | $ | 53,573 | | | $ | 5,470 | |
| | | | | | | | | | | | | | | | | | | |
| | | | | | | | | | | | | | | | | | | |
| $ | 944,201 | | | $ | 262,127 | | | $ | 438,659 | | | $ | 43,106 | | | $ | 6,920 | |
| | (1,134 | ) | | | (1,435 | ) | | | (705 | ) | | | (255 | ) | | | 4 | |
| | (605,973 | ) | | | (138,785 | ) | | | (8,530 | ) | | | (7,221 | ) | | | (1,814 | ) |
| | 119,558 | | | | 29,108 | | | | 84,122 | | | | 17,943 | | | | 360 | |
| $ | 456,652 | | | $ | 151,015 | | | $ | 513,546 | | | $ | 53,573 | | | $ | 5,470 | |
| | | | | | | | | | | | | | | | | | | |
| | 31,223 | | | | 11,681 | | | | 34,092 | | | | 4,554 | | | | 653 | |
| | | | | | | | | | | | | | | | | | | |
| $ | 14.63 | | | $ | 12.93 | | | $ | 15.06 | | | $ | 11.76 | | | $ | 8.38 | |
FINANCIAL STATEMENTS
STATEMENTS OF OPERATIONS
FOR THE SIX-MONTHS ENDED March 31, 2012 (Unaudited)
| (Amounts in thousands) | | MARSICO FOCUS FUND | | | MARSICO GROWTH FUND | |
| | | | | | | |
| INVESTMENT INCOME | | | | | | |
| Dividends (net of $0, $0, $6, $84, $147, $16, and $2, respectively of non-reclaimable foreign withholding taxes) | | $ | 8,691 | | | $ | 5,879 | |
| Interest | | | — | | | | — | |
| Total Investment Income | | | 8,691 | | | | 5,879 | |
| | | | | | | | | |
| EXPENSES | | | | | | | | |
| Investment advisory fees | | | 4,432 | | | | 3,037 | |
| Distribution fees | | | 1,303 | | | | 893 | |
| Transfer agent fees and expenses | | | 644 | | | | 425 | |
| Trustees' fees and expenses | | | 221 | (1) | | | 144 | (1) |
| Professional fees | | | 123 | | | | 85 | |
| Printing and postage expenses | | | 122 | | | | 86 | |
| Fund administration fees | | | 100 | | | | 91 | |
| Custody and fund accounting fees | | | 94 | | | | 82 | |
| Miscellaneous | | | 57 | | | | 42 | |
| Federal and state registration fees | | | 20 | | | | 25 | |
| Total Expenses | | | 7,116 | | | | 4,910 | |
| Less waiver of expenses and expenses paid indirectly | | | (1 | ) | | | — | |
| Net Expenses | | | 7,115 | | | | 4,910 | |
| | | | | | | | | |
| NET INVESTMENT INCOME (LOSS) | | | 1,576 | | | | 969 | |
| | | | | | | | | |
| REALIZED AND UNREALIZED GAIN (LOSS) | | | | | | | | |
| Net realized gain (loss) on investments | | | 61,021 | | | | 35,952 | |
| Net realized gain (loss) on foreign currency transactions and forward foreign currency contracts | | | (501 | ) | | | (18 | ) |
| Change in unrealized appreciation (depreciation) on investments and foreign currency translations | | | 193,849 | | | | 137,171 | |
| Change in unrealized appreciation (depreciation) on forward foreign currency contracts | | | — | | | | — | |
| | | | | | | | | |
| Net Gain on Investments | | | 254,369 | | | | 173,105 | |
| | | | | | | | | |
NET INCREASE IN NET ASSETS RESULTING FROM OPERATIONS | | $ | 255,945 | | | $ | 174,074 | |
| (1) | Amounts include trustees’ fees and expenses and the mark to market unrealized appreciation during the period for shares held in the Trustees’ Deferred Plan, as more fully described in Note 2(g) in the Notes to Financial Statements. |
| | | Trustees’ Fees and Expenses* | | | | |
| Focus Fund | | $ | 81,605 | | | $ | 139,551 | |
| Growth Fund | | | 55,776 | | | | 87,958 | |
21st Century Fund | | | 37,530 | | | | 87,579 | |
| International Opportunities Fund | | | 11,645 | | | | 46,472 | |
| Flexible Capital Fund | | | 34,991 | | | | 123,360 | |
| Global Fund | | | 10,774 | | | | 75,155 | |
| Emerging Markets Fund | | | 354 | | | | 8,316 | |
| | See notes to financial statements. |
MARSICO 21st CENTURY FUND | | | MARSICO INTERNATIONAL OPPORTUNITIES FUND | | | MARSICO FLEXIBLE CAPITAL FUND | | | MARSICO GLOBAL FUND | | | MARSICO EMERGING MARKETS FUND | |
| | | | | | | | | | | | | | |
| | | | | | | | | | | | | | |
| $ | 2,888 | | | $ | 1,135 | | | $ | 2,531 | | | $ | 594 | | | $ | 36 | |
| | — | | | | — | | | | 1,125 | | | | — | | | | — | |
| | 2,888 | | | | 1,135 | | | | 3,656 | | | | 594 | | | | 36 | |
| | | | | | | | | | | | | | | | | | | |
| | | | | | | | | | | | | | | | | | | |
| | 2,064 | | | | 667 | | | | 1,899 | | | | 383 | | | | 25 | |
| | 607 | | | | 196 | | | | 558 | | | | 113 | | | | 6 | |
| | 370 | | | | 142 | | | | 331 | | | | 67 | | | | 10 | |
| | 125 | (1) | | | 58 | (1) | | | 158 | (1) | | | 86 | (1) | | | 9 | (1) |
| | 57 | | | | 18 | | | | 52 | | | | 13 | | | | — | |
| | 59 | | | | 18 | | | | 55 | | | | 13 | | | | — | |
| | 79 | | | | 62 | | | | 77 | | | | 47 | | | | 26 | |
| | 69 | | | | 111 | | | | 87 | | | | 52 | | | | 62 | |
| | 30 | | | | 18 | | | | 21 | | | | 10 | | | | 3 | |
| | 14 | | | | 11 | | | | 46 | | | | 8 | | | | 9 | |
| | 3,474 | | | | 1,301 | | | | 3,284 | | | | 792 | | | | 150 | |
| | — | | | | (45 | ) | | | — | | | | (71 | ) | | | (106 | ) |
| | 3,474 | | | | 1,256 | | | | 3,284 | | | | 721 | | | | 44 | |
| | | | | | | | | | | | | | | | | | | |
| | (586 | ) | | | (121 | ) | | | 372 | | | | (127 | ) | | | (8 | ) |
| | | | | | | | | | | | | | | | | | | |
| | | | | | | | | | | | | | | | | | | |
| | (3,468 | ) | | | 2,508 | | | | 18,709 | | | | 9,557 | | | | (255 | ) |
| | (71 | ) | | | (1,303 | ) | | | (1,460 | ) | | | 607 | | | | (118 | ) |
| | 126,591 | | | | 29,111 | | | | 82,891 | | | | 10,659 | | | | 1,208 | |
| | — | | | | 573 | | | | — | | | | — | | | | — | |
| | | | | | | | | | | | | | | | | | | |
| | 123,052 | | | | 30,889 | | | | 100,140 | | | | 20,823 | | | | 835 | |
| | | | | | | | | | | | | | | | | | | |
| $ | 122,466 | | | $ | 30,768 | | | $ | 100,512 | | | $ | 20,696 | | | $ | 827 | |
STATEMENTS OF CHANGES IN NET ASSETS
| | | MARSICO FOCUS FUND | | | MARSICO GROWTH FUND | | | MARSICO 21st CENTURY FUND | |
| | | | | | | | | | | | | | | | | | | |
| (Amounts in thousands) | | Six-Months Ended 3/31/12 (Unaudited) | | | Year Ended 9/30/11 | | | Six-Months Ended 3/31/12 (Unaudited) | | | Year Ended 9/30/11 | | | Six-Months Ended 3/31/12 (Unaudited) | | | Year Ended 9/30/11 | |
| | | | | | | | | | | | | | | | | | | |
| OPERATIONS: | | | | | | | | | | | | | | | | | | |
| Net investment income (loss) | | $ | 1,576 | | | $ | (537 | ) | | $ | 969 | | | $ | 252 | | | $ | (586 | ) | | $ | (2,365 | ) |
| Net realized gain (loss) on investments | | | 61,021 | | | | 255,864 | | | | 35,952 | | | | 177,608 | | | | (3,468 | ) | | | 103,526 | |
| Net realized gain on written option contracts | | | — | | | | — | | | | — | | | | — | | | | — | | | | — | |
| Net realized gain (loss) on foreign currency transactions and forward foreign currency contracts | | | (501 | ) | | | 1 | | | | (18 | ) | | | 2 | | | | (71 | ) | | | 1,073 | |
| Change in unrealized appreciation (depreciation) on investments and foreign currency translations | | | 193,849 | | | | (196,092 | ) | | | 137,171 | | | | (122,967 | ) | | | 126,591 | | | | (122,551 | ) |
| Change in unrealized appreciation (depreciation) on forward foreign currency contracts | | | — | | | | — | | | | — | | | | — | | | | — | | | | — | |
| | | | | | | | | | | | | | | | | | | | | | | | | |
| Net increase (decrease) in net assets resulting from operations | | | 255,945 | | | | 59,236 | | | | 174,074 | | | | 54,895 | | | | 122,466 | | | | (20,317 | ) |
| | | | | | | | | | | | | | | | | | | | | | | | | |
| DISTRIBUTIONS: | | | | | | | | | | | | | | | | | | | | | | | | |
| Net investment income | | | — | | | | — | | | | (291 | ) | | | (473 | ) | | | — | | | | — | |
| Net realized gains | | | — | | | | — | | | | — | | | | — | | | | — | | | | — | |
| Total distributions | | | — | | | | — | | | | (291 | ) | | | (473 | ) | | | — | | | | — | |
| | | | | | | | | | | | | | | | | | | | | | | | | |
| CAPITAL SHARE TRANSACTIONS: | | | | | | | | | | | | | | | | | | | | | | | | |
| Proceeds from sale of shares | | | 78,903 | | | | 189,852 | | | | 69,637 | | | | 259,237 | | | | 8,626 | | | | 75,136 | |
| Proceeds from reinvestment of distributions | | | — | | | | — | | | | 283 | | | | 459 | | | | — | | | | — | |
| Redemption fees | | | 3 | | | | 20 | | | | 26 | | | | 126 | | | | 4 | | | | 7 | |
| Redemption of shares | | | (154,301 | ) | | | (764,603 | ) | | | (144,391 | ) | | | (530,372 | ) | | | (169,926 | ) | | | (316,782 | ) |
| | | | | | | | | | | | | | | | | | | | | | | | | |
| Net increase (decrease) from capital share transactions | | | (75,395 | ) | | | (574,731 | ) | | | (74,445 | ) | | | (270,550 | ) | | | (161,296 | ) | | | (241,639 | ) |
| | | | | | | | | | | | | | | | | | | | | | | | | |
| TOTAL INCREASE (DECREASE) IN NET ASSETS | | | 180,550 | | | | (515,495 | ) | | | 99,338 | | | | (216,128 | ) | | | (38,830 | ) | | | (261,956 | ) |
| | | | | | | | | | | | | | | | | | | | | | | | | |
| NET ASSETS: | | | | | | | | | | | | | | | | | | | | | | | | |
| Beginning of Period | | | 936,382 | | | | 1,451,877 | | | | 666,925 | | | | 883,053 | | | | 495,482 | | | | 757,438 | |
| | | | | | | | | | | | | | | | | | | | | | | | | |
| End of Period | | $ | 1,116,932 | | | $ | 936,382 | | | $ | 766,263 | | | $ | 666,925 | | | $ | 456,652 | | | $ | 495,482 | |
| | | | | | | | | | | | | | | | | | | | | | | | | |
| Undistributed net investment income (Accumulated net investment loss) | | $ | 399 | | | $ | (1,177 | ) | | $ | 289 | | | $ | (389 | ) | | $ | (1,134 | ) | | $ | (549 | ) |
| | | | | | | | | | | | | | | | | | | | | | | | | |
| TRANSACTIONS IN SHARES: | | | | | | | | | | | | | | | | | | | | | | | | |
| Shares sold | | | 4,309 | | | | 10,628 | | | | 3,481 | | | | 13,436 | | | | 666 | | | | 5,255 | |
| Shares issued in reinvestment of distributions | | | — | | | | — | | | | 15 | | | | 24 | | | | — | | | | — | |
| Shares redeemed | | | (8,389 | ) | | | (43,949 | ) | | | (7,278 | ) | | | (27,027 | ) | | | (13,047 | ) | | | (22,839 | ) |
| | | | | | | | | | | | | | | | | | | | | | | | | |
| NET INCREASE (DECREASE) | | | (4,080 | ) | | | (33,321 | ) | | | (3,782 | ) | | | (13,567 | ) | | | (12,381 | ) | | | (17,584 | ) |
| (1) | Commencement of operations. |
| | See notes to financial statements. |
MARSICO INTERNATIONAL OPPORTUNITIES FUND | | | MARSICO FLEXIBLE CAPITAL FUND | | | MARSICO GLOBAL FUND | | | MARSICO EMERGING MARKETS FUND | |
| | | | | | | | | | | | | | | | | | | | | | | |
Six-Months Ended 3/31/12 (Unaudited) | | | Year Ended 9/30/11 | | | Six-Months Ended 3/31/12 (Unaudited) | | | Year Ended 9/30/11 | | | Six-Months Ended 3/31/12 (Unaudited) | | | Year Ended 9/30/11 | | | Six-Months Ended 3/31/12 (Unaudited) | | | 12/31/2010(1) to 9/30/2011 | |
| | | | | | | | | | | | | | | | | | | | | | | |
| | | | | | | | | | | | | | | | | | | | | | | |
| $ | (121 | ) | | $ | (620 | ) | | $ | 372 | | | $ | 2,669 | | | $ | (127 | ) | | $ | (601 | ) | | $ | (8 | ) | | $ | 8 | |
| | 2,508 | | | | 50,008 | | | | 18,709 | | | | (24,643 | ) | | | 9,557 | | | | 8,558 | | | | (255 | ) | | | (1,378 | ) |
| | — | | | | — | | | | — | | | | 394 | | | | — | | | | — | | | | — | | | | — | |
| | (1,303 | ) | | | 12,543 | | | | (1,460 | ) | | | 263 | | | | 607 | | | | 750 | | | | (118 | ) | | | (79 | ) |
| | 29,111 | | | | (75,336 | ) | | | 82,891 | | | | (15,219 | ) | | | 10,659 | | | | (17,624 | ) | | | 1,208 | | | | (848 | ) |
| | 573 | | | | (573 | ) | | | — | | | | — | | | | — | | | | — | | | | — | | | | — | |
| | | | | | | | | | | | | | | | | | | | | | | | | | | | | | | |
| | 30,768 | | | | (13,978 | ) | | | 100,512 | | | | (36,536 | ) | | | 20,696 | | | | (8,917 | ) | | | 827 | | | | (2,297 | ) |
| | | | | | | | | | | | | | | | | | | | | | | | | | | | | | | |
| | | | | | | | | | | | | | | | | | | | | | | | | | | | | | | |
| | — | | | | (6,560 | ) | | | (1,878 | ) | | | (2,289 | ) | | | — | | | | (1,099 | ) | | | — | | | | — | |
| | — | | | | — | | | | — | | | | (677 | ) | | | — | | | | — | | | | — | | | | — | |
| | — | | | | (6,560 | ) | | | (1,878 | ) | | | (2,966 | ) | | | — | | | | (1,099 | ) | | | — | | | | — | |
| | | | | | | | | | | | | | | | | | | | | | | | | | | | | | | |
| | | | | | | | | | | | | | | | | | | | | | | | | | | | | | | |
| | 7,608 | | | | 52,453 | | | | 122,987 | | | | 681,461 | | | | 7,370 | | | | 45,443 | | | | 384 | | | | 11,380 | |
| | — | | | | 6,365 | | | | 1,728 | | | | 2,776 | | | | — | | | | 1,044 | | | | — | | | | — | |
| | 1 | | | | 16 | | | | 20 | | | | 100 | | | | 11 | | | | 11 | | | | — | | | | — | |
| | (41,217 | ) | | | (243,457 | ) | | | (118,968 | ) | | | (368,035 | ) | | | (82,525 | ) | | | (44,562 | ) | | | (377 | ) | | | (4,447 | ) |
| | | | | | | | | | | | | | | | | | | | | | | | | | | | | | | |
| | (33,608 | ) | | | (184,623 | ) | | | 5,767 | | | | 316,302 | | | | (75,144 | ) | | | 1,936 | | | | 7 | | | | 6,933 | |
| | | | | | | | | | | | | | | | | | | | | | | | | | | | | | | |
| | (2,840 | ) | | | (205,161 | ) | | | 104,401 | | | | 276,800 | | | | (54,448 | ) | | | (8,080 | ) | | | 834 | | | | 4,636 | |
| | | | | | | | | | | | | | | | | | | | | | | | | | | | | | | |
| | | | | | | | | | | | | | | | | | | | | | | | | | | | | | | |
| | 153,855 | | | | 359,016 | | | | 409,145 | | | | 132,345 | | | | 108,021 | | | | 116,101 | | | | 4,636 | | | | — | |
| | | | | | | | | | | | | | | | | | | | | | | | | | | | | | | |
| $ | 151,015 | | | $ | 153,855 | | | $ | 513,546 | | | $ | 409,145 | | | $ | 53,573 | | | $ | 108,021 | | | $ | 5,470 | | | $ | 4,636 | |
| | | | | | | | | | | | | | | | | | | | | | | | | | | | | | | |
| $ | (1,435 | ) | | $ | (1,314 | ) | | $ | (705 | ) | | $ | 801 | | | $ | (255 | ) | | $ | (128 | ) | | $ | 4 | | | $ | 12 | |
| | | | | | | | | | | | | | | | | | | | | | | | | | | | | | | |
| | | | | | | | | | | | | | | | | | | | | | | | | | | | | | | |
| | 628 | | | | 3,983 | | | | 8,945 | | | | 50,035 | | | | 744 | | | | 4,175 | | | | 47 | | | | 1,148 | |
| | — | | | | 488 | | | | 136 | | | | 207 | | | | — | | | | 96 | | | | — | | | | — | |
| | (3,453 | ) | | | (18,537 | ) | | | (8,950 | ) | | | (27,335 | ) | | | (8,118 | ) | | | (4,071 | ) | | | (47 | ) | | | (495 | ) |
| | | | | | | | | | | | | | | | | | | | | | | | | | | | | | | |
| | (2,825 | ) | | | (14,066 | ) | | | 131 | | | | 22,907 | | | | (7,374 | ) | | | 200 | | | | — | | | | 653 | |
| | | MARSICO FOCUS FUND | |
For a Fund Share Outstanding Throughout the Period | | Six-Months Ended 3/31/12 (Unaudited) | | | Year Ended 9/30/11 | | | Year Ended 9/30/10 | | | Year Ended 9/30/09 | | | Year Ended 9/30/08 | | | Year Ended 9/30/07 | |
| | | | | | | | | | | | | | | | | | | |
| Net Asset Value, Beginning of Period | | $ | 15.97 | | | $ | 15.79 | | | $ | 14.38 | | | $ | 15.43 | | | $ | 21.75 | | | $ | 18.19 | |
| | | | | | | | | | | | | | | | | | | | | | | | | |
| | | | | | | | | | | | | | | | | | | | | | | | | |
| Income from Investment Operations: | | | | | | | | | | | | | | | | | | | | | | | | |
| Net investment income (loss) | | | 0.03 | | | | (0.02 | ) | | | (0.01 | ) | | | 0.04 | | | | 0.08 | | | | (0.04 | ) |
| Net realized and unrealized gains (losses) on investments | | | 4.47 | | | | 0.20 | | | | 1.45 | | | | (0.99 | ) | | | (4.60 | ) | | | 4.09 | |
| | | | | | | | | | | | | | | | | | | | | | | | | |
| Total from investment operations | | | 4.50 | | | | 0.18 | | | | 1.44 | | | | (0.95 | ) | | | (4.52 | ) | | | 4.05 | |
| | | | | | | | | | | | | | | | | | | | | | | | | |
| Distributions & Other: | | | | | | | | | | | | | | | | | | | | | | | | |
| Net investment income | | | — | | | | — | | | | (0.03 | ) | | | (0.09 | ) | | | — | | | | (0.02 | ) |
| Tax return of capital | | | — | | | | — | | | | — | | | | — | | | | — | | | | — | |
| Net realized gains | | | — | | | | — | | | | — | | | | (0.01 | ) | | | (1.80 | ) | | | (0.47 | ) |
| Redemption fees [See Note 2(h)] | | | — | (1) | | | — | (1) | | | — | (1) | | | — | (1) | | | — | (1) | | | — | (1) |
| | | | | | | | | | | | | | | | | | | | | | | | | |
| Total distributions and other | | | — | | | | — | | | | (0.03 | ) | | | (0.10 | ) | | | (1.80 | ) | | | (0.49 | ) |
| | | | | | | | | | | | | | | | | | | | | | | | | |
| Net Asset Value, End of Period | | $ | 20.47 | | | $ | 15.97 | | | $ | 15.79 | | | $ | 14.38 | | | $ | 15.43 | | | $ | 21.75 | |
| | | | | | | | | | | | | | | | | | | | | | | | | |
| | | | | | | | | | | | | | | | | | | | | | | | | |
| Total Return | | | 28.18 | %(2) | | | 1.14 | % | | | 10.02 | % | | | (5.98 | )% | | | (22.69 | )% | | | 22.65 | % |
| | | | | | | | | | | | | | | | | | | | | | | | | |
| | | | | | | | | | | | | | | | | | | | | | | | | |
| Supplemental Data and Ratios: | | | | | | | | | | | | | | | | | | | | | | | | |
| | | | | | | | | | | | | | | | | | | | | | | | | |
| Net assets, end of Period (000s) | | $ | 1,116,932 | | | $ | 936,382 | | | $ | 1,451,877 | | | $ | 2,001,041 | | | $ | 3,430,813 | | | $ | 5,051,662 | |
| | | | | | | | | | | | | | | | | | | | | | | | | |
| Ratio of expenses to average net assets, less waivers and before expenses paid indirectly, plus reimbursements of previously waived expenses | | | 1.36 | %(3) | | | 1.33 | % | | | 1.33 | % | | | 1.31 | % | | | 1.21 | % | | | 1.23 | % |
| | | | | | | | | | | | | | | | | | | | | | | | | |
| Ratio of net investment income (loss) to average net assets, net of waivers, reimbursements of previously waived expenses and expenses paid indirectly | | | 0.30 | %(3) | | | (0.04 | )% | | | (0.06 | )% | | | 0.27 | % | | | 0.41 | % | | | (0.20 | )% |
| | | | | | | | | | | | | | | | | | | | | | | | | |
| Ratio of expenses to average net assets, before waivers, reimbursements of previously waived expenses and expenses paid indirectly | | | 1.36 | %(3) | | | 1.33 | % | | | 1.33 | % | | | 1.31 | % | | | 1.21 | % | | | 1.23 | % |
| | | | | | | | | | | | | | | | | | | | | | | | | |
| Ratio of net investment income (loss) to average net assets, before waivers, reimbursements of previously waived expenses and expenses paid indirectly | | | 0.30 | %(3) | | | (0.04 | )% | | | (0.06 | )% | | | 0.27 | % | | | 0.41 | % | | | (0.21 | )% |
| | | | | | | | | | | | | | | | | | | | | | | | | |
| Portfolio turnover rate | | | 37 | %(2) | | | 82 | % | | | 85 | % | | | 90 | % | | | 78 | % | | | 69 | % |
| (4) | Portfolio turnover is greater than most funds due to the investment style of the Fund. |
| | See notes to financial statements. |
MARSICO GROWTH FUND | | | MARSICO 21st CENTURY FUND | |
Six-Months Ended 3/31/12 (Unaudited) | | | Year Ended 9/30/11 | | | Year Ended 9/30/10 | | | Year Ended 9/30/09 | | | Year Ended 9/30/08 | | | Year Ended 9/30/07 | | | Six-Months Ended 3/31/12 (Unaudited) | | | Year Ended 9/30/11 | | | Year Ended 9/30/10 | | | Year Ended 9/30/09 | | | Year Ended 9/30/08 | | | Year Ended 9/30/07 | |
| | | | | | | | | | | | | | | | | | | | | | | | | | | | | | | | | | | |
| $ | 17.43 | | | $ | 17.04 | | | $ | 15.32 | | | $ | 16.73 | | | $ | 23.07 | | | $ | 18.61 | | | $ | 11.36 | | | $ | 12.38 | | | $ | 11.56 | | | $ | 12.86 | | | $ | 18.07 | | | $ | 13.89 | |
| | | | | | | | | | | | | | | | | | | | | | | | | | | | | | | | | | | | | | | | | | | | | | | |
| | | | | | | | | | | | | | | | | | | | | | | | | | | | | | | | | | | | | | | | | | | | | | | |
| | | | | | | | | | | | | | | | | | | | | | | | | | | | | | | | | | | | | | | | | | | | | | | |
| | 0.03 | | | | — | (1) | | | 0.01 | | | | 0.07 | | | | 0.07 | | | | (0.05 | ) | | | (0.02 | ) | | | (0.06 | ) | | | (0.08 | ) | | | — | (1) | | | 0.01 | | | | 0.05 | |
| | 4.78 | | | | 0.40 | | | | 1.78 | | | | (1.38 | ) | | | (5.69 | ) | | | 4.51 | | | | 3.29 | | | | (0.96 | ) | | | 0.90 | | | | (1.27 | ) | | | (4.48 | ) | | | 4.26 | |
| | | | | | | | | | | | | | | | | | | | | | | | | | | | | | | | | | | | | | | | | | | | | | | |
| | 4.81 | | | | 0.40 | | | | 1.79 | | | | (1.31 | ) | | | (5.62 | ) | | | 4.46 | | | | 3.27 | | | | (1.02 | ) | | | 0.82 | | | | (1.27 | ) | | | (4.47 | ) | | | 4.31 | |
| | | | | | | | | | | | | | | | | | | | | | | | | | | | | | | | | | | | | | | | | | | | | | | |
| | | | | | | | | | | | | | | | | | | | | | | | | | | | | | | | | | | | | | | | | | | | | | | |
| | (0.01 | ) | | | (0.01 | ) | | | (0.07 | ) | | | (0.09 | ) | | | — | | | | — | | | | — | | | | — | | | | — | | | | (0.01 | ) | | | — | | | | (0.13 | ) |
| | — | | | | — | | | | — | | | | — | | | | — | | | | — | | | | — | | | | — | | | | — | | | | (0.02 | ) | | | — | | | | — | |
| | — | | | | — | | | | — | | | | (0.01 | ) | | | (0.72 | ) | | | — | | | | — | | | | — | | | | — | | | | — | | | | (0.74 | ) | | | — | (1) |
| | — | (1) | | | — | (1) | | | — | (1) | | | — | (1) | | | — | (1) | | | — | (1) | | | — | (1) | | | — | (1) | | | — | (1) | | | — | (1) | | | — | (1) | | | — | (1) |
| | | | | | | | | | | | | | | | | | | | | | | | | | | | | | | | | | | | | | | | | | | | | | | |
| | (0.01 | ) | | | (0.01 | ) | | | (0.07 | ) | | | (0.10 | ) | | | (0.72 | ) | | | — | | | | — | | | | — | | | | — | | | | (0.03 | ) | | | (0.74 | ) | | | (0.13 | ) |
| | | | | | | | | | | | | | | | | | | | | | | | | | | | | | | | | | | | | | | | | | | | | | | |
| $ | 22.23 | | | $ | 17.43 | | | $ | 17.04 | | | $ | 15.32 | | | $ | 16.73 | | | $ | 23.07 | | | $ | 14.63 | | | $ | 11.36 | | | $ | 12.38 | | | $ | 11.56 | | | $ | 12.86 | | | $ | 18.07 | |
| | | | | | | | | | | | | | | | | | | | | | | | | | | | | | | | | | | | | | | | | | | | | | | |
| | | | | | | | | | | | | | | | | | | | | | | | | | | | | | | | | | | | | | | | | | | | | | | |
| | 27.59 | %(2) | | | 2.34 | % | | | 11.75 | % | | | (7.74 | )% | | | (25.14 | )% | | | 23.97 | % | | | 28.79 | %(2) | | | (8.24 | )% | | | 7.09 | % | | | (9.79 | )% | | | (25.83 | )% | | | 31.25 | % |
| | | | | | | | | | | | | | | | | | | | | | | | | | | | | | | | | | | | | | | | | | | | | | | |
| | | | | | | | | | | | | | | | | | | | | | | | | | | | | | | | | | | | | | | | | | | | | | | |
| | | | | | | | | | | | | | | | | | | | | | | | | | | | | | | | | | | | | | | | | | | | | | | |
| | | | | | | | | | | | | | | | | | | | | | | | | | | | | | | | | | | | | | | | | | | | | | | |
| $ | 766,263 | | | $ | 666,925 | | | $ | 883,053 | | | $ | 1,193,231 | | | $ | 2,097,571 | | | $ | 3,087,904 | | | $ | 456,652 | | | $ | 495,482 | | | $ | 757,438 | | | $ | 921,676 | | | $ | 1,853,435 | | | $ | 2,467,126 | |
| | | | | | | | | | | | | | | | | | | | | | | | | | | | | | | | | | | | | | | | | | | | | | | |
| | 1.37 | %(3) | | | 1.33 | % | | | 1.33 | % | | | 1.30 | % | | | 1.24 | % | | | 1.24 | % | | | 1.43 | %(3) | | | 1.37 | % | | | 1.37 | % | | | 1.37 | % | | | 1.29 | % | | | 1.31 | % |
| | | | | | | | | | | | | | | | | | | | | | | | | | | | | | | | | | | | | | | | | | | | | | | |
| | 0.27 | %(3) | | | 0.03 | % | | | 0.04 | % | | | 0.42 | % | | | 0.33 | % | | | (0.25 | )% | | | (0.24 | )%(3) | | | (0.32 | )% | | | (0.60 | )% | | | 0.06 | % | | | 0.07 | % | | | 0.43 | % |
| | | | | | | | | | | | | | | | | | | | | | | | | | | | | | | | | | | | | | | | | | | | | | | |
| | 1.37 | %(3) | | | 1.33 | % | | | 1.33 | % | | | 1.30 | % | | | 1.24 | % | | | 1.24 | % | | | 1.43 | %(3) | | | 1.37 | % | | | 1.37 | % | | | 1.37 | % | | | 1.29 | % | | | 1.31 | % |
| | | | | | | | | | | | | | | | | | | | | | | | | | | | | | | | | | | | | | | | | | | | | | | |
| | 0.27 | %(3) | | | 0.03 | % | | | 0.04 | % | | | 0.41 | % | | | 0.33 | % | | | (0.25 | )% | | | (0.24 | )%(3) | | | (0.32 | )% | | | (0.60 | )% | | | 0.06 | % | | | 0.07 | % | | | 0.43 | % |
| | | | | | | | | | | | | | | | | | | | | | | | | | | | | | | | | | | | | | | | | | | | | | | |
| | 25 | %(2) | | | 67 | % | | | 67 | % | | | 77 | % | | | 72 | % | | | 53 | % | | | 41 | %(2)(4) | | | 86 | %(4) | | | 100 | %(4) | | | 135 | %(4) | | | 143 | %(4) | | | 105 | %(4) |
| | | MARSICO INTERNATIONAL OPPORTUNITIES FUND | |
For a Fund Share Outstanding Throughout the Period | | Six-Months Ended 3/31/12 (Unaudited) | | | Year Ended 9/30/11 | | | Year Ended 9/30/10 | | | Year Ended 9/30/09 | | | Year Ended 9/30/08 | | | Year Ended 9/30/07 | |
| | | | | | | | | | | | | | | | | | | |
| Net Asset Value, Beginning of Period | | $ | 10.61 | | | $ | 12.57 | | | $ | 11.86 | | | $ | 12.27 | | | $ | 20.10 | | | $ | 15.81 | |
| | | | | | | | | | | | | | | | | | | | | | | | | |
| | | | | | | | | | | | | | | | | | | | | | | | | |
| Income from Investment Operations: | | | | | | | | | | | | | | | | | | | | | | | | |
| Net investment income (loss) | | | (0.03 | ) | | | (0.22 | ) | | | 0.04 | | | | 0.06 | | | | 0.16 | | | | 0.16 | |
| Net realized and unrealized gains (losses) on investments | | | 2.35 | | | | (1.49 | ) | | | 0.72 | | | | (0.33 | ) | | | (5.66 | ) | | | 4.81 | |
| | | | | | | | | | | | | | | | | | | | | | | | | |
| Total from investment operations | | | 2.32 | | | | (1.71 | ) | | | 0.76 | | | | (0.27 | ) | | | (5.50 | ) | | | 4.97 | |
| | | | | | | | | | | | | | | | | | | | | | | | | |
| Distributions & Other: | | | | | | | | | | | | | | | | | | | | | | | | |
| Net investment income | | | — | | | | (0.25 | ) | | | (0.05 | ) | | | (0.14 | ) | | | (0.18 | ) | | | (0.03 | ) |
| Net realized gains | | | — | | | | — | | | | — | | | | — | | | | (2.15 | ) | | | (0.65 | ) |
| Redemption fees [See Note 2(h)] | | | — | (1) | | | — | (1) | | | — | (1) | | | — | (1) | | | — | (1) | | | — | (1) |
| | | | | | | | | | | | | | | | | | | | | | | | | |
| Total distributions and other | | | — | | | | (0.25 | ) | | | (0.05 | ) | | | (0.14 | ) | | | (2.33 | ) | | | (0.68 | ) |
| | | | | | | | | | | | | | | | | | | | | | | | | |
| Net Asset Value, End of Period | | $ | 12.93 | | | $ | 10.61 | | | $ | 12.57 | | | $ | 11.86 | | | $ | 12.27 | | | $ | 20.10 | |
| | | | | | | | | | | | | | | | | | | | | | | | | |
| | | | | | | | | | | | | | | | | | | | | | | | | |
| Total Return | | | 21.87 | %(2) | | | (13.98 | )% | | | 6.48 | % | | | (1.68 | )% | | | (30.95 | )% | | | 32.42 | % |
| | | | | | | | | | | | | | | | | | | | | | | | | |
| | | | | | | | | | | | | | | | | | | | | | | | | |
| Supplemental Data and Ratios: | | | | | | | | | | | | | | | | | | | | | | | | |
| | | | | | | | | | | | | | | | | | | | | | | | | |
| Net assets, end of Period (000s) | | $ | 151,015 | | | $ | 153,855 | | | $ | 359,016 | | | $ | 450,926 | | | $ | 597,603 | | | $ | 822,073 | |
| | | | | | | | | | | | | | | | | | | | | | | | | |
| Ratio of expenses to average net assets, less waivers and before expenses paid indirectly, plus reimbursements of previously waived expenses | | | 1.60 | %(3) | | | 1.56 | % | | | 1.52 | % | | | 1.48 | % | | | 1.35 | % | | | 1.37 | % |
| | | | | | | | | | | | | | | | | | | | | | | | | |
| Ratio of net investment income (loss) to average net assets, net of waivers, reimbursements of previously waived expenses and expenses paid indirectly | | | (0.15 | )%(3) | | | (0.22 | )% | | | 0.31 | % | | | 0.54 | % | | | 1.00 | % | | | 0.92 | % |
| | | | | | | | | | | | | | | | | | | | | | | | | |
| Ratio of expenses to average net assets, before waivers, reimbursements of previously waived expenses and expenses paid indirectly | | | 1.66 | %(3) | | | 1.56 | % | | | 1.52 | % | | | 1.48 | % | | | 1.35 | % | | | 1.37 | % |
| | | | | | | | | | | | | | | | | | | | | | | | | |
| Ratio of net investment income (loss) to average net assets, before waivers, reimbursements of previously waived expenses and expenses paid indirectly | | | (0.21 | )%(3) | | | (0.22 | )% | | | 0.31 | % | | | 0.54 | % | | | 1.00 | % | | | 0.92 | % |
| | | | | | | | | | | | | | | | | | | | | | | | | |
| Portfolio turnover rate | | | 30 | %(2)(4) | | | 103 | %(4) | | | 134 | %(4) | | | 108 | %(4) | | | 115 | %(4) | | | 125 | %(4) |
| * | Commencement of operations. |
| (4) | Portfolio turnover is greater than most funds due to the investment style of the Fund. |
| | See notes to financial statements. |
MARSICO FLEXIBLE CAPITAL FUND | | | MARSICO GLOBAL FUND | |
Six-Months Ended 3/31/12 (Unaudited) | | | Year Ended 9/30/11 | | | Year Ended 9/30/10 | | | Year Ended 9/30/09 | | | Year Ended 9/30/08 | | | 12/29/06* to 9/30/07 | | | Six-Months Ended 3/31/12 (Unaudited) | | | Year Ended 9/30/11 | | | Year Ended 9/30/10 | | | Year Ended 9/30/09 | | | Year Ended 9/30/08 | | | 6/29/07* to 9/30/07 | |
| | | | | | | | | | | | | | | | | | | | | | | | | | | | | | | | | | | |
| $ | 12.05 | | | $ | 11.97 | | | $ | 9.65 | | | $ | 8.74 | | | $ | 11.32 | | | $ | 10.00 | | | $ | 9.06 | | | $ | 9.90 | | | $ | 8.59 | | | $ | 8.87 | | | $ | 11.46 | | | $ | 10.00 | |
| | | | | | | | | | | | | | | | | | | | | | | | | | | | | | | | | | | | | | | | | | | | | | | |
| | | | | | | | | | | | | | | | | | | | | | | | | | | | | | | | | | | | | | | | | | | | | | | |
| | | | | | | | | | | | | | | | | | | | | | | | | | | | | | | | | | | | | | | | | | | | | | | |
| | 0.01 | | | | 0.08 | | | | 0.27 | | | | 0.06 | | | | 0.14 | | | | 0.22 | | | | (0.05 | ) | | | (0.05 | ) | | | (0.05 | ) | | | 0.04 | | | | 0.08 | | | | 0.02 | |
| | 3.06 | | | | 0.12 | | | | 2.42 | | | | 0.93 | | | | (1.93 | ) | | | 1.10 | | | | 2.75 | | | | (0.70 | ) | | | 1.42 | | | | (0.24 | ) | | | (2.46 | ) | | | 1.44 | |
| | | | | | | | | | | | | | | | | | | | | | | | | | | | | | | | | | | | | | | | | | | | | | | |
| | 3.07 | | | | 0.20 | | | | 2.69 | | | | 0.99 | | | | (1.79 | ) | | | 1.32 | | | | 2.70 | | | | (0.75 | ) | | | 1.37 | | | | (0.20 | ) | | | (2.38 | ) | | | 1.46 | |
| | | | | | | | | | | | | | | | | | | | | | | | | | | | | | | | | | | | | | | | | | | | | | | |
| | | | | | | | | | | | | | | | | | | | | | | | | | | | | | | | | | | | | | | | | | | | | | | |
| | (0.06 | ) | | | (0.09 | ) | | | (0.37 | ) | | | (0.08 | ) | | | (0.35 | ) | | | — | | | | — | | | | (0.09 | ) | | | (0.06 | ) | | | (0.08 | ) | | | (0.05 | ) | | | — | |
| | — | | | | (0.03 | ) | | | — | | | | — | | | | (0.44 | ) | | | — | | | | — | | | | — | | | | — | | | | — | | | | (0.17 | ) | | | — | |
| | — | (1) | | | — | (1) | | | — | (1) | | | — | (1) | | | — | (1) | | | — | (1) | | | — | (1) | | | — | (1) | | | — | (1) | | | — | (1) | | | 0.01 | | | | — | (1) |
| | | | | | | | | | | | | | | | | | | | | | | | | | | | | | | | | | | | | | | | | | | | | | | |
| | (0.06 | ) | | | (0.12 | ) | | | (0.37 | ) | | | (0.08 | ) | | | (0.79 | ) | | | — | | | | — | | | | (0.09 | ) | | | (0.06 | ) | | | (0.08 | ) | | | (0.21 | ) | | | — | |
| | | | | | | | | | | | | | | | | | | | | | | | | | | | | | | | | | | | | | | | | | | | | | | |
| $ | 15.06 | | | $ | 12.05 | | | $ | 11.97 | | | $ | 9.65 | | | $ | 8.74 | | | $ | 11.32 | | | $ | 11.76 | | | $ | 9.06 | | | $ | 9.90 | | | $ | 8.59 | | | $ | 8.87 | | | $ | 11.46 | |
| | | | | | | | | | | | | | | | | | | | | | | | | | | | | | | | | | | | | | | | | | | | | | | |
| | | | | | | | | | | | | | | | | | | | | | | | | | | | | | | | | | | | | | | | | | | | | | | |
| | 25.55 | %(2) | | | 1.59 | % | | | 28.68 | % | | | 11.68 | % | | | (17.10 | )% | | | 13.20 | %(2) | | | 29.80 | %(2) | | | (7.73 | )% | | | 16.01 | % | | | (1.93 | )% | | | (21.13 | )% | | | 14.60 | %(2) |
| | | | | | | | | | | | | | | | | | | | | | | | | | | | | | | | | | | | | | | | | | | | | | | |
| | | | | | | | | | | | | | | | | | | | | | | | | | | | | | | | | | | | | | | | | | | | | | | |
| | | | | | | | | | | | | | | | | | | | | | | | | | | | | | | | | | | | | | | | | | | | | | | |
| | | | | | | | | | | | | | | | | | | | | | | | | | | | | | | | | | | | | | | | | | | | | | | |
| $ | 513,546 | | | $ | 409,145 | | | $ | 132,345 | | | $ | 31,331 | | | $ | 14,461 | | | $ | 24,741 | | | $ | 53,573 | | | $ | 108,021 | | | $ | 116,101 | | | $ | 109,149 | | | $ | 82,543 | | | $ | 31,477 | |
| | | | | | | | | | | | | | | | | | | | | | | | | | | | | | | | | | | | | | | | | | | | | | | |
| | 1.47 | %(3) | | | 1.27 | % | | | 0.75 | % | | | 0.75 | % | | | 0.75 | % | | | 1.22 | %(3) | | | 1.60 | %(3) | | | 1.48 | % | | | 1.54 | % | | | 1.40 | % | | | 0.75 | % | | | 0.75 | %(3) |
| | | | | | | | | | | | | | | | | | | | | | | | | | | | | | | | | | | | | | | | | | | | | | | |
| | 0.17 | %(3) | | | 0.55 | % | | | 1.33 | % | | | 1.44 | % | | | 1.15 | % | | | 2.62 | %(3) | | | (0.28 | )%(3) | | | (0.46 | )% | | | (0.57 | )% | | | 0.52 | % | | | 0.88 | % | | | 1.06 | %(3) |
| | | | | | | | | | | | | | | | | | | | | | | | | | | | | | | | | | | | | | | | | | | | | | | |
| | 1.47 | %(3) | | | 1.40 | % | | | 1.73 | % | | | 2.84 | % | | | 1.71 | % | | | 2.47 | %(3) | | | 1.76 | %(3) | | | 1.48 | % | | | 1.54 | % | | | 1.58 | % | | | 1.49 | % | | | 4.48 | %(3) |
| | | | | | | | | | | | | | | | | | | | | | | | | | | | | | | | | | | | | | | | | | | | | | | |
| | 0.17 | %(3) | | | 0.42 | % | | | 0.35 | % | | | (0.65 | )% | | | 0.19 | % | | | 1.37 | %(3) | | | (0.44 | )%(3) | | | (0.46 | )% | | | (0.57 | )% | | | 0.34 | % | | | 0.14 | % | | | (2.67 | )%(3) |
| | | | | | | | | | | | | | | | | | | | | | | | | | | | | | | | | | | | | | | | | | | | | | | |
| | 64 | %(2)(4) | | | 231 | %(4) | | | 146 | %(4) | | | 259 | %(4) | | | 207 | %(4) | | | 237 | %(2)(4) | | | 53 | %(2)(4) | | | 93 | %(4) | | | 125 | %(4) | | | 185 | %(4) | | | 201 | %(4) | | | 56 | %(2)(4) |
| | | MARSICO EMERGING MARKETS FUND | |
| | | | |
For a Fund Share Outstanding Throughout the Period | | Six-Months Ended 3/31/12 (Unaudited) | | | 12/31/10* to 9/30/11 | |
| | | | | | | |
| Net Asset Value, Beginning of Period | | $ | 7.10 | | | $ | 10.00 | |
| | | | | | | | | |
| | | | | | | | | |
| Income from Investment Operations: | | | | | | | | |
| Net investment income (loss) | | | (0.01 | ) | | | 0.01 | |
| Net realized and unrealized gains (losses) on investments | | | 1.29 | | | | (2.91 | ) |
| | | | | | | | | |
| Total from investment operations | | | 1.28 | | | | (2.90 | ) |
| | | | | | | | | |
| Distributions & Other: | | | | | | | | |
| Net investment income | | | — | | | | — | |
| Net realized gains | | | — | | | | — | |
| Redemption fees [See Note 2(h)] | | | — | (1) | | | — | (1) |
| | | | | | | | | |
| Total distributions and other | | | — | | | | — | |
| | | | | | | | | |
| Net Asset Value, End of Period | | $ | 8.38 | | | $ | 7.10 | |
| | | | | | | | | |
| | | | | | | | | |
| Total Return | | | 18.03 | %(2) | | | (29.00 | )%(2) |
| | | | | | | | | |
| | | | | | | | | |
| Supplemental Data and Ratios: | | | | | | | | |
| | | | | | | | | |
| Net assets, end of Period (000s) | | $ | 5,470 | | | $ | 4,636 | |
| | | | | | | | | |
| Ratio of expenses to average net assets, less waivers and before expenses paid indirectly, plus reimbursements of previously waived expenses | | | 1.75 | %(3) | | | 1.75 | %(3) |
| | | | | | | | | |
| Ratio of net investment income (loss) to average net assets, net of waivers, reimbursements of previously waived expenses and expenses paid indirectly | | | (0.31 | )%(3) | | | 0.12 | %(3) |
| | | | | | | | | |
| Ratio of expenses to average net assets, before waivers, reimbursements of previously waived expenses and expenses paid indirectly | | | 5.94 | %(3) | | | 5.73 | %(3) |
| | | | | | | | | |
| Ratio of net investment income (loss) to average net assets, before waivers, reimbursements of previously waived expenses and expenses paid indirectly | | | (4.50 | )%(3) | | | (3.86 | )%(3) |
| | | | | | | | | |
| Portfolio turnover rate | | | 97 | %(2)(4) | | | 389 | %(2)(4) |
| * | Commencement of operations. |
| (4) | Portfolio turnover is greater than most funds due to the investment style of the Fund. |
| | See notes to financial statements. |
| |
NOTES TO FINANCIAL STATEMENTS |
| |
NOTES TO FINANCIAL STATEMENTS March 31, 2012 (Unaudited)
The Marsico Investment Fund (the “Trust”) was organized on October 1, 1997, as a Delaware Statutory Trust and is registered under the Investment Company Act of 1940 (the “1940 Act”) as an open-end management investment company. The Focus Fund, Growth Fund, 21st Century Fund, International Opportunities Fund, Flexible Capital Fund, Global Fund, and Emerging Markets Fund (collectively, the “Funds”) are separate investment portfolios of the Trust. The Focus Fund is a non-diversified fund and the Growth Fund, the 21st Century Fund, the International Opportunities Fund, the Flexible Capital Fund, the Global Fund, and the Emerging Markets Fund are diversified funds. The Focus Fund and Growth Fund commenced operations on December 31, 1997, the 21st Century Fund commenced operations on February 1, 2000, the International Opportunities Fund commenced operations on June 30, 2000, the Flexible Capital Fund commenced operations on December 29, 2006, the Global Fund commenced operations on June 29, 2007, and the Emerging Markets Fund commenced operations on December 31, 2010. Affiliates of Marsico Capital Management, LLC (the “Adviser”) hold approximately 6%, 22%, and 81% of the Flexible Capital Fund’s, Global Fund’s, and Emerging Markets Fund’s outstanding shares, respectively, as of March 31, 2012.
| 2. | Significant Accounting Policies |
The following is a summary of significant accounting policies consistently followed by the Funds in the preparation of their financial statements. These policies are in conformity with Generally Accepted Accounting Principles (“GAAP”) for investment companies. The presentation of financial statements in conformity with GAAP requires management to make estimates and assumptions that affect the reported amounts of assets and liabilities at the date of the financial statements and the reported amounts of income and expenses during the reporting period. Actual results could differ from those estimates.
| | (a) | Investment Valuation — A security traded on a recognized stock exchange is generally valued at the last sale price prior to the closing of the principal exchange on which the security is traded. Securities traded on NASDAQ generally will be valued at the NASDAQ Official Closing Price. If no sale price is reported on the valuation date, the most current bid price will generally be used, with the exception of short option positions which will generally utilize the most current ask price. Other securities for which over-the-counter market quotations are readily available are generally valued at the last sale price. Debt securities that will mature in more than 60 days are generally valued at their bid prices furnished by a pricing service approved by the Funds’ Board of Trustees and subject to review and determination of the appropriate price by the Adviser. Debt securities that will mature in 60 days or less are valued at amortized cost, if it approximates market value. Any securities for which market quotations are not readily available are valued at their fair value as determined in good faith by the Adviser in accordance with procedures established by, and under the general supervision of, the Funds’ Board of Trustees. The Funds may use pricing services to assist in determining market value. The Board of Trustees has authorized the use of a pricing service to assist the Funds in valuing certain equity securities listed or traded on foreign security exchanges in the Funds’ portfolios in certain circumstances where there is a significant change in the value of related US-traded securities, as represented by, for example, the S&P 500 Index. |
“Fair Value Measurements and Disclosures” (the “Fair Value Statement”) defines fair value, establishes a framework for measuring fair value in GAAP, and expands disclosures about fair value measurements. Under the Fair Value Statement, various inputs are used in determining the value of the Funds’ investments.
These inputs are summarized into three broad levels and described below:
| | • | Level 1 – quoted prices in active markets for identical investments |
| | • | Level 2 – other significant observable inputs (including quoted prices for similar investments, interest rates, and evaluated quotations obtained from pricing services) |
| | • | Level 3 – significant unobservable inputs (including the Fund’s own assumptions in determining the fair value of investments). |
The inputs or methodology used for valuing investments are not an indication of the risk associated with investing in those investments. Changes in valuation techniques may result in transfers between the levels during the reporting period. The Funds recognize transfers between the levels as of the beginning and end of the reporting period. In accordance with procedures established by, and under the general supervision of, the Funds’ Board of Trustees, certain equity securities listed or traded on
| |
NOTES TO FINANCIAL STATEMENTS |
| |
NOTES TO FINANCIAL STATEMENTS March 31, 2012 (Unaudited) (continued)
S
foreign security exchanges in the Funds’ portfolios had a fair valuation adjustment factor applied to their equity prices as of the beginning of the fiscal year and were categorized as Level 2. Application of fair valuation adjustment factors was not deemed necessary at the end of the reporting period and as such equity securities listed or traded on foreign security exchanges were categorized as Level 1. These securities represent the only significant transfers between each of the three levels. The following is a summary of the fair values of the Funds’ investments in each category and economic sector as of March 31, 2012:
Fund Investments by Major Security Type | | | | | | | | | | | | |
| Marsico Focus Fund | | | | | | | | | | | | |
| Assets | | | | | | | | | | | | |
| Common Stocks | | | | | | | | | | | | |
| Consumer Discretionary | | $ | 316,856,288 | | | $ | — | | | $ | — | | | $ | 316,856,288 | |
| Consumer Staples | | | 40,179,307 | | | | — | | | | — | | | | 40,179,307 | |
| Energy | | | 92,635,364 | | | | — | | | | — | | | | 92,635,364 | |
| Financials | | | 90,401,615 | | | | — | | | | — | | | | 90,401,615 | |
| Health Care | | | 93,185,911 | | | | — | | | | — | | | | 93,185,911 | |
| Industrials | | | 91,853,476 | | | | — | | | | — | | | | 91,853,476 | |
| Information Technology | | | 307,506,087 | | | | — | | | | — | | | | 307,506,087 | |
| Materials | | | 55,139,408 | | | | — | | | | — | | | | 55,139,408 | |
| Short-term Investments | | | 4,190,130 | | | | — | | | | — | | | | 4,190,130 | |
| | | | | | | | | | | | | | | $ | 1,091,947,586 | |
| Marsico Growth Fund | | | | | | | | | | | | | | | | |
| Assets | | | | | | | | | | | | | | | | |
| Common Stocks | | | | | | | | | | | | | | | | |
| Consumer Discretionary | | | 259,869,102 | | | | — | | | | — | | | | 259,869,102 | |
| Consumer Staples | | | 25,999,058 | | | | — | | | | — | | | | 25,999,058 | |
| Energy | | | 61,502,480 | | | | — | | | | — | | | | 61,502,480 | |
| Financials | | | 40,715,137 | | | | — | | | | — | | | | 40,715,137 | |
| Health Care | | | 42,174,954 | | | | — | | | | — | | | | 42,174,954 | |
| Industrials | | | 73,592,950 | | | | — | | | | — | | | | 73,592,950 | |
| Information Technology | | | 165,357,078 | | | | — | | | | — | | | | 165,357,078 | |
| Materials | | | 45,269,420 | | | | — | | | | — | | | | 45,269,420 | |
| Preferred Stocks | | | 9,793,220 | | | | — | | | | — | | | | 9,793,220 | |
| Units | | | 8,522,100 | | | | — | | | | — | | | | 8,522,100 | |
| Short-term Investments | | | 37,458,991 | | | | — | | | | — | | | | 37,458,991 | |
| | | | | | | | | | | | | | | $ | 770,254,490 | |
Marsico 21st Century Fund | | | | | | | | | | | | | | | | |
| Assets | | | | | | | | | | | | | | | | |
| Common Stocks | | | | | | | | | | | | | | | | |
| Consumer Discretionary | | | 126,592,539 | | | | — | | | | — | | | | 126,592,539 | |
| Consumer Staples | | | 4,804,090 | | | | — | | | | — | | | | 4,804,090 | |
| Energy | | | 41,355,732 | | | | — | | | | — | | | | 41,355,732 | |
| Financials | | | 49,380,388 | | | | — | | | | — | | | | 49,380,388 | |
| Health Care | | | 39,886,703 | | | | — | | | | — | | | | 39,886,703 | |
| Industrials | | | 65,293,700 | | | | — | | | | — | | | | 65,293,700 | |
| Information Technology | | | 101,930,901 | | | | — | | | | — | | | | 101,930,901 | |
| Materials | | | 17,170,410 | | | | — | | | | — | | | | 17,170,410 | |
| Short-term Investments | | | 3,318,237 | | | | — | | | | — | | | | 3,318,237 | |
| | | | | | | | | | | | | | | $ | 449,732,700 | |
| Marsico International Opportunities Fund | | | | | | | | | | | | | | | | |
| Assets | | | | | | | | | | | | | | | | |
| Common Stocks | | | | | | | | | | | | | | | | |
| Consumer Discretionary | | | 30,795,350 | | | | — | | | | — | | | | 30,795,350 | |
| Consumer Staples | | | 10,230,988 | | | | — | | | | — | | | | 10,230,988 | |
| Energy | | | 8,783,852 | | | | — | | | | — | | | | 8,783,852 | |
| Financials | | | 19,955,823 | | | | — | | | | — | | | | 19,955,823 | |
| Health Care | | | 11,170,458 | | | | — | | | | — | | | | 11,170,458 | |
| Industrials | | | 18,704,619 | | | | — | | | | — | | | | 18,704,619 | |
| Information Technology | | | 28,991,777 | | | | — | | | | — | | | | 28,991,777 | |
| Materials | | | 9,505,332 | | | | — | | | | — | | | | 9,505,332 | |
| Telecommunication Services | | | 8,377,018 | | | | — | | | | — | | | | 8,377,018 | |
| Short-term Investments | | | 4,804,007 | | | | — | | | | — | | | | 4,804,007 | |
| | | | | | | | | | | | | | | $ | 151,319,224 | |
| |
NOTES TO FINANCIAL STATEMENTS |
| |
Fund Investments by Major Security Type | | | | | | | | | | | | |
| Marsico Flexible Capital Fund | | | | | | | | | | | | |
| Assets | | | | | | | | | | | | |
| Common Stocks | | | | | | | | | | | | |
| Consumer Discretionary | | $ | 121,627,532 | | | $ | — | | | $ | — | | | $ | 121,627,532 | |
| Energy | | | 36,751,634 | | | | — | | | | — | | | | 36,751,634 | |
| Financials | | | 94,725,439 | | | | — | | | | — | | | | 94,725,439 | |
| Health Care | | | 21,504,704 | | | | — | | | | — | | | | 21,504,704 | |
| Industrials | | | 31,970,165 | | | | — | | | | — | | | | 31,970,165 | |
| Information Technology | | | 103,562,718 | | | | — | | | | — | | | | 103,562,718 | |
| Materials | | | 10,229,598 | | | | — | | | | — | | | | 10,229,598 | |
| Telecommunication Services | | | 1,554,677 | | | | — | | | | — | | | | 1,554,677 | |
| Corporate Bonds | | | — | | | | 32,950,219 | | | | — | | | | 32,950,219 | |
| Preferred Stocks | | | 5,866,868 | | | | — | | | | — | | | | 5,866,868 | |
| Short-term Investments | | | 52,907,554 | | | | — | | | | — | | | | 52,907,554 | |
| | | | | | | | | | | | | | | $ | 513,651,108 | |
| Marsico Global Fund | | | | | | | | | | | | | | | | |
| Assets | | | | | | | | | | | | | | | | |
| Common Stocks | | | | | | | | | | | | | | | | |
| Consumer Discretionary | | | 16,140,036 | | | | — | | | | — | | | | 16,140,036 | |
| Consumer Staples | | | 5,057,468 | | | | — | | | | — | | | | 5,057,468 | |
| Energy | | | 2,026,658 | | | | — | | | | — | | | | 2,026,658 | |
| Financials | | | 4,670,785 | | | | — | | | | — | | | | 4,670,785 | |
| Health Care | | | 2,653,163 | | | | — | | | | — | | | | 2,653,163 | |
| Industrials | | | 5,391,902 | | | | — | | | | — | | | | 5,391,902 | |
| Information Technology | | | 12,519,438 | | | | — | | | | — | | | | 12,519,438 | |
| Materials | | | 2,497,559 | | | | — | | | | — | | | | 2,497,559 | |
| Short-term Investments | | | 32,558 | | | | — | | | | — | | | | 32,558 | |
| | | | | | | | | | | | | | | $ | 50,989,567 | |
| Marsico Emerging Markets Fund | | | | | | | | | | | | | | | | |
| Assets | | | | | | | | | | | | | | | | |
| Common Stocks | | | | | | | | | | | | | | | | |
| Consumer Discretionary | | | 1,350,776 | | | | — | | | | — | | | | 1,350,776 | |
| Consumer Staples | | | 225,195 | | | | — | | | | — | | | | 225,195 | |
| Energy | | | 397,425 | | | | — | | | | — | | | | 397,425 | |
| Financials | | | 669,116 | | | | — | | | | — | | | | 669,116 | |
| Health Care | | | 342,606 | | | | — | | | | — | | | | 342,606 | |
| Industrials | | | 407,661 | | | | — | | | | — | | | | 407,661 | |
| Information Technology | | | 872,615 | | | | — | | | | — | | | | 872,615 | |
| Materials | | | 425,807 | | | | — | | | | — | | | | 425,807 | |
| Telecommunication Services | | | 284,279 | | | | — | | | | — | | | | 284,279 | |
| Short-term Investments | | | 475,523 | | | | — | | | | — | | | | 475,523 | |
| | | | | | | | | | | | | | | $ | 5,451,003 | |
| | (b) | Expenses — The Funds are charged for those expenses that are directly attributable to each Fund, such as advisory and custodial fees. Expenses that are not directly attributable to a Fund are typically allocated among the Funds in proportion to their respective net assets and in some cases allocated based on other factors. The Funds’ expenses may be reduced by voluntary advisory fee waivers, brokerage credits and uninvested cash balances earning interest or credits. Such credits are included in “Less waiver of expenses and expenses paid indirectly” on the Statements of Operations. |
Brokerage commissions were paid to certain brokers which reduced certain transfer agent fees and expenses in the amount of $7 for the Growth Fund, for the six-months ended March 31, 2012. The Funds also received earnings credits on certain cash account balances which reduced transfer agent fees and expenses in the amount of $510, $357, $252, $81, $215, $56, and $2 for the Focus Fund, Growth Fund, 21st Century Fund, International Opportunities Fund, Flexible Capital Fund, Global Fund, and Emerging Markets Fund, respectively, for the six-months ended March 31, 2012. Brokerage commission credits and earnings credits are included in “Less waiver of expenses and expenses paid indirectly” on the Statements of Operations.
| | (c) | Federal Income Taxes — Each Fund intends to comply with the requirements of the Internal Revenue Code necessary to qualify as a regulated investment company and to make the requisite distributions of income to its shareholders which will be sufficient to relieve it from all or substantially all federal and state income taxes. Certain funds may utilize earnings and profits on redemption of shares as part of the dividends paid deduction. |
| |
NOTES TO FINANCIAL STATEMENTS |
| |
NOTES TO FINANCIAL STATEMENTS March 31, 2012 (Unaudited) (continued)
NOTES TO FINANCIAL STATEMENTS
| | (d) | Distributions to Shareholders — Dividends from net investment income and net realized capital gains, if any, will be declared and paid at least annually. Distributions to shareholders are recorded on the ex-dividend date. Each Fund may periodically make reclassifications among certain of its capital accounts as a result of the timing and characterization of certain income and capital gains distributions determined in accordance with federal tax regulations, which may differ from GAAP. These reclassifications are due to differing treatment for items such as foreign currency transactions, passive foreign investment companies (“PFICs”), net investment losses and investments in partnerships. |
| | (e) | Foreign Currency Translation — The accounting records of the Funds are maintained in US dollars. Values of securities denominated in foreign currencies are translated into US dollars at 4:00 p.m. ET. Amounts related to the purchase and sale of foreign securities and investment income are translated at the rates of exchange prevailing on the respective dates of such transactions. |
Reported realized gains on foreign currency transactions arise from sales of portfolio securities, forward foreign currency contracts, currency gains or losses realized between the trade and settlement dates on securities transactions, the difference between the amounts of dividends, interest, and foreign withholding taxes recorded on the Funds’ books, and the US dollar equivalent of the amounts actually received or paid.
The Funds do not isolate that portion of the results of operations resulting from changes in foreign exchange rates on investments from the fluctuations arising from changes in market prices of securities held at the end of the reporting period. Net unrealized appreciation or depreciation on investments and foreign currency translations arise from changes in the value of assets and liabilities, including investments in securities at the end of the reporting period, resulting from changes in the exchange rates and changes in market prices of securities held. Transactions in foreign-denominated assets may involve greater risks than domestic transactions, including currency risk, political and economic risk, regulatory risk and market risk.
| | (f) | Derivative Instruments — “Disclosure about Derivative Instruments and Hedging Activities” (the “Derivatives Statement”) requires enhanced disclosures about the Funds’ derivative and hedging activities, including how such activities are accounted for and their effects on the Funds’ financial position, performance and cash flows. |
The Funds may enter into futures contracts and options on securities, financial indexes, and foreign currencies, options on futures, forward foreign currency contracts, interest rate swaps, credit default swaps, and swap-related products. The Funds intend to use such derivative instruments primarily to hedge or protect from adverse movements in securities prices, currency rates or interest rates. The use of futures contracts, options, and forward foreign currency contracts may involve risks such as the possibility of illiquid markets or imperfect correlation between the value of the contracts and the underlying securities, or that the counterparty will fail to perform its obligations. The limited use of derivative instruments by the Funds during the six-months ended March 31, 2012 was related to the use of forward foreign currency contracts in the International Opportunities Fund and purchased index options for the Flexible Capital Fund, each of which did not have a significant impact on each Fund’s respective performance during the reporting period. There were no outstanding derivative instruments held by the Funds as of March 31, 2012. The following tables provide information about the effects of the derivative instruments on the Statements of Operations for the International Opportunities Fund and Flexible Capital Fund, as appropriate, for the six-months ended March 31, 2012 and for the year ended September 30, 2011.
The effects of derivative instruments on the Statements of Operations for the period October 1, 2011 through March 31, 2012 (amounts in thousands):
| | | | Amount of Realized Gain (Loss) on Derivatives | |
| Derivatives Not Accounted for as Hedging Instruments | | | | | | | | Forward Foreign Currency Contracts | | | | |
| International Opportunities Fund | Forward Foreign Currency Contracts | | | N/A | | | | N/A | | | $ | (573 | ) | | $ | (573 | ) |
| | Total | | | N/A | | | | N/A | | | $ | (573 | ) | | $ | (573 | ) |
| | | | | | | | | | | | | | | | | | |
| Flexible Capital Fund | Index contracts | | $ | (1,809 | ) | | | N/A | | | | N/A | | | $ | (1,809 | ) |
| | Total | | $ | (1,809 | ) | | | N/A | | | | N/A | | | $ | (1,809 | ) |
| |
NOTES TO FINANCIAL STATEMENTS |
| |
| | | | Change in Unrealized Appreciation (Depreciation) on Derivatives | |
| Derivatives Not Accounted for as Hedging Instruments | | Forward Foreign Currency Contracts | |
| International Opportunities Fund | Forward Foreign Currency Contracts | | $ | 573 | |
| | Total | | $ | 573 | |
The effects of derivative instruments on the Statements of Operations for the period October 1, 2010 through September 30, 2011 (amounts in thousands):
| | | | Amount of Realized Gain (Loss) on Derivatives | |
| Derivatives Not Accounted for as Hedging Instruments | | | | | | | | Forward Foreign Currency Contracts | | | | |
| International Opportunities Fund | Forward Foreign Currency Contracts | | | N/A | | | | N/A | | | $ | (1,102 | ) | | $ | (1,102 | ) |
| | Total | | | N/A | | | | N/A | | | $ | (1,102 | ) | | $ | (1,102 | ) |
| | | | | | | | | | | | | | | | | | |
| Flexible Capital Fund | Equity/Index contracts | | $ | (1,177 | ) | | $ | 394 | | | | N/A | | | $ | (783 | ) |
| | Total | | $ | (1,177 | ) | | $ | 394 | | | | N/A | | | $ | (783 | ) |
| | | | Change in Unrealized Appreciation (Depreciation) on Derivatives | |
| Derivatives Not Accounted for as Hedging Instruments | | Forward Foreign Currency Contracts | |
| International Opportunities Fund | Forward Foreign Currency Contracts | | $ | (573 | ) |
| | Total | | $ | (573 | ) |
Forward Foreign Currency Contracts — A forward currency contract is a commitment to purchase or sell foreign currency at a specified price on a future date. The Funds may enter into a forward foreign currency contract in order to hedge against foreign currency fluctuations, such as when a Fund elects to reduce exposure to changes in foreign currency exchange rates on foreign portfolio holdings denominated in or exposed to foreign currencies, or in preparation of purchasing securities in a particular market as well as other investment purposes.
The market value of a forward foreign currency contract fluctuates with changes in currency exchange rates. Outstanding forward foreign currency contracts are valued daily at current market rates and the resulting change in market value is recorded as unrealized appreciation or depreciation. When a forward foreign currency contract is settled, the Fund records a realized gain or loss equal to the difference between the value at the time the forward foreign currency contract was opened and the value at the time it was settled.
The Funds are subject to foreign currency exchange risk in the normal course of pursuing their investment objectives. Forward foreign currency contracts may involve market risk in excess of the unrealized gain or loss reflected on the Statements of Assets and Liabilities. In addition, the Funds could be exposed to a credit risk if the counterparties are unable or unwilling to meet the terms of the contracts or if the value of the foreign currency changes unfavorably. In connection with these contracts, the Funds typically segregate cash and/or other securities as collateral in a sufficient value equal to the aggregate amount of the Funds’ commitments under the forward foreign currency contracts; such collateral would be in the possession of the Funds’ custodian, if applicable.
Options Contracts — The Funds may purchase and write (sell) put and call options on foreign and domestic stock indices, foreign currencies, and US and foreign securities that are traded on a securities exchange or an over-the-counter market. These transactions are for hedging purposes or for the purpose of earning additional income. In addition, the Funds may enter into such transactions for cross-hedging purposes. There is minimal counterparty credit risk involved in entering into option contracts since they are exchange-traded instruments and the exchange’s clearinghouse, as counterparty to all exchange-traded options, guarantees the options against default.
| |
NOTES TO FINANCIAL STATEMENTS |
| |
NOTES TO FINANCIAL STATEMENTS March 31, 2012 (Unaudited) (continued)
NOTES TO FINANCIAL STATEMENTS
The risk associated with purchasing an option is that the Fund pays a premium whether or not the option is exercised. Additionally, the Fund bears the risk of loss of premium and change in market value should the counterparty not perform under the contract. Put and call options purchased are accounted for in the same manner as portfolio securities. The cost of securities acquired through the exercise of call options is increased by premiums paid. The proceeds from securities sold through the exercise of put options are decreased by the premiums paid.
When the Fund writes an option, the premium received by the Fund is recorded as a liability and is subsequently adjusted to the current market value of the option written. Premiums received from writing options that expire are recorded by the Fund on the expiration date as realized gains from option transactions. The difference between the premium and the amount paid on effecting a closing purchase transaction, including brokerage commissions, is also treated as a realized gain, or if the premium is less than the amount paid for the closing purchase transaction, as a realized loss. If a call option is exercised, the premium is added to the proceeds from the sale of the underlying security or currency in determining whether the Fund has realized a gain or loss. If a put option is exercised, the premium reduces the cost basis of the security or currency purchased by the Fund. In writing an option, the Fund bears the market risk of an unfavorable change in the price of the security or currency underlying the written option. Exercise of an option written by the Fund could result in the Fund selling or buying a security or currency at a price different from the current market value.
| | (g) | Trustees’ Deferred Fee Plan — Effective February 1, 2000, the Board of Trustees adopted the Marsico Investment Fund Deferred Fee Plan (the “Deferred Fee Plan”), amended and restated as of December 30, 2005, which allows the Trustees to defer the receipt of all or a portion of their compensation received from the Funds. Any deferred fees are credited to accounts established on behalf of the Trustees into the Funds as directed by each Trustee. The amounts credited to these accounts increase or decrease in accordance with the performance of the Funds selected by the Trustees. The market value of the deferred account balances as of March 31, 2012 is shown on the Statements of Assets and Liabilities as part of an asset account, “Prepaid expenses and other assets”, and a liability account, “Accrued trustees’ fees”. Additionally, the fluctuation of the account balances due to the Funds’ performance is recorded by the Funds as unrealized appreciation/(depreciation) which is shown as part of “Net unrealized appreciation on investments and foreign currency translations” on the Statements of Assets and Liabilities and as compensation expense which is shown as part of the expense account “Trustees’ fees and expenses” on the Statements of Operations. Fees earned and deferred by the Trustees for the six-months ended March 31, 2012 are also included in “Trustees’ fees and expenses” on the Statements of Operations. Amounts credited to the Deferred Fee Plan will be deferred until distributed in accordance with the Deferred Fee Plan. Unrealized appreciation/depreciation of Fund shares held in the Deferred Fee Plan is subject to the Funds’ expense reimbursement agreement with the Adviser. |
| | (h) | Redemption Fee — A 2.00% redemption fee is retained by the Funds to offset transaction costs and other expenses associated with short-term investing. The fee is imposed on certain redemptions or exchanges of shares held 30 days or less from their purchase date. Redemption fees are recorded by the Funds as a reduction of shares redeemed and as a credit to paid-in-capital. For the six-months ended March 31, 2012, the Focus Fund, Growth Fund, 21st Century Fund, International Opportunities Fund, Flexible Capital Fund, Global Fund, and Emerging Markets Fund received $2,559, $26,145, $3,566, $690, $19,738, $10,999, and $10, respectively, in redemption fees. |
| | (i) | Other — Investment transactions are accounted for on a trade date basis. Each Fund determines the gain or loss realized from the investment transactions by comparing the original cost of the security lot sold with the net sale proceeds. Dividend income is recognized on the ex-dividend date. Certain dividends from foreign securities will be recorded as soon as the Trust is informed of the dividend if such information is obtained subsequent to the ex-dividend date. Interest income is recognized on an accrual basis. |
| | (j) | Indemnifications — In the normal course of business, the Funds enter into contracts that contain provisions indemnifying other parties against specified potential liabilities. Each Fund’s maximum exposure under these arrangements is unknown as this would involve future claims that may be made against the Fund that have not yet occurred. However, based on experience, the Funds expect the risk of loss to be remote. |
| |
NOTES TO FINANCIAL STATEMENTS |
| |
| 3. | Investment Advisory Agreement and Transactions With Affiliates |
Each Fund has an agreement with the Adviser to furnish investment advisory services to the Funds. Under the terms of these agreements, the Adviser is compensated for managing the Focus Fund and the Growth Fund at the rate of 0.85% per year of average daily net assets up to $3 billion in each Fund, and 0.75% per year of average daily net assets exceeding $3 billion in each Fund; and at a rate of 0.85% of the average daily net assets of the 21st Century Fund, the International Opportunities Fund, the Flexible Capital Fund, and the Global Fund; and at a rate of 1.00% of the average net assets of the Emerging Markets Fund. The Adviser has voluntarily agreed to limit the total expenses of each Fund (excluding interest, taxes, acquired fund fees and expenses, litigation, brokerage, and extraordinary expenses) to an annual rate of 1.75% of the average net assets of the Emerging Markets Fund, 1.60% of the average net assets of the Focus Fund, the International Opportunities Fund, the Flexible Capital Fund, and the Global Fund, and 1.50% of the average net assets of the Growth Fund and the 21st Century Fund until January 31, 2013. Prior to February 1, 2011, the Adviser’s voluntary expense limitation agreement relating to the Flexible Capital Fund limited total expenses of the Flexible Capital Fund (excluding interest, taxes, acquired fund fees and expenses, litigation, brokerage, and extraordinary expenses) to an annual rate of 0.75% of the Flexible Capital Fund’s average net assets.
The Adviser is entitled to reimbursement from a Fund of any amounts waived pursuant to this arrangement if such reimbursements do not cause a Fund to exceed current expense limitations and the reimbursement is made within three years after the year in which the Adviser incurred the expense. As of March 31, 2012, reimbursements that may potentially be made by the International Opportunities Fund, Global Fund, and Emerging Markets Fund to the Adviser are $45,174, $71,134, and $355,686, respectively, which expire between 2014 and 2015. The Adviser has elected not to seek recoupment of amounts related to fees waived or expenses reimbursed during the time that the Flexible Capital Fund’s expense limitation was 0.75% of average net assets.
Certain officers of the Trust are also officers of the Adviser. The Funds pay a portion of the Chief Compliance Officer’s total compensation costs which is shown as part of the expense account “Professional fees” on the Statements of Operations. No other officers of the Trust received compensation from the Funds.
| 4. | Service and Distribution Plan |
The Funds have adopted a Service and Distribution Plan (the “Plan”) pursuant to Rule 12b-1 under the 1940 Act. The Plan authorizes payments by the Funds in connection with the distribution of their shares at an annual rate, as determined from time to time by the Board of Trustees, of up to 0.25% of a Fund’s average daily net assets. The Adviser may, out of its own resources and at its sole discretion, make certain payments on behalf of the Plan for expenses incurred by a Fund for distribution of Fund shares and related services.
| 5. | Investment Transactions |
The aggregate purchases and sales of securities, excluding short-term investments, for the Funds for the six-months ended March 31, 2012, were as follows:
| | | | | | | | | | | International Opportunities Fund | | | | | | | | | | |
| Purchases | | $ | 371,993 | | | $ | 175,305 | | | $ | 191,708 | | | $ | 45,616 | | | $ | 270,960 | | | $ | 44,146 | | | $ | 4,545 | |
| Sales | | $ | 414,939 | | | $ | 219,923 | | | $ | 343,056 | | | $ | 81,264 | | | $ | 265,965 | | | $ | 116,190 | | | $ | 4,551 | |
There were no purchases or sales of US government securities, excluding short-term investments.
| 6. | Federal Income Tax Information |
Accounting for Uncertainty in Income Taxes (the “Income Tax Statement”) requires an evaluation of tax positions taken (or expected to be taken) in the course of preparing a Fund’s tax returns to determine whether these positions meet a “more-likely-than-not” standard that, based on the technical merits, have a more than fifty percent likelihood of being sustained by a taxing authority upon examination. A tax position that meets the “more-likely-than-not” recognition threshold is measured to determine the amount of benefit to recognize in the financial statements. The Funds recognize interest and penalties, if any, related to unrecognized tax benefits as income tax expense in the Statements of Operations.
| |
NOTES TO FINANCIAL STATEMENTS |
| |
NOTES TO FINANCIAL STATEMENTS March 31, 2012 (Unaudited) (continued)
The Income Tax Statement requires management of the Funds to analyze all open tax years, fiscal years 2008-2012 as defined by IRS statute of limitations for all major jurisdictions, including federal tax authorities and certain state tax authorities. As of and during the six-months ended March 31, 2012, the Funds did not have a liability for any unrecognized tax benefits. The Funds have no examinations in progress and are not aware of any tax positions for which it is reasonably possible that the total amounts of unrecognized tax benefits will significantly change in the next twelve months.
At March 31, 2012 gross unrealized appreciation and depreciation of investments, based on cost for federal income tax purposes were as follows:
| | | | | | | | | | | International Opportunities Fund | | | | | | | | | | |
| Cost of Investments | | $ | 789,756 | | | $ | 545,451 | | | $ | 333,394 | | | $ | 123,443 | | | $ | 432,386 | | | $ | 33,859 | | | $ | 5,272 | |
| | | | | | | | | | | | | | | | | | | | | | | | | | | | | |
| Gross Unrealized Appreciation | | $ | 314,866 | | | $ | 239,409 | | | $ | 120,924 | | | $ | 30,171 | | | $ | 87,837 | | | $ | 17,203 | | | $ | 467 | |
| Gross Unrealized Depreciation | | | (12,674 | ) | | | (14,606 | ) | | | (4,585 | ) | | | (2,295 | ) | | | (6,572 | ) | | | (72 | ) | | | (288 | ) |
| | | | | | | | | | | | | | | | | | | | | | | | | | | | | |
| Net Unrealized Appreciation (Depreciation) on investments | | $ | 302,192 | | | $ | 224,803 | | | $ | 116,339 | | | $ | 27,876 | | | $ | 81,265 | | | $ | 17,131 | | | $ | 179 | |
The difference between cost amounts for financial statement and federal income tax purposes is due primarily to wash sale loss deferrals and PFICs.
The Flexible Capital Fund had realized capital losses (in thousands) from transactions between November 1, 2010 and September 30, 2011 of $16,092. The Flexible Capital Fund has elected to treat post-October capital losses as arising in the next fiscal year.
The Focus Fund, Growth Fund, 21st Century Fund, International Opportunities Fund, Flexible Capital Fund, and Global Fund had realized currency losses (in thousands) from transactions between November 1, 2010 and September 30, 2011 of $0, $0, $131, $1,710, $150, and $52 respectively. Each Fund has elected to treat post-October currency losses as arising in the next fiscal year.
At September 30, 2011, the Funds had accumulated capital loss carryforwards (in thousands) as follows:
| | | | | | | | | | | International Opportunities Fund | | | | | | | | | | |
| For Losses Expiring September 30, | | | | | | | | | | | | | | | | | | | | | |
| 2017 | | $ | — | | | $ | 54,807 | | | $ | 207,284 | | | $ | 45,122 | | | $ | — | | | $ | 10,100 | | | $ | — | |
| 2018 | | | 20,227 | | | | — | | | | 390,537 | | | | 93,558 | | | | — | | | | 6,440 | | | | — | |
| Not Subject to Expiration | | | — | | | | — | | | | — | | | | — | | | | — | | | | — | | | | 1,204 | |
| | | $ | 20,227 | | | $ | 54,807 | | | $ | 597,821 | | | $ | 138,680 | | | $ | — | | | $ | 16,540 | | | $ | 1,204 | |
To the extent that a Fund may realize future net capital gains, those gains will be offset by any of its unused capital loss carryforward. Future capital loss carryover utilization in any given year may be subject to Internal Revenue Code limitations.
Under the recently enacted Regulated Investment Company Modernization Act of 2010 (the “Act”), the Funds will be permitted to carryforward capital losses incurred in taxable years beginning after December 22, 2010 for an unlimited period. However, any losses incurred during those future taxable years will be required to be utilized prior to the losses incurred in pre-enactment taxable years. As a result of this ordering rule, pre-enactment capital loss carryforwards may be more likely to expire unused. Additionally, post-enactment capital losses that are carried forward will retain their character as either short-term or long-term capital losses rather than being considered all short-term as under previous law.
The Focus Fund, Growth Fund, 21st Century Fund, International Opportunities Fund, Flexible Capital Fund, and Global Fund utilized (in thousands) $236,033, $173,943, $80,563, $54,448, $595, and $7,293, respectively, of its capital loss carryforwards, during the year ended September 30, 2011.
| |
NOTES TO FINANCIAL STATEMENTS |
| |
As of September 30, 2011, the components of accumulated earnings (deficit) on a tax basis were as follows:
| | | | | | | | | | | International Opportunities Fund | | | | | | | | | | |
| Undistributed Ordinary Income (Deficit) | | $ | — | | | $ | 289 | | | $ | — | | | $ | 573 | | | $ | 1,097 | | | $ | (11 | ) | | $ | — | |
| Undistributed Trustees’ Deferred Compensation | | | (1,177 | ) | | | (678 | ) | | | (418 | ) | | | (162 | ) | | | (145 | ) | | | (65 | ) | | | 12 | |
| Undistributed Long-Term Capital Gains | | | — | | | | — | | | | — | | | | — | | | | — | | | | — | | | | — | |
| Tax Accumulated Earnings (Deficit) | | | (1,177 | ) | | | (389 | ) | | | (418 | ) | | | 411 | | | | 952 | | | | (76 | ) | | | 12 | |
| Accumulated Capital and Other Losses | | | (20,227 | ) | | | (54,807 | ) | | | (597,952 | ) | | | (140,390 | ) | | | (16,242 | ) | | | (16,592 | ) | | | (1,204 | ) |
| Unrealized Appreciation (Depreciation) on Investments and on Foreign Currency Translations | | | 107,507 | | | | 85,634 | | | | (11,634 | ) | | | (1,861 | ) | | | (8,561 | ) | | | 6,405 | | | | (1,072 | ) |
| Trustees Deferred Compensation Mark to Market | | | 34 | | | | 24 | | | | (11 | ) | | | (40 | ) | | | 104 | | | | 34 | | | | (13 | ) |
| Total Accumulated Earnings (Deficit) | | $ | 86,137 | | | $ | 30,462 | | | $ | (610,015 | ) | | $ | (141,880 | ) | | $ | (23,747 | ) | | $ | (10,229 | ) | | $ | (2,277 | ) |
Undistributed ordinary income (deficit) consists of net investment income and timing differences related to post-October currency losses, PFICs, and forward foreign currency contracts.
The tax character of distributions paid during the fiscal years ended September 30, 2011 and 2010 were as follows:
| (Amounts in thousands) | | | | | | |
| | | | | | | | | | | | |
| Focus Fund | | $ | — | | | $ | — | | | $ | 3,909 | | | $ | — | |
| Growth Fund | | | 473 | | | | — | | | | 5,169 | | | | — | |
21st Century Fund | | | — | | | | — | | | | — | | | | — | |
| International Opportunities Fund | | | 6,560 | | | | — | | | | 2,073 | | | | — | |
| Flexible Capital Fund | | | 2,489 | | | | 477 | | | | 1,302 | | | | — | |
| Global Fund | | | 1,099 | | | | — | | | | 721 | | | | — | |
| Emerging Markets Fund | | | — | | | | — | | | | — | | | | — | |
The tax character of dividends paid may differ from that shown in the Statements of Changes in Net Assets due to short-term gains being treated as ordinary income for tax purposes.
Except for matters previously disclosed, management of the Adviser has determined that there were no material events that would require disclosure in the Funds’ financial statements.
| 8. | New Accounting Pronouncements |
In May 2011, the Financial Accounting Standards Board (“FASB”) issued Accounting Standards Update (“ASU”) No. 2011-04 “Amendments to Achieve Common Fair Value Measurement and Disclosure Requirements in GAAP and the International Financial Reporting Standards (“IFRSs”)”. ASU No. 2011-04 amends FASB Accounting Standards Codification Topic 820, Fair Value Measurement and Disclosures, to establish common requirements for measurement of and disclosure about fair value between GAAP and IFRSs. Additionally, ASU No. 2011-04 will require reporting entities to disclose certain information for fair value measurements categorized within Level 3 of the fair value hierarchy such as quantitative information about the unobservable inputs used in the fair value measurement, the valuation processes used by the reporting entity and a narrative description of the sensitivity of the fair value measurement to changes in unobservable inputs and the interrelationships between those unobservable inputs. ASU No. 2011-04 will further require reporting entities to make disclosures about amounts and reasons for transfers into and out of Level 1 and Level 2 fair value measurements. ASU No. 2011-04 is effective for fiscal years beginning after December 15, 2011 and for interim periods within those fiscal years. The Adviser is currently evaluating the impact the adoption of these amendments may have on the Funds’ financial statement disclosures.
EXPENSE EXAMPLE For the six-months ended March 31, 2012 (Unaudited)
As a shareholder of the Marsico Funds (the “Funds”), you incur two types of costs: (1) transaction costs, including redemption fees on certain redemptions; and (2) ongoing costs, including management fees, distribution (12b-1) fees, and other Fund expenses. This Example is intended to help you understand your ongoing costs (in dollars) of investing in the Funds and to compare these costs with the ongoing costs of investing in other mutual funds.
The Example is based on an investment of $1,000 invested at the beginning of the period and held for the entire period from October 1, 2011 to March 31, 2012 (the “period”).
The first line of the table below provides information about actual account values and actual expenses. You may use the information in this line, together with the amount you invested, to estimate the expenses you paid over the period. Simply divide your account value by $1,000 (for example, an $8,600 account value divided by $1,000 equals 8.6), then multiply the result by the number in the first line under the heading entitled “Expenses paid for the six-month period ended March 31, 2012” to estimate the expenses you paid on your account during the period.
| Hypothetical Example for Comparison Purposes |
The second line of the table below provides information about hypothetical account values and hypothetical expenses based on the Funds’ actual expense ratios and an assumed rate of return of 5% per year before expenses, which is not the actual return of any of the Funds. The hypothetical account values and expenses may not be used to estimate the actual ending account balance or expenses you paid for the period. You may use this information to compare the ongoing costs of investing in the Funds and other funds. To do so, compare this 5% hypothetical example with the 5% hypothetical examples that appear in the shareholder reports of other funds.
Please note that the expenses shown in the table are meant to highlight your ongoing costs only and do not reflect any transactional costs, such as redemption fees. Therefore, the second line of the table is useful in comparing the ongoing costs only, and will not help you determine the relative total costs of owning different funds. In addition, if these transactional costs were included, your costs could have been higher.
| Expenses Paid During the Period | | Beginning account value October 1, 2011 | | | Ending account value March 31, 2012 | | | Expenses paid for the six-month period ended March 31, 2012(1) | |
| FOCUS FUND | | | | | | | | | |
| Actual Example | | $ | 1,000.00 | | | $ | 1,281.80 | | | $ | 7.78 | |
| Hypothetical Example, assuming a 5% return before expenses | | $ | 1,000.00 | | | $ | 1,018.18 | | | $ | 6.89 | |
| | | | | | | | | | | | | |
| GROWTH FUND | | | | | | | | | | | | |
| Actual Example | | $ | 1,000.00 | | | $ | 1,275.90 | | | $ | 7.82 | |
| Hypothetical Example, assuming a 5% return before expenses | | $ | 1,000.00 | | | $ | 1,018.13 | | | $ | 6.93 | |
| | | | | | | | | | | | | |
21st CENTURY FUND | | | | | | | | | | | | |
| Actual Example | | $ | 1,000.00 | | | $ | 1,287.90 | | | $ | 8.18 | |
| Hypothetical Example, assuming a 5% return before expenses | | $ | 1,000.00 | | | $ | 1,017.85 | | | $ | 7.22 | |
| | | | | | | | | | | | | |
| INTERNATIONAL OPPORTUNITIES FUND | | | | | | | | | | | | |
| Actual Example | | $ | 1,000.00 | | | $ | 1,218.70 | | | $ | 8.87 | |
| Hypothetical Example, assuming a 5% return before expenses | | $ | 1,000.00 | | | $ | 1,017.00 | | | $ | 8.07 | |
| | | | | | | | | | | | | |
| FLEXIBLE CAPITAL FUND | | | | | | | | | | | | |
| Actual Example | | $ | 1,000.00 | | | $ | 1,255.50 | | | $ | 8.29 | |
| Hypothetical Example, assuming a 5% return before expenses | | $ | 1,000.00 | | | $ | 1,017.65 | | | $ | 7.42 | |
| | | | | | | | | | | | | |
| GLOBAL FUND | | | | | | | | | | | | |
| Actual Example | | $ | 1,000.00 | | | $ | 1,298.00 | | | $ | 9.19 | |
| Hypothetical Example, assuming a 5% return before expenses | | $ | 1,000.00 | | | $ | 1,017.00 | | | $ | 8.07 | |
| | | | | | | | | | | | | |
| EMERGING MARKETS FUND | | | | | | | | | | | | |
| Actual Example | | $ | 1,000.00 | | | $ | 1,180.30 | | | $ | 9.54 | |
| Hypothetical Example, assuming a 5% return before expenses | | $ | 1,000.00 | | | $ | 1,016.25 | | | $ | 8.82 | |
| (1) | Expenses are equal to the Funds’ annualized expense ratios (1.364% for the Focus Fund, 1.374% for the Growth Fund, 1.431% for the 21st Century Fund, 1.600% for the International Opportunities Fund, 1.470% for the Flexible Capital Fund, 1.600% for the Global Fund, and 1.750% for the Emerging Markets Fund), multiplied by the average account value over the period, multiplied by 183/366 (to reflect the six-month period). |
| |
CONSIDERATION OF INVESTMENT ADVISORY AGREEMENTS |
| |
CONSIDERATION OF INVESTMENT ADVISORY AGREEMENTS (Unaudited)
At a meeting of the Board of Trustees of the Trust held on November 8, 2011 the Trustees, by a unanimous vote (including a separate vote of those Trustees who are not “interested persons” (as the term is defined in the 1940 Act) (the “Independent Trustees”), approved the renewal of the Investment Advisory and Management Agreements (the “Agreements”) for the Focus Fund, Growth Fund, 21st Century Fund, International Opportunities Fund, Flexible Capital Fund and Global Fund. The Investment Advisory and Management Agreement for the Emerging Markets Fund was not up for renewal this year because that agreement has a two-year initial term beginning December 30, 2010. In advance of the meeting, the Independent Trustees requested and received extensive materials from the Adviser to assist them in considering the renewal of the Agreements for the Focus Fund, Growth Fund, 21st Century Fund, International Opportunities Fund, Flexible Capital Fund and Global Fund. The materials provided by the Adviser contained information with respect to the factors noted below, including detailed comparative information relating to the performance, advisory fees and other expenses of the Funds, other funds sub-advised by the Adviser and non-fund advisory accounts of the Adviser. The materials also included comparisons of the Funds with other funds and non-fund accounts of similar size and investment objectives in terms of performance, fees and other expenses, as well as the performance of each Fund versus its benchmark. In addition, the Adviser provided information regarding its overall expenses and profitability, as well as estimates of its costs and profitability relating to managing the Funds.
In addition to the materials prepared specifically for contract review analysis, on an ongoing basis the Trustees receive information and reports from the Adviser and other service providers to the Funds on investment performance as well as operational, compliance and other matters.
The Trustees engaged in a detailed discussion of the materials with management of the Adviser. The Independent Trustees then met separately with independent counsel to the Independent Trustees for a full review of the materials. Following this session, the full Board reconvened and approved the continuation of the Agreements for the Focus Fund, Growth Fund, 21st Century Fund, International Opportunities Fund, Flexible Capital Fund and Global Fund.
| Discussion of Factors Considered |
In connection with the consideration of the Agreements, the Trustees, including the Independent Trustees, requested and received from the Adviser, and reviewed, a wide variety of information, including information about (1) the nature, extent, and quality of the services provided by the Adviser; (2) the investment performance of the Funds and the Adviser; (3) the costs of the services to be provided and profits realized by the Adviser and its affiliates from the relationship with the Funds; (4) the extent to which economies of scale may be realized as the Funds grow; and (5) whether fee levels reflect these economies of scale for the benefit of Fund investors; as well as other relevant considerations such as the management fees and expense ratios of each Fund; potential fall-out benefits to the Adviser from its relationship to each Fund; and other general information about the Adviser. The following is a summary of the Board’s discussion and views regarding these factors.
| 1. | Nature, Extent, and Quality of Services. |
The Independent Trustees considered the nature, quality and extent of the services performed by the Adviser under the Investment Advisory Agreements (the “Agreements”) with the Adviser, including portfolio management, supervision of Fund operations and compliance and regulatory filings and disclosures to shareholders, general oversight of other service providers, coordination of Fund marketing initiatives, review of Fund legal issues, assisting the Trustees in that capacity and other services. The Independent Trustees concluded that the services are extensive in nature, that the Adviser effectively manages the outsourcing by the Funds to other service providers and that the Adviser consistently delivered a high level of service.
| 2. | Investment Performance of the Funds and Adviser. |
The Independent Trustees considered short-term and long-term investment performance for each Fund over various periods of time as compared to both relevant equity indices and the performance of such Fund’s Lipper, Inc. peer group universe. The peer group information may not be fully comparable as it is based on data from the peer funds’ most recent available fiscal year, which in some cases ended earlier than data periods considered for the Funds. The Funds’ information, in contrast, is current information fully reflecting current markets. The Independent Trustees also considered that the Funds are typically managed in a tax-efficient manner, which could also make peer group performance information not comparable to the Funds. The Independent Trustees also noted MCM’s continued investment in research, despite a reduction in fee revenue due to a decline in assets of most Funds over the past year. The Independent Trustees concluded that the Adviser was managing the Funds consistent with their long-term investment strategies. The Independent Trustees noted the continued improvement in the performance of the Focus Fund and Growth Fund while recognizing the underperformance in relation to peers and its benchmark in certain past periods. The Independent Trustees also recognized the
| |
CONSIDERATION OF INVESTMENT ADVISORY AGREEMENTS |
| |
CONSIDERATION OF INVESTMENT ADVISORY AGREEMENTS (Unaudited) (continued)
recent promotion of Brandon Geisler to portfolio manager of the 21st Century Fund and the corresponding portfolio changes made, which are intended to add balance and breadth to the portfolio of the 21st Century Fund. For the International Opportunities Fund and Global Fund, the Independent Trustees understood the sources of the underperformance over various periods and were satisfied that the Adviser was taking appropriate steps to address performance matters. The Independent Trustees also noted that the investment performance delivered by the Adviser to the Funds appeared to be consistent with the performance delivered for other clients of the Adviser. The Independent Trustees would continue at their regular meetings to monitor steps the Adviser is taking to address performance matters for certain Funds.
| 3. | Costs of Services and Profits Realized by the Adviser. |
(a) Costs of Services to Funds: Fees and Expenses. The Independent Trustees considered each Fund’s management fee rates and expense ratios relative to industry averages for such Fund’s benchmark category and the advisory fees charged by the Adviser to other sub-advised funds and non-fund clients, including information regarding expense limitation commitments from the Adviser, and the breakpoints for certain Funds’ advisory services. The Independent Trustees noted that the mix of services under the Agreements are much more extensive than those under the Adviser’s advisory agreements for sub-advised funds as well as non-fund clients. While the Independent Trustees noted that the investment advisory fees paid by the Funds are generally in the upper quartile of their peer groups, they were cognizant that it is difficult to know whether the services provided by advisers to peer funds are as extensive as those provided by MCM to the Funds. The Independent Trustees noted the actions taken by MCM to reduce Fund expenses, including that MCM had waived fees and absorbed expenses from time to time, and that some of those expenditures were not expected to be recouped. The Independent Trustees concluded that the investment advisory fees are acceptable based upon the qualifications, experience, reputation, and performance of the Adviser and the low-to-moderate overall expense ratios of the Funds.
(b) Profitability and Costs of Services to Adviser. The Independent Trustees considered the Adviser’s overall profitability and costs and a pro forma estimate of the Adviser’s profitability and costs if the Funds constituted the Adviser’s only assets under management. The Independent Trustees took into consideration that MCM’s fee revenue from the Funds had declined as most Funds’ assets had declined, and that MCM had completed a debt restructuring that could in some circumstances potentially reduce its profitability over the short and intermediate term to facilitate debt repayment (while strengthening MCM’s overall financial position and profitability over the long term), but that MCM had not reduced services or investment personnel as a result. The Independent Trustees also considered whether the amount of profit is a fair entrepreneurial profit for the management of each Fund, and noted that the Adviser has substantially increased its resources devoted to Fund matters in response to regulatory requirements enacted during the last few years and Fund policies and procedures that were adopted or enhanced in late 2004 and thereafter. The Independent Trustees concluded that the Adviser’s profitability was at an acceptable level, particularly in light of the extent and quality of the services being provided to the Funds.
| 4. | Extent of Economies of Scale as Funds Grow. |
The Independent Trustees considered whether there have been economies of scale with respect to the management of each Fund and whether such Fund has appropriately benefited from any economies of scale. The Independent Trustees noted that economies of scale may develop for certain Funds as their assets increase and their Fund-level expenses decline as a percentage of assets, but that Fund-level economies of scale may not necessarily result in Adviser-level economies of scale. The written materials presented to the Independent Trustees indicate that the expenses incurred by the Adviser relating to management of the existing Funds have increased substantially in recent years as a percentage of management fees and that the asset levels of certain Funds had decreased over the past year. Given the decline in the assets in most of the Funds over the past year, the Independent Trustees agreed that it was possible that if trends changed and Fund assets began growing again beyond certain thresholds, Adviser-level expenses incurred in managing the Funds eventually could level off or decline as a percentage of management fees in the future.
| 5. | Whether Fee Levels Reflect Economies of Scale. |
The Independent Trustees also considered whether the management fee rate is reasonable in relation to the asset size of each Fund and any economies of scale that may exist. The Independent Trustees noted that, effective November 11, 2004, at the behest of the Independent Trustees, breakpoints had been introduced for the two larger Funds, the Focus Fund and the Growth Fund, for assets in excess of $3 billion in each Fund. Under the breakpoints, investment management fees are 0.85% per year of average daily net assets up to $3 billion in each of those two Funds, and 0.75% per year of average daily net assets exceeding $3 billion in each Fund. The Independent Trustees also took note that the Adviser also intended to renew the voluntary fund expense limitations for each of the Funds until at least January 31, 2013, all subject to possible future recoupment of previously waived fees or other expenses under
| |
CONSIDERATION OF INVESTMENT ADVISORY AGREEMENTS |
| |
certain conditions. Given the decline in the assets of most of the Funds over the past year, the Independent Trustees did not consider there to have been economies of scale realized by the Adviser in managing the Funds. The Independent Trustees agreed to continue to monitor whether any additional breakpoints for any of the Funds may be appropriate in the future.
| 6. | Other Relevant Considerations. |
(a) Adviser Personnel and Methods. The Independent Trustees considered information about the financial condition of the Adviser, including information about MCM’s debt restructuring and its potential effects on MCM’s profitability, and the Adviser’s stated commitment to maintaining a high quality investment management operation, including in the areas of investment analysis, research, trading, compliance, and operations. They also considered the size, education and experience of the Adviser’s staff. There was also a review of the Adviser’s “top down” economic analysis with “bottom up” stock selection. This two-pronged approach considering both macro-economic factors, such as interest rates, inflation and the global competitive landscape, and seeking to identify individual companies with unique market presence and potential earnings growth that may not be recognized by the market at-large, was regarded by the Trustees as consistent with the Funds’ disclosure documents and, therefore, investor expectations. MCM’s corporate culture and investment team structure were further viewed as facilitating the recruitment, training and retention of portfolio managers and other research and management personnel.
(b) Other Benefits to the Adviser. The Independent Trustees also considered the character and amount of other incidental benefits received by the Adviser and its affiliates from its association with the Funds. The Independent Trustees concluded that potential “fall-out” benefits that the Adviser may receive, such as greater name recognition or increased ability to obtain research or brokerage services, appear to be reasonable, and may in some cases benefit the Funds.
In considering the Agreements, the Independent Trustees did not identify any factor as all-important or all-controlling and instead considered these factors collectively in light of each Fund’s surrounding circumstances. Based on this review, it was the judgment of the Independent Trustees that each Fund’s fees were reasonable, the extent and quality of services were acceptable and the Adviser’s steps to address performance issues for certain Funds was satisfactory. Therefore, re-approval of the Agreements was in the best interests of each Fund and its shareholders. As a part of their decision-making process, the Independent Trustees noted that the Adviser has managed the Funds since their inception, and the Independent Trustees believe that a long-term relationship with a capable, conscientious adviser is in the best interests of the Funds and their shareholders. The Independent Trustees considered, generally, that shareholders invested in a Fund knowing that the Adviser managed that Fund and knowing its investment management fee. As such, the Independent Trustees considered, in particular, whether the Adviser managed each Fund in accordance with its investment objectives and policies as disclosed to shareholders. The Independent Trustees concluded that each Fund was managed by the Adviser consistent with its investment objectives and policies. Additionally, as part of its deliberations, the Board also considered and relied upon the information about the Funds and MCM that had been provided to them throughout the year in connection with their regular Board meetings at which they engage in the ongoing oversight of the Funds and their operations.
Upon conclusion of their review and discussion, the Independent Trustees unanimously agreed the Agreements for each of the Funds were appropriate.
OTHER INFORMATION (Unaudited) |
The Funds exercise the voting rights associated with the securities held by the Funds under the proxy voting policy of the Funds. A description of those policies and procedures of the Funds and a record of the Funds’ proxy votes for the one-year period ended June 30, 2011 are available without charge, upon request, by calling 888-860-8686. It is also available on the Securities and Exchange Commission’s website at www.sec.gov.
| Quarterly Filing of Portfolio Holdings |
The Funds will file their complete schedule of investments with the SEC for the first and third quarters of each fiscal year on Form N-Q. The Funds’ Form N-Q will be available (i) on the SEC’s Website at www.sec.gov; (ii) at the SEC’s Public Reference Room; and (iii) by calling 800-SEC-0330.
As of January 1, 2012, federal law requires that mutual fund companies must maintain and report a shareholder’s cost basis by tax lot, gain/loss information, and holding period of “covered” security sales to the Internal Revenue Service (“IRS”) on Form 1099. Covered securities, that are mutual fund shares, are shares acquired on or after January 1, 2012. A fund is not responsible for maintaining and reporting share information if such shares are not deemed “covered”.
The new tax regulations require that the Funds elect a default tax identification methodology in order to perform the required reporting. As a result, the Funds have chosen the first-in-first-out (“FIFO”) method as the default tax lot identification method for its shareholders. This is the method the Funds will use to determine which specific shares are deemed to be sold when a shareholder’s entire position is not sold in a single transaction and is the method in which “covered” share sales will be reported on a shareholder’s Form 1099.
However, at the time of purchase or upon the sale of “covered” shares, shareholders may choose a different tax lot identification method. Shareholders should consult a tax advisor with regard to their personal circumstances as the Funds and their service providers do not provide tax advice.
| The Marsico Investment Fund UMB Distribution Services, LLC, Distributor P.O. Box 3210, Milwaukee, WI 53201-3210 www.marsicofunds.com • 888.860.8686
©2012 MARSICO CAPITAL MANAGEMENT, LLC
Not authorized for distribution unless preceded or accompanied by an effective Marsico Funds prospectus. |