|
SEMI-ANNUAL REPORT MARCH 31, 2013 |
APRIL 2013
DEAR SHAREHOLDER: Enclosed is your semi-annual report for The Marsico Investment Fund, encompassing the six-month fiscal period from October 1, 2012 to March 31, 2013. The purpose of this report is to provide a review of the Marsico Funds’ six-month investment results by discussing what we believe were the main areas that impacted performance – including the macroeconomic environment, sector and industry positioning, and individual stock selection – as compared to the Funds’ performance benchmark indexes. For updated information regarding the market environment and the Funds’ overall investment postures and performance, please refer to the Funds’ most recent monthly fact sheets and quarterly investment updates, which are available under the name of each Fund on the Funds’ website at www.marsicofunds.com. |
| | KEY FUND STATISTICS | 2 | |
| | MARKET ENVIRONMENT | 5 | |
| | | | |
| | |
| | Investment Review | 6 | |
| | Fund Overview | 9 | |
| | Schedule of Investments | 10 | |
| | | | |
| | |
| | Investment Review | 6 | |
| | Fund Overview | 11 | |
| | Schedule of Investments | 12 | |
| | | | |
| | MARSICO 21st CENTURY FUND |
| | Investment Review | 14 | |
| | Fund Overview | 16 | |
| | Schedule of Investments | 17 | |
| | | | |
| | MARSICO INTERNATIONAL OPPORTUNITIES FUND |
| | Investment Review | 19 | |
| | Fund Overview | 21 | |
| | Schedule of Investments | 22 | |
| | | | |
| | MARSICO FLEXIBLE CAPITAL FUND |
| | Investment Review | 24 | |
| | Fund Overview | 26 | |
| | Schedule of Investments | 27 | |
| | | | |
| | |
| | Investment Review | 29 | |
| | Fund Overview | 31 | |
| | Schedule of Investments | 32 | |
| | | | |
| | FINANCIAL STATEMENTS | 34 | |
| | NOTES TO FINANCIAL STATEMENTS | 44 | |
| | EXPENSE EXAMPLE | 53 | |
| | CONSIDERATION OF INVESTMENT ADVISORY AGREEMENTS | 54 | |
| | OTHER INFORMATION | 57 | |
| |
| KEY FUND STATISTICS (UNAUDITED) |
| |
Marsico Focus Fund | Marsico Growth Fund | Marsico 21st Century Fund |
| MFOCX | MGRIX | MXXIX |
| For additional disclosures, please see page 9. | For additional disclosures, please see page 11. | For additional disclosures, please see page 16. |
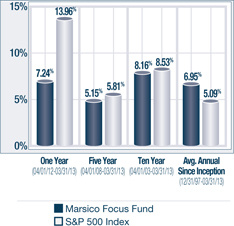
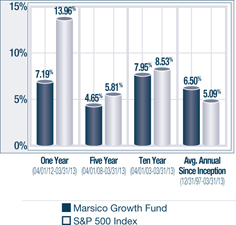
PERFORMANCE COMPARISON(1) | PERFORMANCE COMPARISON(1) | PERFORMANCE COMPARISON(1) |
| | |
TOTAL ANNUAL OPERATING
EXPENSES* 1.34% | TOTAL ANNUAL OPERATING
EXPENSES* 1.35% | TOTAL ANNUAL OPERATING
EXPENSES* 1.42% |
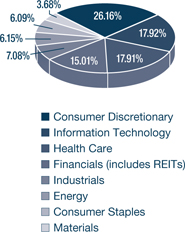
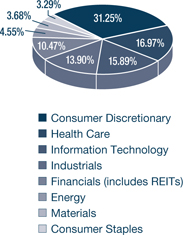
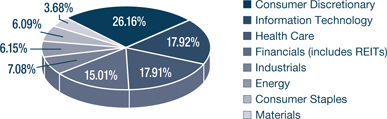
SECTOR ALLOCATION(2) | SECTOR ALLOCATION(2) | SECTOR ALLOCATION(2) |
| | |
| TOP FIVE HOLDINGS | TOP FIVE HOLDINGS | TOP FIVE HOLDINGS |
| GILEAD SCIENCES, INC. | 5.71% | GILEAD SCIENCES, INC. | 5.25% | BIOGEN IDEC INC. | 3.77% |
| BIOGEN IDEC INC. | 5.43% | BRISTOL-MYERS SQUIBB COMPANY | 4.38% | GILEAD SCIENCES, INC. | 3.72% |
| BRISTOL-MYERS SQUIBB COMPANY | 4.72% | BIOGEN IDEC INC. | 4.29% | MONSANTO COMPANY | 3.42% |
| VISA, INC. - CL. A | 4.42% | EBAY, INC. | 4.27% | LOWE'S COMPANIES, INC. | 3.26% |
| EBAY, INC. | 4.35% | GOOGLE, INC. - CL. A | 3.12% | PRECISION CASTPARTS CORP. | 3.06% |
For additional disclosures about the Marsico Funds, please see page 4. The performance data quoted here represent past performance, and past performance is not a guarantee of future results. Investment return and principal value of an investment will fluctuate so that an investor’s shares, when redeemed, may be worth more or less than their original cost.
| |
| KEY FUND STATISTICS (UNAUDITED) |
| |
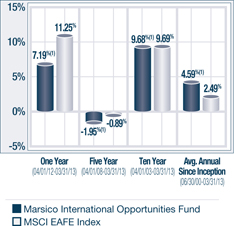
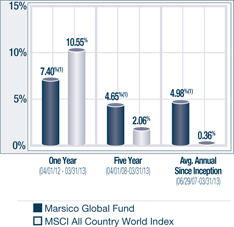
Marsico International Opportunities Fund | Marsico Flexible Capital Fund | Marsico Global Fund |
| MIOFX | MFCFX | MGLBX |
| For additional disclosures, please see page 21. | For additional disclosures, please see page 26. | For additional disclosures, please see page 31. |
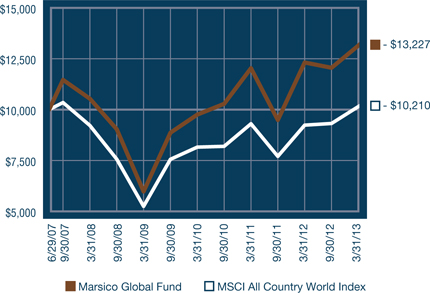
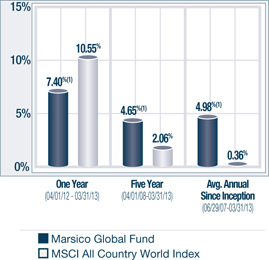
PERFORMANCE COMPARISON(1) | PERFORMANCE COMPARISON(1) | PERFORMANCE COMPARISON(1) |
| | |
TOTAL ANNUAL OPERATING
EXPENSES* 1.65% NET EXPENSES*† 1.60% | TOTAL ANNUAL OPERATING
EXPENSES* 1.44% | TOTAL ANNUAL OPERATING
EXPENSES* 1.71% NET EXPENSES*† 1.61% |
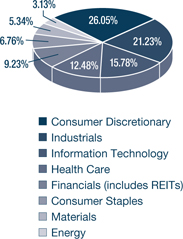
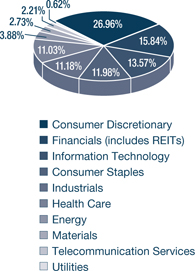
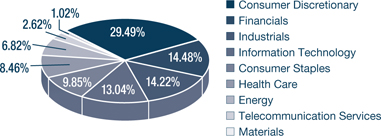
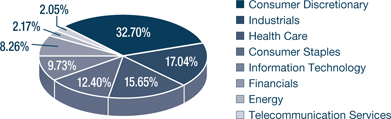
SECTOR ALLOCATION(2) | SECTOR ALLOCATION(2) | SECTOR ALLOCATION(2) |
| | |
| TOP FIVE HOLDINGS | TOP FIVE HOLDINGS | TOP FIVE HOLDINGS |
| LIBERTY GLOBAL, INC. SERIES C | 3.25% | LIBERTY GLOBAL, INC. SERIES C | 4.39% | ROCHE HOLDING AG | 4.95% |
| ROCHE HOLDING AG | 2.99% | AUTOZONE, INC. | 4.08% | ROLLS-ROYCE HOLDINGS PLC | 4.58% |
| NESTLÉ S.A. | 2.93% | LOWE'S COMPANIES, INC. | 3.95% | BIOGEN IDEC INC. | 3.90% |
| DIAGEO PLC | 2.73% | MONDELEZ INTERNATIONAL, INC. - CL. A | 3.76% | EBAY, INC. | 3.76% |
| TELECITY GROUP PLC | 2.72% | UNITED RENTALS, INC. | 2.97% | GOOGLE, INC. - CL. A | 3.62% |
Current performance may be lower or higher than the performance information quoted. To obtain performance information current to the most recent month-end, please call 888-860-8686 or visit www.marsicofunds.com. A redemption fee may be imposed on redemptions or exchanges of Fund shares held for 30 days or less.
| |
| KEY FUND STATISTICS (UNAUDITED) |
| |
ADDITIONAL DISCLOSURES ABOUT THE MARSICO FUNDS
| * | The Total Annual Operating Expenses and Net Expenses are reflective of the information disclosed in the Funds’ Prospectus dated February 1, 2013. The information may differ from the expense ratios disclosed in this report. |
| † | Marsico Capital Management, LLC (the “Adviser”) has entered into a written expense limitation and fee waiver agreement under which it has agreed to limit the total expenses of each of the International Opportunities Fund and the Global Fund (excluding interest, taxes, acquired fund fees and expenses, litigation, brokerage and extraordinary expenses) to an annual rate of 1.60% of each Fund’s average net assets until January 31, 2014. This expense limitation and fee waiver agreement may be terminated by the Adviser at any time after January 31, 2014, upon 15 days prior notice to the Fund and its administrator. The Adviser may recoup from a Fund fees previously waived or expenses previously reimbursed by the Adviser with respect to that Fund pursuant to this agreement (or a previous expense limitation agreement) if such reimbursement does not cause the Fund to exceed the expense limitation currently in effect and the reimbursement is made within three years after the year in which the Adviser waived the fee or reimbursed the expense. |
| (1) | The performance data quoted here represent past performance, and past performance is not a guarantee of future results. Investment return and principal value of an investment will fluctuate so that an investor’s shares, when redeemed, may be worth more or less than their original cost. Current performance may be lower or higher than the performance information quoted. To obtain performance information current to the most recent month-end, please call 888-860-8686 or visit www.marsicofunds.com. A redemption fee may be imposed on redemptions or exchanges of Fund shares held for 30 days or less. |
| | The performance included in the chart does not reflect the deduction of taxes on Fund distributions or the redemption of Fund shares. |
| | All indices are unmanaged and investors cannot invest directly in an index. |
| | The performance returns for the 21st Century Fund (for the period prior to March 31, 2004), the International Opportunities Fund (for the period prior to September 30, 2004 and from October 2011 through March 2013), the Flexible Capital Fund (for the period prior to February 1, 2011), and the Global Fund (for the period prior to January 1, 2009, from April 2009 through May 2009 and from January 2012 through March 2013) reflect a fee waiver in effect; in the absence of such a waiver, the returns would be reduced. The performance returns for the 21st Century Fund (for the period beginning April 2004 through January 2005), the International Opportunities Fund (for the period beginning October 2004 through December 2005), and the Global Fund (for the one-month period June 2009) would have been higher but for the reimbursement of fees waived previously. |
| (2) | Sector weightings represent the percentage of the respective Fund’s investments (excluding cash equivalents) in certain general sectors. These sectors may include more than one industry. The Fund’s portfolio composition is subject to change at any time. |
MARKET ENVIRONMENT: OCTOBER 2012 – MARCH 2013 (UNAUDITED)
Equities markets were able to surmount policy-related uncertainty and responded favorably to a variety of stabilizing and improving economic data and ultra-accommodative central bank policy around the globe. Stocks posted solid gains for the six-month fiscal period ended March 31, 2013, albeit with considerable intra-period volatility.
US equities were pressured by a tightly-contested, contentious Presidential election and worries regarding the “fiscal cliff” tax increases and spending cut machinations in Washington. However, those negative forces were counterbalanced by a number of solid corporate earnings reports and generally improving economic data. The market was buoyed by optimism that the US housing recovery is entrenched and that employers are starting to hire again. The S&P 500 Index ended the period at 1,569, eclipsing its previous nominal high of 1,565 set on October 9, 2007. At March 31, 2013, the index had recouped its entire decline associated with the financial crisis and recession, and ended up 132% (on a price return basis) since the low of 677 reached on March 9, 2009.
Central bank intervention remained at the forefront. Federal Reserve Chairman Ben Bernanke and European Central Bank President Mario Draghi made it clear that they continue to support accommodative monetary policies. Based on the significant increase in assets on central bank balance sheets, it appears that many of the world’s central bankers have joined the fight against deflation. The newest entrant to the fray, the Bank of Japan, vowed to double its holdings of government bonds and double the amount of yen circulating in the economy. Such policy moves, in our view, seemed to overshadow troubles such as Cyprus’s banking crisis, an inconclusive Italian election and continued political discord in Washington.
As depicted in the table below, developed market equities posted strong returns for the six-month period ended March 31, 2013, while emerging markets experienced muted gains:
Index Name(1) | Universe of Equities Represented | Six-Month
Total Return |
| US | | |
| S&P 500 | US large-capitalization equities | +10.19% |
| Russell 3000 | US publicly-traded equities of all sizes | +11.35% |
| Russell 2000 | US small-capitalization equities | +14.48% |
| Russell Mid-Cap | US medium-capitalization equities | +16.21% |
Index Name(1) | Universe of Equities Represented | Six-Month
Total Return |
| INTERNATIONAL | |
| MSCI EAFE (US$) | Equities in developed international equity markets, including Japan, Western Europe, and Australasia | +12.04% |
| MSCI Emerging Markets (US$) | Equities in developing international equity markets, including China, India, Eastern Europe, and Latin America | +3.86% |
| MSCI ACWI (US$) | Equities in the global developed and emerging markets | +9.57% |
In terms of the underlying dynamics of US equity market performance, small- and mid-capitalization stocks outperformed large-capitalization stocks.
In emerging markets, concerns regarding slower growth and rising inflation resulted in relatively weak performance. China’s industrial production showed signs of slowing during the period, leading investors to question the direction of the Chinese economy going forward. India’s economy appeared to be on track to register its slowest growth rate in more than a decade. Brazil, meanwhile, has been challenged by rising inflation and high levels of consumer debt.
From a currency perspective, a number of major foreign currencies experienced sizeable fluctuations. One of the most notable was the weakening of the Japanese yen. Newly-elected Japanese officials took steps to weaken the yen in an effort to help stimulate Japan’s economy. The euro generally strengthened intra-period before moving lower as compared to the US dollar during the last two months of the reporting period. The US dollar, meanwhile, moved higher as compared to major world currencies during the late-stages of the reporting period. An appreciating US dollar dampened returns of US investors in foreign securities.
THE MARSICO INVESTMENT TEAM
| (1) | All indices are unmanaged and investors cannot invest directly in an index. |
INVESTMENT REVIEW BY TOM MARSICO AND CORALIE WITTER (UNAUDITED)
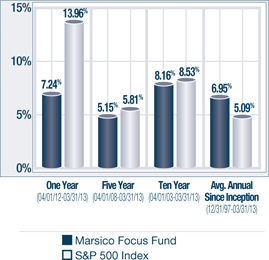
The Marsico Focus Fund and the Marsico Growth Fund generated total returns of +9.65% and +8.51%, respectively, for the six-month fiscal period ended March 31, 2013. While the Funds posted strong gains, both Funds’ performance lagged their benchmark index, the S&P 500 Index, which had a total return of +10.19% for the six-month period ended March 31, 2013. Please see the Funds’ Overviews for more detailed information about each Fund’s longer-term performance for various periods ended March 31, 2013.
The performance data for the Funds quoted here represent past performance, and past performance is not a guarantee of future results. Investment return and principal value of an investment will fluctuate so that an investor’s shares, when redeemed, may be worth more or less than their original cost. Current performance may be lower or higher than the performance information quoted. To obtain performance information current to the most recent month-end, please call 888-860-8686 or visit www.marsicofunds.com.(1)
This review highlights Fund performance over a six-month fiscal period. Shareholders should keep in mind that the Funds are intended for long-term investors who hold their shares for substantially longer periods of time. You should also keep in mind that our views on all investments discussed in this report are subject to change at any time. References to specific securities, industries, and sectors discussed in this report are not recommendations to buy or sell such securities or related investments, and the Funds may not necessarily hold these securities or investments today. Please see the accompanying Schedules of Investments for the percentage of each Fund’s portfolio represented by the securities mentioned in this report as of the end of the reporting period.
The Focus Fund is non-diversified and may hold fewer securities than a diversified fund because it is permitted to invest a greater percentage of its assets in a smaller number of securities. Holding fewer securities increases the risk that the value of the Fund could go down because of the poor performance of a single investment. The Funds and the stocks and markets in which they invest are subject to general risks that include periods of turbulence, instability, decline, and cyclical change, and that investors may continue to avoid investments in equity securities generally. Please see the Prospectus for more information.
The Focus Fund and the Growth Fund often invest in similar growth companies. Their performance may differ at times, however, because of a variety of factors. Among other factors, the Focus Fund is a non-diversified mutual fund that may invest in a more concentrated portfolio and may hold the securities of fewer issuers than the Growth Fund. As a result, the Focus Fund may hold some securities that are different from those held by the Growth Fund, and may be more exposed to individual stock volatility than the Growth Fund or other mutual funds that invest in a larger number of securities.
FOCUS FUND
The Marsico Focus Fund moderately underperformed the S&P 500 Index for the six-month fiscal period ended March 31, 2013. Stock selection in the Consumer Discretionary and Financials sectors, as defined under the Global Industry Classification Standard (“GICS”)(2), constituted primary detractors from performance.
Several of the Fund’s primary performance detractors included positions in “value proposition” retailers such as Dollar General Corporation (-15% prior to being sold) and The TJX Companies, Inc. (+5%) whose returns did not keep up with the +14% return of the S&P 500 Index Consumer Discretionary sector. Retailing companies, especially those with a globally-oriented business model, were challenged by the potential impact of slowing economic activity levels in general and more subdued consumer discretionary spending in particular. Other laggards within the sector included restaurant companies Chipotle Mexican Grill, Inc. (+3%) and McDonald’s Corporation (+10%).
The collective return of the Fund’s Financials positions, +10%, lagged the +18% return of the S&P 500 Index Financials sector. U.S. Bancorp (-3%) declined prior to being sold from the Fund. An underweight allocation to the strong-performing sector further hampered performance results.
Certain individual holdings adversely impacted results, including Mead Johnson Nutrition Company (-19%), Express Scripts Holding Company (-15%) and VMware, Inc. – Cl. A (-20%). All three positions posted double-digit negative returns and were sold from the Fund during the period.
The Fund’s performance was aided by stock selection and overweight allocation to the Health Care sector. The Fund’s Health Care positions posted a collective return of +23% and significantly surpassed the +16% return of the respective benchmark index sector. A number of the Fund’s pharmaceuticals and biotechnology holdings generated strong returns including Gilead Sciences, Inc. (+47%), Biogen Idec Inc. (+29%), Celgene Corporation (+25%) and Bristol-Myers Squibb Company (+24%). The Fund further benefitted from having an overweight allocation to Health Care, as it was a strong-performing sector of the S&P 500 Index.
Stock selection in the Information Technology and Materials sectors also buoyed the Fund’s results. Apple, Inc. was the largest constituent of the S&P 500 Index and was also a significant holding in the Fund early in the reporting period. The Fund began selling Apple in the second half of 2012 and sold completely out of the stock in January 2013. Though Apple declined -27% prior to being sold from the Fund, the Fund’s performance benefitted from selling Apple before further stock price declines. We felt Apple’s product pipeline was lacking a major catalyst and, perhaps more importantly, believed that the company may not have recurring revenues. Financial transaction processor Visa, Inc. – Cl. A (+27%) was another leading contributor to Fund performance in the Information Technology sector. Within Materials, agricultural materials company Monsanto Company (+17%) was a strong performer as it benefitted from increased use of its US corn and soybean products, as well as strong performance in its international seeds business.
From a sector allocation standpoint, the Fund benefitted from having a significant overweight allocation to the strong-performing Consumer Discretionary sector while refraining from investments in the Telecommunication Services sector, which was a weak-performing sector of the S&P 500 Index.
During the period, the Fund reduced its exposure to the Information Technology and Consumer Discretionary sectors while increasing its allocations to the Financials, Energy, Industrials, Health Care and Consumer Staples sectors.
GROWTH FUND
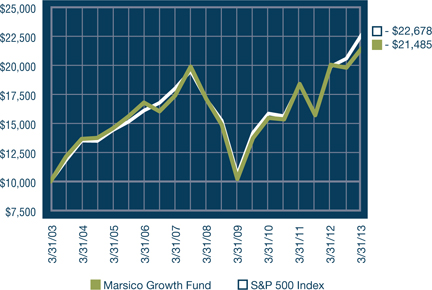
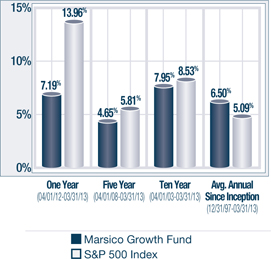
The Marsico Growth Fund underperformed the S&P 500 Index and shared several of the Focus Fund’s performance attributes for the six-month fiscal period ended March 31, 2013.
The Growth Fund’s Financials holdings posted an aggregate return of +7% and lagged the +18% return of the S&P 500 Index Financials sector. Financials was the strongest-performing sector of the benchmark index, and the Fund’s underweight allocation to the sector further detracted from performance.
Stock selection in the Consumer Discretionary and Energy sectors was also weak. Discount retailer Dollar General Corporation (-16% prior to being sold) and athletic apparel company lululemon athletica, inc. (-15%) posted disappointing returns. National Oilwell Varco, Inc., a provider of equipment for oil and gas drilling and production, slid -17% and was sold from the Fund.
Other individual holdings also weighed on results, including software firm VMware, Inc. – Cl. A (-38%), pharmacy benefit company Express Scripts Holding Company (-15%) and nutritional products company Mead Johnson Nutrition Company (-18%). All three positions were sold from the Fund prior to period-end.
At times during the period, the Growth Fund held a slightly elevated level of cash. The uninvested cash weighed on performance to some degree as the equity market posted gains. (The Fund’s benchmark index holds no cash.)
There were several positive performance factors for the Fund. Stock selection in the Materials and Health Care sectors contributed to Fund results. Within Materials, specialty chemical firm LyondellBasell Industries N.V. – Cl. A (+30%) and agricultural materials company Monsanto Company (+17%) were strong performers. LyondellBasell’s ethylene margins increased during the period, driven by lower feedstock costs in the US, as ethane supply continued to outpace demand. Monsanto benefitted from increased use of its US corn and soybean products, as well as strong performance in its international seeds business. Leading Health Care holdings included drug companies Gilead Sciences, Inc. (+46%), Biogen Idec Inc. (+29%) and Bristol-Myers Squibb Company (+23%).
Like the Focus Fund, the Growth Fund was aided by having a significant portion of its net assets invested in the strong-performing Consumer Discretionary sector while refraining from investments in the weak-performing Telecommunication Services sector. Also similar to the Focus Fund, the Growth Fund benefitted from selling its position in Apple, Inc. (-23%) during the period.
Other individual holdings making meaningful positive contributions to performance included media company CBS Corporation – Cl. B (+30%) and financial transaction processor Visa, Inc. – Cl. A (+27%).
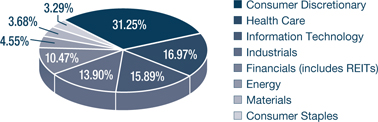
During the period, the Fund increased its exposure to the Industrials, Health Care and Financials sectors while paring back its exposure to the Information Technology, Energy, Consumer Discretionary and Consumer Staples sectors.
Fiscal Period-End Investment Posture
As of March 31, 2013, the Focus Fund’s and the Growth Fund’s largest sector allocations included Consumer Discretionary, Information Technology, Health Care, Financials and Industrials. The Funds had no exposure to the Utilities and Telecommunication Services sectors.
Sincerely,
THOMAS F. MARSICO
CORALIE T. WITTER, CFA
PORTFOLIO MANAGERS
| (1) | Total returns are based on net change in net asset value assuming reinvestment of distributions. A redemption fee of 2% may be imposed on redemptions or exchanges of Fund shares owned for 30 days or less. Please see the Prospectus for more information. |
| (2) | Regarding GICS data cited throughout this report, the Global Industry Classification Standard (“GICS”) was developed by and is the exclusive property and service mark of MSCI Inc. (“MSCI”) and Standard & Poor’s (“S&P”) and is licensed for use by Marsico Capital Management, LLC (“MCM”). Neither MSCI, S&P, nor MCM or any third party involved in compiling GICS makes any express or implied warranties or representations with respect to such standard or classification (or the results from use thereof), and all such parties hereby expressly disclaim all warranties of originality, accuracy, completeness, merchantability and fitness for a particular purpose with respect to any such standard or classification. MSCI, S&P, MCM, and any of their affiliates or third parties involved in compiling GICS shall not have any liability for any direct, indirect, special, punitive, consequential or any other damages (including lost profits) even if notified of the possibility of such damages. |
March 31, 2013 (Unaudited)
The Focus Fund invests primarily in the common stocks of large companies, normally a core position of 20–30 common stocks that are selected for their long-term growth potential.
| TOTAL ANNUAL OPERATING EXPENSES* 1.34% | NET ASSETS $871,592,681 | NET ASSET VALUE PER SHARE $19.32 |
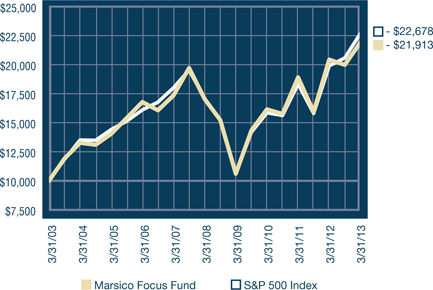
GROWTH OF $10,000(1) | PERFORMANCE COMPARISON |
| |
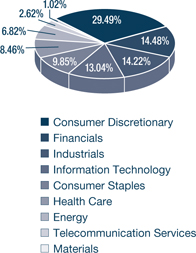
SECTOR ALLOCATION(2) | TOP FIVE HOLDINGS |
| | |
| GILEAD SCIENCES, INC. | 5.71% |
| BIOGEN IDEC INC. | 5.43% |
| BRISTOL-MYERS SQUIBB COMPANY | 4.72% |
| VISA, INC. - CL. A | 4.42% |
| EBAY, INC. | 4.35% |
| | |
| * | The Total Annual Operating Expenses are reflective of the information disclosed in the Funds’ Prospectus dated February 1, 2013 and may differ from the expense ratio disclosed in this report. |
| | The performance data quoted here represent past performance, and past performance is not a guarantee of future results. Investment return and principal value of an investment will fluctuate so that an investor’s shares, when redeemed, may be worth more or less than their original cost. Current performance may be lower or higher than the performance information quoted. To obtain performance information current to the most recent month-end, please call 888-860-8686 or visit www.marsicofunds.com. A redemption fee may be imposed on redemptions or exchanges of Fund shares held for 30 days or less. |
| | The performance included in the chart and graph does not reflect the deduction of taxes on Fund distributions or the redemption of Fund shares. |
| | All indices are unmanaged and investors cannot invest directly in an index. |
| (1) | This chart assumes an initial investment of $10,000 made on March 31, 2003. Total returns are based on net change in NAV, assuming reinvestment of distributions. |
| (2) | Sector weightings represent the percentage of the Fund’s investments (excluding cash equivalents) in certain general sectors. These sectors may include more than one industry. The Fund’s portfolio composition is subject to change at any time. |
MARSICO FOCUS FUND
SCHEDULE OF INVESTMENTS
March 31, 2013 (Unaudited)
| | | Number of Shares | | | Value | | | Percent of Net Assets | |
| COMMON STOCKS | | | | | | | | | |
| Aerospace & Defense | | | | | | | | | |
| Precision Castparts Corp. | | | 150,564 | | | $ | 28,549,946 | | | | 3.28 | % |
| | | | | | | | | | | | | |
| Apparel Retail | | | | | | | | | | | | |
| The TJX Companies, Inc. | | | 574,973 | | | | 26,879,988 | | | | 3.08 | |
| | | | | | | | | | | | | |
| Automotive Retail | | | | | | | | | | | | |
| AutoZone, Inc.* | | | 55,311 | | | | 21,945,745 | | | | 2.52 | |
| | | | | | | | | | | | | |
| Biotechnology | | | | | | | | | | | | |
| Biogen Idec Inc.* | | | 245,240 | | | | 47,309,249 | | | | 5.43 | |
| Celgene Corporation* | | | 116,575 | | | | 13,512,208 | | | | 1.55 | |
| Gilead Sciences, Inc.* | | | 1,016,944 | | | | 49,759,070 | | | | 5.71 | |
| | | | | | | | 110,580,527 | | | | 12.69 | |
| Brewers | | | | | | | | | | | | |
| Anheuser-Busch InBev N.V. Spon. ADR | | | 266,562 | | | | 26,536,247 | | | | 3.04 | |
| | | | | | | | | | | | | |
| Cable & Satellite | | | | | | | | | | | | |
| Comcast Corporation - Cl. A | | | 441,004 | | | | 18,526,578 | | | | 2.13 | |
| | | | | | | | | | | | | |
| Casinos & Gaming | | | | | | | | | | | | |
| Wynn Resorts Ltd. | | | 217,591 | | | | 27,233,690 | | | | 3.12 | |
| | | | | | | | | | | | | |
| Construction & Farm Machinery & Heavy Trucks | | | | | |
| Cummins, Inc. | | | 98,289 | | | | 11,382,849 | | | | 1.31 | |
| | | | | | | | | | | | | |
| Consumer Finance | | | | | | | | | | | | |
| American Express Company | | | 363,355 | | | | 24,511,928 | | | | 2.81 | |
| | | | | | | | | | | | | |
| Data Processing & Outsourced Services | | | | | |
| Visa, Inc. - Cl. A | | | 227,000 | | | | 38,553,680 | | | | 4.42 | |
| | | | | | | | | | | | | |
| Diversified Banks | | | | | | | | | | | | |
| Wells Fargo & Company | | | 946,455 | | | | 35,009,370 | | | | 4.02 | |
| | | | | | | | | | | | | |
| Fertilizers & Agricultural Chemicals | | | | | |
| Monsanto Company | | | 302,461 | | | | 31,948,955 | | | | 3.67 | |
| | | | | | | | | | | | | |
| Footwear | | | | | | | | | | | | |
| NIKE, Inc. - Cl. B | | | 436,622 | | | | 25,765,064 | | | | 2.96 | |
| | | | | | | | | | | | | |
| Health Care Equipment | | | | | | | | | | | | |
| Intuitive Surgical, Inc.* | | | 7,527 | | | | 3,697,187 | | | | 0.42 | |
| | | | | | | | | | | | | |
| Home Improvement Retail | | | | | | | | | | | | |
| Lowe's Companies, Inc. | | | 494,938 | | | | 18,768,049 | | | | 2.15 | |
| The Home Depot, Inc. | | | 444,615 | | | | 31,025,235 | | | | 3.56 | |
| | | | | | | | 49,793,284 | | | | 5.71 | |
| Hypermarkets & Super Centers | | | | | | | | | |
| Wal-Mart Stores, Inc. | | | 351,257 | | | | 26,284,561 | | | | 3.02 | |
| | | | | | | | | | | | | |
| Internet Software & Services | | | | | | | | | |
| eBay, Inc.* | | | 699,257 | | | | 37,913,715 | | | | 4.35 | |
| Equinix, Inc.* | | | 78,272 | | | | 16,931,016 | | | | 1.94 | |
| Google, Inc. - Cl. A* | | | 46,233 | | | | 36,710,389 | | | | 4.21 | |
| | | | | | | | 91,555,120 | | | | 10.50 | |
| IT Consulting & Other Services | | | | | | | | | |
| Accenture plc - Cl. A | | | 334,085 | | | | 25,380,437 | | | | 2.91 | |
| | | | | | | | | | | | | |
COMMON STOCKS (continued) | | | | | | | | | |
| Multi-Line Insurance | | | | | | | | | | | | |
| American International Group, Inc.* | | | 688,069 | | | $ | 26,710,839 | | | | 3.06 | % |
| | | | | | | | | | | | | |
| Oil & Gas Equipment & Services | | | | | | | | | |
| Schlumberger Ltd. | | | 272,215 | | | | 20,386,181 | | | | 2.34 | |
| | | | | | | | | | | | | |
| Oil & Gas Storage & Transportation | | | | | | | | | |
| Kinder Morgan, Inc. | | | 852,915 | | | | 32,990,752 | | | | 3.79 | |
| | | | | | | | | | | | | |
| Other Diversified Financial Services | | | | | | | | | |
| Citigroup, Inc. | | | 609,120 | | | | 26,947,469 | | | | 3.09 | |
| | | | | | | | | | | | | |
| Pharmaceuticals | | | | | | | | | | | | |
| Bristol-Myers Squibb Company | | | 998,277 | | | | 41,119,030 | | | | 4.72 | |
| | | | | | | | | | | | | |
| Railroads | | | | | | | | | | | | |
| Union Pacific Corporation | | | 151,075 | | | | 21,514,591 | | | | 2.47 | |
| | | | | | | | | | | | | |
| Restaurants | | | | | | | | | | | | |
| Chipotle Mexican Grill, Inc.* | | | 55,490 | | | | 18,082,526 | | | | 2.07 | |
| McDonald's Corporation | | | 184,082 | | | | 18,351,135 | | | | 2.11 | |
| Starbucks Corporation | | | 358,008 | | | | 20,392,136 | | | | 2.34 | |
| | | | | | | | 56,825,797 | | | | 6.52 | |
| Specialized REITs | | | | | | | | | | | | |
| American Tower Corporation - Cl. A | | | 222,424 | | | | 17,108,854 | | | | 1.96 | |
| | | | | | | | | | | | | |
| TOTAL COMMON STOCKS | | | | | | | | | | | | |
| (Cost $652,228,700) | | | | | | | 867,738,669 | | | | 99.56 | |
| | | | | | | | | | | | | |
| SHORT-TERM INVESTMENTS | | | | | | | | | |
| State Street Institutional U.S. Government Money Market Fund, 0.039% | | | 11,546,751 | | | | 11,546,751 | | | | 1.32 | |
| | | | | | | | | | | | | |
| TOTAL SHORT-TERM INVESTMENTS | | | | | | | | | |
| (Cost $11,546,751) | | | | | | | 11,546,751 | | | | 1.32 | |
| | | | | | | | | | | | | |
| TOTAL INVESTMENTS | | | | | | | | | | | | |
| (Cost $663,775,451) | | | | | | | 879,285,420 | | | | 100.88 | |
| | | | | | | | | | | | | |
| Liabilities, Less Cash and Other Assets | | | | | | | (7,692,739 | ) | | | (0.88 | ) |
| | | | | | | | | | | | | |
| NET ASSETS | | | | | | $ | 871,592,681 | | | | 100.00 | % |
| | See notes to financial statements. |
March 31, 2013 (Unaudited)
The Growth Fund invests primarily in the common stocks of large companies that are selected for their long-term growth potential. The Growth Fund will normally hold a core position of between 35 and 50 common stocks.
| TOTAL ANNUAL OPERATING EXPENSES* 1.35% | NET ASSETS $653,031,284 | NET ASSET VALUE PER SHARE $22.46 |
GROWTH OF $10,000(1) | PERFORMANCE COMPARISON |
| |
SECTOR ALLOCATION(2) | TOP FIVE HOLDINGS |
| | |
| GILEAD SCIENCES, INC. | 5.25% |
| BRISTOL-MYERS SQUIBB COMPANY | 4.38% |
| BIOGEN IDEC INC. | 4.29% |
| EBAY, INC. | 4.27% |
| GOOGLE, INC. - CL. A | 3.12% |
| | |
| * | The Total Annual Operating Expenses are reflective of the information disclosed in the Funds’ Prospectus dated February 1, 2013 and may differ from the expense ratio disclosed in this report. |
| | The performance data quoted here represent past performance, and past performance is not a guarantee of future results. Investment return and principal value of an investment will fluctuate so that an investor’s shares, when redeemed, may be worth more or less than their original cost. Current performance may be lower or higher than the performance information quoted. To obtain performance information current to the most recent month-end, please call 888-860-8686 or visit www.marsicofunds.com. A redemption fee may be imposed on redemptions or exchanges of Fund shares held for 30 days or less. |
| | The performance included in the chart and graph does not reflect the deduction of taxes on Fund distributions or the redemption of Fund shares. |
| | All indices are unmanaged and investors cannot invest directly in an index. |
| (1) | This chart assumes an initial investment of $10,000 made on March 31, 2003. Total returns are based on net change in NAV, assuming reinvestment of distributions. |
| (2) | Sector weightings represent the percentage of the Fund’s investments (excluding cash equivalents) in certain general sectors. These sectors may include more than one industry. The Fund’s portfolio composition is subject to change at any time. |
MARSICO GROWTH FUND
SCHEDULE OF INVESTMENTS
March 31, 2013 (Unaudited)
| | | Number of Shares | | | Value | | | Percent of Net Assets | |
| COMMON STOCKS | | | | | | | | | |
| Aerospace & Defense | | | | | | | | | |
| Precision Castparts Corp. | | | 77,888 | | | $ | 14,769,123 | | | | 2.26 | % |
| Rolls-Royce Holdings PLC* | | | 427,643 | | | | 7,342,537 | | | | 1.13 | |
| | | | | | | | 22,111,660 | | | | 3.39 | |
| Apparel Retail | | | | | | | | | | | | |
| The TJX Companies, Inc. | | | 281,547 | | | | 13,162,322 | | | | 2.02 | |
| | | | | | | | | | | | | |
| Apparel, Accessories & Luxury Goods | | | | | |
| lululemon athletica, inc.* | | | 116,485 | | | | 7,262,840 | | | | 1.11 | |
| | | | | | | | | | | | | |
| Application Software | | | | | | | | | | | | |
| Intuit, Inc. | | | 95,373 | | | | 6,261,237 | | | | 0.96 | |
| | | | | | | | | | | | | |
| Automotive Retail | | | | | | | | | | | | |
| AutoZone, Inc.* | | | 44,947 | | | | 17,833,621 | | | | 2.73 | |
| | | | | | | | | | | | | |
| Biotechnology | | | | | | | | | | | | |
| Biogen Idec Inc.* | | | 145,058 | | | | 27,983,139 | | | | 4.29 | |
| Celgene Corporation* | | | 85,840 | | | | 9,949,714 | | | | 1.52 | |
| Gilead Sciences, Inc.* | | | 700,285 | | | | 34,264,945 | | | | 5.25 | |
| | | | | | | | 72,197,798 | | | | 11.06 | |
| Brewers | | | | | | | | | | | | |
| Anheuser-Busch InBev N.V. Spon. ADR | | | 78,765 | | | | 7,841,056 | | | | 1.20 | |
| | | | | | | | | | | | | |
| Broadcasting | | | | | | | | | | | | |
| CBS Corporation - Cl. B | | | 411,964 | | | | 19,234,599 | | | | 2.95 | |
| | | | | | | | | | | | | |
| Cable & Satellite | | | | | | | | | | | | |
| Comcast Corporation - Cl. A | | | 329,546 | | | | 13,844,227 | | | | 2.12 | |
| Liberty Global, Inc. - Cl. A* | | | 125,329 | | | | 9,199,149 | | | | 1.41 | |
| | | | | | | | 23,043,376 | | | | 3.53 | |
| Casinos & Gaming | | | | | | | | | | | | |
| Wynn Resorts Ltd. | | | 130,017 | | | | 16,272,928 | | | | 2.49 | |
| | | | | | | | | | | | | |
| Commodity Chemicals | | | | | | | | | | | | |
| LyondellBasell Industries N.V. - Cl. A | | | 75,661 | | | | 4,788,585 | | | | 0.73 | |
| | | | | | | | | | | | | |
| Communications Equipment | | | | | | | | | |
| Motorola Solutions, Inc. | | | 76,668 | | | | 4,909,052 | | | | 0.75 | |
| QUALCOMM, Inc. | | | 98,215 | | | | 6,575,494 | | | | 1.01 | |
| | | | | | | | 11,484,546 | | | | 1.76 | |
| Construction & Farm Machinery & Heavy Trucks | | | | | |
| Cummins, Inc. | | | 56,301 | | | | 6,520,219 | | | | 1.00 | |
| | | | | | | | | | | | | |
| Consumer Finance | | | | | | | | | | | | |
| American Express Company | | | 197,892 | | | | 13,349,794 | | | | 2.04 | |
| | | | | | | | | | | | | |
| Data Processing & Outsourced Services | | | | | |
| Visa, Inc. - Cl. A | | | 102,075 | | | | 17,336,418 | | | | 2.65 | |
| | | | | | | | | | | | | |
| Diversified Banks | | | | | | | | | | | | |
| Wells Fargo & Company | | | 541,975 | | | | 20,047,655 | | | | 3.07 | |
| | | | | | | | | | | | | |
| Fertilizers & Agricultural Chemicals | | | | | | | | | |
| Monsanto Company | | | 175,773 | | | | 18,566,902 | | | | 2.84 | |
| | | | | | | | | | | | | |
| Footwear | | | | | | | | | | | | |
| NIKE, Inc. - Cl. B | | | 233,956 | | | | 13,805,744 | | | | 2.11 | |
| | | | | | | | | | | | | |
COMMON STOCKS (continued) | | | | | | | | | |
| Health Care Equipment | | | | | | | | | | | | |
| Intuitive Surgical, Inc.* | | | 14,293 | | | $ | 7,020,579 | | | | 1.08 | % |
| | | | | | | | | | | | | |
| Home Improvement Retail | | | | | | | | | | | | |
| Lowe's Companies, Inc. | | | 492,129 | | | | 18,661,532 | | | | 2.86 | |
| The Home Depot, Inc. | | | 187,003 | | | | 13,049,069 | | | | 2.00 | |
| | | | | | | | 31,710,601 | | | | 4.86 | |
| Hotels, Resorts & Cruise Lines | | | | | | | | | |
| Starwood Hotels & Resorts Worldwide, Inc. | | | 231,561 | | | | 14,757,383 | | | | 2.26 | |
| | | | | | | | | | | | | |
| Hypermarkets & Super Centers | | | | | | | | | |
| Wal-Mart Stores, Inc. | | | 174,391 | | | | 13,049,679 | | | | 2.00 | |
| | | | | | | | | | | | | |
| Industrial Conglomerates | | | | | | | | | | | | |
| Danaher Corporation | | | 123,084 | | | | 7,649,671 | | | | 1.17 | |
| | | | | | | | | | | | | |
| Industrial Machinery | | | | | | | | | | | | |
| Pentair Ltd. | | | 299,921 | | | | 15,820,833 | | | | 2.42 | |
| | | | | | | | | | | | | |
| Internet Retail | | | | | | | | | | | | |
| priceline.com, Inc.* | | | 11,568 | | | | 7,957,974 | | | | 1.22 | |
| | | | | | | | | | | | | |
| Internet Software & Services | | | | | | | | | |
| eBay, Inc.* | | | 514,327 | | | | 27,886,810 | | | | 4.27 | |
| Equinix, Inc.* | | | 52,158 | | | | 11,282,297 | | | | 1.73 | |
| Google, Inc. - Cl. A* | | | 25,679 | | | | 20,389,896 | | | | 3.12 | |
| | | | | | | | 59,559,003 | | | | 9.12 | |
| IT Consulting & Other Services | | | | | | | | | |
| Accenture plc - Cl. A | | | 83,069 | | | | 6,310,752 | | | | 0.97 | |
| | | | | | | | | | | | | |
| Multi-Line Insurance | | | | | | | | | | | | |
| American International Group, Inc.* | | | 96,338 | | | | 3,739,841 | | | | 0.57 | |
| | | | | | | | | | | | | |
| Oil & Gas Equipment & Services | | | | | | | | | |
| Schlumberger Ltd. | | | 255,774 | | | | 19,154,915 | | | | 2.93 | |
| | | | | | | | | | | | | |
| Oil & Gas Storage & Transportation | | | | | | | | | |
| Kinder Morgan, Inc. | | | 251,768 | | | | 9,738,386 | | | | 1.49 | |
| | | | | | | | | | | | | |
| Other Diversified Financial Services | | | | | | | | | |
| Citigroup, Inc. | | | 397,648 | | | | 17,591,947 | | | | 2.69 | |
| | | | | | | | | | | | | |
| Pharmaceuticals | | | | | | | | | | | | |
| Bristol-Myers Squibb Company | | | 694,422 | | | | 28,603,242 | | | | 4.38 | |
| | | | | | | | | | | | | |
| Railroads | | | | | | | | | | | | |
| CSX Corporation | | | 262,260 | | | | 6,459,464 | | | | 0.99 | |
| Union Pacific Corporation | | | 93,442 | | | | 13,307,075 | | | | 2.04 | |
| | | | | | | | 19,766,539 | | | | 3.03 | |
| Restaurants | | | | | | | | | | | | |
| Chipotle Mexican Grill, Inc.* | | | 19,619 | | | | 6,393,244 | | | | 0.98 | |
| McDonald's Corporation | | | 163,804 | | | | 16,329,621 | | | | 2.50 | |
| Starbucks Corporation | | | 188,513 | | | | 10,737,700 | | | | 1.64 | |
| | | | | | | | 33,460,565 | | | | 5.12 | |
| Specialized REITs | | | | | | | | | | | | |
| American Tower Corporation - Cl. A | | | 153,386 | | | | 11,798,451 | | | | 1.81 | |
| | See notes to financial statements. |
| | | | Number of Shares | | | | Value | | | | Percent of Net Assets | |
COMMON STOCKS (continued) | | | | | | | | | |
| Trading Companies & Distributors | | | | | | | | | |
| United Rentals, Inc.* | | | 63,023 | | | $ | 3,464,374 | | | | 0.53 | % |
| W.W. Grainger, Inc. | | | 57,592 | | | | 12,957,048 | | | | 1.98 | |
| | | | | | | | 16,421,422 | | | | 2.51 | |
| | | | | | | | | | | | | |
| TOTAL COMMON STOCKS | | | | | | | | | | | | |
| (Cost $482,224,779) | | | | | | | 635,233,083 | | | | 97.27 | |
| | | | | | | | | | | | | |
| SHORT-TERM INVESTMENTS | | | | | | | | | |
| State Street Institutional Treasury Money Market Fund, 0.000% | | | 19,192,790 | | | | 19,192,790 | | | | 2.94 | |
| | | | | | | | | | | | | |
| TOTAL SHORT-TERM INVESTMENTS | | | | | | | | | |
| (Cost $19,192,790) | | | | | | | 19,192,790 | | | | 2.94 | |
| | | | | | | | | | | | | |
| TOTAL INVESTMENTS | | | | | | | | | | | | |
| (Cost $501,417,569) | | | | | | | 654,425,873 | | | | 100.21 | |
| | | | | | | | | | | | | |
| Liabilities, Less Cash and Other Assets | | | | | | | (1,394,589 | ) | | | (0.21 | ) |
| | | | | | | | | | | | | |
| NET ASSETS | | | | | | $ | 653,031,284 | | | | 100.00 | % |
| | See notes to financial statements. |
INVESTMENT REVIEW BY BRANDON GEISLER (UNAUDITED)
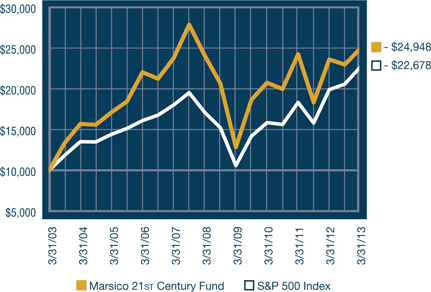
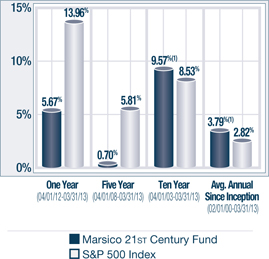
The Marsico 21st Century Fund posted a return of +8.57% for the six-month fiscal period ended March 31, 2013. The Fund underperformed the S&P 500 Index, the Fund’s benchmark index, which had a total return of +10.19% over the same time period. For comparison, the Russell 3000 Index, a proxy for the performance of all publicly-traded US equity securities including smaller capitalization companies (which may be a useful representation of the Fund’s ability to invest across the entire market capitalization spectrum), had a total return of +11.35%. Please see the Fund Overview for more detailed information about the Fund’s longer-term performance for various time periods ended March 31, 2013.
The performance data for the Fund quoted here represent past performance, and past performance is not a guarantee of future results. Investment return and principal value of an investment will fluctuate so that an investor’s shares, when redeemed, may be worth more or less than their original cost. Current performance may be lower or higher than the performance information quoted. To obtain performance information current to the most recent month-end, please call 888-860-8686 or visit www.marsicofunds.com.(1)
This review highlights Fund performance over a six-month fiscal period. Shareholders should keep in mind that the Fund is intended for long-term investors who hold their shares for substantially longer periods of time. You should also keep in mind that our views on all investments discussed in this report are subject to change at any time. References to specific securities, industries, and sectors discussed in this report are not recommendations to buy or sell such securities or related investments, and the Fund may not necessarily hold these securities or investments today. Please see the accompanying Schedule of Investments for the percentage of the Fund’s portfolio represented by the securities mentioned in this report as of the end of the reporting period. The Fund and the stocks and markets in which it invests are subject to general risks that include periods of turbulence, instability, decline, and cyclical change, and that investors may continue to avoid investments in equity securities generally. Please see the Prospectus for more information.
Stock selection in several sectors contributed to the Fund’s underperformance versus its benchmark index. The Fund’s Financials holdings gained +6% in aggregate; however, that return did not keep pace with the +18% return of the S&P 500 Index Financials sector returns. Two banks, Capital One Financial Corporation (-3%) and The PNC Financial Services Group, Inc. (-16%), were primary detractors within the sector. The Fund sold its position in PNC Financial Services during the period. As Financials was a strong-performing sector of the benchmark index, the Fund’s performance was also hurt by having an underweight allocation to the sector.
Several of the Fund’s Information Technology positions posted weak returns. Enterprise technology company Fusion-io, Inc. slid -36% and was sold from the Fund. Software companies VMware, Inc. – Cl. A (-31% prior to being sold) and Red Hat, Inc. (-11%) also sustained double-digit stock price declines.
Stock selection in Energy and Consumer Discretionary detracted from performance. Energy firm National Oilwell Varco, Inc. declined -17% prior to being sold from the Fund. In Consumer Discretionary, retailers Ulta Salon, Cosmetics & Fragrance, Inc. (-17% prior to being sold) and Ross Stores, Inc. (-6%) posted negative returns.
The Fund benefitted from stock selection and an overweight allocation to the Industrials sector. Capital goods companies Precision Castparts Corp. (+16%) and WESCO International, Inc. (+30% prior to being sold) and railroad operator Genesee & Wyoming, Inc. – Cl. A (+35%) each experienced strong stock price appreciation. Industrials was a strong-performing sector of the S&P 500 Index with a return of +15%, and the Fund did well by having approximately double the exposure to the Industrials sector as compared to the benchmark index for a portion of the period.
Fund results also were aided by stock selection in the Materials, Health Care and Consumer Staples sectors. Within Materials, specialty chemical company LyondellBasell Industries N.V. – Cl. A (+30%) was a material positive contributor. Leading Health Care holdings included Gilead Sciences, Inc. (+31%) and Biogen Idec Inc. (+30%). Green Mountain Coffee Roasters, Inc., a Consumer Staples holding, rose +24%.
During the reporting period, the Fund increased its allocations to the Industrials, Consumer Staples and Consumer Discretionary sectors. Allocations to the Information Technology, Energy and Financials sectors were reduced.
Fiscal Period-End Investment Posture
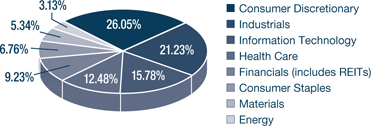
As of March 31, 2013, the Fund’s primary economic sector allocations included Consumer Discretionary, Industrials, Information Technology and Health Care. The Fund had no investments in the Utilities and Telecommunication Services sectors.
Sincerely,
BRANDON A. GEISLER
PORTFOLIO MANAGER
| (1) | Total returns are based on net change in net asset value assuming reinvestment of distributions. For the period prior to March 31, 2004, the performance returns for the 21st Century Fund reflect a fee waiver in effect; in the absence of such a waiver, the returns would have been reduced. For the period beginning April 2004 through January 2005, performance returns for the 21st Century Fund would have been higher but for the reimbursement of fees waived previously. A redemption fee of 2% may be imposed on redemptions or exchanges of Fund shares owned for 30 days or less. Please see the Prospectus for more information. |
| |
21st CENTURY FUND OVERVIEW |
| |
March 31, 2013 (Unaudited)
The 21st Century Fund invests primarily in common stocks that are selected for their long-term growth potential. The Fund may invest in companies of any size, and will normally hold a core position of between 35 and 50 common stocks.
| TOTAL ANNUAL OPERATING EXPENSES* 1.42% | NET ASSETS $301,155,781 | NET ASSET VALUE PER SHARE $15.46 |
GROWTH OF $10,000(1)(2) | PERFORMANCE COMPARISON |
| |
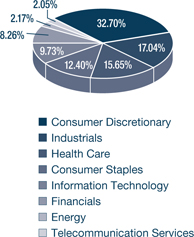
SECTOR ALLOCATION(3) | TOP FIVE HOLDINGS |
| | |
| BIOGEN IDEC INC. | 3.77% |
| GILEAD SCIENCES, INC. | 3.72% |
| MONSANTO COMPANY | 3.42% |
| LOWE'S COMPANIES, INC. | 3.26% |
| PRECISION CASTPARTS CORP. | 3.06% |
| | |
| * | The Total Annual Operating Expenses are reflective of the information disclosed in the Funds’ Prospectus dated February 1, 2013 and may differ from the expense ratio disclosed in this report. |
| | The performance data quoted here represent past performance, and past performance is not a guarantee of future results. Investment return and principal value of an investment will fluctuate so that an investor’s shares, when redeemed, may be worth more or less than their original cost. Current performance may be lower or higher than the performance information quoted. To obtain performance information current to the most recent month-end, please call 888-860-8686 or visit www.marsicofunds.com. A redemption fee may be imposed on redemptions or exchanges of Fund shares held for 30 days or less. |
| | The performance included in the chart and graph does not reflect the deduction of taxes on Fund distributions or the redemption of Fund shares. |
| | All indices are unmanaged and investors cannot invest directly in an index. |
| (1) | The performance returns for the 21st Century Fund (for the period prior to March 31, 2004) reflect a fee waiver in effect; in the absence of such a waiver, the returns would be reduced. For the period beginning April 2004 through January 2005, performance returns for the 21st Century Fund would be higher but for the reimbursement of fees waived previously. |
| (2) | This chart assumes an initial investment of $10,000 made on March 31, 2003. Total returns are based on net change in NAV, assuming reinvestment of distributions. |
| (3) | Sector weightings represent the percentage of the Fund’s investments (excluding cash equivalents) in certain general sectors. These sectors may include more than one industry. The Fund’s portfolio composition is subject to change at any time. |
MARSICO 21st CENTURY FUND
SCHEDULE OF INVESTMENTS
March 31, 2013 (Unaudited)
| | | Number of Shares | | | Value | | | Percent of Net Assets | |
| COMMON STOCKS | | | | | | | | | |
| Aerospace & Defense | | | | | | | | | |
| Precision Castparts Corp. | | | 48,675 | | | $ | 9,229,753 | | | | 3.06 | % |
| TransDigm, Inc. | | | 44,518 | | | | 6,807,693 | | | | 2.26 | |
| | | | | | | | 16,037,446 | | | | 5.32 | |
| Apparel Retail | | | | | | | | | | | | |
| Foot Locker, Inc. | | | 69,058 | | | | 2,364,546 | | | | 0.78 | |
| Ross Stores, Inc. | | | 84,430 | | | | 5,118,147 | | | | 1.70 | |
| | | | | | | | 7,482,693 | | | | 2.48 | |
| Apparel, Accessories & Luxury Goods | | | | | |
| Ralph Lauren Corporation - Cl. A | | | 25,684 | | | | 4,348,558 | | | | 1.44 | |
| | | | | | | | | | | | | |
| Application Software | | | | | | | | | | | | |
| salesforce.com, inc.* | | | 20,477 | | | | 3,661,902 | | | | 1.22 | |
| | | | | | | | | | | | | |
| Automobile Manufacturers | | | | | | | | | | | | |
| Tesla Motors, Inc.* | | | 77,529 | | | | 2,937,574 | | | | 0.97 | |
| | | | | | | | | | | | | |
| Automotive Retail | | | | | | | | | | | | |
| Monro Muffler Brake, Inc. | | | 39,002 | | | | 1,548,769 | | | | 0.51 | |
| | | | | | | | | | | | | |
| Biotechnology | | | | | | | | | | | | |
| Alkermes PLC* | | | 167,908 | | | | 3,981,099 | | | | 1.32 | |
| Biogen Idec Inc.* | | | 58,735 | | | | 11,330,569 | | | | 3.77 | |
| BioMarin Pharmaceutical, Inc.* | | | 36,870 | | | | 2,295,526 | | | | 0.76 | |
| Gilead Sciences, Inc.* | | | 228,949 | | | | 11,202,474 | | | | 3.72 | |
| | | | | | | | 28,809,668 | | | | 9.57 | |
| Cable & Satellite | | | | | | | | | | | | |
| Liberty Global, Inc. Series C* | | | 51,255 | | | | 3,517,631 | | | | 1.17 | |
| | | | | | | | | | | | | |
| Casinos & Gaming | | | | | | | | | | | | |
| Wynn Resorts Ltd. | | | 60,136 | | | | 7,526,622 | | | | 2.50 | |
| | | | | | | | | | | | | |
| Commodity Chemicals | | | | | | | | | | | | |
| LyondellBasell Industries N.V. - Cl. A | | | 90,993 | | | | 5,758,947 | | | | 1.91 | |
| | | | | | | | | | | | | |
| Construction & Farm Machinery & Heavy Trucks | | | | | |
| Cummins, Inc. | | | 41,022 | | | | 4,750,758 | | | | 1.58 | |
| | | | | | | | | | | | | |
| Consumer Finance | | | | | | | | | | | | |
| Capital One Financial Corporation | | | 55,205 | | | | 3,033,515 | | | | 1.01 | |
| | | | | | | | | | | | | |
| Data Processing & Outsourced Services | | | | | |
| FleetCor Technologies, Inc.* | | | 53,623 | | | | 4,111,276 | | | | 1.36 | |
| MasterCard, Inc. - Cl. A | | | 14,625 | | | | 7,914,026 | | | | 2.63 | |
| | | | | | | | 12,025,302 | | | | 3.99 | |
| Distillers & Vintners | | | | | | | | | | | | |
| Constellation Brands, Inc. - Cl. A* | | | 95,995 | | | | 4,573,202 | | | | 1.52 | |
| | | | | | | | | | | | | |
| Diversified Support Services | | | | | | | | | |
| Copart, Inc.* | | | 83,289 | | | | 2,855,147 | | | | 0.95 | |
| | | | | | | | | | | | | |
| Fertilizers & Agricultural Chemicals | | | | | | | | | |
| Monsanto Company | | | 97,584 | | | | 10,307,798 | | | | 3.42 | |
| | | | | | | | | | | | | |
| General Merchandise Stores | | | | | | | | | |
| Dollar Tree, Inc.* | | | 154,450 | | | | 7,480,013 | | | | 2.48 | |
| | | | | | | | | | | | | |
COMMON STOCKS (continued) | | | | | | | | | |
| Health Care Equipment | | | | | | | | | | | | |
| Hologic, Inc.* | | | 164,116 | | | $ | 3,709,022 | | | | 1.23 | % |
| Intuitive Surgical, Inc.* | | | 10,237 | | | | 5,028,312 | | | | 1.67 | |
| | | | | | | | 8,737,334 | | | | 2.90 | |
| Home Improvement Retail | | | | | | | | | | | | |
| Lowe's Companies, Inc. | | | 258,667 | | | | 9,808,653 | | | | 3.26 | |
| | | | | | | | | | | | | |
| Hotels, Resorts & Cruise Lines | | | | | | | | | |
| Norwegian Cruise Line Holdings Ltd.* | | | 61,805 | | | | 1,832,518 | | | | 0.61 | |
| | | | | | | | | | | | | |
| Household Products | | | | | | | | | | | | |
| Church & Dwight Company, Inc. | | | 49,188 | | | | 3,179,020 | | | | 1.06 | |
| | | | | | | | | | | | | |
| Industrial Machinery | | | | | | | | | | | | |
| Pentair Ltd. | | | 129,076 | | | | 6,808,759 | | | | 2.26 | |
| | | | | | | | | | | | | |
| Internet Retail | | | | | | | | | | | | |
| Expedia, Inc. | | | 31,261 | | | | 1,875,973 | | | | 0.62 | |
| | | | | | | | | | | | | |
| Internet Software & Services | | | | | | | | | |
| Equinix, Inc.* | | | 27,971 | | | | 6,050,407 | | | | 2.01 | |
| Facebook, Inc. - Cl. A* | | | 100,842 | | | | 2,579,538 | | | | 0.86 | |
| Google, Inc. - Cl. A* | | | 11,047 | | | | 8,771,650 | | | | 2.91 | |
| VeriSign, Inc.* | | | 68,836 | | | | 3,254,566 | | | | 1.08 | |
| Yahoo!, Inc.* | | | 65,623 | | | | 1,544,109 | | | | 0.51 | |
| | | | | | | | 22,200,270 | | | | 7.37 | |
| Investment Banking & Brokerage | | | | | | | | | |
| Morgan Stanley | | | 95,107 | | | | 2,090,452 | | | | 0.69 | |
| | | | | | | | | | | | | |
| IT Consulting & Other Services | | | | | | | | | |
| Accenture plc - Cl. A | | | 65,322 | | | | 4,962,512 | | | | 1.65 | |
| | | | | | | | | | | | | |
| Movies & Entertainment | | | | | | | | | | | | |
| Viacom, Inc. - Cl. B | | | 114,555 | | | | 7,053,151 | | | | 2.34 | |
| | | | | | | | | | | | | |
| Oil & Gas Equipment & Services | | | | | | | | | |
| Halliburton Company | | | 74,071 | | | | 2,993,209 | | | | 1.00 | |
| Schlumberger Ltd. | | | 85,732 | | | | 6,420,470 | | | | 2.13 | |
| | | | | | | | 9,413,679 | | | | 3.13 | |
| Other Diversified Financial Services | | | | | | | | | |
| Citigroup, Inc. | | | 177,546 | | | | 7,854,635 | | | | 2.61 | |
| | | | | | | | | | | | | |
| Packaged Foods & Meats | | | | | | | | | | | | |
| Green Mountain Coffee Roasters, Inc.* | | | 83,548 | | | | 4,742,184 | | | | 1.58 | |
| Mondelez International, Inc. - Cl. A | | | 217,344 | | | | 6,652,900 | | | | 2.21 | |
| Pinnacle Foods, Inc.* | | | 53,496 | | | | 1,188,146 | | | | 0.39 | |
| | | | | | | | 12,583,230 | | | | 4.18 | |
| Railroads | | | | | | | | | | | | |
| Genesee & Wyoming, Inc. - Cl. A* | | | 67,296 | | | | 6,265,931 | | | | 2.08 | |
| | | | | | | | | | | | | |
| Regional Banks | | | | | | | | | | | | |
| BankUnited, Inc. | | | 115,829 | | | | 2,967,539 | | | | 0.99 | |
| City National Corporation | | | 67,008 | | | | 3,947,441 | | | | 1.31 | |
| Columbia Banking System, Inc. | | | 72,872 | | | | 1,601,727 | | | | 0.53 | |
| | | | | | | | 8,516,707 | | | | 2.83 | |
| Research & Consulting Services | | | | | | | | | |
| IHS, Inc. - Cl. A* | | | 54,030 | | | | 5,658,021 | | | | 1.88 | |
| Nielsen Holdings N.V. | | | 171,157 | | | | 6,130,844 | | | | 2.03 | |
| | | | | | | | 11,788,865 | | | | 3.91 | |
| | See notes to financial statements. |
MARSICO 21st CENTURY FUND
SCHEDULE OF INVESTMENTS (continued)
March 31, 2013 (Unaudited)
| | | | Number of Shares | | | | Value | | | | Percent of Net Assets | |
COMMON STOCKS (continued) | | | | | | | | | |
| Restaurants | | | | | | | | | | | | |
| Chipotle Mexican Grill, Inc.* | | | 14,539 | | | $ | 4,737,824 | | | | 1.57 | % |
| Dunkin' Brands Group, Inc. | | | 145,178 | | | | 5,354,164 | | | | 1.78 | |
| McDonald's Corporation | | | 90,526 | | | | 9,024,537 | | | | 3.00 | |
| | | | | | | | 19,116,525 | | | | 6.35 | |
| Specialized REITs | | | | | | | | | | | | |
| American Tower Corporation - Cl. A | | | 81,329 | | | | 6,255,827 | | | | 2.08 | |
| | | | | | | | | | | | | |
| Specialty Stores | | | | | | | | | | | | |
| Tractor Supply Company | | | 36,602 | | | | 3,811,366 | | | | 1.27 | |
| | | | | | | | | | | | | |
| Systems Software | | | | | | | | | | | | |
| Red Hat, Inc.* | | | 90,879 | | | | 4,594,842 | | | | 1.53 | |
| | | | | | | | | | | | | |
| Trading Companies & Distributors | | | | | | | | | |
| MRC Global, Inc.* | | | 166,281 | | | | 5,475,633 | | | | 1.82 | |
| United Rentals, Inc.* | | | 55,574 | | | | 3,054,903 | | | | 1.01 | |
| W.W. Grainger, Inc. | | | 30,344 | | | | 6,826,793 | | | | 2.27 | |
| | | | | | | | 15,357,329 | | | | 5.10 | |
| TOTAL COMMON STOCKS | | | | | | | | | | | | |
| (Cost $229,594,852) | | | | | | | 300,763,123 | | | | 99.87 | |
| | | | | | | | | | | | | |
| SHORT-TERM INVESTMENTS | | | | | | | | | |
| State Street Institutional Treasury Money Market Fund, 0.000% | | | 4,125,273 | | | | 4,125,273 | | | | 1.37 | |
| | | | | | | | | | | | | |
| TOTAL SHORT-TERM INVESTMENTS | | | | | | | | | |
| (Cost $4,125,273) | | | | | | | 4,125,273 | | | | 1.37 | |
| | | | | | | | | | | | | |
| TOTAL INVESTMENTS | | | | | | | | | | | | |
| (Cost $233,720,125) | | | | | | | 304,888,396 | | | | 101.24 | |
| | | | | | | | | | | | | |
| Liabilities, Less Cash and Other Assets | | | | | | | (3,732,615 | ) | | | (1.24 | ) |
| | | | | | | | | | | | | |
| NET ASSETS | | | | | | $ | 301,155,781 | | | | 100.00 | % |
| | See notes to financial statements. |
| |
| INTERNATIONAL OPPORTUNITIES FUND |
| |
INVESTMENT REVIEW BY JIM GENDELMAN AND MUNISH MALHOTRA (UNAUDITED)
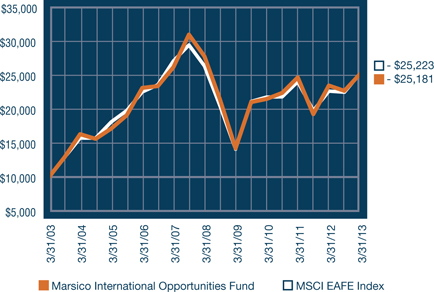
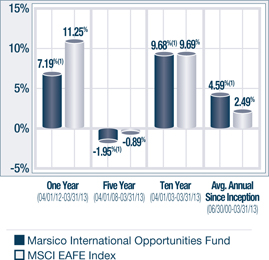
The Marsico International Opportunities Fund posted a total return of (US$) +10.88% for the six-month fiscal period ended March 31, 2013. The Fund underperformed the MSCI EAFE Index, which we consider to be the Fund’s benchmark index and which had a total return of (US$) +12.04%. Please see the Fund Overview for more detailed information about the Fund’s longer-term performance for various time periods ended March 31, 2013.
The performance data for the Fund quoted here represent past performance, and past performance is not a guarantee of future results. Investment return and principal value of an investment will fluctuate so that an investor’s shares, when redeemed, may be worth more or less than their original cost. Current performance may be lower or higher than the performance information quoted. To obtain performance information current to the most recent month-end, please call 888-860-8686 or visit www.marsicofunds.com.(1)
This review highlights Fund performance over a six-month fiscal period. Shareholders should keep in mind that the Fund is intended for long-term investors who hold their shares for substantially longer periods of time. You should also keep in mind that our views on all investments discussed in this report are subject to change at any time. References to specific securities, industries, and sectors discussed in this report are not recommendations to buy or sell such securities or related investments, and the Fund may not necessarily hold these securities or investments today. Please see the accompanying Schedule of Investments for the percentage of the Fund’s portfolio represented by the securities mentioned in this report as of the end of the reporting period.
Foreign investments present additional risks due to currency fluctuations, economic and political factors, lower liquidity, differences in securities regulations and accounting standards, possible changes in taxation, limited public information, and other factors. In addition, the Fund and the stocks and markets in which it invests are subject to other general risks that include periods of turbulence, instability, decline, and cyclical change, and that investors may continue to avoid investments in equity securities generally. Please see the Prospectus for more information.
The Fund’s underperformance versus its benchmark index was primarily attributable to stock selection in several sectors. Several of the Fund’s Information Technology holdings posted weak returns and accounted for some of the shortfall relative to the benchmark index. Chinese Internet services company Baidu, Inc. Spon. ADR (-27%), Japanese ecommerce company DeNA Co., Ltd. (-16%) and imaging products company HOYA CORPORATION (-15% prior to being sold) each registered sizeable stock price declines.
Stock selection and an underweight allocation to the Financials sector also impaired performance. Financials was a strong-performing sector of the MSCI EAFE Index with a return of +17%. The Fund’s performance was penalized by being significantly underweight the sector as compared to the benchmark index. Additionally, several of the Fund’s Financials positions struggled, most notably Brazilian real estate company BR Malls Participacoes S.A. (-11%).
Several of the Fund’s holdings in the Energy and Telecommunication Services sectors declined sharply. Oil and gas exploration company Tullow Oil PLC (-17%) and mobile phone operator Millicom International Cellular S.A. (-17% prior to being sold) each had a material, negative effect on performance results.
While some of the Fund’s holdings in the Consumer Discretionary and Health Care sectors posted positive absolute returns, their results significantly lagged the overall return of the benchmark index. Japanese ecommerce retailer Rakuten, Inc. gained just 0.01% and detracted from relative performance. In Health Care, Perrigo Company, manufacturer of store-branded over-the-counter medications, garnered a return of +2% and significantly lagged the +14% return of the MSCI EAFE Index Health Care sector.
The Fund’s sector allocations generally aided performance as compared to the benchmark index. Consumer Discretionary and Information Technology were strong-performing sectors of the MSCI EAFE Index, and the Fund did well by having a significant portion of its net assets invested in the sectors. The Fund’s performance was also buoyed by having few investments in Utilities, Energy and Materials, as these were some of the weakest-performing sectors of the benchmark index.
The Fund benefitted from strong performance by a few of its individual holdings. Semiconductor company ARM Holdings PLC (+48%), specialty chemicals company LyondellBasell Industries N.V. – Cl. A (+31%) and German media company Kabel Deutschland Holding AG (+35%) were among the Fund’s top-performing individual holdings.
| |
| INTERNATIONAL OPPORTUNITIES FUND |
| |
Although active currency management is not a central facet of the Fund’s investment process, currency fluctuations may at times affect the Fund’s performance. The Fund did well by having less exposure to securities denominated in the weaker Japanese yen than its benchmark index. The Fund also benefitted from having some exposure to companies whose securities are denominated in the US dollar, as the US dollar appreciated during the period.
During the period, the Fund increased its allocation to companies in the Consumer Discretionary and Industrials sectors while reducing its exposure to the Information Technology and Telecommunication Services sectors.
Fiscal Period-End Investment Posture
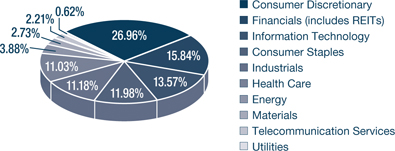
As of March 31, 2013, the Fund’s primary economic sector allocations included Consumer Discretionary, Financials and Information Technology.
In terms of country allocations, the Fund’s most significant weightings, excluding short-term investments, at period-end were the United Kingdom, Japan and Switzerland. Country-level weightings generally should be considered a residual of the Fund’s stock selection process rather than a major, proactive facet of its investment strategy.
Sincerely,
JAMES G. GENDELMAN
MUNISH MALHOTRA, CFA
PORTFOLIO MANAGERS
| (1) | Total returns are based on net change in net asset value assuming reinvestment of distributions. For the period prior to September 30, 2004 and from October 2011 through March 2013, the performance returns for the International Opportunities Fund reflect a fee waiver in effect; in the absence of such a waiver, the returns would have been reduced. For the period beginning October 2004 through December 2005, performance returns for the International Opportunities Fund would have been higher but for the reimbursement of fees waived previously. A redemption fee of 2% may be imposed on redemptions or exchanges of Fund shares owned for 30 days or less. Please see the Prospectus for more information. |
| |
| INTERNATIONAL OPPORTUNITIES FUND OVERVIEW |
| |
March 31, 2013 (Unaudited)
The International Opportunities Fund invests primarily in common stocks of foreign companies that are selected for their long-term growth potential. The Fund may invest in companies of any size throughout the world. It normally invests in the securities of issuers that are economically tied to one or more foreign countries, and expects to be invested in various issuers or securities that together have ties to at least four different foreign countries. Some issuers or securities in the Fund’s portfolio may be based in or economically tied to the United States. The Fund may hold an unlimited number of common stocks.
TOTAL ANNUAL OPERATING EXPENSES* 1.65% NET EXPENSES*† 1.60% | NET ASSETS $118,988,472 | NET ASSET VALUE PER SHARE $13.86 |
GROWTH OF $10,000(1)(2) | PERFORMANCE COMPARISON |
| |
SECTOR ALLOCATION(3) | TOP FIVE HOLDINGS |
| | |
| LIBERTY GLOBAL, INC. SERIES C | 3.25% |
| ROCHE HOLDING AG | 2.99% |
| NESTLÉ S.A. | 2.93% |
| DIAGEO PLC | 2.73% |
| TELECITY GROUP PLC | 2.72% |
| | |
| * | The Total Annual Operating Expenses and Net Expenses are reflective of the information disclosed in the Funds’ Prospectus dated February 1, 2013 and may differ from the expense ratios disclosed in this report. |
| † | Marsico Capital Management, LLC (the “Adviser”) has entered into a written expense limitation and fee waiver agreement under which it has agreed to limit the total expenses of the International Opportunities Fund (excluding interest, taxes, acquired fund fees and expenses, litigation, brokerage and extraordinary expenses) to an annual rate of 1.60% of the Fund’s average net assets until January 31, 2014. This expense limitation and fee waiver agreement may be terminated by the Adviser at any time after January 31, 2014, upon 15 days prior notice to the Fund and its administrator. The Adviser may recoup from the Fund fees previously waived or expenses previously reimbursed by the Adviser with respect to the Fund pursuant to this agreement (or a previous expense limitation agreement) if such reimbursement does not cause the Fund to exceed the expense limitation currently in effect and the reimbursement is made within three years after the year in which the Adviser waived the fee or reimbursed the expense. |
| | The performance data quoted here represent past performance, and past performance is not a guarantee of future results. Investment return and principal value of an investment will fluctuate so that an investor’s shares, when redeemed, may be worth more or less than their original cost. Current performance may be lower or higher than the performance information quoted. To obtain performance information current to the most recent month-end, please call 888-860-8686 or visit www.marsicofunds.com. A redemption fee may be imposed on redemptions or exchanges of Fund shares held for 30 days or less. |
| | The performance included in the chart and graph does not reflect the deduction of taxes on Fund distributions or the redemption of Fund shares. |
| | All indices are unmanaged and investors cannot invest directly in an index. |
| (1) | The performance returns for the International Opportunities Fund (for the period prior to September 30, 2004 and from October 2011 through March 2013) reflect a fee waiver in effect; in the absence of such a waiver, the returns would be reduced. For the period beginning October 2004 through December 2005, performance returns for the International Opportunities Fund would be higher but for the reimbursement of fees waived previously. |
| (2) | This chart assumes an initial investment of $10,000 made on March 31, 2003. Total returns are based on net change in NAV, assuming reinvestment of distributions. |
| (3) | Sector weightings represent the percentage of the Fund’s investments (excluding cash equivalents) in certain general sectors. These sectors may include more than one industry. The Fund’s portfolio composition is subject to change at any time. |
| | The MSCI EAFE Index tracks the stocks of about 1,000 companies in Europe, Australasia, and the Far East (EAFE). |
MARSICO INTERNATIONAL OPPORTUNITIES FUND
SCHEDULE OF INVESTMENTS
March 31, 2013 (Unaudited)
| | | Number of Shares | | | Value | | | Percent of Net Assets | |
| COMMON STOCKS | | | | | | | | | |
| Aerospace & Defense | | | | | | | | | |
| Rolls-Royce Holdings PLC* | | | 161,008 | | | $ | 2,764,472 | | | | 2.32 | % |
| | | | | | | | | | | | | |
| Alternative Carriers | | | | | | | | | | | | |
| Ziggo N.V. | | | 71,688 | | | | 2,521,093 | | | | 2.12 | |
| | | | | | | | | | | | | |
| Apparel, Accessories & Luxury Goods | | | | | |
| Adidas A.G. | | | 22,505 | | | | 2,334,961 | | | | 1.96 | |
| Swatch Group AG | | | 3,169 | | | | 1,842,714 | | | | 1.55 | |
| | | | | | | | 4,177,675 | | | | 3.51 | |
| Automobile Manufacturers | | | | | | | | | | | | |
| Bayerische Motoren Werke AG | | | 29,363 | | | | 2,533,480 | | | | 2.13 | |
| Honda Motor Co., Ltd. | | | 63,200 | | | | 2,416,954 | | | | 2.03 | |
| Hyundai Motor Company | | | 9,322 | | | | 1,872,611 | | | | 1.57 | |
| | | | | | | | 6,823,045 | | | | 5.73 | |
| Brewers | | | | | | | | | | | | |
| Anheuser-Busch InBev N.V. | | | 32,505 | | | | 3,218,742 | | | | 2.71 | |
| | | | | | | | | | | | | |
| Cable & Satellite | | | | | | | | | | | | |
| British Sky Broadcasting Group PLC | | | 239,943 | | | | 3,219,253 | | | | 2.71 | |
| Kabel Deutschland Holding AG | | | 26,050 | | | | 2,403,571 | | | | 2.02 | |
| Liberty Global, Inc. Series C* | | | 56,376 | | | | 3,869,085 | | | | 3.25 | |
| Naspers Ltd. - Cl. N | | | 23,676 | | | | 1,474,971 | | | | 1.24 | |
| | | | | | | | 10,966,880 | | | | 9.22 | |
| Commodity Chemicals | | | | | | | | | | | | |
| LyondellBasell Industries N.V. - Cl. A | | | 49,150 | | | | 3,110,704 | | | | 2.61 | |
| | | | | | | | | | | | | |
| Computer Storage & Peripherals | | | | | | | | | |
| Seagate Technology PLC | | | 51,998 | | | | 1,901,047 | | | | 1.60 | |
| | | | | | | | | | | | | |
| Construction & Farm Machinery & Heavy Trucks | | | | | |
| Komatsu Ltd. | | | 57,600 | | | | 1,366,344 | | | | 1.15 | |
| | | | | | | | | | | | | |
| Department Stores | | | | | | | | | | | | |
| Next PLC | | | 20,392 | | | | 1,352,788 | | | | 1.14 | |
| | | | | | | | | | | | | |
| Distillers & Vintners | | | | | | | | | | | | |
| Diageo PLC | | | 103,169 | | | | 3,252,772 | | | | 2.73 | |
| Pernod-Ricard S.A. | | | 10,582 | | | | 1,318,610 | | | | 1.11 | |
| | | | | | | | 4,571,382 | | | | 3.84 | |
| Diversified Banks | | | | | | | | | | | | |
| Barclays PLC | | | 369,948 | | | | 1,636,605 | | | | 1.37 | |
| BNP Paribas | | | 31,541 | | | | 1,618,851 | | | | 1.36 | |
| Mizuho Financial Group, Inc. | | | 1,069,700 | | | | 2,284,057 | | | | 1.92 | |
| Standard Chartered PLC | | | 89,550 | | | | 2,317,897 | | | | 1.95 | |
| | | | | | | | 7,857,410 | | | | 6.60 | |
| Diversified Capital Markets | | | | | | | | | |
| UBS A.G. | | | 106,935 | | | | 1,639,002 | | | | 1.38 | |
| | | | | | | | | | | | | |
| Electrical Components & Equipment | | | | | | | | | |
| Schneider Electric S.A. | | | 21,549 | | | | 1,574,488 | | | | 1.32 | |
| | | | | | | | | | | | | |
| Gas Utilities | | | | | | | | | | | | |
| ENN Energy Holdings Ltd. | | | 128,000 | | | | 705,747 | | | | 0.59 | |
| | | | | | | | | | | | | |
| Health Care Services | | | | | | | | | | | | |
| Fresenius S.E. & Company KGaA | | | 14,502 | | | | 1,789,973 | | | | 1.50 | |
| | | | | | | | | | | | | |
COMMON STOCKS (continued) | | | | | | | | | |
| Hotels, Resorts & Cruise Lines | | | | | | | | | |
| InterContinental Hotels Group PLC | | | 90,892 | | | $ | 2,771,784 | | | | 2.33 | % |
| | | | | | | | | | | | | |
| Industrial Machinery | | | | | | | | | | | | |
| FANUC Corporation | | | 12,500 | | | | 1,910,820 | | | | 1.61 | |
| | | | | | | | | | | | | |
| Internet Retail | | | | | | | | | | | | |
| Rakuten, Inc. | | | 228,900 | | | | 2,336,781 | | | | 1.96 | |
| | | | | | | | | | | | | |
| Internet Software & Services | | | | | | | | | |
| Baidu, Inc. Spon. ADR* | | | 13,408 | | | | 1,175,882 | | | | 0.99 | |
| DeNA Co., Ltd. | | | 69,900 | | | | 1,900,929 | | | | 1.60 | |
| MercadoLibre, Inc. | | | 13,000 | | | | 1,255,280 | | | | 1.05 | |
| Telecity Group PLC | | | 235,451 | | | | 3,232,325 | | | | 2.72 | |
| Yandex N.V. - Cl. A* | | | 107,634 | | | | 2,488,498 | | | | 2.09 | |
| | | | | | | | 10,052,914 | | | | 8.45 | |
| IT Consulting & Other Services | | | | | | | | | |
| Accenture plc - Cl. A | | | 16,162 | | | | 1,227,827 | | | | 1.03 | |
| | | | | | | | | | | | | |
| Life & Health Insurance | | | | | | | | | | | | |
| AIA Group Ltd. | | | 703,800 | | | | 3,073,580 | | | | 2.58 | |
| | | | | | | | | | | | | |
| Movies & Entertainment | | | | | | | | | | | | |
| Imax Corporation* | | | 44,024 | | | | 1,176,762 | | | | 0.99 | |
| | | | | | | | | | | | | |
| Oil & Gas Drilling | | | | | | | | | | | | |
| Seadrill Ltd. | | | 36,995 | | | | 1,340,897 | | | | 1.13 | |
| | | | | | | | | | | | | |
| Oil & Gas Exploration & Production | | | | | | | | | |
| CNOOC Ltd. | | | 680,800 | | | | 1,306,777 | | | | 1.10 | |
| Tullow Oil PLC | | | 94,978 | | | | 1,776,509 | | | | 1.49 | |
| | | | | | | | 3,083,286 | | | | 2.59 | |
| Packaged Foods & Meats | | | | | | | | | | | | |
| Danone S.A. | | | 34,191 | | | | 2,378,971 | | | | 2.00 | |
| Nestlé S.A. | | | 48,193 | | | | 3,485,146 | | | | 2.93 | |
| | | | | | | | 5,864,117 | | | | 4.93 | |
| Pharmaceuticals | | | | | | | | | | | | |
| Novo Nordisk A/S - B Shares | | | 10,678 | | | | 1,734,872 | | | | 1.46 | |
| Perrigo Company | | | 21,828 | | | | 2,591,638 | | | | 2.18 | |
| Roche Holding AG | | | 15,298 | | | | 3,561,422 | | | | 2.99 | |
| Shire PLC | | | 94,865 | | | | 2,888,618 | | | | 2.43 | |
| | | | | | | | 10,776,550 | | | | 9.06 | |
| Railroads | | | | | | | | | | | | |
| Canadian National Railway Company | | | 25,460 | | | | 2,553,638 | | | | 2.15 | |
| Canadian Pacific Railway Ltd. | | | 5,425 | | | | 696,756 | | | | 0.58 | |
| | | | | | | | 3,250,394 | | | | 2.73 | |
| Real Estate Operating Companies | | | | | | | | | |
| BR Malls Participacoes S.A. | | | 194,600 | | | | 2,422,930 | | | | 2.04 | |
| Global Logistic Properties Ltd. | | | 571,000 | | | | 1,206,127 | | | | 1.01 | |
| | | | | | | | 3,629,057 | | | | 3.05 | |
| Retail REITs | | | | | | | | | | | | |
| Unibail-Rodamco S.E. | | | 7,929 | | | | 1,846,762 | | | | 1.55 | |
| | | | | | | | | | | | | |
| Semiconductors | | | | | | | | | | | | |
| ARM Holdings PLC | | | 82,871 | | | | 1,159,708 | | | | 0.98 | |
| Taiwan Semiconductor Manufacturing Co., Ltd. Spon. ADR | | | 65,154 | | | | 1,119,997 | | | | 0.94 | |
| | | | | | | | 2,279,705 | | | | 1.92 | |
| | See notes to financial statements. |
| | | | Number of Shares | | | | Value | | | | Percent of Net Assets | |
COMMON STOCKS (continued) | | | | | | | | | |
| Specialty Stores | | | | | | | | | | | | |
| Dufry A.G.* | | | 9,006 | | | $ | 1,117,568 | | | | 0.94 | % |
| | | | | | | | | | | | | |
| Trading Companies & Distributors | | | | | | | | | |
| Marubeni Corporation | | | 247,000 | | | | 1,878,706 | | | | 1.58 | |
| | | | | | | | | | | | | |
| TOTAL COMMON STOCKS | | | | | | | | | | | | |
| (Cost $89,753,098) | | | | | | | 113,958,302 | | | | 95.77 | |
| | | | | | | | | | | | | |
| SHORT-TERM INVESTMENTS | | | | | | | | | |
| State Street Institutional Treasury Money Market Fund, 0.000% | | | 5,425,300 | | | | 5,425,300 | | | | 4.56 | |
| | | | | | | | | | | | | |
| TOTAL SHORT-TERM INVESTMENTS | | | | | | | | | |
| (Cost $5,425,300) | | | | | | | 5,425,300 | | | | 4.56 | |
| | | | | | | | | | | | | |
| TOTAL INVESTMENTS | | | | | | | | | | | | |
| (Cost $95,178,398) | | | | | | | 119,383,602 | | | | 100.33 | |
| | | | | | | | | | | | | |
| Liabilities, Less Cash and Other Assets | | | | | | | (395,130 | ) | | | (0.33 | ) |
| | | | | | | | | | | | | |
| NET ASSETS | | | | | | $ | 118,988,472 | | | | 100.00 | % |
| SUMMARY OF INVESTMENTS BY COUNTRY | |
| Country | | Market Value | | | Percent of Investment Securities | |
| Argentina | | $ | 1,255,280 | | | | 1.05 | % |
| Belgium | | | 3,218,742 | | | | 2.70 | |
| Brazil | | | 2,422,930 | | | | 2.03 | |
| Canada | | | 4,427,156 | | | | 3.71 | |
| China/Hong Kong | | | 6,261,986 | | | | 5.25 | |
| Denmark | | | 1,734,872 | | | | 1.45 | |
| France | | | 8,737,682 | | | | 7.32 | |
| Germany | | | 9,061,985 | | | | 7.59 | |
| Ireland | | | 6,017,492 | | | | 5.04 | |
| Japan | | | 14,094,591 | | | | 11.81 | |
| Netherlands | | | 5,631,797 | | | | 4.72 | |
| Norway | | | 1,340,897 | | | | 1.12 | |
| Russia | | | 2,488,498 | | | | 2.08 | |
| Singapore | | | 1,206,127 | | | | 1.01 | |
| South Africa | | | 1,474,971 | | | | 1.23 | |
| South Korea | | | 1,872,611 | | | | 1.57 | |
| Switzerland | | | 11,645,852 | | | | 9.75 | |
| Taiwan | | | 1,119,997 | | | | 0.94 | |
| United Kingdom | | | 23,484,113 | | | | 19.67 | |
United States(1) | | | 11,886,023 | | | | 9.96 | |
| | | $ | 119,383,602 | | | | 100.00 | % |
| (1) | Includes short-term securities. |
| | See notes to financial statements. |
INVESTMENT REVIEW BY MUNISH MALHOTRA AND JORDON LAYCOB (UNAUDITED)
The Marsico Flexible Capital Fund posted a total return of +8.16% for the six-month fiscal period ended March 31, 2013. The Fund underperformed the S&P 500 Index, which we consider to be the Fund’s benchmark index and which had a total return of +10.19%. Please see the Fund Overview for more detailed information about the Fund’s performance for various time periods ended March 31, 2013.
The performance data for the Fund quoted here represent past performance, and past performance is not a guarantee of future results. Investment return and principal value of an investment will fluctuate so that an investor’s shares, when redeemed, may be worth more or less than their original cost. Current performance may be lower or higher than the performance information quoted. To obtain performance information current to the most recent month-end, please call 888-860-8686 or visit www.marsicofunds.com.(1)
This review highlights Fund performance over a six-month fiscal period. Shareholders should keep in mind that the Fund is intended for long-term investors who hold their shares for substantially longer periods of time. You should also keep in mind that our views on all investments discussed in this report are subject to change at any time. References to specific securities, industries, and sectors discussed in this report are not recommendations to buy or sell such securities or related investments, and the Fund may not necessarily hold these securities or investments today. Please see the accompanying Schedule of Investments for the percentage of the Fund’s portfolio represented by the securities mentioned in this report as of the end of the reporting period.
The Fund and the stocks and markets in which it invests are subject to general risks that include periods of turbulence, instability, decline, and cyclical change, and that investors may continue to avoid investments in equity securities generally. Please see the Prospectus for more information.
The Fund’s performance shortfall relative to its benchmark index was attributable, in part, to stock selection in the Financials sector. Financials was the strongest-performing sector of the S&P 500 index with a return of +18%. In comparison, the Fund’s Financials sector return was just +7%. Much of the underperformance was attributable to the Fund’s diversified financials holdings including bank Capital One Financial Corporation (-5%) and Brazil-based financial settlements company CETIP S.A. – Mercados Organizado (-9% prior to being sold).
An elevated cash level, which we maintain as a buying reserve and as a defensive measure against adverse market conditions, was a further detractor to performance. Cash and cash equivalents averaged approximately 9% of the Fund’s net assets during the six-month period. The Fund’s elevated cash and modest allocation to fixed-income securities had a dampening effect to some degree on performance results during a time of generally stronger equity returns. (The Fund’s benchmark index holds no cash or fixed income securities.)
Stock selection and an underweight allocation to the strong-performing Health Care sector also hurt performance. Pharmacy benefit management company Express Scripts Holding Company slid -7%.
Stock selection in the Information Technology sector also detracted from performance. VMware, Inc. – Cl. A, a provider of virtualization software and services, tumbled -22% prior to being sold from the Fund. Enterprise software company Red Hat, Inc. (-7%) also posted a negative return.
There were several factors that aided performance during the period, led by stock selection and an overweight allocation to the Consumer Discretionary sector. The Fund had, on average, more than twice the allocation to the Consumer Discretionary sector as compared to the S&P 500 Index. This positioning benefitted the Fund, as Consumer Discretionary was one of the best-performing sectors of the benchmark index. Several of the Fund’s media positions posted double-digit gains, including Virgin Media, Inc. (+24% during the period held by the Fund) and Liberty Global, Inc. Series C (+10%). Liberty Global, a leading international cable operator, acquired Virgin Media during the period. Home improvement retailer Lowe’s Companies, Inc. (+27%) was another important contributor to performance.
Stock selection in the Consumer Staples and Materials sectors was strong. Consumer Staples holdings were led by Green Mountain Coffee Roasters, Inc. (+25%) and Constellation Brands, Inc. – Cl. A (+43%). Constellation Brands’s stock price soared as it appeared poised to gain control over the distribution of Corona beer in the US. In Materials, specialty chemical company LyondellBasell Industries N.V. - Cl. A (+27%) was a stand-out performer.
The Fund benefitted from having an overweight allocation to the Financials sector and by being underweight the weak-performing Information Technology sector.
During the period, the Fund increased its allocations to the Consumer Staples and Industrials sectors, while reducing exposure to the Financials and Information Technology sectors. The Fund reduced its exposure to international securities in favor of emphasizing investments in the US. Relative to much of the world, we believe the US to be further along in terms of de-leveraging, and its economy appears to be stabilizing or improving in a number of respects.
The Flexible Capital Fund has, during various periods since its inception, tended to have a relatively high portfolio turnover level. This is attributable in part to the Fund’s investment style. Although the Fund may hold core positions for some time, it may change its portfolio composition quickly to take advantage of new opportunities, preserve capital or limit losses.
Fiscal Period-End Investment Posture
As of March 31, 2013, the Fund’s primary economic sector allocations included Consumer Discretionary, Financials and Industrials. At period-end, the Fund had no exposure to the Utilities sector. During the period, the Fund’s investments emphasized investments in US equities and select foreign securities that we considered to be attractively valued. The Fund also held a few investments in fixed-income and preferred securities that we believed to offer equity-like return potential.
Sincerely,
MUNISH MALHOTRA, CFA
JORDON S. LAYCOB
PORTFOLIO MANAGERS
| (1) | Total returns are based on net change in net asset value assuming reinvestment of distributions. For the period prior to February 1, 2011, the performance returns for the Flexible Capital Fund reflect a fee waiver in effect; in the absence of such a waiver, the returns would have been reduced. A redemption fee of 2% may be imposed on redemptions or exchanges of Fund shares owned for 30 days or less. Please see the Prospectus for more information. |
| |
| FLEXIBLE CAPITAL FUND OVERVIEW |
| |
March 31, 2013 (Unaudited)
The Flexible Capital Fund invests primarily in equity securities and other investments that are selected primarily for their long-term growth potential. The Fund may invest in issuers of any size throughout the world, and will normally hold a core position of between 20 and 50 securities or other investments.
| TOTAL ANNUAL OPERATING EXPENSES* 1.44% | NET ASSETS $644,884,091 | NET ASSET VALUE PER SHARE $16.10 |
GROWTH OF $10,000(1)(2) | PERFORMANCE COMPARISON |
| |
SECTOR ALLOCATION(3) | TOP FIVE HOLDINGS |
| | |
| LIBERTY GLOBAL, INC. SERIES C | 4.39% |
| AUTOZONE, INC. | 4.08% |
| LOWE'S COMPANIES, INC. | 3.95% |
| MONDELEZ INTERNATIONAL, INC. - CL. A | 3.76% |
| UNITED RENTALS, INC. | 2.97% |
| | |
| * | The Total Annual Operating Expenses are reflective of the information disclosed in the Funds’ Prospectus dated February 1, 2013 and may differ from the expense ratio disclosed in this report. |
| | The performance data quoted here represent past performance, and past performance is not a guarantee of future results. Investment return and principal value of an investment will fluctuate so that an investor’s shares, when redeemed, may be worth more or less than their original cost. Current performance may be lower or higher than the performance information quoted. To obtain performance information current to the most recent month-end, please call 888-860-8686 or visit www.marsicofunds.com. A redemption fee may be imposed on redemptions or exchanges of Fund shares owned for 30 days or less. |
| | The performance included in the chart and graph does not reflect the deduction of taxes on Fund distributions or the redemption of Fund shares. |
| | All indices are unmanaged and investors cannot invest directly in an index. |
| (1) | The performance returns for the Flexible Capital Fund (for the period prior to February 1, 2011) reflect a fee waiver in effect; in the absence of such a waiver, the returns would be reduced. |
| (2) | This chart assumes an initial investment of $10,000 made on December 29, 2006 (inception). Total returns are based on change in NAV, assuming reinvestment of distributions. |
| (3) | Sector weightings represent the percentage of the Fund’s investments (excluding cash equivalents) in certain general sectors. These sectors may include more than one industry. The Fund’s portfolio composition is subject to change at any time. |
MARSICO FLEXIBLE CAPITAL FUND
SCHEDULE OF INVESTMENTS
March 31, 2013 (Unaudited)
| | | Number of Shares | | | Value | | | Percent of Net Assets | |
| COMMON STOCKS | | | | | | | | | |
| Aerospace & Defense | | | | | | | | | |
| TransDigm, Inc. | | | 44,175 | | | $ | 6,755,241 | | | | 1.05 | % |
| | | | | | | | | | | | | |
| Apparel Retail | | | | | | | | | | | | |
| Foot Locker, Inc. | | | 362,875 | | | | 12,424,840 | | | | 1.93 | |
| | | | | | | | | | | | | |
| Application Software | | | | | | | | | | | | |
| Model N, Inc.* | | | 166,177 | | | | 3,293,628 | | | | 0.51 | |
| | | | | | | | | | | | | |
| Automobile Manufacturers | | | | | | | | | | | | |
| Tesla Motors, Inc.* | | | 348,625 | | | | 13,209,401 | | | | 2.05 | |
| | | | | | | | | | | | | |
| Automotive Retail | | | | | | | | | | | | |
| AutoZone, Inc.* | | | 66,275 | | | | 26,295,932 | | | | 4.08 | |
| | | | | | | | | | | | | |
| Biotechnology | | | | | | | | | | | | |
| Biogen Idec Inc.* | | | 13,988 | | | | 2,698,425 | | | | 0.42 | |
| Celgene Corporation* | | | 114,408 | | | | 13,261,031 | | | | 2.06 | |
| Gilead Sciences, Inc.* | | | 129,434 | | | | 6,333,206 | | | | 0.98 | |
| | | | | | | | 22,292,662 | | | | 3.46 | |
| Broadcasting | | | | | | | | | | | | |
| CBS Corporation - Cl. B | | | 164,015 | | | | 7,657,860 | | | | 1.19 | |
| Television Broadcasts Ltd. | | | 773,000 | | | | 5,850,365 | | | | 0.90 | |
| | | | | | | | 13,508,225 | | | | 2.09 | |
| Cable & Satellite | | | | | | | | | | | | |
| Liberty Global, Inc. Series C* | | | 412,136 | | | | 28,284,894 | | | | 4.39 | |
| | | | | | | | | | | | | |
| Casinos & Gaming | | | | | | | | | | | | |
| Wynn Resorts Ltd. | | | 102,402 | | | | 12,816,634 | | | | 1.99 | |
| | | | | | | | | | | | | |
| Commodity Chemicals | | | | | | | | | | | | |
| LyondellBasell Industries N.V. - Cl. A | | | 101,450 | | | | 6,420,770 | | | | 1.00 | |
| | | | | | | | | | | | | |
| Communications Equipment | | | | | | | | | |
| QUALCOMM, Inc. | | | 249,589 | | | | 16,709,984 | | | | 2.59 | |
| | | | | | | | | | | | | |
| Construction & Farm Machinery & Heavy Trucks | | | | | |
| Cummins, Inc. | | | 106,869 | | | | 12,376,499 | | | | 1.92 | |
| | | | | | | | | | | | | |
| Consumer Finance | | | | | | | | | | | | |
| Capital One Financial Corporation | | | 244,381 | | | | 13,428,736 | | | | 2.08 | |
| | | | | | | | | | | | | |
| Distillers & Vintners | | | | | | | | | | | | |
| Constellation Brands, Inc. - Cl. A* | | | 357,442 | | | | 17,028,537 | | | | 2.64 | |
| | | | | | | | | | | | | |
| Diversified Banks | | | | | | | | | | | | |
| Standard Chartered PLC | | | 346,554 | | | | 8,970,143 | | | | 1.39 | |
| | | | | | | | | | | | | |
| Food Retail | | | | | | | | | | | | |
| Natural Grocers by Vitamin Cottage, Inc. * | | | 111,288 | | | | 2,509,544 | | | | 0.39 | |
| | | | | | | | | | | | | |
| Footwear | | | | | | | | | | | | |
| NIKE, Inc. - Cl. B | | | 126,792 | | | | 7,481,996 | | | | 1.16 | |
| | | | | | | | | | | | | |
| Health Care Equipment | | | | | | | | | | | | |
| Hologic, Inc.* | | | 723,844 | | | | 16,358,874 | | | | 2.54 | |
| | | | | | | | | | | | | |
COMMON STOCKS (continued) | | | | | | | | | |
| Health Care Services | | | | | | | | | | | | |
| Express Scripts Holding Company* | | | 252,749 | | | $ | 14,570,980 | | | | 2.26 | % |
| | | | | | | | | | | | | |
| Home Improvement Retail | | | | | | | | | | | | |
| Lowe's Companies, Inc. | | | 672,569 | | | | 25,503,816 | | | | 3.95 | |
| | | | | | | | | | | | | |
| Internet Retail | | | | | | | | | | | | |
| priceline.com, Inc.* | | | 18,484 | | | | 12,715,698 | | | | 1.97 | |
| | | | | | | | | | | | | |
| Internet Software & Services | | | | | | | | | |
| Equinix, Inc.* | | | 59,334 | | | | 12,834,538 | | | | 1.99 | |
| Google, Inc. - Cl. A* | | | 23,480 | | | | 18,643,824 | | | | 2.89 | |
| Yahoo!, Inc.* | | | 290,166 | | | | 6,827,606 | | | | 1.06 | |
| | | | | | | | 38,305,968 | | | | 5.94 | |
| IT Consulting & Other Services | | | | | | | | | |
| Cognizant Technology Solutions Corporation - Cl. A* | | | 159,636 | | | | 12,229,714 | | | | 1.90 | |
| | | | | | | | | | | | | |
| Life & Health Insurance | | | | | | | | | | | | |
| AIA Group Ltd. | | | 2,989,400 | | | | 13,055,073 | | | | 2.02 | |
| | | | | | | | | | | | | |
| Movies & Entertainment | | | | | | | | | | | | |
| Viacom, Inc. - Cl. B | | | 223,308 | | | | 13,749,074 | | | | 2.13 | |
| | | | | | | | | | | | | |
| Oil & Gas Equipment & Services | | | | | | | | | |
| Schlumberger Ltd. | | | 165,877 | | | | 12,422,529 | | | | 1.93 | |
| | | | | | | | | | | | | |
| Oil & Gas Refining & Marketing | | | | | | | | | |
| Phillips 66 | | | 184,683 | | | | 12,922,270 | | | | 2.00 | |
| | | | | | | | | | | | | |
| Oil & Gas Storage & Transportation | | | | | | | | | |
| Kinder Morgan, Inc. | | | 416,519 | | | | 16,110,955 | | | | 2.50 | |
| | | | | | | | | | | | | |
| Other Diversified Financial Services | | | | | | | | | |
| Citigroup, Inc. | | | 387,676 | | | | 17,150,786 | | | | 2.66 | |
| | | | | | | | | | | | | |
| Packaged Foods & Meats | | | | | | | | | | | | |
| Green Mountain Coffee Roasters, Inc.* | | | 276,045 | | | | 15,668,314 | | | | 2.43 | |
| Mondelez International, Inc. - Cl. A | | | 791,681 | | | | 24,233,355 | | | | 3.76 | |
| Pinnacle Foods, Inc.* | | | 113,541 | | | | 2,521,746 | | | | 0.39 | |
| | | | | | | | 42,423,415 | | | | 6.58 | |
| Railroads | | | | | | | | | | | | |
| CSX Corporation | | | 518,051 | | | | 12,759,596 | | | | 1.98 | |
| | | | | | | | | | | | | |
| Real Estate Operating Companies | | | | | | | | | |
| Global Logistic Properties Ltd. | | | 6,199,000 | | | | 13,094,191 | | | | 2.03 | |
| | | | | | | | | | | | | |
| Regional Banks | | | | | | | | | | | | |
| BankUnited, Inc. | | | 254,558 | | | | 6,521,776 | | | | 1.01 | |
| | | | | | | | | | | | | |
| Restaurants | | | | | | | | | | | | |
| Bloomin' Brands, Inc.* | | | 437,372 | | | | 7,815,838 | | | | 1.21 | |
| | | | | | | | | | | | | |
| Specialized Finance | | | | | | | | | | | | |
| Moody's Corporation | | | 123,880 | | | | 6,605,282 | | | | 1.02 | |
| | | | | | | | | | | | | |
| Systems Software | | | | | | | | | | | | |
| Red Hat, Inc.* | | | 227,368 | | | | 11,495,726 | | | | 1.78 | |
| | See notes to financial statements. |
MARSICO FLEXIBLE CAPITAL FUND
SCHEDULE OF INVESTMENTS (continued)
March 31, 2013 (Unaudited)
| | | Number of Shares/ Par Value | | | Value | | | Percent of Net Assets | |
COMMON STOCKS (continued) | | | | | | | |
| Trading Companies & Distributors | | | | | | | |
| MRC Global, Inc.* | | | 432,910 | | | $ | 14,255,727 | | | | 2.21 | % |
| United Rentals, Inc.* | | | 348,658 | | | | 19,165,730 | | | | 2.97 | |
| W.W. Grainger, Inc. | | | 61,140 | | | | 13,755,277 | | | | 2.13 | |
| | | | | | | | 47,176,734 | | | | 7.31 | |
| TOTAL COMMON STOCKS | | | | | | | | | | | | |
| (Cost $496,570,615) | | | | | | | 576,795,961 | | | | 89.44 | |
| | | | | | | | | | | | | |
| CORPORATE BONDS | | | | | | | | | | | | |
| Aerospace & Defense | | | | | | | | | | | | |
| TransDigm, Inc., 7.750%, 12/15/18 | | $ | 4,256,000 | | | | 4,670,960 | | | | 0.73 | |
| | | | | | | | | | | | | |
| Cable & Satellite | | | | | | | | | | | | |
| CCO Holdings LLC, 7.250%, 10/30/17 | | | 4,099,000 | | | | 4,421,797 | | | | 0.68 | |
| Dish DBS Corp., 6.625%, 10/1/14 | | | 4,099,000 | | | | 4,360,311 | | | | 0.68 | |
| | | | | | | | 8,782,108 | | | | 1.36 | |
| Casinos & Gaming | | | | | | | | | | | | |
| Marina District Finance Company, Inc., 9.500%, 10/15/15 | | | 2,855,000 | | | | 2,940,650 | | | | 0.46 | |
| | | | | | | | | | | | | |
| Real Estate Services | | | | | | | | | | | | |
| CB Richard Ellis Services, Inc., 11.625%, 6/15/17 | | | 5,613,000 | | | | 6,040,991 | | | | 0.94 | |
| | | | | | | | | | | | | |
| Research & Consulting Services | | | | | | | | | |
| Nielsen Finance Co., 7.750%, 10/15/18 | | | 5,185,000 | | | | 5,755,350 | | | | 0.89 | |
| | | | | | | | | | | | | |
| Wireless Telecommunication Services | | | | | |
| Crown Castle International Corp., 7.125%, 11/1/19 | | | 7,392,000 | | | | 8,075,760 | | | | 1.25 | |
| | | | | | | | | | | | | |
| TOTAL CORPORATE BONDS | | | | | | | | | |
| (Cost $35,133,426) | | | | | | | 36,265,819 | | | | 5.63 | |
| | | | | | | | | | | | | |
| INTERNATIONAL BONDS | | | | | | | | | | | | |
| Alternative Carriers | | | | | | | | | | | | |
| Ziggo Bond Co. 144A, 8.000%, 5/15/18 | | € | 6,086,000 | | | | 8,405,948 | | | | 1.30 | |
| | | | | | | | | | | | | |
| TOTAL INTERNATIONAL BONDS | | | | | | | | | |
| (Cost $8,269,002) | | | | | | | 8,405,948 | | | | 1.30 | |
| | | | | | | | | | | | | |
| PREFERRED STOCKS | | | | | | | | | | | | |
| Thrifts & Mortgage Finance | | | | | | | | | |
| First Niagara Financial Group, Inc., Series B, 8.625% | | | 212,799 | | | | 6,252,034 | | | | 0.97 | |
| | | | | | | | | | | | | |
| TOTAL PREFERRED STOCKS | | | | | | | | | |
| (Cost $5,319,975) | | | | | | | 6,252,034 | | | | 0.97 | |
| | | | | | | | | | | | | |
| | | Number of Shares/
Warrants | | | Value | | | Percent of Net Assets | |
| WARRANTS | | | | | | | | | |
| Oil & Gas Storage & Transportation | | | | | | | |
| Kinder Morgan, Inc., Strike Price: $40.00, Expiration Date: May 25, 2017* | | | 277,141 | | | $ | 1,424,505 | | | | 0.22 | % |
| | | | | | | | | | | | | |
| TOTAL WARRANTS | | | | | | | | | | | | |
| (Cost $527,954) | | | | | | | 1,424,505 | | | | 0.22 | |
| | | | | | | | | | | | | |
| SHORT-TERM INVESTMENTS | | | | | | | | | |
| State Street Institutional Treasury Money Market Fund, 0.000% | | | 8,773,272 | | | | 8,773,272 | | | | 1.36 | |
| | | | | | | | | | | | | |
| TOTAL SHORT-TERM INVESTMENTS | | | | | | | | | |
| (Cost $8,773,272) | | | | | | | 8,773,272 | | | | 1.36 | |
| | | | | | | | | | | | | |
| TOTAL INVESTMENTS | | | | | | | | | | | | |
| (Cost $554,594,244) | | | | | | | 637,917,539 | | | | 98.92 | |
| | | | | | | | | | | | | |
| Cash and Other Assets, Less Liabilities | | | | | | | 6,966,552 | | | | 1.08 | |
| | | | | | | | | | | | | |
| NET ASSETS | | | | | | $ | 644,884,091 | | | | 100.00 | % |
| | See notes to financial statements. |
INVESTMENT REVIEW BY TOM MARSICO AND JIM GENDELMAN (UNAUDITED)
The Marsico Global Fund posted a total return of (US$) +9.73% for the six-month fiscal period ended March 31, 2013. The Fund’s return modestly outperformed that of the MSCI All Country World Index (“MSCI ACWI Index”), which we consider to be the Fund’s benchmark index and which had a total return of (US$) +9.57%. The MSCI ACWI Index measures equity market performance in the global developed and emerging markets. Please see the Fund Overview for more detailed information about the Fund’s performance for various time periods ended March 31, 2013.
The performance data for the Fund quoted here represent past performance, and past performance is not a guarantee of future results. Investment return and principal value of an investment will fluctuate so that an investor’s shares, when redeemed, may be worth more or less than their original cost. Current performance may be lower or higher than the performance information quoted. To obtain performance information current to the most recent month-end, please call 888-860-8686 or visit www.marsicofunds.com.(1)
This review highlights Fund performance over a six-month fiscal period. Shareholders should keep in mind that the Fund is intended for long-term investors who hold their shares for substantially longer periods of time. You should also keep in mind that our views on all investments discussed in this report are subject to change at any time. References to specific securities, industries, and sectors discussed in this report are not recommendations to buy or sell such securities or related investments, and the Fund may not necessarily hold these securities or investments today. Please see the accompanying Schedule of Investments for the percentage of the Fund’s portfolio represented by the securities mentioned in this report as of the end of the reporting period.
Foreign investments present additional risks due to currency fluctuations, economic and political factors, lower liquidity, differences in securities regulations and accounting standards, possible changes in taxation, limited public information, and other factors. In addition, the Fund and the stocks and markets in which it invests are subject to other general risks that include periods of turbulence, instability, decline, and cyclical change, and that investors may continue to avoid investments in equity securities generally. Please see the Prospectus for more information.
The Global Fund’s outperformance versus the MSCI ACWI Index was partially attributable to strong stock selection and positioning in the Health Care and Materials sectors. Health Care was a strong-performing sector of the benchmark index and the Fund did well by having an overweight posture in the sector as compared to the index. A number of the Fund’s pharmaceutical and biotechnology holdings posted sizeable stock price gains, including Roche Holding AG (+27%), Gilead Sciences, Inc. (+40%), Biogen Idec Inc. (+27%) and Bristol-Myers Squibb Company (+29%). The Fund’s sole holding in the Materials sector, LyondellBasell Industries N.V. – Cl. A, gained +23% and was sold. Materials was a weak-performing area of the MSCI ACWI Index and the Fund benefitted from having very little exposure to the sector.
Other individual holdings having a material, positive effect on Fund performance included capital goods company Rolls-Royce Holdings PLC (+22%) and media position Kabel Deutschland Holding AG (+32%).
From a sector allocation standpoint, the Fund benefitted from having a significant overweight allocation to the strong-performing Consumer Discretionary sector while being underweight the Energy and Telecommunication Services sectors.
Active currency management is not a central facet of the Fund’s investment process, but fluctuations in major world currencies can affect performance. During this six-month period, the Fund’s performance was bolstered by having very little exposure to companies whose securities are denominated in the Japanese yen, which weakened considerably in the period, and by having an overweight allocation to securities denominated in the US dollar, which strengthened.
There were a few negative performance factors during the period. Financials was the strongest-performing sector of the MSCI ACWI Index with a return of +16% and the Fund’s performance was hurt by having an underweight allocation to the sector. Further, the Fund’s Financials sector return of +12% trailed the return of the pertinent benchmark index sector. A position in Brazilian real estate company BR Malls Participacoes S.A. (-9% prior to being sold) was a primary detractor within the sector.
A few of the Fund’s Information Technology holdings experienced significant stock price declines. Hardware manufacturer Fusion-io, Inc. (-30%) and Chinese Internet services company Baidu, Inc. Spon. ADR (-18%) each posted negative returns and were sold from the Fund. Apple, Inc. was one of the largest individual holdings in the Fund early in the reporting period and was also a significant constituent of the benchmark index. The Fund sold Apple in late 2012, owing to concerns about the company’s future revenue growth. Although the Fund benefitted from selling Apple before further stock price declines in 2013, Apple’s stock posted a return of -23% during the period it was held in the Fund and detracted from relative performance, as the Fund’s position size in Apple was larger, on average, than the size of the position in the benchmark index.
Certain individual positions struggled. Pharmaceutical company Perrigo Company (-14%), athletic apparel company lululemon athletica, inc. (-17%) and casino operator Wynn Macau Ltd. (-3%) each sustained losses. Perrigo and Wynn Macau were sold from the Fund during the period. Mead Johnson Nutrition Company (-19%, also sold in the period) experienced stock price pressure after the company warned that slowing international growth for its baby formula products could affect future revenue and profit growth.
The Global Fund has, during various periods since its inception, tended to have a relatively high portfolio turnover level. This is attributable in part to the Fund’s investment style. Although the Fund may hold core positions for some time, it may change its portfolio composition quickly to take advantage of new opportunities, preserve capital or limit losses.
During the period, the Fund increased its investments in the Industrials and Health Care sectors while reducing investments in Information Technology, Energy and Consumer Staples.
Fiscal Period-End Investment Posture
As of March 31, 2013, the Fund’s primary economic sector allocations were Consumer Discretionary, Industrials, Health Care and Consumer Staples. The Fund had no investments in the Utilities sector. The Fund’s most significant country allocations were the US, Switzerland, the United Kingdom and France.
Sincerely,
THOMAS F. MARSICO
JAMES G. GENDELMAN
PORTFOLIO MANAGERS
| (1) | Total returns are based on net change in net asset value assuming reinvestment of distributions. For the periods prior to January 1, 2009, from April 2009 through May 2009, and from January 2012 through March 2013, the performance returns for the Global Fund reflect a fee waiver in effect; in the absence of such a waiver, the returns would have been reduced. For the one-month period of June 2009, performance returns for the Global Fund would have been higher but for the reimbursement of fees waived previously. A redemption fee of 2% may be imposed on redemptions or exchanges of Fund shares owned for 30 days or less. Please see the Prospectus for more information. |
March 31, 2013 (Unaudited)
The Global Fund invests primarily in common stocks that are selected for their long-term growth potential. The Fund invests in the securities of companies of any size that are economically tied to any countries or markets throughout the world, including the securities of companies economically tied to emerging markets. Under normal market conditions, the Fund will invest significantly (generally, at least 40% of its net assets) in the securities of issuers organized or located outside the US or doing business outside the US (unless market conditions are not deemed favorable by the Adviser, in which case the Fund generally will invest at least 30% of its assets in such foreign securities). The Fund will invest its assets in various regions and countries, including the US, that encompass not less than three different countries overall. The Fund may hold an unlimited number of common stocks.
TOTAL ANNUAL OPERATING EXPENSES* 1.71% NET EXPENSES*† 1.61% | NET ASSETS $53,217,994 | NET ASSET VALUE PER SHARE $12.63 |
GROWTH OF $10,000(1)(2) | PERFORMANCE COMPARISON |
| |
SECTOR ALLOCATION(3) | TOP FIVE HOLDINGS |
| | |
| ROCHE HOLDING AG | 4.95% |
| ROLLS-ROYCE HOLDINGS PLC | 4.58% |
| BIOGEN IDEC INC. | 3.90% |
| EBAY, INC. | 3.76% |
| GOOGLE, INC. - CL. A | 3.62% |
| | |
| * | The Total Annual Operating Expenses and Net Expenses are reflective of the information disclosed in the Funds’ Prospectus dated February 1, 2013 and may differ from the expense ratios disclosed in this report. |
| † | Marsico Capital Management, LLC (the “Adviser”) has entered into a written expense limitation and fee waiver agreement under which it has agreed to limit the total expenses of the Global Fund (excluding interest, taxes, acquired fund fees and expenses, litigation, brokerage and extraordinary expenses) to an annual rate of 1.60% of the Fund’s average net assets until January 31, 2014. This expense limitation and fee waiver agreement may be terminated by the Adviser at any time after January 31, 2014, upon 15 days prior notice to the Fund and its administrator. The Adviser may recoup from the Fund fees previously waived or expenses previously reimbursed by the Adviser with respect to the Fund pursuant to this agreement (or a previous expense limitation agreement) if such reimbursement does not cause the Fund to exceed the expense limitation currently in effect and the reimbursement is made within three years after the year in which the Adviser waived the fee or reimbursed the expense. |
| | The performance data quoted here represent past performance, and past performance is not a guarantee of future results. Investment return and principal value of an investment will fluctuate so that an investor’s shares, when redeemed, may be worth more or less than their original cost. Current performance may be lower or higher than the performance information quoted. To obtain performance information current to the most recent month-end, please call 888-860-8686 or visit www.marsicofunds.com. A redemption fee may be imposed on redemptions or exchanges of Fund shares held for 30 days or less. |
| | The performance included in the chart and graph does not reflect the deduction of taxes on Fund distributions or the redemption of Fund shares. |
| | All indices are unmanaged and investors cannot invest directly in an index. |
| (1) | The performance returns for the Global Fund (for the period prior to January 1, 2009, from April 2009 through May 2009 and from January 2012 through March 2013) reflect a fee waiver in effect; in absence of such a waiver, the returns would be reduced. For the one-month period June 2009, performance returns for the Global Fund would have been higher but for reimbursement of fees waived previously. |
| (2) | This chart assumes an initial investment of $10,000 made on June 29, 2007 (inception). Total returns are based on change in NAV, assuming reinvestment of distributions. |
| (3) | Sector weightings represent the percentage of the Fund’s investments (excluding cash equivalents) in certain general sectors. These sectors may include more than one industry. The Fund’s portfolio composition is subject to change at any time. |
| | The MSCI ACWI (All Country World Index) Index is a free float-adjusted market capitalization index that is designed to measure equity market performance in the global developed and emerging markets. |
MARSICO GLOBAL FUND
SCHEDULE OF INVESTMENTS
March 31, 2013 (Unaudited)
| | | Number of Shares | | | Value | | | Percent of Net Assets | |
| COMMON STOCKS | | | | | | | | | |
| Aerospace & Defense | | | | | | | | | |
| Precision Castparts Corp. | | | 6,847 | | | $ | 1,298,328 | | | | 2.44 | % |
| Rolls-Royce Holdings PLC* | | | 141,954 | | | | 2,437,319 | | | | 4.58 | |
| | | | | | | | 3,735,647 | | | | 7.02 | |
| Alternative Carriers | | | | | | | | | | | | |
| Ziggo N.V. | | | 30,182 | | | | 1,061,428 | | | | 1.99 | |
| | | | | | | | | | | | | |
| Apparel Retail | | | | | | | | | | | | |
| The TJX Companies, Inc. | | | 34,584 | | | | 1,616,802 | | | | 3.04 | |
| | | | | | | | | | | | | |
| Apparel, Accessories & Luxury Goods | | | | | |
| Compagnie Financière Richemont SA | | | 6,377 | | | | 500,460 | | | | 0.94 | |
| Hermes International | | | 4,660 | | | | 1,617,902 | | | | 3.04 | |
| lululemon athletica, inc.* | | | 16,332 | | | | 1,018,300 | | | | 1.92 | |
| Luxottica Group SpA Spon. ADR | | | 32,183 | | | | 1,618,483 | | | | 3.04 | |
| | | | | | | | 4,755,145 | | | | 8.94 | |
| Automobile Manufacturers | | | | | | | | | | | | |
| Tesla Motors, Inc.* | | | 21,163 | | | | 801,866 | | | | 1.51 | |
| | | | | | | | | | | | | |
| Automotive Retail | | | | | | | | | | | | |
| AutoZone, Inc.* | | | 2,190 | | | | 868,926 | | | | 1.63 | |
| | | | | | | | | | | | | |
| Biotechnology | | | | | | | | | | | | |
| Biogen Idec Inc.* | | | 10,747 | | | | 2,073,204 | | | | 3.90 | |
| Gilead Sciences, Inc.* | | | 38,544 | | | | 1,885,958 | | | | 3.54 | |
| | | | | | | | 3,959,162 | | | | 7.44 | |
| Brewers | | | | | | | | | | | | |
| Anheuser-Busch InBev N.V. | | | 19,333 | | | | 1,914,411 | | | | 3.60 | |
| | | | | | | | | | | | | |
| Cable & Satellite | | | | | | | | | | | | |
| British Sky Broadcasting Group PLC | | | 103,546 | | | | 1,389,250 | | | | 2.61 | |
| Comcast Corporation - Cl. A | | | 26,512 | | | | 1,113,769 | | | | 2.09 | |
| Kabel Deutschland Holding AG | | | 17,857 | | | | 1,647,623 | | | | 3.10 | |
| | | | | | | | 4,150,642 | | | | 7.80 | |
| Construction & Farm Machinery & Heavy Trucks | | | | | |
| Cummins, Inc. | | | 9,040 | | | | 1,046,922 | | | | 1.97 | |
| | | | | | | | | | | | | |
| Diversified Banks | | | | | | | | | | | | |
| Wells Fargo & Company | | | 44,506 | | | | 1,646,277 | | | | 3.09 | |
| | | | | | | | | | | | | |
| Electrical Components & Equipment | | | | | | | | | |
| Eaton Corporation PLC | | | 18,250 | | | | 1,117,813 | | | | 2.10 | |
| | | | | | | | | | | | | |
| Footwear | | | | | | | | | | | | |
| NIKE, Inc. - Cl. B | | | 19,788 | | | | 1,167,690 | | | | 2.19 | |
| | | | | | | | | | | | | |
| Home Improvement Retail | | | | | | | | | | | | |
| The Home Depot, Inc. | | | 23,350 | | | | 1,629,363 | | | | 3.06 | |
| | | | | | | | | | | | | |
| Hotels, Resorts & Cruise Lines | | | | | | | | | |
| Starwood Hotels & Resorts Worldwide, Inc. | | | 13,067 | | | | 832,760 | | | | 1.57 | |
| | | | | | | | | | | | | |
| Hypermarkets & Super Centers | | | | | | | | | |
| PriceSmart, Inc. | | | 13,683 | | | | 1,064,948 | | | | 2.00 | |
| | | | | | | | | | | | | |
| Industrial Machinery | | | | | | | | | | | | |
| Pentair Ltd. | | | 20,007 | | | | 1,055,369 | | | | 1.98 | |
| | | | | | | | | | | | | |
COMMON STOCKS (continued) | | | | | | | | | |
| Internet Software & Services | | | | | |
| eBay, Inc.* | | | 36,871 | | | $ | 1,999,145 | | | | 3.76 | % |
| Google, Inc. - Cl. A* | | | 2,426 | | | | 1,926,317 | | | | 3.62 | |
| | | | | | | | 3,925,462 | | | | 7.38 | |
| IT Consulting & Other Services | | | | | | | | | |
| Accenture plc - Cl. A | | | 14,602 | | | | 1,109,314 | | | | 2.08 | |
| | | | | | | | | | | | | |
| Oil & Gas Equipment & Services | | | | | |
| Schlumberger Ltd. | | | 15,009 | | | | 1,124,024 | | | | 2.11 | |
| | | | | | | | | | | | | |
| Other Diversified Financial Services | | | | | | | | | |
| Citigroup, Inc. | | | 37,499 | | | | 1,658,956 | | | | 3.12 | |
| | | | | | | | | | | | | |
| Packaged Foods & Meats | | | | | | | | | | | | |
| Danone S.A. | | | 22,440 | | | | 1,561,350 | | | | 2.94 | |
| Nestlé S.A. | | | 25,919 | | | | 1,874,370 | | | | 3.52 | |
| | | | | | | | 3,435,720 | | | | 6.46 | |
| Pharmaceuticals | | | | | | | | | | | | |
| Bristol-Myers Squibb Company | | | 36,457 | | | | 1,501,664 | | | | 2.82 | |
| Roche Holding AG | | | 11,315 | | | | 2,634,167 | | | | 4.95 | |
| | | | | | | | 4,135,831 | | | | 7.77 | |
| Railroads | | | | | | | | | | | | |
| Canadian Pacific Railway Ltd. | | | 8,073 | | | | 1,036,850 | | | | 1.95 | |
| | | | | | | | | | | | | |
| Real Estate Operating Companies | | | | | | | | | |
| Global Logistic Properties Ltd. | | | 459,000 | | | | 969,549 | | | | 1.82 | |
| | | | | | | | | | | | | |
| Restaurants | | | | | | | | | | | | |
| Starbucks Corporation | | | 19,197 | | | | 1,093,461 | | | | 2.05 | |
| | | | | | | | | | | | | |
| Trading Companies & Distributors | | | | | | | | | |
| W.W. Grainger, Inc. | | | 3,643 | | | | 819,602 | | | | 1.54 | |
| | | | | | | | | | | | | |
| TOTAL COMMON STOCKS | | | | | | | | | | | | |
| (Cost $42,174,790) | | | | | | | 51,733,940 | | | | 97.21 | |
| | | | | | | | | | | | | |
| SHORT-TERM INVESTMENTS | | | | | | | | | |
| State Street Institutional Treasury Money Market Fund, 0.000% | | | 1,586,109 | | | | 1,586,109 | | | | 2.98 | |
| | | | | | | | | | | | | |
| TOTAL SHORT-TERM INVESTMENTS | | | | | | | | | |
| (Cost $1,586,109) | | | | | | | 1,586,109 | | | | 2.98 | |
| | | | | | | | | | | | | |
| TOTAL INVESTMENTS | | | | | | | | | | | | |
| (Cost $43,760,899) | | | | | | | 53,320,049 | | | | 100.19 | |
| | | | | | | | | | | | | |
| Liabilities, Less Cash and Other Assets | | | | | | | (102,055 | ) | | | (0.19 | ) |
| | | | | | | | | | | | | |
| NET ASSETS | | | | | | $ | 53,217,994 | | | | 100.00 | % |
| | See notes to financial statements. |
| SUMMARY OF INVESTMENTS BY COUNTRY | |
| Country | | Market Value | | | Percent of Investment Securities | |
| Belgium | | $ | 1,914,411 | | | | 3.59 | % |
| Canada | | | 2,055,150 | | | | 3.85 | |
| France | | | 3,179,252 | | | | 5.96 | |
| Germany | | | 1,647,623 | | | | 3.09 | |
| Ireland | | | 1,109,314 | | | | 2.08 | |
| Italy | | | 1,618,483 | | | | 3.04 | |
| Netherlands | | | 2,185,452 | | | | 4.10 | |
| Singapore | | | 969,549 | | | | 1.82 | |
| Switzerland | | | 5,008,997 | | | | 9.39 | |
| United Kingdom | | | 3,826,569 | | | | 7.18 | |
United States(1) | | | 29,805,249 | | | | 55.90 | |
| | | $ | 53,320,049 | | | | 100.00 | % |
| (1) | Includes short-term securities. |
| | See notes to financial statements. |
STATEMENTS OF ASSETS AND LIABILITIES
March 31, 2013 (Unaudited)
| (Amounts in thousands) | | MARSICO FOCUS FUND | | | MARSICO GROWTH FUND | |
| | | | | | | |
| ASSETS | | | | | | |
| Investments, at value (cost $663,775, $501,418, $233,720, $95,178, $554,594, and $43,761, respectively) | | $ | 879,285 | | | $ | 654,426 | |
| Cash | | | — | | | | 167 | |
| Foreign currency (cost $0, $0, $0, $67, $0, and $0, respectively) | | | — | | | | — | |
| Receivable for investments sold | | | — | | | | 3,758 | |
| Receivable for capital stock sold | | | 536 | | | | 109 | |
| Interest and dividends receivable | | | 487 | | | | 350 | |
| Prepaid expenses and other assets | | | 905 | | | | 622 | |
| Total Assets | | | 881,213 | | | | 659,432 | |
| | | | | | | | | |
| LIABILITIES | | | | | | | | |
| Payable for investments purchased | | | 4,127 | | | | 3,469 | |
| Payable for capital stock redeemed | | | 1,691 | | | | 325 | |
| Payable to investment adviser | | | 623 | | | | 465 | |
| Accrued trustees' fees | | | 921 | | | | 626 | |
| Accrued distribution fee | | | 1,884 | | | | 1,254 | |
| Accrued professional fees | | | 66 | | | | 45 | |
| Accrued transfer agent fees and expenses | | | 162 | | | | 112 | |
| Accrued printing expenses | | | 101 | | | | 71 | |
| Accrued expenses and other liabilities | | | 45 | | | | 34 | |
| Total Liabilities | | | 9,620 | | | | 6,401 | |
| | | | | | | | | |
| NET ASSETS | | $ | 871,593 | | | $ | 653,031 | |
| | | | | | | | | |
| NET ASSETS CONSIST OF | | | | | | | | |
| Paid-in-capital | | $ | 585,343 | | | $ | 445,888 | |
| Undistributed net investment income (accumulated net investment loss) | | | (1,916 | ) | | | (48 | ) |
| Accumulated net realized gain (loss) on investments and foreign currency transactions | | | 72,429 | | | | 54,034 | |
| Net unrealized appreciation on investments and foreign currency translations | | | 215,737 | | | | 153,157 | |
| NET ASSETS | | $ | 871,593 | | | $ | 653,031 | |
| | | | | | | | | |
SHARES OUTSTANDING, $0.001 par value (Unlimited shares authorized) | | | 45,117 | | | | 29,077 | |
| | | | | | | | | |
NET ASSET VALUE, REDEMPTION PRICE, AND OFFERING PRICE PER SHARE (NET ASSETS/SHARES OUTSTANDING)* | | $ | 19.32 | | | $ | 22.46 | |
| * | Not in thousands, based on unrounded net assets and shares outstanding. |
| | See notes to financial statements. |
| | MARSICO 21st CENTURY FUND | | | MARSICO INTERNATIONAL OPPORTUNITIES FUND | | | MARSICO FLEXIBLE CAPITAL FUND | | | MARSICO GLOBAL FUND | |
| | | | | | | | | | | | |
| | | | | | | | | | | | |
| | $ | 304,888 | | | $ | 119,384 | | | $ | 637,918 | | | $ | 53,320 | |
| | | 12 | | | | 182 | | | | — | | | | — | |
| | | — | | | | 67 | | | | — | | | | — | |
| | | 1,317 | | | | 163 | | | | 22,910 | | | | 2,097 | |
| | | 27 | | | | 34 | | | | 1,099 | | | | 7 | |
| | | 121 | | | | 451 | | | | 1,891 | | | | 58 | |
| | | 532 | | | | 371 | | | | 906 | | | | 478 | |
| | | 306,897 | | | | 120,652 | | | | 664,724 | | | | 55,960 | |
| | | | | | | | | | | | | | | | |
| | | | | | | | | | | | | | | | |
| | | 2,806 | | | | 943 | | | | 17,567 | | | | 2,108 | |
| | | 1,458 | | | | 28 | | | | 399 | | | | — | |
| | | 220 | | | | 71 | | | | 467 | | | | 22 | |
| | | 531 | | | | 365 | | | | 893 | | | | 472 | |
| | | 547 | | | | 166 | | | | 334 | | | | 96 | |
| | | 28 | | | | 9 | | | | 27 | | | | 5 | |
| | | 69 | | | | 38 | | | | 83 | | | | 12 | |
| | | 36 | | | | 11 | | | | 39 | | | | 6 | |
| | | 46 | | | | 33 | | | | 31 | | | | 21 | |
| | | 5,741 | | | | 1,664 | | | | 19,840 | | | | 2,742 | |
| | | | | | | | | | | | | | | | |
| | $ | 301,156 | | | $ | 118,988 | | | $ | 644,884 | | | $ | 53,218 | |
| | | | | | | | | | | | | | | | |
| | | | | | | | | | | | | | | | |
| | $ | 778,922 | | | $ | 222,022 | | | $ | 528,238 | | | $ | 39,179 | |
| | | (1,632 | ) | | | 114 | | | | (2,364 | ) | | | (357 | ) |
| | | (547,407 | ) | | | (127,392 | ) | | | 35,369 | | | | 4,699 | |
| | | 71,273 | | | | 24,244 | | | | 83,641 | | | | 9,697 | |
| | $ | 301,156 | | | $ | 118,988 | | | $ | 644,884 | | | $ | 53,218 | |
| | | | | | | | | | | | | | | | |
| | | 19,475 | | | | 8,583 | | | | 40,065 | | | | 4,214 | |
| | | | | | | | | | | | | | | | |
| | $ | 15.46 | | | $ | 13.86 | | | $ | 16.10 | | | $ | 12.63 | |
STATEMENTS OF OPERATIONS
FOR THE SIX-MONTH PERIOD ENDED March 31, 2013 (Unaudited)
| (Amounts in thousands) | | MARSICO FOCUS FUND | | | MARSICO GROWTH FUND | |
| | | | | | | |
| INVESTMENT INCOME | | | | | | |
| Dividends (net of $0, $193, $80, $87, $176, and $27, respectively of non-reclaimable foreign withholding taxes) | | $ | 5,465 | | | $ | 5,125 | |
| Interest | | | 5 | | | | — | |
| Total Investment Income | | | 5,470 | | | | 5,125 | |
| | | | | | | | | |
| EXPENSES | | | | | | | | |
| Investment advisory fees | | | 3,712 | | | | 2,694 | |
| Distribution fees | | | 1,092 | | | | 792 | |
| Transfer agent fees and expenses | | | 548 | | | | 365 | |
| Trustees' fees and expenses | | | 143 | (1) | | | 94 | (1) |
| Professional fees | | | 118 | | | | 83 | |
| Printing and postage expenses | | | 101 | | | | 72 | |
| Fund administration fees | | | 95 | | | | 86 | |
| Custody and fund accounting fees | | | 92 | | | | 87 | |
| Miscellaneous | | | 53 | | | | 37 | |
| Federal and state registration fees | | | 25 | | | | 28 | |
| Total Expenses | | | 5,979 | | | | 4,338 | |
| Less waiver of expenses and expenses paid indirectly | | | (1 | ) | | | — | |
| Net Expenses | | | 5,978 | | | | 4,338 | |
| | | | | | | | | |
| NET INVESTMENT INCOME (LOSS) | | | (508 | ) | | | 787 | |
| | | | | | | | | |
| REALIZED AND UNREALIZED GAIN (LOSS) | | | | | | | | |
| Net realized gain on investments | | | 114,205 | | | | 84,539 | |
| Net realized gain (loss) on foreign currency transactions | | | — | | | | — | |
| Change in unrealized appreciation (depreciation) on investments and foreign currency translations | | | (38,388 | ) | | | (34,963 | ) |
| | | | | | | | | |
| Net Gain on Investments | | | 75,817 | | | | 49,576 | |
| | | | | | | | | |
| NET INCREASE IN NET ASSETS RESULTING FROM OPERATIONS | | $ | 75,309 | | | $ | 50,363 | |
| (1) | Amounts include trustees’ fees and expenses and the mark to market unrealized appreciation during the period for shares held in the Trustees’ Deferred Plan, as more fully described in Note 2(g) in the Notes to Financial Statements. |
| | | Trustees’ Fees and Expenses* | | | | |
| Focus Fund | | $ | 79,431 | | | $ | 64,036 | |
| Growth Fund | | | 56,048 | | | | 37,884 | |
21st Century Fund | | | 29,152 | | | | 34,224 | |
| International Opportunities Fund | | | 11,301 | | | | 30,472 | |
| Flexible Capital Fund | | | 46,284 | | | | 57,482 | |
| Global Fund | | | 5,057 | | | | 34,902 | |
| | See notes to financial statements. |
| | MARSICO 21st CENTURY FUND | | | MARSICO INTERNATIONAL OPPORTUNITIES FUND | | | MARSICO FLEXIBLE CAPITAL FUND | | | MARSICO GLOBAL FUND | |
| | | | | | | | | | | | |
| | | | | | | | | | | | |
| | $ | 2,485 | | | $ | 1,320 | | | $ | 4,371 | | | $ | 440 | |
| | | — | | | | — | | | | 1,265 | | | | — | |
| | | 2,485 | | | | 1,320 | | | | 5,636 | | | | 440 | |
| | | | | | | | | | | | | | | | |
| | | | | | | | | | | | | | | | |
| | | 1,333 | | | | 526 | | | | 2,566 | | | | 221 | |
| | | 392 | | | | 155 | | | | 755 | | | | 65 | |
| | | 249 | | | | 124 | | | | 427 | | | | 42 | |
| | | 63 | (1) | | | 42 | (1) | | | 104 | (1) | | | 40 | (1) |
| | | 43 | | | | 17 | | | | 71 | | | | 8 | |
| | | 38 | | | | 14 | | | | 54 | | | | 6 | |
| | | 71 | | | | 54 | | | | 85 | | | | 33 | |
| | | 59 | | | | 131 | | | | 108 | | | | 47 | |
| | | 21 | | | | 11 | | | | 26 | | | | 7 | |
| | | 18 | | | | 13 | | | | 36 | | | | 10 | |
| | | 2,287 | | | | 1,087 | | | | 4,232 | | | | 479 | |
| | | — | | | | (96 | ) | | | — | | | | (62 | ) |
| | | 2,287 | | | | 991 | | | | 4,232 | | | | 417 | |
| | | | | | | | | | | | | | | | |
| | | 198 | | | | 329 | | | | 1,404 | | | | 23 | |
| | | | | | | | | | | | | | | | |
| | | | | | | | | | | | | | | | |
| | | 40,375 | | | | 10,338 | | | | 54,452 | | | | 9,872 | |
| | | — | | | | (214 | ) | | | (47 | ) | | | 137 | |
| | | (16,842 | ) | | | 2,165 | | | | (8,298 | ) | | | (5,249 | ) |
| | | | | | | | | | | | | | | | |
| | | 23,533 | | | | 12,289 | | | | 46,107 | | | | 4,760 | |
| | | | | | | | | | | | | | | | |
| | $ | 23,731 | | | $ | 12,618 | | | $ | 47,511 | | | $ | 4,783 | |
STATEMENTS OF CHANGES IN NET ASSETS
| | | MARSICO FOCUS FUND | | | MARSICO GROWTH FUND | |
| | | | | | | | | | | | | |
| (Amounts in thousands) | | Six-Month Period Ended 3/31/13 (Unaudited) | | | Year Ended 9/30/12 | | | Six-Month Period Ended 3/31/13 (Unaudited) | | | Year Ended 9/30/12 | |
| | | | | | | | | | | | | |
| OPERATIONS: | | | | | | | | | | | | |
| Net investment income (loss) | | $ | (508 | ) | | $ | 972 | | | $ | 787 | | | $ | 1,070 | |
| Net realized gain on investments | | | 114,205 | | | | 98,278 | | | | 84,539 | | | | 69,072 | |
| Net realized gain (loss) on foreign currency transactions and forward foreign currency contracts | | | — | | | | (501 | ) | | | — | | | | 31 | |
| Change in unrealized appreciation (depreciation) on investments and foreign currency translations | | | (38,388 | ) | | | 129,020 | | | | (34,963 | ) | | | 92,018 | |
| Change in unrealized appreciation (depreciation) on forward foreign currency contracts | | | — | | | | — | | | | — | | | | — | |
| | | | | | | | | | | | | | | | | |
| Net increase in net assets resulting from operations | | | 75,309 | | | | 227,769 | | | | 50,363 | | | | 162,191 | |
| | | | | | | | | | | | | | | | | |
| DISTRIBUTIONS: | | | | | | | | | | | | | | | | |
| Net investment income | | | (1,177 | ) | | | — | | | | (1,219 | ) | | | (292 | ) |
| Net realized gains | | | (101,796 | ) | | | — | | | | (34,354 | ) | | | — | |
| | | | | | | | | | | | | | | | | |
| Total distributions | | | (102,973 | ) | | | — | | | | (35,573 | ) | | | (292 | ) |
| | | | | | | | | | | | | | | | | |
| CAPITAL SHARE TRANSACTIONS: | | | | | | | | | | | | | | | | |
| Proceeds from sales of shares | | | 59,113 | | | | 128,626 | | | | 25,712 | | | | 114,581 | |
| Proceeds from reinvestment of distributions | | | 100,815 | | | | — | | | | 34,546 | | | | 283 | |
| Redemption fees | | | 3 | | | | 12 | | | | 1 | | | | 31 | |
| Redemption of shares | | | (226,684 | ) | | | (326,779 | ) | | | (99,411 | ) | | | (266,326 | ) |
| | | | | | | | | | | | | | | | | |
| Net increase (decrease) from capital share transactions | | | (66,753 | ) | | | (198,141 | ) | | | (39,152 | ) | | | (151,431 | ) |
| | | | | | | | | | | | | | | | | |
| TOTAL INCREASE (DECREASE) IN NET ASSETS | | | (94,417 | ) | | | 29,628 | | | | (24,362 | ) | | | 10,468 | |
| | | | | | | | | | | | | | | | | |
| NET ASSETS: | | | | | | | | | | | | | | | | |
| Beginning of Period | | | 966,010 | | | | 936,382 | | | | 677,393 | | | | 666,925 | |
| | | | | | | | | | | | | | | | | |
| End of Period | | $ | 871,593 | | | $ | 966,010 | | | $ | 653,031 | | | $ | 677,393 | |
| | | | | | | | | | | | | | | | | |
| Undistributed net investment income (Accumulated net investment loss) | | $ | (1,916 | ) | | $ | (231 | ) | | $ | (48 | ) | | $ | 384 | |
| | | | | | | | | | | | | | | | | |
| TRANSACTIONS IN SHARES: | | | | | | | | | | | | | | | | |
| Shares sold | | | 3,135 | | | | 6,837 | | | | 1,209 | | | | 5,547 | |
| Shares issued in reinvestment of distributions | | | 5,817 | | | | — | | | | 1,705 | | | | 15 | |
| Shares redeemed | | | (12,097 | ) | | | (17,206 | ) | | | (4,682 | ) | | | (12,976 | ) |
| | | | | | | | | | | | | | | | | |
| NET INCREASE (DECREASE) | | | (3,145 | ) | | | (10,369 | ) | | | (1,768 | ) | | | (7,414 | ) |
| | See notes to financial statements. |
MARSICO 21st CENTURY FUND | | | MARSICO INTERNATIONAL OPPORTUNITIES FUND | | | MARSICO FLEXIBLE CAPITAL FUND | | | MARSICO GLOBAL FUND | |
| | | | | | | | | | | | | | | | | | | | | | | |
Six-Month Period Ended 3/31/13 (Unaudited) | | | Year Ended 9/30/12 | | | Six-Month Period Ended 3/31/13 (Unaudited) | | | Year Ended 9/30/12 | | | Six-Month Period Ended 3/31/13 (Unaudited) | | | Year Ended 9/30/12 | | | Six-Month Period Ended 3/31/13 (Unaudited) | | | Year Ended 9/30/12 | |
| | | | | | | | | | | | | | | | | | | | | | | |
| | | | | | | | | | | | | | | | | | | | | | | |
| $ | 198 | | | $ | (1,360 | ) | | $ | 329 | | | $ | 425 | | | $ | 1,404 | | | $ | 820 | | | $ | 23 | | | $ | (231 | ) |
| | 40,375 | | | | 14,722 | | | | 10,338 | | | | 4,076 | | | | 54,452 | | | | 38,397 | | | | 9,872 | | | | 11,459 | |
| | — | | | | (71 | ) | | | (214 | ) | | | (1,780 | ) | | | (47 | ) | | | (2,159 | ) | | | 137 | | | | 585 | |
| | (16,842 | ) | | | 95,147 | | | | 2,165 | | | | 22,082 | | | | (8,298 | ) | | | 90,708 | | | | (5,249 | ) | | | 7,662 | |
| | — | | | | — | | | | — | | | | 573 | | | | — | | | | — | | | | — | | | | — | |
| | | | | | | | | | | | | | | | | | | | | | | | | | | | | | | |
| | 23,731 | | | | 108,438 | | | | 12,618 | | | | 25,376 | | | | 47,511 | | | | 127,766 | | | | 4,783 | | | | 19,475 | |
| | | | | | | | | | | | | | | | | | | | | | | | | | | | | | | |
| | | | | | | | | | | | | | | | | | | | | | | | | | | | | | | |
| | — | | | | — | | | | — | | | | — | | | | (3,473 | ) | | | (1,878 | ) | | | — | | | | — | |
| | — | | | | — | | | | — | | | | — | | | | (29,533 | ) | | | — | | | | — | | | | — | |
| | | | | | | | | | | | | | | | | | | | | | | | | | | | | | | |
| | — | | | | — | | | | — | | | | — | | | | (33,006 | ) | | | (1,878 | ) | | | — | | | | — | |
| | | | | | | | | | | | | | | | | | | | | | | | | | | | | | | |
| | | | | | | | | | | | | | | | | | | | | | | | | | | | | | | |
| | 4,384 | | | | 15,514 | | | | 3,841 | | | | 12,020 | | | | 196,079 | | | | 297,142 | | | | 1,734 | | | | 14,965 | |
| | — | | | | — | | | | — | | | | — | | | | 29,608 | | | | 1,728 | | | | — | | | | — | |
| | 1 | | | | 6 | | | | — | | | | 1 | | | | 23 | | | | 51 | | | | — | | | | 6 | |
| | (81,505 | ) | | | (264,895 | ) | | | (31,692 | ) | | | (57,031 | ) | | | (185,624 | ) | | | (243,661 | ) | | | (7,494 | ) | | | (88,272 | ) |
| | | | | | | | | | | | | | | | | | | | | | | | | | | | | | | |
| | (77,120 | ) | | | (249,375 | ) | | | (27,851 | ) | | | (45,010 | ) | | | 40,086 | | | | 55,260 | | | | (5,760 | ) | | | (73,301 | ) |
| | | | | | | | | | | | | | | | | | | | | | | | | | | | | | | |
| | (53,389 | ) | | | (140,937 | ) | | | (15,233 | ) | | | (19,634 | ) | | | 54,591 | | | | 181,148 | | | | (977 | ) | | | (53,826 | ) |
| | | | | | | | | | | | | | | | | | | | | | | | | | | | | | | |
| | | | | | | | | | | | | | | | | | | | | | | | | | | | | | | |
| | 354,545 | | | | 495,482 | | | | 134,221 | | | | 153,855 | | | | 590,293 | | | | 409,145 | | | | 54,195 | | | | 108,021 | |
| | | | | | | | | | | | | | | | | | | | | | | | | | | | | | | |
| $ | 301,156 | | | $ | 354,545 | | | $ | 118,988 | | | $ | 134,221 | | | $ | 644,884 | | | $ | 590,293 | | | $ | 53,218 | | | $ | 54,195 | |
| | | | | | | | | | | | | | | | | | | | | | | | | | | | | | | |
| $ | (1,632 | ) | | $ | (1,830 | ) | | $ | 114 | | | $ | (215 | ) | | $ | (2,364 | ) | | $ | (295 | ) | | $ | (357 | ) | | $ | (380 | ) |
| | | | | | | | | | | | | | | | | | | | | | | | | | | | | | | |
| | | | | | | | | | | | | | | | | | | | | | | | | | | | | | | |
| | 307 | | | | 1,159 | | | | 289 | | | | 995 | | | | 12,677 | | | | 20,642 | | | | 147 | | | | 1,416 | |
| | — | | | | — | | | | — | | | | — | | | | 1,998 | | | | 136 | | | | — | | | | — | |
| | (5,729 | ) | | | (19,866 | ) | | | (2,442 | ) | | | (4,765 | ) | | | (11,987 | ) | | | (17,362 | ) | | | (643 | ) | | | (8,634 | ) |
| | | | | | | | | | | | | | | | | | | | | | | | | | | | | | | |
| | (5,422 | ) | | | (18,707 | ) | | | (2,153 | ) | | | (3,770 | ) | | | 2,688 | | | | 3,416 | | | | (496 | ) | | | (7,218 | ) |
FINANCIAL HIGHLIGHTS
| | | MARSICO FOCUS FUND | |
For a Fund Share Outstanding Throughout the Period | | Six-Month Period Ended 3/31/13 (Unaudited) | | | Year Ended 9/30/12 | | | Year Ended 9/30/11 | | | Year Ended 9/30/10 | | | Year Ended 9/30/09 | | | Year Ended 9/30/08 | |
| | | | | | | | | | | | | | | | | | | |
| Net Asset Value, Beginning of Period | | $ | 20.02 | | | $ | 15.97 | | | $ | 15.79 | | | $ | 14.38 | | | $ | 15.43 | | | $ | 21.75 | |
| | | | | | | | | | | | | | | | | | | | | | | | | |
| | | | | | | | | | | | | | | | | | | | | | | | | |
| Income from Investment Operations: | | | | | | | | | | | | | | | | | | | | | | | | |
| Net investment income (loss) | | | (0.01 | ) | | | 0.02 | | | | (0.02 | ) | | | (0.01 | ) | | | 0.04 | | | | 0.08 | |
| Net realized and unrealized gains (losses) on investments | | | 1.67 | | | | 4.03 | | | | 0.20 | | | | 1.45 | | | | (0.99 | ) | | | (4.60 | ) |
| | | | | | | | | | | | | | | | | | | | | | | | | |
| Total from investment operations | | | 1.66 | | | | 4.05 | | | | 0.18 | | | | 1.44 | | | | (0.95 | ) | | | (4.52 | ) |
| | | | | | | | | | | | | | | | | | | | | | | | | |
| Distributions & Other: | | | | | | | | | | | | | | | | | | | | | | | | |
| Net investment income | | | (0.03 | ) | | | — | | | | — | | | | (0.03 | ) | | | (0.09 | ) | | | — | |
| Tax return of capital | | | — | | | | — | | | | — | | | | — | | | | — | | | | — | |
| Net realized gains | | | (2.33 | ) | | | — | | | | — | | | | — | | | | (0.01 | ) | | | (1.80 | ) |
| Redemption fees [See Note 2(h)] | | | — | (1) | | | — | (1) | | | — | (1) | | | — | (1) | | | — | (1) | | | — | (1) |
| | | | | | | | | | | | | | | | | | | | | | | | | |
| Total distributions and other | | | (2.36 | ) | | | — | | | | — | | | | (0.03 | ) | | | (0.10 | ) | | | (1.80 | ) |
| | | | | | | | | | | | | | | | | | | | | | | | | |
| Net Asset Value, End of Period | | $ | 19.32 | | | $ | 20.02 | | | $ | 15.97 | | | $ | 15.79 | | | $ | 14.38 | | | $ | 15.43 | |
| | | | | | | | | | | | | | | | | | | | | | | | | |
| | | | | | | | | | | | | | | | | | | | | | | | | |
| Total Return | | | 9.65 | %(2) | | | 25.36 | % | | | 1.14 | % | | | 10.02 | % | | | (5.98 | )% | | | (22.69 | )% |
| | | | | | | | | | | | | | | | | | | | | | | | | |
| | | | | | | | | | | | | | | | | | | | | | | | | |
| Supplemental Data and Ratios: | | | | | | | | | | | | | | | | | | | | | | | | |
| | | | | | | | | | | | | | | | | | | | | | | | | |
| Net assets, end of Period (000s) | | $ | 871,593 | | | $ | 966,010 | | | $ | 936,382 | | | $ | 1,451,877 | | | $ | 2,001,041 | | | $ | 3,430,813 | |
| | | | | | | | | | | | | | | | | | | | | | | | | |
| Ratio of expenses to average net assets, less waivers and before expenses paid indirectly, plus reimbursements of previously waived expenses | | | 1.37 | %(3) | | | 1.34 | % | | | 1.33 | % | | | 1.33 | % | | | 1.31 | % | | | 1.21 | % |
| | | | | | | | | | | | | | | | | | | | | | | | | |
| Ratio of net investment income (loss) to average net assets, net of waivers, reimbursements of previously waived expenses and expenses paid indirectly | | | (0.12 | )%(3) | | | 0.09 | % | | | (0.04 | )% | | | (0.06 | )% | | | 0.27 | % | | | 0.41 | % |
| | | | | | | | | | | | | | | | | | | | | | | | | |
| Ratio of expenses to average net assets, before waivers, reimbursements of previously waived expenses and expenses paid indirectly | | | 1.37 | %(3) | | | 1.34 | % | | | 1.33 | % | | | 1.33 | % | | | 1.31 | % | | | 1.21 | % |
| | | | | | | | | | | | | | | | | | | | | | | | | |
| Ratio of net investment income (loss) to average net assets, before waivers, reimbursements of previously waived expenses and expenses paid indirectly | | | (0.12 | )%(3) | | | 0.09 | % | | | (0.04 | )% | | | (0.06 | )% | | | 0.27 | % | | | 0.41 | % |
| | | | | | | | | | | | | | | | | | | | | | | | | |
| Portfolio turnover rate | | | 43 | %(2) | | | 66 | % | | | 82 | % | | | 85 | % | | | 90 | % | | | 78 | % |
| | See notes to financial statements. |
MARSICO GROWTH FUND | | | MARSICO 21st CENTURY FUND | |
Six-Month Period Ended 3/31/13 (Unaudited) | | | Year Ended 9/30/12 | | | Year Ended 9/30/11 | | | Year Ended 9/30/10 | | | Year Ended 9/30/09 | | | Year Ended 9/30/08 | | | Six-Month Period Ended 3/31/13 (Unaudited) | | | Year Ended 9/30/12 | | | Year Ended 9/30/11 | | | Year Ended 9/30/10 | | | Year Ended 9/30/09 | | | Year Ended 9/30/08 | |
| | | | | | | | | | | | | | | | | | | | | | | | | | | | | | | | | | | |
| $ | 21.96 | | | $ | 17.43 | | | $ | 17.04 | | | $ | 15.32 | | | $ | 16.73 | | | $ | 23.07 | | | $ | 14.24 | | | $ | 11.36 | | | $ | 12.38 | | | $ | 11.56 | | | $ | 12.86 | | | $ | 18.07 | |
| | | | | | | | | | | | | | | | | | | | | | | | | | | | | | | | | | | | | | | | | | | | | | | |
| | | | | | | | | | | | | | | | | | | | | | | | | | | | | | | | | | | | | | | | | | | | | | | |
| | | | | | | | | | | | | | | | | | | | | | | | | | | | | | | | | | | | | | | | | | | | | | | |
| | 0.03 | | | | 0.03 | | | | — | (1) | | | 0.01 | | | | 0.07 | | | | 0.07 | | | | (0.01 | ) | | | (0.06 | ) | | | (0.06 | ) | | | (0.08 | ) | | | — | (1) | | | 0.01 | |
| | 1.70 | | | | 4.51 | | | | 0.40 | | | | 1.78 | | | | (1.38 | ) | | | (5.69 | ) | | | 1.23 | | | | 2.94 | | | | (0.96 | ) | | | 0.90 | | | | (1.27 | ) | | | (4.48 | ) |
| | | | | | | | | | | | | | | | | | | | | | | | | | | | | | | | | | | | | | | | | | | | | | | |
| | 1.73 | | | | 4.54 | | | | 0.40 | | | | 1.79 | | | | (1.31 | ) | | | (5.62 | ) | | | 1.22 | | | | 2.88 | | | | (1.02 | ) | | | 0.82 | | | | (1.27 | ) | | | (4.47 | ) |
| | | | | | | | | | | | | | | | | | | | | | | | | | | | | | | | | | | | | | | | | | | | | | | |
| | | | | | | | | | | | | | | | | | | | | | | | | | | | | | | | | | | | | | | | | | | | | | | |
| | (0.04 | ) | | | (0.01 | ) | | | (0.01 | ) | | | (0.07 | ) | | | (0.09 | ) | | | — | | | | — | | | | — | | | | — | | | | — | | | | (0.01 | ) | | | — | |
| | — | | | | — | | | | — | | | | — | | | | — | | | | — | | | | — | | | | — | | | | — | | | | — | | | | (0.02 | ) | | | — | |
| | (1.19 | ) | | | — | | | | — | | | | — | | | | (0.01 | ) | | | (0.72 | ) | | | — | | | | — | | | | — | | | | — | | | | — | | | | (0.74 | ) |
| | — | (1) | | | — | (1) | | | — | (1) | | | — | (1) | | | — | (1) | | | — | (1) | | | — | (1) | | | — | (1) | | | — | (1) | | | — | (1) | | | — | (1) | | | — | (1) |
| | | | | | | | | | | | | | | | | | | | | | | | | | | | | | | | | | | | | | | | | | | | | | | |
| | (1.23 | ) | | | (0.01 | ) | | | (0.01 | ) | | | (0.07 | ) | | | (0.10 | ) | | | (0.72 | ) | | | — | | | | — | | | | — | | | | — | | | | (0.03 | ) | | | (0.74 | ) |
| | | | | | | | | | | | | | | | | | | | | | | | | | | | | | | | | | | | | | | | | | | | | | | |
| $ | 22.46 | | | $ | 21.96 | | | $ | 17.43 | | | $ | 17.04 | | | $ | 15.32 | | | $ | 16.73 | | | $ | 15.46 | | | $ | 14.24 | | | $ | 11.36 | | | $ | 12.38 | | | $ | 11.56 | | | $ | 12.86 | |
| | | | | | | | | | | | | | | | | | | | | | | | | | | | | | | | | | | | | | | | | | | | | | | |
| | | | | | | | | | | | | | | | | | | | | | | | | | | | | | | | | | | | | | | | | | | | | | | |
| | 8.51 | %(2) | | | 26.04 | % | | | 2.34 | % | | | 11.75 | % | | | (7.74 | )% | | | (25.14 | )% | | | 8.57 | %(2) | | | 25.35 | % | | | (8.24 | )% | | | 7.09 | % | | | (9.79 | )% | | | (25.83 | )% |
| | | | | | | | | | | | | | | | | | | | | | | | | | | | | | | | | | | | | | | | | | | | | | | |
| | | | | | | | | | | | | | | | | | | | | | | | | | | | | | | | | | | | | | | | | | | | | | | |
| | | | | | | | | | | | | | | | | | | | | | | | | | | | | | | | | | | | | | | | | | | | | | | |
| | | | | | | | | | | | | | | | | | | | | | | | | | | | | | | | | | | | | | | | | | | | | | | |
| $ | 653,031 | | | $ | 677,393 | | | $ | 666,925 | | | $ | 883,053 | | | $ | 1,193,231 | | | $ | 2,097,571 | | | $ | 301,156 | | | $ | 354,545 | | | $ | 495,482 | | | $ | 757,438 | | | $ | 921,676 | | | $ | 1,853,435 | |
| | | | | | | | | | | | | | | | | | | | | | | | | | | | | | | | | | | | | | | | | | | | | | | |
| | 1.37 | %(3) | | | 1.35 | % | | | 1.33 | % | | | 1.33 | % | | | 1.30 | % | | | 1.24 | % | | | 1.46 | %(3) | | | 1.41 | % | | | 1.37 | % | | | 1.37 | % | | | 1.37 | % | | | 1.29 | % |
| | | | | | | | | | | | | | | | | | | | | | | | | | | | | | | | | | | | | | | | | | | | | | | |
| | 0.25 | %(3) | | | 0.15 | % | | | 0.03 | % | | | 0.04 | % | | | 0.42 | % | | | 0.33 | % | | | 0.13 | %(3) | | | (0.31 | )% | | | (0.32 | )% | | | (0.60 | )% | | | 0.06 | % | | | 0.07 | % |
| | | | | | | | | | | | | | | | | | | | | | | | | | | | | | | | | | | | | | | | | | | | | | | |
| | 1.37 | %(3) | | | 1.35 | % | | | 1.33 | % | | | 1.33 | % | | | 1.30 | % | | | 1.24 | % | | | 1.46 | %(3) | | | 1.41 | % | | | 1.37 | % | | | 1.37 | % | | | 1.37 | % | | | 1.29 | % |
| | | | | | | | | | | | | | | | | | | | | | | | | | | | | | | | | | | | | | | | | | | | | | | |
| | 0.25 | %(3) | | | 0.15 | % | | | 0.03 | % | | | 0.04 | % | | | 0.41 | % | | | 0.33 | % | | | 0.13 | %(3) | | | (0.31 | )% | | | (0.32 | )% | | | (0.60 | )% | | | 0.06 | % | | | 0.07 | % |
| | | | | | | | | | | | | | | | | | | | | | | | | | | | | | | | | | | | | | | | | | | | | | | |
| | 59 | %(2) | | | 65 | % | | | 67 | % | | | 67 | % | | | 77 | % | | | 72 | % | | | 54 | %(2) | | | 63 | % | | | 86 | % | | | 100 | % | | | 135 | % | | | 143 | % |
| | | MARSICO INTERNATIONAL OPPORTUNITIES FUND | |
For a Fund Share Outstanding Throughout the Period | | Six-Month Period Ended 3/31/13 (Unaudited) | | | Year Ended 9/30/12 | | | Year Ended 9/30/11 | | | Year Ended 9/30/10 | | | Year Ended 9/30/09 | | | Year Ended 9/30/08 | |
| | | | | | | | | | | | | | | | | | | |
| Net Asset Value, Beginning of Period | | $ | 12.50 | | | $ | 10.61 | | | $ | 12.57 | | | $ | 11.86 | | | $ | 12.27 | | | $ | 20.10 | |
| | | | | | | | | | | | | | | | | | | | | | | | | |
| | | | | | | | | | | | | | | | | | | | | | | | | |
| Income from Investment Operations: | | | | | | | | | | | | | | | | | | | | | | | | |
| Net investment income (loss) | | | 0.03 | | | | 0.01 | | | | (0.22 | ) | | | 0.04 | | | | 0.06 | | | | 0.16 | |
| Net realized and unrealized gains (losses) on investments | | | 1.33 | | | | 1.88 | | | | (1.49 | ) | | | 0.72 | | | | (0.33 | ) | | | (5.66 | ) |
| | | | | | | | | | | | | | | | | | | | | | | | | |
| Total from investment operations | | | 1.36 | | | | 1.89 | | | | (1.71 | ) | | | 0.76 | | | | (0.27 | ) | | | (5.50 | ) |
| | | | | | | | | | | | | | | | | | | | | | | | | |
| Distributions & Other: | | | | | | | | | | | | | | | | | | | | | | | | |
| Net investment income | | | — | | | | — | | | | (0.25 | ) | | | (0.05 | ) | | | (0.14 | ) | | | (0.18 | ) |
| Net realized gains | | | — | | | | — | | | | — | | | | — | | | | — | | | | (2.15 | ) |
| Redemption fees [See Note 2(h)] | | | — | (1) | | | — | (1) | | | — | (1) | | | — | (1) | | | — | (1) | | | — | (1) |
| | | | | | | | | | | | | | | | | | | | | | | | | |
| Total distributions and other | | | — | | | | — | | | | (0.25 | ) | | | (0.05 | ) | | | (0.14 | ) | | | (2.33 | ) |
| | | | | | | | | | | | | | | | | | | | | | | | | |
| Net Asset Value, End of Period | | $ | 13.86 | | | $ | 12.50 | | | $ | 10.61 | | | $ | 12.57 | | | $ | 11.86 | | | $ | 12.27 | |
| | | | | | | | | | | | | | | | | | | | | | | | | |
| | | | | | | | | | | | | | | | | | | | | | | | | |
| Total Return | | | 10.88 | %(2) | | | 17.81 | % | | | (13.98 | )% | | | 6.48 | % | | | (1.68 | )% | | | (30.95 | )% |
| | | | | | | | | | | | | | | | | | | | | | | | | |
| | | | | | | | | | | | | | | | | | | | | | | | | |
| Supplemental Data and Ratios: | | | | | | | | | | | | | | | | | | | | | | | | |
| | | | | | | | | | | | | | | | | | | | | | | | | |
| Net assets, end of Period (000s) | | $ | 118,988 | | | $ | 134,221 | | | $ | 153,855 | | | $ | 359,016 | | | $ | 450,926 | | | $ | 597,603 | |
| | | | | | | | | | | | | | | | | | | | | | | | | |
| Ratio of expenses to average net assets, less waivers and before expenses paid indirectly, plus reimbursements of previously waived expenses | | | 1.60 | %(3) | | | 1.60 | % | | | 1.56 | % | | | 1.52 | % | | | 1.48 | % | | | 1.35 | % |
| | | | | | | | | | | | | | | | | | | | | | | | | |
| Ratio of net investment income (loss) to average net assets, net of waivers, reimbursements of previously waived expenses and expenses paid indirectly | | | 0.53 | %(3) | | | 0.29 | % | | | (0.22 | )% | | | 0.31 | % | | | 0.54 | % | | | 1.00 | % |
| | | | | | | | | | | | | | | | | | | | | | | | | |
| Ratio of expenses to average net assets, before waivers, reimbursements of previously waived expenses and expenses paid indirectly | | | 1.75 | %(3) | | | 1.65 | % | | | 1.56 | % | | | 1.52 | % | | | 1.48 | % | | | 1.35 | % |
| | | | | | | | | | | | | | | | | | | | | | | | | |
| Ratio of net investment income (loss) to average net assets, before waivers, reimbursements of previously waived expenses and expenses paid indirectly | | | 0.38 | %(3) | | | 0.24 | % | | | (0.22 | )% | | | 0.31 | % | | | 0.54 | % | | | 1.00 | % |
| | | | | | | | | | | | | | | | | | | | | | | | | |
| Portfolio turnover rate | | | 46 | %(2) | | | 66 | % | | | 103 | % | | | 134 | % | | | 108 | % | | | 115 | % |
| | See notes to financial statements. |
MARSICO FLEXIBLE CAPITAL FUND | | | MARSICO GLOBAL FUND | |
Six-Month Period Ended 3/31/13 (Unaudited) | | | Year Ended 9/30/12 | | | Year Ended 9/30/11 | | | Year Ended 9/30/10 | | | Year Ended 9/30/09 | | | Year Ended 9/30/08 | | | Six-Month Period Ended 3/31/13 (Unaudited) | | | Year Ended 9/30/12 | | | Year Ended 9/30/11 | | | Year Ended 9/30/10 | | | Year Ended 9/30/09 | | | Year Ended 9/30/08 | |
| | | | | | | | | | | | | | | | | | | | | | | | | | | | | | | | | | | |
| $ | 15.79 | | | $ | 12.05 | | | $ | 11.97 | | | $ | 9.65 | | | $ | 8.74 | | | $ | 11.32 | | | $ | 11.51 | | | $ | 9.06 | | | $ | 9.90 | | | $ | 8.59 | | | $ | 8.87 | | | $ | 11.46 | |
| | | | | | | | | | | | | | | | | | | | | | | | | | | | | | | | | | | | | | | | | | | | | | | |
| | | | | | | | | | | | | | | | | | | | | | | | | | | | | | | | | | | | | | | | | | | | | | | |
| | | | | | | | | | | | | | | | | | | | | | | | | | | | | | | | | | | | | | | | | | | | | | | |
| | 0.04 | | | | 0.03 | | | | 0.08 | | | | 0.27 | | | | 0.06 | | | | 0.14 | | | | — | (1) | | | (0.07 | ) | | | (0.05 | ) | | | (0.05 | ) | | | 0.04 | | | | 0.08 | |
| | 1.17 | | | | 3.77 | | | | 0.12 | | | | 2.42 | | | | 0.93 | | | | (1.93 | ) | | | 1.12 | | | | 2.52 | | | | (0.70 | ) | | | 1.42 | | | | (0.24 | ) | | | (2.46 | ) |
| | | | | | | | | | | | | | | | | | | | | | | | | | | | | | | | | | | | | | | | | | | | | | | |
| | 1.21 | | | | 3.80 | | | | 0.20 | | | | 2.69 | | | | 0.99 | | | | (1.79 | ) | | | 1.12 | | | | 2.45 | | | | (0.75 | ) | | | 1.37 | | | | (0.20 | ) | | | (2.38 | ) |
| | | | | | | | | | | | | | | | | | | | | | | | | | | | | | | | | | | | | | | | | | | | | | | |
| | | | | | | | | | | | | | | | | | | | | | | | | | | | | | | | | | | | | | | | | | | | | | | |
| | (0.09 | ) | | | (0.06 | ) | | | (0.09 | ) | | | (0.37 | ) | | | (0.08 | ) | | | (0.35 | ) | | | — | | | | — | | | | (0.09 | ) | | | (0.06 | ) | | | (0.08 | ) | | | (0.05 | ) |
| | (0.81 | ) | | | — | | | | (0.03 | ) | | | — | | | | — | | | | (0.44 | ) | | | — | | | | — | | | | — | | | | — | | | | — | | | | (0.17 | ) |
| | — | (1) | | | — | (1) | | | — | (1) | | | — | (1) | | | — | (1) | | | — | (1) | | | — | (1) | | | — | (1) | | | — | (1) | | | — | (1) | | | — | (1) | | | 0.01 | |
| | | | | | | | | | | | | | | | | | | | | | | | | | | | | | | | | | | | | | | | | | | | | | | |
| | (0.90 | ) | | | (0.06 | ) | | | (0.12 | ) | | | (0.37 | ) | | | (0.08 | ) | | | (0.79 | ) | | | — | | | | — | | | | (0.09 | ) | | | (0.06 | ) | | | (0.08 | ) | | | (0.21 | ) |
| | | | | | | | | | | | | | | | | | | | | | | | | | | | | | | | | | | | | | | | | | | | | | | |
| $ | 16.10 | | | $ | 15.79 | | | $ | 12.05 | | | $ | 11.97 | | | $ | 9.65 | | | $ | 8.74 | | | $ | 12.63 | | | $ | 11.51 | | | $ | 9.06 | | | $ | 9.90 | | | $ | 8.59 | | | $ | 8.87 | |
| | | | | | | | | | | | | | | | | | | | | | | | | | | | | | | | | | | | | | | | | | | | | | | |
| | | | | | | | | | | | | | | | | | | | | | | | | | | | | | | | | | | | | | | | | | | | | | | |
| | 8.16 | %(2) | | | 31.63 | % | | | 1.59 | % | | | 28.68 | % | | | 11.68 | % | | | (17.10 | )% | | | 9.73 | %(2) | | | 27.04 | % | | | (7.73 | )% | | | 16.01 | % | | | (1.93 | )% | | | (21.13 | )% |
| | | | | | | | | | | | | | | | | | | | | | | | | | | | | | | | | | | | | | | | | | | | | | | |
| | | | | | | | | | | | | | | | | | | | | | | | | | | | | | | | | | | | | | | | | | | | | | | |
| | | | | | | | | | | | | | | | | | | | | | | | | | | | | | | | | | | | | | | | | | | | | | | |
| | | | | | | | | | | | | | | | | | | | | | | | | | | | | | | | | | | | | | | | | | | | | | | |
| $ | 644,884 | | | $ | 590,293 | | | $ | 409,145 | | | $ | 132,345 | | | $ | 31,331 | | | $ | 14,461 | | | $ | 53,218 | | | $ | 54,195 | | | $ | 108,021 | | | $ | 116,101 | | | $ | 109,149 | | | $ | 82,543 | |
| | | | | | | | | | | | | | | | | | | | | | | | | | | | | | | | | | | | | | | | | | | | | | | |
| | 1.40 | %(3) | | | 1.43 | % | | | 1.27 | % | | | 0.75 | % | | | 0.75 | % | | | 0.75 | % | | | 1.60 | %(3) | | | 1.60 | % | | | 1.48 | % | | | 1.54 | % | | | 1.40 | % | | | 0.75 | % |
| | | | | | | | | | | | | | | | | | | | | | | | | | | | | | | | | | | | | | | | | | | | | | | |
| | 0.46 | %(3) | | | 0.17 | % | | | 0.55 | % | | | 1.33 | % | | | 1.44 | % | | | 1.15 | % | | | 0.09 | %(3) | | | (0.32 | )% | | | (0.46 | )% | | | (0.57 | )% | | | 0.52 | % | | | 0.88 | % |
| | | | | | | | | | | | | | | | | | | | | | | | | | | | | | | | | | | | | | | | | | | | | | | |
| | 1.40 | %(3) | | | 1.43 | % | | | 1.40 | % | | | 1.73 | % | | | 2.84 | % | | | 1.71 | % | | | 1.84 | %(3) | | | 1.70 | % | | | 1.48 | % | | | 1.54 | % | | | 1.58 | % | | | 1.49 | % |
| | | | | | | | | | | | | | | | | | | | | | | | | | | | | | | | | | | | | | | | | | | | | | | |
| | 0.46 | %(3) | | | 0.17 | % | | | 0.42 | % | | | 0.35 | % | | | (0.65 | )% | | | 0.19 | % | | | (0.15 | )%(3) | | | (0.42 | )% | | | (0.46 | )% | | | (0.57 | )% | | | 0.34 | % | | | 0.14 | % |
| | | | | | | | | | | | | | | | | | | | | | | | | | | | | | | | | | | | | | | | | | | | | | | |
| | 74 | %(2) | | | 121 | % | | | 231 | % | | | 146 | % | | | 259 | % | | | 207 | % | | | 81 | %(2) | | | 95 | % | | | 93 | % | | | 125 | % | | | 185 | % | | | 201 | % |
| |
| NOTES TO FINANCIAL STATEMENTS |
| |
NOTES TO FINANCIAL STATEMENTS March 31, 2013 (Unaudited)
The Marsico Investment Fund (the “Trust”) was organized on October 1, 1997, as a Delaware Statutory Trust and is registered under the Investment Company Act of 1940 (the “1940 Act”) as an open-end management investment company. The Focus Fund, Growth Fund, 21st Century Fund, International Opportunities Fund, Flexible Capital Fund, and Global Fund (collectively, the “Funds”) are separate investment portfolios of the Trust. The Focus Fund is a non-diversified fund and the Growth Fund, the 21st Century Fund, the International Opportunities Fund, the Flexible Capital Fund, and the Global Fund are diversified funds. The Focus Fund and Growth Fund commenced operations on December 31, 1997, the 21st Century Fund commenced operations on February 1, 2000, the International Opportunities Fund commenced operations on June 30, 2000, the Flexible Capital Fund commenced operations on December 29, 2006, and the Global Fund commenced operations on June 29, 2007. Trustees and officers of the Trust and employees of Marsico Capital Management, LLC (the “Adviser”) own approximately 8% and 24% of the Focus Fund’s and Global Fund’s outstanding shares, respectively, as of March 31, 2013.
| 2. | Significant Accounting Policies |
The following is a summary of significant accounting policies consistently followed by the Funds in the preparation of their financial statements. These policies are in conformity with Generally Accepted Accounting Principles (“GAAP”) for investment companies. The presentation of financial statements in conformity with GAAP requires management to make estimates and assumptions that affect the reported amounts of assets and liabilities at the date of the financial statements and the reported amounts of income and expenses during the reporting period. Actual results could differ from those estimates.
| | (a) | Investment Valuation — A security traded on a recognized stock exchange is generally valued at the last sale price prior to the closing of the principal exchange on which the security is traded. Securities traded on NASDAQ generally will be valued at the NASDAQ Official Closing Price. If no sale price is reported on the valuation date, the most current bid price will generally be used, with the exception of short option positions which will generally utilize the most current ask price. Other securities for which over-the-counter market quotations are readily available are generally valued at the last sale price. Debt securities that will mature in more than 60 days are generally valued at their bid prices furnished by a pricing service approved by the Funds’ Board of Trustees and subject to review and determination of the appropriate price by the Adviser. Debt securities that will mature in 60 days or less are valued at amortized cost, if it approximates market value. Any securities for which market quotations are not readily available are valued at their fair value as determined in good faith by the Adviser in accordance with procedures established by, and under the general supervision of, the Funds’ Board of Trustees. The Funds may use pricing services to assist in determining market value. The Board of Trustees has authorized the use of a pricing service to assist the Funds in valuing certain equity securities listed or traded on foreign security exchanges in the Funds’ portfolios in certain circumstances where there is a significant change in the value of related US-traded securities, as represented by, for example, the S&P 500 Index. |
“Fair Value Measurements and Disclosures” (the “Fair Value Statement”) defines fair value, establishes a framework for measuring fair value in GAAP, and expands disclosures about fair value measurements. Under the Fair Value Statement, various inputs are used in determining the value of the Funds’ investments.
These inputs are summarized into three broad levels and described below:
| | • | Level 1 – quoted prices in active markets for identical investments |
| | • | Level 2 – other significant observable inputs (including quoted prices for similar investments, interest rates, and evaluated quotations obtained from pricing services) |
| | • | Level 3 – significant unobservable inputs (including the Fund’s own assumptions in determining the fair value of investments). |
| |
| NOTES TO FINANCIAL STATEMENTS |
| |
The inputs or methodology used for valuing investments are not an indication of the risk associated with investing in those investments. Changes in valuation techniques may result in transfers between the levels during the reporting period. The Funds recognize transfers between the levels as of the end of each reporting period. There were no transfers between each of the three levels during the reporting period. The following is a summary of the fair values of the Funds’ investments in each category and economic sector as of March 31, 2013:
Fund Investments by Major Security Type | | | | | | | | | | | | |
| Marsico Focus Fund | | | | | | | | | | | | |
| Assets | | | | | | | | | | | | |
| Common Stocks | | | | | | | | | | | | |
| Consumer Discretionary | | $ | 226,970,146 | | | $ | — | | | $ | — | | | $ | 226,970,146 | |
| Consumer Staples | | | 52,820,808 | | | | — | | | | — | | | | 52,820,808 | |
| Energy | | | 53,376,933 | | | | — | | | | — | | | | 53,376,933 | |
| Financials | | | 130,288,460 | | | | — | | | | — | | | | 130,288,460 | |
| Health Care | | | 155,396,744 | | | | — | | | | — | | | | 155,396,744 | |
| Industrials | | | 61,447,386 | | | | — | | | | — | | | | 61,447,386 | |
| Information Technology | | | 155,489,237 | | | | — | | | | — | | | | 155,489,237 | |
| Materials | | | 31,948,955 | | | | — | | | | — | | | | 31,948,955 | |
| Short-term Investments | | | 11,546,751 | | | | — | | | | — | | | | 11,546,751 | |
| | | | | | | | | | | | | | | $ | 879,285,420 | |
| Marsico Growth Fund | | | | | | | | | | | | | | | | |
| Assets | | | | | | | | | | | | | | | | |
| Common Stocks | | | | | | | | | | | | | | | | |
| Consumer Discretionary | | $ | 198,501,953 | | | $ | — | | | $ | — | | | $ | 198,501,953 | |
| Consumer Staples | | | 20,890,735 | | | | — | | | | — | | | | 20,890,735 | |
| Energy | | | 28,893,301 | | | | — | | | | — | | | | 28,893,301 | |
| Financials | | | 66,527,688 | | | | — | | | | — | | | | 66,527,688 | |
| Health Care | | | 107,821,619 | | | | — | | | | — | | | | 107,821,619 | |
| Industrials | | | 88,290,344 | | | | — | | | | — | | | | 88,290,344 | |
| Information Technology | | | 100,951,956 | | | | — | | | | — | | | | 100,951,956 | |
| Materials | | | 23,355,487 | | | | — | | | | — | | | | 23,355,487 | |
| Short-term Investments | | | 19,192,790 | | | | — | | | | — | | | | 19,192,790 | |
| | | | | | | | | | | | | | | $ | 654,425,873 | |
Marsico 21st Century Fund | | | | | | | | | | | | | | | | |
| Assets | | | | | | | | | | �� | | | | | | |
| Common Stocks | | | | | | | | | | | | | | | | |
| Consumer Discretionary | | $ | 78,340,046 | | | $ | — | | | $ | — | | | $ | 78,340,046 | |
| Consumer Staples | | | 20,335,452 | | | | — | | | | — | | | | 20,335,452 | |
| Energy | | | 9,413,679 | | | | — | | | | — | | | | 9,413,679 | |
| Financials | | | 27,751,136 | | | | — | | | | — | | | | 27,751,136 | |
| Health Care | | | 37,547,002 | | | | — | | | | — | | | | 37,547,002 | |
| Industrials | | | 63,864,235 | | | | — | | | | — | | | | 63,864,235 | |
| Information Technology | | | 47,444,828 | | | | — | | | | — | | | | 47,444,828 | |
| Materials | | | 16,066,745 | | | | — | | | | — | | | | 16,066,745 | |
| Short-term Investments | | | 4,125,273 | | | | — | | | | — | | | | 4,125,273 | |
| | | | | | | | | | | | | | | $ | 304,888,396 | |
| Marsico International Opportunities Fund | | | | | | | | | | | | | | | | |
| Assets | | | | | | | | | | | | | | | | |
| Common Stocks | | | | | | | | | | | | | | | | |
| Consumer Discretionary | | $ | 30,723,283 | | | $ | — | | | $ | — | | | $ | 30,723,283 | |
| Consumer Staples | | | 13,654,241 | | | | — | | | | — | | | | 13,654,241 | |
| Energy | | | 4,424,183 | | | | — | | | | — | | | | 4,424,183 | |
| Financials | | | 18,045,811 | | | | — | | | | — | | | | 18,045,811 | |
| Health Care | | | 12,566,523 | | | | — | | | | — | | | | 12,566,523 | |
| Industrials | | | 12,745,224 | | | | — | | | | — | | | | 12,745,224 | |
| Information Technology | | | 15,461,493 | | | | — | | | | — | | | | 15,461,493 | |
| Materials | | | 3,110,704 | | | | — | | | | — | | | | 3,110,704 | |
| Telecommunication Services | | | 2,521,093 | | | | — | | | | — | | | | 2,521,093 | |
| Utilities | | | 705,747 | | | | — | | | | — | | | | 705,747 | |
| Short-term Investments | | | 5,425,300 | | | | — | | | | — | | | | 5,425,300 | |
| | | | | | | | | | | | | | | $ | 119,383,602 | |
| |
| NOTES TO FINANCIAL STATEMENTS |
| |
NOTES TO FINANCIAL STATEMENTS March 31, 2013 (Unaudited) (continued)
Fund Investments by Major Security Type | | | | | | | | | | | | |
| Marsico Flexible Capital Fund | | | | | | | | | | | | |
| Assets | | | | | | | | | | | | |
| Common Stocks | | | | | | | | | | | | |
| Consumer Discretionary | | $ | 173,806,348 | | | $ | — | | | $ | — | | | $ | 173,806,348 | |
| Consumer Staples | | | 61,961,496 | | | | — | | | | — | | | | 61,961,496 | |
| Energy | | | 41,455,754 | | | | — | | | | — | | | | 41,455,754 | |
| Financials | | | 78,825,987 | | | | — | | | | — | | | | 78,825,987 | |
| Health Care | | | 53,222,516 | | | | — | | | | — | | | | 53,222,516 | |
| Industrials | | | 79,068,070 | | | | — | | | | — | | | | 79,068,070 | |
| Information Technology | | | 82,035,020 | | | | — | | | | — | | | | 82,035,020 | |
| Materials | | | 6,420,770 | | | | — | | | | — | | | | 6,420,770 | |
| Corporate Bonds | | | — | | | | 36,265,819 | | | | — | | | | 36,265,819 | |
| International Bonds | | | — | | | | 8,405,948 | | | | — | | | | 8,405,948 | |
| Preferred Stocks | | | 6,252,034 | | | | — | | | | — | | | | 6,252,034 | |
| Warrants | | | 1,424,505 | | | | — | | | | — | | | | 1,424,505 | |
| Short-term Investments | | | 8,773,272 | | | | — | | | | — | | | | 8,773,272 | |
| | | | | | | | | | | | | | | $ | 637,917,539 | |
| Marsico Global Fund | | | | | | | | | | | | | | | | |
| Assets | | | | | | | | | | | | | | | | |
| Common Stocks | | | | | | | | | | | | | | | | |
| Consumer Discretionary | | $ | 16,916,655 | | | $ | — | | | $ | — | | | $ | 16,916,655 | |
| Consumer Staples | | | 6,415,079 | | | | — | | | | — | | | | 6,415,079 | |
| Energy | | | 1,124,024 | | | | — | | | | — | | | | 1,124,024 | |
| Financials | | | 4,274,782 | | | | — | | | | — | | | | 4,274,782 | |
| Health Care | | | 8,094,993 | | | | — | | | | — | | | | 8,094,993 | |
| Industrials | | | 8,812,203 | | | | — | | | | — | | | | 8,812,203 | |
| Information Technology | | | 5,034,776 | | | | — | | | | — | | | | 5,034,776 | |
| Telecommunication Services | | | 1,061,428 | | | | — | | | | — | | | | 1,061,428 | |
| Short-term Investments | | | 1,586,109 | | | | — | | | | — | | | | 1,586,109 | |
| | | | | | | | | | | | | | | $ | 53,320,049 | |
| | (b) | Expenses — The Funds are charged for those expenses that are directly attributable to each Fund, such as advisory and custodial fees. Expenses that are not directly attributable to a Fund are typically allocated among the Funds in proportion to their respective net assets and in some cases allocated based on other factors. The Funds’ expenses may be reduced by voluntary advisory fee waivers, brokerage credits and uninvested cash balances earning interest or credits. Such credits are included in “Less waiver of expenses and expenses paid indirectly” on the Statements of Operations. |
Brokerage commissions may be paid to certain brokers which reduce transfer agent fees and expenses. For the six-month period ended March 31, 2013 the Funds received no such brokerage commission credits. The Funds received earnings credits on certain cash account balances which reduced transfer agent fees and expenses in the amount of $608, $441, $219, $86, $420, and $36 for the Focus Fund, Growth Fund, 21st Century Fund, International Opportunities Fund, Flexible Capital Fund, and Global Fund, respectively, for the six-month period ended March 31, 2013. Brokerage commission credits and earnings credits are included in “Less waiver of expenses and expenses paid indirectly” on the Statements of Operations.
| | (c) | Federal Income Taxes — Each Fund intends to comply with the requirements of the Internal Revenue Code necessary to qualify as a regulated investment company and to make the requisite distributions of income to its shareholders which will be sufficient to relieve it from all or substantially all federal and state income taxes. Certain Funds may utilize earnings and profits on redemption of shares as part of the dividends paid deduction. |
| | (d) | Distributions to Shareholders — Dividends from net investment income and net realized capital gains, if any, will be declared and paid at least annually. Distributions to shareholders are recorded on the ex-dividend date. Each Fund may periodically make reclassifications among certain of its capital accounts as a result of the timing and characterization of certain income and capital gains distributions determined in accordance with federal tax regulations, which may differ from GAAP. These reclassifications are due to differing treatment for items such as foreign currency transactions, passive foreign investment companies (“PFICs”) and net investment losses. |
| |
| NOTES TO FINANCIAL STATEMENTS |
| |
| | (e) | Foreign Currency Translation — The accounting records of the Funds are maintained in US dollars. Values of securities denominated in foreign currencies are translated into US dollars at 4:00 p.m. Eastern Time. Amounts related to the purchase and sale of foreign securities and investment income are translated at the rates of exchange prevailing on the respective dates of such transactions. |
Reported realized gains on foreign currency transactions arise from sales of portfolio securities, forward foreign currency contracts, currency gains or losses realized between the trade and settlement dates on securities transactions, the difference between the amounts of dividends, interest, and foreign withholding taxes recorded on the Funds’ books, and the US dollar equivalent of the amounts actually received or paid.
The Funds do not isolate that portion of the results of operations resulting from changes in foreign exchange rates on investments from the fluctuations arising from changes in market prices of securities held at the end of the reporting period. Net unrealized appreciation or depreciation on investments and foreign currency translations arise from changes in the value of assets and liabilities, including investments in securities at the end of the reporting period, resulting from changes in the exchange rates and changes in market prices of securities held. Transactions in foreign-denominated assets may involve greater risks than domestic transactions, including currency risk, political and economic risk, regulatory risk and market risk.
| | (f) | Derivative Instruments — “Disclosure about Derivative Instruments and Hedging Activities” (the “Derivatives Statement”) requires enhanced disclosures about the Funds’ derivative and hedging activities, including how such activities are accounted for and their effects on the Funds’ financial position, performance and cash flows. |
The Funds may enter into futures contracts and options on securities, financial indexes, and foreign currencies, options on futures, forward foreign currency contracts, interest rate swaps, credit default swaps, and swap-related products. The Funds intend to use such derivative instruments primarily to hedge or protect from adverse movements in securities prices, currency rates or interest rates. The use of futures contracts, options, and forward foreign currency contracts may involve risks such as the possibility of illiquid markets or imperfect correlation between the value of the contracts and the underlying securities, or that the counterparty will fail to perform its obligations. The Funds did not use any derivative instruments during the six-month period ended March 31, 2013. There were no outstanding derivative instruments held by the Funds as of March 31, 2013. The following tables provide information about the effects of the derivative instruments on the Statements of Operations for the International Opportunities Fund and Flexible Capital Fund, as appropriate, for the year ended September 30, 2012.
The effects of derivative instruments on the Statements of Operations for the period October 1, 2011 through September 30, 2012 (amounts in thousands):
| | | | Amount of Realized Gain (Loss) on Derivatives | |
| Derivatives Not Accounted for as Hedging Instruments | | | | | | | | Forward Foreign Currency Contracts | | | | |
| International Opportunities Fund | Forward Foreign Currency Contracts | | | N/A | | | | N/A | | | $ | (573 | ) | | $ | (573 | ) |
| | Total | | | N/A | | | | N/A | | | $ | (573 | ) | | $ | (573 | ) |
| | | | | | | | | | | | | | | | | | |
| Flexible Capital Fund | Index contracts | | $ | (1,809 | ) | | | N/A | | | | N/A | | | $ | (1,809 | ) |
| | Total | | $ | (1,809 | ) | | | N/A | | | | N/A | | | $ | (1,809 | ) |
| | Derivatives Not Accounted | | Change in Unrealized Appreciation (Depreciation) on Derivatives | |
| for as Hedging Instruments | | Forward Foreign Currency Contracts | |
| International Opportunities Fund | Forward Foreign Currency Contracts | | $ | 573 | |
| | Total | | $ | 573 | |
Forward Foreign Currency Contracts — A forward currency contract is a commitment to purchase or sell foreign currency at a specified price on a future date. The Funds may enter into a forward foreign currency contract in order to hedge against foreign currency fluctuations, such as when a Fund elects to reduce exposure to changes in foreign currency exchange rates on foreign portfolio holdings denominated in or exposed to foreign currencies, or in preparation of purchasing securities in a particular market as well as other investment purposes.
| |
| NOTES TO FINANCIAL STATEMENTS |
| |
NOTES TO FINANCIAL STATEMENTS March 31, 2013 (Unaudited) (continued)
The market value of a forward foreign currency contract fluctuates with changes in currency exchange rates. Outstanding forward foreign currency contracts are valued daily at current market rates and the resulting change in market value is recorded as unrealized appreciation or depreciation. When a forward foreign currency contract is settled, the Fund records a realized gain or loss equal to the difference between the value at the time the forward foreign currency contract was opened and the value at the time it was settled.
The Funds are subject to foreign currency exchange risk in the normal course of pursuing their investment objectives. Forward foreign currency contracts may involve market risk in excess of the unrealized gain or loss reflected on the Statements of Assets and Liabilities. In addition, the Funds could be exposed to a credit risk if the counterparties are unable or unwilling to meet the terms of the contracts or if the value of the foreign currency changes unfavorably. In connection with these contracts, the Funds typically segregate cash and/or other securities as collateral in a sufficient value equal to the aggregate amount of the Funds’ commitments under the forward foreign currency contracts; such collateral would be in the possession of the Funds’ custodian, if applicable.
Options Contracts — The Funds may purchase and write (sell) put and call options on foreign and domestic stock indices, foreign currencies, and US and foreign securities that are traded on a securities exchange or an over-the-counter market. These transactions are for hedging purposes or for the purpose of earning additional income. In addition, the Funds may enter into such transactions for cross-hedging purposes. There is minimal counterparty credit risk involved in entering into option contracts since they are exchange-traded instruments and the exchange’s clearinghouse, as counterparty to all exchange-traded options, guarantees the options against default.
The risk associated with purchasing an option is that the Fund pays a premium whether or not the option is exercised. Additionally, the Fund bears the risk of loss of premium and change in market value should the counterparty not perform under the contract. Put and call options purchased are accounted for in the same manner as portfolio securities. The cost of securities acquired through the exercise of call options is increased by premiums paid. The proceeds from securities sold through the exercise of put options are decreased by the premiums paid.
When a Fund writes an option, the premium received by the Fund is recorded as a liability and is subsequently adjusted to the current market value of the option written. Premiums received from writing options that expire are recorded by the Fund on the expiration date as realized gains from option transactions. The difference between the premium and the amount paid on effecting a closing purchase transaction, including brokerage commissions, is also treated as a realized gain, or if the premium is less than the amount paid for the closing purchase transaction, as a realized loss. If a call option is exercised, the premium is added to the proceeds from the sale of the underlying security or currency in determining whether the Fund has realized a gain or loss. If a put option is exercised, the premium reduces the cost basis of the security or currency purchased by the Fund. In writing an option, the Fund bears the market risk of an unfavorable change in the price of the security or currency underlying the written option. Exercise of an option written by the Fund could result in the Fund selling or buying a security or currency at a price different from the current market value.
| | (g) | Trustees’ Deferred Fee Plan — Effective February 1, 2000, the Board of Trustees adopted the Marsico Investment Fund Deferred Fee Plan (the “Deferred Fee Plan”), amended and restated as of December 30, 2005, which allows the Trustees to defer the receipt of all or a portion of their compensation received from the Funds. Any deferred fees are credited to accounts established on behalf of the Trustees into the Funds as directed by each Trustee. The amounts credited to these accounts increase or decrease in accordance with the performance of the Funds selected by the Trustees. The market value of the deferred account balances as of March 31, 2013 is shown on the Statements of Assets and Liabilities as part of an asset account, “Prepaid expenses and other assets”, and a liability account, “Accrued trustees’ fees”. Additionally, the fluctuation of the account balances due to the Funds’ performance is recorded by the Funds as unrealized appreciation (depreciation) which is shown as part of “Net unrealized appreciation on investments and foreign currency translations” on the Statements of Assets and Liabilities and as compensation expense which is shown as part of the expense account “Trustees’ fees and expenses” on the Statements of Operations. Fees earned and deferred by the Trustees for the six-month period ended March 31, 2013 are also included in “Trustees’ fees and expenses” on the Statements of Operations. Amounts contributed to the Deferred Fee Plan will be deferred until distributed in accordance with the Deferred Fee Plan. Unrealized appreciation (depreciation) of Fund shares held in the Deferred Fee Plan is subject to the Funds’ expense reimbursement agreement with the Adviser. |
| |
| NOTES TO FINANCIAL STATEMENTS |
| |
| | (h) | Redemption Fee — A 2.00% redemption fee is retained by the Funds to offset transaction costs and other expenses associated with short-term investing. The fee is imposed on certain redemptions or exchanges of shares held 30 days or less from their purchase date. Redemption fees are recorded by the Funds as a reduction of shares redeemed and as a credit to paid-in-capital. For the six-month period ended March 31, 2013, the Focus Fund, Growth Fund, 21st Century Fund, International Opportunities Fund, Flexible Capital Fund, and Global Fund received $3,255, $1,208, $882, $394, $22,730, and $33, respectively, in redemption fees. |
| | (i) | Other — Investment transactions are accounted for on a trade date basis. Each Fund determines the gain or loss realized from the investment transactions by comparing the original cost of the security lot sold with the net sale proceeds. Dividend income is recognized on the ex-dividend date. Certain dividends from foreign securities will be recorded as soon as the Trust is informed of the dividend if such information is obtained subsequent to the ex-dividend date. Interest income is recognized on an accrual basis. |
| | (j) | Indemnifications — In the normal course of business, the Funds enter into contracts that contain provisions indemnifying other parties against specified potential liabilities. Each Fund’s maximum exposure under these arrangements is unknown as this would involve future claims that may be made against the Fund that have not yet occurred. However, based on experience, the Funds expect the risk of loss to be remote. |
| 3. | Investment Advisory Agreement and Transactions With Affiliates |
Each Fund has an agreement with the Adviser to furnish investment advisory services to the Funds. Under the terms of these agreements, the Adviser is compensated for managing the Focus Fund and the Growth Fund at the rate of 0.85% per year of average daily net assets up to $3 billion in each Fund, and 0.75% per year of average daily net assets exceeding $3 billion in each Fund; and at a rate of 0.85% of the average daily net assets of the 21st Century Fund, the International Opportunities Fund, the Flexible Capital Fund, and the Global Fund. The Adviser has voluntarily agreed to limit the total expenses of each Fund (excluding interest, taxes, acquired fund fees and expenses, litigation, brokerage, and extraordinary expenses) to an annual rate of 1.60% of the average net assets of the Focus Fund, the International Opportunities Fund, the Flexible Capital Fund, and the Global Fund, and 1.50% of the average net assets of the Growth Fund and the 21st Century Fund until January 31, 2014.
The Adviser is entitled to reimbursement from a Fund of any amounts waived pursuant to this arrangement if such reimbursements do not cause a Fund to exceed current expense limitations and the reimbursement is made within three years after the year in which the Adviser incurred the expense. As of March 31, 2013, reimbursements that may potentially be made by the International Opportunities Fund and Global Fund to the Adviser are $163,713 and $131,460, respectively, which expire between 2015 and 2016.
Certain officers of the Trust are also officers of the Adviser. The Funds pay a portion of the Chief Compliance Officer’s total compensation costs which is shown as part of the expense account “Professional fees” on the Statements of Operations. No other officers of the Trust received compensation from the Funds.
| 4. | Service and Distribution Plan |
The Funds have adopted a Service and Distribution Plan (the “Plan”) pursuant to Rule 12b-1 under the 1940 Act. The Plan authorizes payments by the Funds in connection with the distribution of their shares at an annual rate, as determined from time to time by the Board of Trustees, of up to 0.25% of a Fund’s average daily net assets. The Adviser may, out of its own resources and at its sole discretion, make certain payments on behalf of the Plan for expenses incurred by a Fund for distribution of Fund shares and related services.
| |
| NOTES TO FINANCIAL STATEMENTS |
| |
NOTES TO FINANCIAL STATEMENTS March 31, 2013 (Unaudited) (continued)
| 5. | Investment Transactions |
The aggregate purchases and sales of securities, excluding short-term investments, for the Funds for the six-month period ended March 31, 2013, were as follows:
| | | | | | | | | | | International Opportunities Fund | | | | | | | |
| Purchases | | $ | 368,342 | | | $ | 368,172 | | | $ | 168,399 | | | $ | 55,175 | | | $ | 455,377 | | | $ | 40,855 | |
| Sales | | $ | 523,488 | | | $ | 447,071 | | | $ | 236,824 | | | $ | 82,885 | | | $ | 404,648 | | | $ | 46,038 | |
There were no purchases or sales of US government securities, excluding short-term investments.
| 6. | Federal Income Tax Information |
Accounting for Uncertainty in Income Taxes (the “Income Tax Statement”) requires an evaluation of tax positions taken (or expected to be taken) in the course of preparing a Fund’s tax returns to determine whether these positions meet a “more-likely-than-not” standard that, based on the technical merits, have a more than fifty percent likelihood of being sustained by a taxing authority upon examination. A tax position that meets the “more-likely-than-not” recognition threshold is measured to determine the amount of benefit to recognize in the financial statements. The Funds recognize interest and penalties, if any, related to unrecognized tax benefits as income tax expense in the Statements of Operations.
The Income Tax Statement requires management of the Funds to analyze all open tax years, fiscal years 2009-2013 as defined by IRS statute of limitations for all major jurisdictions, including federal tax authorities and certain state tax authorities. As of and during the six-month period ended March 31, 2013, the Funds did not have a liability for any unrecognized tax benefits. The Funds have no examinations in progress and are not aware of any tax positions for which it is reasonably possible that the total amounts of unrecognized tax benefits will significantly change in the next twelve months.
At March 31, 2013 gross unrealized appreciation and depreciation of investments, based on cost for federal income tax purposes were as follows:
| | | | | | | | | | | International Opportunities Fund | | | | | | | |
| Cost of Investments | | $ | 668,887 | | | $ | 501,796 | | | $ | 235,946 | | | $ | 95,987 | | | $ | 555,361 | | | $ | 43,835 | |
| | | | | | | | | | | | | | | | | | | | | | | | | |
| Gross Unrealized Appreciation | | $ | 210,423 | | | $ | 152,946 | | | $ | 69,373 | | | $ | 24,247 | | | $ | 83,150 | | | $ | 9,529 | |
| Gross Unrealized Depreciation | | | (25 | ) | | | (316 | ) | | | (431 | ) | | | (850 | ) | | | (593 | ) | | | (44 | ) |
| | | | | | | | | | | | | | | | | | | | | | | | | |
| Net Unrealized Appreciation (Depreciation) on Investments | | $ | 210,398 | | | $ | 152,630 | | | $ | 68,942 | | | $ | 23,397 | | | $ | 82,557 | | | $ | 9,485 | |
The difference between cost amounts for financial statement and federal income tax purposes is due primarily to wash sale loss deferrals and PFICs.
At September 30, 2012, the Funds had accumulated capital loss carryforwards (in thousands) as follows:
| | | | | | | | | | | International Opportunities Fund | | | | | | | |
| For Losses Expiring September 30, | | | | | | | | | | | | | | | | | | |
| 2017 | | $ | — | | | $ | — | | | $ | 193,704 | | | $ | 39,483 | | | $ | — | | | $ | — | |
| 2018 | | | — | | | | — | | | | 390,537 | | | | 93,558 | | | | — | | | | 4,665 | |
| Not Subject to Expiration | | | — | | | | — | | | | — | | | | — | | | | — | | | | — | |
| | | $ | — | | | $ | — | | | $ | 584,241 | | | $ | 133,041 | | | $ | — | | | $ | 4,665 | |
| |
| NOTES TO FINANCIAL STATEMENTS |
| |
To the extent that a Fund may realize future net capital gains, those gains will be offset by any of its unused capital loss carryforward. Future capital loss carryover utilization in any given year may be subject to Internal Revenue Code limitations.
Under the Regulated Investment Company Modernization Act of 2010, the Funds are permitted to carryforward capital losses incurred in taxable years beginning after December 22, 2010 for an unlimited period. However, any losses incurred during those future taxable years will be required to be utilized prior to the losses incurred in pre-enactment taxable years. As a result of this ordering rule, pre-enactment capital loss carryforwards may be more likely to expire unused. Additionally, post-enactment capital losses that are carried forward will retain their character as either short-term or long-term capital losses rather than being considered all short-term as under previous law.
As of September 30, 2012, the Focus Fund, Growth Fund, 21st Century Fund, International Opportunities Fund, Flexible Capital Fund, and Global Fund, respectively, had $0, $0, $1,288, $0, $0, and $236 of qualified late-year losses, which are deferred until fiscal year 2013 for tax purposes. Net late-year losses incurred after December 31st, and within the taxable year are deemed to arise on the first day of the Fund’s next taxable year.
The 21st Century Fund and International Opportunities Fund, respectively, had realized capital losses (in thousands) from transactions between November 1, 2011 and September 30, 2012 of $907 and $3,469. The 21st Century Fund and International Opportunities Fund have elected to treat post-October capital losses as arising in the next fiscal year.
The Focus Fund, Growth Fund, 21st Century Fund, International Opportunities Fund, Flexible Capital Fund, and Global Fund utilized (in thousands) $20,227, $54,807, $13,577, $5,625, $0, and $11,875, respectively, of its capital loss carryforwards, during the year ended September 30, 2012.
As of September 30, 2012, the components of accumulated earnings (deficit) on a tax basis were as follows:
| | | | | | | | | | | International Opportunities Fund | | | | | | | |
| Undistributed Ordinary Income (Deficit) | | $ | 1,173 | | | $ | 1,218 | | | $ | — | | | $ | 1 | | | $ | 1,653 | | | $ | 3 | |
| Undistributed Trustees’ Deferred Compensation | | | (1,404 | ) | | | (834 | ) | | | (542 | ) | | | (216 | ) | | | (351 | ) | | | (147 | ) |
| Undistributed Long-Term Capital Gains | | | 69,463 | | | | 11,099 | | | | — | | | | — | | | | 13,674 | | | | — | |
| Tax Accumulated Earnings (Deficit) | | | 69,232 | | | | 11,483 | | | | (542 | ) | | | (215 | ) | | | 14,976 | | | | (144 | ) |
| Accumulated Capital and Other Losses | | | — | | | | — | | | | (586,436 | ) | | | (136,510 | ) | | | — | | | | (4,901 | ) |
| Unrealized Appreciation (Depreciation) on Investments and on Foreign Currency Translations | | | 244,520 | | | | 180,759 | | | | 85,414 | | | | 21,070 | | | | 86,898 | | | | 14,198 | |
| Trustees Deferred Compensation Mark to Market | | | 162 | | | | 111 | | | | 67 | | | | 3 | | | | 267 | | | | 103 | |
| Total Accumulated Earnings (Deficit) | | $ | 313,914 | | | $ | 192,353 | | | $ | (501,497 | ) | | $ | (115,652 | ) | | $ | 102,141 | | | $ | 9,256 | |
Undistributed ordinary income (deficit) consists of net investment income and timing differences related to qualified late-year losses and PFICs.
The tax character of distributions paid during the fiscal years ended September 30, 2012 and 2011 were as follows:
| (Amounts in thousands) | | | | | | |
| | | | | | | | | | | | |
| Focus Fund | | $ | — | | | $ | — | | | $ | — | | | $ | — | |
| Growth Fund | | | 292 | | | | — | | | | 473 | | | | — | |
21st Century Fund | | | — | | | | — | | | | — | | | | — | |
| International Opportunities Fund | | | — | | | | — | | | | 6,560 | | | | — | |
| Flexible Capital Fund | | | 1,878 | | | | — | | | | 2,489 | | | | 477 | |
| Global Fund | | | — | | | | — | | | | 1,099 | | | | — | |
The tax character of dividends paid may differ from that shown in the Statements of Changes in Net Assets due to short-term gains being treated as ordinary income for tax purposes.
| |
| NOTES TO FINANCIAL STATEMENTS |
| |
NOTES TO FINANCIAL STATEMENTS March 31, 2013 (Unaudited) (continued)
Management of the Adviser has determined that there were no material events that would require disclosure in the Funds’ financial statements.
| 8. | New Accounting Pronouncements |
In January 2013, the Financial Accounting Standards Board (“FASB”) issued Accounting Standards Update (“ASU”) No. 2013-01 “Clarifying the Scope of Disclosures about Offsetting Assets and Liabilities”. This update gives additional clarification to the FASB’s ASU No. 2011-11 “Disclosures about Offsetting Assets and Liabilities”. The amendments in this ASU require an entity to disclose information about offsetting and related arrangements to enable users of its financial statements to understand the effect of those arrangements on its financial position. The ASU is effective for annual reporting periods beginning on or after January 1, 2013, and interim periods within those annual periods. The guidance requires retrospective application for all comparative periods presented. The Adviser is currently evaluating the impact the adoption of ASU 2013-01 may have on the Funds’ financial statement disclosures.
EXPENSE EXAMPLE For the six-month period ended March 31, 2013 (Unaudited)
As a shareholder of the Marsico Funds (the “Funds”), you incur two types of costs: (1) transaction costs, including redemption fees on certain redemptions; and (2) ongoing costs, including management fees, distribution (12b-1) fees, and other Fund expenses. This Example is intended to help you understand your ongoing costs (in dollars) of investing in the Funds and to compare these costs with the ongoing costs of investing in other mutual funds.
The Example is based on an investment of $1,000 invested at the beginning of the period and held for the entire period from October 1, 2012 to March 31, 2013 (the “period”).
The first line of the table below provides information about actual account values and actual expenses. You may use the information in this line, together with the amount you invested, to estimate the expenses you paid over the period. Simply divide your account value by $1,000 (for example, an $8,600 account value divided by $1,000 equals 8.6), then multiply the result by the number in the first line under the heading entitled “Expenses paid for the six-month period ended March 31, 2013” to estimate the expenses you paid on your account during the period.
| Hypothetical Example for Comparison Purposes |
The second line of the table below provides information about hypothetical account values and hypothetical expenses based on the Funds’ actual expense ratios and an assumed rate of return of 5% per year before expenses, which is not the actual return of any of the Funds. The hypothetical account values and expenses may not be used to estimate the actual ending account balance or expenses you paid for the period. You may use this information to compare the ongoing costs of investing in the Funds and other funds. To do so, compare this 5% hypothetical example with the 5% hypothetical examples that appear in the shareholder reports of other funds.
Please note that the expenses shown in the table are meant to highlight your ongoing costs only and do not reflect any transactional costs, such as redemption fees. Therefore, the second line of the table is useful in comparing the ongoing costs only, and will not help you determine the relative total costs of owning different funds. In addition, if these transactional costs were included, your costs could have been higher.
| Expenses Paid During the Period | | Beginning account value October 1, 2012 | | | Ending account value March 31, 2013 | | | Expenses paid
for the six-month
period ended March 31, 2013(1) | |
| FOCUS FUND | | | | | | | | | |
| Actual Example | | $ | 1,000.00 | | | $ | 1,096.50 | | | $ | 7.15 | |
| Hypothetical Example, assuming a 5% return before expenses | | $ | 1,000.00 | | | $ | 1,018.18 | | | $ | 6.89 | |
| | | | | | | | | | | | | |
| GROWTH FUND | | | | | | | | | | | | |
| Actual Example | | $ | 1,000.00 | | | $ | 1,085.10 | | | $ | 7.11 | |
| Hypothetical Example, assuming a 5% return before expenses | | $ | 1,000.00 | | | $ | 1,018.18 | | | $ | 6.89 | |
| | | | | | | | | | | | | |
21st CENTURY FUND | | | | | | | | | | | | |
| Actual Example | | $ | 1,000.00 | | | $ | 1,085.70 | | | $ | 7.58 | |
| Hypothetical Example, assuming a 5% return before expenses | | $ | 1,000.00 | | | $ | 1,017.73 | | | $ | 7.34 | |
| | | | | | | | | | | | | |
| INTERNATIONAL OPPORTUNITIES FUND | | | | | | | | | | | | |
| Actual Example | | $ | 1,000.00 | | | $ | 1,108.80 | | | $ | 8.41 | |
| Hypothetical Example, assuming a 5% return before expenses | | $ | 1,000.00 | | | $ | 1,017.02 | | | $ | 8.05 | |
| | | | | | | | | | | | | |
| FLEXIBLE CAPITAL FUND | | | | | | | | | | | | |
| Actual Example | | $ | 1,000.00 | | | $ | 1,081.60 | | | $ | 7.27 | |
| Hypothetical Example, assuming a 5% return before expenses | | $ | 1,000.00 | | | $ | 1,018.01 | | | $ | 7.05 | |
| | | | | | | | | | | | | |
| GLOBAL FUND | | | | | | | | | | | | |
| Actual Example | | $ | 1,000.00 | | | $ | 1,097.30 | | | $ | 8.36 | |
| Hypothetical Example, assuming a 5% return before expenses | | $ | 1,000.00 | | | $ | 1,017.02 | | | $ | 8.04 | |
| (1) | Expenses are equal to the Funds’ annualized expense ratios (1.369% for the Focus Fund, 1.368% for the Growth Fund, 1.458% for the 21st Century Fund, 1.600% for the International Opportunities Fund, 1.402% for the Flexible Capital Fund, and 1.600% for the Global Fund), multiplied by the average account value over the period, multiplied by 182/365 (to reflect the six-month period). |
| |
| CONSIDERATION OF INVESTMENT ADVISORY AGREEMENTS |
| |
CONSIDERATION OF INVESTMENT ADVISORY AGREEMENTS (Unaudited) |
At a meeting of the Board of Trustees of the Trust held on November 14, 2012, the Trustees, by a unanimous vote (including a separate vote of those Trustees who are not “interested persons” (as the term is defined in the 1940 Act) of the Trust (the “Independent Trustees”), approved the renewal of the Investment Advisory and Management Agreements for the Focus Fund, Growth Fund, 21st Century Fund, International Opportunities Fund, Flexible Capital Fund and Global Fund (the “Agreements”). In advance of the meeting, the Independent Trustees requested and received extensive materials from the Adviser to assist them in considering the renewal of the Agreements. The materials provided by the Adviser contained information with respect to the factors noted below, including detailed information relating to the performance, advisory fees and other expenses of the Funds, other funds sub-advised by the Adviser and non-fund advisory accounts of the Adviser. The materials also included comparisons of the Funds with third party funds of similar size and investment objectives in terms of performance, fees and other expenses, as well as the performance of each Fund versus its benchmark. In addition, the Adviser provided information regarding its overall expenses and profitability, as well as other information requested by the Trustees.
In addition to the materials prepared specifically for contract review analysis, on an ongoing basis the Trustees receive information and reports from the Adviser and other service providers to the Funds regarding the investment performance of the Funds as well as operational, compliance, marketing and other matters.
The Trustees engaged in a detailed discussion of the materials with management of the Adviser. The Independent Trustees then met separately with independent counsel to the Independent Trustees for a full review of the materials. Following this session, the full Board reconvened and approved the continuation of the Agreements for the Focus Fund, Growth Fund, 21st Century Fund, International Opportunities Fund, Flexible Capital Fund and Global Fund.
| Discussion of Certain Factors Considered |
In connection with the consideration of the Agreements, the Trustees, including the Independent Trustees, requested and received from the Adviser, and reviewed, a wide variety of information, including information about (1) the nature, extent, and quality of the services provided by the Adviser; (2) the investment performance of the Funds and the Adviser; (3) the costs of the services to be provided and profits realized by the Adviser and its affiliates from their relationship with the Funds; (4) the extent to which economies of scale may be realized as the Funds grow; and (5) whether fee levels reflect these economies of scale for the benefit of Fund investors; as well as other relevant considerations such as the management fees and expense ratios of each Fund; potential fall-out benefits to the Adviser from its relationship to each Fund; and other general information about the Adviser. The following is a summary of the Board’s discussion and views regarding these factors.
| 1. | Nature, Extent, and Quality of Services. |
The Trustees considered the nature, quality and extent of the services performed by the Adviser under the Agreements, including portfolio management, supervision of Fund operations and compliance and regulatory filings and disclosures to shareholders, general oversight of other service providers, coordination of Fund marketing initiatives, review of Fund legal issues, and other services. The Trustees also considered the personnel who provide these services, which includes a team of individuals collectively having years of experience in their particular areas of expertise. The Trustees considered the Adviser’s investment philosophy and experience, noting that the Adviser and its affiliates have committed significant resources over time in supporting the Funds. The Trustees discussed the Adviser’s ability to continue to provide the same level and quality of services to the Funds. The Trustees concluded that the services are extensive in nature, that the Adviser employs investment advisory personnel who consistently delivered a high level of service and that, with respect to third party service providers, the Adviser effectively manages the outsourcing of certain services to other service providers and the oversight of those service providers.
| 2. | Investment Performance of the Funds and Adviser. |
The Trustees considered short-term and long-term investment performance for each Fund over various periods of time as compared to both relevant equity indices and the performance of such Fund’s Lipper, Inc. peer group universe. The Trustees discussed with representatives of the Adviser the factors underlying the outperformance or under-performance of the Funds over various time periods. It was noted that the peer group information may not be fully comparable as it is based on data from the peer funds’ most recent available fiscal year, which in some cases ended earlier than data periods considered for the Funds. The information provided in respect of the Funds, in contrast, reflected current market conditions. The Trustees also noted certain management styles that could also make peer group performance information not comparable to the Funds. In addition to reviewing performance information of comparable funds, the Trustees noted that they regularly review each Fund’s performance.
| |
| CONSIDERATION OF INVESTMENT ADVISORY AGREEMENTS |
| |
The Trustees considered the Adviser’s substantial investment advisory experience and capabilities. The Trustees also discussed with representatives of the Adviser recent changes in the portfolio management staff of the Adviser. The Trustees noted MCM’s continued investment in research. The Trustees reviewed the performance of the Funds in the context of the long-term investment strategies being pursued by the Funds. The Trustees also noted that the investment performance delivered by the Adviser to the Funds appeared to be consistent with the performance delivered for other clients of the Adviser. Based on this review, the Trustees concluded that the performance of the Adviser with respect to each Fund was satisfactory for the purposes of approving the Agreements.
| 3. | Costs of Services and Profits Realized by the Adviser. |
(a) Costs of Services to Funds: Fees and Expenses. The Trustees considered each Fund’s management fee rates and expense ratios relative to industry averages for such Fund’s benchmark category and the advisory fees charged by the Adviser to other sub-advised funds and non-fund clients, including information regarding expense limitation commitments from the Adviser, and the breakpoints for certain Funds’ advisory services. The Trustees noted that the mix of services under the Agreements are much more extensive than those under the Adviser’s advisory agreements for sub-advised funds as well as non-fund clients. While the Trustees noted that the investment advisory fees paid by the Funds are generally in the upper quartile of their peer groups, they were cognizant that it is difficult to know whether the services provided by advisers to peer funds are as extensive as those provided by the Adviser to the Funds. The Trustees noted the actions taken by MCM to reduce Fund expenses, including that MCM had waived fees and absorbed expenses from time to time, and that some of those expenditures may not be recouped. The Trustees concluded that the investment advisory fees are acceptable based upon the qualifications, experience, reputation, and performance of the Adviser and the moderate overall expense ratios of the Funds. The Trustees noted, however, that they would continue at their regular meetings to monitor the overall expense ratios of the Funds.
(b) Profitability and Costs of Services to Adviser. The Trustees considered the Adviser’s overall profitability and costs and a pro forma estimate of the Adviser’s profitability and costs if the Funds constituted the Adviser’s only assets under management. The Trustees took into consideration that MCM’s fee revenue from the Funds had declined as most Funds’ assets had declined, but that MCM had not reduced services or investment personnel as a result. The Trustees also considered that MCM had recently completed a second debt restructuring that could in some circumstances potentially increase its profitability over the short and intermediate term (while further strengthening MCM’s overall financial position and profitability over the short and long term). The Trustees also noted that the Adviser has substantially increased its resources devoted to Fund matters in response to regulatory requirements enacted during the last few years and Fund policies and procedures that were adopted or enhanced in late 2004 and thereafter. The Trustees concluded that the fees received by the Adviser under the Agreements were set at an acceptable level, particularly in light of the extent and quality of the services being provided to the Funds.
| 4. | Extent of Economies of Scale as Funds Grow. |
The Trustees considered whether there have been economies of scale with respect to the management of each Fund and whether that Fund has appropriately benefited from any economies of scale. The Trustees noted that economies of scale may develop for certain Funds as their assets increase and their Fund-level expenses decline as a percentage of assets, but that Fund-level economies of scale may not necessarily result in Adviser-level economies of scale. It was reported to the Trustees that the expenses incurred by the Adviser relating to management of the Funds increased substantially in recent years as a percentage of management fees and that the asset levels of certain Funds had decreased over the past year. The Trustees agreed that it was possible that if trends changed and Fund assets began growing again beyond certain thresholds, Adviser-level expenses incurred in managing the Funds eventually could level off or decline as a percentage of management fees in the future, potentially resulting in economies of scale. The Trustees noted that they expect to consider economies of scale on at least an annual basis and thus be in a position to evaluate additional economies of scale, if any, occurring as Fund asset levels change over time.
| 5. | Whether Fee Levels Reflect Economies of Scale. |
The Trustees considered whether the management fee rate is reasonable in relation to the asset size of each Fund and any economies of scale that may exist. The Trustees noted that, at the request of the Trustees, breakpoints were previously introduced for the two larger Funds, the Focus Fund and the Growth Fund, for assets in excess of $3 billion in each Fund. Under the breakpoints, investment management fees are 0.85% per year of average daily net assets up to $3 billion in each of those two Funds, and 0.75% per year of average daily net assets exceeding $3 billion in each Fund. The Trustees also took note that the Adviser also intended to renew the voluntary fund expense limitations for each of the Funds until at least January 31, 2014, all subject to possible future recoupment of previously waived fees or other expenses under certain conditions. The Trustees agreed to continue to monitor whether any additional breakpoints for any of the Funds may be appropriate in the future.
| |
| CONSIDERATION OF INVESTMENT ADVISORY AGREEMENTS |
| |
CONSIDERATION OF INVESTMENT ADVISORY AGREEMENTS (Unaudited) (continued) |
| 6. | Other Relevant Considerations. |
(a) Adviser Personnel and Methods. The Trustees considered information about the financial condition of the Adviser, including information about MCM’s most recent debt restructuring and its potential effects on MCM’s profitability, and the Adviser’s stated commitment to maintaining a high quality investment management operation, including in the areas of investment analysis, research, trading, compliance, and operations. They also considered the size, education and experience of the Adviser’s staff. There was also a discussion of the Adviser’s “top down” economic analysis with “bottom up” stock selection. The Trustees noted that several personnel changes occurred on the investment team during the past year, which they agreed to continue to monitor at their regular meetings.
(b) Other Benefits to the Adviser. The Trustees also considered the character and amount of other incidental benefits received by the Adviser and its affiliates from its association with the Funds. The Trustees concluded that potential “fall-out” benefits that the Adviser may receive, such as greater name recognition or increased ability to obtain research or brokerage services, appear to be reasonable, and may in some cases benefit the Funds.
In considering the Agreements, the Trustees, including the Independent Trustees, did not identify any factor as all-important or all-controlling and instead considered these factors collectively in light of each Fund’s surrounding circumstances. Based on this review, it was the judgment of the Trustees that each Fund’s fees were reasonable, the extent and quality of services were acceptable and the Adviser’s steps to address performance issues for certain Funds was satisfactory. Therefore, re-approval of the Agreements was in the best interests of each Fund and its shareholders. As a part of their decision-making process, the Trustees noted that the Adviser has managed the Funds since their inception, and the Trustees believe that a long-term relationship with a capable, conscientious adviser is in the best interests of the Funds and their shareholders. The Trustees considered, generally, that shareholders invested in an existing Fund knowing that the Adviser managed that Fund and knowing its investment management fee. Additionally, as part of its deliberations, the Board also considered and relied upon the information about the Funds and MCM that had been provided to them throughout the year in connection with their regular Board meetings at which they engage in the ongoing oversight of the Funds and their operations.
Upon conclusion of their review and discussion, the Trustees, including all of the Independent Trustees, unanimously agreed the Agreements for each of the Funds should be continued.
OTHER INFORMATION (Unaudited) |
The Funds exercise the voting rights associated with the securities held by the Funds under the proxy voting policy of the Funds. A description of those policies and procedures of the Funds and a record of the Funds’ proxy votes for the one-year period ended June 30, 2012 are available without charge, upon request, by calling 888-860-8686. It is also available on the Securities and Exchange Commission’s (SEC) website at www.sec.gov.
| Quarterly Filing of Portfolio Holdings |
The Funds will file their complete schedule of investments with the SEC for the first and third quarters of each fiscal year on Form N-Q. The Funds’ Form N-Q will be available (i) on the SEC’s website at www.sec.gov; (ii) at the SEC’s Public Reference Room; and (iii) by calling 800-SEC-0330.
As of January 1, 2012, federal law requires that mutual fund companies must maintain and report a shareholder’s cost basis by tax lot, gain/loss information, and holding period of “covered” security sales to the Internal Revenue Service (“IRS”) on Form 1099. Covered securities, that are mutual fund shares, are shares acquired on or after January 1, 2012. A fund is not responsible for maintaining and reporting share information if such shares are not deemed “covered”.
The new tax regulations require that the Funds elect a default tax identification methodology in order to perform the required reporting. As a result, the Funds have chosen the first-in-first-out (“FIFO”) method as the default tax lot identification method for its shareholders. This is the method the Funds will use to determine which specific shares are deemed to be sold when a shareholder’s entire position is not sold in a single transaction and is the method in which “covered” share sales will be reported on a shareholder’s Form 1099.
However, at the time of purchase or upon the sale of “covered” shares, shareholders may choose a different tax lot identification method. Shareholders should consult a tax advisor with regard to their personal circumstances as the Funds and their service providers do not provide tax advice.
NOTES
The Marsico Investment Fund UMB Distribution Services, LLC, Distributor P.O. Box 3210, Milwaukee, WI 53201-3210 www.marsicofunds.com • 888.860.8686
©2013 MARSICO CAPITAL MANAGEMENT, LLC
Not authorized for distribution unless preceded or accompanied by an effective Marsico Funds prospectus. |
| | Not applicable to semi-annual reports. |
| Item 3. | Audit Committee Financial Expert |
| | Not applicable to semi-annual reports. |
| Item 4. | Principal Accountant Fees and Services |
| | Not applicable to semi-annual reports. |
| Item 5. | Audit Committee of Listed Registrants |
| Item 6. | Schedule of Investments |
The schedule of investments in securities of unaffiliated issuers is included as part of the report to shareholders filed under Item 1.
| Item 7. | Disclosure of Proxy Voting Policies and Procedures for Closed-End Management Investment Companies |
| Item 8. | Portfolio Managers of Closed-End Management Investment Companies |
| Item 9. | Purchases of Equity Securities by Closed-End Management Investment Company and Affiliated Purchasers |
| Item 10. | Submission of Matters to a Vote of Security Holders |
| Item 11. | Controls and Procedures. |
| (a) | The registrant's principal executive officer and principal financial officer have concluded that the registrant's disclosure controls and procedures (as defined in Rule 30a-3(c) under the Investment Company Act of 1940, as amended) are effective based on their evaluation of these disclosure controls and procedures within 90 days of the filing date of this report on Form N-CSR. |
| (b) | There were no changes in the registrant's internal control over financial reporting (as defined in Rule 30a-3(d) under the Investment Company Act of 1940, as amended) that occurred during the second fiscal quarter of the period covered by this report that has materially affected, or is reasonably likely to materially affect, the registrant's internal control over financial reporting. |
| | Not applicable to semi-annual reports. |
| (a)(2) | Certification for each principal executive and principal financial officer of the registrant as required by Rule 30a-2(a) under the Act (17 CFR 270.30a-2(a)). Filed as an attachment to this filing. |
| (a)(3) | Any written solicitation to purchase securities under Rule 23c-1 under the Investment Company Act of 1940, as amended, that was sent or given during the period covered by the report by or on behalf of the registrant to 10 or more persons. |
| (b) | Certifications required by Rule 30a-2(b) under the Act (17 CFR 270.30a-2(b)), Rule 13a-14(b) or Rule 15d-14(b) under the Exchange Act (17 CFR 240.13a-14(b) or 240.15d-14(b)), and Section 1350 of Chapter 63 of Title 18 of the United States Code (18 U.S.C. 1350). Filed as an attachment to this filing. |
SIGNATURES
Pursuant to the requirements of the Securities Exchange Act of 1934 and the Investment Company Act of 1940, the registrant has duly caused this report to be signed on its behalf by the undersigned, thereunto duly authorized.
The Marsico Investment Fund
| By: | /s/ Christopher J. Marsico |
| | Christopher J. Marsico, |
| | Executive Vice President and Chief Operating Officer |
| | |
| Date: | June 4, 2013 |
Pursuant to the requirements of the Securities Exchange Act of 1934 and the Investment Company Act of 1940, this report has been signed below by the following persons on behalf of the registrant and in the capacities and on the dates indicated.
| By: | /s/ Christopher J. Marsico |
| | Christopher J. Marsico, |
| | Executive Vice President and Chief Operating Officer |
| | |
| Date: | June 4, 2013 |
| | |
| By: | /s/ Neil L. Gloude |
| | Neil L. Gloude, |
| | Vice President, Secretary and Treasurer |
| | |
| Date: | June 4, 2013 |