INVESTMENT REVIEW BY MUNISH MALHOTRA AND JORDON LAYCOB (UNAUDITED)
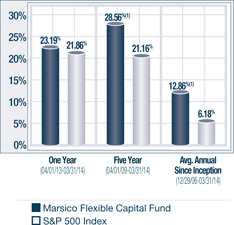
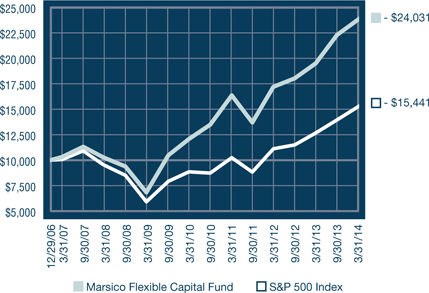
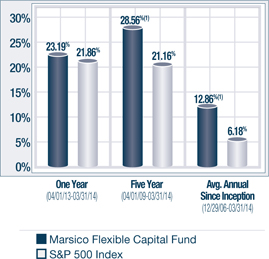
The Marsico Flexible Capital Fund posted a total return of +8.92% for the six-month fiscal period ended March 31, 2014. While the Fund produced a significant absolute return, it underperformed the S&P 500 Index, which we consider to be the Fund’s benchmark index and which had a total return of +12.51%. Please see the Fund Overview for more detailed information about the Fund’s performance for various time periods ended March 31, 2014.
The performance data for the Fund quoted here represent past performance, and past performance is not a guarantee of future results. Investment return and principal value of an investment will fluctuate so that an investor’s shares, when redeemed, may be worth more or less than their original cost. Current performance may be lower or higher than the performance information quoted. To obtain performance information current to the most recent month-end, please call 888-860-8686 or visit www.marsicofunds.com.(1)
This review highlights Fund performance over a six-month fiscal period. Shareholders should keep in mind that the Fund is intended for long-term investors who hold their shares for substantially longer periods of time. You should also keep in mind that our views on all investments discussed in this report are subject to change at any time. References to specific securities, industries, and sectors discussed in this report are not recommendations to buy or sell such securities or related investments, and the Fund may not necessarily hold these securities or investments today. Please see the accompanying Schedule of Investments for the percentage of the Fund’s portfolio represented by the securities mentioned in this report as of the end of the reporting period.
The Fund is subject to broad risks associated with investing in equity securities markets generally, including the risks that the securities and markets in which it invests may experience volatility and instability, that domestic and global economies and markets may undergo periods of cyclical change and decline, that investors may at times avoid investments in equity securities, and that investments may not perform as anticipated. Please see the Prospectus for more information.
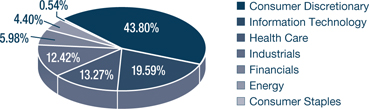
Throughout the period, the Fund’s exposure to the Consumer Discretionary sector was more than twice that of its benchmark, the S&P 500 Index. This positioning detracted from relative performance, as Consumer Discretionary was a weak-performing sector of the benchmark index. Lululemon athletica, inc. (-36%), an athletic apparel company, faced several challenges during the period, including quality control and a change in its CEO. Media conglomerate SFX Entertainment, Inc. slid -40%. Retailing companies generally struggled during the period as extremely harsh winter weather led to fewer shoppers visiting stores. Japanese eyewear retailer Jin Company Ltd. declined -39%. Lululemon athletica, SFX Entertainment and Jin were each sold from the Fund prior to period-end.
Stock selection in the Industrials sector was weak. The Fund’s Industrials positions posted a combined return of +1.0% during the period and significantly lagged the +14% return of the benchmark index’s Industrials sector. Aerospace holding Lockheed Martin Corporation (-1% prior to being sold) and professional services company IHS, Inc. – Cl. A (-0.2% prior to being sold) were the Fund’s primary detractors within the sector.
The Fund’s Financials and Materials holdings also failed to keep pace with the returns of the pertinent benchmark index sectors. Diversified financials company UBS A.G. slid -17% prior to being sold and was a material detractor from Fund performance. Within the Materials sector, The Sherwin-Williams Company gained +8%, but underperformed the +14% return of the S&P 500 Index Materials sector and, therefore, detracted from performance relative to the Fund’s benchmark index.
Other holdings that detracted from Fund performance included biotechnology company Celgene Corporation (-8%), French alcoholic beverage company Remy Cointreau S.A. (-28% prior to being sold), and semiconductor equipment company ASML Holding N.V. (-5%).
Holdings within the Consumer Staples sector contributed some top performers for the period. Beverage companies Constellation Brands, Inc. - Cl. A (+48%) and Keurig Green Mountain, Inc. (+40%) contributed positively to Fund performance.
An underweight allocation to the weaker-performing Energy sector also aided results in comparison to benchmark performance.
Certain individual Fund holdings had a material, positive effect on performance, including casino operator Wynn Resorts Ltd. (+45%), biotechnology company Biogen Idec Inc. (+27%), Internet services company Google, Inc. – Cl. A (+27%), and retailer AutoZone, Inc. (+27%).
During the period, the Fund reduced its allocations to the Financials, Industrials, and Consumer Staples sectors. The Fund’s allocations to Consumer Discretionary, Health Care, and Information Technology sectors increased. The Fund also held several investments in fixed-income securities that did not substantially affect performance during the period and that we believe offer equity-like return potential.
The Flexible Capital Fund experienced slightly elevated portfolio turnover during the period, which may occur at times such as when the Fund changes its portfolio composition to harvest gains, take advantage of new opportunities, preserve capital, or limit losses. Portfolio turnover increases transaction-related expenses and could reduce Fund returns.
Fiscal Period-End Investment Posture
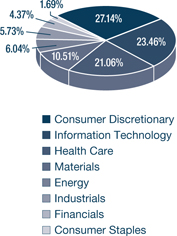
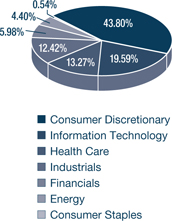
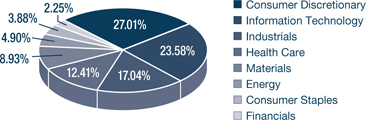
As of period-end, the Fund’s primary economic sector allocations included Consumer Discretionary, Information Technology, Health Care, and Materials. At period-end, the Fund had no exposure to the Energy and Utilities sectors.
Sincerely,
MUNISH MALHOTRA, CFA
JORDON S. LAYCOB
PORTFOLIO MANAGERS
INVESTMENT REVIEW BY TOM MARSICO AND JIM GENDELMAN (UNAUDITED)
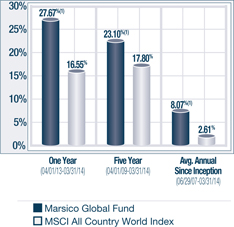
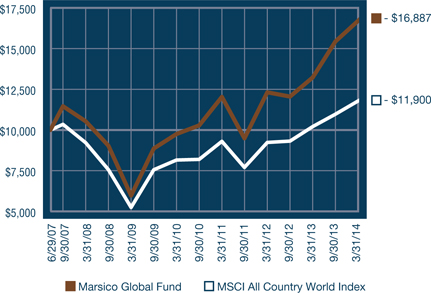
The Marsico Global Fund posted a total return of (US$) +9.39% for the six-month fiscal period ended March 31, 2014. The Fund outperformed the MSCI All Country World Index (“MSCI ACWI Index”), which we consider to be the Fund’s benchmark index and which had a total return of (US$) +8.48%. The MSCI ACWI Index measures equity market performance in the global developed and emerging markets. Please see the Fund Overview for more detailed information about the Fund’s performance for various time periods ended March 31, 2014.
The performance data for the Fund quoted here represent past performance, and past performance is not a guarantee of future results. Investment return and principal value of an investment will fluctuate so that an investor’s shares, when redeemed, may be worth more or less than their original cost. Current performance may be lower or higher than the performance information quoted. To obtain performance information current to the most recent month-end, please call 888-860-8686 or visit www.marsicofunds.com.(1)
This review highlights Fund performance over a six-month fiscal period. Shareholders should keep in mind that the Fund is intended for long-term investors who hold their shares for substantially longer periods of time. You should also keep in mind that our views on all investments discussed in this report are subject to change at any time. References to specific securities, industries, and sectors discussed in this report are not recommendations to buy or sell such securities or related investments, and the Fund may not necessarily hold these securities or investments today. Please see the accompanying Schedule of Investments for the percentage of the Fund’s portfolio represented by the securities mentioned in this report as of the end of the reporting period.
Foreign investments present additional risks due to currency fluctuations, economic and political factors, lower liquidity, differences in securities regulations and accounting standards, possible changes in taxation, limited public information, and other factors. In addition, the Fund is subject to broad risks associated with investing in equity securities markets generally, including the risks that the securities and markets in which it invests may experience volatility and instability, that domestic and global economies and markets may undergo periods of cyclical change and decline, that investors may at times avoid investments in equity securities, and that investments may not perform as anticipated. Please see the Prospectus for more information.
The Global Fund’s outperformance versus the MSCI ACWI Index was partially attributable to stock selection in the Consumer Discretionary sector. Restaurant operators Potbelly Corporation (+122% prior to being sold) and Alsea S.A.B. de C.V. (+23%) were material, positive performance contributors. Retailer Burlington Stores, Inc. (+66% prior to being sold) and media company Comcast Corporation – Cl. A (+21% prior to being sold) were other leading holdings within the sector. The Fund purchased Potbelly and Burlington Stores during the companies’ respective initial public offerings. A portion of this positive stock selection effect was offset by weak performance from luxury goods companies Hermes International (-7%) and Brunello Cucinelli SpA (-13% prior to being sold). Athletic apparel company lululemon athletica, inc. (-16% prior to being sold) and auto parts retailer LKQ Corporation (-22% prior to being sold) were additional detractors from performance.
Stock selection in the Industrials sector aided performance, as aerospace holding Lockheed Martin Corporation (+22%) and water and thermal equipment manufacturer Pentair Ltd. (+18%) posted double-digit gains prior to being sold from the Fund.
Stock selection and an underweight allocation to the Energy sector further benefitted performance relative to the Fund’s benchmark. Continental Resources, Inc., a leading driller and producer in the Bakken shale region, posted a stock price gain of +16%. Energy was a weaker-performing sector of the benchmark index and the Fund benefitted from having few investments in the sector.
Other strong-performing individual holdings for the Fund included biotechnology company Biogen Idec Inc. (+27%), Internet services company Google, Inc. – Cl. A (+27%), and online security provider FireEye, Inc. (+59% prior to being sold).
From a sector allocation perspective, the Fund was aided by having an overweight allocation to the strongest-performing sector of the benchmark index, Health Care, while maintaining an underweight allocation to the weak-performing Consumer Staples sector.
Although active currency management is not a central facet of the Fund’s investment process, fluctuations in major world currencies can at times affect the Fund’s performance. During the period, the net effect of currency moves was positive for the Fund, in part because a smaller proportion of its securities compared to the benchmark were denominated in currencies that weakened substantially against the US dollar and other major world currencies. During the period, the Fund’s performance was helped by having no exposure to companies whose securities are denominated in the Japanese yen, which weakened relative to the US dollar.
Stock selection in the Information Technology sector was a primary detractor from Fund performance. Latin American ecommerce holding MercadoLibre, Inc. (-21% prior to being sold), cloud software provider salesforce.com, inc. (-8%), and semiconductor equipment company ASML Holding N.V. (-5%) posted negative returns during the period.
Consumer Discretionary was a weak-performing area of the benchmark index and the Fund’s performance was hampered by having an overweight allocation to the sector.
Several of the Fund’s Financials holdings struggled. Hong Kong-headquartered insurance company AIA Group Ltd. (-3% prior to being sold) and diversified financials company Citigroup, Inc. (+0.6% prior to being sold) failed to keep pace with the overall benchmark index return.
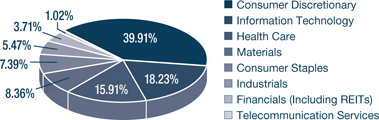
During the period, the Fund increased its allocations to the Information Technology and Energy sectors. The Fund reduced its allocations to the Financials, Health Care, Consumer Staples, and Telecommunication Services sectors.
The Global Fund experienced elevated portfolio turnover during the period, which may occur at times such as when the Fund changes its portfolio composition to harvest gains, take advantage of new opportunities, preserve capital, or limit losses. Portfolio turnover increases transaction-related expenses and could reduce Fund returns.
Fiscal Period-End Investment Posture
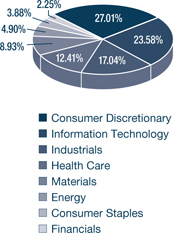
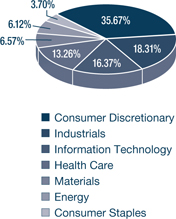
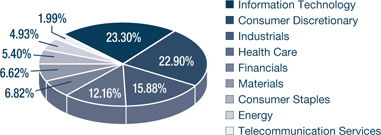
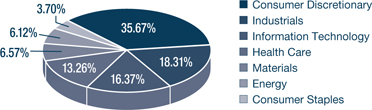
As of March 31, 2014, the Fund’s primary economic sector allocations were Consumer Discretionary, Industrials, Information Technology, and Health Care. The Fund had no investments in the Financials, Telecommunication Services, or Utilities sectors. The Fund’s most significant country allocations were the US, France, Canada, and the Netherlands.
Sincerely,
THOMAS F. MARSICO
JAMES G. GENDELMAN
PORTFOLIO MANAGERS
| (1) | Total returns are based on net change in net asset value assuming reinvestment of distributions. For the period prior to January 1, 2009, from April 2009 through May 2009, and from January 2012 through March 2014, the performance returns for the Global Fund reflect a fee waiver in effect; in the absence of such a waiver, the returns would have been reduced. For the one-month period of June 2009, performance returns for the Global Fund would have been higher but for the reimbursement of fees waived previously. Please see the Prospectus for more information. |
NOTES TO FINANCIAL STATEMENTS March 31, 2014 (Unaudited)
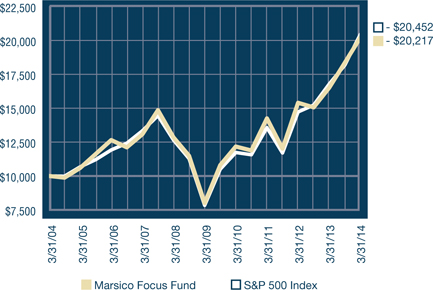
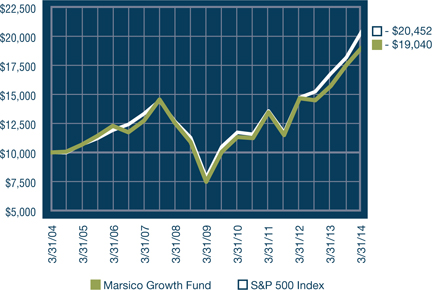
The Marsico Investment Fund (the “Trust”) was organized on October 1, 1997, as a Delaware Statutory Trust and is registered under the Investment Company Act of 1940 (the “1940 Act”) as an open-end management investment company. The Focus Fund, Growth Fund, 21st Century Fund, International Opportunities Fund, Flexible Capital Fund, and Global Fund (collectively, the “Funds”) are separate investment portfolios of the Trust. The Focus Fund is a non-diversified fund and the Growth Fund, the 21st Century Fund, the International Opportunities Fund, the Flexible Capital Fund, and the Global Fund are diversified funds. The Focus Fund and Growth Fund commenced operations on December 31, 1997, the 21st Century Fund commenced operations on February 1, 2000, the International Opportunities Fund commenced operations on June 30, 2000, the Flexible Capital Fund commenced operations on December 29, 2006, and the Global Fund commenced operations on June 29, 2007. Trustees and officers of the Trust and employees of Marsico Capital Management, LLC (the “Adviser”) own approximately 8% and 17% of the Focus Fund’s and Global Fund’s outstanding shares, respectively, as of March 31, 2014.
| 2. | Significant Accounting Policies |
The following is a summary of significant accounting policies consistently followed by the Funds in the preparation of their financial statements. These policies are in conformity with Generally Accepted Accounting Principles (“GAAP”) for investment companies. The presentation of financial statements in conformity with GAAP requires management to make estimates and assumptions that affect the reported amounts of assets and liabilities at the date of the financial statements and the reported amounts of income and expenses during the reporting period. Actual results could differ from those estimates.
| | (a) | Investment Valuation — A security traded on a recognized stock exchange is generally valued at the last sale price prior to the closing of the principal exchange on which the security is traded. Securities traded on NASDAQ generally will be valued at the NASDAQ Official Closing Price. If no sale price is reported on the valuation date, the most current bid price will generally be used, with the exception of short option positions which will generally utilize the most current ask price. Other securities for which over-the-counter market quotations are readily available are generally valued at the last sale price. Debt securities that will mature in more than 60 days are generally valued at their bid prices furnished by a pricing service approved by the Funds’ Board of Trustees and subject to review pursuant to procedures established by, and under the general supervision of, the Funds’ Board of Trustees. Debt securities that will mature in 60 days or less are valued at amortized cost, if it approximates market value. Any securities for which market quotations are not readily available are valued at their fair value as determined in good faith by the Adviser in accordance with procedures established by, and under the general supervision of, the Funds’ Board of Trustees. The Funds may use pricing services to assist in determining market value. The Board of Trustees has authorized the use of a pricing service to assist the Funds in valuing certain equity securities listed or traded on foreign security exchanges in the Funds’ portfolios in certain circumstances where there is a significant change in the value of related US-traded securities, as represented by, for example, the S&P 500 Index. |
“Fair Value Measurements and Disclosures” (the “Fair Value Statement”) defines fair value, establishes a framework for measuring fair value in GAAP, and expands disclosures about fair value measurements. Under the Fair Value Statement, various inputs are used in determining the value of the Funds’ investments.
These inputs are summarized into three broad levels and described below:
| | • | Level 1 – quoted prices in active markets for identical investments |
| | • | Level 2 – other significant observable inputs (including quoted prices for similar investments, interest rates, and evaluated quotations obtained from pricing services) |
| | • | Level 3 – significant unobservable inputs (including the Fund’s own assumptions in determining the fair value of investments). |
NOTES TO FINANCIAL STATEMENTS |
The inputs or methodology used for valuing investments are not an indication of the risk associated with investing in those investments. Changes in valuation techniques may result in transfers between the levels during the reporting period. The Funds recognize transfers between the levels as of the end of each reporting period. There were no transfers between each of the three levels during the reporting period. The following is a summary of the fair values of the Funds’ investments in each category and economic sector as of March 31, 2014:
Fund Investments by Major Security Type | | | | | | | | | | | | |
| Marsico Focus Fund | | | | | | | | | | | | |
| Assets | | | | | | | | | | | | |
| Common Stocks | | | | | | | | | | | | |
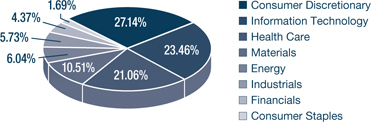
| Consumer Discretionary | | $ | 226,209,604 | | | $ | — | | | $ | — | | | $ | 226,209,604 | |
| Consumer Staples | | | 14,115,799 | | | | — | | | | — | | | | 14,115,799 | |
| Energy | | | 50,292,966 | | | | — | | | | — | | | | 50,292,966 | |
| Financials | | | 36,423,131 | | | | — | | | | — | | | | 36,423,131 | |
| Health Care | | | 175,485,705 | | | | — | | | | — | | | | 175,485,705 | |
| Industrials | | | 47,708,657 | | | | — | | | | — | | | | 47,708,657 | |
| Information Technology | | | 195,533,321 | | | | — | | | | — | | | | 195,533,321 | |
| Materials | | | 87,574,379 | | | | — | | | | — | | | | 87,574,379 | |
| Short-term Investments | | | 35,533,154 | | | | — | | | | — | | | | 35,533,154 | |
| | | | | | | | | | | | | | | $ | 868,876,716 | |
| Marsico Growth Fund | | | | | | | | | | | | | | | | |
| Assets | | | | | | | | | | | | | | | | |
| Common Stocks | | | | | | | | | | | | | | | | |
| Consumer Discretionary | | $ | 157,821,924 | | | $ | — | | | $ | — | | | $ | 157,821,924 | |
| Consumer Staples | | | 22,693,932 | | | | — | | | | — | | | | 22,693,932 | |
| Energy | | | 28,623,201 | | | | — | | | | — | | | | 28,623,201 | |
| Financials | | | 13,161,067 | | | | — | | | | — | | | | 13,161,067 | |
| Health Care | | | 72,518,426 | | | | — | | | | — | | | | 72,518,426 | |
| Industrials | | | 99,598,384 | | | | — | | | | — | | | | 99,598,384 | |
| Information Technology | | | 137,819,697 | | | | — | | | | — | | | | 137,819,697 | |
| Materials | | | 52,185,480 | | | | — | | | | — | | | | 52,185,480 | |
| Short-term Investments | | | 5,816,127 | | | | — | | | | — | | | | 5,816,127 | |
| | | | | | | | | | | | | | | $ | 590,238,238 | |
Marsico 21st Century Fund | | | | | | | | | | | | | | | | |
| Assets | | | | | | | | | | | | | | | | |
| Common Stocks | | | | | | | | | | | | | | | | |
| Consumer Discretionary | | $ | 72,946,633 | | | $ | — | | | $ | — | | | $ | 72,946,633 | |
| Consumer Staples | | | 17,212,711 | | | | — | | | | — | | | | 17,212,711 | |
| Energy | | | 15,695,753 | | | | — | | | | — | | | | 15,695,753 | |
| Financials | | | 21,744,848 | | | | — | | | | — | | | | 21,744,848 | |
| Health Care | | | 38,732,211 | | | | — | | | | — | | | | 38,732,211 | |
| Industrials | | | 50,587,218 | | | | — | | | | — | | | | 50,587,218 | |
| Information Technology | | | 74,246,634 | | | | — | | | | — | | | | 74,246,634 | |
| Materials | | | 21,084,841 | | | | — | | | | — | | | | 21,084,841 | |
| Telecommunication Services | | | 6,344,369 | | | | — | | | | — | | | | 6,344,369 | |
| Short-term Investments | | | 8,826,854 | | | | — | | | | — | | | | 8,826,854 | |
| | | | | | | | | | | | | | | $ | 327,422,072 | |
| Marsico International Opportunities Fund | | | | | | | | | | | | | | | | |
| Assets | | | | | | | | | | | | | | | | |
| Common Stocks | | | | | | | | | | | | | | | | |
| Consumer Discretionary | | $ | 76,171,785 | | | $ | — | | | $ | — | | | $ | 76,171,785 | |
| Consumer Staples | | | 935,730 | | | | — | | | | — | | | | 935,730 | |
| Energy | | | 7,650,379 | | | | — | | | | — | | | | 7,650,379 | |
| Financials | | | 10,398,226 | | | | — | | | | — | | | | 10,398,226 | |
| Health Care | | | 23,075,936 | | | | — | | | | — | | | | 23,075,936 | |
| Industrials | | | 21,591,895 | | | | — | | | | — | | | | 21,591,895 | |
| Information Technology | | | 34,060,870 | | | | — | | | | — | | | | 34,060,870 | |
| Short-term Investments | | | 14,132,112 | | | | — | | | | — | | | | 14,132,112 | |
| | | | | | | | | | | | | | | $ | 188,016,933 | |
NOTES TO FINANCIAL STATEMENTS |
NOTES TO FINANCIAL STATEMENTS March 31, 2014 (Unaudited) (continued)
Fund Investments by Major Security Type | | | | | | | | | | | | |
| Marsico Flexible Capital Fund | | | | | | | | | | | | |
| Assets | | | | | | | | | | | | |
| Common Stocks | | | | | | | | | | | | |
| Consumer Discretionary | | $ | 339,757,318 | | | $ | — | | | $ | — | | | $ | 339,757,318 | |
| Consumer Staples | | | 64,492,510 | | | | — | | | | — | | | | 64,492,510 | |
| Financials | | | 26,388,592 | | | | — | | | | — | | | | 26,388,592 | |
| Health Care | | | 138,887,377 | | | | — | | | | — | | | | 138,887,377 | |
| Industrials | | | 37,609,269 | | | | — | | | | — | | | | 37,609,269 | |
| Information Technology | | | 159,147,613 | | | | — | | | | — | | | | 159,147,613 | |
| Materials | | | 72,996,770 | | | | — | | | | — | | | | 72,996,770 | |
| Corporate Bonds | | | — | | | | 18,693,794 | | | | — | | | | 18,693,794 | |
| International Bonds | | | — | | | | 8,908,399 | | | | — | | | | 8,908,399 | |
| Preferred Stocks | | | 6,045,619 | | | | — | | | | — | | | | 6,045,619 | |
| Short-term Investments | | | 36,879,654 | | | | — | | | | — | | | | 36,879,654 | |
| | | | | | | | | | | | | | | $ | 909,806,915 | |
| Marsico Global Fund | | | | | | | | | | | | | | | | |
| Assets | | | | | | | | | | | | | | | | |
| Common Stocks | | | | | | | | | | | | | | | | |
| Consumer Discretionary | | $ | 26,759,437 | | | $ | — | | | $ | — | | | $ | 26,759,437 | |
| Consumer Staples | | | 2,777,028 | | | | — | | | | — | | | | 2,777,028 | |
| Energy | | | 4,590,773 | | | | — | | | | — | | | | 4,590,773 | |
| Health Care | | | 9,949,050 | | | | — | | | | — | | | | 9,949,050 | |
| Industrials | | | 13,732,516 | | | | — | | | | — | | | | 13,732,516 | |
| Information Technology | | | 12,282,481 | | | | — | | | | — | | | | 12,282,481 | |
| Materials | | | 4,926,402 | | | | — | | | | — | | | | 4,926,402 | |
| Short-term Investments | | | 1,062,641 | | | | — | | | | — | | | | 1,062,641 | |
| | | | | | | | | | | | | | | $ | 76,080,328 | |
| | (b) | Expenses — The Funds are charged for those expenses that are directly attributable to each Fund, such as advisory and custodial fees. Expenses that are not directly attributable to a Fund are typically allocated among the Funds in proportion to their respective net assets and in some cases allocated based on other factors. The Funds’ expenses may be reduced by advisory fee waivers, brokerage credits and uninvested cash balances earning interest or credits. Such credits are included in “Less waiver of expenses and expenses paid indirectly” on the Statements of Operations. |
Brokerage commissions may be paid to certain brokers which reduce transfer agent fees and expenses. For the six-month period ended March 31, 2014 the Funds received no such brokerage commission credits. The Funds received earnings credits on certain cash account balances which reduced transfer agent fees and expenses in the amount of $246, $164, $91, $41, $244, and $19 for the Focus Fund, Growth Fund, 21st Century Fund, International Opportunities Fund, Flexible Capital Fund, and Global Fund, respectively, for the six-month period ended March 31, 2014. Brokerage commission credits and earnings credits (if any) are included in “Less waiver of expenses and expenses paid indirectly” on the Statements of Operations.
| | (c) | Federal Income Taxes — Each Fund intends to comply with the requirements of the Internal Revenue Code necessary to continue to qualify as a regulated investment company and to make the requisite distributions of income to its shareholders which will be sufficient to relieve it from all or substantially all federal and state income taxes. Certain Funds may utilize earnings and profits on redemption of shares as part of the dividends paid deduction. |
| | (d) | Distributions to Shareholders — Dividends from net investment income and net realized capital gains, if any, will be declared and paid at least annually. Distributions to shareholders are recorded on the ex-dividend date. Each Fund may periodically make reclassifications among certain of its capital accounts as a result of the timing and characterization of certain income and capital gains distributions determined in accordance with federal tax regulations, which may differ from GAAP. These reclassifications are due to differing treatment for items such as foreign currency transactions, passive foreign investment companies (“PFICs”) and net investment losses. |
NOTES TO FINANCIAL STATEMENTS |
| | (e) | Foreign Currency Translation — The accounting records of the Funds are maintained in US dollars. For valuation purposes, values of securities denominated in foreign currencies are translated into US dollars at 4:00 p.m. Eastern Time. Amounts related to the purchase and sale of foreign securities and investment income are translated at the rates of exchange prevailing on the respective dates of such transactions. |
Reported realized gains on foreign currency transactions arise from sales of portfolio securities, forward foreign currency contracts, currency gains or losses realized between the trade and settlement dates on securities transactions, and the difference between the amounts of dividends, interest, and foreign withholding taxes recorded on the Funds’ books and the US dollar equivalent of the amounts actually received or paid.
The Funds do not isolate that portion of the results of operations resulting from changes in foreign exchange rates on investments from the fluctuations arising from changes in market prices of securities held at the end of the reporting period. Net unrealized appreciation or depreciation on investments and foreign currency translations arise from changes in the value of assets and liabilities, including investments in securities at the end of the reporting period, resulting from changes in the exchange rates and changes in market prices of securities held. Transactions in foreign-denominated assets may involve greater risks than domestic transactions, including currency risk, political and economic risk, regulatory risk and market risk.
| | (f) | Derivative Instruments — “Disclosure about Derivative Instruments and Hedging Activities” (the “Derivatives Statement”) requires enhanced disclosures about the Funds’ derivative and hedging activities, including how such activities are accounted for and their effects on the Funds’ financial position, performance and cash flows. |
In January 2013, the Financial Accounting Standards Board (“FASB”) issued Accounting Standards Update (“ASU”) No. 2013-01 “Clarifying the Scope of Disclosures about Offsetting Assets and Liabilities”. This update gives additional clarification to the FASB’s ASU No. 2011-11 “Disclosures about Offsetting Assets and Liabilities”. The amendments in these ASUs require an entity to disclose information about offsetting and related arrangements to enable users of its financial statements to understand the effect of those arrangements on its financial position. The Funds adopted these ASUs in fiscal year 2014. The guidance requires retrospective application for all comparative periods presented. The adoption of these ASUs did not have a material effect on the Funds’ financial statements as of March 31, 2014.
The Funds are not intended as vehicles for investing substantially in derivative instruments, and may hold derivative instruments only infrequently. The Funds enter into derivative instruments in order to increase exposure to certain investments, asset classes, or markets, or for hedging purposes to hedge against adverse movements in securities prices, currency rates or interest rates. The Funds can hold various types of derivative instruments such as futures contracts and options on securities, financial indexes, and foreign currencies, options on futures, forward foreign currency contracts, interest rate swaps, credit default swaps, and swap-related products. The use of derivative instruments may involve risks such as the possibility of illiquid markets or imperfect correlation between the value of the derivative instruments and the underlying securities, or that the counterparty will fail to perform its obligations. There were no outstanding derivative instruments held by the Funds as of March 31, 2014 nor did the Funds utilize derivative instruments during the six-month period ended March 31, 2014.
Forward Foreign Currency Contracts — A forward currency contract is a commitment to purchase or sell foreign currency at a specified price on a future date. The Funds may enter into a forward foreign currency contract in order to hedge against foreign currency fluctuations, such as when a Fund elects to reduce exposure to changes in foreign currency exchange rates on foreign portfolio holdings denominated in or exposed to foreign currencies, or in preparation for purchasing securities in a particular market, or for other investment purposes.
The market value of a forward foreign currency contract fluctuates with changes in currency exchange rates. Outstanding forward foreign currency contracts are valued daily at current market rates and the resulting change in market value is recorded as unrealized appreciation or depreciation. When a forward foreign currency contract is settled, the Fund records a realized gain or loss equal to the difference between the value at the time the forward foreign currency contract was opened and the value at the time it was settled.
NOTES TO FINANCIAL STATEMENTS |
NOTES TO FINANCIAL STATEMENTS March 31, 2014 (Unaudited) (continued)
The Funds are subject to foreign currency exchange risk in the normal course of pursuing their investment objectives. Forward foreign currency contracts may involve market risk in excess of the unrealized gain or loss reflected on the Statements of Assets and Liabilities. In addition, the Funds could be exposed to a credit risk if the counterparties are unable or unwilling to meet the terms of the contracts or if the value of the foreign currency changes unfavorably. In connection with these contracts, the Funds typically segregate cash and/or other securities as collateral in a sufficient value equal to the aggregate amount of the Funds’ commitments under the forward foreign currency contracts; such collateral would be in the possession of the Funds’ custodian, if applicable.
Options Contracts — The Funds may purchase or write (sell) put and call options on foreign and domestic stock indices, foreign currencies, and US and foreign securities that are traded on a securities exchange or an over-the-counter market. These transactions are generally for hedging purposes or for the purpose of earning additional income. In addition, the Funds may enter into such transactions for cross-hedging purposes. There is generally limited counterparty credit risk involved when entering into exchange-traded option contracts because the exchange’s clearinghouse acts as counterparty to all options traded on such exchange.
In purchasing an option, the Fund pays a premium whether or not the option is exercised. Additionally, the Fund bears the risk of loss of premium and change in market value should the counterparty not perform under the contract. Put and call options purchased are accounted for in the same manner as portfolio securities. The cost of securities acquired through the exercise of call options is increased by premiums paid. The proceeds from securities sold through the exercise of put options are decreased by the premiums paid.
When a Fund writes an option, the premium received by the Fund is recorded as a liability and is subsequently adjusted to the current market value of the option written. Premiums received from writing options that expire are recorded by the Fund on the expiration date as realized gains from option transactions. The difference between the premium and the amount paid on effecting a closing purchase transaction, including brokerage commissions, is also treated as a realized gain, or if the premium is less than the amount paid for the closing purchase transaction, as a realized loss. If a call option is exercised, the premium is added to the proceeds from the sale of the underlying security or currency in determining whether the Fund has realized a gain or loss. If a put option is exercised, the premium reduces the cost basis of the security or currency purchased by the Fund. In writing an option, the Fund bears the market risk of an unfavorable change in the price of the security or currency underlying the written option. Exercise of an option written by the Fund could result in the Fund selling or buying a security or currency at a price different from the current market value.
| | (g) | Trustees’ Deferred Fee Plan — Effective February 1, 2000, the Board of Trustees adopted the Marsico Investment Fund Deferred Fee Plan (the “Deferred Fee Plan”), amended and restated as of December 30, 2005, which allows the Trustees to defer the receipt of all or a portion of their compensation received from the Funds. Any deferred fees are credited to accounts established on behalf of the Trustees into the Funds as directed by each Trustee. The amounts credited to these accounts increase or decrease in accordance with the performance of the Funds selected by the Trustees. The market value of the deferred account balances as of March 31, 2014 is shown on the Statements of Assets and Liabilities as part of an asset account, “Prepaid expenses and other assets”, and a liability account, “Accrued trustees’ fees”. Additionally, the fluctuation of the account balances due to the Funds’ performance is recorded by the Funds as unrealized appreciation (depreciation), which is shown as part of “Net unrealized appreciation on investments and foreign currency translations” on the Statements of Assets and Liabilities, and as compensation expense, which is shown as part of the expense account “Trustees’ fees and expenses” on the Statements of Operations. Fees earned and deferred by the Trustees for the six-month period ended March 31, 2014 are also included in “Trustees’ fees and expenses” on the Statements of Operations. Amounts contributed to the Deferred Fee Plan will be deferred until distributed in accordance with the Deferred Fee Plan. Unrealized appreciation (depreciation) of Fund shares held in the Deferred Fee Plan is subject to the Funds’ expense reimbursement agreement with the Adviser. |
| | (h) | Redemption Fee — Effective January 31, 2014, the Funds’ Board of Trustees approved the elimination of redemption fees from Fund share transactions placed on and after January 31, 2014. Prior to January 31, 2014, a 2.00% redemption fee was retained by the Funds to offset transaction costs and other expenses associated with short-term investing. The fee was imposed on certain redemptions or exchanges of shares held 30 days or less from their purchase date. Redemption fees were recorded by the Funds as a reduction of shares redeemed and as a credit to paid-in-capital. For the period October 1, 2013 through January 30, 2014, the Focus Fund, Growth Fund, 21st Century Fund, International Opportunities Fund, Flexible Capital Fund, and Global Fund received $1,691, $1,538, $696, $3,378, $30,499, and $1,528, respectively, in redemption fees. |
NOTES TO FINANCIAL STATEMENTS |
| | (i) | Other — Investment transactions are accounted for on a trade date basis. Each Fund determines the gain or loss realized from the investment transactions by comparing the original cost of the security lot sold with the net sale proceeds. Dividend income is recognized on the ex-dividend date. Certain dividends from foreign securities are recorded when the Trust is informed of the dividend if such information is obtained subsequent to the ex-dividend date. Interest income is recognized on an accrual basis and includes amortization of premiums and accretion of discounts. |
| | (j) | Indemnifications — In the normal course of business, the Funds enter into contracts that contain provisions indemnifying other parties against specified potential liabilities. Each Fund’s maximum exposure under these arrangements is unknown as this would involve future claims that may be made against the Fund that have not yet occurred. However, based on experience, the Funds expect the risk of loss to be remote. |
| 3. | Investment Advisory Agreement and Transactions With Affiliates |
Each Fund has an agreement with the Adviser to furnish investment advisory services to the Funds. Under the terms of these agreements, the Adviser is compensated for managing the Focus Fund and the Growth Fund at the rate of 0.85% per year of average daily net assets up to $3 billion in each Fund, and 0.75% per year of average daily net assets exceeding $3 billion in each Fund; and at a rate of 0.85% of the average daily net assets of the 21st Century Fund, the International Opportunities Fund, the Flexible Capital Fund, and the Global Fund. The Adviser has entered into a written expense limitation and fee waiver agreement under which it has agreed to limit the total expenses of each Fund (excluding interest, taxes, acquired fund fees and expenses, litigation, brokerage, and extraordinary expenses) to an annual rate of 1.60% of the average net assets of the Focus Fund, the International Opportunities Fund, the Flexible Capital Fund, and the Global Fund, and 1.50% of the average net assets of the Growth Fund and the 21st Century Fund until January 31, 2015.
The Adviser is entitled to reimbursement from a Fund of any amounts waived pursuant to this arrangement (or a previous expense limitation agreement) if such reimbursement does not cause a Fund to exceed the expense limitation currently in effect and the reimbursement is made within three years after the year in which the Adviser waived the fee or reimbursed the expense. Under this arrangement during the six-month period ended March 31, 2014, the Adviser received $68,623 of reimbursement from the International Opportunities Fund for previously waived fees or reimbursed expenses. The reimbursement amount is reflected in “Recovery of previously waived expenses” on the Statements of Operations. As of March 31, 2014, reimbursements that may potentially be made by the International Opportunities Fund and Global Fund to the Adviser are $170,284 and $235,549, respectively, which expire between 2015 and 2017.
Certain officers of the Trust are also officers of the Adviser. The Funds pay a portion of the Chief Compliance Officer’s total compensation costs which is shown as part of the expense account “Professional fees” on the Statements of Operations. No other officers of the Trust affiliated with the Adviser received compensation from the Funds.
| 4. | Distribution and Service Plan |
The Funds have adopted a Distribution and Service Plan (the “Plan”) pursuant to Rule 12b-1 under the 1940 Act. The Plan authorizes payments by the Funds in connection with the distribution of their shares at an annual rate, as determined from time to time by the Board of Trustees, of up to 0.25% of a Fund’s average daily net assets. The Adviser may, out of its own resources and at its sole discretion, make certain payments on behalf of the Plan for expenses incurred by a Fund for distribution of Fund shares and related services.
| 5. | Investment Transactions |
The aggregate purchases and sales of securities, excluding short-term investments, for the Funds for the six-month period ended March 31, 2014, were as follows:
| | | | | | | | | | | International Opportunities Fund | | | | | | | |
| Purchases | | $ | 338,179 | | | $ | 284,368 | | | $ | 173,461 | | | $ | 177,707 | | | $ | 515,667 | | | $ | 58,957 | |
| Sales | | $ | 448,799 | | | $ | 305,828 | | | $ | 195,783 | | | $ | 118,453 | | | $ | 492,863 | | | $ | 51,209 | |
There were no purchases or sales of US government securities, excluding short-term investments.
NOTES TO FINANCIAL STATEMENTS |
NOTES TO FINANCIAL STATEMENTS March 31, 2014 (Unaudited) (continued)
| 6. | Federal Income Tax Information |
“Accounting for Uncertainty in Income Taxes” (the “Income Tax Statement”) requires an evaluation of tax positions taken (or expected to be taken) in the course of preparing a Fund’s tax returns to determine whether these positions meet a “more-likely-than-not” standard that, based on the technical merits, have a more than fifty percent likelihood of being sustained by a taxing authority upon examination. A tax position that meets the “more-likely-than-not” recognition threshold is measured to determine the amount of benefit to recognize in the financial statements. The Funds recognize interest and penalties, if any, related to unrecognized tax benefits as income tax expense in the Statements of Operations.
The Income Tax Statement requires management of the Funds to analyze all open tax years, fiscal years 2010-2014 as defined by IRS statute of limitations for all major jurisdictions, including federal tax authorities and certain state tax authorities. As of and during the six-month period ended March 31, 2014, the Funds did not have a liability for any unrecognized tax benefits. The Funds have no examinations in progress and are not aware of any tax positions for which it is reasonably possible that the total amounts of unrecognized tax benefits will significantly change in the next twelve months.
At March 31, 2014 gross unrealized appreciation and depreciation of investments, based on cost for federal income tax purposes were as follows:
| | | | | | | | | | | International Opportunities Fund | | | | | | | |
| Cost of Investments | | $ | 627,989 | | | $ | 426,090 | | | $ | 256,215 | | | $ | 173,241 | | | $ | 754,486 | | | $ | 66,183 | |
| | | | | | | | | | | | | | | | | | | | | | | | | |
| Gross Unrealized Appreciation | | $ | 242,826 | | | $ | 165,800 | | | $ | 72,922 | | | $ | 15,199 | | | $ | 161,126 | | | $ | 9,902 | |
| Gross Unrealized Depreciation | | | (1,938 | ) | | | (1,652 | ) | | | (1,715 | ) | | | (423 | ) | | | (5,805 | ) | | | (5 | ) |
| | | | | | | | | | | | | | | | | | | | | | | | | |
| Net Unrealized Appreciation on investments | | $ | 240,888 | | | $ | 164,148 | | | $ | 71,207 | | | $ | 14,776 | | | $ | 155,321 | | | $ | 9,897 | |
The difference between cost amounts for financial statement and federal income tax purposes is due primarily to wash sale loss deferrals.
At September 30, 2013, the Funds had accumulated capital loss carryforwards (in thousands) as follows:
| | | | | | | | | | | International Opportunities Fund | | | | | | | |
| For Losses Expiring September 30, | | | | | | | | | | | | | | | | | | |
| 2017 | | $ | — | | | $ | — | | | $ | 118,543 | | | $ | 18,872 | | | $ | — | | | $ | — | |
| 2018 | | | — | | | | — | | | | 390,537 | | | | 93,558 | | | | — | | | | — | |
| Not Subject to Expiration | | | — | | | | — | | | | — | | | | — | | | | — | | | | — | |
| | | $ | — | | | $ | — | | | $ | 509,080 | | | $ | 112,430 | | | $ | — | | | $ | — | |
To the extent that a Fund may realize future net capital gains, those gains will be offset by any of its unused capital loss carryforward. Future capital loss carryover utilization in any given year may be subject to Internal Revenue Code limitations.
Under the Regulated Investment Company Modernization Act of 2010, the Funds are permitted to carryforward capital losses incurred in taxable years beginning after December 22, 2010 for an unlimited period. However, any losses incurred during those future taxable years will be required to be utilized prior to the losses incurred in pre-enactment taxable years. As a result of this ordering rule, pre-enactment capital loss carryforwards may be more likely to expire unused. Additionally, post-enactment capital losses that are carried forward will retain their character as either short-term or long-term capital losses rather than being considered all short-term as under previous law.
As of September 30, 2013, the Focus Fund, Growth Fund, 21st Century Fund, International Opportunities Fund, Flexible Capital Fund, and Global Fund, respectively, had (in thousands) $550, $1,254, $1,616, $0, $53, and $0 of qualified late-year losses, which are deferred until fiscal year 2014 for tax purposes. Net late-year losses incurred after December 31st, and within the taxable year are deemed to arise on the first day of the Fund’s next taxable year.
NOTES TO FINANCIAL STATEMENTS |
The Focus Fund, Growth Fund, 21st Century Fund, International Opportunities Fund, Flexible Capital Fund, and Global Fund utilized (in thousands) $0, $0, $75,161, $20,611, $0, and $4,665, respectively, of its capital loss carryforwards, during the year ended September 30, 2013.
As of September 30, 2013, the components of accumulated earnings (deficit) on a tax basis were as follows:
| | | | | | | | | | | International Opportunities Fund | | | | | | | |
| Undistributed Ordinary Income | | $ | 13,018 | | | $ | 24,012 | | | $ | — | | | $ | 741 | | | $ | 31,563 | | | $ | — | |
| Undistributed Trustees’ Deferred Compensation | | | (1,624 | ) | | | (989 | ) | | | (691 | ) | | | (298 | ) | | | (598 | ) | | | (272 | ) |
| Undistributed Long-Term Capital Gains | | | 118,241 | | | | 88,145 | | | | — | | | | — | | | | 44,555 | | | | 8,814 | |
| Tax Accumulated Earnings (Deficit) | | | 129,635 | | | | 111,168 | | | | (691 | ) | | | 443 | | | | 75,520 | | | | 8,542 | |
| Accumulated Capital and Other Losses | | | (550 | ) | | | (1,254 | ) | | | (510,696 | ) | | | (112,430 | ) | | | (53 | ) | | | — | |
| Unrealized Appreciation on Investments and on Foreign Currency Translations | | | 236,494 | | | | 151,221 | | | | 80,772 | | | | 20,331 | | | | 119,648 | | | | 13,902 | |
| Trustees Deferred Compensation Mark to Market | | | 339 | | | | 227 | | | | 198 | | | | 82 | | | | 445 | | | | 226 | |
| Total Accumulated Earnings (Deficit) | | $ | 365,918 | | | $ | 261,362 | | | $ | (430,417 | ) | | $ | (91,574 | ) | | $ | 195,560 | | | $ | 22,670 | |
Undistributed ordinary income (deficit) consists of net investment income and timing differences related to qualified late-year losses and PFICs.
The tax character of distributions paid during the fiscal years ended September 30, 2013 and 2012 were as follows:
| (Amounts in thousands) | | | | | | |
| | | | | | | | | | | | |
| Focus Fund | | $ | 1,177 | | | $ | 101,796 | | | $ | — | | | $ | — | |
| Growth Fund | | | 5,395 | | | | 30,178 | | | | 292 | | | | — | |
21st Century Fund | | | — | | | | — | | | | — | | | | — | |
| International Opportunities Fund | | | — | | | | — | | | | — | | | | — | |
| Flexible Capital Fund | | | 10,360 | | | | 22,646 | | | | 1,878 | | | | — | |
| Global Fund | | | — | | | | — | | | | — | | | | — | |
The tax character of dividends paid may differ from that shown in the Statements of Changes in Net Assets due to short-term gains being treated as ordinary income for tax purposes.
Management of the Adviser has determined that there were no material subsequent events that would require disclosure in the Funds’ financial statements.