UNITED STATES
SECURITIES AND EXCHANGE COMMISSION
Washington, D.C. 20549
FORM N-CSR
CERTIFIED SHAREHOLDER REPORT OF REGISTERED
MANAGEMENT INVESTMENT COMPANIES
Investment Company Act file number 811-08397
The Marsico Investment Fund
(Exact name of Registrant as specified in charter)
1200 17th Street, Suite 1600
Denver, Colorado 80202
(Address of principal executive offices) (Zip code)
Christopher J. Marsico
The Marsico Investment Fund
1200 17th Street, Suite 1600
Denver, Colorado 80202
(Name and address of agent for service)
Copies to:
Anthony H. Zacharski
Dechert LLP
90 State House Square
Hartford, CT 06103
Registrant's telephone number, including area code: (303) 454-5600
Date of fiscal year end: September 30
Date of reporting period: March 31, 2015
| Item 1. | Reports to Stockholders |
DEAR SHAREHOLDER:
Enclosed is your semi-annual report for The Marsico Investment Fund, encompassing the six-month fiscal period from October 1, 2014 to March 31, 2015.
The purpose of this report is to provide a review of the Marsico Funds’ six-month investment results by discussing what we believe were the main areas that impacted performance – including the macroeconomic environment, sector and industry positioning, and individual stock selection – as compared to the Funds’ performance benchmark indexes. For updated information regarding the market environment and the Funds’ overall investment postures and performance, please refer to the Funds’ most recent monthly fact sheets and quarterly investment updates, which are available in the Investor Resources section of the Funds’ website at www.marsicofunds.com.(1)
(1) | The references to the Marsico Funds website (www.marsicofunds.com) included throughout this annual report do not incorporate the website’s contents into this report. |
| KEY FUND STATISTICS | 2 | |
| | MARKET ENVIRONMENT | 5 | |
| | | | |
| | MARSICO FOCUS FUND |
| | Investment Review | 6 | |
| | Fund Overview | 9 | |
| | Schedule of Investments | 10 | |
| | | | |
| | MARSICO GROWTH FUND |
| | Investment Review | 11 | |
| | Fund Overview | 13 | |
| | Schedule of Investments | 14 | |
| | | | |
| | MARSICO 21st CENTURY FUND |
| | Investment Review | 16 | |
| | Fund Overview | 18 | |
| | Schedule of Investments | 19 | |
| | | | |
| | MARSICO INTERNATIONAL OPPORTUNITIES FUND |
| | Investment Review | 21 | |
| | Fund Overview | 23 | |
| | Schedule of Investments | 24 | |
| | | | |
| | MARSICO FLEXIBLE CAPITAL FUND |
| | Investment Review | 26 | |
| | Fund Overview | 28 | |
| | Schedule of Investments | 29 | |
| | | | |
| | MARSICO GLOBAL FUND |
| | Investment Review | 31 | |
| | Fund Overview | 33 | |
| | Schedule of Investments | 34 | |
| | | | |
| | FINANCIAL STATEMENTS | 36 | |
| | NOTES TO FINANCIAL STATEMENTS | 46 | |
| | EXPENSE EXAMPLE | 55 | |
| | CONSIDERATION OF INVESTMENT ADVISORY AGREEMENTS | 56 | |
| | OTHER INFORMATION | 59 | |
| KEY FUND STATISTICS (UNAUDITED) |
Marsico Focus Fund | Marsico Growth Fund | Marsico 21st Century Fund |
| | MFOCX | | | MGRIX | | | MXXIX | |
For additional disclosures,
please see page 9. | For additional disclosures,
please see page 13. | For additional disclosures,
please see page 18. |
PERFORMANCE COMPARISON(1) | PERFORMANCE COMPARISON(1) | PERFORMANCE COMPARISON(1) |
| | |
TOTAL ANNUAL OPERATING EXPENSES* 1.34% | TOTAL ANNUAL OPERATING EXPENSES* 1.37% | TOTAL ANNUAL OPERATING EXPENSES* 1.43% |
SECTOR ALLOCATION(2) | SECTOR ALLOCATION(2) | SECTOR ALLOCATION(2) |
| | |
| TOP FIVE HOLDINGS | TOP FIVE HOLDINGS | TOP FIVE HOLDINGS |
| BIOGEN IDEC INC. | 7.08% | BIOGEN IDEC INC. | 5.92% | FACEBOOK, INC. - CL. A | 5.55% |
| APPLE, INC. | 7.02% | FACEBOOK, INC. - CL. A | 5.90% | BIOGEN IDEC INC. | 5.02% |
| FACEBOOK, INC. - CL. A | 6.86% | APPLE, INC. | 5.81% | ACTAVIS PLC | 4.08% |
| CANADIAN PACIFIC RAILWAY LTD. | 5.26% | THE WALT DISNEY COMPANY | 4.48% | THE WALT DISNEY COMPANY | 3.46% |
| VISA, INC. - CL. A | 5.16% | CANADIAN PACIFIC RAILWAY LTD. | 4.16% | CONSTELLATION BRANDS, INC. - CL. A | 3.29% |
For additional disclosures about the Marsico Funds, please see page 4. The performance data quoted here represent past performance, and past performance is not a guarantee of future results. Investment return and principal value of an investment will fluctuate so that an investor’s shares, when redeemed, may be worth more or less than their original cost.
| KEY FUND STATISTICS (UNAUDITED) |
Marsico International Opportunities Fund | Marsico Flexible Capital Fund | Marsico Global Fund |
| | MIOFX | | | MFCFX | | | MGLBX | |
For additional disclosures,
please see page 23. | For additional disclosures,
please see page 28. | For additional disclosures,
please see page 33. |
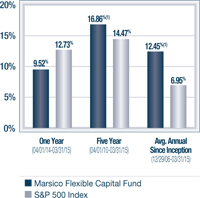
PERFORMANCE COMPARISON(1) | PERFORMANCE COMPARISON(1) | PERFORMANCE COMPARISON(1) |
| | |
TOTAL ANNUAL OPERATING EXPENSES* 1.69% NET EXPENSES*†1.60% | TOTAL ANNUAL OPERATING EXPENSES* 1.39% | TOTAL ANNUAL OPERATING EXPENSES* 1.66% NET EXPENSES*† 1.60% |
SECTOR ALLOCATION(2) | SECTOR ALLOCATION(2) | SECTOR ALLOCATION(2) |
| | |
| TOP FIVE HOLDINGS | TOP FIVE HOLDINGS | TOP FIVE HOLDINGS |
LIBERTY GLOBAL PLC -
SERIES C | 5.91% | CONSTELLATION BRANDS, INC. - CL. A | 4.83% | BIOGEN IDEC INC. | 5.13% |
| TENCENT HOLDINGS LTD. | 5.51% | LOWE'S COMPANIES, INC. | 4.59% | FACEBOOK, INC. - CL. A | 4.63% |
| ENDO INTERNATIONAL PLC | 4.16% | LIBERTY GLOBAL PLC - SERIES C | 4.27% | APPLE, INC. | 4.32% |
| ALIBABA GROUP HOLDING LTD. SPON. ADR | 4.16% | FACEBOOK, INC. - CL. A | 4.23% | DOMINO'S PIZZA GROUP PLC | 4.10% |
| NXP SEMICONDUCTORS N.V. | 4.09% | VISA, INC. - CL. A | 4.04% | THE SHERWIN-WILLIAMS COMPANY | 4.02% |
Current performance may be lower or higher than the performance information quoted. To obtain performance information current to the most recent month-end, please call 888-860-8686 or visit www.marsicofunds.com.
| KEY FUND STATISTICS (UNAUDITED) |
ADDITIONAL DISCLOSURES ABOUT THE MARSICO FUNDS
| * | The Total Annual Operating Expenses and Net Expenses are reflective of the information disclosed in the Funds’ Prospectus dated January 30, 2015. The information may differ from the expense ratios disclosed in this report. |
| † | Marsico Capital Management, LLC (the “Adviser”) has entered into a written expense limitation and fee waiver agreement under which it has agreed to limit the total expenses of each of the International Opportunities Fund and the Global Fund (excluding interest, taxes, acquired fund fees and expenses, litigation, brokerage and extraordinary expenses) to an annual rate of 1.60% of each Fund’s average net assets until January 31, 2016. This expense limitation and fee waiver agreement may be terminated by the Adviser at any time after January 31, 2016, upon 15 days prior notice to the Fund and its administrator. The Adviser may recoup from a Fund fees previously waived or expenses previously reimbursed by the Adviser with respect to that Fund pursuant to this agreement (or a previous expenses limitation agreement) if: (1) such recoupment by the Adviser does not cause the Fund, at the time of recoupment, to exceed the lesser of (a) the expense limitation in effect at the time the relevant amount was waived and/or reimbursed, or (b) the expense limitation in effect at the time of the proposed recoupment, and (2) the recoupment is made within three fiscal years after the end of the fiscal year in which the amount was waived or reimbursed. |
(1) | The performance data quoted here represent past performance, and past performance is not a guarantee of future results. Investment return and principal value of an investment will fluctuate so that an investor’s shares, when redeemed, may be worth more or less than their original cost. Current performance may be lower or higher than the performance information quoted. To obtain performance information current to the most recent month-end, please call 888-860-8686 or visit www.marsicofunds.com. |
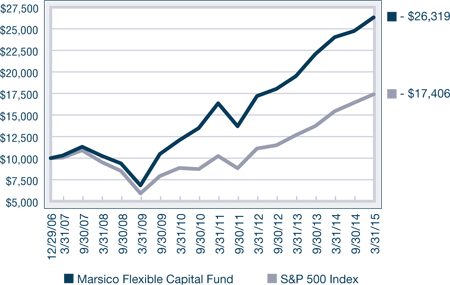
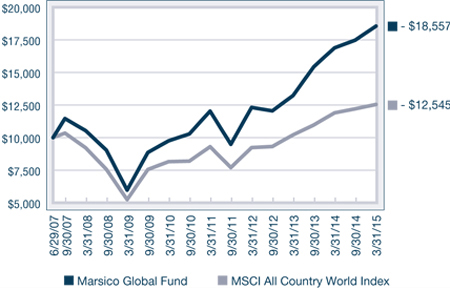
The performance included in the chart does not reflect the deduction of taxes on Fund distributions or the redemption of Fund shares.
All indices are unmanaged and investors cannot invest directly in an index.
The performance returns for the 21st Century Fund (for the period prior to March 31, 2004), the International Opportunities Fund (for the periods prior to September 30, 2004, from October 2011 through December 2013 and from October 2014 through March 2015), the Flexible Capital Fund (for the period prior to February 1, 2011), and the Global Fund (for the periods prior to January 1, 2009, from April 2009 through May 2009 and from January 2012 through March 2015) reflect a fee waiver in effect; in the absence of such a waiver, the returns would be reduced. The performance returns for the 21st Century Fund (for the period from April 2004 through January 2005), the International Opportunities Fund (for the periods from October 2004 through December 2005 and from January 2014 through September 2014), and the Global Fund (for the one-month period June 2009) would have been higher but for the reimbursement of fees waived previously.
| (2) | Sector weightings represent the percentage of the respective Fund’s investments (excluding cash equivalents) in certain general sectors. These sectors may include more than one industry. The Fund’s portfolio composition is subject to change at any time. |
MARKET ENVIRONMENT: OCTOBER 2014 – MARCH 2015 (UNAUDITED)
US and international developed market equities posted positive returns for the six-month fiscal period that ended March 31, 2015, while emerging market equities struggled. It was a volatile period for the markets, as plummeting crude oil and commodity prices stoked fears of slowing global growth. The decline in oil prices stemmed in part from slowing growth in demand, as reflected in China’s continued economic sputter and Europe’s stagnating economic growth. Accommodative monetary policy by central banks overseas – particularly in Europe and Japan – and relatively healthy US economic conditions buoyed equity market performance.
US equities outperformed international equities during the period. In a slow global growth environment, the US has been the bright spot, characterized by generally improving economic data. Solid corporate earnings growth, strong merger and acquisitions activity, and widespread corporate share buybacks further bolstered US equity returns. Given the strong US economic backdrop as compared to foreign economies, small, domestically-focused US companies were in favor. As depicted in the table below, small and medium-capitalization US equities rallied and handily outperformed large capitalization stocks for the six-month period ended March 31, 2015.
The US dollar strengthened compared to many international currencies as many foreign central banks were in stimulus mode, while the US Federal Reserve considered tightening measures. The magnitude of currency movements was pronounced. Late in the period, the US dollar traded at a 12-year high versus the euro and an eight-year high against the Japanese yen.
Positive effects of a rising dollar on the US economy included lower import and commodity prices. With few signs of inflation, the US Federal Reserve had more leeway to consider raising rates more slowly than might have otherwise been the case. US consumers benefitted from lower gas prices and cheaper prices for foreign goods and travel.
Not all effects of a strong dollar were positive. The strengthening dollar created headwinds for US multinational companies with large foreign operations, as a stronger dollar cuts the dollar value of international revenues and dampens earnings. Similarly, US investors in international markets generally experienced more muted gains after translating international investment performance from local currency into US dollar returns. For example, the MSCI EAFE Index soared +12.81% in local currency terms during the six-month period ended March 31, 2015, but rose only +1.13% after translating the return into US dollar terms.
Concerns regarding a potential Federal Reserve rate hike, low commodity prices, and currency woes hurt many emerging market economies. The MSCI Emerging Markets Index posted a negative return during the period.
International developed equity markets, as measured by the MSCI EAFE Index, fared slightly better and posted a modest, positive return in dollar terms as noted above. The comparatively better performance of developed international markets may have been partially attributable to expectations of more quantitative easing from both the European Central Bank and the Bank of Japan.
ENT
Index Name(1) | Universe of
Equities Represented | Six-Month Total Return |
| US | | |
| S&P 500 | US large-capitalization equities | +5.93% |
| Russell 3000 | US publicly-traded equities of all sizes | +7.13% |
| Russell 2000 | US small-capitalization equities | +14.46% |
| Russell Mid-Cap | US medium-capitalization equities | +10.13% |
Index Name(1) | Universe of
Equities Represented | Six-Month Total Return |
| INTERNATIONAL | |
| MSCI EAFE (US$) | Equities in developed international equity markets, including Japan, Western Europe, and Australasia | +1.13% |
| MSCI Emerging Markets (US$) | Equities in developing international equity markets, including China, India, Eastern Europe, and Latin America | -2.37% |
| MSCI ACWI (US$) | Equities in the global developed and emerging markets | +2.73% |
THE MARSICO INVESTMENT TEAM
| (1) | All indices are unmanaged and investors cannot invest directly in an index. |
INVESTMENT REVIEW BY TOM MARSICO AND CORALIE WITTER (UNAUDITED)
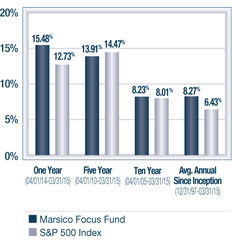
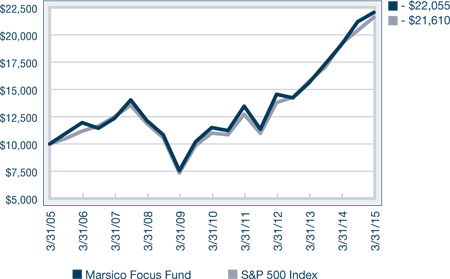
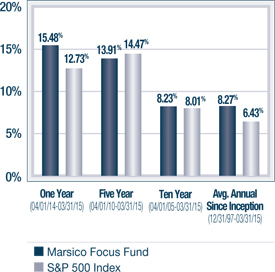
The Marsico Focus Fund posted a total return of +4.04% for the six-month fiscal period ended March 31, 2015. While the Fund posted a positive return, the Fund’s relative performance lagged its benchmark index, the S&P 500 Index, which had a total return of +5.93% over the same time period. Please see the Fund’s Overview for more detailed information about the Fund’s longer-term performance for various periods ended March 31, 2015.
The performance data for the Fund quoted here represent past performance, and past performance is not a guarantee of future results. Investment return and principal value of an investment will fluctuate so that an investor’s shares, when redeemed, may be worth more or less than their original cost. Current performance may be lower or higher than the performance information quoted. To obtain performance information current to the most recent month-end, please call 888-860-8686 or visit www.marsicofunds.com.(1)
This review highlights Fund performance over a six-month fiscal period. Shareholders should keep in mind that the Fund is intended for long-term investors who hold their shares for substantially longer periods of time. You should also keep in mind that our views and beliefs regarding all investments discussed in this report are subject to change at any time. References to specific securities, industries, and sectors discussed in this report are not recommendations to buy or sell such securities or related investments, and the Fund may not necessarily hold these securities or investments today. Please see the accompanying Schedules of Investments for the percentage of the Fund’s portfolio represented by the securities mentioned in this report as of the end of the reporting period.
The Focus Fund is non-diversified and may hold fewer securities than a diversified fund because it is permitted to invest a greater percentage of its assets in a smaller number of securities. Holding fewer securities increases the risk that the value of the Fund could go down because of the poor performance of a single investment. The Fund is subject to broad risks associated with investing in equity securities markets generally, including the risks that the securities and markets in which they invest may experience volatility and instability, that domestic and global economies and markets may undergo periods of cyclical change and decline, that investors may at times avoid investments in equity securities, and that investments may not perform as anticipated. Please see the Prospectus for more information.
The Focus Fund and the Growth Fund often invest in similar growth companies. Their performance may differ, however, because of a variety of factors. Among other factors, the Focus Fund is a non-diversified mutual fund that may hold the securities of fewer issuers than the Growth Fund, which is a diversified Fund. As a result, the Focus Fund may hold some securities that are different from those held by the Growth Fund, and the Focus Fund may be more exposed to individual stock volatility than the Growth Fund or other mutual funds that invest in a relatively larger number of securities.
The Marsico Focus Fund’s performance shortfall during the six months ended March 31, 2015, as compared to the S&P 500 Index, was primarily attributable to certain Fund holdings in the Health Care and Consumer Discretionary sectors, as defined in the Global Industry Classification Standard (“GICS”)(2).
Biotechnology holding Gilead Sciences, Inc. declined -8% during the period and was a significant detractor from the Fund’s performance. Gilead’s stock price slid in late 2014 after a competitor announced an agreement with a large pharmacy benefit management company to provide a lower cost treatment for the most common form of hepatitis C, genotype 1. We believe that Gilead’s hepatitis C treatment remains superior to offerings by competitors, as Gilead’s single pill per day therapy is far more convenient for patients than the leading competitor’s treatment, which involves taking approximately four to six pills per day for 12 weeks. Subsequent developments supported our view of Gilead’s advantages, as in early 2015, Gilead’s therapy for hepatitis C treatment received preferred status from several major benefit providers. While we have confidence in the long-term growth prospects for Gilead, the marketplace’s outstanding questions about hepatitis C drug pricing was an overhang and we felt it prudent to trim the Fund’s Gilead position from the Fund’s largest individual holding to a core position during the period.
Several of the Fund’s Consumer Discretionary holdings struggled during the period, including Wynn Resorts Ltd., Tesla Motors, Inc., and Starwood Hotels & Resorts Worldwide, Inc. Long-time Fund holding Wynn Resorts experienced a sharp stock price decline (-31%) prior to being sold from the Fund. Wynn Resorts has substantial operations in Macau. The company’s stock price struggled as the Chinese government’s anti-corruption campaign contributed to weakness in Macau’s VIP gaming segment. The stock price of electric vehicle manufacturer Tesla Motors fell in conjunction with the decline in crude oil prices, as concerns rose that lower gas prices may reduce demand for fuel efficient cars. Tesla Motors posted a return of -20% and was sold from the Fund. Starwood Hotels & Resorts also had a material, negative impact on Fund performance. Nearly half of Starwood’s properties are located in international markets. The company’s profits have been negatively affected by volatility in international markets and the strengthening US dollar. We believe US dollar strength is likely to continue for some time, and we sold the position in favor of other investments we believe offer better upside potential.
As oil prices fell, we sold the Fund’s holdings in the Energy sector. While the underweight allocation was beneficial to performance relative to the benchmark index, a portion of the positive sector allocation effect was offset by weak returns experienced by several of the Fund’s Energy positions held earlier in the period.
Canadian Pacific Railway Ltd. (-12%) was another Fund holding negatively affected by declining oil prices. Although lower energy prices were an overhang for the railroad operator, we continued to maintain the Fund’s position. A sizeable portion of Canadian Pacific’s crude oil business is sourced from western Canada in projects that we believe are likely to produce oil for shipment by rail even in a lower oil price environment.
Within the Financials sector, American Express Company’s stock price dropped -10% after the company announced that its exclusivity and co-branded card agreement with Costco Wholesale will end next year. We sold the position from the Fund.
Although several Fund holdings within the Health Care and Consumer Discretionary sectors posted negative returns, as discussed in more detail above, other holdings within the sectors generated strong performance results. Biotechnology holdings Biogen Idec Inc. (+28%), Actavis PLC (+12%), and Celgene Corporation (+22%) were positive contributors to performance. Health care services provider UnitedHealth Group, Inc. (+25%) was another strong-performing holding. Leading Consumer Discretionary positions included Starbucks Corporation (+26%) and The Walt Disney Company (+19%). Walt Disney has experienced strong revenue growth in its studio and consumer products businesses, driven by the continued success of its animated film, Frozen. Starbucks, meanwhile, has reported strong same store sales and customer traffic. This trend is likely attributable in part to consumers benefitting from an improving economy and lower gas prices.
Other individual holdings having a material, positive impact on Fund performance included The Sherwin-Williams Company (+31%) and Visa, Inc. – Cl. A (+23%). The stock price of paint manufacturer Sherwin-Williams rose as it reported stronger than expected sales from its stores. Financial transaction processor Visa’s stock price gain was largely attributable to the company’s strong revenue growth, accelerating cross-border volumes, and lower than expected operating expenses.
From a sector allocation perspective, the Fund benefitted relative to its benchmark from selling its Energy holdings during the period, as Energy was the weakest-performing sector of the S&P 500 Index. The Fund’s performance was also aided by having no holdings in the weak-performing Telecommunication Services sector. Overweight allocations to the strongest-performing sectors of the benchmark index, Health Care and Consumer Discretionary, contributed positively to Fund performance. A portion of the positive sector allocation effect was offset by the Fund’s having few holdings in the Consumer Staples sector, a strong-performing sector of the benchmark index.
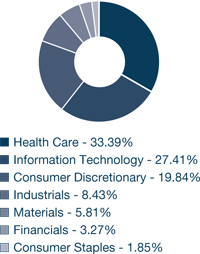
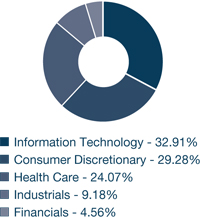
During the reporting period, the Fund reduced its exposure to the Consumer Discretionary, Materials, and Financials sectors while increasing its allocations to the Health Care and Information Technology sectors.
Fiscal Period-End Investment Posture
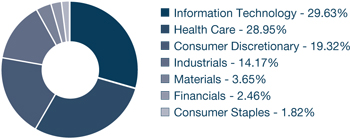
As of March 31, 2015, the Fund’s largest sector allocations included Health Care, Information Technology, Consumer Discretionary and Industrials. As of that date, the Fund had no exposure to the Energy, Utilities, or Telecommunication Services sectors.
Sincerely,
THOMAS F. MARSICO
CORALIE T. WITTER, CFA
PORTFOLIO MANAGERS
| (1) | Total returns are based on net change in net asset value assuming reinvestment of distributions. Please see the Prospectus for more information. |
| (2) | Regarding GICS data cited throughout this report, the Global Industry Classification Standard (“GICS”) was developed by and is the exclusive property and service mark of MSCI Inc. (“MSCI”) and Standard & Poor’s (“S&P”) and is licensed for use by Marsico Capital Management, LLC (the “Adviser”). Neither MSCI, S&P, nor the Adviser or any third party involved in compiling GICS makes any express or implied warranties or representations with respect to such standard or classification (or the results from use thereof), and all such parties hereby expressly disclaim all warranties of originality, accuracy, completeness, merchantability and fitness for a particular purpose with respect to any such standard or classification. MSCI, S&P, the Adviser, and any of their affiliates or third parties involved in compiling GICS shall not have any liability for any direct, indirect, special, punitive, consequential or any other damages (including lost profits) even if notified of the possibility of such damages. |
March 31, 2015 (Unaudited)
The Focus Fund invests primarily in the common stocks of large companies that are selected for their long-term growth potential. The Fund will normally hold a core position of between 20 and 35 common stocks.
TOTAL ANNUAL OPERATING EXPENSES* 1.34% | NET ASSETS $913,084,514 | NET ASSET VALUE PER SHARE $20.44 |
GROWTH OF $10,000(1) | PERFORMANCE COMPARISON |
|  |
SECTOR ALLOCATION(2) | TOP FIVE HOLDINGS |
 | | |
| BIOGEN IDEC INC. | 7.08% |
| APPLE, INC. | 7.02% |
| FACEBOOK, INC. - CL. A | 6.86% |
| CANADIAN PACIFIC RAILWAY LTD. | 5.26% |
| VISA, INC. - CL. A | 5.16% |
| * | The Total Annual Operating Expenses are reflective of the information disclosed in the Funds’ Prospectus dated January 30, 2015 and may differ from the expense ratio disclosed in this report. |
The performance data quoted here represent past performance, and past performance is not a guarantee of future results. Investment return and principal value of an investment will fluctuate so that an investor’s shares, when redeemed, may be worth more or less than their original cost. Current performance may be lower or higher than the performance information quoted. To obtain performance information current to the most recent month-end, please call 888-860-8686 or visit www.marsicofunds.com.
The performance included in the chart and graph does not reflect the deduction of taxes on Fund distributions or the redemption of Fund shares.
All indices are unmanaged and investors cannot invest directly in an index.
| (1) | This chart assumes an initial investment of $10,000 made on March 31, 2005. Total returns are based on net change in NAV, assuming reinvestment of distributions. |
| (2) | Sector weightings represent the percentage of the Fund’s investments (excluding cash equivalents) in certain general sectors. These sectors may include more than one industry. The Fund’s portfolio composition is subject to change at any time. |
MARSICO FOCUS FUND
SCHEDULE OF INVESTMENTS
March 31, 2015 (Unaudited)
| | | Number
of
Shares | | | Value | | | Percent
of Net
Assets | |
| COMMON STOCKS | | | | | | | | | |
| Aerospace & Defense | | | | | | | | | |
| The Boeing Company | | | 181,413 | | | $ | 27,226,463 | | | | 2.98 | % |
| | | | | | | | | | | | | |
| Biotechnology | | | | | | | | | | | | |
| Biogen Idec Inc.* | | | 153,122 | | | | 64,654,233 | | | | 7.08 | |
| Celgene Corporation* | | | 206,849 | | | | 23,845,553 | | | | 2.61 | |
| Gilead Sciences, Inc.* | | | 278,785 | | | | 27,357,172 | | | | 3.00 | |
| Vertex Pharmaceuticals, Inc.* | | | 193,460 | | | | 22,822,476 | | | | 2.50 | |
| | | | | | | | 138,679,434 | | | | 15.19 | |
| Cable & Satellite | | | | | | | | | | | | |
| Comcast Corporation - Cl. A | | | 440,595 | | | | 24,880,400 | | | | 2.73 | |
| Time Warner Cable, Inc. | | | 58,615 | | | | 8,785,216 | | | | 0.96 | |
| | | | | | | | 33,665,616 | | | | 3.69 | |
| Data Processing & Outsourced Services | | | | | |
| Visa, Inc. - Cl. A | | | 720,884 | | | | 47,153,022 | | | | 5.16 | |
| | | | | | | | | | | | | |
| Drug Retail | | | | | | | | | | | | |
| CVS Health Corporation | | | 160,201 | | | | 16,534,345 | | | | 1.81 | |
| | | | | | | | | | | | | |
| Fertilizers & Agricultural Chemicals | | | | | | | | | |
| Monsanto Company | | | 76,468 | | | | 8,605,709 | | | | 0.94 | |
| | | | | | | | | | | | | |
| Footwear | | | | | | | | | | | | |
| NIKE, Inc. - Cl. B | | | 369,313 | | | | 37,053,173 | | | | 4.06 | |
| | | | | | | | | | | | | |
| General Merchandise Stores | | | | | | | | | |
| Dollar Tree, Inc.* | | | 338,408 | | | | 27,460,117 | | | | 3.01 | |
| | | | | | | | | | | | | |
| Health Care Facilities | | | | | | | | | | | | |
| HCA Holdings, Inc.* | | | 446,699 | | | | 33,605,166 | | | | 3.68 | |
| | | | | | | | | | | | | |
| Internet Software & Services | | | | | | | | | |
| Alibaba Group Holding Ltd. Spon. ADR* | | | 332,758 | | | | 27,698,776 | | | | 3.03 | |
| Facebook, Inc. - Cl. A* | | | 761,329 | | | | 62,592,664 | | | | 6.86 | |
| LinkedIn Corporation - Cl. A* | | | 59,925 | | | | 14,972,860 | | | | 1.64 | |
| | | | | | | | 105,264,300 | | | | 11.53 | |
| Investment Banking & Brokerage | | | | | | | | | |
| The Charles Schwab Corporation | | | 958,816 | | | | 29,186,359 | | | | 3.20 | |
| | | | | | | | | | | | | |
| Managed Health Care | | | | | | | | | | | | |
| UnitedHealth Group, Inc. | | | 287,373 | | | | 33,993,352 | | | | 3.72 | |
| | | | | | | | | | | | | |
| Movies & Entertainment | | | | | | | | | | | | |
| The Walt Disney Company | | | 429,830 | | | | 45,084,869 | | | | 4.94 | |
| | | | | | | | | | | | | |
| Pharmaceuticals | | | | | | | | | | | | |
| Actavis PLC* | | | 113,847 | | | | 33,883,144 | | | | 3.71 | |
| Novartis AG | | | 280,877 | | | | 27,790,002 | | | | 3.04 | |
| Pacira Pharmaceuticals, Inc.* | | | 234,075 | | | | 20,797,564 | | | | 2.28 | |
| Valeant Pharmaceuticals International, Inc.* | | | 46,102 | | | | 9,156,779 | | | | 1.00 | |
| | | | | | | | 91,627,489 | | | | 10.03 | |
| | | | | | | | | | | | | |
| Railroads | | | | | | | | | | | | |
| Canadian Pacific Railway Ltd. | | | 262,685 | | | $ | 47,992,549 | | | | 5.26 | % |
| | | | | | | | | | | | | |
| Restaurants | | | | | | | | | | | | |
| Starbucks Corporation | | | 356,287 | | | | 33,740,379 | | | | 3.69 | |
| | | | | | | | | | | | | |
| Semiconductor Equipment | | | | | | | | | | | | |
| ASML Holding N.V. | | | 277,992 | | | | 28,085,532 | | | | 3.08 | |
| | | | | | | | | | | | | |
| Specialty Chemicals | | | | | | | | | | | | |
| The Sherwin-Williams Company | | | 152,043 | | | | 43,256,234 | | | | 4.74 | |
| | | | | | | | | | | | | |
| Technology Hardware, Storage & Peripherals | | | | | |
| Apple, Inc. | | | 515,101 | | | | 64,094,017 | | | | 7.02 | |
| | | | | | | | | | | | | |
| TOTAL COMMON STOCKS | | | | | | | | | | | | |
| (Cost $647,800,092) | | | | | | | 892,308,125 | | | | 97.73 | |
| | | | | | | | | | | | | |
| SHORT-TERM INVESTMENTS | | | | | | | | | |
| State Street Institutional U.S. Government Money Market Fund, 0.000% | | | 31,246,368 | | | | 31,246,368 | | | | 3.42 | |
| | | | | | | | | | | | | |
| TOTAL SHORT-TERM INVESTMENTS | | | | | | | | | |
| (Cost $31,246,368) | | | | | | | 31,246,368 | | | | 3.42 | |
| | | | | | | | | | | | | |
| TOTAL INVESTMENTS | | | | | | | | | | | | |
| (Cost $679,046,460) | | | | | | | 923,554,493 | | | | 101.15 | |
| | | | | | | | | | | | | |
| Liabilities, Less Cash and Other Assets | | | | | | | (10,469,979 | ) | | | (1.15 | ) |
| | | | | | | | | | | | | |
| NET ASSETS | | | | | | $ | 913,084,514 | | | | 100.00 | % |
See notes to financial statements.
INVESTMENT REVIEW BY TOM MARSICO, CORALIE WITTER AND KEVIN BOONE (UNAUDITED)
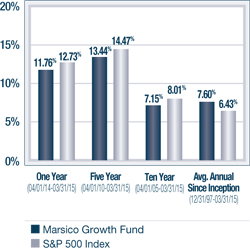
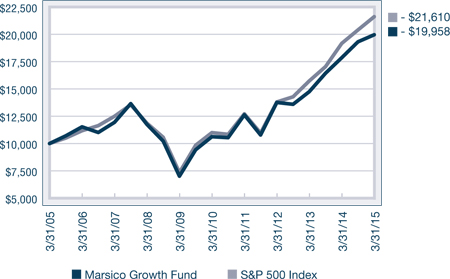
The Marsico Growth Fund posted a total return of +3.34% for the six-month fiscal period ended March 31, 2015. The Fund underperformed the S&P 500 Index, which we consider to be the Fund’s benchmark index and which had a total return of +5.93% over the same time period. Please see the Fund’s Overview for more detailed information about the Fund’s longer-term performance for various periods ended March 31, 2015.
The performance data for the Fund quoted here represent past performance, and past performance is not a guarantee of future results. Investment return and principal value of an investment will fluctuate so that an investor’s shares, when redeemed, may be worth more or less than their original cost. Current performance may be lower or higher than the performance information quoted. To obtain performance information current to the most recent month-end, please call 888-860-8686 or visit www.marsicofunds.com.(1)
This review highlights Fund performance over a six-month fiscal period. Shareholders should keep in mind that the Fund is intended for long-term investors who hold their shares for substantially longer periods of time. You should also keep in mind that our views and beliefs regarding all investments discussed in this report are subject to change at any time. References to specific securities, industries, and sectors discussed in this report are not recommendations to buy or sell such securities or related investments, and the Fund may not necessarily hold these securities or investments today. Please see the accompanying Schedules of Investments for the percentage of the Fund’s portfolio represented by the securities mentioned in this report as of the end of the reporting period.
The Fund is subject to broad risks associated with investing in equity securities markets generally, including the risks that the securities and markets in which it invests may experience volatility and instability, that domestic and global economies and markets may undergo periods of cyclical change and decline, that investors may at times avoid investments in equity securities, and that investments may not perform as anticipated. Please see the Prospectus for more information.
The Focus Fund and the Growth Fund often invest in similar growth companies. Their performance may differ, however, because of a variety of factors. Among other factors, the Focus Fund is a non-diversified mutual fund that may hold the securities of fewer issuers than the Growth Fund, which is a diversified Fund. As a result, the Focus Fund may hold some securities that are different from those held by the Growth Fund, and the Focus Fund may be more exposed to individual stock volatility than the Growth Fund or other mutual funds that invest in a relatively larger number of securities.
Several of the Growth Fund’s Consumer Discretionary holdings posted weak returns and adversely affected performance results. These holdings included Wynn Resorts Ltd. (-31%), Tesla Motors, Inc. (-22%), and Starwood Hotels & Resorts Worldwide, Inc. (+1% prior to being sold), which are also discussed in more detail in the review of the Focus Fund, as well as The Priceline Group, Inc. (-10% prior to being sold). The Growth Fund significantly trimmed its Wynn Resorts and Tesla positions during the period, but did not completely sell them from the Fund. Given that the Growth Fund holds a larger number of securities than the Focus Fund, certain investments may be maintained in the Growth Fund that were entirely sold from the Focus Fund portfolio.
Also similar to the Focus Fund, Health Care biotechnology company Gilead Sciences, Inc. (-7%) was a significant detractor from the Growth Fund’s performance. Gilead was trimmed from being the Growth Fund’s largest individual holding at the start of the reporting period to a core position by period-end.
Energy was the weakest-performing sector of the S&P 500 Index, posting a return of -13% for the six-month period as the price of oil plunged to its lowest price in six years. The Growth Fund benefitted from having a smaller allocation to the Energy sector as compared to the benchmark index. As oil prices fell, we sold the Fund’s holdings within the sector. While an underweight allocation to Energy on average during the six-month period was beneficial to relative performance, it was not enough to offset weak returns experienced by several of the Fund’s Energy positions early in the period. Much of the Growth Fund’s performance shortfall relative to the Focus Fund was attributable to the Growth Fund’s having more exposure to the Energy sector than the Focus Fund, on average, during the period. The Growth Fund’s performance versus the Focus Fund was also hurt by holding a position in Antero Resources Corporation (-33% prior to being sold), a name not held in the Focus Fund.
Industrials holding Canadian Pacific Railway Ltd. (-12%) and Financials position American Express Company (-16% prior to being sold) were other holdings having a material, negative effect on performance.
There were several areas of strength for the Growth Fund. These included biotechnology holdings Biogen Idec Inc. (+27%), Actavis PLC (+12%), and Celgene Corporation (+22%), and health care services provider UnitedHealth Group, Inc. (+26%). Consumer Discretionary positions Starbucks Corporation (+26%) and The Walt Disney Company (+19%) also performed well. Paint manufacturer The Sherwin-Williams Company (+31%) and financial transaction processor Visa, Inc. – Cl. A (+23%) were other significant positive performance contributors.
From a sector allocation perspective, the Fund benefitted relative to its benchmark from selling its Energy holdings during the period and from having no holdings in the weak-performing Telecommunication Services sector. Overweight allocations to the strongest-performing sectors of the benchmark index, Health Care and Consumer Discretionary, also contributed positively to Fund performance. A modest portion of the positive sector allocation effect was offset by the Fund’s having few holdings in the Consumer Staples sector, a strong-performing sector of the benchmark index.
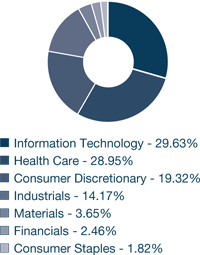
During the reporting period, the Fund reduced its exposure to the Consumer Discretionary, Materials, and Consumer Staples sectors while increasing its allocations to the Health Care, Information Technology, and Industrials sectors.
Fiscal Period-End Investment Posture
As of March 31, 2015, the Growth Fund’s largest sector allocations included Information Technology, Health Care, Consumer Discretionary, and Industrials. At period-end, the Fund had no exposure to the Energy, Utilities, or Telecommunication Services sectors.
In closing, we are pleased to note that, as previously communicated to shareholders, Kevin Boone was promoted to serve as co-portfolio manager for the Growth Fund effective January 30, 2015. Mr. Boone has some 9 years of experience as a securities analyst and in the investment banking field. Prior to joining MCM in 2012, Mr. Boone was a senior equity analyst with Citadel Investment Group from 2011-2012, and before that served as Vice President of Equity Research at Morgan Stanley from 2009-2011, and Senior Associate in Investment Banking at Merrill Lynch from 2006-2009. He earned a BS in Accounting from the University of Florida and an MBA from the University of North Carolina. Mr. Boone was a certified public accountant for Ernst & Young from 2002-2004, and an associate with Arthur Andersen from 2000-2002.
Sincerely,
THOMAS F. MARSICO
CORALIE T. WITTER, CFA
KEVIN S. BOONE
PORTFOLIO MANAGERS
| (1) | Total returns are based on net change in net asset value assuming reinvestment of distributions. Please see the Prospectus for more information. |
March 31, 2015 (Unaudited)
The Growth Fund invests primarily in the common stocks of large companies that are selected for their long-term growth potential. The Growth Fund will normally hold a core position of between 35 and 50 common stocks.
TOTAL ANNUAL OPERATING EXPENSES* 1.37% | NET ASSETS $510,175,828 | NET ASSET VALUE PER SHARE $21.67 |
GROWTH OF $10,000(1) | PERFORMANCE COMPARISON |
|  |
SECTOR ALLOCATION(2) | TOP FIVE HOLDINGS |
 | | |
| BIOGEN IDEC INC. | 5.92% |
| FACEBOOK, INC. - CL. A | 5.90% |
| APPLE, INC. | 5.81% |
| THE WALT DISNEY COMPANY | 4.48% |
| CANADIAN PACIFIC RAILWAY LTD. | 4.16% |
| * | The Total Annual Operating Expenses are reflective of the information disclosed in the Funds’ Prospectus dated January 30, 2015 and may differ from the expense ratio disclosed in this report. |
The performance data quoted here represent past performance, and past performance is not a guarantee of future results. Investment return and principal value of an investment will fluctuate so that an investor’s shares, when redeemed, may be worth more or less than their original cost. Current performance may be lower or higher than the performance information quoted. To obtain performance information current to the most recent month-end, please call 888-860-8686 or visit www.marsicofunds.com.
The performance included in the chart and graph does not reflect the deduction of taxes on Fund distributions or the redemption of Fund shares.
All indices are unmanaged and investors cannot invest directly in an index.
| (1) | This chart assumes an initial investment of $10,000 made on March 31, 2005. Total returns are based on net change in NAV, assuming reinvestment of distributions. |
| (2) | Sector weightings represent the percentage of the Fund’s investments (excluding cash equivalents) in certain general sectors. These sectors may include more than one industry. The Fund’s portfolio composition is subject to change at any time. |
MARSICO GROWTH FUND
SCHEDULE OF INVESTMENTS
March 31, 2015 (Unaudited)
| | | Number
of
Shares | | | Value | | | Percent
of Net
Assets | |
| COMMON STOCKS | | | | | | | | | |
| Aerospace & Defense | | | | | | | | | |
| Lockheed Martin Corporation | | | 50,501 | | | $ | 10,249,683 | | | | 2.01 | % |
| The Boeing Company | | | 77,512 | | | | 11,633,001 | | | | 2.28 | |
| | | | | | | | 21,882,684 | | | | 4.29 | |
| Airlines | | | | | | | | | | | | |
| Delta Air Lines, Inc. | | | 239,721 | | | | 10,777,856 | | | | 2.11 | |
| | | | | | | | | | | | | |
| Apparel, Accessories & Luxury Goods | | | | | |
| lululemon athletica, inc.* | | | 62,763 | | | | 4,018,087 | | | | 0.79 | |
| | | | | | | | | | | | | |
| Application Software | | | | | | | | | | | | |
| salesforce.com, inc.* | | | 81,231 | | | | 5,427,043 | | | | 1.06 | |
| | | | | | | | | | | | | |
| Automobile Manufacturers | | | | | | | | | | | | |
| Tesla Motors, Inc.* | | | 27,148 | | | | 5,124,728 | | | | 1.00 | |
| | | | | | | | | | | | | |
| Biotechnology | | | | | | | | | | | | |
| Biogen Idec Inc.* | | | 71,542 | | | | 30,207,894 | | | | 5.92 | |
| Celgene Corporation* | | | 122,322 | | | | 14,101,280 | | | | 2.76 | |
| Gilead Sciences, Inc.* | | | 102,763 | | | | 10,084,133 | | | | 1.98 | |
| Incyte Corp.* | | | 28,503 | | | | 2,612,585 | | | | 0.51 | |
| Vertex Pharmaceuticals, Inc.* | | | 112,907 | | | | 13,319,639 | | | | 2.61 | |
| | | | | | | | 70,325,531 | | | | 13.78 | |
| Cable & Satellite | | | | | | | | | | | | |
| Comcast Corporation - Cl. A | | | 176,248 | | | | 9,952,725 | | | | 1.95 | |
| | | | | | | | | | | | | |
| Casinos & Gaming | | | | | | | | | | | | |
| Wynn Resorts Ltd. | | | 30,443 | | | | 3,832,165 | | | | 0.75 | |
| | | | | | | | | | | | | |
| Data Processing & Outsourced Services | | | | | |
| FleetCor Technologies, Inc.* | | | 62,811 | | | | 9,479,436 | | | | 1.86 | |
| Visa, Inc. - Cl. A | | | 275,779 | | | | 18,038,705 | | | | 3.53 | |
| | | | | | | | 27,518,141 | | | | 5.39 | |
| Drug Retail | | | | | | | | | | | | |
| CVS Health Corporation | | | 89,690 | | | | 9,256,905 | | | | 1.81 | |
| | | | | | | | | | | | | |
| Fertilizers & Agricultural Chemicals | | | | | | | | | |
| Monsanto Company | | | 18,252 | | | | 2,054,080 | | | | 0.40 | |
| | | | | | | | | | | | | |
| Footwear | | | | | | | | | | | | |
| NIKE, Inc. - Cl. B | | | 153,839 | | | | 15,434,667 | | | | 3.03 | |
| | | | | | | | | | | | | |
| General Merchandise Stores | | | | | | | | | |
| Dollar Tree, Inc.* | | | 199,654 | | | | 16,200,924 | | | | 3.18 | |
| | | | | | | | | | | | | |
| Health Care Facilities | | | | | | | | | | | | |
| HCA Holdings, Inc.* | | | 214,914 | | | | 16,167,980 | | | | 3.17 | |
| | | | | | | | | | | | | |
| Home Entertainment Software | | | | | | | | | |
| Electronic Arts, Inc.* | | | 116,385 | | | $ | 6,845,184 | | | | 1.34 | % |
| | | | | | | | | | | | | |
| Hotels, Resorts & Cruise Lines | | | | | | | | | |
| Royal Caribbean Cruises Ltd. | | | 68,279 | | | | 5,588,636 | | | | 1.10 | |
| | | | | | | | | | | | | |
| Internet Software & Services | | | | | | | | | |
| Alibaba Group Holding Ltd. Spon. ADR* | | | 129,494 | | | | 10,779,081 | | | | 2.11 | |
| Facebook, Inc. - Cl. A* | | | 366,201 | | | | 30,107,215 | | | | 5.90 | |
| LinkedIn Corporation - Cl. A* | | | 31,717 | | | | 7,924,810 | | | | 1.56 | |
| Tencent Holdings Ltd. | | | 587,600 | | | | 11,164,373 | | | | 2.19 | |
| | | | | | | | 59,975,479 | | | | 11.76 | |
| Investment Banking & Brokerage | | | | | | | | | |
| The Charles Schwab Corporation | | | 410,999 | | | | 12,510,810 | | | | 2.45 | |
| | | | | | | | | | | | | |
| Life Sciences Tools & Services | | | | | | | | | |
| Illumina, Inc.* | | | 21,788 | | | | 4,044,724 | | | | 0.79 | |
| | | | | | | | | | | | | |
| Managed Health Care | | | | | | | | | | | | |
| UnitedHealth Group, Inc. | | | 133,808 | | | | 15,828,148 | | | | 3.10 | |
| | | | | | | | | | | | | |
| Movies & Entertainment | | | | | | | | | | | | |
| The Walt Disney Company | | | 217,708 | | | | 22,835,392 | | | | 4.48 | |
| | | | | | | | | | | | | |
| Pharmaceuticals | | | | | | | | | | | | |
| Actavis PLC* | | | 63,795 | | | | 18,986,668 | | | | 3.72 | |
| Merck & Co., Inc. | | | 124,152 | | | | 7,136,257 | | | | 1.40 | |
| Pacira Pharmaceuticals, Inc.* | | | 92,689 | | | | 8,235,417 | | | | 1.62 | |
| Valeant Pharmaceuticals International, Inc.* | | | 33,745 | | | | 6,702,432 | | | | 1.31 | |
| | | | | | | | 41,060,774 | | | | 8.05 | |
| Railroads | | | | | | | | | | | | |
| Canadian Pacific Railway Ltd. | | | 115,985 | | | | 21,190,459 | | | | 4.16 | |
| Union Pacific Corporation | | | 169,180 | | | | 18,323,886 | | | | 3.59 | |
| | | | | | | | 39,514,345 | | | | 7.75 | |
| Restaurants | | | | | | | | | | | | |
| Chipotle Mexican Grill, Inc.* | | | 4,008 | | | | 2,607,364 | | | | 0.51 | |
| Starbucks Corporation | | | 135,120 | | | | 12,795,864 | | | | 2.51 | |
| | | | | | | | 15,403,228 | | | | 3.02 | |
| Semiconductor Equipment | | | | | | | | | | | | |
| ASML Holding N.V. | | | 103,836 | | | | 10,490,551 | | | | 2.06 | |
| | | | | | | | | | | | | |
| Semiconductors | | | | | | | | | | | | |
| NXP Semiconductors N.V.* | | | 109,638 | | | | 11,003,270 | | | | 2.16 | |
| | | | | | | | | | | | | |
| Specialty Chemicals | | | | | | | | | | | | |
| The Sherwin-Williams Company | | | 58,245 | | | | 16,570,703 | | | | 3.25 | |
See notes to financial statements.
| | | Number
of
Shares | | | Value | | | Percent
of Net
Assets | |
COMMON STOCKS (continued) | | | | | | | |
| Technology Hardware, Storage & Peripherals | | | | |
| Apple, Inc. | | | 238,221 | | | $ | 29,641,839 | | | | 5.81 | % |
| | | | | | | | | | | | | |
| TOTAL COMMON STOCKS | | | | | | �� | | | | | | |
| (Cost $380,981,423) | | | | | | | 509,286,599 | | | | 99.83 | |
| | | | | | | | | | | | | |
| TOTAL INVESTMENTS | | | | | | | | | | | | |
| (Cost $380,981,423) | | | | | | | 509,286,599 | | | | 99.83 | |
| | | | | | | | | | | | | |
| Cash and Other Assets, Less Liabilities | | | | | | | 889,229 | | | | 0.17 | |
| | | | | | | | | | | | | |
| NET ASSETS | | | | | | $ | 510,175,828 | | | | 100.00 | % |
See notes to financial statements.
INVESTMENT REVIEW BY BRANDON GEISLER (UNAUDITED)
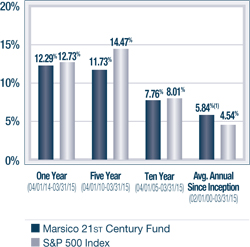
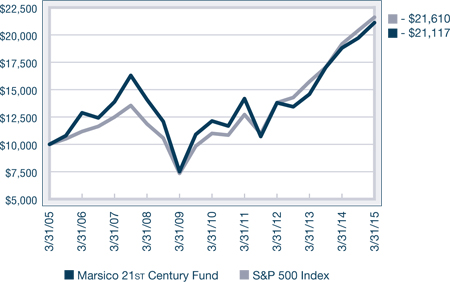
The Marsico 21st Century Fund posted a return of +7.13% for the six-month fiscal period ended March 31, 2015. The Fund outperformed the S&P 500 Index, which we consider to be the Fund’s primary benchmark index and which had a total return of +5.93% over the same time period. The Russell 3000 Index, a proxy for the performance of all publicly-traded US equity securities including smaller capitalization companies (which may be a useful comparison in light of the Fund’s ability to invest across the entire market capitalization spectrum), also had a total return of +7.13%. Please see the Fund Overview for more detailed information about the Fund’s longer-term performance for various time periods ended March 31, 2015.
The performance data for the Fund quoted here represent past performance, and past performance is not a guarantee of future results. Investment return and principal value of an investment will fluctuate so that an investor’s shares, when redeemed, may be worth more or less than their original cost. Current performance may be lower or higher than the performance information quoted. To obtain performance information current to the most recent month-end, please call 888-860-8686 or visit www.marsicofunds.com.(1)
This review highlights Fund performance over a six-month fiscal period. Shareholders should keep in mind that the Fund is intended for long-term investors who hold their shares for substantially longer periods of time. You should also keep in mind that our views and beliefs regarding all investments discussed in this report are subject to change at any time. References to specific securities, industries, and sectors discussed in this report are not recommendations to buy or sell such securities or related investments, and the Fund may not necessarily hold these securities or investments today. Please see the accompanying Schedule of Investments for the percentage of the Fund’s portfolio represented by the securities mentioned in this report as of the end of the reporting period.
The Fund is subject to broad risks associated with investing in equity securities markets generally, including the risks that the securities and markets in which it invests may experience volatility and instability, that domestic and global economies and markets may undergo periods of cyclical change and decline, that investors may at times avoid investments in equity securities, and that investments may not perform as anticipated. Please see the Prospectus for more information.
The Fund’s outperformance as compared to the S&P 500 Index for the six-month period ended March 31, 2015 was primarily attributable to stock selection in a few sectors and variations from certain benchmark sector weightings.
Consumer Discretionary and Health Care were the strongest-performing sectors of the benchmark S&P 500 Index, and Fund performance was aided by having overweight allocations to both sectors as compared to the benchmark index. Energy was the weakest-performing sector of the benchmark index and the Fund did well by selling its few investments in the Energy sector during the period.
Several holdings in the Information Technology sector contributed positively to performance. Video game software company Electronic Arts, Inc. (+34%) and online social networking service LinkedIn Corporation – Cl. A (+21%) posted sizeable stock price gains. Electronic Arts performed well due to strong sales of its games, and its growing online presence as new video game consoles make it more convenient for players to download video games online, rather than purchasing physical copies of game software. LinkedIn has benefitted from growth in the number of members using its services, and has improved its services for mobile devices. Semiconductor holdings NXP Semiconductors N.V. (+17%) and ARM Holdings PLC (+15%) also generated strong returns.
Stock selection in the Materials and Consumer Staples sectors was strong. The stock price of paint manufacturer The Sherwin-Williams Company rose +30%, aided by reports of stronger than expected sales from its stores. Constellation Brands, Inc. - Cl. A (+33%) experienced strong growth in the company’s beer segment, which includes the Corona and Modelo brands.
Other leading individual Fund holdings having a material, positive effect on performance included biotechnology positions Biogen Idec Inc. (+28%) and Alkermes PLC (+43%), media holding The Walt Disney Company (+19%) and consumer services positions Domino’s Pizza, Inc. (+32%) and Norwegian Cruise Line Holdings Ltd. (+16%).
While several of the Fund’s Health Care and Consumer Discretionary positions posted double-digit stock price gains, other Fund holdings within those sectors posted negative returns. In aggregate, the Fund’s stock selection in both sectors detracted from relative performance. More specifically, Health Care holdings Salix Pharmaceuticals Ltd. (-43% prior to being sold) and Gilead Sciences, Inc. (-7% prior to being sold) were significant detractors from performance. The Fund sold its position in Salix after the company announced inventory issues and cut its full year forecast. Wynn Resorts Ltd. (-31%) struggled as the Chinese government’s anti-corruption campaign contributed to weakness in Wynn’s Macau VIP gaming segment. Online travel review company TripAdvisor, Inc. posted a return of -23% prior to being sold from the Fund. The stock price of electric vehicle manufacturer Tesla Motors, Inc. fell -21% in conjunction with the decline in crude oil prices, as concerns rose that lower gas prices may reduce demand for fuel efficient cars. The Fund maintained its position in Tesla as we find the company’s innovative battery technology and new car models to be attractive long-term growth opportunities.
Stock selection in the Energy sector also detracted from performance. The Fund held only two holdings in the Energy sector – Schlumberger Ltd. and Antero Resources Corporation – during the reporting period. Both holdings were sold from the Fund during the period as our outlook for energy weakened. Schlumberger and Antero posted negative returns of -16% and -37%, respectively, prior to being sold from the Fund.
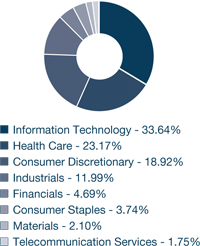
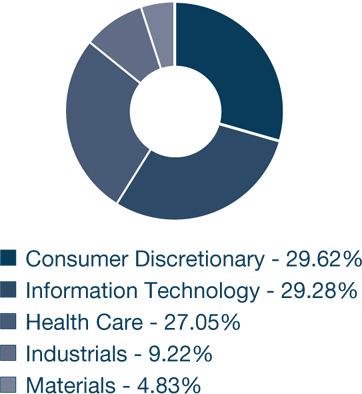
Other shifts in Fund positioning during the reporting period included trimming the Fund’s holdings in the Materials, Consumer Discretionary, and Industrials sectors. The Fund’s investments in the Information Technology and Health Care sectors were increased.
During the period, the Fund held securities of several medium-capitalization companies and a few small-capitalization firms. In aggregate, the Fund’s medium-capitalization holdings had a modest, positive contribution to performance as compared to the S&P 500 Index. The Fund’s small-capitalization holdings did not have a material impact on Fund performance.
The 21st Century Fund experienced moderately elevated portfolio turnover during the period, which primarily related to the Fund’s changing its portfolio composition to reinvest in other positions that we believe may have more upside potential and to take advantage of new opportunities. Portfolio turnover increases transaction-related expenses and could reduce Fund returns.
Fiscal Period-End Investment Posture
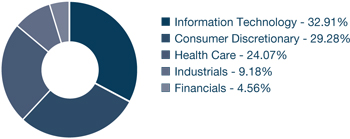
As of March 31, 2015, the Fund’s primary economic sector allocations included Information Technology, Health Care, Consumer Discretionary and Industrials. The Fund had no investments in the Energy or Utilities sectors at period-end.
Sincerely,
BRANDON A. GEISLER
PORTFOLIO MANAGER
| (1) | Total returns are based on net change in net asset value assuming reinvestment of distributions. For the period prior to March 31, 2004, the performance returns for the 21st Century Fund reflect a fee waiver in effect; in the absence of such a waiver, the returns would have been reduced. For the period from April 2004 through January 2005, performance returns for the 21st Century Fund would have been higher but for the reimbursement of fees waived previously. Please see the Prospectus for more information. |
21ST CENTURY FUND OVERVIEW |
March 31, 2015 (Unaudited)
The 21st Century Fund invests primarily in common stocks that are selected for their long-term growth potential. The Fund may invest in companies of any size, and will normally hold a core position of between 35 and 60 common stocks.
TOTAL ANNUAL OPERATING EXPENSES* 1.43% | NET ASSETS $313,690,602 | NET ASSET VALUE PER SHARE $22.39 |
GROWTH OF $10,000(1)(2) | PERFORMANCE COMPARISON |
|  |
SECTOR ALLOCATION(3) | TOP FIVE HOLDINGS |
 | | |
| FACEBOOK, INC. - CL. A | 5.55% |
| BIOGEN IDEC INC. | 5.02% |
| ACTAVIS PLC | 4.08% |
| THE WALT DISNEY COMPANY | 3.46% |
| CONSTELLATION BRANDS, INC. - CL. A | 3.29% |
| * | The Total Annual Operating Expenses are reflective of the information disclosed in the Funds’ Prospectus dated January 30, 2015 and may differ from the expense ratio disclosed in this report. |
The performance data quoted here represent past performance, and past performance is not a guarantee of future results. Investment return and principal value of an investment will fluctuate so that an investor’s shares, when redeemed, may be worth more or less than their original cost. Current performance may be lower or higher than the performance information quoted. To obtain performance information current to the most recent month-end, please call 888-860-8686 or visit www.marsicofunds.com.
The performance included in the chart and graph does not reflect the deduction of taxes on Fund distributions or the redemption of Fund shares.
All indices are unmanaged and investors cannot invest directly in an index.
| (1) | The performance returns for the 21st Century Fund (for the period prior to March 31, 2004) reflect a fee waiver in effect; in the absence of such a waiver, the returns would be reduced. For the period from April 2004 through January 2005, performance returns for the 21st Century Fund would be higher but for the reimbursement of fees waived previously. |
| (2) | This chart assumes an initial investment of $10,000 made on March 31, 2005. Total returns are based on net change in NAV, assuming reinvestment of distributions. |
| (3) | Sector weightings represent the percentage of the Fund’s investments (excluding cash equivalents) in certain general sectors. These sectors may include more than one industry. The Fund’s portfolio composition is subject to change at any time. |
MARSICO 21st CENTURY FUND
SCHEDULE OF INVESTMENTS
March 31, 2015 (Unaudited)
| | | Number
of
Shares | | | Value | | | Percent
of Net
Assets | |
| COMMON STOCKS | | | | | | | | | |
| Aerospace & Defense | | | | | | | | | |
| BE Aerospace, Inc. | | | 87,586 | | | $ | 5,572,221 | | | | 1.78 | % |
| Lockheed Martin Corporation | | | 34,190 | | | | 6,939,203 | | | | 2.21 | |
| The Boeing Company | | | 52,542 | | | | 7,885,503 | | | | 2.51 | |
| | | | | | | | 20,396,927 | | | | 6.50 | |
| Air Freight & Logistics | | | | | | | | | | | | |
| XPO Logistics, Inc.* | | | 33,811 | | | | 1,537,386 | | | | 0.49 | |
| | | | | | | | | | | | | |
| Airlines | | | | | | | | | | | | |
| Delta Air Lines, Inc. | | | 122,801 | | | | 5,521,133 | | | | 1.76 | |
| | | | | | | | | | | | | |
| Application Software | | | | | | | | | | | | |
| Mobileye N.V.* | | | 37,911 | | | | 1,593,399 | | | | 0.51 | |
| salesforce.com, inc.* | | | 121,469 | | | | 8,115,344 | | | | 2.59 | |
| | | | | | | | 9,708,743 | | | | 3.10 | |
| Automobile Manufacturers | | | | | | | | | | | | |
| Tesla Motors, Inc.* | | | 18,775 | | | | 3,544,157 | | | | 1.13 | |
| | | | | | | | | | | | | |
| Automotive Retail | | | | | | | | | | | | |
| O'Reilly Automotive, Inc.* | | | 18,461 | | | | 3,992,007 | | | | 1.27 | |
| | | | | | | | | | | | | |
| Biotechnology | | | | | | | | | | | | |
| Alkermes PLC* | | | 93,393 | | | | 5,694,171 | | | | 1.82 | |
| Biogen Idec Inc.* | | | 37,269 | | | | 15,736,463 | | | | 5.02 | |
| Juno Therapeutics, Inc.* | | | 31,289 | | | | 1,897,991 | | | | 0.61 | |
| Receptos, Inc.* | | | 10,736 | | | | 1,770,259 | | | | 0.56 | |
| Regeneron Pharmaceuticals, Inc.* | | | 11,773 | | | | 5,315,274 | | | | 1.69 | |
| | | | | | | | 30,414,158 | | | | 9.70 | |
| Cable & Satellite | | | | | | | | | | | | |
| Comcast Corporation - Cl. A | | | 135,281 | | | | 7,639,318 | | | | 2.44 | |
| | | | | | | | | | | | | |
| Casinos & Gaming | | | | | | | | | | | | |
| Wynn Resorts Ltd. | | | 25,803 | | | | 3,248,082 | | | | 1.04 | |
| | | | | | | | | | | | | |
| Communications Equipment | | | | | | | | | |
| Palo Alto Networks, Inc.* | | | 21,707 | | | | 3,170,959 | | | | 1.01 | |
| | | | | | | | | | | | | |
| Data Processing & Outsourced Services | | | | | |
| FleetCor Technologies, Inc.* | | | 52,253 | | | | 7,886,023 | | | | 2.51 | |
| MasterCard, Inc. - Cl. A | | | 100,228 | | | | 8,658,697 | | | | 2.76 | |
| | | | | | | | 16,544,720 | | | | 5.27 | |
| Distillers & Vintners | | | | | | | | | | | | |
| Constellation Brands, Inc. - Cl. A* | | | 88,936 | | | | 10,335,253 | | | | 3.29 | |
| | | | | | | | | | | | | |
| General Merchandise Stores | | | | | | | | | |
| Burlington Stores, Inc.* | | | 69,326 | | | | 4,119,351 | | | | 1.31 | |
| | | | | | | | | | | | | |
| Health Care Equipment | | | | | | | | | | | | |
| DexCom, Inc.* | | | 43,219 | | | | 2,694,272 | | | | 0.86 | |
| | | | | | | | | | | | | |
| Health Care Services | | | | | | | | | | | | |
| Envision Healthcare Holdings, Inc.* | | | 218,841 | | | | 8,392,552 | | | | 2.68 | |
| | | | | | | | | | | | | |
| Home Entertainment Software | | | | | | | | | |
| Electronic Arts, Inc.* | | | 138,663 | | | $ | 8,155,464 | | | | 2.60 | % |
| | | | | | | | | | | | | |
| Hotels, Resorts & Cruise Lines | | | | | | | | | |
| Norwegian Cruise Line Holdings Ltd.* | | | 179,247 | | | | 9,681,130 | | | | 3.09 | |
| | | | | | | | | | | | | |
| Internet Software & Services | | | | | | | | | |
| Alibaba Group Holding Ltd. Spon. ADR* | | | 83,920 | | | | 6,985,501 | | | | 2.23 | |
| CoStar Group, Inc.* | | | 19,256 | | | | 3,809,414 | | | | 1.21 | |
| Facebook, Inc. - Cl. A* | | | 211,889 | | | | 17,420,454 | | | | 5.55 | |
| LinkedIn Corporation - Cl. A* | | | 33,223 | | | | 8,301,099 | | | | 2.65 | |
| | | | | | | | 36,516,468 | | | | 11.64 | |
| Investment Banking & Brokerage | | | | | | | | | |
| Morgan Stanley | | | 134,517 | | | | 4,800,912 | | | | 1.53 | |
| The Charles Schwab Corporation | | | 171,335 | | | | 5,215,437 | | | | 1.66 | |
| | | | | | | | 10,016,349 | | | | 3.19 | |
| Life Sciences Tools & Services | | | | | | | | | |
| Illumina, Inc.* | | | 24,609 | | | | 4,568,415 | | | | 1.46 | |
| | | | | | | | | | | | | |
| Movies & Entertainment | | | | | | | | | | | | |
| The Walt Disney Company | | | 103,409 | | | | 10,846,570 | | | | 3.46 | |
| Time Warner, Inc. | | | 91,398 | | | | 7,717,647 | | | | 2.46 | |
| | | | | | | | 18,564,217 | | | | 5.92 | |
| Packaged Foods & Meats | | | | | | | | | | | | |
| Keurig Green Mountain, Inc. | | | 10,702 | | | | 1,195,734 | | | | 0.38 | |
| | | | | | | | | | | | | |
| Pharmaceuticals | | | | | | | | | | | | |
| Actavis PLC* | | | 42,983 | | | | 12,792,601 | | | | 4.08 | |
| Endo International PLC* | | | 87,798 | | | | 7,875,481 | | | | 2.51 | |
| Merck & Co., Inc. | | | 81,653 | | | | 4,693,414 | | | | 1.49 | |
| | | | | | | | 25,361,496 | | | | 8.08 | |
| Railroads | | | | | | | | | | | | |
| Genesee & Wyoming, Inc. - Cl. A* | | | 52,688 | | | | 5,081,231 | | | | 1.62 | |
| Union Pacific Corporation | | | 41,041 | | | | 4,445,150 | | | | 1.42 | |
| | | | | | | | 9,526,381 | | | | 3.04 | |
| Regional Banks | | | | | | | | | | | | |
| First Republic Bank | | | 77,654 | | | | 4,433,267 | | | | 1.41 | |
| | | | | | | | | | | | | |
| Restaurants | | | | | | | | | | | | |
| Domino's Pizza, Inc. | | | 51,876 | | | | 5,216,132 | | | | 1.66 | |
| Popeyes Louisiana Kitchen, Inc.* | | | 38,617 | | | | 2,310,069 | | | | 0.74 | |
| | | | | | | | 7,526,201 | | | | 2.40 | |
| Semiconductor Equipment | | | | | | | | | | | | |
| ASML Holding N.V. | | | 56,211 | | | | 5,678,997 | | | | 1.81 | |
| | | | | | | | | | | | | |
| Semiconductors | | | | | | | | | | | | |
| ARM Holdings PLC | | | 291,916 | | | | 4,784,962 | | | | 1.52 | |
| NXP Semiconductors N.V.* | | | 97,465 | | | | 9,781,587 | | | | 3.12 | |
| | | | | | | | 14,566,549 | | | | 4.64 | |
| Specialty Chemicals | | | | | | | | | | | | |
| The Sherwin-Williams Company | | | 22,718 | | | | 6,463,271 | | | | 2.06 | |
See notes to financial statements.
MARSICO 21st CENTURY FUND
SCHEDULE OF INVESTMENTS (continued)
March 31, 2015 (Unaudited)
| | | Number
of
Shares | | | Value | | | Percent
of Net
Assets | |
COMMON STOCKS (continued) | | | | | | | |
| Technology Hardware, Storage & Peripherals | | | | |
| Apple, Inc. | | | 75,337 | | | $ | 9,374,183 | | | | 2.99 | % |
| | | | | | | | | | | | | |
| Wireless Telecommunication Services | | | | | |
| SBA Communications Corporation - Cl. A* | | | 46,015 | | | | 5,388,357 | | | | 1.72 | |
| | | | | | | | | | | | | |
| TOTAL COMMON STOCKS | | | | | | | | | | | | |
| (Cost $235,115,567) | | | | | | | 308,275,497 | | | | 98.28 | |
| | | | | | | | | | | | | |
| SHORT-TERM INVESTMENTS | | | | | | | | | |
| State Street Institutional Treasury Money Market Fund, 0.000% | | | 6,883,277 | | | | 6,883,277 | | | | 2.19 | |
| | | | | | | | | | | | | |
| TOTAL SHORT-TERM INVESTMENTS | | | | | | | | | |
| (Cost $6,883,277) | | | | | | | 6,883,277 | | | | 2.19 | |
| | | | | | | | | | | | | |
| TOTAL INVESTMENTS | | | | | | | | | | | | |
| (Cost $241,998,844) | | | | | | | 315,158,774 | | | | 100.47 | |
| | | | | | | | | | | | | |
| Liabilities, Less Cash and Other Assets | | | | | | | (1,468,172 | ) | | | (0.47 | ) |
| | | | | | | | | | | | | |
| NET ASSETS | | | | | | $ | 313,690,602 | | | | 100.00 | % |
See notes to financial statements.
| INTERNATIONAL OPPORTUNITIES FUND |
INVESTMENT REVIEW BY MUNISH MALHOTRA (UNAUDITED)
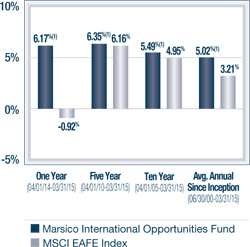
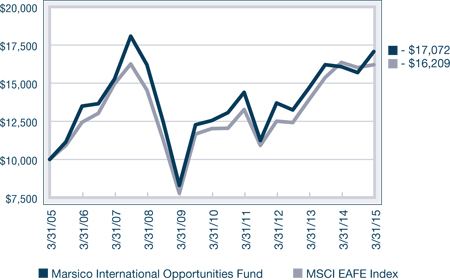
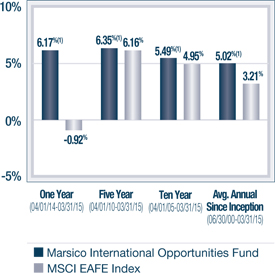
The Marsico International Opportunities Fund posted a total return of (US$) +8.76% for the six-month fiscal period ended March 31, 2015. The Fund significantly outperformed the MSCI EAFE Index, which we consider to be the Fund’s benchmark index and which had a total return of (US$) +1.13% over the same time period. Please see the Fund Overview for more detailed information about the Fund’s longer-term performance for various time periods ended March 31, 2015.
The performance data for the Fund quoted here represent past performance, and past performance is not a guarantee of future results. Investment return and principal value of an investment will fluctuate so that an investor’s shares, when redeemed, may be worth more or less than their original cost. Current performance may be lower or higher than the performance information quoted. To obtain performance information current to the most recent month-end, please call 888-860-8686 or visit www.marsicofunds.com.(1)
This review highlights Fund performance over a six-month fiscal period. Shareholders should keep in mind that the Fund is intended for long-term investors who hold their shares for substantially longer periods of time. You should also keep in mind that our views and beliefs regarding all investments discussed in this report are subject to change at any time. References to specific securities, industries, and sectors discussed in this report are not recommendations to buy or sell such securities or related investments, and the Fund may not necessarily hold these securities or investments today. Please see the accompanying Schedule of Investments for the percentage of the Fund’s portfolio represented by the securities mentioned in this report as of the end of the reporting period.
Foreign investments present additional risks due to currency fluctuations, economic and political factors, lower liquidity, differences in securities regulations and accounting standards, possible changes in taxation, limited public information, and other factors. In addition, the Fund is subject to broad risks associated with investing in equity securities markets generally, including the risks that the securities and markets in which it invests may experience volatility and instability, that domestic and global economies and markets may undergo periods of cyclical change and decline, that investors may at times avoid investments in equity securities, and that investments may not perform as anticipated. Please see the Prospectus for more information.
Certain individual Fund holdings had a material, positive effect on performance. Consumer services holdings Domino’s Pizza Group PLC (+27%), Domino’s Pizza Enterprises Ltd. (+14%) and Norwegian Cruise Line Holdings Ltd. (+23%) each benefitted the Fund’s performance. Pizza delivery is a growing franchise business in overseas markets such as the United Kingdom and Australia – markets in which Domino’s Pizza Group and Domino’s Pizza Enterprises, respectively, operate.
The Fund maintained significant investments in the Pharmaceuticals Biotechnology and Life Sciences industry given the paradigm shift that we saw occurring within the industry. Fund holdings Alkermes PLC (+40%), Valeant Pharmaceuticals International, Inc. (+23%), and Endo International PLC (+21%) each posted strong gains during the reporting period.
Other strong-performing Fund holdings included media position Liberty Global PLC - Series C (+21%) and semiconductor positions Infineon Technologies AG (+19%) and NXP Semiconductors N.V. (+27%).
Although active currency management is not a central facet of the Fund’s investment process, fluctuations in major world currencies can at times affect the Fund’s performance. During the period, the net effect of currency moves was positive for the Fund. The Fund did well as compared to the benchmark index by having greater exposure to securities denominated in the US dollar (which strengthened versus most major world currencies), and the Chinese yuan, which is roughly pegged to the US dollar. Additionally, the Fund’s results were positively affected by having an underweight allocation, as compared to the MSCI EAFE Index, to investments denominated in the euro, which weakened during the period.
From a sector allocation perspective, the Fund benefitted as compared to its benchmark index by having overweight allocations to the strong-performing Information Technology and Consumer Discretionary sectors, while being underweight the weak-performing Energy sector.
| INTERNATIONAL OPPORTUNITIES FUND |
Stock selection in the Consumer Discretionary and Industrials sectors detracted from Fund performance. While a few of the Fund’s Consumer Discretionary holdings posted strong returns, which are discussed in more detail above, other holdings within the sector posted weak returns. In particular, the Fund’s investments in Chinese casino resorts detracted from performance as Wynn Macau Ltd. (-19%) and MGM China Holdings Ltd. (-17% prior to being sold) posted steep losses. Both companies’ results were negatively affected by the Chinese government’s efforts to reduce corruption, as fewer high rollers visited Macau’s casinos.
Within the Industrials sector, Canadian Pacific Railway Ltd. (-12%) was a drag on Fund performance results. Although lower energy prices were an overhang for the railroad operator, we continued to maintain the Fund’s position. A sizeable portion of Canadian Pacific’s crude oil business is sourced from western Canada in projects that we believe are likely to produce oil for shipment by rail even in a lower oil price environment.
Other holdings having a material, negative effect on performance included biotechnology position UCB S.A. (-19%) and Micron Technology, Inc. (-23% prior to being sold). UCB’s stock price declined, in part, on lower 2015 earnings guidance. We maintained a position in UCB, as we find its pipeline of new drugs, which includes treatments for epilepsy and arthritis, to be attractive. Micron Technology’s stock price slumped on softer pricing trends and increased inventory for its memory chips. The Fund sold its position in Micron late in the reporting period.
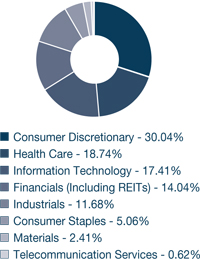
During the period, the Fund increased its allocations to the Consumer Discretionary, Health Care and Information Technology sectors. The Fund sold its few Energy positions and reduced its allocation to the Industrials sector.
The International Opportunities Fund experienced elevated portfolio turnover during the period, which primarily related to the Fund’s changing its portfolio composition to reinvest in other positions that we believe may have more upside potential and to take advantage of new opportunities. Portfolio turnover increases transaction-related expenses and could reduce Fund returns.
Fiscal Period-End Investment Posture
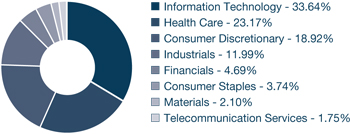
As of March 31, 2015, the Fund’s primary economic sector allocations included Information Technology, Consumer Discretionary, Health Care, and Industrials. The Fund had no exposure to the Energy, Consumer Staples, Utilities, Telecommunication Services, and Materials sectors at period-end.
In terms of country allocations, the Fund’s most significant weightings at period-end, excluding short-term investments, were the United Kingdom, Canada, China/Hong Kong, the United States, and the Netherlands. The Fund’s United States holdings primarily comprised multi-national companies. Country-level weightings generally should be considered a residual of the Fund’s stock selection process rather than a major, proactive facet of its investment strategy.
Sincerely,
MUNISH MALHOTRA, CFA
PORTFOLIO MANAGER
| (1) | Total returns are based on net change in net asset value assuming reinvestment of distributions. For the periods prior to September 30, 2004, from October 2011 through December 2013, and from October 2014 through March 2015, the performance returns for the International Opportunities Fund reflect a fee waiver in effect; in the absence of such a waiver, the returns would have been reduced. For the periods from October 2004 through December 2005 and from January 2014 through September 2014, performance returns for the International Opportunities Fund would have been higher but for the reimbursement of fees waived previously. Please see the Prospectus for more information. |
| INTERNATIONAL OPPORTUNITIES FUND OVERVIEW |
March 31, 2015 (Unaudited)
The International Opportunities Fund invests primarily in common stocks of foreign companies that are selected for their long-term growth potential. The Fund may invest in an unlimited number of companies of any size throughout the world. It normally invests in the securities of issuers that are economically tied to one or more foreign countries, and expects to be invested in various issuers or securities that together have ties to at least four different foreign countries. Some issuers or securities in the Fund’s portfolio may be based in or economically tied to the United States or to emerging markets.
TOTAL ANNUAL OPERATING EXPENSES* NET EXPENSES*† | 1.69%1.60% | NET ASSETS $102,869,841 | NET ASSET VALUE PER SHARE $16.01 |
GROWTH OF $10,000(1)(2) | PERFORMANCE COMPARISON |
|  |
SECTOR ALLOCATION(3) | TOP FIVE HOLDINGS |
 | | |
| LIBERTY GLOBAL PLC - SERIES C | 5.91% |
| TENCENT HOLDINGS LTD. | 5.51% |
| ENDO INTERNATIONAL PLC | 4.16% |
| ALIBABA GROUP HOLDING LTD. SPON. ADR | 4.16% |
| NXP SEMICONDUCTORS N.V. | 4.09% |
| * | The Total Annual Operating Expenses and Net Expenses are reflective of the information disclosed in the Funds’ Prospectus dated January 30, 2015 and may differ from the expense ratios disclosed in this report. |
| † | Marsico Capital Management, LLC (the “Adviser”) has entered into a written expense limitation and fee waiver agreement under which it has agreed to limit the total expenses of the International Opportunities Fund (excluding interest, taxes, acquired fund fees and expenses, litigation, brokerage and extraordinary expenses) to an annual rate of 1.60% of the Fund’s average net assets until January 31, 2016. This expense limitation and fee waiver agreement may be terminated by the Adviser at any time after January 31, 2016, upon 15 days prior notice to the Fund and its administrator. The Adviser may recoup from the Fund fees previously waived or expenses previously reimbursed by the Adviser with respect to the Fund pursuant to this agreement (or a previous expense limitation agreement) if: (1) such recoupment by the Adviser does not cause the Fund, at the time of recoupment, to exceed the lesser of (a) the expense limitation in effect at the time the relevant amount was waived and/or reimbursed, or (b) the expense limitation in effect at the time of the proposed recoupment, and (2) the recoupment is made within three fiscal years after the end of the fiscal year in which the amount was waived or reimbursed. |
The performance data quoted here represent past performance, and past performance is not a guarantee of future results. Investment return and principal value of an investment will fluctuate so that an investor’s shares, when redeemed, may be worth more or less than their original cost. Current performance may be lower or higher than the performance information quoted. To obtain performance information current to the most recent month-end, please call 888-860-8686 or visit www.marsicofunds.com.
The performance included in the chart and graph does not reflect the deduction of taxes on Fund distributions or the redemption of Fund shares.
All indices are unmanaged and investors cannot invest directly in an index.
| (1) | The performance returns for the International Opportunities Fund (for the periods prior to September 30, 2004, from October 2011 through December 2013 and from October 2014 through March 2015) reflect a fee waiver in effect; in the absence of such a waiver, the returns would be reduced. For the periods from October 2004 through December 2005 and from January 2014 through September 2014, performance returns for the International Opportunities Fund would be higher but for the reimbursement of fees waived previously. |
| (2) | This chart assumes an initial investment of $10,000 made on March 31, 2005. Total returns are based on net change in NAV, assuming reinvestment of distributions. |
| (3) | Sector weightings represent the percentage of the Fund’s investments (excluding cash equivalents) in certain general sectors. These sectors may include more than one industry. The Fund’s portfolio composition is subject to change at any time. |
The MSCI EAFE Index tracks the stocks of about 1,000 companies in Europe, Australasia, and the Far East (EAFE).
MARSICO INTERNATIONAL OPPORTUNITIES FUND
SCHEDULE OF INVESTMENTS
March 31, 2015 (Unaudited)
| | | Number
of
Shares | | | Value | | | Percent
of Net
Assets | |
| COMMON STOCKS | | | | | | | | | |
| Airlines | | | | | | | | | |
| Ryanair Holdings PLC Spon. ADR | | | 48,477 | | | $ | 3,236,809 | | | | 3.15 | % |
| | | | | | | | | | | | | |
| Apparel, Accessories & Luxury Goods | | | | | |
| Gildan Activewear, Inc. | | | 68,600 | | | | 2,022,442 | | | | 1.97 | |
| | | | | | | | | | | | | |
| Application Software | | | | | | | | | | | | |
| Constellation Software, Inc. | | | 3,620 | | | | 1,251,187 | | | | 1.22 | |
| | | | | | | | | | | | | |
| Asset Management & Custody Banks | | | | | |
| Hargreaves Lansdown PLC | | | 180,808 | | | | 3,089,786 | | | | 3.00 | |
| Partners Group Holding A.G. | | | 5,097 | | | | 1,523,645 | | | | 1.48 | |
| | | | | | | | 4,613,431 | | | | 4.48 | |
| Automobile Manufacturers | | | | | | | | | | | | |
| Bayerische Motoren Werke AG | | | 22,623 | | | | 2,832,692 | | | | 2.75 | |
| Tata Motors Ltd. ADR | | | 42,169 | | | | 1,900,135 | | | | 1.85 | |
| | | | | | | | 4,732,827 | | | | 4.60 | |
| Biotechnology | | | | | | | | | | | | |
| Alkermes PLC* | | | 34,295 | | | | 2,090,966 | | | | 2.03 | |
| | | | | | | | | | | | | |
| Cable & Satellite | | | | | | | | | | | | |
| Liberty Global PLC - Series C* | | | 122,021 | | | | 6,077,866 | | | | 5.91 | |
| | | | | | | | | | | | | |
| Casinos & Gaming | | | | | | | | | | | | |
| Wynn Macau Ltd. | | | 454,000 | | | | 984,990 | | | | 0.96 | |
| | | | | | | | | | | | | |
| Data Processing & Outsourced Services | | | | | |
| MasterCard, Inc. - Cl. A | | | 34,504 | | | | 2,980,801 | | | | 2.90 | |
| | | | | | | | | | | | | |
| Health Care Equipment | | | | | | | | | | | | |
| Novadaq Technologies, Inc.* | | | 109,374 | | | | 1,776,234 | | | | 1.73 | |
| | | | | | | | | | | | | |
| Hotels, Resorts & Cruise Lines | | | | | | | | | |
| Norwegian Cruise Line Holdings Ltd.* | | | 68,393 | | | | 3,693,906 | | | | 3.59 | |
| | | | | | | | | | | | | |
| Industrial Machinery | | | | | | | | | | | | |
| FANUC Corporation | | | 9,400 | | | | 2,057,364 | | | | 2.00 | |
| | | | | | | | | | | | | |
| Internet Retail | | | | | | | | | | | | |
| ASOS PLC* | | | 31,276 | | | | 1,683,668 | | | | 1.63 | |
| Start Today Company Ltd. | | | 63,800 | | | | 1,683,637 | | | | 1.64 | |
| | | | | | | | 3,367,305 | | | | 3.27 | |
| Internet Software & Services | | | | | | | | | |
| Alibaba Group Holding Ltd. Spon. ADR* | | | 51,358 | | | | 4,275,040 | | | | 4.16 | |
| Auto Trader Group PLC* | | | 255,174 | | | | 952,937 | | | | 0.93 | |
| Baidu, Inc. Spon. ADR* | | | 20,155 | | | | 4,200,302 | | | | 4.08 | |
| Tencent Holdings Ltd. | | | 298,400 | | | | 5,669,587 | | | | 5.51 | |
| | | | | | | | 15,097,866 | | | | 14.68 | |
| | | | | | | | | | | | | |
| Pharmaceuticals | | | | | | | | | | | | |
| Actavis PLC* | | | 13,106 | | | $ | 3,900,608 | | | | 3.79 | % |
| Endo International PLC* | | | 47,701 | | | | 4,278,780 | | | | 4.16 | |
| Novartis AG | | | 21,050 | | | | 2,082,689 | | | | 2.03 | |
| Novo Nordisk A/S - Cl. B | | | 37,907 | | | | 2,029,373 | | | | 1.97 | |
| Ono Pharmaceutical Company Ltd. | | | 17,900 | | | | 2,026,781 | | | | 1.97 | |
| UCB S.A. | | | 28,756 | | | | 2,082,455 | | | | 2.02 | |
| Valeant Pharmaceuticals International, Inc.* | | | 20,735 | | | | 4,096,249 | | | | 3.98 | |
| | | | | | | | 20,496,935 | | | | 19.92 | |
| Railroads | | | | | | | | | | | | |
| Canadian Pacific Railway Ltd. | | | 21,864 | | | | 4,003,207 | | | | 3.89 | |
| | | | | | | | | | | | | |
| Restaurants | | | | | | | | | | | | |
| Domino's Pizza Enterprises Ltd. | | | 99,295 | | | | 2,811,094 | | | | 2.73 | |
| Domino's Pizza Group PLC | | | 296,751 | | | | 3,413,754 | | | | 3.32 | |
| Restaurant Brands International, Inc. | | | 66,047 | | | | 2,532,267 | | | | 2.46 | |
| | | | | | | | 8,757,115 | | | | 8.51 | |
| Semiconductor Equipment | | | | | | | | | | | | |
| ASML Holding N.V. | | | 37,436 | | | | 3,815,589 | | | | 3.71 | |
| | | | | | | | | | | | | |
| Semiconductors | | | | | | | | | | | | |
| ARM Holdings PLC | | | 171,385 | | | | 2,809,269 | | | | 2.73 | |
| Infineon Technologies AG | | | 262,866 | | | | 3,145,858 | | | | 3.06 | |
| NXP Semiconductors N.V.* | | | 41,927 | | | | 4,207,794 | | | | 4.09 | |
| | | | | | | | 10,162,921 | | | | 9.88 | |
| TOTAL COMMON STOCKS | | | | | | | | | | | | |
| (Cost $85,526,948) | | | | | | | 101,219,761 | | | | 98.40 | |
| | | | | | | | | | | | | |
| SHORT-TERM INVESTMENTS | | | | | | | | | |
| State Street Institutional Treasury Money Market Fund, 0.000% | | | 319,473 | | | | 319,473 | | | | 0.31 | |
| | | | | | | | | | | | | |
| TOTAL SHORT-TERM INVESTMENTS | | | | | | | | | |
| (Cost $319,473) | | | | | | | 319,473 | | | | 0.31 | |
| | | | | | | | | | | | | |
| TOTAL INVESTMENTS | | | | | | | | | | | | |
| (Cost $85,846,421) | | | | | | | 101,539,234 | | | | 98.71 | |
| | | | | | | | | | | | | |
| Cash and Other Assets, Less Liabilities | | | | | | | 1,330,607 | | | | 1.29 | |
| | | | | | | | | | | | | |
| NET ASSETS | | | | | | $ | 102,869,841 | | | | 100.00 | % |
See notes to financial statements.
| SUMMARY OF INVESTMENTS BY COUNTRY | |
| Country | | Market Value | | | Percent of
Investment
Securities | |
| Australia | | $ | 2,811,094 | | | | 2.77 | % |
| Belgium | | | 2,082,455 | | | | 2.05 | |
| Canada | | | 15,681,586 | | | | 15.44 | |
| China/Hong Kong | | | 15,129,919 | | | | 14.90 | |
| Denmark | | | 2,029,373 | | | | 2.00 | |
| Germany | | | 5,978,550 | | | | 5.89 | |
| India | | | 1,900,135 | | | | 1.87 | |
| Ireland | | | 5,327,775 | | | | 5.25 | |
| Japan | | | 5,767,782 | | | | 5.68 | |
| Netherlands | | | 8,023,383 | | | | 7.90 | |
| Switzerland | | | 3,606,334 | | | | 3.55 | |
| United Kingdom | | | 18,027,280 | | | | 17.75 | |
United States(1) | | | 15,173,568 | | | | 14.95 | |
| | | $ | 101,539,234 | | | | 100.00 | % |
| (1) | Includes short-term securities. |
See notes to financial statements.
INVESTMENT REVIEW BY MUNISH MALHOTRA AND JORDON LAYCOB (UNAUDITED)
The Marsico Flexible Capital Fund posted a total return of +6.37% for the six-month fiscal period ended March 31, 2015. The Fund outperformed the S&P 500 Index, which we consider to be the Fund’s benchmark index and which had a total return of +5.93% over the same time period. Please see the Fund Overview for more detailed information about the Fund’s performance for various time periods ended March 31, 2015.
The performance data for the Fund quoted here represent past performance, and past performance is not a guarantee of future results. Investment return and principal value of an investment will fluctuate so that an investor’s shares, when redeemed, may be worth more or less than their original cost. Current performance may be lower or higher than the performance information quoted. To obtain performance information current to the most recent month-end, please call 888-860-8686 or visit www.marsicofunds.com.(1)
This review highlights Fund performance over a six-month fiscal period. Shareholders should keep in mind that the Fund is intended for long-term investors who hold their shares for substantially longer periods of time. You should also keep in mind that our views and beliefs regarding all investments discussed in this report are subject to change at any time. References to specific securities, industries, and sectors discussed in this report are not recommendations to buy or sell such securities or related investments, and the Fund may not necessarily hold these securities or investments today. Please see the accompanying Schedule of Investments for the percentage of the Fund’s portfolio represented by the securities mentioned in this report as of the end of the reporting period.
The Fund is subject to broad risks associated with investing in equity securities markets generally, including the risks that the securities and markets in which it invests may experience volatility and instability, that domestic and global economies and markets may undergo periods of cyclical change and decline, that investors may at times avoid investments in equity securities, and that investments may not perform as anticipated. Please see the Prospectus for more information.
Sector allocations contributed positively to the Fund’s performance for the six-month period ended March 31, 2015. Energy was the weakest-performing sector of the S&P 500 Index, registering a return of -13% during the period. The Fund benefitted relative to its benchmark from having an underweight allocation to the sector and from selling its sole, small holding within the Energy sector during the first half of the reporting period, as oil prices further declined. Throughout the period, the Fund’s exposure to the Consumer Discretionary sector was more than twice that of its benchmark. This positioning aided relative performance, as Consumer Discretionary was a strong-performing sector of the benchmark index garnering a return of nearly +14%.
Stock selection in the Consumer Staples sector was another primary area of strength. Constellation Brands, Inc. - Cl. A posted a return of +33% after reporting solid growth in the company’s beer segment, which includes the Corona and Modelo brands. Coffee brewer manufacturer Keurig Green Mountain, Inc.’s stock price rose +13% and was sold from the Fund after the company benefitted from several key growth catalysts.
Within the Consumer Discretionary sector, media companies Liberty Global PLC - Series C (+21%) and The Walt Disney Company (+19%) each were material, positive contributors to performance. Liberty Global, the largest international cable television company, reported robust growth in its European broadband business. Walt Disney experienced strong revenue growth in its studio and consumer products businesses, driven by the continued success of its animated film, Frozen. Other strong-performing holdings in the Consumer Discretionary sector included home improvement retailer Lowe’s Companies, Inc. (+42%) and United Kingdom-based pizza master-franchise company Domino’s Pizza Group PLC (+27%).
While those Consumer Discretionary holdings performed well, the overall stock selection effect of the Fund’s Consumer Discretionary holdings was negative. Most notably, casino operator Wynn Resorts Ltd.’s stock price slid -31% during the period and was the largest individual detractor from the Fund’s return. Wynn Resorts has substantial operations in Macau. The company’s stock price struggled as the Chinese government’s anti-corruption campaign contributed to weakness in Macau’s VIP gaming segment.
Performance in the Information Technology sector was mixed. Financial transaction processor Visa, Inc. – Cl. A soared +23%. Visa’s stock price gain was largely attributable to the company’s strong revenue growth, accelerating cross-border volumes, and lower than expected operating expenses. Internet services company Google, Inc. – Cl. A (-9% prior to being sold) and Chinese ecommerce company Alibaba Group Holding Ltd. Spon. ADR (-6%), however, posted negative returns during the period.
Stock selection in the Health Care sector also detracted from Fund performance. Biotechnology holding Gilead Sciences, Inc. declined -8% during the period. Gilead’s stock price slid in late 2014 after a competitor announced an agreement with a large pharmacy benefit management company to provide a lower cost treatment for the most common form of hepatitis C, genotype 1. Online travel reservations company The Priceline Group, Inc. and hospitality company Hilton Worldwide Holdings, Inc. struggled on uncertainties around foreign currency moves and related impacts on revenues for global travel service providers. Both Priceline and Hilton were sold from the Fund during the period after their stock prices declined -12% and -7%, respectively.
The Fund reduced its investments in the Consumer Discretionary and Materials sectors and sold its holding in the Energy sector during the period. The Fund’s allocations to the Health Care, Financials, and Industrials sectors increased. The Fund also held several investments in fixed-income securities that we believed to offer equity-like return potential. The Fund’s fixed-income holdings did not substantially affect performance during the period.
Fiscal Period-End Investment Posture
As of period-end, the Fund’s primary economic sector allocations included Consumer Discretionary, Health Care, Information Technology, Financials, and Industrials. At period-end, the Fund had no exposure to the Energy and Utilities sectors.
Sincerely,
MUNISH MALHOTRA, CFA
JORDON S. LAYCOB
PORTFOLIO MANAGERS
| (1) | Total returns are based on net change in net asset value assuming reinvestment of distributions. For the period prior to February 1, 2011, the performance returns for the Flexible Capital Fund reflect a fee waiver in effect; in the absence of such a waiver, the returns would have been reduced. Please see the Prospectus for more information. |
| FLEXIBLE CAPITAL FUND OVERVIEW |
March 31, 2015 (Unaudited)
The Flexible Capital Fund invests primarily in equity securities and other investments that are selected primarily for their long-term growth potential. The Fund may invest in issuers of any size throughout the world, and will normally hold a core position of between 20 and 50 securities or other investments.
TOTAL ANNUAL OPERATING EXPENSES* 1.39% | NET ASSETS $697,630,248 | NET ASSET VALUE PER SHARE $17.79 |
GROWTH OF $10,000(1)(2) | PERFORMANCE COMPARISON |
|  |
SECTOR ALLOCATION(3) | TOP FIVE HOLDINGS |
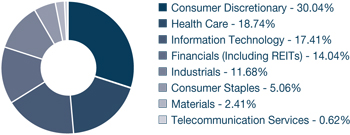 | | |
| CONSTELLATION BRANDS, INC. - CL. A | 4.83% |
| LOWE'S COMPANIES, INC. | 4.59% |
| LIBERTY GLOBAL PLC - SERIES C | 4.27% |
| FACEBOOK, INC. - CL. A | 4.23% |
| VISA, INC. - CL. A | 4.04% |
| * | The Total Annual Operating Expenses are reflective of the information disclosed in the Funds’ Prospectus dated January 30, 2015 and may differ from the expense ratio disclosed in this report. |
The performance data quoted here represent past performance, and past performance is not a guarantee of future results. Investment return and principal value of an investment will fluctuate so that an investor’s shares, when redeemed, may be worth more or less than their original cost. Current performance may be lower or higher than the performance information quoted. To obtain performance information current to the most recent month-end, please call 888-860-8686 or visit www.marsicofunds.com.
The performance included in the chart and graph does not reflect the deduction of taxes on Fund distributions or the redemption of Fund shares.
All indices are unmanaged and investors cannot invest directly in an index.
| (1) | The performance returns for the Flexible Capital Fund (for the period prior to February 1, 2011) reflect a fee waiver in effect; in the absence of such a waiver, the returns would be reduced. |
| (2) | This chart assumes an initial investment of $10,000 made on December 29, 2006 (inception). Total returns are based on change in NAV, assuming reinvestment of distributions. |
| (3) | Sector weightings represent the percentage of the Fund’s investments (excluding cash equivalents) in certain general sectors. These sectors may include more than one industry. The Fund’s portfolio composition is subject to change at any time. |
MARSICO FLEXIBLE CAPITAL FUND
SCHEDULE OF INVESTMENTS
March 31, 2015 (Unaudited)
| | | Number
of
Shares | | | Value | | | Percent
of Net
Assets | |
| COMMON STOCKS | | | | | | | | | |
| Aerospace & Defense | | | | | | | | | |
| BAE Systems PLC | | | 2,577,596 | | | $ | 20,016,577 | | | | 2.87 | % |
| | | | | | | | | | | | | |
| Automotive Retail | | | | | | | | | | | | |
| O'Reilly Automotive, Inc.* | | | 50,782 | | | | 10,981,100 | | | | 1.57 | |
| | | | | | | | | | | | | |
| Biotechnology | | | | | | | | | | | | |
| Biogen Idec Inc.* | | | 62,706 | | | | 26,476,982 | | | | 3.79 | |
| Gilead Sciences, Inc.* | | | 214,448 | | | | 21,043,782 | | | | 3.02 | |
| | | | | | | | 47,520,764 | | | | 6.81 | |
| Broadcasting | | | | | | | | | | | | |
| CBS Corporation - Cl. B | | | 347,154 | | | | 21,047,947 | | | | 3.02 | |
| | | | | | | | | | | | | |
| Cable & Satellite | | | | | | | | | | | | |
| Liberty Global PLC - Series C* | | | 597,687 | | | | 29,770,789 | | | | 4.27 | |
| | | | | | | | | | | | | |
| Casinos & Gaming | | | | | | | | | | | | |
| Wynn Resorts Ltd. | | | 110,041 | | | | 13,851,961 | | | | 1.99 | |
| | | | | | | | | | | | | |
| Construction & Engineering | | | | | | | | | |
| Louis XIII Holdings Ltd.* | | | 11,995,000 | | | | 4,502,390 | | | | 0.65 | |
| | | | | | | | | | | | | |
| Data Processing & Outsourced Services | | | | | |
| Visa, Inc. - Cl. A | | | 431,058 | | | | 28,195,504 | | | | 4.04 | |
| | | | | | | | | | | | | |
| Distillers & Vintners | | | | | | | | | | | | |
| Constellation Brands, Inc. - Cl. A* | | | 290,184 | | | | 33,722,283 | | | | 4.83 | |
| | | | | | | | | | | | | |
| Diversified Banks | | | | | | | | | | | | |
| Citigroup, Inc. | | | 453,357 | | | | 23,356,953 | | | | 3.35 | |
| | | | | | | | | | | | | |
| Fertilizers & Agricultural Chemicals | | | | | | | | | |
| Monsanto Company | | | 90,709 | | | | 10,208,391 | | | | 1.46 | |
| | | | | | | | | | | | | |
| Health Care Equipment | | | | | | | | | | | | |
| Medtronic, Inc. | | | 288,473 | | | | 22,498,009 | | | | 3.22 | |
| | | | | | | | | | | | | |
| Health Care Services | | | | | | | | | | | | |
| Envision Healthcare Holdings, Inc.* | | | 501,570 | | | | 19,235,209 | | | | 2.76 | |
| | | | | | | | | | | | | |
| Home Improvement Retail | | | | | | | | | | | | |
| Lowe's Companies, Inc. | | | 430,526 | | | | 32,026,829 | | | | 4.59 | |
| | | | | | | | | | | | | |
| Hotels, Resorts & Cruise Lines | | | | | | | | | |
| Starwood Hotels & Resorts Worldwide, Inc. | | | 172,259 | | | | 14,383,626 | | | | 2.06 | |
| | | | | | | | | | | | | |
| Internet Software & Services | | | | | | | | | |
| Alibaba Group Holding Ltd. Spon. ADR* | | | 189,689 | | | | 15,789,712 | | | | 2.26 | |
| Facebook, Inc. - Cl. A* | | | 358,971 | | | | 29,512,801 | | | | 4.23 | |
| | | | | | | | 45,302,513 | | | | 6.49 | |
| | | | | | | | | | | | | |
| Leisure Facilities | | | | | | | | | | | | |
| ClubCorp Holdings, Inc. | | | 1,070,379 | | | $ | 20,722,537 | | | | 2.97 | % |
| | | | | | | | | | | | | |
| Mortgage REITs | | | | | | | | | | | | |
| Starwood Property Trust, Inc. | | | 691,879 | | | | 16,812,660 | | | | 2.41 | |
| | | | | | | | | | | | | |
| Movies & Entertainment | | | | | | | | | | | | |
| The Walt Disney Company | | | 249,939 | | | | 26,216,102 | | | | 3.76 | |
| | | | | | | | | | | | | |
| Pharmaceuticals | | | | | | | | | | | | |
| Merck & Co., Inc. | | | 364,963 | | | | 20,978,073 | | | | 3.01 | |
| Novartis AG | | | 149,451 | | | | 14,786,699 | | | | 2.12 | |
| | | | | | | | 35,764,772 | | | | 5.13 | |
| Railroads | | | | | | | | | | | | |
| Union Pacific Corporation | | | 245,835 | | | | 26,626,389 | | | | 3.82 | |
| | | | | | | | | | | | | |
| Research & Consulting Services | | | | | | | | | |
| Nielsen Holdings N.V. | | | 332,589 | | | | 14,823,492 | | | | 2.12 | |
| | | | | | | | | | | | | |
| Restaurants | | | | | | | | | | | | |
| Domino's Pizza Group PLC | | | 1,593,801 | | | | 18,334,715 | | | | 2.63 | |
| Restaurant Brands International, Inc. | | | 176,467 | | | | 6,765,811 | | | | 0.97 | |
| | | | | | | | 25,100,526 | | | | 3.60 | |
| Semiconductor Equipment | | | | | | | | | | | | |
| ASML Holding N.V. | | | 170,938 | | | | 17,269,866 | | | | 2.48 | |
| | | | | | | | | | | | | |
| Specialized Finance | | | | | | | | | | | | |
| CME Group, Inc. | | | 157,648 | | | | 14,930,842 | | | | 2.14 | |
| | | | | | | | | | | | | |
| Specialized REITs | | | | | | | | | | | | |
| Crown Castle International Corp. | | | 170,169 | | | | 14,045,749 | | | | 2.01 | |
| | | | | | | | | | | | | |
| Technology Hardware, Storage & Peripherals | | | | | |
| Apple, Inc. | | | 204,165 | | | | 25,404,251 | | | | 3.64 | |
| | | | | | | | | | | | | |
| TOTAL COMMON STOCKS | | | | | | | | | | | | |
| (Cost $472,055,293) | | | | | | | 614,338,031 | | | | 88.06 | |
See notes to financial statements.
MARSICO FLEXIBLE CAPITAL FUND
SCHEDULE OF INVESTMENTS (continued)
March 31, 2015 (Unaudited)
| | | Par
Value | | | Value | | | Percent
of Net
Assets | |
| CORPORATE BONDS | | | | | | | | | |
| Casinos & Gaming | | | | | | | | | |
Pinnacle Entertainment, Inc.,
7.500%, 4/15/21 | | $ | 6,000,000 | | | $ | 6,330,000 | | | | 0.91 | % |
| | | | | | | | | | | | | |
| Metal & Glass Containers | | | | | | | | | | | | |
Ball Corp.,
4.000%, 11/15/23 | | | 6,000,000 | | | | 5,850,000 | | | | 0.84 | |
| | | | | | | | | | | | | |
| Real Estate Development | | | | | | | | | | | | |
The Howard Hughes Corporation,
6.875%, 10/1/21 | | | 4,000,000 | | | | 4,190,000 | | | | 0.60 | |
| | | | | | | | | | | | | |
| Research & Consulting Services | | | | | | | | | |
IHS, Inc.,
5.000%, 11/1/22 | | | 6,000,000 | | | | 6,026,400 | | | | 0.86 | |
| | | | | | | | | | | | | |
| Trading Companies & Distributors | | | | | | | | | |
United Rentals North America, Inc.,
8.375%, 9/15/20 | | | 5,500,000 | | | | 5,914,150 | | | | 0.85 | |
| | | | | | | | | | | | | |
| Wireless Telecommunication Services | | | | | |
T-Mobile USA, Inc.,
6.464%, 4/28/19 | | | 4,000,000 | | | | 4,125,000 | | | | 0.59 | |
| | | | | | | | | | | | | |
| TOTAL CORPORATE BONDS | | | | | | | | | |
| (Cost $32,241,959) | | | | | | | 32,435,550 | | | | 4.65 | |
| | | Number
of
Shares | | | Value | | | Percent
of Net
Assets | |
| PREFERRED STOCKS | | | | | | | | | |
| Diversified Banks | | | | | | | | | |
Wells Fargo & Company,
Series N, 5.200% | | | 169,871 | | | $ | 4,175,429 | | | | 0.60 | % |
| | | | | | | | | | | | | |
| Mortgage REITs | | | | | | | | | | | | |
NorthStar Realty Finance Corp.,
Series E, 8.750% | | | 143,529 | | | | 3,789,166 | | | | 0.54 | |
| | | | | | | | | | | | | |
| Regional Banks | | | | | | | | | | | | |
BB&T Corporation,
Series D, 5.850% | | | 150,181 | | | | 3,832,619 | | | | 0.55 | |
First Niagara Financial Group, Inc.,
Series B, 8.625% | | | 168,558 | | | | 4,642,087 | | | | 0.67 | |
Regions Financial Corporation,
Series A, 6.375% | | | 154,966 | | | | 3,906,693 | | | | 0.56 | |
| | | | | | | | 12,381,399 | | | | 1.78 | |
| TOTAL PREFERRED STOCKS | | | | | | | | | |
| (Cost $19,218,276) | | | | | | | 20,345,994 | | | | 2.92 | |
| | | | | | | | | | | | | |
| SHORT-TERM INVESTMENTS | | | | | | | | | |
State Street Institutional Treasury
Money Market Fund, 0.000% | | | 30,160,306 | | | | 30,160,306 | | | | 4.32 | |
| | | | | | | | | | | | | |
| TOTAL SHORT-TERM INVESTMENTS | | | | | | | | | |
| (Cost $30,160,306) | | | | | | | 30,160,306 | | | | 4.32 | |
| | | | | | | | | | | | | |
| TOTAL INVESTMENTS | | | | | | | | | | | | |
| (Cost $553,675,834) | | | | | | | 697,279,881 | | | | 99.95 | |
| | | | | | | | | | | | | |
| Cash and Other Assets, Less Liabilities | | | | | | | 350,367 | | | | 0.05 | |
| | | | | | | | | | | | | |
| NET ASSETS | | | | | | $ | 697,630,248 | | | | 100.00 | % |
| SUMMARY OF INVESTMENTS BY COUNTRY | |
| Country | | Market Value | | | Percent of
Investment
Securities | |
| Canada | | $ | 6,765,811 | | | | 0.97 | % |
| China/Hong Kong | | | 20,292,102 | | | | 2.91 | |
| Netherlands | | | 17,269,866 | | | | 2.48 | |
| Switzerland | | | 14,786,699 | | | | 2.12 | |
| United Kingdom | | | 68,122,081 | | | | 9.77 | |
United States(1) | | | 570,043,322 | | | | 81.75 | |
| | | $ | 697,279,881 | | | | 100.00 | % |
| (1) | Includes short-term securities. |
See notes to financial statements.
INVESTMENT REVIEW BY TOM MARSICO (UNAUDITED)
The Marsico Global Fund posted a total return of (US$) +6.16% for the six-month fiscal period ended March 31, 2015. The Fund significantly outperformed the MSCI All Country World Index (“MSCI ACWI Index”), which we consider to be the Fund’s benchmark index and which had a total return of (US$) +2.73% over the same time period. The MSCI ACWI Index measures equity market performance in the global developed and emerging markets. Please see the Fund Overview for more detailed information about the Fund’s performance for various time periods ended March 31, 2015.
The performance data for the Fund quoted here represent past performance, and past performance is not a guarantee of future results. Investment return and principal value of an investment will fluctuate so that an investor’s shares, when redeemed, may be worth more or less than their original cost. Current performance may be lower or higher than the performance information quoted. To obtain performance information current to the most recent month-end, please call 888-860-8686 or visit www.marsicofunds.com.(1)
This review highlights Fund performance over a six-month fiscal period. Shareholders should keep in mind that the Fund is intended for long-term investors who hold their shares for substantially longer periods of time. You should also keep in mind that our views and beliefs regarding all investments discussed in this report are subject to change at any time. References to specific securities, industries, and sectors discussed in this report are not recommendations to buy or sell such securities or related investments, and the Fund may not necessarily hold these securities or investments today. Please see the accompanying Schedule of Investments for the percentage of the Fund’s portfolio represented by the securities mentioned in this report as of the end of the reporting period.
Foreign investments present additional risks due to currency fluctuations, economic and political factors, lower liquidity, differences in securities regulations and accounting standards, possible changes in taxation, limited public information, and other factors. In addition, the Fund is subject to broad risks associated with investing in equity securities markets generally, including the risks that the securities and markets in which it invests may experience volatility and instability, that domestic and global economies and markets may undergo periods of cyclical change and decline, that investors may at times avoid investments in equity securities, and that investments may not perform as anticipated. Please see the Prospectus for more information.
The Global Fund’s outperformance versus the MSCI ACWI Index was partially attributable to stock selection in the Materials and Information Technology sectors. The stock price of paint manufacturer The Sherwin-Williams Company rose +31%, buoyed by stronger than expected sales from its stores. Within the Information Technology sector, financial transaction processor Visa, Inc. – Cl. A posted a return of +23%. Visa’s stock price gain was largely attributable to the company’s strong revenue growth, accelerating cross-border volumes, and lower than expected operating expenses. Chinese Internet services company Tencent Holdings Ltd. gained +19% as the company generated strong revenue from its online gaming and advertising segments. Apple, Inc. rose +24% on strong sales of iPhone smartphones. Both Sherwin-Williams and Apple were among the Fund’s largest individual holdings and, as such, had a material, positive impact on Fund performance.
Select holdings in the Consumer Discretionary sector performed well. Media companies Liberty Global PLC – Series C and The Walt Disney Company posted returns of +21% and +19%, respectively. Liberty Global, the largest international cable television company, reported robust growth in its European broadband business. Walt Disney experienced strong revenue growth in its studio and consumer products businesses, driven by the continued success of its animated film, Frozen. United Kingdom-based pizza master-franchise company Domino’s Pizza Group PLC (+27%) was another leading holding within the sector.
Certain Health Care positions also aided performance. The Fund purchased Juno Therapeutics, a biotechnology company pioneering new cancer treatments, during the company’s initial public offering in December 2014, and maintained the position throughout the remainder of the reporting period. While Juno Therapeutics soared +153% over the entire period it was held, its contribution to Fund performance was muted by its relatively small position size in the Fund. The Fund’s largest individual holding, Biogen Idec Inc., gained +28% and was another positive contributor to performance. Biogen has benefitted from the growing demand for its products, which include therapies for multiple sclerosis. The company’s product pipeline includes treatments for Alzheimer’s disease and a variety of other neurology, immunology and hematology therapies.
Although active currency management is not a central facet of the Fund’s investment process, fluctuations in major world currencies can at times affect the Fund’s performance. During the period, the net effect of currency moves was positive for the Fund. The Fund did well as compared to the benchmark index by having greater exposure to securities denominated in the US dollar, which strengthened versus most major world currencies. An overweight allocation to investments denominated in the Swiss franc aided performance, as the franc was a relatively strong performing currency
during the period. The Fund’s euro-denominated investments posted a currency return that, while negative, fared slightly better than the currency return of the benchmark index’s euro-denominated constituents. Additionally, the Fund’s results were positively affected relative to the benchmark by having no exposure to the Japanese yen, which weakened during the period.
From a sector allocation perspective, the Fund benefitted as compared to its benchmark index by having overweight allocations to the strong-performing Consumer Discretionary and Health Care sectors, while being underweight the weak-performing Energy sector.
While certain Consumer Discretionary holdings posted strong performance, as discussed above, the aggregate return of the Fund’s holdings within the sector (+10%) lagged the +12% return of the respective benchmark index sector. Electric vehicle manufacturer Tesla Motors, Inc.’s stock price fell -22% in conjunction with the decline in crude oil prices, as concerns rose that lower gas prices may reduce demand for fuel efficient cars. Starwood Hotels & Resorts Worldwide, Inc. (+2% prior to being sold) also held back Fund performance. Nearly half of Starwood’s properties are located in international markets. The company’s profits have been negatively affected by volatility in international markets and the strengthening US dollar. We believe US dollar strength is likely to continue for some time, and we sold the position in favor of other investments we believe offer better upside potential.
Similarly, the aggregate return of the Fund’s Health Care holdings (+8%) lagged the +11% return of the respective benchmark index sector. While certain biotechnology holdings posted strong gains, other positions posted negative returns, including Gilead Sciences, Inc. (-8%), UCB S.A. (-16% prior to being sold), and Roche Holding AG (-8% prior to being sold).
Energy was the weakest-performing sector in the benchmark index during the reporting period. Falling crude oil prices and increased supply were largely responsible for the negative returns in the sector. As oil prices fell, we sold the Fund’s holdings within the energy sector. While an underweight allocation to Energy was beneficial to relative performance, a portion of the positive sector allocation effect was offset by negative returns from the Fund’s energy positions held early in the reporting period.
Industrials holding Canadian Pacific Railway Ltd. (-12%) was another Fund position negatively affected by declining oil prices. While lower energy prices were an overhang for the railroad operator, we continued to maintain the Fund’s position. A sizeable portion of Canadian Pacific’s crude oil business is sourced from western Canada in projects that we believe are likely to produce oil for shipment by rail even in a lower oil price environment.
During the period, the Fund increased its allocations to the Health Care, Consumer Discretionary, and Information Technology sectors. The Fund sold its holdings in the Energy and Consumer Staples sectors and modestly reduced its allocation to Materials.
The Global Fund experienced moderately elevated portfolio turnover during the period, which primarily related to the Fund’s changing its portfolio composition to reinvest in other positions that we believe may have more upside potential and to take advantage of new opportunities. Portfolio turnover increases transaction-related expenses and could reduce Fund returns.
Fiscal Period-End Investment Posture
As of March 31, 2015, the Fund’s primary economic sector allocations were Consumer Discretionary, Information Technology, and Health Care. The Fund had no investments in the Financials, Consumer Staples, Energy, Telecommunication Services, or Utilities sectors. The Fund’s most significant country allocations were the United States, the United Kingdom, Canada, China/Hong Kong, and France. Country-level weightings generally should be considered a residual of the Fund’s stock selection process rather than a major, proactive facet of its investment strategy.
Sincerely,
THOMAS F. MARSICO
PORTFOLIO MANAGER
| (1) | Total returns are based on net change in net asset value assuming reinvestment of distributions. For the periods prior to January 1, 2009, from April 2009 through May 2009, and from January 2012 through March 2015, the performance returns for the Global Fund reflect a fee waiver in effect; in the absence of such a waiver, the returns would have been reduced. For the one-month period of June 2009, performance returns for the Global Fund would have been higher but for the reimbursement of fees waived previously. Please see the Prospectus for more information. |
March 31, 2015 (Unaudited)
The Global Fund invests primarily in the common stocks of US and foreign companies that are selected for their long-term growth potential. The Fund may invest in the securities of companies of any size that are economically tied to any countries or markets throughout the world, including the securities of companies economically tied to emerging markets. Under normal market conditions, the Fund will invest significantly (generally, at least 40% of its net assets) in the securities of issuers organized or located outside the US or doing business outside the US (unless market conditions are not deemed favorable by the Adviser, in which case the Fund generally will invest at least 30% of its assets in such foreign securities). The Fund will invest its assets in various regions and countries, including the US, that encompass not less than three different countries overall. The Fund may hold an unlimited number of common stocks.
TOTAL ANNUAL OPERATING EXPENSES* NET EXPENSES*† | 1.66% 1.60% | NET ASSETS $72,818,540 | NET ASSET VALUE PER SHARE $13.61 |
GROWTH OF $10,000(1)(2) | PERFORMANCE COMPARISON |
| 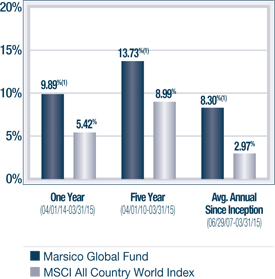 |
SECTOR ALLOCATION(3) | TOP FIVE HOLDINGS |
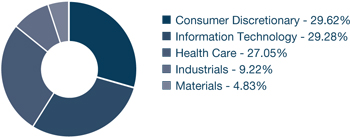 | | |
| BIOGEN IDEC INC. | 5.13% |
| FACEBOOK, INC. - CL. A | 4.63% |
| APPLE, INC. | 4.32% |
| DOMINO'S PIZZA GROUP PLC | 4.10% |
| THE SHERWIN-WILLIAMS COMPANY | 4.02% |
| * | The Total Annual Operating Expenses and Net Expenses are reflective of the information disclosed in the Funds’ Prospectus dated January 30, 2015 and may differ from the expense ratios disclosed in this report. |
| † | Marsico Capital Management, LLC (the “Adviser”) has entered into a written expense limitation and fee waiver agreement under which it has agreed to limit the total expenses of the Global Fund (excluding interest, taxes, acquired fund fees and expenses, litigation, brokerage and extraordinary expenses) to an annual rate of 1.60% of the Fund’s average net assets until January 31, 2016. This expense limitation and fee waiver agreement may be terminated by the Adviser at any time after January 31, 2016, upon 15 days prior notice to the Fund and its administrator. The Adviser may recoup from the Fund fees previously waived or expenses previously reimbursed by the Adviser with respect to the Fund pursuant to this agreement (or a previous expense limitation agreement) if: (1) such recoupment by the Adviser does not cause the Fund, at the time of recoupment, to exceed the lesser of (a) the expense limitation in effect at the time the relevant amount was waived and/or reimbursed, or (b) the expense limitation in effect at the time of the proposed recoupment, and (2) the recoupment is made within three fiscal years after the end of the fiscal year in which the amount was waived or reimbursed. |
The performance data quoted here represent past performance, and past performance is not a guarantee of future results. Investment return and principal value of an investment will fluctuate so that an investor’s shares, when redeemed, may be worth more or less than their original cost. Current performance may be lower or higher than the performance information quoted. To obtain performance information current to the most recent month-end, please call 888-860-8686 or visit www.marsicofunds.com.
The performance included in the chart and graph does not reflect the deduction of taxes on Fund distributions or the redemption of Fund shares.
All indices are unmanaged and investors cannot invest directly in an index.
| (1) | The performance returns for the Global Fund (for the periods prior to January 1, 2009, from April 2009 through May 2009 and from January 2012 through March 2015) reflect a fee waiver in effect; in absence of such a waiver, the returns would be reduced. For the one-month period June 2009, performance returns for the Global Fund would have been higher but for reimbursement of fees waived previously. |
| (2) | This chart assumes an initial investment of $10,000 made on June 29, 2007 (inception). Total returns are based on change in NAV, assuming reinvestment of distributions. |
| (3) | Sector weightings represent the percentage of the Fund’s investments (excluding cash equivalents) in certain general sectors. These sectors may include more than one industry. The Fund’s portfolio composition is subject to change at any time. |
The MSCI ACWI (All Country World Index) Index is a free float-adjusted market capitalization index that is designed to measure equity market performance in the global developed and emerging markets.
MARSICO GLOBAL FUND
SCHEDULE OF INVESTMENTS
March 31, 2015 (Unaudited)
| | | Number
of
Shares | | | Value | | | Percent
of Net
Assets | |
| COMMON STOCKS | | | | | | | | | |
| Aerospace & Defense | | | | | | | | | |
| BAE Systems PLC | | | 210,314 | | | $ | 1,633,214 | | | | 2.25 | % |
| Safran S.A. | | | 30,338 | | | | 2,120,362 | | | | 2.91 | |
| | | | | | | | 3,753,576 | | | | 5.16 | |
| Apparel, Accessories & Luxury Goods | | | | | |
| Hermes International | | | 3,289 | | | | 1,161,386 | | | | 1.60 | |
| | | | | | | | | | | | | |
| Automobile Manufacturers | | | | | | | | | | | | |
| Bayerische Motoren Werke AG | | | 17,831 | | | | 2,232,671 | | | | 3.07 | |
| Tata Motors Ltd. ADR | | | 40,919 | | | | 1,843,810 | | | | 2.53 | |
| Tesla Motors, Inc.* | | | 6,721 | | | | 1,268,723 | | | | 1.74 | |
| | | | | | | | 5,345,204 | | | | 7.34 | |
| Biotechnology | | | | | | | | | | | | |
| Biogen Idec Inc.* | | | 8,841 | | | | 3,733,024 | | | | 5.13 | |
| Celldex Therapeutics, Inc.* | | | 57,026 | | | | 1,589,315 | | | | 2.18 | |
| Gilead Sciences, Inc.* | | | 17,607 | | | | 1,727,775 | | | | 2.37 | |
| Juno Therapeutics, Inc.* | | | 19,475 | | | | 1,181,353 | | | | 1.62 | |
| Vertex Pharmaceuticals, Inc.* | | | 15,228 | | | | 1,796,447 | | | | 2.47 | |
| | | | | | | | 10,027,914 | | | | 13.77 | |
| Cable & Satellite | | | | | | | | | | | | |
| Liberty Global PLC - Series C* | | | 57,175 | | | | 2,847,887 | | | | 3.91 | |
| | | | | | | | | | | | | |
| Data Processing & Outsourced Services | | | | | |
| FleetCor Technologies, Inc.* | | | 9,741 | | | | 1,470,112 | | | | 2.02 | |
| Visa, Inc. - Cl. A | | | 31,888 | | | | 2,085,794 | | | | 2.86 | |
| | | | | | | | 3,555,906 | | | | 4.88 | |
| Fertilizers & Agricultural Chemicals | | | | | | | | | |
| Monsanto Company | | | 4,622 | | | | 520,160 | | | | 0.71 | |
| | | | | | | | | | | | | |
| Footwear | | | | | | | | | | | | |
| NIKE, Inc. - Cl. B | | | 22,000 | | | | 2,207,260 | | | | 3.03 | |
| | | | | | | | | | | | | |
| General Merchandise Stores | | | | | | | | | |
| Dollar Tree, Inc.* | | | 18,498 | | | | 1,501,020 | | | | 2.06 | |
| | | | | | | | | | | | | |
| Home Entertainment Software | | | | | | | | | |
| Electronic Arts, Inc.* | | | 18,967 | | | | 1,115,544 | | | | 1.53 | |
| | | | | | | | | | | | | |
| Hotels, Resorts & Cruise Lines | | | | | | | | | |
| Norwegian Cruise Line Holdings Ltd.* | | | 41,407 | | | | 2,236,392 | | | | 3.07 | |
| | | | | | | | | | | | | |
| Internet Software & Services | | | | | | | | | |
| Alibaba Group Holding Ltd. Spon. ADR* | | | 18,940 | | | | 1,576,566 | | | | 2.17 | |
| Auto Trader Group PLC* | | | 180,099 | | | | 672,572 | | | | 0.92 | |
| Facebook, Inc. - Cl. A* | | | 41,034 | | | | 3,373,610 | | | | 4.63 | |
| LinkedIn Corporation - Cl. A* | | | 1,717 | | | | 429,010 | | | | 0.59 | |
| Tencent Holdings Ltd. | | | 138,700 | | | | 2,635,294 | | | | 3.62 | |
| | | | | | | | 8,687,052 | | | | 11.93 | |
| Managed Health Care | | | | | | | | | | | | |
| UnitedHealth Group, Inc. | | | 16,025 | | | | 1,895,597 | | | | 2.60 | |
| | | | | | | | | | | | | |
| Movies & Entertainment | | | | | | | | | | | | |
| The Walt Disney Company | | | 21,955 | | | $ | 2,302,860 | | | | 3.16 | % |
| | | | | | | | | | | | | |
| Pharmaceuticals | | | | | | | | | | | | |
| Actavis PLC* | | | 7,495 | | | | 2,230,662 | | | | 3.06 | |
| Novartis AG | | | 24,756 | | | | 2,449,361 | | | | 3.37 | |
| Pacira Pharmaceuticals, Inc.* | | | 14,075 | | | | 1,250,564 | | | | 1.72 | |
| Valeant Pharmaceuticals International, Inc.* | | | 7,371 | | | | 1,464,028 | | | | 2.01 | |
| | | | | | | | 7,394,615 | | | | 10.16 | |
| Railroads | | | | | | | | | | | | |
| Canadian Pacific Railway Ltd. | | | 15,442 | | | | 2,827,365 | | | | 3.88 | |
| | | | | | | | | | | | | |
| Restaurants | | | | | | | | | | | | |
| Domino's Pizza Enterprises Ltd. | | | 19,934 | | | | 564,342 | | | | 0.77 | |
| Domino's Pizza Group PLC | | | 259,303 | | | | 2,982,961 | | | | 4.10 | |
| | | | | | | | 3,547,303 | | | | 4.87 | |
| Semiconductor Equipment | | | | | | | | | | | | |
| ASML Holding N.V. | | | 26,631 | | | | 2,690,530 | | | | 3.70 | |
| | | | | | | | | | | | | |
| Semiconductors | | | | | | | | | | | | |
| ARM Holdings PLC | | | 104,583 | | | | 1,714,280 | | | | 2.35 | |
| | | | | | | | | | | | | |
| Specialty Chemicals | | | | | | | | | | | | |
| The Sherwin-Williams Company | | | 10,287 | | | | 2,926,651 | | | | 4.02 | |
| | | | | | | | | | | | | |
| Technology Hardware, Storage & Peripherals | | | | | |
| Apple, Inc. | | | 25,269 | | | | 3,144,222 | | | | 4.32 | |
| | | | | | | | | | | | | |
| TOTAL COMMON STOCKS | | | | | | | | | | | | |
| (Cost $57,772,888) | | | | | | | 71,402,724 | | | | 98.05 | |
| | | | | | | | | | | | | |
| SHORT-TERM INVESTMENTS | | | | | | | | | |
| State Street Institutional Treasury Money Market Fund, 0.000% | | | 1,591,392 | | | | 1,591,392 | | | | 2.19 | |
| | | | | | | | | | | | | |
| TOTAL SHORT-TERM INVESTMENTS | | | | | | | | | |
| (Cost $1,591,392) | | | | | | | 1,591,392 | | | | 2.19 | |
| | | | | | | | | | | | | |
| TOTAL INVESTMENTS | | | | | | | | | | | | |
| (Cost $59,364,280) | | | | | | | 72,994,116 | | | | 100.24 | |
| | | | | | | | | | | | | |
| Liabilities, Less Cash and Other Assets | | | | | | | (175,576 | ) | | | (0.24 | ) |
| | | | | | | | | | | | | |
| NET ASSETS | | | | | | $ | 72,818,540 | | | | 100.00 | % |
See notes to financial statements.
| SUMMARY OF INVESTMENTS BY COUNTRY | |
| Country | | Market Value | | | Percent of
Investment
Securities | |
| Australia | | $ | 564,342 | | | | 0.77 | % |
| Canada | | | 4,291,393 | | | | 5.88 | |
| China/Hong Kong | | | 4,211,860 | | | | 5.77 | |
| France | | | 3,281,748 | | | | 4.49 | |
| Germany | | | 2,232,671 | | | | 3.06 | |
| India | | | 1,843,810 | | | | 2.53 | |
| Netherlands | | | 2,690,530 | | | | 3.69 | |
| Switzerland | | | 2,449,361 | | | | 3.36 | |
| United Kingdom | | | 9,850,914 | | | | 13.49 | |
United States(1) | | | 41,577,487 | | | | 56.96 | |
| | | $ | 72,994,116 | | | | 100.00 | % |
| (1) | Includes short-term securities. |
See notes to financial statements.
STATEMENTS OF ASSETS AND LIABILITIES
March 31, 2015 (Unaudited)
| (Amounts in thousands) | | MARSICO
FOCUS FUND | | | MARSICO
GROWTH FUND | |
| | | | | | | |
| ASSETS | | | | | | |
Investments, at value (cost $679,046, $380,981, $241,999,
$85,846, $553,676, and $59,364, respectively) | | $ | 923,554 | | | $ | 509,287 | |
| Foreign currency (cost $0, $0, $0, $61, $41, and $0, respectively) | | | — | | | | — | |
| Receivable for investments sold | | | 1,186 | | | | 24,992 | |
| Receivable for capital stock sold | | | 205 | | | | 4 | |
| Interest and dividends receivable | | | 522 | | | | 288 | |
| Prepaid expenses and other assets | | | 1,586 | | | | 1,055 | |
| Total Assets | | | 927,053 | | | | 535,626 | |
| | | | | | | | | |
| LIABILITIES | | | | | | | | |
| Payable for investments purchased | | | 7,970 | | | | 3,501 | |
| Payable for capital stock redeemed | | | 367 | | | | 313 | |
| Due to custodian | | | — | | | | 18,435 | |
| Payable to investment adviser | | | 673 | | | | 394 | |
| Accrued trustees' fees | | | 1,569 | | | | 1,044 | |
| Accrued distribution fee | | | 3,098 | | | | 1,564 | |
| Accrued professional fees | | | 57 | | | | 36 | |
| Accrued transfer agent fees and expenses | | | 122 | | | | 85 | |
| Accrued printing expenses | | | 58 | | | | 33 | |
| Accrued custody and fund accounting fees | | | 27 | | | | 25 | |
| Accrued expenses and other liabilities | | | 27 | | | | 20 | |
| Total Liabilities | | | 13,968 | | | | 25,450 | |
| | | | | | | | | |
| NET ASSETS | | $ | 913,085 | | | $ | 510,176 | |
| | | | | | | | | |
| NET ASSETS CONSIST OF | | | | | | | | |
| Paid-in-capital | | $ | 592,737 | | | $ | 323,963 | |
| Accumulated net investment loss | | | (6,093 | ) | | | (3,594 | ) |
Accumulated net realized gain (loss) on investments
and foreign currency transactions | | | 81,285 | | | | 61,105 | |
Net unrealized appreciation on investments
and foreign currency translations | | | 245,156 | | | | 128,702 | |
| NET ASSETS | | $ | 913,085 | | | $ | 510,176 | |
| | | | | | | | | |
| SHARES OUTSTANDING, $0.001 par value | | | | | | | | |
| (Unlimited shares authorized) | | | 44,677 | | | | 23,544 | |
| | | | | | | | | |
NET ASSET VALUE, REDEMPTION PRICE, AND OFFERING
PRICE PER SHARE (NET ASSETS/SHARES OUTSTANDING)* | | $ | 20.44 | | | $ | 21.67 | |
| * | Not in thousands, based on unrounded net assets and shares outstanding. |
See notes to financial statements.
MARSICO
21st CENTURY FUND | | | MARSICO
INTERNATIONAL
OPPORTUNITIES
FUND | | | MARSICO
FLEXIBLE
CAPITAL FUND | | | MARSICO
GLOBAL FUND | |
| | | | | | | | | | |
| $ | 315,159 | | | $ | 101,539 | | | $ | 697,280 | | | $ | 72,994 | |
| | — | | | | 61 | | | | 41 | | | | — | |
| | 1,004 | | | | 1,145 | | | | — | | | | 72 | |
| | 24 | | | | 290 | | | | 173 | | | | 71 | |
| | 98 | | | | 249 | | | | 2,015 | | | | 117 | |
| | 748 | | | | 366 | | | | 1,344 | | | | 506 | |
| | 317,033 | | | | 103,650 | | | | 700,853 | | | | 73,760 | |
| | | | | | | | | | | | | | | |
| | | | | | | | | | | | | | | |
| | 1,235 | | | | — | | | | — | | | | 180 | |
| | 214 | | | | 39 | | | | 764 | | | | 12 | |
| | — | | | | — | | | | — | | | | — | |
| | 230 | | | | 64 | | | | 517 | | | | 55 | |
| | 737 | | | | 352 | | | | 1,326 | | | | 492 | |
| | 792 | | | | 229 | | | | 350 | | | | 150 | |
| | 23 | | | | 11 | | | | 54 | | | | 5 | |
| | 50 | | | | 21 | | | | 124 | | | | 12 | |
| | 15 | | | | 2 | | | | 36 | | | | 4 | |
| | 20 | | | | 40 | | | | 34 | | | | 15 | |
| | 26 | | | | 22 | | | | 18 | | | | 16 | |
| | 3,342 | | | | 780 | | | | 3,223 | | | | 941 | |
| | | | | | | | | | | | | | | |
| $ | 313,691 | | | $ | 102,870 | | | $ | 697,630 | | | $ | 72,819 | |
| | | | | | | | | | | | | | | |
| | | | | | | | | | | | | | | |
| $ | 673,309 | | | $ | 194,535 | | | $ | 525,297 | | | $ | 56,310 | |
| | (4,058 | ) | | | (1,219 | ) | | | (432 | ) | | | (797 | ) |
| | (429,045 | ) | | | (106,202 | ) | | | 28,565 | | | | 3,452 | |
| | 73,485 | | | | 15,756 | | | | 144,200 | | | | 13,854 | |
| $ | 313,691 | | | $ | 102,870 | | | $ | 697,630 | | | $ | 72,819 | |
| | | | | | | | | | | | | | | |
| | | | | | | | | | | | | | | |
| | 14,010 | | | | 6,424 | | | | 39,217 | | | | 5,350 | |
| | | | | | | | | | | | | | | |
| $ | 22.39 | | | $ | 16.01 | | | $ | 17.79 | | | $ | 13.61 | |
STATEMENTS OF OPERATIONS
FOR THE SIX-MONTH PERIOD ENDED March 31, 2015 (Unaudited)
| (Amounts in thousands) | | MARSICO
FOCUS FUND | | | MARSICO
GROWTH FUND | |
| | | | | | | |
| INVESTMENT INCOME | | | | | | |
Dividends (net of $96, $11, $0, $21, $88, and $14, respectively,
of non-reclaimable foreign withholding taxes) | | $ | 5,132 | | | $ | 2,829 | |
| Interest | | | — | | | | — | |
| Total Investment Income | | | 5,132 | | | | 2,829 | |
| | | | | | | | | |
| EXPENSES | | | | | | | | |
| Investment advisory fees | | | 4,032 | | | | 2,328 | |
| Distribution fees | | | 1,186 | | | | 685 | |
| Transfer agent fees and expenses | | | 507 | | | | 342 | |
| Trustees' fees and expenses | | | 153 | (1) | | | 88 | (1) |
| Professional fees | | | 129 | | | | 74 | |
| Fund administration fees | | | 97 | | | | 82 | |
| Custody and fund accounting fees | | | 82 | | | | 67 | |
| Printing and postage expenses | | | 75 | | | | 43 | |
| Miscellaneous | | | 43 | | | | 29 | |
| Federal and state registration fees | | | 18 | | | | 16 | |
| Total Expenses | | | 6,322 | | | | 3,754 | |
| Less waiver of expenses and expenses paid indirectly | | | — | | | | — | |
| Net Expenses | | | 6,322 | | | | 3,754 | |
| | | | | | | | | |
| NET INVESTMENT INCOME (LOSS) | | | (1,190 | ) | | | (925 | ) |
| | | | | | | | | |
| REALIZED AND UNREALIZED GAIN (LOSS) | | | | | | | | |
| Net realized gain on investments | | | 83,643 | | | | 61,775 | |
| Net realized loss on foreign currency transactions | | | (32 | ) | | | (306 | ) |
Change in unrealized appreciation (depreciation) on
investments, and foreign currency translations | | | (42,965 | ) | | | (42,267 | ) |
| | | | | | | | | |
| Net Gain on Investments | | | 40,646 | | | | 19,202 | |
| | | | | | | | | |
| NET INCREASE IN NET ASSETS RESULTING FROM OPERATIONS | | $ | 39,456 | | | $ | 18,277 | |
| (1) | Amounts include trustees’ fees and expenses and the mark to market unrealized appreciation during the period for shares held in the Trustees’ Deferred Fee Plan, as more fully described in Note 2(g) in the Notes to Financial Statements. |
| | | Trustees’
Fees and
Expenses* | | | Unrealized
Appreciation* | |
| Focus Fund | | $ | 77,468 | | | $ | 75,873 | |
| Growth Fund | | | 44,187 | | | | 43,681 | |
21st Century Fund | | | 26,665 | | | | 54,510 | |
| International Opportunities Fund | | | 9,684 | | | | 28,529 | |
| Flexible Capital Fund | | | 62,321 | | | | 84,968 | |
| Global Fund | | | 5,914 | | | | 29,135 | |
See notes to financial statements.
MARSICO
21st CENTURY FUND | | | MARSICO
INTERNATIONAL
OPPORTUNITIES
FUND | | | MARSICO
FLEXIBLE
CAPITAL FUND | | | MARSICO
GLOBAL FUND | |
| | | | | | | | | | |
| $ | 1,195 | | | $ | 464 | | | $ | 6,574 | | | $ | 292 | |
| | — | | | | — | | | | 731 | | | | — | |
| | 1,195 | | | | 464 | | | | 7,305 | | | | 292 | |
| | | | | | | | | | | | | | | |
| | | | | | | | | | | | | | | |
| | 1,335 | | | | 470 | | | | 3,227 | | | | 307 | |
| | 393 | | | | 138 | | | | 949 | | | | 90 | |
| | 215 | | | | 91 | | | | 551 | | | | 54 | |
| | 81 | (1) | | | 38 | (1) | | | 147 | (1) | | | 35 | (1) |
| | 45 | | | | 17 | | | | 105 | | | | 10 | |
| | 70 | | | | 52 | | | | 93 | | | | 40 | |
| | 54 | | | | 125 | | | | 94 | | | | 42 | |
| | 25 | | | | 9 | | | | 59 | | | | 6 | |
| | 15 | | | | 17 | | | | 47 | | | | 8 | |
| | 9 | | | | 11 | | | | 25 | | | | 11 | |
| | 2,242 | | | | 968 | | | | 5,297 | | | | 603 | |
| | — | | | | (84 | ) | | | — | | | | (25 | ) |
| | 2,242 | | | | 884 | | | | 5,297 | | | | 578 | |
| | | | | | | | | | | | | | | |
| | (1,047 | ) | | | (420 | ) | | | 2,008 | | | | (286 | ) |
| | | | | | | | | | | | | | | |
| | | | | | | | | | | | | | | |
| | 34,386 | | | | 10,264 | | | | 45,778 | | | | 4,090 | |
| | (203 | ) | | | (5,806 | ) | | | (3,252 | ) | | | (606 | ) |
| | (11,453 | ) | | | 3,673 | | | | 3,199 | | | | 972 | |
| | | | | | | | | | | | | | | |
| | 22,730 | | | | 8,131 | | | | 45,725 | | | | 4,456 | |
| | | | | | | | | | | | | | | |
| $ | 21,683 | | | $ | 7,711 | | | $ | 47,733 | | | $ | 4,170 | |
STATEMENTS OF CHANGES IN NET ASSETS
| | | MARSICO
FOCUS FUND | | | MARSICO
GROWTH FUND | |
| | | | | | | | | | | | | |
| (Amounts in thousands) | | Six-Month
Period Ended
3/31/15
(Unaudited) | | | Year
Ended
9/30/14 | | | Six-Month
Period Ended
3/31/15
(Unaudited) | | | Year
Ended
9/30/14 | |
| | | | | | | | | | | | | |
| OPERATIONS: | | | | | | | | | | | | |
| Net investment income (loss) | | $ | (1,190 | ) | | $ | (3,071 | ) | | $ | (925 | ) | | $ | (1,962 | ) |
| Net realized gain on investments | | | 83,643 | | | | 133,166 | | | | 61,775 | | | | 75,176 | |
| Net realized gain (loss) on foreign currency transactions | | | (32 | ) | | | 2,085 | | | | (306 | ) | | | 281 | |
Change in unrealized appreciation (depreciation) on
investments and foreign currency translations | | | (42,965 | ) | | | 46,251 | | | | (42,267 | ) | | | 19,061 | |
| | | | | | | | | | | | | | | | | |
| Net increase (decrease) in net assets resulting from operations | | | 39,456 | | | | 178,431 | | | | 18,277 | | | | 92,556 | |
| | | | | | | | | | | | | | | | | |
| DISTRIBUTIONS: | | | | | | | | | | | | | | | | |
| Net investment income | | | — | | | | — | | | | — | | | | (1,356 | ) |
| Net realized gains | | | (124,082 | ) | | | (133,035 | ) | | | (63,630 | ) | | | (117,682 | ) |
| | | | | | | | | | | | | | | | | |
| Total distributions | | | (124,082 | ) | | | (133,035 | ) | | | (63,630 | ) | | | (119,038 | ) |
| | | | | | | | | | | | | | | | | |
| CAPITAL SHARE TRANSACTIONS: | | | | | | | | | | | | | | | | |
| Proceeds from sales of shares | | | 99,170 | | | | 79,841 | | | | 14,765 | | | | 83,402 | |
| Proceeds from reinvestment of distributions | | | 113,800 | | | | 120,542 | | | | 61,081 | | | | 112,618 | |
| Redemption fees | | | — | | | | 2 | | | | — | | | | 2 | |
| Redemption of shares | | | (148,313 | ) | | | (167,435 | ) | | | (82,970 | ) | | | (171,653 | ) |
| | | | | | | | | | | | | | | | | |
| Net increase (decrease) from capital share transactions | | | 64,657 | | | | 32,950 | | | | (7,124 | ) | | | 24,369 | |
| | | | | | | | | | | | | | | | | |
| TOTAL INCREASE (DECREASE) IN NET ASSETS | | | (19,969 | ) | | | 78,346 | | | | (52,477 | ) | | | (2,113 | ) |
| | | | | | | | | | | | | | | | | |
| NET ASSETS: | | | | | | | | | | | | | | | | |
| Beginning of Period | | | 933,054 | | | | 854,708 | | | | 562,653 | | | | 564,766 | |
| | | | | | | | | | | | | | | | | |
| End of Period | | $ | 913,085 | | | $ | 933,054 | | | $ | 510,176 | | | $ | 562,653 | |
| | | | | | | | | | | | | | | | | |
| Accumulated net investment loss | | $ | (6,093 | ) | | $ | (4,903 | ) | | $ | (3,594 | ) | | $ | (2,669 | ) |
| | | | | | | | | | | | | | | | | |
| TRANSACTIONS IN SHARES: | | | | | | | | | | | | | | | | |
| Shares sold | | | 4,591 | | | | 3,721 | | | | 665 | | | | 3,612 | |
| Shares issued in reinvestment of distributions | | | 5,600 | | | | 5,988 | | | | 2,823 | | | | 5,173 | |
| Shares redeemed | | | (7,158 | ) | | | (7,882 | ) | | | (3,750 | ) | | | (7,546 | ) |
| | | | | | | | | | | | | | | | | |
| NET INCREASE (DECREASE) | | | 3,033 | | | | 1,827 | | | | (262 | ) | | | 1,239 | |
See notes to financial statements.
MARSICO
21st CENTURY FUND | | | MARSICO
INTERNATIONAL
OPPORTUNITIES FUND | | | MARSICO
FLEXIBLE
CAPITAL FUND | | | MARSICO
GLOBAL FUND | |
| | | | | | | | | | | | | | | | | | | | | | |
Six-Month
Period Ended
3/31/15
(Unaudited) | | | Year
Ended
9/30/14 | | | Six-Month
Period Ended
3/31/15
(Unaudited) | | | Year
Ended
9/30/14 | | | Six-Month
Period Ended
3/31/15
(Unaudited) | | | Year
Ended
9/30/14 | | | Six-Month
Period Ended
3/31/15
(Unaudited) | | | Year
Ended
9/30/14 | |
| | | | | | | | | | | | | | | | | | | | | | |
| $ | (1,047 | ) | | $ | (2,856 | ) | | $ | (420 | ) | | $ | (923 | ) | | $ | 2,008 | | | $ | (1,860 | ) | | $ | (286 | ) | | $ | (307 | ) |
| | 34,386 | | | | 47,655 | | | | 10,264 | | | | 3,145 | | | | 45,778 | | | | 78,629 | | | | 4,090 | | | | 9,758 | |
| | (203 | ) | | | 89 | | | | (5,806 | ) | | | (1,232 | ) | | | (3,252 | ) | | | 646 | | | | (606 | ) | | | 427 | |
| | (11,453 | ) | | | 2,092 | | | | 3,673 | | | | (8,497 | ) | | | 3,199 | | | | 20,204 | | | | 972 | | | | (1,297 | ) |
| | | | | | | | | | | | | | | | | | | | | | | | | | | | | | | |
| | 21,683 | | | | 46,980 | | | | 7,711 | | | | (7,507 | ) | | | 47,733 | | | | 97,619 | | | | 4,170 | | | | 8,581 | |
| | | | | | | | | | | | | | | | | | | | | | | | | | | | | | | |
| | | | | | | | | | | | | | | | | | | | | | | | | | | | | | | |
| | — | | | | — | | | | — | | | | (742 | ) | | | — | | | | — | | | | — | | | | — | |
| | — | | | | — | | | | — | | | | — | | | | (72,202 | ) | | | (89,103 | ) | | | (8,410 | ) | | | (9,278 | ) |
| | | | | | | | | | | | | | | | | | | | | | | | | | | | | | | |
| | — | | | | — | | | | — | | | | (742 | ) | | | (72,202 | ) | | | (89,103 | ) | | | (8,410 | ) | | | (9,278 | ) |
| | | | | | | | | | | | | | | | | | | | | | | | | | | | | | | |
| | | | | | | | | | | | | | | | | | | | | | | | | | | | | | | |
| | 3,757 | | | | 12,600 | | | | 22,000 | | | | 101,347 | | | | 45,193 | | | | 249,527 | | | | 12,062 | | | | 27,301 | |
| | — | | | | — | | | | — | | | | 694 | | | | 61,280 | | | | 74,212 | | | | 6,836 | | | | 7,242 | |
| | — | | | | 1 | | | | — | | | | 3 | | | | — | | | | 30 | | | | — | | | | 2 | |
| | (28,042 | ) | | | (55,503 | ) | | | (102,825 | ) | | | (37,333 | ) | | | (190,822 | ) | | | (331,572 | ) | | | (15,314 | ) | | | (21,756 | ) |
| | | | | | | | | | | | | | | | | | | | | | | | | | | | | | | |
| | (24,285 | ) | | | (42,902 | ) | | | (80,825 | ) | | | 64,711 | | | | (84,349 | ) | | | (7,803 | ) | | | 3,584 | | | | 12,789 | |
| | | | | | | | | | | | | | | | | | | | | | | | | | | | | | | |
| | (2,602 | ) | | | 4,078 | | | | (73,114 | ) | | | 56,462 | | | | (108,818 | ) | | | 713 | | | | (656 | ) | | | 12,092 | |
| | | | | | | | | | | | | | | | | | | | | | | | | | | | | | | |
| | | | | | | | | | | | | | | | | | | | | | | | | | | | | | | |
| | 316,293 | | | | 312,215 | | | | 175,984 | | | | 119,522 | | | | 806,448 | | | | 805,735 | | | | 73,475 | | | | 61,383 | |
| | | | | | | | | | | | | | | | | | | | | | | | | | | | | | | |
| $ | 313,691 | | | $ | 316,293 | | | $ | 102,870 | | | $ | 175,984 | | | $ | 697,630 | | | $ | 806,448 | | | $ | 72,819 | | | $ | 73,475 | |
| | | | | | | | | | | | | | | | | | | | | | | | | | | | | | | |
| $ | (4,058 | ) | | $ | (3,011 | ) | | $ | (1,219 | ) | | $ | (799 | ) | | $ | (432 | ) | | $ | (2,440 | ) | | $ | (797 | ) | | $ | (511 | ) |
| | | | | | | | | | | | | | | | | | | | | | | | | | | | | | | |
| | | | | | | | | | | | | | | | | | | | | | | | | | | | | | | |
| | 174 | | | | 632 | | | | 1,431 | | | | 6,558 | | | | 2,513 | | | | 13,675 | | | | 866 | | | | 1,924 | |
| | — | | | | — | | | | — | | | | 45 | | | | 3,496 | | | | 4,188 | | | | 523 | | | | 518 | |
| | (1,299 | ) | | | (2,792 | ) | | | (6,963 | ) | | | (2,461 | ) | | | (10,646 | ) | | | (18,246 | ) | | | (1,122 | ) | | | (1,524 | ) |
| | | | | | | | | | | | | | | | | | | | | | | | | | | | | | | |
| | (1,125 | ) | | | (2,160 | ) | | | (5,532 | ) | | | 4,142 | | | | (4,637 | ) | | | (383 | ) | | | 267 | | | | 918 | |
FINANCIAL HIGHLIGHTS
| | | MARSICO
FOCUS FUND | |
| | | | |
For a Fund Share Outstanding Throughout the Period | | Six-Month
Period Ended
3/31/15
(Unaudited) | | | Year
Ended
9/30/14 | | | Year
Ended
9/30/13 | | | Year
Ended
9/30/12 | | | Year
Ended
9/30/11 | | | Year
Ended
9/30/10 | |
| | | | | | | | | | | | | | | | | | | |
| Net Asset Value, Beginning of Period | | $ | 22.41 | | | $ | 21.47 | | | $ | 20.02 | | | $ | 15.97 | | | $ | 15.79 | | | $ | 14.38 | |
| | | | | | | | | | | | | | | | | | | | | | | | | |
| | | | | | | | | | | | | | | | | | | | | | | | | |
| Income from Investment Operations: | | | | | | | | | | | | | | | | | | | | | | | | |
| Net investment income (loss) | | | (0.02 | ) | | | (0.07 | ) | | | (0.03 | ) | | | 0.02 | | | | (0.02 | ) | | | (0.01 | ) |
| Net realized and unrealized gains (losses) on investments | | | 0.91 | | | | 4.46 | | | | 3.84 | | | | 4.03 | | | | 0.20 | | | | 1.45 | |
| | | | | | | | | | | | | | | | | | | | | | | | | |
| Total from investment operations | | | 0.89 | | | | 4.39 | | | | 3.81 | | | | 4.05 | | | | 0.18 | | | | 1.44 | |
| | | | | | | | | | | | | | | | | | | | | | | | | |
| Distributions & Other: | | | | | | | | | | | | | | | | | | | | | | | | |
| Net investment income | | | — | | | | — | | | | (0.03 | ) | | | — | | | | — | | | | (0.03 | ) |
| Net realized gains | | | (2.86 | ) | | | (3.45 | ) | | | (2.33 | ) | | | — | | | | — | | | | — | |
| Redemption fees [See Note 2(h)] | | | — | | | | — | (1) | | | — | (1) | | | — | (1) | | | — | (1) | | | — | (1) |
| | | | | | | | | | | | | | | | | | | | | | | | | |
| Total distributions and other | | | (2.86 | ) | | | (3.45 | ) | | | (2.36 | ) | | | — | | | | — | | | | (0.03 | ) |
| | | | | | | | | | | | | | | | | | | | | | | | | |
| Net Asset Value, End of Period | | $ | 20.44 | | | $ | 22.41 | | | $ | 21.47 | | | $ | 20.02 | | | $ | 15.97 | | | $ | 15.79 | |
| | | | | | | | | | | | | | | | | | | | | | | | | |
| | | | | | | | | | | | | | | | | | | | | | | | | |
| Total Return | | | 4.04 | %(2) | | | 22.27 | % | | | 21.86 | % | | | 25.36 | % | | | 1.14 | % | | | 10.02 | % |
| | | | | | | | | | | | | | | | | | | | | | | | | |
| | | | | | | | | | | | | | | | | | | | | | | | | |
| Supplemental Data and Ratios: | | | | | | | | | | | | | | | | | | | | | | | | |
| | | | | | | | | | | | | | | | | | | | | | | | | |
| Net assets, end of Period (000s) | | $ | 913,085 | | | $ | 933,054 | | | $ | 854,708 | | | $ | 966,010 | | | $ | 936,382 | | | $ | 1,451,877 | |
| | | | | | | | | | | | | | | | | | | | | | | | | |
| Ratio of expenses to average net assets, less waivers and before expenses paid indirectly, plus recoupment of previously waived expenses | | | 1.33 | %(3) | | | 1.34 | % | | | 1.35 | % | | | 1.34 | % | | | 1.33 | % | | | 1.33 | % |
| | | | | | | | | | | | | | | | | | | | | | | | | |
| Ratio of net investment income (loss) to average net assets, net of waivers, recoupment of previously waived expenses and expenses paid indirectly | | | (0.25 | )%(3) | | | (0.35 | )% | | | (0.10 | )% | | | 0.09 | % | | | (0.04 | )% | | | (0.06 | )% |
| | | | | | | | | | | | | | | | | | | | | | | | | |
| Ratio of expenses to average net assets, before waivers, recoupment of previously waived expenses and expenses paid indirectly | | | 1.33 | %(3) | | | 1.34 | % | | | 1.35 | % | | | 1.34 | % | | | 1.33 | % | | | 1.33 | % |
| | | | | | | | | | | | | | | | | | | | | | | | | |
| Ratio of net investment income (loss) to average net assets, before waivers, recoupment of previously waived expenses and expenses paid indirectly | | | (0.25 | )%(3) | | | (0.35 | )% | | | (0.10 | )% | | | 0.09 | % | | | (0.04 | )% | | | (0.06 | )% |
| | | | | | | | | | | | | | | | | | | | | | | | | |
| Portfolio turnover rate | | | 35 | %(2) | | | 71 | % | | | 92 | % | | | 66 | % | | | 82 | % | | | 85 | % |
See notes to financial statements.
MARSICO
GROWTH FUND | | | MARSICO
21st CENTURY FUND | |
| | | | | |
Six-Month
Period Ended
3/31/15
(Unaudited) | | | Year
Ended
9/30/14 | | | Year
Ended
9/30/13 | | | Year
Ended
9/30/12 | | | Year
Ended
9/30/11 | | | Year
Ended
9/30/10 | | | Six-Month
Period Ended
3/31/15
(Unaudited) | | | Year
Ended
9/30/14 | | | Year
Ended
9/30/13 | | | Year
Ended
9/30/12 | | | Year
Ended
9/30/11 | | | Year
Ended
9/30/10 | |
| | | | | | | | | | | | | | | | | | | | | | | | | | | | | | | | | | |
| $ | 23.63 | | | $ | 25.03 | | | $ | 21.96 | | | $ | 17.43 | | | $ | 17.04 | | | $ | 15.32 | | | $ | 20.90 | | | $ | 18.05 | | | $ | 14.24 | | | $ | 11.36 | | | $ | 12.38 | | | $ | 11.56 | |
| | | | | | | | | | | | | | | | | | | | | | | | | | | | | | | | | | | | | | | | | | | | | | | |
| | | | | | | | | | | | | | | | | | | | | | | | | | | | | | | | | | | | | | | | | | | | | | | |
| | | | | | | | | | | | | | | | | | | | | | | | | | | | | | | | | | | | | | | | | | | | | | | |
| | (0.04 | ) | | | (0.08 | ) | | | — | (1) | | | 0.03 | | | | — | (1) | | | 0.01 | | | | (0.09 | ) | | | (0.21 | ) | | | (0.09 | ) | | | (0.06 | ) | | | (0.06 | ) | | | (0.08 | ) |
| | 0.83 | | | | 4.01 | | | | 4.30 | | | | 4.51 | | | | 0.40 | | | | 1.78 | | | | 1.58 | | | | 3.06 | | | | 3.90 | | | | 2.94 | | | | (0.96 | ) | | | 0.90 | |
| | | | | | | | | | | | | | | | | | | | | | | | | | | | | | | | | | | | | | | | | | | | | | | |
| | 0.79 | | | | 3.93 | | | | 4.30 | | | | 4.54 | | | | 0.40 | | | | 1.79 | | | | 1.49 | | | | 2.85 | | | | 3.81 | | | | 2.88 | | | | (1.02 | ) | | | 0.82 | |
| | | | | | | | | | | | | | | | | | | | | | | | | | | | | | | | | | | | | | | | | | | | | | | |
| | | | | | | | | | | | | | | | | | | | | | | | | | | | | | | | | | | | | | | | | | | | | | | |
| | — | | | | (0.06 | ) | | | (0.04 | ) | | | (0.01 | ) | | | (0.01 | ) | | | (0.07 | ) | | | — | | | | — | | | | — | | | | — | | | | — | | | | — | |
| | (2.75 | ) | | | (5.27 | ) | | | (1.19 | ) | | | — | | | | — | | | | — | | | | — | | | | — | | | | — | | | | — | | | | — | | | | — | |
| | — | | | | — | (1) | | | — | (1) | | | — | (1) | | | — | (1) | | | — | (1) | | | — | | | | — | (1) | | | — | (1) | | | — | (1) | | | — | (1) | | | — | (1) |
| | | | | | | | | | | | | | | | | | | | | | | | | | | | | | | | | | | | | | | | | | | | | | | |
| | (2.75 | ) | | | (5.33 | ) | | | (1.23 | ) | | | (0.01 | ) | | | (0.01 | ) | | | (0.07 | ) | | | — | | | | — | | | | — | | | | — | | | | — | | | | — | |
| | | | | | | | | | | | | | | | | | | | | | | | | | | | | | | | | | | | | | | | | | | | | | | |
| $ | 21.67 | | | $ | 23.63 | | | $ | 25.03 | | | $ | 21.96 | | | $ | 17.43 | | | $ | 17.04 | | | $ | 22.39 | | | $ | 20.90 | | | $ | 18.05 | | | $ | 14.24 | | | $ | 11.36 | | | $ | 12.38 | |
| | | | | | | | | | | | | | | | | | | | | | | | | | | | | | | | | | | | | | | | | | | | | | | |
| | | | | | | | | | | | | | | | | | | | | | | | | | | | | | | | | | | | | | | | | | | | | | | |
| | 3.34 | %(2) | | | 17.51 | % | | | 20.92 | % | | | 26.04 | % | | | 2.34 | % | | | 11.75 | % | | | 7.13 | %(2) | | | 15.79 | % | | | 26.76 | % | | | 25.35 | % | | | (8.24 | )% | | | 7.09 | % |
| | | | | | | | | | | | | | | | | | | | | | | | | | | | | | | | | | | | | | | | | | | | | | | |
| | | | | | | | | | | | | | | | | | | | | | | | | | | | | | | | | | | | | | | | | | | | | | | |
| | | | | | | | | | | | | | | | | | | | | | | | | | | | | | | | | | | | | | | | | | | | | | | |
| | | | | | | | | | | | | | | | | | | | | | | | | | | | | | | | | | | | | | | | | | | | | | | |
| $ | 510,176 | | | $ | 562,653 | | | $ | 564,766 | | | $ | 677,393 | | | $ | 666,925 | | | $ | 883,053 | | | $ | 313,691 | | | $ | 316,293 | | | $ | 312,215 | | | $ | 354,545 | | | $ | 495,482 | | | $ | 757,438 | |
| | | | | | | | | | | | | | | | | | | | | | | | | | | | | | | | | | | | | | | | | | | | | | | |
| | 1.37 | %(3) | | | 1.37 | % | | | 1.37 | % | | | 1.35 | % | | | 1.33 | % | | | 1.33 | % | | | 1.43 | %(3) | | | 1.42 | % | | | 1.45 | % | | | 1.41 | % | | | 1.37 | % | | | 1.37 | % |
| | | | | | | | | | | | | | | | | | | | | | | | | | | | | | | | | | | | | | | | | | | | | | | |
| | (0.34 | )%(3) | | | (0.34 | )% | | | 0.01 | % | | | 0.15 | % | | | 0.03 | % | | | 0.04 | % | | | (0.67 | )%(3) | | | (0.88 | )% | | | (0.33 | )% | | | (0.31 | )% | | | (0.32 | )% | | | (0.60 | )% |
| | | | | | | | | | | | | | | | | | | | | | | | | | | | | | | | | | | | | | | | | | | | | | | |
| | 45 | %(2) | | | 80 | % | | | 114 | % | | | 65 | % | | | 67 | % | | | 67 | % | | | 55 | %(2) | | | 83 | % | | | 102 | % | | | 63 | % | | | 86 | % | | | 100 | % |
FINANCIAL HIGHLIGHTS
| | | MARSICO
INTERNATIONAL OPPORTUNITIES FUND | |
| | | | |
For a Fund Share Outstanding Throughout the Period | | Six-Month
Period Ended
3/31/15
(Unaudited) | | | Year
Ended
9/30/14 | | | Year
Ended
9/30/13 | | | Year
Ended
9/30/12 | | | Year
Ended
9/30/11 | | | Year
Ended
9/30/10 | |
| | | | | | | | | | | | | | | | | | | |
| Net Asset Value, Beginning of Period | | $ | 14.72 | | | $ | 15.30 | | | $ | 12.50 | | | $ | 10.61 | | | $ | 12.57 | | | $ | 11.86 | |
| | | | | | | | | | | | | | | | | | | | | | | | | |
| | | | | | | | | | | | | | | | | | | | | | | | | |
| Income from Investment Operations: | | | | | | | | | | | | | | | | | | | | | | | | |
| Net investment income (loss) | | | (0.12 | ) | | | (0.06 | ) | | | 0.09 | | | | 0.01 | | | | (0.22 | ) | | | 0.04 | |
| Net realized and unrealized gains (losses) on investments | | | 1.41 | | | | (0.42 | ) | | | 2.71 | | | | 1.88 | | | | (1.49 | ) | | | 0.72 | |
| | | | | | | | | | | | | | | | | | | | | | | | | |
| Total from investment operations | | | 1.29 | | | | (0.48 | ) | | | 2.80 | | | | 1.89 | | | | (1.71 | ) | | | 0.76 | |
| | | | | | | | | | | | | | | | | | | | | | | | | |
| Distributions & Other: | | | | | | | | | | | | | | | | | | | | | | | | |
| Net investment income | | | — | | | | (0.10 | ) | | | — | | | | — | | | | (0.25 | ) | | | (0.05 | ) |
| Net realized gains | | | — | | | | — | | | | — | | | | — | | | | — | | | | — | |
| Redemption fees [See Note 2(h)] | | | — | | | | — | (1) | | | — | (1) | | | — | (1) | | | — | (1) | | | — | (1) |
| | | | | | | | | | | | | | | | | | | | | | | | | |
| Total distributions and other | | | — | | | | (0.10 | ) | | | — | | | | — | | | | (0.25 | ) | | | (0.05 | ) |
| | | | | | | | | | | | | | | | | | | | | | | | | |
| Net Asset Value, End of Period | | $ | 16.01 | | | $ | 14.72 | | | $ | 15.30 | | | $ | 12.50 | | | $ | 10.61 | | | $ | 12.57 | |
| | | | | | | | | | | | | | | | | | | | | | | | | |
| | | | | | | | | | | | | | | | | | | | | | | | | |
| Total Return | | | 8.76 | %(2) | | | (3.18 | )% | | | 22.40 | % | | | 17.81 | % | | | (13.98 | )% | | | 6.48 | % |
| | | | | | | | | | | | | | | | | | | | | | | | | |
| | | | | | | | | | | | | | | | | | | | | | | | | |
| Supplemental Data and Ratios: | | | | | | | | | | | | | | | | | | | | | | | | |
| | | | | | | | | | | | | | | | | | | | | | | | | |
| Net assets, end of Period (000s) | | $ | 102,870 | | | $ | 175,984 | | | $ | 119,522 | | | $ | 134,221 | | | $ | 153,855 | | | $ | 359,016 | |
| | | | | | | | | | | | | | | | | | | | | | | | | |
| Ratio of expenses to average net assets, less waivers and before expenses paid indirectly, plus recoupment of previously waived expenses | | | 1.60 | %(3) | | | 1.60 | % | | | 1.60 | % | | | 1.60 | % | | | 1.56 | % | | | 1.52 | % |
| | | | | | | | | | | | | | | | | | | | | | | | | |
| Ratio of net investment income (loss) to average net assets, net of waivers, recoupment of previously waived expenses and expenses paid indirectly | | | (0.76 | )%(3) | | | (0.55 | )% | | | 0.61 | % | | | 0.29 | % | | | (0.22 | )% | | | 0.31 | % |
| | | | | | | | | | | | | | | | | | | | | | | | | |
| Ratio of expenses to average net assets, before waivers, recoupment of previously waived expenses and expenses paid indirectly | | | 1.75 | %(3) | | | 1.52 | % | | | 1.74 | % | | | 1.65 | % | | | 1.56 | % | | | 1.52 | % |
| | | | | | | | | | | | | | | | | | | | | | | | | |
| Ratio of net investment income (loss) to average net assets, before waivers, recoupment of previously waived expenses and expenses paid indirectly | | | (0.91 | )%(3) | | | (0.47 | )% | | | 0.47 | % | | | 0.24 | % | | | (0.22 | )% | | | 0.31 | % |
| | | | | | | | | | | | | | | | | | | | | | | | | |
| Portfolio turnover rate | | | 127 | %(2) | | | 178 | % | | | 121 | % | | | 66 | % | | | 103 | % | | | 134 | % |
See notes to financial statements.
MARSICO
FLEXIBLE CAPITAL FUND | | | MARSICO
GLOBAL FUND | |
| | | | | |
Six-Month
Period Ended
3/31/15
(Unaudited) | | | Year
Ended
9/30/14 | | | Year
Ended
9/30/13 | | | Year
Ended
9/30/12 | | | Year
Ended
9/30/11 | | | Year
Ended
9/30/10 | | | Six-Month
Period Ended
3/31/15
(Unaudited) | | | Year
Ended
9/30/14 | | | Year
Ended
9/30/13 | | | Year
Ended
9/30/12 | | | Year
Ended
9/30/11 | | | Year
Ended
9/30/10 | |
| | | | | | | | | | | | | | | | | | | | | | | | | | | | | | | | | | |
| $ | 18.39 | | | $ | 18.21 | | | $ | 15.79 | | | $ | 12.05 | | | $ | 11.97 | | | $ | 9.65 | | | $ | 14.45 | | | $ | 14.74 | | | $ | 11.51 | | | $ | 9.06 | | | $ | 9.90 | | | $ | 8.59 | |
| | | | | | | | | | | | | | | | | | | | | | | | | | | | | | | | | | | | | | | | | | | | | | | |
| | | | | | | | | | | | | | | | | | | | | | | | | | | | | | | | | | | | | | | | | | | | | | | |
| | | | | | | | | | | | | | | | | | | | | | | | | | | | | | | | | | | | | | | | | | | | | | | |
| | 0.04 | | | | (0.04 | ) | | | 0.04 | | | | 0.03 | | | | 0.08 | | | | 0.27 | | | | (0.05 | ) | | | (0.05 | ) | | | (0.02 | ) | | | (0.07 | ) | | | (0.05 | ) | | | (0.05 | ) |
| | 1.10 | | | | 2.18 | | | | 3.28 | | | | 3.77 | | | | 0.12 | | | | 2.42 | | | | 0.87 | | | | 1.93 | | | | 3.25 | | | | 2.52 | | | | (0.70 | ) | | | 1.42 | |
| | | | | | | | | | | | | | | | | | | | | | | | | | | | | | | | | | | | | | | | | | | | | | | |
| | 1.14 | | | | 2.14 | | | | 3.32 | | | | 3.80 | | | | 0.20 | | | | 2.69 | | | | 0.82 | | | | 1.88 | | | | 3.23 | | | | 2.45 | | | | (0.75 | ) | | | 1.37 | |
| | | | | | | | | | | | | | | | | | | | | | | | | | | | | | | | | | | | | | | | | | | | | | | |
| | | | | | | | | | | | | | | | | | | | | | | | | | | | | | | | | | | | | | | | | | | | | | | |
| | — | | | | — | | | | (0.09 | ) | | | (0.06 | ) | | | (0.09 | ) | | | (0.37 | ) | | | — | | | | — | | | | — | | | | — | | | | (0.09 | ) | | | (0.06 | ) |
| | (1.74 | ) | | | (1.96 | ) | | | (0.81 | ) | | | — | | | | (0.03 | ) | | | — | | | | (1.66 | ) | | | (2.17 | ) | | | — | | | | — | | | | — | | | | — | |
| | — | | | | — | (1) | | | — | (1) | | | — | (1) | | | — | (1) | | | — | (1) | | | — | | | | — | (1) | | | — | (1) | | | — | (1) | | | — | (1) | | | — | (1) |
| | | | | | | | | | | | | | | | | | | | | | | | | | | | | | | | | | | | | | | | | | | | | | | |
| | (1.74 | ) | | | (1.96 | ) | | | (0.90 | ) | | | (0.06 | ) | | | (0.12 | ) | | | (0.37 | ) | | | (1.66 | ) | | | (2.17 | ) | | | — | | | | — | | | | (0.09 | ) | | | (0.06 | ) |
| | | | | | | | | | | | | | | | | | | | | | | | | | | | | | | | | | | | | | | | | | | | | | | |
| $ | 17.79 | | | $ | 18.39 | | | $ | 18.21 | | | $ | 15.79 | | | $ | 12.05 | | | $ | 11.97 | | | $ | 13.61 | | | $ | 14.45 | | | $ | 14.74 | | | $ | 11.51 | | | $ | 9.06 | | | $ | 9.90 | |
| | | | | | | | | | | | | | | | | | | | | | | | | | | | | | | | | | | | | | | | | | | | | | | |
| | | | | | | | | | | | | | | | | | | | | | | | | | | | | | | | | | | | | | | | | | | | | | | |
| | 6.37 | %(2) | | | 12.15 | % | | | 22.34 | % | | | 31.63 | % | | | 1.59 | % | | | 28.68 | % | | | 6.16 | %(2) | | | 13.23 | % | | | 28.06 | % | | | 27.04 | % | | | (7.73 | )% | | | 16.01 | % |
| | | | | | | | | | | | | | | | | | | | | | | | | | | | | | | | | | | | | | | | | | | | | | | |
| | | | | | | | | | | | | | | | | | | | | | | | | | | | | | | | | | | | | | | | | | | | | | | |
| | | | | | | | | | | | | | | | | | | | | | | | | | | | | | | | | | | | | | | | | | | | | | | |
| | | | | | | | | | | | | | | | | | | | | | | | | | | | | | | | | | | | | | | | | | | | | | | |
| $ | 697,630 | | | $ | 806,448 | | | $ | 805,735 | | | $ | 590,293 | | | $ | 409,145 | | | $ | 132,345 | | | $ | 72,819 | | | $ | 73,475 | | | $ | 61,383 | | | $ | 54,195 | | | $ | 108,021 | | | $ | 116,101 | |
| | | | | | | | | | | | | | | | | | | | | | | | | | | | | | | | | | | | | | | | | | | | | | | |
| | 1.40 | %(3) | | | 1.38 | % | | | 1.41 | % | | | 1.43 | % | | | 1.27 | % | | | 0.75 | % | | | 1.60 | %(3) | | | 1.60 | % | | | 1.60 | % | | | 1.60 | % | | | 1.48 | % | | | 1.54 | % |
| | | | | | | | | | | | | | | | | | | | | | | | | | | | | | | | | | | | | | | | | | | | | | | |
| | 0.53 | %(3) | | | (0.21 | )% | | | 0.16 | % | | | 0.17 | % | | | 0.55 | % | | | 1.33 | % | | | (0.79 | )%(3) | | | (0.42 | )% | | | (0.06 | )% | | | (0.32 | )% | | | (0.46 | )% | | | (0.57 | )% |
| | | | | | | | | | | | | | | | | | | | | | | | | | | | | | | | | | | | | | | | | | | | | | | |
| | 1.40 | %(3) | | | 1.38 | % | | | 1.41 | % | | | 1.43 | % | | | 1.40 | % | | | 1.73 | % | | | 1.67 | %(3) | | | 1.66 | % | | | 1.86 | % | | | 1.70 | % | | | 1.48 | % | | | 1.54 | % |
| | | | | | | | | | | | | | | | | | | | | | | | | | | | | | | | | | | | | | | | | | | | | | | |
| | 0.53 | %(3) | | | (0.21 | )% | | | 0.16 | % | | | 0.17 | % | | | 0.42 | % | | | 0.35 | % | | | (0.86 | )%(3) | | | (0.48 | )% | | | (0.32 | )% | | | (0.42 | )% | | | (0.46 | )% | | | (0.57 | )% |
| | | | | | | | | | | | | | | | | | | | | | | | | | | | | | | | | | | | | | | | | | | | | | | |
| | 37 | %(2) | | | 118 | % | | | 145 | % | | | 121 | % | | | 231 | % | | | 146 | % | | | 50 | %(2) | | | 129 | % | | | 134 | % | | | 95 | % | | | 93 | % | | | 125 | % |
| NOTES TO FINANCIAL STATEMENTS |
NOTES TO FINANCIAL STATEMENTS March 31, 2015 (Unaudited)
The Marsico Investment Fund (the “Trust”) was organized on October 1, 1997, as a Delaware statutory trust and is registered under the Investment Company Act of 1940 (the “1940 Act”) as an open-end management investment company. The Focus Fund, Growth Fund, 21st Century Fund, International Opportunities Fund, Flexible Capital Fund, and Global Fund (collectively, the “Funds”) are separate investment portfolios of the Trust. The Focus Fund is a non-diversified fund and the Growth Fund, the 21st Century Fund, the International Opportunities Fund, the Flexible Capital Fund, and the Global Fund are diversified funds. The Focus Fund and Growth Fund commenced operations on December 31, 1997, the 21st Century Fund commenced operations on February 1, 2000, the International Opportunities Fund commenced operations on June 30, 2000, the Flexible Capital Fund commenced operations on December 29, 2006, and the Global Fund commenced operations on June 29, 2007. Trustees and officers of the Trust and employees of Marsico Capital Management, LLC (the “Adviser”) own approximately 8%, 5%, and 17% of the Focus Fund’s, International Opportunities Fund’s, and Global Fund’s outstanding shares, respectively, as of March 31, 2015.
| 2. | Significant Accounting Policies |
The Funds qualify as investment companies under Accounting Standards Update No. 2013-08, Accounting Standard Codification Topic 946, Financial Services — Investment Companies (“ASC 946”). The following is a summary of significant accounting policies consistently followed by the Funds in the preparation of their financial statements. These policies are in conformity with Generally Accepted Accounting Principles (“GAAP”) in the United States of America for investment companies and follow the accounting guidance provided in ASC 946. The presentation of financial statements in conformity with GAAP requires management to make estimates and assumptions that affect the reported amounts and disclosures of assets and liabilities at the date of the financial statements and the reported amounts and disclosures of income and expenses during the reporting period. Actual results could differ from those estimates.
| (a) | Investment Valuation — A security traded on a recognized stock exchange is generally valued at the last sale price prior to the closing of the principal exchange on which the security is traded. Securities traded on NASDAQ generally will be valued at the NASDAQ Official Closing Price. If no sale price is reported on the valuation date, the most current bid price will generally be used, with the exception of short option positions which will generally utilize the most current ask price. Other securities for which over-the-counter market quotations are readily available are generally valued at the last sale price. Debt securities that will mature in more than 60 days are generally valued at their bid prices furnished by a pricing service approved by the Funds’ Board of Trustees and subject to review pursuant to procedures established by, and under the general supervision of, the Funds’ Board of Trustees. Debt securities that will mature in 60 days or less are valued at amortized cost, if it approximates market value. Any securities for which market quotations are not readily available are valued at their fair value as determined in good faith by the Adviser in accordance with procedures established by, and under the general supervision of, the Funds’ Board of Trustees. The Funds may use pricing services to assist in determining market value. The Board of Trustees has authorized the use of a pricing service to assist the Funds in valuing certain equity securities listed or traded on foreign security exchanges in the Funds’ portfolios in certain circumstances where there is a significant change in the value of related US-traded securities, as represented by, for example, the S&P 500 Index. |
“Fair Value Measurements and Disclosures” (the “Fair Value Statement”) defines fair value, establishes a framework for measuring fair value in GAAP, and expands disclosures about fair value measurements. Under the Fair Value Statement, various inputs are used in determining the value of the Funds’ investments.
These inputs are summarized into three broad levels and described below:
| • | Level 1 – quoted prices in active markets for identical investments |
| • | Level 2 – other significant observable inputs (including quoted prices for similar investments, interest rates, and evaluated quotations obtained from pricing services) |
| • | Level 3 – significant unobservable inputs (including the Fund’s own assumptions in determining the fair value of investments). |
| NOTES TO FINANCIAL STATEMENTS |
The inputs or methodology used for valuing investments are not an indication of the risk associated with investing in those investments. Changes in valuation techniques may result in transfers between the levels during the reporting period. The Funds recognize transfers between the levels as of the end of each reporting period. There were no transfers between each of the three levels during the reporting period. The following is a summary of the fair values of the Funds’ investments in each category and economic sector as of March 31, 2015:
Fund Investments by
Major Security Type | | Level 1 | | | Level 2 | | | Level 3 | | | Total | |
| Marsico Focus Fund | | | | | | | | | | | | |
| Assets | | | | | | | | | | | | |
| Common Stocks | | | | | | | | | | | | |
| Consumer Discretionary | | $ | 177,004,154 | | | $ | — | | | $ | — | | | $ | 177,004,154 | |
| Consumer Staples | | | 16,534,345 | | | | — | | | | — | | | | 16,534,345 | |
| Financials | | | 29,186,359 | | | | — | | | | — | | | | 29,186,359 | |
| Health Care | | | 297,905,441 | | | | — | | | | — | | | | 297,905,441 | |
| Industrials | | | 75,219,012 | | | | — | | | | — | | | | 75,219,012 | |
| Information Technology | | | 244,596,871 | | | | — | | | | — | | | | 244,596,871 | |
| Materials | | | 51,861,943 | | | | — | | | | — | | | | 51,861,943 | |
| Short-term Investments | | | 31,246,368 | | | | — | | | | — | | | | 31,246,368 | |
| | | | | | | | | | | | | | | $ | 923,554,493 | |
| Marsico Growth Fund | | | | | | | | | | | | | | | | |
| Assets | | | | | | | | | | | | | | | | |
| Common Stocks | | | | | | | | | | | | | | | | |
| Consumer Discretionary | | $ | 98,390,552 | | | $ | — | | | $ | — | | | $ | 98,390,552 | |
| Consumer Staples | | | 9,256,905 | | | | — | | | | — | | | | 9,256,905 | |
| Financials | | | 12,510,810 | | | | — | | | | — | | | | 12,510,810 | |
| Health Care | | | 147,427,157 | | | | — | | | | — | | | | 147,427,157 | |
| Industrials | | | 72,174,885 | | | | — | | | | — | | | | 72,174,885 | |
| Information Technology | | | 150,901,507 | | | | — | | | | — | | | | 150,901,507 | |
| Materials | | | 18,624,783 | | | | — | | | | — | | | | 18,624,783 | |
| | | | | | | | | | | | | | | $ | 509,286,599 | |
Marsico 21st Century Fund | | | | | | | | | | | | | | | | |
| Assets | | | | | | | | | | | | | | | | |
| Common Stocks | | | | | | | | | | | | | | | | |
| Consumer Discretionary | | $ | 58,314,463 | | | $ | — | | | $ | — | | | $ | 58,314,463 | |
| Consumer Staples | | | 11,530,987 | | | | — | | | | — | | | | 11,530,987 | |
| Financials | | | 14,449,616 | | | | — | | | | — | | | | 14,449,616 | |
| Health Care | | | 71,430,893 | | | | — | | | | — | | | | 71,430,893 | |
| Industrials | | | 36,981,827 | | | | — | | | | — | | | | 36,981,827 | |
| Information Technology | | | 103,716,083 | | | | — | | | | — | | | | 103,716,083 | |
| Materials | | | 6,463,271 | | | | — | | | | — | | | | 6,463,271 | |
| Telecommunication Services | | | 5,388,357 | | | | — | | | | — | | | | 5,388,357 | |
| Short-term Investments | | | 6,883,277 | | | | — | | | | — | | | | 6,883,277 | |
| | | | | | | | | | | | | | | $ | 315,158,774 | |
| Marsico International Opportunities Fund | | | | | | | | | | | | | | | | |
| Assets | | | | | | | | | | | | | | | | |
| Common Stocks | | | | | | | | | | | | | | | | |
| Consumer Discretionary | | $ | 29,636,451 | | | $ | — | | | $ | — | | | $ | 29,636,451 | |
| Financials | | | 4,613,431 | | | | — | | | | — | | | | 4,613,431 | |
| Health Care | | | 24,364,135 | | | | — | | | | — | | | | 24,364,135 | |
| Industrials | | | 9,297,380 | | | | — | | | | — | | | | 9,297,380 | |
| Information Technology | | | 33,308,364 | | | | — | | | | — | | | | 33,308,364 | |
| Short-term Investments | | | 319,473 | | | | — | | | | — | | | | 319,473 | |
| | | | | | | | | | | | | | | $ | 101,539,234 | |
| NOTES TO FINANCIAL STATEMENTS |
NOTES TO FINANCIAL STATEMENTS March 31, 2015 (Unaudited) (continued)
Fund Investments by
Major Security Type | | Level 1 | | | Level 2 | | | Level 3 | | | Total | |
| Marsico Flexible Capital Fund | | | | | | | | | | | | |
| Assets | | | | | | | | | | | | |
| Common Stocks | | | | | | | | | | | | |
| Consumer Discretionary | | $ | 194,101,417 | | | $ | — | | | $ | — | | | $ | 194,101,417 | |
| Consumer Staples | | | 33,722,283 | | | | — | | | | — | | | | 33,722,283 | |
| Financials | | | 69,146,204 | | | | — | | | | — | | | | 69,146,204 | |
| Health Care | | | 125,018,754 | | | | — | | | | — | | | | 125,018,754 | |
| Industrials | | | 65,968,848 | | | | — | | | | — | | | | 65,968,848 | |
| Information Technology | | | 116,172,134 | | | | — | | | | — | | | | 116,172,134 | |
| Materials | | | 10,208,391 | | | | — | | | | — | | | | 10,208,391 | |
| Corporate Bonds | | | — | | | | 32,435,550 | | | | — | | | | 32,435,550 | |
| Preferred Stocks | | | 20,345,994 | | | | — | | | | — | | | | 20,345,994 | |
| Short-term Investments | | | 30,160,306 | | | | — | | | | — | | | | 30,160,306 | |
| | | | | | | | | | | | | | | $ | 697,279,881 | |
| Marsico Global Fund | | | | | | | | | | | | | | | | |
| Assets | | | | | | | | | | | | | | | | |
| Common Stocks | | | | | | | | | | | | | | | | |
| Consumer Discretionary | | $ | 21,149,312 | | | $ | — | | | $ | — | | | $ | 21,149,312 | |
| Health Care | | | 19,318,126 | | | | — | | | | — | | | | 19,318,126 | |
| Industrials | | | 6,580,941 | | | | — | | | | — | | | | 6,580,941 | |
| Information Technology | | | 20,907,534 | | | | — | | | | — | | | | 20,907,534 | |
| Materials | | | 3,446,811 | | | | — | | | | — | | | | 3,446,811 | |
| Short-term Investments | | | 1,591,392 | | | | — | | | | — | | | | 1,591,392 | |
| | | | | | | | | | | | | | | $ | 72,994,116 | |
| (b) | Expenses — The Funds are charged for those expenses that are directly attributable to each Fund, such as advisory and custodial fees. Expenses that are not directly attributable to a Fund are typically allocated among the Funds in proportion to their respective net assets and are in some cases allocated based on other factors. The Funds’ expenses may be reduced by advisory fee waivers, brokerage credits and uninvested cash balances earning interest or credits. Such credits are included in “Less waiver of expenses and expenses paid indirectly” on the Statements of Operations. |
Brokerage commissions may be paid to certain brokers which reduce transfer agent fees and expenses. For the six-month period ended March 31, 2015, the Funds received no such brokerage commission credits. The Funds received earnings credits on certain cash account balances which reduced transfer agent fees and expenses in the amount of $222, $128, $74, $26, $178, and $17 for the Focus Fund, Growth Fund, 21st Century Fund, International Opportunities Fund, Flexible Capital Fund, and Global Fund, respectively, for the six-month period ended March 31, 2015. Brokerage commission credits and earnings credits (if any) are included in “Less waiver of expenses and expenses paid indirectly” on the Statements of Operations.
| (c) | Federal Income Taxes — Each Fund intends to comply with the requirements of the Internal Revenue Code of 1986, as amended, (the “Internal Revenue Code”) necessary to continue to qualify as a regulated investment company and to make the requisite distributions of income to its shareholders which will be sufficient to relieve it from all or substantially all federal and state income taxes. Certain Funds may utilize earnings and profits on redemption of shares as part of the dividends paid deduction. |
| (d) | Distributions to Shareholders — Dividends from net investment income and net realized capital gains, if any, will be declared and paid at least annually. Distributions to shareholders are recorded on the ex-dividend date. Each Fund may periodically make reclassifications among certain of its capital accounts as a result of the timing and characterization of certain income and capital gains distributions determined in accordance with federal tax regulations, which may differ from GAAP. These reclassifications are due to differing treatment for items such as foreign currency transactions, passive foreign investment companies (“PFICs”) and net investment losses. |
| NOTES TO FINANCIAL STATEMENTS |
The Funds at times may invest in real estate investment trusts (“REITs”). REITs generally pay dividends to their investors based upon cash available from their operations and this amount may differ significantly from the REITs’ actual earnings and profits (“E&P”) determined for income tax purposes. It is common for these dividends to exceed the REITs’ taxable E&P, resulting in the excess portion of such dividends eventually being designated as a return of capital. Determination of the tax character of dividends made by REITs is typically performed by the REIT several months subsequent to the payment of the dividend. Therefore, due to timing issues, the Funds may be in a position of being required to calculate and pay required distribution amounts to their shareholders based on the best information available from the REITs, which may be prior to the final determination of the REITs’ taxable E&P, and it is possible that a portion of the Funds’ distribution amounts could include a return of capital to shareholders for federal income tax purposes.
| (e) | Foreign Currency Translation — The accounting records of the Funds are maintained in US dollars. For valuation purposes, values of securities denominated in foreign currencies are translated into US dollars at 4:00 p.m. Eastern Time. Amounts related to the purchase and sale of foreign securities and investment income are translated at the rates of exchange prevailing on the respective dates of such transactions. |
Reported realized gains and losses on foreign currency transactions arise from sales of portfolio securities, forward foreign currency contracts, currency gains or losses realized between the trade and settlement dates on securities transactions, and the difference between the amounts of dividends, interest, and foreign withholding taxes recorded on the Funds’ books and the US dollar equivalent of the amounts actually received or paid.
The Funds do not isolate that portion of the results of operations resulting from changes in foreign exchange rates on investments from the fluctuations arising from changes in market prices of securities held at the end of the reporting period. Net unrealized appreciation or depreciation on investments and foreign currency translations arises from changes in the value of assets and liabilities, including investments in securities at the end of the reporting period, resulting from changes in the exchange rates and changes in market prices of securities held. Transactions in foreign-denominated assets may involve greater risks than domestic transactions, including currency risk, political and economic risk, regulatory risk and market risk.
| (f) | Derivative Instruments — “Disclosure about Derivative Instruments and Hedging Activities” (the “Derivatives Statement”) requires enhanced disclosures about the Funds’ derivative and hedging activities, including how such activities are accounted for and their effects on the Funds’ financial position, performance and cash flows. |
The Funds are not intended as vehicles for investing substantially in derivative instruments, and may hold derivative instruments only infrequently. The Funds enter into derivative instruments in order to increase exposure to certain investments, asset classes, or markets, or for hedging purposes to hedge against adverse movements in securities prices, currency rates or interest rates. The Funds can hold various types of derivative instruments such as futures contracts and options on securities, financial indexes, and foreign currencies, options on futures, forward foreign currency contracts, interest rate swaps, credit default swaps, and swap-related products. The use of derivative instruments may involve risks such as the possibility of illiquid markets or imperfect correlation between the value of the derivative instruments and the underlying securities, or that the counterparty will fail to perform its obligations. There were no outstanding derivative instruments held by the Funds as of March 31, 2015 nor did the Funds utilize derivative instruments during the six-month period ended March 31, 2015.
Forward Foreign Currency Contracts — A forward currency contract is a commitment to purchase or sell foreign currency at a specified price on a future date. A Fund may enter into a forward foreign currency contract in order to hedge against foreign currency fluctuations, such as when the Fund elects to reduce exposure to changes in foreign currency exchange rates on foreign portfolio holdings denominated in or exposed to foreign currencies, or in preparation for purchasing securities in a particular market, or for other investment purposes.
The market value of a forward foreign currency contract fluctuates with changes in currency exchange rates. Outstanding forward foreign currency contracts are valued daily at current market rates and the resulting change in market value is recorded as unrealized appreciation or depreciation. When a forward foreign currency contract is settled, the Fund records a realized gain or loss equal to the difference between the value at the time the forward foreign currency contract was opened and the value at the time it was settled.
| NOTES TO FINANCIAL STATEMENTS |
NOTES TO FINANCIAL STATEMENTS March 31, 2015 (Unaudited) (continued)
The Funds are subject to foreign currency exchange risk in the normal course of pursuing their investment objectives. Forward foreign currency contracts may involve market risk in excess of the unrealized gain or loss reflected on the Statements of Assets and Liabilities. In addition, the Funds could be exposed to a credit risk if the counterparties are unable or unwilling to meet the terms of the contracts or if the value of the foreign currency changes unfavorably. In connection with these contracts, the Funds typically segregate cash and/or other securities as collateral in a sufficient value equal to the aggregate amount of the Funds’ commitments under the forward foreign currency contracts; such collateral would be in the possession of the Funds’ custodian, if applicable.
Options Contracts — The Funds may purchase or write (sell) put and call options on foreign and domestic stock indices, foreign currencies, and US and foreign securities that are traded on a securities exchange or an over-the-counter market. These transactions are generally for hedging purposes or for the purpose of earning additional income. In addition, the Funds may enter into such transactions for cross-hedging purposes. There is generally limited counterparty credit risk involved when entering into exchange-traded option contracts because the exchange’s clearinghouse acts as counterparty to all options traded on such exchange.
In purchasing an option, a Fund pays a premium whether or not the option is exercised. Additionally, the Fund bears the risk of loss of premium and change in market value should the counterparty not perform under the contract. Put and call options purchased are accounted for in the same manner as portfolio securities. The cost of securities acquired through the exercise of call options is increased by premiums paid. The proceeds from securities sold through the exercise of put options are decreased by the premiums paid.
When a Fund writes an option, the premium received by the Fund is recorded as a liability and is subsequently adjusted to the current market value of the option written. Premiums received from writing options that expire are recorded by the Fund on the expiration date as realized gains from option transactions. The difference between the premium and the amount paid on effecting a closing purchase transaction, including brokerage commissions, is also treated as a realized gain, or if the premium is less than the amount paid for the closing purchase transaction, as a realized loss. If a call option is exercised, the premium is added to the proceeds from the sale of the underlying security or currency in determining whether the Fund has realized a gain or loss. If a put option is exercised, the premium reduces the cost basis of the security or currency purchased by the Fund. In writing an option, the Fund bears the market risk of an unfavorable change in the price of the security or currency underlying the written option. Exercise of an option written by the Fund could result in the Fund selling or buying a security or currency at a price different from the current market value.
| (g) | Trustees’ Deferred Fee Plan — Effective February 1, 2000, the Board of Trustees adopted the Marsico Investment Fund Deferred Fee Plan (the “Deferred Fee Plan”), amended and restated as of December 30, 2005, which allows the Trustees to defer the receipt of all or a portion of their compensation received from the Funds. Any deferred fees are credited to accounts established on behalf of the Trustees into the Funds as directed by each Trustee. The amounts credited to these accounts increase or decrease in accordance with the performance of the Funds selected by the Trustees. The market value of the deferred account balances as of March 31, 2015 is shown on the Statements of Assets and Liabilities as part of an asset account, “Prepaid expenses and other assets”, and a liability account, “Accrued trustees’ fees”. Additionally, the fluctuation of the account balances due to the Funds’ performance is recorded by the Funds as unrealized appreciation (depreciation), which is shown as part of “Net unrealized appreciation on investments and foreign currency translations” on the Statements of Assets and Liabilities, and as compensation expense, which is shown as part of the expense account “Trustees’ fees and expenses” on the Statements of Operations. Fees earned and deferred by the Trustees for the six-month period ended March 31, 2015 are also included in “Trustees’ fees and expenses” on the Statements of Operations. Amounts contributed to the Deferred Fee Plan will be deferred until distributed in accordance with the Deferred Fee Plan. Unrealized appreciation (depreciation) of Fund shares held in the Deferred Fee Plan is subject to the Funds’ expense reimbursement agreement with the Adviser. |
| NOTES TO FINANCIAL STATEMENTS |
| (h) | Redemption Fee — Effective January 31, 2014, the Funds’ Board of Trustees approved the elimination of redemption fees from Fund share transactions placed on and after January 31, 2014. Prior to January 31, 2014, a 2.00% redemption fee was retained by the Funds to offset transaction costs and other expenses associated with short-term investing. The fee was imposed on certain redemptions or exchanges of shares held 30 days or less from their purchase date. Redemption fees were recorded by the Funds as a reduction of shares redeemed and as a credit to paid-in-capital. |
| (i) | Other — Investment transactions are accounted for on a trade date basis. Each Fund determines the gain or loss realized from the investment transactions by comparing the original cost of the security lot sold with the net sale proceeds. Dividend income is recognized on the ex-dividend date. Certain dividends from foreign securities are recorded when the Funds are informed of the dividend if such information is obtained subsequent to the ex-dividend date. Interest income is recognized on an accrual basis and includes amortization of premiums and accretion of discounts. |
| (j) | Indemnifications — In the normal course of business, the Funds enter into contracts that contain provisions indemnifying other parties against specified potential liabilities. Each Fund’s maximum exposure under these arrangements is unknown as this would involve future claims that may be made against the Fund that have not yet occurred. However, based on experience, the Funds expect the risk of loss to be remote. |
| 3. | Investment Advisory Agreement and Transactions With Affiliates |
Each Fund has an agreement with the Adviser to furnish investment advisory services to the Funds. Under the terms of these agreements, the Adviser is compensated for managing the Focus Fund and the Growth Fund at the rate of 0.85% per year of average daily net assets up to $3 billion in each Fund, and 0.75% per year of average daily net assets exceeding $3 billion in each Fund; and at a rate of 0.85% of the average daily net assets of the 21st Century Fund, the International Opportunities Fund, the Flexible Capital Fund, and the Global Fund. The Adviser has entered into a written expense limitation and fee waiver agreement under which it has agreed to limit the total expenses of each Fund (excluding interest, taxes, acquired fund fees and expenses, litigation, brokerage, and extraordinary expenses) to an annual rate of 1.60% of the average net assets of the Focus Fund, the International Opportunities Fund, the Flexible Capital Fund, and the Global Fund, and 1.50% of the average net assets of the Growth Fund and the 21st Century Fund until January 31, 2016.
The Adviser may recoup from a Fund fees previously waived or expenses previously reimbursed by the Adviser with respect to that Fund pursuant to this agreement (or a previous expenses limitation agreement) if: (1) such recoupment by the Adviser does not cause the Fund, at the time of recoupment, to exceed the lesser of (a) the expense limitation in effect at the time the relevant amount was waived and/or reimbursed, or (b) the expense limitation in effect at the time of the proposed recoupment, and (2) the recoupment is made within three fiscal years after the end of the fiscal year in which the amount was waived or reimbursed. As of March 31, 2015, recoupment amounts (in thousands) that may potentially be made by the International Opportunities Fund and Global Fund to the Adviser are as follows:
| Year of Expiration | | International
Opportunities Fund | | | Global Fund | |
| 2015 | | $ | — | | | $ | 69 | |
| 2016 | | | 101 | | | | 140 | |
| 2017 | | | — | | | | 47 | |
| 2018 | | | 84 | | | | 25 | |
| | | $ | 185 | | | $ | 281 | |
Certain officers of the Trust are also officers of the Adviser. The Funds pay a portion of the Chief Compliance Officer’s total compensation costs which is shown as part of the expense account “Professional fees” on the Statements of Operations. No other officers of the Trust affiliated with the Adviser received compensation from the Funds during the six-month period ended March 31, 2015.
| NOTES TO FINANCIAL STATEMENTS |
NOTES TO FINANCIAL STATEMENTS March 31, 2015 (Unaudited) (continued)
| 4. | Distribution and Service Plan |
The Funds have adopted a Distribution and Service Plan (the “Plan”) pursuant to Rule 12b-1 under the 1940 Act. The Plan authorizes payments by the Funds in connection with the distribution of their shares at an annual rate, as determined from time to time by the Board of Trustees, of up to 0.25% of a Fund’s average daily net assets. The Adviser may, out of its own resources and at its sole discretion, make certain payments on behalf of the Plan for expenses incurred by a Fund for distribution of Fund shares and related services.
| 5. | Investment Transactions |
The aggregate purchases and sales of securities, excluding short-term investments, for the Funds for the six-month period ended March 31, 2015, were as follows:
| (Amounts in thousands) | | Focus
Fund | | | Growth
Fund | | | 21st
Century
Fund | | | International
Opportunities
Fund | | | Flexible
Capital
Fund | | | Global
Fund | |
| Purchases | | $ | 321,577 | | | $ | 239,290 | | | $ | 168,766 | | | $ | 142,303 | | | $ | 267,103 | | | $ | 35,416 | |
| Sales | | $ | 359,225 | | | $ | 290,432 | | | $ | 189,007 | | | $ | 198,907 | | | $ | 409,992 | | | $ | 41,233 | |
There were no purchases or sales of US government securities, excluding short-term investments.
| 6. | Federal Income Tax Information |
“Accounting for Uncertainty in Income Taxes” (the “Income Tax Statement”) requires an evaluation of tax positions taken (or expected to be taken) in the course of preparing a Fund’s tax returns to determine whether these positions meet a “more-likely-than-not” standard that, based on the technical merits, have a more than fifty percent likelihood of being sustained by a taxing authority upon examination. A tax position that meets the “more-likely-than-not” recognition threshold is measured to determine the amount of benefit to recognize in the financial statements. The Funds recognize interest and penalties, if any, related to unrecognized tax benefits as income tax expense in the Statements of Operations.
The Income Tax Statement requires management of the Funds to analyze all open tax years, fiscal years 2011-2015 as defined by Internal Revenue Service (“IRS”) statute of limitations for all major jurisdictions, including federal tax authorities and certain state tax authorities. As of and during the six-month period ended March 31, 2015, the Funds did not have a liability for any unrecognized tax benefits. The Funds have no examinations in progress and are not aware of any tax positions for which it is reasonably possible that the total amounts of unrecognized tax benefits will significantly change in the next twelve months.
At March 31, 2015 gross unrealized appreciation and depreciation of investments, based on cost for federal income tax purposes were as follows:
| (Amounts in thousands) | | Focus
Fund | | | Growth
Fund | | | 21st
Century
Fund | | | International
Opportunities
Fund | | | Flexible
Capital
Fund | | | Global
Fund | |
| Cost of Investments | | $ | 680,183 | | | $ | 381,217 | | | $ | 242,841 | | | $ | 88,333 | | | $ | 554,509 | | | $ | 59,446 | |
| | | | | | | | | | | | | | | | | | | | | | | | | |
| Gross Unrealized Appreciation | | $ | 243,672 | | | $ | 131,038 | | | $ | 73,916 | | | $ | 14,337 | | | $ | 148,948 | | | $ | 14,097 | |
| Gross Unrealized Depreciation | | | (301 | ) | | | (2,968 | ) | | | (1,598 | ) | | | (1,131 | ) | | | (6,177 | ) | | | (549 | ) |
| | | | | | | | | | | | | | | | | | | | | | | | | |
| Net Unrealized Appreciation on investments | | $ | 243,371 | | | $ | 128,070 | | | $ | 72,318 | | | $ | 13,206 | | | $ | 142,771 | | | $ | 13,548 | |
The difference between cost amounts for financial statement and federal income tax purposes is due primarily to wash sale loss deferrals.
| NOTES TO FINANCIAL STATEMENTS |
At September 30, 2014, the Funds had accumulated capital loss carryforwards as follows:
| (Amounts in thousands) | | Focus
Fund | | | Growth
Fund | | | 21st
Century
Fund | | | International
Opportunities
Fund | | | Flexible
Capital
Fund | | | Global
Fund | |
| For Losses Expiring September 30, | | | | | | | | | | | | | | | | | | |
| 2017 | | $ | — | | | $ | — | | | $ | 70,343 | | | $ | 8,585 | | | $ | — | | | $ | — | |
| 2018 | | | — | | | | — | | | | 390,537 | | | | 93,558 | | | | — | | | | — | |
| Not Subject to Expiration | | | — | | | | — | | | | — | | | | — | | | | — | | | | — | |
| | | $ | — | | | $ | — | | | $ | 460,880 | | | $ | 102,143 | | | $ | — | | | $ | — | |
To the extent that a Fund may realize future net capital gains, those gains will be offset by any of its unused capital loss carryforward. Future capital loss carryover utilization in any given year may be subject to Internal Revenue Code limitations.
Under the Regulated Investment Company Modernization Act of 2010, the Funds are permitted to carryforward capital losses incurred in taxable years beginning after December 22, 2010 for an unlimited period. However, any losses incurred during those future taxable years will be required to be utilized prior to the losses incurred in pre-enactment taxable years. As a result of this ordering rule, pre-enactment capital loss carryforwards may be more likely to expire unused. Additionally, post-enactment capital losses that are carried forward will retain their character as either short-term or long-term capital losses rather than being considered all short-term as under previous law.
As of September 30, 2014, the Focus Fund, Growth Fund, 21st Century Fund, International Opportunities Fund, Flexible Capital Fund, and Global Fund, respectively, had (in thousands) $3,004, $1,526, $2,212, $498, $1,649 and $164 of qualified late-year losses, which are deferred until fiscal year 2015 for tax purposes. Net late-year losses incurred after December 31st, and within the taxable year, are deemed to arise on the first day of the Fund’s next taxable year.
The International Opportunities Fund had realized capital losses (in thousands) from transactions between November 1, 2013 and September 30, 2014 of $6,487. The International Opportunities Fund has elected to treat post-October capital losses as arising in the next fiscal year.
The 21st Century Fund and International Opportunities Fund utilized (in thousands) $48,208 and $10,287, respectively, of its capital loss carryforwards, during the year ended September 30, 2014.
As of September 30, 2014, the components of accumulated earnings (deficit) on a tax basis were as follows:
| (Amounts in thousands) | | Focus
Fund | | | Growth
Fund | | | 21st
Century
Fund | | | International
Opportunities
Fund | | | Flexible
Capital
Fund | | | Global
Fund | |
| Undistributed Ordinary Income | | $ | 17,275 | | | $ | 11,034 | | | $ | — | | | $ | — | | | $ | 11,183 | | | $ | 1,487 | |
| Undistributed Trustees’ Deferred Compensation | | | (1,899 | ) | | | (1,143 | ) | | | (798 | ) | | | (291 | ) | | | (786 | ) | | | (347 | ) |
| Undistributed Long-Term Capital Gains | | | 106,804 | | | | 52,593 | | | | — | | | | — | | | | 48,460 | | | | 6,922 | |
| Tax Accumulated Earnings (Deficit) | | | 122,180 | | | | 62,484 | | | | (798 | ) | | | (291 | ) | | | 58,857 | | | | 8,062 | |
| Accumulated Capital and Other Losses | | | (3,004 | ) | | | (1,526 | ) | | | (463,092 | ) | | | (109,128 | ) | | | (1,649 | ) | | | (164 | ) |
| Unrealized Appreciation on Investments and Foreign Currency Translations | | | 285,225 | | | | 170,255 | | | | 82,305 | | | | 9,993 | | | | 139,055 | | | | 12,622 | |
| Trustees Deferred Compensation Mark to Market | | | 573 | | | | 353 | | | | 284 | | | | 50 | | | | 539 | | | | 229 | |
| Total Accumulated Earnings (Deficit) | | $ | 404,974 | | | $ | 231,566 | | | $ | (381,301 | ) | | $ | (99,376 | ) | | $ | 196,802 | | | $ | 20,749 | |
Undistributed ordinary income (deficit) consists of net investment income and timing differences related to qualified late-year losses.
| NOTES TO FINANCIAL STATEMENTS |
NOTES TO FINANCIAL STATEMENTS March 31, 2015 (Unaudited) (continued)
The tax character of distributions paid during the fiscal years ended September 30, 2014 and 2013 were as follows:
| | | 2014 | | | 2013 | |
| (Amounts in thousands) | | Ordinary Income | | | Long-Term Capital Gains | | | Ordinary Income | | | Long-Term Capital Gains | |
| Focus Fund | | $ | 13,021 | | | $ | 120,014 | | | $ | 1,177 | | | $ | 101,796 | |
| Growth Fund | | | 24,630 | | | | 94,408 | | | | 5,395 | | | | 30,178 | |
21st Century Fund | | | — | | | | — | | | | — | | | | — | |
| International Opportunities Fund | | | 742 | | | | — | | | | — | | | | — | |
| Flexible Capital Fund | | | 44,547 | | | | 44,556 | | | | 10,360 | | | | 22,646 | |
| Global Fund | | | 216 | | | | 9,062 | | | | — | | | | — | |
The tax character of dividends paid may differ from that shown in the Statements of Changes in Net Assets due to short-term gains being treated as ordinary income for tax purposes.
Management of the Adviser has determined that there were no material subsequent events that would require disclosure in the Funds’ financial statements.
| 8. | New Accounting Pronouncements |
In June 2014, FASB issued ASU No. 2014-11 “Repurchase-to-Maturity Transactions, Repurchase Financings, and Disclosures”. The amendments in this ASU require an entity to modify accounting for repurchase-to-maturity transactions and repurchase financing arrangements, as well as to modify required disclosures for repurchase agreements, securities lending transactions, and repurchase-to-maturity transactions that are accounted for as secured borrowings. The guidance is effective for fiscal years beginning on or after December 15, 2014, and for interim periods within those fiscal years. Management is currently evaluating the impact these changes may have on the Funds’ financial statements.
EXPENSE EXAMPLE For the six-month period ended March 31, 2015 (Unaudited)
As a shareholder of the Marsico Funds (the “Funds”), you incur two types of costs: (1) transaction costs, including redemption fees (if any), and (2) ongoing costs, including management fees, distribution (12b-1) fees, and other Fund expenses. This Example is intended to help you understand your ongoing costs (in dollars) of investing in the Funds and to compare these costs with the ongoing costs of investing in other mutual funds.
The Example is based on an investment of $1,000 invested at the beginning of the period and held for the entire period from October 1, 2014 to March 31, 2015 (the “period”).
Actual Expenses
The first line of the table below provides information about actual account values and actual expenses. You may use the information in this line, together with the amount you invested, to estimate the expenses you paid over the period. Simply divide your account value by $1,000 (for example, an $8,600 account value divided by $1,000 equals 8.6), then multiply the result by the number in the first line under the heading entitled “Expenses paid for the six-month period ended March 31, 2015” to estimate the expenses you paid on your account during the period.
Hypothetical Example for Comparison Purposes
The second line of the table below provides information about hypothetical account values and hypothetical expenses based on the Funds’ actual expense ratios and an assumed rate of return of 5% per year before expenses, which is not the actual return of any of the Funds. The hypothetical account values and expenses may not be used to estimate the actual ending account balance or expenses you paid for the period. You may use this information to compare the ongoing costs of investing in the Funds and other funds. To do so, compare this 5% hypothetical example with the 5% hypothetical examples that appear in the shareholder reports of other funds.
Please note that the expenses shown in the table are meant to highlight your ongoing costs only and do not reflect any transactional costs such as redemption fees (if any). Therefore, the second line of the table is useful in comparing the ongoing costs only, and will not help you determine the relative total costs of owning different funds. In addition, if these transactional costs (if any) were included, your costs could have been higher.
| Expenses Paid During the Period | Beginning
account value
October 1, 2014 | Ending
account value
March 31, 2015 | Expenses paid for the six-month period ended
March 31, 2015(1) |
| FOCUS FUND | | | |
| Actual Example | $1,000.00 | $1,040.40 | $6.78 |
| Hypothetical Example, assuming a 5% return before expenses | $1,000.00 | $1,018.35 | $6.71 |
| | | | |
| GROWTH FUND | | | |
| Actual Example | $1,000.00 | $1,033.40 | $6.95 |
| Hypothetical Example, assuming a 5% return before expenses | $1,000.00 | $1,018.17 | $6.90 |
| | | | |
21st CENTURY FUND | | | |
| Actual Example | $1,000.00 | $1,071.30 | $7.37 |
| Hypothetical Example, assuming a 5% return before expenses | $1,000.00 | $1,017.88 | $7.18 |
| | | | |
| INTERNATIONAL OPPORTUNITIES FUND | | | |
| Actual Example | $1,000.00 | $1,087.60 | $8.33 |
| Hypothetical Example, assuming a 5% return before expenses | $1,000.00 | $1,017.02 | $8.05 |
| | | | |
| FLEXIBLE CAPITAL FUND | | | |
| Actual Example | $1,000.00 | $1,063.70 | $7.18 |
| Hypothetical Example, assuming a 5% return before expenses | $1,000.00 | $1,018.04 | $7.02 |
| | | | |
| GLOBAL FUND | | | |
| Actual Example | $1,000.00 | $1,061.60 | $8.22 |
| Hypothetical Example, assuming a 5% return before expenses | $1,000.00 | $1,017.02 | $8.05 |
| (1) | Expenses are equal to the Funds’ annualized expense ratios (1.33% for the Focus Fund, 1.37% for the Growth Fund, 1.43% for the 21st Century Fund, 1.60% for the International Opportunities Fund, 1.40% for the Flexible Capital Fund, and 1.60% for the Global Fund), multiplied by the average account value over the period, multiplied by 182/365 (to reflect the six-month period). |
| CONSIDERATION OF INVESTMENT ADVISORY AGREEMENTS |
CONSIDERATION OF INVESTMENT ADVISORY AGREEMENTS (Unaudited)
At a meeting of the Board of Trustees of the Trust held on November 12, 2014, the Trustees, by a unanimous vote (including a separate vote of those Trustees who are not “interested persons” (as the term is defined in the 1940 Act) of the Trust (the “Independent Trustees”), approved the renewal of the Investment Advisory and Management Agreements for the Focus Fund, Growth Fund, 21st Century Fund, International Opportunities Fund, Flexible Capital Fund, and Global Fund (the “Advisory Agreements”). In advance of the meeting, the Independent Trustees requested and received extensive materials from Marsico Capital Management, LLC (the “Adviser” or “MCM”) to assist them in considering the renewal of the Agreements. The materials provided by the Adviser contained information with respect to the factors noted below, including detailed information relating to the performance, advisory fees and other expenses of the Funds, other funds sub-advised by the Adviser and non-fund advisory accounts of the Adviser. The materials also included comparisons of the Funds with third party funds of similar size and investment objectives in terms of performance, fees and other expenses, as well as the performance of each Fund versus its benchmark. In addition, the Adviser provided information regarding its overall expenses and profitability, as well as other information requested by the Trustees.
In addition to the materials prepared specifically for contract review analysis, on an ongoing basis the Trustees receive information and reports from the Adviser and other service providers to the Funds regarding the investment performance of the Funds as well as operational, compliance, marketing, and other matters.
The Trustees engaged in a detailed discussion of the materials with management of the Adviser. The Independent Trustees then met separately with independent counsel to the Independent Trustees for a full review of the materials. Following this session, the full Board reconvened and approved the continuation of the Agreements for the Focus Fund, Growth Fund, 21st Century Fund, International Opportunities Fund, Flexible Capital Fund, and Global Fund.
Discussion of Certain Factors Considered
1. Nature, Extent, and Quality of Services.
The Independent Trustees considered the nature, quality and extent of the services performed by the Adviser under the Advisory Agreements including portfolio management, supervision of Fund operations and compliance and regulatory filings and disclosures to shareholders, general oversight of other service providers, review of Fund legal issues, and other services. The Independent Trustees also considered the personnel who provide these services, which includes a team of individuals collectively having years of experience in their particular areas of expertise. The Independent Trustees also considered the Adviser’s investment philosophy and experience, noting that the Adviser and its affiliates employ a focused stock-picking strategy that involves extensive research. The Independent Trustees also discussed the Adviser’s ability to continue to provide the same level and quality of services to the Funds. The Independent Trustees concluded that the services are extensive in nature, that the Adviser employs investment advisory personnel who consistently delivered a high level of service and that, with respect to third party service providers, the Adviser effectively manages the outsourcing by the Funds to other service providers and the oversight of those service providers.
2. Investment Performance of the Funds and Adviser.
The Independent Trustees considered short-term and long-term investment performance for each Fund over various periods of time as compared to both relevant equity indices and the performance of each Fund’s Lipper, Inc. peer group universe. The Independent Trustees discussed with representatives of the Adviser the factors underlying the outperformance or under-performance of the Funds over various time periods. The Independent Trustees considered the strong overall Fund performance during the previous year, noting in particular the fact that five of the six Funds posted double-digit positive returns for the one year period, the three year period, and five year period ended September 30, 2014, and also generally outperformed peer funds performance averages during those periods. The Independent Trustees also recognized the recent appointment of Munish Malhotra as sole portfolio manager of the International Opportunities Fund and the corresponding portfolio changes made, which has started to improve the performance of the International Opportunities Fund. The Independent Trustees reviewed the performance of the Funds in the context of the long-term investment strategies being pursued by the Funds. In addition to reviewing performance information of comparable funds, the Independent Trustees took into account that they regularly review each Fund’s performance.
The Independent Trustees considered the Adviser’s substantial investment advisory experience and capabilities. The Independent Trustees also discussed with representatives of the Adviser recent and previous changes in the portfolio management staff of the Adviser and their corresponding impacts. The Independent Trustees noted MCM’s continued investment in research. The Independent Trustees noted that the investment performance delivered by the Adviser to the Funds appeared to be consistent with the performance delivered for other clients of the Adviser. Based on this review, the Independent Trustees concluded that the performance of the Adviser with respect to each Fund was satisfactory for the purposes of approving the Advisory Agreements.
| CONSIDERATION OF INVESTMENT ADVISORY AGREEMENTS |
3. Costs of Services and Profits Realized by the Adviser.
(a) Costs of Services to Funds: Fees and Expenses. The Independent Trustees considered each Fund’s management fee rates and expense ratios relative to industry averages for the Fund’s benchmark category and the advisory fees charged by the Adviser to other sub-advised funds and non-fund clients, including information regarding expense limitation commitments from the Adviser, and the breakpoints in the advisory fee for certain Funds. The Independent Trustees noted the information provided by MCM stated that the mix of services under the Advisory Agreements are much more extensive than those under the Adviser’s advisory agreements for sub-advised funds and non-fund clients. While the Independent Trustees noted that the investment advisory fees paid by the Funds are generally in the upper quartile of their peer groups, they were cognizant that it is difficult to know whether the services provided by advisers to peer funds are as extensive as those provided by MCM to the Funds. The Independent Trustees noted the actions taken by MCM to reduce Fund expenses, including that MCM had waived fees and absorbed expenses from time to time, and that some of those expenditures may not be recouped. The Independent Trustees concluded that the investment advisory fees are acceptable based upon the qualifications, experience, reputation, and performance of the Adviser and the overall expense ratios of the Funds. The Independent Trustees noted, however, that they would continue at their regular meetings to monitor the overall expense ratios of the Funds.
(b) Profitability and Costs of Services to Adviser. The Independent Trustees reviewed the information provided by MCM regarding its overall profitability and costs and a pro forma estimate of the Adviser’s profitability and costs if the Funds constituted the Adviser’s only assets under management. The Independent Trustees noted that MCM’s fee revenue from the Funds had remained flat or increased only slightly for a few Funds whose assets had slightly increased, and that MCM had not reduced its services, but continued to devote substantial resources and personnel to the Funds. The Independent Trustees also discussed the 2012 restructuring of the outstanding debt obligations of the Adviser’s parent companies, and additional progress in reducing debt in 2013 and 2014, noting that these events helped to maintain the Adviser’s ability to pay its operating expenses over the short and intermediate term (while further strengthening MCM’s overall financial position and potential profitability over the short and long term). The Independent Trustees agreed to continue at their regular meetings to monitor the impact of the debt restructuring on the Adviser. The Independent Trustees also noted that the Adviser has substantially increased its resources devoted to Fund matters in response to regulatory requirements enacted during the last few years. The Independent Trustees concluded that the fees received by the Adviser under the Advisory Agreements were set at an acceptable level, particularly in light of the extent and quality of the services being provided to the Funds.
4. Extent of Economies of Scale as Funds Grow.
The Independent Trustees considered whether there have been economies of scale with respect to the management of each Fund and whether such Fund has appropriately benefited from any economies of scale. The Independent Trustees noted that economies of scale may develop for certain Funds as their assets increase and their Fund-level expenses decline as a percentage of assets, but that Fund-level economies of scale may not necessarily result in Adviser-level economies of scale. It was reported to the Independent Trustees that the expenses incurred by the Adviser relating to management of the Funds increased substantially in recent years as a percentage of management fees and that the asset levels of certain Funds had only increased slightly over the past year. The Independent Trustees agreed that it was possible that if trends changed and Fund assets began growing again beyond certain thresholds, Adviser-level expenses incurred in managing the Funds eventually could level off or decline as a percentage of management fees in the future, potentially resulting in economies of scale. The Independent Trustees noted that they expect to consider economies of scale on at least an annual basis and thus be in a position to evaluate additional economies of scale, if any, occurring as Fund asset levels change over time.
5. Whether Fee Levels Reflect Economies of Scale.
The Independent Trustees also considered whether the management fee rate is reasonable in relation to the asset size of each Fund and any economies of scale that may exist. The Independent Trustees noted that, at the request of the Independent Trustees, breakpoints previously had been introduced for the Focus Fund and the Growth Fund for assets in excess of $3 billion in each Fund. Under the breakpoints, investment management fees are 0.85% per year of average daily net assets up to $3 billion in each of those two Funds, and 0.75% per year of average daily net assets exceeding $3 billion in each Fund. The Independent Trustees also took note that the Adviser also intended to renew the voluntary fund expense limitations for each of the Funds until at least January 31, 2016, all subject to possible future recoupment of previously waived fees or other expenses under certain conditions. The Independent Trustees agreed to continue to monitor whether any additional breakpoints for any of the Funds may be appropriate in the future.
| CONSIDERATION OF INVESTMENT ADVISORY AGREEMENTS |
CONSIDERATION OF INVESTMENT ADVISORY AGREEMENTS (Unaudited) (continued)
6. Other Relevant Considerations.
The Independent Trustees considered the character and amount of other incidental benefits received by the Adviser and its affiliates from its association with the Funds. The Independent Trustees concluded that potential “fall-out” benefits that the Adviser may receive, such as greater name recognition or increased ability to obtain research or brokerage services, appear to be reasonable, and may in some cases benefit the Funds.
Conclusions
In considering the Advisory Agreements, the Independent Trustees did not identify any factor as all-important or all-controlling and instead considered these factors collectively in light of each Fund’s surrounding circumstances. Based on this review, it was the judgment of the Independent Trustees that each Fund’s fees were reasonable, the extent and quality of services were acceptable and performance of the Funds was satisfactory. Therefore, re-approval of the Advisory Agreements was in the best interests of each Fund and its shareholders. As a part of their decision-making process, the Independent Trustees noted that the Adviser has managed the Funds since their inception, and the Independent Trustees believe that a long-term relationship with a capable, conscientious adviser is in the best interests of the Funds and their shareholders. The Independent Trustees considered, generally, that shareholders invested in a Fund knowing that the Adviser managed that Fund and knowing its investment management fee. As such, the Independent Trustees considered, in particular, whether the Adviser managed each Fund in accordance with its investment objectives and policies as disclosed to shareholders. Additionally, as part of its deliberations, the Board also considered and relied upon the information about the Funds and MCM that had been provided to them throughout the year in connection with their regular Board meetings at which they engage in the ongoing oversight of the Funds and their operations.
Upon conclusion of their review and discussion, the Trustees, including all of the Independent Trustees, unanimously agreed the Advisory Agreements for each of the Funds should be continued.
OTHER INFORMATION (Unaudited)
Proxy Voting Guidelines
The Funds exercise the voting rights associated with the securities held by the Funds under the proxy voting policy of the Funds. A description of those policies and procedures of the Funds and a record of the Funds’ proxy votes for the one-year period ended June 30, 2014 are available without charge, upon request, by calling
888-860-8686. It is also available on the Securities and Exchange Commission’s (SEC) website at www.sec.gov.
Quarterly Filing of Portfolio Holdings
The Funds will file their complete schedule of investments with the SEC for the first and third quarters of each fiscal year on Form N-Q. The Funds’ Form N-Q will be available (i) on the SEC’s website at www.sec.gov; (ii) at the SEC’s Public Reference Room; and (iii) by calling 800‑SEC‑0330.
Cost Basis Information
Federal law requires mutual fund companies to maintain a shareholder’s cost basis by tax lot and report gain/loss information and holding periods for sales of mutual fund shares that are “covered” securities to the IRS and to shareholders on Form 1099. Mutual fund shares, such as shares of the Funds, acquired on or after January 1, 2012 are covered securities. The Funds are not responsible for maintaining and reporting share information for their shares that are not deemed “covered.”
The tax regulations require that the Funds elect a default tax identification methodology in order to perform the required reporting. The Funds have chosen the first-in-first-out (“FIFO”) method as the default tax lot identification method for its shareholders. This is the method the Funds will use to determine which specific shares are deemed to be sold when a shareholder’s entire position is not sold in a single transaction and is the method in which “covered” share sales will be reported on a shareholder’s Form 1099.
However, at the time of purchase or upon the sale of “covered” shares, shareholders may generally choose a different tax lot identification method. Shareholders should consult a tax advisor with regard to their personal circumstances as the Funds and their service providers do not provide tax advice.
NOTES
Not applicable to semi-annual reports.
| Item 3. | Audit Committee Financial Expert |
Not applicable to semi-annual reports.
| Item 4. | Principal Accountant Fees and Services |
Not applicable to semi-annual reports.
| Item 5. | Audit Committee of Listed Registrants |
Not applicable.
| Item 6. | Schedule of Investments |
The schedule of investments in securities of unaffiliated issuers is included as part of the report to shareholders filed under Item 1.
| Item 7. | Disclosure of Proxy Voting Policies and Procedures for Closed-End Management Investment Companies |
Not applicable.
| Item 8. | Portfolio Managers of Closed-End Management Investment Companies |
Not applicable.
| Item 9. | Purchases of Equity Securities by Closed-End Management Investment Company and Affiliated Purchasers |
Not applicable.
| Item 10. | Submission of Matters to a Vote of Security Holders |
Not applicable.
| Item 11. | Controls and Procedures. |
(a) The registrant's principal executive officer and principal financial officer have concluded that the registrant's disclosure controls and procedures (as defined in Rule 30a-3(c) under the Investment Company Act of 1940, as amended) are effective based on their evaluation of these disclosure controls and procedures within 90 days of the filing date of this report on Form N-CSR.
(b) There were no changes in the registrant's internal control over financial reporting (as defined in Rule 30a-3(d) under the Investment Company Act of 1940, as amended) that occurred during the second fiscal quarter of the period covered by this report that has materially affected, or is reasonably likely to materially affect, the registrant's internal control over financial reporting.
(a)(1) Code of Ethics
Not applicable to semi-annual reports.
(a)(2) Certification for each principal executive and principal financial officer of the registrant as required by Rule 30a-2(a) under the Act (17 CFR 270.30a-2(a)). Filed as an attachment to this filing.
(a)(3) Any written solicitation to purchase securities under Rule 23c-1 under the Investment Company Act of 1940, as amended, that was sent or given during the period covered by the report by or on behalf of the registrant to 10 or more persons.
Not applicable.
(b) Certifications required by Rule 30a-2(b) under the Act (17 CFR 270.30a-2(b)), Rule 13a-14(b) or Rule 15d-14(b) under the Exchange Act (17 CFR 240.13a-14(b) or 240.15d-14(b)), and Section 1350 of Chapter 63 of Title 18 of the United States Code (18 U.S.C. 1350). Filed as an attachment to this filing.
SIGNATURES
Pursuant to the requirements of the Securities Exchange Act of 1934 and the Investment Company Act of 1940, the registrant has duly caused this report to be signed on its behalf by the undersigned, thereunto duly authorized.
The Marsico Investment Fund
| By: | /s/ Christopher J. Marsico | |
| | Christopher J. Marsico, | |
| | Executive Vice President and Chief Operating Officer |
| | | |
| Date: | June 3, 2015 | |
Pursuant to the requirements of the Securities Exchange Act of 1934 and the Investment Company Act of 1940, this report has been signed below by the following persons on behalf of the registrant and in the capacities and on the dates indicated.
| By: | /s/ Christopher J. Marsico | |
| | Christopher J. Marsico, | |
| | Executive Vice President and Chief Operating Officer |
| | | |
| Date: | June 3, 2015 | |
| | | |
| By: | /s/ Neil L. Gloude | |
| | Neil L. Gloude, | |
| | Vice President, Secretary and Treasurer | |
| | | |
| Date: | June 3, 2015 | |