Marsico Focus Fund | Marsico Growth Fund | Marsico 21st Century
Fund |
MFOCX | MGRIX | MXXIX |
For additional disclosures, please see page 10. | For additional disclosures, please see page 15. | For additional disclosures, please see page 21. |
PERFORMANCE COMPARISON(1) | PERFORMANCE COMPARISON(1) | PERFORMANCE COMPARISON(1) |
| 
| 
|
TOTAL ANNUAL OPERATING EXPENSES* 1.27% | TOTAL ANNUAL OPERATING EXPENSES* 1.36% | TOTAL ANNUAL OPERATING EXPENSES* 1.41% |
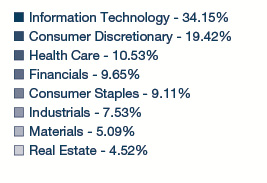
SECTOR ALLOCATION(2) | SECTOR ALLOCATION(2) | SECTOR ALLOCATION(2) |
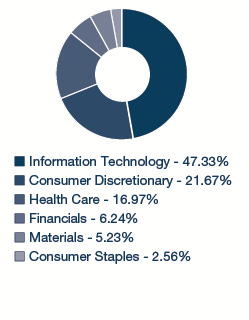
| 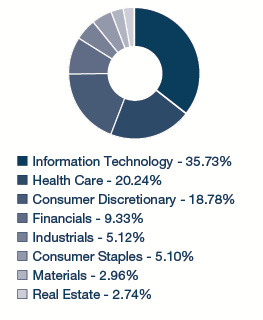
| 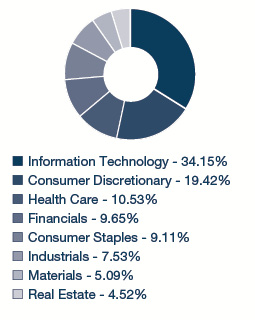
|
TOP FIVE HOLDINGS | TOP FIVE HOLDINGS | TOP FIVE HOLDINGS |
| FACEBOOK, INC. - CL. A | 6.91% | FACEBOOK, INC. - CL. A | 5.31% | SALESFORCE.COM, INC. | 4.02% |
| AMAZON.COM, INC. | 6.48% | VISA, INC. - CL. A | 4.19% | CONSTELLATION BRANDS, INC. - CL. A | 4.02% |
ALIBABA GROUP HOLDING LTD. SPON. ADR | 5.04% | AMAZON.COM, INC. | 3.94% | MASTERCARD, INC. - CL. A | 3.50% |
| VISA, INC. - CL. A | 5.02% | ADOBE SYSTEMS, INC. | 3.68% | INTUITIVE SURGICAL, INC. | 3.34% |
| UNITEDHEALTH GROUP, INC. | 5.00% | ALIBABA GROUP HOLDING LTD. SPON. ADR | 3.67% | COSTAR GROUP, INC. | 3.31% |
For additional disclosures about the Marsico Funds, please see page 4. The performance data quoted here represent past performance, and past performance is not a guarantee of future results. Investment return and principal value of an investment will fluctuate so that an investor’s shares, when redeemed, may be worth more or less than their original cost.
2
| KEY FUND STATISTICS (UNAUDITED) |
Marsico International
Opportunities Fund | Marsico Flexible Capital
Fund | Marsico Global Fund |
| MIOFX | MFCFX | MGLBX |
For additional disclosures, please see page 26. | For additional disclosures, please see page 31. | For additional disclosures, please see page 36. |
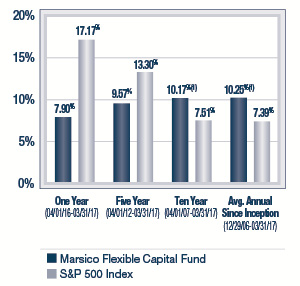
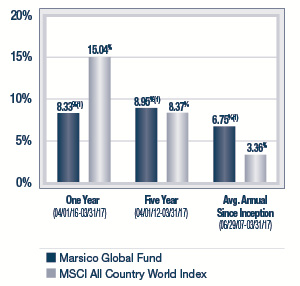
PERFORMANCE COMPARISON(1) | PERFORMANCE COMPARISON(1) | PERFORMANCE COMPARISON(1) |
| 
| 
|
TOTAL ANNUAL OPERATING EXPENSES* 1.77% NET EXPENSES*† 1.60% | TOTAL ANNUAL OPERATING EXPENSES* 1.37% | TOTAL ANNUAL OPERATING EXPENSES* 1.69% NET EXPENSES*† 1.60% |
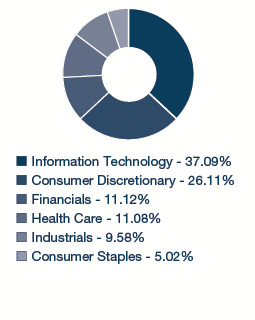
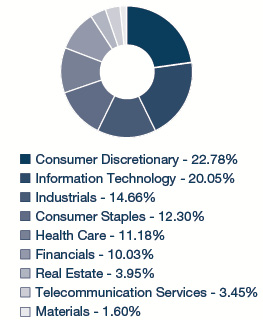
SECTOR ALLOCATION(2) | SECTOR ALLOCATION(2) | SECTOR ALLOCATION(2) |
| 
| 
|
TOP FIVE HOLDINGS | TOP FIVE HOLDINGS | TOP FIVE HOLDINGS |
| ASML HOLDING N.V. | 5.33% | CONSTELLATION BRANDS, INC. - CL. A | 6.32% | FACEBOOK, INC. - CL. A | 6.13% |
| TENCENT HOLDINGS LTD. | 5.25% | LOCKHEED MARTIN CORPORATION | 4.63% | ALIBABA GROUP HOLDING LTD. SPON. ADR | 5.56% |
| WIRECARD A.G. | 5.22% | VISA, INC. - CL. A | 4.30% | TENCENT HOLDINGS LTD. | 4.91% |
| INTERXION HOLDING N.V. | 4.97% | CISCO SYSTEMS, INC. | 4.22% | AMAZON.COM, INC. | 4.74% |
DOMINO'S PIZZA ENTERPRISES LTD. | 4.31% | THE HOME DEPOT, INC. | 3.99% | HERMES INTERNATIONAL | 4.55% |
Current performance may be lower or higher than the performance information quoted. To obtain performance information current to the most recent month-end, please call 888-860-8686 or visit marsicofunds.com.
3
| KEY FUND STATISTICS (UNAUDITED) |
ADDITIONAL DISCLOSURES ABOUT THE MARSICO FUNDS
* | The Total Annual Operating Expenses and Net Expenses are reflective of the information disclosed in the Funds’ Prospectus dated January 30, 2017. The information may differ from the expense ratios disclosed in this report. |
† | Marsico Capital Management, LLC (the “Adviser”) has entered into a written expense limitation and fee waiver agreement under which it has agreed to limit the total expenses of each of the International Opportunities Fund and the Global Fund (excluding interest, taxes, acquired fund fees and expenses, litigation, brokerage and extraordinary expenses) to an annual rate of 1.60% of each Fund’s average net assets until January 31, 2018. This expense limitation and fee waiver agreement may be terminated by the Adviser at any time after January 31, 2018, upon 15 days prior notice to the Fund and its administrator. The Adviser may recoup from a Fund fees previously waived or expenses previously reimbursed by the Adviser with respect to that Fund pursuant to this agreement (or a previous expenses limitation agreement) if: (1) such recoupment by the Adviser does not cause the Fund, at the time of recoupment, to exceed the lesser of (a) the expense limitation in effect at the time the relevant amount was waived and/or reimbursed, or (b) the expense limitation in effect at the time of the proposed recoupment, and (2) the recoupment is made within three fiscal years after the end of the fiscal year in which the amount was waived or reimbursed. |
(1) | The performance data quoted here represent past performance, and past performance is not a guarantee of future results. Investment return and principal value of an investment will fluctuate so that an investor’s shares, when redeemed, may be worth more or less than their original cost. Current performance may be lower or higher than the performance information quoted. To obtain performance information current to the most recent month-end, please call 888-860-8686 or visit marsicofunds.com. |
| The performance included in the chart does not reflect the deduction of taxes on Fund distributions or the redemption of Fund shares. |
| All indices are unmanaged and investors cannot invest directly in an index. |
Periodically, certain fees and expenses have been waived or reimbursed by the Adviser for the 21st Century Fund, the International Opportunities Fund, the Flexible Capital Fund and the Global Fund. In the absence of such a waiver or reimbursement, the performance returns reflected would have been reduced. In accordance with the expense limitation and fee waiver agreement, the Adviser may recoup fees and expenses previously waived or reimbursed under certain parameters. Periodically, the Adviser has recouped such fees or expenses from the 21st Century Fund, the International Opportunities Fund, and the Global Fund, resulting in a lower performance return.
(2) | Sector weightings represent the percentage of the respective Fund’s investments (excluding cash equivalents) in certain general sectors. These sectors may include more than one industry. The Fund’s portfolio composition is subject to change at any time. |
4
MARKET ENVIRONMENT: OCTOBER 2016 – MARCH 2017 (UNAUDITED)
After the election of Donald Trump in November 2016, global equity markets recorded strong performances for the six-month fiscal period ended March 31, 2017. On the eve of the election, handicappers assigned very high odds to the notion that Hillary Clinton would win, but would ultimately face gridlock amid near certain control of the House of Representatives by Republicans. Instead, Trump won the presidency and entered the White House with Republicans in charge of both the House and the Senate. Stocks, bonds, currencies and commodities abruptly repriced around the globe amid this new political reality. Gains were healthy in the US, Europe, and in many emerging markets including China. Oil prices (using West Texas Intermediate crude as the proxy) ended the period positively above $50 per barrel.
Before the Trump election victory, there was widespread conviction that global economic momentum remained soft and that inflation worries were misplaced. US growth, in fact, faltered during much of 2016, as reflected in softer jobs gains and weak real gross domestic product growth. Some analysts pointed to the harsh, polarizing nature of the US election campaigns as a likely contributor to the soft patch. The end of the election campaigns, and the prospects for some tax and regulation cuts in future years, coupled with substantial infrastructure spending efforts, all worked to reverse notions of stagnation.
Two of the most striking economic developments in the period were the leap in US Treasury bond yields, and the sharp rise in the US dollar compared to other major currencies. As investors digested an anticipated shift from budgetary austerity, which was typical for the last five years around the world, to potential large tax cuts, major increases in infrastructure and defense spending, and substantial loosening of regulations, it became clear that growth could increase and US interest rates might rise substantially. The US 10-year Treasury yield jumped from just under 1.70% to a high point of 2.6% during the period, although yields subsequently have declined.
The dollar’s ascent directly followed the performance of US interest rates. With both the European Central Bank and the Bank of Japan committed to continued “easy money,” investors judged that flows would migrate to the higher-yielding fixed income marketplace, and the US dollar jumped accordingly against some currencies, although it subsequently leveled off.
In the US, the job market remained reasonably healthy. Economic performance in the services sector firmed, especially in the first quarter of 2017, evidenced by upbeat news from surveys and decent gains for services jobs. In addition, manufacturing indicators continued to improve, signaling an end to the pressures emanating from the 2015 dollar rebound and plunge in oil prices during 2015 and early 2016.
Steady gains for US employment and a slow creep upward for inflation led the US Federal Reserve Board to raise short-term rates in December and March, and to suggest that rates would rise perhaps two more times in 2017. The Federal Open Market Committee was careful to emphasize that its prospective tightening plans assumed no change in Federal tax policy and infrastructure spending. Fed officials, in various speeches, explained that they would consider adjusting their policy plans if potentially stimulative Trump policies are enacted.
Globally, news in Europe and Japan improved over the first quarter of 2017. Surveys of corporations in continental Europe showed firming growth for both service and manufacturing sectors. The Markit Eurozone Services Purchasing Managers Index (an indicator of the economic conditions in the Euro Zone services sector) rose from a December reading of 53.7 to a March level of 56, the highest recorded reading in over five years. In Japan, year-over-year industrial production was up 4.8% after declining throughout 2015 and much of 2016.
News out of China remained lackluster. Retail sales rose “only” 9.5% in February of 2017, an impressive absolute gain that still fell below double digits for the first time in more than 10 years. Industrial production was up only 6.3% in the latest reading, hovering near recent lows. What remains true of China is that it continues to struggle to shift its economic emphasis from exports and capital spending to consumer spending. That move, to date, has been slow to take hold.
In summary, markets now appear to be priced for major policy changes that may be put in place during 2017. If, when, and how these changes are implemented will remain major issues throughout the year.
5
The performance of global markets during the period is depicted below. US markets posted strong gains for the six-month period ended March 31, 2017. Large capitalization US equities lagged small capitalization stocks, yet both segments rose double-digits during the period. Emerging market equities performed positively as their currencies strengthened relative to the US dollar, easing import costs for those countries. Developed international markets posted positive returns as well despite political uncertainty in Europe and an overall focus on domestic agendas.
Index Name(1) | Universe of
Equities Represented | Six-Month
Total Return (as of March 31, 2017) |
US | | |
S&P 500 | US large-capitalization equities | +10.12% |
Russell 3000 | US publicly-traded equities of all sizes | +10.19% |
Russell 2000 | US small-capitalization equities | +11.52% |
Russell Mid-Cap Growth | US medium-capitalization equities | +7.38% |
Index Name(1) | Universe of
Equities Represented | Six-Month
Total Return (as of March 31, 2017) |
INTERNATIONAL | |
MSCI EAFE (US$) | Equities in developed international equity markets, including Japan, Western Europe, and Australasia | +6.48% |
MSCI Emerging Markets (US$) | Equities in developing international equity markets, including China, India, Eastern Europe, and Latin America | +6.80% |
MSCI ACWI (US$) | Equities in the global developed and emerging markets | +8.18% |
THE MARSICO INVESTMENT TEAM
(1) | All indices are unmanaged and investors cannot invest directly in an index. |
6
INVESTMENT REVIEW BY TOM MARSICO (UNAUDITED)
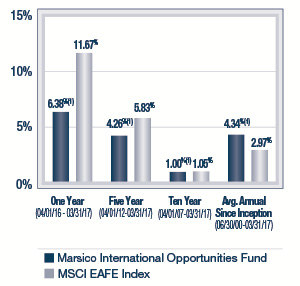
The Marsico Focus Fund posted a total return of +5.89% for the six-month fiscal period ended March 31, 2017. While the Fund posted a positive return, the Fund’s relative performance lagged its benchmark index, the S&P 500 Index, which had a total return of +10.12% over the same time period. Please see the Fund’s Overview for more detailed information about the Fund’s longer-term performance for various time periods ended March 31, 2017.
The performance data for the Fund quoted here represent past performance, and past performance is not a guarantee of future results. Investment return and principal value of an investment will fluctuate so that an investor’s shares, when redeemed, may be worth more or less than their original cost. Current performance may be lower or higher than the performance information quoted. To obtain performance information current to the most recent month-end, please call 888-860-8686 or visit marsicofunds.com.(1)
This review highlights Fund performance over a six-month fiscal period. Shareholders should keep in mind that the Fund is intended for long-term investors who hold their shares for substantially longer periods of time. You should also keep in mind that our current views and beliefs regarding all investments discussed in this report are subject to change at any time. References to specific securities, industries, and sectors discussed in this report are not recommendations to buy or sell such securities or related investments, and the Fund may not necessarily hold these securities or investments today. Please see the accompanying Schedule of Investments for the percentage of the Fund’s portfolio represented by the securities mentioned in this report as of the end of the reporting period.
The Focus Fund is non-diversified and may hold fewer securities than a diversified fund because it is permitted to invest a greater percentage of its assets in a smaller number of securities. Holding fewer securities increases the risk that the value of the Fund could go down because of the poor performance of a single investment or may be more volatile than its benchmark. The Fund is subject to broad risks associated with investing in equity securities markets generally, including the risks that the securities and markets in which it invests may experience volatility and instability, that domestic and global economies and markets may undergo periods of cyclical change and decline, that investors may at times avoid investments in equity securities, and that investments may not perform as anticipated. Please see the Prospectus for more information.
The Fund is not managed to track the benchmark index, and may hold a substantially overweight or underweight position in a sector, industry, or security compared to its weight in the benchmark. For informational purposes, the discussion below may compare the benchmark weight or performance of a sector or industry to the investment approach of the Fund.
The Focus Fund’s performance shortfall during the six months ended March 31, 2017, as compared to the S&P 500 Index, was primarily attributable to certain Fund holdings in the Information Technology and Consumer Discretionary sectors, as defined in the Global Industry Classification Standard (“GICS”)(2).
Stock prices of several Information Technology companies performed weakly during the reporting period, primarily in the Software & Services industry group. Although Chinese Internet conglomerate Alibaba Group Holding Ltd. Spon. ADR. returned +2% in the period, it lagged the S&P 500 Index return. This was attributable mainly to developments in the fourth quarter of 2016, including general uncertainty in China as the new Trump administration took office. Additionally, Alibaba was a victim of general weakness in the sector post-election as investor sentiment shifted away from more “growth” oriented names and toward the more cyclical Industrials and Financials sectors. Video game maker Electronic Arts, Inc. (“EA”) returned -9% during the period before being sold from the Fund. EA detracted from performance due to poor reviews of one of their newly launched games that caused investors to question the future sales prospects of the company. We subsequently sold the position as game publishers’ earnings have become more dependent upon the monetization of their user base, thus bringing into question the earnings outlook for the firm. The Fund’s position in online payments facilitator PayPal Holdings, Inc. slid -1% during the period, as PayPal was a victim of sector rotations into more value-oriented names in the Financials, Industrials, and Energy sectors. However, we continue to believe we are in the early stages of mobile-spend acceleration, and we maintain a position in the stock.
Several of the Fund’s Consumer Discretionary holdings struggled during the period, including Australia-based Domino’s Pizza Enterprises Ltd. and Chipotle Mexican Grill, Inc. Domino’s share price was challenged (-16%) largely due to a rotation (in Australia and globally) out of higher-growth names and into economically-sensitive cyclicals that had been laggards for years. Domino’s commands a premium valuation and, after reporting strong half-year results in the fall of 2016, the shares faded through the remainder of the period due to the slowdown in positive news and the heavy rotation into cyclicals. Restaurant operator Chipotle (-5%) posted a negative return during the period before being sold from the Fund. This decline was a result of continued uncertainty around the company’s ability to recover from the food-quality related issues it suffered in late 2015.
7
The Fund initiated a position in Apple, Inc. in February. Although the stock performed well for the Fund by returning +11% during the period, Apple’s overall weight in the Fund lagged Apple’s weight in the S&P 500 Index, causing a relative drag on the Fund’s performance compared to the Index. We continue to be positive on future growth prospects for the company. Because Apple holds an enormous amount of cash domiciled overseas, the prospect of tax reform and repatriation could lead to significant increases in its capital allocation to shareholders from share repurchases and/or dividend increases. Additionally, Apple is increasing its mix of recurring revenue services – thereby structurally improving its business model – while preparing for what may be a super cycle of iPhone upgrades in the second half of 2017.
One holding within the Pharmaceutical, Biotechnology & Life Sciences industry group, Allergan PLC, posted a negative return. The Allergan position (-9% prior to being sold) struggled on weak operational results in the company’s specialty pharmaceutical brands division. Allergan is in the midst of several new product launches, but these launches have been sluggish, and we chose to exit the position accordingly.
In the Real Estate sector, Crown Castle International Corp. normally is a defensive, high-yield position. However, as rate-sensitive stocks rallied dramatically on the Federal Reserve’s rate increase announcements, Crown Castle dropped -3%, lagging the broader Index return. The Fund exited its position in the stock during the period.
From a sector allocation perspective, the Fund’s performance was impaired by having an underweight exposure to the Financials and Industrials sectors – two of the stronger-performing sectors of the S&P 500 Index during the period. In the post-Trump election environment, primarily in the 4th quarter of 2016, these sectors led the market higher as they were perceived to be the most direct beneficiaries of President Trump’s pro-growth initiatives. We believed valuations for many companies in both sectors became stretched very rapidly, although we eventually identified select opportunities in Financials. We also found more compelling, longer-term growth investment opportunities in other sectors, such as Information Technology, which substantially outperformed later in the period as discussed below.
Fund performance also lagged as a result of having a slightly higher than normal 5% average cash weight during the period as we considered various investment opportunities in light of market conditions.
The picture was brighter in other areas. Several of the Fund’s holdings in the Information Technology sector performed strongly, led by holdings in the Software & Services industry. The Fund has continued to maintain investments in companies making innovative use of technology, both cloud and online, to create better retail, customer service, and advertising business models. Salesforce.com, inc. shares rose +16% after the company raised its sales forecast citing investment in new products and acquisitions. Salesforce is benefitting from rising demand for the company’s cloud-based products, including services focused on e-commerce and artificial intelligence. Salesforce also announced a partnership with International Business Machines to integrate the artificial intelligence capabilities of both companies’ business software and to attract customers by offering more advanced data analysis. As part of the partnership, IBM’s Watson will be integrated with Salesforce’s Einstein artificial intelligence service which is aimed at improving customer interactions in sales, service, marketing and commerce.
Shares of video game company Activision Blizzard, Inc. surged +15% in the period after reporting results that beat analysts’ expectations as the paradigm shift from physical video games to digital downloads of games such as World of Warcraft and past versions of Call of Duty boosted revenues. Similar to other video game companies, Activision has been expanding beyond one-time purchases of games played on consoles and is capitalizing on sales from in-game content and characters.
In the Consumer Discretionary sector, online travel services company The Priceline Group, Inc. rose +21% as the company benefitted from the growth in online hotel room bookings through its website. Priceline has expanded geographically and scaled its business by increasing the number of properties on its website and marketing effectively to new markets. Priceline is growing despite increased competition from TripAdvisor, Ctrip.com and Airbnb as well as direct discounts on hotel websites. To compete with Airbnb, Priceline is ramping up the number of private home properties on its website and currently has 590,000 non-hotel listings, up 49% from a year ago.
A holding in the Health Care sector, UnitedHealth Group, Inc. (+18%), had a significant, positive impact on Fund performance. UnitedHealth’s performance was driven by its return to operational growth. The company’s decision to exit the Affordable Care Act (“ACA”) exchanges resulted in a normalization of growth as the company capped its exchange insurance losses in 2016. In addition, UnitedHealth’s insurance division continued to outperform the industry in the commercial, Medicare, and Medicaid markets. Finally, the company continued to experience robust growth in its OptumHealth business as UnitedHealth expanded its ambulatory healthcare services offerings in the US.
8
From a sector allocation perspective, the Fund was aided relative to its benchmark index by having an overweight allocation to the strong-performing Information Technology sector, while having no exposure to the weak-performing Energy sector.
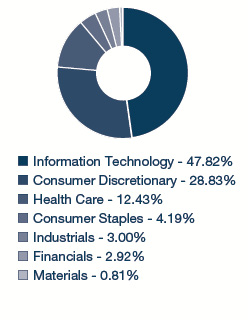
During the reporting period, the Fund sold its position in the Real Estate sector(3) and reduced its exposure to the Consumer Discretionary sector. The Fund increased its allocations to the Financials, Information Technology, Health Care, and Materials sectors.
Fiscal Period-End Investment Posture
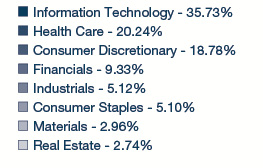
As of March 31, 2017, the Fund’s largest sector allocations included Information Technology, Consumer Discretionary, and Health Care. As of that date, the Fund had no exposure to the Energy, Industrials, Real Estate, Utilities, or Telecommunication Services sectors.
Effective on and after December 1, 2016, Coralie Witter no longer served as co-manager of the Marsico Focus Fund, and Thomas F. Marsico is solely responsible for day-to-day management of the Fund.
Sincerely,
THOMAS F. MARSICO
PORTFOLIO MANAGER
(1) | Total returns are based on net change in net asset value assuming reinvestment of distributions. Please see the Prospectus for more information. |
(2) | Regarding GICS data cited throughout this report, the Global Industry Classification Standard (“GICS”) was developed by and is the exclusive property and service mark of MSCI Inc. (“MSCI”) and Standard & Poor’s (“S&P”) and is licensed for use by Marsico Capital Management, LLC (the “Adviser”). Neither MSCI, S&P, nor the Adviser or any third party involved in compiling GICS makes any express or implied warranties or representations with respect to such standard or classification (or the results from use thereof), and all such parties hereby expressly disclaim all warranties of originality, accuracy, completeness, merchantability and fitness for a particular purpose with respect to any such standard or classification. MSCI, S&P, the Adviser, and any of their affiliates or third parties involved in compiling GICS shall not have any liability for any direct, indirect, special, punitive, consequential or any other damages (including lost profits) even if notified of the possibility of such damages. |
(3) | Through September 30, 2016, the Funds reported certain real estate investment trusts as having been classified within the Financials sector. These investments are now reported in the new GICS Real Estate sector. References to investment sector exposure included throughout this semi-annual report reflect the impact of this change. |
9
March 31, 2017 (Unaudited)
The Focus Fund is a non-diversified portfolio and invests primarily in the common stocks of large companies that are selected for their long-term growth potential. The Fund will normally hold a core position of between 20 and 35 common stocks.
TOTAL ANNUAL OPERATING EXPENSES* 1.27% | NET ASSETS $522,133,099 | NET ASSET VALUE PER SHARE $16.90 |
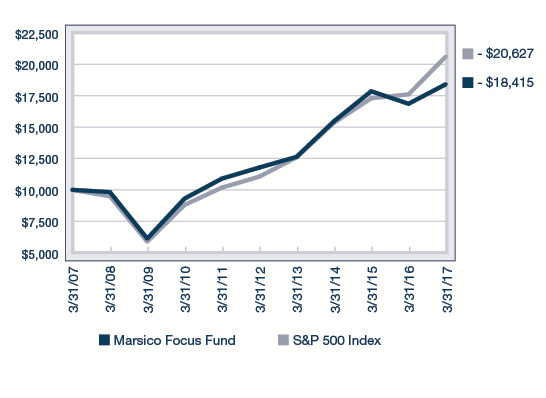
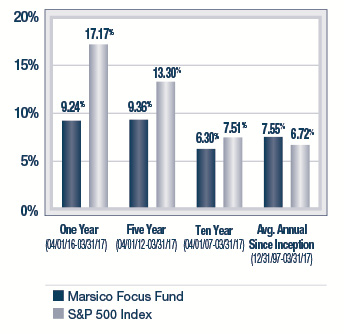
GROWTH OF $10,000(1) | PERFORMANCE COMPARISON |
| 
|
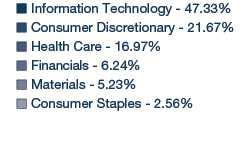
SECTOR ALLOCATION(2) | TOP FIVE HOLDINGS |
| | | | |
| | Facebook, Inc. - Cl. A | 6.91% | |
| | Amazon.com, Inc. | 6.48% | |
| | Alibaba Group Holding Ltd. Spon. ADR | 5.04% | |
| | Visa, Inc. - Cl. A | 5.02% | |
| | UnitedHealth Group, Inc. | 5.00% | |
| | | | |
* | The Total Annual Operating Expenses are reflective of the information disclosed in the Funds’ Prospectus dated January 30, 2017 and may differ from the expense ratio disclosed in this report. |
| The performance data quoted here represent past performance, and past performance is not a guarantee of future results. Investment return and principal value of an investment will fluctuate so that an investor’s shares, when redeemed, may be worth more or less than their original cost. Current performance may be lower or higher than the performance information quoted. To obtain performance information current to the most recent month-end, please call 888-860-8686 or visit marsicofunds.com. |
| The performance included in the chart and graph does not reflect the deduction of taxes on Fund distributions or the redemption of Fund shares. |
| All indices are unmanaged and investors cannot invest directly in an index. |
(1) | This chart assumes an initial investment of $10,000 made on March 31, 2007. Total returns are based on net change in NAV, assuming reinvestment of distributions. |
(2) | Sector weightings represent the percentage of the Fund’s investments (excluding cash equivalents) in certain general sectors. These sectors may include more than one industry. The Fund’s portfolio composition is subject to change at any time. |
10
MARSICO FOCUS FUND
SCHEDULE OF INVESTMENTS
March 31, 2017 (Unaudited)
| | | Number
of
Shares | | | Value | | | Percent
of Net
Assets | |
COMMON STOCKS | | | | | | | | | |
Application Software | | | | | | | | | |
salesforce.com, inc.* | | | 311,046 | | | $ | 25,658,185 | | | | 4.91 | % |
| | | | | | | | | | | | | |
Biotechnology | | | | | | | | | | | | |
Celgene Corporation* | | | 172,901 | | | | 21,514,071 | | | | 4.12 | |
| | | | | | | | | | | | | |
Data Processing & Outsourced Services | |
PayPal Holdings, Inc.* | | | 393,900 | | | | 16,945,578 | | | | 3.25 | |
Visa, Inc. - Cl. A | | | 295,240 | | | | 26,237,979 | | | | 5.02 | |
| | | | | | | | 43,183,557 | | | | 8.27 | |
Diversified Banks | | | | | | | | | | | | |
Wells Fargo & Company | | | 335,864 | | | | 18,694,190 | | | | 3.58 | |
| | | | | | | | | | | | | |
Fertilizers & Agricultural Chemicals | |
Monsanto Company | | | 97,914 | | | | 11,083,865 | | | | 2.12 | |
| | | | | | | | | | | | | |
Financial Exchanges & Data | | | | | | | | | |
Intercontinental Exchange, Inc. | | | 231,928 | | | | 13,885,529 | | | | 2.66 | |
| | | | | | | | | | | | | |
Health Care Equipment | | | | | | | | | | | | |
Boston Scientific Corporation* | | | 556,508 | | | | 13,840,354 | | | | 2.65 | |
| | | | | | | | | | | | | |
Home Entertainment Software | |
Activision Blizzard, Inc. | | | 470,731 | | | | 23,470,648 | | | | 4.50 | |
| | | | | | | | | | | | | |
Home Improvement Retail | | | | | | | | | | | | |
The Home Depot, Inc. | | | 135,631 | | | | 19,914,700 | | | | 3.81 | |
| | | | | | | | | | | | | |
Internet & Direct Marketing Retail | |
Amazon.com, Inc.* | | | 38,169 | | | | 33,838,345 | | | | 6.48 | |
The Priceline Group, Inc.* | | | 13,196 | | | | 23,488,484 | | | | 4.50 | |
| | | | | | | | 57,326,829 | | | | 10.98 | |
Internet Software & Services | |
Alibaba Group Holding Ltd. Spon. ADR* | | | 244,080 | | | | 26,319,146 | | | | 5.04 | |
Alphabet, Inc. - Cl. A* | | | 23,998 | | | | 20,345,504 | | | | 3.90 | |
Facebook, Inc. - Cl. A* | | | 253,993 | | | | 36,079,706 | | | | 6.91 | |
| | | | | | | | 82,744,356 | | | | 15.85 | |
IT Consulting & Other Services | |
Accenture PLC - Cl. A | | | 131,527 | | | | 15,767,457 | | | | 3.02 | |
| | | | | | | | | | | | | |
Managed Health Care | | | | | | | | | | | | |
Anthem, Inc. | | | 80,392 | | | | 13,295,229 | | | | 2.54 | |
UnitedHealth Group, Inc. | | | 159,128 | | | | 26,098,583 | | | | 5.00 | |
| | | | | | | | 39,393,812 | | | | 7.54 | |
Movies & Entertainment | | | | | | | | | | | | |
The Walt Disney Company | | | 160,632 | | | | 18,214,062 | | | | 3.49 | |
| | | | | | | | | | | | | |
Packaged Foods & Meats | | | | | | | | | | | | |
The Kraft Heinz Company | | | 147,267 | | | | 13,373,316 | | | | 2.56 | |
| | | | | | | | | | | | | |
Pharmaceuticals | | | | | | | | | | | | |
Merck & Co., Inc. | | | 217,870 | | | | 13,843,460 | | | | 2.65 | |
| | | | | | | | | | | | | |
COMMON STOCKS (continued) | |
Restaurants | | | | | | | | | | | | |
Domino's Pizza Enterprises Ltd. | | | 397,088 | | | $ | 17,632,162 | | | | 3.38 | % |
| | | | | | | | | | | | | |
Semiconductor Equipment | | | | | | | | | | | | |
Applied Materials, Inc. | | | 276,441 | | | | 10,753,555 | | | | 2.06 | |
| | | | | | | | | | | | | |
Semiconductors | | | | | | | | | | | | |
NVIDIA Corporation | | | 143,123 | | | | 15,590,388 | | | | 2.99 | |
Texas Instruments, Inc. | | | 208,940 | | | | 16,832,207 | | | | 3.22 | |
| | | | | | | | 32,422,595 | | | | 6.21 | |
Specialty Chemicals | | | | | | | | | | | | |
The Sherwin-Williams Company | | | 52,220 | | | | 16,198,122 | | | | 3.10 | |
| | | | | | | | | | | | | |
Technology Hardware, Storage & Peripherals | |
Apple, Inc. | | | 90,715 | | | | 13,032,117 | | | | 2.50 | |
| | | | | | | | | | | | | |
TOTAL COMMON STOCKS | | | | | | | | | | | | |
(Cost $400,234,219) | | | | | | | 521,946,942 | | | | 99.96 | |
| | | | | | | | | | | | | |
TOTAL INVESTMENTS | | | | | | | | | | | | |
(Cost $400,234,219) | | | | | | | 521,946,942 | | | | 99.96 | |
| | | | | | | | | | | | | |
Cash and Other Assets, Less Liabilities | | | | | | | 186,157 | | | | 0.04 | |
| | | | | | | | | | | | | |
NET ASSETS | | | | | | $ | 522,133,099 | | | | 100.00 | % |
| See notes to financial statements. |
11
INVESTMENT REVIEW BY TOM MARSICO (UNAUDITED)
The Marsico Growth Fund posted a total return of +5.31% for the six-month fiscal period ended March 31, 2017. The Fund underperformed the S&P 500 Index, the Fund’s benchmark index, which had a total return of +10.12% over the same time period. Please see the Fund’s Overview for more detailed information about the Fund’s longer-term performance for various time periods ended March 31, 2017.
The performance data for the Fund quoted here represent past performance, and past performance is not a guarantee of future results. Investment return and principal value of an investment will fluctuate so that an investor’s shares, when redeemed, may be worth more or less than their original cost. Current performance may be lower or higher than the performance information quoted. To obtain performance information current to the most recent month-end, please call 888-860-8686 or visit marsicofunds.com.(1)
This review highlights Fund performance over a six-month fiscal period. Shareholders should keep in mind that the Fund is intended for long-term investors who hold their shares for substantially longer periods of time. You should also keep in mind that our current views and beliefs regarding all investments discussed in this report are subject to change at any time. References to specific securities, industries, and sectors discussed in this report are not recommendations to buy or sell such securities or related investments, and the Fund may not necessarily hold these securities or investments today. Please see the accompanying Schedule of Investments for the percentage of the Fund’s portfolio represented by the securities mentioned in this report as of the end of the reporting period.
The Fund is subject to broad risks associated with investing in equity securities markets generally, including the risks that the securities and markets in which it invests may experience volatility and instability, that domestic and global economies and markets may undergo periods of cyclical change and decline, that investors may at times avoid investments in equity securities, and that investments may not perform as anticipated. Please see the Prospectus for more information.
The Fund is not managed to track the benchmark index, and may hold a substantially overweight or underweight position in a sector, industry, or security compared to its weight in the benchmark. For informational purposes, the discussion below may compare the benchmark weight or performance of a sector or industry to the investment approach of the Fund.
Much of the Growth Fund’s underperformance during the six months ended March 31, 2017, as compared to the S&P 500 Index, was attributable to certain holdings in the Information Technology and Industrials sectors. Additionally, the Fund lagged the Index due to an underweight allocation to the strong-performing Financials sector.
Stock prices of several Information Technology companies underperformed during the reporting period, primarily in the Software & Services industry group. Shares of FleetCor Technologies, Inc., a fleet credit card company, dropped -13% during the semi-annual period. The weakness in the stock reflected the persistent slowdown in US oil & gas and construction markets—industries that are large users of fleet cards. Nevertheless, the February earnings report was strong, and we remain optimistic about organic growth for FleetCor in 2017. Although Chinese Internet conglomerate Alibaba Group Holding Ltd. Spon. ADR returned +2% in the period, it lagged the S&P 500 Index return. This was attributable mainly to developments during the fourth quarter of 2016 including general uncertainty in China as the new Trump administration took office. Additionally, the stock was a victim of general weakness in the sector post-election as investor sentiment shifted away from more “growth” oriented names toward the more cyclical Industrials and Financials sectors.
The Fund’s position in online payments facilitator PayPal Holdings, Inc. slid -1% during the period, as PayPal was a victim of sector rotations into more value-oriented names in the Financials, Industrials, and Energy sectors. However, we continue to believe we are in the early stages of mobile-spend acceleration, and we maintain a position in the stock.
A holding in the Industrials sector, Nielsen Holdings PLC, dropped -21% during the period and was sold from the Fund. It underperformed due to substantial missteps by management in addressing the changing landscape in its Consumer Packaged Goods (“CPG”) measurement business. CPG companies are spending more in their e-commerce channels, and Nielsen has failed to develop strong measurement tools to help those CPG companies move effectively in this new environment.
Two of the Fund’s Consumer Discretionary holdings struggled during the period, including consumer products company Newell Brands, Inc. and O’Reilly Automotive, Inc. Newell’s share price was challenged (-11% before being sold) largely due to investor concerns that sales growth had slowed following a weaker-than-expected holiday selling period. Automotive aftermarket parts retailer O’Reilly Automotive, Inc. (-4%) posted a negative return during the period. This occurred as
12
investors grew cautious over Amazon.com, Inc.’s entrance into the market and O’Reilly’s uncertain ability to outperform strong sales growth from the prior year. In addition, gasoline prices have risen substantially year-over-year, causing investor concern that fewer miles driven may lead to fewer car failures and subsequent repairs.
The Fund initiated a position in Apple, Inc. in February. Although the stock performed well for the Fund by returning +9% during the period, the overall weight of Apple in the Fund lagged Apple’s weight in the S&P 500 Index (3.7% as of period end), causing a relative drag on the Fund’s performance compared to the Index. We continue to be positive on future growth prospects for the company. Because Apple holds an enormous amount of cash domiciled overseas, the prospect of tax reform and repatriation could lead to significant increases in its capital allocation to shareholders from share repurchases and/or dividend increases. Additionally, Apple is increasing its mix of recurring revenue services – thereby structurally improving its business model – while preparing for what may be a super cycle of iPhone upgrades in the second half of 2017.
An individual holding within the Health Care Equipment & Services industry group posted a negative return. Edwards Lifesciences Corporation declined by -25% prior to being sold from the Fund. The company has struggled to meet expectations for its expansion into the minimally-invasive heart valve replacement market.
In the Real Estate sector, Crown Castle International Corp. is normally a defensive, high-yield position. However, as rate-sensitive stocks rallied dramatically on the Federal Reserve’s rate increase announcements, Crown Castle rallied less, to the tune of +2%, lagging the broader Index return. The Fund maintains a position in the stock and we expect continued cash flow growth for the company.
From a sector allocation perspective, the Fund’s performance was impaired by having an underweight exposure to the Financials sector – the strongest-performing sector of the S&P 500 Index during the period. In the post-Trump election environment, primarily in the 4th quarter of 2016, Financials led the market higher as they were perceived to be the most direct beneficiaries of President Trump’s pro-growth initiatives. We believed valuations for many companies in the sector became stretched very rapidly, although we eventually identified select opportunities in Financials. We also found more compelling, longer-term growth investment opportunities in other sectors, such as Information Technology, which substantially outperformed later in the period as discussed below.
The picture was brighter in other areas. Two holdings in the Health Care sector, HCA Holdings, Inc. (+30%) and UnitedHealth Group, Inc. (+18%), had a significant, positive impact on Fund performance. The Fund initiated a position in HCA as a result of weakness in the stock resulting from the Presidential election. After the election of President Trump, investors became uncertain around the future of the Affordable Care Act (“ACA”). The ACA benefitted HCA’s profitability, and the stock recovered because a complete reversal of the ACA was deemed difficult to achieve, mainly due to the sheer number of individuals who had received insurance under the ACA. UnitedHealth’s performance was driven by its return to operational growth. The company’s decision to exit the ACA exchanges resulted in a normalization of growth as the company capped its exchange insurance losses in 2016. In addition, UnitedHealth’s insurance division continued to outperform the industry in the commercial, Medicare, and Medicaid markets. Finally, the company continued to experience robust growth in its OptumHealth business as UnitedHealth expanded its ambulatory healthcare services offerings in the US.
A single Information Technology holding in the Software & Services industry group, Adobe Systems, Inc., returned +20% during the period. The company benefitted as more businesses are investing their information technology budgets in digital marketing efforts. We believe that Adobe is one of the best positioned software companies in the digital marketing space.
In the Consumer Discretionary sector, online travel services company The Priceline Group, Inc. rose +21% as the company benefitted from the growth in online hotel room bookings through its website. Priceline has expanded geographically and scaled its business by increasing the number of properties on its website and marketing effectively to new markets. Priceline is growing despite increased competition from TripAdvisor, Ctrip.com and Airbnb as well as direct discounts on hotel websites. To compete with Airbnb, Priceline is ramping up the number of private home properties on its website and currently has 590,000 non-hotel listings, up 49% from a year ago.
From a sector allocation perspective, the Fund was aided relative to its benchmark index by having no exposure to the weak-performing Energy sector and maintaining an overweight allocation to the strong-performing Information Technology sector. Additionally, the Fund benefitted from an underweight stance in the Consumer Staples sector, as the sector’s return lagged the return of the S&P 500 Index.
13
During the reporting period, the Fund reduced its exposure to the Consumer Discretionary, Industrials, Real Estate,(2) and Materials sectors. The Fund increased its allocations to the Financials, Information Technology, Health Care, and Consumer Staples sectors.
Fiscal Period-End Investment Posture
As of March 31, 2017, the Fund’s largest sector allocations included Information Technology, Health Care, Consumer Discretionary, and Financials. As of that date, the Fund had no exposure to the Energy, Utilities, or Telecommunication Services sectors.
Effective on and after December 1, 2016, Coralie Witter no longer served as a co-manager of the Marsico Growth Fund, and Thomas F. Marsico is solely responsible for day-to-day management of the Fund.
Sincerely,
THOMAS F. MARSICO
PORTFOLIO MANAGER
(1) | Total returns are based on net change in net asset value assuming reinvestment of distributions. Please see the Prospectus for more information. |
(2) | Through September 30, 2016, the Funds reported certain real estate investment trusts as having been classified within the Financials sector. These investments are now reported in the new GICS Real Estate sector. References to investment sector exposure included throughout this semi-annual report reflect the impact of this change. |
14
March 31, 2017 (Unaudited)
The Growth Fund is a diversified portfolio and invests primarily in the common stocks of large companies that are selected for their long-term growth potential. The Growth Fund will normally hold a core position of between 35 and 50 common stocks.
TOTAL ANNUAL OPERATING EXPENSES* 1.36% | NET ASSETS $257,013,307 | NET ASSET VALUE PER SHARE $16.23 |
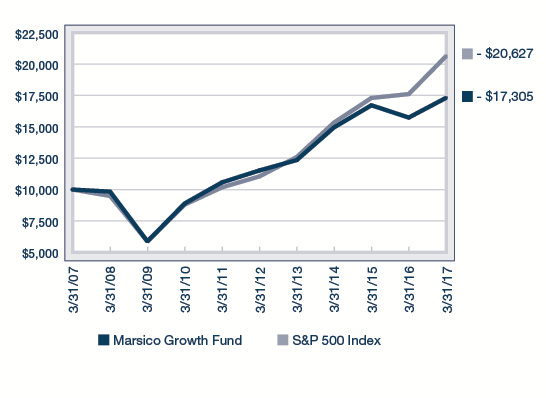
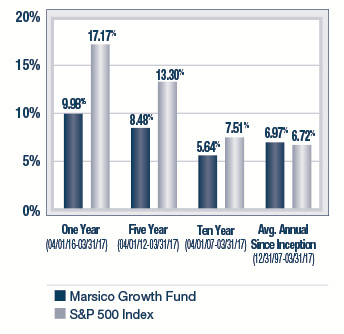
GROWTH OF $10,000(1) | PERFORMANCE COMPARISON |
| 
|
SECTOR ALLOCATION(2) | TOP FIVE HOLDINGS |
| | | | |
| | Facebook, Inc. - Cl. A | 5.31% | |
| | Visa, Inc. - Cl. A | 4.19% | |
| | Amazon.com, Inc. | 3.94% | |
| | Adobe Systems, Inc. | 3.68% | |
| | Alibaba Group Holding Ltd. Spon. ADR | 3.67% | |
| | | | |
* | The Total Annual Operating Expenses are reflective of the information disclosed in the Funds’ Prospectus dated January 30, 2017 and may differ from the expense ratio disclosed in this report. |
| The performance data quoted here represent past performance, and past performance is not a guarantee of future results. Investment return and principal value of an investment will fluctuate so that an investor’s shares, when redeemed, may be worth more or less than their original cost. Current performance may be lower or higher than the performance information quoted. To obtain performance information current to the most recent month-end, please call 888-860-8686 or visit marsicofunds.com. |
| The performance included in the chart and graph does not reflect the deduction of taxes on Fund distributions or the redemption of Fund shares. |
| All indices are unmanaged and investors cannot invest directly in an index. |
(1) | This chart assumes an initial investment of $10,000 made on March 31, 2007. Total returns are based on net change in NAV, assuming reinvestment of distributions. |
(2) | Sector weightings represent the percentage of the Fund’s investments (excluding cash equivalents) in certain general sectors. These sectors may include more than one industry. The Fund’s portfolio composition is subject to change at any time. |
15
MARSICO GROWTH FUND
SCHEDULE OF INVESTMENTS
March 31, 2017 (Unaudited)
| | | Number
of
Shares | | | Value | | | Percent
of Net
Assets | |
COMMON STOCKS | | | | | | | | | |
Aerospace & Defense | | | | | | | | | |
Lockheed Martin Corporation | | | 30,332 | | | $ | 8,116,843 | | | | 3.16 | % |
Raytheon Company | | | 31,428 | | | | 4,792,770 | | | | 1.86 | |
| | | | | | | | 12,909,613 | | | | 5.02 | |
Apparel Retail | | | | | | | | | | | | |
The TJX Companies, Inc. | | | 49,276 | | | | 3,896,746 | | | | 1.52 | |
| | | | | | | | | | | | | |
Application Software | | | | | | | | | | | | |
Adobe Systems, Inc.* | | | 72,717 | | | | 9,462,663 | | | | 3.68 | |
salesforce.com, inc.* | | | 90,863 | | | | 7,495,289 | | | | 2.92 | |
| | | | | | | | 16,957,952 | | | | 6.60 | |
Automotive Retail | | | | | | | | | | | | |
O'Reilly Automotive, Inc.* | | | 19,232 | | | | 5,189,563 | | | | 2.02 | |
| | | | | | | | | | | | | |
Biotechnology | | | | | | | | | | | | |
Amgen, Inc. | | | 51,709 | | | | 8,483,896 | | | | 3.30 | |
Celgene Corporation* | | | 45,615 | | | | 5,675,874 | | | | 2.21 | |
| | | | | | | | 14,159,770 | | | | 5.51 | |
Data Processing & Outsourced Services | |
FleetCor Technologies, Inc.* | | | 29,917 | | | | 4,530,331 | | | | 1.76 | |
PayPal Holdings, Inc.* | | | 153,764 | | | | 6,614,927 | | | | 2.58 | |
Visa, Inc. - Cl. A | | | 121,278 | | | | 10,777,976 | | | | 4.19 | |
| | | | | | | | 21,923,234 | | | | 8.53 | |
Distillers & Vintners | | | | | | | | | | | | |
Constellation Brands, Inc. - Cl. A | | | 33,546 | | | | 5,436,800 | | | | 2.12 | |
| | | | | | | | | | | | | |
Diversified Banks | | | | | | | | | | | | |
Wells Fargo & Company | | | 104,922 | | | | 5,839,959 | | | | 2.27 | |
| | | | | | | | | | | | | |
Fertilizers & Agricultural Chemicals | |
Monsanto Company | | | 17,512 | | | | 1,982,358 | | | | 0.77 | |
| | | | | | | | | | | | | |
Financial Exchanges & Data | | | | | | | | | |
Intercontinental Exchange, Inc. | | | 80,625 | | | | 4,827,019 | | | | 1.88 | |
| | | | | | | | | | | | | |
Health Care Equipment | | | | | | | | | | | | |
Boston Scientific Corporation* | | | 150,353 | | | | 3,739,279 | | | | 1.46 | |
| | | | | | | | | | | | | |
Health Care Facilities | | | | | | | | | | | | |
HCA Holdings, Inc.* | | | 56,135 | | | | 4,995,454 | | | | 1.94 | |
| | | | | | | | | | | | | |
Health Care Services | | | | | | | | | | | | |
Laboratory Corporation of America Holdings* | | | 46,035 | | | | 6,604,641 | | | | 2.57 | |
| | | | | | | | | | | | | |
Home Improvement Retail | | | | | | | | | | | | |
The Home Depot, Inc. | | | 45,948 | | | | 6,746,545 | | | | 2.63 | |
| | | | | | | | | | | | | |
Hotel & Resort REITs | | | | | | | | | | | | |
MGM Growth Properties LLC - Cl. A | | | 103,079 | | | | 2,788,287 | | | | 1.09 | |
| | | | | | | | | | | | | |
Hotels, Resorts & Cruise Lines | |
Norwegian Cruise Line Holdings Ltd.* | | | 116,431 | | | | 5,906,545 | | | | 2.30 | |
COMMON STOCKS (continued) | |
Internet & Direct Marketing Retail | |
Amazon.com, Inc.* | | | 11,432 | | | $ | 10,134,925 | | | | 3.94 | % |
The Priceline Group, Inc.* | | | 4,633 | | | | 8,246,601 | | | | 3.21 | |
| | | | | | | | 18,381,526 | | | | 7.15 | |
Internet Software & Services | |
Alibaba Group Holding Ltd. Spon. ADR* | | | 87,498 | | | | 9,434,909 | | | | 3.67 | |
Alphabet, Inc. - Cl. A* | | | 9,493 | | | | 8,048,165 | | | | 3.13 | |
Facebook, Inc. - Cl. A* | | | 96,120 | | | | 13,653,846 | | | | 5.31 | |
Tencent Holdings Ltd. | | | 145,100 | | | | 4,159,851 | | | | 1.62 | |
| | | | | | | | 35,296,771 | | | | 13.73 | |
IT Consulting & Other Services | |
Accenture PLC - Cl. A | | | 54,514 | | | | 6,535,138 | | | | 2.54 | |
| | | | | | | | | | | | | |
Managed Health Care | | | | | | | | | | | | |
Anthem, Inc. | | | 23,163 | | | | 3,830,697 | | | | 1.49 | |
UnitedHealth Group, Inc. | | | 47,060 | | | | 7,718,311 | | | | 3.00 | |
| | | | | | | | 11,549,008 | | | | 4.49 | |
Movies & Entertainment | | | | | | | | | | | | |
The Walt Disney Company | | | 64,071 | | | | 7,265,011 | | | | 2.83 | |
| | | | | | | | | | | | | |
Multi-Sector Holdings | | | | | | | | | | | | |
Berkshire Hathaway, Inc. - Cl. B* | | | 44,885 | | | | 7,481,432 | | | | 2.91 | |
| | | | | | | | | | | | | |
Packaged Foods & Meats | | | | | | | | | | | | |
The Kraft Heinz Company | | | 81,879 | | | | 7,435,432 | | | | 2.89 | |
| | | | | | | | | | | | | |
Pharmaceuticals | | | | | | | | | | | | |
Merck & Co., Inc. | | | 51,676 | | | | 3,283,493 | | | | 1.28 | |
Zoetis, Inc. | | | 126,679 | | | | 6,760,858 | | | | 2.63 | |
| | | | | | | | 10,044,351 | | | | 3.91 | |
Regional Banks | | | | | | | | | | | | |
First Republic Bank | | | 57,608 | | | | 5,404,206 | | | | 2.10 | |
| | | | | | | | | | | | | |
Semiconductors | | | | | | | | | | | | |
Texas Instruments, Inc. | | | 49,505 | | | | 3,988,123 | | | | 1.55 | |
| | | | | | | | | | | | | |
Specialized REITs | | | | | | | | | | | | |
Crown Castle International Corp. | | | 43,588 | | | | 4,116,887 | | | | 1.60 | |
| | | | | | | | | | | | | |
Specialty Chemicals | | | | | | | | | | | | |
The Sherwin-Williams Company | | | 17,682 | | | | 5,484,780 | | | | 2.13 | |
| | | | | | | | | | | | | |
Technology Hardware, Storage & Peripherals | |
Apple, Inc. | | | 38,140 | | | | 5,479,192 | | | | 2.13 | |
| | | | | | | | | | | | | |
TOTAL COMMON STOCKS | | | | | | | | | | | | |
(Cost $194,093,994) | | | | | | | 252,365,622 | | | | 98.19 | |
| See notes to financial statements. |
16
| | | Number
of
Shares | | | Value | | | Percent
of Net
Assets | |
SHORT-TERM INVESTMENTS | |
State Street Institutional Treasury Money Market Fund, 0.000% | | | 6,824,837 | | | $ | 6,824,837 | | | | 2.66 | % |
| | | | | | | | | | | | | |
TOTAL SHORT-TERM INVESTMENTS | | | | | | | | | |
(Cost $6,824,837) | | | | | | | 6,824,837 | | | | 2.66 | |
| | | | | | | | | | | | | |
TOTAL INVESTMENTS | | | | | | | | | | | | |
(Cost $200,918,831) | | | | | | | 259,190,459 | | | | 100.85 | |
| | | | | | | | | | | | | |
Liabilities, Less Cash and Other Assets | | | | | | | (2,177,152 | ) | | | (0.85 | ) |
| | | | | | | | | | | | | |
NET ASSETS | | | | | | $ | 257,013,307 | | | | 100.00 | % |
| See notes to financial statements. |
17
INVESTMENT REVIEW BY BRANDON GEISLER (UNAUDITED)
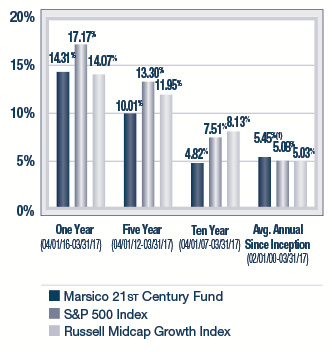
The Marsico 21st Century Fund posted a total return of +6.94% for the six-month fiscal period ended March 31, 2017. The Fund underperformed the S&P 500 Index, the Fund’s primary benchmark index, which had a total return of +10.12% over the same time period. The Russell Midcap Growth Index, a proxy for the performance of medium-capitalization US equity securities (which may be a useful comparison in light of the Fund’s current medium-capitalization positioning), had a total return of +7.38%. Please see the Fund’s Overview for more detailed information about the Fund’s longer-term performance for various time periods ended March 31, 2017.
The performance data for the Fund quoted here represent past performance, and past performance is not a guarantee of future results. Investment return and principal value of an investment will fluctuate so that an investor’s shares, when redeemed, may be worth more or less than their original cost. Current performance may be lower or higher than the performance information quoted. To obtain performance information current to the most recent month-end, please call 888-860-8686 or visit marsicofunds.com.(1)
This review highlights Fund performance over a six-month fiscal period. Shareholders should keep in mind that the Fund is intended for long-term investors who hold their shares for substantially longer periods of time. You should also keep in mind that our current views and beliefs regarding all investments discussed in this report are subject to change at any time. References to specific securities, industries, and sectors discussed in this report are not recommendations to buy or sell such securities or related investments, and the Fund may not necessarily hold these securities or investments today. Please see the accompanying Schedule of Investments for the percentage of the Fund’s portfolio represented by the securities mentioned in this report as of the end of the reporting period.
The Fund is subject to broad risks associated with investing in equity securities markets generally, including the risks that the securities and markets in which it invests may experience volatility and instability, that domestic and global economies and markets may undergo periods of cyclical change and decline, that investors may at times avoid investments in equity securities, and that investments may not perform as anticipated. Please see the Prospectus for more information.
The Fund is not managed to track the benchmark index, and may hold a substantially overweight or underweight position in a sector, industry, or security compared to its weight in the benchmark. For informational purposes, the discussion below may compare the benchmark weight or performance of a sector or industry to the investment approach of the Fund.
The 21st Century Fund’s underperformance during the six-month period ended March 31, 2017 as compared to the S&P 500 Index was primarily attributable to certain holdings in the Information Technology and Consumer Staples sectors. Additionally, the Fund’s underweight position in the Financials sector was a detractor from returns.
Several of the Fund’s holdings in the Information Technology sector posted negative returns. Cyber security firm Palo Alto Networks, Inc. slid -29% during the period. Palo Alto was a detractor because the company missed market expectations for its January 2017 revenues and earnings. While the demand environment in cyber security remains firm, the company’s miss was self-inflicted as management conducted a larger than normal sales force reorganization that became disruptive and pushed out sales cycles in the final month of the quarter. The Fund continues to hold shares of Palo Alto because we believe the company’s longer-term posture is favorable. Shares of FleetCor Technologies, Inc., a fleet credit card company, dropped -13% during the semi-annual period. The weakness in the stock reflected the persistent slowdown in US oil & gas and construction markets—industries that are large users of fleet cards. Nevertheless, the February earnings report was strong and we remain optimistic about organic growth for FleetCor in 2017. Real Estate(2) information company CoStar Group, Inc. dropped -4% during the period, as the company’s 3Q results were disappointing. Investors expected steady margin progression in 2017, but instead Costar announced it would delay margin growth by investing heavily in hiring and marketing while also continuing to phase out some products. As long-term investors, we understand why this higher-multiple stock sold off, but believe it was temporary.
A few of the Fund’s Consumer Staples holdings posted negative returns that had an adverse effect on Fund performance. Beer-maker Constellation Brands, Inc. – Cl. A. (-2%) posted a negative return on investor sentiment following Donald Trump’s surprise election victory. The market believed that the company’s significant operations in Mexico could be impacted by President Trump’s criticisms of the North American Free Trade Agreement (NAFTA) and support for potential border taxes that might result in price increases for certain of Constellation’s products. However, it’s proven harder to agree on related policy changes than initially expected, and the Fund maintains a position in the stock.
18
Consumer staples company TreeHouse Foods, Inc. underperformed (-3%) due to a challenging third quarter driven by integration issues with its newly acquired Private Brands business, and the announcement that a key executive left the company. These issues caused the market to question management’s ability to realize the synergy goals announced at the time of the merger, and led to earnings revisions and a stock price decline. The Fund continues to hold shares of Treehouse because we believe the merger ultimately will have a positive impact on the company.
Within the Health Care sector, Acadia Healthcare Company, Inc. (-12%) detracted from Fund performance. Acadia’s weakness was attributed to a delay in the company’s acquisition of Priory due to additional antitrust scrutiny in the United Kingdom. In addition, the US election created uncertainty around the sustainability of the Affordable Care Act (“ACA”), which benefits Acadia as the legislation expanded behavioral health benefits provided to those who are insured.
From a sector allocation perspective, the Fund’s performance was impaired by having an underweight exposure (9.5% average weight over the period) to the Financials sector – one of the strongest-performing sectors of the S&P 500 Index during the period. In the post-Trump election environment, primarily in the 4th quarter of 2016, Financials led the market higher as they were perceived to be the most direct beneficiaries of Trump’s pro-growth initiatives. We believed valuations for many companies in the sector became stretched very rapidly, although we eventually identified select opportunities in Financials. We also found more compelling, longer-term growth investment opportunities in other sectors such as Information Technology, which substantially outperformed later in the period as discussed below.
On the brighter side, Fund holdings in the Consumer Discretionary sector performed well. A position in cruise line operator Norwegian Cruise Line Holdings Ltd. was among the Fund’s best performing holdings and posted a gain of +35% during the reporting period. Norwegian contributed to the Fund’s performance as the company reported improving demand trends for their European itineraries, driving enthusiasm for a full recovery in pricing and bookings after a challenging year in 2016 caused by geopolitical events in the region. Domestic pizza delivery company Domino’s Pizza, Inc. gained +22% as the company reported strong same store sales growth. Central to our investment thesis is Domino’s use of technology to enable customers to place their orders more efficiently, and other technology enhancements designed to prepare and deliver pizzas more quickly. NetFlix, Inc. continued to exhibit strength (+50%) and drove substantial subscriber growth both domestically and internationally. Alongside the acceleration in subscriber/revenue growth, the company has steadily improved margins across the business in developed markets.
Two Financials holdings, The Charles Schwab Corporation (+30%) and First Republic Bank (+22%), performed well during the period. At Schwab, business trends (especially increasing assets under management) remain excellent. Also in the short term, the stock traded with a potential positive catalyst reflecting increasing expectations of Federal Reserve rate hikes. Higher interest rates typically result in higher net investment income at Schwab. Regional bank First Republic outperformed as part of a broader bank stock rally post the Donald Trump victory. President Trump’s plan to ease regulation and cut tax rates is favorable for financial stocks. As specific confirmation of the vitality of First Republic’s business, the company reported two strong quarters over the period, which showed continued strong loan growth.
In the Software & Services industry group, Mobileye N.V., a provider of image sensing and processing technology for the automotive sector, gained +44%. The gains were due to strong underlying execution and continued market share wins with companies like BMW and Volkswagen, which ultimately culminated in the company’s purchase by Intel in March for approximately $15 billion dollars (which is expected to be completed near the end of 2017).
From a sector allocation perspective, the Fund was aided relative to its benchmark index by having no exposure to the weak-performing Energy sector and maintaining an overweight allocation to the strong-performing Information Technology sector. Additionally, the Fund benefitted from an underweight stance in the Health Care sector, as the sector’s return lagged the return on the S&P 500 Index.
The Fund invests across the market capitalization spectrum in companies of any size. Over the reporting period, the Fund continued to increase exposure to medium-capitalization companies, as we believe these companies have compelling growth opportunities that may not be recognized by the broader market. However, the Fund continues to hold stocks in what we consider to be high quality large-sized companies that we believe continue to offer strong long-term growth potential.
During the reporting period, the Fund slightly reduced its exposure to the Consumer Discretionary and Information Technology sectors. The Fund increased its investment assets in the Financials, Materials, and Health Care sectors.
19
Fiscal Period-End Investment Posture
As of March 31, 2017, the Fund’s primary economic sector allocations included Information Technology, Consumer Discretionary, Health Care, Financials, and Consumer Staples. The Fund had no investments in the Energy, Utilities, or Telecommunication Services sectors.
Sincerely,
BRANDON A. GEISLER
PORTFOLIO MANAGER
(1) | Total returns are based on net change in net asset value assuming reinvestment of distributions. Periodically, certain fees and expenses have been waived or reimbursed by the Adviser for the 21st Century Fund. In the absence of such a waiver or reimbursement, the performance returns reflected would have been reduced. In accordance with the expense limitation and fee waiver agreement, the Adviser may recoup fees and expenses previously waived or reimbursed under certain parameters. Periodically, the Adviser has recouped such fees or expenses from the 21st Century Fund, resulting in a lower performance return. Please see the Prospectus for more information. |
(2) | Through September 30, 2016, the Funds reported certain real estate investment trusts as having been classified within the Financials sector. These investments are now reported in the new GICS Real Estate sector. References to investment sector exposure included throughout this semi-annual report reflect the impact of this change. |
20
| 21st CENTURY FUND OVERVIEW |
March 31, 2017 (Unaudited)
The 21st Century Fund is a diversified portfolio and invests primarily in common stocks that are selected for their long-term growth potential. The Fund may invest in companies of any size. The portions of Fund assets invested in large-capitalization, medium-capitalization, or small-capitalization companies will vary based on market conditions, depending on the portfolio manager’s judgment as to how to achieve the Fund’s investment objective. Under current market conditions the portfolio manager expects to invest substantially in medium-capitalization companies. The Fund will normally hold a core position of between 35 and 60 common stocks.
TOTAL ANNUAL OPERATING EXPENSES* 1.41% | NET ASSETS $222,950,520 | NET ASSET VALUE PER SHARE $23.57 |
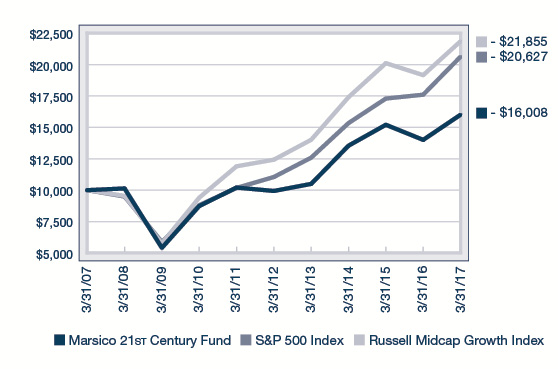
GROWTH OF $10,000(2) | PERFORMANCE COMPARISON |
| 
|
SECTOR ALLOCATION(3) | TOP FIVE HOLDINGS |
| | | | |
| | salesforce.com, inc. | 4.02% | |
| | Constellation Brands, Inc. - Cl. A | 4.02% | |
| | MasterCard, Inc. - Cl. A | 3.50% | |
| | Intuitive Surgical, Inc. | 3.34% | |
| | CoStar Group, Inc. | 3.31% | |
| | | | |
* | The Total Annual Operating Expenses are reflective of the information disclosed in the Funds’ Prospectus dated January 30, 2017 and may differ from the expense ratio disclosed in this report. |
| The performance data quoted here represent past performance, and past performance is not a guarantee of future results. Investment return and principal value of an investment will fluctuate so that an investor’s shares, when redeemed, may be worth more or less than their original cost. Current performance may be lower or higher than the performance information quoted. To obtain performance information current to the most recent month-end, please call 888-860-8686 or visit marsicofunds.com. |
| The performance included in the chart and graph does not reflect the deduction of taxes on Fund distributions or the redemption of Fund shares. |
| All indices are unmanaged and investors cannot invest directly in an index. |
(1) | Periodically, certain fees and expenses have been waived or reimbursed by the Adviser for the 21st Century Fund. In the absence of such a waiver or reimbursement, the performance returns reflected would have been reduced. In accordance with the expense limitation and fee waiver agreement, the Adviser may recoup fees and expenses previously waived or reimbursed under certain parameters. Periodically, the Adviser has recouped such fees or expenses from the 21st Century Fund, resulting in a lower performance return. |
(2) | This chart assumes an initial investment of $10,000 made on March 31, 2007. Total returns are based on net change in NAV, assuming reinvestment of distributions. |
(3) | Sector weightings represent the percentage of the Fund’s investments (excluding cash equivalents) in certain general sectors. These sectors may include more than one industry. The Fund’s portfolio composition is subject to change at any time. |
| The Russell Midcap Growth Index was added as a supplemental benchmark index. The Russell Midcap Growth Index is an index composed of mid-capitalization US equities that exhibit growth characteristics. |
21
MARSICO 21st CENTURY FUND
SCHEDULE OF INVESTMENTS
March 31, 2017 (Unaudited)
| | | Number
of
Shares | | | Value | | | Percent
of Net
Assets | |
COMMON STOCKS | | | | | | | | | |
Aerospace & Defense | | | | | | | | | |
HEICO Corporation | | | 7,039 | | | $ | 613,801 | | | | 0.27 | % |
| | | | | | | | | | | | | |
Apparel Retail | | | | | | | | | | | | |
Burlington Stores, Inc.* | | | 73,738 | | | | 7,173,970 | | | | 3.22 | |
| | | | | | | | | | | | | |
Application Software | | | | | | | | | | | | |
Adobe Systems, Inc.* | | | 46,275 | | | | 6,021,766 | | | | 2.70 | |
Atlassian Corporation PLC - Cl. A* | | | 39,927 | | | | 1,195,813 | | | | 0.54 | |
Mobileye N.V.* | | | 64,247 | | | | 3,944,766 | | | | 1.77 | |
PTC, Inc.* | | | 71,905 | | | | 3,778,608 | | | | 1.69 | |
salesforce.com, inc.* | | | 108,681 | | | | 8,965,095 | | | | 4.02 | |
The Descartes Systems Group, Inc.* | | | 107,200 | | | | 2,456,205 | | | | 1.10 | |
| | | | | | | | 26,362,253 | | | | 11.82 | |
Automobile Manufacturers | | | | | | | | | | | | |
Tesla, Inc.* | | | 8,270 | | | | 2,301,541 | | | | 1.03 | |
| | | | | | | | | | | | | |
Automotive Retail | | | | | | | | | | | | |
O'Reilly Automotive, Inc.* | | | 14,646 | | | | 3,952,077 | | | | 1.77 | |
| | | | | | | | | | | | | |
Biotechnology | | | | | | | | | | | | |
Alkermes PLC* | | | 39,854 | | | | 2,331,459 | | | | 1.05 | |
| | | | | | | | | | | | | |
Communications Equipment | |
Palo Alto Networks, Inc.* | | | 19,776 | | | | 2,228,360 | | | | 1.00 | |
| | | | | | | | | | | | | |
Construction Materials | | | | | | | | | | | | |
Vulcan Materials Company | | | 40,483 | | | | 4,877,392 | | | | 2.19 | |
| | | | | | | | | | | | | |
Data Processing & Outsourced Services | |
Broadridge Financial Solutions, Inc. | | | 55,281 | | | | 3,756,344 | | | | 1.68 | |
FleetCor Technologies, Inc.* | | | 25,930 | | | | 3,926,580 | | | | 1.76 | |
MasterCard, Inc. - Cl. A | | | 69,429 | | | | 7,808,680 | | | | 3.50 | |
Paysafe Group PLC* | | | 557,718 | | | | 3,267,426 | | | | 1.47 | |
Vantiv, Inc. - Cl. A* | | | 55,837 | | | | 3,580,268 | | | | 1.61 | |
| | | | | | | | 22,339,298 | | | | 10.02 | |
Distillers & Vintners | | | | | | | | | | | | |
Constellation Brands, Inc. - Cl. A | | | 55,246 | | | | 8,953,719 | | | | 4.02 | |
| | | | | | | | | | | | | |
Diversified Support Services | |
Healthcare Services Group, Inc. | | | 116,444 | | | | 5,017,572 | | | | 2.25 | |
| | | | | | | | | | | | | |
Electrical Components & Equipment | |
AMETEK, Inc. | | | 41,557 | | | | 2,247,403 | | | | 1.01 | |
| | | | | | | | | | | | | |
Electronic Equipment & Instruments | |
Cognex Corporation | | | 8,810 | | | | 739,599 | | | | 0.33 | |
| | | | | | | | | | | | | |
Food Retail | | | | | | | | | | | | |
Whole Foods Market, Inc. | | | 17,871 | | | | 531,126 | | | | 0.24 | |
| | | | | | | | | | | | | |
COMMON STOCKS (continued) | |
General Merchandise Stores | |
Ollie's Bargain Outlet Holdings, Inc.* | | | 66,073 | | | $ | 2,213,445 | | | | 0.99 | % |
| | | | | | | | | | | | | |
Health Care Equipment | | | | | | | | | | | | |
Dexcom, Inc.* | | | 33,314 | | | | 2,822,695 | | | | 1.27 | |
Intuitive Surgical, Inc.* | | | 9,723 | | | | 7,452,388 | | | | 3.34 | |
Teleflex, Inc. | | | 21,130 | | | | 4,093,515 | | | | 1.83 | |
| | | | | | | | 14,368,598 | | | | 6.44 | |
Health Care Facilities | | | | | | | | | | | | |
Acadia Healthcare Company, Inc.* | | | 78,555 | | | | 3,424,998 | | | | 1.53 | |
VCA, Inc.* | | | 12,379 | | | | 1,132,678 | | | | 0.51 | |
| | | | | | | | 4,557,676 | | | | 2.04 | |
Home Entertainment Software | |
Activision Blizzard, Inc. | | | 58,832 | | | | 2,933,363 | | | | 1.32 | |
Electronic Arts, Inc.* | | | 44,171 | | | | 3,954,188 | | | | 1.77 | |
| | | | | | | | 6,887,551 | | | | 3.09 | |
Hotels, Resorts & Cruise Lines | |
Marriott International, Inc. - Cl. A | | | 44,779 | | | | 4,217,286 | | | | 1.89 | |
Norwegian Cruise Line Holdings Ltd.* | | | 124,674 | | | | 6,324,712 | | | | 2.84 | |
| | | | | | | | 10,541,998 | | | | 4.73 | |
Industrial Machinery | | | | | | | | | | | | |
RBC Bearings, Inc.* | | | 5,866 | | | | 569,530 | | | | 0.26 | |
| | | | | | | | | | | | | |
Internet & Direct Marketing Retail | |
Ctrip.com International, Ltd. ADR* | | | 93,285 | | | | 4,584,958 | | | | 2.06 | |
NetFlix, Inc.* | | | 27,484 | | | | 4,062,410 | | | | 1.82 | |
| | | | | | | | 8,647,368 | | | | 3.88 | |
Internet Software & Services | |
CoStar Group, Inc.* | | | 35,651 | | | | 7,387,600 | | | | 3.31 | |
Scout24 A.G.* | | | 65,258 | | | | 2,182,500 | | | | 0.98 | |
Twilio, Inc. - Cl. A* | | | 33,147 | | | | 956,954 | | | | 0.43 | |
| | | | | | | | 10,527,054 | | | | 4.72 | |
Investment Banking & Brokerage | |
The Charles Schwab Corporation | | | 133,916 | | | | 5,465,112 | | | | 2.45 | |
| | | | | | | | | | | | | |
IT Consulting & Other Services | |
Gartner, Inc.* | | | 20,314 | | | | 2,193,709 | | | | 0.98 | |
| | | | | | | | | | | | | |
Metal & Glass Containers | | | | | | | | | | | | |
Ball Corporation | | | 21,676 | | | | 1,609,660 | | | | 0.72 | |
| | | | | | | | | | | | | |
Packaged Foods & Meats | | | | | | | | | | | | |
Blue Buffalo Pet Products, Inc.* | | | 70,623 | | | | 1,624,329 | | | | 0.73 | |
TreeHouse Foods, Inc.* | | | 58,519 | | | | 4,954,219 | | | | 2.22 | |
| | | | | | | | 6,578,548 | | | | 2.95 | |
Pharmaceuticals | | | | | | | | | | | | |
Pacira Pharmaceuticals, Inc.* | | | 38,675 | | | | 1,763,580 | | | | 0.79 | |
| | | | | | | | | | | | | |
Railroads | | | | | | | | | | | | |
Genesee & Wyoming, Inc. - Cl. A* | | | 59,592 | | | | 4,043,913 | | | | 1.81 | |
| See notes to financial statements. |
22
| | | Number
of
Shares | | | Value | | | Percent
of Net
Assets | |
COMMON STOCKS (continued) | |
Regional Banks | | | | | | | | | |
First Republic Bank | | | 76,842 | | | $ | 7,208,548 | | | | 3.24 | % |
Signature Bank* | | | 39,099 | | | | 5,801,901 | | | | 2.60 | |
| | | | | | | | 13,010,449 | | | | 5.84 | |
Research & Consulting Services | |
Verisk Analytics, Inc.* | | | 49,049 | | | | 3,979,836 | | | | 1.78 | |
| | | | | | | | | | | | | |
Restaurants | | | | | | | | | | | | |
Domino's Pizza, Inc. | | | 27,660 | | | | 5,097,738 | | | | 2.29 | |
| | | | | | | | | | | | | |
Semiconductor Equipment | | | | | | | | | | | | |
ASML Holding N.V. | | | 17,726 | | | | 2,354,013 | | | | 1.06 | |
| | | | | | | | | | | | | |
Semiconductors | | | | | | | | | | | | |
NVIDIA Corporation | | | 9,780 | | | | 1,065,335 | | | | 0.48 | |
| | | | | | | | | | | | | |
Soft Drinks | | | | | | | | | | | | |
Monster Beverage Corporation* | | | 83,895 | | | | 3,873,432 | | | | 1.74 | |
| | | | | | | | | | | | | |
Specialized Finance | | | | | | | | | | | | |
Element Fleet Management Corporation | | | 284,993 | | | | 2,638,090 | | | | 1.18 | |
| | | | | | | | | | | | | |
Specialized REITs | | | | | | | | | | | | |
Crown Castle International Corp. | | | 49,545 | | | | 4,679,525 | | | | 2.10 | |
SBA Communications Corporation - Cl. A* | | | 43,307 | | | | 5,212,864 | | | | 2.34 | |
| | | | | | | | 9,892,389 | | | | 4.44 | |
Specialty Chemicals | | | | | | | | | | | | |
The Sherwin-Williams Company | | | 15,007 | | | | 4,655,021 | | | | 2.09 | |
| | | | | | | | | | | | | |
Specialty Stores | | | | | | | | | | | | |
Ulta Beauty, Inc.* | | | 8,932 | | | | 2,547,674 | | | | 1.14 | |
| | | | | | | | | | | | | |
TOTAL COMMON STOCKS | | | | | | | | | | | | |
(Cost $161,539,112) | | | | | | | 218,751,289 | | | | 98.11 | |
| | | | | | | | | | | | | |
SHORT-TERM INVESTMENTS | |
State Street Institutional Treasury Money Market Fund, 0.000% | | | 5,566,999 | | | $ | 5,566,999 | | | | 2.50 | % |
| | | | | | | | | | | | | |
TOTAL SHORT-TERM INVESTMENTS | | | | | | | | | |
(Cost $5,566,999) | | | | | | | 5,566,999 | | | | 2.50 | |
| | | | | | | | | | | | | |
TOTAL INVESTMENTS | | | | | | | | | | | | |
(Cost $167,106,111) | | | | | | | 224,318,288 | | | | 100.61 | |
| | | | | | | | | | | | | |
Liabilities, Less Cash and Other Assets | | | | | | | (1,367,768 | ) | | | (0.61 | ) |
| | | | | | | | | | | | | |
NET ASSETS | | | | | | $ | 222,950,520 | | | | 100.00 | % |
| See notes to financial statements. |
23
| INTERNATIONAL OPPORTUNITIES FUND |
INVESTMENT REVIEW BY MUNISH MALHOTRA (UNAUDITED)
The Marsico International Opportunities Fund posted a total return of (US$) +1.21% for the six-month fiscal period ended March 31, 2017. The Fund underperformed the MSCI EAFE Index, the Fund’s benchmark index, which had a total return of (US$) +6.48% over the same time period. Please see the Fund’s Overview for more detailed information about the Fund’s longer-term performance for various time periods ended March 31, 2017.
The performance data for the Fund quoted here represent past performance, and past performance is not a guarantee of future results. Investment return and principal value of an investment will fluctuate so that an investor’s shares, when redeemed, may be worth more or less than their original cost. Current performance may be lower or higher than the performance information quoted. To obtain performance information current to the most recent month-end, please call 888-860-8686 or visit marsicofunds.com.(1)
This review highlights Fund performance over a six-month fiscal period. Shareholders should keep in mind that the Fund is intended for long-term investors who hold their shares for substantially longer periods of time. You should also keep in mind that our current views and beliefs regarding all investments discussed in this report are subject to change at any time. References to specific securities, industries, and sectors discussed in this report are not recommendations to buy or sell such securities or related investments, and the Fund may not necessarily hold these securities or investments today. Please see the accompanying Schedule of Investments for the percentage of the Fund’s portfolio represented by the securities mentioned in this report as of the end of the reporting period.
Foreign investments present additional risks due to currency fluctuations, economic and political factors, lower liquidity, differences in securities regulations and accounting standards, possible changes in taxation, limited public information, and other factors. In addition, the Fund is subject to broad risks associated with investing in equity securities markets generally, including the risks that the securities and markets in which it invests may experience volatility and instability, that domestic and global economies and markets may undergo periods of cyclical change and decline, that investors may at times avoid investments in equity securities, and that investments may not perform as anticipated. Please see the Prospectus for more information.
The Fund is not managed to track the benchmark index, and may hold a substantially overweight or underweight position in a sector, industry, or security compared to its weight in the benchmark. For informational purposes, the discussion below may compare the benchmark weight or performance of a sector or industry to the investment approach of the Fund.
The International Opportunities Fund’s underperformance during the six-month period ended March 31, 2017 as compared to the MSCI EAFE Index was primarily attributable to certain weaker stock holdings in the Consumer Discretionary, Information Technology, and Financials sectors.
Several of the Fund’s positions in the Consumer Services industry were detractors from performance. Australia-based Domino’s Pizza Enterprises Ltd.’s share price was challenged (-16%) largely due to a rotation (in Australia and globally) out of higher-growth names and into economically-sensitive cyclicals that had been laggards for years. Domino’s commands a premium valuation and, after reporting strong half-year results in the fall of 2016, the shares faded through the remainder of the period due to the slowdown in positive news and the heavy rotation into cyclicals. Domino’s Pizza Group PLC (-19%), a United Kingdom-based master franchiser of pizza stores, experienced a slowdown in overall same store sales. The Fund maintains a position in both stocks, as we believe these issues aren’t structural but rather are temporary cyclical matters.
Stock prices of several Information Technology companies underperformed during the reporting period, primarily in the Software & Services industry group. Notably, although Chinese Internet conglomerate Alibaba Group Holding Ltd. Spon. ADR returned +2% in the period, it lagged the broader industry group’s return. This was attributable mainly to developments in the fourth quarter of 2016, including general uncertainty in China as the new Trump administration took office. Additionally, the stock was a victim of general weakness in the sector post-election as investor sentiment shifted away from more “growth” oriented names toward the more cyclical Industrials and Financials sectors.
Media holding Next Company Ltd., Japan’s leading online real estate portal for rentals and home purchases, fell -16% during the period. The company incurred larger than normal capital and investment expenses which held back its operating margins. In addition, the company saw a slight slowdown in top-line revenue growth due largely to its prior overseas acquisition of Trovit.com.
One of the Fund’s Industrials holdings, global data measurement company Nielsen Holdings PLC, posted a return of -22% during the period prior to being sold, and was a detractor from performance.
24
| INTERNATIONAL OPPORTUNITIES FUND |
In terms of sector weights, the Fund was penalized for an underweight stance in the Financials and Materials sectors, two of the strongest-performing sectors in the MSCI EAFE Index during the period.
There were areas of significant positive performance during the reporting period. In particular, one of the Fund’s holdings within the Semiconductors & Semiconductor Equipment industry group, ASML Holding N.V., posted a +21% return for the period. ASML is a critical supplier to the global semiconductor industry, and produces photolithography machines that are used to imprint the pattern of the circuits of a chip onto silicon wafers with a precision measured in nanometers. The company has benefitted from an improved spending backdrop from its customers that produce logic, memory, and other semiconductors used in smartphones and cars. ASML’s next generation machines are expected to drive revenue and earnings growth through 2020.
India-based online retailer MakeMyTrip Ltd. gained +53%. The company acquired its largest competitor in late 2016, which doubled its market share in India. Additionally, concerns over the impact of India’s currency demonetization that had negatively impacted the stock in prior periods may have been overstated.
Japan-based online retailer Start Today Company Ltd. rose +30% during the period, adding to Fund returns. This strength was driven primarily by the company’s effective execution of growth initiatives during the third quarter of 2016, resulting in an acceleration in its core business plus traction in its new online used clothing initiative.
From a sector allocation perspective, the Fund was rewarded for an overweight stance in the strong-performing Information Technology sector. By the same measure, abstaining from investments in the Telecommunication Services, Real Estate, and Utilities sectors contributed positively to the Fund’s performance compared to the MSCI EAFE Index.
Although active currency management is not a central facet of the Fund’s investment process, fluctuations in major world currencies can at times affect the Fund’s performance. During the period, the net effect of currency moves was strongly positive for the Fund. In particular, the Fund’s results were positively affected by having an overweight allocation, as compared to the MSCI EAFE Index, to investments denominated in US dollar-based currencies, which strengthened during the period.
There were a few shifts in the Fund’s sector allocations during the period. The Fund reduced its allocations to the Consumer Staples and Industrials sectors and increased its allocations to the Consumer Discretionary and Financials sectors.
Fiscal Period-End Investment Posture
As of March 31, 2017, the Fund’s primary economic sector allocations included Information Technology, Consumer Discretionary, Financials, Health Care, and Industrials. The Fund had no exposure to the Energy, Utilities, Telecommunication Services, Real Estate,(2) and Materials sectors.
In terms of country allocations, the Fund’s most significant weightings at period-end, excluding short-term investments, were the United Kingdom, Germany, Japan, China/Hong Kong, Netherlands, and Canada. Country-level weightings generally should be considered a residual of the Fund’s stock selection process rather than a major, proactive facet of its investment strategy.
Sincerely,
MUNISH MALHOTRA, CFA
PORTFOLIO MANAGER
(1) | Total returns are based on net change in net asset value assuming reinvestment of distributions. Periodically, certain fees and expenses have been waived or reimbursed by the Adviser for the International Opportunities Fund. In the absence of such a waiver or reimbursement, the performance returns reflected would have been reduced. In accordance with the expense limitation and fee waiver agreement, the Adviser may recoup fees and expenses previously waived or reimbursed under certain parameters. Periodically, the Adviser has recouped such fees or expenses from the International Opportunities Fund, resulting in a lower performance return. Please see the Prospectus for more information. |
(2) | Through September 30, 2016, the Funds reported certain real estate investment trusts as having been classified within the Financials sector. These investments are now reported in the new GICS Real Estate sector. References to investment sector exposure included throughout this semi-annual report reflect the impact of this change. |
25
| INTERNATIONAL OPPORTUNITIES FUND OVERVIEW |
March 31, 2017 (Unaudited)
The International Opportunities Fund is a diversified portfolio and invests primarily (no less than 65% of its total assets) in common stocks of foreign companies that are selected for their long-term growth potential, including foreign securities, whether traded in the US (including as American Depositary Receipts) or in foreign markets or both. The Fund may invest in an unlimited number of companies of any size throughout the world. It normally invests in the securities of issuers that are economically tied to one or more foreign countries, and expects to be invested in various issuers or securities that together have ties to at least four different foreign countries. The Fund may invest in securities of companies economically tied to emerging markets. Some issuers or securities in the Fund’s portfolio may be economically tied to the US.
TOTAL ANNUAL OPERATING EXPENSES* 1.77% NET EXPENSES*†† 1.60% | NET ASSETS $54,920,951 | NET ASSET VALUE PER SHARE $15.83 |
GROWTH OF $10,000(1)(2) | PERFORMANCE COMPARISON |
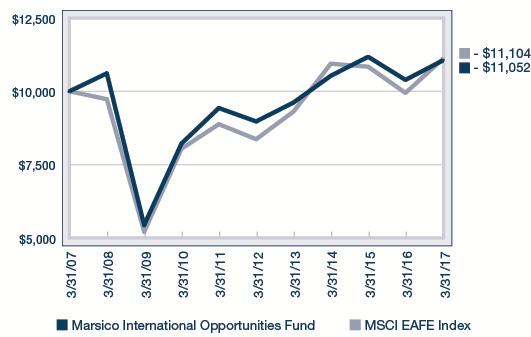
| 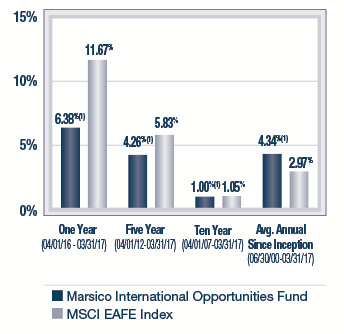
|
SECTOR ALLOCATION(3) | TOP FIVE HOLDINGS |
 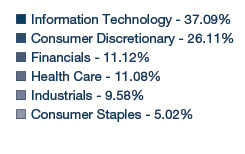
| | | | |
| | ASML Holding N.V. | 5.33% | |
| | Tencent Holdings Ltd. | 5.25% | |
| | Wirecard A.G. | 5.22% | |
| | InterXion Holding N.V. | 4.97% | |
| | Domino's Pizza Enterprises Ltd. | 4.31% | |
| | | | |
* | The Total Annual Operating Expenses and Net Expenses are reflective of the information disclosed in the Funds’ Prospectus dated January 30, 2017 and may differ from the expense ratios disclosed in this report. |
† | Marsico Capital Management, LLC (the “Adviser”) has entered into a written expense limitation and fee waiver agreement under which it has agreed to limit the total expenses of the International Opportunities Fund (excluding interest, taxes, acquired fund fees and expenses, litigation, brokerage and extraordinary expenses) to an annual rate of 1.60% of the Fund’s average net assets until January 31, 2018. This expense limitation and fee waiver agreement may be terminated by the Adviser at any time after January 31, 2018, upon 15 days prior notice to the Fund and its administrator. The Adviser may recoup from the Fund fees previously waived or expenses previously reimbursed by the Adviser with respect to the Fund pursuant to this agreement (or a previous expense limitation agreement) if: (1) such recoupment by the Adviser does not cause the Fund, at the time of recoupment, to exceed the lesser of (a) the expense limitation in effect at the time the relevant amount was waived and/or reimbursed, or (b) the expense limitation in effect at the time of the proposed recoupment, and (2) the recoupment is made within three fiscal years after the end of the fiscal year in which the amount was waived or reimbursed. |
| The performance data quoted here represent past performance, and past performance is not a guarantee of future results. Investment return and principal value of an investment will fluctuate so that an investor’s shares, when redeemed, may be worth more or less than their original cost. Current performance may be lower or higher than the performance information quoted. To obtain performance information current to the most recent month-end, please call 888-860-8686 or visit marsicofunds.com. |
| The performance included in the chart and graph does not reflect the deduction of taxes on Fund distributions or the redemption of Fund shares. |
| All indices are unmanaged and investors cannot invest directly in an index. |
(1) | Periodically, certain fees and expenses have been waived or reimbursed by the Adviser for the International Opportunities Fund. In the absence of such a waiver or reimbursement, the performance returns reflected would have been reduced. In accordance with the expense limitation and fee waiver agreement, the Adviser may recoup fees and expenses previously waived or reimbursed under certain parameters. Periodically, the Adviser has recouped such fees or expenses from the International Opportunities Fund, resulting in a lower performance return. |
(2) | This chart assumes an initial investment of $10,000 made on March 31, 2007. Total returns are based on net change in NAV, assuming reinvestment of distributions. |
(3) | Sector weightings represent the percentage of the Fund’s investments (excluding cash equivalents) in certain general sectors. These sectors may include more than one industry. The Fund’s portfolio composition is subject to change at any time. |
| The MSCI EAFE Index tracks the stocks of about 1,000 companies in Europe, Australasia, and the Far East (EAFE). |
26
MARSICO INTERNATIONAL OPPORTUNITIES FUND
SCHEDULE OF INVESTMENTS
March 31, 2017 (Unaudited)
| | | Number
of
Shares | | | Value | | | Percent
of Net
Assets | |
COMMON STOCKS | | | | | | | | | |
Advertising | | | | | | | | | |
REA Group Ltd. | | | 25,833 | | | $ | 1,170,961 | | | | 2.13 | % |
| | | | | | | | | | | | | |
Airlines | | | | | | | | | | | | |
Ryanair Holdings PLC Spon. ADR* | | | 21,224 | | | | 1,761,167 | | | | 3.21 | |
| | | | | | | | | | | | | |
Apparel, Accessories & Luxury Goods | |
Adidas A.G. | | | 4,209 | | | | 800,596 | | | | 1.46 | |
| | | | | | | | | | | | | |
Application Software | | | | | | | | | | | | |
Constellation Software, Inc. | | | 2,429 | | | | 1,193,632 | | | | 2.17 | |
Dassault Systemes | | | 13,359 | | | | 1,156,357 | | | | 2.11 | |
| | | | | | | | 2,349,989 | | | | 4.28 | |
Asset Management & Custody Banks | |
Hargreaves Lansdown PLC | | | 98,370 | | | | 1,603,454 | | | | 2.92 | |
Julius Baer Group Ltd. | | | 33,229 | | | | 1,658,713 | | | | 3.02 | |
| | | | | | | | 3,262,167 | | | | 5.94 | |
Biotechnology | | | | | | | | | | | | |
Abcam PLC | | | 75,009 | | | | 775,795 | | | | 1.41 | |
Alkermes PLC* | | | 10,089 | | | | 590,207 | | | | 1.08 | |
| | | | | | | | 1,366,002 | | | | 2.49 | |
Data Processing & Outsourced Services | |
Paysafe Group PLC* | | | 190,238 | | | | 1,114,521 | | | | 2.03 | |
Wirecard A.G. | | | 51,760 | | | | 2,865,791 | | | | 5.22 | |
| | | | | | | | 3,980,312 | | | | 7.25 | |
Diversified Banks | | | | | | | | | | | | |
HDFC Bank Ltd. ADR | | | 22,144 | | | | 1,665,672 | | | | 3.03 | |
| | | | | | | | | | | | | |
Drug Retail | | | | | | | | | | | | |
Kusuri no Aoki Holdings Company Ltd. | | | 24,000 | | | | 1,070,331 | | | | 1.95 | |
| | | | | | | | | | | | | |
Electronic Equipment & Instruments | |
Coherent, Inc.* | | | 2,920 | | | | 600,469 | | | | 1.09 | |
| | | | | | | | | | | | | |
General Merchandise Stores | |
Dollarama, Inc. | | | 22,049 | | | | 1,827,289 | | | | 3.33 | |
| | | | | | | | | | | | | |
Health Care Equipment | | | | | | | | | | | | |
Sartorius A.G., Preference Shares | | | 12,986 | | | | 1,139,447 | | | | 2.07 | |
| | | | | | | | | | | | | |
Home Entertainment Software | |
Ubisoft Entertainment S.A.* | | | 20,487 | | | | 875,205 | | | | 1.59 | |
| | | | | | | | | | | | | |
Hotels, Resorts & Cruise Lines | |
Norwegian Cruise Line Holdings Ltd.* | | | 16,219 | | | | 822,790 | | | | 1.50 | |
| | | | | | | | | | | | | |
Household Products | | | | | | | | | | | | |
Reckitt Benckiser Group PLC | | | 17,911 | | | | 1,635,029 | | | | 2.98 | |
| | | | | | | | | | | | | |
Industrial Machinery | | | | | | | | | | | | |
FANUC Corporation | | | 8,600 | | | | 1,762,795 | | | | 3.21 | |
| | | | | | | | | | | | | |
COMMON STOCKS (continued) | |
Internet & Direct Marketing Retail | |
ASOS PLC* | | | 12,378 | | | $ | 937,483 | | | | 1.71 | % |
Ctrip.com International, Ltd. ADR* | | | 34,236 | | | | 1,682,700 | | | | 3.06 | |
MakeMyTrip Ltd.* | | | 27,814 | | | | 962,364 | | | | 1.75 | |
Start Today Company Ltd. | | | 37,200 | | | | 822,991 | | | | 1.50 | |
| | | | | | | | 4,405,538 | | | | 8.02 | |
Internet Software & Services | |
Alibaba Group Holding Ltd. Spon. ADR* | | | 16,206 | | | | 1,747,493 | | | | 3.18 | |
MercadoLibre, Inc. | | | 2,551 | | | | 539,460 | | | | 0.98 | |
Scout24 A.G.* | | | 40,642 | | | | 1,359,238 | | | | 2.48 | |
Tencent Holdings Ltd. | | | 100,600 | | | | 2,884,087 | | | | 5.25 | |
| | | | | | | | 6,530,278 | | | | 11.89 | |
IT Consulting & Other Services | |
InterXion Holding N.V.* | | | 68,959 | | | | 2,728,018 | | | | 4.97 | |
| | | | | | | | | | | | | |
Pharmaceuticals | | | | | | | | | | | | |
Bayer A.G. | | | 19,412 | | | | 2,237,577 | | | | 4.07 | |
Dechra Pharmaceuticals PLC | | | 58,790 | | | | 1,233,035 | | | | 2.25 | |
| | | | | | | | 3,470,612 | | | | 6.32 | |
Publishing | | | | | | | | | | | | |
Next Company Ltd. | | | 172,600 | | | | 1,170,511 | | | | 2.13 | |
| | | | | | | | | | | | | |
Restaurants | | | | | | | | | | | | |
Domino's Pizza Enterprises Ltd. | | | 53,325 | | | | 2,367,825 | | | | 4.31 | |
Domino's Pizza Group PLC | | | 389,710 | | | | 1,507,771 | | | | 2.74 | |
| | | | | | | | 3,875,596 | | | | 7.05 | |
Semiconductor Equipment | | | | | | | | | | | | |
ASML Holding N.V. | | | 22,069 | | | | 2,928,775 | | | | 5.33 | |
| | | | | | | | | | | | | |
Specialized Finance | | | | | | | | | | | | |
Element Fleet Management Corporation | | | 115,018 | | | | 1,064,685 | | | | 1.94 | |
| | | | | | | | | | | | | |
Trading Companies & Distributors | |
MISUMI Group, Inc. | | | 90,900 | | | | 1,642,781 | | | | 2.99 | |
| | | | | | | | | | | | | |
TOTAL COMMON STOCKS | | | | | | | | | | | | |
(Cost $44,591,704) | | | | | | | 53,907,015 | | | | 98.15 | |
| | | | | | | | | | | | | |
SHORT-TERM INVESTMENTS | |
State Street Institutional Treasury Money Market Fund, 0.000% | | | 888,728 | | | | 888,728 | | | | 1.62 | |
| | | | | | | | | | | | | |
TOTAL SHORT-TERM INVESTMENTS | | | | | | | | | |
(Cost $888,728) | | | | | | | 888,728 | | | | 1.62 | |
| | | | | | | | | | | | | |
TOTAL INVESTMENTS | | | | | | | | | | | | |
(Cost $45,480,432) | | | | | | | 54,795,743 | | | | 99.77 | |
| | | | | | | | | | | | | |
Cash and Other Assets, Less Liabilities | | | | | | | 125,208 | | | | 0.23 | |
| | | | | | | | | | | | | |
NET ASSETS | | | | | | $ | 54,920,951 | | | | 100.00 | % |
| See notes to financial statements. |
27
MARSICO INTERNATIONAL OPPORTUNITIES FUND
SCHEDULE OF INVESTMENTS (continued)
March 31, 2017 (Unaudited)
SUMMARY OF INVESTMENTS BY COUNTRY |
Country | Market Value | Percent of
Investment
Securities |
Argentina | $ 539,460 | 0.98% |
Australia | 3,538,786 | 6.46 |
Canada | 4,085,606 | 7.46 |
China/Hong Kong | 6,314,280 | 11.52 |
France | 2,031,562 | 3.71 |
Germany | 8,402,649 | 15.33 |
India | 2,628,036 | 4.80 |
Ireland | 2,351,374 | 4.29 |
Japan | 6,469,409 | 11.81 |
Netherlands | 5,656,793 | 10.32 |
Switzerland | 1,658,713 | 3.03 |
United Kingdom | 8,807,088 | 16.07 |
United States(1) | 2,311,987 | 4.22 |
| | $ 54,795,743 | 100.00% |
(1) | Includes short-term securities. |
| See notes to financial statements. |
28
INVESTMENT REVIEW BY MUNISH MALHOTRA AND JORDON LAYCOB (UNAUDITED)
The Marsico Flexible Capital Fund posted a total return of +2.69% for the six-month fiscal period ended March 31, 2017. The Fund underperformed the S&P 500 Index, the Fund’s benchmark index, which had a total return of +10.12% over the same time period. Please see the Fund’s Overview for more detailed information about the Fund’s longer-term performance for various time periods ended March 31, 2017.
The performance data for the Fund quoted here represent past performance, and past performance is not a guarantee of future results. Investment return and principal value of an investment will fluctuate so that an investor’s shares, when redeemed, may be worth more or less than their original cost. Current performance may be lower or higher than the performance information quoted. To obtain performance information current to the most recent month-end, please call 888-860-8686 or visit marsicofunds.com.(1)
This review highlights Fund performance over a six-month fiscal period. Shareholders should keep in mind that the Fund is intended for long-term investors who hold their shares for substantially longer periods of time. You should also keep in mind that our current views and beliefs regarding all investments discussed in this report are subject to change at any time. References to specific securities, industries, and sectors discussed in this report are not recommendations to buy or sell such securities or related investments, and the Fund may not necessarily hold these securities or investments today. Please see the accompanying Schedule of Investments for the percentage of the Fund’s portfolio represented by the securities mentioned in this report as of the end of the reporting period.
The Fund is subject to broad risks associated with investing in equity securities markets generally, including the risks that the securities and markets in which it invests may experience volatility and instability, that domestic and global economies and markets may undergo periods of cyclical change and decline, that investors may at times avoid investments in equity securities, and that investments may not perform as anticipated. Please see the Prospectus for more information.
The Fund is not managed to track the benchmark index, and may hold a substantially overweight or underweight position in a sector, industry, or security compared to its weight in the benchmark. For informational purposes, the discussion below may compare the benchmark weight or performance of a sector or industry to the investment approach of the Fund.
The Flexible Capital Fund’s underperformance during the six-month period ended March 31, 2017 versus the S&P 500 Index was largely attributable to certain holdings in the Financials, Consumer Discretionary, Industrials and Consumer Staples sectors.
Given the Fund’s flexible mandate and ability to invest across the capital structure of a company, the Fund invested a small percentage of its assets (approximately 4% on average over the period) in preferred shares of certain banks and other financial firms, including Wells Fargo & Company, JP Morgan Chase & Co., KeyCorp (sold during the period), The Charles Schwab Corporation, and Regions Financial Corporation. These investments provided stability and dividend yield to the Fund, but also modestly hampered the Fund’s relative performance in a rising market environment, as witnessed in the period.
Consumer Discretionary position Domino’s Pizza Group PLC, a United Kingdom-based master franchiser of pizza stores, which posted a return of -19%. The company experienced a slowdown in overall same store sales. The Fund maintains a position in the stock, as we believe these issues aren’t structural but rather are temporary cyclical matters. Automotive aftermarket parts retailer O’Reilly Automotive, Inc. (-4%) also posted a negative return during the period. This occurred as investors grew cautious over Amazon.com, Inc.’s entrance into the market and O’Reilly’s uncertain ability to outperform strong sales growth from the prior year. In addition, gasoline prices have risen substantially year-over-year, causing investor concern that fewer miles driven may lead to fewer car failures and subsequent repairs. The Fund continues to hold shares of O’Reilly because we believe it remains well-positioned for growth.
A holding in the Industrials sector, Nielsen Holdings PLC, dropped -22% during the period and was sold from the Flexible Capital Fund. It underperformed due to substantial missteps by management in addressing the changing landscape in its Consumer Packaged Goods (“CPG”) measurement business. CPG companies are spending more in their e-commerce channels, and Nielsen has failed to develop strong measurement tools to help those CPG companies move effectively in this new environment.
In the Consumer Staples sector, two beer holdings, Molson Coors Brewing Company – Cl. B and Constellation Brands, Inc. – Cl. A, declined -12% and -2%, respectively. Overall beer volumes were sluggish in the fourth quarter of 2016, due in part to unusually bad weather. Molson Coors’ business was not immune to this trend and the company’s results were choppy during the period. In addition, the company completed its acquisition of the remaining 50% of its MillerCoors LLC unit which became wholly-owned. The story for beer-maker Constellation Brands was slightly different. The company posted a negative return on investor sentiment following Donald Trump’s surprise election victory. The market believed that the company’s significant operations in Mexico could potentially be impacted by President Trump’s criticisms of the North American Free Trade
29
Agreement (NAFTA) and support for potential border taxes that might result in price increases for certain of Constellation’s products. However, it’s proven harder to agree on related policy changes than initially expected, and the Fund maintains a position in the stock, as well as in Molson Coors.
TreeHouse Foods, Inc. (-3%) was another holding in the Consumer Staples sector that had a negative impact on Fund performance. Integration issues with its newly acquired Private Brands business, and the announcement that a key executive left the company caused weakness in the name. These issues caused the market to question management’s ability to realize the synergy goals announced at the time of the merger, and led to earnings revisions and a stock price decline. The Fund continues to hold shares of Treehouse because we believe the merger ultimately will have a positive impact on the company.
From a sector allocation perspective, the Fund’s performance was slightly impaired by having an overweight posture to the Real Estate and Consumer Staples sectors – two of the weaker-performing sectors of the S&P 500 Index.
On the brighter side, one of the Fund’s holdings in the Financials sector contributed positively to the Fund’s performance for the six-month period ended March 31, 2017. CME Group, Inc. posted a return of +18%. Among other reasons for its solid performance, first, CME maintains a large interest rate futures trading platform, and as expectations of Federal Reserve rate hikes grew, so did CME volumes. Second, CME continues to benefit from growth outside of the US as more international derivatives participants start to trade CME futures and options. This helped drive strong quarterly results over the period.
Another strong-performing individual Fund holding was defense and aerospace company BAE Systems PLC (+20%). BAE has benefitted from the potential for increased defense spending in the US and United Kingdom post the Trump election. In addition, the company’s stock rose on the news of new, larger orders for F-35 aircraft.
The Fund maintained no exposure to the Energy sector during the period, thereby benefitting relative to the S&P 500 Index in which Energy is a 7% average weight. The sector return was flat for the period, and significantly trailed the Index return of 10%. We continue to see little to no growth for companies in the Energy sector, as technology developments increase the supply of oil and other potentially cleaner sources of energy for cars and homes. The Fund also was rewarded for an underweight stance in the Health Care sector, where returns have been dampened due to the increased politicization of drug pricing, as well as uncertainty surrounding the future of the Affordable Care Act (“ACA”).
The Fund has a flexible mandate, and its allocations to equities, fixed income, preferred securities and cash may change over time. The Fund’s cash position was slightly elevated (5%), particularly during the later portions of the reporting period, as we considered various investment opportunities in light of market conditions. In a generally rising equity market, the Fund’s cash position was a modest drag on performance when measured over the full six-month period.
During the period, the Fund maintained relative consistency in its holdings of fixed-income and preferred stock securities. The Fund increased its holdings in the Health Care and Information Technology sectors, and trimmed its allocations to the Consumer Discretionary, Financials, Consumer Staples and Real Estate(2) sectors.
Fiscal Period-End Investment Posture
As of period-end, the Fund’s primary economic sector allocations included Consumer Discretionary, Information Technology, Industrials, Consumer Staples, and Health Care. At period-end, the Fund had no exposure to the Energy and Utilities sectors.
Sincerely,
MUNISH MALHOTRA, CFA
JORDON S. LAYCOB
PORTFOLIO MANAGERS
(1) | Total returns are based on net change in net asset value assuming reinvestment of distributions. Periodically, certain fees and expenses have been waived or reimbursed by the Adviser for the Flexible Capital Fund. In the absence of such a waiver or reimbursement, the performance returns reflected would have been reduced. In accordance with the expense limitation and fee waiver agreement, the Adviser may recoup fees and expenses previously waived or reimbursed under certain parameters. Please see the Prospectus for more information. |
(2) | Through September 30, 2016, the Funds reported certain real estate investment trusts as having been classified within the Financials sector. These investments are now reported in the new GICS Real Estate sector. References to investment sector exposure included throughout this semi-annual report reflect the impact of this change. |
30
| FLEXIBLE CAPITAL FUND OVERVIEW |
March 31, 2017 (Unaudited)
The Flexible Capital Fund is a diversified portfolio and invests primarily in equity securities and other investments that are selected primarily for their long-term growth potential. The Fund may invest in issuers of any size throughout the world, and will normally hold a core position of between 20 and 50 securities or other investments.
TOTAL ANNUAL OPERATING EXPENSES* 1.37% | NET ASSETS $261,626,845 | NET ASSET VALUE PER SHARE $14.56 |
GROWTH OF $10,000(1)(2) | PERFORMANCE COMPARISON |
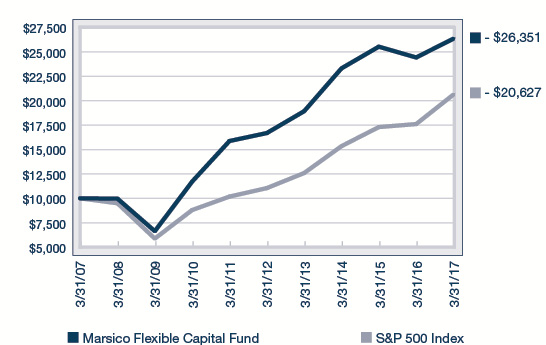
| 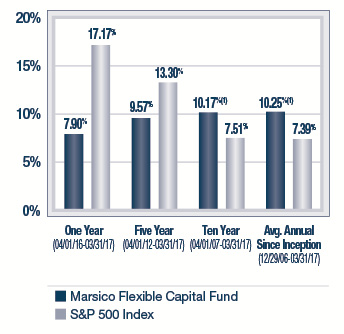
|
SECTOR ALLOCATION(3) | TOP FIVE HOLDINGS |
 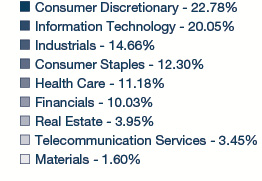
| | | | |
| | Constellation Brands, Inc. - Cl. A | 6.32% | |
| | Lockheed Martin Corporation | 4.63% | |
| | Visa, Inc. - Cl. A | 4.30% | |
| | Cisco Systems, Inc. | 4.22% | |
| | The Home Depot, Inc. | 3.99% | |
| | | | |
* | The Total Annual Operating Expenses are reflective of the information disclosed in the Funds’ Prospectus dated January 30, 2017 and may differ from the expense ratio disclosed in this report. |
| The performance data quoted here represent past performance, and past performance is not a guarantee of future results. Investment return and principal value of an investment will fluctuate so that an investor’s shares, when redeemed, may be worth more or less than their original cost. Current performance may be lower or higher than the performance information quoted. To obtain performance information current to the most recent month-end, please call 888-860-8686 or visit marsicofunds.com. |
| The performance included in the chart and graph does not reflect the deduction of taxes on Fund distributions or the redemption of Fund shares. |
| All indices are unmanaged and investors cannot invest directly in an index. |
(1) | Periodically, certain fees and expenses have been waived or reimbursed by the Adviser for the Flexible Capital Fund. In the absence of such a waiver or reimbursement, the performance returns reflected would have been reduced. In accordance with the expense limitation and fee waiver agreement, the Adviser may recoup fees and expenses previously waived or reimbursed under certain parameters. |
(2) | This chart assumes an initial investment of $10,000 made on March 31, 2007. Total returns are based on change in NAV, assuming reinvestment of distributions. |
(3) | Sector weightings represent the percentage of the Fund’s investments (excluding cash equivalents) in certain general sectors. These sectors may include more than one industry. The Fund’s portfolio composition is subject to change at any time. |
31
MARSICO FLEXIBLE CAPITAL FUND
SCHEDULE OF INVESTMENTS
March 31, 2017 (Unaudited)
| | | Number
of
Shares | | | Value | | | Percent
of Net
Assets | |
COMMON STOCKS | | | | | | | | | |
Aerospace & Defense | | | | | | | | | |
BAE Systems PLC | | | 865,391 | | | $ | 6,966,298 | | | | 2.66 | % |
Lockheed Martin Corporation | | | 45,288 | | | | 12,119,069 | | | | 4.63 | |
| | | | | | | | 19,085,367 | | | | 7.29 | |
Airport Services | | | | | | | | | | | | |
Macquarie Infrastructure Corporation | | | 88,696 | | | | 7,147,124 | | | | 2.73 | |
| | | | | | | | | | | | | |
Automotive Retail | | | | | | | | | | | | |
O'Reilly Automotive, Inc.* | | | 20,725 | | | | 5,592,434 | | | | 2.14 | |
| | | | | | | | | | | | | |
Biotechnology | | | | | | | | | | | | |
Amgen, Inc. | | | 48,299 | | | | 7,924,417 | | | | 3.03 | |
| | | | | | | | | | | | | |
Brewers | | | | | | | | | | | | |
Molson Coors Brewing Company - Cl. B | | | 70,981 | | | | 6,793,591 | | | | 2.60 | �� |
| | | | | | | | | | | | | |
Casinos & Gaming | | | | | | | | | | | | |
Red Rock Resorts, Inc. - Cl. A | | | 194,103 | | | | 4,305,205 | | | | 1.64 | |
| | | | | | | | | | | | | |
Communications Equipment | |
Cisco Systems, Inc. | | | 326,794 | | | | 11,045,637 | | | | 4.22 | |
| | | | | | | | | | | | | |
Data Processing & Outsourced Services | |
Visa, Inc. - Cl. A | | | 126,675 | | | | 11,257,607 | | | | 4.30 | |
| | | | | | | | | | | | | |
Distillers & Vintners | | | | | | | | | | | | |
Constellation Brands, Inc. - Cl. A | | | 101,954 | | | | 16,523,685 | | | | 6.32 | |
| | | | | | | | | | | | | |
Environmental & Facilities Services | |
Waste Management, Inc. | | | 92,089 | | | | 6,715,130 | | | | 2.57 | |
| | | | | | | | | | | | | |
Financial Exchanges & Data | | | | | | | | | |
CME Group, Inc. | | | 54,812 | | | | 6,511,666 | | | | 2.49 | |
| | | | | | | | | | | | | |
Health Care Equipment | | | | | | | | | | | | |
Zimmer Biomet Holdings, Inc. | | | 21,767 | | | | 2,657,968 | | | | 1.02 | |
| | | | | | | | | | | | | |
Home Improvement Retail | | | | | | | | | | | | |
The Home Depot, Inc. | | | 71,076 | | | | 10,436,089 | | | | 3.99 | |
| | | | | | | | | | | | | |
Integrated Telecommunication Services | |
AT&T, Inc. | | | 110,845 | | | | 4,605,610 | | | | 1.76 | |
| | | | | | | | | | | | | |
Internet Software & Services | |
Alphabet, Inc. - Cl. A* | | | 10,285 | | | | 8,719,623 | | | | 3.33 | |
Facebook, Inc. - Cl. A* | | | 65,725 | | | | 9,336,236 | | | | 3.57 | |
| | | | | | | | 18,055,859 | | | | 6.90 | |
Leisure Facilities | | | | | | | | | | | | |
ClubCorp Holdings, Inc. | | | 331,960 | | | | 5,327,958 | | | | 2.04 | |
Six Flags Entertainment Corporation | | | 102,639 | | | | 6,105,994 | | | | 2.33 | |
| | | | | | | | 11,433,952 | | | | 4.37 | |
| | | Number
of Shares/
Par Value | | | Value | | | Percent
of Net
Assets | |
COMMON STOCKS (continued) | |
Managed Health Care | | | | | | | | | |
Anthem, Inc. | | | 31,893 | | | $ | 5,274,464 | | | | 2.02 | % |
| | | | | | | | | | | | | |
Mortgage REITs | | | | | | | | | | | | |
Starwood Property Trust, Inc. | | | 375,761 | | | | 8,484,683 | | | | 3.24 | |
| | | | | | | | | | | | | |
Packaged Foods & Meats | | | | | | | | | | | | |
Mondelez International, Inc. - Cl. A | | | 30,438 | | | | 1,311,269 | | | | 0.50 | |
TreeHouse Foods, Inc.* | | | 71,857 | | | | 6,083,414 | | | | 2.33 | |
| | | | | | | | 7,394,683 | | | | 2.83 | |
Pharmaceuticals | | | | | | | | | | | | |
Johnson & Johnson | | | 68,803 | | | | 8,569,414 | | | | 3.27 | |
| | | | | | | | | | | | | |
Restaurants | | | | | | | | | | | | |
Domino's Pizza Group PLC | | | 2,062,495 | | | | 7,979,704 | | | | 3.05 | |
| | | | | | | | | | | | | |
Specialized REITs | | | | | | | | | | | | |
Crown Castle International Corp. | | | 104,308 | | | | 9,851,891 | | | | 3.76 | |
| | | | | | | | | | | | | |
Technology Hardware, Storage & Peripherals | |
Apple, Inc. | | | 67,488 | | | | 9,695,326 | | | | 3.71 | |
| | | | | | | | | | | | | |
TOTAL COMMON STOCKS | | | | | | | | | | | | |
(Cost $157,890,000) | | | | | | | 207,341,506 | | | | 79.25 | |
| | | | | | | | | | | | | |
CONVERTIBLE PREFERRED STOCKS | |
Pharmaceuticals | | | | | | | | | | | | |
Allergan PLC, Series A, 5.500% | | | 4,091 | | | | 3,476,450 | | | | 1.33 | |
| | | | | | | | | | | | | |
TOTAL CONVERTIBLE PREFERRED STOCKS | |
(Cost $3,343,424) | | | | | | | 3,476,450 | | | | 1.33 | |
| | | | | | | | | | | | | |
CORPORATE BONDS | | | | | | | | | | | | |
Casinos & Gaming | | | | | | | | | | | | |
MGM Resorts International, 6.625%, 12/15/21 | | $ | 4,000,000 | | | | 4,425,000 | | | | 1.69 | |
| | | | | | | | | | | | | |
General Merchandise Stores | |
Dollar Tree, Inc., 5.750%, 3/1/23 | | | 5,000,000 | | | | 5,325,000 | | | | 2.04 | |
| | | | | | | | | | | | | |
Leisure Facilities | | | | | | | | | | | | |
ClubCorp Club Operations, Inc. 144A, 8.250%, 12/15/23† | | | 3,000,000 | | | | 3,262,500 | | | | 1.25 | |
| | | | | | | | | | | | | |
Metal & Glass Containers | | | | | | | | | | | | |
Ball Corp., 4.000%, 11/15/23 | | | 4,000,000 | | | | 4,005,000 | | | | 1.53 | |
† | These securities have been determined to be liquid under guidelines established by the Board of Trustees. At March 31, 2017, the total value of the Fund’s 144A securities was 3.04% of net assets. |
| See notes to financial statements. |
32
| | | Par Value/ Number
of Shares | | | Value | | | Percent
of Net
Assets | |
CORPORATE BONDS (continued) | |
Movies & Entertainment | | | | | | | | | |
Lions Gate Entertainment Corporation 144A, 5.875%, 11/1/24† | | $ | 1,000,000 | | | $ | 1,037,500 | | | | 0.39 | % |
| | | | | | | | | | | | | |
Research & Consulting Services | |
IHS Markit Ltd. 144A, 5.000%, 11/1/22† | | | 3,500,000 | | | | 3,666,250 | | | | 1.40 | |
| | | | | | | | | | | | | |
Restaurants | | | | | | | | | | | | |
Yum! Brands, Inc., 6.875%, 11/15/37 | | | 3,000,000 | | | | 3,090,000 | | | | 1.18 | |
| | | | | | | | | | | | | |
Wireless Telecommunication Services | |
T-Mobile USA, Inc., 6.464%, 4/28/19 | | | 4,000,000 | | | | 4,010,000 | | | | 1.54 | |
| | | | | | | | | | | | | |
TOTAL CORPORATE BONDS | |
(Cost $27,361,739) | | | | | | | 28,821,250 | | | | 11.02 | |
| | | | | | | | | | | | | |
PREFERRED STOCKS | | | | | | | | | | | | |
Diversified Banks | | | | | | | | | | | | |
JPMorgan Chase & Co., Series BB, 6.150% | | | 100,076 | | | | 2,665,024 | | | | 1.02 | |
Wells Fargo & Company, Series N, 5.200% | | | 107,069 | | | | 2,623,190 | | | | 1.00 | |
| | | | | | | | 5,288,214 | | | | 2.02 | |
Investment Banking & Brokerage | |
The Charles Schwab Corporation, Series C, 6.000% | | | 100,212 | | | | 2,673,656 | | | | 1.02 | |
| | | | | | | | | | | | | |
Regional Banks | | | | | | | | | | | | |
Regions Financial Corporation, Series A, 6.375% | | | 79,783 | | | | 2,071,167 | | | | 0.79 | |
| | | | | | | | | | | | | |
TOTAL PREFERRED STOCKS | |
(Cost $9,581,592) | | | | | | | 10,033,037 | | | | 3.83 | |
| | | Number
of
Shares | | | Value | | | Percent
of Net
Assets | |
SHORT-TERM INVESTMENTS | |
State Street Institutional Treasury Money Market Fund, 0.000% | | | 10,300,633 | | | $ | 10,300,633 | | | | 3.94 | % |
| | | | | | | | | | | | | |
TOTAL SHORT-TERM INVESTMENTS | |
(Cost $10,300,633) | | | | | | | 10,300,633 | | | | 3.94 | |
| | | | | | | | | | | | | |
TOTAL INVESTMENTS | | | | | | | | | | | | |
(Cost $208,477,388) | | | | | | | 259,972,876 | | | | 99.37 | |
| | | | | | | | | | | | | |
Cash and Other Assets, Less Liabilities | | | | | | | 1,653,969 | | | | 0.63 | |
| | | | | | | | | | | | | |
NET ASSETS | | | | | | $ | 261,626,845 | | | | 100.00 | % |
| See notes to financial statements. |
33
INVESTMENT REVIEW BY TOM MARSICO (UNAUDITED)
The Marsico Global Fund posted a total return of (US$) +3.74% for the six-month fiscal period ended March 31, 2017. The Fund underperformed the MSCI All Country World Index (“MSCI ACWI Index”), the Fund’s benchmark index, which had a total return of (US$) +8.18% over the same time period. The MSCI ACWI Index measures equity market performance in the global developed and emerging markets. Please see the Fund’s Overview for more detailed information about the Fund’s longer-term performance for various time periods ended March 31, 2017.
The performance data for the Fund quoted here represent past performance, and past performance is not a guarantee of future results. Investment return and principal value of an investment will fluctuate so that an investor’s shares, when redeemed, may be worth more or less than their original cost. Current performance may be lower or higher than the performance information quoted. To obtain performance information current to the most recent month-end, please call 888-860-8686 or visit marsicofunds.com.(1)
This review highlights Fund performance over a six-month fiscal period. Shareholders should keep in mind that the Fund is intended for long-term investors who hold their shares for substantially longer periods of time. You should also keep in mind that our current views and beliefs regarding all investments discussed in this report are subject to change at any time. References to specific securities, industries, and sectors discussed in this report are not recommendations to buy or sell such securities or related investments, and the Fund may not necessarily hold these securities or investments today. Please see the accompanying Schedule of Investments for the percentage of the Fund’s portfolio represented by the securities mentioned in this report as of the end of the reporting period.
Foreign investments present additional risks due to currency fluctuations, economic and political factors, lower liquidity, differences in securities regulations and accounting standards, possible changes in taxation, limited public information, and other factors. In addition, the Fund is subject to broad risks associated with investing in equity securities markets generally, including the risks that the securities and markets in which it invests may experience volatility and instability, that domestic and global economies and markets may undergo periods of cyclical change and decline, that investors may at times avoid investments in equity securities, and that investments may not perform as anticipated. Please see the Prospectus for more information.
The Fund is not managed to track the benchmark index, and may hold a substantially overweight or underweight position in a sector, industry, or security compared to its weight in the benchmark. For informational purposes, the discussion below may compare the benchmark weight or performance of a sector or industry to the investment approach of the Fund.
The Global Fund’s underperformance during the six-month period ended March 31, 2017 versus the MSCI ACWI Index was primarily attributable to certain holdings in the Consumer Discretionary, Information Technology, and Industrials sectors.
Several of the Fund’s positions in the Consumer Services industry were detractors from performance. Australia-based Domino’s Pizza Enterprises Ltd.’s share price was challenged (-17%) largely due to a rotation (in Australia and globally) out of higher-growth names and into economically-sensitive cyclicals that had been laggards for years. Domino’s commands a premium valuation and, after reporting strong half-year results in the fall of 2016, the shares faded through the remainder of the period due to the slowdown in positive news and the heavy rotation into cyclicals. Domino’s Pizza Group PLC (-19%), a United Kingdom-based master franchiser of pizza stores, experienced a slowdown in overall same store sales. The Fund maintains a position in both stocks, as we believe these issues aren’t structural but rather are temporary cyclical matters.
The Fund’s holdings in the Information Technology sector, in aggregate, lagged the return of the MSCI ACWI Index and hampered returns.
A select Consumer Staples holding detracted from performance. Anheuser-Busch InBev S.A. (“ABI”) posted a return of -15%. ABI performed poorly in the period as fourth quarter results were challenged by a weak Brazilian economy, a strong dollar, and market share losses in developed markets. We expect earnings to reaccelerate in 2017 as the company laps an unfavorable currency environment and begins to realize synergies from its newly acquired international beer company, SABMiller. SABMiller gives ABI more international exposure, further diversifying the company away from the North American market, where beer volumes have struggled to recover.
A holding in the Industrials sector, Nielsen Holdings PLC, dropped -21% during the period and was sold from the Fund. It underperformed due to substantial missteps by management in addressing the changing landscape in its Consumer Packaged Goods (“CPG”) measurement business. CPG companies are spending more in their e-commerce channels, and Nielsen has failed to develop strong measurement tools to help those CPG companies move effectively in this new environment.
34
The Fund’s performance also was held back by having an underweight allocation to the strongest-performing sector of the MSCI ACWI Index, Financials.
On the brighter side, a portion of this negative impact was offset by the Fund’s overweight allocation to the strong-performing Information Technology sector and its underweight stance in the weak-performing Consumer Staples sector. The Fund also benefitted from having no exposure to the Energy, Real Estate, and Telecommunication Services sectors.
On a stock-specific level, a holding in the Health Care sector, UnitedHealth Group, Inc. (+18%), had a significant, positive impact on Fund performance. UnitedHealth’s performance was driven by its return to operational growth. The company’s decision to exit the Affordable Care Act (“ACA”) exchanges resulted in a normalization of growth as the company capped its exchange insurance losses in 2016. In addition, UnitedHealth’s insurance division continued to outperform the industry in the commercial, Medicare, and Medicaid markets. Finally, the company continued to experience robust growth in its OptumHealth business as UnitedHealth expanded its ambulatory healthcare services offerings in the US.
Global footwear and sports apparel retailer Adidas A.G. posted strong returns (+29%) on momentum from its current lineup of products. In addition, the company is actively looking to divest its non-core skiing and golf businesses, as part of a seemingly successful turnaround effort by its new CEO.
In the Information Technology sector, semiconductor company Infineon Technologies AG posted a strong +19% return. Infineon is a leading supplier of semiconductors for automotive applications and has greatly benefitted from increased chip content in new cars, driven by the shift toward hybrid/electric vehicles and assisted driving technologies (i.e. lane change assist, parking assist). This gave management the confidence to increase fiscal 2017 revenue and margin guidance, driving outperformance of the shares.
Although active currency management is not a central facet of the Fund’s investment process, fluctuations in major world currencies can at times affect the Fund’s performance. During the period, the net effect of currency moves was strongly positive for the Fund. In particular, the Fund’s results were positively affected by having an overweight allocation, as compared to the MSCI ACWI Index, to investments denominated in US dollar-based currencies, which strengthened during the period.
During the period, the Fund increased its allocations to the Information Technology, Health Care, Financials, and Consumer Staples sectors. The Fund reduced its positions in the Consumer Discretionary, Industrials, and Materials sectors.
Fiscal Period-End Investment Posture
As of March 31, 2017, the Fund’s primary economic sector allocations were Information Technology, Consumer Discretionary, and Health Care. The Fund had no investments in the Real Estate,(2) Energy, Telecommunication Services, or Utilities sectors. The Fund’s most significant country allocations were the United States, Germany, China/Hong Kong, and France. Country-level weightings generally should be considered a residual of the Fund’s stock selection process rather than a major, proactive facet of its investment strategy.
Sincerely,
THOMAS F. MARSICO
PORTFOLIO MANAGER
(1) | Total returns are based on net change in net asset value assuming reinvestment of distributions. Periodically, certain fees and expenses have been waived or reimbursed by the Adviser for the Global Fund. In the absence of such a waiver or reimbursement, the performance returns reflected would have been reduced. In accordance with the expense limitation and fee waiver agreement, the Adviser may recoup fees and expenses previously waived or reimbursed under certain parameters. Periodically, the Adviser has recouped such fees or expenses from the Global Fund, resulting in a lower performance return. Please see the Prospectus for more information. |
(2) | Through September 30, 2016, the Funds reported certain real estate investment trusts as having been classified within the Financials sector. These investments are now reported in the new GICS Real Estate sector. References to investment sector exposure included throughout this semi-annual report reflect the impact of this change. |
35
March 31, 2017 (Unaudited)
The Global Fund is a diversified portfolio and invests primarily in the common stocks of US and foreign companies that are selected for their long-term growth potential. The Fund may invest in an unlimited number of companies of any size that are economically tied to any countries or markets throughout the world, including securities of companies economically tied to emerging markets. Under normal market conditions, the Fund will invest significantly (generally, at least 40% of its net assets) in the securities of issuers organized or located outside the US or doing business outside the US or other foreign securities (unless market conditions are not deemed favorable by the Adviser, in which case the Fund generally will invest at least 30% of its assets in such foreign securities). The Fund will invest its assets in various regions and countries, including the US, that encompass not less than three different countries overall.
TOTAL ANNUAL OPERATING EXPENSES* 1.69% NET EXPENSES*†† 1.60% | NET ASSETS $35,312,579 | NET ASSET VALUE PER SHARE $12.48 |
GROWTH OF $10,000(1)(2) | PERFORMANCE COMPARISON |
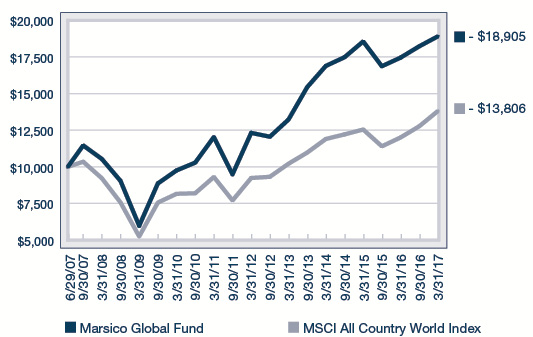
| 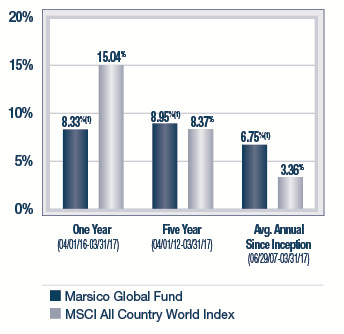
|
SECTOR ALLOCATION(3) | TOP FIVE HOLDINGS |
 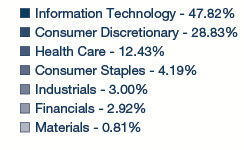
| | | | |
| | Facebook, Inc. - Cl. A | 6.13% | |
| | Alibaba Group Holding Ltd. Spon. ADR | 5.56% | |
| | Tencent Holdings Ltd. | 4.91% | |
| | Amazon.com, Inc. | 4.74% | |
| | Hermes International | 4.55% | |
| | | | |
* | The Total Annual Operating Expenses and Net Expenses are reflective of the information disclosed in the Funds’ Prospectus dated January 30, 2017 and may differ from the expense ratios disclosed in this report. |
† | Marsico Capital Management, LLC (the “Adviser”) has entered into a written expense limitation and fee waiver agreement under which it has agreed to limit the total expenses of the Global Fund (excluding interest, taxes, acquired fund fees and expenses, litigation, brokerage and extraordinary expenses) to an annual rate of 1.60% of the Fund’s average net assets until January 31, 2018. This expense limitation and fee waiver agreement may be terminated by the Adviser at any time after January 31, 2018, upon 15 days prior notice to the Fund and its administrator. The Adviser may recoup from the Fund fees previously waived or expenses previously reimbursed by the Adviser with respect to the Fund pursuant to this agreement (or a previous expense limitation agreement) if: (1) such recoupment by the Adviser does not cause the Fund, at the time of recoupment, to exceed the lesser of (a) the expense limitation in effect at the time the relevant amount was waived and/or reimbursed, or (b) the expense limitation in effect at the time of the proposed recoupment, and (2) the recoupment is made within three fiscal years after the end of the fiscal year in which the amount was waived or reimbursed. |
| The performance data quoted here represent past performance, and past performance is not a guarantee of future results. Investment return and principal value of an investment will fluctuate so that an investor’s shares, when redeemed, may be worth more or less than their original cost. Current performance may be lower or higher than the performance information quoted. To obtain performance information current to the most recent month-end, please call 888-860-8686 or visit marsicofunds.com. |
| The performance included in the chart and graph does not reflect the deduction of taxes on Fund distributions or the redemption of Fund shares. |
| All indices are unmanaged and investors cannot invest directly in an index. |
(1) | Periodically, certain fees and expenses have been waived or reimbursed by the Adviser for the Global Fund. In the absence of such a waiver or reimbursement, the performance returns reflected would have been reduced. In accordance with the expense limitation and fee waiver agreement, the Adviser may recoup fees and expenses previously waived or reimbursed under certain parameters. Periodically, the Adviser has recouped such fees or expenses from the Global Fund, resulting in a lower performance return. |
(2) | This chart assumes an initial investment of $10,000 made on June 29, 2007 (inception). Total returns are based on change in NAV, assuming reinvestment of distributions. |
(3) | Sector weightings represent the percentage of the Fund’s investments (excluding cash equivalents) in certain general sectors. These sectors may include more than one industry. The Fund’s portfolio composition is subject to change at any time. |
| The MSCI ACWI (All Country World Index) Index is a free float-adjusted market capitalization index that is designed to measure equity market performance in the global developed and emerging markets. |
36
MARSICO GLOBAL FUND
SCHEDULE OF INVESTMENTS
March 31, 2017 (Unaudited)
| | | Number
of
Shares | | | Value | | | Percent
of Net
Assets | |
COMMON STOCKS | | | | | | | | | |
Airlines | | | | | | | | | |
Ryanair Holdings PLC Spon. ADR* | | | 12,677 | | | $ | 1,051,937 | | | | 2.98 | % |
| | | | | | | | | | | | | |
Apparel, Accessories & Luxury Goods | |
Adidas A.G. | | | 8,166 | | | | 1,553,258 | | | | 4.40 | |
Hermes International | | | 3,395 | | | | 1,608,435 | | | | 4.55 | |
| | | | | | | | 3,161,693 | | | | 8.95 | |
Application Software | | | | | | | | | | | | |
salesforce.com, inc.* | | | 12,493 | | | | 1,030,547 | | | | 2.92 | |
SAP S.E. | | | 12,916 | | | | 1,267,373 | | | | 3.59 | |
| | | | | | | | 2,297,920 | | | | 6.51 | |
Biotechnology | | | | | | | | | | | | |
Amgen, Inc. | | | 6,495 | | | | 1,065,634 | | | | 3.02 | |
Celgene Corporation* | | | 7,053 | | | | 877,605 | | | | 2.48 | |
| | | | | | | | 1,943,239 | | | | 5.50 | |
Brewers | | | | | | | | | | | | |
Anheuser-Busch InBev S.A. | | | 9,869 | | | | 1,083,357 | | | | 3.07 | |
| | | | | | | | | | | | | |
Data Processing & Outsourced Services | |
Visa, Inc. - Cl. A | | | 13,913 | | | | 1,236,448 | | | | 3.50 | |
Wirecard A.G. | | | 8,827 | | | | 488,724 | | | | 1.38 | |
| | | | | | | | 1,725,172 | | | | 4.88 | |
Distillers & Vintners | | | | | | | | | | | | |
Constellation Brands, Inc. - Cl. A | | | 2,364 | | | | 383,134 | | | | 1.08 | |
| | | | | | | | | | | | | |
Fertilizers & Agricultural Chemicals | |
Monsanto Company | | | 2,514 | | | | 284,585 | | | | 0.81 | |
| | | | | | | | | | | | | |
General Merchandise Stores | |
Dollarama, Inc. | | | 13,321 | | | | 1,103,965 | | | | 3.13 | |
| | | | | | | | | | | | | |
Health Care Equipment | | | | | | | | | | | | |
Intuitive Surgical, Inc.* | | | 1,183 | | | | 906,734 | | | | 2.57 | |
| | | | | | | | | | | | | |
Health Care Facilities | | | | | | | | | | | | |
HCA Holdings, Inc.* | | | 5,113 | | | | 455,006 | | | | 1.29 | |
| | | | | | | | | | | | | |
Home Entertainment Software | |
Activision Blizzard, Inc. | | | 22,030 | | | | 1,098,416 | | | | 3.11 | |
Ubisoft Entertainment S.A.* | | | 13,285 | | | | 567,535 | | | | 1.61 | |
| | | | | | | | 1,665,951 | | | | 4.72 | |
Home Improvement Retail | | | | | | | | | | | | |
The Home Depot, Inc. | | | 7,086 | | | | 1,040,437 | | | | 2.95 | |
| | | | | | | | | | | | | |
Internet & Direct Marketing Retail | |
Amazon.com, Inc.* | | | 1,887 | | | | 1,672,901 | | | | 4.74 | |
NetFlix, Inc.* | | | 3,872 | | | | 572,320 | | | | 1.62 | |
| | | | | | | | 2,245,221 | | | | 6.36 | |
Internet Software & Services | |
Alibaba Group Holding Ltd. Spon. ADR* | | | 18,200 | | | | 1,962,506 | | | | 5.56 | |
Alphabet, Inc. - Cl. A* | | | 1,244 | | | | 1,054,663 | | | | 2.99 | |
Facebook, Inc. - Cl. A* | | | 15,246 | | | | 2,165,694 | | | | 6.13 | |
Tencent Holdings Ltd. | | | 60,500 | | | | 1,734,466 | | | | 4.91 | |
| | | | | | | | 6,917,329 | | | | 19.59 | |
COMMON STOCKS (continued) | |
IT Consulting & Other Services | |
Accenture PLC - Cl. A | | | 5,670 | | | $ | 679,720 | | | | 1.92 | % |
| | | | | | | | | | | | | |
Managed Health Care | | | | | | | | | | | | |
UnitedHealth Group, Inc. | | | 6,391 | | | | 1,048,188 | | | | 2.97 | |
| | | | | | | | | | | | | |
Regional Banks | | | | | | | | | | | | |
First Republic Bank | | | 10,924 | | | | 1,024,780 | | | | 2.90 | |
| | | | | | | | | | | | | |
Restaurants | | | | | | | | | | | | |
Domino's Pizza Enterprises Ltd. | | | 34,018 | | | | 1,510,524 | | | | 4.28 | |
Domino's Pizza Group PLC | | | 268,147 | | | | 1,037,449 | | | | 2.94 | |
| | | | | | | | 2,547,973 | | | | 7.22 | |
Semiconductor Equipment | | | | | | | | | | | | |
ASML Holding N.V. | | | 9,257 | | | | 1,228,496 | | | | 3.48 | |
| | | | | | | | | | | | | |
Semiconductors | | | | | | | | | | | | |
Infineon Technologies AG | | | 64,420 | | | | 1,315,706 | | | | 3.72 | |
NVIDIA Corporation | | | 8,459 | | | | 921,439 | | | | 2.61 | |
| | | | | | | | 2,237,145 | | | | 6.33 | |
TOTAL COMMON STOCKS | | | | | | | | | | | | |
(Cost $26,974,154) | | | | | | | 35,031,982 | | | | 99.21 | |
| | | | | | | | | | | | | |
SHORT-TERM INVESTMENTS | |
State Street Institutional Treasury Money Market Fund, 0.000% | | | 464,024 | | | | 464,024 | | | | 1.31 | |
| | | | | | | | | | | | | |
TOTAL SHORT-TERM INVESTMENTS | |
(Cost $464,024) | | | | | | | 464,024 | | | | 1.31 | |
| | | | | | | | | | | | | |
TOTAL INVESTMENTS | | | | | | | | | | | | |
(Cost $27,438,178) | | | | | | | 35,496,006 | | | | 100.52 | |
| | | | | | | | | | | | | |
Liabilities, Less Cash and Other Assets | | | | | | | (183,427 | ) | | | (0.52 | ) |
| | | | | | | | | | | | | |
NET ASSETS | | | | | | $ | 35,312,579 | | | | 100.00 | % |
SUMMARY OF INVESTMENTS BY COUNTRY |
Country | Market Value | Percent of
Investment
Securities |
Australia | $ 1,510,524 | 4.26% |
Belgium | 1,083,357 | 3.05 |
Canada | 1,103,965 | 3.11 |
China/Hong Kong | 3,696,972 | 10.42 |
France | 2,175,970 | 6.13 |
Germany | 4,625,061 | 13.03 |
Ireland | 1,051,937 | 2.96 |
Netherlands | 1,228,496 | 3.46 |
United Kingdom | 1,037,449 | 2.92 |
United States(1) | 17,982,275 | 50.66 |
| | $ 35,496,006 | 100.00% |
(1) | Includes short-term securities. |
| See notes to financial statements. |
37
STATEMENTS OF ASSETS AND LIABILITIES
March 31, 2017 (Unaudited)
(Amounts in thousands) | | MARSICO
FOCUS FUND | | | MARSICO
GROWTH FUND | |
| | | | | | | |
ASSETS | | | | | | |
Investments, at value (cost $400,234, $200,919, $167,106, $45,480, $208,477, and $27,438, respectively) | | $ | 521,947 | | | $ | 259,190 | |
Receivable for investments sold | | | 11,069 | | | | — | |
Receivable for capital stock sold | | | 886 | | | | 3 | |
Interest and dividends receivable | | | 439 | | | | 66 | |
Prepaid expenses and other assets | | | 2,519 | | | | 997 | |
Total Assets | | | 536,860 | | | | 260,256 | |
| | | | | | | | | |
LIABILITIES | | | | | | | | |
Payable for investments purchased | | | — | | | | — | |
Payable for capital stock redeemed | | | 2,820 | | | | 176 | |
Due to custodian | | | 4,745 | | | | — | |
Payable to investment adviser | | | 349 | | | | 176 | |
Accrued trustees' fees | | | 2,525 | | | | 990 | |
Accrued distribution fee | | | 3,989 | | | | 1,750 | |
Accrued professional fees | | | 108 | | | | 51 | |
Accrued transfer agent fees and expenses | | | 104 | | | | 52 | |
Accrued printing expenses | | | 41 | | | | 18 | |
Accrued custody and fund accounting fees | | | 14 | | | | 9 | |
Accrued expenses and other liabilities | | | 32 | | | | 21 | |
Total Liabilities | | | 14,727 | | | | 3,243 | |
| | | | | | | | | |
NET ASSETS | | $ | 522,133 | | | $ | 257,013 | |
| | | | | | | | | |
NET ASSETS CONSIST OF | | | | | | | | |
Paid-in-capital | | $ | 354,098 | | | $ | 185,988 | |
Undistributed net investment income (accumulated net investment loss) | | | (6,890 | ) | | | (3,478 | ) |
Accumulated net realized gain (loss) on investments and foreign currency transactions | | | 52,480 | | | | 15,868 | |
Net unrealized appreciation on investments and foreign currency translations | | | 122,445 | | | | 58,635 | |
NET ASSETS | | $ | 522,133 | | | $ | 257,013 | |
| | | | | | | | | |
SHARES OUTSTANDING, $0.001 par value | | | | | | | | |
(Unlimited shares authorized) | | | 30,903 | | | | 15,832 | |
| | | | | | | | | |
NET ASSET VALUE, REDEMPTION PRICE, AND OFFERING PRICE PER SHARE (NET ASSETS/SHARES OUTSTANDING)* | | $ | 16.90 | | | $ | 16.23 | |
* | Not in thousands, based on unrounded net assets and shares outstanding. |
| See notes to financial statements. |
38
MARSICO
21st CENTURY FUND | | | MARSICO
INTERNATIONAL
OPPORTUNITIES
FUND | | | MARSICO
FLEXIBLE
CAPITAL FUND | | | MARSICO
GLOBAL FUND | |
| | | | | | | | | | | |
$ | 224,318 | | | $ | 54,796 | | | $ | 259,973 | | | $ | 35,496 | |
| | 1,093 | | | | 605 | | | | 1,877 | | | | — | |
| | 1 | | | | 1 | | | | 12 | | | | 2 | |
| | 52 | | | | 128 | | | | 845 | | | | 51 | |
| | 370 | | | | 169 | | | | 1,642 | | | | 113 | |
| | 225,834 | | | | 55,699 | | | | 264,349 | | | | 35,662 | |
| | | | | | | | | | | | | | | |
| | 1,186 | | | | 273 | | | | — | | | | — | |
| | 65 | | | | 17 | | | | 470 | | | | 18 | |
| | — | | | | — | | | | — | | | | — | |
| | 152 | | | | 22 | | | | 181 | | | | 13 | |
| | 362 | | | | 159 | | | | 1,639 | | | | 102 | |
| | 994 | | | | 241 | | | | 225 | | | | 168 | |
| | 40 | | | | 11 | | | | 64 | | | | 8 | |
| | 38 | | | | 17 | | | | 89 | | | | 11 | |
| | 11 | | | | 1 | | | | 17 | | | | 3 | |
| | 9 | | | | 20 | | | | 17 | | | | 11 | |
| | 26 | | | | 17 | | | | 20 | | | | 15 | |
| | 2,883 | | | | 778 | | | | 2,722 | | | | 349 | |
| | | | | | | | | | | | | | | |
$ | 222,951 | | | $ | 54,921 | | | $ | 261,627 | | | $ | 35,313 | |
| | | | | | | | | | | | | | | |
$ | 569,927 | | | $ | 148,023 | | | $ | 197,313 | | | $ | 26,802 | |
| | (3,864 | ) | | | (780 | ) | | | 67 | | | | (687 | ) |
| | (400,496 | ) | | | (101,670 | ) | | | 12,086 | | | | 1,089 | |
| | 57,384 | | | | 9,348 | | | | 52,161 | | | | 8,109 | |
$ | 222,951 | | | $ | 54,921 | | | $ | 261,627 | | | $ | 35,313 | |
| | | | | | | | | | | | | | | |
| | 9,460 | | | | 3,470 | | | | 17,963 | | | | 2,829 | |
| | | | | | | | | | | | | | | |
$ | 23.57 | | | $ | 15.83 | | | $ | 14.56 | | | $ | 12.48 | |
39
STATEMENTS OF OPERATIONS
FOR THE SIX-MONTH PERIOD ENDED March 31, 2017 (Unaudited)
(Amounts in thousands) | | MARSICO
FOCUS FUND | | | MARSICO
GROWTH FUND | |
| | | | | | | |
INVESTMENT INCOME | | | | | | |
Dividends (net of $20, $6, $3, $7, $0, and $5, respectively, of non-reclaimable foreign withholding taxes) | | $ | 2,095 | | | $ | 1,125 | |
Interest | | | — | | | | — | |
Total Investment Income | | | 2,095 | | | | 1,125 | |
| | | | | | | | | |
EXPENSES | | | | | | | | |
Investment advisory fees | | | 2,114 | | | | 1,043 | |
Distribution fees | | | 688 | | | | 327 | |
Transfer agent fees and expenses | | | 337 | | | | 169 | |
Trustees' fees and expenses | | | 247 | (1) | | | 98 | (1) |
Professional fees | | | 170 | | | | 79 | |
Fund administration fees | | | 82 | | | | 68 | |
Custody and fund accounting fees | | | 67 | | | | 47 | |
Printing and postage expenses | | | 57 | | | | 27 | |
Miscellaneous | | | 43 | | | | 22 | |
Federal and state registration fees | | | 16 | | | | 14 | |
Total Expenses | | | 3,821 | | | | 1,894 | |
Less waiver of expenses and expenses paid indirectly | | | — | | | | — | |
Net Expenses | | | 3,821 | | | | 1,894 | |
| | | | | | | | | |
NET INVESTMENT INCOME (LOSS) | | | (1,726 | ) | | | (769 | ) |
| | | | | | | | | |
REALIZED AND UNREALIZED GAIN | | | | | | | | |
Net realized gain on investments | | | 53,957 | | | | 15,884 | |
Net realized loss on foreign currency transactions | | | (13 | ) | | | — | |
Change in unrealized appreciation (depreciation) on investments and foreign currency translations | | | (24,311 | ) | | | (2,854 | ) |
| | | | | | | | | |
Net Gain on Investments | | | 29,633 | | | | 13,030 | |
| | | | | | | | | |
NET INCREASE IN NET ASSETS RESULTING FROM OPERATIONS | | $ | 27,907 | | | $ | 12,261 | |
(1) | Amounts include trustees’ fees and expenses and the mark to market unrealized appreciation during the period for shares held in the Trustees’ Deferred Fee Plan, as more fully described in Note 2(g) in the Notes to Financial Statements. |
| | | Trustees’
Fees and
Expenses* | | | Unrealized
Appreciation* | |
Focus Fund | | $ | 88,348 | | | $ | 158,636 | |
Growth Fund | | | 41,204 | | | | 56,607 | |
21st Century Fund | | | 34,868 | | | | 24,840 | |
International Opportunities Fund | | | 8,891 | | | | 1,464 | |
Flexible Capital Fund | | | 48,225 | | | | 53,760 | |
Global Fund | | | 6,039 | | | | 4,036 | |
| See notes to financial statements. |
40
MARSICO
21st CENTURY FUND | | | MARSICO
INTERNATIONAL
OPPORTUNITIES
FUND | | | MARSICO
FLEXIBLE
CAPITAL FUND | | | MARSICO
GLOBAL FUND | |
| | | | | | | | | | | |
$ | 480 | | | $ | 125 | | | $ | 3,704 | | | $ | 145 | |
| | — | | | | — | | | | 1,033 | | | | — | |
| | 480 | | | | 125 | | | | 4,737 | | | | 145 | |
| | | | | | | | | | | | | | | |
| | 893 | | | | 221 | | | | 1,168 | | | | 150 | |
| | 279 | | | | 69 | | | | 369 | | | | 47 | |
| | 157 | | | | 54 | | | | 263 | | | | 36 | |
| | 60 | (1) | | | 10 | (1) | | | 102 | (1) | | | 10 | (1) |
| | 67 | | | | 17 | | | | 94 | | | | 12 | |
| | 63 | | | | 47 | | | | 69 | | | | 37 | |
| | 48 | | | | 72 | | | | 69 | | | | 40 | |
| | 23 | | | | 6 | | | | 31 | | | | 4 | |
| | 15 | | | | 7 | | | | 31 | | | | 5 | |
| | 10 | | | | 8 | | | | 14 | | | | 7 | |
| | 1,615 | | | | 511 | | | | 2,210 | | | | 348 | |
| | — | | | | (70 | ) | | | — | | | | (48 | ) |
| | 1,615 | | | | 441 | | | | 2,210 | | | | 300 | |
| | | | | | | | | | | | | | | |
| | (1,135 | ) | | | (316 | ) | | | 2,527 | | | | (155 | ) |
| | | | | | | | | | | | | | | |
| | 17,506 | | | | 2,223 | | | | 14,650 | | | | 1,982 | |
| | (9 | ) | | | (716 | ) | | | (1,562 | ) | | | (143 | ) |
| | (1,728 | ) | | | (1,006 | ) | | | (10,767 | ) | | | (725 | ) |
| | | | | | | | | | | | | | | |
| | 15,769 | | | | 501 | | | | 2,321 | | | | 1,114 | |
| | | | | | | | | | | | | | | |
$ | 14,634 | | | $ | 185 | | | $ | 4,848 | | | $ | 959 | |
41
STATEMENTS OF CHANGES IN NET ASSETS
| | | MARSICO
FOCUS FUND | | | MARSICO
GROWTH FUND | |
| | | | | | | | | | | | | |
(Amounts in thousands) | | Six-Month
Period Ended
3/31/17
(Unaudited) | | | Year
Ended
9/30/16 | | | Six-Month
Period Ended
3/31/17
(Unaudited) | | | Year
Ended
9/30/16 | |
| | | | | | | | | | | | | |
OPERATIONS: | | | | | | | | | | | | |
Net investment income (loss) | | $ | (1,726 | ) | | $ | (4,486 | ) | | $ | (769 | ) | | $ | (2,098 | ) |
Net realized gain (loss) on investments | | | 53,957 | | | | (119 | ) | | | 15,884 | | | | 2,049 | |
Net realized loss on foreign currency transactions | | | (13 | ) | | | (292 | ) | | | — | | | | — | |
Change in unrealized appreciation (depreciation) on investments and foreign currency translations | | | (24,311 | ) | | | 45,999 | | | | (2,854 | ) | | | 19,892 | |
| | | | | | | | | | | | | | | | | |
Net increase in net assets resulting from operations | | | 27,907 | | | | 41,102 | | | | 12,261 | | | | 19,843 | |
| | | | | | | | | | | | | | | | | |
DISTRIBUTIONS: | | | | | | | | | | | | | | | | |
Net investment income | | | — | | | | — | | | | — | | | | — | |
Net realized gains | | | — | | | | (157,703 | ) | | | (2,136 | ) | | | (111,369 | ) |
| | | | | | | | | | | | | | | | | |
Total distributions | | | — | | | | (157,703 | ) | | | (2,136 | ) | | | (111,369 | ) |
| | | | | | | | | | | | | | | | | |
CAPITAL SHARE TRANSACTIONS: | | | | | | | | | | | | | | | | |
Proceeds from sales of shares | | | 15,123 | | | | 30,902 | | | | 8,538 | | | | 16,765 | |
Proceeds from reinvestment of distributions | | | — | | | | 147,665 | | | | 2,048 | | | | 106,035 | |
Redemption of shares | | | (134,767 | ) | | | (236,947 | ) | | | (51,911 | ) | | | (153,503 | ) |
| | | | | | | | | | | | | | | | | |
Net decrease from capital share transactions | | | (119,644 | ) | | | (58,380 | ) | | | (41,325 | ) | | | (30,703 | ) |
| | | | | | | | | | | | | | | | | |
TOTAL DECREASE IN NET ASSETS | | | (91,737 | ) | | | (174,981 | ) | | | (31,200 | ) | | | (122,229 | ) |
| | | | | | | | | | | | | | | | | |
NET ASSETS: | | | | | | | | | | | | | | | | |
Beginning of Period | | | 613,870 | | | | 788,851 | | | | 288,213 | | | | 410,442 | |
| | | | | | | | | | | | | | | | | |
End of Period | | $ | 522,133 | | | $ | 613,870 | | | $ | 257,013 | | | $ | 288,213 | |
| | | | | | | | | | | | | | | | | |
Undistributed net investment income (Accumulated net investment loss) | | $ | (6,890 | ) | | $ | (5,164 | ) | | $ | (3,478 | ) | | $ | (2,709 | ) |
| | | | | | | | | | | | | | | | | |
TRANSACTIONS IN SHARES: | | | | | | | | | | | | | | | | |
Shares sold | | | 947 | | | | 1,894 | | | | 539 | | | | 1,038 | |
Shares issued in reinvestment of distributions | | | — | | | | 9,166 | | | | 137 | | | | 6,814 | |
Shares redeemed | | | (8,518 | ) | | | (14,476 | ) | | | (3,394 | ) | | | (9,708 | ) |
| | | | | | | | | | | | | | | | | |
NET DECREASE | | | (7,571 | ) | | | (3,416 | ) | | | (2,718 | ) | | | (1,856 | ) |
| See notes to financial statements. |
42
MARSICO
21st CENTURY FUND | | | MARSICO
INTERNATIONAL
OPPORTUNITIES FUND | | | MARSICO
FLEXIBLE
CAPITAL FUND | | | MARSICO
GLOBAL FUND | |
| | | | | | | | | | | | | | | | | | | | | | | |
Six-Month
Period Ended
3/31/17
(Unaudited) | | | Year
Ended
9/30/16 | | | Six-Month
Period Ended
3/31/17
(Unaudited) | | | Year
Ended
9/30/16 | | | Six-Month
Period Ended
3/31/17
(Unaudited) | | | Year
Ended
9/30/16 | | | Six-Month
Period Ended
3/31/17
(Unaudited) | | | Year
Ended
9/30/16 | |
| | | | | | | | | | | | | | | | | | | | | | | |
$ | (1,135 | ) | | $ | (2,547 | ) | | $ | (316 | ) | | $ | (501 | ) | | $ | 2,527 | | | $ | 5,812 | | | $ | (155 | ) | | $ | (341 | ) |
| | 17,506 | | | | (1,442 | ) | | | 2,223 | | | | 1,451 | | | | 14,650 | | | | 28,781 | | | | 1,982 | | | | 627 | |
| | (9 | ) | | | (201 | ) | | | (716 | ) | | | (982 | ) | | | (1,562 | ) | | | (2,492 | ) | | | (143 | ) | | | (979 | ) |
| | (1,728 | ) | | | 23,264 | | | | (1,006 | ) | | | 5,801 | | | | (10,767 | ) | | | 3,467 | | | | (725 | ) | | | 4,517 | |
| | | | | | | | | | | | | | | | | | | | | | | | | | | | | | | |
| | 14,634 | | | | 19,074 | | | | 185 | | | | 5,769 | | | | 4,848 | | | | 35,568 | | | | 959 | | | | 3,824 | |
| | | | | | | | | | | | | | | | | | | | | | | | | | | | | | | |
| | — | | | | — | | | | — | | | | — | | | | (4,808 | ) | | | (3,373 | ) | | | — | | | | — | |
| | — | | | | — | | | | — | | | | — | | | | (21,758 | ) | | | (64,551 | ) | | | — | | | | (6,835 | ) |
| | | | | | | | | | | | | | | | | | | | | | | | | | | | | | | |
| | — | | | | — | | | | — | | | | — | | | | (26,566 | ) | | | (67,924 | ) | | | — | | | | (6,835 | ) |
| | | | | | | | | | | | | | | | | | | | | | | | | | | | | | | |
| | 2,488 | | | | 3,888 | | | | 855 | | | | 2,573 | | | | 9,421 | | | | 74,732 | | | | 328 | | | | 6,817 | |
| | — | | | | — | | | | — | | | | — | | | | 23,955 | | | | 57,636 | | | | — | | | | 5,566 | |
| | (28,951 | ) | | | (56,566 | ) | | | (8,952 | ) | | | (34,650 | ) | | | (103,122 | ) | | | (296,134 | ) | | | (10,247 | ) | | | (31,711 | ) |
| | | | | | | | | | | | | | | | | | | | | | | | | | | | | | | |
| | (26,463 | ) | | | (52,678 | ) | | | (8,097 | ) | | | (32,077 | ) | | | (69,746 | ) | | | (163,766 | ) | | | (9,919 | ) | | | (19,328 | ) |
| | | | | | | | | | | | | | | | | | | | | | | | | | | | | | | |
| | (11,829 | ) | | | (33,604 | ) | | | (7,912 | ) | | | (26,308 | ) | | | (91,464 | ) | | | (196,122 | ) | | | (8,960 | ) | | | (22,339 | ) |
| | | | | | | | | | | | | | | | | | | | | | | | | | | | | | | |
| | 234,780 | | | | 268,384 | | | | 62,833 | | | | 89,141 | | | | 353,091 | | | | 549,213 | | | | 44,273 | | | | 66,612 | |
| | | | | | | | | | | | | | | | | | | | | | | | | | | | | | | |
$ | 222,951 | | | $ | 234,780 | | | $ | 54,921 | | | $ | 62,833 | | | $ | 261,627 | | | $ | 353,091 | | | $ | 35,313 | | | $ | 44,273 | |
| | | | | | | | | | | | | | | | | | | | | | | | | | | | | | | |
$ | (3,864 | ) | | $ | (2,729 | ) | | $ | (780 | ) | | $ | (464 | ) | | $ | 67 | | | $ | 2,348 | | | $ | (687 | ) | | $ | (532 | ) |
| | | | | | | | | | | | | | | | | | | | | | | | | | | | | | | |
| | 112 | | | | 180 | | | | 58 | | | | 164 | | | | 652 | | | | 5,059 | | | | 28 | | | | 572 | |
| | — | | | | — | | | | — | | | | — | | | | 1,738 | | | | 3,850 | | | | — | | | | 467 | |
| | (1,306 | ) | | | (2,693 | ) | | | (605 | ) | | | (2,292 | ) | | | (7,131 | ) | | | (19,300 | ) | | | (880 | ) | | | (2,743 | ) |
| | | | | | | | | | | | | | | | | | | | | | | | | | | | | | | |
| | (1,194 | ) | | | (2,513 | ) | | | (547 | ) | | | (2,128 | ) | | | (4,741 | ) | | | (10,391 | ) | | | (852 | ) | | | (1,704 | ) |
43
FINANCIAL HIGHLIGHTS
| | | MARSICO FOCUS FUND | |
For a Fund Share Outstanding Throughout the Period | | Six-Month
Period Ended 3/31/17 (Unaudited) | | | Year
Ended
9/30/16 | | | Year
Ended
9/30/15 | | | Year
Ended
9/30/14 | | | Year
Ended
9/30/13 | | | Year
Ended
9/30/12 | |
| | | | | | | | | | | | | | | | | | | |
Net Asset Value, Beginning of Period | | $ | 15.96 | | | $ | 18.83 | | | $ | 22.41 | | | $ | 21.47 | | | $ | 20.02 | | | $ | 15.97 | |
| | | | | | | | | | | | | | | | | | | | | | | | | |
Income from Investment Operations: | | | | | | | | | | | | | | | | | | | | | | | | |
Net investment income (loss) | | | (0.09 | ) | | | (0.13 | ) | | | (0.10 | ) | | | (0.07 | ) | | | (0.03 | ) | | | 0.02 | |
Net realized and unrealized gains (losses) on investments | | | 1.03 | | | | 1.25 | | | | (0.62 | ) | | | 4.46 | | | | 3.84 | | | | 4.03 | |
| | | | | | | | | | | | | | | | | | | | | | | | | |
Total from investment operations | | | 0.94 | | | | 1.12 | | | | (0.72 | ) | | | 4.39 | | | | 3.81 | | | | 4.05 | |
| | | | | | | | | | | | | | | | | | | | | | | | | |
Distributions & Other: | | | | | | | | | | | | | | | | | | | | | | | | |
Net investment income | | | — | | | | — | | | | — | | | | — | | | | (0.03 | ) | | | — | |
Net realized gains | | | — | | | | (3.99 | ) | | | (2.86 | ) | | | (3.45 | ) | | | (2.33 | ) | | | — | |
Redemption fees [See Note 2(h)] | | | — | | | | — | | | | — | | | | — | (1) | | | — | (1) | | | — | (1) |
| | | | | | | | | | | | | | | | | | | | | | | | | |
Total distributions and other | | | — | | | | (3.99 | ) | | | (2.86 | ) | | | (3.45 | ) | | | (2.36 | ) | | | — | |
| | | | | | | | | | | | | | | | | | | | | | | | | |
Net Asset Value, End of Period | | $ | 16.90 | | | $ | 15.96 | | | $ | 18.83 | | | $ | 22.41 | | | $ | 21.47 | | | $ | 20.02 | |
| | | | | | | | | | | | | | | | | | | | | | | | | |
Total Return | | | 5.89 | %(2) | | | 5.75 | % | | | (4.15 | )% | | | 22.27 | % | | | 21.86 | % | | | 25.36 | % |
| | | | | | | | | | | | | | | | | | | | | | | | | |
Supplemental Data and Ratios: | | | | | | | | | | | | | | | | | | | | | | | | |
| | | | | | | | | | | | | | | | | | | | | | | | | |
Net assets, end of period (000s) | | $ | 522,133 | | | $ | 613,870 | | | $ | 788,851 | | | $ | 933,054 | | | $ | 854,708 | | | $ | 966,010 | |
| | | | | | | | | | | | | | | | | | | | | | | | | |
Ratio of expenses to average net assets, less waivers and before expenses paid indirectly, plus recoupment of previously waived fees or expenses paid | | | 1.39 | %(3) | | | 1.29 | % | | | 1.31 | % | | | 1.34 | % | | | 1.35 | % | | | 1.34 | % |
| | | | | | | | | | | | | | | | | | | | | | | | | |
Ratio of net investment income (loss) to average net assets, net of waivers, recoupment of previously waived fees or expenses paid and expenses paid indirectly | | | (0.63 | )%(3) | | | (0.63 | )% | | | (0.45 | )% | | | (0.35 | )% | | | (0.10 | )% | | | 0.09 | % |
| | | | | | | | | | | | | | | | | | | | | | | | | |
Ratio of expenses to average net assets, before waivers, recoupment of previously waived fees or expenses paid and expenses paid indirectly | | | 1.39 | %(3) | | | 1.29 | % | | | 1.31 | % | | | 1.34 | % | | | 1.35 | % | | | 1.34 | % |
| | | | | | | | | | | | | | | | | | | | | | | | | |
Ratio of net investment income (loss) to average net assets, before waivers, recoupment of previously waived fees or expenses paid and expenses paid indirectly | | | (0.63 | )%(3) | | | (0.63 | )% | | | (0.45 | )% | | | (0.35 | )% | | | (0.10 | )% | | | 0.09 | % |
| | | | | | | | | | | | | | | | | | | | | | | | | |
Portfolio turnover rate | | | 38 | %(2) | | | 45 | % | | | 68 | % | | | 71 | % | | | 92 | % | | | 66 | % |
| See notes to financial statements. |
44
MARSICO
GROWTH FUND | | | MARSICO
21st CENTURY FUND | |
Six-Month
Period Ended 3/31/17 (Unaudited) | | | Year
Ended
9/30/16 | | | Year
Ended
9/30/15 | | | Year
Ended
9/30/14 | | | Year
Ended
9/30/13 | | | Year
Ended
9/30/12 | | | Six-Month
Period Ended 3/31/17 (Unaudited) | | | Year
Ended
9/30/16 | | | Year
Ended
9/30/15 | | | Year
Ended
9/30/14 | | | Year
Ended
9/30/13 | | | Year
Ended
9/30/12 | |
| | | | | | | | | | | | | | | | | | | | | | | | | | | | | | | | | | | |
$ | 15.54 | | | $ | 20.11 | | | $ | 23.63 | | | $ | 25.03 | | | $ | 21.96 | | | $ | 17.43 | | | $ | 22.04 | | | $ | 20.38 | | | $ | 20.90 | | | $ | 18.05 | | | $ | 14.24 | | | $ | 11.36 | |
| | | | | | | | | | | | | | | | | | | | | | | | | | | | | | | | | | | | | | | | | | | | | | | |
| | (0.07 | ) | | | (0.13 | ) | | | (0.15 | ) | | | (0.08 | ) | | | — | (1) | | | 0.03 | | | | (0.15 | ) | | | (0.29 | ) | | | (0.21 | ) | | | (0.21 | ) | | | (0.09 | ) | | | (0.06 | ) |
| | 0.88 | | | | 1.33 | | | | (0.62 | ) | | | 4.01 | | | | 4.30 | | | | 4.51 | | | | 1.68 | | | | 1.95 | | | | (0.31 | ) | | | 3.06 | | | | 3.90 | | | | 2.94 | |
| | | | | | | | | | | | | | | | | | | | | | | | | | | | | | | | | | | | | | | | | | | | | | | |
| | 0.81 | | | | 1.20 | | | | (0.77 | ) | | | 3.93 | | | | 4.30 | | | | 4.54 | | | | 1.53 | | | | 1.66 | | | | (0.52 | ) | | | 2.85 | | | | 3.81 | | | | 2.88 | |
| | | | | | | | | | | | | | | | | | | | | | | | | | | | | | | | | | | | | | | | | | | | | | | |
| | — | | | | — | | | | — | | | | (0.06 | ) | | | (0.04 | ) | | | (0.01 | ) | | | — | | | | — | | | | — | | | | — | | | | — | | | | — | |
| | (0.12 | ) | | | (5.77 | ) | | | (2.75 | ) | | | (5.27 | ) | | | (1.19 | ) | | | — | | | | — | | | | — | | | | — | | | | — | | | | — | | | | — | |
| | — | | | | — | | | | — | | | | — | (1) | | | — | (1) | | | — | (1) | | | — | | | | — | | | | — | | | | — | (1) | | | — | (1) | | | — | (1) |
| | | | | | | | | | | | | | | | | | | | | | | | | | | | | | | | | | | | | | | | | | | | | | | |
| | (0.12 | ) | | | (5.77 | ) | | | (2.75 | ) | | | (5.33 | ) | | | (1.23 | ) | | | (0.01 | ) | | | — | | | | — | | | | — | | | | — | | | | — | | | | — | |
| | | | | | | | | | | | | | | | | | | | | | | | | | | | | | | | | | | | | | | | | | | | | | | |
$ | 16.23 | | | $ | 15.54 | | | $ | 20.11 | | | $ | 23.63 | | | $ | 25.03 | | | $ | 21.96 | | | $ | 23.57 | | | $ | 22.04 | | | $ | 20.38 | | | $ | 20.90 | | | $ | 18.05 | | | $ | 14.24 | |
| | | | | | | | | | | | | | | | | | | | | | | | | | | | | | | | | | | | | | | | | | | | | | | |
| | 5.31 | %(2) | | | 5.94 | % | | | (4.10 | )% | | | 17.51 | % | | | 20.92 | % | | | 26.04 | % | | | 6.94 | %(2) | | | 8.15 | % | | | (2.49 | )% | | | 15.79 | % | | | 26.76 | % | | | 25.35 | % |
| | | | | | | | | | | | | | | | | | | | | | | | | | | | | | | | | | | | | | | | | | | | | | | |
$ | 257,013 | | | $ | 288,213 | | | $ | 410,442 | | | $ | 562,653 | | | $ | 564,766 | | | $ | 677,393 | | | $ | 222,951 | | | $ | 234,780 | | | $ | 268,384 | | | $ | 316,293 | | | $ | 312,215 | | | $ | 354,545 | |
| | | | | | | | | | | | | | | | | | | | | | | | | | | | | | | | | | | | | | | | | | | | | | | |
| | 1.45 | %(3) | | | 1.37 | % | | | 1.35 | % | | | 1.37 | % | | | 1.37 | % | | | 1.35 | % | | | 1.45 | %(3) | | | 1.41 | % | | | 1.38 | % | | | 1.42 | % | | | 1.45 | % | | | 1.41 | % |
| | | | | | | | | | | | | | | | | | | | | | | | | | | | | | | | | | | | | | | | | | | | | | | |
| | (0.59 | )%(3) | | | (0.61 | )% | | | (0.52 | )% | | | (0.34 | )% | | | 0.01 | % | | | 0.15 | % | | | (1.02 | )%(3) | | | (1.01 | )% | | | (0.78 | )% | | | (0.88 | )% | | | (0.33 | )% | | | (0.31 | )% |
| | | | | | | | | | | | | | | | | | | | | | | | | | | | | | | | | | | | | | | | | | | | | | | |
| | 30 | %(2) | | | 52 | % | | | 81 | % | | | 80 | % | | | 114 | % | | | 65 | % | | | 17 | %(2) | | | 44 | % | | | 94 | % | | | 83 | % | | | 102 | % | | | 63 | % |
45
FINANCIAL HIGHLIGHTS
| | | MARSICO
INTERNATIONAL OPPORTUNITIES FUND | |
For a Fund Share Outstanding Throughout the Period | | Six-Month
Period Ended 3/31/17 (Unaudited) | | | Year
Ended
9/30/16 | | | Year
Ended
9/30/15 | | | Year
Ended
9/30/14 | | | Year
Ended
9/30/13 | | | Year
Ended
9/30/12 | |
| | | | | | | | | | | | | | | | | | | |
Net Asset Value, Beginning of Period | | $ | 15.64 | | | $ | 14.51 | | | $ | 14.72 | | | $ | 15.30 | | | $ | 12.50 | | | $ | 10.61 | |
| | | | | | | | | | | | | | | | | | | | | | | | | |
Income from Investment Operations: | | | | | | | | | | | | | | | | | | | | | | | | |
Net investment income (loss) | | | (0.11 | ) | | | (0.20 | ) | | | (0.21 | ) | | | (0.06 | ) | | | 0.09 | | | | 0.01 | |
Net realized and unrealized gains (losses) on investments | | | 0.30 | | | | 1.33 | | | | — | (1) | | | (0.42 | ) | | | 2.71 | | | | 1.88 | |
| | | | | | | | | | | | | | | | | | | | | | | | | |
Total from investment operations | | | 0.19 | | | | 1.13 | | | | (0.21 | ) | | | (0.48 | ) | | | 2.80 | | | | 1.89 | |
| | | | | | | | | | | | | | | | | | | | | | | | | |
Distributions & Other: | | | | | | | | | | | | | | | | | | | | | | | | |
Net investment income | | | — | | | | — | | | | — | | | | (0.10 | ) | | | — | | | | — | |
Net realized gains | | | — | | | | — | | | | — | | | | — | | | | — | | | | — | |
Redemption fees [See Note 2(h)] | | | — | | | | — | | | | — | | | | — | (1) | | | — | (1) | | | — | (1) |
| | | | | | | | | | | | | | | | | | | | | | | | | |
Total distributions and other | | | — | | | | — | | | | — | | | | (0.10 | ) | | | — | | | | — | |
| | | | | | | | | | | | | | | | | | | | | | | | | |
Net Asset Value, End of Period | | $ | 15.83 | | | $ | 15.64 | | | $ | 14.51 | | | $ | 14.72 | | | $ | 15.30 | | | $ | 12.50 | |
| | | | | | | | | | | | | | | | | | | | | | | | | |
Total Return | | | 1.21 | %(2) | | | 7.79 | % | | | (1.43 | )% | | | (3.18 | )% | | | 22.40 | % | | | 17.81 | % |
| | | | | | | | | | | | | | | | | | | | | | | | | |
Supplemental Data and Ratios: | | | | | | | | | | | | | | | | | | | | | | | | |
| | | | | | | | | | | | | | | | | | | | | | | | | |
Net assets, end of period (000s) | | $ | 54,921 | | | $ | 62,833 | | | $ | 89,141 | | | $ | 175,984 | | | $ | 119,522 | | | $ | 134,221 | |
| | | | | | | | | | | | | | | | | | | | | | | | | |
Ratio of expenses to average net assets, less waivers and before expenses paid indirectly, plus recoupment of previously waived fees or expenses paid | | | 1.60 | %(3) | | | 1.60 | % | | | 1.60 | % | | | 1.60 | % | | | 1.60 | % | | | 1.60 | % |
| | | | | | | | | | | | | | | | | | | | | | | | | |
Ratio of net investment income (loss) to average net assets, net of waivers, recoupment of previously waived fees or expenses paid and expenses paid indirectly | | | (1.15 | )%(3) | | | (0.71 | )% | | | (0.86 | )% | | | (0.55 | )% | | | 0.61 | % | | | 0.29 | % |
| | | | | | | | | | | | | | | | | | | | | | | | | |
Ratio of expenses to average net assets, before waivers, recoupment of previously waived fees or expenses paid and expenses paid indirectly | | | 1.85 | %(3) | | | 1.78 | % | | | 1.63 | % | | | 1.52 | % | | | 1.74 | % | | | 1.65 | % |
| | | | | | | | | | | | | | | | | | | | | | | | | |
Ratio of net investment income (loss) to average net assets, before waivers, recoupment of previously waived fees or expenses paid and expenses paid indirectly | | | (1.40 | )%(3) | | | (0.89 | )% | | | (0.89 | )% | | | (0.47 | )% | | | 0.47 | % | | | 0.24 | % |
| | | | | | | | | | | | | | | | | | | | | | | | | |
Portfolio turnover rate | | | 54 | %(2) | | | 223 | % | | | 217 | % | | | 178 | % | | | 121 | % | | | 66 | % |
| See notes to financial statements. |
46
MARSICO
FLEXIBLE CAPITAL FUND | | | MARSICO
GLOBAL FUND | |
Six-Month
Period Ended 3/31/17 (Unaudited) | | | Year
Ended
9/30/16 | | | Year
Ended
9/30/15 | | | Year
Ended
9/30/14 | | | Year
Ended
9/30/13 | | | Year
Ended
9/30/12 | | | Six-Month
Period Ended 3/31/17 (Unaudited) | | | Year
Ended
9/30/16 | | | Year
Ended
9/30/15 | | | Year
Ended
9/30/14 | | | Year
Ended
9/30/13 | | | Year
Ended
9/30/12 | |
| | | | | | | | | | | | | | | | | | | | | | | | | | | | | | | | | | | |
$ | 15.55 | | | $ | 16.59 | | | $ | 18.39 | | | $ | 18.21 | | | $ | 15.79 | | | $ | 12.05 | | | $ | 12.03 | | | $ | 12.37 | | | $ | 14.45 | | | $ | 14.74 | | | $ | 11.51 | | | $ | 9.06 | |
| | | | | | | | | | | | | | | | | | | | | | | | | | | | | | | | | | | | | | | | | | | | | | | |
| | 0.14 | | | | 0.24 | | | | 0.09 | | | | (0.04 | ) | | | 0.04 | | | | 0.03 | | | | (0.10 | ) | | | (0.16 | ) | | | (0.10 | ) | | | (0.05 | ) | | | (0.02 | ) | | | (0.07 | ) |
| | 0.20 | | | | 0.96 | | | | (0.15 | ) | | | 2.18 | | | | 3.28 | | | | 3.77 | | | | 0.55 | | | | 1.14 | | | | (0.32 | ) | | | 1.93 | | | | 3.25 | | | | 2.52 | |
| | | | | | | | | | | | | | | | | | | | | | | | | | | | | | | | | | | | | | | | | | | | | | | |
| | 0.34 | | | | 1.20 | | | | (0.06 | ) | | | 2.14 | | | | 3.32 | | | | 3.80 | | | | 0.45 | | | | 0.98 | | | | (0.42 | ) | | | 1.88 | | | | 3.23 | | | | 2.45 | |
| | | | | | | | | | | | | | | | | | | | | | | | | | | | | | | | | | | | | | | | | | | | | | | |
| | (0.24 | ) | | | (0.11 | ) | | | — | | | | — | | | | (0.09 | ) | | | (0.06 | ) | | | — | | | | — | | | | — | | | | — | | | | — | | | | — | |
| | (1.09 | ) | | | (2.13 | ) | | | (1.74 | ) | | | (1.96 | ) | | | (0.81 | ) | | | — | | | | — | | | | (1.32 | ) | | | (1.66 | ) | | | (2.17 | ) | | | — | | | | — | |
| | — | | | | — | | | | — | | | | — | (1) | | | — | (1) | | | — | (1) | | | — | | | | — | | | | — | | | | — | (1) | | | — | (1) | | | — | (1) |
| | | | | | | | | | | | | | | | | | | | | | | | | | | | | | | | | | | | | | | | | | | | | | | |
| | (1.33 | ) | | | (2.24 | ) | | | (1.74 | ) | | | (1.96 | ) | | | (0.90 | ) | | | (0.06 | ) | | | — | | | | (1.32 | ) | | | (1.66 | ) | | | (2.17 | ) | | | — | | | | — | |
| | | | | | | | | | | | | | | | | | | | | | | | | | | | | | | | | | | | | | | | | | | | | | | |
$ | 14.56 | | | $ | 15.55 | | | $ | 16.59 | | | $ | 18.39 | | | $ | 18.21 | | | $ | 15.79 | | | $ | 12.48 | | | $ | 12.03 | | | $ | 12.37 | | | $ | 14.45 | | | $ | 14.74 | | | $ | 11.51 | |
| | | | | | | | | | | | | | | | | | | | | | | | | | | | | | | | | | | | | | | | | | | | | | | |
| | 2.69 | %(2) | | | 7.79 | % | | | (0.81 | )% | | | 12.15 | % | | | 22.34 | % | | | 31.63 | % | | | 3.74 | %(2) | | | 8.05 | % | | | (3.51 | )% | | | 13.23 | % | | | 28.06 | % | | | 27.04 | % |
| | | | | | | | | | | | | | | | | | | | | | | | | | | | | | | | | | | | | | | | | | | | | | | |
$ | 261,627 | | | $ | 353,091 | | | $ | 549,213 | | | $ | 806,448 | | | $ | 805,735 | | | $ | 590,293 | | | $ | 35,313 | | | $ | 44,273 | | | $ | 66,612 | | | $ | 73,475 | | | $ | 61,383 | | | $ | 54,195 | |
| | | | | | | | | | | | | | | | | | | | | | | | | | | | | | | | | | | | | | | | | | | | | | | |
| | 1.50 | %(3) | | | 1.38 | % | | | 1.37 | % | | | 1.38 | % | | | 1.41 | % | | | 1.43 | % | | | 1.60 | %(3) | | | 1.60 | % | | | 1.60 | % | | | 1.60 | % | | | 1.60 | % | | | 1.60 | % |
| | | | | | | | | | | | | | | | | | | | | | | | | | | | | | | | | | | | | | | | | | | | | | | |
| | 1.71 | %(3) | | | 1.25 | % | | | 0.53 | % | | | (0.21 | )% | | | 0.16 | % | | | 0.17 | % | | | (0.83 | )%(3) | | | (0.60 | )% | | | (0.80 | )% | | | (0.42 | )% | | | (0.06 | )% | | | (0.32 | )% |
| | | | | | | | | | | | | | | | | | | | | | | | | | | | | | | | | | | | | | | | | | | | | | | |
| | 1.50 | %(3) | | | 1.38 | % | | | 1.37 | % | | | 1.38 | % | | | 1.41 | % | | | 1.43 | % | | | 1.85 | %(3) | | | 1.69 | % | | | 1.54 | % | | | 1.66 | % | | | 1.86 | % | | | 1.70 | % |
| | | | | | | | | | | | | | | | | | | | | | | | | | | | | | | | | | | | | | | | | | | | | | | |
| | 1.71 | %(3) | | | 1.25 | % | | | 0.53 | % | | | (0.21 | )% | | | 0.16 | % | | | 0.17 | % | | | (1.08 | )%(3) | | | (0.69 | )% | | | (0.74 | )% | | | (0.48 | )% | | | (0.32 | )% | | | (0.42 | )% |
| | | | | | | | | | | | | | | | | | | | | | | | | | | | | | | | | | | | | | | | | | | | | | | |
| | 6 | %(2) | | | 35 | % | | | 69 | % | | | 118 | % | | | 145 | % | | | 121 | % | | | 42 | %(2) | | | 82 | % | | | 110 | % | | | 129 | % | | | 134 | % | | | 95 | % |
47
| NOTES TO FINANCIAL STATEMENTS |
NOTES TO FINANCIAL STATEMENTS March 31, 2017 (Unaudited)
The Marsico Investment Fund (the “Trust”) was organized on October 1, 1997, as a Delaware statutory trust and is registered under the Investment Company Act of 1940 (the “1940 Act”) as an open-end management investment company. The Focus Fund, Growth Fund, 21st Century Fund, International Opportunities Fund, Flexible Capital Fund, and Global Fund (collectively, the “Funds”) are separate investment portfolios of the Trust. The Focus Fund is a non-diversified fund and the Growth Fund, the 21st Century Fund, the International Opportunities Fund, the Flexible Capital Fund, and the Global Fund are diversified funds. The Focus Fund and Growth Fund commenced operations on December 31, 1997, the 21st Century Fund commenced operations on February 1, 2000, the International Opportunities Fund commenced operations on June 30, 2000, the Flexible Capital Fund commenced operations on December 29, 2006, and the Global Fund commenced operations on June 29, 2007. Trustees and officers of the Trust and employees of Marsico Capital Management, LLC (the “Adviser”) own approximately 6% and 19% of the International Opportunities Fund’s and Global Fund’s outstanding shares, respectively, as of March 31, 2017.
2. | Significant Accounting Policies |
The Funds qualify as investment companies under Accounting Standards Update No. 2013-08, Accounting Standard Codification Topic 946, Financial Services — Investment Companies (“ASC 946”). The following is a summary of significant accounting policies consistently followed by the Funds in the preparation of their financial statements. These policies are in conformity with Generally Accepted Accounting Principles (“GAAP”) in the United States of America for investment companies and follow the accounting guidance provided in ASC 946. The presentation of financial statements in conformity with GAAP requires management to make estimates and assumptions that affect the reported amounts and disclosures of assets and liabilities at the date of the financial statements and the reported amounts and disclosures of income and expenses during the reporting period. Actual results could differ from those estimates.
| | (a) | Investment Valuation — A security traded on a recognized stock exchange is generally valued at the last sale price prior to the closing of the principal exchange on which the security is traded. Securities traded on NASDAQ generally will be valued at the NASDAQ Official Closing Price. If no sale price is reported on the valuation date, the most current bid price will generally be used, with the exception of short option positions which will generally utilize the most current ask price. Other securities for which over-the-counter market quotations are readily available are generally valued at the last sale price. Debt securities that will mature in more than 60 days are generally valued at their bid prices furnished by a pricing service approved by the Funds’ Board of Trustees and subject to review pursuant to procedures established by, and under the general supervision of, the Board of Trustees. Debt securities that will mature in 60 days or less are valued at amortized cost, if it approximates market value. Any securities for which market quotations are not readily available are valued at their fair value as determined in good faith by the Adviser in accordance with procedures established by, and under the general supervision of, the Funds’ Board of Trustees. The Funds may use pricing services to assist in determining market value. The Board of Trustees has authorized the use of a pricing service to assist the Funds in valuing certain equity securities listed or traded on foreign security exchanges in the Funds’ portfolios in certain circumstances where there is a significant change in the value of related US-traded securities, as represented by, for example, the S&P 500 Index. |
“Fair Value Measurements and Disclosures” (the “Fair Value Statement”) defines fair value, establishes a framework for measuring fair value in GAAP, and expands disclosures about fair value measurements. Under the Fair Value Statement, various inputs are used in determining the value of the Funds’ investments.
These inputs are summarized into three broad levels and described below:
| | ● | Level 1 – quoted prices in active markets for identical investments |
| | ● | Level 2 – other significant observable inputs (including quoted prices for similar investments, interest rates, and evaluated quotations obtained from pricing services) |
| | ● | Level 3 – significant unobservable inputs (including the Fund’s assumptions that market participants would use in determining the fair value of investments) |
48
| NOTES TO FINANCIAL STATEMENTS |
The inputs or methodology used for valuing investments are not an indication of the risk associated with investing in those investments. Changes in valuation techniques may result in transfers between the levels during the reporting period. The Funds recognize transfers between the levels as of the end of each reporting period and consider securities that are purchased during the reporting period as not having transferred between levels as of the end of the reporting period. There were no transfers between each of the three levels during the reporting period. The following is a summary of the fair values of the Funds’ investments in each category and economic sector as of March 31, 2017:
Fund Investments by
Major Security Type | | Level 1 | | | Level 2 | | | Level 3 | | | Total | |
Marsico Focus Fund | | | | | | | | | | | | |
Assets | | | | | | | | | | | | |
Common Stocks | | | | | | | | | | | | |
Consumer Discretionary | | $ | 113,087,753 | | | $ | — | | | $ | — | | | $ | 113,087,753 | |
Consumer Staples | | | 13,373,316 | | | | — | | | | — | | | | 13,373,316 | |
Financials | | | 32,579,719 | | | | — | | | | — | | | | 32,579,719 | |
Health Care | | | 88,591,697 | | | | — | | | | — | | | | 88,591,697 | |
Information Technology | | | 247,032,470 | | | | — | | | | — | | | | 247,032,470 | |
Materials | | | 27,281,987 | | | | — | | | | — | | | | 27,281,987 | |
| | | | | | | | | | | | | | | $ | 521,946,942 | |
Marsico Growth Fund | | | | | | | | | | | | | | | | |
Assets | | | | | | | | | | | | | | | | |
Common Stocks | | | | | | | | | | | | | | | | |
Consumer Discretionary | | $ | 47,385,936 | | | $ | — | | | $ | — | | | $ | 47,385,936 | |
Consumer Staples | | | 12,872,232 | | | | — | | | | — | | | | 12,872,232 | |
Financials | | | 23,552,616 | | | | — | | | | — | | | | 23,552,616 | |
Health Care | | | 51,092,503 | | | | — | | | | — | | | | 51,092,503 | |
Industrials | | | 12,909,613 | | | | — | | | | — | | | | 12,909,613 | |
Information Technology | | | 90,180,410 | | | | — | | | | — | | | | 90,180,410 | |
Materials | | | 7,467,138 | | | | — | | | | — | | | | 7,467,138 | |
Real Estate | | | 6,905,174 | | | | — | | | | — | | | | 6,905,174 | |
Short-term Investments | | | 6,824,837 | | | | — | | | | — | | | | 6,824,837 | |
| | | | | | | | | | | | | | | $ | 259,190,459 | |
Marsico 21st Century Fund | | | | | | | | | | | | | | | | |
Assets | | | | | | | | | | | | | | | | |
Common Stocks | | | | | | | | | | | | | | | | |
Consumer Discretionary | | $ | 42,475,811 | | | $ | — | | | $ | — | | | $ | 42,475,811 | |
Consumer Staples | | | 19,936,825 | | | | — | | | | — | | | | 19,936,825 | |
Financials | | | 21,113,651 | | | | — | | | | — | | | | 21,113,651 | |
Health Care | | | 23,021,313 | | | | — | | | | — | | | | 23,021,313 | |
Industrials | | | 16,472,055 | | | | — | | | | — | | | | 16,472,055 | |
Information Technology | | | 74,697,172 | | | | — | | | | — | | | | 74,697,172 | |
Materials | | | 11,142,073 | | | | — | | | | — | | | | 11,142,073 | |
Real Estate | | | 9,892,389 | | | | — | | | | — | | | | 9,892,389 | |
Short-term Investments | | | 5,566,999 | | | | — | | | | — | | | | 5,566,999 | |
| | | | | | | | | | | | | | | $ | 224,318,288 | |
Marsico International Opportunities Fund | | | | | | | | | | | | | | | | |
Assets | | | | | | | | | | | | | | | | |
Common Stocks | | | | | | | | | | | | | | | | |
Consumer Discretionary | | $ | 14,073,281 | | | $ | — | | | $ | — | | | $ | 14,073,281 | |
Consumer Staples | | | 2,705,360 | | | | — | | | | — | | | | 2,705,360 | |
Financials | | | 5,992,524 | | | | — | | | | — | | | | 5,992,524 | |
Health Care | | | 5,976,061 | | | | — | | | | — | | | | 5,976,061 | |
Industrials | | | 5,166,743 | | | | — | | | | — | | | | 5,166,743 | |
Information Technology | | | 19,993,046 | | | | — | | | | — | | | | 19,993,046 | |
Short-term Investments | | | 888,728 | | | | — | | | | — | | | | 888,728 | |
| | | | | | | | | | | | | | | $ | 54,795,743 | |
49
| NOTES TO FINANCIAL STATEMENTS |
NOTES TO FINANCIAL STATEMENTS March 31, 2017 (Unaudited) (continued)
Fund Investments by
Major Security Type | | Level 1 | | | Level 2 | | | Level 3 | | | Total | |
Marsico Flexible Capital Fund | | | | | | | | | | | | |
Assets | | | | | | | | | | | | |
Common Stocks | | | | | | | | | | | | |
Consumer Discretionary | | $ | 39,747,384 | | | $ | — | | | $ | — | | | $ | 39,747,384 | |
Consumer Staples | | | 30,711,959 | | | | — | | | | — | | | | 30,711,959 | |
Financials | | | 14,996,349 | | | | — | | | | — | | | | 14,996,349 | |
Health Care | | | 24,426,263 | | | | — | | | | — | | | | 24,426,263 | |
Industrials | | | 32,947,621 | | | | — | | | | — | | | | 32,947,621 | |
Information Technology | | | 50,054,429 | | | | — | | | | — | | | | 50,054,429 | |
Real Estate | | | 9,851,891 | | | | — | | | | — | | | | 9,851,891 | |
Telecommunication Services | | | 4,605,610 | | | | — | | | | — | | | | 4,605,610 | |
Convertible Preferred Stocks | | | 3,476,450 | | | | — | | | | — | | | | 3,476,450 | |
Corporate Bonds | | | — | | | | 28,821,250 | | | | — | | | | 28,821,250 | |
Preferred Stocks | | | 10,033,037 | | | | — | | | | — | | | | 10,033,037 | |
Short-term Investments | | | 10,300,633 | | | | — | | | | — | | | | 10,300,633 | |
| | | | | | | | | | | | | | | $ | 259,972,876 | |
Marsico Global Fund | | | | | | | | | | | | | | | | |
Assets | | | | | | | | | | | | | | | | |
Common Stocks | | | | | | | | | | | | | | | | |
Consumer Discretionary | | $ | 10,099,289 | | | $ | — | | | $ | — | | | $ | 10,099,289 | |
Consumer Staples | | | 1,466,491 | | | | — | | | | — | | | | 1,466,491 | |
Financials | | | 1,024,780 | | | | — | | | | — | | | | 1,024,780 | |
Health Care | | | 4,353,167 | | | | — | | | | — | | | | 4,353,167 | |
Industrials | | | 1,051,937 | | | | — | | | | — | | | | 1,051,937 | |
Information Technology | | | 16,751,733 | | | | — | | | | — | | | | 16,751,733 | |
Materials | | | 284,585 | | | | — | | | | — | | | | 284,585 | |
Short-term Investments | | | 464,024 | | | | — | | | | — | | | | 464,024 | |
| | | | | | | | | | | | | | | $ | 35,496,006 | |
| | (b) | Expenses — The Funds are charged for those expenses that are directly attributable to each Fund, such as advisory and custodial fees. Expenses that are not directly attributable to a Fund are typically allocated among the Funds in proportion to their respective net assets and are in some cases allocated based on other factors. The Funds’ expenses may be reduced by advisory fee waivers, brokerage credits and uninvested cash balances earning interest or credits. Such credits are included in “Less waiver of expenses and expenses paid indirectly” on the Statements of Operations. |
Brokerage commissions may be paid to certain brokers which reduce transfer agent fees and expenses. For the six-month period ended March 31, 2017, the Funds received no such brokerage commission credits. The Funds received earnings credits on certain cash account balances which reduced transfer agent fees and expenses in the amount of $379, $180, $154, $38, $203 and $26 for the Focus Fund, Growth Fund, 21st Century Fund, International Opportunities Fund, Flexible Capital Fund, and Global Fund, respectively, for the six-month period ended March 31, 2017. Brokerage commission credits and earnings credits (if any) are included in “Less waiver of expenses and expenses paid indirectly” on the Statements of Operations.
| | (c) | Federal Income Taxes — Each Fund intends to comply with the requirements of the Internal Revenue Code of 1986, as amended (the “Internal Revenue Code”), necessary to continue to qualify as a regulated investment company and to make the requisite distributions of income to its shareholders which will be sufficient to relieve it from all or substantially all federal and state income taxes. Certain Funds may utilize earnings and profits on redemption of shares as part of the dividends paid deduction. |
| | (d) | Distributions to Shareholders — Dividends from net investment income and net realized capital gains, if any, will be declared and paid at least annually. Distributions to shareholders are recorded on the ex-dividend date. Each Fund may periodically make reclassifications among certain of its capital accounts as a result of the timing and characterization of certain income and capital gains distributions determined in accordance with federal tax regulations, which may differ from GAAP. These reclassifications are due to differing treatment for items such as foreign currency transactions, passive foreign investment companies and net investment losses. |
The Funds at times may invest in real estate investment trusts (“REITs”). REITs generally pay dividends to their investors based upon cash available from their operations and this amount may differ significantly from the REITs’ actual earnings and profits (“E&P”) determined for income tax purposes. It is common for these dividends to exceed the REITs’ taxable E&P, resulting in the excess portion of such dividends eventually being designated as a return of capital. Determination of the tax character of dividends made by REITs is
50
| NOTES TO FINANCIAL STATEMENTS |
typically performed by the REIT several months subsequent to the payment of the dividend. Therefore, due to timing issues, the Funds may be in a position of being required to calculate and pay required distribution amounts to their shareholders based on the best information available from the REITs, which may be prior to the final determination of the REITs’ taxable E&P, and it is possible that a portion of the Funds’ distribution amounts could include a return of capital to shareholders for federal income tax purposes.
| | (e) | Foreign Currency Translation — The accounting records of the Funds are maintained in US dollars. For valuation purposes, values of securities denominated in foreign currencies are translated into US dollars at 4:00 p.m. Eastern Time. Amounts related to the purchase and sale of foreign securities and investment income are translated at the rates of exchange prevailing on the respective dates of such transactions. |
Reported realized gains and losses on foreign currency transactions arise from sales of portfolio securities, forward foreign currency contracts, currency gains or losses realized between the trade and settlement dates on securities transactions, and the difference between the amounts of dividends, interest, and foreign withholding taxes recorded on the Funds’ books and the US dollar equivalent of the amounts actually received or paid.
The Funds do not isolate that portion of the results of operations resulting from changes in foreign exchange rates on investments from the fluctuations arising from changes in market prices of securities held at the end of the reporting period. Net unrealized appreciation or depreciation on investments and foreign currency translations arises from changes in the value of assets and liabilities, including investments in securities at the end of the reporting period, resulting from changes in the exchange rates and changes in market prices of securities held. Transactions in foreign-denominated assets may involve greater risks than domestic transactions, including currency risk, political and economic risk, regulatory risk and market risk.
| | (f) | Derivative Instruments — “Disclosure about Derivative Instruments and Hedging Activities” (the “Derivatives Statement”) requires enhanced disclosures about the Funds’ derivative and hedging activities, including how such activities are accounted for and their effects on the Funds’ financial position, performance and cash flows. |
The Funds are not intended as vehicles for investing substantially in derivative instruments, and may hold derivative instruments only infrequently. The Funds enter into derivative instruments in order to increase exposure to certain investments, asset classes, or markets, or for hedging purposes to hedge against adverse movements in securities prices, currency rates or interest rates. The Funds can hold various types of derivative instruments such as futures contracts and options on securities, financial indexes, and foreign currencies, options on futures, forward foreign currency contracts, interest rate swaps, credit default swaps, and swap-related products. The use of derivative instruments may involve risks such as the possibility of illiquid markets or imperfect correlation between the value of the derivative instruments and the underlying securities, or that the counterparty will fail to perform its obligations. There were no outstanding derivative instruments held by the Funds as of March 31, 2017 nor did the Funds utilize derivative instruments during the six-month period ended March 31, 2017.
Forward Foreign Currency Contracts — A forward currency contract is a commitment to purchase or sell foreign currency at a specified price on a future date. A Fund may enter into a forward foreign currency contract in order to hedge against foreign currency fluctuations, such as when the Fund elects to reduce exposure to changes in foreign currency exchange rates on foreign portfolio holdings denominated in or exposed to foreign currencies, or in preparation for purchasing securities in a particular market, or for other investment purposes.
The market value of a forward foreign currency contract fluctuates with changes in currency exchange rates. Outstanding forward foreign currency contracts are valued daily at current market rates and the resulting change in market value is recorded as unrealized appreciation or depreciation. When a forward foreign currency contract is settled, the Fund records a realized gain or loss equal to the difference between the value at the time the forward foreign currency contract was opened and the value at the time it was settled.
The Funds are subject to foreign currency exchange risk in the normal course of pursuing their investment objectives. Forward foreign currency contracts may involve market risk in excess of the unrealized gain or loss reflected on the Statements of Assets and Liabilities. In addition, the Funds could be exposed to a credit risk if the counterparties are unable or unwilling to meet the terms of the contracts or if the value of the foreign currency changes unfavorably. In connection with these contracts, the Funds typically segregate cash and/or other securities as collateral in a sufficient value equal to the aggregate amount of the Funds’ commitments under the forward foreign currency contracts; such collateral would be in the possession of the Funds’ custodian, if applicable.
Options Contracts — The Funds may purchase or write (sell) put and call options on foreign and domestic stock indices, foreign currencies, and US and foreign securities that are traded on a securities exchange or an over-the-counter market. These transactions
51
| NOTES TO FINANCIAL STATEMENTS |
NOTES TO FINANCIAL STATEMENTS March 31, 2017 (Unaudited) (continued)
are generally for hedging purposes or for the purpose of earning additional income. In addition, the Funds may enter into such transactions for cross-hedging purposes. There is generally limited counterparty credit risk involved when entering into exchange-traded option contracts because the exchange’s clearinghouse acts as counterparty to all options traded on such exchange.
In purchasing an option, a Fund pays a premium whether or not the option is exercised. Additionally, the Fund bears the risk of loss of premium and change in market value should the counterparty not perform under the contract. Put and call options purchased are accounted for in the same manner as portfolio securities. The cost of securities acquired through the exercise of call options is increased by premiums paid. The proceeds from securities sold through the exercise of put options are decreased by the premiums paid.
When a Fund writes an option, the premium received by the Fund is recorded as a liability and is subsequently adjusted to the current market value of the option written. Premiums received from writing options that expire are recorded by the Fund on the expiration date as realized gains from option transactions. The difference between the premium and the amount paid on effecting a closing purchase transaction, including brokerage commissions, is also treated as a realized gain, or if the premium is less than the amount paid for the closing purchase transaction, as a realized loss. If a call option is exercised, the premium is added to the proceeds from the sale of the underlying security or currency in determining whether the Fund has realized a gain or loss. If a put option is exercised, the premium reduces the cost basis of the security or currency purchased by the Fund. In writing an option, the Fund bears the market risk of an unfavorable change in the price of the security or currency underlying the written option. Exercise of an option written by the Fund could result in the Fund selling or buying a security or currency at a price different from the current market value.
| | (g) | Trustees’ Deferred Fee Plan — Effective February 1, 2000, the Board of Trustees adopted the Marsico Investment Fund Deferred Fee Plan (the “Deferred Fee Plan”), amended and restated as of December 30, 2005, which allows the Trustees to defer the receipt of all or a portion of their compensation received from the Funds. Any deferred fees are credited to accounts established on behalf of the Trustees into the Funds as directed by each Trustee. The amounts credited to these accounts increase or decrease in accordance with the performance of the Funds selected by the Trustees. The market value of the deferred account balances as of March 31, 2017 is shown on the Statements of Assets and Liabilities as part of an asset account, “Prepaid expenses and other assets”, and a liability account, “Accrued trustees’ fees”. Additionally, the fluctuation of the account balances due to the Funds’ performance is recorded by the Funds as unrealized appreciation (depreciation), which is shown as part of “Net unrealized appreciation on investments and foreign currency translations” on the Statements of Assets and Liabilities, and as compensation expense, which is shown as part of the expense account “Trustees’ fees and expenses” on the Statements of Operations. Fees earned and deferred by the Trustees for the six-month period ended March 31, 2017 are also included in “Trustees’ fees and expenses” on the Statements of Operations. Amounts contributed to the Deferred Fee Plan will be deferred until distributed in accordance with the Deferred Fee Plan. Unrealized appreciation (depreciation) of Fund shares held in the Deferred Fee Plan is subject to the Funds’ expense reimbursement agreement with the Adviser. |
| | (h) | Redemption Fee — Effective January 31, 2014, the Funds’ Board of Trustees approved the elimination of redemption fees from Fund share transactions placed on and after January 31, 2014. Prior to January 31, 2014, a 2.00% redemption fee was retained by the Funds to offset transaction costs and other expenses associated with short-term investing. The fee was imposed on certain redemptions or exchanges of shares held 30 days or less from their purchase date. Redemption fees were recorded by the Funds as a reduction of shares redeemed and as a credit to paid-in-capital. |
| | (i) | Other — Investment transactions are accounted for on a trade date basis. Each Fund determines the gain or loss realized from the investment transactions by comparing the original cost of the security lot sold with the net sale proceeds. Dividend income is recognized on the ex-dividend date. Certain dividends from foreign securities are recorded when the Funds are informed of the dividend if such information is obtained subsequent to the ex-dividend date. Interest income is recognized on an accrual basis and includes amortization of premiums and accretion of discounts. |
During the fiscal year ended September 30, 2016, the custodian reimbursed the Funds, including interest, for billing processing errors. The custodian paid (in thousands) $32, $31, $35, $116, $8, and $11 to the Focus Fund, Growth Fund, 21st Century Fund, International Opportunities Fund, Flexible Capital Fund, and Global Fund, respectively. These amounts are included in Paid-in-capital and Capital Share Transactions for each of the Funds. The amounts did not have a significant effect on each of the Fund’s total return.
| | (j) | Indemnifications — In the normal course of business, the Funds enter into contracts that contain provisions indemnifying other parties against specified potential liabilities. Each Fund’s maximum exposure under these arrangements is unknown as this would |
52
| NOTES TO FINANCIAL STATEMENTS |
involve future claims that may be made against the Fund that have not yet occurred. However, based on experience, the Funds expect the risk of loss in connection with these potential indemnification obligations to be remote. There can be no assurance that material liabilities related to such obligations will not arise in the future, which may adversely impact a Fund.
3. | Investment Advisory Agreement and Transactions With Affiliates |
Each Fund has an agreement with the Adviser to furnish investment advisory services to the Funds. Prior to December 1, 2015, the Adviser was compensated for managing the Focus Fund and the Growth Fund at the rate of 0.85% per year of average daily net assets up to $3 billion in each Fund, and 0.75% per year of average daily net assets exceeding $3 billion in each Fund; and at a rate of 0.85% of the average daily net assets of the 21st Century Fund, the International Opportunities Fund, the Flexible Capital Fund, and the Global Fund. As of December 1, 2015, each Fund pays the Adviser a fee calculated using the following, lower rates:
Annual Rate of Average Daily Net Assets | Asset Threshold |
0.80% | First $250 million |
0.75% | Next $250 million |
0.70% | Next $250 million |
0.65% | In excess of $750 million |
The Adviser has entered into a written expense limitation and fee waiver agreement under which it has agreed to limit the total expenses of each Fund (excluding interest, taxes, acquired fund fees and expenses, litigation, brokerage, and extraordinary expenses) to an annual rate of 1.60% of the average net assets of the Focus Fund, the International Opportunities Fund, the Flexible Capital Fund, and the Global Fund, and 1.50% of the average net assets of the Growth Fund and the 21st Century Fund until January 31, 2018. This expense limitation and fee waiver agreement may be terminated by the Adviser at any time after January 31, 2018, upon 15 days prior notice to the Fund and its administrator.
The Adviser may recoup from a Fund fees previously waived or expenses previously reimbursed by the Adviser with respect to that Fund pursuant to this agreement (or a previous expense limitation agreement) if: (1) such recoupment by the Adviser does not cause the Fund, at the time of recoupment, to exceed the lesser of (a) the expense limitation in effect at the time the relevant amount was waived and/or reimbursed, or (b) the expense limitation in effect at the time of the proposed recoupment, and (2) the recoupment is made within three fiscal years after the end of the fiscal year in which the amount was waived or reimbursed. As of March 31, 2017, recoupment amounts (in thousands) that may potentially be made by the International Opportunities Fund and Global Fund to the Adviser are as follows:
Year of Expiration | | International
Opportunities Fund | | | Global Fund | |
2017 | | $ | — | | | $ | 47 | |
2018 | | | 32 | | | | — | |
2019 | | | 128 | | | | 53 | |
2020 | | | 70 | | | | 48 | |
| | | $ | 230 | | | $ | 148 | |
Certain officers of the Trust are also officers of the Adviser. The Funds pay a portion of the Chief Compliance Officer’s total compensation costs which is shown as part of the expense account “Professional fees” on the Statements of Operations. No other officers of the Trust received compensation from the Funds during the six-month period ended March 31, 2017.
4. | Distribution and Service Plan |
The Funds have adopted a Distribution and Service Plan (the “Plan”) pursuant to Rule 12b-1 under the 1940 Act. The Plan authorizes payments by the Funds in connection with the distribution of their shares at an annual rate, as determined from time to time by the Board of Trustees, of up to 0.25% of a Fund’s average daily net assets. Payments may be made by the Funds under the Plan for the purpose of financing any activity primarily intended to result in the sale of shares of the Funds, as determined by the Board of Trustees, as well as for account maintenance and personal services to shareholders and any other non-distribution-related services. The Adviser may, out of its own resources (which may include legitimate profits from providing advisory services to the Funds or other clients) and at its sole discretion, make certain payments on behalf of the Funds or the Plan for expenses incurred by a Fund for distribution of Fund shares and related services or for administrative or other expenses incurred by the Fund. The Plan was also amended in
53
| NOTES TO FINANCIAL STATEMENTS |
NOTES TO FINANCIAL STATEMENTS March 31, 2017 (Unaudited) (continued)
November 2016 to reflect certain non-material changes, which were intended to clarify the types of non-distribution expenses that may be paid for through 12b-1 fees under the Plan. For the six-month period ended March 31, 2017, there were no non-distribution expenses paid for through 12b-1 fees under the Plan.
5. | Investment Transactions |
The aggregate purchases and sales of securities, excluding short-term investments, for the Funds for the six-month period ended March 31, 2017, were as follows:
(Amounts in thousands) | | Focus
Fund | | | Growth
Fund | | | 21st
Century
Fund | | | International
Opportunities
Fund | | | Flexible
Capital
Fund | | | Global
Fund | |
Purchases | | $ | 199,560 | | | $ | 76,317 | | | $ | 37,962 | | | $ | 29,796 | | | $ | 16,372 | | | $ | 15,601 | |
Sales | | $ | 309,212 | | | $ | 104,927 | | | $ | 68,150 | | | $ | 39,033 | | | $ | 118,919 | | | $ | 22,832 | |
There were no purchases or sales of US government securities, excluding short-term investments.
6. | Federal Income Tax Information |
“Accounting for Uncertainty in Income Taxes” (the “Income Tax Statement”) requires an evaluation of tax positions taken (or expected to be taken) in the course of preparing a Fund’s tax returns to determine whether these positions meet a “more-likely-than-not” standard that, based on the technical merits, have a more than fifty percent likelihood of being sustained by a taxing authority upon examination. A tax position that meets the “more-likely-than-not” recognition threshold is measured to determine the amount of benefit to recognize in the financial statements. The Funds recognize interest and penalties, if any, related to unrecognized tax benefits as income tax expense in the Statements of Operations.
The Income Tax Statement requires management of the Funds to analyze all open tax years, fiscal years 2013-2017 as defined by Internal Revenue Service (“IRS”) statute of limitations for all major jurisdictions, including federal tax authorities and certain state tax authorities. As of and during the six-month period ended March 31, 2017, the Funds did not have any liabilities for any unrecognized tax benefits. The Funds have no examinations in progress and are not aware of any tax positions for which it is reasonably possible that the total amounts of unrecognized tax benefits will significantly change in the next twelve months.
At March 31, 2017, gross unrealized appreciation and depreciation of investments, based on cost for federal income tax purposes were as follows:
(Amounts in thousands) | | Focus
Fund | | | Growth
Fund | | | 21st
Century
Fund | | | International
Opportunities
Fund | | | Flexible
Capital
Fund | | | Global
Fund | |
Cost of Investments | | $ | 400,691 | | | $ | 200,917 | | | $ | 167,207 | | | $ | 46,318 | | | $ | 208,727 | | | $ | 27,785 | |
| | | | | | | | | | | | | | | | | | | | | | | | | |
Gross Unrealized Appreciation | | $ | 122,761 | | | $ | 58,342 | | | $ | 60,293 | | | $ | 9,116 | | | $ | 51,312 | | | $ | 7,898 | |
Gross Unrealized Depreciation | | | (1,505 | ) | | | (69 | ) | | | (3,182 | ) | | | (638 | ) | | | (66 | ) | | | (187 | ) |
| | | | | | | | | | | | | | | | | | | | | | | | | |
Net Unrealized Appreciation on Investments | | $ | 121,256 | | | $ | 58,273 | | | $ | 57,111 | | | $ | 8,478 | | | $ | 51,246 | | | $ | 7,711 | |
The difference between cost amounts for financial statement and federal income tax purposes is due primarily to wash sale loss deferrals.
At September 30, 2016, for federal income tax purposes, the Funds had accumulated capital loss carryforwards as follows:
(Amounts in thousands) | | Focus
Fund | | | Growth
Fund | | | 21st
Century
Fund | | | International
Opportunities
Fund | | | Flexible
Capital
Fund | | | Global
Fund | |
For losses expiring September 30, | | | | | | | | | | | | | | | | | | |
2017 | | $ | — | | | $ | — | | | $ | 25,304 | | | $ | 8,008 | | | $ | — | | | $ | — | |
2018 | | | — | | | | — | | | | 390,537 | | | | 93,558 | | | | — | | | | — | |
Not Subject to Expiration | | | 988 | | | | — | | | | 1,995 | | | | 811 | | | | — | | | | 416 | |
| | | $ | 988 | | | $ | — | | | $ | 417,836 | | | $ | 102,377 | | | $ | — | | | $ | 416 | |
54
| NOTES TO FINANCIAL STATEMENTS |
To the extent that a Fund may realize future net capital gains, those gains will be offset by any of its unused capital loss carryforward. Future capital loss carryforward utilization in any given year may be subject to Internal Revenue Code limitations.
The Funds are permitted to carryforward capital losses incurred in taxable years beginning after December 22, 2010 for an unlimited period, and such capital losses will retain their character as either short-term or long-term capital losses. Capital losses incurred by the Funds in taxable years beginning before December 23, 2010 may only be carried forward eight taxable years as short-term capital losses.
As of September 30, 2016, the Focus Fund, Growth Fund, 21st Century Fund, International Opportunities Fund, Flexible Capital Fund, and Global Fund, respectively, had (in thousands) $3,193, $1,522, $1,893, $151, $0 and $173 of qualified late-year losses, which are deferred until fiscal year 2017 for tax purposes. Net late-year losses incurred after December 31st, and within the taxable year, are deemed to arise on the first day of the Fund’s next taxable year.
As of September 30, 2016, the components of accumulated earnings (deficit) on a tax basis were as follows:
(Amounts in thousands) | | Focus
Fund | | | Growth
Fund | | | 21st
Century
Fund | | | International
Opportunities
Fund | | | Flexible
Capital
Fund | | | Global
Fund | |
Undistributed Ordinary Income | | $ | — | | | $ | — | | | $ | — | | | $ | — | | | $ | 3,268 | | | $ | — | |
Undistributed Trustees' Deferred Compensation | | | (1,971 | ) | | | (1,187 | ) | | | (835 | ) | | | (313 | ) | | | (920 | ) | | | (359 | ) |
Undistributed Long-Term Capital Gains | | | — | | | | 2,135 | | | | — | | | | — | | | | 21,402 | | | | — | |
Tax Accumulated Earnings (Deficit) | | | (1,971 | ) | | | 948 | | | | (835 | ) | | | (313 | ) | | | 23,750 | | | | (359 | ) |
Accumulated Capital and Other Losses | | | (4,181 | ) | | | (1,522 | ) | | | (419,729 | ) | | | (102,528 | ) | | | — | | | | (589 | ) |
Net Unrealized Appreciation on Investments and on Foreign Currency Translations | | | 145,701 | | | | 61,167 | | | | 58,807 | | | | 9,516 | | | | 61,669 | | | | 8,451 | |
Trustees' Deferred Compensation Mark-to-Market | | | 579 | | | | 307 | | | | 147 | | | | 38 | | | | 613 | | | | 49 | |
Total Accumulated Earnings (Deficit) | | $ | 140,128 | | | $ | 60,900 | | | $ | (361,610 | ) | | $ | (93,287 | ) | | $ | 86,032 | | | $ | 7,552 | |
Undistributed ordinary income consists of net investment income and timing differences related to qualified late-year losses.
The tax character of distributions paid during the fiscal years ended September 30, 2016 and 2015 was as follows:
| | | 2016 | | | 2015 | |
(Amounts in thousands) | | Ordinary Income | | | Long-Term Capital Gains | | | Ordinary Income | | | Long-Term Capital Gains | |
Focus Fund | | $ | — | | | $ | 157,703 | | | $ | 17,276 | | | $ | 106,806 | |
Growth Fund | | | — | | | | 111,369 | | | | 11,035 | | | | 52,595 | |
21st Century Fund | | | — | | | | — | | | | — | | | | — | |
International Opportunities Fund | | | — | | | | — | | | | — | | | | — | |
Flexible Capital Fund | | | 3,373 | | | | 64,551 | | | | 11,186 | | | | 61,016 | |
Global Fund | | | — | | | | 6,835 | | | | 1,487 | | | | 6,923 | |
The tax character of dividends paid may differ from that shown in the Statements of Changes in Net Assets due to short-term gains being treated as ordinary income for tax purposes.
Management of the Adviser has determined that there were no material subsequent events that would require disclosure in the Funds’ financial statements.
55
EXPENSE EXAMPLE For the six-month period ended March 31, 2017 (Unaudited)
As a shareholder of the Marsico Funds (the “Funds”), you incur two types of costs: (1) transaction costs, including redemption fees (if any), and (2) ongoing costs, including management fees, distribution (12b-1) fees, and other Fund expenses. This Example is intended to help you understand your ongoing costs (in dollars) of investing in the Funds and to compare these costs with the ongoing costs of investing in other mutual funds.
The Example is based on an investment of $1,000 invested at the beginning of the period and held for the entire period from October 1, 2016 to March 31, 2017 (the “period”).
Actual Expenses
The first line of the table below provides information about actual account values and actual expenses. You may use the information in this line, together with the amount you invested, to estimate the expenses you paid over the period. Simply divide your account value by $1,000 (for example, an $8,600 account value divided by $1,000 equals 8.6), then multiply the result by the number in the first line under the heading entitled “Expenses paid for the six-month period ended March 31, 2017” to estimate the expenses you paid on your account during the period.
Hypothetical Example for Comparison Purposes
The second line of the table below provides information about hypothetical account values and hypothetical expenses based on the Funds’ actual expense ratios and an assumed rate of return of 5% per year before expenses, which is not the actual return of any of the Funds. The hypothetical account values and expenses may not be used to estimate the actual ending account balance or expenses you paid for the period. You may use this information to compare the ongoing costs of investing in the Funds and other funds. To do so, compare this 5% hypothetical example with the 5% hypothetical examples that appear in the shareholder reports of other funds.
Please note that the expenses shown in the table are meant to highlight your ongoing costs only and do not reflect any transactional costs such as redemption fees (if any). Therefore, the second line of the table is useful in comparing the ongoing costs only, and will not help you determine the relative total costs of owning different funds. In addition, if these transactional costs (if any) were included, your costs could have been higher.
Expenses Paid During the Period | Beginning
account value
October 1, 2016 | Ending
account value
March 31, 2017 | Expenses paid for the
six-month period ended
March 31, 2017(1) |
FOCUS FUND | | | |
Actual Example | $ 1,000.00 | $ 1,058.90 | $ 7.13 |
Hypothetical Example, assuming a 5% return before expenses | $ 1,000.00 | $ 1,018.08 | $ 6.98 |
| | | | |
GROWTH FUND | | | |
Actual Example | $ 1,000.00 | $ 1,053.10 | $ 7.41 |
Hypothetical Example, assuming a 5% return before expenses | $ 1,000.00 | $ 1,017.78 | $ 7.28 |
| | | | |
21st CENTURY FUND | | | |
Actual Example | $ 1,000.00 | $ 1,069.40 | $ 7.46 |
Hypothetical Example, assuming a 5% return before expenses | $ 1,000.00 | $ 1,017.79 | $ 7.28 |
| | | | |
INTERNATIONAL OPPORTUNITIES FUND | | | |
Actual Example | $ 1,000.00 | $ 1,012.10 | $ 8.03 |
Hypothetical Example, assuming a 5% return before expenses | $ 1,000.00 | $ 1,017.02 | $ 8.05 |
| | | | |
FLEXIBLE CAPITAL FUND | | | |
Actual Example | $ 1,000.00 | $ 1,026.90 | $ 7.57 |
Hypothetical Example, assuming a 5% return before expenses | $ 1,000.00 | $ 1,017.53 | $ 7.54 |
| | | | |
GLOBAL FUND | | | |
Actual Example | $ 1,000.00 | $ 1,037.40 | $ 8.13 |
Hypothetical Example, assuming a 5% return before expenses | $ 1,000.00 | $ 1,017.02 | $ 8.05 |
(1) | Expenses are equal to the Funds’ annualized expense ratios (1.39% for the Focus Fund, 1.45% for the Growth Fund, 1.45% for the 21st Century Fund, 1.60% for the International Opportunities Fund, 1.50% for the Flexible Capital Fund, and 1.60% for the Global Fund), multiplied by the average account value over the period, multiplied by 182/365 (to reflect the six-month period). |
56
| CONSIDERATION OF INVESTMENT ADVISORY AGREEMENTS |
CONSIDERATION OF INVESTMENT ADVISORY AGREEMENTS (Unaudited)
At a meeting of the Board of Trustees of the Trust held on November 16, 2016, the Trustees, by a unanimous vote (including a separate vote of those Trustees who are not “interested persons” (as the term is defined in the 1940 Act) of the Trust (the “Independent Trustees”)), approved the renewal of the Investment Advisory and Management Agreements for the Focus Fund, Growth Fund, 21st Century Fund, International Opportunities Fund, Flexible Capital Fund, and Global Fund (the “Agreements”). In advance of the meeting, the Independent Trustees requested and received extensive materials from the Marsico Capital Management, LLC (the “Adviser” or “MCM”) to assist them in considering the renewal of the Agreements. The materials provided by the Adviser contained information with respect to the factors noted below, including detailed information relating to the performance, advisory fees and other expenses of the Funds, other funds sub-advised by the Adviser and non-fund advisory accounts of the Adviser. The materials also included comparisons of the Funds with third party funds of similar size and investment objectives in terms of performance, fees and other expenses, as well as the performance of each Fund versus its benchmark. In addition, the Adviser provided information regarding its overall expenses and profitability, as well as other information requested by the Trustees.
In addition to the materials prepared specifically for contract review analysis, on an ongoing basis the Trustees receive information and reports from the Adviser and other service providers to the Funds regarding the investment performance of the Funds as well as operational, compliance, marketing and other matters.
The Trustees engaged in a detailed discussion of the materials with management of the Adviser. The Independent Trustees then met separately with independent counsel to the Independent Trustees for a full review of the materials. Following this session, the full Board reconvened and approved the continuation of the Agreements for the Focus Fund, Growth Fund, 21st Century Fund, International Opportunities Fund, Flexible Capital Fund, and Global Fund.
Discussion of Certain Factors Considered
1. Nature, Extent, and Quality of Services.
The Independent Trustees considered the nature, quality and extent of the services performed by the Adviser under the Investment Advisory Agreements (the “Advisory Agreements”) with the Adviser, including portfolio management, supervision of Fund operations, regulatory filings and disclosures to shareholders, compliance functions, general oversight of other service providers, review of Fund legal issues, and other services. The Independent Trustees also considered the personnel who provide these services, which includes a team of individuals collectively having years of experience in their particular areas of expertise. The Independent Trustees reviewed the Adviser’s investment philosophy and experience, noting that the Adviser and its affiliates employ a focused stock-picking strategy that involves extensive research. The Independent Trustees discussed the Adviser’s ability to continue to provide the same level and quality of services to the Funds, and discussed with members of management of MCM the financial condition of the Adviser and its ability to attract and retain experienced personnel. The Independent Trustees considered the reinvestment in MCM by Mr. T. Marsico and the steps taken to ensure the financial viability of the Adviser, including the extinguishment of debt to third parties and elimination of most of MCM’s overall debt. The Independent Trustees also discussed MCM’s commitment to devoting substantial resources to the Adviser’s investment management process, including investment research and the exploration of the use of various analytical tools to assist in management of the Funds’ portfolios. The Independent Trustees concluded that the services are extensive in nature, that the Adviser employs investment advisory personnel who consistently delivered a high level of service and that, with respect to third party service providers, the Adviser effectively manages the outsourcing by the Funds of certain services to other service providers and the oversight of those service providers.
2. Investment Performance of the Funds and Adviser.
The Independent Trustees considered short-term and long-term investment performance for each Fund over various periods of time as compared to both relevant equity indices and the performance of each Fund’s Lipper, Inc. peer group universe. The Independent Trustees discussed with representatives of the Adviser the factors underlying the performance of the Funds over various time periods. The Independent Trustees discussed with representatives of MCM actions the Adviser may pursue to enhance performance, including repositioning of certain Funds and refinement of the investment process and other actions that could be taken in the event of consistent under-performance. The Independent Trustees reviewed the performance of the Funds in the context of the long-term investment strategies being pursued by the Funds. In addition to reviewing performance information of comparable funds, the Independent Trustees took into account that they regularly review each Fund’s performance.
The Independent Trustees considered the Adviser’s substantial investment advisory experience and capabilities. The Independent Trustees noted MCM’s continued investment in research and the potential use of other analytical tools. The Independent Trustees noted that the investment performance delivered by the Adviser to the Funds appeared to be generally consistent with the performance delivered for other clients of the Adviser with similar strategies. Based on this review, the Independent Trustees concluded that the performance of the Adviser
57
| CONSIDERATION OF INVESTMENT ADVISORY AGREEMENTS |
CONSIDERATION OF INVESTMENT ADVISORY AGREEMENTS (Unaudited) (continued)
with respect to each Fund was acceptable for the purposes of approving the Advisory Agreements, but that the Independent Trustees would continue to monitor performance.
3. Costs of Services and Profits Realized by the Adviser.
(a) Costs of Services to Funds: Fees and Expenses. The Independent Trustees considered each Fund’s management fee rates and expense ratios relative to industry averages for the Fund’s benchmark category and the advisory fees charged by the Adviser to other sub-advised funds and non-fund clients, including information regarding expense limitation commitments from the Adviser, and the breakpoints in the advisory fee schedule for all of the Funds. The Independent Trustees noted the information provided by MCM stated that the mix of services under the Advisory Agreements are much more extensive than those under the Adviser’s advisory agreements for sub-advised funds and non-fund clients. The Independent Trustees also noted previous actions taken by MCM to reduce Fund expenses, including that MCM had waived fees and absorbed expenses from time to time, and that some of those expenditures may not be recouped. The Trustees considered certain actions taken by MCM, including the advisory fee reductions discussed below, and MCM’s continuing commitment to review all aspects of the Funds to identify areas where costs or expenses may be reduced in the coming year. It was noted that on December 1, 2015, as requested by the Independent Trustees, the Adviser implemented reduced fees and new breakpoints for the management fee rates of all of the Funds resulting in overall reductions in the management fee rates. The Independent Trustees reviewed various expense information and noted that the lower management fee rates and breakpoints reduced advisory fees and as such were a positive factor in maintaining overall Fund expenses in a range that continues to be reasonable. The Independent Trustees concluded that the investment advisory fees are acceptable based upon the qualifications, experience, reputation, and performance of the Adviser and the overall expense ratios of the Funds.
(b) Profitability and Costs of Services to Adviser. The Independent Trustees reviewed the information provided by MCM regarding its overall profitability and costs and an estimate (which utilized a revenue-based expense allocation model) of the Adviser’s profitability and costs in serving the Funds as part of MCM’s overall investment management business serving many clients. The Independent Trustees noted that MCM’s fee revenue from the Funds had decreased in 2016 as a result of lower net assets and the lower investment advisory fee rates which became effective December 1, 2015, and that MCM had not reduced its services, but continued to devote substantial resources and personnel to the Funds. The Independent Trustees also considered that MCM and its affiliates had recently completed a debt restructuring through an affiliated party that retired all debt to third parties and eliminated most of the overall debt, noting that these actions further strengthened MCM’s overall financial position. The Independent Trustees also noted that the Adviser previously had substantially increased its resources devoted to Fund matters in response to regulatory requirements enacted in prior years. The Independent Trustees discussed the level of estimated profit of MCM from its relationship to the Funds and considered profitability levels reviewed by federal courts that were found to be reasonable. The Independent Trustees concluded that the estimated profits received by the Adviser under the Advisory Agreements were acceptable for purposes of approving the Advisory Agreements.
4. Extent of Economies of Scale as Funds Grow.
The Independent Trustees considered whether there have been economies of scale with respect to the management of each Fund and whether such Fund has appropriately benefited from any economies of scale. The Independent Trustees noted that economies of scale may develop for certain Funds as their assets increase and their Fund-level expenses decline as a percentage of assets, but that Fund-level economies of scale may not necessarily result in Adviser-level economies of scale. It was reported to the Independent Trustees that the resources devoted by the Adviser relating to management of the Funds previously had increased substantially in prior years, and that the average net asset levels of each of the Funds had decreased over the past year. The Independent Trustees agreed that it was possible that if trends changed and Fund assets began growing again beyond certain thresholds, Adviser-level expenses incurred in managing the Funds eventually could level off or decline as a percentage of management fees in the future, potentially resulting in economies of scale. The Independent Trustees noted that should economies of scale be realized in the future, the advisory fee schedule contains breakpoints that would benefit shareholders of the Funds as assets increase.
5. Whether Fee Levels Reflect Economies of Scale.
The Independent Trustees also considered whether the management fee rate is reasonable in relation to the asset size of each Fund and any economies of scale that may exist. The Independent Trustees noted that, at the request of the Independent Trustees, lower management fee rates and breakpoints had been introduced for all of the Funds effective December 1, 2015. The Independent Trustees noted that MCM agreed to the breakpoints and a fee reduction in an effort to maintain overall Fund expenses in a range that continues to be reasonable. The Independent Trustees also took note that the Adviser also intended to renew the voluntary fund expense limitations for each of the Funds until at least January 31, 2018, all subject to possible future recoupment of previously waived fees or other expenses under certain conditions.
58
| CONSIDERATION OF INVESTMENT ADVISORY AGREEMENTS |
6. Other Relevant Considerations.
The Independent Trustees considered the character and amount of other incidental benefits received by the Adviser and its affiliates from its association with the Funds. The Independent Trustees concluded that potential “fall-out” benefits that the Adviser may receive, such as greater name recognition or increased ability to obtain research or brokerage services, appear to be reasonable, and may in some cases benefit the Funds.
Conclusions
In considering the Advisory Agreements, the Independent Trustees did not identify any factor as all-important or all-controlling and instead considered these factors collectively in light of each Fund’s surrounding circumstances. Based on this review, it was the judgment of the Independent Trustees that each Fund’s fees were reasonable, the extent and quality of services were acceptable and performance of the Funds was acceptable. Therefore, re-approval of the Advisory Agreements was in the best interests of each Fund and its shareholders. As a part of their decision-making process, the Independent Trustees noted that the Adviser has managed the Funds since their inception, and the Independent Trustees believe that a long-term relationship with a capable, conscientious adviser is in the best interests of the Funds and their shareholders. The Independent Trustees considered, generally, that shareholders invested in a Fund knowing that the Adviser managed that Fund and knowing its investment management fee. As such, the Independent Trustees considered whether the Adviser managed each Fund in accordance with its investment objectives and policies as disclosed to shareholders. Additionally, as part of its deliberations, the Board also considered and relied upon the information about the Funds and MCM that had been provided to them throughout the year in connection with their regular Board meetings at which they engage in the ongoing oversight of the Funds and their operations.
Upon conclusion of their review and discussion, the Trustees, including all of the Independent Trustees, unanimously agreed the Advisory Agreements for each of the Funds should be continued.
59
OTHER INFORMATION (Unaudited)
Proxy Voting Guidelines
The Funds exercise the voting rights associated with the securities held by the Funds under the proxy voting policy of the Funds. A description of those policies and procedures of the Funds and a record of the Funds’ proxy votes for the one-year period ended June 30, 2016 are available without charge, upon request, by calling 888-860-8686. It is also available on the Securities and Exchange Commission’s (SEC) website at www.sec.gov.
Quarterly Filing of Portfolio Holdings
The Funds will file their complete schedule of investments with the SEC for the first and third quarters of each fiscal year on Form N-Q. The Funds’ Form N-Q will be available (i) on the SEC’s website at www.sec.gov; (ii) at the SEC’s Public Reference Room; and (iii) by calling 800-SEC-0330.
Cost Basis Information
Federal law requires mutual fund companies to maintain a shareholder’s cost basis by tax lot and report gain/loss information and holding periods for sales of mutual fund shares that are “covered” securities to the IRS and to shareholders on Form 1099. Mutual fund shares, such as shares of the Funds, acquired on or after January 1, 2012 are covered securities. The Funds are not responsible for maintaining and reporting share information for their shares that are not deemed “covered.”
The tax regulations require that the Funds elect a default tax identification methodology in order to perform the required reporting. The Funds have chosen the first-in-first-out (“FIFO”) method as the default tax lot identification method for its shareholders. This is the method the Funds will use to determine which specific shares are deemed to be sold when a shareholder’s entire position is not sold in a single transaction and is the method in which “covered” share sales will be reported on a shareholder’s Form 1099.
However, at the time of purchase or upon the sale of “covered” shares, shareholders may generally choose a different tax lot identification method. Shareholders should consult a tax advisor with regard to their personal circumstances as the Funds and their service providers do not provide tax advice.
60
Not applicable to semi-annual reports.
| Item 3. | Audit Committee Financial Expert |
Not applicable to semi-annual reports.
| Item 4. | Principal Accountant Fees and Services |
Not applicable to semi-annual reports.
| Item 5. | Audit Committee of Listed Registrants |
Not applicable.
| Item 6. | Schedule of Investments |
The schedule of investments in securities of unaffiliated issuers is included as part of the report to shareholders filed under Item 1.
| Item 7. | Disclosure of Proxy Voting Policies and Procedures for Closed-End Management Investment Companies |
Not applicable.
| Item 8. | Portfolio Managers of Closed-End Management Investment Companies |
Not applicable.
| Item 9. | Purchases of Equity Securities by Closed-End Management Investment Company and Affiliated Purchasers |
Not applicable.
| Item 10. | Submission of Matters to a Vote of Security Holders |
Not applicable.
| Item 11. | Controls and Procedures. |
(a) The registrant's principal executive officer and principal financial officer have concluded that the registrant's disclosure controls and procedures (as defined in Rule 30a-3(c) under the Investment Company Act of 1940, as amended) are effective based on their evaluation of these disclosure controls and procedures within 90 days of the filing date of this report on Form N-CSR.
(b) There were no changes in the registrant's internal control over financial reporting (as defined in Rule 30a-3(d) under the Investment Company Act of 1940, as amended) that occurred during the second fiscal quarter of the period covered by this report that has materially affected, or is reasonably likely to materially affect, the registrant's internal control over financial reporting.
(a)(1) Code of Ethics
Not applicable to semi-annual reports.
(a)(2) Certification for each principal executive and principal financial officer of the registrant as required by Rule 30a-2(a) under the Act (17 CFR 270.30a-2(a)). Filed as an attachment to this filing.
(a)(3) Any written solicitation to purchase securities under Rule 23c-1 under the Investment Company Act of 1940, as amended, that was sent or given during the period covered by the report by or on behalf of the registrant to 10 or more persons.
Not applicable.
(b) Certifications required by Rule 30a-2(b) under the Act (17 CFR 270.30a-2(b)), Rule 13a-14(b) or Rule 15d-14(b) under the Exchange Act (17 CFR 240.13a-14(b) or 240.15d-14(b)), and Section 1350 of Chapter 63 of Title 18 of the United States Code (18 U.S.C. 1350). Filed as an attachment to this filing.
SIGNATURES
Pursuant to the requirements of the Securities Exchange Act of 1934 and the Investment Company Act of 1940, the registrant has duly caused this report to be signed on its behalf by the undersigned, thereunto duly authorized.
The Marsico Investment Fund
| By: | /s/ Christopher J. Marsico | |
| | Christopher J. Marsico, | |
| | Executive Vice President and Chief Operating Officer | |
| | | |
| Date: | June 7, 2017 | |
Pursuant to the requirements of the Securities Exchange Act of 1934 and the Investment Company Act of 1940, this report has been signed below by the following persons on behalf of the registrant and in the capacities and on the dates indicated.
| By: | /s/ Christopher J. Marsico | |
| | Christopher J. Marsico, | |
| | Executive Vice President and Chief Operating Officer | |
| | | |
| Date: | June 7, 2017 | |
| | | |
| By: | /s/ Neil L. Gloude | |
| | Neil L. Gloude, | |
| | Vice President, Secretary and Treasurer | |
| | | |
| Date: | June 7, 2017 | |