UNITED STATES
SECURITIES AND EXCHANGE COMMISSION
Washington, D.C. 20549
FORM N-CSR
CERTIFIED SHAREHOLDER REPORT OF REGISTERED
MANAGEMENT INVESTMENT COMPANIES
Investment Company Act file number 811-08397
The Marsico Investment Fund
(Exact name of Registrant as specified in charter)
1200 17th Street, Suite 1600
Denver, Colorado 80202
(Address of principal executive offices) (Zip code)
Christopher J. Marsico
The Marsico Investment Fund
1200 17th Street, Suite 1600
Denver, Colorado 80202
(Name and address of agent for service)
Copies to:
Anthony H. Zacharski
Dechert LLP
90 State House Square
Hartford, CT 06103
Registrant's telephone number, including area code: (303) 454-5600
Date of fiscal year end: September 30
Date of reporting period: March 31, 2016
Item 1. Reports to Stockholders
DEAR SHAREHOLDER:
Enclosed is your semi-annual report for The Marsico Investment Fund, encompassing the six-month fiscal period from October 1, 2015 to March 31, 2016.
The purpose of this report is to provide a review of the Marsico Funds’ six-month investment results by discussing what we believe were the main areas that impacted performance – including the macroeconomic environment, sector and industry positioning, and individual stock selection – as compared to the Funds’ performance benchmark indexes. For updated information regarding the market environment and the Funds’ overall investment postures and performance, please refer to the Funds’ most recent monthly fact sheets and quarterly investment updates, which are available in the Investor Resources section of the Funds’ website at marsicofunds.com.(1)
(1) | The references to the Marsico Funds website (marsicofunds.com) included throughout this semi-annual report do not incorporate the website’s contents into this report. |
| | KEY FUND STATISTICS | 2 | |
| | MARKET ENVIRONMENT | 5 | |
| | | | |
| | MARSICO FOCUS FUND |
| | Investment Review | 6 | |
| | Fund Overview | 9 | |
| | Schedule of Investments | 10 | |
| | | | |
| | MARSICO GROWTH FUND |
| | Investment Review | 11 | |
| | Fund Overview | 14 | |
| | Schedule of Investments | 15 | |
| | | | |
| | MARSICO 21st CENTURY FUND |
| | Investment Review | 16 | |
| | Fund Overview | 18 | |
| | Schedule of Investments | 19 | |
| | | | |
| | MARSICO INTERNATIONAL OPPORTUNITIES FUND |
| | Investment Review | 21 | |
| | Fund Overview | 24 | |
| | Schedule of Investments | 25 | |
| | | | |
| | MARSICO FLEXIBLE CAPITAL FUND |
| | Investment Review | 27 | |
| | Fund Overview | 29 | |
| | Schedule of Investments | 30 | |
| | | | |
| | MARSICO GLOBAL FUND |
| | Investment Review | 32 | |
| | Fund Overview | 35 | |
| | Schedule of Investments | 36 | |
| | | | |
| | FINANCIAL STATEMENTS | 38 | |
| | NOTES TO FINANCIAL STATEMENTS | 48 | |
| | EXPENSE EXAMPLE | 56 | |
| | CONSIDERATION OF INVESTMENT ADVISORY AGREEMENTS | 57 | |
| | OTHER INFORMATION | 60 | |
1
KEY FUND STATISTICS (UNAUDITED) |
Marsico Focus Fund | Marsico Growth Fund | Marsico 21st Century
Fund |
MFOCX | MGRIX | MXXIX |
For additional disclosures, please see page 9. | For additional disclosures, please see page 14. | For additional disclosures, please see page 18. |
PERFORMANCE COMPARISON(1) | PERFORMANCE COMPARISON(1) | PERFORMANCE COMPARISON(1) |
| 
| 
|
TOTAL ANNUAL OPERATING EXPENSES* 1.19% | TOTAL ANNUAL OPERATING EXPENSES* 1.27% | TOTAL ANNUAL OPERATING EXPENSES* 1.33% |
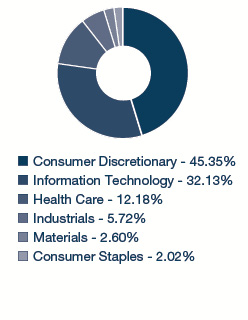
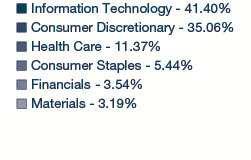
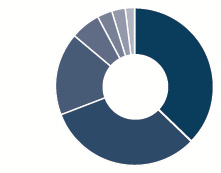
SECTOR ALLOCATION(2) | SECTOR ALLOCATION(2) | SECTOR ALLOCATION(2) |
|  | 
|
TOP FIVE HOLDINGS | TOP FIVE HOLDINGS | TOP FIVE HOLDINGS |
| FACEBOOK, INC. - CL. A | 10.51% | FACEBOOK, INC. - CL. A | 8.37% | FACEBOOK, INC. - CL. A | 6.04% |
| ALPHABET, INC. - CL. A | 8.12% | ALPHABET, INC. - CL. A | 7.29% | DOMINO'S PIZZA, INC. | 4.28% |
| VISA, INC. - CL. A | 7.14% | SALESFORCE.COM, INC. | 5.19% | CONSTELLATION BRANDS, INC. - CL. A | 4.06% |
| NIKE, INC. - CL. B | 5.73% | STARBUCKS CORPORATION | 4.88% | SALESFORCE.COM, INC. | 3.92% |
| CHIPOTLE MEXICAN GRILL, INC. | 5.67% | VISA, INC. - CL. A | 4.63% | AMAZON.COM, INC. | 3.83% |
For additional disclosures about the Marsico Funds, please see page 4. The performance data quoted here represent past performance, and past performance is not a guarantee of future results. Investment return and principal value of an investment will fluctuate so that an investor’s shares, when redeemed, may be worth more or less than their original cost.
2
KEY FUND STATISTICS (UNAUDITED) |
Marsico International
Opportunities Fund | Marsico Flexible Capital
Fund | Marsico Global Fund |
| MIOFX | MFCFX | MGLBX |
| For additional disclosures, please see page 24. | For additional disclosures, please see page 29. | For additional disclosures, please see page 35. |
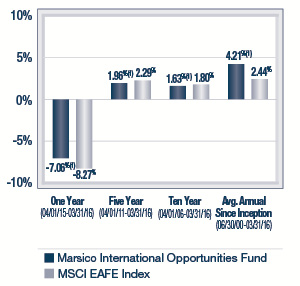
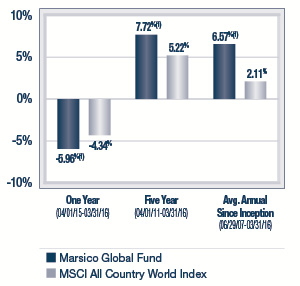
PERFORMANCE COMPARISON(1) | PERFORMANCE COMPARISON(1) | PERFORMANCE COMPARISON(1) |
 | 
| 
|
TOTAL ANNUAL OPERATING EXPENSES* 1.58% NET EXPENSES*† 1.60% | TOTAL ANNUAL OPERATING EXPENSES* 1.27% | TOTAL ANNUAL OPERATING EXPENSES* 1.49% NET EXPENSES*† 1.60% |
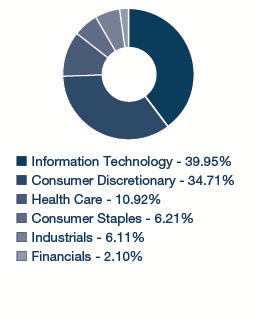
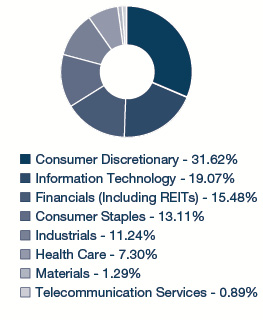
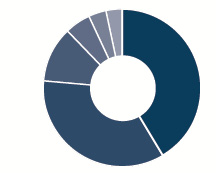
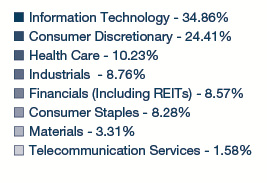
SECTOR ALLOCATION(2) | SECTOR ALLOCATION(2) | SECTOR ALLOCATION(2) |
 | 
| 
|
| TOP FIVE HOLDINGS | TOP FIVE HOLDINGS | TOP FIVE HOLDINGS |
| DOMINO'S PIZZA ENTERPRISES LTD. | 4.97% | CONSTELLATION BRANDS, INC. - CL. A | 6.61% | FACEBOOK, INC. - CL. A | 6.13% |
| TENCENT HOLDINGS LTD. | 4.23% | THE HOME DEPOT, INC. | 5.64% | DOMINO'S PIZZA ENTERPRISES LTD. | 5.59% |
| MASTERCARD, INC. - CL. A | 4.04% | VISA, INC. - CL. A | 4.91% | ALPHABET, INC - CL. A | 5.16% |
| RECKITT BENCKISER GROUP PLC | 3.94% | FACEBOOK, INC - CL. A | 4.34% | WYNN MACAU LTD. | 5.09% |
| NOVO NORDISK A/S - CL. B | 3.65% | NIELSEN HOLDINGS N.V. | 4.30% | RYANAIR HOLDINGS PLC SPON. ADR | 4.08% |
Current performance may be lower or higher than the performance information quoted. To obtain performance information current to the most recent month-end, please call 888-860-8686 or visit marsicofunds.com.
3
KEY FUND STATISTICS (UNAUDITED) |
ADDITIONAL DISCLOSURES ABOUT THE MARSICO FUNDS
* | The Total Annual Operating Expenses and Net Expenses are reflective of the information disclosed in the Funds’ Prospectus dated January 29, 2016. The information may differ from the expense ratios disclosed in this report. |
† | Marsico Capital Management, LLC (the “Adviser”) has entered into a written expense limitation and fee waiver agreement under which it has agreed to limit the total expenses of each of the International Opportunities Fund and the Global Fund (excluding interest, taxes, acquired fund fees and expenses, litigation, brokerage and extraordinary expenses) to an annual rate of 1.60% of each Fund’s average net assets until January 31, 2017. This expense limitation and fee waiver agreement may be terminated by the Adviser at any time after January 31, 2017, upon 15 days prior notice to the Fund and its administrator. The Adviser may recoup from a Fund fees previously waived or expenses previously reimbursed by the Adviser with respect to that Fund pursuant to this agreement (or a previous expenses limitation agreement) if: (1) such recoupment by the Adviser does not cause the Fund, at the time of recoupment, to exceed the lesser of (a) the expense limitation in effect at the time the relevant amount was waived and/or reimbursed, or (b) the expense limitation in effect at the time of the proposed recoupment, and (2) the recoupment is made within three fiscal years after the end of the fiscal year in which the amount was waived or reimbursed. |
(1) | The performance data quoted here represent past performance, and past performance is not a guarantee of future results. Investment return and principal value of an investment will fluctuate so that an investor’s shares, when redeemed, may be worth more or less than their original cost. Current performance may be lower or higher than the performance information quoted. To obtain performance information current to the most recent month-end, please call 888-860-8686 or visit marsicofunds.com. |
| The performance included in the chart does not reflect the deduction of taxes on Fund distributions or the redemption of Fund shares. |
| All indices are unmanaged and investors cannot invest directly in an index. |
Periodically, certain fees and expenses have been waived or reimbursed by the Adviser for the 21st Century Fund, the International Opportunities Fund, the Flexible Capital Fund and the Global Fund. In the absence of such a waiver, the performance returns reflected would have been reduced. In accordance with the expense limitation and fee waiver agreement, the Adviser may recoup fees and expenses previously waived or reimbursed under certain parameters. Periodically, the Adviser has recouped such fees or expenses from the 21st Century Fund, the International Opportunities Fund, and the Global Fund resulting in a lower performance return.
(2) | Sector weightings represent the percentage of the respective Fund’s investments (excluding cash equivalents) in certain general sectors. These sectors may include more than one industry. The Fund’s portfolio composition is subject to change at any time. |
4
MARKET ENVIRONMENT: OCTOBER 2015 – MARCH 2016 (UNAUDITED)
Equity markets registered solid gains after a roller coaster correction in the six-month fiscal period that ended March 31, 2016. During the period, financial markets were heavily influenced by global monetary policymakers’ actions, falling oil prices, weakness in Chinese markets, and currency exchange rate fluctuations.
Following a decline in the third quarter of 2015, stocks initially rebounded. However, anxieties about aggressive monetary tightening in the US, disappointment with tepid support from the European Central Bank and broad-based fears of Chinese currency devaluation, combined to drive risk assets and global equity markets sharply lower in early 2016. Treasury rates dropped amid the stock market sell-off and remained relatively low as news of easier monetary policy took hold.
Global central bankers then changed their tune to adopt a more dovish tone. This apparent change in posture and other factors helped to trigger recoveries in risk assets. Oil prices slid and then rebounded from multi-year lows near $26 to end the period at approximately $38 per barrel. Other commodities also began to recover from steep declines. The US dollar retreated during the final weeks of the reporting period, and non-energy dollar-denominated commodities rose as the Federal Reserve revealed a scaled back plan for interest rate normalization.
US economic news was mixed overall during the period. Employment performance remained strong, with jobs rising at a pace faster than 200,000 per month during the first quarter of 2016. That said, spending and production data were somewhat disappointing. Consumer spending was modest, despite strong job growth and low energy prices. Likewise, the drag from energy company retrenchment and faltering exports weighed on US gross domestic product.
Chinese policy makers were also in the news as they pledged to work to improve consumer conditions and to avoid a plunge in their currency, the renminbi. China has been a major contributor to global growth over the past 10 years, but much of this growth was tied to China’s strength in export markets. Chinese demand for products from the rest of the world, however, was concentrated in commodities and capital goods. Arguably, slower growth in China may not derail global growth unless China takes steps to drive the renminbi down. Accordingly, the People’s Bank of China’s apparent official commitment to avoid such a move was welcome.
Currency markets were volatile throughout the reporting period. Much worry stemmed from emerging market currency swoons apparently tied to capital returning to the US in anticipation of Federal Reserve tightening of interest rates, a stronger US dollar and higher US fixed income returns. The Fed’s decision to scale back tightening plans was met with sharp rallies for developing economy currencies, an abatement in US dollar strength, and increases in dollar-denominated prices of many developing country commodity exports. The Japanese yen, often considered a safe-haven currency, rose approximately 7% versus the US dollar during the first three months of 2016.
Gold, another asset often perceived as a safe-haven during times of market stress, registered its strongest quarterly return in nearly 30 years, gaining more than 15% during the first quarter of 2016. The precious metal rose on the heels of dovish Fed policy and US dollar weakness.
After all the drama, US markets posted solid gains for the six-month period, as depicted in the table below. Large capitalization US equities outperformed small capitalization stocks, perhaps because larger companies are sometimes viewed as offering more stability during uncertain global economic conditions. Emerging market equities rallied late in the reporting period as the US dollar weakened, easing concerns of servicing emerging economies’ dollar denominated debt. Developed international markets posted anemic returns as depicted in the table.
Index Name(1) | Universe of
Equities Represented | Six-Month Total Return |
US | | |
S&P 500 | US large-capitalization equities | +8.49% |
Russell 3000 | US publicly-traded equities of all sizes | +7.30% |
Russell 2000 | US small-capitalization equities | +2.02% |
Russell Mid-Cap | US medium-capitalization equities | +5.94% |
Index Name(1) | Universe of
Equities Represented | Six-Month Total Return |
INTERNATIONAL | |
MSCI EAFE (US$) | Equities in developed international equity markets, including Japan, Western Europe, and Australasia | +1.56% |
MSCI Emerging Markets (US$) | Equities in developing international equity markets, including China, India, Eastern Europe, and Latin America | +6.41% |
MSCI ACWI (US$) | Equities in the global developed and emerging markets | +5.28% |
THE MARSICO INVESTMENT TEAM
(1) | All indices are unmanaged and investors cannot invest directly in an index. |
5
INVESTMENT REVIEW BY TOM MARSICO AND CORALIE WITTER (UNAUDITED)
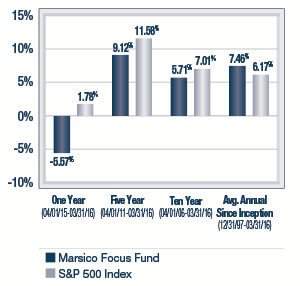
The Marsico Focus Fund posted a total return of +2.50% for the six-month fiscal period ended March 31, 2016. While the Fund posted a positive return, the Fund’s relative performance lagged its benchmark index, the S&P 500 Index, which had a total return of +8.49% over the same time period. Please see the Fund’s Overview for more detailed information about the Fund’s longer-term performance for various periods ended March 31, 2016.
The performance data for the Fund quoted here represent past performance and past performance is not a guarantee of future results. Investment return and principal value of an investment will fluctuate so that an investor’s shares, when redeemed, may be worth more or less than their original cost. Current performance may be lower or higher than the performance information quoted. To obtain performance information current to the most recent month-end, please call 888-860-8686 or visit marsicofunds.com. (1)
This review highlights Fund performance over a six-month fiscal period. Shareholders should keep in mind that the Fund is intended for long-term investors who hold their shares for substantially longer periods of time. You should also keep in mind that our current views and beliefs regarding all investments discussed in this report are subject to change at any time. References to specific securities, industries, and sectors discussed in this report are not recommendations to buy or sell such securities or related investments, and the Fund may not necessarily hold these securities or investments today. Please see the accompanying Schedules of Investments for the percentage of the Fund’s portfolio represented by the securities mentioned in this report as of the end of the reporting period.
The Focus Fund is non-diversified and may hold fewer securities than a diversified fund because it is permitted to invest a greater percentage of its assets in a smaller number of securities. Holding fewer securities increases the risk that the value of the Fund could go down because of the poor performance of a single investment or may be more volatile than its benchmark. The Fund is subject to broad risks associated with investing in equity securities markets generally, including the risks that the securities and markets in which they invest may experience volatility and instability, that domestic and global economies and markets may undergo periods of cyclical change and decline, that investors may at times avoid investments in equity securities, and that investments may not perform as anticipated. Please see the Prospectus for more information.
The Fund is not managed to track the benchmark index, and may hold a substantially overweight or underweight position in a sector, industry, or security compared to its weight in the benchmark. For informational purposes, the discussion below may compare the benchmark weight or performance of a sector or industry to the investment approach of the Fund.
The Focus Fund’s performance shortfall during the six months ended March 31, 2016, as compared to the S&P 500 Index, was primarily attributable to certain Fund holdings in the Health Care, Consumer Discretionary, and Consumer Staples sectors, as defined in the Global Industry Classification Standard (“GICS”)(2).
Stock prices of many Health Care companies were under pressure during the reporting period. Hospital operators slumped during late 2015 on worries that an increasing number of uninsured patients will be unable to pay their bills as fewer states expand Medicaid and more patients drop insurance because of unaffordable premiums. The Fund’s position in health care facility operator HCA Holdings, Inc. slid -16% prior to being sold during the period.
Certain of the Fund’s holdings within the Pharmaceutical, Biotechnology & Life Sciences industry posted negative returns. Regeneron Pharmaceuticals, Inc. and Novartis AG declined -20% and -19%, respectively, during the period prior to being sold from the Fund. We chose to sell Regeneron because the US government is stepping up efforts to control Medicare Part B costs, an area where Regeneron has more exposure than many of its peers. We sold Novartis after a disappointing launch of the company’s new heart failure drug and operational challenges in its eye care division. Genome sequencing company Illumina, Inc. (-21% during the period prior to being sold) preannounced lower-than-expected revenues and cut its guidance due in part to disappointing sales in Europe and Asia.
Several of the Fund’s Consumer Discretionary holdings struggled during the period, including Chipotle Mexican Grill, Inc. and NIKE, Inc. – Cl. B. Restaurant operator Chipotle’s (-35%) stock posted a negative return during the period after it was discovered that foodborne illnesses, including norovirus and E. coli outbreaks, were linked to Chipotle restaurants in several states. The Fund maintained a position in the company as the company is taking important measures to improve the safety of its food supply chain, and a resolution of food safety issues should lead to improvement in the number of customer visits and contribute to strong same store sales growth. Athletic apparel company NIKE, meanwhile, posted
6
an essentially flat return of +0.6% during the period, trailing the return of the Fund’s benchmark index. NIKE is a global company and a significant portion of its sales and production is from overseas markets. Although fluctuations in currency exchange rates had an adverse impact on NIKE’s business, we like NIKE’s product innovation, and believe the upcoming Rio Summer Olympics will provide a positive tailwind for its business.
A few stocks in the Consumer Staples sector detracted from Fund performance. Shares of retailer and pharmacy benefit manager CVS Health Corporation (-0.7% during the period prior to being sold) came under pressure amid a more challenging drug retail backdrop. We sold CVS from the Fund and invested much of the proceeds in establishing a new position in The Kroger Company, the largest grocery chain in the US. Although Kroger’s stock price dipped 6% during the period it was held by the Fund, we like Kroger’s scale, investment in technology, strong private label penetration and opportunities to derive synergies from strategic acquisitions. Consumer Staples was a strong-performing sector of the S&P 500 Index and the Fund’s performance was held back by having an underweight allocation to the sector as compared to the benchmark index.
��
We sold the Fund’s only holding in the Industrials sector, The Boeing Company (-11% during the portion of the reporting period it was held), in recognition of pricing and supply issues forming in the jumbo aircraft marketplace. An underweight allocation to the Industrials sector was a further detractor from Fund performance, as this sector was among the stronger-performing sectors of the benchmark index.
From a sector allocation perspective, the Fund’s performance was impaired by having no exposure to the Telecommunication Services and Utilities sectors – the two strongest-performing sectors of the S&P 500 Index during the period. In the uncertain macroeconomic environment, it seemed that dividend paying stocks perceived by the market to offer safety, such as Utilities and Telecommunications, were rewarded. We believed valuations for many companies in both sectors were high, and we found more compelling investment opportunities in other sectors.
The picture was brighter in other areas, as a few Fund holdings within the Consumer Discretionary sector generated strong performance results. In particular, discount retailer Dollar Tree, Inc. soared +24% during the period, buoyed by better than expected profits from Family Dollar stores. Dollar Tree acquired Family Dollar in July 2015; since that time, Dollar Tree has begun implementing efficiencies through procurement, distribution and store formats.
The Fund’s holdings in the Information Technology sector also performed strongly, led by holdings in the Software & Services industry. For some time, the Fund has maintained investments in companies making innovative use of technology to create better retail and advertising business models. Alibaba Group Holding Ltd. Spon. ADR, China’s leading ecommerce company, staged a stock price gain of +33% during the period. Alibaba’s stock rose after sales on China’s “Singles Day,” a holiday popular among young unmarried adults in China, were stronger than expected. Internet services positions Facebook, Inc. – Cl. A and Alphabet, Inc. – Cl. A were also among the Fund’s best performing holdings and posted gains of +27% and +19%, respectively, during the reporting period. Facebook announced results that exceeded market expectations, led by strong advertising revenue and monthly active user growth rates. In October 2015, Google reorganized its business under a new holding company called Alphabet. The restructuring effectively separates reporting of proven moneymaking Internet business units from newer and innovative lines of business in industries such as self-driving cars, smart home technology, and life sciences. The reorganization was welcomed by many investors, and Alphabet’s shares were buoyed by strong revenue growth, particularly from continued strength in mobile search.
The Fund’s sole holding in the Materials sector, The Sherwin-Williams Company (+29%), was another individual holding having a significant, positive impact on Fund performance. Sherwin-Williams has benefitted from lower raw materials costs and a stronger housing market.
From a sector allocation perspective, the Fund was aided relative to its benchmark index by having an overweight allocation to the strong-performing Information Technology sector, while being underweight the weak-performing Financials sector.
During the reporting period, the Fund sold its positions in the Industrials and Energy sectors and reduced its exposure to the Health Care, Financials, and Materials sectors. The Fund increased its allocations to the Consumer Discretionary and Information Technology sectors.
7
Fiscal Period-End Investment Posture
As of March 31, 2016, the Fund’s largest sector allocations included Information Technology, Consumer Discretionary, and Health Care. As of that date, the Fund had no exposure to the Energy, Industrials, Utilities, or Telecommunication Services sectors.
Sincerely,
THOMAS F. MARSICO
CORALIE T. WITTER, CFA
PORTFOLIO MANAGERS
(1) | Total returns are based on net change in net asset value assuming reinvestment of distributions. Please see the Prospectus for more information. |
(2) | Regarding GICS data cited throughout this report, the Global Industry Classification Standard (“GICS”) was developed by and is the exclusive property and service mark of MSCI Inc. (“MSCI”) and Standard & Poor’s (“S&P”) and is licensed for use by Marsico Capital Management, LLC (the “Adviser”). Neither MSCI, S&P, nor the Adviser or any third party involved in compiling GICS makes any express or implied warranties or representations with respect to such standard or classification (or the results from use thereof), and all such parties hereby expressly disclaim all warranties of originality, accuracy, completeness, merchantability and fitness for a particular purpose with respect to any such standard or classification. MSCI, S&P, the Adviser, and any of their affiliates or third parties involved in compiling GICS shall not have any liability for any direct, indirect, special, punitive, consequential or any other damages (including lost profits) even if notified of the possibility of such damages. |
8
March 31, 2016 (Unaudited)
The Focus Fund invests primarily in the common stocks of large companies that are selected for their long-term growth potential. The Fund will normally hold a core position of between 20 and 35 common stocks.
| TOTAL ANNUAL OPERATING EXPENSES* | 1.19% | NET ASSETS $696,470,167 | NET ASSET VALUE PER SHARE $15.47 |
GROWTH OF $10,000(1) | PERFORMANCE COMPARISON |
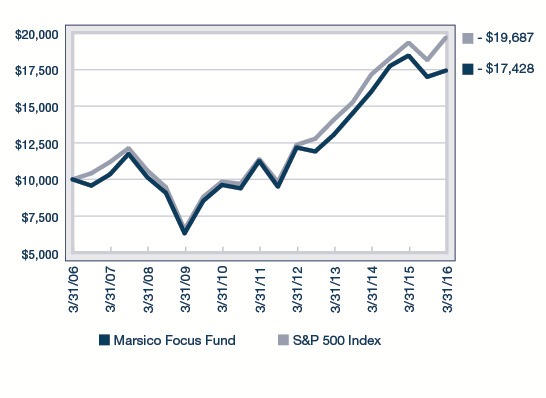
| 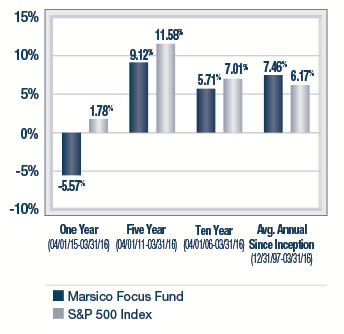
|
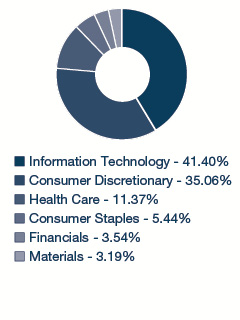
SECTOR ALLOCATION(2) | TOP FIVE HOLDINGS |
| | | | |
| | Facebook, Inc. - Cl. A | 10.51% | |
| | Alphabet, Inc. - Cl. A | 8.12% | |
| | Visa, Inc. - Cl. A | 7.14% | |
| | NIKE, Inc. - Cl. B | 5.73% | |
| | Chipotle Mexican Grill, Inc. | 5.67% | |
| | | | |
* | The Total Annual Operating Expenses are reflective of the information disclosed in the Funds’ Prospectus dated January 29, 2016 and may differ from the expense ratio disclosed in this report. |
| The performance data quoted here represent past performance, and past performance is not a guarantee of future results. Investment return and principal value of an investment will fluctuate so that an investor’s shares, when redeemed, may be worth more or less than their original cost. Current performance may be lower or higher than the performance information quoted. To obtain performance information current to the most recent month-end, please call 888-860-8686 or visit marsicofunds.com. |
| The performance included in the chart and graph does not reflect the deduction of taxes on Fund distributions or the redemption of Fund shares. |
| All indices are unmanaged and investors cannot invest directly in an index. |
(1) | This chart assumes an initial investment of $10,000 made on March 31, 2006. Total returns are based on net change in NAV, assuming reinvestment of distributions. |
(2) | Sector weightings represent the percentage of the Fund’s investments (excluding cash equivalents) in certain general sectors. These sectors may include more than one industry. The Fund’s portfolio composition is subject to change at any time. |
9
MARSICO FOCUS FUND
SCHEDULE OF INVESTMENTS
March 31, 2016 (Unaudited)
| | | Number
of
Shares | | | Value | | | Percent
of Net
Assets | |
COMMON STOCKS | | | | | | | | | |
Application Software | | | | | | | | | |
salesforce.com, inc.* | | | 533,790 | | | $ | 39,409,716 | | | | 5.66 | % |
| | | | | | | | | | | | | |
Biotechnology | | | | | | | | | | | | |
Celgene Corporation* | | | 243,856 | | | | 24,407,547 | | | | 3.50 | |
| | | | | | | | | | | | | |
Data Processing & Outsourced Services | |
Visa, Inc. - Cl. A | | | 649,746 | | | | 49,692,574 | | | | 7.14 | |
| | | | | | | | | | | | | |
Food Retail | | | | | | | | | | | | |
The Kroger Company | | | 603,510 | | | | 23,084,258 | | | | 3.31 | |
| | | | | | | | | | | | | |
Footwear | | | | | | | | | | | | |
NIKE, Inc. - Cl. B | | | 648,666 | | | | 39,873,499 | | | | 5.73 | |
| | | | | | | | | | | | | |
General Merchandise Stores | |
Dollar Tree, Inc.* | | | 412,301 | | | | 33,998,340 | | | | 4.88 | |
| | | | | | | | | | | | | |
Home Entertainment Software | |
Electronic Arts, Inc.* | | | 483,557 | | | | 31,967,953 | | | | 4.59 | |
| | | | | | | | | | | | | |
Home Improvement Retail | |
The Home Depot, Inc. | | | 287,206 | | | | 38,321,897 | | | | 5.50 | |
| | | | | | | | | | | | | |
Internet Retail | | | | | | | | | | | | |
Amazon.com, Inc.* | | | 46,447 | | | | 27,572,797 | | | | 3.96 | |
The Priceline Group, Inc.* | | | 15,619 | | | | 20,132,266 | | | | 2.89 | |
| | | | | | | | 47,705,063 | | | | 6.85 | |
Internet Software & Services | |
Alibaba Group Holding Ltd. Spon. ADR* | | | 403,309 | | | | 31,873,510 | | | | 4.58 | |
Alphabet, Inc. - Cl. A* | | | 74,125 | | | | 56,549,963 | | | | 8.12 | |
Facebook, Inc. - Cl. A* | | | 641,672 | | | | 73,214,775 | | | | 10.51 | |
| | | | | | | | 161,638,248 | | | | 23.21 | |
Investment Banking & Brokerage | |
The Charles Schwab Corporation | | | 863,016 | | | | 24,181,708 | | | | 3.47 | |
| | | | | | | | | | | | | |
Managed Health Care | | | | | | | | | | | | |
UnitedHealth Group, Inc. | | | 243,514 | | | | 31,388,955 | | | | 4.51 | |
| | | | | | | | | | | | | |
Packaged Foods & Meats | | | | | | | | | | | | |
The Kraft Heinz Company | | | 178,986 | | | | 14,061,140 | | | | 2.02 | |
| | | | | | | | | | | | | |
Pharmaceuticals | | | | | | | | | | | | |
Pacira Pharmaceuticals, Inc.* | | | 412,801 | | | | 21,870,197 | | | | 3.14 | |
| | | | | | | | | | | | | |
Restaurants | | | | | | | | | | | | |
Chipotle Mexican Grill, Inc.* | | | 83,798 | | | | 39,466,344 | | | | 5.67 | |
Domino's Pizza Enterprises Ltd. | | | 110,754 | | | | 4,879,966 | | | | 0.70 | |
Starbucks Corporation | | | 588,657 | | | | 35,142,823 | | | | 5.04 | |
| | | | | | | | 79,489,133 | | | | 11.41 | |
COMMON STOCKS (continued) | |
Specialty Chemicals | | | | | | | | | | | | |
The Sherwin-Williams Company | | | 76,422 | | | $ | 21,755,051 | | | | 3.12 | % |
| | | | | | | | | | | | | |
TOTAL COMMON STOCKS | |
(Cost $545,837,419) | | | | | | | 682,845,279 | | | | 98.04 | |
| | | | | | | | | | | | | |
SHORT-TERM INVESTMENTS | |
State Street Institutional U.S. Government Money Market Fund, 0.000% | | | 17,952,687 | | | | 17,952,687 | | | | 2.58 | |
| | | | | | | | | | | | | |
TOTAL SHORT-TERM INVESTMENTS | |
(Cost $17,952,687) | | | | | | | 17,952,687 | | | | 2.58 | |
| | | | | | | | | | | | | |
TOTAL INVESTMENTS | |
(Cost $563,790,106) | | | | | | | 700,797,966 | | | | 100.62 | |
| | | | | | | | | | | | | |
Liabilities, Less Cash and Other Assets | | | | | | | (4,327,799 | ) | | | (0.62 | ) |
| | | | | | | | | | | | | |
NET ASSETS | | | | | | $ | 696,470,167 | | | | 100.00 | % |
| See notes to financial statements. |
10
INVESTMENT REVIEW BY TOM MARSICO AND CORALIE WITTER (UNAUDITED)
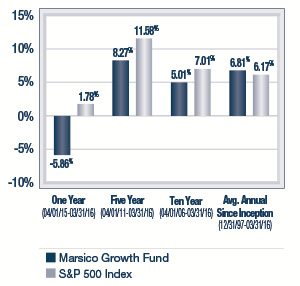
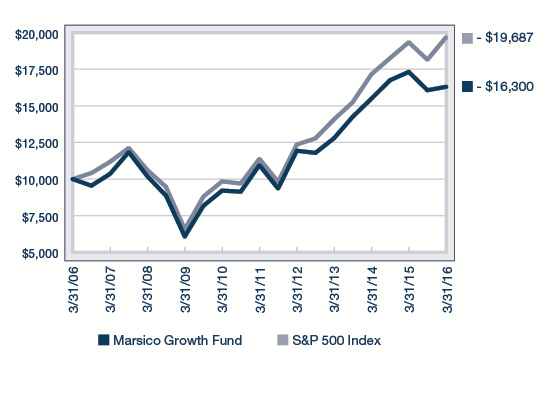
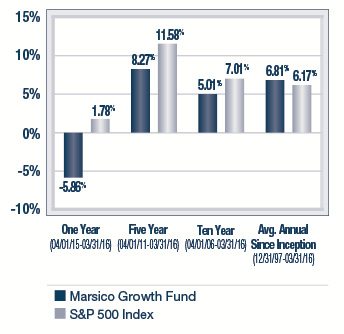
The Marsico Growth Fund posted a total return of +1.44% for the six-month fiscal period ended March 31, 2016. The Fund underperformed the S&P 500 Index, which is the Fund’s benchmark index and had a total return of +8.49% over the same time period. Please see the Fund’s Overview for more detailed information about the Fund’s longer-term performance for various periods ended March 31, 2016.
The performance data for the Fund quoted here represent past performance, and past performance is not a guarantee of future results. Investment return and principal value of an investment will fluctuate so that an investor’s shares, when redeemed, may be worth more or less than their original cost. Current performance may be lower or higher than the performance information quoted. To obtain performance information current to the most recent month-end, please call 888-860-8686 or visit marsicofunds.com. (1)
This review highlights Fund performance over a six-month fiscal period. Shareholders should keep in mind that the Fund is intended for long-term investors who hold their shares for substantially longer periods of time. You should also keep in mind that our current views and beliefs regarding all investments discussed in this report are subject to change at any time. References to specific securities, industries, and sectors discussed in this report are not recommendations to buy or sell such securities or related investments, and the Fund may not necessarily hold these securities or investments today. Please see the accompanying Schedules of Investments for the percentage of the Fund’s portfolio represented by the securities mentioned in this report as of the end of the reporting period.
The Fund is subject to broad risks associated with investing in equity securities markets generally, including the risks that the securities and markets in which it invests may experience volatility and instability, that domestic and global economies and markets may undergo periods of cyclical change and decline, that investors may at times avoid investments in equity securities, and that investments may not perform as anticipated. Please see the Prospectus for more information.
The Fund is not managed to track the benchmark index, and may hold a substantially overweight or underweight position in a sector, industry, or security compared to its weight in the benchmark. For informational purposes, the discussion below may compare the benchmark weight or performance of a sector or industry to the investment approach of the Fund.
Much of the Growth Fund’s underperformance during the six months ended March 31, 2016, as compared to the S&P 500 Index, was attributable to certain holdings in the Consumer Discretionary, Health Care and Consumer Staples sectors.
Several of the Growth Fund’s Consumer Discretionary holdings struggled during the period, including Chipotle Mexican Grill, Inc. and NIKE, Inc. – Cl. B. Restaurant operator Chipotle Mexican Grill (-36%) was negatively impacted during the period after it was discovered that foodborne illnesses, including norovirus and E. coli outbreaks, were linked to Chipotle restaurants in several states. The Fund maintained a position in the company as the company is taking important measures to improve the safety of its food supply chain, and a resolution of food safety issues should lead to improvement in the number of customer visits and contribute to strong same store sales growth. Athletic apparel company NIKE, meanwhile, posted an essentially flat return of +0.3% during the period, trailing the return of the Fund’s benchmark index. NIKE is a global company and a significant portion of its sales and production is from overseas markets. Although fluctuations in currency exchange rates had an adverse impact on NIKE’s business, we like NIKE’s product innovation, and believe the upcoming Rio Summer Olympics will provide a positive tailwind for the company.
Several of the Fund’s Health Care holdings within the Pharmaceuticals, Biotechnology & Life Sciences industry posted negative returns. Illumina, Inc. and Regeneron Pharmaceuticals, Inc. declined -21% and -20%, respectively, during the period prior to being sold from the Fund. Genome sequencing company Illumina preannounced lower-than-expected revenues and cut its guidance due in part to disappointing sales in Europe and Asia. We chose to sell Regeneron because the US government is stepping up efforts to control Medicare Part B costs, an area where Regeneron has more exposure than many of its peers.
Hospital operators slumped during late-2015 on worries that an increasing number of uninsured patients will be unable to pay their bills as fewer states expand Medicaid and more patients drop insurance because of unaffordable premiums. The Fund’s position in HCA Holdings, Inc. slid -16% prior to being sold during the period.
A few stocks in the Consumer Staples sector detracted from Fund performance. Shares of retailer and pharmacy benefit manager CVS Health Corporation (-0.7% during the period prior to being sold) came under pressure amid a more challenging drug retail backdrop. We sold CVS from the Fund and invested much of the proceeds in establishing a new
11
position in The Kroger Company, the largest grocery chain in the US. Although Kroger’s stock price dipped -6% during the period it was held by the Fund, we like Kroger’s scale, investment in technology, strong private label penetration, and opportunities to derive synergies from strategic acquisitions. Consumer Staples was a strong-performing sector of the S&P 500 Index and the Fund’s performance was held back by having an underweight allocation to the sector as compared to the benchmark index.
An underweight allocation to the Industrials sector detracted from Fund performance, as the sector was among the stronger-performing sectors of the benchmark index. The Fund’s position in The Boeing Company (-0.3% during the portion of the reporting period it was held) was a further detractor. We sold Boeing in recognition of pricing and supply issues forming in the jumbo aircraft marketplace.
From a sector allocation perspective, the Fund’s performance was also impaired by having no exposure to the Telecommunication Services and Utilities sectors – the two strongest-performing sectors of the S&P 500 Index. In the uncertain macroeconomic environment, it seemed that dividend paying stocks perceived by the market to offer safety, such as Utilities and Telecommunications, were rewarded. We believed valuations for many companies in both sectors were high, and we found more compelling investment opportunities in other sectors.
The Fund’s Information Technology holdings posted mixed results. Three of the Fund’s holdings within the sector posted negative returns. Cybersecurity provider Palo Alto Networks, Inc. slipped -27% prior to being sold on market concerns about slower spending by corporate enterprise customers. NXP Semiconductors N.V. (-14% prior to being sold) posted a negative return on concerns about weaker demand for semiconductors and rising inventory levels. Video game software company Electronic Arts, Inc.’s stock price dipped -2% during the period. We maintained the Fund’s position in Electronic Arts because we believe the firm’s profitability should improve as new video game consoles make it more convenient for players to download video games online, rather than purchasing physical copies of game software.
On the brighter side, several of the Fund’s Software & Services holdings posted strong returns. The Growth Fund maintained investments in companies making innovative use of technology to create better retail and advertising business models. Alibaba Group Holding Ltd. Spon. ADR, China’s leading ecommerce company, staged a stock price gain of +34% during the period. Alibaba’s stock rose after sales on China’s “Singles Day,” a holiday popular among young unmarried adults in China, were stronger than expected. Internet services positions Facebook, Inc. – Cl. A and Alphabet, Inc. – Cl. A were also among the Fund’s best performing holdings and posted gains of +27% and +20%, respectively, during the reporting period. Facebook announced results that exceeded market expectations, led by strong advertising revenue and monthly active user growth rates. In October 2015, Google reorganized its business under a new holding company called Alphabet. The restructuring effectively separates reporting of proven moneymaking Internet business units from newer and innovative lines of business in industries such as self-driving cars, smart home technology, and life sciences. The reorganization was welcomed by many investors, and Alphabet’s shares were buoyed by strong revenue growth, particularly from continued strength in mobile search.
The Fund’s sole holding in the Materials sector, The Sherwin-Williams Company (+29%), was another individual holding having a material, positive impact on Fund performance. Sherwin-Williams has benefitted from lower raw materials costs and a stronger housing market.
From a sector allocation perspective, the Fund benefitted relative to its benchmark index by having an overweight allocation to the strong-performing Information Technology sector, while being underweight the weak-performing Financials sector.
During the reporting period, the Fund sold its sole position in the Energy sector and reduced its exposure to the Health Care and Industrials sectors. The Fund increased its allocations to the Information Technology, Consumer Discretionary, and Consumer Staples sectors.
12
Fiscal Period-End Investment Posture
As of March 31, 2016, the Fund’s largest sector allocations included Information Technology, Consumer Discretionary, and Health Care. As of that date, the Fund had no exposure to the Energy, Utilities, or Telecommunication Services sectors.
Sincerely,
THOMAS F. MARSICO
CORALIE T. WITTER, CFA
PORTFOLIO MANAGERS
(1) | Total returns are based on net change in net asset value assuming reinvestment of distributions. Please see the Prospectus for more information. |
13
March 31, 2016 (Unaudited)
The Growth Fund invests primarily in the common stocks of large companies that are selected for their long-term growth potential. The Growth Fund will normally hold a core position of between 35 and 50 common stocks.
TOTAL ANNUAL OPERATING EXPENSES* | 1.27% | NET ASSETS $336,152,472 | NET ASSET VALUE PER SHARE $14.88 |
GROWTH OF $10,000(1) | PERFORMANCE COMPARISON |
| 
|
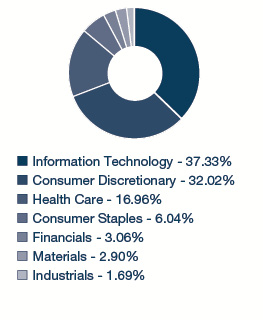
SECTOR ALLOCATION(2) | TOP FIVE HOLDINGS |
| | | | |
| | Facebook, Inc. - Cl. A | 8.37% | |
| | Alphabet, Inc. - Cl. A | 7.29% | |
| | salesforce.com, inc. | 5.19% | |
| | Starbucks Corporation | 4.88% | |
| | Visa, Inc. - Cl. A | 4.63% | |
| | | | |
* | The Total Annual Operating Expenses are reflective of the information disclosed in the Funds’ Prospectus dated January 29, 2016 and may differ from the expense ratio disclosed in this report. |
| The performance data quoted here represent past performance, and past performance is not a guarantee of future results. Investment return and principal value of an investment will fluctuate so that an investor’s shares, when redeemed, may be worth more or less than their original cost. Current performance may be lower or higher than the performance information quoted. To obtain performance information current to the most recent month-end, please call 888-860-8686 or visit marsicofunds.com. |
| The performance included in the chart and graph does not reflect the deduction of taxes on Fund distributions or the redemption of Fund shares. |
| All indices are unmanaged and investors cannot invest directly in an index. |
(1) | This chart assumes an initial investment of $10,000 made on March 31, 2006. Total returns are based on net change in NAV, assuming reinvestment of distributions. |
(2) | Sector weightings represent the percentage of the Fund’s investments (excluding cash equivalents) in certain general sectors. These sectors may include more than one industry. The Fund’s portfolio composition is subject to change at any time. |
14
MARSICO GROWTH FUND
SCHEDULE OF INVESTMENTS
March 31, 2016 (Unaudited)
| | | Number
of
Shares | | | Value | | | Percent
of Net
Assets | |
COMMON STOCKS | | | | | | | | | |
Airlines | | | | | | | | | |
Delta Air Lines, Inc. | | | 114,551 | | | $ | 5,576,343 | | | | 1.66 | % |
| | | | | | | | | | | | | |
Application Software | | | | | | | | | | | | |
salesforce.com, inc.* | | | 236,383 | | | | 17,452,157 | | | | 5.19 | |
| | | | | | | | | | | | | |
Automotive Retail | | | | | | | | | | | | |
O'Reilly Automotive, Inc.* | | | 19,232 | | | | 5,263,029 | | | | 1.57 | |
| | | | | | | | | | | | | |
Biotechnology | | | | | | | | | | | | |
Amgen, Inc. | | | 63,039 | | | | 9,451,437 | | | | 2.81 | |
Celgene Corporation* | | | 99,318 | | | | 9,940,739 | | | | 2.96 | |
| | | | | | | | 19,392,176 | | | | 5.77 | |
Data Processing & Outsourced Services | |
FleetCor Technologies, Inc.* | | | 43,674 | | | | 6,496,508 | | | | 1.93 | |
Visa, Inc. - Cl. A | | | 203,363 | | | | 15,553,202 | | | | 4.63 | |
| | | | | | | | 22,049,710 | | | | 6.56 | |
Food Retail | | | | | | | | | | | | |
The Kroger Company | | | 335,082 | | | | 12,816,886 | | | | 3.81 | |
| | | | | | | | | | | | | |
Footwear | | | | | | | | | | | | |
NIKE, Inc. - Cl. B | | | 229,439 | | | | 14,103,615 | | | | 4.19 | |
| | | | | | | | | | | | | |
General Merchandise Stores | |
Dollar Tree, Inc.* | | | 178,160 | | | | 14,691,074 | | | | 4.37 | |
| | | | | | | | | | | | | |
Home Entertainment Software | |
Electronic Arts, Inc.* | | | 182,110 | | | | 12,039,292 | | | | 3.58 | |
| | | | | | | | | | | | | |
Home Improvement Retail | |
The Home Depot, Inc. | | | 108,818 | | | | 14,519,586 | | | | 4.32 | |
| | | | | | | | | | | | | |
Hotels, Resorts & Cruise Lines | |
Royal Caribbean Cruises Ltd. | | | 80,370 | | | | 6,602,396 | | | | 1.96 | |
| | | | | | | | | | | | | |
Internet Retail | | | | | | | | | | | | |
Amazon.com, Inc.* | | | 23,863 | | | | 14,166,031 | | | | 4.22 | |
The Priceline Group, Inc.* | | | 4,728 | | | | 6,094,203 | | | | 1.81 | |
| | | | | | | | 20,260,234 | | | | 6.03 | |
Internet Software & Services | |
Alibaba Group Holding Ltd. Spon. ADR* | | | 145,571 | | | | 11,504,476 | | | | 3.42 | |
Alphabet, Inc. - Cl. A* | | | 32,114 | | | | 24,499,771 | | | | 7.29 | |
Facebook, Inc. - Cl. A* | | | 246,666 | | | | 28,144,590 | | | | 8.37 | |
| | | | | | | | 64,148,837 | | | | 19.08 | |
Investment Banking & Brokerage | |
The Charles Schwab Corporation | | | 360,296 | | | | 10,095,494 | | | | 3.00 | |
| | | | | | | | | | | | | |
IT Consulting & Other Services | |
Accenture PLC - Cl. A | | | 65,729 | | | | 7,585,127 | | | | 2.26 | |
| | | | | | | | | | | | | |
Managed Health Care | | | | | | | | | | | | |
UnitedHealth Group, Inc. | | | 108,472 | | | | 13,982,041 | | | | 4.16 | |
| | | | | | | | | | | | | |
COMMON STOCKS (Continued) | | | | | |
Packaged Foods & Meats | | | | | | | | | | | | |
The Kraft Heinz Company | | | 43,110 | | | $ | 3,386,722 | | | | 1.01 | % |
TreeHouse Foods, Inc.* | | | 43,062 | | | | 3,735,628 | | | | 1.11 | |
| | | | | | | | 7,122,350 | | | | 2.12 | |
Pharmaceuticals | | | | | | | | | | | | |
Eli Lilly & Company | | | 96,694 | | | | 6,962,935 | | | | 2.07 | |
Pacira Pharmaceuticals, Inc.* | | | 107,199 | | | | 5,679,403 | | | | 1.69 | |
Zoetis, Inc. | | | 225,676 | | | | 10,004,217 | | | | 2.98 | |
| | | | | | | | 22,646,555 | | | | 6.74 | |
Restaurants | | | | | | | | | | | | |
Chipotle Mexican Grill, Inc.* | | | 29,547 | | | | 13,915,750 | | | | 4.14 | |
Starbucks Corporation | | | 274,571 | | | | 16,391,889 | | | | 4.88 | |
| | | | | | | | 30,307,639 | | | | 9.02 | |
Specialty Chemicals | | | | | | | | | | | | |
The Sherwin-Williams Company | | | 33,651 | | | | 9,579,430 | | | | 2.85 | |
| | | | | | | | | | | | | |
TOTAL COMMON STOCKS | | | | | | | | | | | | |
(Cost $274,571,699) | | | | | | | 330,233,971 | | | | 98.24 | |
| | | | | | | | | | | | | |
SHORT-TERM INVESTMENTS | |
State Street Institutional Treasury Money Market Fund, 0.000% | | | 2,553,760 | | | | 2,553,760 | | | | 0.76 | |
| | | | | | | | | | | | | |
TOTAL SHORT-TERM INVESTMENTS | |
(Cost $2,553,760) | | | | | | | 2,553,760 | | | | 0.76 | |
| | | | | | | | | | | | | |
TOTAL INVESTMENTS | | | | | | | | | | | | |
(Cost $277,125,459) | | | | | | | 332,787,731 | | | | 99.00 | |
| | | | | | | | | | | | | |
Cash and Other Assets, Less Liabilities | | | | | | | 3,364,741 | | | | 1.00 | |
| | | | | | | | | | | | | |
NET ASSETS | | | | | | $ | 336,152,472 | | | | 100.00 | % |
| See notes to financial statements. |
15
INVESTMENT REVIEW BY BRANDON GEISLER (UNAUDITED)
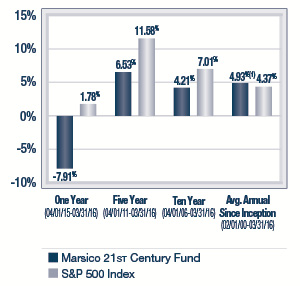
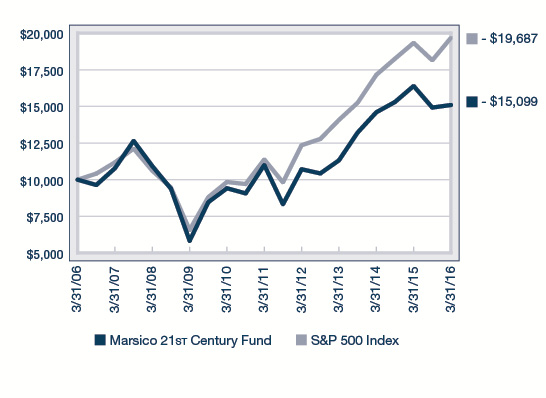
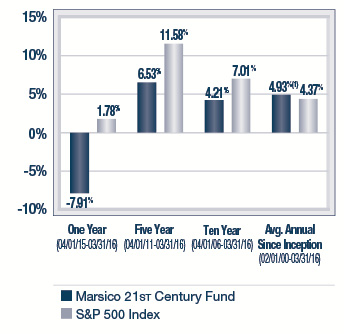
The Marsico 21st Century Fund posted a total return of +1.18% for the six-month fiscal period ended March 31, 2016. The Fund underperformed the S&P 500 Index, which is the Fund’s primary benchmark index and had a total return of +8.49% over the same time period. The Russell 3000 Index, a proxy for the performance of all publicly-traded US equity securities including smaller capitalization companies (which may be a useful comparison in light of the Fund’s ability to invest across the entire market capitalization spectrum), had a total return of +7.30%. Please see the Fund Overview for more detailed information about the Fund’s longer-term performance for various time periods ended March 31, 2016.
The performance data for the Fund quoted here represent past performance, and past performance is not a guarantee of future results. Investment return and principal value of an investment will fluctuate so that an investor’s shares, when redeemed, may be worth more or less than their original cost. Current performance may be lower or higher than the performance information quoted. To obtain performance information current to the most recent month-end, please call 888-860-8686 or visit marsicofunds.com. (1)
This review highlights Fund performance over a six-month fiscal period. Shareholders should keep in mind that the Fund is intended for long-term investors who hold their shares for substantially longer periods of time. You should also keep in mind that our current views and beliefs regarding all investments discussed in this report are subject to change at any time. References to specific securities, industries, and sectors discussed in this report are not recommendations to buy or sell such securities or related investments, and the Fund may not necessarily hold these securities or investments today. Please see the accompanying Schedule of Investments for the percentage of the Fund’s portfolio represented by the securities mentioned in this report as of the end of the reporting period.
The Fund is subject to broad risks associated with investing in equity securities markets generally, including the risks that the securities and markets in which it invests may experience volatility and instability, that domestic and global economies and markets may undergo periods of cyclical change and decline, that investors may at times avoid investments in equity securities, and that investments may not perform as anticipated. Please see the Prospectus for more information.
The Fund is not managed to track the benchmark index, and may hold a substantially overweight or underweight position in a sector, industry, or security compared to its weight in the benchmark. For informational purposes, the discussion below may compare the benchmark weight or performance of a sector or industry to the investment approach of the Fund.
The Fund’s underperformance as compared to the S&P 500 Index for the six-month period ended March 31, 2016 was primarily attributable to certain holdings in the Health Care and Information Technology sectors.
Health Care services provider Acadia Healthcare Company, Inc. posted a return of -17% during the period. Though the company has relatively little Medicare exposure, Acadia’s stock price slumped in tandem with many of its industry peers on worries about government reimbursement for health facilities and services. DexCom, Inc., a developer of continuous glucose monitoring systems for people with diabetes, returned -21%.
Several of the Fund’s holdings in the Pharmaceuticals, Biotechnology & Life Sciences industry group also posted negative returns. Alkermes PLC, an Ireland-based specialty pharmaceutical company, slid -42% during the period and was sold. Regeneron Pharmaceuticals, Inc. and Alexion Pharmaceuticals, Inc. declined -24% and
-11%, respectively. We significantly reduced the Fund’s holding in Regeneron because the US government is stepping up efforts to control Medicare Part B costs, an area where Regeneron has more exposure than many of its peers. The Fund added to its position in Alexion, a developer of treatments for rare diseases, at what we consider to be attractive stock prices. Among the products in Alexion’s pipeline is Soliris, a breakthrough drug for treatment of a rare, life-threatening blood disorder.
A few of the Fund’s Information Technology holdings posted negative returns and had an adverse effect on Fund performance. Cybersecurity provider Palo Alto Networks, Inc. slipped -5% on market concerns about slower spending by corporate enterprise customers. NXP Semiconductors N.V. (-22% prior to being sold) posted a negative return on concerns about weaker demand for semiconductors and rising inventory levels. Video game software company Electronic Arts, Inc.’s stock price dipped -2% during the period. We maintained the Fund’s position in Electronic Arts because we believe the firm’s profitability should improve as new video game consoles make it more convenient for players to download video games online, rather than purchasing physical copies of game software.
The Utilities and Consumer Staples sectors were among the stronger-performing sectors of the S&P 500 Index. The Fund’s performance was held back by having no exposure to Utilities and by being underweight the Consumer Staples sector.
16
Within the Consumer Discretionary sector, Tesla Motors, Inc. (-7%) was a holding that detracted from Fund performance. Tesla’s stock price was subject to heightened volatility given uncertainty about the macroeconomic environment and the growth and timing of new vehicle deliveries.
On the brighter side, many other Fund holdings in the Consumer Discretionary sector performed well. Chinese online travel reservations company Ctrip.com International, Ltd. ADR soared +40%. Ctrip’s business has benefitted from a growing middle class in China that is increasing tourist travel. Pizza delivery company Domino’s Pizza, Inc. gained +23% as the company reported strong same store sales growth. Central to our investment thesis is Domino’s use of technology to enable customers to place their orders more efficiently, and other technology enhancements to prepare and deliver pizzas more quickly.
Positive performance in the Fund’s Materials holdings was led by The Sherwin-Williams Company (+28%), which has benefitted from lower raw materials costs and a stronger housing market.
The Fund did well by having little exposure to the Financials sector, the weakest-performing sector of the benchmark index. The Fund also benefitted from having a significant portion of its assets invested in the strong-performing Information Technology sector.
The Fund invests across the market capitalization spectrum in companies of any size. In aggregate, the Fund’s large capitalization stocks outperformed its medium and small capitalization holdings. Stocks of large companies are often perceived by investors as being a safer bet during periods of uncertain global conditions. We chose to continue to hold stocks in what we considered to be high quality smaller and medium-sized companies that we believe to offer strong long-term growth potential.
During the reporting period, the Fund significantly reduced its exposure to the Health Care sector. The Fund increased investment in the Information Technology, Consumer Staples, Consumer Discretionary, and Financials sectors.
Fiscal Period-End Investment Posture
As of March 31, 2016, the Fund’s primary economic sector allocations included Information Technology, Consumer Discretionary, Health Care, Industrials, and Financials. The Fund had no investments in the Energy or Utilities sectors.
Sincerely,
BRANDON A. GEISLER
PORTFOLIO MANAGER
(1) | Total returns are based on net change in net asset value assuming reinvestment of distributions. Periodically, certain fees and expenses have been waived or reimbursed by the Adviser for the 21st Century Fund. In the absence of such a waiver, the performance returns reflected would have been reduced. In accordance with the expense limitation and fee waiver agreement, the Adviser may recoup fees and expenses previously waived or reimbursed under certain parameters. Periodically, the Adviser has recouped such fees or expenses from the 21st Century Fund resulting in a lower performance return. Please see the Prospectus for more information. |
17
March 31, 2016 (Unaudited)
The 21st Century Fund invests primarily in common stocks that are selected for their long-term growth potential. The Fund may invest in companies of any size, and will normally hold a core position of between 35 and 60 common stocks.
TOTAL ANNUAL OPERATING EXPENSES* | 1.33% | NET ASSETS $251,975,686 | NET ASSET VALUE PER SHARE $20.62 |
GROWTH OF $10,000(1)(2) | PERFORMANCE COMPARISON |
| 
|
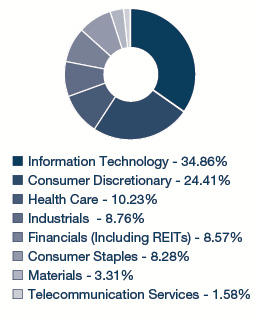
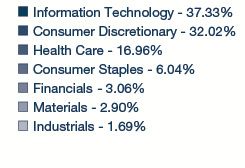
SECTOR ALLOCATION(3) | TOP FIVE HOLDINGS |
| | | | |
| | Facebook, Inc. - Cl. A | 6.04% | |
| | Domino's Pizza, Inc. | 4.28% | |
| | Constellation Brands, Inc. - Cl. A | 4.06% | |
| | salesforce.com, inc. | 3.92% | |
| | Amazon.com, Inc. | 3.83% | |
| | | | |
* | The Total Annual Operating Expenses are reflective of the information disclosed in the Funds’ Prospectus dated January 29, 2016 and may differ from the expense ratio disclosed in this report. |
| The performance data quoted here represent past performance, and past performance is not a guarantee of future results. Investment return and principal value of an investment will fluctuate so that an investor’s shares, when redeemed, may be worth more or less than their original cost. Current performance may be lower or higher than the performance information quoted. To obtain performance information current to the most recent month-end, please call 888-860-8686 or visit marsicofunds.com. |
| The performance included in the chart and graph does not reflect the deduction of taxes on Fund distributions or the redemption of Fund shares. |
| All indices are unmanaged and investors cannot invest directly in an index. |
(1) | Periodically, certain fees and expenses have been waived or reimbursed by the Adviser for the 21st Century Fund. In the absence of such a waiver, the performance returns reflected would have been reduced. In accordance with the expense limitation and fee waiver agreement, the Adviser may recoup fees and expenses previously waived or reimbursed under certain parameters. Periodically, the Adviser has recouped such fees or expenses from the 21st Century Fund resulting in a lower performance return. |
(2) | This chart assumes an initial investment of $10,000 made on March 31, 2006. Total returns are based on net change in NAV, assuming reinvestment of distributions. |
(3) | Sector weightings represent the percentage of the Fund’s investments (excluding cash equivalents) in certain general sectors. These sectors may include more than one industry. The Fund’s portfolio composition is subject to change at any time. |
18
MARSICO 21st CENTURY FUND
SCHEDULE OF INVESTMENTS
March 31, 2016 (Unaudited)
| | | Number
of
Shares | | | Value | | | Percent
of Net
Assets | |
COMMON STOCKS | | | | | | | | | |
Aerospace & Defense | | | | | | | | | |
BE Aerospace, Inc. | | | 91,649 | | | $ | 4,226,852 | | | | 1.68 | % |
| | | | | | | | | | | | | |
Airlines | | | | | | | | | | | | |
Delta Air Lines, Inc. | | | 59,247 | | | | 2,884,144 | | | | 1.14 | |
| | | | | | | | | | | | | |
Application Software | | | | | | | | | | | | |
Adobe Systems, Inc.* | | | 54,413 | | | | 5,103,939 | | | | 2.02 | |
Atlassian Corporation PLC - Cl. A* | | | 29,829 | | | | 750,199 | | | | 0.30 | |
Blackbaud, Inc. | | | 50,875 | | | | 3,199,529 | | | | 1.27 | |
Mobileye N.V.* | | | 64,247 | | | | 2,395,771 | | | | 0.95 | |
salesforce.com, inc.* | | | 133,819 | | | | 9,879,857 | | | | 3.92 | |
The Descartes Systems Group, Inc.* | | | 107,200 | | | | 2,086,634 | | | | 0.83 | |
| | | | | | | | 23,415,929 | | | | 9.29 | |
Automobile Manufacturers | |
Tesla Motors, Inc.* | | | 8,181 | | | | 1,879,748 | | | | 0.75 | |
| | | | | | | | | | | | | |
Automotive Retail | | | | | | | | | | | | |
O'Reilly Automotive, Inc.* | | | 23,445 | | | | 6,415,959 | | | | 2.55 | |
| | | | | | | | | | | | | |
Biotechnology | | | | | | | | | | | | |
Alexion Pharmaceuticals, Inc.* | | | 36,712 | | | | 5,111,045 | | | | 2.03 | |
Regeneron Pharmaceuticals, Inc.* | | | 3,398 | | | | 1,224,775 | | | | 0.48 | |
| | | | | | | | 6,335,820 | | | | 2.51 | |
Communications Equipment | |
Palo Alto Networks, Inc.* | | | 25,318 | | | | 4,130,379 | | | | 1.64 | |
| | | | | | | | | | | | | |
Construction Materials | | | | | | | | | | | | |
Vulcan Materials Company | | | 35,955 | | | | 3,795,769 | | | | 1.51 | |
| | | | | | | | | | | | | |
Data Processing & Outsourced Services | |
Broadridge Financial Solutions, Inc. | | | 43,624 | | | | 2,587,340 | | | | 1.03 | |
FleetCor Technologies, Inc.* | | | 35,943 | | | | 5,346,521 | | | | 2.12 | |
MasterCard, Inc. - Cl. A | | | 86,574 | | | | 8,181,243 | | | | 3.25 | |
Paysafe Group PLC* | | | 557,718 | | | | 3,393,930 | | | | 1.35 | |
Vantiv, Inc. - Cl. A* | | | 55,837 | | | | 3,008,498 | | | | 1.19 | |
| | | | | | | | 22,517,532 | | | | 8.94 | |
Distillers & Vintners | | | | | | | | | | | | |
Constellation Brands, Inc. - Cl. A | | | 67,713 | | | | 10,230,757 | | | | 4.06 | |
| | | | | | | | | | | | | |
Diversified Support Services | |
Healthcare Services Group, Inc. | | | 135,549 | | | | 4,989,559 | | | | 1.98 | |
| | | | | | | | | | | | | |
Environmental & Facilities Services | |
Stericycle, Inc.* | | | 31,068 | | | | 3,920,471 | | | | 1.56 | |
| | | | | | | | | | | | | |
General Merchandise Stores | |
Burlington Stores, Inc.* | | | 138,828 | | | | 7,807,687 | | | | 3.10 | |
| | | | | | | | | | | | | |
Health Care Equipment | |
DexCom, Inc.* | | | 55,398 | | | | 3,762,078 | | | | 1.49 | |
Intuitive Surgical, Inc.* | | | 12,209 | | | | 7,338,220 | | | | 2.91 | |
| | | | | | | | 11,100,298 | | | | 4.40 | |
COMMON STOCKS (Continued) | | | | | |
Health Care Facilities | | | | | | | | | | | | |
Acadia Healthcare Company, Inc.* | | | 76,055 | | | $ | 4,191,391 | | | | 1.66 | % |
| | | | | | | | | | | | | |
Home Entertainment Software | |
Electronic Arts, Inc.* | | | 129,782 | | | | 8,579,888 | | | | 3.40 | |
| | | | | | | | | | | | | |
Hotels, Resorts & Cruise Lines | |
Norwegian Cruise Line Holdings Ltd.* | | | 140,814 | | | | 7,785,606 | | | | 3.09 | |
| | | | | | | | | | | | | |
Internet Retail | | | | | | | | | | | | |
Amazon.com, Inc.* | | | 16,239 | | | | 9,640,120 | | | | 3.83 | |
Ctrip.com International, Ltd. ADR* | | | 133,157 | | | | 5,893,529 | | | | 2.34 | |
NetFlix, Inc.* | | | 38,766 | | | | 3,963,048 | | | | 1.57 | |
| | | | | | | | 19,496,697 | | | | 7.74 | |
Internet Software & Services | |
CoStar Group, Inc.* | | | 35,500 | | | | 6,680,035 | | | | 2.65 | |
Facebook, Inc. - Cl. A* | | | 133,453 | | | | 15,226,987 | | | | 6.04 | |
Scout24 A.G.* | | | 49,007 | | | | 1,700,834 | | | | 0.68 | |
| | | | | | | | 23,607,856 | | | | 9.37 | |
Investment Banking & Brokerage | |
The Charles Schwab Corporation | | | 270,012 | | | | 7,565,736 | | | | 3.00 | |
| | | | | | | | | | | | | |
Life Sciences Tools & Services | |
Illumina, Inc.* | | | 11,898 | | | | 1,928,785 | | | | 0.77 | |
| | | | | | | | | | | | | |
Movies & Entertainment | | | | | | | | | | | | |
Imax Corporation* | | | 82,553 | | | | 2,566,573 | | | | 1.02 | |
| | | | | | | | | | | | | |
Packaged Foods & Meats | | | | | | | | | | | | |
Blue Buffalo Pet Products, Inc.* | | | 55,386 | | | | 1,421,205 | | | | 0.56 | |
TreeHouse Foods, Inc.* | | | 70,031 | | | | 6,075,189 | | | | 2.41 | |
| | | | | | | | 7,496,394 | | | | 2.97 | |
Pharmaceuticals | | | | | | | | | | | | |
Concordia Healthcare Corporation | | | 54,565 | | | | 1,396,528 | | | | 0.55 | |
| | | | | | | | | | | | | |
Railroads | | | | | | | | | | | | |
Genesee & Wyoming, Inc. - Cl. A* | | | 22,906 | | | | 1,436,206 | | | | 0.57 | |
| | | | | | | | | | | | | |
Regional Banks | | | | | | | | | | | | |
First Republic Bank | | | 119,652 | | | | 7,973,609 | | | | 3.16 | |
Signature Bank* | | | 10,000 | | | | 1,361,200 | | | | 0.54 | |
| | | | | | | | 9,334,809 | | | | 3.70 | |
Research & Consulting Services | |
Verisk Analytics, Inc. - Cl. A* | | | 49,049 | | | | 3,919,996 | | | | 1.56 | |
| | | | | | | | | | | | | |
Restaurants | | | | | | | | | | | | |
Domino's Pizza, Inc. | | | 81,722 | | | | 10,775,863 | | | | 4.28 | |
| | | | | | | | | | | | | |
Semiconductors | | | | | | | | | | | | |
ARM Holdings PLC | | | 190,851 | | | | 2,779,471 | | | | 1.10 | |
| | | | | | | | | | | | | |
Soft Drinks | | | | | | | | | | | | |
Monster Beverage Corporation* | | | 18,538 | | | | 2,472,598 | | | | 0.98 | |
| See notes to financial statements. |
19
MARSICO 21st CENTURY FUND
SCHEDULE OF INVESTMENTS (continued)
March 31, 2016 (Unaudited)
| | | Number
of
Shares | | | Value | | | Percent
of Net
Assets | |
COMMON STOCKS (Continued) | | | | |
Specialized REITs | | | | | | | | | |
Crown Castle International Corp. | | | 46,397 | | | $ | 4,013,340 | | | | 1.59 | % |
| | | | | | | | | | | | | |
Specialty Chemicals | | | | | | | | | | | | |
The Sherwin-Williams Company | | | 15,007 | | | | 4,272,043 | | | | 1.70 | |
| | | | | | | | | | | | | |
Specialty Stores | | | | | | | | | | | | |
Ulta Salon Cosmetics & Fragrance, Inc.* | | | 14,520 | | | | 2,813,105 | | | | 1.12 | |
| | | | | | | | | | | | | |
Wireless Telecommunication Services | |
SBA Communications Corporation - Cl. A* | | | 38,489 | | | | 3,855,443 | | | | 1.53 | |
| | | | | | | | | | | | | |
TOTAL COMMON STOCKS | | | | | | | | | | | | |
(Cost $199,059,440) | | | | | | | 243,939,232 | | | | 96.81 | |
| | | | | | | | | | | | | |
SHORT-TERM INVESTMENTS | |
State Street Institutional Treasury Money Market Fund, 0.000% | | | 9,394,244 | | | | 9,394,244 | | | | 3.73 | |
| | | | | | | | | | | | | |
TOTAL SHORT-TERM INVESTMENTS | |
(Cost $9,394,244) | | | | | | | 9,394,244 | | | | 3.73 | |
| | | | | | | | | | | | | |
TOTAL INVESTMENTS | | | | | | | | | | | | |
(Cost $208,453,684) | | | | | | | 253,333,476 | | | | 100.54 | |
| | | | | | | | | | | | | |
Liabilities, Less Cash and Other Assets | | | | | | | (1,357,790 | ) | | | (0.54 | ) |
| | | | | | | | | | | | | |
NET ASSETS | | | | | | $ | 251,975,686 | | | | 100.00 | % |
| | | See notes to financial statements. |
20
| INTERNATIONAL OPPORTUNITIES FUND |
INVESTMENT REVIEW BY MUNISH MALHOTRA (UNAUDITED)
The Marsico International Opportunities Fund posted a total return of (US$) +2.55% for the six-month fiscal period ended March 31, 2016. The Fund outperformed the MSCI EAFE Index, which is the Fund’s benchmark index and had a total return of (US$) +1.56% over the same time period. Please see the Fund Overview for more detailed information about the Fund’s longer-term performance for various time periods ended March 31, 2016.
The performance data for the Fund quoted here represent past performance, and past performance is not a guarantee of future results. Investment return and principal value of an investment will fluctuate so that an investor’s shares, when redeemed, may be worth more or less than their original cost. Current performance may be lower or higher than the performance information quoted. To obtain performance information current to the most recent month-end, please call 888-860-8686 or visit marsicofunds.com. (1)
This review highlights Fund performance over a six-month fiscal period. Shareholders should keep in mind that the Fund is intended for long-term investors who hold their shares for substantially longer periods of time. You should also keep in mind that our current views and beliefs regarding all investments discussed in this report are subject to change at any time. References to specific securities, industries, and sectors discussed in this report are not recommendations to buy or sell such securities or related investments, and the Fund may not necessarily hold these securities or investments today. Please see the accompanying Schedule of Investments for the percentage of the Fund’s portfolio represented by the securities mentioned in this report as of the end of the reporting period.
Foreign investments present additional risks due to currency fluctuations, economic and political factors, lower liquidity, differences in securities regulations and accounting standards, possible changes in taxation, limited public information, and other factors. In addition, the Fund is subject to broad risks associated with investing in equity securities markets generally, including the risks that the securities and markets in which it invests may experience volatility and instability, that domestic and global economies and markets may undergo periods of cyclical change and decline, that investors may at times avoid investments in equity securities, and that investments may not perform as anticipated. Please see the Prospectus for more information.
The Fund is not managed to track the benchmark index, and may hold a substantially overweight or underweight position in a sector, industry, or security compared to its weight in the benchmark. For informational purposes, the discussion below may compare the benchmark weight or performance of a sector or industry to the investment approach of the Fund.
The Marsico International Opportunities Fund’s outperformance during the six months ended March 31, 2016, as compared to the MSCI EAFE Index, was primarily attributable to certain outperforming stocks we selected in the Consumer Discretionary sector.
Several of the Fund’s positions in the Retailing and Consumer Services industries were significant, positive contributors to performance. Chinese online travel reservations company Ctrip.com International, Ltd. ADR soared +40%. Ctrip’s business has benefitted from a growing middle class in China that is increasing tourist travel. Canadian discount retailer Dollarama, Inc. gained +35% as the company reported strong same store sales growth, benefiting from value conscious spending by consumers. Pizza delivery is a growing franchise business in Australia, where Domino’s Pizza Enterprises Ltd. (+57%) operates. Central to our investment thesis is Domino’s use of technology to enable customers to place their orders more efficiently, and other innovative enhancements to prepare and deliver pizzas more quickly. Japanese ecommerce fashion retailer Start Today Company Ltd. rose +22%. The company has made improvements to its smartphone app and is rolling out new discount promotions to help drive sales.
Media holdings REA Group Ltd. and JC Decaux S.A. gained +35% and +20%, respectively. REA’s Australian online real estate advertising service has seen improving revenue as its user base continues to grow. Advertising company JC Decaux’s stock price was buoyed during the period on strong revenues from Asia and rollout of its digital billboards.
The stocks we selected in the Information Technology sector exhibited strong performance, led by holdings in the Software & Services industry. Social media company Facebook, Inc. – Cl. A gained +24%. Facebook announced results that exceeded market expectations, led by strong advertising revenue and monthly active user growth rates. Chinese Internet services company Tencent Holdings Ltd. gained +22% as the company generated strong revenue growth from its mobile gaming business. United Kingdom headquartered electronic payment processor Paysafe Group PLC (+16%) benefited from
21
| INTERNATIONAL OPPORTUNITIES FUND |
growth in its North American processing business. The Fund’s overweight allocation to the Information Technology sector further benefitted performance, as Information Technology was among the stronger-performing sectors of the MSCI EAFE Index.
Financials was the weakest-performing sector of the benchmark index, posting a return of -6%. Maintaining a significant underweight allocation to the sector, relative to the benchmark index, therefore benefitted the Fund. Our selection of stocks within the sector also contributed to the Fund’s outperformance relative to the benchmark index, as the Fund’s sole Financials holding as of March 31, 2016, Hargreaves Lansdown PLC, posted a return of +6% during the reporting period.
There were a few areas of negative performance during the reporting period. In particular, several of the Fund’s holdings within the Pharmaceutical, Biotechnology & Life Sciences industry posted negative returns. Negative effects of currency translation and political pressure surrounding drug pricing were factors contributing to stock price declines for many pharmaceutical and biotechnology companies. We believe political rhetoric may continue for some time, and we therefore reduced the Fund’s investments in the industry, selling specialty pharmaceutical and biotechnology holdings including Alkermes PLC (-42%), Endo International PLC (-19%), UCB S.A., (-14%) and Perrigo Company (-19%). The Fund maintained its position in Concordia Healthcare Corporation (-39%), as we like the company’s strong generic drug offerings and believe that companies offering affordable and effective treatments will be rewarded over the longer term.
Consumer Staples was one of the stronger-performing sectors of the benchmark index, and the Fund’s return was held back by having few investments in the sector. One of the Fund’s holdings in the sector, premier spirits company Pernod Ricard S.A., posted a return of -8% during the period prior to being sold, and was an additional detractor from performance.
Other individual holdings having a material, negative effect on Fund performance included Information Technology holdings NXP Semiconductors N.V. and Wirecard A.G. (-17%) posted a negative return on concerns about weaker demand for semiconductors and rising inventory levels. The Fund trimmed its position in the stock. Payment processor Wirecard A.G. posted a return of -25% prior to being sold in favor of other investments in which we have higher conviction.
The Fund had no investments in the Telecommunication Services and Energy sectors during the period. This positioning held back performance to a degree on a relative basis, as the sectors were among the stronger-performing areas of the benchmark index.
Although active currency management is not a central facet of the Fund’s investment process, fluctuations in major world currencies can at times affect the Fund’s performance. During the period, the net effect of currency moves was modestly negative for the Fund. The Fund’s results also were modestly negatively affected by having an underweight allocation, as compared to the MSCI EAFE Index, to investments denominated in the Japanese yen, which strengthened relative to the US dollar during the period.
There were a few shifts in the Fund’s sector allocations during the period. The Fund reduced its allocations to the Health Care and Consumer Discretionary sectors and increased its allocations to the Information Technology and Consumer Staples sectors.
The International Opportunities Fund experienced elevated portfolio turnover during the period, which primarily related to the Fund’s changing its portfolio composition to reinvest in other positions that we believe may have more upside potential and to take advantage of new opportunities. Portfolio turnover increases transaction-related expenses and could reduce Fund returns.
Fiscal Period-End Investment Posture
As of March 31, 2016, the Fund’s primary economic sector allocations included Information Technology, Consumer Discretionary, and Health Care. The Fund had no exposure to the Energy, Utilities, Telecommunication Services, and Materials sectors.
22
| INTERNATIONAL OPPORTUNITIES FUND |
In terms of country allocations, the Fund’s most significant weightings at period-end, excluding short-term investments, were the United States, the United Kingdom, Australia, Canada, and China/Hong Kong. The Fund’s United States holdings primarily comprised multi-national companies. Country-level weightings generally should be considered a residual of the Fund’s stock selection process rather than a major, proactive facet of its investment strategy.
Sincerely,
MUNISH MALHOTRA, CFA
PORTFOLIO MANAGER
(1) | Total returns are based on net change in net asset value assuming reinvestment of distributions. Periodically, certain fees and expenses have been waived or reimbursed by the Adviser for the International Opportunities Fund. In the absence of such a waiver, the performance returns reflected would have been reduced. In accordance with the expense limitation and fee waiver agreement, the Adviser may recoup fees and expenses previously waived or reimbursed under certain parameters. Periodically, the Adviser has recouped such fees or expenses from the International Opportunities Fund resulting in a lower performance return. Please see the Prospectus for more information. |
23
| INTERNATIONAL OPPORTUNITIES FUND OVERVIEW |
March 31, 2016 (Unaudited)
The International Opportunities Fund invests primarily (no less than 65% of its total assets) in common stocks of foreign companies that are selected for their long-term growth potential, including foreign securities, whether traded in the US (including as American Depositary Receipts) or in foreign markets or both. The Fund may invest in an unlimited number of companies of any size throughout the world. It normally invests in the securities of issuers that are economically tied to one or more foreign countries, and expects to be invested in various issuers or securities that together have ties to at least four different foreign countries. Some issuers or securities in the Fund’s portfolio may be economically tied to the United States or to emerging markets.
TOTAL ANNUAL OPERATING EXPENSES* NET EXPENSES*† | 1.58% 1.60% | NET ASSETS $68,781,460 | NET ASSET VALUE PER SHARE $14.88 |
GROWTH OF $10,000(1)(2) | PERFORMANCE COMPARISON |
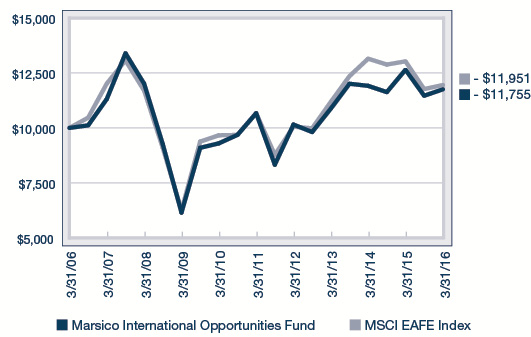
| 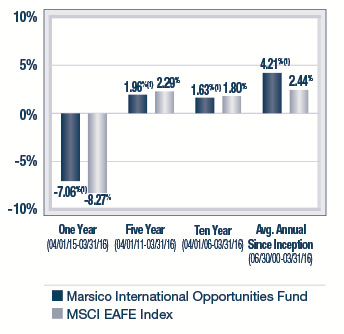
|
SECTOR ALLOCATION(3) | TOP FIVE HOLDINGS |
 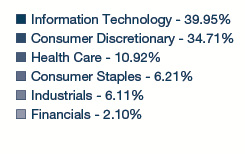
| | | | |
| | Domino's Pizza Enterprises Ltd. | 4.97% | |
| | Tencent Holdings Ltd. | 4.23% | |
| | MasterCard, Inc. - Cl. A | 4.04% | |
| | Reckitt Benckiser Group PLC | 3.94% | |
| | Novo Nordisk A/S - Cl. B | 3.65% | |
| | | | |
* | The Total Annual Operating Expenses and Net Expenses are reflective of the information disclosed in the Funds’ Prospectus dated January 29, 2016 and may differ from the expense ratios disclosed in this report. |
† | Marsico Capital Management, LLC (the “Adviser”) has entered into a written expense limitation and fee waiver agreement under which it has agreed to limit the total expenses of the International Opportunities Fund (excluding interest, taxes, acquired fund fees and expenses, litigation, brokerage and extraordinary expenses) to an annual rate of 1.60% of the Fund’s average net assets until January 31, 2017. This expense limitation and fee waiver agreement may be terminated by the Adviser at any time after January 31, 2017, upon 15 days prior notice to the Fund and its administrator. The Adviser may recoup from the Fund fees previously waived or expenses previously reimbursed by the Adviser with respect to the Fund pursuant to this agreement (or a previous expense limitation agreement) if: (1) such recoupment by the Adviser does not cause the Fund, at the time of recoupment, to exceed the lesser of (a) the expense limitation in effect at the time the relevant amount was waived and/or reimbursed, or (b) the expense limitation in effect at the time of the proposed recoupment, and (2) the recoupment is made within three fiscal years after the end of the fiscal year in which the amount was waived or reimbursed. |
| The performance data quoted here represent past performance, and past performance is not a guarantee of future results. Investment return and principal value of an investment will fluctuate so that an investor’s shares, when redeemed, may be worth more or less than their original cost. Current performance may be lower or higher than the performance information quoted. To obtain performance information current to the most recent month-end, please call 888-860-8686 or visit marsicofunds.com. |
| The performance included in the chart and graph does not reflect the deduction of taxes on Fund distributions or the redemption of Fund shares. |
| All indices are unmanaged and investors cannot invest directly in an index. |
(1) | Periodically, certain fees and expenses have been waived or reimbursed by the Adviser for the International Opportunities Fund. In the absence of such a waiver, the performance returns reflected would have been reduced. In accordance with the expense limitation and fee waiver agreement, the Adviser may recoup fees and expenses previously waived or reimbursed under certain parameters. Periodically, the Adviser has recouped such fees or expenses from the International Opportunities Fund resulting in a lower performance return. |
(2) | This chart assumes an initial investment of $10,000 made on March 31, 2006. Total returns are based on net change in NAV, assuming reinvestment of distributions. |
(3) | Sector weightings represent the percentage of the Fund’s investments (excluding cash equivalents) in certain general sectors. These sectors may include more than one industry. The Fund’s portfolio composition is subject to change at any time. |
| The MSCI EAFE Index tracks the stocks of about 1,000 companies in Europe, Australasia, and the Far East (EAFE). |
24
MARSICO INTERNATIONAL OPPORTUNITIES FUND
SCHEDULE OF INVESTMENTS
March 31, 2016 (Unaudited)
| | | Number
of
Shares | | | Value | | | Percent
of Net
Assets | |
COMMON STOCKS | | | | | | | | | |
Advertising | | | | | | | | | |
JC Decaux S.A. | | | 48,302 | | | $ | 2,114,420 | | | | 3.07 | % |
REA Group Ltd. | | | 52,620 | | | | 2,179,347 | | | | 3.17 | |
| | | | | | | | 4,293,767 | | | | 6.24 | |
Airlines | | | | | | | | | | | | |
Ryanair Holdings PLC Spon. ADR | | | 24,095 | | | | 2,067,833 | | | | 3.01 | |
| | | | | | | | | | | | | |
Apparel, Accessories & Luxury Goods | |
lululemon athletica, inc.* | | | 10,364 | | | | 701,746 | | | | 1.02 | |
| | | | | | | | | | | | | |
Application Software | | | | | | | | | | | | |
Constellation Software, Inc. | | | 3,211 | | | | 1,314,785 | | | | 1.91 | |
Mobileye N.V.* | | | 23,244 | | | | 866,769 | | | | 1.26 | |
SAP S.E. | | | 24,518 | | | | 1,983,621 | | | | 2.88 | |
| | | | | | | | 4,165,175 | | | | 6.05 | |
Asset Management & Custody Banks | |
Hargreaves Lansdown PLC | | | 72,565 | | | | 1,400,736 | | | | 2.04 | |
| | | | | | | | | | | | | |
Cable & Satellite | | | | | | | | | | | | |
Liberty Global PLC - Series C* | | | 35,539 | | | | 1,334,845 | | | | 1.94 | |
| | | | | | | | | | | | | |
Casinos & Gaming | | | | | | | | | | | | |
Wynn Resorts Ltd. | | | 15,383 | | | | 1,437,234 | | | | 2.09 | |
| | | | | | | | | | | | | |
Data Processing & Outsourced Services | |
MasterCard, Inc. - Cl. A | | | 29,439 | | | | 2,781,986 | | | | 4.04 | |
Paysafe Group PLC* | | | 357,591 | | | | 2,176,080 | | | | 3.16 | |
Worldpay Group PLC* | | | 314,591 | | | | 1,242,987 | | | | 1.81 | |
| | | | | | | | 6,201,053 | | | | 9.01 | |
Drug Retail | | | | | | | | | | | | |
Sundrug Company Ltd. | | | 19,300 | | | | 1,443,920 | | | | 2.10 | |
| | | | | | | | | | | | | |
General Merchandise Stores | |
Dollarama, Inc. | | | 34,954 | | | | 2,459,631 | | | | 3.58 | |
| | | | | | | | | | | | | |
Health Care Equipment | | | | | | | | | | | | |
Medtronic PLC | | | 26,272 | | | | 1,970,400 | | | | 2.86 | |
| | | | | | | | | | | | | |
Hotels, Resorts & Cruise Lines | |
Norwegian Cruise Line Holdings Ltd.* | | | 38,560 | | | | 2,131,982 | | | | 3.10 | |
| | | | | | | | | | | | | |
Household Products | | | | | | | | | | | | |
Reckitt Benckiser Group PLC | | | 28,021 | | | | 2,708,498 | | | | 3.94 | |
| | | | | | | | | | | | | |
COMMON STOCKS (Continued) | | | | | | | | | |
Internet Retail | | | | | | | | | | | | |
Ctrip.com International, Ltd. ADR* | | | 48,379 | | | $ | 2,141,255 | | | | 3.11 | % |
Start Today Company Ltd. | | | 33,900 | | | | 1,367,506 | | | | 1.99 | |
Yoox SpA* | | | 34,665 | | | | 1,063,840 | | | | 1.55 | |
| | | | | | | | 4,572,601 | | | | 6.65 | |
Internet Software & Services | |
Alphabet, Inc. - Cl. A* | | | 2,717 | | | | 2,072,799 | | | | 3.01 | |
Auto Trader Group PLC | | | 383,883 | | | | 2,150,272 | | | | 3.13 | |
carsales.com Ltd. | | | 165,350 | | | | 1,490,569 | | | | 2.17 | |
Facebook, Inc. - Cl. A* | | | 18,472 | | | | 2,107,655 | | | | 3.06 | |
Scout24 A.G.* | | | 42,976 | | | | 1,491,523 | | | | 2.17 | |
Tencent Holdings Ltd. | | | 142,300 | | | | 2,907,507 | | | | 4.23 | |
| | | | | | | | 12,220,325 | | | | 17.77 | |
Movies & Entertainment | | | | | | | | | | | | |
Imax Corporation* | | | 22,619 | | | | 703,225 | | | | 1.02 | |
| | | | | | | | | | | | | |
Pharmaceuticals | | | | | | | | | | | | |
Concordia Healthcare Corporation | | | 51,321 | | | | 1,313,502 | | | | 1.91 | |
Novo Nordisk A/S - Cl. B | | | 46,338 | | | | 2,513,439 | | | | 3.65 | |
Ono Pharmaceutical Company Ltd. | | | 35,500 | | | | 1,503,021 | | | | 2.19 | |
| | | | | | | | 5,329,962 | | | | 7.75 | |
Research & Consulting Services | |
Nielsen Holdings N.V. | | | 38,305 | | | | 2,017,141 | | | | 2.93 | |
| | | | | | | | | | | | | |
Restaurants | | | | | | | | | | | | |
Domino's Pizza Enterprises Ltd. | | | 77,630 | | | | 3,420,479 | | | | 4.97 | |
Domino's Pizza Group PLC | | | 148,871 | | | | 2,155,264 | | | | 3.14 | |
| | | | | | | | 5,575,743 | | | | 8.11 | |
Semiconductor Equipment | |
ASML Holding N.V. | | | 20,278 | | | | 2,060,076 | | | | 2.99 | |
| | | | | | | | | | | | | |
Semiconductors | | | | | | | | | | | | |
ARM Holdings PLC | | | 93,677 | | | | 1,364,271 | | | | 1.99 | |
NXP Semiconductors N.V.* | | | 8,679 | | | | 703,607 | | | | 1.02 | |
| | | | | | | | 2,067,878 | | | | 3.01 | |
TOTAL COMMON STOCKS | | | | | | | | | | | | |
(Cost $56,411,544) | | | | | | | 66,863,771 | | | | 97.21 | |
| | | | | | | | | | | | | |
SHORT-TERM INVESTMENTS | |
State Street Institutional Treasury Money Market Fund, 0.000% | | | 3,419,600 | | | | 3,419,600 | | | | 4.97 | |
| | | | | | | | | | | | | |
TOTAL SHORT-TERM INVESTMENTS | |
(Cost $3,419,600) | | | | | | | 3,419,600 | | | | 4.97 | |
| | | | | | | | | | | | | |
TOTAL INVESTMENTS | | | | | | | | | | | | |
(Cost $59,831,144) | | | | | | | 70,283,371 | | | | 102.18 | |
| | | | | | | | | | | | | |
Liabilities, Less Cash and Other Assets | | | | | | | (1,501,911 | ) | | | (2.18 | ) |
| | | | | | | | | | | | | |
NET ASSETS | | | | | | $ | 68,781,460 | | | | 100.00 | % |
| See notes to financial statements. |
25
MARSICO INTERNATIONAL OPPORTUNITIES FUND
SCHEDULE OF INVESTMENTS (continued)
March 31, 2016 (Unaudited)
SUMMARY OF INVESTMENTS BY COUNTRY | |
Country | | Market Value | | | Percent of
Investment
Securities | |
Australia | | $ | 7,090,395 | | | | 10.09 | % |
Canada | | | 5,791,143 | | | | 8.24 | |
China/Hong Kong | | | 5,048,762 | | | | 7.18 | |
Denmark | | | 2,513,439 | | | | 3.58 | |
France | | | 2,114,420 | | | | 3.01 | |
Germany | | | 3,475,144 | | | | 4.94 | |
Ireland | | | 2,067,833 | | | | 2.94 | |
Israel | | | 866,769 | | | | 1.23 | |
Italy | | | 1,063,840 | | | | 1.51 | |
Japan | | | 4,314,447 | | | | 6.14 | |
Netherlands | | | 2,763,683 | | | | 3.93 | |
United Kingdom | | | 14,532,953 | | | | 20.69 | |
United States(1) | | | 18,640,543 | | | | 26.52 | |
| | | $ | 70,283,371 | | | | 100.00 | % |
(1) | | Includes short-term securities, if any. |
| See notes to financial statements. |
26
INVESTMENT REVIEW BY MUNISH MALHOTRA AND JORDON LAYCOB (UNAUDITED)
The Marsico Flexible Capital Fund posted a total return of +2.59% for the six-month fiscal period ended March 31, 2016. The Fund underperformed the S&P 500 Index, which is the Fund’s benchmark index and had a total return of +8.49% over the same time period. Please see the Fund Overview for more detailed information about the Fund’s performance for various time periods ended March 31, 2016.
The performance data for the Fund quoted here represent past performance, and past performance is not a guarantee of future results. Investment return and principal value of an investment will fluctuate so that an investor’s shares, when redeemed, may be worth more or less than their original cost. Current performance may be lower or higher than the performance information quoted. To obtain performance information current to the most recent month-end, please call 888-860-8686 or visit marsicofunds.com. (1)
This review highlights Fund performance over a six-month fiscal period. Shareholders should keep in mind that the Fund is intended for long-term investors who hold their shares for substantially longer periods of time. You should also keep in mind that our current views and beliefs regarding all investments discussed in this report are subject to change at any time. References to specific securities, industries, and sectors discussed in this report are not recommendations to buy or sell such securities or related investments, and the Fund may not necessarily hold these securities or investments today. Please see the accompanying Schedule of Investments for the percentage of the Fund’s portfolio represented by the securities mentioned in this report as of the end of the reporting period.
The Fund is subject to broad risks associated with investing in equity securities markets generally, including the risks that the securities and markets in which it invests may experience volatility and instability, that domestic and global economies and markets may undergo periods of cyclical change and decline, that investors may at times avoid investments in equity securities, and that investments may not perform as anticipated. Please see the Prospectus for more information.
The Fund is not managed to track the benchmark index, and may hold a substantially overweight or underweight position in a sector, industry, or security compared to its weight in the benchmark. For informational purposes, the discussion below may compare the benchmark weight or performance of a sector or industry to the investment approach of the Fund.
The Fund’s underperformance versus the S&P 500 Index was largely attributable to certain holdings in the Consumer Discretionary and Health Care sectors.
Consumer Discretionary position ClubCorp Holdings, Inc., the largest owner and operator of private golf and country clubs in the US, posted a return of -34%. The company’s stock declined on concerns that weak oil prices would negatively affect the company’s Texas clubs. We believed these fears to be overblown and maintained the position. Media positions Liberty Global PLC – Series C (-9%) and The Walt Disney Company (-2%) were other holdings in the Consumer Discretionary sector that had a negative impact on Fund performance. London-headquartered Liberty Global is the largest cable TV provider in Europe. Uncertainty regarding the European Union’s economy and consumer spending for pay TV weighed on the company’s stock price. We trimmed the Fund’s Walt Disney position as we believe the company may experience slower earnings growth in its core cable networks and broadcast businesses.
Two of the Fund’s holdings in the Pharmaceuticals, Biotechnology & Life Sciences industry posted negative returns. Eli Lilly & Company declined -13%. In early 2016, the company issued more conservative profit and revenue guidance due, in part, to foreign-exchange headwinds. We maintained the Fund’s position in Eli Lilly as we like its product pipeline for treatments in areas such as oncology, diabetes and rheumatoid arthritis. We sold Novartis AG (-17% during the period prior to being sold) after a disappointing launch of the company’s new heart failure drug and operational challenges in its eye care division.
Another of the Fund’s Health Care positions, Envision Healthcare Holdings, Inc., a provider of outsourced medical services, dropped -29% prior to being sold. Envision’s stock was under pressure as the company reported higher than anticipated turnover within its contract physician staffing segment.
From a sector allocation perspective, the Fund’s performance was impaired by having few investments in Telecommunication Services and no holdings in Utilities – the two strongest-performing sectors of the S&P 500 Index. In the uncertain macroeconomic environment, it seemed that dividend paying stocks perceived by the market to offer safety, such as Utilities and Telecommunications, were rewarded. We believed valuations for many companies in both sectors were high, and we found more compelling investment opportunities in other sectors.
27
On the brighter side, the Fund’s holdings in the Consumer Staples sector contributed positively to the Fund’s performance for the six-month period ended March 31, 2016. Constellation Brands, Inc. – Cl. A posted a return of +21% on continued growth in the company’s beer segment, which includes the Corona and Modelo brands. Molson Coors Brewing Company – Cl. B also performed well, gaining +17% during the period.
Other strong performing individual Fund holdings included social media company Facebook, Inc. – Cl. A (+27%) and commercial services firm Nielsen Holdings N.V. (+20%). Facebook announced results that exceeded market expectations, led by strong advertising revenue and monthly active user growth rates. Nielsen’s leadership position in media and retail measurement remains strong, and the company is gaining traction with its new unified rating for content shown across media including TV, desktops and mobile devices.
The Fund has a flexible mandate, and its allocations to equities, fixed income, preferred securities and cash may change over time. The Fund’s cash position was slightly elevated at times, particularly during the early portions of the reporting period. Much of the reporting period was characterized by volatility in the markets. The Fund’s cash levels were reduced during the period as we sought to pick entry points in which to redeploy cash into securities at what we believed to be attractive prices. Nevertheless, in a generally rising equity market, the Fund’s cash positions were a drag on performance when measured over the full six-month period.
During the period, the Fund sought to generate more income and increased its holdings in fixed-income and preferred stock securities. In aggregate, these holdings posted a positive return, but modestly trailed the overall return of the S&P 500 Index. The Fund increased its holdings in the Consumer Staples, Consumer Discretionary, and Industrials sectors. The Fund trimmed its allocations to the Health Care and Financials sectors.
Fiscal Period-End Investment Posture
As of period-end, the Fund’s primary economic sector allocations included Consumer Discretionary, Information Technology, Financials, Consumer Staples, and Industrials. At period-end, the Fund had no exposure to the Energy and Utilities sectors.
Sincerely,
MUNISH MALHOTRA, CFA
JORDON S. LAYCOB
PORTFOLIO MANAGERS
(1) | Total returns are based on net change in net asset value assuming reinvestment of distributions. Periodically, certain fees and expenses have been waived or reimbursed by the Adviser for the Flexible Capital Fund. In the absence of such a waiver, the performance returns reflected would have been reduced. In accordance with the expense limitation and fee waiver agreement, the Adviser may recoup fees and expenses previously waived or reimbursed under certain parameters. Please see the Prospectus for more information. |
28
| FLEXIBLE CAPITAL FUND OVERVIEW |
March 31, 2016 (Unaudited)
The Flexible Capital Fund invests primarily in equity securities and other investments that are selected primarily for their long-term growth potential. The Fund may invest in issuers of any size throughout the world, and will normally hold a core position of between 20 and 50 securities or other investments.
TOTAL ANNUAL OPERATING EXPENSES* | 1.27% | NET ASSETS $469,009,292 | NET ASSET VALUE PER SHARE $14.80 |
GROWTH OF $10,000(1)(2) | PERFORMANCE COMPARISON |
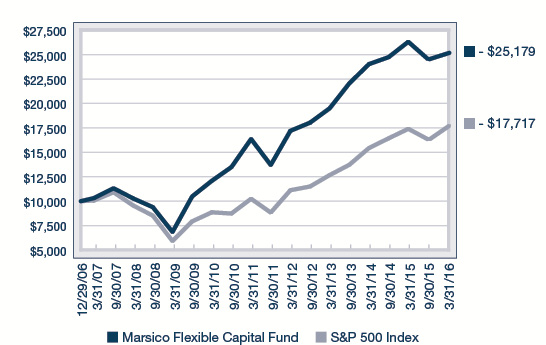
| 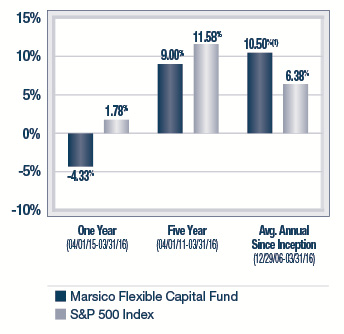
|
SECTOR ALLOCATION(3) | TOP FIVE HOLDINGS |
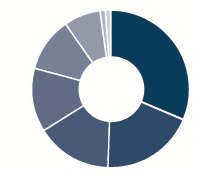 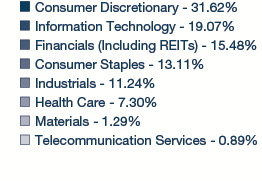
| | | | |
| | Constellation Brands, Inc. - Cl. A | 6.61% | |
| | The Home Depot, Inc. | 5.64% | |
| | Visa, Inc. - Cl. A | 4.91% | |
| | Facebook, Inc. - Cl. A | 4.34% | |
| | Nielsen Holdings N.V. | 4.30% | |
| | | | |
* | The Total Annual Operating Expenses are reflective of the information disclosed in the Funds’ Prospectus dated January 29, 2016 and may differ from the expense ratio disclosed in this report. |
| The performance data quoted here represent past performance, and past performance is not a guarantee of future results. Investment return and principal value of an investment will fluctuate so that an investor’s shares, when redeemed, may be worth more or less than their original cost. Current performance may be lower or higher than the performance information quoted. To obtain performance information current to the most recent month-end, please call 888-860-8686 or visit marsicofunds.com. |
| The performance included in the chart and graph does not reflect the deduction of taxes on Fund distributions or the redemption of Fund shares. |
| All indices are unmanaged and investors cannot invest directly in an index. |
(1) | Periodically, certain fees and expenses have been waived or reimbursed by the Adviser for the Flexible Capital Fund. In the absence of such a waiver, the performance returns reflected would have been reduced. In accordance with the expense limitation and fee waiver agreement, the Adviser may recoup fees and expenses previously waived or reimbursed under certain parameters. |
(2) | This chart assumes an initial investment of $10,000 made on December 29, 2006 (inception). Total returns are based on change in NAV, assuming reinvestment of distributions. |
(3) | Sector weightings represent the percentage of the Fund’s investments (excluding cash equivalents) in certain general sectors. These sectors may include more than one industry. The Fund’s portfolio composition is subject to change at any time. |
29
MARSICO FLEXIBLE CAPITAL FUND
SCHEDULE OF INVESTMENTS
March 31, 2016 (Unaudited)
| | | Number
of
Shares | | | Value | | | Percent
of Net
Assets | |
COMMON STOCKS | | | | | | | | | |
Aerospace & Defense | | | | | | | | | |
BAE Systems PLC | | | 2,110,984 | | | $ | 15,432,366 | | | | 3.29 | % |
Lockheed Martin Corporation | | | 42,947 | | | | 9,512,761 | | | | 2.03 | |
| | | | | | | | 24,945,127 | | | | 5.32 | |
Apparel Retail | | | | | | | | | | | | |
Foot Locker, Inc. | | | 144,736 | | | | 9,335,472 | | | | 1.99 | |
| | | | | | | | | | | | | |
Automotive Retail | | | | | | | | | | | | |
O'Reilly Automotive, Inc.* | | | 59,020 | | | | 16,151,413 | | | | 3.44 | |
| | | | | | | | | | | | | |
Biotechnology | | | | | | | | | | | | |
Amgen, Inc. | | | 64,158 | | | | 9,619,209 | | | | 2.05 | |
| | | | | | | | | | | | | |
Brewers | | | | | | | | | | | | |
Molson Coors Brewing Company - Cl. B | | | 196,356 | | | | 18,885,520 | | | | 4.03 | |
| | | | | | | | | | | | | |
Cable & Satellite | | | | | | | | | | | | |
Liberty Global PLC - Series C* | | | 257,592 | | | | 9,675,156 | | | | 2.06 | |
| | | | | | | | | | | | | |
Communications Equipment | | | | | |
Cisco Systems, Inc. | | | 500,275 | | | | 14,242,829 | | | | 3.04 | |
| | | | | | | | | | | | | |
Data Processing & Outsourced Services | |
Visa, Inc. - Cl. A | | | 300,822 | | | | 23,006,867 | | | | 4.91 | |
| | | | | | | | | | | | | |
Distillers & Vintners | | | | | | | | | | | | |
Constellation Brands, Inc. - Cl. A | | | 205,268 | | | | 31,013,942 | | | | 6.61 | |
| | | | | | | | | | | | | |
Home Improvement Retail | | | | | | | | | | | | |
The Home Depot, Inc. | | | 198,062 | | | | 26,427,413 | | | | 5.64 | |
| | | | | | | | | | | | | |
Internet Software & Services | |
Alphabet, Inc. - Cl. A* | | | 18,082 | | | | 13,794,758 | | | | 2.94 | |
Facebook, Inc. - Cl. A* | | | 178,411 | | | | 20,356,695 | | | | 4.34 | |
| | | | | | | | 34,151,453 | | | | 7.28 | |
Leisure Facilities | | | | | | | | | | | | |
ClubCorp Holdings, Inc. | | | 1,084,273 | | | | 15,223,193 | | | | 3.24 | |
Six Flags Entertainment Corporation | | | 174,802 | | | | 9,699,763 | | | | 2.07 | |
| | | | | | | | 24,922,956 | | | | 5.31 | |
Mortgage REITs | | | | | | | | | | | | |
Starwood Property Trust, Inc. | | | 863,213 | | | | 16,340,622 | | | | 3.48 | |
| | | | | | | | | | | | | |
Movies & Entertainment | | | | | | | | | | | | |
The Walt Disney Company | | | 96,017 | | | | 9,535,448 | | | | 2.03 | |
| | | | | | | | | | | | | |
Packaged Foods & Meats | | | | | | | | | | | | |
TreeHouse Foods, Inc.* | | | 115,312 | | | | 10,003,316 | | | | 2.13 | |
| | | | | | | | | | | | | |
Pharmaceuticals | | | | | | | | | | | | |
Eli Lilly & Company | | | 135,446 | | | | 9,753,467 | | | | 2.08 | |
Johnson & Johnson | | | 89,406 | | | | 9,673,729 | | | | 2.06 | |
| | | | | | | | 19,427,196 | | | | 4.14 | |
Research & Consulting Services | |
Nielsen Holdings N.V. | | | 382,869 | | | | 20,161,882 | | | | 4.30 | |
| | | | | | | | | | | | | |
Restaurants | | | | | | | | | | | | |
Domino's Pizza Group PLC | | | 1,201,569 | | | | 17,395,585 | | | | 3.71 | |
| | | Number
of Shares/
Par Value | | | Value | | | Percent
of Net
Assets | |
COMMON STOCKS (Continued) | |
Specialized Finance | | | | | | | | | |
CME Group, Inc. | | | 147,418 | | | $ | 14,159,499 | | | | 3.02 | % |
| | | | | | | | | | | | | |
Specialized REITs | | | | | | | | | | | | |
Crown Castle International Corp. | | | 211,201 | | | | 18,268,886 | | | | 3.90 | |
| | | | | | | | | | | | | |
Technology Hardware, Storage & Peripherals | |
Apple, Inc. | | | 144,197 | | | | 15,716,031 | | | | 3.35 | |
| | | | | | | | | | | | | |
TOTAL COMMON STOCKS | | | | | | | | | | | | |
(Cost $312,491,973) | | | | | | | 383,385,822 | | | | 81.74 | |
| | | | | | | | | | | | | |
CORPORATE BONDS | | | | | | | | | | | | |
Advertising | | | | | | | | | | | | |
MDC Partners, Inc.,
6.500%, 5/1/24 | | $ | 2,500,000 | | | | 2,553,125 | | | | 0.54 | |
| | | | | | | | | | | | | |
Casinos & Gaming | | | | | | | | | | | | |
MGM Resorts International, 6.625%, 12/15/21 | | | 5,000,000 | | | | 5,362,500 | | | | 1.14 | |
Pinnacle Entertainment, Inc., 7.500%, 4/15/21 | | | 6,000,000 | | | | 6,240,000 | | | | 1.33 | |
| | | | | | | | 11,602,500 | | | | 2.47 | |
General Merchandise Stores | | | | | |
Dollar Tree, Inc.,
5.750%, 3/1/23 | | | 6,000,000 | | | | 6,360,000 | | | | 1.36 | |
| | | | | | | | | | | | | |
Leisure Facilities | | | | | | | | | | | | |
ClubCorp Club Operations, Inc.,
8.250%, 12/15/23 | | | 5,000,000 | | | | 4,775,000 | | | | 1.02 | |
| | | | | | | | | | | | | |
Metal & Glass Containers | | | | | | | | | | | | |
Ball Corp.,
4.000%, 11/15/23 | | | 6,000,000 | | | | 5,910,000 | | | | 1.26 | |
| | | | | | | | | | | | | |
Pharmaceuticals | | | | | | | | | | | | |
Concordia Healthcare Corporation, 7.000%, 4/15/23 | | | 5,000,000 | | | | 4,287,500 | | | | 0.91 | |
| | | | | | | | | | | | | |
Real Estate Development | | | | | | | | | | | | |
The Howard Hughes Corporation, 6.875%, 10/1/21 | | | 4,000,000 | | | | 3,940,000 | | | | 0.84 | |
| | | | | | | | | | | | | |
Research & Consulting Services | | | | | |
IHS, Inc.,
5.000%, 11/1/22 | | | 6,000,000 | | | | 6,217,500 | | | | 1.33 | |
| | | | | | | | | | | | | |
Restaurants | | | | | | | | | | | | |
Yum! Brands, Inc.,
6.875%, 11/15/37 | | | 6,000,000 | | | | 5,700,000 | | | | 1.22 | |
| | | | | | | | | | | | | |
Wireless Telecommunication Services | |
T-Mobile USA, Inc.,
6.464%, 4/28/19 | | | 4,000,000 | | | | 4,080,000 | | | | 0.87 | |
| | | | | | | | | | | | | |
TOTAL CORPORATE BONDS | |
(Cost $54,673,601) | | | | | | | 55,425,625 | | | | 11.82 | |
| See notes to financial statements. |
30
| | | Number
of
Shares | | | Value | | | Percent
of Net
Assets | |
PREFERRED STOCKS | | | | | | | | | |
Diversified Banks | | | | | | | | | |
JPMorgan Chase & Co., Series BB, 6.150% | | | 135,072 | | | $ | 3,524,028 | | | | 0.75 | % |
Wells Fargo & Company, Series N, 5.200% | | | 172,538 | | | | 4,420,424 | | | | 0.94 | |
| | | | | | | | 7,944,452 | | | | 1.69 | |
Investment Banking & Brokerage | |
The Charles Schwab Corporation, Series C, 6.000% | | | 90,812 | | | | 2,395,620 | | | | 0.51 | |
| | | | | | | | | | | | | |
Regional Banks | | | | | | | | | | | | |
First Niagara Financial Group, Inc.,
Series B, 8.625% | | | 136,336 | | | | 3,631,991 | | | | 0.77 | |
Regions Financial Corporation, Series A, 6.375% | | | 154,966 | | | | 4,021,368 | | | | 0.86 | |
| | | | | | | | 7,653,359 | | | | 1.63 | |
TOTAL PREFERRED STOCKS | |
(Cost $17,038,487) | | | | | | | 17,993,431 | | | | 3.83 | |
| | | | | | | | | | | | | |
SHORT-TERM INVESTMENTS | | | | | |
State Street Institutional Treasury Money Market Fund, 0.000% | | | 11,749,091 | | | | 11,749,091 | | | | 2.51 | |
| | | | | | | | | | | | | |
TOTAL SHORT-TERM INVESTMENTS | | | | | |
(Cost $11,749,091) | | | | | | | 11,749,091 | | | | 2.51 | |
| | | | | | | | | | | | | |
TOTAL INVESTMENTS | | | | | | | | | | | | |
(Cost $395,953,152) | | | | | | | 468,553,969 | | | | 99.90 | |
| | | | | | | | | | | | | |
Cash and Other Assets, Less Liabilities | | | | | | | 455,323 | | | | 0.10 | |
| | | | | | | | | | | | | |
NET ASSETS | | | | | | $ | 469,009,292 | | | | 100.00 | % |
| See notes to financial statements. |
31
INVESTMENT REVIEW BY TOM MARSICO (UNAUDITED)
The Marsico Global Fund posted a total return of (US$) +3.46% for the six-month fiscal period ended March 31, 2016. The Fund underperformed the MSCI All Country World Index (“MSCI ACWI Index”), which is the Fund’s benchmark index and had a total return of (US$) +5.28% over the same time period. The MSCI ACWI Index measures equity market performance in the global developed and emerging markets. Please see the Fund Overview for more detailed information about the Fund’s performance for various time periods ended March 31, 2016.
The performance data for the Fund quoted here represent past performance, and past performance is not a guarantee of future results. Investment return and principal value of an investment will fluctuate so that an investor’s shares, when redeemed, may be worth more or less than their original cost. Current performance may be lower or higher than the performance information quoted. To obtain performance information current to the most recent month-end, please call 888-860-8686 or visit marsicofunds.com. (1)
This review highlights Fund performance over a six-month fiscal period. Shareholders should keep in mind that the Fund is intended for long-term investors who hold their shares for substantially longer periods of time. You should also keep in mind that our current views and beliefs regarding all investments discussed in this report are subject to change at any time. References to specific securities, industries, and sectors discussed in this report are not recommendations to buy or sell such securities or related investments, and the Fund may not necessarily hold these securities or investments today. Please see the accompanying Schedule of Investments for the percentage of the Fund’s portfolio represented by the securities mentioned in this report as of the end of the reporting period.
Foreign investments present additional risks due to currency fluctuations, economic and political factors, lower liquidity, differences in securities regulations and accounting standards, possible changes in taxation, limited public information, and other factors. In addition, the Fund is subject to broad risks associated with investing in equity securities markets generally, including the risks that the securities and markets in which it invests may experience volatility and instability, that domestic and global economies and markets may undergo periods of cyclical change and decline, that investors may at times avoid investments in equity securities, and that investments may not perform as anticipated. Please see the Prospectus for more information.
The Fund is not managed to track the benchmark index, and may hold a substantially overweight or underweight position in a sector, industry, or security compared to its weight in the benchmark. For informational purposes, the discussion below may compare the benchmark weight or performance of a sector or industry to the investment approach of the Fund.
The Marsico Global Fund’s underperformance versus the MSCI ACWI Index was partially attributable to certain holdings in the Health Care sector.
Stock prices of many Health Care companies were under pressure during the reporting period. Hospital operators slumped during late-2015 on worries that an increasing number of uninsured patients will be unable to pay their bills as fewer states expand Medicaid and more patients drop insurance because of unaffordable premiums. The Fund’s position in HCA Holdings, Inc. slid -11% prior to being sold during the period. DexCom, Inc., a developer of continuous glucose monitoring systems for people with diabetes, returned -26% during the period prior to being sold.
Certain of the Fund’s holdings within the Pharmaceutical, Biotechnology & Life Sciences industry posted negative returns. Nivalis Therapeutics, Inc., a drug company developing treatments for cystic fibrosis, returned -63% during the period and was sold from the Fund. Regeneron Pharmaceuticals, Inc. and Novartis AG declined
-31% and -22%, respectively, during the period prior to being sold. We chose to sell Regeneron because the US government is stepping up efforts to control Medicare Part B costs, an area where Regeneron has more exposure than many of its peers. We sold Novartis after a disappointing launch of the company’s new heart failure drug and operational challenges in their eye care division. Genome sequencing company Illumina, Inc. (-21% during the period prior to being sold) preannounced lower-than-expected revenues and cut its guidance due in part to disappointing sales in Europe and Asia.
From a sector allocation perspective, the Fund’s performance was impaired by having an overweight allocation to the weak-performing Health Care sector. The Fund’s performance also was held back by having an underweight allocation to the strongest-performing sectors of the MSCI ACWI Index – Telecommunication Services and Consumer Staples. We believed valuations for many companies in both sectors were high, and we found more compelling investment opportunities in other sectors.
32
On the brighter side, a portion of this negative effect was offset by the Fund’s lack of exposure to Financials, the weakest-performing sector of the benchmark index. An overweight allocation to the relatively strong Information Technology sector also aided performance.
Certain of the Fund’s Information Technology and Industrials holdings detracted from performance results. Technology positions Palo Alto Networks, Inc. and Activision Blizzard, Inc. posted returns of -29% and -30%, respectively, and were sold. Palo Alto Network’s stock sank on market concerns about slower spending by corporate enterprise customers. Video game developer Activision Blizzard was sold after the company reported quarterly results that were weaker than expected and lowered its 2016 guidance. French aerospace company Safran S.A. declined -18% and was sold after the company experienced development problems with its new business jet engine.
Regarding positive contributors, many of the Fund’s Consumer Discretionary holdings performed well. Domino’s Pizza Enterprises Ltd. soared +57% on strong pizza sales in its Australian market. Central to our investment thesis is Domino’s use of technology to enable customers to place their orders more efficiently, and other innovative enhancements to prepare and deliver pizzas more quickly. Chinese online travel reservations company Ctrip.com International, Ltd. Spon. ADR rose +35%. Ctrip’s business has benefitted from a growing middle class in China that is increasing tourist travel. Canadian discount retailer Dollarama, Inc. gained +32% as the company reported strong same store sales growth, benefiting from value conscious spending by consumers. The Fund reestablished a position in casino operator Wynn Macau Ltd. during the period and the stock rose +39% during the period it was held by the Fund.
The Materials sector was strong and the Fund’s sole holding in the sector, The Sherwin-Williams Company, gained +29%. Sherwin-Williams has benefitted from lower raw materials costs and a stronger housing market.
Information Technology holdings Facebook, Inc. – Cl. A and Alibaba Group Holding Ltd. Spon. ADR each had a material, positive effect on performance. Alibaba, China’s leading ecommerce company, staged a stock price gain of +32% during the period. Alibaba’s stock rose after sales on China’s “Singles Day,” a holiday popular among young unmarried adults in China, were stronger than expected. Social media company Facebook (+27%) announced results that exceeded market expectations, led by strong advertising revenue and monthly active user growth rates.
Although active currency management is not a central facet of the Fund’s investment process, fluctuations in major world currencies can at times affect the Fund’s performance. During the period, the net effect of currency moves was negative for the Fund. The Fund’s results were adversely impacted by having an underweight allocation, as compared to the MSCI ACWI Index, to investments denominated in the Japanese yen, which strengthened during the period. The Fund’s overweight allocation to stocks denominated in the relatively weaker British pound sterling modestly detracted from results.
During the period, the Fund increased its allocations to the Consumer Discretionary and Information Technology sectors. The Fund reduced its positions in the Health Care sector.
The Global Fund experienced moderate portfolio turnover during the period, which primarily related to the Fund’s changing its portfolio composition to reinvest in other positions that we believe may have more upside potential and to take advantage of new opportunities. Portfolio turnover increases transaction-related expenses and could reduce Fund returns.
33
Fiscal Period-End Investment Posture
As of March 31, 2016, the Fund’s primary economic sector allocations were Consumer Discretionary, Information Technology, and Health Care. The Fund had no investments in the Financials, Energy, Telecommunication Services, or Utilities sectors. The Fund’s most significant country allocations were the United States, China/Hong Kong, the United Kingdom, and Australia. Country-level weightings generally should be considered a residual of the Fund’s stock selection process rather than a major, proactive facet of its investment strategy.
Sincerely,
THOMAS F. MARSICO
PORTFOLIO MANAGER
(1) | Total returns are based on net change in net asset value assuming reinvestment of distributions. Periodically, certain fees and expenses have been waived or reimbursed by the Adviser for the Global Fund. In the absence of such a waiver, the performance returns reflected would have been reduced. In accordance with the expense limitation and fee waiver agreement, the Adviser may recoup fees and expenses previously waived or reimbursed under certain parameters. Periodically, the Adviser has recouped such fees or expenses from the Global Fund resulting in a lower performance return. Please see the Prospectus for more information. |
34
March 31, 2016 (Unaudited)
The Global Fund invests primarily in the common stocks of US and foreign companies that are selected for their long-term growth potential. The Fund may invest in the securities of companies of any size that are economically tied to any countries or markets throughout the world, including the securities of companies economically tied to emerging markets. Under normal market conditions, the Fund will invest significantly (generally, at least 40% of its net assets) in the securities of issuers organized or located outside the US or doing business outside the US or other foreign securities (unless market conditions are not deemed favorable by the Adviser, in which case the Fund generally will invest at least 30% of its assets in such foreign securities). The Fund will invest its assets in various regions and countries, including the US, that encompass not less than three different countries overall. The Fund may hold an unlimited number of common stocks.
TOTAL ANNUAL OPERATING EXPENSES* NET EXPENSES*† | 1.49% 1.60% | NET ASSETS $58,554,763 | NET ASSET VALUE PER SHARE $11.52 |
GROWTH OF $10,000(1)(2) | PERFORMANCE COMPARISON |
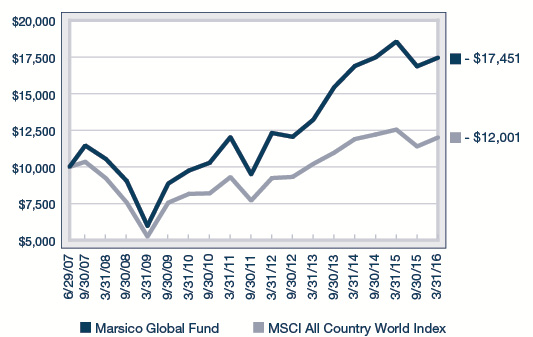
| 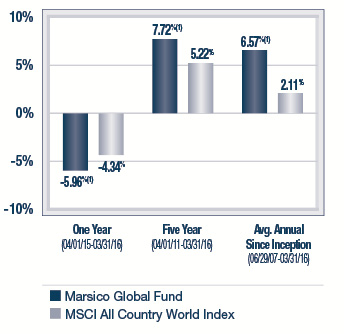
|
SECTOR ALLOCATION(3) | TOP FIVE HOLDINGS |
 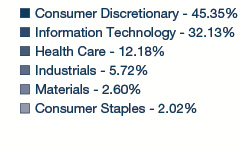
| | | | |
| | Facebook, Inc. - Cl. A | 6.13% | |
| | Domino's Pizza Enterprises Ltd. | 5.59% | |
| | Alphabet, Inc. - Cl. A | 5.16% | |
| | Wynn Macau Ltd. | 5.09% | |
| | Ryanair Holdings PLC Spon. ADR | 4.08% | |
| | | | |
* | The Total Annual Operating Expenses and Net Expenses are reflective of the information disclosed in the Funds’ Prospectus dated January 29, 2016 and may differ from the expense ratios disclosed in this report. |
† | Marsico Capital Management, LLC (the “Adviser”) has entered into a written expense limitation and fee waiver agreement under which it has agreed to limit the total expenses of the Global Fund (excluding interest, taxes, acquired fund fees and expenses, litigation, brokerage and extraordinary expenses) to an annual rate of 1.60% of the Fund’s average net assets until January 31, 2017. This expense limitation and fee waiver agreement may be terminated by the Adviser at any time after January 31, 2017, upon 15 days prior notice to the Fund and its administrator. The Adviser may recoup from the Fund fees previously waived or expenses previously reimbursed by the Adviser with respect to the Fund pursuant to this agreement (or a previous expense limitation agreement) if: (1) such recoupment by the Adviser does not cause the Fund, at the time of recoupment, to exceed the lesser of (a) the expense limitation in effect at the time the relevant amount was waived and/or reimbursed, or (b) the expense limitation in effect at the time of the proposed recoupment, and (2) the recoupment is made within three fiscal years after the end of the fiscal year in which the amount was waived or reimbursed. |
| The performance data quoted here represent past performance, and past performance is not a guarantee of future results. Investment return and principal value of an investment will fluctuate so that an investor’s shares, when redeemed, may be worth more or less than their original cost. Current performance may be lower or higher than the performance information quoted. To obtain performance information current to the most recent month-end, please call 888-860-8686 or visit marsicofunds.com. |
| The performance included in the chart and graph does not reflect the deduction of taxes on Fund distributions or the redemption of Fund shares. |
| All indices are unmanaged and investors cannot invest directly in an index. |
(1) | Periodically, certain fees and expenses have been waived or reimbursed by the Adviser for the Global Fund. In the absence of such a waiver, the performance returns reflected would have been reduced. In accordance with the expense limitation and fee waiver agreement, the Adviser may recoup fees and expenses previously waived or reimbursed under certain parameters. Periodically, the Adviser has recouped such fees or expenses from the Global Fund resulting in a lower performance return. |
(2) | This chart assumes an initial investment of $10,000 made on June 29, 2007 (inception). Total returns are based on change in NAV, assuming reinvestment of distributions. |
(3) | Sector weightings represent the percentage of the Fund’s investments (excluding cash equivalents) in certain general sectors. These sectors may include more than one industry. The Fund’s portfolio composition is subject to change at any time. |
| The MSCI ACWI (All Country World Index) Index is a free float-adjusted market capitalization index that is designed to measure equity market performance in the global developed and emerging markets. |
35
MARSICO GLOBAL FUND
SCHEDULE OF INVESTMENTS
March 31, 2016 (Unaudited)
| | | Number
of
Shares | | | Value | | | Percent
of Net
Assets | |
COMMON STOCKS | | | | | | | | | |
Advertising | | | | | | | | | |
JC Decaux S.A. | | | 36,624 | | | $ | 1,603,216 | | | | 2.74 | % |
| | | | | | | | | | | | | |
Airlines | | | | | | | | | | | | |
Ryanair Holdings PLC Spon. ADR | | | 27,804 | | | | 2,386,139 | | | | 4.08 | |
| | | | | | | | | | | | | |
Apparel, Accessories & Luxury Goods | |
Hermes International | | | 3,237 | | | | 1,139,822 | | | | 1.95 | |
| | | | | | | | | | | | | |
Application Software | | | | | | | | | | | | |
salesforce.com, inc.* | | | 25,764 | | | | 1,902,156 | | | | 3.25 | |
SAP S.E. | | | 10,909 | | | | 882,589 | | | | 1.51 | |
| | | | | | | | 2,784,745 | | | | 4.76 | |
Automotive Retail | | | | | | | | | | | | |
O'Reilly Automotive, Inc.* | | | 6,041 | | | | 1,653,180 | | | | 2.82 | |
| | | | | | | | | | | | | |
Biotechnology | | | | | | | | | | | | |
Amgen, Inc. | | | 8,226 | | | | 1,233,324 | | | | 2.11 | |
Celgene Corporation* | | | 10,527 | | | | 1,053,648 | | | | 1.80 | |
| | | | | | | | 2,286,972 | | | | 3.91 | |
Casinos & Gaming | | | | | | | | | | | | |
Wynn Macau Ltd.* | | | 1,926,800 | | | | 2,980,605 | | | | 5.09 | |
| | | | | | | | | | | | | |
Data Processing & Outsourced Services | |
Visa, Inc. - Cl. A | | | 26,623 | | | | 2,036,127 | | | | 3.48 | |
Worldpay Group PLC* | | | 328,301 | | | | 1,297,157 | | | | 2.21 | |
| | | | | | | | 3,333,284 | | | | 5.69 | |
Footwear | | | | | | | | | | | | |
NIKE, Inc. - Cl. B | | | 32,433 | | | | 1,993,656 | | | | 3.40 | |
| | | | | | | | | | | | | |
General Merchandise Stores | |
Dollar Tree, Inc.* | | | 20,884 | | | | 1,722,095 | | | | 2.94 | |
Dollarama, Inc. | | | 26,065 | | | | 1,834,133 | | | | 3.13 | |
| | | | | | | | 3,556,228 | | | | 6.07 | |
Health Care Equipment | | | | | | | | | | | | |
Intuitive Surgical, Inc.* | | | 2,604 | | | | 1,565,134 | | | | 2.67 | |
| | | | | | | | | | | | | |
Home Entertainment Software | |
Electronic Arts, Inc.* | | | 19,253 | | | | 1,272,816 | | | | 2.17 | |
| | | | | | | | | | | | | |
Home Improvement Retail | | | | | | | | | | | | |
The Home Depot, Inc. | | | 14,046 | | | | 1,874,158 | | | | 3.20 | |
| | | | | | | | | | | | | |
Hotels, Resorts & Cruise Lines | |
Norwegian Cruise Line Holdings Ltd.* | | | 26,844 | | | | 1,484,205 | | | | 2.53 | |
| | | | | | | | | | | | | |
Household Products | | | | | | | | | | | | |
Reckitt Benckiser Group PLC | | | 12,341 | | | | 1,192,876 | | | | 2.04 | |
| | | | | | | | | | | | | |
Internet Retail | | | | | | | | | | | | |
Amazon.com, Inc.* | | | 2,596 | | | | 1,541,090 | | | | 2.63 | |
Ctrip.com International, Ltd. ADR* | | | 39,439 | | | | 1,745,570 | | | | 2.98 | |
| | | | | | | | 3,286,660 | | | | 5.61 | |
COMMON STOCKS (Continued) | |
Internet Software & Services | |
Alibaba Group Holding Ltd. Spon. ADR* | | | 25,332 | | | $ | 2,001,988 | | | | 3.42 | % |
Alphabet, Inc. - Cl. A* | | | 3,963 | | | | 3,023,373 | | | | 5.16 | |
Auto Trader Group PLC | | | 226,010 | | | | 1,265,966 | | | | 2.16 | |
Facebook, Inc. - Cl. A* | | | 31,463 | | | | 3,589,928 | | | | 6.13 | |
Tencent Holdings Ltd. | | | 85,000 | | | | 1,736,740 | | | | 2.97 | |
| | | | | | | | 11,617,995 | | | | 19.84 | |
Managed Health Care | | | | | | | | | | | | |
UnitedHealth Group, Inc. | | | 13,992 | | | | 1,803,569 | | | | 3.08 | |
| | | | | | | | | | | | | |
Pharmaceuticals | | | | | | | | | | | | |
Novo Nordisk A/S - Cl. B | | | 28,605 | | | | 1,551,576 | | | | 2.65 | |
| | | | | | | | | | | | | |
Research & Consulting Services | |
Nielsen Holdings N.V. | | | 19,000 | | | | 1,000,540 | | | | 1.71 | |
| | | | | | | | | | | | | |
Restaurants | | | | | | | | | | | | |
Chipotle Mexican Grill, Inc.* | | | 4,437 | | | | 2,089,694 | | | | 3.57 | |
Domino's Pizza Enterprises Ltd. | | | 74,307 | | | | 3,274,063 | | | | 5.59 | |
Domino's Pizza Group PLC | | | 130,957 | | | | 1,895,916 | | | | 3.24 | |
| | | | | | | | 7,259,673 | | | | 12.40 | |
Specialty Chemicals | | | | | | | | | | | | |
The Sherwin-Williams Company | | | 5,407 | | | | 1,539,211 | | | | 2.63 | |
| | | | | | | | | | | | | |
TOTAL COMMON STOCKS | | | | | |
(Cost $50,006,801) | | | | | | | 59,166,260 | | | | 101.04 | |
| | | | | | | | | | | | | |
TOTAL INVESTMENTS | | | | | |
(Cost $50,006,801) | | | | | | | 59,166,260 | | | | 101.04 | |
| | | | | | | | | | | | | |
Liabilities, Less Cash and Other Assets | | | | | | | (611,497 | ) | | | (1.04 | ) |
| | | | | | | | | | | | | |
NET ASSETS | | | | | | $ | 58,554,763 | | | | 100.00 | % |
| See notes to financial statements. |
36
SUMMARY OF INVESTMENTS BY COUNTRY | |
Country | | Market Value | | | Percent of
Investment
Securities | |
Australia | | $ | 3,274,063 | | | | 5.53 | % |
Canada | | | 1,834,133 | | | | 3.10 | |
China/Hong Kong | | | 8,464,903 | | | | 14.31 | |
Denmark | | | 1,551,576 | | | | 2.62 | |
France | | | 2,743,038 | | | | 4.64 | |
Germany | | | 882,589 | | | | 1.49 | |
Ireland | | | 2,386,139 | | | | 4.03 | |
United Kingdom | | | 5,651,915 | | | | 9.56 | |
United States(1) | | | 32,377,904 | | | | 54.72 | |
| | | $ | 59,166,260 | | | | 100.00 | % |
(1) | Includes short-term securities, if any. |
| See notes to financial statements. |
37
STATEMENTS OF ASSETS AND LIABILITIES
March 31, 2016 (Unaudited)
(Amounts in thousands) | | MARSICO
FOCUS FUND | | | MARSICO
GROWTH FUND | |
| | | | | | | |
ASSETS | | | | | | |
Investments, at value (cost $563,790, $277,125, $208,454, $59,831, $395,953, and $50,007, respectively) | | $ | 700,798 | | | $ | 332,788 | |
Foreign currency (cost $0, $0, $0, $8, $0, and $0, respectively) | | | — | | | | — | |
Receivable for investments sold | | | — | | | | 5,310 | |
Receivable for capital stock sold | | | 156 | | | | 276 | |
Interest and dividends receivable | | | 479 | | | | 110 | |
Prepaid expenses and other assets | | | 2,314 | | | | 917 | |
Total Assets | | | 703,747 | | | | 339,401 | |
| | | | | | | | | |
LIABILITIES | | | | | | | | |
Payable for investments purchased | | | — | | | | — | |
Payable for capital stock redeemed | | | 607 | | | | 290 | |
Due to custodian | | | — | | | | — | |
Payable to investment adviser | | | 442 | | | | 222 | |
Accrued trustees' fees | | | 2,314 | | | | 904 | |
Accrued distribution fee | | | 3,616 | | | | 1,653 | |
Accrued professional fees | | | 80 | | | | 42 | |
Accrued transfer agent fees and expenses | | | 130 | | | | 84 | |
Accrued expenses and other liabilities | | | 88 | | | | 54 | |
Total Liabilities | | | 7,277 | | | | 3,249 | |
| | | | | | | | | |
NET ASSETS | | $ | 696,470 | | | $ | 336,152 | |
| | | | | | | | | |
NET ASSETS CONSIST OF | | | | | | | | |
Paid-in-capital | | $ | 581,278 | | | $ | 291,610 | |
Undistributed net investment income (accumulated net investment loss) | | | (7,504 | ) | | | (4,747 | ) |
Accumulated net realized loss on investments and foreign currency transactions | | | (14,844 | ) | | | (6,648 | ) |
Net unrealized appreciation on investments and foreign currency translations | | | 137,540 | | | | 55,937 | |
NET ASSETS | | $ | 696,470 | | | $ | 336,152 | |
| | | | | | | | | |
SHARES OUTSTANDING, $0.001 par value | | | | | | | | |
(Unlimited shares authorized) | | | 45,007 | | | | 22,595 | |
| | | | | | | | | |
NET ASSET VALUE, REDEMPTION PRICE, AND OFFERING PRICE PER SHARE (NET ASSETS/SHARES OUTSTANDING)* | | $ | 15.47 | | | $ | 14.88 | |
* | Not in thousands, based on unrounded net assets and shares outstanding. |
| See notes to financial statements. |
38
MARSICO
21st CENTURY FUND | | | MARSICO
INTERNATIONAL
OPPORTUNITIES
FUND | | | MARSICO
FLEXIBLE
CAPITAL FUND | | | MARSICO
GLOBAL FUND | |
| | | | | | | | | | | |
| $ | 253,333 | | | $ | 70,283 | | | $ | 468,554 | | | $ | 59,166 | |
| | — | | | | 8 | | | | — | | | | — | |
| | — | | | | — | | | | — | | | | 2,114 | |
| | 1 | | | | — | | | | 74 | | | | 2 | |
| | 8 | | | | 164 | | | | 2,049 | | | | 59 | |
| | 329 | | | | 162 | | | | 1,531 | | | | 105 | |
| | 253,671 | | | | 70,617 | | | | 472,208 | | | | 61,446 | |
| | | | | | | | | | | | | | | |
| | — | | | | 1,358 | | | | — | | | | 1,434 | |
| | 178 | | | | 24 | | | | 840 | | | | 14 | |
| | — | | | | — | | | | — | | | | 1,105 | |
| | 168 | | | | 22 | | | | 310 | | | | 35 | |
| | 319 | | | | 150 | | | | 1,524 | | | | 94 | |
| | 898 | | | | 237 | | | | 294 | | | | 167 | |
| | 31 | | | | 9 | | | | 56 | | | | 6 | |
| | 55 | | | | 17 | | | | 125 | | | | 15 | |
| | 46 | | | | 19 | | | | 50 | | | | 21 | |
| | 1,695 | | | | 1,836 | | | | 3,199 | | | | 2,891 | |
| | | | | | | | | | | | | | | |
| $ | 251,976 | | | $ | 68,781 | | | $ | 469,009 | | | $ | 58,555 | |
| | | | | | | | | | | | | | | |
| $ | 632,443 | | | $ | 165,932 | | | $ | 400,984 | | | $ | 53,181 | |
| | (4,115 | ) | | | (1,148 | ) | | | 365 | | | | (1,030 | ) |
| | (421,360 | ) | | | (106,482 | ) | | | (5,474 | ) | | | (2,799 | ) |
| | 45,008 | | | | 10,479 | | | | 73,134 | | | | 9,203 | |
| $ | 251,976 | | | $ | 68,781 | | | $ | 469,009 | | | $ | 58,555 | |
| | | | | | | | | | | | | | | |
| | 12,220 | | | | 4,621 | | | | 31,691 | | | | 5,085 | |
| | | | | | | | | | | | | | | |
| $ | 20.62 | | | $ | 14.88 | | | $ | 14.80 | | | $ | 11.52 | |
39
STATEMENTS OF OPERATIONS
FOR THE SIX-MONTH PERIOD ENDED March 31, 2016 (Unaudited)
(Amounts in thousands) | | MARSICO
FOCUS FUND | | | MARSICO
GROWTH FUND | |
| | | | | | | |
INVESTMENT INCOME | | | | | | |
Dividends (net of $76, $12, $1, $14, $0, and $8, respectively, of non-reclaimable foreign withholding taxes) | | $ | 2,919 | | | $ | 1,337 | |
Interest | | | 9 | | | | 1 | |
Total Investment Income | | | 2,928 | | | | 1,338 | |
| | | | | | | | | |
EXPENSES | | | | | | | | |
Investment advisory fees | | | 2,992 | | | | 1,534 | |
Distribution fees | | | 950 | | | | 474 | |
Transfer agent fees and expenses | | | 437 | | | | 255 | |
Professional fees | | | 147 | | | | 75 | |
Trustees' fees and expenses | | | 141 | (1) | | | 84 | (1) |
Fund administration fees | | | 93 | | | | 74 | |
Custody and fund accounting fees | | | 85 | | | | 53 | |
Printing and postage expenses | | | 66 | | | | 33 | |
Miscellaneous | | | 44 | | | | 26 | |
Federal and state registration fees | | | 19 | | | | 14 | |
Total Expenses | | | 4,974 | | | | 2,622 | |
Less waiver of expenses and expenses paid indirectly | | | — | | | | — | |
Net Expenses | | | 4,974 | | | | 2,622 | |
| | | | | | | | | |
NET INVESTMENT INCOME (LOSS) | | | (2,046 | ) | | | (1,284 | ) |
| | | | | | | | | |
REALIZED AND UNREALIZED GAIN (LOSS) | | | | | | | | |
Net realized loss on investments | | | (13,251 | ) | | | (6,490 | ) |
Net realized gain (loss) on foreign currency transactions | | | (294 | ) | | | — | |
Change in unrealized appreciation (depreciation) on investments and foreign currency translations | | | 36,783 | | | | 14,340 | |
| | | | | | | | | |
Net Gain on Investments | | | 23,238 | | | | 7,850 | |
| | | | | | | | | |
NET INCREASE IN NET ASSETS RESULTING FROM OPERATIONS | | $ | 21,192 | | | $ | 6,566 | |
(1) | Amounts include trustees’ fees and expenses and the mark to market unrealized appreciation during the period for shares held in the Trustees’ Deferred Fee Plan, as more fully described in Note 2(g) in the Notes to Financial Statements. |
| | | Trustees’
Fees and
Expenses* | | | Unrealized
Appreciation* | |
Focus Fund | | $ | 84,035 | | | $ | 56,501 | |
Growth Fund | | | 42,681 | | | | 40,956 | |
21st Century Fund | | | 30,552 | | | | 34,783 | |
International Opportunities Fund | | | 8,848 | | | | 23,517 | |
Flexible Capital Fund | | | 55,600 | | | | 47,599 | |
Global Fund | | | 7,037 | | | | 30,512 | |
| See notes to financial statements. |
40
MARSICO
21st CENTURY FUND | | | MARSICO
INTERNATIONAL
OPPORTUNITIES
FUND | | | MARSICO
FLEXIBLE
CAPITAL FUND | | | MARSICO
GLOBAL FUND | |
| | | | | | | | | | | |
| $ | 514 | | | $ | 286 | | | $ | 4,610 | | | $ | 228 | |
| | 6 | | | | 1 | | | | 1,417 | | | | — | |
| | 520 | | | | 287 | | | | 6,027 | | | | 228 | |
| | | | | | | | | | | | | | | |
| | 1,071 | | | | 312 | | | | 2,059 | | | | 258 | |
| | 328 | | | | 95 | | | | 641 | | | | 79 | |
| | 193 | | | | 69 | | | | 405 | | | | 51 | |
| | 54 | | | | 16 | | | | 98 | | | | 12 | |
| | 65 | (1) | | | 32 | (1) | | | 103 | (1) | | | 38 | (1) |
| | 68 | | | | 42 | | | | 81 | | | | 37 | |
| | 53 | | | | 79 | | | | 73 | | | | 40 | |
| | 24 | | | | 7 | | | | 44 | | | | 5 | |
| | 15 | | | | 10 | | | | 39 | | | | 6 | |
| | 9 | | | | 9 | | | | 19 | | | | 8 | |
| | 1,880 | | | | 671 | | | | 3,562 | | | | 534 | |
| | — | | | | (61 | ) | | | — | | | | (30 | ) |
| | 1,880 | | | | 610 | | | | 3,562 | | | | 504 | |
| | | | | | | | | | | | | | | |
| | (1,360 | ) | | | (323 | ) | | | 2,465 | | | | (276 | ) |
| | | | | | | | | | | | | | | |
| | (4,943 | ) | | | (2,013 | ) | | | (376 | ) | | | (1,894 | ) |
| | 61 | | | | (804 | ) | | | (1,384 | ) | | | (514 | ) |
| | 9,160 | | | | 5,926 | | | | 13,673 | | | | 4,886 | |
| | | | | | | | | | | | | | | |
| | 4,278 | | | | 3,109 | | | | 11,913 | | | | 2,478 | |
| | | | | | | | | | | | | | | |
| $ | 2,918 | | | $ | 2,786 | | | $ | 14,378 | | | $ | 2,202 | |
41
STATEMENTS OF CHANGES IN NET ASSETS
| | | MARSICO
FOCUS FUND | | | MARSICO
GROWTH FUND | |
| | | | | | | | | | | | | |
(Amounts in thousands) | | Six-Month
Period Ended 3/31/16 (Unaudited) | | | Year
Ended
9/30/15 | | | Six-Month Period Ended 3/31/16 (Unaudited) | | | Year
Ended
9/30/15 | |
| | | | | | | | | | | | | |
OPERATIONS: | | | | | | | | | | | | |
Net investment income (loss) | | $ | (2,046 | ) | | $ | (4,091 | ) | | $ | (1,284 | ) | | $ | (2,659 | ) |
Net realized gain (loss) on investments | | | (13,251 | ) | | | 163,514 | | | | (6,490 | ) | | | 119,260 | |
Net realized gain (loss) on foreign currency transactions | | | (294 | ) | | | (32 | ) | | | — | | | | (301 | ) |
Change in unrealized appreciation (depreciation) on investments and foreign currency translations | | | 36,783 | | | | (187,364 | ) | | | 14,340 | | | | (129,372 | ) |
| | | | | | | | | | | | | | | | | |
Net increase (decrease) in net assets resulting from operations | | | 21,192 | | | | (27,973 | ) | | | 6,566 | | | | (13,072 | ) |
| | | | | | | | | | | | | | | | | |
DISTRIBUTIONS: | | | | | | | | | | | | | | | | |
Net investment income | | | — | | | | — | | | | — | | | | — | |
Net realized gains | | | (157,703 | ) | | | (124,082 | ) | | | (111,369 | ) | | | (63,630 | ) |
| | | | | | | | | | | | | | | | | |
Total distributions | | | (157,703 | ) | | | (124,082 | ) | | | (111,369 | ) | | | (63,630 | ) |
| | | | | | | | | | | | | | | | | |
CAPITAL SHARE TRANSACTIONS: | | | | | | | | | | | | | | | | |
Proceeds from sales of shares | | | 18,687 | | | | 129,352 | | | | 13,950 | | | | 29,300 | |
Proceeds from reinvestment of distributions | | | 147,665 | | | | 113,800 | | | | 106,035 | | | | 61,081 | |
Redemption of shares | | | (122,222 | ) | | | (235,300 | ) | | | (89,472 | ) | | | (165,890 | ) |
| | | | | | | | | | | | | | | | | |
Net increase (decrease) from capital share transactions | | | 44,130 | | | | 7,852 | | | | 30,513 | | | | (75,509 | ) |
| | | | | | | | | | | | | | | | | |
TOTAL INCREASE (DECREASE) IN NET ASSETS | | | (92,381 | ) | | | (144,203 | ) | | | (74,290 | ) | | | (152,211 | ) |
| | | | | | | | | | | | | | | | | |
NET ASSETS: | | | | | | | | | | | | | | | | |
Beginning of Period | | | 788,851 | | | | 933,054 | | | | 410,442 | | | | 562,653 | |
| | | | | | | | | | | | | | | | | |
End of Period | | $ | 696,470 | | | $ | 788,851 | | | $ | 336,152 | | | $ | 410,442 | |
| | | | | | | | | | | | | | | | | |
Undistributed net investment income (Accumulated net investment loss) | | $ | (7,504 | ) | | $ | (5,458 | ) | | $ | (4,747 | ) | | $ | (3,463 | ) |
| | | | | | | | | | | | | | | | | |
TRANSACTIONS IN SHARES: | | | | | | | | | | | | | | | | |
Shares sold | | | 1,114 | | | | 6,050 | | | | 853 | | | | 1,329 | |
Shares issued in reinvestment of distributions | | | 9,166 | | | | 5,600 | | | | 6,814 | | | | 2,823 | |
Shares redeemed | | | (7,163 | ) | | | (11,404 | ) | | | (5,478 | ) | | | (7,552 | ) |
| | | | | | | | | | | | | | | | | |
NET INCREASE (DECREASE) | | | 3,117 | | | | 246 | | | | 2,189 | | | | (3,400 | ) |
| See notes to financial statements. |
42
MARSICO
21st CENTURY FUND | | | MARSICO
INTERNATIONAL
OPPORTUNITIES FUND | | | MARSICO
FLEXIBLE
CAPITAL FUND | | | MARSICO
GLOBAL FUND | |
| | | | | | | | | | | | | | | | | | | | | | | |
Six-Month
Period Ended 3/31/16 (Unaudited) | | | Year
Ended
9/30/15 | | | Six-Month
Period Ended 3/31/16 (Unaudited) | | | Year
Ended
9/30/15 | | | Six-Month
Period Ended 3/31/16 (Unaudited) | | | Year
Ended
9/30/15 | | | Six-Month
Period Ended 3/31/16 (Unaudited) | | | Year
Ended
9/30/15 | |
| | | | | | | | | | | | | | | | | | | | | | | |
| $ | (1,360 | ) | | $ | (2,401 | ) | | $ | (323 | ) | | $ | (909 | ) | | $ | 2,465 | | | $ | 3,727 | | | $ | (276 | ) | | $ | (578 | ) |
| | (4,943 | ) | | | 47,026 | | | | (2,013 | ) | | | 14,886 | | | | (376 | ) | | | 89,386 | | | | (1,894 | ) | | | 7,722 | |
| | 61 | | | | (280 | ) | | | (804 | ) | | | (7,949 | ) | | | (1,384 | ) | | | (3,742 | ) | | | (514 | ) | | | (1,071 | ) |
| | 9,160 | | | | (49,090 | ) | | | 5,926 | | | | (7,530 | ) | | | 13,673 | | | | (81,540 | ) | | | 4,886 | | | | (8,565 | ) |
| | | | | | | | | | | | | | | | | | | | | | | | | | | | | | | |
| | 2,918 | | | | (4,745 | ) | | | 2,786 | | | | (1,502 | ) | | | 14,378 | | | | 7,831 | | | | 2,202 | | | | (2,492 | ) |
| | | | | | | | | | | | | | | | | | | | | | | | | | | | | | | |
| | — | | | | — | | | | — | | | | — | | | | (3,373 | ) | | | — | | | | — | | | | — | |
| | — | | | | — | | | | — | | | | — | | | | (64,551 | ) | | | (72,202 | ) | | | (6,835 | ) | | | (8,410 | ) |
| | | | | | | | | | | | | | | | | | | | | | | | | | | | | | | |
| | — | | | | — | | | | — | | | | — | | | | (67,924 | ) | | | (72,202 | ) | | | (6,835 | ) | | | (8,410 | ) |
| | | | | | | | | | | | | | | | | | | | | | | | | | | | | | | |
| | 2,357 | | | | 6,269 | | | | 1,791 | | | | 28,781 | | | | 63,069 | | | | 64,926 | | | | 4,359 | | | | 17,368 | |
| | — | | | | — | | | | — | | | | — | | | | 57,636 | | | | 61,280 | | | | 5,566 | | | | 6,836 | |
| | (21,683 | ) | | | (49,433 | ) | | | (24,937 | ) | | | (114,122 | ) | | | (147,363 | ) | | | (319,070 | ) | | | (13,349 | ) | | | (20,165 | ) |
| | | | | | | | | | | | | | | | | | | | | | | | | | | | | | | |
| | (19,326 | ) | | | (43,164 | ) | | | (23,146 | ) | | | (85,341 | ) | | | (26,658 | ) | | | (192,864 | ) | | | (3,424 | ) | | | 4,039 | |
| | | | | | | | | | | | | | | | | | | | | | | | | | | | | | | |
| | (16,408 | ) | | | (47,909 | ) | | | (20,360 | ) | | | (86,843 | ) | | | (80,204 | ) | | | (257,235 | ) | | | (8,057 | ) | | | (6,863 | ) |
| | | | | | | | | | | | | | | | | | | | | | | | | | | | | | | |
| | 268,384 | | | | 316,293 | | | | 89,141 | | | | 175,984 | | | | 549,213 | | | | 806,448 | | | | 66,612 | | | | 73,475 | |
| | | | | | | | | | | | | | | | | | | | | | | | | | | | | | | |
| $ | 251,976 | | | $ | 268,384 | | | $ | 68,781 | | | $ | 89,141 | | | $ | 469,009 | | | $ | 549,213 | | | $ | 58,555 | | | $ | 66,612 | |
| | | | | | | | | | | | | | | | | | | | | | | | | | | | | | | |
| $ | (4,115 | ) | | $ | (2,755 | ) | | $ | (1,148 | ) | | $ | (825 | ) | | $ | 365 | | | $ | 1,273 | | | $ | (1,030 | ) | | $ | (754 | ) |
| | | | | | | | | | | | | | | | | | | | | | | | | | | | | | | |
| | 110 | | | | 287 | | | | 119 | | | | 1,852 | | | | 4,290 | | | | 3,624 | | | | 363 | | | | 1,264 | |
| | — | | | | — | | | | — | | | | — | | | | 3,850 | | | | 3,496 | | | | 467 | | | | 523 | |
| | (1,057 | ) | | | (2,255 | ) | | | (1,643 | ) | | | (7,663 | ) | | | (9,544 | ) | | | (17,879 | ) | | | (1,130 | ) | | | (1,485 | ) |
| | | | | | | | | | | | | | | | | | | | | | | | | | | | | | | |
| | (947 | ) | | | (1,968 | ) | | | (1,524 | ) | | | (5,811 | ) | | | (1,404 | ) | | | (10,759 | ) | | | (300 | ) | | | 302 | |
43
| | | MARSICO FOCUS FUND | |
For a Fund Share Outstanding Throughout the Period | | Six-Month
Period Ended 3/31/16 (Unaudited) | | | Year
Ended
9/30/15 | | | Year
Ended
9/30/14 | | | Year
Ended
9/30/13 | | | Year
Ended
9/30/12 | | | Year
Ended
9/30/11 | |
| | | | | | | | | | | | | | | | | | | |
Net Asset Value, Beginning of Period | | $ | 18.83 | | | $ | 22.41 | | | $ | 21.47 | | | $ | 20.02 | | | $ | 15.97 | | | $ | 15.79 | |
| | | | | | | | | | | | | | | | | | | | | | | | | |
Income from Investment Operations: | | | | | | | | | | | | | | | | | | | | | | | | |
Net investment income (loss) | | | (0.04 | ) | | | (0.10 | ) | | | (0.07 | ) | | | (0.03 | ) | | | 0.02 | | | | (0.02 | ) |
Net realized and unrealized gains (losses) on investments | | | 0.67 | | | | (0.62 | ) | | | 4.46 | | | | 3.84 | | | | 4.03 | | | | 0.20 | |
| | | | | | | | | | | | | | | | | | | | | | | | | |
Total from investment operations | | | 0.63 | | | | (0.72 | ) | | | 4.39 | | | | 3.81 | | | | 4.05 | | | | 0.18 | |
| | | | | | | | | | | | | | | | | | | | | | | | | |
Distributions & Other: | | | | | | | | | | | | | | | | | | | | | | | | |
Net investment income | | | — | | | | — | | | | — | | | | (0.03 | ) | | | — | | | | — | |
Net realized gains | | | (3.99 | ) | | | (2.86 | ) | | | (3.45 | ) | | | (2.33 | ) | | | — | | | | — | |
Redemption fees [See Note 2(h)] | | | — | | | | — | | | | — | (1) | | | — | (1) | | | — | (1) | | | — | (1) |
| | | | | | | | | | | | | | | | | | | | | | | | | |
Total distributions and other | | | (3.99 | ) | | | (2.86 | ) | | | (3.45 | ) | | | (2.36 | ) | | | — | | | | — | |
| | | | | | | | | | | | | | | | | | | | | | | | | |
Net Asset Value, End of Period | | $ | 15.47 | | | $ | 18.83 | | | $ | 22.41 | | | $ | 21.47 | | | $ | 20.02 | | | $ | 15.97 | |
| | | | | | | | | | | | | | | | | | | | | | | | | |
Total Return | | | 2.50 | %(2) | | | (4.15 | )% | | | 22.27 | % | | | 21.86 | % | | | 25.36 | % | | | 1.14 | % |
| | | | | | | | | | | | | | | | | | | | | | | | | |
Supplemental Data and Ratios: | | | | | | | | | | | | | | | | | | | | | | | | |
| | | | | | | | | | | | | | | | | | | | | | | | | |
Net assets, end of Period (000s) | | $ | 696,470 | | | $ | 788,851 | | | $ | 933,054 | | | $ | 854,708 | | | $ | 966,010 | | | $ | 936,382 | |
| | | | | | | | | | | | | | | | | | | | | | | | | |
Ratio of expenses to average net assets, less waivers and before expenses paid indirectly, plus recoupment of previously waived fees or expenses paid | | | 1.31 | %(3) | | | 1.31 | % | | | 1.34 | % | | | 1.35 | % | | | 1.34 | % | | | 1.33 | % |
| | | | | | | | | | | | | | | | | | | | | | | | | |
Ratio of net investment income (loss) to average net assets, net of waivers, recoupment of previously waived fees or expenses and expenses paid indirectly | | | (0.54 | )%(3) | | | (0.45 | )% | | | (0.35 | )% | | | (0.10 | )% | | | 0.09 | % | | | (0.04 | )% |
| | | | | | | | | | | | | | | | | | | | | | | | | |
Ratio of expenses to average net assets, before waivers, recoupment of previously waived fees or expenses paid and expenses paid indirectly | | | 1.31 | %(3) | | | 1.31 | % | | | 1.34 | % | | | 1.35 | % | | | 1.34 | % | | | 1.33 | % |
| | | | | | | | | | | | | | | | | | | | | | | | | |
Ratio of net investment income (loss) to average net assets, before waivers, recoupment of previously waived fees or expenses paid and expenses paid indirectly | | | (0.54 | )%(3) | | | (0.45 | )% | | | (0.35 | )% | | | (0.10 | )% | | | 0.09 | % | | | (0.04 | )% |
| | | | | | | | | | | | | | | | | | | | | | | | | |
Portfolio turnover rate | | | 29 | %(2) | | | 68 | % | | | 71 | % | | | 92 | % | | | 66 | % | | | 82 | % |
| See notes to financial statements. |
44
MARSICO
GROWTH FUND | | | MARSICO
21st CENTURY FUND | |
Six-Month
Period Ended 3/31/16 (Unaudited) | | | Year
Ended
9/30/15 | | | Year
Ended
9/30/14 | | | Year
Ended
9/30/13 | | | Year
Ended
9/30/12 | | | Year
Ended
9/30/11 | | | Six-Month
Period Ended 3/31/16 (Unaudited) | | | Year
Ended
9/30/15 | | | Year
Ended
9/30/14 | | | Year
Ended
9/30/13 | | | Year
Ended
9/30/12 | | | Year
Ended
9/30/11 | |
| | | | | | | | | | | | | | | | | | | | | | | | | | | | | | | | | | | |
| $ | 20.11 | | | $ | 23.63 | | | $ | 25.03 | | | $ | 21.96 | | | $ | 17.43 | | | $ | 17.04 | | | $ | 20.38 | | | $ | 20.90 | | | $ | 18.05 | | | $ | 14.24 | | | $ | 11.36 | | | $ | 12.38 | |
| | | | | | | | | | | | | | | | | | | | | | | | | | | | | | | | | | | | | | | | | | | | | | | |
| | (0.04 | ) | | | (0.15 | ) | | | (0.08 | ) | | | — | (1) | | | 0.03 | | | | — | (1) | | | (0.13 | ) | | | (0.21 | ) | | | (0.21 | ) | | | (0.09 | ) | | | (0.06 | ) | | | (0.06 | ) |
| | 0.58 | | | | (0.62 | ) | | | 4.01 | | | | 4.30 | | | | 4.51 | | | | 0.40 | | | | 0.37 | | | | (0.31 | ) | | | 3.06 | | | | 3.90 | | | | 2.94 | | | | (0.96 | ) |
| | | | | | | | | | | | | | | | | | | | | | | | | | | | | | | | | | | | | | | | | | | | | | | |
| | 0.54 | | | | (0.77 | ) | | | 3.93 | | | | 4.30 | | | | 4.54 | | | | 0.40 | | | | 0.24 | | | | (0.52 | ) | | | 2.85 | | | | 3.81 | | | | 2.88 | | | | (1.02 | ) |
| | | | | | | | | | | | | | | | | | | | | | | | | | | | | | | | | | | | | | | | | | | | | | | |
| | — | | | | — | | | | (0.06 | ) | | | (0.04 | ) | | | (0.01 | ) | | | (0.01 | ) | | | — | | | | — | | | | — | | | | — | | | | — | | | | — | |
| | (5.77 | ) | | | (2.75 | ) | | | (5.27 | ) | | | (1.19 | ) | | | — | | | | — | | | | — | | | | — | | | | — | | | | — | | | | — | | | | — | |
| | — | | | | — | | | | — | (1) | | | — | (1) | | | — | (1) | | | — | (1) | | | — | | | | — | | | | — | (1) | | | — | (1) | | | — | (1) | | | — | (1) |
| | | | | | | | | | | | | | | | | | | | | | | | | | | | | | | | | | | | | | | | | | | | | | | |
| | (5.77 | ) | | | (2.75 | ) | | | (5.33 | ) | | | (1.23 | ) | | | (0.01 | ) | | | (0.01 | ) | | | — | | | | — | | | | — | | | | — | | | | — | | | | — | |
| | | | | | | | | | | | | | | | | | | | | | | | | | | | | | | | | | | | | | | | | | | | | | | |
| $ | 14.88 | | | $ | 20.11 | | | $ | 23.63 | | | $ | 25.03 | | | $ | 21.96 | | | $ | 17.43 | | | $ | 20.62 | | | $ | 20.38 | | | $ | 20.90 | | | $ | 18.05 | | | $ | 14.24 | | | $ | 11.36 | |
| | | | | | | | | | | | | | | | | | | | | | | | | | | | | | | | | | | | | | | | | | | | | | | |
| | 1.44 | %(2) | | | (4.10 | )% | | | 17.51 | % | | | 20.92 | % | | | 26.04 | % | | | 2.34 | % | | | 1.18 | %(2) | | | (2.49 | )% | | | 15.79 | % | | | 26.76 | % | | | 25.35 | % | | | (8.24 | )% |
| | | | | | | | | | | | | | | | | | | | | | | | | | | | | | | | | | | | | | | | | | | | | | | |
| $ | 336,152 | | | $ | 410,442 | | | $ | 562,653 | | | $ | 564,766 | | | $ | 677,393 | | | $ | 666,925 | | | $ | 251,976 | | | $ | 268,384 | | | $ | 316,293 | | | $ | 312,215 | | | $ | 354,545 | | | $ | 495,482 | |
| | | | | | | | | | | | | | | | | | | | | | | | | | | | | | | | | | | | | | | | | | | | | | | |
| | 1.38 | %(3) | | | 1.35 | % | | | 1.37 | % | | | 1.37 | % | | | 1.35 | % | | | 1.33 | % | | | 1.43 | %(3) | | | 1.38 | % | | | 1.42 | % | | | 1.45 | % | | | 1.41 | % | | | 1.37 | % |
| | | | | | | | | | | | | | | | | | | | | | | | | | | | | | | | | | | | | | | | | | | | | | | |
| | (0.68 | )%(3) | | | (0.52 | )% | | | (0.34 | )% | | | 0.01 | % | | | 0.15 | % | | | 0.03 | % | | | (1.04 | )%(3) | | | (0.78 | )% | | | (0.88 | )% | | | (0.33 | )% | | | (0.31 | )% | | | (0.32 | )% |
| | | | | | | | | | | | | | | | | | | | | | | | | | | | | | | | | | | | | | | | | | | | | | | |
| | 26 | %(2) | | | 81 | % | | | 80 | % | | | 114 | % | | | 65 | % | | | 67 | % | | | 34 | %(2) | | | 94 | % | | | 83 | % | | | 102 | % | | | 63 | % | | | 86 | % |
45
| | | MARSICO
INTERNATIONAL OPPORTUNITIES FUND | |
For a Fund Share Outstanding Throughout the Period | | Six-Month
Period Ended 3/31/16 (Unaudited) | | | Year
Ended
9/30/15 | | | Year
Ended
9/30/14 | | | Year
Ended
9/30/13 | | | Year
Ended
9/30/12 | | | Year
Ended
9/30/11 | |
| | | | | | | | | | | | | | | | | | | |
Net Asset Value, Beginning of Period | | $ | 14.51 | | | $ | 14.72 | | | $ | 15.30 | | | $ | 12.50 | | | $ | 10.61 | | | $ | 12.57 | |
| | | | | | | | | | | | | | | | | | | | | | | | | |
Income from Investment Operations: | | | | | | | | | | | | | | | | | | | | | | | | |
Net investment income (loss) | | | (0.11 | ) | | | (0.21 | ) | | | (0.06 | ) | | | 0.09 | | | | 0.01 | | | | (0.22 | ) |
Net realized and unrealized gains (losses) on investments | | | 0.48 | | | | — | (1) | | | (0.42 | ) | | | 2.71 | | | | 1.88 | | | | (1.49 | ) |
| | | | | | | | | | | | | | | | | | | | | | | | | |
Total from investment operations | | | 0.37 | | | | (0.21 | ) | | | (0.48 | ) | | | 2.80 | | | | 1.89 | | | | (1.71 | ) |
| | | | | | | | | | | | | | | | | | | | | | | | | |
Distributions & Other: | | | | | | | | | | | | | | | | | | | | | | | | |
Net investment income | | | — | | | | — | | | | (0.10 | ) | | | — | | | | — | | | | (0.25 | ) |
Net realized gains | | | — | | | | — | | | | — | | | | — | | | | — | | | | — | |
Redemption fees [See Note 2(h)] | | | — | | | | — | | | | — | (1) | | | — | (1) | | | — | (1) | | | — | (1) |
| | | | | | | | | | | | | | | | | | | | | | | | | |
Total distributions and other | | | — | | | | — | | | | (0.10 | ) | | | — | | | | — | | | | (0.25 | ) |
| | | | | | | | | | | | | | | | | | | | | | | | | |
Net Asset Value, End of Period | | $ | 14.88 | | | $ | 14.51 | | | $ | 14.72 | | | $ | 15.30 | | | $ | 12.50 | | | $ | 10.61 | |
| | | | | | | | | | | | | | | | | | | | | | | | | |
Total Return | | | 2.55 | %(2) | | | (1.43 | )% | | | (3.18 | )% | | | 22.40 | % | | | 17.81 | % | | | (13.98 | )% |
| | | | | | | | | | | | | | | | | | | | | | | | | |
Supplemental Data and Ratios: | | | | | | | | | | | | | | | | | | | | | | | | |
| | | | | | | | | | | | | | | | | | | | | | | | | |
Net assets, end of Period (000s) | | $ | 68,781 | | | $ | 89,141 | | | $ | 175,984 | | | $ | 119,522 | | | $ | 134,221 | | | $ | 153,855 | |
| | | | | | | | | | | | | | | | | | | | | | | | | |
Ratio of expenses to average net assets, less waivers and before expenses paid indirectly, plus recoupment of previously waived fees or expenses paid | | | 1.60 | %(3) | | | 1.60 | % | | | 1.60 | % | | | 1.60 | % | | | 1.60 | % | | | 1.56 | % |
| | | | | | | | | | | | | | | | | | | | | | | | | |
Ratio of net investment income (loss) to average net assets, net of waivers, recoupment of previously waived fees or expenses and expenses paid indirectly | | | (0.85 | )%(3) | | | (0.86 | )% | | | (0.55 | )% | | | 0.61 | % | | | 0.29 | % | | | (0.22 | )% |
| | | | | | | | | | | | | | | | | | | | | | | | | |
Ratio of expenses to average net assets, before waivers, recoupment of previously waived fees or expenses paid and expenses paid indirectly | | | 1.76 | %(3) | | | 1.63 | % | | | 1.52 | % | | | 1.74 | % | | | 1.65 | % | | | 1.56 | % |
| | | | | | | | | | | | | | | | | | | | | | | | | |
Ratio of net investment income (loss) to average net assets, before waivers, recoupment of previously waived fees or expenses paid and expenses paid indirectly | | | (1.01 | )%(3) | | | (0.89 | )% | | | (0.47 | )% | | | 0.47 | % | | | 0.24 | % | | | (0.22 | )% |
| | | | | | | | | | | | | | | | | | | | | | | | | |
Portfolio turnover rate | | | 142 | %(2) | | | 217 | % | | | 178 | % | | | 121 | % | | | 66 | % | | | 103 | % |
| See notes to financial statements. |
46
MARSICO
FLEXIBLE CAPITAL FUND | | | MARSICO
GLOBAL FUND | |
Six-Month
Period Ended 3/31/16 (Unaudited) | | | Year
Ended
9/30/15 | | | Year
Ended
9/30/14 | | | Year
Ended
9/30/13 | | | Year
Ended
9/30/12 | | | Year
Ended
9/30/11 | | | Six-Month
Period Ended 3/31/16 (Unaudited) | | | Year
Ended
9/30/15 | | | Year
Ended
9/30/14 | | | Year
Ended
9/30/13 | | | Year
Ended
9/30/12 | | | Year
Ended
9/30/11 | |
| | | | | | | | | | | | | | | | | | | | | | | | | | | | | | | | | | | |
| $ | 16.59 | | | $ | 18.39 | | | $ | 18.21 | | | $ | 15.79 | | | $ | 12.05 | | | $ | 11.97 | | | $ | 12.37 | | | $ | 14.45 | | | $ | 14.74 | | | $ | 11.51 | | | $ | 9.06 | | | $ | 9.90 | |
| | | | | | | | | | | | | | | | | | | | | | | | | | | | | | | | | | | | | | | | | | | | | | | |
| | 0.08 | | | | 0.09 | | | | (0.04 | ) | | | 0.04 | | | | 0.03 | | | | 0.08 | | | | (0.06 | ) | | | (0.10 | ) | | | (0.05 | ) | | | (0.02 | ) | | | (0.07 | ) | | | (0.05 | ) |
| | 0.37 | | | | (0.15 | ) | | | 2.18 | | | | 3.28 | | | | 3.77 | | | | 0.12 | | | | 0.53 | | | | (0.32 | ) | | | 1.93 | | | | 3.25 | | | | 2.52 | | | | (0.70 | ) |
| | | | | | | | | | | | | | | | | | | | | | | | | | | | | | | | | | | | | | | | | | | | | | | |
| | 0.45 | | | | (0.06 | ) | | | 2.14 | | | | 3.32 | | | | 3.80 | | | | 0.20 | | | | 0.47 | | | | (0.42 | ) | | | 1.88 | | | | 3.23 | | | | 2.45 | | | | (0.75 | ) |
| | | | | | | | | | | | | | | | | | | | | | | | | | | | | | | | | | | | | | | | | | | | | | | |
| | (0.11 | ) | | | — | | | | — | | | | (0.09 | ) | | | (0.06 | ) | | | (0.09 | ) | | | — | | | | — | | | | — | | | | — | | | | — | | | | (0.09 | ) |
| | (2.13 | ) | | | (1.74 | ) | | | (1.96 | ) | | | (0.81 | ) | | | — | | | | (0.03 | ) | | | (1.32 | ) | | | (1.66 | ) | | | (2.17 | ) | | | — | | | | — | | | | — | |
| | — | | | | — | | | | — | (1) | | | — | (1) | | | — | (1) | | | — | (1) | | | — | | | | — | | | | — | (1) | | | — | (1) | | | — | (1) | | | — | (1) |
| | | | | | | | | | | | | | | | | | | | | | | | | | | | | | | | | | | | | | | | | | | | | | | |
| | (2.24 | ) | | | (1.74 | ) | | | (1.96 | ) | | | (0.90 | ) | | | (0.06 | ) | | | (0.12 | ) | | | (1.32 | ) | | | (1.66 | ) | | | (2.17 | ) | | | — | | | | — | | | | (0.09 | ) |
| | | | | | | | | | | | | | | | | | | | | | | | | | | | | | | | | | | | | | | | | | | | | | | |
| $ | 14.80 | | | $ | 16.59 | | | $ | 18.39 | | | $ | 18.21 | | | $ | 15.79 | | | $ | 12.05 | | | $ | 11.52 | | | $ | 12.37 | | | $ | 14.45 | | | $ | 14.74 | | | $ | 11.51 | | | $ | 9.06 | |
| | | | | | | | | | | | | | | | | | | | | | | | | | | | | | | | | | | | | | | | | | | | | | | |
| | 2.59 | %(2) | | | (0.81 | )% | | | 12.15 | % | | | 22.34 | % | | | 31.63 | % | | | 1.59 | % | | | 3.46 | %(2) | | | (3.51 | )% | | | 13.23 | % | | | 28.06 | % | | | 27.04 | % | | | (7.73 | )% |
| | | | | | | | | | | | | | | | | | | | | | | | | | | | | | | | | | | | | | | | | | | | | | | |
| $ | 469,009 | | | $ | 549,213 | | | $ | 806,448 | | | $ | 805,735 | | | $ | 590,293 | | | $ | 409,145 | | | $ | 58,555 | | | $ | 66,612 | | | $ | 73,475 | | | $ | 61,383 | | | $ | 54,195 | | | $ | 108,021 | |
| | | | | | | | | | | | | | | | | | | | | | | | | | | | | | | | | | | | | | | | | | | | | | | |
| | 1.39 | %(3) | | | 1.37 | % | | | 1.38 | % | | | 1.41 | % | | | 1.43 | % | | | 1.27 | % | | | 1.60 | %(3) | | | 1.60 | % | | | 1.60 | % | | | 1.60 | % | | | 1.60 | % | | | 1.48 | % |
| | | | | | | | | | | | | | | | | | | | | | | | | | | | | | | | | | | | | | | | | | | | | | | |
| | 0.96 | %(3) | | | 0.53 | % | | | (0.21 | )% | | | 0.16 | % | | | 0.17 | % | | | 0.55 | % | | | (0.87 | )%(3) | | | (0.80 | )% | | | (0.42 | )% | | | (0.06 | )% | | | (0.32 | )% | | | (0.46 | )% |
| | | | | | | | | | | | | | | | | | | | | | | | | | | | | | | | | | | | | | | | | | | | | | | |
| | 1.39 | %(3) | | | 1.37 | % | | | 1.38 | % | | | 1.41 | % | | | 1.43 | % | | | 1.40 | % | | | 1.70 | %(3) | | | 1.54 | % | | | 1.66 | % | | | 1.86 | % | | | 1.70 | % | | | 1.48 | % |
| | | | | | | | | | | | | | | | | | | | | | | | | | | | | | | | | | | | | | | | | | | | | | | |
| | 0.96 | %(3) | | | 0.53 | % | | | (0.21 | )% | | | 0.16 | % | | | 0.17 | % | | | 0.42 | % | | | (0.97 | )%(3) | | | (0.74 | )% | | | (0.48 | )% | | | (0.32 | )% | | | (0.42 | )% | | | (0.46 | )% |
| | | | | | | | | | | | | | | | | | | | | | | | | | | | | | | | | | | | | | | | | | | | | | | |
| | 24 | %(2) | | | 69 | % | | | 118 | % | | | 145 | % | | | 121 | % | | | 231 | % | | | 55 | %(2) | | | 110 | % | | | 129 | % | | | 134 | % | | | 95 | % | | | 93 | % |
47
| NOTES TO FINANCIAL STATEMENTS |
NOTES TO FINANCIAL STATEMENTS March 31, 2016 (Unaudited)
The Marsico Investment Fund (the “Trust”) was organized on October 1, 1997, as a Delaware statutory trust and is registered under the Investment Company Act of 1940 (the “1940 Act”) as an open-end management investment company. The Focus Fund, Growth Fund, 21st Century Fund, International Opportunities Fund, Flexible Capital Fund, and Global Fund (collectively, the “Funds”) are separate investment portfolios of the Trust. The Focus Fund is a non-diversified fund and the Growth Fund, the 21st Century Fund, the International Opportunities Fund, the Flexible Capital Fund, and the Global Fund are diversified funds. The Focus Fund and Growth Fund commenced operations on December 31, 1997, the 21st Century Fund commenced operations on February 1, 2000, the International Opportunities Fund commenced operations on June 30, 2000, the Flexible Capital Fund commenced operations on December 29, 2006, and the Global Fund commenced operations on June 29, 2007. Trustees and officers of the Trust and employees of Marsico Capital Management, LLC (the “Adviser”) own approximately 7%, 6%, and 20% of the International Opportunities Fund’s, Flexible Capital Fund’s, and Global Fund’s outstanding shares, respectively, as of March 31, 2016.
2. | Significant Accounting Policies |
The Funds qualify as investment companies under Accounting Standards Update No. 2013-08, Accounting Standard Codification Topic 946, Financial Services — Investment Companies (“ASC 946”). The following is a summary of significant accounting policies consistently followed by the Funds in the preparation of their financial statements. These policies are in conformity with Generally Accepted Accounting Principles (“GAAP”) in the United States of America for investment companies and follow the accounting guidance provided in ASC 946. The presentation of financial statements in conformity with GAAP requires management to make estimates and assumptions that affect the reported amounts and disclosures of assets and liabilities at the date of the financial statements and the reported amounts and disclosures of income and expenses during the reporting period. Actual results could differ from those estimates.
| | (a) | Investment Valuation — A security traded on a recognized stock exchange is generally valued at the last sale price prior to the closing of the principal exchange on which the security is traded. Securities traded on NASDAQ generally will be valued at the NASDAQ Official Closing Price. If no sale price is reported on the valuation date, the most current bid price will generally be used, with the exception of short option positions which will generally utilize the most current ask price. Other securities for which over-the-counter market quotations are readily available are generally valued at the last sale price. Debt securities that will mature in more than 60 days are generally valued at their bid prices furnished by a pricing service approved by the Funds’ Board of Trustees and subject to review pursuant to procedures established by, and under the general supervision of, the Board of Trustees. Debt securities that will mature in 60 days or less are valued at amortized cost, if it approximates market value. Any securities for which market quotations are not readily available are valued at their fair value as determined in good faith by the Adviser in accordance with procedures established by, and under the general supervision of, the Funds’ Board of Trustees. The Funds may use pricing services to assist in determining market value. The Board of Trustees has authorized the use of a pricing service to assist the Funds in valuing certain equity securities listed or traded on foreign security exchanges in the Funds’ portfolios in certain circumstances where there is a significant change in the value of related US-traded securities, as represented by, for example, the S&P 500 Index. |
“Fair Value Measurements and Disclosures” (the “Fair Value Statement”) defines fair value, establishes a framework for measuring fair value in GAAP, and expands disclosures about fair value measurements. Under the Fair Value Statement, various inputs are used in determining the value of the Funds’ investments.
These inputs are summarized into three broad levels and described below:
| | ● | Level 1 – quoted prices in active markets for identical investments |
| | ● | Level 2 – other significant observable inputs (including quoted prices for similar investments, interest rates, and evaluated quotations obtained from pricing services) |
| | ● | Level 3 – significant unobservable inputs (including the Fund’s assumptions that market participants would use in determining the fair value of investments) |
48
| NOTES TO FINANCIAL STATEMENTS |
The inputs or methodology used for valuing investments are not an indication of the risk associated with investing in those investments. Changes in valuation techniques may result in transfers between the levels during the reporting period. The Funds recognize transfers between the levels as of the end of each reporting period and consider securities that are purchased during the reporting period as not having transferred between levels as of the end of the reporting period. In accordance with procedures established by, and under the general supervision of, the Funds’ Board of Trustees, certain equity securities listed or traded on foreign security exchanges in the Funds’ portfolios had a fair valuation adjustment factor applied to their equity prices as of the applicable prior fiscal year-end and were categorized as Level 2. Application of fair valuation adjustment factors was not deemed necessary at the end of the reporting period and, as such, equity securities listed or traded on foreign security exchanges were categorized as Level 1. These securities represent the only significant transfers between each of the three levels. As of March 31, 2016, the market value of these security transfers from Level 2 to Level 1 were (in thousands) $2,779, $24,697, $32,828 and $12,467 for the 21st Century Fund, International Opportunities Fund, Flexible Capital Fund and Global Fund, respectively. The following is a summary of the fair values of the Funds’ investments in each category and economic sector as of March 31, 2016:
Fund Investments by
Major Security Type | | Level 1 | | | Level 2 | | | Level 3 | | | Total | |
Marsico Focus Fund | | | | | | | | | | | | |
Assets | | | | | | | | | | | | |
Common Stocks | | | | | | | | | | | | |
Consumer Discretionary | | $ | 239,387,932 | | | $ | — | | | $ | — | | | $ | 239,387,932 | |
Consumer Staples | | | 37,145,398 | | | | — | | | | — | | | | 37,145,398 | |
Financials | | | 24,181,708 | | | | — | | | | — | | | | 24,181,708 | |
Health Care | | | 77,666,699 | | | | — | | | | — | | | | 77,666,699 | |
Information Technology | | | 282,708,491 | | | | — | | | | — | | | | 282,708,491 | |
Materials | | | 21,755,051 | | | | — | | | | — | | | | 21,755,051 | |
Short-term Investments | | | 17,952,687 | | | | — | | | | — | | | | 17,952,687 | |
| | | | | | | | | | | | | | | $ | 700,797,966 | |
Marsico Growth Fund | | | | | | | | | | | | | | | | |
Assets | | | | | | | | | | | | | | | | |
Common Stocks | | | | | | | | | | | | | | | | |
Consumer Discretionary | | $ | 105,747,573 | | | $ | — | | | $ | — | | | $ | 105,747,573 | |
Consumer Staples | | | 19,939,236 | | | | — | | | | — | | | | 19,939,236 | |
Financials | | | 10,095,494 | | | | — | | | | — | | | | 10,095,494 | |
Health Care | | | 56,020,772 | | | | — | | | | — | | | | 56,020,772 | |
Industrials | | | 5,576,343 | | | | — | | | | — | | | | 5,576,343 | |
Information Technology | | | 123,275,123 | | | | — | | | | — | | | | 123,275,123 | |
Materials | | | 9,579,430 | | | | — | | | | — | | | | 9,579,430 | |
Short-term Investments | | | 2,553,760 | | | | — | | | | — | | | | 2,553,760 | |
| | | | | | | | | | | | | | | $ | 332,787,731 | |
Marsico 21st Century Fund | | | | | | | | | | | | | | | | |
Assets | | | | | | | | | | | | | | | | |
Common Stocks | | | | | | | | | | | | | | | | |
Consumer Discretionary | | $ | 59,541,238 | | | $ | — | | | $ | — | | | $ | 59,541,238 | |
Consumer Staples | | | 20,199,749 | | | | — | | | | — | | | | 20,199,749 | |
Financials | | | 20,913,885 | | | | — | | | | — | | | | 20,913,885 | |
Health Care | | | 24,952,822 | | | | — | | | | — | | | | 24,952,822 | |
Industrials | | | 21,377,228 | | | | — | | | | — | | | | 21,377,228 | |
Information Technology | | | 85,031,055 | | | | — | | | | — | | | | 85,031,055 | |
Materials | | | 8,067,812 | | | | — | | | | — | | | | 8,067,812 | |
Telecommunication Services | | | 3,855,443 | | | | — | | | | — | | | | 3,855,443 | |
Short-term Investments | | | 9,394,244 | | | | — | | | | — | | | | 9,394,244 | |
| | | | | | | | | | | | | | | $ | 253,333,476 | |
Marsico International Opportunities Fund | | | | | | | | | | | | | | | | |
Assets | | | | | | | | | | | | | | | | |
Common Stocks | | | | | | | | | | | | | | | | |
Consumer Discretionary | | $ | 23,210,774 | | | $ | — | | | $ | — | | | $ | 23,210,774 | |
Consumer Staples | | | 4,152,418 | | | | — | | | | — | | | | 4,152,418 | |
Financials | | | 1,400,736 | | | | — | | | | — | | | | 1,400,736 | |
Health Care | | | 7,300,362 | | | | — | | | | — | | | | 7,300,362 | |
Industrials | | | 4,084,974 | | | | — | | | | — | | | | 4,084,974 | |
Information Technology | | | 26,714,507 | | | | — | | | | — | | | | 26,714,507 | |
Short-term Investments | | | 3,419,600 | | | | — | | | | — | | | | 3,419,600 | |
| | | | | | | | | | | | | | | $ | 70,283,371 | |
49
| NOTES TO FINANCIAL STATEMENTS |
NOTES TO FINANCIAL STATEMENTS March 31, 2016 (Unaudited) (continued)
Fund Investments by
Major Security Type | | Level 1 | | | Level 2 | | | Level 3 | | | Total | |
Marsico Flexible Capital Fund | | | | | | | | | | | | |
Assets | | | | | | | | | | | | |
Common Stocks | | | | | | | | | | | | |
Consumer Discretionary | | $ | 113,443,443 | | | $ | — | | | $ | — | | | $ | 113,443,443 | |
Consumer Staples | | | 59,902,778 | | | | — | | | | — | | | | 59,902,778 | |
Financials | | | 48,769,007 | | | | — | | | | — | | | | 48,769,007 | |
Health Care | | | 29,046,405 | | | | — | | | | — | | | | 29,046,405 | |
Industrials | | | 45,107,009 | | | | — | | | | — | | | | 45,107,009 | |
Information Technology | | | 87,117,180 | | | | — | | | | — | | | | 87,117,180 | |
Corporate Bonds | | | — | | | | 55,425,625 | | | | — | | | | 55,425,625 | |
Preferred Stocks | | | 17,993,431 | | | | — | | | | — | | | | 17,993,431 | |
Short-term Investments | | | 11,749,091 | | | | — | | | | — | | | | 11,749,091 | |
| | | | | | | | | | | | | | | $ | 468,553,969 | |
Marsico Global Fund | | | | | | | | | | | | | | | | |
Assets | | | | | | | | | | | | | | | | |
Common Stocks | | | | | | | | | | | | | | | | |
Consumer Discretionary | | $ | 26,831,403 | | | $ | — | | | $ | — | | | $ | 26,831,403 | |
Consumer Staples | | | 1,192,876 | | | | — | | | | — | | | | 1,192,876 | |
Health Care | | | 7,207,251 | | | | — | | | | — | | | | 7,207,251 | |
Industrials | | | 3,386,679 | | | | — | | | | — | | | | 3,386,679 | |
Information Technology | | | 19,008,840 | | | | — | | | | — | | | | 19,008,840 | |
Materials | | | 1,539,211 | | | | — | | | | — | | | | 1,539,211 | |
| | | | | | | | | | | | | | | $ | 59,166,260 | |
| | (b) | Expenses — The Funds are charged for those expenses that are directly attributable to each Fund, such as advisory and custodial fees. Expenses that are not directly attributable to a Fund are typically allocated among the Funds in proportion to their respective net assets and are in some cases allocated based on other factors. The Funds’ expenses may be reduced by advisory fee waivers, brokerage credits and uninvested cash balances earning interest or credits. Such credits are included in “Less waiver of expenses and expenses paid indirectly” on the Statements of Operations. |
Brokerage commissions may be paid to certain brokers which reduce transfer agent fees and expenses. For the six-month period ended March 31, 2016, the Funds received no such brokerage commission credits. The Funds received earnings credits on certain cash account balances which reduced transfer agent fees and expenses in the amount of $394, $197, $136, $40, $266 and $33 for the Focus Fund, Growth Fund, 21st Century Fund, International Opportunities Fund, Flexible Capital Fund, and Global Fund, respectively, for the six-month period ended March 31, 2016. Brokerage commission credits and earnings credits (if any) are included in “Less waiver of expenses and expenses paid indirectly” on the Statements of Operations.
| | (c) | Federal Income Taxes — Each Fund intends to comply with the requirements of the Internal Revenue Code of 1986, as amended (the “Internal Revenue Code”), necessary to continue to qualify as a regulated investment company and to make the requisite distributions of income to its shareholders which will be sufficient to relieve it from all or substantially all federal and state income taxes. Certain Funds may utilize earnings and profits on redemption of shares as part of the dividends paid deduction. |
| | (d) | Distributions to Shareholders — Dividends from net investment income and net realized capital gains, if any, will be declared and paid at least annually. Distributions to shareholders are recorded on the ex-dividend date. Each Fund may periodically make reclassifications among certain of its capital accounts as a result of the timing and characterization of certain income and capital gains distributions determined in accordance with federal tax regulations, which may differ from GAAP. These reclassifications are due to differing treatment for items such as foreign currency transactions, passive foreign investment companies and net investment losses. |
The Funds at times may invest in real estate investment trusts (“REITs”). REITs generally pay dividends to their investors based upon cash available from their operations and this amount may differ significantly from the REITs’ actual earnings and profits (“E&P”) determined for income tax purposes. It is common for these dividends to exceed the REITs’ taxable E&P, resulting in the excess portion of such dividends eventually being designated as a return of capital. Determination of the tax character of dividends made by REITs is typically performed by the REIT several months subsequent to the payment of the dividend. Therefore, due to timing issues, the Funds may be in a position of being required to calculate and pay required distribution amounts to their shareholders based on the best information available from the REITs, which may be prior to the final determination of the REITs’
50
| NOTES TO FINANCIAL STATEMENTS |
taxable E&P, and it is possible that a portion of the Funds’ distribution amounts could include a return of capital to shareholders for federal income tax purposes.
| | (e) | Foreign Currency Translation — The accounting records of the Funds are maintained in US dollars. For valuation purposes, values of securities denominated in foreign currencies are translated into US dollars at 4:00 p.m. Eastern Time. Amounts related to the purchase and sale of foreign securities and investment income are translated at the rates of exchange prevailing on the respective dates of such transactions. |
Reported realized gains and losses on foreign currency transactions arise from sales of portfolio securities, forward foreign currency contracts, currency gains or losses realized between the trade and settlement dates on securities transactions, and the difference between the amounts of dividends, interest, and foreign withholding taxes recorded on the Funds’ books and the US dollar equivalent of the amounts actually received or paid.
The Funds do not isolate that portion of the results of operations resulting from changes in foreign exchange rates on investments from the fluctuations arising from changes in market prices of securities held at the end of the reporting period. Net unrealized appreciation or depreciation on investments and foreign currency translations arises from changes in the value of assets and liabilities, including investments in securities at the end of the reporting period, resulting from changes in the exchange rates and changes in market prices of securities held. Transactions in foreign-denominated assets may involve greater risks than domestic transactions, including currency risk, political and economic risk, regulatory risk and market risk.
| | (f) | Derivative Instruments — “Disclosure about Derivative Instruments and Hedging Activities” (the “Derivatives Statement”) requires enhanced disclosures about the Funds’ derivative and hedging activities, including how such activities are accounted for and their effects on the Funds’ financial position, performance and cash flows. |
The Funds are not intended as vehicles for investing substantially in derivative instruments, and may hold derivative instruments only infrequently. The Funds enter into derivative instruments in order to increase exposure to certain investments, asset classes, or markets, or for hedging purposes to hedge against adverse movements in securities prices, currency rates or interest rates. The Funds can hold various types of derivative instruments such as futures contracts and options on securities, financial indexes, and foreign currencies, options on futures, forward foreign currency contracts, interest rate swaps, credit default swaps, and swap-related products. The use of derivative instruments may involve risks such as the possibility of illiquid markets or imperfect correlation between the value of the derivative instruments and the underlying securities, or that the counterparty will fail to perform its obligations. There were no outstanding derivative instruments held by the Funds as of March 31, 2016 nor did the Funds utilize derivative instruments during the six-month period ended March 31, 2016.
Forward Foreign Currency Contracts — A forward currency contract is a commitment to purchase or sell foreign currency at a specified price on a future date. A Fund may enter into a forward foreign currency contract in order to hedge against foreign currency fluctuations, such as when the Fund elects to reduce exposure to changes in foreign currency exchange rates on foreign portfolio holdings denominated in or exposed to foreign currencies, or in preparation for purchasing securities in a particular market, or for other investment purposes.
The market value of a forward foreign currency contract fluctuates with changes in currency exchange rates. Outstanding forward foreign currency contracts are valued daily at current market rates and the resulting change in market value is recorded as unrealized appreciation or depreciation. When a forward foreign currency contract is settled, the Fund records a realized gain or loss equal to the difference between the value at the time the forward foreign currency contract was opened and the value at the time it was settled.
The Funds are subject to foreign currency exchange risk in the normal course of pursuing their investment objectives. Forward foreign currency contracts may involve market risk in excess of the unrealized gain or loss reflected on the Statements of Assets and Liabilities. In addition, the Funds could be exposed to a credit risk if the counterparties are unable or unwilling to meet the terms of the contracts or if the value of the foreign currency changes unfavorably. In connection with these contracts, the Funds typically segregate cash and/or other securities as collateral in a sufficient value equal to the aggregate amount of the Funds’ commitments under the forward foreign currency contracts; such collateral would be in the possession of the Funds’ custodian, if applicable.
51
| NOTES TO FINANCIAL STATEMENTS |
NOTES TO FINANCIAL STATEMENTS March 31, 2016 (Unaudited) (continued)
Options Contracts — The Funds may purchase or write (sell) put and call options on foreign and domestic stock indices, foreign currencies, and US and foreign securities that are traded on a securities exchange or an over-the-counter market. These transactions are generally for hedging purposes or for the purpose of earning additional income. In addition, the Funds may enter into such transactions for cross-hedging purposes. There is generally limited counterparty credit risk involved when entering into exchange-traded option contracts because the exchange’s clearinghouse acts as counterparty to all options traded on such exchange.
In purchasing an option, a Fund pays a premium whether or not the option is exercised. Additionally, the Fund bears the risk of loss of premium and change in market value should the counterparty not perform under the contract. Put and call options purchased are accounted for in the same manner as portfolio securities. The cost of securities acquired through the exercise of call options is increased by premiums paid. The proceeds from securities sold through the exercise of put options are decreased by the premiums paid.
When a Fund writes an option, the premium received by the Fund is recorded as a liability and is subsequently adjusted to the current market value of the option written. Premiums received from writing options that expire are recorded by the Fund on the expiration date as realized gains from option transactions. The difference between the premium and the amount paid on effecting a closing purchase transaction, including brokerage commissions, is also treated as a realized gain, or if the premium is less than the amount paid for the closing purchase transaction, as a realized loss. If a call option is exercised, the premium is added to the proceeds from the sale of the underlying security or currency in determining whether the Fund has realized a gain or loss. If a put option is exercised, the premium reduces the cost basis of the security or currency purchased by the Fund. In writing an option, the Fund bears the market risk of an unfavorable change in the price of the security or currency underlying the written option. Exercise of an option written by the Fund could result in the Fund selling or buying a security or currency at a price different from the current market value.
| | (g) | Trustees’ Deferred Fee Plan — Effective February 1, 2000, the Board of Trustees adopted the Marsico Investment Fund Deferred Fee Plan (the “Deferred Fee Plan”), amended and restated as of December 30, 2005, which allows the Trustees to defer the receipt of all or a portion of their compensation received from the Funds. Any deferred fees are credited to accounts established on behalf of the Trustees into the Funds as directed by each Trustee. The amounts credited to these accounts increase or decrease in accordance with the performance of the Funds selected by the Trustees. The market value of the deferred account balances as of March 31, 2016 is shown on the Statements of Assets and Liabilities as part of an asset account, “Prepaid expenses and other assets”, and a liability account, “Accrued trustees’ fees”. Additionally, the fluctuation of the account balances due to the Funds’ performance is recorded by the Funds as unrealized appreciation (depreciation), which is shown as part of “Net unrealized appreciation on investments and foreign currency translations” on the Statements of Assets and Liabilities, and as compensation expense, which is shown as part of the expense account “Trustees’ fees and expenses” on the Statements of Operations. Fees earned and deferred by the Trustees for the six-month period ended March 31, 2016 are also included in “Trustees’ fees and expenses” on the Statements of Operations. Amounts contributed to the Deferred Fee Plan will be deferred until distributed in accordance with the Deferred Fee Plan. Unrealized appreciation (depreciation) of Fund shares held in the Deferred Fee Plan is subject to the Funds’ expense reimbursement agreement with the Adviser. |
| | (h) | Redemption Fee — Effective January 31, 2014, the Funds’ Board of Trustees approved the elimination of redemption fees from Fund share transactions placed on and after January 31, 2014. Prior to January 31, 2014, a 2.00% redemption fee was retained by the Funds to offset transaction costs and other expenses associated with short-term investing. The fee was imposed on certain redemptions or exchanges of shares held 30 days or less from their purchase date. Redemption fees were recorded by the Funds as a reduction of shares redeemed and as a credit to paid-in-capital. |
| | (i) | Other — Investment transactions are accounted for on a trade date basis. Each Fund determines the gain or loss realized from the investment transactions by comparing the original cost of the security lot sold with the net sale proceeds. Dividend income is recognized on the ex-dividend date. Certain dividends from foreign securities are recorded when the Funds are informed of the dividend if such information is obtained subsequent to the ex-dividend date. Interest income is recognized on an accrual basis and includes amortization of premiums and accretion of discounts. |
52
| NOTES TO FINANCIAL STATEMENTS |
| | (j) | Indemnifications — In the normal course of business, the Funds enter into contracts that contain provisions indemnifying other parties against specified potential liabilities. Each Fund’s maximum exposure under these arrangements is unknown as this would involve future claims that may be made against the Fund that have not yet occurred. However, based on experience, the Funds expect the risk of loss in connection with these potential indemnification obligations to be remote. There can be no assurance that material liabilities related to such obligations will not arise in the future, which may adversely impact a Fund. |
3. | Investment Advisory Agreement and Transactions With Affiliates |
Each Fund has an agreement with the Adviser to furnish investment advisory services to the Funds. Prior to December 1, 2015, the Adviser was compensated for managing the Focus Fund and the Growth Fund at the rate of 0.85% per year of average daily net assets up to $3 billion in each Fund, and 0.75% per year of average daily net assets exceeding $3 billion in each Fund; and at a rate of 0.85% of the average daily net assets of the 21st Century Fund, the International Opportunities Fund, the Flexible Capital Fund, and the Global Fund. As of December 1, 2015, each Fund pays the Adviser a fee calculated using the following, lower rates:
Annual Rate of Average Daily Net Assets | Asset Threshold |
0.80% | First $250 million |
0.75% | Next $250 million |
0.70% | Next $250 million |
0.65% | In excess of $750 million |
The Adviser has entered into a written expense limitation and fee waiver agreement under which it has agreed to limit the total expenses of each Fund (excluding interest, taxes, acquired fund fees and expenses, litigation, brokerage, and extraordinary expenses) to an annual rate of 1.60% of the average net assets of the Focus Fund, the International Opportunities Fund, the Flexible Capital Fund, and the Global Fund, and 1.50% of the average net assets of the Growth Fund and the 21st Century Fund until January 31, 2017. This expense limitation and fee waiver agreement may be terminated by the Adviser at any time after January 31, 2017, upon 15 days prior notice to the Fund and its administrator.
The Adviser may recoup from a Fund fees previously waived or expenses previously reimbursed by the Adviser with respect to that Fund pursuant to this agreement (or a previous expense limitation agreement) if: (1) such recoupment by the Adviser does not cause the Fund, at the time of recoupment, to exceed the lesser of (a) the expense limitation in effect at the time the relevant amount was waived and/or reimbursed, or (b) the expense limitation in effect at the time of the proposed recoupment, and (2) the recoupment is made within three fiscal years after the end of the fiscal year in which the amount was waived or reimbursed. As of March 31, 2016, recoupment amounts (in thousands) that may potentially be made by the International Opportunities Fund and Global Fund to the Adviser are as follows:
Year of Expiration | | International
Opportunities Fund | | | Global Fund | |
2016 | | $ | 101 | | | $ | 140 | |
2017 | | | — | | | | 47 | |
2018 | | | 32 | | | | — | |
2019 | | | 61 | | | | 30 | |
| | | $ | 194 | | | $ | 217 | |
Certain officers of the Trust are also officers of the Adviser. The Funds pay a portion of the Chief Compliance Officer’s total compensation costs which is shown as part of the expense account “Professional fees” on the Statements of Operations. No other officers of the Trust received compensation from the Funds during the six-month period ended March 31, 2016.
4. | Distribution and Service Plan |
The Funds have adopted a Distribution and Service Plan (the “Plan”) pursuant to Rule 12b-1 under the 1940 Act. The Plan authorizes payments by the Funds in connection with the distribution of their shares at an annual rate, as determined from time to time by the Board of Trustees, of up to 0.25% of a Fund’s average daily net assets. The Adviser may, out of its own resources and at its sole discretion, make certain payments on behalf of the Plan for expenses incurred by a Fund for distribution of Fund shares and related services.
53
| NOTES TO FINANCIAL STATEMENTS |
NOTES TO FINANCIAL STATEMENTS March 31, 2016 (Unaudited) (continued)
5. | Investment Transactions |
The aggregate purchases and sales of securities, excluding short-term investments, for the Funds for the six-month period ended March 31, 2016, were as follows:
(Amounts in thousands) | | Focus
Fund | | | Growth
Fund | | | 21st
Century
Fund | | | International
Opportunities
Fund | | | Flexible
Capital
Fund | | | Global
Fund | |
Purchases | | $ | 218,034 | | | $ | 96,299 | | | $ | 84,597 | | | $ | 108,442 | | | $ | 113,897 | | | $ | 34,811 | |
Sales | | $ | 333,397 | | | $ | 170,726 | | | $ | 92,382 | | | $ | 132,070 | | | $ | 147,928 | | | $ | 40,539 | |
There were no purchases or sales of US government securities, excluding short-term investments.
6. | Federal Income Tax Information |
“Accounting for Uncertainty in Income Taxes” (the “Income Tax Statement”) requires an evaluation of tax positions taken (or expected to be taken) in the course of preparing a Fund’s tax returns to determine whether these positions meet a “more-likely-than-not” standard that, based on the technical merits, have a more than fifty percent likelihood of being sustained by a taxing authority upon examination. A tax position that meets the “more-likely-than-not” recognition threshold is measured to determine the amount of benefit to recognize in the financial statements. The Funds recognize interest and penalties, if any, related to unrecognized tax benefits as income tax expense in the Statements of Operations.
The Income Tax Statement requires management of the Funds to analyze all open tax years, fiscal years 2012-2016 as defined by Internal Revenue Service (“IRS”) statute of limitations for all major jurisdictions, including federal tax authorities and certain state tax authorities. As of and during the six-month period ended March 31, 2016, the Funds did not have any liabilities for any unrecognized tax benefits. The Funds have no examinations in progress and are not aware of any tax positions for which it is reasonably possible that the total amounts of unrecognized tax benefits will significantly change in the next twelve months.
At March 31, 2016, gross unrealized appreciation and depreciation of investments, based on cost for federal income tax purposes were as follows:
(Amounts in thousands) | | Focus
Fund | | | Growth
Fund | | | 21st
Century
Fund | | | International
Opportunities
Fund | | | Flexible
Capital
Fund | | | Global
Fund | |
Cost of Investments | | $ | 565,472 | | | $ | 277,173 | | | $ | 208,615 | | | $ | 62,882 | | | $ | 396,429 | | | $ | 50,434 | |
| | | | | | | | | | | | | | | | | | | | | | | | | |
Gross Unrealized Appreciation | | $ | 153,546 | | | $ | 67,777 | | | $ | 53,313 | | | $ | 10,049 | | | $ | 85,455 | | | $ | 10,124 | |
Gross Unrealized Depreciation | | | (18,220 | ) | | | (12,162 | ) | | | (8,595 | ) | | | (2,648 | ) | | | (13,330 | ) | | | (1,392 | ) |
| | | | | | | | | | | | | | | | | | | | | | | | | |
Net Unrealized Appreciation on Investments | | $ | 135,326 | | | $ | 55,615 | | | $ | 44,718 | | | $ | 7,401 | | | $ | 72,125 | | | $ | 8,732 | |
The difference between cost amounts for financial statement and federal income tax purposes is due primarily to wash sale loss deferrals.
At September 30, 2015, for federal income tax purposes, the Funds had accumulated capital loss carryforwards as follows:
(Amounts in thousands) | | Focus
Fund | | | Growth
Fund | | | 21st
Century
Fund | | | International
Opportunities
Fund | | | Flexible
Capital
Fund | | | Global
Fund | |
For losses expiring September 30, | | | | | | | | | | | | | | | | | | |
2017 | | $ | — | | | $ | — | | | $ | 25,304 | | | $ | 8,008 | | | $ | — | | | $ | — | |
2018 | | | — | | | | — | | | | 390,537 | | | | 93,558 | | | | — | | | | — | |
Not Subject to Expiration | | | — | | | | — | | | | — | | | | — | | | | — | | | | — | |
| | | $ | — | | | $ | — | | | $ | 415,841 | | | $ | 101,566 | | | $ | — | | | $ | — | |
To the extent that a Fund may realize future net capital gains, those gains will be offset by any of its unused capital loss carryforward. Future capital loss carryforward utilization in any given year may be subject to Internal Revenue Code limitations.
54
| NOTES TO FINANCIAL STATEMENTS |
The Funds are permitted to carryforward capital losses incurred in taxable years beginning after December 22, 2010 for an unlimited period, and such capital losses will retain their character as either short-term or long-term capital losses. Capital losses incurred by the Funds in taxable years beginning before December 23, 2010 may only be carried forward eight taxable years as short-term capital losses.
As of September 30, 2015, the Focus Fund, Growth Fund, 21st Century Fund, International Opportunities Fund, Flexible Capital Fund, and Global Fund, respectively, had (in thousands) $3,606, $2,357, $1,978, $541, $0 and $431 of qualified late-year losses, which are deferred until fiscal year 2016 for tax purposes. Net late-year losses incurred after December 31st, and within the taxable year, are deemed to arise on the first day of the Fund’s next taxable year.
The 21st Century Fund and International Opportunities Fund utilized (in thousands) $45,039 and $577, respectively, of its capital loss carryforwards, during the year ended September 30, 2015.
As of September 30, 2015, the components of accumulated earnings (deficit) on a tax basis were as follows:
(Amounts in thousands) | | Focus
Fund | | | Growth
Fund | | | 21st
Century
Fund | | | International
Opportunities
Fund | | | Flexible
Capital
Fund | | | Global
Fund | |
Undistributed Ordinary Income | | $ | — | | | $ | — | | | $ | — | | | $ | — | | | $ | 2,070 | | | $ | — | |
Undistributed Trustees' Deferred Compensation | | | (1,852 | ) | | | (1,106 | ) | | | (777 | ) | | | (281 | ) | | | (797 | ) | | | (323 | ) |
Undistributed Long-Term Capital Gains | | | 157,704 | | | | 111,367 | | | | — | | | | — | | | | 61,322 | | | | 6,835 | |
Tax Accumulated Earnings (Deficit) | | | 155,852 | | | | 110,261 | | | | (777 | ) | | | (281 | ) | | | 62,595 | | | | 6,512 | |
Accumulated Capital and Other Losses | | | (3,606 | ) | | | (2,357 | ) | | | (417,819 | ) | | | (102,107 | ) | | | — | | | | (431 | ) |
Net Unrealized Appreciation on Investments and Foreign Currency Translations | | | 98,985 | | | | 41,156 | | | | 34,979 | | | | 2,418 | | | | 58,473 | | | | 3,752 | |
Trustees' Deferred Compensation Mark-to-Market | | | 472 | | | | 285 | | | | 232 | | | | 33 | | | | 503 | | | | 174 | |
Total Accumulated Earnings (Deficit) | | $ | 251,703 | | | $ | 149,345 | | | $ | (383,385 | ) | | $ | (99,937 | ) | | $ | 121,571 | | | $ | 10,007 | |
Undistributed ordinary income consists of net investment income and timing differences related to qualified late-year losses.
The tax character of distributions paid during the fiscal years ended September 30, 2015 and 2014 was as follows:
| | | 2015 | | | 2014 | |
(Amounts in thousands) | | Ordinary Income | | | Long-Term Capital Gains | | | Ordinary Income | | | Long-Term Capital Gains | |
Focus Fund | | $ | 17,276 | | | $ | 106,806 | | | $ | 13,021 | | | $ | 120,014 | |
Growth Fund | | | 11,035 | | | | 52,595 | | | | 24,630 | | | | 94,408 | |
21st Century Fund | | | — | | | | — | | | | — | | | | — | |
International Opportunities Fund | | | — | | | | — | | | | 742 | | | | — | |
Flexible Capital Fund | | | 11,186 | | | | 61,016 | | | | 44,547 | | | | 44,556 | |
Global Fund | | | 1,487 | | | | 6,923 | | | | 216 | | | | 9,062 | |
The tax character of dividends paid may differ from that shown in the Statements of Changes in Net Assets due to short-term gains being treated as ordinary income for tax purposes.
Management of the Adviser has determined that there were no material subsequent events that would require disclosure in the Funds’ financial statements.
55
EXPENSE EXAMPLE For the six-month period ended March 31, 2016 (Unaudited)
As a shareholder of the Marsico Funds (the “Funds”), you incur two types of costs: (1) transaction costs, including redemption fees (if any), and (2) ongoing costs, including management fees, distribution (12b-1) fees, and other Fund expenses. This Example is intended to help you understand your ongoing costs (in dollars) of investing in the Funds and to compare these costs with the ongoing costs of investing in other mutual funds.
The Example is based on an investment of $1,000 invested at the beginning of the period and held for the entire period from October 1, 2015 to March 31, 2016 (the “period”).
Actual Expenses
The first line of the table below provides information about actual account values and actual expenses. You may use the information in this line, together with the amount you invested, to estimate the expenses you paid over the period. Simply divide your account value by $1,000 (for example, an $8,600 account value divided by $1,000 equals 8.6), then multiply the result by the number in the first line under the heading entitled “Expenses paid for the six-month period ended March 31, 2016” to estimate the expenses you paid on your account during the period.
Hypothetical Example for Comparison Purposes
The second line of the table below provides information about hypothetical account values and hypothetical expenses based on the Funds’ actual expense ratios and an assumed rate of return of 5% per year before expenses, which is not the actual return of any of the Funds. The hypothetical account values and expenses may not be used to estimate the actual ending account balance or expenses you paid for the period. You may use this information to compare the ongoing costs of investing in the Funds and other funds. To do so, compare this 5% hypothetical example with the 5% hypothetical examples that appear in the shareholder reports of other funds.
Please note that the expenses shown in the table are meant to highlight your ongoing costs only and do not reflect any transactional costs such as redemption fees (if any). Therefore, the second line of the table is useful in comparing the ongoing costs only, and will not help you determine the relative total costs of owning different funds. In addition, if these transactional costs (if any) were included, your costs could have been higher.
Expenses Paid During the Period | Beginning
account value
October 1, 2015 | Ending
account value
March 31, 2016 | Expenses paid for the
six-month period ended
March 31, 2016(1) |
FOCUS FUND | | | |
Actual Example | $1,000.00 | $1,025.00 | $6.63 |
Hypothetical Example, assuming a 5% return before expenses | $1,000.00 | $1,018.45 | $6.61 |
| | | | |
GROWTH FUND | | | |
Actual Example | $1,000.00 | $1,014.40 | $6.97 |
Hypothetical Example, assuming a 5% return before expenses | $1,000.00 | $1,018.08 | $6.98 |
| | | | |
21st CENTURY FUND | | | |
Actual Example | $1,000.00 | $1,011.80 | $7.21 |
Hypothetical Example, assuming a 5% return before expenses | $1,000.00 | $1,017.83 | $7.23 |
| | | | |
INTERNATIONAL OPPORTUNITIES FUND | | | |
Actual Example | $1,000.00 | $1,025.50 | $8.10 |
Hypothetical Example, assuming a 5% return before expenses | $1,000.00 | $1,017.00 | $8.07 |
| | | | |
FLEXIBLE CAPITAL FUND | | | |
Actual Example | $1,000.00 | $1,025.90 | $7.03 |
Hypothetical Example, assuming a 5% return before expenses | $1,000.00 | $1,018.06 | $7.01 |
| | | | |
GLOBAL FUND | | | |
Actual Example | $1,000.00 | $1,034.60 | $8.14 |
Hypothetical Example, assuming a 5% return before expenses | $1,000.00 | $1,017.00 | $8.07 |
(1) | Expenses are equal to the Funds’ annualized expense ratios (1.31% for the Focus Fund, 1.38% for the Growth Fund, 1.43% for the 21st Century Fund, 1.60% for the International Opportunities Fund, 1.39% for the Flexible Capital Fund, and 1.60% for the Global Fund), multiplied by the average account value over the period, multiplied by 183/366 (to reflect the six-month period). |
56
| CONSIDERATION OF INVESTMENT ADVISORY AGREEMENTS |
CONSIDERATION OF INVESTMENT ADVISORY AGREEMENTS (Unaudited)
At a meeting of the Board of Trustees of the Trust held on November 18, 2015, the Trustees, by a unanimous vote (including a separate vote of those Trustees who are not “interested persons” (as the term is defined in the 1940 Act) of the Trust (the “Independent Trustees”)), approved the renewal of the Investment Advisory and Management Agreements for the Focus Fund, Growth Fund, 21st Century Fund, International Opportunities Fund, Flexible Capital Fund, and Global Fund (the “Agreements”). In advance of the meeting, the Independent Trustees requested and received extensive materials from Marsico Capital Management, LLC (the “Adviser” or “MCM”) to assist them in considering the renewal of the Agreements. The materials provided by the Adviser contained information with respect to the factors noted below, including detailed information relating to the performance, advisory fees and other expenses of the Funds, other funds sub-advised by the Adviser and non-fund advisory accounts of the Adviser. The materials also included comparisons of the Funds with third party funds of similar size and investment objectives in terms of performance, fees and other expenses, as well as the performance of each Fund versus its benchmark. In addition, the Adviser provided information regarding its overall expenses and profitability, as well as other information requested by the Trustees.
In addition to the materials prepared specifically for contract review analysis, on an ongoing basis the Trustees receive information and reports from the Adviser and other service providers to the Funds regarding the investment performance of the Funds as well as operational, compliance, marketing and other matters.
The Trustees engaged in a detailed discussion of the materials with management of the Adviser. The Independent Trustees then met separately with independent counsel to the Independent Trustees for a full review of the materials. Following this session, the full Board reconvened and approved the continuation of the Agreements for the Focus Fund, Growth Fund, 21st Century Fund, International Opportunities Fund, Flexible Capital Fund, and Global Fund, subject to lower fee rates and new breakpoints (resulting in overall reductions in the management fee rates) for each of the Funds.
Discussion of Certain Factors Considered
1. Nature, Extent, and Quality of Services.
The Independent Trustees considered the nature, quality and extent of the services performed by the Adviser under the Investment Advisory Agreements (the “Advisory Agreements”) with the Adviser, including portfolio management, supervision of Fund operations, regulatory filings and disclosures to shareholders, compliance functions, general oversight of other service providers, review of Fund legal issues, and other services. The Independent Trustees also considered the personnel who provide these services, which includes a team of individuals collectively having years of experience in their particular areas of expertise. The Independent Trustees reviewed the Adviser’s investment philosophy and experience, noting that the Adviser and its affiliates employ a focused stock-picking strategy that involves extensive research. The Independent Trustees discussed the Adviser’s ability to continue to provide the same level and quality of services to the Funds, and discussed with members of management of the Adviser the financial condition of the Adviser and its ability to attract and retain experienced personnel. The Independent Trustees concluded that the services are extensive in nature, that the Adviser employs investment advisory personnel who consistently delivered a high level of service and that, with respect to third party service providers, the Adviser effectively manages the outsourcing by the Funds of certain services to other service providers and the oversight of those service providers.
2. Investment Performance of the Funds and Adviser.
The Independent Trustees considered short-term and long-term investment performance for each Fund over various periods of time as compared to both relevant equity indices and the performance of each Fund’s Lipper, Inc. peer group universe. The Independent Trustees discussed with representatives of the Adviser the factors underlying the outperformance or under-performance of the Funds over various time periods. The Independent Trustees reviewed the performance of the Funds in the context of the long-term investment strategies being pursued by the Funds. In addition to reviewing performance information of comparable funds, the Independent Trustees took into account that they regularly review each Fund’s performance.
The Independent Trustees considered the Adviser’s substantial investment advisory experience and capabilities. The Independent Trustees noted MCM’s continued investment in research. The Independent Trustees noted that the investment performance delivered by the Adviser to the Funds appeared to be consistent with the performance delivered for other clients of the Adviser. Based on this review, the Independent Trustees concluded that the performance of the Adviser with respect to each Fund was acceptable for the purposes of approving the Advisory Agreements, although they would continue to closely monitor performance.
3. Costs of Services and Profits Realized by the Adviser.
(a) Costs of Services to Funds: Fees and Expenses. The Independent Trustees considered each Fund’s management fee rates and expense ratios relative to industry averages for the Fund’s benchmark category and the advisory fees charged by the Adviser to other sub-advised
57
| CONSIDERATION OF INVESTMENT ADVISORY AGREEMENTS |
CONSIDERATION OF INVESTMENT ADVISORY AGREEMENTS (Unaudited) (continued)
funds and non-fund clients, including information regarding expense limitation commitments from the Adviser, and the breakpoints in the proposed new advisory fee schedule for all of the Funds. The Independent Trustees noted the information provided by the Adviser stated that the mix of services under the Advisory Agreements are much more extensive than those under the Adviser’s advisory agreements for sub-advised funds and non-fund clients. The Independent Trustees also noted previous actions taken by MCM to reduce Fund expenses, including that MCM had waived fees and absorbed expenses from time to time, and that some of those expenditures may not be recouped. In response to a suggestion by the Independent Trustees that the Adviser consider whether breakpoints might be appropriate for the management fee rates of the Funds, the Adviser proposed that, effective December 1, 2015, lower fee rates and new breakpoints (resulting in overall reductions in the management fee rates) be introduced for each of the Funds. The Independent Trustees reviewed various expense projections including the proposed breakpoints and noted that the proposed lower fees and new breakpoints were projected to reduce advisory fees and as such would be a positive factor in maintaining overall Fund expenses in a range that continues to be reasonable. The Independent Trustees concluded that the proposed new investment advisory fees are acceptable based upon the qualifications, experience, reputation, and performance of the Adviser and the overall expense ratios of the Funds.
(b) Profitability and Costs of Services to Adviser. The Independent Trustees reviewed the information provided by MCM regarding its overall profitability and costs and a pro forma estimate of the Adviser’s profitability and costs if the Funds constituted the Adviser’s only assets under management. The Independent Trustees noted that MCM’s fee revenue from the Funds had decreased, or increased only slightly for one of the Funds whose average net assets had slightly increased, and that MCM had not reduced its services, but continued to devote substantial resources and personnel to the Funds. The materials provided to the Trustees also included information regarding the Adviser’s payment of some administrative expenses as well as limited distribution expenses for the Funds. The Independent Trustees also noted that the new investment advisory fee schedule proposed by MCM would result in a further reduction of MCM’s fee revenue from the Funds. The Independent Trustees also discussed the previous restructuring and reductions of the outstanding debt obligations of the Adviser’s parent companies, noting that these events helped to maintain the Adviser’s ability to pay its operating expenses over the short and intermediate term while further strengthening MCM’s overall financial position. The Independent Trustees agreed to continue at their regular meetings to monitor the impact of debt levels on the Adviser and its ability to provide services to the Funds. The Independent Trustees also noted that the Adviser previously had substantially increased its resources devoted to Fund matters in response to regulatory requirements enacted in prior years. The Independent Trustees concluded that the fees received by the Adviser under the Advisory Agreements were set at an acceptable level with the proposed lower fee rates and new breakpoints.
4. Extent of Economies of Scale as Funds Grow.
The Independent Trustees considered whether there have been economies of scale with respect to the management of each Fund and whether such Fund has appropriately benefited from any economies of scale. The Independent Trustees noted that economies of scale may develop for certain Funds as their assets increase and their Fund-level expenses decline as a percentage of assets, but that Fund-level economies of scale may not necessarily result in Adviser-level economies of scale. It was reported to the Independent Trustees that the expenses incurred by the Adviser relating to management of the Funds increased substantially in recent years as a percentage of management fees and that the average net asset levels of only one Fund had increased slightly over the past year. The Independent Trustees agreed that it was possible that if trends changed and Fund assets began growing again beyond certain thresholds, Adviser-level expenses incurred in managing the Funds eventually could level off or decline as a percentage of management fees in the future, potentially resulting in economies of scale. The Independent Trustees noted that should economies of scale be realized in the future, the proposed new advisory fee schedule contains breakpoints that would benefit shareholders of the Funds as assets increase.
5. Whether Fee Levels Reflect Economies of Scale.
The Independent Trustees also considered whether the management fee rate is reasonable in relation to the asset size of each Fund and any economies of scale that may exist. In response to a suggestion by the Independent Trustees that the Adviser consider whether breakpoints might be appropriate for the Funds, the Adviser proposed that, effective December 1, 2015, lower fee rates and new breakpoints be introduced for each of the Funds. Under the proposed breakpoints, investment management fees would be equal to 0.80% per year of its average daily net assets up to $250 million, 0.75% per year of its average daily net assets for the next $250 million, 0.70% per year of its average daily net assets for the next $250 million, and 0.65% per year of its average daily net assets exceeding $750 million. The Independent Trustees noted that the Adviser had responded positively to their recommendation that the investment management fees for the Funds be reconsidered, and that MCM proposed the new breakpoints and a fee reduction in an effort to maintain overall Fund expenses in a range that continues to be reasonable. The Independent Trustees also took note that the Adviser also intended to renew the voluntary fund expense limitations for each of the Funds until at least January 31, 2017, all subject to possible future recoupment of previously waived fees or other expenses under certain conditions.
58
| CONSIDERATION OF INVESTMENT ADVISORY AGREEMENTS |
6. Other Relevant Considerations.
The Independent Trustees considered the character and amount of other incidental benefits received by the Adviser and its affiliates from its association with the Funds. The Independent Trustees concluded that potential “fall-out” benefits that the Adviser may receive, such as greater name recognition or increased ability to obtain research or brokerage services, appear to be reasonable, and may in some cases benefit the Funds.
Conclusions
In considering the Advisory Agreements, the Independent Trustees did not identify any factor as all-important or all-controlling and instead considered these factors collectively in light of each Fund’s surrounding circumstances. Based on this review, it was the judgment of the Independent Trustees that each Fund’s fees were reasonable with the proposed lower fee rates and new breakpoints, the extent and quality of services were acceptable and performance of the Funds was acceptable. Therefore, re-approval of the Advisory Agreements was in the best interests of each Fund and its shareholders. As a part of their decision-making process, the Independent Trustees noted that the Adviser has managed the Funds since their inception, and the Independent Trustees believe that a long-term relationship with a capable, conscientious adviser is in the best interests of the Funds and their shareholders. The Independent Trustees considered, generally, that shareholders invested in a Fund knowing that the Adviser managed that Fund and knowing its investment management fee. As such, the Independent Trustees considered whether the Adviser managed each Fund in accordance with its investment objectives and policies as disclosed to shareholders. Additionally, as part of its deliberations, the Board also considered and relied upon the information about the Funds and MCM that had been provided to them throughout the year in connection with their regular Board meetings at which they engage in the ongoing oversight of the Funds and their operations.
Upon conclusion of their review and discussion, the Trustees, including all of the Independent Trustees, unanimously agreed the Advisory Agreements for each of the Funds should be continued.
59
OTHER INFORMATION (Unaudited)
Proxy Voting Guidelines
The Funds exercise the voting rights associated with the securities held by the Funds under the proxy voting policy of the Funds. A description of those policies and procedures of the Funds and a record of the Funds’ proxy votes for the one-year period ended June 30, 2015 are available without charge, upon request, by calling 888-860-8686. It is also available on the Securities and Exchange Commission’s (SEC) website at www.sec.gov.
Quarterly Filing of Portfolio Holdings
The Funds will file their complete schedule of investments with the SEC for the first and third quarters of each fiscal year on Form N-Q. The Funds’ Form N-Q will be available (i) on the SEC’s website at www.sec.gov; (ii) at the SEC’s Public Reference Room; and (iii) by calling 800-SEC-0330.
Cost Basis Information
Federal law requires mutual fund companies to maintain a shareholder’s cost basis by tax lot and report gain/loss information and holding periods for sales of mutual fund shares that are “covered” securities to the IRS and to shareholders on Form 1099. Mutual fund shares, such as shares of the Funds, acquired on or after January 1, 2012 are covered securities. The Funds are not responsible for maintaining and reporting share information for their shares that are not deemed “covered.”
The tax regulations require that the Funds elect a default tax identification methodology in order to perform the required reporting. The Funds have chosen the first-in-first-out (“FIFO”) method as the default tax lot identification method for its shareholders. This is the method the Funds will use to determine which specific shares are deemed to be sold when a shareholder’s entire position is not sold in a single transaction and is the method in which “covered” share sales will be reported on a shareholder’s Form 1099.
However, at the time of purchase or upon the sale of “covered” shares, shareholders may generally choose a different tax lot identification method. Shareholders should consult a tax advisor with regard to their personal circumstances as the Funds and their service providers do not provide tax advice.
60