UNITED STATES
SECURITIES AND EXCHANGE COMMISSION
Washington, D.C. 20549
FORM N-CSR
CERTIFIED SHAREHOLDER REPORT OF REGISTERED
MANAGEMENT INVESTMENT COMPANIES
Investment Company Act File Number: 811-08397
THE MARSICO INVESTMENT FUND
(Exact Name of Registrant as Specified in Charter)
1200 17th Street, Suite 1700
Denver, CO 80202
(Address of Principal Executive Offices) (Zip Code)
The Corporation Trust Company
The Marsico Investment Fund
Corporation Trust Center 1209 Orange Street
Wilmington, Delaware 19802
(Name and address of Agent for Service of Process)
Copies to:
Anthony H. Zacharski
Dechert LLP
90 State House Square
Hartford, CT 06103
Registrant's Telephone Number, including Area Code: 1-888-860-8686
Date of fiscal year end: September 30
Date of Reporting Period: March 31, 2019
| Item 1. | Reports to Stockholders |
DEAR SHAREHOLDER:
Enclosed is your semi-annual report for each portfolio of The Marsico Investment Fund (the “Marsico Funds”), encompassing the six-month fiscal period from October 1, 2018 to March 31, 2019.
The purpose of this report is to provide a review of the Marsico Funds’ six-month investment results by discussing what we believe were the main areas that impacted performance – including the macroeconomic environment, sector and industry positioning, and individual stock selection – as compared to the Funds’ performance benchmark indices.
For updated information regarding the market environment and each Fund’s overall investment positioning and performance, please refer to the Funds’ most recent monthly fact sheets and quarterly investment updates, which are available in the Investor Resources section of the Funds’ website at marsicofunds.com.(1)
Note: Effective February 28, 2019, Brandon A. Geisler became co-manager of the Marsico Focus Fund and Marsico Growth Fund with Thomas F. Marsico.
(1) | The references to the Marsico Funds website (marsicofunds.com) included throughout this semi-annual report do not incorporate the website’s contents into this report. |
| | KEY FUND STATISTICS | 2 | |
| | MARKET ENVIRONMENT | 5 | |
| | | | |
| | MARSICO FOCUS FUND |
| | Investment Review | 7 | |
| | Fund Overview | 10 | |
| | Schedule of Investments | 11 | |
| | | | |
| | MARSICO GROWTH FUND |
| | Investment Review | 12 | |
| | Fund Overview | 15 | |
| | Schedule of Investments | 16 | |
| | | | |
| | MARSICO 21st CENTURY FUND |
| | Investment Review | 17 | |
| | Fund Overview | 19 | |
| | Schedule of Investments | 20 | |
| | | | |
| | MARSICO INTERNATIONAL OPPORTUNITIES FUND |
| | Investment Review | 22 | |
| | Fund Overview | 25 | |
| | Schedule of Investments | 26 | |
| | | | |
| | MARSICO GLOBAL FUND |
| | Investment Review | 28 | |
| | Fund Overview | 30 | |
| | Schedule of Investments | 31 | |
| | | | |
| | FINANCIAL STATEMENTS | 32 | |
| | NOTES TO FINANCIAL STATEMENTS | 42 | |
| | EXPENSE EXAMPLE | 50 | |
| | CONSIDERATION OF INVESTMENT ADVISORY AGREEMENTS | 52 | |
| | OTHER INFORMATION | 55 | |
1
| KEY FUND STATISTICS (UNAUDITED) |
Marsico Focus Fund | Marsico Growth Fund | Marsico 21st Century
Fund |
| | MFOCX | | | MGRIX | | | MXXIX | |
For additional disclosures, please see page 10. | For additional disclosures, please see page 15. | For additional disclosures, please see page 19. |
PERFORMANCE COMPARISON(1) | PERFORMANCE COMPARISON(1) | PERFORMANCE COMPARISON(1) |
Average Annualized Returns | Average Annualized Returns | Average Annualized Returns |
 |  |  |
TOTAL ANNUAL OPERATING EXPENSES* 1.14% | TOTAL ANNUAL OPERATING EXPENSES* 1.44% | TOTAL ANNUAL OPERATING EXPENSES* 1.42% |
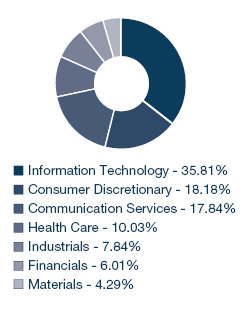
SECTOR ALLOCATION(2) | SECTOR ALLOCATION(2) | SECTOR ALLOCATION(2) |
| 
| 
|
TOP FIVE HOLDINGS | TOP FIVE HOLDINGS | TOP FIVE HOLDINGS |
| | | |
| | Visa, Inc. - Cl. A | 7.19% | | | Alphabet, Inc. - Cl. A | 6.10% | | | Worldpay, Inc. - Cl. A | 3.73% | |
| | PayPal Holdings, Inc. | 6.74% | | | Amazon.com, Inc. | 5.49% | | | CoStar Group, Inc. | 3.04% | |
| | Alphabet, Inc. - Cl. A | 6.37% | | | Visa, Inc. - Cl. A | 5.47% | | | Burlington Stores, Inc. | 2.88% | |
| | Amazon.com, Inc. | 6.14% | | | Facebook, Inc. - Cl. A | 4.72% | | | Mastercard, Inc. - Cl. A | 2.72% | |
| | Alibaba Group Holding Ltd. Spon. ADR | 5.74% | | | Alibaba Group Holding Ltd. Spon. ADR | 4.68% | | | Teleflex, Inc. | 2.71% | |
| | | | | | |
For additional disclosures about the Marsico Funds, please see page 4. The performance data quoted here represent past performance, and past performance is not a guarantee of future results. Investment return and principal value of an investment will fluctuate so that an investor’s shares, when redeemed, may be worth more or less than their original cost.
2
| KEY FUND STATISTICS (UNAUDITED) |
Marsico International
Opportunities Fund | Marsico Global Fund |
| | MIOFX | | | MGLBX | |
For additional disclosures, please see page 25. | For additional disclosures, please see page 30. |
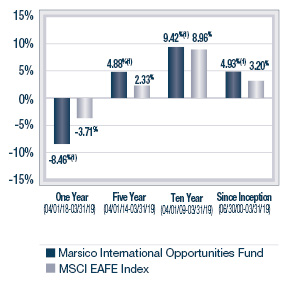
PERFORMANCE COMPARISON(1) | PERFORMANCE COMPARISON(1) |
Average Annualized Returns | Average Annualized Returns |
 | 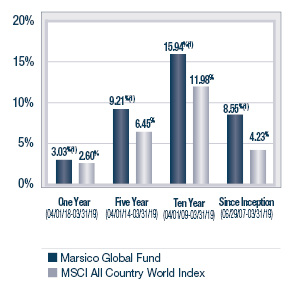 |
TOTAL ANNUAL OPERATING EXPENSES* 1.65% NET EXPENSES*† 1.50% | TOTAL ANNUAL OPERATING EXPENSES* 1.65% NET EXPENSES*† 1.45% |
SECTOR ALLOCATION(2) | SECTOR ALLOCATION(2) |
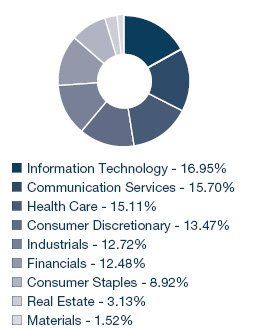
| 
|
TOP FIVE HOLDINGS | TOP FIVE HOLDINGS |
| | | | | | | | |
| | Alibaba Group Holding Ltd. Spon. ADR | 4.57% | | | Amazon.com, Inc. | 5.39% | |
| | Koninklijke Philips N.V. | 3.95% | | | Alibaba Group Holding Ltd. Spon. ADR | 5.19% | |
| | Tencent Holdings Ltd. | 3.95% | | | Airbus SE | 5.03% | |
| | InterXion Holding N.V. | 3.44% | | | Alphabet, Inc. - Cl. A | 4.65% | |
| | ASML Holding N.V. | 3.42% | | | Apple, Inc. | 4.38% | |
| | | | | | | | |
Current performance may be lower or higher than the performance information quoted. To obtain performance information current to the most recent month-end, please call888-860-8686 or visitmarsicofunds.com.
3
| KEY FUND STATISTICS (UNAUDITED) |
ADDITIONAL DISCLOSURES ABOUT THE MARSICO FUNDS
* | The Total Annual Operating Expenses and Net Expenses are reflective of the information disclosed in the Funds’ Prospectus dated February 1, 2019, as supplemented. The information may differ from the expense ratios disclosed in this report. |
† | Marsico Capital Management, LLC (the “Adviser”) has entered into a written expense limitation and fee waiver agreement under which it has agreed to limit the total expenses of each Fund (excluding taxes, interest, acquired fund fees and expenses, litigation, extraordinary expenses, brokerage and other transaction expenses relating to the purchase or sale of portfolio investments) to an annual rate of 1.50% of the average net assets of the International Opportunities Fund and 1.45% of the average net assets of the Global Fund until January 31, 2020. This expense limitation and fee waiver agreement may be terminated by the Adviser at any time after January 31, 2020, upon 15 days prior notice to the Fund and its administrator. The Adviser may recoup from a Fund fees previously waived or expenses previously reimbursed by the Adviser with respect to that Fund pursuant to this agreement (or a previous expense limitation agreement) if: (1) such recoupment by the Adviser does not cause the Fund, at the time of recoupment, to exceed the lesser of (a) the expense limitation in effect at the time the relevant amount was waived and/or reimbursed, or (b) the expense limitation in effect at the time of the proposed recoupment, and (2) the recoupment is made within three years after the fiscal year end date as of which the amount to be waived or reimbursed was determined and the waiver or reimbursement occurred. |
(1) | The performance data quoted here represent past performance, and past performance is not a guarantee of future results. Investment return and principal value of an investment will fluctuate so that an investor’s shares, when redeemed, may be worth more or less than their original cost. Current performance may be lower or higher than the performance information quoted. To obtain performance information current to the most recent month-end, please call 888-860-8686 or visit marsicofunds.com. |
| The performance included in the chart does not reflect the deduction of taxes on Fund distributions or the redemption of Fund shares. |
| All indices are unmanaged and investors cannot invest directly in an index. |
Periodically, certain fees and expenses have been waived or reimbursed by the Adviser for the21st Century Fund, the International Opportunities Fund, and the Global Fund. In the absence of such a waiver or reimbursement, the performance returns reflected would have been reduced. In accordance with the expense limitation and fee waiver agreement, the Adviser may recoup fees and expenses previously waived or reimbursed under certain parameters. Periodically, the Adviser has recouped such fees or expenses from the21st Century Fund, the International Opportunities Fund, and the Global Fund, resulting in a lower performance return.
(2) | Sector weightings represent the percentage of the respective Fund’s investments (excluding cash equivalents) in certain general sectors. These sectors may include more than one industry. The Fund’s portfolio composition is subject to change at any time. |
4
MARKET ENVIRONMENT: OCTOBER 2018 – MARCH 2019 (UNAUDITED)
It was a tale of two quarters for global markets during the six-month fiscal period ended March 31, 2019.
The fourth quarter of 2018 was turbulent, and ushered in a major reset for stock prices and other asset classes around the globe. The continued drumbeat surrounding US/China bi-lateral trade tariffs, along with the impact of steady Federal Reserve rate increases on industries like housing and automobiles, raised anxiety over a potential monetary policy error by the Federal Reserve. Concerns that broader economic growth could slow also weighed on the markets. The fourth quarter was particularly difficult for growth stocks, which had led the broader market higher for much of the year, and thus were the first to be sold as investors became nervous.
Oil prices dropped sharply during the fourth quarter of 2018, with cash prices for West Texas Intermediate crude oil falling by nearly $28 per barrel, a 38% decline. Falling commodity prices catalyzed a powerful rally in global government bond markets. The yield on the US 10-year Treasury note fell by 37 basis points (i.e., 37 hundredths of a percentage point) (-0.37%) to 2.68% at the end of 2018, erasing the lion’s share of the sharp rise in yield earlier in 2018.
By the end of 2018, widespread fears of faltering economic performance radically changed expectations for US Federal Reserve policy. At the outset of the fourth quarter of 2018, futures markets had anticipated that the Federal Reserve would make three moves to tighten interest rates in 2019. However, by year end, futures markets had stripped away expectations of any additional Federal Reserve tightening, and priced in some chance for easing of interest rates in 2019.
In the first quarter of 2019, after the difficult fourth quarter of 2018, markets underwent a strong reversal of sentiment on the back of two major developments. First, and perhaps most importantly, the Federal Reserve changed course by early 2019, and stated that it anticipated only one Federal Funds interest rate increase through 2021, in stark contrast to the six interest rate hikes anticipated by US Federal Reserve Chairman Powell in October of 2018 during his now infamous “far from neutral” speech. Second, there were early indications that China’s aggressive stimulus efforts were working and could contribute to a stabilization of economic conditions. When combined with improved prospects for a comprehensive US/China trade deal, the markets appeared to anticipate an overall improvement in the Chinese economic landscape.
US stock markets rebounded strongly during the first quarter of 2019, as some stocks rose nearly as fast as they had declined in the previous quarter. The prices of oil and other commodities also rallied, with cash prices for West Texas Intermediate crude oil rising by $15 per barrel after oil’s sharp decline in the previous quarter.
Despite rising stock markets and commodity prices, bond prices continued to rise as the yield on the US 10-year Treasury note fell further during the first quarter, dropping an additional 28 basis points to 2.40% — lower than yields available on some short-term debt. The falling long-term yields helped to create an inverted yield curve, which motivated yield-seeking investors to seek higher returns elsewhere. On the economic growth scoreboard, it was announced that the revised Gross Domestic Product growth rate for the fourth quarter of 2018 was 2.2% on an annualized basis, on track with the 2.2% consensus estimates of economists. This number brought the full-year 2018 figure to 2.9%, just shy of President Trump’s 3% goal.
Outside the US, international equity markets also recovered strongly during the first quarter following last year’s sharp drop in global markets. The revival in positive investor sentiment occurred despite a moderation in global economic growth, as reflected in European Central Bank president Mario Draghi’s comments in early March that Europe was in “a period of continued weakness and pervasive uncertainty” as he pushed out a planned interest rate hike. In addition, various Brexit plans proposed by the British Prime Minister were repeatedly voted down in Parliament, causing further uncertainty as to the future of the U.K. and its place in the European Union.
Moving to China, in spite of a reported 20% drop in Beijing exports, sharp rallies in Chinese stocks suggest that investors’ fears of a sharp slowdown and a worsening trade conflict have all lessened. In a show of good faith, President Trump extended a March 1 deadline for an increased round of tariffs, and pushed back his planned meeting with President Xi until late April. Secretary Mnuchin and Ambassador Lighthizer reportedly made good progress in a round of meetings in Beijing in late March and early April, although the process of reaching a deal appears to be taking longer than anticipated.
5
The performance of global markets during the six-month fiscal period ended March 31, 2019 is depicted below. After all of the volatility, the sharp decline in late 2018 was neutralized only in part by the early 2019 rally. US markets posted negative or slightly positive returns for the overall period. Large capitalization US equities outperformed small capitalization stocks, yet both segments lagged medium-capitalization stocks during the period. Emerging market equities were strong as compared to developed international markets, which posted negative returns.
Index Name(1) | Universe of
Equities Represented | Six-Month
Total Return (as of
March 31, 2019) |
US | | |
S&P 500 | US large-capitalization equities | -1.72% |
Russell 3000 | US publicly-traded equities of all sizes | -2.27% |
Russell 2000 | US small-capitalization equities | -8.56% |
Russell Mid-Cap Growth | US medium-capitalization equities | +0.49% |
Index Name(1) | Universe of
Equities Represented | Six-Month
Total Return (as of
March 31, 2019) |
INTERNATIONAL | |
MSCI EAFE (US$) | Equities in developed international equity markets, including Japan, Western Europe, and Australasia | -3.81% |
MSCI Emerging Markets (US$) | Equities in developing international equity markets, including China, India, Eastern Europe, and Latin America | +1.71% |
MSCI ACWI (US$) | Equities in the global developed and emerging markets | -2.13% |
Sincerely,
THE MARSICO INVESTMENT TEAM
(1) | All indices are unmanaged and investors cannot invest directly in an index. |
6
INVESTMENT REVIEW BY TOM MARSICO AND BRANDON GEISLER (UNAUDITED)
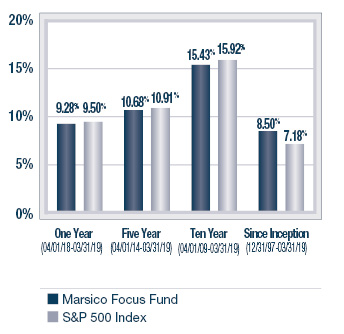
The Marsico Focus Fund posted a total return of -1.45% for the six-month fiscal period ended March 31, 2019. The Fund slightly outperformed its benchmark index, the S&P 500 Index, which had a total return of -1.72% over the same time period. Please see the Fund’s Overview for more detailed information about the Fund’s longer-term performance for various time periods ended March 31, 2019.
The performance data for the Fund quoted here represent past performance, and past performance is not a guarantee of future results. Investment return and principal value of an investment will fluctuate so that an investor’s shares, when redeemed, may be worth more or less than their original cost. Current performance may be lower or higher than the performance information quoted. To obtain performance information current to the most recent month-end, please call 888-860-8686 or visit marsicofunds.com.(1)
This review highlights Fund performance over a six-month fiscal period. Shareholders should keep in mind that the Fund is intended for long-term investors who hold their shares for substantially longer periods of time. You should also keep in mind that our current views and beliefs regarding all investments discussed in this report are subject to change at any time. References to specific securities, industries, and sectors discussed in this report are not recommendations to buy or sell such securities or related investments, and the Fund may not necessarily hold these securities or investments today. Please see the accompanying Schedule of Investments for the percentage of the Fund’s portfolio represented by the securities mentioned in this report as of the end of the reporting period.
The Focus Fund is non-diversified and may hold fewer securities than a diversified fund because it is permitted to invest a greater percentage of its assets in a smaller number of securities. Holding fewer securities increases the risk that the value of the Fund could go down because of the poor performance of a single investment or may be more volatile than its benchmark. The Fund is subject to broad risks associated with investing in equity securities markets generally, including the risks that the securities and markets in which it invests may experience volatility and instability, that domestic and global economies and markets may undergo periods of cyclical change and decline, that investors may at times avoid investments in equity securities, and that investments may not perform as anticipated. Please see the Prospectus for more information.
The Fund is not managed to track its benchmark index, and may hold a substantially overweight or underweight position in a sector, industry, or security compared to its weight in the benchmark. The Fund may be subject to risks associated with a particular sector or other area in which it is overweight, including the risk that the stocks of companies within one area could simultaneously decline in price because of an event that affects the entire area. For informational purposes, the discussion below may compare the benchmark weight or performance of a sector or industry to the investment approach of the Fund.
The Focus Fund’s outperformance during the six-month period ended March 31, 2019, as compared to the S&P 500 Index, was primarily attributable to certain Fund holdings in the Consumer Discretionary, Information Technology and Health Care sectors, as defined in the Global Industry Classification Standard (“GICS”)(2).
In the Information Technology sector, e-commerce payment facilitator PayPal Holdings, Inc. (+18%) performed very strongly during the reporting period. The company continues to benefit from the continued rise of mobile commerce, and the behavioral trend away from cash toward electronic payments. PayPal is one of the most dominant online checkout tools, with approximately 200 million users, including users of its dominant peer-to-peer cash transfer app Venmo, which is growing at a rate of 80% per year and remains largely unmonetized.
Consumer Discretionary holding Alibaba Group Holding Ltd. Spon. ADR returned +10% during the period, handily outperforming both its GICS sector and the benchmark S&P 500 Index return. We have been long-term shareholders in the company, and continue to believe it has one of the best operating models in the world. The company’s goal is to remove friction from the flow of commerce globally, which it strives to do by providing virtually every type of electronic infrastructure that businesses need to compete, including online marketplaces, technology infrastructure, best-in-class mobile payments systems, content marketing, and logistics/distribution. Alibaba has over 600 million active users, yet it remains one of the most under-monetized platform-businesses. Despite having double the user base of Amazon, the company has only approximately 20% of Amazon’s revenues. We believe the company will close that gap, and could grow its revenues above 30% per year for the next several years.
7
Certain new positions that entered the portfolio during the six-month period in the Consumer Discretionary and Communication Services sectors are discussed below:
| | ● | We initiated a position in Marriott International, Inc. – Cl. A (+0%). Marriott is one of the largest hotel chains in the world, having acquired the Starwood Hotels and Resorts portfolio in 2016. With the integration fully completed, including the combination of the companies’ rewards programs most recently, we expect Marriott to begin to reap the benefits of being a larger, more global organization. Marriott gives the portfolio more exposure to the broad cyclical economy, adding balance to secular growth companies. In the event the economy picks up, we expect Marriott to outperform meaningfully. |
| | ● | The Walt Disney Company (-3%) was purchased in the period as the company is in the midst of a massive transition to a media-driven direct-to-consumer business model by taking majority ownership of 21st Century Fox and Hulu, and introducing its new Disney+ streaming service in the fall of 2019. We have witnessed other large iconic brands make analogous shifts to direct-to-consumer models, such as, most notably, Nike, and while the transition can be difficult, we believe it will create incremental shareholder value as the market ascribes a higher value to direct revenue and profits over time. The average upward revision of the stocks of Nike, Microsoft and Walmart during their respective transitions to direct-to-consumer models was +45%. |
| | ● | McDonald’s Corporation (+8%) was purchased in the period as the company’s numerous sales drivers and defensive business model appear likely to provide durable earnings growth in an increasingly choppy environment. The company is pursuing an aggressive reimaging program in the United States to prop up sales in the region, similar to the successful program it implemented in international markets over the last several years. |
Given recent political rhetoric surrounding health care policy, we reduced our overall Health Care sector exposure significantly during the period in anticipation of market uncertainty over talk surrounding “Medicare for All” and a single payer health care system. The ability to enact these type of programs remains challenging for legislators given the nature of election cycles, and we have seen prior periods during which the sector has underperformed and multiples have been pressured relating to such cycles. Investors prefer clarity in the Health Care space and the fear of government legislation and uncertainty surrounding election cycles can act as serious headwinds causing stocks in the sector to pause. This adjustment to positioning was accomplished by exiting positions in Biogen Inc. (-9% prior to being sold) and Anthem, Inc. (+7% prior to being sold) and reducing exposure to UnitedHealth Group, Inc.
Although we typically reserve comments in shareholder reports for notable performers and position changes, given the recent headlines surrounding The Boeing Company, we thought it prudent to provide you an update on this stock held by the Focus Fund. In spite of challenging issues and headlines, Boeing returned +4% in the period. While we are of course very saddened by the recent accident involving a Boeing 737 Max airplane in Africa, there is speculation that the causes may be relatively clear, and may be linked to the automatic flight control software and/or related training issues that may also have caused the prior Lion Air crash. If this is determined to be the case, it is our view that the problem could be fixable relatively quickly. We understand that Boeing and the Federal Aviation Administration (“FAA”) have been working on a software solution and a training update that may be implemented as soon as the end of April. As of the date of this report, it is our opinion that the recent production rate decrease (from building fifty-two 737 Max airplanes per month to building forty-two) is likely to be temporary, and that production should return to the previous rate relatively soon after the FAA grounding of 737 Max aircraft is lifted. Additionally, we view a recent pause in the delivery of 737 Max aircraft as a temporary timing issue that will be remedied with elevated deliveries in future periods. Historically, temporary production and delivery delays of this type do not pose a long-term risk to the company.
From a sector allocation perspective, the Fund’s performance was boosted relative to the benchmark index by having no exposure to the Energy sector and an underweight stance in the Financials sector, both of which were weak performing sectors. It also was aided by an overweight stance in the Information Technology sector.
The Fund’s performance compared to its benchmark index was held back by certain stocks held in the Communication Services sector. In particular, Activision Blizzard, Inc. (-23%, prior to being sold), and Tencent Holdings Ltd. (-18%, prior to being sold), didn’t perform as we anticipated. Activision was sold due to increased competition and a slowdown in sales of its key video games. The rise of Fortnite, an extremely popular free-to-play multiplayer game, has led to a shift away from traditional titles for a large portion of consumers involved in gaming. Likewise, Tencent was sold out of the portfolio as a result of increased government regulation that has clouded the company’s ability to drive sustainable growth. Video games account for 40% of Tencent’s revenue base, and China, the world’s largest gaming market, until recently had not approved any video game licenses after the second quarter of 2018.
8
From a sector allocation perspective, the Fund was held back relative to its benchmark index by having limited or no exposure to the strong-performing Utilities, Real Estate and Consumer Staples sectors. As volatility increased during the period and bond yields dropped, investors sought the defensive characteristics and yield of stocks in these sectors.
During the reporting period, the Fund reduced its exposure to the Health Care and Financials sectors, and increased its allocations to the Consumer Discretionary and Information Technology sectors. The Fund had limited exposure to the Consumer Staples sector intra-period but liquidated its position held within the sector prior to period end. There were no significant changes to the Fund’s allocations to the Industrials, Materials, and Communication Services sectors. Please note that GICS sectors were reconstituted on October 1, 2018, and that the beginning sector values for the Fund have been recalculated in accordance with the reconstitution for purposes of the foregoing paragraph.(3)
Fiscal Period-End Investment Posture
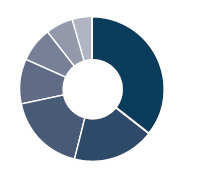
As of March 31, 2019, the Fund’s largest sector allocations included Information Technology, Consumer Discretionary, Communication Services, and Health Care. As of that date, the Fund had no exposure to the Consumer Staples, Energy, Real Estate or Utilities sectors.
Other Developments
Effective February 28, 2019, Brandon A. Geisler became co-manager of the Focus Fund with Thomas F. Marsico.
Sincerely,
THOMAS F. MARSICO
BRANDON A. GEISLER
PORTFOLIO MANAGERS
(1) | Total returns are based on net change in net asset value assuming reinvestment of distributions. Please see the Prospectus for more information. |
(2) | Regarding GICS data cited throughout this report, the Global Industry Classification Standard was developed by and is the exclusive property and service mark of MSCI Inc. (“MSCI”) and Standard & Poor’s (“S&P”) and is licensed for use by Marsico Capital Management, LLC (the “Adviser”). Neither MSCI, S&P, nor the Adviser or any third party involved in compiling GICS makes any express or implied warranties or representations with respect to such standard or classification (or the results from use thereof), and all such parties hereby expressly disclaim all warranties of originality, accuracy, completeness, merchantability and fitness for a particular purpose with respect to any such standard or classification. MSCI, S&P, the Adviser, and any of their affiliates or third parties involved in compiling GICS shall not have any liability for any direct, indirect, special, punitive, consequential or any other damages (including lost profits) even if notified of the possibility of such damages. |
(3) | Through September 30, 2018, the Funds reported certain investments as having been classified within the Information Technology, Consumer Discretionary or Telecommunication Services sectors. Effective October 1, 2018, GICS reconstituted those sectors by reclassifying certain stocks formerly included in them into other sectors based on their business characteristics. For example, investments in telecommunication services companies (previously included in the Telecommunication Services sector) as well as certain companies that offer content through various media platforms (previously included in the Information Technology or Consumer Discretionary sectors) are now reported in the broadened GICS Communication Services sector. Additionally, certain e-commerce companies (previously included in the Information Technology sector) are now reported In the Consumer Discretionary sector. References to investment sector exposure included throughout this semi-annual report reflect the impact of these changes. |
9
March 31, 2019 (Unaudited)
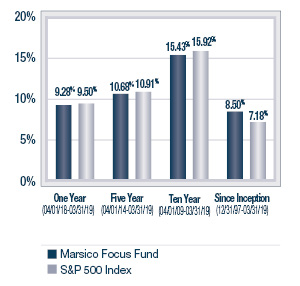
The Focus Fund is a non-diversified portfolio and invests primarily in the common stocks of large companies that are selected for their long-term growth potential. The Fund will normally hold a core position of between 20 and 35 common stocks.
TOTAL ANNUAL OPERATING EXPENSES**1.14% | NET ASSETS$564,291,908 | NET ASSET VALUE PER SHARE$17.87 |
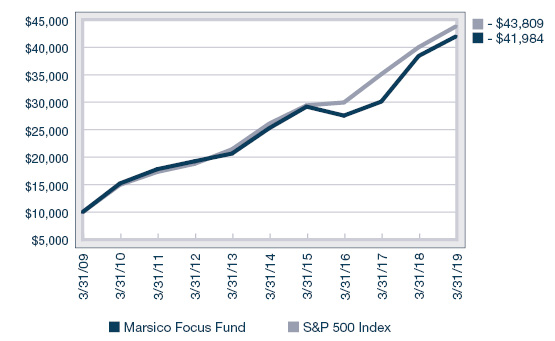
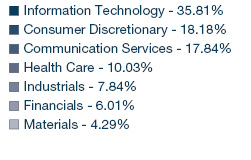
GROWTH OF $10,000(1) | PERFORMANCE COMPARISON |
| | Average Annualized Returns |
| 
|
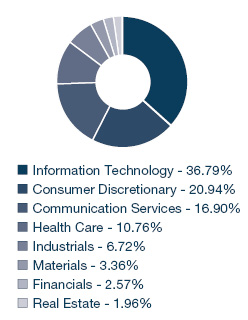
SECTOR ALLOCATION(2) | TOP FIVE HOLDINGS |
| | | | |
| | Visa, Inc. - Cl. A | 7.19% | |
| | PayPal Holdings, Inc. | 6.74% | |
| | Alphabet, Inc. - Cl. A | 6.37% | |
| | Amazon.com, Inc. | 6.14% | |
| | Alibaba Group Holding Ltd. Spon. ADR | 5.74% | |
| | | | |
* | The Total Annual Operating Expenses are reflective of the information disclosed in the Funds’ Prospectus dated February 1, 2019, as supplemented, and may differ from the expense ratio disclosed in this report. |
| The performance data quoted here represent past performance, and past performance is not a guarantee of future results. Investment return and principal value of an investment will fluctuate so that an investor’s shares, when redeemed, may be worth more or less than their original cost. Current performance may be lower or higher than the performance information quoted. To obtain performance information current to the most recent month-end, please call 888-860-8686 or visit marsicofunds.com. |
| The performance included in the chart and graph does not reflect the deduction of taxes on Fund distributions or the redemption of Fund shares. |
| All indices are unmanaged and investors cannot invest directly in an index. |
(1) | This chart assumes an initial investment of $10,000 made on March 31, 2009. Total returns are based on net change in NAV, assuming reinvestment of distributions. |
(2) | Sector weightings represent the percentage of the Fund’s investments (excluding cash equivalents) in certain general sectors. These sectors may include more than one industry. The Fund’s portfolio composition is subject to change at any time. |
10
MARSICO FOCUS FUND
SCHEDULE OF INVESTMENTS
March 31, 2019 (Unaudited)
| | | Number
of
Shares | | | Value | | | Percent
of Net
Assets | |
COMMON STOCKS | | | | | | | | | | | | |
Aerospace & Defense | | | | | | | | | | | | |
Lockheed Martin Corporation | | | 59,296 | | | $ | 17,798,287 | | | | 3.15% | |
The Boeing Company | | | 67,900 | | | | 25,898,418 | | | | 4.59 | |
| | | | | | | | 43,696,705 | | | | 7.74 | |
Application Software | | | | | | | | | | | | |
Adobe, Inc.* | | | 69,814 | | | | 18,604,733 | | | | 3.30 | |
salesforce.com, inc.* | | | 202,149 | | | | 32,014,337 | | | | 5.67 | |
| | | | | | | | 50,619,070 | | | | 8.97 | |
Data Processing & Outsourced Services | | | | |
PayPal Holdings, Inc.* | | | 366,048 | | | | 38,010,424 | | | | 6.74 | |
Visa, Inc. - Cl. A | | | 259,898 | | | | 40,593,469 | | | | 7.19 | |
| | | | | | | | 78,603,893 | | | | 13.93 | |
Financial Exchanges & Data | | | | | | | | |
Intercontinental Exchange, Inc. | | | 126,875 | | | | 9,660,263 | | | | 1.71 | |
S&P Global, Inc. | | | 113,099 | | | | 23,812,994 | | | | 4.22 | |
| | | | | | | | 33,473,257 | | | | 5.93 | |
Health Care Equipment | | | | | | | | | | | | |
Intuitive Surgical, Inc.* | | | 43,497 | | | | 24,818,518 | | | | 4.40 | |
| | | | | | | | | | | | | |
Hotels, Resorts & Cruise Lines | | | | | | | | |
Marriott International, Inc. - Cl. A | | | 134,108 | | | | 16,775,570 | | | | 2.97 | |
| | | | | | | | | | | | | |
Interactive Media & Services | | | | | | | | |
Alphabet, Inc. - Cl. A* | | | 30,556 | | | | 35,961,051 | | | | 6.37 | |
Facebook, Inc. - Cl. A* | | | 178,944 | | | | 29,828,175 | | | | 5.29 | |
| | | | | | | | 65,789,226 | | | | 11.66 | |
Internet & Direct Marketing Retail | | | | | | | | |
Alibaba Group Holding Ltd. Spon. ADR* | | | 177,639 | | | | 32,410,235 | | | | 5.74 | |
Amazon.com, Inc.* | | | 19,436 | | | | 34,610,657 | | | | 6.14 | |
| | | | | | | | 67,020,892 | | | | 11.88 | |
Managed Health Care | | | | | | | | | | | | |
UnitedHealth Group, Inc. | | | 69,582 | | | | 17,204,845 | | | | 3.05 | |
| | | | | | | | | | | | | |
Movies & Entertainment | | | | | | | | | | | | |
Netflix, Inc.* | | | 37,755 | | | | 13,461,923 | | | | 2.38 | |
The Walt Disney Company | | | 181,463 | | | | 20,147,837 | | | | 3.57 | |
| | | | | | | | 33,609,760 | | | | 5.95 | |
Pharmaceuticals | | | | | | | | | | | | |
Eli Lilly & Company | | | 106,922 | | | | 13,874,199 | | | | 2.46 | |
| | | | | | | | | | | | | |
Restaurants | | | | | | | | | | | | |
McDonald's Corporation | | | 92,001 | | | | 17,470,990 | | | | 3.10 | |
| | | | | | | | | | | | | |
Semiconductors | | | | | | | | | | | | |
NVIDIA Corporation | | | 96,794 | | | | 17,380,331 | | | | 3.08 | |
| | | | | | | | | | | | | |
Specialty Chemicals | | | | | | | | | | | | |
The Sherwin-Williams Company | | | 55,469 | | | | 23,891,053 | | | | 4.23 | |
| | | | | | | | | | | | | |
Systems Software | | | | | | | | | | | | |
Microsoft Corporation | | | 200,651 | | | | 23,664,779 | | | | 4.19 | |
| | | | | | | | | | | | | |
Technology Hardware, Storage & Peripherals | | | | |
Apple, Inc. | | | 154,140 | | | | 29,278,893 | | | | 5.19% | |
| | | | | | | | | | | | | |
TOTAL COMMON STOCKS | | | | | | | | | | | | |
(Cost $361,300,209) | | | | | | | 557,171,981 | | | | 98.73 | |
| | | | | | | | | | | | | |
SHORT-TERM INVESTMENTS | | | | | | | | |
State Street Institutional U.S. Government Money Market Fund, 0.020% | | | 10,524,874 | | | | 10,524,874 | | | | 1.87 | |
| | | | | | | | | | | | | |
TOTAL SHORT-TERM INVESTMENTS | | | | | | | | |
(Cost $10,524,874) | | | | | | | 10,524,874 | | | | 1.87 | |
| | | | | | | | | | | | | |
TOTAL INVESTMENTS | | | | | | | | | | | | |
(Cost $371,825,083) | | | | | | | 567,696,855 | | | | 100.60 | |
| | | | | | | | | | | | | |
Liabilities, Less Cash and Other Assets | | | | | | | (3,404,947 | ) | | | (0.60) | |
| | | | | | | | | | | | | |
NET ASSETS | | | | | | $ | 564,291,908 | | | | 100.00% | |
| See notes to financial statements. |
11
INVESTMENT REVIEW BY TOM MARSICO AND BRANDON GEISLER (UNAUDITED)
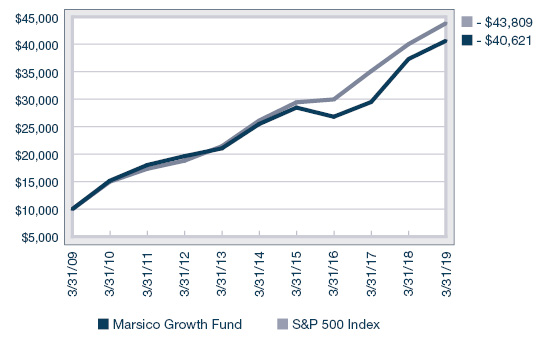
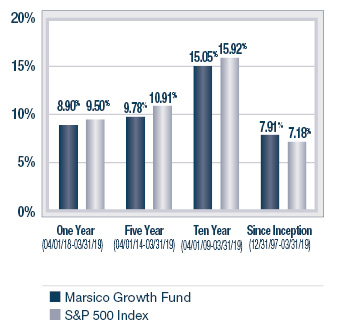
The Marsico Growth Fund posted a total return of -1.63% for the six-month fiscal period ended March 31, 2019. The Fund slightly outperformed the S&P 500 Index, the Fund’s benchmark index, which had a total return of -1.72% over the same time period. Please see the Fund’s Overview for more detailed information about the Fund’s longer-term performance for various time periods ended March 31, 2019.
The performance data for the Fund quoted here represent past performance, and past performance is not a guarantee of future results. Investment return and principal value of an investment will fluctuate so that an investor’s shares, when redeemed, may be worth more or less than their original cost. Current performance may be lower or higher than the performance information quoted. To obtain performance information current to the most recent month-end, please call 888-860-8686 or visit marsicofunds.com.(1)
This review highlights Fund performance over a six-month fiscal period. Shareholders should keep in mind that the Fund is intended for long-term investors who hold their shares for substantially longer periods of time. You should also keep in mind that our current views and beliefs regarding all investments discussed in this report are subject to change at any time. References to specific securities, industries, and sectors discussed in this report are not recommendations to buy or sell such securities or related investments, and the Fund may not necessarily hold these securities or investments today. Please see the accompanying Schedule of Investments for the percentage of the Fund’s portfolio represented by the securities mentioned in this report as of the end of the reporting period.
The Fund is subject to broad risks associated with investing in equity securities markets generally, including the risks that the securities and markets in which it invests may experience volatility and instability, that domestic and global economies and markets may undergo periods of cyclical change and decline, that investors may at times avoid investments in equity securities, and that investments may not perform as anticipated. Please see the Prospectus for more information.
The Fund is not managed to track its benchmark index, and may hold a substantially overweight or underweight position in a sector, industry, or security compared to its weight in the benchmark. The Fund may be subject to risks associated with a particular sector or other area in which it is overweight, including the risk that the stocks of companies within one area could simultaneously decline in price because of an event that affects the entire area. For informational purposes, the discussion below may compare the benchmark weight or performance of a sector or industry to the investment approach of the Fund.
The Growth Fund’s outperformance during the six-month period ended March 31, 2019, as compared to the S&P 500 Index, was primarily attributable to certain Fund holdings in the Consumer Discretionary and the Information Technology sectors as defined in the Global Industry Classification Standard (“GICS”).
In the Information Technology sector, e-commerce payment facilitator PayPal Holdings, Inc. (+18%) performed very strongly during the reporting period. The company continues to benefit from the continued rise of mobile commerce, and the behavioral trend away from cash toward electronic payments. PayPal is one of the most dominant online checkout tools, with approximately 200 million users, including users of its dominant peer-to-peer cash transfer app Venmo, which is growing at a rate of 80% per year and remains largely unmonetized.
Consumer Discretionary holding Alibaba Group Holding Ltd. Spon. ADR returned +10% during the period, handily outperforming both its GICS sector and the benchmark S&P 500 Index return. We have been long-term shareholders in the company, and continue to believe it has one of the best operating models in the world. The company’s goal is to remove friction from the flow of commerce globally, which it strives to do by providing virtually every type of electronic infrastructure that businesses need to compete, including online marketplaces, technology infrastructure, best-in-class mobile payments systems, content marketing, and logistics/distribution. Alibaba has over 600 million active users, yet it remains one of the most under-monetized platform-businesses. Despite having double the user base of Amazon, the company has only approximately 20% of Amazon’s revenues. We believe the company will close that gap, and could grow its revenues above 30% per year for the next several years.
Certain new positions that entered the portfolio during the six-month period, in the Consumer Discretionary and Health Care sectors, are discussed below:
| | ● | We initiated a position in Marriott International, Inc. – Cl. A (-1%). Marriott is one of the largest hotel chains in the world, having acquired the Starwood Hotels and Resorts portfolio in 2016. With the integration fully completed, including the combination of the companies’ rewards programs most recently, we expect Marriott to begin to reap the benefits of being a larger, more global organization. Marriott gives the portfolio more exposure to the broad cyclical economy, adding balance to secular growth companies. In the event the economy picks up, we expect Marriott to outperform meaningfully. |
12
| | ● | We initiated a position in Eli Lilly & Company (+18%), as the company has repositioned its portfolio focus and is now reentering a growth phase reflected in innovative medications. The company has launched 10 new medications in the last 5 years in areas including oncology, pain management, neurodegeneration, immunology, and diabetes. A majority of these new product launches are considered best in class based upon science or the medication’s mechanism of action. As a result, the company has guided investors to expect a long-term revenue growth rate of 7% per year. |
Although we typically reserve comments in shareholder reports for notable performers and position changes, given the recent headlines surrounding The Boeing Company, we thought it prudent to provide you an update on this stock held by the Growth Fund. In spite of challenging issues and headlines, Boeing returned +5% in the period. While we are of course very saddened by the recent accident involving a Boeing 737 Max airplane in Africa, there is speculation that the causes may be relatively clear, and may be linked to the automatic flight control software and/or related training issues that may also have caused the prior Lion Air crash. If this is determined to be the case, it is our view that the problem could be fixable relatively quickly. We understand that Boeing and the Federal Aviation Administration (“FAA”) have been working on a software solution and a training update that may be implemented as soon as the end of April. As of the date of this report, it is our opinion that the recent production rate decrease (from building fifty-two 737 Max airplanes per month to building forty-two) is likely to be temporary, and that production should return to the previous rate relatively soon after the FAA grounding of 737 Max aircraft is lifted. Additionally, we view a recent pause in the delivery of 737 Max aircraft as a temporary timing issue that will be remedied with elevated deliveries in future periods. Historically, temporary production and delivery delays of this type do not pose a long-term risk to the company.
From a sector allocation perspective, the Fund’s performance was boosted relative to the benchmark index by having no exposure to the weak-performing Energy sector, and was aided by an underweight stance in the Financials sector.
Several positions in the Financials sector were sold in the six-month period. As we witnessed a drop in interest rates and a flattening yield curve, we decided to significantly reduce our exposure to interest rate sensitive stocks by liquidating the Fund’s investments in the Banks industry group. Both JPMorgan Chase & Co. (-5% prior to being sold) and First Republic Bank (-11% prior to be being sold) were sold during the period, as we felt that much of the positive effect on banks from the Federal Reserve’s interest rate hikes in 2018 had already been realized. As a point of reference, the Financials sector in aggregate posted the second-weakest return of all GICS sectors during the period, lagging only the Energy sector.
Constellation Brands, Inc. – Cl. A, a material detractor from Fund performance during the period, returned -23% and was sold. We decided to reduce our exposure to Consumer Staples by liquidating the Fund’s investments held in the sector and shift the Fund’s positioning toward other, more cyclical-growth sectors such as Consumer Discretionary.
In addition, we sold a position in G1 Therapeutics, Inc. (-65% prior to being sold) as the regulatory pathway for the company’s lead oncology molecule, trilaciclib, remains uncertain. Although trilaciclib did show a reduction in the harmful side effects of chemotherapy, questions remain regarding the timing of the Food and Drug Administration’s approval as it is now believed that the company will need additional clinical work prior to approval.
From a sector allocation perspective, the Fund was held back relative to its benchmark index by having no exposure to the strong-performing Utilities sector and an underweight stance in the Consumer Staples sector. As volatility increased during the period and bond yields dropped, investors sought the defensive characteristics and yield of stocks in these sectors.
During the reporting period, the Fund reduced its exposure to the Financials, Consumer Staples and Health Care sectors. The Fund increased its allocations to the Consumer Discretionary, Information Technology, Communication Services and Industrials sectors. There were no significant changes to the Fund’s allocations to the Real Estate and Materials sectors. Please note that GICS sectors were reconstituted on October 1, 2018, and that the beginning sector values for the Fund have been recalculated in accordance with the reconstitution for purposes of the foregoing paragraph.(2)
Fiscal Period-End Investment Posture
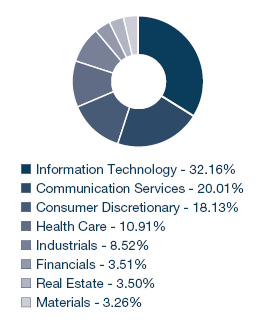
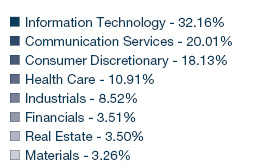
As of March 31, 2019, the Fund’s largest sector allocations included Information Technology, Communication Services, Consumer Discretionary and Health Care. As of that date, the Fund had no exposure to the Consumer Staples, Energy, or Utilities sectors.
13
Other Developments
Effective February 28, 2019, Brandon A. Geisler became co-manager of the Growth Fund with Thomas F. Marsico.
Sincerely,
THOMAS F. MARSICO
BRANDON A. GEISLER
PORTFOLIO MANAGERS
(1) | Total returns are based on net change in net asset value assuming reinvestment of distributions. Please see the Prospectus for more information. |
(2) | Through September 30, 2018, the Funds reported certain investments as having been classified within the Information Technology, Consumer Discretionary or Telecommunication Services sectors. Effective October 1, 2018, GICS reconstituted those sectors by reclassifying certain stocks formerly included in them into other sectors based on their business characteristics. For example, investments in telecommunication services companies (previously included in the Telecommunication Services sector) as well as certain companies that offer content through various media platforms (previously included in the Information Technology or Consumer Discretionary sectors) are now reported in the broadened GICS Communication Services sector. Additionally, certain e-commerce companies (previously included in the Information Technology sector) are now reported In the Consumer Discretionary sector. References to investment sector exposure included throughout this semi-annual report reflect the impact of these changes. |
14
March 31, 2019 (Unaudited)
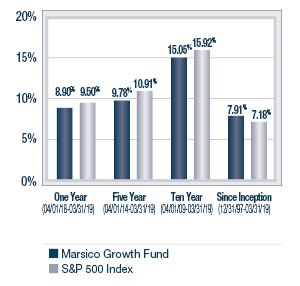
The Growth Fund is a diversified portfolio and invests primarily in the common stocks of large companies that are selected for their long-term growth potential. The Growth Fund will normally hold a core position of between 35 and 50 common stocks.
TOTAL ANNUAL OPERATING EXPENSES**1.44% | NET ASSETS$258,467,465 | NET ASSET VALUE PER SHARE$17.88 |
GROWTH OF $10,000(1) | PERFORMANCE COMPARISON |
| | Average Annualized Returns |
| 
|
SECTOR ALLOCATION(2) | TOP FIVE HOLDINGS |
| | | | |
| | Alphabet, Inc. - Cl. A | 6.10% | |
| | Amazon.com, Inc. | 5.49% | |
| | Visa, Inc. - Cl. A | 5.47% | |
| | Facebook, Inc. - Cl. A | 4.72% | |
| | Alibaba Group Holding Ltd. Spon. ADR | 4.68% | |
| | | | |
* | The Total Annual Operating Expenses are reflective of the information disclosed in the Funds’ Prospectus dated February 1, 2019, as supplemented, and may differ from the expense ratio disclosed in this report. |
| The performance data quoted here represent past performance, and past performance is not a guarantee of future results. Investment return and principal value of an investment will fluctuate so that an investor’s shares, when redeemed, may be worth more or less than their original cost. Current performance may be lower or higher than the performance information quoted. To obtain performance information current to the most recent month-end, please call 888-860-8686 or visit marsicofunds.com. |
| The performance included in the chart and graph does not reflect the deduction of taxes on Fund distributions or the redemption of Fund shares. |
| All indices are unmanaged and investors cannot invest directly in an index. |
(1) | This chart assumes an initial investment of $10,000 made on March 31, 2009. Total returns are based on net change in NAV, assuming reinvestment of distributions. |
(2) | Sector weightings represent the percentage of the Fund’s investments (excluding cash equivalents) in certain general sectors. These sectors may include more than one industry. The Fund’s portfolio composition is subject to change at any time. |
15
MARSICO GROWTH FUND
SCHEDULE OF INVESTMENTS
March 31, 2019 (Unaudited)
| | | Number
of
Shares | | | Value | | | Percent
of Net
Assets | |
COMMON STOCKS | | | | | | | | | | | | |
Aerospace & Defense | | | | | | | | | | | | |
Lockheed Martin Corporation | | | 25,976 | | | $ | 7,796,956 | | | | 3.02% | |
Raytheon Company | | | 31,428 | | | | 5,722,410 | | | | 2.21 | |
The Boeing Company | | | 20,606 | | | | 7,859,541 | | | | 3.04 | |
| | | | | | | | 21,378,907 | | | | 8.27 | |
Application Software | | | | | | | | | | | | |
Adobe, Inc.* | | | 33,487 | | | | 8,923,951 | | | | 3.45 | |
salesforce.com, inc.* | | | 72,722 | | | | 11,516,983 | | | | 4.46 | |
| | | | | | | | 20,440,934 | | | | 7.91 | |
Data Processing & Outsourced Services | | | | |
PayPal Holdings, Inc.* | | | 106,064 | | | | 11,013,686 | | | | 4.26 | |
Visa, Inc. - Cl. A | | | 90,543 | | | | 14,141,911 | | | | 5.47 | |
Worldpay, Inc. - Cl. A* | | | 61,456 | | | | 6,975,256 | | | | 2.70 | |
| | | | | | | | 32,130,853 | | | | 12.43 | |
Financial Exchanges & Data | | | | | | | | |
Intercontinental Exchange, Inc. | | | 57,579 | | | | 4,384,065 | | | | 1.69 | |
S&P Global, Inc. | | | 20,970 | | | | 4,415,234 | | | | 1.71 | |
| | | | | | | | 8,799,299 | | | | 3.40 | |
Health Care Equipment | | | | | | | | | | | | |
Danaher Corporation | | | 20,192 | | | | 2,665,748 | | | | 1.03 | |
Intuitive Surgical, Inc.* | | | 6,123 | | | | 3,493,661 | | | | 1.35 | |
ResMed, Inc. | | | 23,070 | | | | 2,398,588 | | | | 0.93 | |
| | | | | | | | 8,557,997 | | | | 3.31 | |
Hotels, Resorts & Cruise Lines | | | | | | | | |
Marriott International, Inc. - Cl. A | | | 51,008 | | | | 6,380,591 | | | | 2.47 | |
| | | | | | | | | | | | | |
Interactive Media & Services | | | | | | | | |
Alphabet, Inc. - Cl. A* | | | 13,403 | | | | 15,773,857 | | | | 6.10 | |
Facebook, Inc. - Cl. A* | | | 73,141 | | | | 12,191,873 | | | | 4.72 | |
Tencent Holdings Ltd. | | | 147,100 | | | | 6,764,769 | | | | 2.62 | |
| | | | | | | | 34,730,499 | | | | 13.44 | |
Internet & Direct Marketing Retail | | | | | | | | |
Alibaba Group Holding Ltd. Spon. ADR* | | | 66,352 | | | | 12,105,922 | | | | 4.68 | |
Amazon.com, Inc.* | | | 7,970 | | | | 14,192,578 | | | | 5.49 | |
| | | | | | | | 26,298,500 | | | | 10.17 | |
Managed Health Care | | | | | | | | | | | | |
UnitedHealth Group, Inc. | | | 23,565 | | | | 5,826,682 | | | | 2.25 | |
| | | | | | | | | | | | | |
Movies & Entertainment | | | | | | | | | | | | |
Netflix, Inc.* | | | 18,116 | | | | 6,459,441 | | | | 2.50 | |
The Walt Disney Company | | | 81,518 | | | | 9,050,943 | | | | 3.50 | |
| | | | | | | | 15,510,384 | | | | 6.00 | |
Pharmaceuticals | | | | | | | | | | | | |
Elanco Animal Health, Inc.* | | | 16,230 | | | | 520,496 | | | | 0.20 | |
Eli Lilly & Company | | | 22,859 | | | | 2,966,184 | | | | 1.15 | |
Zoetis, Inc. | | | 94,413 | | | | 9,504,557 | | | | 3.68 | |
| | | | | | | | 12,991,237 | | | | 5.03 | |
Restaurants | | | | | | | | | | | | |
McDonald's Corporation | | | 33,167 | | | | 6,298,413 | | | | 2.44% | |
| | | | | | | | | | | | | |
Semiconductors | | | | | | | | | | | | |
NVIDIA Corporation | | | 36,211 | | | | 6,502,047 | | | | 2.52 | |
| | | | | | | | | | | | | |
Specialized REITs | | | | | | | | | | | | |
Crown Castle International Corp. | | | 68,703 | | | | 8,793,984 | | | | 3.40 | |
| | | | | | | | | | | | | |
Specialty Chemicals | | | | | | | | | | | | |
The Sherwin-Williams Company | | | 18,996 | | | | 8,181,767 | | | | 3.17 | |
| | | | | | | | | | | | | |
Specialty Stores | | | | | | | | | | | | |
Ulta Beauty, Inc.* | | | 18,735 | | | | 6,533,456 | | | | 2.53 | |
| | | | | | | | | | | | | |
Systems Software | | | | | | | | | | | | |
Microsoft Corporation | | | 81,265 | | | | 9,584,394 | | | | 3.71 | |
| | | | | | | | | | | | | |
Technology Hardware, Storage & Peripherals | | | | |
Apple, Inc. | | | 63,480 | | | | 12,058,026 | | | | 4.66 | |
| | | | | | | | | | | | | |
TOTAL COMMON STOCKS | | | | | | | | | | | | |
(Cost $156,950,389) | | | | | | | 250,997,970 | | | | 97.11 | |
| | | | | | | | | | | | | |
SHORT-TERM INVESTMENTS | | | | | | | | |
State Street Institutional Treasury Money Market Fund, 0.019% | | | 8,854,701 | | | | 8,854,701 | | | | 3.43 | |
| | | | | | | | | | | | | |
TOTAL SHORT-TERM INVESTMENTS | | | | | | | | |
(Cost $8,854,701) | | | | | | | 8,854,701 | | | | 3.43 | |
| | | | | | | | | | | | | |
TOTAL INVESTMENTS | | | | | | | | | | | | |
(Cost $165,805,090) | | | | | | | 259,852,671 | | | | 100.54 | |
| | | | | | | | | | | | | |
Liabilities, Less Cash and Other Assets | | | | | | | (1,385,206 | ) | | | (0.54) | |
| | | | | | | | | | | | | |
NET ASSETS | | | | | | $ | 258,467,465 | | | | 100.00% | |
| See notes to financial statements. |
16
INVESTMENT REVIEW BY BRANDON GEISLER (UNAUDITED)
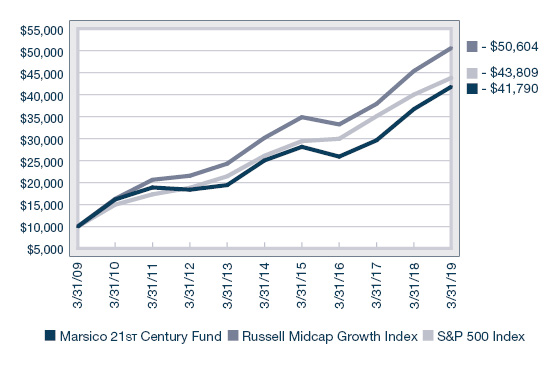
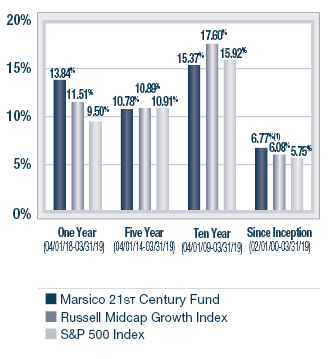
The Marsico 21st Century Fund posted a total return of +0.26% for the six-month fiscal period ended March 31, 2019. The Fund marginally underperformed the Russell Midcap Growth Index, the Fund’s primary benchmark, which had a total return of +0.49% during the six-month fiscal period. Please see the Fund’s Overview for more detailed information about the Fund’s longer-term performance for various time periods ended March 31, 2019.
The performance data for the Fund quoted here represent past performance, and past performance is not a guarantee of future results. Investment return and principal value of an investment will fluctuate so that an investor’s shares, when redeemed, may be worth more or less than their original cost. Current performance may be lower or higher than the performance information quoted. To obtain performance information current to the most recent month-end, please call 888-860-8686 or visit marsicofunds.com.(1)
This review highlights Fund performance over a six-month fiscal period. Shareholders should keep in mind that the Fund is intended for long-term investors who hold their shares for substantially longer periods of time. You should also keep in mind that our current views and beliefs regarding all investments discussed in this report are subject to change at any time. References to specific securities, industries, and sectors discussed in this report are not recommendations to buy or sell such securities or related investments, and the Fund may not necessarily hold these securities or investments today. Please see the accompanying Schedule of Investments for the percentage of the Fund’s portfolio represented by the securities mentioned in this report as of the end of the reporting period.
The Fund is subject to broad risks associated with investing in equity securities markets generally, including the risks that the securities and markets in which it invests may experience volatility and instability, that domestic and global economies and markets may undergo periods of cyclical change and decline, that investors may at times avoid investments in equity securities, and that investments may not perform as anticipated. Please see the Prospectus for more information.
The Fund is not managed to track its benchmark index, and may hold a substantially overweight or underweight position in a sector, industry, or security compared to its weight in the benchmark. The Fund may be subject to risks associated with a particular sector or other area in which it is overweight, including the risk that the stocks of companies within one area could simultaneously decline in price because of an event that affects the entire area. For informational purposes, the discussion below may compare the benchmark weight or performance of a sector or industry to the investment approach of the Fund.
The 21st Century Fund’s slight underperformance during the six-month period ended March 31, 2019 as compared to its benchmark, the Russell Midcap Growth Index, was primarily attributable to certain stocks in the Information Technology, Communication Services and Consumer Staples sectors as defined in the Global Industry Classification Standard (“GICS”).
In the Information Technology space, Broadridge Financial Solutions, Inc. (-21%) underperformed during the period as the company lapped exceptionally strong performance from the prior-year. As 2019 progresses, we anticipate financial performance to accelerate which should benefit stock price performance.
In the Communication Services sector, video game maker Take-Two Interactive Software, Inc. (-33% prior to being sold) underperformed over the period due to increased competition and a slowdown in sales of its key video games. The rise of Fortnite, an extremely popular free-to-play multiplayer game, has led to a shift away from traditional titles for a large portion of consumers involved in gaming.
Beer-maker Constellation Brands, Inc. – Cl. A (-18%), operating in the Consumer Staples sector, was weak during the period due to investor skepticism around the company’s recent investment in the cannabis space (Canopy Growth), in addition to uncertainty regarding dilution from the proposed sale of the company’s lower-end wine business.
From a sector allocation perspective, Fund performance was marginally impaired by having an underweight allocation, based on average weight for the period, to the Information Technology sector, as the sector return outmatched the overall benchmark index return over the same period.
Several new positions in the Fund performed positively during the period, including Information Technology holding ServiceNow, Inc. (+5%). Servicenow is a disruptive share gainer in the $6 billion market for IT service management services. The company is scaling effectively to address this large opportunity with revenues growing drastically over the last few years. The company is also delivering increasing profitability as the business scales, and we expect operating margins to continue expanding, starting from 1% in 2014 to an estimated 24.5% in 2020. There is potential for further upside as a recent sales reorganization has been completed and the company’s deal pipeline is replenished.
17
Also on the positive side, in the Real Estate sector, cellular tower and communications provider SBA Communications Corporation – Cl. A returned +24%, handily outperforming the Real Estate sector as well as the broader Russell Midcap Growth benchmark Index overall. Improvement in tower leasing trends as the industry slowly transitions to mobile phone 5G requirements, along with improvements in its Latin American business, drove strong performance during the six-month period, and we anticipate these trends to continue.
Ball Corporation was up +32% for the period as the company continues to execute strongly post the acquisition of Rexam PLC in 2016, which made the company the largest beverage can maker in the world. Going forward we expect the company to use its strong market position and capital discipline to maintain its growth and free cash flow profile.
Several of the Fund’s Information Technology holdings also rose substantially during the period, including UK-based payments processor Worldpay, Inc. – Cl. A (+12%). Worldpay rose during the period for several reasons. First, the company has continued to generate impressive revenue and earnings growth numbers. On top of that, synergies from the Worldpay/Vantiv integration (which occurred in 2018) continue to bear fruit, leading to earnings upgrades for the company. Finally, Fidelity National Information Services recently announced it is acquiring Worldpay for a premium to Worldpay’s recent trading range. As we analyze the merger, there appear to be significant revenue and earnings benefits from the deal, which is currently projected to close in late 2019.
From a sector allocation perspective, the Fund’s performance was boosted by having an underweight stance in the Communication Services sector, as the sector posted a negative return for the period, underperforming the Russell Midcap Growth benchmark Index as a whole. In addition, the Fund benefitted from an overweight posture in the Real Estate sector, as it was the strongest sector in the benchmark index during the period. As volatility increased during the period and bond yields dropped, investors sought the defensive characteristics and yields of the stocks in this sector.
During the reporting period, the Fund reduced its exposure to the Consumer Staples, Communication Services, and Materials sectors and increased its allocations to the Information Technology, Industrials, and Health Care sectors. There were no significant changes to the Fund’s allocations to the Real Estate, Consumer Discretionary, and Financials sectors. Please note that GICS sectors were reconstituted on October 1, 2018, and that the beginning sector values for the Fund have been recalculated in accordance with the reconstitution for purposes of the foregoing paragraph.(2)
Fiscal Period-End Investment Posture
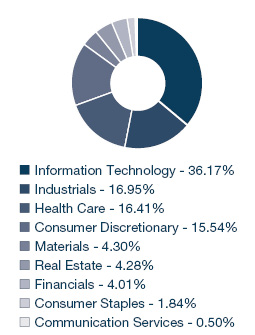
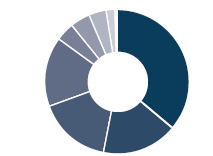
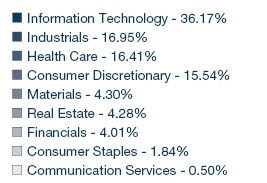
As of March 31, 2019 the Fund’s primary economic sector allocations included Information Technology, Industrials, Health Care and Consumer Discretionary. The Fund had no investments in the Energy or Utilities sectors.
Sincerely,
BRANDON A. GEISLER
PORTFOLIO MANAGER
(1) | Total returns are based on net change in net asset value assuming reinvestment of distributions. Periodically, certain fees and expenses have been waived or reimbursed by the Adviser for the 21st Century Fund. In the absence of such a waiver or reimbursement, the performance returns reflected would have been reduced. In accordance with the expense limitation and fee waiver agreement, the Adviser may recoup fees and expenses previously waived or reimbursed under certain parameters. Periodically, the Adviser has recouped such fees or expenses from the 21st Century Fund, resulting in a lower performance return. Please see the Prospectus for more information. |
(2) | Through September 30, 2018, the Funds reported certain investments as having been classified within the Information Technology, Consumer Discretionary or Telecommunication Services sectors. Effective October 1, 2018, GICS reconstituted those sectors by reclassifying certain stocks formerly included in them into other sectors based on their business characteristics. For example, investments in telecommunication services companies (previously included in the Telecommunication Services sector) as well as certain companies that offer content through various media platforms (previously included in the Information Technology or Consumer Discretionary sectors) are now reported in the broadened GICS Communication Services sector. Additionally, certain e-commerce companies (previously included in the Information Technology sector) are now reported In the Consumer Discretionary sector. References to investment sector exposure included throughout this semi-annual report reflect the impact of these changes. |
18
| 21st CENTURY FUND OVERVIEW |
March 31, 2019 (Unaudited)
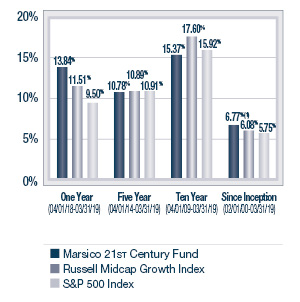
The 21st Century Fund is a diversified portfolio and invests primarily in common stocks that are selected for their long-term growth potential. The Fund may invest in companies of any size. The portions of Fund assets invested in large-capitalization, medium-capitalization, or small-capitalization companies will vary based on market conditions, depending on the portfolio manager’s judgment as to how to achieve the Fund’s investment objective. Under current market conditions the portfolio manager expects to invest substantially in medium-capitalization companies. The Fund will normally hold a core position of between 35 and 60 common stocks.
TOTAL ANNUAL OPERATING EXPENSES**1.42% | NET ASSETS$266,250,868 | NET ASSET VALUE PER SHARE$31.61 |
GROWTH OF $10,000(2) | PERFORMANCE COMPARISON |
| | Average Annualized Returns |
| 
|
SECTOR ALLOCATION(3) | TOP FIVE HOLDINGS |
| | | | |
| | Worldpay, Inc. - Cl. A | 3.73% | |
| | CoStar Group, Inc. | 3.04% | |
| | Burlington Stores, Inc. | 2.88% | |
| | Mastercard, Inc. - Cl. A | 2.72% | |
| | Teleflex, Inc. | 2.71% | |
| | | | |
* | The Total Annual Operating Expenses are reflective of the information disclosed in the Funds’ Prospectus dated February 1, 2019, as supplemented, and may differ from the expense ratio disclosed in this report. |
| The performance data quoted here represent past performance, and past performance is not a guarantee of future results. Investment return and principal value of an investment will fluctuate so that an investor’s shares, when redeemed, may be worth more or less than their original cost. Current performance may be lower or higher than the performance information quoted. To obtain performance information current to the most recent month-end, please call 888-860-8686 or visit marsicofunds.com. |
| The performance included in the chart and graph does not reflect the deduction of taxes on Fund distributions or the redemption of Fund shares. |
| All indices are unmanaged and investors cannot invest directly in an index. |
| Effective January 31, 2018, the Russell Midcap Growth Index was made the primary benchmark index and the S&P 500 Index was made a supplemental benchmark index of the Fund because under current market conditions the Fund is invested substantially in medium-capitalization securities. The Russell Midcap Growth Index (the “Underlying Index”) measures the performance of the mid-capitalization growth sector of the US equity market, and is composed of mid-capitalization US equities that exhibit growth characteristics. It is a subset of the Russell Midcap® Index, which measures the performance of the mid-capitalization sector of the US equity market. The Underlying Index measures the performance of equity securities of Russell Midcap Index issuers with higher price-to-book ratios and higher forecasted growth. |
(1) | Periodically, certain fees and expenses have been waived or reimbursed by the Adviser for the21st Century Fund. In the absence of such a waiver or reimbursement, the performance returns reflected would have been reduced. In accordance with the expense limitation and fee waiver agreement, the Adviser may recoup fees and expenses previously waived or reimbursed under certain parameters. Periodically, the Adviser has recouped such fees or expenses from the21st Century Fund, resulting in a lower performance return. |
(2) | This chart assumes an initial investment of $10,000 made on March 31, 2009. Total returns are based on net change in NAV, assuming reinvestment of distributions. |
(3) | Sector weightings represent the percentage of the Fund’s investments (excluding cash equivalents) in certain general sectors. These sectors may include more than one industry. The Fund’s portfolio composition is subject to change at any time. |
19
MARSICO 21st CENTURY FUND
SCHEDULE OF INVESTMENTS
March 31, 2019 (Unaudited)
| | | Number
of
Shares | | | Value | | | Percent
of Net
Assets | |
COMMON STOCKS | | | | | | | | | | | | |
Aerospace & Defense | | | | | | | | | | | | |
Harris Corporation | | | 28,974 | | | $ | 4,627,437 | | | | 1.74% | |
HEICO Corporation | | | 43,510 | | | | 4,127,794 | | | | 1.55 | |
| | | | | | | | 8,755,231 | | | | 3.29 | |
Apparel Retail | | | | | | | | | | | | |
Burlington Stores, Inc.* | | | 48,903 | | | | 7,662,122 | | | | 2.88 | |
| | | | | | | | | | | | | |
Apparel, Accessories & Luxury Goods | | | | |
Under Armour, Inc. - Cl. A* | | | 123,367 | | | | 2,607,978 | | | | 0.98 | |
| | | | | | | | | | | | | |
Application Software | | | | | | | | | | | | |
Atlassian Corporation PLC - Cl. A* | | | 28,633 | | | | 3,218,063 | | | | 1.21 | |
Constellation Software, Inc. | | | 5,889 | | | | 4,990,678 | | | | 1.87 | |
Guidewire Software, Inc.* | | | 55,533 | | | | 5,395,586 | | | | 2.03 | |
PTC, Inc.* | | | 76,204 | | | | 7,024,485 | | | | 2.64 | |
RealPage, Inc.* | | | 75,693 | | | | 4,593,808 | | | | 1.72 | |
The Descartes Systems Group, Inc.* | | | 136,700 | | | | 4,969,421 | | | | 1.87 | |
The Ultimate Software Group, Inc.* | | | 15,667 | | | | 5,172,147 | | | | 1.94 | |
| | | | | | | | 35,364,188 | | | | 13.28 | |
Automotive Retail | | | | | | | | | | | | |
O'Reilly Automotive, Inc.* | | | 16,990 | | | | 6,597,217 | | | | 2.48 | |
| | | | | | | | | | | | | |
Biotechnology | | | | | | | | | | | | |
Exact Sciences Corporation* | | | 26,614 | | | | 2,305,305 | | | | 0.87 | |
| | | | | | | | | | | | | |
Building Products | | | | | | | | | | | | |
A.O. Smith Corporation | | | 102,151 | | | | 5,446,691 | | | | 2.05 | |
| | | | | | | | | | | | | |
Construction Materials | | | | | | | | | | | | |
Vulcan Materials Company | | | 45,671 | | | | 5,407,447 | | | | 2.03 | |
| | | | | | | | | | | | | |
Data Processing & Outsourced Services | | | | |
Broadridge Financial Solutions, Inc. | | | 53,174 | | | | 5,513,612 | | | | 2.07 | |
FleetCor Technologies, Inc.* | | | 24,639 | | | | 6,075,731 | | | | 2.28 | |
Mastercard, Inc. - Cl. A | | | 30,709 | | | | 7,230,434 | | | | 2.72 | |
Worldpay, Inc. - Cl. A* | | | 87,548 | | | | 9,936,698 | | | | 3.73 | |
| | | | | | | | 28,756,475 | | | | 10.80 | |
Distillers & Vintners | | | | | | | | | | | | |
Constellation Brands, Inc. - Cl. A | | | 27,069 | | | | 4,746,008 | | | | 1.78 | |
| | | | | | | | | | | | | |
Diversified Support Services | | | | | | | | |
Healthcare Services Group, Inc. | | | 138,216 | | | | 4,559,746 | | | | 1.71 | |
| | | | | | | | | | | | | |
Electrical Components & Equipment | | | | |
AMETEK, Inc. | | | 86,491 | | | | 7,176,158 | | | | 2.70 | |
| | | | | | | | | | | | | |
Electronic Equipment & Instruments | | | | | | | | |
Cognex Corporation | | | 103,768 | | | | 5,277,640 | | | | 1.98 | |
Novanta, Inc.* | | | 47,464 | | | | 4,021,625 | | | | 1.51 | |
| | | | | | | | 9,299,265 | | | | 3.49 | |
Financial Exchanges & Data | | | | | | | | |
MSCI, Inc. | | | 8,048 | | | | 1,600,264 | | | | 0.60% | |
| | | | | | | | | | | | | |
General Merchandise Stores | | | | | | | | |
Ollie's Bargain Outlet Holdings, Inc.* | | | 53,625 | | | | 4,575,821 | | | | 1.72 | |
| | | | | | | | | | | | | |
Health Care Equipment | | | | | | | | | | | | |
ABIOMED, Inc.* | | | 12,285 | | | | 3,508,473 | | | | 1.32 | |
IDEXX Laboratories, Inc.* | | | 19,088 | | | | 4,268,077 | | | | 1.60 | |
Intuitive Surgical, Inc.* | | | 12,205 | | | | 6,963,929 | | | | 2.61 | |
LivaNova PLC* | | | 40,181 | | | | 3,907,602 | | | | 1.47 | |
Teleflex, Inc. | | | 23,854 | | | | 7,207,725 | | | | 2.71 | |
| | | | | | | | 25,855,806 | | | | 9.71 | |
Health Care Supplies | | | | | | | | | | | | |
The Cooper Companies, Inc. | | | 18,355 | | | | 5,436,200 | | | | 2.04 | |
| | | | | | | | | | | | | |
Hotels, Resorts & Cruise Lines | | | | | | | | |
Norwegian Cruise Line Holdings Ltd.* | | | 92,636 | | | | 5,091,275 | | | | 1.91 | |
| | | | | | | | | | | | | |
Interactive Media & Services | | | | | | | | |
Snap, Inc. - Cl. A* | | | 116,087 | | | | 1,279,279 | | | | 0.48 | |
| | | | | | | | | | | | | |
IT Consulting & Other Services | | | | | | | | |
Gartner, Inc.* | | | 39,951 | | | | 6,059,768 | | | | 2.28 | |
| | | | | | | | | | | | | |
Leisure Facilities | | | | | | | | | | | | |
Vail Resorts, Inc. | | | 17,643 | | | | 3,833,824 | | | | 1.44 | |
| | | | | | | | | | | | | |
Metal & Glass Containers | | | | | | | | | | | | |
Ball Corporation | | | 97,319 | | | | 5,630,877 | | | | 2.12 | |
| | | | | | | | | | | | | |
Pharmaceuticals | | | | | | | | | | | | |
Elanco Animal Health, Inc.* | | | 122,242 | | | | 3,920,301 | | | | 1.47 | |
GW Pharmaceuticals PLC ADR* | | | 27,644 | | | | 4,659,949 | | | | 1.75 | |
| | | | | | | | 8,580,250 | | | | 3.22 | |
Railroads | | | | | | | | | | | | |
Genesee & Wyoming, Inc. - Cl. A* | | | 37,657 | | | | 3,281,431 | | | | 1.23 | |
| | | | | | | | | | | | | |
Real Estate Services | | | | | | | | | | | | |
FirstService Corporation | | | 47,100 | | | | 4,195,948 | | | | 1.58 | |
| | | | | | | | | | | | | |
Regional Banks | | | | | | | | | | | | |
First Republic Bank | | | 51,040 | | | | 5,127,478 | | | | 1.92 | |
Signature Bank | | | 28,010 | | | | 3,587,241 | | | | 1.35 | |
| | | | | | | | 8,714,719 | | | | 3.27 | |
Research & Consulting Services | | | | | | | | |
CoStar Group, Inc.* | | | 17,335 | | | | 8,085,391 | | | | 3.04 | |
Verisk Analytics, Inc. | | | 46,975 | | | | 6,247,675 | | | | 2.34 | |
| | | | | | | | 14,333,066 | | | | 5.38 | |
Restaurants | | | | | | | | | | | | |
Domino's Pizza, Inc. | | | 17,343 | | | | 4,476,228 | | | | 1.68 | |
| | | | | | | | | | | | | |
Semiconductor Equipment | | | | | | | | | | | | |
Lam Research Corporation | | | 29,909 | | | | 5,354,010 | | | | 2.01 | |
| See notes to financial statements. |
20
| | | Number
of
Shares | | | Value | | | Percent
of Net
Assets | |
| | | | | | | | | | | | | |
COMMON STOCKS(continued) | | | | | | | | |
Semiconductors | | | | | | | | | | | | |
Microchip Technology, Inc. | | | 49,149 | | | $ | 4,077,401 | | | | 1.53% | |
| | | | | | | | | | | | | |
Specialized Consumer Services | | | | | | | | |
frontdoor, Inc.* | | | 39,863 | | | | 1,372,085 | | | | 0.51 | |
ServiceMaster Global Holdings, Inc.* | | | 79,726 | | | | 3,723,204 | | | | 1.40 | |
| | | | | | | | 5,095,289 | | | | 1.91 | |
Specialized REITs | | | | | | | | | | | | |
SBA Communications Corporation - Cl. A* | | | 34,038 | | | | 6,796,027 | | | | 2.55 | |
| | | | | | | | | | | | | |
Systems Software | | | | | | | | | | | | |
ServiceNow, Inc.* | | | 16,375 | | | | 4,036,274 | | | | 1.52 | |
| | | | | | | | | | | | | |
TOTAL COMMON STOCKS | | | | | | | | | | | | |
(Cost $207,231,871) | | | | | | | 256,987,588 | | | | 96.52 | |
| | | | | | | | | | | | | |
SHORT-TERM INVESTMENTS | | | | | | | | |
State Street Institutional Treasury Money Market Fund, 0.019% | | | 17,707,149 | | | | 17,707,149 | | | | 6.65% | |
| | | | | | | | | | | | | |
TOTAL SHORT-TERM INVESTMENTS | | | | | | | | |
(Cost $17,707,149) | | | | | | | 17,707,149 | | | | 6.65 | |
| | | | | | | | | | | | | |
TOTAL INVESTMENTS | | | | | | | | | | | | |
(Cost $224,939,020) | | | | | | | 274,694,737 | | | | 103.17 | |
| | | | | | | | | | | | | |
Liabilities, Less Cash and Other Assets | | | | | | | (8,443,869 | ) | | | (3.17) | |
| | | | | | | | | | | | | |
NET ASSETS | | | | | | $ | 266,250,868 | | | | 100.00% | |
| See notes to financial statements. |
21
| INTERNATIONAL OPPORTUNITIES FUND |
INVESTMENT REVIEW BY TOM MARSICO AND ROB SUSMAN (UNAUDITED)
The Marsico International Opportunities Fund posted a total return of (US$) -5.38% for the six-month fiscal period ended March 31, 2019. The Fund underperformed the MSCI EAFE Index, the Fund’s benchmark index, which had a total return of (US$) -3.81% over the same time period. Please see the Fund’s Overview for more detailed information about the Fund’s longer-term performance for various time periods ended March 31, 2019.
The performance data for the Fund quoted here represent past performance, and past performance is not a guarantee of future results. Investment return and principal value of an investment will fluctuate so that an investor’s shares, when redeemed, may be worth more or less than their original cost. Current performance may be lower or higher than the performance information quoted. To obtain performance information current to the most recent month-end, please call 888-860-8686 or visit marsicofunds.com.(1)
This review highlights Fund performance over a six-month fiscal period. Shareholders should keep in mind that the Fund is intended for long-term investors who hold their shares for substantially longer periods of time. You should also keep in mind that our current views and beliefs regarding all investments discussed in this report are subject to change at any time. References to specific securities, industries, and sectors discussed in this report are not recommendations to buy or sell such securities or related investments, and the Fund may not necessarily hold these securities or investments today. Please see the accompanying Schedule of Investments for the percentage of the Fund’s portfolio represented by the securities mentioned in this report as of the end of the reporting period.
Foreign investments present additional risks due to currency fluctuations, economic and political factors, lower liquidity, differences in securities regulations and accounting standards, possible changes in taxation, limited public information, and other factors. In addition, the Fund is subject to broad risks associated with investing in equity securities markets generally, including the risks that the securities and markets in which it invests may experience volatility and instability, that domestic and global economies and markets may undergo periods of cyclical change and decline, that investors may at times avoid investments in equity securities, and that investments may not perform as anticipated. Please see the Prospectus for more information.
The Fund is not managed to track its benchmark index, and may hold a substantially overweight or underweight position in a sector, industry, or security compared to its weight in the benchmark. The Fund may be subject to risks associated with a particular sector or other area in which it is overweight, including the risk that the stocks of companies within one area could simultaneously decline in price because of an event that affects the entire area. For informational purposes, the discussion below may compare the benchmark weight or performance of a sector or industry to the investment approach of the Fund.
The International Opportunities Fund’s underperformance during the six-month period ended March 31, 2019 as compared to the MSCI EAFE Index was primarily attributable to certain stocks in the Health Care, Industrials, and Information Technology sectors as defined in the Global Industry Classification Standard (“GICS”).
Several of the Fund’s positions in the Health Care sector detracted from performance including Eurofins Scientific S.E. (-27%). The company is a promising global manufacturer of products and services focused on laboratory safety and purity analysis important to the pharmaceutical, environmental, food, and consumer products industries. The company underperformed recently due to concerns that recent acquisitions may be dilutive to organic growth and may have increased debt leverage. In response, the company reiterated its confidence in achieving organic revenue growth of 5% annualized beyond 2020, and reduced its leverage slightly with recent debt repayments.
In the Information Technology sector, German payment processor Wirecard A.G. declined -35% and was sold from the Fund. The UK’s Financial Times published a series of reports accusing Wirecard’s Asian operations of accounting irregularities, and suggested that Wirecard’s upper management was aware of the issues. A Singapore-based law firm found some very minor misstatements that amount to less than 1% of Wirecard’s revenues in each of the impacted years, 2016 and 2017, but found no evidence that management in Germany knew of the minor misstatements. However, because of a history of attacks on Wirecard, we exited the position. We still like Wirecard as a very unique asset exposed to the growing space of online payment processing, but we will remain on the sidelines until we get more clarity on the company’s Asian operations.
Irish low-cost airline Ryanair Holdings PLC Spon. ADR (-22%) has begun working with unions for the first time in its long history, and has taken longer than expected to strike deals with pilot and cabin crew unions in countries it which it operates. It has been making progress, and the company expects negotiations to be completed by the fall. Also, European short-haul capacity growth has been higher than expected for the winter, which led to some softness in fares. Ryanair is the cost leader in European short-haul travel by a wide margin, as its average fares are cheaper than its competitors’ average costs per passenger, and the company should continue to take share in European air travel for years to come.
From a sector allocation perspective, Fund performance was penalized for maintaining no exposure to the Utilities sector, the strongest performing sector in the MSCI EAFE Index during the period, and for maintaining an underweight stance to the Consumer Staples sector.
22
| INTERNATIONAL OPPORTUNITIES FUND |
Several new positions in the Fund performed positively during the period, including Swiss-based food and drink company Nestlé, S.A. (+13%). Nestlé is a very high-quality, global consumer staples company showing consistent revenue and earnings growth. We like management’s ongoing strategy of pruning underperforming brands and product lines to focus on higher growth and higher return lines, which helps to ensure continued growth and improving returns on capital. Additionally, Nestlé is the largest Consumer Staples company in the world, and given its global scale, it can continue to demand best pricing on expense items such as packaging, and raw materials, and to obtain best-in-class terms on retail e-commerce sites such as Amazon.
During the six-month period, we made a conscious decision to increase Fund investments in the Consumer Staples sector as global economic growth may become more uncertain through 2019. Such investments can help to reduce portfolio volatility in times of stress, given the stable earnings streams of companies such as Nestlé.
The top positive contributor to the Fund’s performance for the six-month period was Chinese conglomerate Alibaba Group Holding Ltd. Spon. ADR, which returned +11%. The company’s goal is to remove friction from the flow of commerce globally, which it strives to do by providing virtually every type of electronic infrastructure that businesses need to compete, including online marketplaces, technology infrastructure, best-in-class mobile payments systems, content marketing, and logistics/distribution. Alibaba has over 600 million active users, yet it remains one of the most under-monetized platform businesses. Despite having double the user base of Amazon, the company has only approximately 20% of Amazon’s revenues. We believe the company will close that gap, and could grow its revenues above 30% per year for the next several years.
In the Media & Entertainment industry group, Chinese media/gaming conglomerate Tencent Holdings Ltd. (+11%) also was a strong performer as regulatory issues surrounding its core gaming business have drastically improved. For the better part of 2018, the Chinese government put tighter restrictions on monetization and approvals of new games, which lead to revenue and operating profit estimates to be revised down materially for Tencent. As a result, the stock underperformed for a time. Restrictions recently have eased, however and approvals have now commenced, which has led to renewed optimism around Tencent’s ability to reaccelerate revenue and operating profit, leading to improved stock performance. We own Tencent due in part to our belief in the company’s ability to derive consistent operating profit from gaming, but our larger thesis for ownership revolves around our favorable view of the company’s new business models relating to electronic payments, custom content, and cloud business.
Dechra Pharmaceuticals PLC, a UK based veterinary pharmaceutical products company, rose +25% in the period. The company has transitioned its animal health portfolio from a national business to an increasingly global business with presence in Europe and the US, among other regions. This transition has resulted from organic growth as well as two recent acquisitions. The recent acquisitions expanded the company portfolio into the poultry vaccines market, as well as geographically expanding into the faster growth market of Brazil.
In terms of sector allocation as compared to its benchmark index, the Fund was rewarded for having no exposure to the Energy sector and an underweight stance in the Financials sector, two of the weakest performing sectors in the MSCI EAFE index during the period.
Although active currency management is not a central facet of the Fund’s investment process, fluctuations in major world currencies can at times affect the Fund’s performance. During the period, the net effect of currency moves was slightly negative for the Fund, as the US dollar appreciated modestly against some other currencies in which certain foreign stocks are priced.
There were a few shifts in the Fund’s sector allocations during the period. The Fund reduced its allocations to the Consumer Discretionary, Information Technology, Financials and Communication Services sectors and increased its allocations to the Consumer Staples, Industrials, Health Care, and Materials sectors. There was no significant change to the Fund’s allocation to the Real Estate sector. Please note that GICS sectors were reconstituted on October 1, 2018, and that the beginning sector values for the Fund have been recalculated in accordance with the reconstitution for purposes of the foregoing paragraph.(2)
23
| INTERNATIONAL OPPORTUNITIES FUND |
Fiscal Period-End Investment Posture
As of March 31, 2019, the Fund’s primary economic sector allocations included Information Technology, Communication Services, Health Care, Consumer Discretionary, Industrials and Financials. The Fund had no exposure to the Energy or Utilities sectors.
In terms of country allocations, the Fund’s most significant weightings at period-end, excluding short-term investments, were in Japan, the Netherlands, the United Kingdom, Germany, China/Hong Kong, France, and Switzerland. Country-level weightings generally should be considered a residual of the Fund’s stock selection process rather than a major, proactive facet of its investment strategy.
Sincerely,
THOMAS F. MARSICO
ROBERT G. SUSMAN, CFA
PORTFOLIO MANAGERS
(1) | Total returns are based on net change in net asset value assuming reinvestment of distributions. Periodically, certain fees and expenses have been waived or reimbursed by the Adviser for the International Opportunities Fund. In the absence of such a waiver or reimbursement, the performance returns reflected would have been reduced. In accordance with the expense limitation and fee waiver agreement, the Adviser may recoup fees and expenses previously waived or reimbursed under certain parameters. Periodically, the Adviser has recouped such fees or expenses from the International Opportunities Fund, resulting in a lower performance return. Please see the Prospectus for more information. |
(2) | Through September 30, 2018, the Funds reported certain investments as having been classified within the Information Technology, Consumer Discretionary or Telecommunication Services sectors. Effective October 1, 2018, GICS reconstituted those sectors by reclassifying certain stocks formerly included in them into other sectors based on their business characteristics. For example, investments in telecommunication services companies (previously included in the Telecommunication Services sector) as well as certain companies that offer content through various media platforms (previously included in the Information Technology or Consumer Discretionary sectors) are now reported in the broadened GICS Communication Services sector. Additionally, certain e-commerce companies (previously included in the Information Technology sector) are now reported In the Consumer Discretionary sector. References to investment sector exposure included throughout this semi-annual report reflect the impact of these changes. |
24
| INTERNATIONAL OPPORTUNITIES FUND OVERVIEW |
March 31, 2019 (Unaudited)
The International Opportunities Fund is a diversified portfolio and invests primarily (generally, no less than 65% of its total assets) in common stocks of foreign companies that are selected for their long-term growth potential, including foreign securities, whether traded in the US (including as American Depositary Receipts) or in foreign markets or both. The Fund may invest in an unlimited number of companies of any size throughout the world. It normally invests in the securities of issuers that are economically tied to one or more foreign countries, and expects to be invested in various issuers or securities that together have ties to at least four different foreign countries. The Fund may invest in securities of companies economically tied to emerging markets. Some issuers or securities in the Fund’s portfolio may be economically tied to the US.
TOTAL ANNUAL OPERATING EXPENSES**1.65% NET EXPENSES**†1.50% | NET ASSETS$54,928,103 | NET ASSET VALUE PER SHARE$17.54 |
GROWTH OF $10,000(1)(2) | PERFORMANCE COMPARISON |
| | Average Annualized Returns |
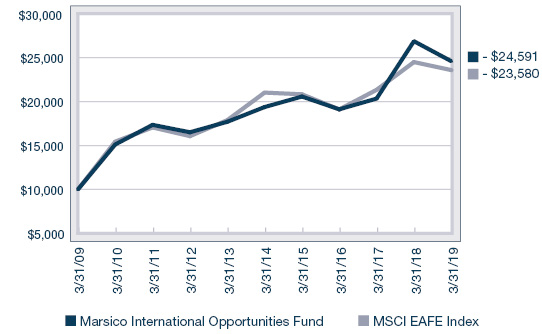
| 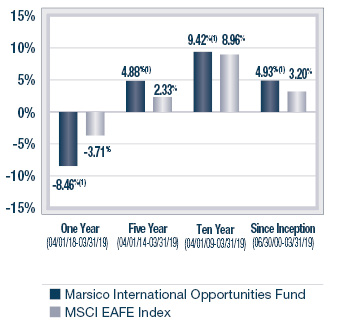
|
SECTOR ALLOCATION(3) | TOP FIVE HOLDINGS |
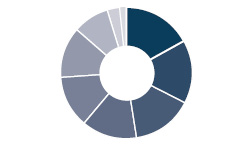 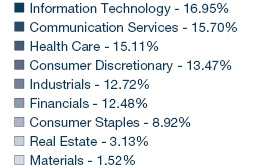
| | | | |
| | Alibaba Group Holding Ltd. Spon. ADR | 4.57% | |
| | Koninklijke Philips N.V. | 3.95% | |
| | Tencent Holdings Ltd. | 3.95% | |
| | InterXion Holding N.V. | 3.44% | |
| | ASML Holding N.V. | 3.42% | |
| | | | |
* | The Total Annual Operating Expenses and Net Expenses are reflective of the information disclosed in the Funds’ Prospectus dated February 1, 2019, as supplemented, and may differ from the expense ratios disclosed in this report. |
† | Marsico Capital Management, LLC (the “Adviser”) has entered into a written expense limitation and fee waiver agreement under which it has agreed to limit the total expenses of the International Opportunities Fund (excluding taxes, interest, acquired fund fees and expenses, litigation, extraordinary expenses, brokerage and other transaction expenses relating to the purchase or sale of portfolio investments) to an annual rate of 1.50% of the Fund’s average net assets until January 31, 2020. This expense limitation and fee waiver agreement may be terminated by the Adviser at any time after January 31, 2020 upon 15 days prior notice to the Fund and its administrator. The Adviser may recoup from the Fund fees previously waived or expenses previously reimbursed by the Adviser with respect to that Fund pursuant to this agreement (or a previous expense limitation agreement) if: (1) such recoupment by the Adviser does not cause the Fund, at the time of recoupment, to exceed the lesser of (a) the expense limitation in effect at the time the relevant amount was waived and/or reimbursed, or (b) the expense limitation in effect at the time of the proposed recoupment, and (2) the recoupment is made within three years after the fiscal year end date as of which the amount to be waived or reimbursed was determined and the waiver or reimbursement occurred. |
| The performance data quoted here represent past performance, and past performance is not a guarantee of future results. Investment return and principal value of an investment will fluctuate so that an investor’s shares, when redeemed, may be worth more or less than their original cost. Current performance may be lower or higher than the performance information quoted. To obtain performance information current to the most recent month-end, please call 888-860-8686 or visit marsicofunds.com. |
| The performance included in the chart and graph does not reflect the deduction of taxes on Fund distributions or the redemption of Fund shares. |
| All indices are unmanaged and investors cannot invest directly in an index. |
| The MSCI EAFE Index tracks the stocks of about 1,000 companies in Europe, Australasia, and the Far East (EAFE). |
(1) | Periodically, certain fees and expenses have been waived or reimbursed by the Adviser for the International Opportunities Fund. In the absence of such a waiver or reimbursement, the performance returns reflected would have been reduced. In accordance with the expense limitation and fee waiver agreement, the Adviser may recoup fees and expenses previously waived or reimbursed under certain parameters. Periodically, the Adviser has recouped such fees or expenses from the International Opportunities Fund, resulting in a lower performance return. |
(2) | This chart assumes an initial investment of $10,000 made on March 31, 2009. Total returns are based on net change in NAV, assuming reinvestment of distributions. |
(3) | Sector weightings represent the percentage of the Fund’s investments (excluding cash equivalents) in certain general sectors. These sectors may include more than one industry. The Fund’s portfolio composition is subject to change at any time. |
25
MARSICO INTERNATIONAL OPPORTUNITIES FUND
SCHEDULE OF INVESTMENTS
March 31, 2019 (Unaudited)
| | | Number
of
Shares | | | Value | | | Percent
of Net
Assets | |
COMMON STOCKS | | | | | | | | | | | | |
Aerospace & Defense | | | | | | | | | | | | |
Airbus SE | | | 10,233 | | | $ | 1,353,359 | | | | 2.46% | |
BAE Systems PLC | | | 80,110 | | | | 503,332 | | | | 0.92 | |
| | | | | | | | 1,856,691 | | | | 3.38 | |
Airlines | | | | | | | | | | | | |
Ryanair Holdings PLC Spon. ADR* | | | 18,755 | | | | 1,405,500 | | | | 2.56 | |
| | | | | | | | | | | | | |
Apparel, Accessories & Luxury Goods | | | | |
LVMH Moet Hennessy Louis Vuitton S.E. | | | 1,158 | | | | 425,938 | | | | 0.78 | |
| | | | | | | | | | | | | |
Application Software | | | | | | | | | | | | |
Constellation Software, Inc. | | | 616 | | | | 522,034 | | | | 0.95 | |
SAP S.E. | | | 10,880 | | | | 1,257,078 | | | | 2.29 | |
| | | | | | | | 1,779,112 | | | | 3.24 | |
Asset Management & Custody Banks | | | | |
Burford Capital Ltd. | | | 22,747 | | | | 499,508 | | | | 0.91 | |
Hargreaves Lansdown PLC | | | 27,906 | | | | 677,311 | | | | 1.23 | |
Julius Baer Group Ltd. | | | 16,158 | | | | 652,811 | | | | 1.19 | |
| | | | | | | | 1,829,630 | | | | 3.33 | |
Brewers | | | | | | | | | | | | |
Anheuser-Busch InBev S.A./N.V. | | | 10,028 | | | | 840,969 | | | | 1.53 | |
| | | | | | | | | | | | | |
Consumer Electronics | | | | | | | | | | | | |
Sony Corporation | | | 12,200 | | | | 511,315 | | | | 0.93 | |
| | | | | | | | | | | | | |
Data Processing & Outsourced Services | | | | |
Pagseguro Digital Ltd. - Cl. A* | | | 20,477 | | | | 611,238 | | | | 1.11 | |
Worldpay, Inc. - Cl. A* | | | 10,289 | | | | 1,167,802 | | | | 2.13 | |
| | | | | | | | 1,779,040 | | | | 3.24 | |
Distillers & Vintners | | | | | | | | | | | | |
Diageo PLC | | | 18,081 | | | | 738,986 | | | | 1.35 | |
Treasury Wine Estates Ltd. | | | 60,741 | | | | 643,918 | | | | 1.17 | |
| | | | | | | | 1,382,904 | | | | 2.52 | |
Diversified Banks | | | | | | | | | | | | |
BAWAG Group A.G. | | | 12,406 | | | | 547,473 | | | | 0.99 | |
HDFC Bank Ltd. ADR | | | 6,720 | | | | 778,915 | | | | 1.42 | |
ING Groep N.V. | | | 22,170 | | | | 268,190 | | | | 0.49 | |
Sumitomo Mitsui Financial Group, Inc. | | | 25,600 | | | | 895,295 | | | | 1.63 | |
| | | | | | | | 2,489,873 | | | | 4.53 | |
Electrical Components & Equipment | | | | |
ABB Ltd. | | | 19,658 | | | | 369,371 | | | | 0.67 | |
| | | | | |
Electronic Equipment & Instruments | | | | |
Keyence Corporation | | | 900 | | | | 560,074 | | | | 1.02 | |
| | | | | | | | | | | | | |
Financial Exchanges & Data | | | | | | | | |
Bolsa Mexicana de Valores S.A.B. de C.V. | | | 193,726 | | | | 402,218 | | | | 0.73 | |
Deutsche Boerse A.G. | | | 8,966 | | | | 1,149,585 | | | | 2.09 | |
| | | | | | | | 1,551,803 | | | | 2.82 | |
General Merchandise Stores | | | | | | | | |
B&M European Value Retail S.A. | | | 153,590 | | | | 747,362 | | | | 1.36% | |
Dollarama, Inc. | | | 21,826 | | | | 582,255 | | | | 1.06 | |
| | | | | | | | 1,329,617 | | | | 2.42 | |
Health Care Equipment | | | | | | | | | | | | |
Koninklijke Philips N.V. | | | 53,218 | | | | 2,167,908 | | | | 3.95 | |
| | | | | | | | | | | | | |
Human Resource & Employment Services | | | | |
Recruit Holdings Company Ltd. | | | 20,500 | | | | 584,684 | | | | 1.06 | |
| | | | | | | | | | | | | |
Industrial Conglomerates | | | | | | | | | | | | |
Siemens A.G. | | | 4,883 | | | | 525,512 | | | | 0.96 | |
| | | | | | | | | | | | | |
Industrial Gases | | | | | | | | | | | | |
Air Liquide S.A. | | | 2,129 | | | | 270,703 | | | | 0.49 | |
| | | | | | | | | | | | | |
Industrial Machinery | | | | | | | | | | | | |
FANUC Corporation | | | 2,300 | | | | 391,807 | | | | 0.71 | |
MISUMI Group, Inc. | | | 44,600 | | | | 1,107,455 | | | | 2.02 | |
| | | | | | | | 1,499,262 | | | | 2.73 | |
Integrated Telecommunication Services | | | | |
Cellnex Telecom SA | | | 29,512 | | | | 866,029 | | | | 1.58 | |
Orange S.A. | | | 59,210 | | | | 963,073 | | | | 1.75 | |
| | | | | | | | 1,829,102 | | | | 3.33 | |
Interactive Home Entertainment | | | | | | | | |
Nintendo Co., Ltd. | | | 2,800 | | | | 797,329 | | | | 1.45 | |
| | | | | | | | | | | | | |
Interactive Media & Services | | | | | | | | |
Facebook, Inc. - Cl. A* | | | 9,699 | | | | 1,616,726 | | | | 2.94 | |
Scout24 A.G. | | | 21,100 | | | | 1,092,558 | | | | 1.99 | |
Tencent Holdings Ltd. | | | 47,100 | | | | 2,166,014 | | | | 3.95 | |
| | | | | | | | 4,875,298 | | | | 8.88 | |
Internet & Direct Marketing Retail | | | | | | | | |
Alibaba Group Holding Ltd. Spon. ADR* | | | 13,750 | | | | 2,508,687 | | | | 4.57 | |
MakeMyTrip Ltd.* | | | 13,173 | | | | 363,575 | | | | 0.66 | |
ZOZO, Inc. | | | 22,900 | | | | 431,015 | | | | 0.78 | |
| | | | | | | | 3,303,277 | | | | 6.01 | |
IT Consulting & Other Services | | | | | | | | |
Capgemini S.E. | | | 3,450 | | | | 418,351 | | | | 0.76 | |
InterXion Holding N.V.* | | | 28,311 | | | | 1,889,193 | | | | 3.44 | |
| | | | | | | | 2,307,544 | | | | 4.20 | |
Life & Health Insurance | | | | | | | | | | | | |
AIA Group Ltd. | | | 54,200 | | | | 539,587 | | | | 0.98 | |
| | | | | | | | | | | | | |
Life Sciences Tools & Services | | | | | | | | |
Eurofins Scientific S.E. | | | 1,789 | | | | 740,513 | | | | 1.35 | |
QIAGEN N.V.* | | | 17,787 | | | | 723,575 | | | | 1.32 | |
| | | | | | | | 1,464,088 | | | | 2.67 | |
Packaged Foods & Meats | | | | | | | | | | | | |
Nestlé S.A. | | | 14,704 | | | | 1,401,365 | | | | 2.55 | |
| | | | | | | | | | | | | |
Personal Products | | | | | | | | | | | | |
Unilever PLC | | | 16,717 | | | | 956,926 | | | | 1.74 | |
| See notes to financial statements. |
26
| | | Number
of
Shares | | | Value | | | Percent
of Net
Assets | |
COMMON STOCKS(continued) | | | | | | | | |
Pharmaceuticals | | | | | | | | | | | | |
AstraZeneca PLC | | | 6,864 | | | $ | 548,470 | | | | 1.00% | |
Bayer A.G. | | | 12,362 | | | | 798,744 | | | | 1.45 | |
Dechra Pharmaceuticals PLC | | | 27,136 | | | | 953,561 | | | | 1.74 | |
GW Pharmaceuticals PLC ADR* | | | 2,736 | | | | 461,208 | | | | 0.84 | |
Novartis AG | | | 10,117 | | | | 973,142 | | | | 1.77 | |
Takeda Pharmaceutical Company Ltd. | | | 9,700 | | | | 395,684 | | | | 0.72 | |
| | | | | | | | 4,130,809 | | | | 7.52 | |
Real Estate Operating Companies | | | | | | | | |
Aroundtown S.A. | | | 195,167 | | | | 1,609,125 | | | | 2.93 | |
| | | | | | | | | | | | | |
Research & Consulting Services | | | | | | | | |
Experian PLC | | | 10,864 | | | | 294,175 | | | | 0.54 | |
| | | | | | | | | | | | | |
Restaurants | | | | | | | | | | | | |
Domino's Pizza Enterprises Ltd. | | | 21,623 | | | | 666,645 | | | | 1.22 | |
Domino's Pizza Group PLC | | | 216,504 | | | | 682,405 | | | | 1.24 | |
| | | | | | | | 1,349,050 | | | | 2.46 | |
Semiconductor Equipment | | | | | | | | | | | | |
ASML Holding N.V. | | | 10,028 | | | | 1,880,818 | | | | 3.42 | |
Tokyo Electron Ltd. | | | 2,800 | | | | 404,223 | | | | 0.74 | |
| | | | | | | | 2,285,041 | | | | 4.16 | |
Specialty Chemicals | | | | | | | | | | | | |
Shin-Etsu Chemical Company Ltd. | | | 6,100 | | | | 510,764 | | | | 0.93 | |
| | | | | | | | | | | | | |
Wireless Telecommunication Services | | | | |
SoftBank Group Corporation | | | 5,800 | | | | 562,312 | | | | 1.02 | |
| | | | | | | | | | | | | |
TOTAL COMMON STOCKS | | | | | | | | | | | | |
(Cost $45,117,829) | | | | | | | 51,375,698 | | | | 93.53 | |
| | | | | | | | | | | | | |
SHORT-TERM INVESTMENTS | | | | | | | | |
State Street Institutional Treasury Money Market Fund, 0.019% | | | 3,719,593 | | | | 3,719,593 | | | | 6.77 | |
| | | | | | | | | | | | | |
TOTAL SHORT-TERM INVESTMENTS | | | | | | | | |
(Cost $3,719,593) | | | | | | | 3,719,593 | | | | 6.77 | |
| | | | | | | | | | | | | |
TOTAL INVESTMENTS | | | | | | | | | | | | |
(Cost $48,837,422) | | | | | | | 55,095,291 | | | | 100.30 | |
| | | | | | | | | | | | | |
Liabilities, Less Cash and Other Assets | | | | | | | (167,188 | ) | | | (0.30) | |
| | | | | | | | | | | | | |
NET ASSETS | | | | | | $ | 54,928,103 | | | | 100.00% | |
| | | | | | |
SUMMARY OF INVESTMENTS BY COUNTRY |
Country | | Market Value | | | Percent of
Investment
Securities | |
Australia | | $ | 1,310,563 | | | | 2.38% | |
Austria | | | 547,473 | | | | 0.99 | |
Belgium | | | 840,969 | | | | 1.53 | |
Brazil | | | 611,238 | | | | 1.11 | |
Canada | | | 1,104,289 | | | | 2.01 | |
China/Hong Kong | | | 5,214,288 | | | | 9.46 | |
France | | | 4,171,937 | | | | 7.57 | |
Germany | | | 6,432,602 | | | | 11.67 | |
India | | | 1,142,490 | | | | 2.07 | |
Ireland | | | 1,405,500 | | | | 2.55 | |
Japan | | | 7,151,957 | | | | 12.99 | |
Mexico | | | 402,218 | | | | 0.73 | |
Netherlands | | | 6,929,684 | | | | 12.57 | |
Spain | | | 866,029 | | | | 1.57 | |
Switzerland | | | 3,396,689 | | | | 6.16 | |
United Kingdom | | | 6,563,736 | | | | 11.93 | |
United States(1) | | | 7,003,629 | | | | 12.71 | |
| | | $ | 55,095,291 | | | | 100.00% | |
(1) | Includes short-term securities. |
| See notes to financial statements. |
27
INVESTMENT REVIEW BY TOM MARSICO, BRANDON GEISLER, AND ROB SUSMAN (UNAUDITED)
The Marsico Global Fund posted a total return of (US$) -7.66% for the six-month fiscal period ended March 31, 2019. The Fund underperformed the MSCI All Country World Index (“MSCI ACWI Index”), the Fund’s benchmark index, which had a total return of (US$) -2.13% over the same time period. Please see the Fund’s Overview for more detailed information about the Fund’s longer-term performance for various time periods ended March 31, 2019.
The performance data for the Fund quoted here represent past performance, and past performance is not a guarantee of future results. Investment return and principal value of an investment will fluctuate so that an investor’s shares, when redeemed, may be worth more or less than their original cost. Current performance may be lower or higher than the performance information quoted. To obtain performance information current to the most recent month-end, please call 888-860-8686 or visit marsicofunds.com.(1)
This review highlights Fund performance over a six-month fiscal period. Shareholders should keep in mind that the Fund is intended for long-term investors who hold their shares for substantially longer periods of time. You should also keep in mind that our current views and beliefs regarding all investments discussed in this report are subject to change at any time. References to specific securities, industries, and sectors discussed in this report are not recommendations to buy or sell such securities or related investments, and the Fund may not necessarily hold these securities or investments today. Please see the accompanying Schedule of Investments for the percentage of the Fund’s portfolio represented by the securities mentioned in this report as of the end of the reporting period.
Foreign investments present additional risks due to currency fluctuations, economic and political factors, lower liquidity, differences in securities regulations and accounting standards, possible changes in taxation, limited public information, and other factors. In addition, the Fund is subject to broad risks associated with investing in equity securities markets generally, including the risks that the securities and markets in which it invests may experience volatility and instability, that domestic and global economies and markets may undergo periods of cyclical change and decline, that investors may at times avoid investments in equity securities, and that investments may not perform as anticipated. Please see the Prospectus for more information.
The Fund is not managed to track its benchmark index, and may hold a substantially overweight or underweight position in a sector, industry, or security compared to its weight in the benchmark. The Fund may be subject to risks associated with a particular sector or other area in which it is overweight, including the risk that the stocks of companies within one area could simultaneously decline in price because of an event that affects the entire area. For informational purposes, the discussion below may compare the benchmark weight or performance of a sector or industry to the investment approach of the Fund.
The Global Fund’s underperformance during the six-month period ended March 31, 2019 versus the MSCI ACWI Index was primarily attributable to certain stocks in the Communication Services, Health Care and Information Technology sectors as defined in the Global Industry Classification Standard (“GICS”).
A position in the Communication Services sector did not perform as we anticipated and was sold during the period. Match Group, Inc. (-37% prior to being sold) participated in the late 2018 market sell-off of high-growth companies as the market pivoted to perceived safer assets. We exited the position to reduce our overall exposure to these types of securities given the uncertainty about Federal Reserve interest rate policy we experienced in late 2018.
In the Information Technology sector, German payment processor Wirecard A.G. declined -42% and was sold from the Fund. The UK’s Financial Times published a series of reports accusing Wirecard’s Asian operations of accounting irregularities, and suggested that Wirecard’s upper management was aware of the issues. A Singapore-based law firm found some very minor misstatements that amount to less than 1% of Wirecard’s revenues in each of the impacted years, 2016 and 2017, but found no evidence that management in Germany knew of the minor misstatements. However, because of the history of attacks on Wirecard, we exited the position. We still like Wirecard as a very unique asset exposed to the growing space of online payment processing, but we will remain on the sidelines until we get more clarity on the company’s Asian operations.
In addition, we sold a position in G1 Therapeutics, Inc. (-64% prior to being sold) as the regulatory pathway for the company’s lead oncology molecule, trilaciclib, remains uncertain. Although trilaciclib did show a reduction in the harmful side effects of chemotherapy, questions remain regarding the timing of the Food and Drug Administration’s approval as it is now believed that the company will need additional clinical work prior to approval.
The Fund’s performance was slightly inhibited by having little or no allocation to the Utilities and Consumer Staples sectors and an underweight stance to the Real Estate sector, which together were the strongest-performing sectors of the MSCI ACWI Index. As volatility increased during the period and bond yields dropped, investors sought the defensive characteristics and yields of stocks in these sectors.
Several new positions entered the portfolio during the six-month period, one of which was the Walt Disney Company (-3%). The Fund purchased Disney shares because the company is in the midst of a massive transition to a media-driven direct-to-consumer business model by taking majority ownership of 21st Century Fox and Hulu, and introducing its new Disney+ streaming service in the fall of 2019. We have witnessed other large iconic brands make analogous shifts to direct-to-consumer models, such as most notably, Nike, and while the transition can be difficult, we believe it will create incremental shareholder value as the market ascribes a higher value to direct revenue and profits over time. The average upward revision of the stocks of Nike, Microsoft and Walmart during their respective transitions to direct-to-consumer models was 45%.
28
The Fund’s top positive contributor for the six-month period was Chinese conglomerate Alibaba Group Holding Ltd. Spon. ADR, which returned +9%. The company’s goal is to remove friction from the flow of commerce globally, which it strives to do by providing virtually every type of electronic infrastructure that businesses need to compete, including online marketplaces, technology infrastructure, best-in-class mobile payments systems, content marketing, and logistics/distribution. Alibaba has over 600 million active users, yet it remains one of the most under-monetized platform businesses. Despite having double the user base of Amazon, the company has only approximately 20% of Amazon’s revenues. We believe the company will close that gap, and could grow its revenues above 30% per year for the next several years.
Airbus SE, a commercial aircraft manufacturer that supplies airplanes to customers globally, performed well and returned +5%. Rising travel demand from emerging markets, particularly China and India, have supported increased production rates resulting in higher revenues. Higher production rates also have benefitted Airbus as economies of scale have resulted in higher operating profits.
Australian software company Atlassian Corporation PLC – Cl. A (+17%) has a dominant position among software development teams with a suite of developer products that improves collaboration and speeds time-to-market for new software. These value propositions have positioned Atlassian for strong revenue growth, with additional support on the back of: 1) continued expansion of the customer base, 2) further penetration into businesses of existing customers, and 3) exertion of pricing power with incremental price hikes. Combining this durable growth engine with one of the most efficient distribution models in software has made the company very strong.
From a sector allocation perspective, the Fund benefitted by maintaining a +6% average cash weight during the very volatile six-month period. The Fund occasionally may hold more cash than usual as a temporary defensive measure, or as a strategic measure enabling it to take rapid advantage of opportunities to buy stocks at favorable prices. The Fund’s performance also was aided relative to the benchmark index by having an underweight allocation in the Financials sector and no allocation to the Energy sector, which were the two weakest performing sectors during the period.
Although active currency management is not a central facet of the Fund’s investment process, fluctuations in major world currencies can at times affect the Fund’s performance. During the period, the net effect of currency moves had a slightly negative effect on Fund performance, as the US dollar appreciated modestly against some other currencies in which certain foreign stocks are priced.
During the period, the Fund increased its allocations to the Information Technology, Financials, Industrials, Real Estate, and Materials sectors. The Fund reduced its position in the Communication Services and Consumer Discretionary sectors. The Fund had limited exposure to the Consumer Staples sector intra-period but liquidated its position held within the sector prior to period end. There was no significant change to the Fund’s allocation to the Health Care sector. Please note that GICS sectors were reconstituted on October 1, 2018, and that the beginning sector values for the Fund have been recalculated in accordance with the reconstitution for purposes of the foregoing paragraph.(2)
Fiscal Period-End Investment Posture
As of March 31, 2019, the Fund’s primary economic sector allocations were to Information Technology, Consumer Discretionary, Communication Services and Health Care. The Fund had no investments in the Consumer Staples, Energy or Utilities sectors.
The Fund’s most significant country allocation weightings at period-end, excluding short-term investments, were in the United States, the Netherlands, China/Hong Kong, France, Germany, and Australia. Country-level weightings generally should be considered a residual of the Fund’s stock selection process rather than a major, proactive facet of its investment strategy.
Sincerely,
THOMAS F. MARSICO
BRANDON A. GEISLER
ROBERT G. SUSMAN, CFA
PORTFOLIO MANAGERS
(1) | Total returns are based on net change in net asset value assuming reinvestment of distributions. Periodically, certain fees and expenses have been waived or reimbursed by the Adviser for the Global Fund. In the absence of such a waiver or reimbursement, the performance returns reflected would have been reduced. In accordance with the expense limitation and fee waiver agreement, the Adviser may recoup fees and expenses previously waived or reimbursed under certain parameters. Periodically, the Adviser has recouped such fees or expenses from the Global Fund, resulting in a lower performance return. Please see the Prospectus for more information. |
(2) | Through September 30, 2018, the Funds reported certain investments as having been classified within the Information Technology, Consumer Discretionary or Telecommunication Services sectors. Effective October 1, 2018, GICS reconstituted those sectors by reclassifying certain stocks formerly included in them into other sectors based on their business characteristics. For example, investments in telecommunication services companies (previously included in the Telecommunication Services sector) as well as certain companies that offer content through various media platforms (previously included in the Information Technology or Consumer Discretionary sectors) are now reported in the broadened GICS Communication Services sector. Additionally, certain e-commerce companies (previously included in the Information Technology sector) are now reported In the Consumer Discretionary sector. References to investment sector exposure included throughout this semi-annual report reflect the impact of these changes. |
29
March 31, 2019 (Unaudited)
The Global Fund is a diversified portfolio and invests primarily in the common stocks of US and foreign companies that are selected for their long-term growth potential. The Fund may invest in an unlimited number of companies of any size that are economically tied to any countries or markets throughout the world, including securities of companies economically tied to emerging markets. Under normal market conditions, the Fund will invest significantly (generally, at least 40% of its net assets) in the securities of issuers organized or located outside the US or doing business outside the US or other foreign securities (unless market conditions are not deemed favorable by the Adviser, in which case the Fund generally will invest at least 30% of its assets in such foreign securities). The Fund will invest its assets in various regions and countries, including the US, that encompass not less than three different countries overall.
TOTAL ANNUAL OPERATING EXPENSES**1.65% NET EXPENSES**†1.45% | NET ASSETS$239,247,256 | NET ASSET VALUE PER SHARE$15.67 |
GROWTH OF $10,000(1)(2) | PERFORMANCE COMPARISON |
| | Average Annualized Returns |
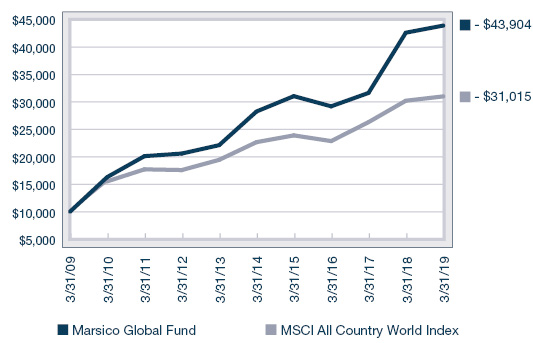
| 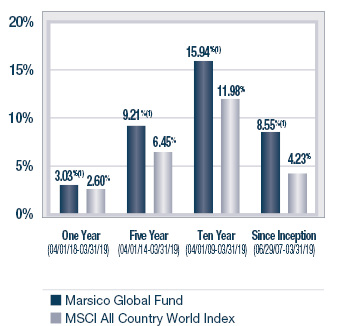
|
SECTOR ALLOCATION(3) | TOP FIVE HOLDINGS |
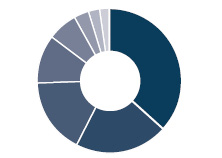 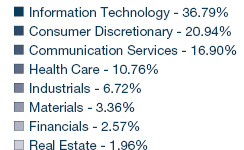
| | | | |
| | Amazon.com, Inc. | 5.39% | |
| | Alibaba Group Holding Ltd. Spon. ADR | 5.19% | |
| | Airbus SE | 5.03% | |
| | Alphabet, Inc. - Cl. A | 4.65% | |
| | Apple, Inc. | 4.38% | |
| | | | |
* | The Total Annual Operating Expenses and Net Expenses are reflective of the information disclosed in the Funds’ Prospectus dated February 1, 2019, as supplemented, and may differ from the expense ratios disclosed in this report. |
† | Marsico Capital Management, LLC (the “Adviser”) has entered into a written expense limitation and fee waiver agreement under which it has agreed to limit the total expenses of the Global Fund (excluding taxes, interest, acquired fund fees and expenses, litigation, extraordinary expenses, brokerage and other transaction expenses relating to the purchase or sale of portfolio investments) to an annual rate of 1.45% of the Fund’s average net assets until January 31, 2020. This expense limitation and fee waiver agreement may be terminated by the Adviser at any time after January 31, 2020 upon 15 days prior notice to the Fund and its administrator. The Adviser may recoup from the Fund fees previously waived or expenses previously reimbursed by the Adviser with respect to that Fund pursuant to this agreement (or a previous expense limitation agreement) if: (1) such recoupment by the Adviser does not cause the Fund, at the time of recoupment, to exceed the lesser of (a) the expense limitation in effect at the time the relevant amount was waived and/or reimbursed, or (b) the expense limitation in effect at the time of the proposed recoupment, and (2) the recoupment is made within three years after the fiscal year end date as of which the amount to be waived or reimbursed was determined and the waiver or reimbursement occurred. |
| The performance data quoted here represent past performance, and past performance is not a guarantee of future results. Investment return and principal value of an investment will fluctuate so that an investor’s shares, when redeemed, may be worth more or less than their original cost. Current performance may be lower or higher than the performance information quoted. To obtain performance information current to the most recent month-end, please call 888-860-8686 or visit marsicofunds.com. |
| The performance included in the chart and graph does not reflect the deduction of taxes on Fund distributions or the redemption of Fund shares. |
| All indices are unmanaged and investors cannot invest directly in an index. |
| The MSCI ACWI (All Country World Index) Index is a free float-adjusted market capitalization index that is designed to measure equity market performance in the global developed and emerging markets. |
(1) | Periodically, certain fees and expenses have been waived or reimbursed by the Adviser for the Global Fund. In the absence of such a waiver or reimbursement, the performance returns reflected would have been reduced. In accordance with the expense limitation and fee waiver agreement, the Adviser may recoup fees and expenses previously waived or reimbursed under certain parameters. Periodically, the Adviser has recouped such fees or expenses from the Global Fund, resulting in a lower performance return. |
(2) | This chart assumes an initial investment of $10,000 made on March 31, 2009. Total returns are based on change in NAV, assuming reinvestment of distributions. |
(3) | Sector weightings represent the percentage of the Fund’s investments (excluding cash equivalents) in certain general sectors. These sectors may include more than one industry. The Fund’s portfolio composition is subject to change at any time. |
30
MARSICO GLOBAL FUND
SCHEDULE OF INVESTMENTS
March 31, 2019 (Unaudited)
| | | Number
of
Shares | | | Value | | | Percent
of Net
Assets | |
COMMON STOCKS | | | | | | | | | | | | |
Aerospace & Defense | | | | | | | | | | | | |
Airbus SE | | | 90,932 | | | $ | 12,026,153 | | | | 5.03% | |
Lockheed Martin Corporation | | | 12,513 | | | | 3,755,902 | | | | 1.57 | |
| | | | | | | | 15,782,055 | | | | 6.60 | |
Apparel, Accessories & Luxury Goods | | | | |
Hermes International | | | 14,956 | | | | 9,868,171 | | | | 4.12 | |
| | | | | | | | | | | | | |
Application Software | | | | | | | | | | | | |
Atlassian Corporation PLC - Cl. A* | | | 48,646 | | | | 5,467,324 | | | | 2.28 | |
salesforce.com, inc.* | | | 52,842 | | | | 8,368,587 | | | | 3.50 | |
SAP S.E. | | | 63,509 | | | | 7,337,848 | | | | 3.07 | |
| | | | | | | | 21,173,759 | | | | 8.85 | |
Asset Management & Custody Banks | | | | |
Burford Capital Ltd. | | | 103,752 | | | | 2,278,321 | | | | 0.95 | |
| | | | | | | | | | | | | |
Communications Equipment | | | | | | | | |
Telefonaktiebolaget LM Ericsson B Shares | | | 858,849 | | | | 7,890,773 | | | | 3.30 | |
| | | | | | | | | | | | | |
Data Processing & Outsourced Services | | | | |
PayPal Holdings, Inc.* | | | 35,999 | | | | 3,738,136 | | | | 1.56 | |
Visa, Inc. - Cl. A | | | 59,986 | | | | 9,369,214 | | | | 3.92 | |
| | | | | | | | 13,107,350 | | | | 5.48 | |
Financial Exchanges & Data | | | | | | | | |
S&P Global, Inc. | | | 17,842 | | | | 3,756,633 | | | | 1.57 | |
| | | | | | | | | | | | | |
Health Care Equipment | | | | | | | | | | | | |
Intuitive Surgical, Inc.* | | | 15,187 | | | | 8,665,399 | | | | 3.62 | |
Koninklijke Philips N.V. | | | 179,063 | | | | 7,294,375 | | | | 3.05 | |
| | | | | | | | 15,959,774 | | | | 6.67 | |
Hotels, Resorts & Cruise Lines | | | | | | | | |
Marriott International, Inc. - Cl. A | | | 28,613 | | | | 3,579,200 | | | | 1.50 | |
| | | | | | | | | | | | | |
Interactive Media & Services | | | | | | | | |
Alphabet, Inc. - Cl. A* | | | 9,458 | | | | 11,131,026 | | | | 4.65 | |
Facebook, Inc. - Cl. A* | | | 59,005 | | | | 9,835,543 | | | | 4.11 | |
Tencent Holdings Ltd. | | | 211,400 | | | | 9,721,769 | | | | 4.07 | |
| | | | | | | | 30,688,338 | | | | 12.83 | |
Internet & Direct Marketing Retail | | | | | | | | |
Alibaba Group Holding Ltd. Spon. ADR* | | | 68,036 | | | | 12,413,168 | | | | 5.19 | |
Amazon.com, Inc.* | | | 7,243 | | | | 12,897,972 | | | | 5.39 | |
| | | | | | | | 25,311,140 | | | | 10.58 | |
IT Consulting & Other Services | | | | | | | | |
InterXion Holding N.V.* | | | 149,009 | | | | 9,943,371 | | | | 4.16 | |
| | | | | | | | | | | | | |
Managed Health Care | | | | | | | | | | | | |
UnitedHealth Group, Inc. | | | 24,412 | | | | 6,036,111 | | | | 2.52 | |
| | | | | | | | | | | | | |
Movies & Entertainment | | | | | | | | | | | | |
Netflix, Inc.* | | | 15,780 | | | | 5,626,517 | | | | 2.35 | |
The Walt Disney Company | | | 30,474 | | | | 3,383,528 | | | | 1.41 | |
| | | | | | | | 9,010,045 | | | | 3.76 | |
Pharmaceuticals | | | | | | | | | | | | |
GW Pharmaceuticals PLC ADR* | | | 19,405 | | | | 3,271,101 | | | | 1.37 | |
| | | | | | | | |
Real Estate Operating Companies | | | | | | | | |
Aroundtown S.A. | | | 558,446 | | | | 4,604,312 | | | | 1.92% | |
| | | | | | | | | | | | | |
Restaurants | | | | | | | | | | | | |
Domino's Pizza, Inc. | | | 22,446 | | | | 5,793,312 | | | | 2.42 | |
McDonald's Corporation | | | 24,414 | | | | 4,636,219 | | | | 1.94 | |
| | | | | | | | 10,429,531 | | | | 4.36 | |
Semiconductor Equipment | | | | | | | | |
ASML Holding N.V. - NY Reg. Shs. | | | 38,763 | | | | 7,289,382 | | | | 3.05 | |
| | | | | | | | | | | | | |
Semiconductors | | | | | | | | | | | | |
NVIDIA Corporation | | | 39,132 | | | | 7,026,542 | | | | 2.94 | |
| | | | | | | | | | | | | |
Specialty Chemicals | | | | | | | | | | | | |
The Sherwin-Williams Company | | | 18,285 | | | | 7,875,532 | | | | 3.29 | |
| | | | | | | | | | | | | |
Systems Software | | | | | | | | | | | | |
Microsoft Corporation | | | 80,494 | | | | 9,493,462 | | | | 3.97 | |
| | | | | | | | | | | | | |
Technology Hardware, Storage & Peripherals | | | | |
Apple, Inc. | | | 55,228 | | | | 10,490,559 | | | | 4.38 | |
| | | | | | | | | | | | | |
TOTAL COMMON STOCKS | | | | | | | | | | | | |
(Cost $188,157,136) | | | | | | | 234,865,462 | | | | 98.17 | |
| | | | | | | | | | | | | |
SHORT-TERM INVESTMENTS | | | | | | | | |
State Street Institutional Treasury Money Market Fund, 0.019% | | | 4,752,862 | | | | 4,752,862 | | | | 1.99 | |
| | | | | | | | | | | | | |
TOTAL SHORT-TERM INVESTMENTS | | | | | | | | |
(Cost $4,752,862) | | | | | | | 4,752,862 | | | | 1.99 | |
| | | | | | | | | | | | | |
TOTAL INVESTMENTS | | | | | | | | | | | | |
(Cost $192,909,998) | | | | | | | 239,618,324 | | | | 100.16 | |
| | | | | | | | | | | | | |
Liabilities, Less Cash and Other Assets | | | | | | | (371,068 | ) | | | (0.16) | |
| | | | | | | | | | | | | |
NET ASSETS | | | | | | $ | 239,247,256 | | | | 100.00% | |
SUMMARY OF INVESTMENTS BY COUNTRY |
Country | | Market Value | | | Percent of
Investment
Securities | |
Australia | | $ | 5,467,324 | | | | 2.28% | |
China/Hong Kong | | | 22,134,937 | | | | 9.24 | |
France | | | 21,894,324 | | | | 9.14 | |
Germany | | | 11,942,160 | | | | 4.98 | |
Netherlands | | | 24,527,128 | | | | 10.24 | |
Sweden | | | 7,890,773 | | | | 3.29 | |
United Kingdom | | | 3,271,101 | | | | 1.37 | |
United States(1) | | | 142,490,577 | | | | 59.46 | |
| | | $ | 239,618,324 | | | | 100.00% | |
(1) | Includes short-term securities. |
| See notes to financial statements. |
31
STATEMENTS OF ASSETS AND LIABILITIES
March 31, 2019 (Unaudited)
(Amounts in thousands) | | MARSICO
FOCUS FUND | | | MARSICO
GROWTH FUND | |
| | | | | | | | | |
ASSETS | | | | | | | | |
Investments, at value (cost $371,825, $165,805, $224,939, $48,837, and $192,910, respectively) | | $ | 567,697 | | | $ | 259,853 | |
Receivable for capital stock sold | | | 34 | | | | 7 | |
Dividends receivable | | | 105 | | | | 20 | |
Prepaid expenses and other assets | | | 3,169 | | | | 1,135 | |
Total Assets | | | 571,005 | | | | 261,015 | |
| | | | | | | | | |
LIABILITIES | | | | | | | | |
Payable for investments purchased | | | — | | | | — | |
Payable for capital stock redeemed | | | 262 | | | | 92 | |
Payable to investment adviser | | | 364 | | | | 173 | |
Accrued trustees’ fees | | | 3,163 | | | | 1,121 | |
Accrued distribution fee | | | 2,656 | | | | 1,019 | |
Accrued transfer agent fees and expenses | | | 96 | | | | 53 | |
Accrued professional fees | | | 96 | | | | 47 | |
Accrued reporting, printing and postage expenses | | | 36 | | | | 16 | |
Accrued expenses and other liabilities | | | 40 | | | | 27 | |
Total Liabilities | | | 6,713 | | | | 2,548 | |
| | | | | | | | | |
NET ASSETS | | $ | 564,292 | | | $ | 258,467 | |
| | | | | | | | | |
NET ASSETS CONSIST OF | | | | | | | | |
Paid-in-capital | | $ | 350,613 | | | $ | 155,717 | |
Total distributable earnings | | | 213,679 | | | | 102,750 | |
NET ASSETS | | $ | 564,292 | | | $ | 258,467 | |
| | | | | | | | | |
SHARES OUTSTANDING, $0.001 par value | | | | | | | | |
(Unlimited shares authorized) | | | 31,579 | | | | 14,452 | |
| | | | | | | | | |
NET ASSET VALUE, REDEMPTION PRICE, AND OFFERING PRICE PER SHARE (NET ASSETS/SHARES OUTSTANDING)* | | $ | 17.87 | | | $ | 17.88 | |
* | Not in thousands, based on unrounded net assets and shares outstanding. |
| See notes to financial statements. |
32
| | MARSICO
21st CENTURY FUND | | | MARSICO
INTERNATIONAL
OPPORTUNITIES
FUND | | | MARSICO
GLOBAL FUND | |
| | | | | | | | | | | | |
| | | | | | | | | | | | |
| | $ | 274,695 | | | $ | 55,095 | | | $ | 239,618 | |
| | | 64 | | | | 23 | | | | 109 | |
| | | 216 | | | | 149 | | | | 101 | |
| | | 376 | | | | 203 | | | | 1,931 | |
| | | 275,351 | | | | 55,470 | | | | 241,759 | |
| | | | | | | | | | | | |
| | | | | | | | | | | | |
| | | 8,168 | | | | 160 | | | | — | |
| | | 59 | | | | 7 | | | | 154 | |
| | | 178 | | | | 23 | | | | 151 | |
| | | 364 | | | | 190 | | | | 1,914 | |
| | | 194 | | | | 118 | | | | 147 | |
| | | 55 | | | | 18 | | | | 77 | |
| | | 43 | | | | 11 | | | | 42 | |
| | | 13 | | | | 1 | | | | 9 | |
| | | 26 | | | | 14 | | | | 18 | |
| | | 9,100 | | | | 542 | | | | 2,512 | |
| | | | | | | | | | | | |
| | $ | 266,251 | | | $ | 54,928 | | | $ | 239,247 | |
| | | | | | | | | | | | |
| | | | | | | | | | | | |
| | $ | 229,451 | | | $ | 53,451 | | | $ | 202,539 | |
| | | 36,800 | | | | 1,477 | | | | 36,708 | |
| | $ | 266,251 | | | $ | 54,928 | | | $ | 239,247 | |
| | | | | | | | | | | | |
| | | | | | | | | | | | |
| | | 8,422 | | | | 3,132 | | | | 15,265 | |
| | | | | | | | | | | | |
| | $ | 31.61 | | | $ | 17.54 | | | $ | 15.67 | |
33
STATEMENTS OF OPERATIONS
FOR THE SIX-MONTH PERIOD ENDED March 31, 2019 (Unaudited)
(Amounts in thousands) | | MARSICO
FOCUS FUND | | | MARSICO
GROWTH FUND | |
| | | | | | | | | |
INVESTMENT INCOME | | | | | | | | |
Dividends (net of $0, $0, $20, $21, and $39, respectively, of non-reclaimable foreign withholding taxes) | | $ | 2,285 | | | $ | 1,087 | |
Total Investment Income | | | 2,285 | | | | 1,087 | |
| | | | | | | | | |
EXPENSES | | | | | | | | |
Investment advisory fees | | | 2,064 | | | | 1,005 | |
Distribution fees | | | — | | | | 103 | |
Transfer agent fees and expenses | | | 206 | | | | 108 | |
Professional fees | | | 155 | | | | 75 | |
Fund administration fees | | | 79 | | | | 64 | |
Custody and fund accounting fees | | | 65 | | | | 44 | |
Reporting, printing, and postage expenses | | | 50 | | | | 27 | |
Miscellaneous | | | 44 | | | | 23 | |
Federal and state registration fees | | | 15 | | | | 15 | |
Trustees’ fees and expenses | | | (39 | )(1) | | | (3 | )(1) |
Total Expenses | | | 2,639 | | | | 1,461 | |
Recoupment of previously waived expenses | | | — | | | | — | |
Less waiver of expenses and expenses paid indirectly | | | — | | | | — | |
Net Expenses | | | 2,639 | | | | 1,461 | |
| | | | | | | | | |
NET INVESTMENT LOSS | | | (354 | ) | | | (374 | ) |
| | | | | | | | | |
REALIZED AND UNREALIZED GAIN (LOSS) | | | | | | | | |
Net realized gain (loss) on investments | | | 21,834 | | | | 10,750 | |
Net realized gain (loss) on foreign currency transactions | | | 30 | | | | 3 | |
Change in unrealized appreciation (depreciation) on investments, foreign currency translations, and non-interested trustees’ deferred compensation | | | (32,991 | ) | | | (17,596 | ) |
| | | | | | | | | |
Net Gain (Loss) on Investments | | | (11,127 | ) | | | (6,843 | ) |
| | | | | | | | | |
NET DECREASE IN NET ASSETS RESULTING FROM OPERATIONS | | $ | (11,481 | ) | | $ | (7,217 | ) |
(1) | Amounts include Trustees’ fees and expenses and the mark to market unrealized depreciation during the period for shares held in the Non-Interested Trustees’ Deferred Fee Plan, as more fully described in Note 2(g) in the Notes to Financial Statements. |
| | | Trustees’
Fees and
Expenses* | | | Unrealized
Depreciation* | |
Focus Fund | | $ | 66,142 | | | $ | (104,660 | ) |
Growth Fund | | | 32,207 | | | | (35,637 | ) |
21stCentury Fund | | | 30,328 | | | | (1,788 | ) |
International Opportunities Fund | | | 6,548 | | | | (13,997 | ) |
Global Fund | | | 30,124 | | | | (161,436 | ) |
| See notes to financial statements. |
34
| | MARSICO
21st CENTURY FUND | | | MARSICO
INTERNATIONAL
OPPORTUNITIES
FUND | | | MARSICO
GLOBAL FUND | |
| | | | | | | | | | | | |
| | | | | | | | | | | | |
| | $ | 907 | | | $ | 249 | | | $ | 910 | |
| | | 907 | | | | 249 | | | | 910 | |
| | | | | | | | | | | | |
| | | | | | | | | | | | |
| | | 988 | | | | 212 | | | | 950 | |
| | | 105 | | | | 66 | | | | 297 | |
| | | 119 | | | | 38 | | | | 176 | |
| | | 71 | | | | 18 | | | | 73 | |
| | | 64 | | | | 36 | | | | 74 | |
| | | 47 | | | | 62 | | | | 96 | |
| | | 26 | | | | 10 | | | | 26 | |
| | | 21 | | | | 6 | | | | 22 | |
| | | 10 | | | | 8 | | | | 13 | |
| | | 29 | (1) | | | (7 | )(1) | | | (131 | )(1) |
| | | 1,480 | | | | 449 | | | | 1,596 | |
| | | — | | | | — | | | | 124 | |
| | | — | | | | (51 | ) | | | — | |
| | | 1,480 | | | | 398 | | | | 1,720 | |
| | | | | | | | | | | | |
| | | (573 | ) | | | (149 | ) | | | (810 | ) |
| | | | | | | | | | | | |
| | | | | | | | | | | | |
| | | 1,255 | | | | 845 | | | | (4,616 | ) |
| | | — | | | | (233 | ) | | | (1,736 | ) |
| | | (746 | ) | | | (4,222 | ) | | | (16,531 | ) |
| | | | | | | | | | | | |
| | | 509 | | | | (3,610 | ) | | | (22,883 | ) |
| | | | | | | | | | | | |
| | $ | (64 | ) | | $ | (3,759 | ) | | $ | (23,693 | ) |
35
STATEMENTS OF CHANGES IN NET ASSETS
| | | MARSICO
FOCUS
FUND | | | | | | | MARSICO
GROWTH
FUND | | | | | |
| | | | | | | | | | | | | | | | | |
(Amounts in thousands) | | Six-Month
Period Ended
3/31/19
(Unaudited) | | | Year
Ended
9/30/18 | | | Six-Month
Period Ended
3/31/19
(Unaudited) | | | Year
Ended
9/30/18 | |
| | | | | | | | | | | | | | | | | |
OPERATIONS: | | | | | | | | | | | | | | | | |
Net investment loss | | $ | (354 | ) | | $ | (2,791 | ) | | $ | (374 | ) | | $ | (1,296 | ) |
Net realized gain (loss) on investments | | | 21,834 | | | | 53,497 | | | | 10,750 | | | | 30,322 | |
Net realized gain (loss) on foreign currency transactions | | | 30 | | | | 431 | | | | 3 | | | | 279 | |
Change in unrealized appreciation (depreciation) on investments, foreign currency translations, and non-interested trustees' deferred compensation | | | (32,991 | ) | | | 62,949 | | | | (17,596 | ) | | | 28,796 | |
| | | | | | | | | | | | | | | | | |
Net increase (decrease) in net assets resulting from operations | | | (11,481 | ) | | | 114,086 | | | | (7,217 | ) | | | 58,101 | |
| | | | | | | | | | | | | | | | | |
DISTRIBUTIONS: | | | (51,626 | ) | | | (87,734 | ) | | | (29,351 | ) | | | (25,153 | ) |
| | | | | | | | | | | | | | | | | |
CAPITAL SHARE TRANSACTIONS: | | | | | | | | | | | | | | | | |
Proceeds from sales of shares | | | 18,381 | | | | 42,040 | | | | 3,234 | | | | 40,238 | |
Proceeds from reinvestment of distributions | | | 49,333 | | | | 85,196 | | | | 28,064 | | | | 24,655 | |
Value of assets acquired in exchange for shares(1) | | | — | | | | — | | | | — | | | | — | |
Redemption of shares | | | (46,329 | ) | | | (107,231 | ) | | | (35,203 | ) | | | (65,823 | ) |
| | | | | | | | | | | | | | | | | |
Net increase (decrease) from capital share transactions | | | 21,385 | | | | 20,005 | | | | (3,905 | ) | | | (930 | ) |
| | | | | | | | | | | | | | | | | |
TOTAL INCREASE (DECREASE) IN NET ASSETS | | | (41,722 | ) | | | 46,357 | | | | (40,473 | ) | | | 32,018 | |
| | | | | | | | | | | | | | | | | |
NET ASSETS: | | | | | | | | | | | | | | | | |
Beginning of Period | | | 606,014 | | | | 559,657 | | | | 298,940 | | | | 266,922 | |
| | | | | | | | | | | | | | | | | |
End of Period | | $ | 564,292 | | | $ | 606,014 | | | $ | 258,467 | | | $ | 298,940 | |
| | | | | | | | | | | | | | | | | |
TRANSACTIONS IN SHARES: | | | | | | | | | | | | | | | | |
Shares sold | | | 1,100 | | | | 2,178 | | | | 186 | | | | 2,083 | |
Shares issued in reinvestment of distributions | | | 3,105 | | | | 4,953 | | | | 1,763 | | | | 1,391 | |
Shares issued for acquisition(1) | | | — | | | | — | | | | — | | | | — | |
Shares redeemed | | | (2,666 | ) | | | (5,608 | ) | | | (1,947 | ) | | | (3,475 | ) |
| | | | | | | | | | | | | | | | | |
NET INCREASE (DECREASE) | | | 1,539 | | | | 1,523 | | | | 2 | | | | (1 | ) |
(1) | Amounts relate to the reorganization of the Flexible Capital Fund with and into the Global Fund. Please refer to Note 4 for additional information. |
| See notes to financial statements. |
36
| | MARSICO
21st
CENTURY
FUND | | | MARSICO
INTERNATIONAL
OPPORTUNITIES FUND | | | MARSICO
GLOBAL
FUND | |
| | | | | | | | | | | | | | | | | | | | | | | | |
| | Six-Month
Period Ended
3/31/19
(Unaudited) | | | Year
Ended
9/30/18 | | | Six-Month
Period Ended
3/31/19
(Unaudited) | | | Year
Ended
9/30/18 | | | Six-Month
Period Ended
3/31/19
(Unaudited) | | | Year
Ended
9/30/18 | |
| | | | | | | | | | | | | | | | | | | | | | | | |
| | | | | | | | | | | | | | | | | | | | | | | | |
| | $ | (573 | ) | | $ | (1,858 | ) | | $ | (149 | ) | | $ | (227 | ) | | $ | (810 | ) | | $ | (785 | ) |
| | | 1,255 | | | | 76,404 | | | | 845 | | | | 6,541 | | | | (4,616 | ) | | | 3,415 | |
| | | — | | | | 151 | | | | (233 | ) | | | 288 | | | | (1,736 | ) | | | (22 | ) |
| | | (746 | ) | | | (15,070 | ) | | | (4,222 | ) | | | (3,447 | ) | | | (16,531 | ) | | | 16,268 | |
| | | | | | | | | | | | | | | | | | | | | | | | |
| | | (64 | ) | | | 59,627 | | | | (3,759 | ) | | | 3,155 | | | | (23,693 | ) | | | 18,876 | |
| | | | | | | | | | | | | | | | | | | | | | | | |
| | | (11,665 | ) | | | — | | | | (4,245 | ) | | | — | | | | (2,537 | ) | | | (4,068 | ) |
| | | | | | | | | | | | | | | | | | | | | | | | |
| | | | | | | | | | | | | | | | | | | | | | | | |
| | | 5,124 | | | | 5,584 | | | | 2,523 | | | | 8,760 | | | | 10,269 | | | | 26,439 | |
| | | 11,079 | | | | — | | | | 4,007 | | | | — | | | | 2,299 | | | | 3,948 | |
| | | — | | | | — | | | | — | | | | — | | | | — | | | | 218,657 | |
| | | (11,090 | ) | | | (26,666 | ) | | | (5,750 | ) | | | (13,552 | ) | | | (33,605 | ) | | | (21,831 | ) |
| | | | | | | | | | | | | | | | | | | | | | | | |
| | | 5,113 | | | | (21,082 | ) | | | 780 | | | | (4,792 | ) | | | (21,037 | ) | | | 227,213 | |
| | | | | | | | | | | | | | | | | | | | | | | | |
| | | (6,616 | ) | | | 38,545 | | | | (7,224 | ) | | | (1,637 | ) | | | (47,267 | ) | | | 242,021 | |
| | | | | | | | | | | | | | | | | | | | | | | | |
| | | | | | | | | | | | | | | | | | | | | | | | |
| | | 272,867 | | | | 234,322 | | | | 62,152 | | | | 63,789 | | | | 286,514 | | | | 44,493 | |
| | | | | | | | | | | | | | | | | | | | | | | | |
| | $ | 266,251 | | | $ | 272,867 | | | $ | 54,928 | | | $ | 62,152 | | | $ | 239,247 | | | $ | 286,514 | |
| | | | | | | | | | | | | | | | | | | | | | | | |
| | | | | | | | | | | | | | | | | | | | | | | | |
| | | 172 | | | | 185 | | | | 141 | | | | 422 | | | | 680 | | | | 1,619 | |
| | | 405 | | | | — | | | | 257 | | | | — | | | | 163 | | | | 274 | |
| | | — | | | | — | | | | — | | | | — | | | | — | | | | 13,188 | |
| | | (380 | ) | | | (907 | ) | | | (338 | ) | | | (655 | ) | | | (2,272 | ) | | | (1,328 | ) |
| | | | | | | | | | | | | | | | | | | | | | | | |
| | | 197 | | | | (722 | ) | | | 60 | | | | (233 | ) | | | (1,429 | ) | | | 13,753 | |
37
FINANCIAL HIGHLIGHTS
| | | MARSICO FOCUS FUND | |
For a Fund Share Outstanding Throughout the Period | | Six-Month
Period Ended
3/31/19
(Unaudited) | | | Year
Ended
9/30/18 | | | Year
Ended
9/30/17 | | | Year
Ended
9/30/16 | | | Year
Ended
9/30/15 | | | Year
Ended
9/30/14 | |
| | | | | | | | | | | | | | | | | | | | | | | | | |
Net Asset Value, Beginning of Period | | $ | 20.17 | | | $ | 19.63 | | | $ | 15.96 | | | $ | 18.83 | | | $ | 22.41 | | | $ | 21.47 | |
| | | | | | | | | | | | | | | | | | | | | | | | | |
| | | | | | | | | | | | | | | | | | | | | | | | | |
Income from Investment Operations: | | | | | | | | | | | | | | | | | | | | | | | | |
Net investment loss | | | — | (1) | | | (0.09 | ) | | | (0.17 | ) | | | (0.13 | ) | | | (0.10 | ) | | | (0.07 | ) |
Net realized and unrealized gains (losses) on investments | | | (0.51 | ) | | | 3.82 | | | | 3.84 | | | | 1.25 | | | | (0.62 | ) | | | 4.46 | |
| | | | | | | | | | | | | | | | | | | | | | | | | |
Total from investment operations | | | (0.51 | ) | | | 3.73 | | | | 3.67 | | | | 1.12 | | | | (0.72 | ) | | | 4.39 | |
| | | | | | | | | | | | | | | | | | | | | | | | | |
Distributions & Other: | | | | | | | | | | | | | | | | | | | | | | | | |
Net investment income | | | — | | | | — | | | | — | | | | — | | | | — | | | | — | |
Net realized gains | | | (1.79 | ) | | | (3.19 | ) | | | — | | | | (3.99 | ) | | | (2.86 | ) | | | (3.45 | ) |
| | | | | | | | | | | | | | | | | | | | | | | | | |
Total distributions and other | | | (1.79 | ) | | | (3.19 | ) | | | — | | | | (3.99 | ) | | | (2.86 | ) | | | (3.45 | ) |
| | | | | | | | | | | | | | | | | | | | | | | | | |
Net Asset Value, End of Period | | $ | 17.87 | | | $ | 20.17 | | | $ | 19.63 | | | $ | 15.96 | | | $ | 18.83 | | | $ | 22.41 | |
| | | | | | | | | | | | | | | | | | | | | | | | | |
| | | | | | | | | | | | | | | | | | | | | | | | | |
Total Return | | | (1.45 | )%(2) | | | 21.78 | % | | | 22.99 | % | | | 5.75 | % | | | (4.15 | )% | | | 22.27 | % |
| | | | | | | | | | | | | | | | | | | | | | | | | |
| | | | | | | | | | | | | | | | | | | | | | | | | |
Supplemental Data and Ratios: | | | | | | | | | | | | | | | | | | | | | | | | |
| | | | | | | | | | | | | | | | | | | | | | | | | |
Net assets, end of period (000s) | | $ | 564,292 | | | $ | 606,014 | | | $ | 559,657 | | | $ | 613,870 | | | $ | 788,851 | | | $ | 933,054 | |
| | | | | | | | | | | | | | | | | | | | | | | | | |
Ratio of expenses to average net assets, less waivers and before expenses paid indirectly, plus recoupment of previously waived fees or expenses paid | | | 0.98 | %(3) | | | 1.21 | % | | | 1.37 | % | | | 1.29 | % | | | 1.31 | % | | | 1.34 | % |
| | | | | | | | | | | | | | | | | | | | | | | | | |
Ratio of net investment loss to average net assets, net of waivers, recoupment of previously waived fees or expenses paid and expenses paid indirectly | | | (0.13 | )%(3) | | | (0.48 | )% | | | (0.62 | )% | | | (0.63 | )% | | | (0.45 | )% | | | (0.35 | )% |
| | | | | | | | | | | | | | | | | | | | | | | | | |
Ratio of expenses to average net assets, before waivers, recoupment of previously waived fees or expenses paid and expenses paid indirectly | | | 0.98 | %(3) | | | 1.21 | % | | | 1.37 | % | | | 1.29 | % | | | 1.31 | % | | | 1.34 | % |
| | | | | | | | | | | | | | | | | | | | | | | | | |
Ratio of net investment loss to average net assets, before waivers, recoupment of previously waived fees or expenses paid and expenses paid indirectly | | | (0.13 | )%(3) | | | (0.48 | )% | | | (0.62 | )% | | | (0.63 | )% | | | (0.45 | )% | | | (0.35 | )% |
| | | | | | | | | | | | | | | | | | | | | | | | | |
Portfolio turnover rate | | | 29 | %(2) | | | 53 | % | | | 67 | % | | | 45 | % | | | 68 | % | | | 71 | % |
| See notes to financial statements. |
38
| | MARSICO
GROWTH
FUND | | | MARSICO
21st
CENTURY FUND | |
| | Six-Month
Period Ended
3/31/19
(Unaudited) | | | Year
Ended
9/30/18 | | | Year
Ended
9/30/17 | | | Year
Ended
9/30/16 | | | Year
Ended
9/30/15 | | | Year
Ended
9/30/14 | | | Six-Month
Period Ended
3/31/19
(Unaudited) | | | Year
Ended
9/30/18 | | | Year
Ended
9/30/17 | | | Year
Ended
9/30/16 | | | Year
Ended
9/30/15 | | | Year
Ended
9/30/14 | |
| | | | | | | | | | | | | | | | | | | | | | | | | | | | | | | | | | | | | | | | | | | | | | | | |
| | $ | 20.69 | | | $ | 18.47 | | | $ | 15.54 | | | $ | 20.11 | | | $ | 23.63 | | | $ | 25.03 | | | $ | 33.18 | | | $ | 26.19 | | | $ | 22.04 | | | $ | 20.38 | | | $ | 20.90 | | | $ | 18.05 | |
| | | | | | | | | | | | | | | | | | | | | | | | | | | | | | | | | | | | | | | | | | | | | | | | |
| | | | | | | | | | | | | | | | | | | | | | | | | | | | | | | | | | | | | | | | | | | | | | | | |
| | | | | | | | | | | | | | | | | | | | | | | | | | | | | | | | | | | | | | | | | | | | | | | | |
| | | (0.03 | ) | | | (0.09 | ) | | | (0.14 | ) | | | (0.13 | ) | | | (0.15 | ) | | | (0.08 | ) | | | (0.06 | ) | | | (0.25 | ) | | | (0.29 | ) | | | (0.29 | ) | | | (0.21 | ) | | | (0.21 | ) |
| | | (0.58 | ) | | | 4.06 | | | | 3.19 | | | | 1.33 | | | | (0.62 | ) | | | 4.01 | | | | (0.08 | ) | | | 7.24 | | | | 4.44 | | | | 1.95 | | | | (0.31 | ) | | | 3.06 | |
| | | | | | | | | | | | | | | | | | | | | | | | | | | | | | | | | | | | | | | | | | | | | | | | |
| | | (0.61 | ) | | | 3.97 | | | | 3.05 | | | | 1.20 | | | | (0.77 | ) | | | 3.93 | | | | (0.14 | ) | | | 6.99 | | | | 4.15 | | | | 1.66 | | | | (0.52 | ) | | | 2.85 | |
| | | | | | | | | | | | | | | | | | | | | | | | | | | | | | | | | | | | | | | | | | | | | | | | |
| | | | | | | | | | | | | | | | | | | | | | | | | | | | | | | | | | | | | | | | | | | | | | | | |
| | | — | | | | — | | | | — | | | | — | | | | — | | | | (0.06 | ) | | | — | | | | — | | | | — | | | | — | | | | — | | | | — | |
| | | (2.20 | ) | | | (1.75 | ) | | | (0.12 | ) | | | (5.77 | ) | | | (2.75 | ) | | | (5.27 | ) | | | (1.43 | ) | | | — | | | | — | | | | — | | | | — | | | | — | |
| | | | | | | | | | | | | | | | | | | | | | | | | | | | | | | | | | | | | | | | | | | | | | | | |
| | | (2.20 | ) | | | (1.75 | ) | | | (0.12 | ) | | | (5.77 | ) | | | (2.75 | ) | | | (5.33 | ) | | | (1.43 | ) | | | — | | | | — | | | | — | | | | — | | | | — | |
| | | | | | | | | | | | | | | | | | | | | | | | | | | | | | | | | | | | | | | | | | | | | | | | |
| | $ | 17.88 | | | $ | 20.69 | | | $ | 18.47 | | | $ | 15.54 | | | $ | 20.11 | | | $ | 23.63 | | | $ | 31.61 | | | $ | 33.18 | | | $ | 26.19 | | | $ | 22.04 | | | $ | 20.38 | | | $ | 20.90 | |
| | | | | | | | | | | | | | | | | | | | | | | | | | | | | | | | | | | | | | | | | | | | | | | | |
| | | | | | | | | | | | | | | | | | | | | | | | | | | | | | | | | | | | | | | | | | | | | | | | |
| | | (1.63 | )%(2) | | | 23.10 | % | | | 19.85 | % | | | 5.94 | % | | | (4.10 | )% | | | 17.51 | % | | | 0.26 | %(2) | | | 26.69 | % | | | 18.83 | % | | | 8.15 | % | | | (2.49 | )% | | | 15.79 | % |
| | | | | | | | | | | | | | | | | | | | | | | | | | | | | | | | | | | | | | | | | | | | | | | | |
| | | | | | | | | | | | | | | | | | | | | | | | | | | | | | | | | | | | | | | | | | | | | | | | |
| | | | | | | | | | | | | | | | | | | | | | | | | | | | | | | | | | | | | | | | | | | | | | | | |
| | | | | | | | | | | | | | | | | | | | | | | | | | | | | | | | | | | | | | | | | | | | | | | | |
| | $ | 258,467 | | | $ | 298,940 | | | $ | 266,922 | | | $ | 288,213 | | | $ | 410,442 | | | $ | 562,653 | | | $ | 266,251 | | | $ | 272,867 | | | $ | 234,322 | | | $ | 234,780 | | | $ | 268,384 | | | $ | 316,293 | |
| | | | | | | | | | | | | | | | | | | | | | | | | | | | | | | | | | | | | | | | | | | | | | | | |
| | | 1.16 | %(3) | | | 1.25 | % | | | 1.42 | % | | | 1.37 | % | | | 1.35 | % | | | 1.37 | % | | | 1.20 | %(3) | | | 1.21 | % | | | 1.40 | % | | | 1.41 | % | | | 1.38 | % | | | 1.42 | % |
| | | | | | | | | | | | | | | | | | | | | | | | | | | | | | | | | | | | | | | | | | | | | | | | |
| | | (0.30 | )%(3) | | | (0.46 | )% | | | (0.53 | )% | | | (0.61 | )% | | | (0.52 | )% | | | (0.34 | )% | | | (0.46 | )%(3) | | | (0.74 | )% | | | (0.96 | )% | | | (1.01 | )% | | | (0.78 | )% | | | (0.88 | )% |
| | | | | | | | | | | | | | | | | | | | | | | | | | | | | | | | | | | | | | | | | | | | | | | | |
| | | 16 | %(2) | | | 40 | % | | | 50 | % | | | 52 | % | | | 81 | % | | | 80 | % | | | 19 | %(2) | | | 90 | % | | | 28 | % | | | 44 | % | | | 94 | % | | | 83 | % |
39
FINANCIAL HIGHLIGHTS
| | | MARSICO
INTERNATIONAL OPPORTUNITIES FUND | |
For a Fund Share Outstanding Throughout the Period | | Six-Month
Period Ended
3/31/19
(Unaudited) | | | Year
Ended
9/30/18 | | | Year
Ended
9/30/17 | | | Year
Ended
9/30/16 | | | Year
Ended
9/30/15 | | | Year
Ended
9/30/14 | |
| | | | | | | | | | | | | | | | | | | | | | | | | |
Net Asset Value, Beginning of Period | | $ | 20.23 | | | $ | 19.30 | | | $ | 15.64 | | | $ | 14.51 | | | $ | 14.72 | | | $ | 15.30 | |
| | | | | | | | | | | | | | | | | | | | | | | | | |
| | | | | | | | | | | | | | | | | | | | | | | | | |
Income from Investment Operations: | | | | | | | | | | | | | | | | | | | | | | | | |
Net investment income (loss) | | | (0.04 | ) | | | (0.09 | ) | | | (0.16 | ) | | | (0.20 | ) | | | (0.21 | ) | | | (0.06 | ) |
Net realized and unrealized gains (losses) on investments | | | (1.23 | ) | | | 1.02 | | | | 3.82 | | | | 1.33 | | | | — | (1) | | | (0.42 | ) |
| | | | | | | | | | | | | | | | | | | | | | | | | |
Total from investment operations | | | (1.27 | ) | | | 0.93 | | | | 3.66 | | | | 1.13 | | | | (0.21 | ) | | | (0.48 | ) |
| | | | | | | | | | | | | | | | | | | | | | | | | |
Distributions & Other: | | | | | | | | | | | | | | | | | | | | | | | | |
Net investment income | | | — | | | | — | | | | — | | | | — | | | | — | | | | (0.10 | ) |
Net realized gains | | | (1.42 | ) | | | — | | | | — | | | | — | | | | — | | | | — | |
| | | | | | | | | | | | | | | | | | | | | | | | | |
Total distributions and other | | | (1.42 | ) | | | — | | | | — | | | | — | | | | — | | | | (0.10 | ) |
| | | | | | | | | | | | | | | | | | | | | | | | | |
Net Asset Value, End of Period | | $ | 17.54 | | | $ | 20.23 | | | $ | 19.30 | | | $ | 15.64 | | | $ | 14.51 | | | $ | 14.72 | |
| | | | | | | | | | | | | | | | | | | | | | | | | |
| | | | | | | | | | | | | | | | | | | | | | | | | |
Total Return | | | (5.38 | )%(4) | | | 4.82 | % | | | 23.40 | % | | | 7.79 | % | | | (1.43 | )% | | | (3.18 | )% |
| | | | | | | | | | | | | | | | | | | | | | | | | |
| | | | | | | | | | | | | | | | | | | | | | | | | |
Supplemental Data and Ratios: | | | | | | | | | | | | | | | | | | | | | | | | |
| | | | | | | | | | | | | | | | | | | | | | | | | |
Net assets, end of period (000s) | | $ | 54,928 | | | $ | 62,152 | | | $ | 63,789 | | | $ | 62,833 | | | $ | 89,141 | | | $ | 175,984 | |
| | | | | | | | | | | | | | | | | | | | | | | | | |
Ratio of expenses to average net assets, less waivers and before expenses paid indirectly, plus recoupment of previously waived fees or expenses paid | | | 1.50 | %(5) | | | 1.52 | %(3) | | | 1.60 | % | | | 1.60 | % | | | 1.60 | % | | | 1.60 | % |
| | | | | | | | | | | | | | | | | | | | | | | | | |
Ratio of net investment loss to average net assets, net of waivers, recoupment of previously waived fees or expenses paid and expenses paid indirectly | | | (0.56 | )%(5) | | | (0.33 | )% | | | (0.77 | )% | | | (0.71 | )% | | | (0.86 | )% | | | (0.55 | )% |
| | | | | | | | | | | | | | | | | | | | | | | | | |
Ratio of expenses to average net assets, before waivers, recoupment of previously waived fees or expenses paid and expenses paid indirectly | | | 1.69 | %(5) | | | 1.59 | % | | | 1.79 | % | | | 1.78 | % | | | 1.63 | % | | | 1.52 | % |
| | | | | | | | | | | | | | | | | | | | | | | | | |
Ratio of net investment loss to average net assets, before waivers, recoupment of previously waived fees or expenses paid and expenses paid indirectly | | | (0.75 | )%(5) | | | (0.40 | )% | | | (0.96 | )% | | | (0.89 | )% | | | (0.89 | )% | | | (0.47 | )% |
| | | | | | | | | | | | | | | | | | | | | | | | | |
Portfolio turnover rate | | | 35 | %(4) | | | 33 | % | | | 108 | % | | | 223 | % | | | 217 | % | | | 178 | % |
(2) | The per share amount shown does not correlate with the amount reflected on the Global Fund’s Statement of Changes in Net Assets due to the shares outstanding significantly increasing late in the fiscal year as a result of the reorganization of the Flexible Capital Fund with and into the Global Fund. Please refer to Note 4 for additional information related to the reorganization. |
(3) | During the fiscal year, the Adviser agreed to reduce the expense limitation cap for the Fund. Please refer to Note 3 for information concerning the timing and modifications made to the written expense limitation and fee waiver agreement. |
| See notes to financial statements. |
40
| | MARSICO
GLOBAL
FUND | |
| | Six-Month
Period Ended
3/31/19
(Unaudited) | | | Year
Ended
9/30/18 | | | Year
Ended
9/30/17 | | | Year
Ended
9/30/16 | | | Year
Ended
9/30/15 | | | Year
Ended
9/30/14 | |
| | | | | | | | | | | | | | | | | | | | | | | | |
| | $ | 17.16 | | | $ | 15.13 | | | $ | 12.03 | | | $ | 12.37 | | | $ | 14.45 | | | $ | 14.74 | |
| | | | | | | | | | | | | | | | | | | | | | | | |
| | | | | | | | | | | | | | | | | | | | | | | | |
| | | | | | | | | | | | | | | | | | | | | | | | |
| | | (0.07 | ) | | | 0.11 | (2) | | | (0.14 | ) | | | (0.16 | ) | | | (0.10 | ) | | | (0.05 | ) |
| | | (1.26 | ) | | | 3.26 | | | | 3.24 | | | | 1.14 | | | | (0.32 | ) | | | 1.93 | |
| | | | | | | | | | | | | | | | | | | | | | | | |
| | | (1.33 | ) | | | 3.37 | | | | 3.10 | | | | 0.98 | | | | (0.42 | ) | | | 1.88 | |
| | | | | | | | | | | | | | | | | | | | | | | | |
| | | | | | | | | | | | | | | | | | | | | | | | |
| | | — | | | | — | | | | — | | | | — | | | | — | | | | — | |
| | | (0.16 | ) | | | (1.34 | ) | | | — | | | | (1.32 | ) | | | (1.66 | ) | | | (2.17 | ) |
| | | | | | | | | | | | | | | | | | | | | | | | |
| | | (0.16 | ) | | | (1.34 | ) | | | — | | | | (1.32 | ) | | | (1.66 | ) | | | (2.17 | ) |
| | | | | | | | | | | | | | | | | | | | | | | | |
| | $ | 15.67 | | | $ | 17.16 | | | $ | 15.13 | | | $ | 12.03 | | | $ | 12.37 | | | $ | 14.45 | |
| | | | | | | | | | | | | | | | | | | | | | | | |
| | | | | | | | | | | | | | | | | | | | | | | | |
| | | (7.66 | )%(4) | | | 23.94 | % | | | 25.77 | % | | | 8.05 | % | | | (3.51 | )% | | | 13.23 | % |
| | | | | | | | | | | | | | | | | | | | | | | | |
| | | | | | | | | | | | | | | | | | | | | | | | |
| | | | | | | | | | | | | | | | | | | | | | | | |
| | | | | | | | | | | | | | | | | | | | | | | | |
| | $ | 239,247 | | | $ | 286,514 | | | $ | 44,493 | | | $ | 44,273 | | | $ | 66,612 | | | $ | 73,475 | |
| | | | | | | | | | | | | | | | | | | | | | | | |
| | | 1.45 | %(5) | | | 1.48 | %(3) | | | 1.60 | % | | | 1.60 | % | | | 1.60 | % | | | 1.60 | % |
| | | | | | | | | | | | | | | | | | | | | | | | |
| | | (0.68 | )%(5) | | | (0.87 | )% | | | (0.82 | )% | | | (0.60 | )% | | | (0.80 | )% | | | (0.42 | )% |
| | | | | | | | | | | | | | | | | | | | | | | | |
| | | 1.35 | %(5) | | | 1.59 | % | | | 1.80 | % | | | 1.69 | % | | | 1.54 | % | | | 1.66 | % |
| | | | | | | | | | | | | | | | | | | | | | | | |
| | | (0.58 | )%(5) | | | (0.98 | )% | | | (1.02 | )% | | | (0.69 | )% | | | (0.74 | )% | | | (0.48 | )% |
| | | | | | | | | | | | | | | | | | | | | | | | |
| | | 42 | %(4) | | | 89 | % | | | 79 | % | | | 82 | % | | | 110 | % | | | 129 | % |
41
| NOTES TO FINANCIAL STATEMENTS |
NOTES TO FINANCIAL STATEMENTS March 31, 2019 (Unaudited)
The Marsico Investment Fund (the “Trust”) was organized on October 1, 1997, as a Delaware statutory trust and is registered under the Investment Company Act of 1940 (the “1940 Act”) as an open-end management investment company. The Focus Fund, Growth Fund, 21st Century Fund, International Opportunities Fund, and Global Fund (collectively, the “Funds”) are separate investment portfolios of the Trust. The Focus Fund is a non-diversified fund and the Growth Fund, the 21st Century Fund, the International Opportunities Fund, and the Global Fund are diversified funds. The Focus Fund and Growth Fund commenced operations on December 31, 1997, the 21st Century Fund commenced operations on February 1, 2000, the International Opportunities Fund commenced operations on June 30, 2000, and the Global Fund commenced operations on June 29, 2007. Trustees and officers of the Trust and employees of Marsico Capital Management, LLC (the “Adviser”) own approximately 5%, 5%, and 9% of the Focus Fund’s, International Opportunities Fund’s, and Global Fund’s outstanding shares, respectively, as of March 31, 2019.
2. | Significant Accounting Policies |
The Funds qualify as investment companies under Accounting Standards Update No. 2013-08, Accounting Standard Codification Topic 946, Financial Services — Investment Companies (“ASC 946”). The following is a summary of significant accounting policies consistently followed by the Funds in the preparation of their financial statements. These policies are in conformity with Generally Accepted Accounting Principles (“GAAP”) in the United States of America for investment companies and follow the accounting guidance provided in ASC 946. The presentation of financial statements in conformity with GAAP requires management to make estimates and assumptions that affect the reported amounts and disclosures of assets and liabilities at the date of the financial statements and the reported amounts and disclosures of income and expenses during the reporting period. Actual results could differ from those estimates.
| | (a) | Investment Valuation — A security traded on a recognized stock exchange is generally valued at the last sale price prior to the closing of the principal exchange on which the security is traded. Securities traded on NASDAQ generally will be valued at the NASDAQ Official Closing Price. If no sale price is reported on the valuation date, the most current bid price will generally be used, with the exception of short option positions which will generally utilize the most current ask price. Other securities for which over-the-counter market quotations are readily available are generally valued at the last sale price. Debt securities that will mature in more than 60 days are generally valued at their bid prices furnished by a pricing service approved by the Funds’ Board of Trustees and subject to review pursuant to procedures established by, and under the general supervision of, the Board of Trustees. Debt securities that will mature in 60 days or less are valued at amortized cost, if it approximates market value. Any securities for which market quotations are not readily available are valued at their fair value as determined in good faith by the Adviser in accordance with procedures established by, and under the general supervision of, the Funds’ Board of Trustees. The Funds may use pricing services to assist in determining market value. The Board of Trustees has authorized the use of a pricing service to assist the Funds in valuing certain equity securities listed or traded on foreign security exchanges in the Funds’ portfolios in certain circumstances where there is a significant change in the value of related US-traded securities, as represented by, for example, the S&P 500 Index. |
“Fair Value Measurements and Disclosures” (the “Fair Value Statement”) defines fair value, establishes a framework for measuring fair value in GAAP, and expands disclosures about fair value measurements. Under the Fair Value Statement, various inputs are used in determining the value of the Funds’ investments.
These inputs are summarized into three broad levels and described below:
| | ● | Level 1 – quoted prices in active markets for identical investments |
| | ● | Level 2 – other significant observable inputs (including quoted prices for similar investments, interest rates, and evaluated quotations obtained from pricing services) |
| | ● | Level 3 – significant unobservable inputs (including the Fund’s assumptions that market participants would use in determining the fair value of investments) |
42
| NOTES TO FINANCIAL STATEMENTS |
The inputs or methodology used for valuing investments are not an indication of the risk associated with investing in those investments. Changes in valuation techniques may result in transfers between the levels during the reporting period. There were no transfers into or out of Level 3 during the reporting period. The following is a summary of the fair values of the Funds’ investments in each category and economic sector as of March 31, 2019:
Fund Investments by
Major Security Type | | Level 1 | | | Level 2 | | | Level 3 | | | Total | |
Marsico Focus Fund | | | | | | | | | | | | | | | | |
Assets | | | | | | | | | | | | | | | | |
Common Stocks | | | | | | | | | | | | | | | | |
Communication Services | | $ | 99,398,986 | | | $ | — | | | $ | — | | | $ | 99,398,986 | |
Consumer Discretionary | | | 101,267,452 | | | | — | | | | — | | | | 101,267,452 | |
Financials | | | 33,473,257 | | | | — | | | | — | | | | 33,473,257 | |
Health Care | | | 55,897,562 | | | | — | | | | — | | | | 55,897,562 | |
Industrials | | | 43,696,705 | | | | — | | | | — | | | | 43,696,705 | |
Information Technology | | | 199,546,966 | | | | — | | | | — | | | | 199,546,966 | |
Materials | | | 23,891,053 | | | | — | | | | — | | | | 23,891,053 | |
Short-term Investments | | | 10,524,874 | | | | — | | | | — | | | | 10,524,874 | |
| | | | | | | | | | | | | | | $ | 567,696,855 | |
Marsico Growth Fund | | | | | | | | | | | | | | | | |
Assets | | | | | | | | | | | | | | | | |
Common Stocks | | | | | | | | | | | | | | | | |
Communication Services | | $ | 50,240,883 | | | $ | — | | | $ | — | | | $ | 50,240,883 | |
Consumer Discretionary | | | 45,510,960 | | | | — | | | | — | | | | 45,510,960 | |
Financials | | | 8,799,299 | | | | — | | | | — | | | | 8,799,299 | |
Health Care | | | 27,375,916 | | | | — | | | | — | | | | 27,375,916 | |
Industrials | | | 21,378,907 | | | | — | | | | — | | | | 21,378,907 | |
Information Technology | | | 80,716,254 | | | | — | | | | — | | | | 80,716,254 | |
Materials | | | 8,181,767 | | | | — | | | | — | | | | 8,181,767 | |
Real Estate | | | 8,793,984 | | | | — | | | | — | | | | 8,793,984 | |
Short-term Investments | | | 8,854,701 | | | | — | | | | — | | | | 8,854,701 | |
| | | | | | | | | | | | | | | $ | 259,852,671 | |
Marsico 21st Century Fund | | | | | | | | | | | | | | | | |
Assets | | | | | | | | | | | | | | | | |
Common Stocks | | | | | | | | | | | | | | | | |
Communication Services | | $ | 1,279,279 | | | $ | — | | | $ | — | | | $ | 1,279,279 | |
Consumer Discretionary | | | 39,939,754 | | | | — | | | | — | | | | 39,939,754 | |
Consumer Staples | | | 4,746,008 | | | | — | | | | — | | | | 4,746,008 | |
Financials | | | 10,314,983 | | | | — | | | | — | | | | 10,314,983 | |
Health Care | | | 42,177,561 | | | | — | | | | — | | | | 42,177,561 | |
Industrials | | | 43,552,323 | | | | — | | | | — | | | | 43,552,323 | |
Information Technology | | | 92,947,381 | | | | — | | | | — | | | | 92,947,381 | |
Materials | | | 11,038,324 | | | | — | | | | — | | | | 11,038,324 | |
Real Estate | | | 10,991,975 | | | | — | | | | — | | | | 10,991,975 | |
Short-term Investments | | | 17,707,149 | | | | — | | | | — | | | | 17,707,149 | |
| | | | | | | | | | | | | | | $ | 274,694,737 | |
Marsico International Opportunities Fund | | | | | | | | | | | | | | | | |
Assets | | | | | | | | | | | | | | | | |
Common Stocks | | | | | | | | | | | | | | | | |
Communication Services | | $ | 8,064,041 | | | $ | — | | | $ | — | | | $ | 8,064,041 | |
Consumer Discretionary | | | 6,919,197 | | | | — | | | | — | | | | 6,919,197 | |
Consumer Staples | | | 4,582,164 | | | | — | | | | — | | | | 4,582,164 | |
Financials | | | 6,410,893 | | | | — | | | | — | | | | 6,410,893 | |
Health Care | | | 7,762,805 | | | | — | | | | — | | | | 7,762,805 | |
Industrials | | | 6,535,195 | | | | — | | | | — | | | | 6,535,195 | |
Information Technology | | | 8,710,811 | | | | — | | | | — | | | | 8,710,811 | |
Materials | | | 781,467 | | | | — | | | | — | | | | 781,467 | |
Real Estate | | | 1,609,125 | | | | — | | | | — | | | | 1,609,125 | |
Short-term Investments | | | 3,719,593 | | | | — | | | | — | | | | 3,719,593 | |
| | | | | | | | | | | | | | | $ | 55,095,291 | |
43
| NOTES TO FINANCIAL STATEMENTS |
NOTES TO FINANCIAL STATEMENTS March 31, 2019 (Unaudited) (continued)
Fund Investments by
Major Security Type | | Level 1 | | | Level 2 | | | Level 3 | | | Total | |
Marsico Global Fund | | | | | | | | | | | | | | | | |
Assets | | | | | | | | | | | | | | | | |
Common Stocks | | | | | | | | | | | | | | | | |
Communication Services | | $ | 39,698,383 | | | $ | — | | | $ | — | | | $ | 39,698,383 | |
Consumer Discretionary | | | 49,188,042 | | | | — | | | | — | | | | 49,188,042 | |
Financials | | | 6,034,954 | | | | — | | | | — | | | | 6,034,954 | |
Health Care | | | 25,266,986 | | | | — | | | | — | | | | 25,266,986 | |
Industrials | | | 15,782,055 | | | | — | | | | — | | | | 15,782,055 | |
Information Technology | | | 86,415,198 | | | | — | | | | — | | | | 86,415,198 | |
Materials | | | 7,875,532 | | | | — | | | | — | | | | 7,875,532 | |
Real Estate | | | 4,604,312 | | | | — | | | | — | | | | 4,604,312 | |
Short-term Investments | | | 4,752,862 | | | | — | | | | — | | | | 4,752,862 | |
| | | | | | | | | | | | | | | $ | 239,618,324 | |
| | (b) | Expenses — The Funds are charged for those expenses that are directly attributable to each Fund, such as advisory and custodial fees. Expenses that are not directly attributable to a Fund are typically allocated among the Funds in proportion to their respective net assets and are in some cases allocated based on other factors. The Funds’ expenses may be reduced by advisory fee waivers, brokerage credits and uninvested cash balances earning interest or credits. Such credits are included in “Less waiver of expenses and expenses paid indirectly” on the Statements of Operations. |
Brokerage commissions may be paid to certain brokers which reduce transfer agent fees and expenses. For the six-month period ended March 31, 2019, the Funds received no such brokerage commission credits. The Funds received earnings credits on certain cash account balances which reduced transfer agent fees and expenses by less than $1 (in thousands) for each of the Focus Fund, Growth Fund, 21st Century Fund, International Opportunities Fund, and Global Fund for the six-month period ended March 31, 2019. Brokerage commission credits and earnings credits (if any) are included in “Less waiver of expenses and expenses paid indirectly” on the Statements of Operations.
| | (c) | Federal Income Taxes — Each Fund intends to comply with the requirements of the Internal Revenue Code of 1986, as amended (the “Internal Revenue Code”), necessary to continue to qualify as a regulated investment company and to make the requisite distributions of income to its shareholders which will be sufficient to relieve it from all or substantially all federal and state income taxes. Certain Funds may utilize earnings and profits on redemption of shares as part of the dividends paid deduction. |
| | (d) | Distributions to Shareholders — Dividends from net investment income and net realized capital gains, if any, will be declared and paid at least annually. Distributions to shareholders are recorded on the ex-dividend date. Each Fund may periodically make reclassifications among certain of its capital accounts as a result of the timing and characterization of certain income and capital gains distributions determined in accordance with federal tax regulations, which may differ from GAAP. These reclassifications are due to differing treatment for items such as foreign currency transactions, passive foreign investment companies and net investment losses. |
The Funds at times may invest in real estate investment trusts (“REITs”). REITs generally pay dividends to their investors based upon cash available from their operations and this amount may differ significantly from the REITs’ actual earnings and profits (“E&P”) determined for income tax purposes. It is common for these dividends to exceed the REITs’ taxable E&P, resulting in the excess portion of such dividends eventually being designated as a return of capital. Determination of the tax character of dividends made by REITs is typically performed by the REIT several months subsequent to the payment of the dividend. Therefore, due to timing issues, the Funds may be in a position of being required to calculate and pay required distribution amounts to their shareholders based on the best information available from the REITs, which may be prior to the final determination of the REITs’ taxable E&P, and it is possible that a portion of the Funds’ distribution amounts could include a return of capital to shareholders for federal income tax purposes.
| | (e) | Foreign Currency Translation — The accounting records of the Funds are maintained in US dollars. For valuation purposes, values of securities denominated in foreign currencies are translated into US dollars at 4:00 p.m. Eastern Time. Amounts related to the purchase and sale of foreign securities and investment income are translated at the rates of exchange prevailing on the respective dates of such transactions. |
Reported realized gains and losses on foreign currency transactions arise from sales of portfolio securities, forward foreign currency contracts, currency gains or losses realized between the trade and settlement dates on securities transactions, and the difference between the amounts of dividends, interest, and foreign withholding taxes recorded on the Funds’ books and the US dollar equivalent of the amounts actually received or paid.
The Funds do not isolate that portion of the results of operations resulting from changes in foreign exchange rates on investments from the fluctuations arising from changes in market prices of securities held at the end of the reporting period. Net unrealized appreciation or depreciation on investments and foreign currency translations arises from changes in the value of assets and liabilities, including investments in securities at the end of the reporting period, resulting from changes in the exchange rates and changes in market prices of securities held. Transactions in foreign-denominated assets may involve greater risks than domestic transactions, including currency risk, political and economic risk, regulatory risk and market risk.
44
| NOTES TO FINANCIAL STATEMENTS |
| | (f) | Derivative Instruments — “Disclosure about Derivative Instruments and Hedging Activities” (the “Derivatives Statement”) requires enhanced disclosures about the Funds’ derivative and hedging activities, including how such activities are accounted for and their effects on the Funds’ financial position, performance and cash flows. |
The Funds are not intended as vehicles for investing substantially in derivative instruments, and may hold derivative instruments only infrequently. The Funds enter into derivative instruments in order to increase exposure to certain investments, asset classes, or markets, or for hedging purposes to hedge against adverse movements in securities prices, currency rates or interest rates. The Funds can hold various types of derivative instruments such as futures contracts and options on securities, financial indexes, and foreign currencies, options on futures, forward foreign currency contracts, interest rate swaps, credit default swaps, and swap-related products. The use of derivative instruments may involve risks such as the possibility of illiquid markets or imperfect correlation between the value of the derivative instruments and the underlying securities, or that the counterparty will fail to perform its obligations. There were no outstanding derivative instruments held by the Funds as of March 31, 2019 nor did the Funds utilize derivative instruments during the six-month period ended March 31, 2019.
| | (g) | Non-Interested Trustees’ Deferred Fee Plan — Effective February 1, 2000, the Board of Trustees adopted the Marsico Investment Fund Deferred Fee Plan (the “Deferred Fee Plan”), amended and restated as of December 30, 2005, which allows the Trustees who are not “interested persons” of the Funds, as defined in the 1940 Act (“non-interested Trustees”), to defer the receipt of all or a portion of their compensation received from the Funds. Any deferred fees are credited to accounts established on behalf of the non-interested Trustees into the Funds as directed by each non-interested Trustee. The amounts credited to these accounts increase or decrease in accordance with the performance of the Funds selected by the non-interested Trustees. The market value of the deferred account balances as of March 31, 2019 is shown on the Statements of Assets and Liabilities as part of an asset account, “Prepaid expenses and other assets”, and a liability account, “Accrued trustees’ fees”. Additionally, the fluctuation of the account balances due to the Funds’ performance is recorded by the Funds as unrealized appreciation (depreciation), which is shown as part of “Total distributable earnings” on the Statements of Assets and Liabilities, and as compensation expense, which is shown as part of the expense account “Trustees’ fees and expenses” on the Statements of Operations. Fees earned and deferred by the non-interested Trustees for the six-month period ended March 31, 2019 are also included in “Trustees’ fees and expenses” on the Statements of Operations. Amounts contributed to the Deferred Fee Plan will be deferred until distributed in accordance with the Deferred Fee Plan. Unrealized appreciation (depreciation) of Fund shares held in the Deferred Fee Plan is subject to the Funds’ expense reimbursement agreement with the Adviser. |
| | (h) | Other — Investment transactions are accounted for on a trade date basis. Each Fund determines the gain or loss realized from the investment transactions by comparing the original cost of the security lot sold with the net sale proceeds. Dividend income is recognized on the ex-dividend date. Certain dividends from foreign securities are recorded when the Funds are informed of the dividend if such information is obtained subsequent to the ex-dividend date. Interest income is recognized on an accrual basis and includes amortization of premiums and accretion of discounts. |
During the six-month period ended March 31, 2019, the transfer agent reimbursed the Funds for billing processing errors. The transfer agent paid (in thousands) $14, $7, $6, $2, and $7 to the Focus Fund, Growth Fund,21st Century Fund, International Opportunities Fund, and Global Fund, respectively. These amounts are included in Paid-in-capital and Capital Share Transactions for each of the Funds. The amounts did not have a significant effect on each of the Fund’s total return.
| | (i) | Indemnifications — In the normal course of business, the Funds enter into contracts that contain provisions indemnifying other parties against specified potential liabilities. Each Fund’s maximum exposure under these arrangements is unknown as this would involve future claims that may be made against the Fund that have not yet occurred. However, based on experience, the Funds expect the risk of loss in connection with these potential indemnification obligations to be remote. There can be no assurance that material liabilities related to such obligations will not arise in the future, which may adversely impact a Fund. |
3. | Investment Advisory Agreement and Transactions With Affiliates |
Each Fund has an agreement with the Adviser to furnish investment advisory services to the Funds. Each Fund pays the Adviser a fee calculated using the following rates:
Annual Rate of Average Daily Net Assets | Asset Threshold |
0.80% | First $250 million |
0.75% | Next $250 million |
0.70% | Next $250 million |
0.65% | In excess of $750 million |
The Adviser has entered into a written expense limitation and fee waiver agreement under which it has agreed to limit the total expenses of each Fund (excluding taxes, interest, acquired fund fees and expenses, litigation, extraordinary expenses, brokerage and other transaction expenses relating to the purchase or sale of portfolio investments) to an annual rate of 1.50% of the average net assets of the International Opportunities Fund, and 1.45% of the average net assets of the Focus Fund, the Growth Fund, the 21st Century Fund, and the Global Fund until January 31, 2020. This expense limitation and fee waiver agreement may be terminated by the Adviser at any time after January 31, 2020, upon 15 days prior notice to the
45
| NOTES TO FINANCIAL STATEMENTS |
NOTES TO FINANCIAL STATEMENTS March 31, 2019 (Unaudited) (continued)
Fund and its administrator. These annual expense limitation rates were effective December 1, 2017 (other than the Global Fund). Prior to December 1, 2017, the Adviser had agreed to limit the total expenses of each Fund (other than the Global Fund) (with certain exclusions) to an annual rate of 1.60% of the average net assets of the Focus Fund and the International Opportunities Fund and 1.50% of the average net assets of the Growth Fund and the21st Century Fund.
The expense limitation agreement between the Adviser and the Global Fund, discussed above, became effective August 4, 2018 upon consummation of the reorganization of the Flexible Capital Fund with and into the Global Fund, which is discussed further below. For the period from December 1, 2017 through August 3, 2018, the Adviser had agreed to limit the total expenses of the Global Fund (with certain exclusions) to an annual rate of 1.50% of the average net assets of the Global Fund. Prior to December 1, 2017, the Adviser had agreed to limit the total expenses of the Global Fund (with certain exclusions) to an annual rate of 1.60% of the average net assets of the Global Fund.
The Adviser may recoup from a Fund fees previously waived or expenses previously reimbursed by the Adviser with respect to that Fund pursuant to these agreements (or a previous expense limitation agreement) if: (1) such recoupment by the Adviser does not cause the Fund, at the time of recoupment, to exceed the lesser of (a) the expense limitation in effect at the time the relevant amount was waived and/or reimbursed, or (b) the expense limitation in effect at the time of the proposed recoupment, and (2) the recoupment is made within three years after the fiscal year end date as of which the amount to be waived or reimbursed was determined and the waiver or reimbursement occurred. Under this arrangement during the six-month period ended March 31, 2019, the Adviser received $124 (in thousands) of reimbursement from the Global Fund for previously waived or reimbursed expenses. The reimbursement amount is reflected in “Recoupment of previously waived expenses” on the Statements of Operations. As of March 31, 2019, recoupment amounts (in thousands) that may potentially be made by the International Opportunities Fund and Global Fund to the Adviser are as follows:
Year of Expiration | | International
Opportunities Fund | | | Global Fund | |
2019 | | $ | 128 | | | $ | — | |
2020 | | | 106 | | | | 5 | |
2021 | | | 46 | | | | 99 | |
2022 | | | 51 | | | | — | |
| | | $ | 331 | | | $ | 104 | |
Certain officers of the Trust are also officers of the Adviser. The Funds pay a portion of the Chief Compliance Officer’s total compensation costs which is shown as part of the expense account “Professional fees” on the Statements of Operations. No other officers of the Trust received compensation from the Funds during the six-month period ended March 31, 2019.
On May 9, 2018, the Board of Trustees of the Trust unanimously approved an agreement and plan of reorganization that provided for the merger of the Flexible Capital Fund with and into the Global Fund. Based on the nature of the transaction, a shareholder vote was not required. After close of business on August 3, 2018, the Global Fund acquired all of the net assets of the Flexible Capital Fund in exchange for shares of the Global Fund. The purpose of the transaction was, in part, to combine two funds managed by the same portfolio manager with comparable investment objectives and strategies. The merger was deemed to be a tax-free reorganization for federal income tax purposes. The table below provides certain information for the impacted Funds on the merger date.
Immediately Prior to Merger | | Immediately Subsequent to Merger | |
(Amounts in thousands) | | Fund
Net Assets | | | Fund Shares
Outstanding | | | Net Unrealized
Appreciation on
Investments, Foreign
Currency Translations
and Non-Interested
Trustees’ Deferred
Compensation | | | Fund
Net Assets | | | Fund Shares
Outstanding | |
Flexible Capital Fund | | $ | 218,657 | | | | 17,732 | | | $ | 35,003 | | | $ | — | | | | — | |
Global Fund | | $ | 64,881 | | | | 3,914 | | | $ | 19,221 | | | $ | 283,538 | | | | 17,102 | |
46
| NOTES TO FINANCIAL STATEMENTS |
5. | Distribution and Service Plan |
The Funds have adopted a Distribution and Service Plan (the “Plan”) pursuant to Rule 12b-1 under the 1940 Act. The Plan authorizes payments by the Funds in connection with the distribution of their shares at an annual rate, as determined from time to time by the Board of Trustees, of 0.25% of a Fund’s average daily net assets.
Payments may be made by the Funds under the Plan for the purpose of financing any activity primarily intended to result in the sale of shares of the Funds, as determined by the Board of Trustees, as well as for account maintenance and personal services to shareholders and any other non-distribution-related services. The Adviser may, out of its own resources (which may include legitimate profits from providing advisory services to the Funds or other clients) and at its sole discretion, make certain payments on behalf of the Funds or the Plan for expenses incurred by a Fund for distribution of Fund shares and related services or for administrative or other expenses incurred by the Fund.
The Plan was amended effective December 1, 2017 to reflect non-material changes which were intended to clarify that while the maximum 12b-1 Fee rate remains limited to 0.25% per annum of each Fund’s average daily net assets, one or more Funds may be charged a lower rate from time to time upon approval by the Board of Trustees, and the rate may vary by Fund. The Plan, as amended, also clarifies that previously accrued amounts of the 12b-1 Fee for each Fund may be used by that Fund to pay any current or previously accrued expenses of the Fund authorized by the amended Plan, including non-distribution expenses, authorized by the Plan.
Pursuant to the amended Plan, the Board of Trustees has determined to cause each Fund to accrue 12b-1 Fees as described below.
Effective June 1, 2018, the Focus Fund suspended accrual of 12b-1 Fees until such time as the Board authorizes accruing 12b-1 Fees (at a rate not exceeding 0.25% per annum). The Focus Fund had previously accrued 12b-1 Fees at a rate of 0.20% per annum (for the period December 1, 2017 through May 31, 2018) and 0.25% per annum (for periods prior to December 1, 2017) of the average daily net assets of the Fund.
Effective February 1, 2019, the Growth Fund and 21st Century Fund began accruing 12b-1 Fees at a rate of 0.25% per annum of the average daily net assets of each Fund. The Growth Fund and 21st Century Fund had previously suspended accrual of 12b-1 Fees (for the period June 1, 2018 through January 31, 2019), and had previously accrued 12b-1 Fees at a rate of 0.20% per annum (for the period December 1, 2017 through May 31, 2018) and 0.25% per annum (for periods prior to December 1, 2017) of the average daily net assets of each Fund.
The International Opportunities Fund and Global Fund continue to accrue 12b-1 Fees at a rate of 0.25% per annum of the average daily net assets of each Fund.
6. | Investment Transactions |
The aggregate purchases and sales of securities, excluding short-term investments, for the Funds for the six-month period ended March 31, 2019, were as follows:
(Amounts in thousands) | | Focus
Fund | | | Growth
Fund | | | 21st
Century
Fund | | | International
Opportunities
Fund | | | Global
Fund | |
Purchases | | $ | 152,738 | | | $ | 39,992 | | | $ | 49,999 | | | $ | 17,854 | | | $ | 98,811 | |
Sales | | $ | 173,926 | | | $ | 74,871 | | | $ | 44,040 | | | $ | 24,103 | | | $ | 126,826 | |
There were no purchases or sales of US government securities, excluding short-term investments.
47
| NOTES TO FINANCIAL STATEMENTS |
NOTES TO FINANCIAL STATEMENTS March 31, 2019 (Unaudited) (continued)
7. | Federal Income Tax Information |
“Accounting for Uncertainty in Income Taxes” (the “Income Tax Statement”) requires an evaluation of tax positions taken (or expected to be taken) in the course of preparing a Fund’s tax returns to determine whether these positions meet a “more-likely-than-not” standard that, based on the technical merits, have a more than fifty percent likelihood of being sustained by a taxing authority upon examination. A tax position that meets the “more-likely-than-not” recognition threshold is measured to determine the amount of benefit to recognize in the financial statements. The Funds recognize interest and penalties, if any, related to unrecognized tax benefits as income tax expense in the Statements of Operations.
The Income Tax Statement requires management of the Funds to analyze all open tax years, consisting of fiscal years 2015-2019 as defined by Internal Revenue Service (“IRS”) statute of limitations for all major jurisdictions, including federal tax authorities and certain state tax authorities. As of and during the six-month period ended March 31, 2019, the Funds did not have any liabilities for any unrecognized tax benefits. The Funds have no examinations in progress and are not aware of any tax positions for which it is reasonably possible that the total amounts of unrecognized tax benefits will significantly change in the next twelve months.
At March 31, 2019, gross unrealized appreciation and depreciation of investments, based on cost for federal income tax purposes, were as follows:
(Amounts in thousands) | | Focus
Fund | | | Growth
Fund | | | 21st
Century
Fund | | | International
Opportunities
Fund | | | Global
Fund | |
Cost of Investments | | $ | 372,124 | | | $ | 165,738 | | | $ | 224,958 | | | $ | 49,264 | | | $ | 194,248 | |
| | | | | | | | | | | | | | | | | | | | | |
Gross Unrealized Appreciation | | $ | 197,128 | | | $ | 94,945 | | | $ | 56,105 | | | $ | 8,219 | | | $ | 47,842 | |
Gross Unrealized Depreciation | | | (1,555 | ) | | | (830 | ) | | | (6,368 | ) | | | (2,388 | ) | | | (2,472 | ) |
| | | | | | | | | | | | | | | | | | | | | |
Net Unrealized Appreciation on Investments | | $ | 195,573 | | | $ | 94,115 | | | $ | 49,737 | | | $ | 5,831 | | | $ | 45,370 | |
The difference between cost amounts for financial statement and federal income tax purposes is due primarily to wash sale loss deferrals.
During the year ended September 30, 2018, the 21st Century Fund and International Opportunities Fund utilized capital loss carryforwards of (in thousands) $76,449 and $6,504, respectively. As of September 30, 2018, the remaining accumulated capital loss carryforwards of (in thousands) $307,179 and $87,054, respectively, for the 21st Century Fund and International Opportunities Fund expired unused. These unused balances have been reclassified to paid-in-capital for tax purposes.
As of September 30, 2018, the Focus Fund, Growth Fund, 21st Century Fund, International Opportunities Fund, and Global Fund, respectively, had (in thousands) $1,283, $740, $1,247, $0 and $520 of qualified late-year losses, which are deferred until fiscal year 2019 for tax purposes. Net late-year losses that are deferred are deemed to arise on the first day of the Fund’s next taxable year.
As of September 30, 2018, the components of accumulated earnings on a tax basis were as follows:
(Amounts in thousands) | | Focus
Fund | | | Growth
Fund | | | 21st
Century
Fund | | | International
Opportunities
Fund | | | Global
Fund | |
Undistributed Ordinary Income | | $ | 201 | | | $ | 1,227 | | | $ | — | | | $ | — | | | $ | — | |
Undistributed Trustees' Deferred Compensation | | | (3,052 | ) | | | (1,560 | ) | | | (940 | ) | | | (344 | ) | | | (1,695 | ) |
Undistributed Long-Term Capital Gains | | | 51,423 | | | | 28,123 | | | | — | | | | — | | | | 2,535 | |
Tax Accumulated Earnings (Deficit) | | | 48,572 | | | | 27,790 | | | | (940 | ) | | | (344 | ) | | | 840 | |
Accumulated Capital and Other Losses | | | (1,283 | ) | | | (740 | ) | | | (1,247 | ) | | | — | | | | (520 | ) |
Net Unrealized Appreciation on Investments and on Foreign Currency Translations | | | 227,789 | | | | 111,566 | | | | 50,485 | | | | 9,741 | | | | 61,573 | |
Trustees' Deferred Compensation Mark-to-Market | | | 1,686 | | | | 674 | | | | 231 | | | | 84 | | | | 1,042 | |
Total Accumulated Earnings | | $ | 276,764 | | | $ | 139,290 | | | $ | 48,529 | | | $ | 9,481 | | | $ | 62,935 | |
Undistributed ordinary income consists of net investment income and timing differences related to qualified late-year losses.
48
| NOTES TO FINANCIAL STATEMENTS |
The tax character of distributions paid during the fiscal years ended September 30, 2018 and 2017 was as follows:
| | | 2018 | | | 2017 | |
(Amounts in thousands) | | Ordinary Income | | | Long-Term Capital Gains | | | Ordinary Income | | | Long-Term Capital Gains | |
Focus Fund | | $ | — | | | $ | 87,734 | | | $ | — | | | $ | — | |
Growth Fund | | | — | | | | 25,153 | | | | — | | | | 2,136 | |
21stCentury Fund | | | — | | | | — | | | | — | | | | — | |
International Opportunities Fund | | | — | | | | — | | | | — | | | | — | |
Global Fund | | | 361 | | | | 3,707 | | | | — | | | | — | |
The tax character of dividends paid may differ from that shown in the Financial Highlights due to short-term gains being treated as ordinary income for tax purposes.
Management of the Adviser has determined that there were no material subsequent events that would require disclosure in the Funds’ financial statements.
| 9. | New Accounting Pronouncements |
The FASB issued Accounting Standards Update No. 2017-08, Receivables – Nonrefundable Fees and Other Costs (Subtopic 310-20), Premium Amortization on Purchased Callable Debt Securities (“ASU 2017-08”) to amend the amortization period for certain purchased callable debt securities held at a premium. The guidance requires certain premiums on callable debt securities to be amortized to the earliest call date. The amortization period for callable debt securities purchased at a discount will not be impacted. The guidance is effective for fiscal years beginning after December 15, 2018, and interim periods within those fiscal years, with early adoption permitted. Management is currently evaluating the impact these changes may have on the Funds’ financial statements.
The FASB issued Accounting Standards Update No. 2018-13, Fair Value Measurement (Topic 820), Disclosure Framework – Changes to the Disclosure Requirements for Fair Value Measurement (“ASU 2018-13”), which includes amendments intended to improve the effectiveness of disclosures in the notes to financial statements, add disclosure requirements regarding the range and weighted average of significant unobservable inputs used to develop Level 3 fair value measurements, and provide clarifications to the narrative description of measurement uncertainty disclosures. ASU 2018-13 is effective for interim and annual periods beginning after December 15, 2019. However, ASU 2018-13 allowed for immediate adoption of those provisions that eliminated certain disclosure items while delaying the adoption of the remaining provisions within ASU 2018-13 until the effective date. Management elected to early adopt only those provisions related to the elimination of certain disclosures, and is currently evaluating the impact that ASU 2018-13 will have on the Funds’ financial statements and related disclosures for the remaining provisions.
49
EXPENSE EXAMPLE For the six-month period ended March 31, 2019 (Unaudited)
As a shareholder of the Marsico Funds (the “Funds”), you incur two types of costs: (1) transaction costs, including redemption fees (if any), and (2) ongoing costs, including management fees, distribution (12b-1) fees, and other Fund expenses. This Example is intended to help you understand your ongoing costs (in dollars) of investing in the Funds and to compare these costs with the ongoing costs of investing in other mutual funds.
The Example is based on an investment of $1,000 invested at the beginning of the period and held for the entire period from October 1, 2018 to March 31, 2019 (the “period”).
Actual Expenses
The first line of the table below provides information about actual account values and actual expenses. You may use the information in this line, together with the amount you invested, to estimate the expenses you paid over the period. Simply divide your account value by $1,000 (for example, an $8,600 account value divided by $1,000 equals 8.6), then multiply the result by the number in the first line under the heading entitled “Expenses paid for the six-month period ended March 31, 2019” to estimate the expenses you paid on your account during the period.
Hypothetical Example for Comparison Purposes
The second line of the table below provides information about hypothetical account values and hypothetical expenses based on the Funds’ actual expense ratios and an assumed rate of return of 5% per year before expenses, which is not the actual return of any of the Funds. The hypothetical account values and expenses may not be used to estimate the actual ending account balance or expenses you paid for the period. You may use this information to compare the ongoing costs of investing in the Funds and other funds. To do so, compare this 5% hypothetical example with the 5% hypothetical examples that appear in the shareholder reports of other funds.
Please note that the expenses shown in the table are meant to highlight your ongoing costs only and do not reflect any transactional costs such as redemption fees (if any). Therefore, the second line of the table is useful in comparing the ongoing costs only, and will not help you determine the relative total costs of owning different funds. In addition, if these transactional costs (if any) were included, your costs could have been higher.
| | Annualized
expense ratio | Beginning
account value
October 1, 2018 | Ending
account value
March 31, 2019 | Expenses paid for the
six-month period ended
March 31, 2019 |
FOCUS FUND | | | | |
Actual Example | 0.98%(1)(2) | $ 1,000.00 | $ 985.50 | $ 4.87(1)(2) |
Hypothetical Example, assuming a 5% return before expenses | | $ 1,000.00 | $ 1,020.10 | $ 4.95(1)(2) |
| (1) | If the current fund administration fee rates and transfer agent fees had been in effect for the entire six-month period, the restated annualized expense ratio would have been 1.00% and the expenses paid in the actual and hypothetical examples above would have been $4.97 and $5.06, respectively. |
| (2) | Expenses are equal to the Fund’s annualized expense ratio multiplied by the average account value over the period, multiplied by 182/365 (to reflect the six-month period). |
GROWTH FUND | | | | |
Actual Example | 1.16%(1)(2) | $ 1,000.00 | $ 983.70 | $ 5.75(1)(2) |
Hypothetical Example, assuming a 5% return before expenses | | $ 1,000.00 | $ 1,019.21 | $ 5.85(1)(2) |
| (1) | If the current 12b-1 fee accrual rate, fund administration fee rates, and transfer agent fees had been in effect for the entire six-month period, the restated annualized expense ratio would have been 1.35% and the expenses paid in the actual and hypothetical examples above would have been $6.68 and $6.80, respectively. |
| (2) | Expenses are equal to the Fund’s annualized expense ratio multiplied by the average account value over the period, multiplied by 182/365 (to reflect the six-month period). |
50
| | Annualized
expense ratio | Beginning
account value
October 1, 2018 | Ending
account value
March 31, 2019 | Expenses paid for the
six-month period ended
March 31, 2019 |
21st CENTURY FUND | | | | |
Actual Example | 1.20%(1)(2) | $ 1,000.00 | $ 1,002.60 | $ 5.98(1)(2) |
Hypothetical Example, assuming a 5% return before expenses | | $ 1,000.00 | $ 1,019.02 | $ 6.03(1)(2) |
| (1) | If the current 12b-1 fee accrual rate, fund administration fee rates, and transfer agent fees had been in effect for the entire six-month period, the restated annualized expense ratio would have been 1.39% and the expenses paid in the actual and hypothetical examples above would have been $6.96 and $7.01, respectively. |
| (2) | Expenses are equal to the Fund’s annualized expense ratio multiplied by the average account value over the period, multiplied by 182/365 (to reflect the six-month period). |
INTERNATIONAL OPPORTUNITIES FUND | | | | |
Actual Example | 1.50%(1) | $ 1,000.00 | $ 946.20 | $ 7.29(1) |
Hypothetical Example, assuming a 5% return before expenses | | $ 1,000.00 | $ 1,017.51 | $ 7.55(1) |
| (1) | Expenses are equal to the Fund’s annualized expense ratio multiplied by the average account value over the period, multiplied by 182/365 (to reflect the six-month period). |
GLOBAL FUND | | | | |
Actual Example | 1.45%(1) | $ 1,000.00 | $ 923.40 | $ 6.95(1) |
Hypothetical Example, assuming a 5% return before expenses | | $ 1,000.00 | $ 1,017.77 | $ 7.29(1) |
| (1) | Expenses are equal to the Fund’s annualized expense ratio multiplied by the average account value over the period, multiplied by 182/365 (to reflect the six-month period). |
51
| CONSIDERATION OF INVESTMENT ADVISORY AGREEMENTS |
CONSIDERATION OF INVESTMENT ADVISORY AGREEMENTS (Unaudited)
At a meeting of the Board of Trustees of the Trust held on November 14, 2018, the Trustees, by a unanimous vote (including a separate vote of those Trustees who are not “interested persons” (as the term is defined in the 1940 Act) of the Trust (the “Independent Trustees”)), approved the renewal of the Investment Advisory and Management Agreements for the Focus Fund, Growth Fund,21st Century Fund, International Opportunities Fund, and Global Fund (the “Advisory Agreements”). In advance of the meeting, the Independent Trustees requested and received extensive materials from Marsico Capital Management, LLC (the “Adviser” or “MCM”) to assist them in considering the renewal of the Advisory Agreements. The materials provided by the Adviser contained information with respect to the factors noted below, including detailed information relating to the performance, advisory fees and other expenses of the Funds, other funds sub-advised by the Adviser and non-fund advisory accounts of the Adviser. The materials also included comparisons of the Funds with third party funds of similar size and investment objectives in terms of performance, fees and other expenses, as well as the performance of each Fund versus its benchmark. In addition, the Adviser provided information regarding its overall expenses and profitability, as well as other information requested by the Trustees.
In addition to the materials prepared specifically for contract review analysis, on an ongoing basis the Trustees receive information and reports from the Adviser and other service providers to the Funds regarding the investment performance of the Funds as well as operational, compliance, marketing and other matters.
The Trustees engaged in a detailed discussion of the materials with management of the Adviser. The Independent Trustees then met separately with independent counsel to the Independent Trustees for a review of the materials. Following this session, the full Board reconvened and approved the continuation of the Advisory Agreements for the Focus Fund, Growth Fund,21st Century Fund, International Opportunities Fund, and Global Fund.
Discussion of Certain Factors Considered
1. Nature, Extent, and Quality of Services. The Independent Trustees considered the nature, quality and extent of the services performed by the Adviser under the Advisory Agreements with the Adviser, including portfolio management, supervision of Fund operations, regulatory filings and disclosures to shareholders, compliance functions, general oversight of other service providers, review of Fund legal issues, and other services. The Independent Trustees also considered the personnel who provide these services, which includes a team of individuals collectively having years of experience in their particular areas of expertise. The Independent Trustees reviewed the Adviser’s investment philosophy and experience, noting that the Adviser and its affiliates employ a focused stock-picking strategy that involves extensive research. The Independent Trustees noted MCM’s continued investment in research, including new risk analytics software intended to assist in evaluating risk exposures within certain portfolios. The Independent Trustees discussed the Adviser’s ability to continue to provide the same level and quality of services to the Funds, and discussed with members of management of MCM the financial condition of the Adviser and its ability to attract and retain experienced personnel. The Independent Trustees considered the reinvestment in MCM by Mr. T. Marsico and the steps taken to ensure the financial viability of the Adviser, including the extinguishment of debt to third parties and elimination of most of MCM’s overall debt in 2016. The Independent Trustees also discussed MCM’s commitment to devoting substantial resources to the Adviser’s investment management process. The Independent Trustees concluded that the services are extensive in nature, that the Adviser employs investment advisory personnel who consistently delivered a high level of service and that, with respect to third-party service providers, the Adviser effectively manages the outsourcing by the Funds of certain services to other service providers and the oversight of those service providers.
2. Investment Performance of the Funds and Adviser. The Independent Trustees considered the Adviser’s substantial investment advisory experience and capabilities. The Independent Trustees considered short-term and long-term investment performance for each Fund over various periods of time as compared to both relevant equity indices and the performance of each Fund’s Lipper, Inc. peer group universe. The Independent Trustees noted the strong performance of most of the Funds relative to their peers and benchmarks during the one-year period ended September 30, 2018, and discussed with representatives of the Adviser the factors underlying the performance of the Funds over various time periods. The Independent Trustees discussed the Funds’ performance with representatives of MCM and concluded that the Adviser was delivering acceptable performance results consistent with the long-term investment strategies being pursued by the Funds. The Independent Trustees took into account that they regularly review each Fund’s performance.
The Independent Trustees noted that the investment performance delivered by the Adviser to the Funds appeared to be generally consistent with the performance delivered for other clients of the Adviser with similar strategies. Based on this review, the Independent Trustees concluded that the performance of the Adviser with respect to each Fund was acceptable for the purposes of approving the Advisory Agreements.
52
| CONSIDERATION OF INVESTMENT ADVISORY AGREEMENTS |
3. Costs of Services and Profits Realized by the Adviser.
(a) Costs of Services to Funds: Fees and Expenses. The Independent Trustees considered each Fund’s management fee rates and expense ratios relative to industry averages for the Fund’s benchmark category and the advisory fees charged by the Adviser to other clients, including information regarding expense limitation commitments from the Adviser, and the breakpoints in the advisory fee schedule for all of the Funds. The Independent Trustees noted the information provided by MCM stated that the mix of services under the Advisory Agreements are much more extensive than those under the Adviser’s advisory agreements for sub-advised and non-fund clients.
The Independent Trustees also noted previous actions taken by MCM to reduce Fund expenses, including that MCM had waived fees and absorbed expenses from time to time, and that some of those expenditures may not be recouped. It was noted that on December 1, 2015, as requested by the Independent Trustees, the Adviser implemented reduced fees and new breakpoints for the management fee rates of all of the Funds resulting in overall reductions in the management fee rates. The Independent Trustees reviewed various expense information and noted that the lower management fee rates and breakpoints reduced advisory fees and as such were a positive factor in maintaining overall Fund expenses in a range that continues to be reasonable. The Trustees also noted other recent actions that have been taken to reduce expenses including (1) applying certain previously accrued 12b-1 balances to pay for certain administrative fees charged by intermediaries for periods of time (2) a reduction in the 12b-1 fees accrued by the Focus, Growth, and21st Century Funds for periods of time; (3) that MCM agreed to lower expense caps for all of the Funds for the benefit of all shareholders effective December 1, 2017, and in the case of the Global Fund, to further lower the expense cap effective August 4, 2018; and (4) that MCM had paid most of the costs of the reorganization of the Flexible Capital Fund into the Global Fund in 2018. The Independent Trustees concluded that the investment advisory fees are acceptable based upon the qualifications, experience, reputation, and performance of the Adviser and the overall expense ratios of the Funds.
(b) Profitability and Costs of Services to Adviser. The Independent Trustees reviewed the information provided by MCM regarding its overall profitability and costs and an estimate of the Adviser’s profitability and costs in serving the Funds as part of MCM’s overall investment management business serving many clients. The Independent Trustees noted that MCM’s fee revenue from the Funds had increased only slightly in 2018 as a result of slightly higher net assets and MCM’s overall profitability actually decreased during that period, and that MCM had not reduced its services, but continued to devote substantial resources and personnel to the Funds. The Independent Trustees also noted that the Adviser previously had substantially increased its resources devoted to Fund matters in response to regulatory requirements enacted in prior years. The Independent Trustees discussed the level of estimated profit of MCM from its relationship to the Funds and considered profitability levels reviewed by federal courts that were found to be reasonable. The Independent Trustees concluded that the estimated profits received by the Adviser under the Advisory Agreements were acceptable for purposes of approving the Advisory Agreements.
4. Extent of Economies of Scale as Funds Grow. The Independent Trustees considered whether there have been economies of scale with respect to the management of each Fund and whether such Fund has appropriately benefited from any economies of scale. The Independent Trustees noted that economies of scale may develop for certain Funds as their assets increase and their Fund-level expenses decline as a percentage of assets, but that Fund-level economies of scale may not necessarily result in Adviser-level economies of scale. It was reported to the Independent Trustees that the resources devoted by the Adviser relating to management of the Funds had increased substantially in prior years, and that the average net asset levels of each of the Funds had increased only slightly over the past year. The Independent Trustees agreed that it was possible that if trends changed and Fund assets began growing again beyond certain thresholds, Adviser-level expenses incurred in managing the Funds eventually could level off or decline as a percentage of management fees in the future, potentially resulting in economies of scale. The Independent Trustees noted that should economies of scale be realized in the future, the advisory fee schedule contains breakpoints that would benefit shareholders of the Funds as assets increase.
5. Whether Fee Levels Reflect Economies of Scale. The Independent Trustees also considered whether the management fee rate is reasonable in relation to the asset size of each Fund and any economies of scale that may exist. The Independent Trustees noted that, at the request of the Independent Trustees, lower management fee rates and breakpoints had been introduced for all of the Funds effective December 1, 2015. The Independent Trustees noted that MCM agreed to the breakpoints and a fee reduction in an effort to maintain overall Fund expenses in a range that continues to be reasonable. The Independent Trustees also took note that the Adviser agreed to implement new, lower expense limitations for all Funds effective December 1, 2017 which would remain in place until at least January 31, 2019. In the case of the Global Fund, the expense limitation was further lowered effective August 4, 2018 and would remain in place until at least September 30, 2019.
53
| CONSIDERATION OF INVESTMENT ADVISORY AGREEMENTS |
CONSIDERATION OF INVESTMENT ADVISORY AGREEMENTS (Unaudited) (continued)
6. Other Relevant Considerations. The Independent Trustees considered the character and amount of other incidental benefits received by the Adviser and its affiliates from its association with the Funds. The Independent Trustees concluded that potential “fall-out” benefits that the Adviser may receive, such as greater name recognition or increased ability to obtain research or brokerage services, appear to be reasonable, and may in some cases benefit the Funds.
Conclusions
In considering the Advisory Agreements, the Independent Trustees did not identify any factor as all-important or all-controlling and instead considered these factors collectively in light of each Fund’s surrounding circumstances. Based on this review, it was the judgment of the Independent Trustees that each Fund’s fees were reasonable, the extent and quality of services were acceptable and performance of the Funds was acceptable. Therefore, re-approval of the Advisory Agreements was in the best interests of each Fund and its shareholders. As a part of their decision-making process, the Independent Trustees noted that the Adviser has managed the Funds since their inception, and the Independent Trustees believe that a long-term relationship with a capable, conscientious adviser is in the best interests of the Funds and their shareholders. The Independent Trustees considered, generally, that shareholders invested in a Fund knowing that the Adviser managed that Fund and knowing its investment management fee. As such, the Independent Trustees considered whether the Adviser managed each Fund in accordance with its investment objectives and policies as disclosed to shareholders. Additionally, as part of its deliberations, the Board also considered the information about the Funds and MCM that had been provided to them throughout the year in connection with their regular Board meetings at which they engage in the ongoing oversight of the Funds and their operations.
Upon conclusion of their review and discussion, the Trustees, including all of the Independent Trustees, unanimously agreed the Advisory Agreements for each of the Funds should be continued.
54
OTHER INFORMATION (Unaudited)
Proxy Voting Guidelines
The Funds exercise the voting rights associated with the securities held by the Funds under the proxy voting policy of the Funds. A description of those policies and procedures of the Funds and a record of the Funds’ proxy votes for the one-year period ended June 30, 2018 are available without charge, upon request, by calling 888-860-8686. It is also available on the Securities and Exchange Commission’s (SEC) website at www.sec.gov.
Quarterly Filing of Portfolio Holdings
The Funds will file their portfolio holdings information for each month in a fiscal quarter within 60 days after the end of the relevant fiscal quarter on Form N-PORT. Portfolio holdings information for the third month of each fiscal quarter will be made available immediately upon filing (i) on the SEC’s website at www.sec.gov; and (ii) by calling 800-SEC-0330.
Cost Basis Information
Federal law requires mutual fund companies to maintain a shareholder’s cost basis by tax lot and report gain/loss information and holding periods for sales of mutual fund shares that are “covered” securities to the IRS and to shareholders on Form 1099. Mutual fund shares, such as shares of the Funds, acquired on or after January 1, 2012 are covered securities. The Funds are not responsible for maintaining and reporting share information for their shares that are not deemed “covered.”
The tax regulations require that the Funds elect a default tax identification methodology in order to perform the required reporting. The Funds have chosen the first-in-first-out (“FIFO”) method as the default tax lot identification method for its shareholders. This is the method the Funds will use to determine which specific shares are deemed to be sold when a shareholder’s entire position is not sold in a single transaction and is the method in which “covered” share sales will be reported on a shareholder’s Form 1099.
However, at the time of purchase or upon the sale of “covered” shares, shareholders may generally choose a different tax lot identification method. Shareholders should consult a tax advisor with regard to their personal circumstances as the Funds and their service providers do not provide tax advice.
55
NOTES
56
Not applicable to semi-annual reports.
| Item 3. | Audit Committee Financial Expert |
Not applicable to semi-annual reports.
| Item 4. | Principal Accountant Fees and Services |
Not applicable to semi-annual reports.
| Item 5. | Audit Committee of Listed Registrants |
Not applicable.
| Item 6. | Schedule of Investments |
The schedule of investments in securities of unaffiliated issuers is included as part of the report to shareholders filed under Item 1.
| Item 7. | Disclosure of Proxy Voting Policies and Procedures for Closed-End Management Investment Companies |
Not applicable.
| Item 8. | Portfolio Managers of Closed-End Management Investment Companies |
Not applicable.
| Item 9. | Purchases of Equity Securities by Closed-End Management Investment Company and Affiliated Purchasers |
Not applicable.
| Item 10. | Submission of Matters to a Vote of Security Holders |
Not applicable.
| Item 11. | Controls and Procedures. |
(a) The registrant's principal executive officer and principal financial officer have concluded that the registrant's disclosure controls and procedures (as defined in Rule 30a-3(c) under the Investment Company Act of 1940, as amended) are effective based on their evaluation of these disclosure controls and procedures within 90 days of the filing date of this report on Form N-CSR.
(b) There were no changes in the registrant's internal control over financial reporting (as defined in Rule 30a-3(d) under the Investment Company Act of 1940, as amended) that occurred during the last fiscal quarter of the period covered by this report that have materially affected, or are reasonably likely to materially affect, the registrant's internal control over financial reporting.
| Item 12. | Disclosure of Securities Lending Activities for Closed-End Management Investment Companies. |
Not applicable.
(a)(1) Code of Ethics
Not applicable to semi-annual reports.
(a)(2) Certification for each principal executive and principal financial officer of the registrant as required by Rule 30a-2(a) under the Act (17 CFR 270.30a-2(a)). Filed as an attachment to this filing.
(a)(3) Any written solicitation to purchase securities under Rule 23c--1 under the Investment Company Act of 1940, as amended, that was sent or given during the period covered by the report by or on behalf of the registrant to 10 or more persons.
Not applicable.
(a)(4) Change in the registrant’s independent public accountant.
Not applicable.
(b) Certifications required by Rule 30a-2(b) under the Act (17 CFR 270.30a-2(b)), Rule 13a-14(b) or Rule 15d-14(b) under the Exchange Act (17 CFR 240.13a-14(b) or 240.15d-14(b)), and Section 1350 of Chapter 63 of Title 18 of the United States Code (18 U.S.C. 1350). Filed as an attachment to this filing.
SIGNATURES
Pursuant to the requirements of the Securities Exchange Act of 1934 and the Investment Company Act of 1940, the registrant has duly caused this report to be signed on its behalf by the undersigned, thereunto duly authorized.
The Marsico Investment Fund
| By: | /s/ Christopher J. Marsico | |
| | Christopher J. Marsico, | |
| | Trustee, Executive Vice President and Chief Operating Officer (Principal Executive Officer) |
Pursuant to the requirements of the Securities Exchange Act of 1934 and the Investment Company Act of 1940, this report has been signed below by the following persons on behalf of the registrant and in the capacities and on the dates indicated.
| By: | /s/ Christopher J. Marsico | |
| | Christopher J. Marsico, | |
| | Trustee, Executive Vice President and Chief Operating Officer (Principal Executive Officer) |
| | | |
| Date: | May 30, 2019 | |
| By: | /s/ Neil L. Gloude | |
| | Neil L. Gloude, | |
| | Vice President, Secretary and Treasurer (Principal Financial Officer) |
| | | |
| Date: | May 30, 2019 | |