UNITED STATES
SECURITIES AND EXCHANGE COMMISSION
Washington, D.C. 20549
FORM N-CSR
CERTIFIED SHAREHOLDER REPORT OF REGISTERED MANAGEMENT INVESTMENT COMPANIES
Investment Company Act File Number: 811-08397
THE MARSICO INVESTMENT FUND
(Exact Name of Registrant as Specified in Charter)
1200 17th Street, Suite 1700
Denver, CO 80202
(Address of Principal Executive Offices) (Zip Code)
The Corporation Trust Company
The Marsico Investment Fund
Corporation Trust Center 1209 Orange Street
Wilmington, Delaware 19802
(Name and address of Agent for Service of Process)
Copies to:
Anthony H. Zacharski
Dechert LLP
90 State House Square
Hartford, CT 06103
Registrant's Telephone Number, including Area Code: 1-888-860-8686
Date of fiscal year end: September 30
Date of Reporting Period: March 31, 2021
| Item 1. | Reports to Stockholders |
DEAR SHAREHOLDER:
Enclosed is your semi-annual report for each portfolio of The Marsico Investment Fund (the “Marsico Funds”), encompassing the six-month fiscal period from October 1, 2020 to March 31, 2021.
The purpose of this report is to provide a review of the Marsico Funds’ six-month investment results by discussing what we believe were the main areas that impacted performance – including the macroeconomic environment, sector and industry positioning, and individual stock selection – as compared to the Funds’ performance benchmark indices.
For updated information regarding the market environment and each Fund’s overall investment positioning and performance, please refer to the Funds’ most recent monthly fact sheets and quarterly investment updates, which are available in the Investor Resources section of the Funds’ website at marsicofunds.com.(1)
Note: Effective December 21, 2020, James D. Marsico became co-manager of the Marsico Growth Fund with Thomas F. Marsico, Brandon A. Geisler, and Peter C. Marsico.
(1) | The references to the Marsico Funds website (marsicofunds.com) included throughout this semi-annual report do not incorporate the website’s contents into this report. |
| | | |
KEY FUND STATISTICS | 2 |
MARKET ENVIRONMENT | 5 |
MARSICO FOCUS FUND | |
Investment Review | 7 |
Fund Overview | 10 |
Schedule of Investments | 11 |
MARSICO GROWTH FUND | |
Investment Review | 12 |
Fund Overview | 14 |
Schedule of Investments | 15 |
MARSICO 21st CENTURY FUND | |
Investment Review | 16 |
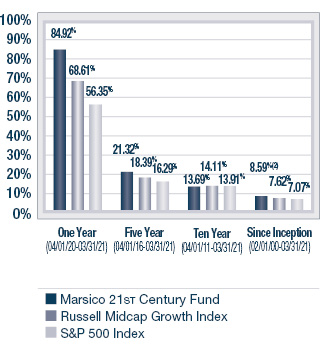
Fund Overview | 18 |
Schedule of Investments | 19 |
MARSICO INTERNATIONAL OPPORTUNITIES FUND |
Investment Review | 21 |
Fund Overview | 23 |
Schedule of Investments | 24 |
MARSICO GLOBAL FUND | |
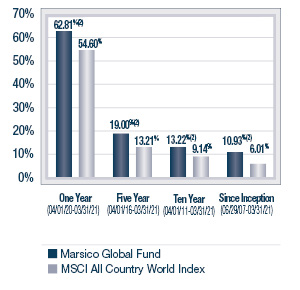
Investment Review | 27 |
Fund Overview | 29 |
Schedule of Investments | 30 |
FINANCIAL STATEMENTS | 32 |
NOTES TO FINANCIAL STATEMENTS | 42 |
EXPENSE EXAMPLE | 47 |
CONSIDERATION OF INVESTMENT ADVISORY AGREEMENTS | 48 |
OTHER INFORMATION | 51 |
1
KEY FUND STATISTICS (UNAUDITED) |
Marsico Focus Fund | Marsico Growth Fund | Marsico
21st Century
Fund |
| | MFOCX | | | MGRIX | | | MXXIX | |
For additional disclosures, please see page 10. | For additional disclosures, please see page 14. | For additional disclosures, please see page 18. |
PERFORMANCE COMPARISON(1) | PERFORMANCE COMPARISON(1) | PERFORMANCE COMPARISON(1) |
Average Annualized Returns | Average Annualized Returns | Average Annualized Returns |
| 
| 
|
TOTAL ANNUAL OPERATING EXPENSES* 1.49% NET EXPENSES*† 1.45% | TOTAL ANNUAL OPERATING EXPENSES* 1.50% NET EXPENSES*† 1.45% | TOTAL ANNUAL OPERATING EXPENSES* 1.40% |
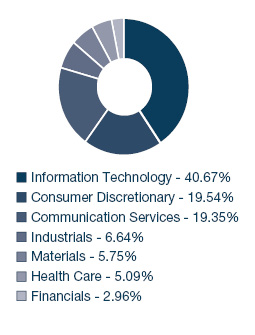
SECTOR ALLOCATION(3) | SECTOR ALLOCATION(3) | SECTOR ALLOCATION(3) |
| 
| 
|
TOP FIVE HOLDINGS | TOP FIVE HOLDINGS | TOP FIVE HOLDINGS |
| | | |
| | Amazon.com, Inc. | 7.25% | | | Microsoft Corporation | 7.54% | | | Snap, Inc. - Cl. A | 4.24% |
| | Microsoft Corporation | 6.88% | | | Amazon.com, Inc. | 6.72% | | | Lam Research Corporation | 3.56% |
| | The Walt Disney Company | 6.35% | | | Alphabet, Inc. - Cl. A | 5.00% | | | Lyft, Inc. - Cl. A | 3.33% |
| | Visa, Inc. - Cl. A | 6.04% | | | Apple, Inc. | 4.89% | | | Burlington Stores, Inc. | 2.76% |
| | Alphabet, Inc. - Cl. A | 5.74% | | | The Walt Disney Company | 4.18% | | | WEX, Inc. | 2.73% |
| | | | | | | | | | | |
For additional disclosures about the Marsico Funds, please see page 4. The performance data quoted here represent past performance, and past performance is not a guarantee of future results. Investment return and principal value of an investment will fluctuate so that an investor’s shares, when redeemed, may be worth more or less than their original cost.
2
KEY FUND STATISTICS (UNAUDITED) |
Marsico International
Opportunities Fund | Marsico Global Fund |
| | MIOFX | | | MGLBX | |
For additional disclosures, please see page 23. | For additional disclosures, please see page 29. |
PERFORMANCE COMPARISON(1) | PERFORMANCE COMPARISON(1) |
Average Annualized Returns | Average Annualized Returns |
| 
|
TOTAL ANNUAL OPERATING EXPENSES* 1.81% NET EXPENSES*† 1.50% | TOTAL ANNUAL OPERATING EXPENSES* 1.73% NET EXPENSES*† 1.50% |
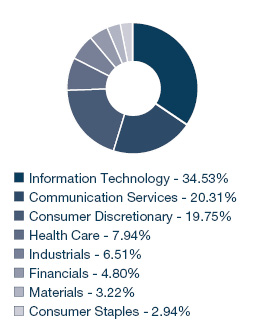
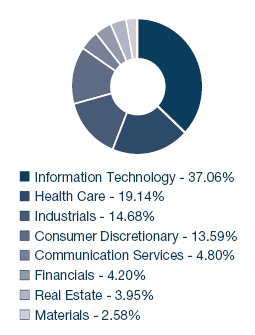
SECTOR ALLOCATION(3) | SECTOR ALLOCATION(3) |
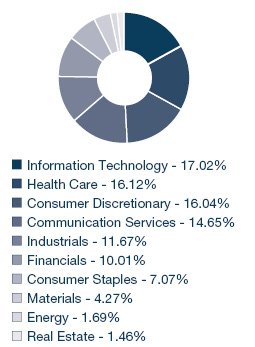
| 
|
TOP FIVE HOLDINGS | TOP FIVE HOLDINGS |
| | | | | | | | |
| | Alibaba Group Holding Ltd. Spon. ADR | 3.72% | | | Amazon.com, Inc. | 6.24% | |
| | Tencent Holdings Ltd. | 3.69% | | | Microsoft Corporation | 5.85% | |
| | Nestlé S.A. | 3.02% | | | ASML Holding N.V. - NY Reg. Shs. | 5.41% | |
| | AstraZeneca PLC | 2.90% | | | Tencent Holdings Ltd. ADR | 4.87% | |
| | Roche Holding AG | 2.88% | | | Facebook, Inc. - Cl. A | 4.70% | |
| | | | | | | | |
Current performance may be lower or higher than the performance information quoted. To obtain performance information current to the most recent month-end, please call 888-860-8686 or visit marsicofunds.com.
3
KEY FUND STATISTICS (UNAUDITED) |
ADDITIONAL DISCLOSURES ABOUT THE MARSICO FUNDS
* | The Total Annual Operating Expenses and Net Expenses are reflective of the information disclosed in the Funds’ Prospectus dated February 1, 2021. The information may differ from the expense ratios disclosed in this report. |
† | Marsico Capital Management, LLC (the “Adviser”) has entered into a written expense limitation and fee waiver agreement under which it has agreed to limit the total expenses of each Fund (excluding taxes, interest, acquired fund fees and expenses, litigation, extraordinary expenses, and brokerage and other transaction expenses relating to the purchase or sale of portfolio investments) to an annual rate of 1.50% of the average net assets of the International Opportunities Fund and the Global Fund and 1.45% of the average net assets of the Focus Fund and the Growth Fund until January 31, 2022. This expense limitation and fee waiver agreement may be terminated by the Adviser at any time after January 31, 2022, upon 15 days prior notice to the Fund and its administrator. The Adviser may recoup from a Fund fees previously waived or expenses previously reimbursed by the Adviser with respect to that Fund pursuant to this agreement (or a previous expense limitation agreement) if: (1) such recoupment by the Adviser does not cause the Fund, at the time of recoupment, to exceed the lesser of (a) the expense limitation in effect at the time the relevant amount was waived and/or reimbursed, or (b) the expense limitation in effect at the time of the proposed recoupment, and (2) the recoupment is made within three years after the fiscal year end date as of which the amount to be waived or reimbursed was determined and the waiver or reimbursement occurred. |
(1) | The performance data quoted here represent past performance, and past performance is not a guarantee of future results. Investment return and principal value of an investment will fluctuate so that an investor’s shares, when redeemed, may be worth more or less than their original cost. Current performance may be lower or higher than the performance information quoted. To obtain performance information current to the most recent month-end, please call 888-860-8686 or visit marsicofunds.com. |
| The performance included in the chart does not reflect the deduction of taxes on Fund distributions or the redemption of Fund shares. |
| All indices are unmanaged and investors cannot invest directly in an index. |
(2) | Periodically, certain fees and expenses have been waived or reimbursed by the Adviser for the Growth Fund, the 21st Century Fund, the International Opportunities Fund, and the Global Fund. In the absence of such a waiver or reimbursement, the performance returns reflected would have been reduced. In accordance with the expense limitation and fee waiver agreement, the Adviser may recoup fees and expenses previously waived or reimbursed under certain parameters. Periodically, the Adviser has recouped such fees or expenses from the Growth Fund, the 21st Century Fund, the International Opportunities Fund, and the Global Fund, resulting in a lower performance return. |
(3) | Sector weightings represent the percentage of the respective Fund’s investments (excluding cash equivalents) in certain general sectors. These sectors may include more than one industry. The Fund’s portfolio composition is subject to change at any time. |
4
MARKET ENVIRONMENT: OCTOBER 2020 – MARCH 2021 (UNAUDITED)
As we navigated the last six months, several key events shaped the path of the US economy, as well as the performance of the markets. These came in the form of increased COVID-19 vaccination efforts, continued policy support from both the Federal Reserve and the Biden administration, and a welcome decrease in the political unrest which dominated much of 2020. Outside the US, many countries’ vaccination efforts have been less successful, and we have recently witnessed several countries reinstating some form of lockdown measures. Amidst these headlines, global equity markets were strongly positive, and several indices ended the period at or near all-time highs.
The strength in markets was dramatic and we see two main catalysts for the move. First, approximately 30% of the US population over 18 has had at least one COVID-19 vaccine dose, and roughly 16% are fully vaccinated. The US is currently averaging administering 2.5 million vaccine doses per day. Many states have opened up vaccine eligibility to anyone over the age of 16, and all states have announced that they will meet a presidential directive to allow all adults to be eligible for vaccination by May 1.
While COVID-19 case counts may fluctuate as a result of new, more contagious variants, we anticipate that hospitalization and mortality rates will continue to decline as vaccination rates and potential immunity increase. In addition to strong data demonstrating efficacy in preventing infection, all three vaccines available in the US today (manufactured by Pfizer- BioNTech, Moderna, and Johnson & Johnson) have demonstrated a significant reduction in severe illness and a dramatic reduction in hospitalizations, although recent concerns regarding blood clots in patients receiving the Johnson & Johnson vaccine have stalled its use. Although it may be unlikely that COVID-19 will be eliminated entirely, our view is that a reduction in spread and severity should become more evident this year.
The second catalyst we see for the strength in markets was that Federal Reserve Chairman Jerome Powell has been committed to doing whatever is necessary to support the economy. He said that the US economy is at an “inflection point” with growth and hiring expected to speed up in the months ahead on the back of the ramp up in vaccinations and meaningful fiscal and monetary policy support. He added that the outlook has brightened substantially. While these comments about the economy were upbeat, he also stressed it would be “highly unlikely” that the Federal Reserve would raise rates this year.
Further policy support came when President Biden signed the American Rescue Plan Act. At $1.9 trillion, it’s one of the biggest spending bills in American history and strengthened economic momentum, with hundreds of billions of dollars earmarked for vaccination programs, expanded unemployment insurance, significant stimulus checks, state and local governments, school re-openings and more.
Global treasury markets also saw major movements during the period, best exemplified by the yield on the US 10-year Treasury Note rising dramatically. We believe this move was primarily due to two factors. First, the accelerating recent production and roll out of COVID-19 vaccines, coupled with a decline in COVID-19 cases, resulted in increased expectations of economic growth as the economy reopens. Second, the Biden administration’s support for additional direct stimulus to individuals in the form of checks and increased unemployment benefits, as well as additional government spending like the proposed “Infrastructure Bill,” have heightened expectations for continued fiscal economic stimulus. These factors resulted in rising expectations for economic growth and inflation, which are reflected in the dramatic move in the US 10-year Treasury note yield. It is our belief that economic growth will continue to rise while we remain in a period of structural deflation, mainly due to technology improvements and resulting labor efficiencies.
Following a solid February job report indicating that 468,000 new jobs were created, the US recovered 916,000 jobs in March, showing further signs of employment growth acceleration. The current hiring wave indicates more businesses are getting back on their feet approximately one year after the COVID-19 pandemic began. With an aggressive rollout of vaccines and warmer weather ahead, we believe that improvements in the labor market could remain at a robust pace for an extended period. Still, there is plenty of room for further recovery. Even if the labor market sustains monthly job growth at the pace of March’s gains, it would take nearly a year to recover all of the jobs lost across the nation during the COVID-19 pandemic.
5
The performance of global markets during the six-month fiscal period ended March 31, 2021 is depicted below. While US markets posted strong gains across the board for the period, small-capitalization US equities more than doubled the performance of US large- and mid-capitalization stocks. Emerging market equities outperformed compared to developed international equity markets.
Index Name(1) | Universe of
Equities Represented | Six-Month
Total Return (as of
March 31, 2021) |
US | | |
S&P 500 | US large-capitalization equities | +19.07% |
Russell 3000 | US publicly-traded equities of all sizes | +21.96% |
Russell 2000 | US small-capitalization equities | +48.05% |
Russell Mid-Cap Growth | US medium-capitalization equities | +18.35% |
Index Name(1) | Universe of
Equities Represented | Six-Month
Total Return (as of
March 31, 2021) |
INTERNATIONAL | |
MSCI EAFE (US$) | Equities in developed international equity markets, including Japan, Western Europe, and Australasia | +20.08% |
MSCI Emerging Markets (US$) | Equities in developing international equity markets, including China, India, Eastern Europe, and Latin America | +22.43% |
MSCI ACWI (US$) | Equities in the global developed and emerging markets | +19.93% |
Sincerely,
THE MARSICO INVESTMENT TEAM
(1) | All indices are unmanaged and investors cannot invest directly in an index. |
6
Investment Review BY TOM MARSICO AND BRANDON GEISLER (UNAUDITED)
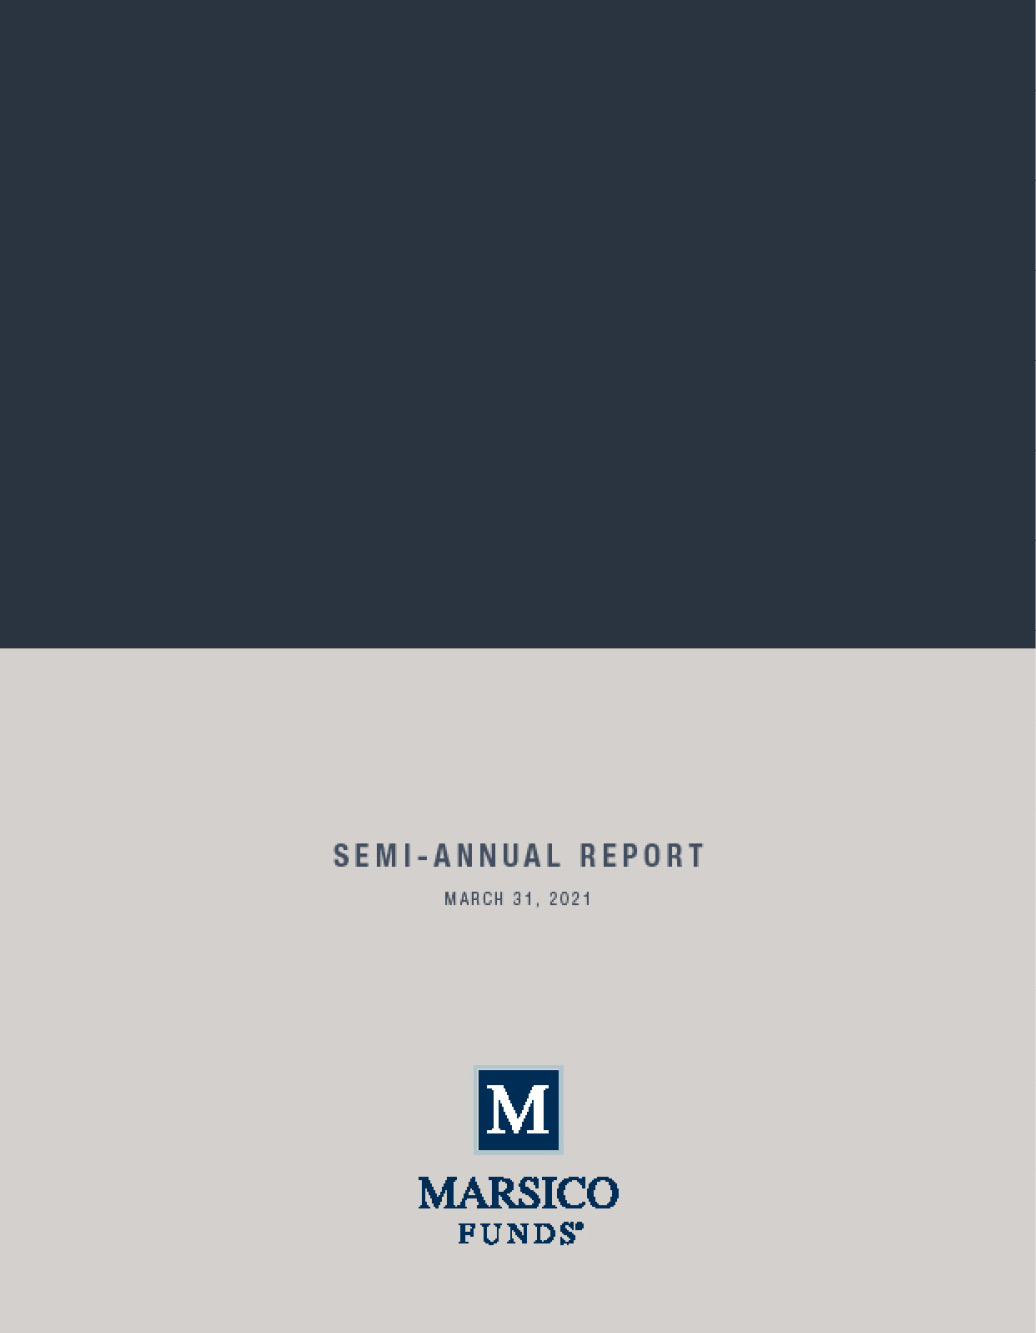
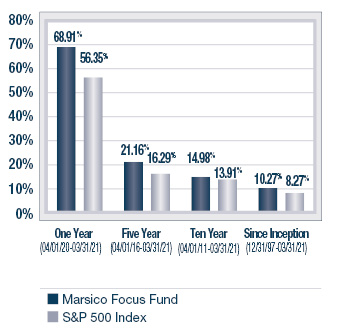
The Marsico Focus Fund posted a total return of +9.35% for the six-month fiscal period ended March 31, 2021. The Fund significantly underperformed its benchmark index, the S&P 500 Index, which had a total return of +19.07% over the same time period. Please see the Fund’s Overview for more detailed information about the Fund’s longer-term performance for various time periods ended March 31, 2021.
The performance data for the Fund quoted here represent past performance, and past performance is not a guarantee of future results. Investment return and principal value of an investment will fluctuate so that an investor’s shares, when redeemed, may be worth more or less than their original cost. Current performance may be lower or higher than the performance information quoted. To obtain performance information current to the most recent month-end, please call 888-860-8686 or visit marsicofunds.com.(1)
This review highlights Fund performance over a six-month fiscal period. Shareholders should keep in mind that the Fund is intended for long-term investors who hold their shares for substantially longer periods of time. You should also keep in mind that our current views and beliefs regarding all investments discussed in this report are subject to change at any time. References to specific securities, industries, and sectors discussed in this report are not recommendations to buy or sell such securities or related investments, and the Fund may not necessarily hold these securities or investments today. Please see the accompanying Schedule of Investments for the percentage of the Fund’s portfolio represented by the securities mentioned in this report as of the end of the reporting period.
The Focus Fund is non-diversified and may hold fewer securities than a diversified fund because it is permitted to invest a greater percentage of its assets in a smaller number of issuers. Holding securities of fewer issuers increases the risk that the value of the Fund could go down because of the poor performance of a single investment or may be more volatile than its benchmark. The Fund is subject to broad risks associated with investing in equity securities markets generally, including the risks that the securities and markets in which it invests may experience volatility and instability, that domestic and global economies and markets may undergo periods of cyclical change and decline, that investors may at times avoid investments in equity securities, and that investments may not perform as anticipated. Please see the Prospectus for more information.
The Fund is not managed to track its benchmark index, and may hold a substantially overweight or underweight position in a sector, industry, or security compared to its weight in the benchmark. The Fund may be subject to risks associated with a particular sector or other area in which it is overweight, including the risk that the stocks of companies within one area could simultaneously decline in price because of an event that affects the entire area. For informational purposes, the discussion below may compare the benchmark weight or performance of a sector or industry to the investment approach of the Fund.
The Focus Fund’s underperformance during the six-month period ended March 31, 2021, as compared to the S&P 500 Index, was primarily attributable to certain weaker- performing Fund holdings in several sectors including the Industrials, Financials, and Consumer Discretionary sectors, as defined in the Global Industry Classification Standard (“GICS”)(2). From a sector allocation perspective, the Fund’s relative performance was further dampened by maintaining an underweight position in the stronger-performing Financials sector of the benchmark index, having no investments in the Energy sector which was the strongest-performing sector, and maintaining an overweight stance in the weaker-performing Information Technology and Consumer Discretionary sectors.
In the Information Technology sector, Adobe, Inc. (“Adobe”) emerged as the largest overall detractor to performance (based on total effect) due to the Fund’s overweighted posture as compared to the benchmark index, as well as the stock’s negative total return (-3%). Adobe struggled as growth for the underlying business is beginning to mature and investors are looking elsewhere to gain leverage toward digital transformation. Adobe’s creative cloud business is best-in-class and helped drive top line and profit for Adobe over the last few years coming out of its transition toward a subscription model. This led to years of outperformance by the stock, and the Fund owned the name for a large portion of that time.
Financials sector holding S&P Global, Inc. (“SPGI”) hindered the Fund’s results (-6% before it was sold). We decided to sell SPGI as the valuation was stretched and the company is now entering a rising interest rate environment with spreads approaching all-time lows. Additionally, SPGI’s pending merger with IHS Markit Ltd. creates new operational and execution risks. While we continue to like SPGI as a company, we believe the current interest rate environment and risks surrounding the merger make further valuation upside limited while earnings growth decelerates.
7
In the Consumer Discretionary sector, online retailer Amazon.com, Inc. (“Amazon”) slid -2% for the period. The Fund’s overweighted posture in the stock relative to its benchmark index further detracted from results. Amazon underperformed during the period as investors gravitated toward companies tied to the reopening of businesses given the rollout of vaccinations globally and the belief that consumers will revert back to some normal off-line shopping, entertainment, and leisure habits as governments lift restrictions on entertainment and leisure activities. We believe that Amazon will return to outperformance as the market starts to appreciate the impressive growth Amazon continues to produce despite current comparisons of its results with strong e-commerce gains achieved a year ago during the COVID-19 pandemic. Most notably, we are optimistic that Amazon’s cloud computing and advertising solutions will offset the anticipated slowdown in the e-commerce division.
On the positive end of the spectrum, the Fund’s relative performance was boosted by having no exposure to the weakest-performing sector of the benchmark index, Consumer Staples, and an underweight allocation to the weaker-performing Health Care sector. In addition, certain stocks in the Communication Services sector, as well as individual stocks in other sectors, provided a tailwind for performance as discussed further below.
Lam Research Corporation (“Lam”) (+80%) emerged as the largest positive contributor to Fund performance during the period. This Information Technology sector stock has outperformed due to much stronger-than-expected fundamentals in the semiconductor industry resulting from widespread chip shortages. Lam makes many of the critical tools used in producing semiconductors, and demand for its products has increased dramatically during the current backdrop of chip shortages that continue to worsen for automakers, PC makers, and other major users of chips. Additionally, Lam has relatively high exposure to assembly of tools utilized in the production of memory chips, and the outlook for this segment has continued to improve. Lam’s order backlog has extended, leading to visibility well into 2022. Also, its higher-margin services business continues to grow as a portion of Lam’s enterprise, adding to more overall company revenue and earnings stability.
In the Communication Services sector, The Walt Disney Company (“Disney”) (+48%) added to returns as the company’s pivot of its model toward streaming and excitement around its parks business led to strong performance. The company reported it had over 95 million Disney+ subscribers in its most recent quarter, which illustrated the massive success that its streaming business has experienced in just one year since launching. The company has also been investing heavily in its parks business during the COVID-19 pandemic, and we expect a significant acceleration in that business line as we believe there is significant pent-up demand to travel and Disney has premier family assets to accommodate that demand.
During the reporting period, the Fund significantly increased exposure to the Communication Services sector. The Fund eliminated its holding in the Real Estate sector and decreased its allocations to the Consumer Discretionary, Information Technology and Health Care sectors. There were no significant changes to the Fund’s allocations to the Industrials, Materials and Financials sectors. The Fund maintained a 2% cash position on average, which increased to approximately 4% (as represented by the Fund’s short-term investments holding) at period-end.
8
Fiscal Period-End Investment Posture
As of March 31, 2021, the Fund’s largest sector allocations included Information Technology, Consumer Discretionary, and Communication Services. As of that date, the Fund had no investments in the Consumer Staples, Energy, Real Estate, and Utilities sectors.
Sincerely,
THOMAS F. MARSICO
BRANDON A. GEISLER
PORTFOLIO MANAGERS
(1) | Total returns are based on net change in net asset value assuming reinvestment of distributions. Please see the Prospectus for more information. |
(2) | Regarding GICS data cited throughout this report, the Global Industry Classification Standard was developed by and is the exclusive property and service mark of MSCI Inc. (“MSCI”) and Standard & Poor’s (“S&P”) and is licensed for use by Marsico Capital Management, LLC (the “Adviser”). Neither MSCI, S&P, nor the Adviser or any third party involved in compiling GICS makes any express or implied warranties or representations with respect to such standard or classification (or the results from use thereof), and all such parties hereby expressly disclaim all warranties of originality, accuracy, completeness, merchantability and fitness for a particular purpose with respect to any such standard or classification. MSCI, S&P, the Adviser, and any of their affiliates or third parties involved in compiling GICS shall not have any liability for any direct, indirect, special, punitive, consequential or any other damages (including lost profits) even if notified of the possibility of such damages. |
9
March 31, 2021 (Unaudited)
The Focus Fund is a non-diversified portfolio and invests primarily in the common stocks of large companies that are selected for their long-term growth potential. The Fund will normally hold a core position of between 20 and 35 common stocks.
TOTAL ANNUAL OPERATING EXPENSES* 1.49% NET EXPENSES*† 1.45% | NET ASSETS $822,199,239 | NET ASSET VALUE PER SHARE $25.74 |
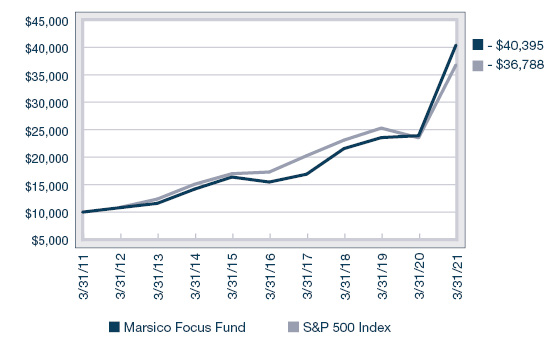
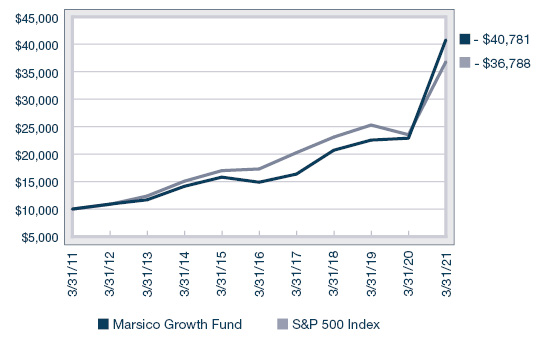
GROWTH OF $10,000(1)(2) | PERFORMANCE COMPARISON(1) |
| | Average Annualized Returns |
| 
|
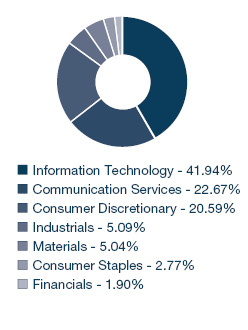
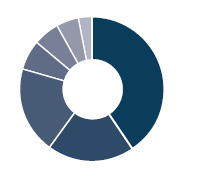
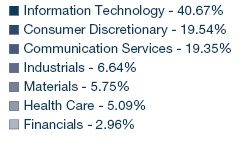
SECTOR ALLOCATION(3) | TOP FIVE HOLDINGS |
| | | | |
| | Amazon.com, Inc. | 7.25% | |
| | Microsoft Corporation | 6.88% | |
| | The Walt Disney Company | 6.35% | |
| | Visa, Inc. - Cl. A | 6.04% | |
| | Alphabet, Inc. - Cl. A | 5.74% | |
| | | | |
* | The Total Annual Operating Expenses and Net Expenses are reflective of the information disclosed in the Funds’ Prospectus dated February 1, 2021 and may differ from the expense ratios disclosed in this report. |
† | Marsico Capital Management, LLC (the “Adviser”) has entered into a written expense limitation and fee waiver agreement under which it has agreed to limit the total expenses of the Focus Fund (excluding taxes, interest, acquired fund fees and expenses, litigation, extraordinary expenses, and brokerage and other transaction expenses relating to the purchase or sale of portfolio investments) to an annual rate of 1.45% of the Fund’s average net assets until January 31, 2022. This expense limitation and fee waiver agreement may be terminated by the Adviser at any time after January 31, 2022 upon 15 days prior notice to the Fund and its administrator. The Adviser may recoup from the Fund fees previously waived or expenses previously reimbursed by the Adviser with respect to that Fund pursuant to this agreement (or a previous expense limitation agreement) if: (1) such recoupment by the Adviser does not cause the Fund, at the time of recoupment, to exceed the lesser of (a) the expense limitation in effect at the time the relevant amount was waived and/or reimbursed, or (b) the expense limitation in effect at the time of the proposed recoupment, and (2) the recoupment is made within three years after the fiscal year end date as of which the amount to be waived or reimbursed was determined and the waiver or reimbursement occurred. |
(1) | The performance data quoted here represent past performance, and past performance is not a guarantee of future results. Investment return and principal value of an investment will fluctuate so that an investor’s shares, when redeemed, may be worth more or less than their original cost. Current performance may be lower or higher than the performance information quoted. To obtain performance information current to the most recent month-end, please call 888-860-8686 or visit marsicofunds.com. |
| The performance included in the chart and graph does not reflect the deduction of taxes on Fund distributions or the redemption of Fund shares. |
| All indices are unmanaged and investors cannot invest directly in an index. |
(2) | This chart assumes an initial investment of $10,000 made on March 31, 2011. Total returns are based on net change in NAV, assuming reinvestment of distributions. |
(3) | Sector weightings represent the percentage of the Fund’s investments (excluding cash equivalents) in certain general sectors. These sectors may include more than one industry. The Fund’s portfolio composition is subject to change at any time. |
10
MARSICO FOCUS FUND
SCHEDULE OF INVESTMENTS
March 31, 2021 (Unaudited)
| | | Number
of
Shares | | | Value | | | Percent
of Net
Assets | |
COMMON STOCKS^ | | | | | | | | | | | | |
Air Freight & Logistics | | | | | | | | | | | | |
United Parcel Service, Inc. - Cl. B | | | 166,234 | | | $ | 28,258,118 | | | | 3.44 | % |
| | | | | | | | | | | | | |
Apparel, Accessories & Luxury Goods | | | | |
lululemon athletica, inc.* | | | 52,632 | | | | 16,142,761 | | | | 1.96 | |
| | | | | | | | | | | | | |
Application Software | | | | | | | | | | | | |
Adobe, Inc.* | | | 53,610 | | | | 25,484,586 | | | | 3.10 | |
| | | | | | | | | | | | | |
Consumer Finance | | | | | | | | | | | | |
American Express Co. | | | 165,792 | | | | 23,449,620 | | | | 2.85 | |
| | | | | | | | | | | | | |
Data Processing & Outsourced Services | | | | |
PayPal Holdings, Inc.* | | | 97,873 | | | | 23,767,479 | | | | 2.89 | |
Square, Inc. - Cl. A* | | | 81,561 | | | | 18,518,425 | | | | 2.25 | |
Visa, Inc. - Cl. A | | | 234,385 | | | | 49,626,336 | | | | 6.04 | |
| | | | | | | 91,912,240 | | | | 11.18 | |
Footwear | | | | |
NIKE, Inc. - Cl. B | | | 180,748 | | | | 24,019,602 | | | | 2.92 | |
| | | | | | | | | | | | | |
Health Care Equipment | | | | | | | | | | | | |
Danaher Corporation | | | 105,369 | | | | 23,716,455 | | | | 2.89 | |
Intuitive Surgical, Inc.* | | | 22,515 | | | | 16,637,234 | | | | 2.02 | |
| | | | | | | 40,353,689 | | | | 4.91 | |
Interactive Home Entertainment | | | | | | | | |
Sea Ltd. ADR* | | | 35,198 | | | | 7,857,250 | | | | 0.96 | |
| | | | | | | | | | | | | |
Interactive Media & Services | | | | |
Alphabet, Inc. - Cl. A* | | | 22,894 | | | | 47,219,333 | | | | 5.74 | |
Facebook, Inc. - Cl. A* | | | 121,838 | | | | 35,884,946 | | | | 4.36 | |
Snap, Inc. - Cl. A* | | | 195,686 | | | | 10,232,421 | | | | 1.25 | |
| | | | | | | 93,336,700 | | | | 11.35 | |
Internet & Direct Marketing Retail | | | | | | | | |
Amazon.com, Inc.* | | | 19,268 | | | | 59,616,733 | | | | 7.25 | |
| | | | | | | | | | | | | |
Metal & Glass Containers | | | | | | | | | | | | |
Ball Corporation | | | 160,448 | | | | 13,596,363 | | | | 1.65 | |
| | | | | | | | | | | | | |
Movies & Entertainment | | | | | | | | | | | | |
The Walt Disney Company* | | | 282,962 | | | | 52,212,148 | | | | 6.35 | |
| | | | | | | | | | | | | |
Railroads | | | | | | | | | | | | |
Canadian Pacific Railway Ltd. | | | 64,241 | | | | 24,365,969 | | | | 2.96 | |
| | | | | | | | | | | | | |
Restaurants | | | | | | | | | | | | |
Chipotle Mexican Grill, Inc.* | | | 12,733 | | | | 18,091,301 | | | | 2.20 | |
Starbucks Corp. | | | 338,934 | | | | 37,035,318 | | | | 4.50 | |
| | | | | | | 55,126,619 | | | | 6.70 | |
COMMON STOCKS^ (continued) | | | | | | | | |
Semiconductor Equipment | | | | | | | | | | | | |
Lam Research Corporation | | | 47,205 | | | | 28,098,304 | | | | 3.42 | % |
| | | | | | | | | | | | | |
Semiconductors | | | | | | | | | | | | |
NVIDIA Corporation | | | 59,664 | | | | 31,856,400 | | | | 3.87 | |
Taiwan Semiconductor Manufacturing Co., Ltd. Spon. ADR | | | 195,665 | | | | 23,143,256 | | | | 2.82 | |
| | | | | | | 54,999,656 | | | | 6.69 | |
Specialty Chemicals | | | | | | | | | | | | |
The Sherwin-Williams Company | | | 43,393 | | | | 32,024,468 | | | | 3.90 | |
| | | | | | | | | | | | | |
Systems Software | | | | | | | | | | | | |
Microsoft Corporation | | | 239,819 | | | | 56,542,125 | | | | 6.88 | |
ServiceNow, Inc.* | | | 65,790 | | | | 32,902,237 | | | | 4.00 | |
| | | | | | | 89,444,362 | | | | 10.88 | |
Technology Hardware, Storage & Peripherals | | | | |
Apple, Inc. | | | 265,921 | | | | 32,482,250 | | | | 3.95 | |
| | | | | | | | | | | | | |
TOTAL COMMON STOCKS | | | | | | | | | | | | |
(Cost $417,370,134) | | | | | | | 792,781,438 | | | | 96.42 | |
| | | | | | | | | | | | |
SHORT-TERM INVESTMENTS^ | | | | | | | | |
State Street Institutional Treasury Money Market Fund - Premier Class, 0.000% | | | 31,197,813 | | | | 31,197,813 | | | | 3.80 | |
| | | | | | | | | | | | | |
TOTAL SHORT-TERM INVESTMENTS | | | | | | | | |
(Cost $31,197,813) | | �� | | | | | 31,197,813 | | | | 3.80 | |
| | | | | | | | | | | | | |
TOTAL INVESTMENTS | | | | | | | | | | | | |
(Cost $448,567,947) | | | | | | | 823,979,251 | | | | 100.22 | |
| | | | | | | | | | | | | |
Liabilities, Less Cash and Other Assets | | | | | | | (1,780,012 | ) | | | (0.22 | ) |
| | | | | | | | | | | | | |
NET ASSETS | | | | | | $ | 822,199,239 | | | | 100.00 | % |
^ | As of March 31, 2021, all investments were classified as Level 1 with their corresponding fair valuation disclosed in the above Schedule of Investments. For more information on investment valuation and valuation inputs, refer to Note 2(a) in the Notes to Financial Statements. |
| See notes to financial statements. |
11
Investment Review BY TOM MARSICO, BRANDON GEISLER, PETER MARSICO, AND JIMMY MARSICO (UNAUDITED)
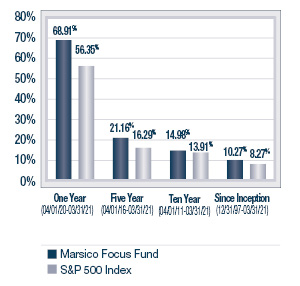
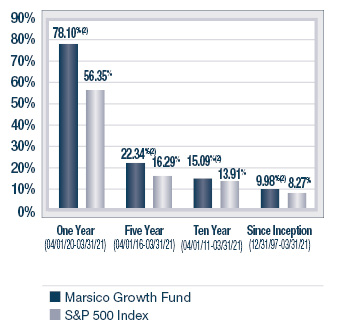
The Marsico Growth Fund posted a total return of +14.11% for the six-month fiscal period ended March 31, 2021. The Fund underperformed the S&P 500 Index, the Fund’s benchmark index, which had a total return of +19.07% over the same time period. Please see the Fund’s Overview for more detailed information about the Fund’s longer-term performance for various time periods ended March 31, 2021.
The performance data for the Fund quoted here represent past performance, and past performance is not a guarantee of future results. Investment return and principal value of an investment will fluctuate so that an investor’s shares, when redeemed, may be worth more or less than their original cost. Current performance may be lower or higher than the performance information quoted. To obtain performance information current to the most recent month-end, please call 888-860-8686 or visit marsicofunds.com.(1)
This review highlights Fund performance over a six-month fiscal period. Shareholders should keep in mind that the Fund is intended for long-term investors who hold their shares for substantially longer periods of time. You should also keep in mind that our current views and beliefs regarding all investments discussed in this report are subject to change at any time. References to specific securities, industries, and sectors discussed in this report are not recommendations to buy or sell such securities or related investments, and the Fund may not necessarily hold these securities or investments today. Please see the accompanying Schedule of Investments for the percentage of the Fund’s portfolio represented by the securities mentioned in this report as of the end of the reporting period.
The Fund is subject to broad risks associated with investing in equity securities markets generally, including the risks that the securities and markets in which it invests may experience volatility and instability, that domestic and global economies and markets may undergo periods of cyclical change and decline, that investors may at times avoid investments in equity securities, and that investments may not perform as anticipated. Please see the Prospectus for more information.
The Fund is not managed to track its benchmark index, and may hold a substantially overweight or underweight position in a sector, industry, or security compared to its weight in the benchmark. The Fund may be subject to risks associated with a particular sector or other area in which it is overweight, including the risk that the stocks of companies within one area could simultaneously decline in price because of an event that affects the entire area. For informational purposes, the discussion below may compare the benchmark weight or performance of a sector or industry to the investment approach of the Fund.
The Growth Fund’s underperformance during the six-month period ended March 31, 2021, as compared to the S&P 500 Index, was in part attributable to certain weaker- performing Fund holdings in the Information Technology, Health Care, and Consumer Discretionary sectors as defined in the Global Industry Classification Standard (“GICS”). From a sector allocation perspective, the Fund’s relative performance was dampened by maintaining an underweight allocation in the strong-performing Financials sector of the benchmark index, having no investments in the Energy sector which was the strongest-performing sector, and maintaining an overweight stance in the weaker-performing Consumer Discretionary sector.
In the Heath Care sector, Pharmaceuticals Biotechnology & Life Sciences holding Zoetis, Inc. (“Zoetis”) detracted from performance due to the Fund’s overweighted posture, as compared to the benchmark index, coupled with a negative total return (-5%). Zoetis is the industry leader in animal health medicines and vaccines. Although the company exceeded expectations in its core companion animal business, investors were concerned overall with the impact of COVID-19 on new product launches, as well as the company’s existing products for this segment. In addition, livestock conditions have remained volatile as swine production was impacted by the African Swine Fever outbreak in China. COVID-19 has also impacted food consumption behavior as restaurants have not remained at full capacity during the pandemic. We expect these conditions to normalize as COVID-19 fades globally, subject to potential volatility if there are further outbreaks.
In a similar vein, in the Information Technology sector, Adobe, Inc. (“Adobe”) detracted from performance due to the Fund’s overweighted posture, as compared to the benchmark index, as well as the stock’s negative total return (-5%). Adobe struggled as growth for the underlying business is beginning to mature and investors are looking elsewhere to gain leverage toward digital transformation. Adobe’s creative cloud business is best-in-class and helped drive top line and profit for Adobe over the last few years coming out of its transition toward a subscription model. This led to years of outperformance by the stock, and the Fund owned the name for a large portion of that time.
In the Consumer Discretionary sector, online retailer Amazon.com, Inc. (“Amazon”) slid -2% for the period. The Fund’s overweighted posture in the stock further detracted from results. Amazon underperformed during the period as investors gravitated toward companies tied to the reopening of businesses given the rollout of vaccinations globally and the belief that consumers will revert back to some normal off-line shopping, entertainment, and leisure habits as governments lift restrictions on entertainment and leisure activities. We believe that Amazon will return to outperformance as the market starts
12
to appreciate the impressive growth Amazon continues to produce despite current comparisons of its results with strong e-commerce gains achieved a year ago during the COVID-19 pandemic. Most notably, we are optimistic that Amazon’s cloud computing and advertising solutions will offset the anticipated slowdown in the e-commerce division.
On the positive end of the spectrum, the Fund’s performance was boosted relative to its benchmark index by having an underweight posture to the weakest-performing sector of the index, Consumer Staples. In addition, certain stocks in the Communication Services and Consumer Discretionary sectors as well as other individual contributors provided a tailwind as discussed further below.
In the Communication Services sector, Snap, Inc. - Cl. A (“SNAP”) (+102%) emerged as the strongest individual contributor to performance overall. SNAP has massively accelerated its engagement, revenue, and profit in the midst of the pandemic. While the company struggled coming out of its 2017 initial public offering and experienced turnover in its management team, we believe the company has turned the corner, and that improvements to the product are causing investors to come back to the name given the substantial opportunity SNAP has to continue to grow. We see this outperformance as only scratching the surface of potential growth for the company.
In the Software & Services sector, Square, Inc. – Cl. A (“Square”) returned +36% during the period as the explosive growth experienced for its Cash App ecosystem led to a massive re-rating of the stock. In the midst of the COVID-19 pandemic, consumers and small businesses were forced to digitize many of their banking and financial needs due to lack of human contact. With this development, Square’s Cash App helped clients meet these needs through its mobile-first ecosystem which provides a wide breadth of payments and banking services. This transition away from traditional banking had been occurring slowly prior to the pandemic, but moved forward at an exponential pace as a result of COVID-19. We see this as only an early phase of the acceleration of online banking and financial services, and believe that Square may continue to be a strong contributor to the Fund moving forward.
During the reporting period, the Fund increased exposure to the Communication Services, Industrials, Consumer Discretionary, and Financials sectors. The Fund eliminated its holding in the Real Estate sector and decreased its allocations to the Health Care and Information Technology sectors. There were no significant changes to the Fund’s allocations to the Consumer Staples and Materials sectors. The Fund maintained a 2% cash position on average, which increased slightly to 3% (as represented by the Fund’s short-term investments holding) at period-end.
Fiscal Period-End Investment Posture
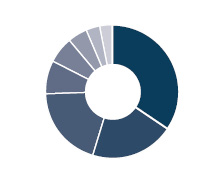
As of March 31, 2021, the Fund’s largest sector allocations included Information Technology, Communication Services, and Consumer Discretionary. As of that date, the Fund had no investments in the Energy, Real Estate, and Utilities sectors.
Other Developments
Effective December 21, 2020, James D. Marsico became co-manager of the Growth Fund with Thomas F. Marsico, Brandon A. Geisler, and Peter C. Marsico.
Sincerely,
THOMAS F. MARSICO
BRANDON A. GEISLER
PETER C. MARSICO
JAMES D. MARSICO
PORTFOLIO MANAGERS
(1) | Total returns are based on net change in net asset value assuming reinvestment of distributions. Periodically, certain fees and expenses have been waived or reimbursed by the Adviser for the Growth Fund. In the absence of such a waiver or reimbursement, the performance returns reflected would have been reduced. In accordance with the expense limitation and fee waiver agreement, the Adviser may recoup fees and expenses previously waived or reimbursed under certain parameters. Periodically, the Adviser has recouped such fees or expenses from the Growth Fund, resulting in a lower performance return. Please see the Prospectus for more information. |
13
March 31, 2021 (Unaudited)
The Growth Fund is a diversified portfolio and invests primarily in the common stocks of large companies that are selected for their long-term growth potential. The Growth Fund will normally hold a core position of up to 50 common stocks.
TOTAL ANNUAL OPERATING EXPENSES* 1.50% NET EXPENSES*† 1.45% | NET ASSETS $446,571,135 | NET ASSET VALUE PER SHARE $26.86 |
GROWTH OF $10,000(1)(2)(3) | PERFORMANCE COMPARISON(1) |
| | Average Annualized Returns |
| 
|
SECTOR ALLOCATION(4) | TOP FIVE HOLDINGS |
| | | | |
| | Microsoft Corporation | 7.54% | |
| | Amazon.com, Inc. | 6.72% | |
| | Alphabet, Inc. - Cl. A | 5.00% | |
| | Apple, Inc. | 4.89% | |
| | The Walt Disney Company | 4.18% | |
| | | | |
* | The Total Annual Operating Expenses and Net Expenses are reflective of the information disclosed in the Funds’ Prospectus dated February 1, 2021 and may differ from the expense ratios disclosed in this report. |
† | Marsico Capital Management, LLC (the “Adviser”) has entered into a written expense limitation and fee waiver agreement under which it has agreed to limit the total expenses of the Growth Fund (excluding taxes, interest, acquired fund fees and expenses, litigation, extraordinary expenses, and brokerage and other transaction expenses relating to the purchase or sale of portfolio investments) to an annual rate of 1.45% of the Fund’s average net assets until January 31, 2022. This expense limitation and fee waiver agreement may be terminated by the Adviser at any time after January 31, 2022 upon 15 days prior notice to the Fund and its administrator. The Adviser may recoup from the Fund fees previously waived or expenses previously reimbursed by the Adviser with respect to that Fund pursuant to this agreement (or a previous expense limitation agreement) if: (1) such recoupment by the Adviser does not cause the Fund, at the time of recoupment, to exceed the lesser of (a) the expense limitation in effect at the time the relevant amount was waived and/or reimbursed, or (b) the expense limitation in effect at the time of the proposed recoupment, and (2) the recoupment is made within three years after the fiscal year end date as of which the amount to be waived or reimbursed was determined and the waiver or reimbursement occurred. |
(1) | The performance data quoted here represent past performance, and past performance is not a guarantee of future results. Investment return and principal value of an investment will fluctuate so that an investor’s shares, when redeemed, may be worth more or less than their original cost. Current performance may be lower or higher than the performance information quoted. To obtain performance information current to the most recent month-end, please call 888-860-8686 or visit marsicofunds.com. |
| The performance included in the chart and graph does not reflect the deduction of taxes on Fund distributions or the redemption of Fund shares. |
| All indices are unmanaged and investors cannot invest directly in an index. |
(2) | Periodically, certain fees and expenses have been waived or reimbursed by the Adviser for the Growth Fund. In the absence of such a waiver or reimbursement, the performance returns reflected would have been reduced. In accordance with the expense limitation and fee waiver agreement, the Adviser may recoup fees and expenses previously waived or reimbursed under certain parameters. Periodically, the Adviser has recouped such fees or expenses from the Growth Fund, resulting in a lower performance return. |
(3) | This chart assumes an initial investment of $10,000 made on March 31, 2011. Total returns are based on net change in NAV, assuming reinvestment of distributions. |
(4) | Sector weightings represent the percentage of the Fund’s investments (excluding cash equivalents) in certain general sectors. These sectors may include more than one industry. The Fund’s portfolio composition is subject to change at any time. |
14
MARSICO GROWTH FUND
SCHEDULE OF INVESTMENTS
March 31, 2021 (Unaudited)
| | | Number
of
Shares | | | Value | | | Percent
of Net
Assets | |
COMMON STOCKS^ | | | | | | | | | | | | |
Apparel Retail | | | | | | | | | | | | |
Burlington Stores, Inc.* | | | 40,848 | | | $ | 12,205,382 | | | | 2.73 | % |
| | | | | | | | | | | | | |
Application Software | | | | | | | | | | | | |
Adobe, Inc.* | | | 14,951 | | | | 7,107,257 | | | | 1.59 | |
| | | | | | | | | | | | | |
Automobile Manufacturers | | | | | | | | | | | | |
Tesla, Inc.* | | | 5,680 | | | | 3,793,842 | | | | 0.85 | |
| | | | | | | | | | | | | |
Consumer Finance | | | | | | | | | | | | |
American Express Co. | | | 83,001 | | | | 11,739,661 | | | | 2.63 | |
| | | | | | | | | | | | | |
Data Processing & Outsourced Services |
Mastercard, Inc. - Cl. A | | | 50,969 | | | | 18,147,513 | | | | 4.06 | |
PayPal Holdings, Inc.* | | | 66,261 | | | | 16,090,821 | | | | 3.60 | |
Square, Inc. - Cl. A* | | | 41,839 | | | | 9,499,545 | | | | 2.13 | |
Visa, Inc. - Cl. A | | | 60,403 | | | | 12,789,127 | | | | 2.87 | |
| | | | | | | 56,527,006 | | | | 12.66 | |
Financial Exchanges & Data | | | | |
S&P Global, Inc. | | | 25,935 | | | | 9,151,684 | | | | 2.05 | |
| | | | | | | | | | | | |
Health Care Equipment | | | | | | | | | | | | |
Danaher Corporation | | | 45,129 | | | | 10,157,635 | | | | 2.27 | |
Edwards Lifesciences Corp.* | | | 72,371 | | | | 6,053,111 | | | | 1.36 | |
Intuitive Surgical, Inc.* | | | 12,084 | | | | 8,929,351 | | | | 2.00 | |
| | | | | | | 25,140,097 | | | | 5.63 | |
Interactive Home Entertainment | | | | | | | | |
Sea Ltd. ADR* | | | 71,275 | | | | 15,910,718 | | | | 3.56 | |
| | | | | | | | | | | | | |
Interactive Media & Services | | | | | | | | |
Alphabet, Inc. - Cl. A* | | | 10,823 | | | | 22,322,654 | | | | 5.00 | |
Facebook, Inc. - Cl. A* | | | 52,337 | | | | 15,414,816 | | | | 3.45 | |
Snap, Inc. - Cl. A* | | | 119,086 | | | | 6,227,007 | | | | 1.39 | |
Twitter, Inc.* | | | 96,609 | | | | 6,147,231 | | | | 1.38 | |
| | | | | | | 50,111,708 | | | | 11.22 | |
Internet & Direct Marketing Retail | | | | | | | | |
Amazon.com, Inc.* | | | 9,708 | | | | 30,037,329 | | | | 6.72 | |
Booking Holdings, Inc.* | | | 4,540 | | | | 10,577,473 | | | | 2.37 | |
| | | | | | | 40,614,802 | | | | 9.09 | |
Internet Services & Infrastructure | | | | |
Shopify, Inc. - Cl. A* | | | 3,944 | | | | 4,364,036 | | | | 0.98 | |
Twilio, Inc. - Cl. A* | | | 18,255 | | | | 6,220,574 | | | | 1.39 | |
| | | | | | | 10,584,610 | | | | 2.37 | |
Movies & Entertainment | | | | | | | | | | | | |
Spotify Technology S.A.* | | | 13,758 | | | | 3,686,456 | | | | 0.83 | |
The Walt Disney Company* | | | 101,289 | | | | 18,689,846 | | | | 4.18 | |
| | | | | | | 22,376,302 | | | | 5.01 | |
COMMON STOCKS^ (continued) | | | | | | | | |
Personal Products | | | | | | | | | | | | |
The Estee Lauder Companies, Inc. – Cl. A | | | 43,996 | | | | 12,796,237 | | | | 2.87 | % |
| | | | | | | | | | | | | |
Pharmaceuticals | | | | | | | | | | | | |
Zoetis, Inc. | | | 59,758 | | | | 9,410,690 | | | | 2.11 | |
| | | | | | | | | | | | | |
Research & Consulting Services | | | | | | | | |
CoStar Group, Inc.* | | | 5,308 | | | | 4,362,592 | | | | 0.98 | |
| | | | | | | | | | | | | |
Restaurants | | | | | | | | | | | | |
Chipotle Mexican Grill, Inc.* | | | 9,822 | | | | 13,955,294 | | | | 3.13 | |
Starbucks Corp. | | | 140,613 | | | | 15,364,783 | | | | 3.44 | |
| | | | | | | 29,320,077 | | | | 6.57 | |
Semiconductors | | | | | | | | | | | | |
NVIDIA Corporation | | | 18,486 | | | | 9,870,230 | | | | 2.21 | |
| | | | | | | | | | | | | |
Specialty Chemicals | | | | | | | | | | | | |
The Sherwin-Williams Company | | | 18,996 | | | | 14,019,238 | | | | 3.14 | |
| | | | | | | | | | | | | |
Systems Software | | | | | | | | | | | | |
Microsoft Corporation | | | 142,810 | | | | 33,670,314 | | | | 7.54 | |
ServiceNow, Inc.* | | | 21,274 | | | | 10,639,340 | | | | 2.38 | |
| | | | | | | 44,309,654 | | | | 9.92 | |
Technology Hardware, Storage & Peripherals | | | | |
Apple, Inc. | | | 178,819 | | | | 21,842,741 | | | | 4.89 | |
| | | | | | | | | | | | | |
Trucking | | | | | | | | | | | | |
Lyft, Inc. - Cl. A* | | | 147,028 | | | | 9,289,229 | | | | 2.08 | |
Uber Technologies, Inc.* | | | 269,342 | | | | 14,681,833 | | | | 3.29 | |
| | | | | | | 23,971,062 | | | | 5.37 | |
TOTAL COMMON STOCKS | | | | | | | | | | | | |
(Cost $243,630,780) | | | | | | | 435,165,590 | | | | 97.45 | |
| | | | | | | | | | | | |
SHORT-TERM INVESTMENTS^ | | | | | | | | |
State Street Institutional Treasury Money Market Fund - Premier Class, 0.000% | | | 13,528,388 | | | | 13,528,388 | | | | 3.03 | |
| | | | | | | | | | | | | |
TOTAL SHORT-TERM INVESTMENTS | | | | | | | | |
(Cost $13,528,388) | | | | | | | 13,528,388 | | | | 3.03 | |
| | | | | | | | | | | | | |
TOTAL INVESTMENTS | | | | | | | | | | | | |
(Cost $257,159,168) | | | | | | | 448,693,978 | | | | 100.48 | |
| | | | | | | | | | | | | |
Liabilities, Less Cash and Other Assets | | | | | | | (2,122,843 | ) | | | (0.48 | ) |
| | | | | | | | | | | | | |
NET ASSETS | | | | | | $ | 446,571,135 | | | | 100.00 | % |
^ | As of March 31, 2021, all investments were classified as Level 1 with their corresponding fair valuation disclosed in the above Schedule of Investments. For more information on investment valuation and valuation inputs, refer to Note 2(a) in the Notes to Financial Statements. |
| See notes to financial statements. |
15
Investment Review BY BRANDON GEISLER (UNAUDITED)
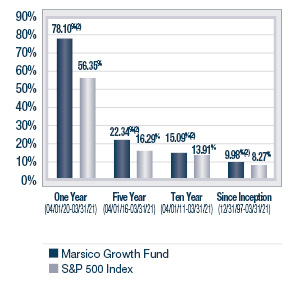
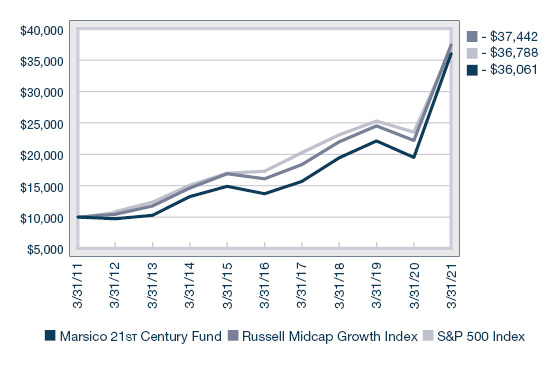
The Marsico 21st Century Fund posted a total return of +26.15% for the six-month fiscal period ended March 31, 2021. The Fund strongly outperformed the Russell Midcap Growth Index, the Fund’s primary benchmark, which had a total return of +18.35% over the same time period. Please see the Fund’s Overview for more detailed information about the Fund’s longer-term performance for various time periods ended March 31, 2021.
The performance data for the Fund quoted here represent past performance, and past performance is not a guarantee of future results. Investment return and principal value of an investment will fluctuate so that an investor’s shares, when redeemed, may be worth more or less than their original cost. Current performance may be lower or higher than the performance information quoted. To obtain performance information current to the most recent month-end, please call 888-860-8686 or visit marsicofunds.com.(1)
This review highlights Fund performance over a six-month fiscal period. Shareholders should keep in mind that the Fund is intended for long-term investors who hold their shares for substantially longer periods of time. You should also keep in mind that our current views and beliefs regarding all investments discussed in this report are subject to change at any time. References to specific securities, industries, and sectors discussed in this report are not recommendations to buy or sell such securities or related investments, and the Fund may not necessarily hold these securities or investments today. Please see the accompanying Schedule of Investments for the percentage of the Fund’s portfolio represented by the securities mentioned in this report as of the end of the reporting period.
The Fund is subject to broad risks associated with investing in equity securities markets generally, including the risks that the securities and markets in which it invests may experience volatility and instability, that domestic and global economies and markets may undergo periods of cyclical change and decline, that investors may at times avoid investments in equity securities, and that investments may not perform as anticipated. Please see the Prospectus for more information.
The Fund is not managed to track its benchmark index, and may hold a substantially overweight or underweight position in a sector, industry, or security compared to its weight in the benchmark. The Fund may be subject to risks associated with a particular sector or other area in which it is overweight, including the risk that the stocks of companies within one area could simultaneously decline in price because of an event that affects the entire area. For informational purposes, the discussion below may compare the benchmark weight or performance of a sector or industry to the investment approach of the Fund.
The 21st Century Fund’s strong outperformance during the six-month period ended March 31, 2021 as compared to its benchmark, the Russell Midcap Growth Index, was due in part to stronger-performing stocks in the Information Technology, Communication Services, and Industrials sectors. From a sector allocation perspective, Fund performance was boosted by having a lack of exposure to the weakest-performing sector of the benchmark index, Consumer Staples.
In the Communication Services sector, Snap, Inc. – Cl. A (“SNAP”) (+106%) emerged as the strongest individual contributor to performance overall. SNAP has massively accelerated its engagement, revenue, and profit in the midst of the pandemic. While the company struggled coming out of its 2017 initial public offering and experienced turnover in its management team, we believe the company has turned the corner, and that improvements to the product are causing investors to come back to the name given the substantial opportunity SNAP has to continue to grow. We see this outperformance as only scratching the surface of potential growth for the company, and have maintained a position in the company in the Fund.
In the Industrials sector, ride-hailing service Lyft, Inc. – Cl. A (“LYFT”) gained +130% as expectations for the business coming out of the COVID-19 pandemic have become much higher while vaccinations in the US have grown materially. During the second half of 2020, LYFT worked diligently to cut expenses and optimize the efficiency of its business, despite material losses to its revenue as a result of people staying at home. Coming out of the pandemic, we believe that LYFT is now well positioned to grow and take share of rides as pent-up demand for human interaction returns and people feel more comfortable participating in physical gatherings and events.
Information Technology holding Lam Research Corporation (“Lam”) (+80%) was a top performer for the Fund for the period. Lam has outperformed due to much stronger-than-expected fundamentals in the semiconductor industry resulting from widespread chip shortages. Lam makes many of the critical tools used in producing semiconductors, and demand for its products has increased dramatically during the current backdrop of chip shortages that continue to worsen for automakers, PC makers, and other major users of chips. Additionally, Lam has relatively high exposure to assembly of tools utilized in the production of memory chips, and the outlook for this segment has continued to improve. Lam’s order backlog has extended, leading to visibility well into 2022. Also, its higher-margin services business continues to grow as a portion of Lam’s enterprise, adding to more overall company revenue and earnings stability.
16
The Fund had a few weak spots during the period, including Real Estate sector stock SBA Communications Corporation – Cl. A (“SBA”), which declined (-13%). The company continues to be a very strong 5G wireless franchise in the Americas. While SBA performed well over the last several years, over the last six months it was negatively impacted by rising interest rates based on the long-duration of its cash flows. Over time, we expect interest rates to normalize, and believe that SBA will continue to grow its power base and capitalize on the opportunity that exists in 5G.
Other individual detractors from the Fund’s performance relative to its benchmark included Health Care sector holdings Adaptive Biotechnologies Corporation (-16%) and DexCom, Inc. (“Dex”) (-13%). Dex dropped due to near term pricing pressure concerns and a push-out of its next generation continuous glucose monitoring (“CGM”) platform. As the company has increased its market share and moved away from its traditional durable medical equipment distribution model, concerns have arisen about pricing for its current devices. The company is transitioning more sales into the pharmacy channel, which has lower revenue per device, but we believe these concerns will prove temporary. As this transition has occurred, company inventory has grown at a faster rate than revenues and the market has remained concerned about future margin impacts. In addition, the company delayed the launch of its next generation CGM device known as the G7 by six months due to clinical enrollment slowdown as a result of the current pandemic. The company will now launch the G7 in a limited capacity for 2021 and have a more significant launch in 2022.
During the reporting period, the Fund reduced its exposure to the Information Technology and Health Care sectors, and increased its allocations to the Industrials sector. There were no significant changes to the Fund’s allocations to the Financials, Communication Services, Consumer Discretionary, Materials, and Real Estate sectors.
Fiscal Period-End Investment Posture
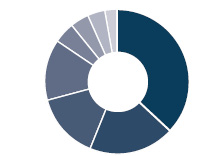
As of March 31, 2021, the Fund’s primary economic sector allocations included Information Technology, Health Care, Industrials, and Consumer Discretionary. At period end, the Fund had no investments in the Consumer Staples, Energy, and Utilities sectors.
Sincerely,
BRANDON A. GEISLER
PORTFOLIO MANAGER
(1) | Total returns are based on net change in net asset value assuming reinvestment of distributions. Periodically, certain fees and expenses have been waived or reimbursed by the Adviser for the 21st Century Fund. In the absence of such a waiver or reimbursement, the performance returns reflected would have been reduced. In accordance with the expense limitation and fee waiver agreement, the Adviser may recoup fees and expenses previously waived or reimbursed under certain parameters. Periodically, the Adviser has recouped such fees or expenses from the 21st Century Fund, resulting in a lower performance return. Please see the Prospectus for more information. |
17
21st CENTURY Fund Overview |
March 31, 2021 (Unaudited)
The 21st Century Fund is a diversified portfolio and invests primarily in common stocks that are selected for their long-term growth potential. The Fund may invest in companies of any size. The portions of Fund assets invested in large-capitalization, medium-capitalization, or small-capitalization companies will vary based on market conditions, depending on the portfolio manager’s judgment as to how to achieve the Fund’s investment objective. Under current market conditions the portfolio manager expects to invest substantially in medium-capitalization companies. The Fund will normally hold a core position of between 35 and 60 common stocks.
TOTAL ANNUAL OPERATING EXPENSES* 1.40% | NET ASSETS $361,622,256 | NET ASSET VALUE PER SHARE $48.48 |
GROWTH OF $10,000(1)(3) | PERFORMANCE COMPARISON(1) |
| | Average Annualized Returns |
| 
|
SECTOR ALLOCATION(4) | TOP FIVE HOLDINGS |
| | | | |
| | Snap, Inc. - Cl. A | 4.24% | |
| | Lam Research Corporation | 3.56% | |
| | Lyft, Inc. - Cl. A | 3.33% | |
| | Burlington Stores, Inc. | 2.76% | |
| | WEX, Inc. | 2.73% | |
| | | | |
* | The Total Annual Operating Expenses are reflective of the information disclosed in the Funds’ Prospectus dated February 1, 2021 and may differ from the expense ratio disclosed in this report. |
(1) | The performance data quoted here represent past performance, and past performance is not a guarantee of future results. Investment return and principal value of an investment will fluctuate so that an investor’s shares, when redeemed, may be worth more or less than their original cost. Current performance may be lower or higher than the performance information quoted. To obtain performance information current to the most recent month-end, please call 888-860-8686 or visit marsicofunds.com. |
| The performance included in the chart and graph does not reflect the deduction of taxes on Fund distributions or the redemption of Fund shares. |
| All indices are unmanaged and investors cannot invest directly in an index. |
| The Russell Midcap Growth Index (the “Underlying Index”) measures the performance of the mid-capitalization growth sector of the US equity market, and is composed of mid-capitalization US equities that exhibit growth characteristics. It is a subset of the Russell Midcap® Index, which measures the performance of the mid-capitalization sector of the US equity market. The Underlying Index measures the performance of equity securities of Russell Midcap Index issuers with higher price-to-book ratios and higher forecasted growth. |
(2) | Periodically, certain fees and expenses have been waived or reimbursed by the Adviser for the 21st Century Fund. In the absence of such a waiver or reimbursement, the performance returns reflected would have been reduced. In accordance with the expense limitation and fee waiver agreement, the Adviser may recoup fees and expenses previously waived or reimbursed under certain parameters. Periodically, the Adviser has recouped such fees or expenses from the 21st Century Fund, resulting in a lower performance return. |
(3) | This chart assumes an initial investment of $10,000 made on March 31, 2011. Total returns are based on net change in NAV, assuming reinvestment of distributions. |
(4) | Sector weightings represent the percentage of the Fund’s investments (excluding cash equivalents) in certain general sectors. These sectors may include more than one industry. The Fund’s portfolio composition is subject to change at any time. |
18
MARSICO 21st CENTURY FUND
SCHEDULE OF INVESTMENTS
March 31, 2021 (Unaudited)
| | | Number
of
Shares | | | Value | | | Percent
of Net
Assets | |
COMMON STOCKS^ | | | | | | | | | | | | |
Aerospace & Defense | | | | | | | | | | | | |
Axon Enterprise, Inc.* | | | 27,318 | | | $ | 3,890,629 | | | | 1.07 | % |
HEICO Corporation | | | 48,506 | | | | 6,102,055 | | | | 1.69 | |
| | | | | | | 9,992,684 | | | | 2.76 | |
Airlines | | | | | | | | | | | | |
Spirit Airlines, Inc.* | | | 191,315 | | | | 7,059,524 | | | | 1.95 | |
| | | | | | | | | | | | | |
Apparel Retail | | | | | | | | | | | | |
Burlington Stores, Inc.* | | | 33,400 | | | | 9,979,920 | | | | 2.76 | |
| | | | | | | | | | | | | |
Application Software | | | | | | | | | | | | |
Atlassian Corporation PLC - Cl. A* | | | 42,007 | | | | 8,853,395 | | | | 2.45 | |
C3.ai, Inc. - Cl. A* | | | 1,000 | | | | 65,910 | | | | 0.02 | |
Constellation Software, Inc. | | | 5,185 | | | | 7,241,094 | | | | 2.00 | |
Datadog, Inc. - Cl. A* | | | 36,162 | | | | 3,013,741 | | | | 0.83 | |
Guidewire Software, Inc.* | | | 51,859 | | | | 5,270,430 | | | | 1.46 | |
PTC, Inc.* | | | 62,052 | | | | 8,541,458 | | | | 2.36 | |
The Descartes Systems Group, Inc.* | | | 130,400 | | | | 7,955,572 | | | | 2.20 | |
Topicus.com, Inc.* | | | 9,643 | | | | 633,352 | | | | 0.18 | |
| | | | | | | 41,574,952 | | | | 11.50 | |
Biotechnology | | | | | | | | | | | | |
Exact Sciences Corporation* | | | 43,786 | | | | 5,770,119 | | | | 1.59 | |
Natera, Inc.* | | | 37,954 | | | | 3,853,849 | | | | 1.07 | |
| | | | | | | 9,623,968 | | | | 2.66 | |
Construction Materials | | | | | | | | | | | | |
Vulcan Materials Company | | | 17,340 | | | | 2,926,125 | | | | 0.81 | |
| | | | | | | | | | | | | |
Data Processing & Outsourced Services | | | | |
Global Payments, Inc. | | | 44,029 | | | | 8,875,366 | | | | 2.46 | |
Square, Inc. - Cl. A* | | | 39,341 | | | | 8,932,374 | | | | 2.47 | |
WEX, Inc.* | | | 47,247 | | | | 9,885,017 | | | | 2.73 | |
| | | | | | | 27,692,757 | | | | 7.66 | |
Diversified Support Services | | | | | | | | |
Cintas Corp. | | | 22,184 | | | | 7,571,621 | | | | 2.09 | |
| | | | | | | | | | | | | |
Education Services | | | | | | | | | | | | |
Bright Horizons Family Solutions, Inc.* | | | 44,346 | | | | 7,603,122 | | | | 2.10 | |
| | | | | | | | | | | | | |
Electrical Components & Equipment | | | | |
AMETEK, Inc. | | | 48,635 | | | | 6,212,149 | | | | 1.72 | |
| | | | | | | | | | | | | |
Electronic Components | | | | | | | | | | | | |
Amphenol Corp. - Cl. A | | | 112,790 | | | | 7,440,756 | | | | 2.06 | |
| | | | | | | | | | | | | |
Electronic Equipment & Instruments | | | | |
Cognex Corporation | | | 95,603 | | | | 7,934,093 | | | | 2.19 | |
Novanta, Inc.* | | | 42,470 | | | | 5,601,368 | | | | 1.55 | |
| | | | | | | 13,535,461 | | | | 3.74 | |
Financial Exchanges & Data | | | | |
MSCI, Inc. | | | 14,888 | | | | 6,242,241 | | | | 1.73 | |
| | | | | | | | | | | | | |
General Merchandise Stores | | | | |
Ollie’s Bargain Outlet Holdings, Inc.* | | | 54,113 | | | | 4,707,831 | | | | 1.30 | |
COMMON STOCKS^ (continued) | | | | | | | | |
Health Care Equipment | | | | | | | | | | | | |
DexCom, Inc.* | | | 19,509 | | | | 7,011,340 | | | | 1.94 | % |
IDEXX Laboratories, Inc.* | | | 14,839 | | | | 7,260,871 | | | | 2.01 | |
Insulet Corp.* | | | 29,650 | | | | 7,736,278 | | | | 2.14 | |
| | | | | | | 22,008,489 | | | | 6.09 | |
Health Care Supplies | | | | | | | | | | | | |
The Cooper Companies, Inc. | | | 18,402 | | | | 7,068,024 | | | | 1.95 | |
| | | | | | | | | | | | | |
Health Care Technology | | | | | | | | | | | | |
GoodRx Holdings, Inc. - Cl. A* | | | 69,508 | | | | 2,712,202 | | | | 0.75 | |
Teladoc Health, Inc.* | | | 16,822 | | | | 3,057,399 | | | | 0.85 | |
| | | | | | | 5,769,601 | | | | 1.60 | |
Home Improvement Retail | | | | | | | | | | | | |
Floor & Decor Holdings, Inc. - Cl. A* | | | 48,648 | | | | 4,644,911 | | | | 1.28 | |
| | | | | | | | | | | | | |
Hotels, Resorts & Cruise Lines | | | | | | | | |
Hilton Worldwide Holdings, Inc.* | | | 67,365 | | | | 8,145,776 | | | | 2.25 | |
| | | | | | | | | | | | | |
Interactive Media & Services | | | | | | | | |
Snap, Inc. - Cl. A* | | | 293,435 | | | | 15,343,716 | | | | 4.24 | |
| | | | | | | | | | | | | |
Internet Services & Infrastructure | | | | | | | | |
Okta, Inc.* | | | 7,187 | | | | 1,584,230 | | | | 0.44 | |
Twilio, Inc. - Cl. A* | | | 27,881 | | | | 9,500,730 | | | | 2.63 | |
| | | | | | | 11,084,960 | | | | 3.07 | |
Leisure Facilities | | | | | | | | |
Planet Fitness, Inc. - Cl. A* | | | 45,573 | | | | 3,522,793 | | | | 0.97 | |
| | | | | | | | | | | | | |
Life Sciences Tools & Services | | | | |
Adaptive Biotechnologies Corporation* | | | 106,723 | | | | 4,296,668 | | | | 1.19 | |
Avantor, Inc.* | | | 222,919 | | | | 6,449,047 | | | | 1.79 | |
Mettler-Toledo International, Inc.* | | | 3,357 | | | | 3,879,651 | | | | 1.07 | |
Repligen Corp.* | | | 22,893 | | | | 4,450,628 | | | | 1.23 | |
| | | | | | | 19,075,994 | | | | 5.28 | |
Metal & Glass Containers | | | | | | | | | | | | |
Ball Corporation | | | 72,399 | | | | 6,135,091 | | | | 1.70 | |
| | | | | | | | | | | | | |
Movies & Entertainment | | | | | | | | | | | | |
Spotify Technology S.A.* | | | 5,621 | | | | 1,506,147 | | | | 0.42 | |
| | | | | | | | | | | | | |
Pharmaceuticals | | | | | | | | | | | | |
Horizon Therapeutics PLC* | | | 40,140 | | | | 3,694,486 | | | | 1.02 | |
| | | | | | | | | | | | | |
Real Estate Services | | | | | | | | | | | | |
FirstService Corporation | | | 63,800 | | | | 9,470,241 | | | | 2.62 | |
| | | | | | | | | | | | | |
Regional Banks | | | | | | | | | | | | |
First Republic Bank | | | 51,040 | | | | 8,510,920 | | | | 2.35 | |
| | | | | | | | | | | | | |
Research & Consulting Services | | | | |
CoStar Group, Inc.* | | | 10,588 | | | | 8,702,171 | | | | 2.41 | |
| | | | | | | | | | | | | |
Restaurants | | | | | | | | | | | | |
Chipotle Mexican Grill, Inc.* | | | 3,860 | | | | 5,484,365 | | | | 1.52 | |
19
MARSICO 21st CENTURY FUND
SCHEDULE OF INVESTMENTS (continued)
March 31, 2021 (Unaudited)
| | | Number
of
Shares | | | Value | | | Percent
of Net
Assets | |
COMMON STOCKS^ (continued) | | | | | | | | |
Semiconductor Equipment | | | | | | | | | | | | |
Lam Research Corporation | | | 21,638 | | | $ | 12,879,803 | | | | 3.56 | % |
| | | | | | | | | | | | | |
Semiconductors | | | | | | | | | | | | |
Marvell Technology Group Ltd. | | | 156,766 | | | | 7,678,399 | | | | 2.12 | |
Microchip Technology, Inc. | | | 53,322 | | | | 8,276,641 | | | | 2.29 | |
| | | | | | | 15,955,040 | | | | 4.41 | |
Specialized Consumer Services | | | | | | | | |
frontdoor, inc.* | | | 67,857 | | | | 3,647,314 | | | | 1.01 | |
| | | | | | | | | | | | |
Specialized REITs | | | | | | | | | | | | |
SBA Communications Corporation - Cl. A | | | 15,799 | | | | 4,385,012 | | | | 1.21 | |
| | | | | | | | | | | | | |
Trucking | | | | | | | | | | | | |
Lyft, Inc. - Cl. A* | | | 190,483 | | | | 12,034,716 | | | | 3.33 | |
| | | | | | | | | | | | | |
TOTAL COMMON STOCKS | | | | | | | | | | | | |
(Cost $200,003,870) | | | | | | | 351,232,681 | | | | 97.13 | |
| | | | | | | | | | | | |
SHORT-TERM INVESTMENTS^ | | | | | | | | |
State Street Institutional Treasury Money Market Fund - Premier Class, 0.000% | | | 11,179,419 | | | | 11,179,419 | | | | 3.09 | |
| | | | | | | | | | | | | |
TOTAL SHORT-TERM INVESTMENTS | | | | |
(Cost $11,179,419) | | | | | | | 11,179,419 | | | | 3.09 | |
| | | | | | | | | | | | | |
TOTAL INVESTMENTS | | | | | | | | | | | | |
(Cost $211,183,289) | | | | | | | 362,412,100 | | | | 100.22 | |
| | | | | | | | | | | | | |
Liabilities, Less Cash and Other Assets | | | | | | | (789,844 | ) | | | (0.22 | ) |
| | | | | | | | | | | | | |
NET ASSETS | | | | | | $ | 361,622,256 | | | | 100.00 | % |
^ | As of March 31, 2021, all investments were classified as Level 1 with their corresponding fair valuation disclosed in the above Schedule of Investments. For more information on investment valuation and valuation inputs, refer to Note 2(a) in the Notes to Financial Statements. |
| See notes to financial statements. |
20
INTERNATIONAL OPPORTUNITIES FUND |
Investment Review BY TOM MARSICO AND ROB SUSMAN (UNAUDITED)
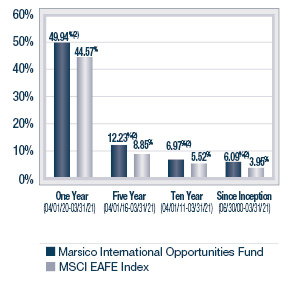
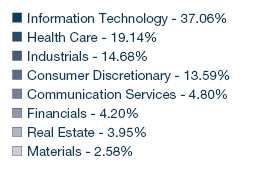
The Marsico International Opportunities Fund posted a total return of (US$) +13.20% for the six-month fiscal period ended March 31, 2021. The Fund underperformed the MSCI EAFE Index, the Fund’s benchmark index, which had a total return of (US$) +20.08% over the same time period. Please see the Fund’s Overview for more detailed information about the Fund’s longer-term performance for various time periods ended March 31, 2021.
The performance data for the Fund quoted here represent past performance, and past performance is not a guarantee of future results. Investment return and principal value of an investment will fluctuate so that an investor’s shares, when redeemed, may be worth more or less than their original cost. Current performance may be lower or higher than the performance information quoted. To obtain performance information current to the most recent month-end, please call 888-860-8686 or visit marsicofunds.com.(1)
This review highlights Fund performance over a six-month fiscal period. Shareholders should keep in mind that the Fund is intended for long-term investors who hold their shares for substantially longer periods of time. You should also keep in mind that our current views and beliefs regarding all investments discussed in this report are subject to change at any time. References to specific securities, industries, and sectors discussed in this report are not recommendations to buy or sell such securities or related investments, and the Fund may not necessarily hold these securities or investments today. Please see the accompanying Schedule of Investments for the percentage of the Fund’s portfolio represented by the securities mentioned in this report as of the end of the reporting period.
Foreign investments present additional risks due to currency fluctuations, economic and political factors, lower liquidity, differences in securities regulations and accounting standards, possible changes in taxation, limited public information, and other factors. In addition, the Fund is subject to broad risks associated with investing in equity securities markets generally, including the risks that the securities and markets in which it invests may experience volatility and instability, that domestic and global economies and markets may undergo periods of cyclical change and decline, that investors may at times avoid investments in equity securities, and that investments may not perform as anticipated. Please see the Prospectus for more information.
The Fund is not managed to track its benchmark index, and may hold a substantially overweight or underweight position in a sector, industry, or security compared to its weight in the benchmark. The Fund may be subject to risks associated with a particular sector or other area in which it is overweight, including the risk that the stocks of companies within one area could simultaneously decline in price because of an event that affects the entire area. For informational purposes, the discussion below may compare the benchmark weight or performance of a sector or industry to the investment approach of the Fund.
The International Opportunities Fund’s underperformance during the six-month period ended March 31, 2021 as compared to the MSCI EAFE Index was due, in part, to certain weaker-performing stocks in the Consumer Discretionary, Communication Services, and Financials sectors as defined in the Global Industry Classification Standard (“GICS”) as well as certain other stocks. In addition, the Fund’s relative performance was dampened by having an overweight allocation to Health Care as the weakest-performing sector of the benchmark index, and an underweight allocation to the stronger-performing Financials and Energy sectors.
In the Consumer Discretionary sector, Chinese e-commerce company Alibaba Group Holding Ltd. Spon. ADR (“BABA”) (-23%) detracted from performance due to Chinese regulatory scrutiny of the company that began in December 2020. Specifically, the Chinese State Administration for Market Regulation (“SAMR”) reviewed Alibaba’s competitive practices across its e-commerce platform, as well as those of other large Internet marketplace platforms in China. This caused the entire Chinese Internet sector to underperform during the period. As of this writing, SAMR has concluded its review and announced administrative penalties on Alibaba’s platform exclusivity practices. A fine representing 4% of Alibaba’s cash and cash equivalents as of December 2020 has been imposed. While the exclusivity practice in question historically covered merchants participating in BABA’s Singles Day shopping festivals, its TMall platform enjoys a 98% annual customer retention rate due to strong value creation and customer experience. Although regulatory inquiries into BABA or related companies may continue, we believe that BABA represents a sharply undervalued asset with a dominant competitive advantage.
Communication Services holding Cellnex Telecom SA (“Cellnex”) (-5%), a cellular tower company, created a headwind to performance largely as a result of its defensive, low volatility nature. Cellnex reported good results and announced a string of large, accretive tower acquisitions in Europe that we applauded. That said, as COVID vaccine enthusiasm grew and cyclical and rate sensitive stocks outperformed, low volatility growth stocks, especially those tied to long-term contracts, underperformed. We remain confident in the growth prospects of Cellnex.
In the Information Technology sector, Software & Services stock SAP S.E. (“SAP”) (-27%) detracted from results. Weakness in the stock occurred after the company announced it was essentially changing its business model from a license-based sales approach to a recurring, ratable, software-as-a-service-based approach. While we like the move, and believe it will position the company better in the long run and reduce sales volatility, in the near-term it creates some pressure on sales and margin targets. That said, the company has taken a bold step forward, and the core underlying growth of SAP’s product remains strong and should continue to be a world leader.
21
INTERNATIONAL OPPORTUNITIES FUND |
On the positive side, overall stock selection in the Health Care and Consumer Staples sectors contributed positively to results as certain stocks returned +20% or more. A lack of exposure to the weaker-performing Utilities sector also added to results relative to the benchmark, as did an underweighted posture in the weak-performing Consumer Staples sector.
Semiconductors & Semiconductor Equipment holdings ASML Holding N.V. (“ASML”) (+65%) and Tokyo Electron Ltd. (+66%) were positive contributors to performance. ASML outperformed in the period as major chip makers (such as Intel, Samsung, and Taiwan Semiconductor Manufacturing Co., Ltd Spon. ADR (“TSMC”) have had to spend heavily on ASML’s chip-making tools to keep up with higher demand for chips for PCs, smartphones, servers, and other devices used for remote activities. We believe that this trend will continue throughout 2021 as the 5G cycle is still gaining steam, corporate server budgets are implying strong growth, and cyclical chip-consuming industries like automakers have improved more quickly than expected and experienced a shortage of key chips. Further, we now have a longer look into the spending plans of some of ASML’s customers, as TSMC has indicated that it will spend $100 billion on chip-making capacity in 2021-2023. All of these factors indicate to us that ASML has a continually strengthening backlog, and the company’s tools are expected to be in short supply for the foreseeable future.
Tokyo Electron Ltd. outperformed due to much stronger-than-expected fundamentals in the semiconductor industry resulting from widespread chip shortages. Tokyo Electron makes many of the critical tools used in producing semiconductors and as a result, demand for its products has increased during the environment of shortages that continues to worsen for automakers, PC makers, and other major users of chips. Additionally, as a Japanese producer of critical semiconductor fabrication tools, the company has benefitted as US competitors have become subject to tightened export restrictions to China. Tokyo Electron’s order backlog has extended, and industry spending appears to be on a multi-year upswing.
Although active currency management is not a central facet of the International Opportunities Fund’s investment process, fluctuations in major world currencies can at times affect the Fund’s performance. During the period, the net effect of currency moves had a modestly positive impact on Fund performance as foreign currencies rose modestly on balance against the US dollar.
There were a few shifts in the Fund’s sector allocations during the period. The Fund reduced its allocations to the Consumer Staples, Financials, and Communication Services sectors and increased its allocations to the Industrials, Information Technology and Consumer Discretionary sectors. There were no significant changes to the Fund’s allocations to the Materials, Energy, Real Estate, and Health Care sectors.
Fiscal Period-End Investment Posture
As of March 31, 2021, the Fund’s primary economic sector allocations included Information Technology, Health Care, Consumer Discretionary, Communication Services, Industrials, and Financials sectors. The Fund had no investments in the Utilities sector.
In terms of country allocations, the Fund’s most significant weightings at period-end, excluding short-term investments, were in Japan, the United Kingdom, China/Hong Kong, Germany, Switzerland, France, Netherlands, and Canada. Country-level weightings generally should be considered a residual of the Fund’s stock selection process rather than a major, proactive facet of its investment strategy.
Sincerely,
THOMAS F. MARSICO
ROBERT G. SUSMAN, CFA
PORTFOLIO MANAGERS
(1) | Total returns are based on net change in net asset value assuming reinvestment of distributions. Periodically, certain fees and expenses have been waived or reimbursed by the Adviser for the International Opportunities Fund. In the absence of such a waiver or reimbursement, the performance returns reflected would have been reduced. In accordance with the expense limitation and fee waiver agreement, the Adviser may recoup fees and expenses previously waived or reimbursed under certain parameters. Periodically, the Adviser has recouped such fees or expenses from the International Opportunities Fund, resulting in a lower performance return. Please see the Prospectus for more information. |
22
INTERNATIONAL OPPORTUNITIES Fund Overview |
March 31, 2021 (Unaudited)
The International Opportunities Fund is a diversified portfolio and invests primarily in common stocks of foreign companies that are selected for their long-term growth potential, including foreign securities, whether traded in the US (including as American Depositary Receipts) or in foreign markets or both. The Fund may invest in an unlimited number of companies of any size throughout the world. The Fund normally invests in the securities of issuers that are economically tied to one or more foreign countries, and expects to be invested in various issuers or securities that together have ties to at least four different foreign countries. The Fund may invest in securities of companies economically tied to emerging markets. Some issuers or securities in the Fund’s portfolio may be economically tied to the US.
TOTAL ANNUAL OPERATING EXPENSES* 1.81% NET EXPENSES*† 1.50% | NET ASSETS $59,331,206 | NET ASSET VALUE PER SHARE $22.73 |
GROWTH OF $10,000(1)(2)(3) | PERFORMANCE COMPARISON(1) |
| | Average Annualized Returns |
| 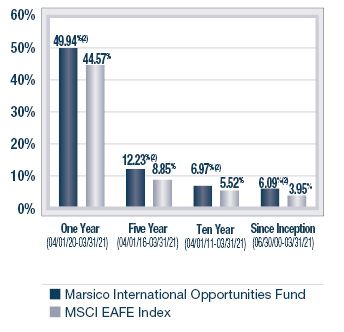
|
SECTOR ALLOCATION(4) | TOP FIVE HOLDINGS |
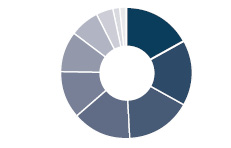 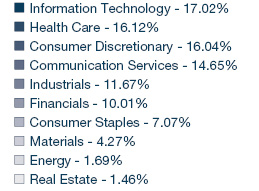
| | | | |
| | Alibaba Group Holding Ltd. Spon. ADR | 3.72% | |
| | Tencent Holdings Ltd. | 3.69% | |
| | Nestlé S.A. | 3.02% | |
| | AstraZeneca PLC | 2.90% | |
| | Roche Holding AG | 2.88% | |
| | | | |
* | The Total Annual Operating Expenses and Net Expenses are reflective of the information disclosed in the Funds’ Prospectus dated February 1, 2021 and may differ from the expense ratios disclosed in this report. |
† | Marsico Capital Management, LLC (the “Adviser”) has entered into a written expense limitation and fee waiver agreement under which it has agreed to limit the total expenses of the International Opportunities Fund (excluding taxes, interest, acquired fund fees and expenses, litigation, extraordinary expenses, and brokerage and other transaction expenses relating to the purchase or sale of portfolio investments) to an annual rate of 1.50% of the Fund’s average net assets until January 31, 2022. This expense limitation and fee waiver agreement may be terminated by the Adviser at any time after January 31, 2022 upon 15 days prior notice to the Fund and its administrator. The Adviser may recoup from the Fund fees previously waived or expenses previously reimbursed by the Adviser with respect to that Fund pursuant to this agreement (or a previous expense limitation agreement) if: (1) such recoupment by the Adviser does not cause the Fund, at the time of recoupment, to exceed the lesser of (a) the expense limitation in effect at the time the relevant amount was waived and/or reimbursed, or (b) the expense limitation in effect at the time of the proposed recoupment, and (2) the recoupment is made within three years after the fiscal year end date as of which the amount to be waived or reimbursed was determined and the waiver or reimbursement occurred. |
(1) | The performance data quoted here represent past performance, and past performance is not a guarantee of future results. Investment return and principal value of an investment will fluctuate so that an investor’s shares, when redeemed, may be worth more or less than their original cost. Current performance may be lower or higher than the performance information quoted. To obtain performance information current to the most recent month-end, please call 888-860-8686 or visit marsicofunds.com. |
| The performance included in the chart and graph does not reflect the deduction of taxes on Fund distributions or the redemption of Fund shares. |
| All indices are unmanaged and investors cannot invest directly in an index. |
| The MSCI EAFE Index tracks the stocks of about 1,000 companies in Europe, Australasia, and the Far East (EAFE). |
(2) | Periodically, certain fees and expenses have been waived or reimbursed by the Adviser for the International Opportunities Fund. In the absence of such a waiver or reimbursement, the performance returns reflected would have been reduced. In accordance with the expense limitation and fee waiver agreement, the Adviser may recoup fees and expenses previously waived or reimbursed under certain parameters. Periodically, the Adviser has recouped such fees or expenses from the International Opportunities Fund, resulting in a lower performance return. |
(3) | This chart assumes an initial investment of $10,000 made on March 31, 2011. Total returns are based on net change in NAV, assuming reinvestment of distributions. |
(4) | Sector weightings represent the percentage of the Fund’s investments (excluding cash equivalents) in certain general sectors. These sectors may include more than one industry. The Fund’s portfolio composition is subject to change at any time. |
23
MARSICO INTERNATIONAL OPPORTUNITIES FUND
SCHEDULE OF INVESTMENTS
March 31, 2021 (Unaudited)
| | | Number
of
Shares | | | Value | | | Percent
of Net
Assets | |
COMMON STOCKS^ | | | | | | | | | | | | |
Aerospace & Defense | | | | | | | | | | | | |
Airbus SE* | | | 5,804 | | | $ | 657,085 | | | | 1.11 | % |
BAE Systems PLC | | | 99,600 | | | | 693,408 | | | | 1.17 | |
Safran S.A.* | | | 3,320 | | | | 451,825 | | | | 0.76 | |
| | | | | | | 1,802,318 | | | | 3.04 | |
Airlines | | | | | | | | | | | | |
Wizz Air Holdings PLC* | | | 7,571 | | | | 503,290 | | | | 0.85 | |
| | | | | | | | | | | | | |
Airport Services | | | | | | | | | | | | |
Aena SME S.A.* | | | 2,547 | | | | 413,084 | | | | 0.70 | |
| | | | | | | | | | | | | |
Apparel, Accessories & Luxury Goods | | | | |
adidas A.G.* | | | 1,652 | | | | 515,709 | | | | 0.87 | |
LVMH Moet Hennessy Louis Vuitton S.E. | | | 1,065 | | | | 709,515 | | | | 1.20 | |
| | | | | | | 1,225,224 | | | | 2.07 | |
Application Software | | | | | | | | | | | | |
Atlassian Corporation PLC - Cl. A* | | | 2,606 | | | | 549,241 | | | | 0.92 | |
Constellation Software, Inc. | | | 288 | | | | 402,205 | | | | 0.68 | |
SAP S.E. | | | 4,964 | | | | 607,858 | | | | 1.02 | |
The Descartes Systems Group, Inc.* | | | 5,900 | | | | 359,953 | | | | 0.61 | |
Xero Ltd.* | | | 7,877 | | | | 757,026 | | | | 1.28 | |
| | | | | | | 2,676,283 | | | | 4.51 | |
Asset Management & Custody Banks | | | | |
Julius Baer Group Ltd. | | | 9,951 | | | | 636,342 | | | | 1.07 | |
| | | | | | | | | | | | | |
Automobile Manufacturers | | | | | | | | | | | | |
Volkswagen A.G. Preference Shares | | | 871 | | | | 243,711 | | | | 0.41 | |
| | | | | | | | | | | | | |
Automotive Retail | | | | | | | | | | | | |
Auto1 Group S.E.* | | | 9,988 | | | | 566,320 | | | | 0.95 | |
| | | | | | | | | | | | | |
Biotechnology | | | | | | | | |
CSL Ltd. | | | 2,903 | | | | 583,546 | | | | 0.98 | |
| | | | | | | | | | | | | |
Casinos & Gaming | | | | | | | | | | | | |
Sands China, Ltd.* | | | 180,800 | | | | 903,523 | | | | 1.52 | |
| | | | | | | | | | | | | |
Communications Equipment | | | | | | | | |
Telefonaktiebolaget LM Ericsson B Shares | | | 33,906 | | | | 448,601 | | | | 0.76 | |
| | | | | | | | | | | | | |
Consumer Electronics | | | | | | | | | | | | |
Sony Corporation | | | 11,000 | | | | 1,151,908 | | | | 1.94 | |
| | | | | | | | | | | | | |
Data Processing & Outsourced Services | | | | |
Adyen N.V.* | | | 172 | | | | 383,944 | | | | 0.65 | |
Mastercard, Inc. - Cl. A | | | 2,068 | | | | 736,311 | | | | 1.24 | |
Pagseguro Digital Ltd. - Cl. A* | | | 7,189 | | | | 332,851 | | | | 0.56 | |
| | | | | | | 1,453,106 | | | | 2.45 | |
Distillers & Vintners | | | | | | | | | | | | |
Diageo PLC | | | 25,645 | | | | 1,056,913 | | | | 1.78 | |
COMMON STOCKS^ (continued) | | | | | | | | |
Diversified Banks | | | | | | | | | | | | |
BAWAG Group A.G. | | | 9,866 | | | | 509,537 | | | | 0.86 | % |
BNP Paribas S.A.* | | | 17,534 | | | | 1,066,763 | | | | 1.80 | |
HDFC Bank Ltd. ADR* | | | 4,219 | | | | 327,774 | | | | 0.55 | |
| | | | | | | 1,904,074 | | | | 3.21 | |
Electronic Equipment & Instruments | | | | |
Keyence Corporation | | | 1,400 | | | | 635,611 | | | | 1.07 | |
| | | | | | | | | | | | | |
Financial Exchanges & Data | | | | | | | | |
Deutsche Boerse A.G. | | | 6,282 | | | | 1,043,890 | | | | 1.76 | |
| | | | | | | | | | | | | |
General Merchandise Stores | | | | |
B&M European Value Retail S.A. | | | 61,099 | | | | 444,571 | | | | 0.75 | |
Dollarama, Inc. | | | 15,670 | | | | 692,288 | | | | 1.17 | |
| | | | | | | 1,136,859 | | | | 1.92 | |
Health Care Equipment | | | | | | | | | | | | |
Koninklijke Philips N.V.* | | | 17,977 | | | | 1,026,148 | | | | 1.73 | |
Olympus Corporation | | | 57,600 | | | | 1,191,796 | | | | 2.01 | |
Straumann Holding A.G. | | | 269 | | | | 335,556 | | | | 0.56 | |
| | | | | | | 2,553,500 | | | | 4.30 | |
Health Care Supplies | | | | | | | | | | | | |
Alcon, Inc.* | | | 6,970 | | | | 488,044 | | | | 0.82 | |
| | | | | | | | | | | | | |
Health Care Technology | | | | | | | | |
M3, Inc. | | | 5,900 | | | | 403,422 | | | | 0.68 | |
| | | | | | | | | | | | | |
Human Resource & Employment Services | | | | |
Recruit Holdings Company Ltd. | | | 14,600 | | | | 712,166 | | | | 1.20 | |
| | | | | | | | | | | | | |
Industrial Conglomerates | | | | | | | | | | | | |
Siemens A.G. | | | 7,391 | | | | 1,213,440 | | | | 2.05 | |
| | | | | | | | | | | | | |
Industrial Gases | | | | | | | | | | | | |
Air Liquide S.A. | | | 4,821 | | | | 787,545 | | | | 1.33 | |
| | | | | | | | | | | | | |
Industrial Machinery | | | | | | | | | | | | |
MISUMI Group, Inc. | | | 23,900 | | | | 693,958 | | | | 1.17 | |
| | | | | | | | | | | | | |
Integrated Oil & Gas | | | | | | | | | | | | |
TOTAL S.E. | | | 21,506 | | | | 1,003,129 | | | | 1.69 | |
| | | | | | | | | | | | | |
Integrated Telecommunication Services | | | | |
Cellnex Telecom SA | | | 26,115 | | | | 1,503,690 | | | | 2.53 | |
| | | | | | | | | | | | | |
Interactive Home Entertainment | | | | | | | | |
Nintendo Co., Ltd. | | | 1,400 | | | | 781,522 | | | | 1.32 | |
Sea Ltd. ADR* | | | 5,514 | | | | 1,230,890 | | | | 2.07 | |
| | | | | | | 2,012,412 | | | | 3.39 | |
24
| | | Number
of
Shares | | | Value | | | Percent
of Net
Assets | |
COMMON STOCKS^ (continued) | | | | | | | | |
Interactive Media & Services | | | | |
Adevinta ASA* | | | 44,736 | | | $ | 658,502 | | | | 1.11 | % |
Facebook, Inc. - Cl. A* | | | 1,295 | | | | 381,416 | | | | 0.64 | |
REA Group Ltd. | | | 4,023 | | | | 433,111 | | | | 0.73 | |
Scout24 A.G. | | | 8,646 | | | | 656,004 | | | | 1.11 | |
Tencent Holdings Ltd. | | | 27,900 | | | | 2,189,192 | | | | 3.69 | |
Z Holdings Corporation | | | 76,300 | | | | 379,415 | | | | 0.64 | |
| | | | | | | 4,697,640 | | | | 7.92 | |
Internet & Direct Marketing Retail | | | | |
Alibaba Group Holding Ltd. Spon. ADR* | | | 9,725 | | | | 2,204,949 | | | | 3.72 | |
boohoo group plc* | | | 133,458 | | | | 625,549 | | | | 1.05 | |
Meituan - Cl. B* | | | 13,400 | | | | 513,999 | | | | 0.87 | |
MercadoLibre, Inc.* | | | 247 | | | | 363,619 | | | | 0.61 | |
| | | | | | | 3,708,116 | | | | 6.25 | |
Internet Services & Infrastructure | | | | | | | | |
GDS Holdings Ltd. ADR* | | | 4,597 | | | | 372,771 | | | | 0.63 | |
NEXTDC Ltd.* | | | 33,900 | | | | 268,302 | | | | 0.45 | |
Shopify, Inc. - Cl. A* | | | 259 | | | | 286,583 | | | | 0.48 | |
Wix.com Ltd.* | | | 1,167 | | | | 325,850 | | | | 0.55 | |
| | | | | | | 1,253,506 | | | | 2.11 | |
Life & Health Insurance | | | | | | | | | | | | |
AIA Group Ltd. | | | 59,400 | | | | 720,523 | | | | 1.21 | |
| | | | | | | | | | | | | |
Movies & Entertainment | | | | | | | | | | | | |
Spotify Technology S.A.* | | | 1,715 | | | | 459,534 | | | | 0.78 | |
| | | | | | | | | | | | | |
Packaged Foods & Meats | | | | | | | | | | | | |
Nestlé S.A. | | | 16,070 | | | | 1,791,053 | | | | 3.02 | |
| | | | | | | | | | | | | |
Personal Products | | | | | | | | | | | | |
L’Oreal S.A. | | | 1,717 | | | | 658,020 | | | | 1.11 | |
| | | | | | | | | | | | | |
Pharmaceuticals | | | | | | | | | | | | |
AstraZeneca PLC | | | 17,238 | | | | 1,722,198 | | | | 2.90 | |
Dechra Pharmaceuticals PLC | | | 14,565 | | | | 688,720 | | | | 1.16 | |
Novo Nordisk A/S - Cl. B | | | 8,922 | | | | 604,458 | | | | 1.02 | |
Roche Holding AG | | | 5,282 | | | | 1,707,017 | | | | 2.88 | |
Takeda Pharmaceutical Company Ltd. | | | 22,100 | | | | 795,381 | | | | 1.34 | |
| | | | | | | 5,517,774 | | | | 9.30 | |
Property & Casualty Insurance | | | | | | | | |
Intact Financial Corporation | | | 7,300 | | | | 894,565 | | | | 1.51 | |
Tokio Marine Holdings, Inc. | | | 15,300 | | | | 727,519 | | | | 1.22 | |
| | | | | | | 1,622,084 | | | | 2.73 | |
Real Estate Operating Companies | | | | |
Aroundtown S.A. | | | 61,217 | | | | 435,760 | | | | 0.73 | |
| | | | | | | | | | | | | |
Real Estate Services | | | | | | | | | | | | |
FirstService Corporation | | | 2,900 | | | | 430,466 | | | | 0.73 | |
| | | | | | | | | | | | | |
Research & Consulting Services | | | | | | | | |
Experian PLC | | | 30,295 | | | | 1,042,864 | | | | 1.76 | |
COMMON STOCKS^ (continued) | | | | | | | | |
Restaurants | | | | | | | | | | | | |
Domino’s Pizza Enterprises Ltd. | | | 7,749 | | | | 566,504 | | | | 0.96 | % |
| | | | | | | | | | | | | |
Semiconductor Equipment | | | | | | | | | | | | |
ASML Holding N.V. | | | 2,632 | | | | 1,595,745 | | | | 2.69 | |
Tokyo Electron Ltd. | | | 1,700 | | | | 718,383 | | | | 1.21 | |
| | | | | | | 2,314,128 | | | | 3.90 | |
Semiconductors | | | | | | | | | | | | |
Taiwan Semiconductor Manufacturing Co., Ltd. Spon. ADR | | | 5,015 | | | | 593,174 | | | | 1.00 | |
| | | | | | | | | | | | | |
Soft Drinks | | | | | | | | | | | | |
Coca-Cola European Partners PLC | | | 13,097 | | | | 683,140 | | | | 1.15 | |
| | | | | | | | | | | | | |
Specialty Chemicals | | | | | | | | | | | | |
Akzo Nobel N.V. | | | 6,011 | | | | 671,638 | | | | 1.13 | |
Shin-Etsu Chemical Company Ltd. | | | 4,500 | | | | 756,333 | | | | 1.27 | |
Symrise A.G. | | | 2,568 | | | | 311,389 | | | | 0.53 | |
| | | | | | | 1,739,360 | | | | 2.93 | |
Technology Hardware, Storage & Peripherals | | | | |
Samsung Electronics Company Ltd. GDR 144A† | | | 385 | | | | 702,240 | | | | 1.18 | |
| | | | | | | | | | | | | |
Trucking | | | | | | | | | | | | |
Uber Technologies, Inc.* | | | 9,697 | | | | 528,583 | | | | 0.89 | |
| | | | | | | | | | | | | |
TOTAL COMMON STOCKS | | | | | | | | | | | | |
(Cost $41,193,804) | | | | | | | 59,220,378 | | | | 99.81 | |
| | | | | | | | | | | | |
SHORT-TERM INVESTMENTS^ | | | | | | | | |
State Street Institutional Treasury Money Market Fund - Premier Class, 0.000% | | | 273,106 | | | | 273,106 | | | | 0.46 | |
| | | | | | | | | | | | | |
TOTAL SHORT-TERM INVESTMENTS | | | | | | | | |
(Cost $273,106) | | | | | | | 273,106 | | | | 0.46 | |
| | | | | | | | | | | | | |
TOTAL INVESTMENTS | | | | | | | | | | | | |
(Cost $41,466,910) | | | | | | | 59,493,484 | | | | 100.27 | |
| | | | | | | | | | | | | |
Liabilities, Less Cash and Other Assets | | | | | | | (162,278 | ) | | | (0.27 | ) |
| | | | | | | | | | | | | |
NET ASSETS | | | | | | $ | 59,331,206 | | | | 100.00 | % |
25
MARSICO INTERNATIONAL OPPORTUNITIES FUND
SCHEDULE OF INVESTMENTS (continued)
March 31, 2021 (Unaudited)
SUMMARY OF INVESTMENTS BY COUNTRY |
Country | | Market Value | | | Percent of
Investment
Securities | |
Argentina | | $ | 363,619 | | | | 0.61 | % |
Australia | | | 2,400,704 | | | | 4.03 | |
Austria | | | 509,537 | | | | 0.86 | |
Brazil | | | 332,851 | | | | 0.56 | |
Canada | | | 3,066,060 | | | | 5.15 | |
China/Hong Kong | | | 6,904,957 | | | | 11.61 | |
Denmark | | | 604,458 | | | | 1.02 | |
France | | | 5,333,882 | | | | 8.97 | |
Germany | | | 5,594,081 | | | | 9.40 | |
India | | | 327,774 | | | | 0.55 | |
Israel | | | 325,850 | | | | 0.55 | |
Japan | | | 8,947,414 | | | | 15.04 | |
Netherlands | | | 3,677,475 | | | | 6.18 | |
New Zealand | | | 757,026 | | | | 1.27 | |
Norway | | | 658,502 | | | | 1.11 | |
Singapore | | | 1,230,890 | | | | 2.07 | |
South Korea | | | 702,240 | | | | 1.18 | |
Spain | | | 1,916,774 | | | | 3.22 | |
Sweden | | | 908,135 | | | | 1.52 | |
Switzerland | | | 5,461,302 | | | | 9.18 | |
Taiwan | | | 593,174 | | | | 1.00 | |
United Kingdom | | | 6,957,363 | | | | 11.69 | |
United States(1) | | | 1,919,416 | | | | 3.23 | |
| | | $ | 59,493,484 | | | | 100.00 | % |
(1) | Includes short-term securities. |
^ | As of March 31, 2021, all investments were classified as Level 1 with their corresponding fair valuation disclosed in the above Schedule of Investments. For more information on investment valuation and valuation inputs, refer to Note 2(a) in the Notes to Financial Statements. |
† | This security has been determined to be liquid under guidelines established by the Board of Trustees. At March 31, 2021, the total value of the Fund’s 144A securities was 1.18% of net assets. |
| See notes to financial statements. |
26
Investment Review BY TOM MARSICO, BRANDON GEISLER, AND ROB SUSMAN (UNAUDITED)
The Marsico Global Fund posted a total return of (US$) +8.97% for the six-month fiscal period ended March 31, 2021. The Fund significantly underperformed the MSCI All Country World Index (“MSCI ACWI Index”), the Fund’s benchmark index, which had a total return of (US$) +19.93% over the same time period. Please see the Fund’s Overview for more detailed information about the Fund’s longer-term performance for various time periods ended March 31, 2021.
The performance data for the Fund quoted here represent past performance, and past performance is not a guarantee of future results. Investment return and principal value of an investment will fluctuate so that an investor’s shares, when redeemed, may be worth more or less than their original cost. Current performance may be lower or higher than the performance information quoted. To obtain performance information current to the most recent month-end, please call 888-860-8686 or visit marsicofunds.com.(1)
This review highlights Fund performance over a six-month fiscal period. Shareholders should keep in mind that the Fund is intended for long-term investors who hold their shares for substantially longer periods of time. You should also keep in mind that our current views and beliefs regarding all investments discussed in this report are subject to change at any time. References to specific securities, industries, and sectors discussed in this report are not recommendations to buy or sell such securities or related investments, and the Fund may not necessarily hold these securities or investments today. Please see the accompanying Schedule of Investments for the percentage of the Fund’s portfolio represented by the securities mentioned in this report as of the end of the reporting period.
Foreign investments present additional risks due to currency fluctuations, economic and political factors, lower liquidity, differences in securities regulations and accounting standards, possible changes in taxation, limited public information, and other factors. In addition, the Fund is subject to broad risks associated with investing in equity securities markets generally, including the risks that the securities and markets in which it invests may experience volatility and instability, that domestic and global economies and markets may undergo periods of cyclical change and decline, that investors may at times avoid investments in equity securities, and that investments may not perform as anticipated. Please see the Prospectus for more information.
The Fund is not managed to track its benchmark index, and may hold a substantially overweight or underweight position in a sector, industry, or security compared to its weight in the benchmark. The Fund may be subject to risks associated with a particular sector or other area in which it is overweight, including the risk that the stocks of companies within one area could simultaneously decline in price because of an event that affects the entire area. For informational purposes, the discussion below may compare the benchmark weight or performance of a sector or industry to the investment approach of the Fund.
The Global Fund’s underperformance during the six-month period ended March 31, 2021 as compared to the MSCI ACWI Index was due, in part, to certain weaker-performing stocks in several sectors such as the Consumer Discretionary and Financials sectors as defined in the Global Industry Classification Standard (“GICS”). The Fund’s relative performance was also hindered by having an underweight allocation in the stronger-performing Financials sector of the benchmark index, no exposure to the Energy Sector which was the strongest-performing sector, and an almost double-overweight allocation to a weaker-performing area of the benchmark index, Information Technology.
In the Consumer Discretionary sector, Chinese e-commerce company Alibaba Group Holding Ltd. Spon. ADR (“BABA”) (-23%) detracted from performance due to Chinese regulatory scrutiny of the company that began in December 2020. Specifically, the Chinese State Administration for Market Regulation (“SAMR”) reviewed Alibaba’s competitive practices across its e-commerce platform, as well as those of other large Internet marketplace platforms in China. This caused the entire Chinese Internet sector to underperform during the period. As of this writing, SAMR has concluded its review and announced administrative penalties on Alibaba’s platform exclusivity practices. A fine representing 4% of Alibaba’s cash and cash equivalents as of December 2020 has been imposed. While the exclusivity practice in question historically covered merchants participating in BABA’s Singles Day shopping festivals, its TMall platform enjoys a 98% annual customer retention rate due to strong value creation and customer experience. Although regulatory inquiries into BABA or related companies may continue, we believe that BABA represents a sharply undervalued asset with a dominant competitive advantage.
Financials sector holding S&P Global, Inc. (“SPGI”) (-6% before it was sold) hindered the Fund’s results. We decided to sell SPGI as the valuation was stretched and SPGI is now entering a rising interest rate environment with spreads approaching all-time lows. Additionally, SPGI’s pending merger with IHS Markit Ltd. creates new operational and execution risks. While we continue to like SPGI as a company, we believe the current interest rate environment and risks surrounding the merger make further valuation upside limited while earnings growth decelerates.
27
Although active currency management is not a central facet of the Global Fund’s investment process, fluctuations in major world currencies can at times affect the Fund’s performance. During the period, the net effect of currency moves had a negative impact on Fund performance as an overall decline in the US dollar reduced the value of the Fund’s dollar-denominated holdings.
On the positive side, overall stock selection in the Information Technology and Consumer Staples sectors contributed positively to results. An underweighted posture in the weaker-performing Health Care and Consumer Staples sectors boosted returns.
More specifically in Information Technology, Semiconductors & Semiconductor Equipment holding ASML Holding N.V. – NY Reg. Shs. (“ASML”) (+68%) contributed positively to performance. ASML outperformed in the period as major chip makers (such as Intel, Samsung, and Taiwan Semiconductor Manufacturing Co., Ltd Spon. ADR (“TSMC”) have had to spend heavily on ASML’s chip-making tools to keep up with higher demand for chips for PCs, smartphones, servers, and other devices used for remote activities. We believe that this trend will continue throughout 2021 as the 5G cycle is still gaining steam, corporate server budgets are implying strong growth, and cyclical chip-consuming industries like automakers have improved more quickly than expected and experienced a shortage of key chips. Further, we now have a longer look into the spending plans of some of ASML’s customers, as TSMC has indicated that it will spend $100 billion on chip-making capacity in 2021-2023. All of these factors indicate to us that ASML has a continually strengthening backlog, and the company’s tools are expected to be in short supply for the foreseeable future.
In the Software & Services sector Square, Inc. – Cl. A (“Square”) (+35%) performed well as the explosive growth experienced for its Cash App ecosystem led to a massive re-rating of the stock. In the midst of the COVID-19 pandemic, consumers and small businesses were forced to digitize many of their banking and financial needs due to lack of human contact. With this development, Square’s Cash App helped clients meet these needs through its mobile-first ecosystem which provides a wide breadth of payments and banking services. This transition away from traditional banking had been occurring slowly prior to the pandemic, but moved forward at an exponential pace as a result of COVID-19. We see this as only an early phase of the acceleration of online banking and financial services, and believe that Square may continue to be a strong contributor to the Fund moving forward.
During the period, the Fund increased its allocations to the Communication Services, Industrials, and Consumer Discretionary sectors. The Fund eliminated its holdings in the Health Care and Real Estate sectors and reduced its positions in the Information Technology, and Financials sectors. There were no significant changes to the Fund’s allocations to the Consumer Staples, and Materials sectors.
Fiscal Period-End Investment Posture
As of March 31, 2021, the Fund’s primary economic sector allocations included Information Technology, Communication Services, and Consumer Discretionary. The Fund had no investments in the Energy, Health Care, Real Estate, and Utilities sectors.
The Fund’s most significant country allocation weightings at period-end, excluding short-term investments, were in the United States, France, China/Hong Kong, Netherlands, and Canada. Country-level weightings generally should be considered a residual of the Fund’s stock selection process rather than a major, proactive facet of its investment strategy.
Sincerely,
THOMAS F. MARSICO
BRANDON A. GEISLER
ROBERT G. SUSMAN, CFA
PORTFOLIO MANAGERS
(1) | Total returns are based on net change in net asset value assuming reinvestment of distributions. Periodically, certain fees and expenses have been waived or reimbursed by the Adviser for the Global Fund. In the absence of such a waiver or reimbursement, the performance returns reflected would have been reduced. In accordance with the expense limitation and fee waiver agreement, the Adviser may recoup fees and expenses previously waived or reimbursed under certain parameters. Periodically, the Adviser has recouped such fees or expenses from the Global Fund, resulting in a lower performance return. Please see the Prospectus for more information. |
28
March 31, 2021 (Unaudited)
The Global Fund is a diversified portfolio and invests primarily in the common stocks of US and foreign companies that are selected for their long-term growth potential. The Fund may invest in an unlimited number of companies of any size that are economically tied to any countries or markets throughout the world, including securities of companies economically tied to emerging markets. Under normal market conditions, the Fund will invest significantly (generally, at least 40% of its net assets) in the securities of issuers organized or located outside the US or doing business outside the US or other foreign securities (unless market conditions are not deemed favorable by the Adviser, in which case the Fund generally will invest at least 30% of its assets in such foreign securities). The Fund will invest its assets in various regions and countries, including the US, that encompass not less than three different countries overall.
TOTAL ANNUAL OPERATING EXPENSES* 1.73% NET EXPENSES*† 1.50% | NET ASSETS $299,898,987 | NET ASSET VALUE PER SHARE $24.29 |
GROWTH OF $10,000(1)(2)(3) | PERFORMANCE COMPARISON(1) |
| | Average Annualized Returns |
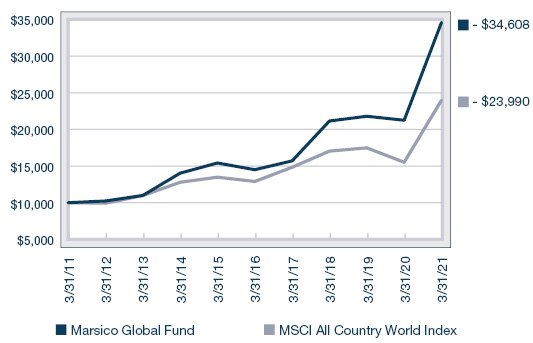
| 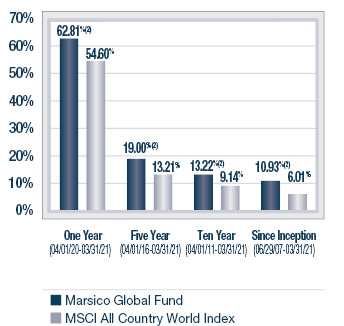
|
SECTOR ALLOCATION(4) | TOP FIVE HOLDINGS |
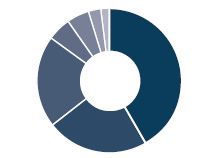 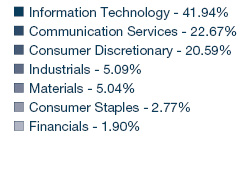
| | | | |
| | Amazon.com, Inc. | 6.24% | |
| | Microsoft Corporation | 5.85% | |
| | ASML Holding N.V. - NY Reg. Shs. | 5.41% | |
| | Tencent Holdings Ltd. ADR | 4.87% | |
| | Facebook, Inc. - Cl. A | 4.70% | |
| | | | |
* | The Total Annual Operating Expenses and Net Expenses are reflective of the information disclosed in the Funds’ Prospectus dated February 1, 2021 and may differ from the expense ratios disclosed in this report. |
† | Marsico Capital Management, LLC (the “Adviser”) has entered into a written expense limitation and fee waiver agreement under which it has agreed to limit the total expenses of the Global Fund (excluding taxes, interest, acquired fund fees and expenses, litigation, extraordinary expenses, and brokerage and other transaction expenses relating to the purchase or sale of portfolio investments) to an annual rate of 1.50% of the Fund’s average net assets until January 31, 2022. This expense limitation and fee waiver agreement may be terminated by the Adviser at any time after January 31, 2022 upon 15 days prior notice to the Fund and its administrator. The Adviser may recoup from the Fund fees previously waived or expenses previously reimbursed by the Adviser with respect to that Fund pursuant to this agreement (or a previous expense limitation agreement) if: (1) such recoupment by the Adviser does not cause the Fund, at the time of recoupment, to exceed the lesser of (a) the expense limitation in effect at the time the relevant amount was waived and/or reimbursed, or (b) the expense limitation in effect at the time of the proposed recoupment, and (2) the recoupment is made within three years after the fiscal year end date as of which the amount to be waived or reimbursed was determined and the waiver or reimbursement occurred. |
(1) | The performance data quoted here represent past performance, and past performance is not a guarantee of future results. Investment return and principal value of an investment will fluctuate so that an investor’s shares, when redeemed, may be worth more or less than their original cost. Current performance may be lower or higher than the performance information quoted. To obtain performance information current to the most recent month-end, please call 888-860-8686 or visit marsicofunds.com. |
| The performance included in the chart and graph does not reflect the deduction of taxes on Fund distributions or the redemption of Fund shares. |
| All indices are unmanaged and investors cannot invest directly in an index. |
| The MSCI ACWI (All Country World Index) Index is a free float-adjusted market capitalization index that is designed to measure equity market performance in the global developed and emerging markets. |
(2) | Periodically, certain fees and expenses have been waived or reimbursed by the Adviser for the Global Fund. In the absence of such a waiver or reimbursement, the performance returns reflected would have been reduced. In accordance with the expense limitation and fee waiver agreement, the Adviser may recoup fees and expenses previously waived or reimbursed under certain parameters. Periodically, the Adviser has recouped such fees or expenses from the Global Fund, resulting in a lower performance return. |
(3) | This chart assumes an initial investment of $10,000 made on March 31, 2011. Total returns are based on change in NAV, assuming reinvestment of distributions. |
(4) | Sector weightings represent the percentage of the Fund’s investments (excluding cash equivalents) in certain general sectors. These sectors may include more than one industry. The Fund’s portfolio composition is subject to change at any time. |
29
MARSICO GLOBAL FUND
SCHEDULE OF INVESTMENTS
March 31, 2021 (Unaudited)
| | | Number
of
Shares | | | Value | | | Percent
of Net
Assets | |
COMMON STOCKS^ | | | | | | | | | | | | |
Aerospace & Defense | | | | | | | | | | | | |
Safran S.A.* | | | 41,229 | | | $ | 5,610,930 | | | | 1.87 | % |
| | | | | | | | | | | | | |
Apparel, Accessories & Luxury Goods | | | | |
Hermes International | | | 8,813 | | | | 9,756,245 | | | | 3.26 | |
lululemon athletica, inc.* | | | 22,202 | | | | 6,809,575 | | | | 2.27 | |
LVMH Moet Hennessy Louis Vuitton S.E. | | | 15,360 | | | | 10,232,999 | | | | 3.41 | |
| | | | | | | 26,798,819 | | | | 8.94 | |
Application Software | | | | | | | | | | | | |
Atlassian Corporation PLC - Cl. A* | | | 26,520 | | | | 5,589,355 | | | | 1.86 | |
| | | | | | | | | | | | | |
Automobile Manufacturers | | | | | | | | | | | | |
Volkswagen A.G. Preference Shares | | | 12,122 | | | | 3,391,811 | | | | 1.13 | |
| | | | | | | | | | | | | |
Consumer Finance | | | | | | | | | | | | |
American Express Co. | | | 40,307 | | | | 5,701,022 | | | | 1.90 | |
| | | | | | | | | | | | | |
Data Processing & Outsourced Services | | | | |
Adyen N.V.* | | | 2,692 | | | | 6,009,175 | | | | 2.00 | |
PayPal Holdings, Inc.* | | | 36,985 | | | | 8,981,437 | | | | 3.00 | |
Square, Inc. - Cl. A* | | | 30,820 | | | | 6,997,681 | | | | 2.33 | |
Visa, Inc. - Cl. A | | | 54,241 | | | | 11,484,447 | | | | 3.83 | |
| | | | | | | 33,472,740 | | | | 11.16 | |
Integrated Telecommunication Services | | | | |
Cellnex Telecom SA | | | 127,901 | | | | 7,364,485 | | | | 2.46 | |
| | | | | | | | | | | | | |
Interactive Home Entertainment | | | | | | | | |
Sea Ltd. ADR* | | | 37,709 | | | | 8,417,780 | | | | 2.81 | |
| | | | | | | | | | | | | |
Interactive Media & Services |
Facebook, Inc. - Cl. A* | | | 47,851 | | | | 14,093,555 | | | | 4.70 | |
Scout24 A.G. | | | 55,464 | | | | 4,208,258 | | | | 1.40 | |
Tencent Holdings Ltd. ADR | | | 182,973 | | | | 14,601,246 | | | | 4.87 | |
| | | | | | | 32,903,059 | | | | 10.97 | |
Internet & Direct Marketing Retail | | | | | | | | |
Alibaba Group Holding Ltd. Spon. ADR* | | | 56,140 | | | | 12,728,622 | | | | 4.25 | |
Amazon.com, Inc.* | | | 6,049 | | | | 18,716,090 | | | | 6.24 | |
| | | | | | | 31,444,712 | | | | 10.49 | |
Internet Services & Infrastructure | | | | |
Okta, Inc.* | | | 7,773 | | | | 1,713,402 | | | | 0.57 | |
Shopify, Inc. - Cl. A* | | | 7,744 | | | | 8,568,736 | | | | 2.86 | |
Twilio, Inc. - Cl. A* | | | 21,915 | | | | 7,467,756 | | | | 2.49 | |
| | | | | | | 17,749,894 | | | | 5.92 | |
Metal & Glass Containers | | | | | | | | |
Ball Corporation | | | 82,498 | | | | 6,990,880 | | | | 2.33 | |
| | | | | | | | | | | | | |
Movies & Entertainment | | | | | | | | | | | | |
Spotify Technology S.A.* | | | 21,201 | | | | 5,680,808 | | | | 1.90 | |
The Walt Disney Company* | | | 73,186 | | | | 13,504,281 | | | | 4.50 | |
| | | | | | | 19,185,089 | | | | 6.40 | |
COMMON STOCKS^ (continued) | | | | | | | | |
Personal Products | | | | | | | | | | | | |
L’Oreal S.A. | | | 21,664 | | | | 8,302,476 | | | | 2.77 | % |
| | | | | | | | | | | | | |
Railroads | | | | | | | | | | | | |
Canadian Pacific Railway Ltd. | | | 25,409 | | | | 9,637,380 | | | | 3.21 | |
| | | | | | | | | | | | | |
Semiconductor Equipment | | | | | | | | | | | | |
ASML Holding N.V. - NY Reg. Shs. | | | 26,284 | | | | 16,226,690 | | | | 5.41 | |
| | | | | | | | | | | | | |
Semiconductors | | | | | | | | | | | | |
NVIDIA Corporation | | | 17,213 | | | | 9,190,537 | | | | 3.06 | |
Taiwan Semiconductor Manufacturing Co., Ltd. Spon. ADR | | | 82,044 | | | | 9,704,164 | | | | 3.24 | |
| | | | | | | 18,894,701 | | | | 6.30 | |
Specialty Chemicals | | | | | | | | | | | | |
The Sherwin-Williams Company | | | 10,971 | | | | 8,096,708 | | | | 2.70 | |
| | | | | | | | | | | | | |
Systems Software | | | | | | | | | | | | |
Microsoft Corporation | | | 74,401 | | | | 17,541,524 | | | | 5.85 | |
ServiceNow, Inc.* | | | 14,466 | | | | 7,234,591 | | | | 2.41 | |
| | | | | | | 24,776,115 | | | | 8.26 | |
Technology Hardware, Storage & Peripherals | | | | |
Apple, Inc. | | | 72,732 | | | | 8,884,214 | | | | 2.96 | |
| | | | | | | | | | | | | |
TOTAL COMMON STOCKS | | | | | | | | | | | | |
(Cost $166,461,233) | | | | | | | 299,438,860 | | | | 99.85 | |
| | | | | | | | | | | | | |
SHORT-TERM INVESTMENTS^ | | | | | | | | |
State Street Institutional Treasury Money Market Fund - Premier Class, 0.000% | | | 1,185,305 | | | | 1,185,305 | | | | 0.39 | |
| | | | | | | | | | | | | |
TOTAL SHORT-TERM INVESTMENTS | | | | |
(Cost $1,185,305) | | | | | | | 1,185,305 | | | | 0.39 | |
| | | | | | | | | | | | | |
TOTAL INVESTMENTS | | | | | | | | | | | | |
(Cost $167,646,538) | | | | | | | 300,624,165 | | | | 100.24 | |
| | | | | | | | | | | | | |
Liabilities, Less Cash and Other Assets | | | | | | | (725,178 | ) | | | (0.24 | ) |
| | | | | | | | | | | | | |
NET ASSETS | | | | | | $ | 299,898,987 | | | | 100.00 | % |
30
SUMMARY OF INVESTMENTS BY COUNTRY |
Country | | Market Value | | | Percent of
Investment
Securities | |
Australia | | $ | 5,589,355 | | | | 1.86 | % |
Canada | | | 18,206,116 | | | | 6.05 | |
China/Hong Kong | | | 27,329,868 | | | | 9.09 | |
France | | | 33,902,650 | | | | 11.28 | |
Germany | | | 7,600,069 | | | | 2.53 | |
Netherlands | | | 22,235,865 | | | | 7.40 | |
Singapore | | | 8,417,780 | | | | 2.80 | |
Spain | | | 7,364,485 | | | | 2.45 | |
Sweden | | | 5,680,808 | | | | 1.89 | |
Taiwan | | | 9,704,164 | | | | 3.23 | |
United States(1) | | | 154,593,005 | | | | 51.42 | |
| | | $ | 300,624,165 | | | | 100.00 | % |
(1) | Includes short-term securities. |
^ | As of March 31, 2021, all investments were classified as Level 1 with their corresponding fair valuation disclosed in the above Schedule of Investments. For more information on investment valuation and valuation inputs, refer to Note 2(a) in the Notes to Financial Statements. |
| See notes to financial statements. |
31
STATEMENTS OF ASSETS AND LIABILITIES
March 31, 2021 (Unaudited)
(Amounts in thousands) | | MARSICO
FOCUS FUND | | | MARSICO
GROWTH FUND | |
| | | | | | | | | |
ASSETS | | | | | | | | |
Investments, at value (cost $448,568, $257,159, $211,183, $41,467, and $167,647, respectively) | | $ | 823,979 | | | $ | 448,694 | |
Foreign currency (cost $0, $0, $0, $4, and $0, respectively) | | | — | | | | — | |
Receivable for capital stock sold | | | 58 | | | | 7 | |
Dividends receivable | | | 315 | | | | 59 | |
Prepaid expenses and other assets | | | 6,987 | | | | 1,787 | |
Total Assets | | | 831,339 | | | | 450,547 | |
| | | | | | | | | |
LIABILITIES | | | | | | | | |
Payable for investments purchased | | | — | | | | — | |
Payable for capital stock redeemed | | | 460 | | | | 297 | |
Payable to investment adviser | | | 515 | | | | 299 | |
Accrued trustees’ fees | | | 6,976 | | | | 1,761 | |
Accrued distribution fee | | | 939 | | | | 1,485 | |
Accrued professional fees | | | 81 | | | | 38 | |
Accrued transfer agent fees and expenses | | | 69 | | | | 28 | |
Accrued custody and fund accounting expenses | | | 34 | | | | 26 | |
Accrued reporting, printing and postage expenses | | | 27 | | | | 13 | |
Accrued expenses and other liabilities | | | 39 | | | | 29 | |
Total Liabilities | | | 9,140 | | | | 3,976 | |
| | | | | | | | | |
NET ASSETS | | $ | 822,199 | | | $ | 446,571 | |
| | | | | | | | | |
NET ASSETS CONSIST OF | | | | | | | | |
Paid-in-capital | | $ | 361,885 | | | $ | 202,920 | |
Total distributable earnings | | | 460,314 | | | | 243,651 | |
NET ASSETS | | $ | 822,199 | | | $ | 446,571 | |
| | | | | | | | | |
SHARES OUTSTANDING, $0.001 par value | | | | | | | | |
(Unlimited shares authorized) | | | 31,941 | | | | 16,625 | |
| | | | | | | | | |
NET ASSET VALUE, REDEMPTION PRICE, AND OFFERING PRICE PER SHARE (NET ASSETS/SHARES OUTSTANDING)* | | $ | 25.74 | | | $ | 26.86 | |
* | Not in thousands, based on unrounded net assets and shares outstanding. |
| See notes to financial statements. |
32
| | MARSICO
21st CENTURY FUND | | | MARSICO
INTERNATIONAL
OPPORTUNITIES
FUND | | | MARSICO
GLOBAL FUND | |
| | | | | | | | | | | | |
| | | | | | | | | | | | |
| | $ | 362,412 | | | $ | 59,493 | | | $ | 300,624 | |
| | | — | | | | 4 | | | | — | |
| | | 25 | | | | 9 | | | | 1 | |
| | | 59 | | | | 215 | | | | 121 | |
| | | 626 | | | | 160 | | | | 897 | |
| | | 363,122 | | | | 59,881 | | | | 301,643 | |
| | | | | | | | | | | | |
| | | | | | | | | | | | |
| | | — | | | | 120 | | | | — | |
| | | 48 | | | | — | | | | 233 | |
| | | 241 | | | | 34 | | | | 247 | |
| | | 612 | | | | 147 | | | | 888 | |
| | | 464 | | | | 163 | | | | 245 | |
| | | 31 | | | | 12 | | | | 30 | |
| | | 29 | | | | 11 | | | | 28 | |
| | | 30 | | | | 46 | | | | 38 | |
| | | 9 | | | | 2 | | | | 7 | |
| | | 36 | | | | 15 | | | | 28 | |
| | | 1,500 | | | | 550 | | | | 1,744 | |
| | | | | | | | | | | | |
| | $ | 361,622 | | | $ | 59,331 | | | $ | 299,899 | |
| | | | | | | | | | | | |
| | | | | | | | | | | | |
| | $ | 188,129 | | | $ | 40,879 | | | $ | 152,112 | |
| | | 173,493 | | | | 18,452 | | | | 147,787 | |
| | $ | 361,622 | | | $ | 59,331 | | | $ | 299,899 | |
| | | | | | | | | | | | |
| | | | | | | | | | | | |
| | | 7,459 | | | | 2,610 | | | | 12,348 | |
| | | | | | | | | | | | |
| | $ | 48.48 | | | $ | 22.73 | | | $ | 24.29 | |
33
STATEMENTS OF OPERATIONS
FOR THE SIX-MONTH PERIOD ENDED March 31, 2021 (Unaudited)
(Amounts in thousands) | | MARSICO
FOCUS FUND | | | MARSICO
GROWTH FUND | |
| | | | | | | | | |
INVESTMENT INCOME | | | | | | | | |
Dividends (net of $26, $0, $5, $50, and $23, respectively, of non-reclaimable foreign withholding taxes) | | $ | 2,075 | | | $ | 849 | |
Total Investment Income | | | 2,075 | | | | 849 | |
| | | | | | | | | |
EXPENSES | | | | | | | | |
Investment advisory fees | | | 3,080 | | | | 1,737 | |
Distribution fees | | | 339 | | | | 558 | |
Trustees’ fees and expenses | | | 617 | (1) | | | 244 | (1) |
Transfer agent fees and expenses | | | 324 | | | | 181 | |
Professional fees | | | 152 | | | | 78 | |
Fund administration fees | | | 89 | | | | 72 | |
Custody and fund accounting fees | | | 59 | | | | 43 | |
Reporting, printing, and postage expenses | | | 46 | | | | 26 | |
Miscellaneous | | | 43 | | | | 22 | |
Federal and state registration fees | | | 17 | | | | 15 | |
Total Expenses | | | 4,766 | | | | 2,976 | |
Recoupment of previously waived expenses | | | — | | | | 139 | |
Less waiver of expenses and expenses paid indirectly | | | — | | | | — | |
Net Expenses | | | 4,766 | | | | 3,115 | |
| | | | | | | | | |
NET INVESTMENT LOSS | | | (2,691 | ) | | | (2,266 | ) |
| | | | | | | | | |
REALIZED AND UNREALIZED GAIN (LOSS) | | | | | | | | |
Net realized gain on investments | | | 89,517 | | | | 56,630 | |
Net realized gain on foreign currency transactions | | | — | | | | — | |
Change in unrealized appreciation (depreciation) on investments, foreign currency translations, and non-interested trustees’ deferred compensation | | | (12,653 | ) | | | 3,098 | |
| | | | | | | | | |
Net Gain on Investments | | | 76,864 | | | | 59,728 | |
| | | | | | | | | |
NET INCREASE IN NET ASSETS RESULTING FROM OPERATIONS | | $ | 74,173 | | | $ | 57,462 | |
(1) | Amounts include Trustees’ fees and expenses and the mark to market unrealized appreciation during the period for shares held in the Non-Interested Trustees’ Deferred Fee Plan, as more fully described in Note 2(g) in the Notes to Financial Statements. |
| | | Trustees’
Fees and
Expenses* | | | Unrealized
Appreciation* | |
Focus Fund | | $ | 71,153 | | | $ | 545,958 | |
Growth Fund | | | 36,567 | | | | 207,573 | |
21st Century Fund | | | 26,300 | | | | 93,215 | |
International Opportunities Fund | | | 4,888 | | | | 24,078 | |
Global Fund | | | 24,819 | | | | 59,923 | |
| See notes to financial statements. |
34
| | MARSICO
21st CENTURY FUND | | | MARSICO
INTERNATIONAL
OPPORTUNITIES
FUND | | | MARSICO
GLOBAL FUND | |
| | | | | | | | | | | | |
| | | | | | | | | | | | |
| | $ | 1,127 | | | $ | 442 | | | $ | 428 | |
| | | 1,127 | | | | 442 | | | | 428 | |
| | | | | | | | | | | | |
| | | | | | | | | | | | |
| | | 1,352 | | | | 236 | | | | 1,190 | |
| | | 430 | | | | 74 | | | | 376 | |
| | | 120 | (1) | | | 29 | (1) | | | 85 | (1) |
| | | 174 | | | | 42 | | | | 173 | |
| | | 56 | | | | 14 | | | | 55 | |
| | | 67 | | | | 31 | | | | 77 | |
| | | 48 | | | | 66 | | | | 59 | |
| | | 20 | | | | 8 | | | | 19 | |
| | | 22 | | | | 5 | | | | 18 | |
| | | 13 | | | | 9 | | | | 13 | |
| | | 2,302 | | | | 514 | | | | 2,065 | |
| | | — | | | | — | | | | 116 | |
| | | — | | | | (72 | ) | | | — | |
| | | 2,302 | | | | 442 | | | | 2,181 | |
| | | | | | | | | | | | |
| | | (1,175 | ) | | | — | | | | (1,753 | ) |
| | | | | | | | | | | | |
| | | | | | | | | | | | |
| | | 30,136 | | | | 2,613 | | | | 20,444 | |
| | | 10 | | | | 733 | | | | 1,486 | |
| | | 46,276 | | | | 3,765 | | | | 3,487 | |
| | | | | | | | | | | | |
| | | 76,422 | | | | 7,111 | | | | 25,417 | |
| | | | | | | | | | | | |
| | $ | 75,247 | | | $ | 7,111 | | | $ | 23,664 | |
35
STATEMENTS OF CHANGES IN NET ASSETS
| | | MARSICO
FOCUS
FUND | | | MARSICO
GROWTH
FUND | |
| | | | | | | | | | | | | | | | | |
(Amounts in thousands) | | Six-Month
Period Ended
3/31/21
(Unaudited) | | | Year
Ended
9/30/20 | | | Six-Month
Period Ended
3/31/21
(Unaudited) | | | Year
Ended
9/30/20 | |
| | | | | | | | | | | | | | | | | |
OPERATIONS: | | | | | | | | | | | | | | | | |
Net investment income (loss) | | $ | (2,691 | ) | | $ | (3,349 | ) | | $ | (2,266 | ) | | $ | (2,616 | ) |
Net realized gain on investments | | | 89,517 | | | | 82,521 | | | | 56,630 | | | | 39,875 | |
Net realized gain (loss) on foreign currency transactions | | | — | | | | — | | | | — | | | | — | |
Change in unrealized appreciation (depreciation) on investments, foreign currency translations, and non-interested trustees’ deferred compensation | | | (12,653 | ) | | | 192,398 | | | | 3,098 | | | | 96,000 | |
| | | | | | | | | | | | | | | | | |
Net increase in net assets resulting from operations | | | 74,173 | | | | 271,570 | | | | 57,462 | | | | 133,259 | |
| | | | | | | | | | | | | | | | | |
DISTRIBUTIONS: | | | (79,818 | ) | | | (43,408 | ) | | | (37,975 | ) | | | (25,236 | ) |
| | | | | | | | | | | | | | | | | |
CAPITAL SHARE TRANSACTIONS: | | | | | | | | | | | | | | | | |
Proceeds from sales of shares | | | 25,304 | | | | 73,471 | | | | 23,918 | | | | 68,169 | |
Proceeds from reinvestment of distributions | | | 77,365 | | | | 42,039 | | | | 36,654 | | | | 24,193 | |
Redemption of shares | | | (81,006 | ) | | | (92,136 | ) | | | (44,080 | ) | | | (49,098 | ) |
| | | | | | | | | | | | | | | | | |
Net increase (decrease) from capital share transactions | | | 21,663 | | | | 23,374 | | | | 16,492 | | | | 43,264 | |
| | | | | | | | | | | | | | | | | |
TOTAL INCREASE IN NET ASSETS | | | 16,018 | | | | 251,536 | | | | 35,979 | | | | 151,287 | |
| | | | | | | | | | | | | | | | | |
NET ASSETS: | | | | | | | | | | | | | | | | |
Beginning of Period | | | 806,181 | | | | 554,645 | | | | 410,592 | | | | 259,305 | |
| | | | | | | | | | | | | | | | | |
End of Period | | $ | 822,199 | | | $ | 806,181 | | | $ | 446,571 | | | $ | 410,592 | |
| | | | | | | | | | | | | | | | | |
TRANSACTIONS IN SHARES: | | | | | | | | | | | | | | | | |
Shares sold | | | 938 | | | | 3,475 | | | | 872 | | | | 3,291 | |
Shares issued in reinvestment of distributions | | | 3,015 | | | | 2,280 | | | | 1,388 | | | | 1,345 | |
Shares redeemed | | | (3,111 | ) | | | (4,499 | ) | | | (1,634 | ) | | | (2,463 | ) |
| | | | | | | | | | | | | | | | | |
NET INCREASE (DECREASE) | | | 842 | | | | 1,256 | | | | 626 | | | | 2,173 | |
| See notes to financial statements. |
36
| | | | | | MARSICO
21st
CENTURY
FUND | | | MARSICO
INTERNATIONAL
OPPORTUNITIES FUND | | | MARSICO
GLOBAL
FUND | |
| | | | | | | | | | | | | | | | | | | | | | | | | | | | |
| | | | | | Six-Month
Period Ended
3/31/21
(Unaudited) | | | Year
Ended
9/30/20 | | | Six-Month
Period Ended
3/31/21
(Unaudited) | | | Year
Ended
9/30/20 | | | Six-Month
Period Ended
3/31/21
(Unaudited) | | | Year
Ended
9/30/20 | |
| | | | | | | | | | | | | | | | | | | | | | | | | | | | |
| | | | | | | | | | | | | | | | | | | | | | | | | | | | |
| | | | | | $ | (1,175 | ) | | $ | (2,604 | ) | | $ | — | | | $ | 150 | | | $ | (1,753 | ) | | $ | (2,037 | ) |
| | | | | | | 30,136 | | | | 5,929 | | | | 2,613 | | | | 1,457 | | | | 20,444 | | | | 8,476 | |
| | | | | | | 10 | | | | (34 | ) | | | 733 | | | | (201 | ) | | | 1,486 | | | | (1,591 | ) |
| | | | | | | 46,276 | | | | 47,029 | | | | 3,765 | | | | 6,540 | | | | 3,487 | | | | 81,560 | |
| | | | | | | | | | | | | | | | | | | | | | | | | | | | |
| | | | | | | 75,247 | | | | 50,320 | | | | 7,111 | | | | 7,946 | | | | 23,664 | | | | 86,408 | |
| | | | | | | | | | | | | | | | | | | | | | | | | | | | |
| | | | | | | (9,729 | ) | | | (8,884 | ) | | | (1,438 | ) | | | (2,281 | ) | | | (7,258 | ) | | | — | |
| | | | | | | | | | | | | | | | | | | | | | | | | | | | |
| | | | | | | | | | | | | | | | | | | | | | | | | | | | |
| | | | | | | 12,604 | | | | 5,247 | | | | 657 | | | | 5,356 | | | | 11,301 | | | | 15,187 | |
| | | | | | | 9,419 | | | | 8,549 | | | | 1,387 | | | | 2,211 | | | | 7,067 | | | | — | |
| | | | | | | (17,895 | ) | | | (46,035 | ) | | | (3,410 | ) | | | (11,519 | ) | | | (19,908 | ) | | | (45,455 | ) |
| | | | | | | | | | | | | | | | | | | | | | | | | | | | |
| | | | | | | 4,128 | | | | (32,239 | ) | | | (1,366 | ) | | | (3,952 | ) | | | (1,540 | ) | | | (30,268 | ) |
| | | | | | | | | | | | | | | | | | | | | | | | | | | | |
| | | | | | | 69,646 | | | | 9,197 | | | | 4,307 | | | | 1,713 | | | | 14,866 | | | | 56,140 | |
| | | | | | | | | | | | | | | | | | | | | | | | | | | | |
| | | | | | | | | | | | | | | | | | | | | | | | | | | | |
| | | | | | | 291,976 | | | | 282,779 | | | | 55,024 | | | | 53,311 | | | | 285,033 | | | | 228,893 | |
| | | | | | | | | | | | | | | | | | | | | | | | | | | | |
| | | | | | $ | 361,622 | | | $ | 291,976 | | | $ | 59,331 | | | $ | 55,024 | | | $ | 299,899 | | | $ | 285,033 | |
| | | | | | | | | | | | | | | | | | | | | | | | | | | | |
| | | | | | | | | | | | | | | | | | | | | | | | | | | | |
| | | | | | | 260 | | | | 157 | | | | 25 | | | | 283 | | | | 399 | | | | 789 | |
| | | | | | | 199 | | | | 258 | | | | 62 | | | | 118 | | | | 289 | | | | — | |
| | | | | | | (387 | ) | | | (1,418 | ) | | | (152 | ) | | | (612 | ) | | | (825 | ) | | | (2,559 | ) |
| | | | | | | | | | | | | | | | | | | | | | | | | | | | |
| | | | | | | 72 | | | | (1,003 | ) | | | (65 | ) | | | (211 | ) | | | (137 | ) | | | (1,770 | ) |
37
FINANCIAL HIGHLIGHTS
| | | | MARSICO FOCUS FUND | |
For a Fund Share Outstanding Throughout the Period | | | Six-Month
Period Ended
3/31/21
(Unaudited) | | | Year
Ended
9/30/20 | | | Year
Ended
9/30/19 | | | Year
Ended
9/30/18 | | | Year
Ended
9/30/17 | | | Year
Ended
9/30/16 | |
| | | | | | | | | | | | | | | | | | | | | | | | | | |
Net Asset Value, Beginning of Period | | | $ | 25.92 | | | $ | 18.59 | | | $ | 20.17 | | | $ | 19.63 | | | $ | 15.96 | | | $ | 18.83 | |
| | | | | | | | | | | | | | | | | | | | | | | | | | |
| | | | | | | | | | | | | | | | | | | | | | | | | | |
Income from Investment Operations: | | | | | | | | | | | | | | | | | | | | | | | | | |
Net investment loss | | | | (0.08 | ) | | | (0.10 | ) | | | (0.04 | ) | | | (0.09 | ) | | | (0.17 | ) | | | (0.13 | ) |
Net realized and unrealized gains on investments | | | | 2.50 | | | | 8.92 | | | | 0.25 | | | | 3.82 | | | | 3.84 | | | | 1.25 | |
| | | | | | | | | | | | | | | | | | | | | | | | | | |
Total from investment operations | | | | 2.42 | | | | 8.82 | | | | 0.21 | | | | 3.73 | | | | 3.67 | | | | 1.12 | |
| | | | | | | | | | | | | | | | | | | | | | | | | | |
Distributions & Other: | | | | | | | | | | | | | | | | | | | | | | | | | |
Net realized gains | | | | (2.60 | ) | | | (1.49 | ) | | | (1.79 | ) | | | (3.19 | ) | | | — | | | | (3.99 | ) |
| | | | | | | | | | | | | | | | | | | | | | | | | | |
Total distributions and other | | | | (2.60 | ) | | | (1.49 | ) | | | (1.79 | ) | | | (3.19 | ) | | | — | | | | (3.99 | ) |
| | | | | | | | | | | | | | | | | | | | | | | | | | |
Net Asset Value, End of Period | | | $ | 25.74 | | | $ | 25.92 | | | $ | 18.59 | | | $ | 20.17 | | | $ | 19.63 | | | $ | 15.96 | |
| | | | | | | | | | | | | | | | | | | | | | | | | | |
| | | | | | | | | | | | | | | | | | | | | | | | | | |
Total Return | | | | 9.35 | %(1) | | | 50.71 | % | | | 2.52 | % | | | 21.78 | % | | | 22.99 | % | | | 5.75 | % |
| | | | | | | | | | | | | | | | | | | | | | | | | | |
| | | | | | | | | | | | | | | | | | | | | | | | | | |
Supplemental Data and Ratios: | | | | | | | | | | | | | | | | | | | | | | | | | |
| | | | | | | | | | | | | | | | | | | | | | | | | | |
Net assets, end of period (000s) | | | $ | 822,199 | | | $ | 806,181 | | | $ | 554,645 | | | $ | 606,014 | | | $ | 559,657 | | | $ | 613,870 | |
| | | | | | | | | | | | | | | | | | | | | | | | | | |
Ratio of expenses to average net assets, less waivers and before expenses paid indirectly, plus recoupment of previously waived fees or expenses paid | | | | 1.14 | %(2) | | | 1.24 | % | | | 1.02 | % | | | 1.21 | % | | | 1.37 | % | | | 1.29 | % |
| | | | | | | | | | | | | | | | | | | | | | | | | | |
Ratio of net investment loss to average net assets, net of waivers, recoupment of previously waived fees or expenses paid and expenses paid indirectly | | | | (0.65 | )%(2) | | | (0.53 | )% | | | (0.19 | )% | | | (0.48 | )% | | | (0.62 | )% | | | (0.63 | )% |
| | | | | | | | | | | | | | | | | | | | | | | | | | |
Ratio of expenses to average net assets, before waivers, recoupment of previously waived fees or expenses paid and expenses paid indirectly | | | | 1.14 | %(2) | | | 1.24 | % | | | 1.02 | % | | | 1.21 | % | | | 1.37 | % | | | 1.29 | % |
| | | | | | | | | | | | | | | | | | | | | | | | | | |
Ratio of net investment loss to average net assets, before waivers, recoupment of previously waived fees or expenses paid and expenses paid indirectly | | | | (0.65 | )%(2) | | | (0.53 | )% | | | (0.19 | )% | | | (0.48 | )% | | | (0.62 | )% | | | (0.63 | )% |
| | | | | | | | | | | | | | | | | | | | | | | | | | |
Portfolio turnover rate | | | | 21 | %(1) | | | 45 | % | | | 42 | % | | | 53 | % | | | 67 | % | | | 45 | % |
| See notes to financial statements. |
38
| | | MARSICO
GROWTH
FUND | | | MARSICO
21st
CENTURY FUND | | |
| | | Six-Month
Period Ended
3/31/21
(Unaudited) | | | Year
Ended
9/30/20 | | | Year
Ended
9/30/19 | | | Year
Ended
9/30/18 | | | Year
Ended
9/30/17 | | | Year
Ended
9/30/16 | | | Six-Month
Period Ended
3/31/21
(Unaudited) | | | Year
Ended
9/30/20 | | | Year
Ended
9/30/19 | | | Year
Ended
9/30/18 | | | Year
Ended
9/30/17 | | | Year
Ended
9/30/16 | | |
| | | | | | | | | | | | | | | | | | | | | | | | | | | | | | | | | | | | | | | | | | | | | | | | | | |
| | | $ | 25.66 | | | $ | 18.75 | | | $ | 20.69 | | | $ | 18.47 | | | $ | 15.54 | | | $ | 20.11 | | | $ | 39.52 | | | $ | 33.70 | | | $ | 33.18 | | | $ | 26.19 | | | $ | 22.04 | | | $ | 20.38 | | |
| | | | | | | | | | | | | | | | | | | | | | | | | | | | | | | | | | | | | | | | | | | | | | | | | | |
| | | | | | | | | | | | | | | | | | | | | | | | | | | | | | | | | | | | | | | | | | | | | | | | | | |
| | | | | | | | | | | | | | | | | | | | | | | | | | | | | | | | | | | | | | | | | | | | | | | | | | |
| | | | (0.13 | ) | | | (0.14 | ) | | | (0.08 | ) | | | (0.09 | ) | | | (0.14 | ) | | | (0.13 | ) | | | (0.15 | ) | | | (0.39 | ) | | | (0.20 | ) | | | (0.25 | ) | | | (0.29 | ) | | | (0.29 | ) | |
| | | | 3.71 | | | | 8.92 | | | | 0.34 | | | | 4.06 | | | | 3.19 | | | | 1.33 | | | | 10.45 | | | | 7.30 | | | | 2.15 | | | | 7.24 | | | | 4.44 | | | | 1.95 | | |
| | | | | | | | | | | | | | | | | | | | | | | | | | | | | | | | | | | | | | | | | | | | | | | | | | |
| | | | 3.58 | | | | 8.78 | | | | 0.26 | | | | 3.97 | | | | 3.05 | | | | 1.20 | | | | 10.30 | | | | 6.91 | | | | 1.95 | | | | 6.99 | | | | 4.15 | | | | 1.66 | | |
| | | | | | | | | | | | | | | | | | | | | | | | | | | | | | | | | | | | | | | | | | | | | | | | | | |
| | | | | | | | | | | | | | | | | | | | | | | | | | | | | | | | | | | | | | | | | | | | | | | | | | |
| | | | (2.38 | ) | | | (1.87 | ) | | | (2.20 | ) | | | (1.75 | ) | | | (0.12 | ) | | | (5.77 | ) | | | (1.34 | ) | | | (1.09 | ) | | | (1.43 | ) | | | — | | | | — | | | | — | | |
| | | | | | | | | | | | | | | | | | | | | | | | | | | | | | | | | | | | | | | | | | | | | | | | | | |
| | | | (2.38 | ) | | | (1.87 | ) | | | (2.20 | ) | | | (1.75 | ) | | | (0.12 | ) | | | (5.77 | ) | | | (1.34 | ) | | | (1.09 | ) | | | (1.43 | ) | | | — | | | | — | | | | — | | |
| | | | | | | | | | | | | | | | | | | | | | | | | | | | | | | | | | | | | | | | | | | | | | | | | | |
| | | $ | 26.86 | | | $ | 25.66 | | | $ | 18.75 | | | $ | 20.69 | | | $ | 18.47 | | | $ | 15.54 | | | $ | 48.48 | | | $ | 39.52 | | | $ | 33.70 | | | $ | 33.18 | | | $ | 26.19 | | | $ | 22.04 | | |
| | | | | | | | | | | | | | | | | | | | | | | | | | | | | | | | | | | | | | | | | | | | | | | | | | |
| | | | | | | | | | | | | | | | | | | | | | | | | | | | | | | | | | | | | | | | | | | | | | | | | | |
| | | | 14.11 | %(1) | | | 51.11 | % | | | 3.16 | % | | | 23.10 | % | | | 19.85 | % | | | 5.94 | % | | | 26.15 | %(1) | | | 21.15 | % | | | 6.88 | % | | | 26.69 | % | | | 18.83 | % | | | 8.15 | % | |
| | | | | | | | | | | | | | | | | | | | | | | | | | | | | | | | | | | | | | | | | | | | | | | | | | |
| | | | | | | | | | | | | | | | | | | | | | | | | | | | | | | | | | | | | | | | | | | | | | | | | | |
| | | | | | | | | | | | | | | | | | | | | | | | | | | | | | | | | | | | | | | | | | | | | | | | | | |
| | | | | | | | | | | | | | | | | | | | | | | | | | | | | | | | | | | | | | | | | | | | | | | | | | |
| | | $ | 446,571 | | | $ | 410,592 | | | $ | 259,305 | | | $ | 298,940 | | | $ | 266,922 | | | $ | 288,213 | | | $ | 361,622 | | | $ | 291,976 | | | $ | 282,779 | | | $ | 272,867 | | | $ | 234,322 | | | $ | 234,780 | | |
| | | | | | | | | | | | | | | | | | | | | | | | | | | | | | | | | | | | | | | | | | | | | | | | | | |
| | | | 1.40 | %(2) | | | 1.45 | % | | | 1.27 | % | | | 1.25 | % | | | 1.42 | % | | | 1.37 | % | | | 1.34 | %(2) | | | 1.40 | % | | | 1.30 | % | | | 1.21 | % | | | 1.40 | % | | | 1.41 | % | |
| | | | | | | | | | | | | | | | | | | | | | | | | | | | | | | | | | | | | | | | | | | | | | | | | | |
| | | | (1.02 | )%(2) | | | (0.85 | )% | | | (0.40 | )% | | | (0.46 | )% | | | (0.53 | )% | | | (0.61 | )% | | | (0.68 | )%(2) | | | (0.96 | )% | | | (0.66 | )% | | | (0.74 | )% | | | (0.96 | )% | | | (1.01 | )% | |
| | | | | | | | | | | | | | | | | | | | | | | | | | | | | | | | | | | | | | | | | | | | | | | | | | |
| | | | 1.33 | %(2) | | | 1.50 | % | | | 1.27 | % | | | 1.25 | % | | | 1.42 | % | | | 1.37 | % | | | 1.34 | %(2) | | | 1.40 | % | | | 1.30 | % | | | 1.21 | % | | | 1.40 | % | | | 1.41 | % | |
| | | | | | | | | | | | | | | | | | | | | | | | | | | | | | | | | | | | | | | | | | | | | | | | | | |
| | | | (0.95 | )%(2) | | | (0.90 | )% | | | (0.40 | )% | | | (0.46 | )% | | | (0.53 | )% | | | (0.61 | )% | | | (0.68 | )%(2) | | | (0.96 | )% | | | (0.66 | )% | | | (0.74 | )% | | | (0.96 | )% | | | (1.01 | )% | |
| | | | | | | | | | | | | | | | | | | | | | | | | | | | | | | | | | | | | | | | | | | | | | | | | | |
| | | | 27 | %(1) | | | 77 | % | | | 39 | % | | | 40 | % | | | 50 | % | | | 52 | % | | | 13 | %(1) | | | 38 | % | | | 34 | % | | | 90 | % | | | 28 | % | | | 44 | % | |
39
FINANCIAL HIGHLIGHTS
| | | | | | | | MARSICO
INTERNATIONAL OPPORTUNITIES FUND | |
For a Fund Share Outstanding Throughout the Period | | | Six-Month
Period Ended
3/31/21
(Unaudited) | | | Year
Ended
9/30/20 | | | Year
Ended
9/30/19 | | | Year
Ended
9/30/18 | | | Year
Ended
9/30/17 | | | Year
Ended
9/30/16 | |
| | | | | | | | | | | | | | | | | | | | | | | | | | |
Net Asset Value, Beginning of Period | | | $ | 20.57 | | | $ | 18.47 | | | $ | 20.23 | | | $ | 19.30 | | | $ | 15.64 | | | $ | 14.51 | |
| | | | | | | | | | | | | | | | | | | | | | | | | | |
| | | | | | | | | | | | | | | | | | | | | | | | | | |
Income from Investment Operations: | | | | | | | | | | | | | | | | | | | | | | | | | |
Net investment income (loss) | | | | (0.01 | ) | | | 0.04 | | | | 0.01 | | | | (0.09 | ) | | | (0.16 | ) | | | (0.20 | ) |
Net realized and unrealized gains (losses) on investments | | | | 2.72 | | | | 2.87 | | | | (0.35 | ) | | | 1.02 | | | | 3.82 | | | | 1.33 | |
| | | | | | | | | | | | | | | | | | | | | | | | | | |
Total from investment operations | | | | 2.71 | | | | 2.91 | | | | (0.34 | ) | | | 0.93 | | | | 3.66 | | | | 1.13 | |
| | | | | | | | | | | | | | | | | | | | | | | | | | |
Distributions & Other: | | | | | | | | | | | | | | | | | | | | | | | | | |
Net investment income | | | | — | | | | (0.07 | ) | | | — | | | | — | | | | — | | | | — | |
Net realized gains | | | | (0.55 | ) | | | (0.74 | ) | | | (1.42 | ) | | | — | | | | — | | | | — | |
| | | | | | | | | | | | | | | | | | | | | | | | | | |
Total distributions and other | | | | (0.55 | ) | | | (0.81 | ) | | | (1.42 | ) | | | — | | | | — | | | | — | |
| | | | | | | | | | | | | | | | | | | | | | | | | | |
Net Asset Value, End of Period | | | $ | 22.73 | | | $ | 20.57 | | | $ | 18.47 | | | $ | 20.23 | | | $ | 19.30 | | | $ | 15.64 | |
| | | | | | | | | | | | | | | | | | | | | | | | | | |
| | | | | | | | | | | | | | | | | | | | | | | | | | |
Total Return | | | | 13.20 | %(1) | | | 16.14 | % | | | (0.37 | )% | | | 4.82 | % | | | 23.40 | % | | | 7.79 | % |
| | | | | | | | | | | | | | | | | | | | | | | | | | |
| | | | | | | | | | | | | | | | | | | | | | | | | | |
Supplemental Data and Ratios: | | | | | | | | | | | | | | | | | | | | | | | | | |
| | | | | | | | | | | | | | | | | | | | | | | | | | |
Net assets, end of period (000s) | | | $ | 59,331 | | | $ | 55,024 | | | $ | 53,311 | | | $ | 62,152 | | | $ | 63,789 | | | $ | 62,833 | |
| | | | | | | | | | | | | | | | | | | | | | | | | | |
Ratio of expenses to average net assets, less waivers and before expenses paid indirectly, plus recoupment of previously waived fees or expenses paid | | | | 1.50 | %(2) | | | 1.50 | % | | | 1.50 | % | | | 1.52 | % | | | 1.60 | % | | | 1.60 | % |
| | | | | | | | | | | | | | | | | | | | | | | | | | |
Ratio of net investment income (loss) to average net assets, net of waivers, recoupment of previously waived fees or expenses paid and expenses paid indirectly | | | | 0.00 | %(2) | | | 0.28 | % | | | 0.14 | % | | | (0.33 | )% | | | (0.77 | )% | | | (0.71 | )% |
| | | | | | | | | | | | | | | | | | | | | | | | | | |
Ratio of expenses to average net assets, before waivers, recoupment of previously waived fees or expenses paid and expenses paid indirectly | | | | 1.75 | %(2) | | | 1.81 | % | | | 1.72 | % | | | 1.59 | % | | | 1.79 | % | | | 1.78 | % |
| | | | | | | | | | | | | | | | | | | | | | | | | | |
Ratio of net investment loss to average net assets, before waivers, recoupment of previously waived fees or expenses paid and expenses paid indirectly | | | | (0.25 | )%(2) | | | (0.03 | )% | | | (0.08 | )% | | | (0.40 | )% | | | (0.96 | )% | | | (0.89 | )% |
| | | | | | | | | | | | | | | | | | | | | | | | | | |
Portfolio turnover rate | | | | 25 | %(1) | | | 60 | % | | | 57 | % | | | 33 | % | | | 108 | % | | | 223 | % |
(3) | For information concerning the timing and modifications made to the written expense limitation and fee waiver agreement during the fiscal year, refer to Note 3 in the Notes to Financial Statements. |
| See notes to financial statements. |
40
| | | | | | MARSICO
GLOBAL
FUND | |
| | Six-Month
Period Ended
3/31/21
(Unaudited) | | | Year
Ended
9/30/20 | | | Year
Ended
9/30/19 | | | Year
Ended
9/30/18 | | | Year
Ended
9/30/17 | | | Year
Ended
9/30/16 | |
| | | | | | | | | | | | | | | | | | | | | | | | |
| | $ | 22.83 | | | $ | 16.06 | | | $ | 17.16 | | | $ | 15.13 | | | $ | 12.03 | | | $ | 12.37 | |
| | | | | | | | | | | | | | | | | | | | | | | | |
| | | | | | | | | | | | | | | | | | | | | | | | |
| | | | | | | | | | | | | | | | | | | | | | | | |
| | | (0.14 | ) | | | (0.19 | ) | | | (0.12 | ) | | | 0.11 | | | | (0.14 | ) | | | (0.16 | ) |
| | | 2.19 | | | | 6.96 | | | | (0.82 | ) | | | 3.26 | | | | 3.24 | | | | 1.14 | |
| | | | | | | | | | | | | | | | | | | | | | | | |
| | | 2.05 | | | | 6.77 | | | | (0.94 | ) | | | 3.37 | | | | 3.10 | | | | 0.98 | |
| | | | | | | | | | | | | | | | | | | | | | | | |
| | | | | | | | | | | | | | | | | | | | | | | | |
| | | — | | | | — | | | | — | | | | — | | | | — | | | | — | |
| | | (0.59 | ) | | | — | | | | (0.16 | ) | | | (1.34 | ) | | | — | | | | (1.32 | ) |
| | | | | | | | | | | | | | | | | | | | | | | | |
| | | (0.59 | ) | | | — | | | | (0.16 | ) | | | (1.34 | ) | | | — | | | | (1.32 | ) |
| | | | | | | | | | | | | | | | | | | | | | | | |
| | $ | 24.29 | | | $ | 22.83 | | | $ | 16.06 | | | $ | 17.16 | | | $ | 15.13 | | | $ | 12.03 | |
| | | | | | | | | | | | | | | | | | | | | | | | |
| | | | | | | | | | | | | | | | | | | | | | | | |
| | | 8.97 | %(1) | | | 42.15 | % | | | (5.36 | )% | | | 23.94 | % | | | 25.77 | % | | | 8.05 | % |
| | | | | | | | | | | | | | | | | | | | | | | | |
| | | | | | | | | | | | | | | | | | | | | | | | |
| | | | | | | | | | | | | | | | | | | | | | | | |
| | | | | | | | | | | | | | | | | | | | | | | | |
| | $ | 299,899 | | | $ | 285,033 | | | $ | 228,893 | | | $ | 286,514 | | | $ | 44,493 | | | $ | 44,273 | |
| | | | | | | | | | | | | | | | | | | | | | | | |
| | | 1.45 | %(2)(3) | | | 1.45 | % | | | 1.45 | % | | | 1.48 | % | | | 1.60 | % | | | 1.60 | % |
| | | | | | | | | | | | | | | | | | | | | | | | |
| | | (1.17 | )%(2) | | | (0.84 | )% | | | (0.55 | )% | | | (0.87 | )% | | | (0.82 | )% | | | (0.60 | )% |
| | | | | | | | | | | | | | | | | | | | | | | | |
| | | 1.37 | %(2) | | | 1.73 | % | | | 1.41 | % | | | 1.59 | % | | | 1.80 | % | | | 1.69 | % |
| | | | | | | | | | | | | | | | | | | | | | | | |
| | | (1.09 | )%(2) | | | (1.12 | )% | | | (0.51 | )% | | | (0.98 | )% | | | (1.02 | )% | | | (0.69 | )% |
| | | | | | | | | | | | | | | | | | | | | | | | |
| | | 30 | %(1) | | | 51 | % | | | 67 | % | | | 89 | % | | | 79 | % | | | 82 | % |
41
NOTES TO FINANCIAL STATEMENTS |
NOTES TO FINANCIAL STATEMENTS March 31, 2021 (Unaudited)
The Marsico Investment Fund (the “Trust”) was organized on October 1, 1997, as a Delaware statutory trust and is registered under the Investment Company Act of 1940 (the “1940 Act”) as an open-end management investment company. The Focus Fund, Growth Fund, 21st Century Fund, International Opportunities Fund, and Global Fund (collectively, the “Funds”) are separate investment portfolios of the Trust. The Focus Fund is a non-diversified fund and the Growth Fund, the 21st Century Fund, the International Opportunities Fund, and the Global Fund are diversified funds. The Focus Fund and Growth Fund commenced operations on December 31, 1997, the 21st Century Fund commenced operations on February 1, 2000, the International Opportunities Fund commenced operations on June 30, 2000, and the Global Fund commenced operations on June 29, 2007. Trustees and officers of the Trust and employees of Marsico Capital Management, LLC (the “Adviser”) own approximately 6%, 5%, 7%, and 10% of the Focus Fund’s, Growth Fund’s, International Opportunities Fund’s, and Global Fund’s outstanding shares, respectively, as of March 31, 2021.
2. | Significant Accounting Policies |
The Funds qualify as investment companies under Accounting Standards Update No. 2013-08, Accounting Standard Codification Topic 946, Financial Services — Investment Companies (“ASC 946”). The following is a summary of significant accounting policies consistently followed by the Funds in the preparation of their financial statements. These policies are in conformity with Generally Accepted Accounting Principles (“GAAP”) in the United States of America for investment companies and follow the accounting guidance provided in ASC 946. The presentation of financial statements in conformity with GAAP requires management to make estimates and assumptions that affect the reported amounts and disclosures of assets and liabilities at the date of the financial statements and the reported amounts and disclosures of income and expenses during the reporting period. Actual results could differ from those estimates.
| | (a) | Investment Valuation — A security traded on a recognized stock exchange is generally valued at the last sale price prior to the closing of the principal exchange on which the security is traded. Securities traded on NASDAQ generally will be valued at the NASDAQ Official Closing Price. If no sale price is reported on the valuation date, the most current bid price will generally be used, with the exception of short option positions which will generally utilize the most current ask price. Other securities for which over-the-counter market quotations are readily available are generally valued at the last sale price. Debt securities that will mature in more than 60 days are generally valued at their bid prices furnished by a pricing service approved by the Funds’ Board of Trustees and subject to review pursuant to procedures established by, and under the general supervision of, the Board of Trustees. Debt securities that will mature in 60 days or less are valued at amortized cost, if it approximates market value. Any securities for which market quotations are not readily available are valued at their fair value as determined in good faith by the Adviser in accordance with procedures established by, and under the general supervision of, the Funds’ Board of Trustees. The Funds may use pricing services to assist in determining market value. The Board of Trustees has authorized the use of a pricing service to assist the Funds in valuing certain equity securities listed or traded on foreign security exchanges in the Funds’ portfolios in certain circumstances where there is a significant change in the value of related US-traded securities, as represented by, for example, the S&P 500 Index. |
“Fair Value Measurements and Disclosures” (the “Fair Value Statement”) defines fair value, establishes a framework for measuring fair value in GAAP, and expands disclosures about fair value measurements. Under the Fair Value Statement, various inputs are used in determining the value of the Funds’ investments.
These inputs are summarized into three broad levels and described below:
| | ● | Level 1 – quoted prices in active markets for identical investments |
| | ● | Level 2 – other significant observable inputs (including quoted prices for similar investments, interest rates, and evaluated quotations obtained from pricing services) |
| | ● | Level 3 – significant unobservable inputs (including the Fund’s assumptions that market participants would use in determining the fair value of investments) |
The inputs or methodology used for valuing investments are not an indication of the risk associated with investing in those investments. Changes in valuation techniques may result in transfers between the levels during the reporting period. The Funds’ Level 3 securities activity during the reporting period was not material to their financial position or results of operations. As of March 31, 2021, each of the Fund’s investments were categorized as Level 1 securities. The fair values of the investments are reflected on each Fund’s Schedule of Investments by security type and economic industry.
| | (b) | Expenses — The Funds are charged for those expenses that are directly attributable to each Fund, such as advisory and custodial fees. Expenses that are not directly attributable to a Fund are typically allocated among the Funds in proportion to their respective net assets and are in some cases allocated based on other factors. The Funds’ expenses may be reduced by advisory fee waivers, brokerage credits and uninvested cash balances earning interest or credits. Such credits are included in “Less waiver of expenses and expenses paid indirectly” on the Statements of Operations. |
Brokerage commissions may be paid to certain brokers which reduce transfer agent fees and expenses. For the six-month period ended March 31, 2021, the Funds received no such brokerage commission credits. The Funds received earnings credits on certain cash account balances which reduced transfer agent fees by less than $1 (in thousands) for each of the Focus Fund, Growth Fund, 21st Century Fund, International
42
NOTES TO FINANCIAL STATEMENTS |
Opportunities Fund, and Global Fund for the six-month period ended March 31, 2021. Brokerage commission credits and earnings credits (if any) are included in “Less waiver of expenses and expenses paid indirectly” on the Statements of Operations.
| | (c) | Federal Income Taxes — Each Fund intends to comply with the requirements of the Internal Revenue Code of 1986, as amended (the “Internal Revenue Code”), necessary to continue to qualify as a regulated investment company and to make the requisite distributions of income to its shareholders which will be sufficient to relieve it from all or substantially all federal and state income taxes. Certain Funds may utilize earnings and profits on redemption of shares as part of the dividends paid deduction. |
| | (d) | Distributions to Shareholders — Dividends from net investment income and net realized capital gains, if any, will be declared and paid at least annually. Distributions to shareholders are recorded on the ex-dividend date. Each Fund may periodically make reclassifications among certain of its capital accounts as a result of the timing and characterization of certain income and capital gains distributions determined in accordance with federal tax regulations, which may differ from GAAP. These reclassifications are due to differing treatment for items such as foreign currency transactions, passive foreign investment companies and net investment losses. |
The Funds at times may invest in real estate investment trusts (“REITs”). REITs generally pay dividends to their investors based upon cash available from their operations and this amount may differ significantly from the REITs’ actual earnings and profits (“E&P”) determined for income tax purposes. It is common for these dividends to exceed the REITs’ taxable E&P, resulting in the excess portion of such dividends eventually being designated as a return of capital. Determination of the tax character of dividends made by REITs is typically performed by the REIT several months subsequent to the payment of the dividend. Therefore, due to timing issues, the Funds may be in a position of being required to calculate and pay required distribution amounts to their shareholders based on the best information available from the REITs, which may be prior to the final determination of the REITs’ taxable E&P, and it is possible that a portion of the Funds’ distribution amounts could include a return of capital to shareholders for federal income tax purposes.
| | (e) | Foreign Currency Translation — The accounting records of the Funds are maintained in US dollars. For valuation purposes, values of securities denominated in foreign currencies are translated into US dollars at 4:00 p.m. Eastern Time. Amounts related to the purchase and sale of foreign securities and investment income are translated at the rates of exchange prevailing on the respective dates of such transactions. |
Reported realized gains and losses on foreign currency transactions arise from sales of portfolio securities, forward foreign currency contracts, currency gains or losses realized between the trade and settlement dates on securities transactions, and the difference between the amounts of dividends, interest, and foreign withholding taxes recorded on the Funds’ books and the US dollar equivalent of the amounts actually received or paid.
The Funds do not isolate that portion of the results of operations resulting from changes in foreign exchange rates on investments from the fluctuations arising from changes in market prices of securities held at the end of the reporting period. Net unrealized appreciation or depreciation on investments and foreign currency translations arises from changes in the value of assets and liabilities, including investments in securities at the end of the reporting period, resulting from changes in the exchange rates and changes in market prices of securities held.
Transactions in foreign-denominated assets may involve greater risks than domestic transactions, including currency risk, political and economic risk, regulatory risk and market risk.
| | (f) | Derivative Instruments — “Disclosure about Derivative Instruments and Hedging Activities” (the “Derivatives Statement”) requires enhanced disclosures about the Funds’ derivative and hedging activities, including how such activities are accounted for and their effects on the Funds’ financial position, performance and cash flows. |
The Funds are not intended as vehicles for investing substantially in derivative instruments, and may hold derivative instruments only infrequently. The Funds enter into derivative instruments in order to increase exposure to certain investments, asset classes, or markets, or for hedging purposes to hedge against adverse movements in securities prices, currency rates or interest rates. The Funds can hold various types of derivative instruments such as futures contracts and options on securities, financial indexes, and foreign currencies, options on futures, forward foreign currency contracts, interest rate swaps, credit default swaps, and swap-related products. The use of derivative instruments may involve risks such as the possibility of illiquid markets or imperfect correlation between the value of the derivative instruments and the underlying securities, or that the counterparty will fail to perform its obligations. There were no outstanding derivative instruments held by the Funds as of March 31, 2021 nor did the Funds utilize derivative instruments during the six-month period ended March 31, 2021.
| | (g) | Non-Interested Trustees’ Deferred Fee Plan — Effective February 1, 2000, the Board of Trustees adopted the Marsico Investment Fund Deferred Fee Plan (the “Deferred Fee Plan”), amended and restated as of December 30, 2005, which allows the Trustees who are not “interested persons” of the Funds, as defined in the 1940 Act (“non-interested Trustees”), to defer the receipt of all or a portion of their compensation received from the Funds and may be invested as directed by each non-interested Trustee. The Deferred Fee Plan was further amended and restated as of November 10, 2020 to allow for any deferred fees credited to accounts established on behalf of the non-interested Trustees to be invested into the Funds and other investment options allowed under the Deferred Fee Plan, such as a non-affiliated US government money market fund, among other clarifying changes. The amounts credited to these accounts increase or decrease in accordance with the performance of the investments selected by the non-interested Trustees. The market value of the deferred account balances as of March 31, 2021 is shown on the Statements of Assets and Liabilities as part of an asset account, “Prepaid expenses and other assets”, and a liability account, “Accrued trustees’ fees”. Additionally, the fluctuation of the account balances due to the performance of the investments is recorded by |
43
NOTES TO FINANCIAL STATEMENTS |
NOTES TO FINANCIAL STATEMENTS March 31, 2021 (Unaudited) (continued)
the Funds as unrealized appreciation (depreciation), which is shown as part of “Total distributable earnings (deficit)” on the Statements of Assets and Liabilities, and as compensation expense, which is shown as part of the expense account “Trustees’ fees and expenses” on the Statements of Operations. Fees earned and deferred by the non-interested Trustees for the six-month period ended March 31, 2021 are also included in “Trustees’ fees and expenses” on the Statements of Operations. Amounts contributed to the Deferred Fee Plan will be deferred until distributed in accordance with the Deferred Fee Plan. Unrealized appreciation (depreciation) of the investments held in the Deferred Fee Plan is subject to the Funds’ expense reimbursement agreement with the Adviser.
| | (h) | Other — Investment transactions are accounted for on a trade date basis. Each Fund determines the gain or loss realized from the investment transactions by comparing the original cost of the security lot sold with the net sale proceeds. Dividend income is recognized on the ex-dividend date. Certain dividends from foreign securities are recorded when the Funds are informed of the dividend if such information is obtained subsequent to the ex-dividend date. Interest income is recognized on an accrual basis and includes amortization of premiums and accretion of discounts. |
| | (i) | Indemnifications — In the normal course of business, the Funds enter into contracts that contain provisions indemnifying other parties against specified potential liabilities. Each Fund’s maximum exposure under these arrangements is unknown as this would involve future claims that may be made against the Fund that have not yet occurred. However, based on experience, the Funds expect the risk of loss in connection with these potential indemnification obligations to be remote. There can be no assurance that material liabilities related to such obligations will not arise in the future, which may adversely impact a Fund. |
3. | Investment Advisory Agreement and Transactions With Affiliates |
Each Fund has an agreement with the Adviser to furnish investment advisory services to the Funds. Each Fund calculates and accrues the investment advisory fee daily based on the following rates (expressed as annual rates) and pays the Adviser monthly:
Annual Rate of Average Daily Net Assets | Asset Threshold |
0.80% | First $250 million |
0.75% | Next $250 million |
0.70% | Next $250 million |
0.65% | In excess of $750 million |
The Adviser has entered into a written expense limitation and fee waiver agreement under which it has agreed to limit the total expenses of each Fund (excluding taxes, interest, acquired fund fees and expenses, litigation, extraordinary expenses, and brokerage and other transaction expenses relating to the purchase or sale of portfolio investments) to an annual rate of 1.50% of the average net assets of the International Opportunities Fund and the Global Fund, and 1.45% of the average net assets of the Focus Fund, the Growth Fund, and the 21st Century Fund until January 31, 2022. This expense limitation and fee waiver agreement may be terminated by the Adviser at any time after January 31, 2022, upon 15 days prior notice to the Fund and its administrator. Prior to February 1, 2021, the Adviser had agreed to limit the total expenses of the Global Fund to an annual rate of 1.45% of the average net assets of the Global Fund.
The Adviser may recoup from a Fund fees previously waived or expenses previously reimbursed by the Adviser with respect to that Fund pursuant to these agreements (or a previous expense limitation agreement) if: (1) such recoupment by the Adviser does not cause the Fund, at the time of recoupment, to exceed the lesser of (a) the expense limitation in effect at the time the relevant amount was waived and/or reimbursed, or (b) the expense limitation in effect at the time of the proposed recoupment, and (2) the recoupment is made within three years after the fiscal year end date as of which the amount to be waived or reimbursed was determined and the waiver or reimbursement occurred. Under this arrangement during the six-month period ended March 31, 2021, the Adviser received $139 and $116 (in thousands) of reimbursement from the Growth Fund and the Global Fund, respectively, for previously waived or reimbursed expenses. The reimbursement amounts are reflected in “Recoupment of previously waived expenses” on the Statements of Operations. As of March 31, 2021, recoupment amounts (in thousands) that may potentially be made by the International Opportunities Fund and the Global Fund to the Adviser are as follows:
Year of Expiration | | International
Opportunities Fund | | | Global Fund | |
2021 | | $ | 46 | | | $ | — | |
2022 | | | 123 | | | | — | |
2023 | | | 167 | | | | 669 | |
2024 | | | 72 | | | | — | |
| | | $ | 408 | | | $ | 669 | |
Certain officers of the Trust are also officers of the Adviser. The Funds pay a portion of the Chief Compliance Officer’s total compensation costs which is shown as part of the expense account “Professional fees” on the Statements of Operations. No other officers of the Trust received compensation from the Funds during the six-month period ended March 31, 2021.
44
NOTES TO FINANCIAL STATEMENTS |
4. | Distribution and Service Plan |
The Funds have adopted a Distribution and Service Plan pursuant to Rule 12b-1 under the 1940 Act, and effective December 1, 2017, the Board of Trustees approved a Second Amended and Restated Distribution and Service Plan (the “Plan”). The Plan authorizes payments by the Funds in connection with the distribution of their shares at an annual rate, as determined from time to time by the Board of Trustees, of up to 0.25% of a Fund’s average daily net assets. The Plan, as amended, clarifies that while the maximum 12b-1 Fee rate remains limited to 0.25% per annum of each
Fund’s average daily net assets, one or more Funds may be charged a lower rate from time to time upon approval by the Board of Trustees, and the rate may vary by Fund. The Plan, as amended, also clarifies that previously accrued amounts of the 12b-1 Fee for each Fund may be used by that Fund to pay any current or previously accrued expenses of the Fund authorized by the amended Plan, including non-distribution expenses, authorized by the Plan.
Payments may be made by the Funds under the Plan for the purpose of financing any activity primarily intended to result in the sale of shares of the Funds, as determined by the Board of Trustees, as well as for account maintenance and personal services to shareholders and any other non-distribution-related services. The Adviser may, out of its own resources (which may include legitimate profits from providing advisory services to the Funds or other clients) and at its sole discretion, make certain payments on behalf of the Funds or the Plan for expenses incurred by a Fund for distribution of Fund shares and related services or for administrative or other expenses incurred by the Fund.
Pursuant to the amended Plan, the Board of Trustees temporarily eliminated 12b-1 accruals for the Focus Fund for the period from June 1, 2018 to January 31, 2021. Effective February 1, 2021, the Focus Fund began accruing 12b-1 Fees at a rate of 0.25% per annum of the average daily net assets of the Fund, continuing until such time as the Board authorizes a different rate. The Growth Fund, the 21st Century Fund, the International Opportunities Fund, and the Global Fund continue to accrue 12b-1 Fees at a rate of 0.25% per annum of the average daily net assets of each Fund.
5. | Investment Transactions |
The aggregate purchases and sales of securities, excluding short-term investments, for the Funds for the six-month period ended March 31, 2021, were as follows:
(Amounts in thousands) | | Focus
Fund | | | Growth
Fund | | | 21st
Century
Fund | | | International
Opportunities
Fund | | | Global
Fund | |
Purchases | | $ | 169,039 | | | $ | 117,022 | | | $ | 41,933 | | | $ | 14,241 | | | $ | 87,399 | |
Sales | | $ | 243,304 | | | $ | 144,508 | | | $ | 58,452 | | | $ | 17,038 | | | $ | 96,499 | |
There were no purchases or sales of US government securities, excluding short-term investments.
The recent global outbreak of an infectious respiratory illness caused by a novel strain of coronavirus (“COVID-19”) has disrupted economic and financial markets, resulted in substantial market volatility and impacted the valuations of the Funds’ investments during the reporting period. The prolonged economic impact of COVID-19 remains uncertain. The operational and financial performance of the issuers of securities in which the Funds invest depends on future developments, including the duration and spread of the COVID-19 pandemic, and such uncertainty may in turn continue to impact the value of the Funds’ investments.
7. | Federal Income Tax Information |
“Accounting for Uncertainty in Income Taxes” (the “Income Tax Statement”) requires an evaluation of tax positions taken (or expected to be taken) in the course of preparing a Fund’s tax returns to determine whether these positions meet a “more-likely-than-not” standard that, based on the technical merits, have a more than fifty percent likelihood of being sustained by a taxing authority upon examination. A tax position that meets the “more-likely-than-not” recognition threshold is measured to determine the amount of benefit to recognize in the financial statements. The Funds recognize interest and penalties, if any, related to unrecognized tax benefits as income tax expense in the Statements of Operations.
The Income Tax Statement requires management of the Funds to analyze all open tax years, consisting of fiscal years 2017-2021 as defined by Internal Revenue Service (“IRS”) statute of limitations for all major jurisdictions, including federal tax authorities and certain state tax authorities. As of and during the six-month period ended March 31, 2021, the Funds did not have any liabilities for any unrecognized tax benefits. The Funds have no examinations in progress and are not aware of any tax positions for which it is reasonably possible that the total amounts of unrecognized tax benefits will significantly change in the next twelve months.
45
NOTES TO FINANCIAL STATEMENTS |
NOTES TO FINANCIAL STATEMENTS March 31, 2021 (Unaudited) (continued)
At March 31, 2021, gross unrealized appreciation and depreciation of investments, based on cost for federal income tax purposes, were as follows:
(Amounts in thousands) | | Focus
Fund | | | Growth
Fund | | | 21st
Century
Fund | | | International
Opportunities
Fund | | | Global
Fund | |
Cost of Investments | | $ | 448,867 | | | $ | 258,276 | | | $ | 211,184 | | | $ | 41,684 | | | $ | 167,965 | |
| | | | | | | | | | | | | | | | | | | | | |
Gross Unrealized Appreciation | | $ | 378,871 | | | $ | 192,521 | | | $ | 153,700 | | | $ | 18,328 | | | $ | 133,808 | |
Gross Unrealized Depreciation | | | (3,759 | ) | | | (2,103 | ) | | | (2,472 | ) | | | (519 | ) | | | (1,149 | ) |
| | | | | | | | | | | | | | | | | | | | | |
Net Unrealized Appreciation on Investments | | $ | 375,112 | | | $ | 190,418 | | | $ | 151,228 | | | $ | 17,809 | | | $ | 132,659 | |
The difference between cost amounts for financial statement and federal income tax purposes is due primarily to wash sale loss deferrals.
As of September 30, 2020, the Focus Fund, Growth Fund, 21st Century Fund, International Opportunities Fund, and Global Fund, respectively, had (in thousands) $0, $0, $2,012, $259, and $865 of qualified late-year losses, which are deferred until fiscal year 2021 for tax purposes. Net late-year losses that are deferred are deemed to arise on the first day of the Fund’s next taxable year.
The International Opportunities Fund had realized capital losses (in thousands) from transactions between November 1, 2019 and September 30, 2020 of $719. The International Opportunities Fund has elected to treat post-October capital losses as arising in the next fiscal year.
As of September 30, 2020, the components of accumulated earnings on a tax basis were as follows:
(Amounts in thousands) | | Focus
Fund | | | Growth
Fund | | | 21st
Century
Fund | | | International
Opportunities
Fund | | | Global
Fund | |
Undistributed Ordinary Income | | $ | 13,700 | | | $ | 11,532 | | | $ | — | | | $ | — | | | $ | — | |
Undistributed Trustees’ Deferred Compensation | | | (4,604 | ) | | | (2,094 | ) | | | (1,001 | ) | | | (357 | ) | | | (2,375 | ) |
Undistributed Long-Term Capital Gains | | | 66,119 | | | | 26,437 | | | | 5,891 | | | | — | | | | 5,296 | |
Tax Accumulated Earnings (Deficit) | | | 75,215 | | | | 35,875 | | | | 4,890 | | | | (357 | ) | | | 2,921 | |
Accumulated Capital and Other Losses | | | — | | | | — | | | | (2,012 | ) | | | (978 | ) | | | (865 | ) |
Net Unrealized Appreciation on Investments and on Foreign Currency Translations | | | 387,597 | | | | 187,083 | | | | 104,764 | | | | 13,995 | | | | 127,669 | |
Trustees’ Deferred Compensation Mark-to-Market | | | 3,147 | | | | 1,206 | | | | 333 | | | | 114 | | | | 1,653 | |
Total Accumulated Earnings | | $ | 465,959 | | | $ | 224,164 | | | $ | 107,975 | | | $ | 12,774 | | | $ | 131,378 | |
Undistributed ordinary income consists of net investment income, passive foreign investment company and timing differences related to qualified late-year losses.
During the year ended September 30, 2020, the Global Fund utilized capital loss carryforwards of (in thousands) $989.
The tax character of distributions paid during the fiscal years ended September 30, 2020 and 2019 was as follows:
| | | 2020 | | | 2019 | |
(Amounts in thousands) | | Ordinary Income | | | Long-Term Capital Gains | | | Ordinary Income | | | Long-Term Capital Gains | |
Focus Fund | | $ | — | | | $ | 43,408 | | | $ | 202 | | | $ | 51,424 | |
Growth Fund | | | — | | | | 25,236 | | | | 1,218 | | | | 28,133 | |
21st Century Fund | | | — | | | | 8,884 | | | | 10,934 | | | | 731 | |
International Opportunities Fund | | | 191 | | | | 2,090 | | | | — | | | | 4,245 | |
Global Fund | | | — | | | | — | | | | — | | | | 2,537 | |
The tax character of dividends paid may differ from that shown in the Financial Highlights due to short-term gains being treated as ordinary income for tax purposes.
Management of the Adviser has determined that there were no material subsequent events that would require disclosure in the Funds’ financial statements.
46
EXPENSE EXAMPLE For the six-month period ended March 31, 2021 (Unaudited)
As a shareholder of the Marsico Funds (the “Funds”), you incur two types of costs: (1) transaction costs, including redemption fees (if any), and (2) ongoing costs, including management fees, distribution (12b-1) fees, and other Fund expenses. This Example is intended to help you understand your ongoing costs (in dollars) of investing in the Funds and to compare these costs with the ongoing costs of investing in other mutual funds.
The Example is based on an investment of $1,000 invested at the beginning of the period and held for the entire period from October 1, 2020 to March 31, 2021 (the “period”).
Actual Expenses
The first line of the table below provides information about actual account values and actual expenses. You may use the information in this line, together with the amount you invested, to estimate the expenses you paid over the period. Simply divide your account value by $1,000 (for example, an $8,600 account value divided by $1,000 equals 8.6), then multiply the result by the number in the first line under the heading entitled “Expenses paid for the six-month period ended March 31, 2021” to estimate the expenses you paid on your account during the period.
Hypothetical Example for Comparison Purposes
The second line of the table below provides information about hypothetical account values and hypothetical expenses based on the Funds’ actual expense ratios and an assumed rate of return of 5% per year before expenses, which is not the actual return of any of the Funds. The hypothetical account values and expenses may not be used to estimate the actual ending account balance or expenses you paid for the period. You may use this information to compare the ongoing costs of investing in the Funds and other funds. To do so, compare this 5% hypothetical example with the 5% hypothetical examples that appear in the shareholder reports of other funds.
Please note that the expenses shown in the table are meant to highlight your ongoing costs only and do not reflect any transactional costs such as redemption fees (if any). Therefore, the second line of the table is useful in comparing the ongoing costs only, and will not help you determine the relative total costs of owning different funds. In addition, if these transactional costs (if any) were included, your costs could have been higher.
| | Annualized
expense ratio | Beginning
account value
October 1, 2020 | Ending
account value
March 31, 2021 | Expenses paid for the
six-month period ended
March 31, 2021(1) |
FOCUS FUND | | | | |
Actual Example | 1.14% | $ 1,000.00 | $ 1,093.50 | $ 5.97(2) |
Hypothetical Example, assuming a 5% return before expenses | | $ 1,000.00 | $ 1,019.29 | $ 5.76(2) |
| | | | | |
GROWTH FUND | | | | |
Actual Example | 1.40% | $ 1,000.00 | $ 1,141.10 | $ 7.45 |
Hypothetical Example, assuming a 5% return before expenses | | $ 1,000.00 | $ 1,018.04 | $ 7.02 |
| | | | | |
21st CENTURY FUND | | | | |
Actual Example | 1.34% | $ 1,000.00 | $ 1,261.50 | $ 7.55 |
Hypothetical Example, assuming a 5% return before expenses | | $ 1,000.00 | $ 1,018.32 | $ 6.74 |
| | | | | |
INTERNATIONAL OPPORTUNITIES FUND | | | | |
Actual Example | 1.50% | $ 1,000.00 | $ 1,132.00 | $ 7.98 |
Hypothetical Example, assuming a 5% return before expenses | | $ 1,000.00 | $ 1,017.52 | $ 7.55 |
| | | | | |
GLOBAL FUND | | | | |
Actual Example | 1.45% | $ 1,000.00 | $ 1,089.70 | $ 7.55(3) |
Hypothetical Example, assuming a 5% return before expenses | | $ 1,000.00 | $ 1,017.77 | $ 7.29(3) |
| (1) | Expenses are equal to the Fund’s annualized expense ratio multiplied by the average account value over the period, multiplied by 182/365 (to reflect the six-month period). |
| (2) | If the 0.25% 12b-1 fee accrual rate discussed in Note 4 had been in effect for the entire six-month period, the restated annualized expense ratio would have been 1.31% and the expenses paid in the actual and hypothetical examples above would have been $6.85 and $6.61, respectively. |
| (3) | If the 1.50% expense limitation cap discussed in Note 3 had been in effect for the entire six-month period, the restated annualized expense ratio and the expenses paid in the actual and hypothetical examples above would not have changed. |
47
CONSIDERATION OF INVESTMENT ADVISORY AGREEMENTS |
CONSIDERATION OF INVESTMENT ADVISORY AGREEMENTS (Unaudited)
At a meeting of the Board of Trustees of the Trust held on November 18, 2020, the Trustees, by a unanimous vote (including a separate vote of those Trustees who are not “interested persons” (as the term is defined in the 1940 Act) of the Trust (the “Independent Trustees”)), approved the renewal of the Investment Advisory and Management Agreements for the Focus Fund, Growth Fund, 21st Century Fund, International Opportunities Fund, and Global Fund (the “Advisory Agreements”). The Trustees met remotely in accordance with relief granted from the SEC from in-person voting requirements. In advance of the meeting, the Independent Trustees requested and received extensive materials from Marsico Capital Management, LLC (the “Adviser” or “MCM”) to assist them in considering the renewal of the Advisory Agreements. The materials provided by the Adviser contained information with respect to the factors noted below, including detailed information relating to the performance, advisory fees and other expenses of the Funds, other funds sub-advised by the Adviser and non-fund advisory accounts of the Adviser. The materials also included comparisons of the Funds with third party funds of similar size and investment objectives in terms of performance, fees and other expenses, as well as the performance of each Fund versus its benchmark. In addition, the Adviser provided information regarding its overall expenses and profitability, as well as other information requested by the Trustees.
In addition to the materials prepared specifically for contract review analysis, on an ongoing basis the Trustees receive information and reports from the Adviser and other service providers to the Funds regarding the investment performance of the Funds as well as operational, compliance, marketing and other matters.
The Trustees engaged in a detailed discussion of the materials with management of the Adviser. The Independent Trustees then met separately with independent counsel to the Independent Trustees for a review of the materials. Following this session, the full Board reconvened and approved the continuation of the Advisory Agreements for the Focus Fund, Growth Fund, 21st Century Fund, International Opportunities Fund, and Global Fund.
Discussion of Certain Factors Considered
1. Nature, Extent, and Quality of Services. The Independent Trustees considered the nature, quality and extent of the services performed by Marsico Capital Management, LLC (“MCM” or the “Adviser”) under the Investment Advisory and Management Agreements (the “Advisory Agreements”) with the Adviser, including portfolio management, supervision of Fund operations, regulatory filings and disclosures to shareholders, compliance functions, general oversight of other service providers, review of Fund legal issues, and other services. The Independent Trustees also considered the personnel who provide these services, which includes a team of individuals collectively having years of experience in their particular areas of expertise. The Independent Trustees reviewed the Adviser’s investment philosophy and experience, noting that the Adviser and its affiliates employ a focused stock-picking strategy that involves extensive research. The Independent Trustees noted MCM’s continued investment in research. The Independent Trustees discussed the Adviser’s ability to continue to provide the same level and quality of services to the Funds, and discussed with members of management of MCM the financial condition of the Adviser and its ability to attract and retain experienced personnel. The Independent Trustees considered the reinvestment in MCM by Mr. T. Marsico and the steps taken to ensure the financial viability of the Adviser, including the extinguishment of debt to third parties and elimination of most of MCM’s overall debt in 2016. The Independent Trustees also discussed MCM’s commitment to devoting substantial resources to the Adviser’s investment management process. The Independent Trustees concluded that the services are extensive in nature, that the Adviser employs investment advisory personnel who consistently delivered a high level of service and that, with respect to third-party service providers, the Adviser effectively manages the outsourcing by the Funds of certain services to other service providers and the oversight of those service providers.
2. Investment Performance of the Funds and Adviser. The Independent Trustees considered the Adviser’s substantial investment advisory experience and capabilities. The Independent Trustees considered short-term and long-term investment performance for each Fund over various periods of time as compared to both relevant equity indices and the performance of each Fund’s Lipper, Inc. peer group universe. The Independent Trustees noted the strong positive performance of all five of the Funds relative to their benchmark indexes during most time periods ended September 30, 2020, and discussed with representatives of the Adviser the factors underlying the performance of the Funds over various time periods. The Independent Trustees discussed the Funds’ performance with representatives of MCM and concluded that the Adviser was delivering acceptable performance results consistent with the long-term investment strategies being pursued by the Funds. The Independent Trustees took into account that they regularly review each Fund’s performance.
The Independent Trustees noted that the investment performance delivered by the Adviser to the Funds appeared to be generally consistent with the performance delivered for other clients of the Adviser with similar strategies. Based on this review, the Independent Trustees
48
CONSIDERATION OF INVESTMENT ADVISORY AGREEMENTS |
concluded that the performance of the Adviser with respect to each Fund was acceptable for the purposes of approving the Advisory Agreements.
3. Costs of Services and Profits Realized by the Adviser.
(a) Costs of Services to Funds: Fees and Expenses. The Independent Trustees considered each Fund’s management fee rates and expense ratios relative to industry averages for the Fund’s benchmark category and the advisory fees charged by the Adviser to other clients, including information regarding expense limitation commitments from the Adviser, and the breakpoints in the advisory fee schedule for all of the Funds. The Independent Trustees noted that the information provided by MCM stated that the mix of services under the Advisory Agreements are much more extensive than those under the Adviser’s advisory agreements for sub-advised and non-fund clients.
The Independent Trustees also noted previous actions taken by MCM to reduce Fund expenses, including that MCM had waived fees and absorbed expenses from time to time, including waiving fees for three of the Funds during the past fiscal year, and that some of those expenditures may not be recouped. The Independent Trustees reviewed various expense information and noted that overall Fund expenses are in a range that continues to be reasonable. The Trustees also noted other recent actions that have been taken to reduce expenses. The Independent Trustees concluded that the investment advisory fees are acceptable based upon the qualifications, experience, reputation, and performance of the Adviser and the overall expense ratios of the Funds.
(b) Profitability and Costs of Services to Adviser. The Independent Trustees reviewed the information provided by MCM regarding its overall profitability and costs and an estimate of the Adviser’s profitability and costs in serving the Funds as part of MCM’s overall investment management business serving many clients. The Independent Trustees noted that MCM’s estimated overall profitability from managing the Funds increased only slightly during the fiscal year ended September 30, 2020, that estimated profit margins were low to moderate overall, that profit margins for one Fund was negative, and that MCM had not reduced its services, but continued to devote substantial resources and personnel to the Funds. The Independent Trustees also noted that the Adviser previously had substantially increased its resources devoted to Fund matters in response to regulatory requirements enacted in prior years. The Independent Trustees discussed the level of estimated profit of MCM from its relationship to the Funds and considered profitability levels reviewed by federal courts that were found to be reasonable. The Independent Trustees concluded that the estimated profits received by the Adviser under the Advisory Agreements were acceptable for purposes of approving the Advisory Agreements.
4. Extent of Economies of Scale as Funds Grow. The Independent Trustees considered whether there have been economies of scale with respect to the management of each Fund and whether such Fund has appropriately benefited from any economies of scale. The Independent Trustees noted that economies of scale may develop for certain Funds as their assets increase and their Fund-level expenses decline as a percentage of assets, but that Fund-level economies of scale may not necessarily result in Adviser-level economies of scale. The Independent Trustees agreed that it was possible that Adviser-level expenses incurred in managing the Funds eventually may decline as a percentage of management fees, especially if the assets of certain Funds continue to grow beyond certain thresholds. The Independent Trustees noted that should economies of scale be realized in the future, the advisory fee schedule contains breakpoints that would benefit shareholders of the Funds as assets increase.
5. Whether Fee Levels Reflect Economies of Scale. The Independent Trustees also considered whether the management fee rate is reasonable in relation to the asset size of each Fund and any economies of scale that may exist. The Independent Trustees noted that the management fee schedule for each Fund contained breakpoints and that MCM had agreed to expense limitations for the Funds that would remain in place until at least January 31, 2022.
6. Other Relevant Considerations. The Independent Trustees considered the character and amount of other incidental benefits received by the Adviser and its affiliates from its association with the Funds. The Independent Trustees concluded that potential ancillary or “fall-out” benefits that the Adviser may receive, such as greater name recognition or increased ability to obtain research or brokerage services, appear to be reasonable, and may in some cases benefit the Funds.
49
CONSIDERATION OF INVESTMENT ADVISORY AGREEMENTS |
CONSIDERATION OF INVESTMENT ADVISORY AGREEMENTS (Unaudited) (continued)
Conclusions
In considering the Advisory Agreements, the Independent Trustees did not identify any factor as all-important or all-controlling and instead considered these factors collectively in light of each Fund’s surrounding circumstances. Based on this review, it was the judgment of the Independent Trustees that each Fund’s fees were reasonable, the extent and quality of services were acceptable and performance of the Funds was acceptable. Therefore, re-approval of the Advisory Agreements was in the best interests of each Fund and its shareholders. As a part of their decision-making process, the Independent Trustees noted that the Adviser has managed the Funds since their inception, and the Independent Trustees believe that a long-term relationship with a capable, conscientious adviser is in the best interests of the Funds and their shareholders. The Independent Trustees considered, generally, that shareholders invested in a Fund knowing that the Adviser managed that Fund and knowing its investment management fee. As such, the Independent Trustees considered whether the Adviser managed each Fund in accordance with its investment objectives and policies as disclosed to shareholders. Additionally, as part of its deliberations, the Board also considered the information about the Funds and MCM that had been provided to them throughout the year in connection with their regular Board meetings at which they engage in the ongoing oversight of the Funds and their operations.
Upon conclusion of their review and discussion, the Trustees, including all of the Independent Trustees, unanimously agreed the Advisory Agreements for each of the Funds should be continued.
50
OTHER INFORMATION (Unaudited)
Proxy Voting Guidelines
The Funds exercise the voting rights associated with the securities held by the Funds under the proxy voting policy of the Funds. A description of those policies and procedures of the Funds and a record of the Funds’ proxy votes for the one-year period ended June 30, 2020 are available without charge, upon request, by calling 888-860-8686. It is also available on the Securities and Exchange Commission’s (SEC) website at www.sec.gov.
Quarterly Filing of Portfolio Holdings
The Funds will file their portfolio holdings information for each month in a fiscal quarter within 60 days after the end of the relevant fiscal quarter on Form N-PORT. Portfolio holdings information for the third month of each fiscal quarter will be made available immediately upon filing on the SEC’s website at www.sec.gov.
Cost Basis Information
Federal law requires mutual fund companies to maintain a shareholder’s cost basis by tax lot and report gain/loss information and holding periods for sales of mutual fund shares that are “covered” securities to the IRS and to shareholders on Form 1099. Mutual fund shares, such as shares of the Funds, acquired on or after January 1, 2012 are covered securities. The Funds are not responsible for maintaining and reporting share information for their shares that are not deemed “covered.”
The tax regulations require that the Funds elect a default tax identification methodology in order to perform the required reporting. The Funds have chosen the first-in-first-out method as the default tax lot identification method for its shareholders. This is the method the Funds will use to determine which specific shares are deemed to be sold when a shareholder’s entire position is not sold in a single transaction and is the method in which “covered” share sales will be reported on a shareholder’s Form 1099.
However, at the time of purchase or upon the sale of “covered” shares, shareholders may generally choose a different tax lot identification method. Shareholders should consult a tax advisor with regard to their personal circumstances as the Funds and their service providers do not provide tax advice.
51
NOTES
52
Not applicable to semi-annual reports.
| Item 3. | Audit Committee Financial Expert |
Not applicable to semi-annual reports.
| Item 4. | Principal Accountant Fees and Services |
Not applicable to semi-annual reports.
| Item 5. | Audit Committee of Listed Registrants |
Not applicable.
| Item 6. | Schedule of Investments |
The schedule of investments in securities of unaffiliated issuers is included as part of the report to shareholders filed under Item 1.
| Item 7. | Disclosure of Proxy Voting Policies and Procedures for Closed-End Management Investment Companies |
Not applicable.
| Item 8. | Portfolio Managers of Closed-End Management Investment Companies |
Not applicable.
| Item 9. | Purchases of Equity Securities by Closed-End Management Investment Company and Affiliated Purchasers |
Not applicable.
| Item 10. | Submission of Matters to a Vote of Security Holders |
Not applicable.
| Item 11. | Controls and Procedures. |
(a) The registrant's principal executive officer and principal financial officer have concluded that the registrant's disclosure controls and procedures (as defined in Rule 30a-3(c) under the Investment Company Act of 1940, as amended) are effective based on their evaluation of these disclosure controls and procedures within 90 days of the filing date of this report on Form N-CSR.
(b) There were no changes in the registrant's internal control over financial reporting (as defined in Rule 30a-3(d) under the Investment Company Act of 1940, as amended) that occurred during the period covered by this report that have materially affected, or are reasonably likely to materially affect, the registrant's internal control over financial reporting.
| Item 12. | Disclosure of Securities Lending Activities for Closed-End Management Investment Companies. |
Not applicable.
(a)(1) Code of Ethics
Not applicable to semi-annual reports.
(a)(2) Certification for each principal executive and principal financial officer of the registrant as required by Rule 30a-2(a) under the Act (17 CFR 270.30a-2(a)). Filed as an attachment to this filing.
(a)(3) Any written solicitation to purchase securities under Rule 23c--1 under the Investment Company Act of 1940, as amended, that was sent or given during the period covered by the report by or on behalf of the registrant to 10 or more persons.
Not applicable.
(a)(4) Change in the registrant’s independent public accountant.
Not applicable.
(b) Certifications required by Rule 30a-2(b) under the Act (17 CFR 270.30a-2(b)), Rule 13a-14(b) or Rule 15d-14(b) under the Exchange Act (17 CFR 240.13a-14(b) or 240.15d-14(b)), and Section 1350 of Chapter 63 of Title 18 of the United States Code (18 U.S.C. 1350). Filed as an attachment to this filing.
SIGNATURES
Pursuant to the requirements of the Securities Exchange Act of 1934 and the Investment Company Act of 1940, the registrant has duly caused this report to be signed on its behalf by the undersigned, thereunto duly authorized.
The Marsico Investment Fund
By: /s/ Christopher J. Marsico
Christopher J. Marsico,
Trustee, Executive Vice President and Chief Operating Officer (Principal Executive Officer)
Date: June 2, 2021
Pursuant to the requirements of the Securities Exchange Act of 1934 and the Investment Company Act of 1940, this report has been signed below by the following persons on behalf of the registrant and in the capacities and on the dates indicated.
By: /s/ Christopher J. Marsico
Christopher J. Marsico,
Trustee, Executive Vice President and Chief Operating Officer (Principal Executive Officer)
Date: June 2, 2021
By: /s/ Neil L. Gloude
Neil L. Gloude,
Vice President, Secretary and Treasurer (Principal Financial Officer)
Date: June 2, 2021