DEAR SHAREHOLDER:
Enclosed is your semi-annual report for each portfolio of The Marsico Investment Fund (the “Marsico Funds”) encompassing the six-month fiscal period from October 1, 2023, to March 31, 2024.
The purpose of this report is to provide a review of the Marsico Funds’ six-month investment results by discussing what we believe were the main areas that impacted performance – including the macroeconomic environment, sector and industry positioning, and individual stock selection – as compared to the Funds’ performance benchmark indices.
For updated information regarding each Fund’s overall investment positioning and performance, please refer to the Funds’ website at marsicofunds.com.(1)
(1) | The references to the Marsico Funds website (marsicofunds.com) included throughout this semi-annual report do not incorporate the website’s contents into this report. |
| | |
KEY FUND STATISTICS | 2 |
MARKET ENVIRONMENT | 5 |
MARSICO FOCUS FUND | |
Investment Review | 6 |
Fund Overview | 8 |
Schedule of Investments | 9 |
MARSICO GROWTH FUND | |
Investment Review | 10 |
Fund Overview | 12 |
Schedule of Investments | 13 |
MARSICO MIDCAP GROWTH FOCUS FUND |
Investment Review | 15 |
Fund Overview | 17 |
Schedule of Investments | 18 |
MARSICO INTERNATIONAL OPPORTUNITIES FUND |
Investment Review | 20 |
Fund Overview | 22 |
Schedule of Investments | 23 |
MARSICO GLOBAL FUND | |
Investment Review | 25 |
Fund Overview | 27 |
Schedule of Investments | 28 |
FINANCIAL STATEMENTS | 30 |
NOTES TO FINANCIAL STATEMENTS | 40 |
EXPENSE EXAMPLE | 47 |
CONSIDERATION OF INVESTMENT ADVISORY AGREEMENTS | 49 |
OTHER INFORMATION | 52 |
1
KEY FUND STATISTICS (UNAUDITED) |
Marsico Focus Fund | Marsico Growth Fund | Marsico
Midcap Growth
Focus Fund |
For additional disclosures, please see page 8. | For additional disclosures, please see page 12. | For additional disclosures, please see page 17. |
PERFORMANCE COMPARISON(1)(2) | PERFORMANCE COMPARISON(1)(2) | PERFORMANCE COMPARISON(1)(2) |
Average Annualized Returns | Average Annualized Returns | Average Annualized Returns |
 |  |  |
INVESTOR CLASS TOTAL ANNUAL OPERATING EXPENSES* 1.50% NET EXPENSES* † 1.45% INSTITUTIONAL CLASS TOTAL ANNUAL OPERATING EXPENSES* 1.23% NET EXPENSES* † 1.20% | INVESTOR CLASS TOTAL ANNUAL OPERATING EXPENSES* 1.49% NET EXPENSES* † 1.46% INSTITUTIONAL CLASS TOTAL ANNUAL OPERATING EXPENSES* 1.25% NET EXPENSES* † 1.21% | INVESTOR CLASS TOTAL ANNUAL OPERATING EXPENSES* 1.46% INSTITUTIONAL CLASS TOTAL ANNUAL OPERATING EXPENSES* 1.22% NET EXPENSES* † 1.21% |
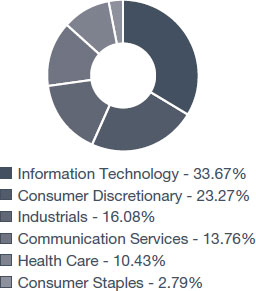
SECTOR ALLOCATION(4) | SECTOR ALLOCATION(4) | SECTOR ALLOCATION(4) |
 |  |  |
TOP FIVE HOLDINGS | TOP FIVE HOLDINGS | TOP FIVE HOLDINGS |
| | | |
| | MICROSOFT CORP. | 10.66% | | | MICROSOFT CORP. | 7.31% | | | CHIPOTLE MEXICAN GRILL, INC. | 6.69% |
| | META PLATFORMS, INC. - CL. A | 8.87% | | | META PLATFORMS, INC. - CL. A | 7.19% | | | SYNOPSYS, INC. | 6.56% |
| | NVIDIA CORP. | 8.24% | | | NVIDIA CORP. | 7.19% | | | KLA CORP. | 5.23% |
| | AMAZON.COM, INC. | 6.04% | | | AMAZON.COM, INC. | 5.51% | | | CONSTELLATION SOFTWARE, INC. | 4.95% |
| | ELI LILLY & COMPANY | 5.56% | | | ALPHABET, INC. - CL. A | 4.86% | | | CINTAS CORP. | 4.80% |
| | | | | | | | | | | |
For additional disclosures about the Marsico Funds, please see page 4. The performance data quoted here represent past performance, and past performance is not a guarantee of future results. Investment return and principal value of an investment will fluctuate so that an investor’s shares, when redeemed, may be worth more or less than their original cost.
2
KEY FUND STATISTICS (UNAUDITED) |
Marsico International
Opportunities Fund | Marsico Global Fund |
For additional disclosures, please see page 22. | For additional disclosures, please see page 27. |
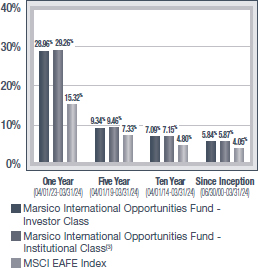
PERFORMANCE COMPARISON(1)(2) | PERFORMANCE COMPARISON(1)(2) |
Average Annualized Returns | Average Annualized Returns |
 | 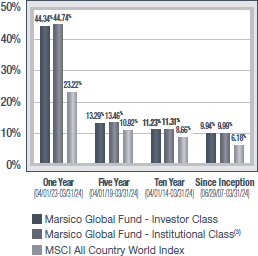 |
INVESTOR CLASS TOTAL ANNUAL OPERATING EXPENSES* 1.86% NET EXPENSES* † 1.50% INSTITUTIONAL CLASS TOTAL ANNUAL OPERATING EXPENSES* 1.98% NET EXPENSES* † 1.25% | INVESTOR CLASS TOTAL ANNUAL OPERATING EXPENSES* 1.55% NET EXPENSES* † 1.50% INSTITUTIONAL CLASS TOTAL ANNUAL OPERATING EXPENSES* 1.29% NET EXPENSES* † 1.25% |
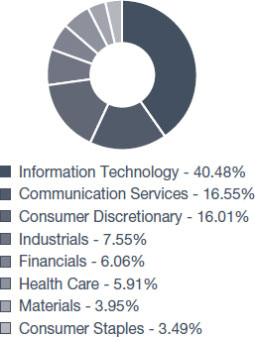
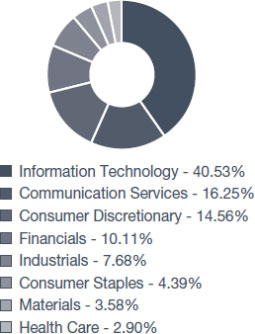
SECTOR ALLOCATION(4) | SECTOR ALLOCATION(4) |
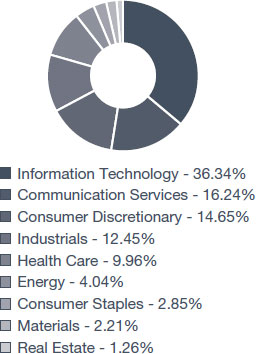 |  |
TOP FIVE HOLDINGS | TOP FIVE HOLDINGS |
| | | | | | | | |
| | ASML HOLDING N.V. | 5.82% | | | META PLATFORMS, INC. - CL. A | 6.75% | |
| | NVIDIA CORP. | 5.67% | | | NVIDIA CORP. | 5.83% | |
| | SAP S.E. | 5.58% | | | ELI LILLY & COMPANY | 4.74% | |
| | NOVO NORDISK A/S - CL. B | 5.47% | | | AMAZON.COM, INC. | 4.66% | |
| | TAIWAN SEMICONDUCTOR MANUFACTURING CO., LTD. SPON. ADR | 5.47% | | | NOVO NORDISK A/S - CL. B | 4.63% | |
| | | | | | | | |
Current performance may be lower or higher than the performance information quoted. To obtain performance information current to the most recent month-end, please call 888-860-8686 or visit marsicofunds.com.
3
KEY FUND STATISTICS (UNAUDITED) |
ADDITIONAL DISCLOSURES ABOUT THE MARSICO FUNDS
* | The Total Annual Operating Expenses and Net Expenses are reflective of the information disclosed in the Funds’ Prospectus dated January 31, 2024. The information may differ from the expense ratios disclosed in this report. |
† | Marsico Capital Management, LLC (the “Adviser”) has entered into a written expense limitation and fee waiver agreement under which it has agreed (i) to limit the total expenses of the Investor Class of each Fund (excluding taxes, interest, acquired fund fees and expenses, litigation, extraordinary expenses, and brokerage and other transaction expenses relating to the purchase or sale of portfolio investments) to an annual rate of 1.50% of the average net assets attributable to Investor Class shares of the International Opportunities Fund and Global Fund, and 1.45% of the average net assets attributable to Investor Class shares of the Focus Fund, Growth Fund and Midcap Growth Focus Fund, and (ii) to limit the total expenses of the Institutional Class of each Fund (excluding taxes, interest, acquired fund fees and expenses, litigation, extraordinary expenses, and brokerage and other transaction expenses relating to the purchase or sale of portfolio investments) to an annual rate of 1.25% of the average net assets attributable to Institutional Class shares of the International Opportunities Fund and Global Fund, and 1.20% of the average net assets attributable to Institutional Class shares of the Focus Fund, Growth Fund and Midcap Growth Focus Fund, until January 31, 2025. This expense limitation and fee waiver agreement may be terminated by the Adviser at any time after January 31, 2025, upon 15 days prior notice to the Fund and its administrator. The Adviser may recoup from a Fund (or share class as applicable) any fees previously waived and/or expenses previously reimbursed by the Adviser with respect to that Fund or share class, as applicable, including any applicable waivers which may apply to a specific share class, pursuant to this agreement (including waivers or reimbursements under previous expense limitations), if (1) such recoupment by the Adviser does not cause the Fund’s share class, at the time of recoupment, to exceed the lesser of (a) the expense limitation in effect at the time the relevant amount was waived and/or reimbursed, or (b) the expense limitation in effect at the time of the proposed recoupment, (2) the recoupment is made within three years after the fiscal year end date as of which the amount to be waived or reimbursed was determined and the waiver or reimbursement occurred, and (3) the Adviser has not agreed to forego recoupment. In accordance with the Funds’ Multi-Class Plan, amounts eligible for recoupment from periods prior to the addition of the Institutional Class will continue to be eligible for recoupment from the Investor Class. |
(1) | The performance data quoted here represent past performance, and past performance is not a guarantee of future results. Investment return and principal value of an investment will fluctuate so that an investor’s shares, when redeemed, may be worth more or less than their original cost. Current performance may be lower or higher than the performance information quoted. To obtain performance information current to the most recent month-end, please call 888-860-8686 or visit marsicofunds.com. |
| The performance included in the chart does not reflect the deduction of taxes on Fund distributions or the redemption of Fund shares. |
| All indices are unmanaged and investors cannot invest directly in an index. |
(2) | Periodically, certain fees and expenses have been waived or reimbursed by the Adviser for the Funds. In the absence of such a waiver or reimbursement, the performance returns reflected would have been reduced. In accordance with the expense limitation and fee waiver agreement, the Adviser may recoup fees and expenses previously waived or reimbursed under certain parameters. Periodically, the Adviser has recouped such fees or expenses from the Funds, resulting in lower performance returns. |
(3) | Institutional Class shares commenced operations on December 6, 2021. The performance attributed to the Institutional Class shares prior to that date is that of the Investor Class shares. Performance prior to December 6, 2021 has not been adjusted to reflect the lower expenses of the Institutional Class shares. During this period, Institutional Class shares would have had returns similar to, but potentially higher than, Investor Class shares due to the fact that Institutional Class shares represent interests in the same portfolio as Investor Class shares but are typically subject to lower expenses than the Investor Class shares. |
(4) | Sector weightings represent the percentage of the respective Fund’s investments (excluding cash equivalents) in certain general sectors. These sectors may include more than one industry. The Fund’s portfolio composition is subject to change at any time. |
4
MARKET ENVIRONMENT: OCTOBER 2023 – MARCH 2024 (UNAUDITED)
In the six months ending March 31, 2024, global equity markets continued their march higher. The S&P 500 and MSCI All-Country World Indices both reached a new all-time high in March. We believe several factors are contributing to the rally in the equity markets, including increasing investor enthusiasm as expectations build for stronger economic growth driven by the prospect of lower interest rates. This growing enthusiasm may be bolstered by the fact that if economic data begins to deteriorate, easing inflation data in the United States could allow the Federal Reserve to cut interest rates more quickly. Moreover, robust corporate earnings during the period due to a resilient demand environment, a massive investment cycle by many companies in accelerated computing, and a more cost-conscious approach by numerous corporations likely further contributed to investor enthusiasm.
Recent inflation data out of the Eurozone and United States suggests inflation is easing towards central bank targets. For example, March 2024 Eurostat data reported consumer price inflation at +2.4% year-over-year, below expectations of +2.6%, which is approaching the stated European Central Bank target of +2%. Additionally, the US Core Personal Consumption Expenditure Index grew +2.8% on an annualized basis in February, a slowdown from Q4 levels.
US economic data readouts continue to give mixed signals. Personal consumption expenditures are slowing as indicated by the trend in the US Core Personal Consumption Expenditure Index noted above. However, that trend is being countered by ongoing stability in the labor market and strengthening US consumer confidence. For example, the labor market sustained its momentum, steadily adding jobs and maintaining the unemployment rate below 4% throughout the period, highlighted by the most recent jobs report in February which revealed a 3.9% unemployment rate, marking the 26th consecutive month below 4%, the longest such streak since the late 1960s. Further, consumer sentiment remained upbeat as evidenced by the University of Michigan’s sentiment index, which climbed from 76.5 to 79.4 in mid-March, representing the most significant intramonth increase since August 2022. These factors are contributing to a more resilient demand environment which may continue to drive stronger-than-expected US GDP growth, such as that which was reported for the fourth quarter of 2023 (+3.4% on an annualized basis).
Lastly, the period’s strong performance was also driven by strong corporate earnings. Nearly 97% of the companies in the S&P 500 Index have reported their fourth-quarter results for 2023, with approximately 73% surpassing earnings expectations. Particularly noteworthy is the Information Technology sector, where approximately 88% of companies have exceeded anticipated earnings. Leading this trend are industry behemoths like NVIDIA Corp. and Microsoft Corp., which are positioned prominently at the forefront of the ongoing computing upgrade cycle.
The performance of global markets during the six-month fiscal period ended March 31, 2024, is depicted below. Both US and global markets posted positive returns during the period. In general, small-capitalization stocks underperformed compared to large- and mid-capitalization equities, and emerging market equities underperformed compared to developed international equity markets.
| Index Name(1) | Universe of
Equities Represented | Six-Month
Total Return (as of
March 31, 2024) |
| US |
| S&P 500 | US large-capitalization equities | +23.48% |
| Russell 3000 | US publicly-traded equities of all capitalizations | +23.30% |
| Russell 2000 | US small-capitalization equities | +19.94% |
| Russell Midcap Growth | US medium-capitalization equities that exhibit growth characteristics | +25.42% |
| Index Name(1) | Universe of
Equities Represented | Six-Month
Total Return (as of
March 31, 2024) |
| INTERNATIONAL |
| MSCI EAFE (US$) | Equities in developed international equity markets, including Japan, Western Europe, and Australasia | +16.81% |
| MSCI Emerging Markets (US$) | Equities in developing international equity markets, including China, India, Eastern Europe, and Latin America | +10.42% |
| MSCI ACWI (US$) | Equities in the global developed and emerging markets | +20.14% |
Sincerely,
THE MARSICO INVESTMENT TEAM
| (1) | All indices are unmanaged and investors cannot invest directly in an index. Past performance does not guarantee future results. |
5
INVESTMENT REVIEW BY TOM MARSICO, PETER MARSICO, AND JIMMY MARSICO (UNAUDITED)
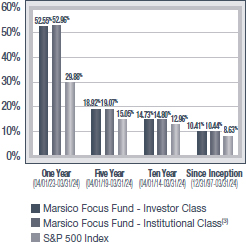
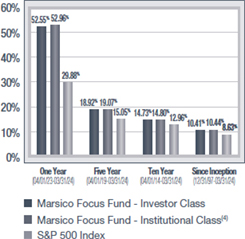
The Marsico Focus Fund’s(1),(2) Investor Class shares and Institutional Class shares posted total returns of +35.96%(3),(4),(5) and +36.18%,(3),(4),(5) respectively, for the six-month fiscal period ended March 31, 2024. The Fund outperformed its benchmark index,(2) the S&P 500 Index, which had a total return of +23.48% over the same period. Please see the Fund’s Overview for more detailed information about the Fund’s longer-term performance for various time periods ended March 31, 2024.
The Focus Fund’s outperformance during the six-month fiscal period ended March 31, 2024, as compared to the S&P 500 Index, can primarily be attributed to stock selection and an overweight allocation to the strongest-performing sector of the benchmark index, Information Technology, as defined in the Global Industry Classification Standard (“GICS”).(6) The Fund’s performance was also bolstered by stock selection in the Consumer Discretionary sector, as well as stock selection and an overweight allocation to one of the stronger-performing sectors of the benchmark index, Communication Services. A lack of exposure to one of the weaker-performing areas of the benchmark index, Energy, further contributed positively to performance.
Information Technology holding NVIDIA Corp. (“NVIDIA”) (+108%) was a top contributor to the Fund’s performance during the period partly due to an improved spending outlook from NVIDIA’s cloud services customers as well as generally more enthusiasm around the utility of generative artificial intelligence (“GenAI”). NVIDIA is a market leader in GenAI hardware and software and stands to benefit from the adoption of new GenAI applications, which are being announced almost daily, by consumers and enterprises. In addition, NVIDIA surpassed consensus expectations when it reported quarterly earnings in both November and February. Further, in late March, NVIDIA hosted NVIDIA GTC, its annual graphics processing unit technology conference, where it launched the latest datacenter business hardware family called Blackwell. NVIDIA’s CEO Jensen Huang claimed Blackwell is 4x faster at artificial intelligence (“AI”) training and 30x faster at AI inference than the prior generation. We believe that NVIDIA’s lead over the competition in AI hardware and services is widening as a result of these factors.
In the Communication Services sector, Meta Platforms, Inc. – Cl. A (“Meta”) (+62%) was a top contributor to the Fund’s performance during the period as the company continues to generate stronger revenue and free cash flow growth compared to 2022. Meta is also at the forefront of building out its AI infrastructure, which is leading to improved engagement on its core product offerings. With higher levels of engagement, we believe that Meta will be able to continue to realize consistent revenue growth and better returns on capital than in previous periods.
In terms of detractors from Fund performance, an underweight allocation and stock selection in the Financials sector, one of the strongest-performing sectors of the benchmark index, had a negative effect on performance relative to the index during the period. Stock selection in the Industrials sector created an additional drag on relative performance. Also, as the benchmark index returned +23.48% for the period, the Fund’s performance was adversely impacted by maintaining an average cash position of approximately 4%.
In the Financials sector, Blackstone, Inc. (“Blackstone”) (-6%, prior to being sold) detracted from the Fund’s performance during the period partly as a result of the potential for higher long-term interest rates, as indicated by the yield on the U.S. 10-year Treasury note having moved higher during the period. Blackstone was sold during the period as we believe the real estate market will be more challenging than we previously anticipated given the expected increase in supply coming online within the multifamily market, which may stunt rental growth and the investment performance of products tied to multifamily real estate. Further, as noted above, longer term rates could potentially stay higher for longer, which we believe may lead to a more challenging fundraising environment for real estate funds. In turn, these circumstances would likely dampen Blackstone’s future performance fees and fundraising efforts in their real estate asset class.
In the Industrials sector, Delta Air Lines, Inc. (“Delta”) (-15%, prior to being sold) was a detractor from the Fund’s performance during the period. Investor concerns related to rising geopolitical risks resulting from instability in the Middle East and Eastern Europe, and the potential impact on the airline industry contributed to driving down the share price of Delta during the period. Given the concentrated nature of the Fund, we decided to exit the position and reallocate the capital towards sectors we believe have better near-term prospects.
During the reporting period, the Fund increased its allocation to the Industrials, and Communication Services sectors, and decreased its exposure to the Health Care, Information Technology, and Financials sectors. There were no significant changes to the Fund’s allocations to the Consumer Discretionary, Consumer Staples, and Materials sectors, and the Fund continued to have no exposure to the Energy, Real Estate, and Utilities sectors during the period.
6
Fiscal Period-End Investment Posture
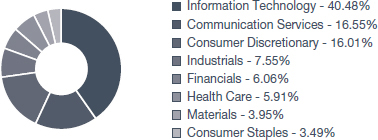
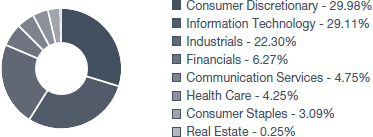
As of March 31, 2024, the Fund’s largest economic sector allocations included Information Technology, Communication Services, and Consumer Discretionary. As of that date, the Fund had no investments in the Energy, Real Estate, or Utilities sectors.
Sincerely,
THOMAS F. MARSICO
PETER C. MARSICO
JAMES D. MARSICO
PORTFOLIO MANAGERS
| (1) | The Focus Fund is non-diversified and may hold fewer portfolio securities than a diversified fund because it is permitted to invest a greater percentage of its assets in a smaller number of issuers. Holding securities of fewer issuers increases the risk that the value of the Fund could go down because of a single event or the poor performance of a single issuer or may be more volatile than its benchmark. The Fund is subject to broad risks associated with investing in equity securities markets generally, including without limitation, the risks that the securities and markets in which it invests may experience volatility and instability, that domestic and global economies and markets may undergo periods of cyclical change and decline, that investors may at times avoid investments in equity securities, and that Marsico Capital Management, LLC (the “Adviser”) may select investments for the Fund that do not perform as anticipated. Please see the Prospectus for more information. |
| (2) | The Fund is not managed to track its benchmark index, and may hold a substantially overweight or underweight position in a sector, industry, or security compared to its weight in the benchmark. The Fund may be subject to risks associated with a particular sector or industry in which it is overweight, including the risk that the stocks of companies within one sector or industry could simultaneously decline in price because of an event that affects the entire sector or industry. For informational purposes, the discussion below may compare the benchmark weight or performance of a sector or industry to the investment approach of the Fund. |
| (3) | The performance data quoted here represent past performance, and past performance is not a guarantee of future results. Investment return and principal value of an investment will fluctuate so that an investor’s shares, when redeemed, may be worth more or less than their original cost. Current performance may be lower or higher than the performance information quoted. To obtain performance information current to the most recent month-end, please call 888-860-8686 or visit marsicofunds.com. |
| (4) | This review highlights Fund performance over a six-month fiscal period. Shareholders should keep in mind that the Fund is intended for long-term investors who hold their shares for substantially longer periods of time. You should also keep in mind that our current views and beliefs regarding all investments discussed in this report are subject to change at any time. References to specific securities, industries, and sectors discussed in this report are not recommendations to buy or sell such securities or related investments, and the Fund may not necessarily hold these securities or investments today due to the active management of the Fund. Please see the accompanying Schedule of Investments for the percentage of the Fund’s portfolio represented by the securities mentioned in this report as of the end of the reporting period. |
| (5) | Total returns are based on net change in net asset value assuming reinvestment of distributions. Periodically, certain fees and expenses have been waived or reimbursed by the Adviser. In the absence of such a waiver or reimbursement, the performance returns reflected would have been reduced. In accordance with the expense limitation and fee waiver agreement, the Adviser may recoup fees and expenses previously waived or reimbursed under certain parameters. Periodically, the Adviser has recouped such fees or expenses, resulting in a lower performance return. Please see the Prospectus for more information. |
| (6) | Regarding GICS data cited throughout this report, the Global Industry Classification Standard was developed by and is the exclusive property and service mark of MSCI Inc. (“MSCI”) and Standard & Poor’s (“S&P”) and is licensed for use by the Adviser. Neither MSCI, S&P, nor the Adviser or any third party involved in compiling GICS makes any express or implied warranties or representations with respect to such standard or classification (or the results from use thereof), and all such parties hereby expressly disclaim all warranties of originality, accuracy, completeness, merchantability, and fitness for a particular purpose with respect to any such standard or classification. MSCI, S&P, the Adviser, and any of their affiliates or third parties involved in compiling GICS shall not have any liability for any direct, indirect, special, punitive, consequential or any other damages (including lost profits) even if notified of the possibility of such damages. |
7
March 31, 2024 (Unaudited)
The Focus Fund is a non-diversified mutual fund and invests primarily in the common stocks of large companies that are selected for their long-term growth potential. The Fund will normally hold a core position of between 20 and 35 common stocks.
| | | INVESTOR CLASS | | | INSTITUTIONAL CLASS | |
| | TOTAL ANNUAL OPERATING EXPENSES* | 1.50% | | TOTAL ANNUAL OPERATING EXPENSES* | 1.23% | |
| | NET EXPENSES* † | 1.45% | | NET EXPENSES*† | 1.20% | |
| | | | | | | |
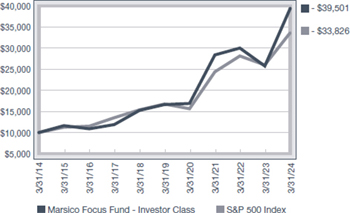
GROWTH OF $10,000(1)(2)(3) | PERFORMANCE COMPARISON(1)(2) |
| | Average Annualized Returns |
 |  |
SECTOR ALLOCATION(5) | TOP FIVE HOLDINGS |
 | | | | |
| | MICROSOFT CORP. | 10.66% | |
| | META PLATFORMS, INC. - CL. A | 8.87% | |
| | NVIDIA CORP. | 8.24% | |
| | AMAZON.COM, INC. | 6.04% | |
| | ELI LILLY & COMPANY | 5.56% | |
| | | | |
| * | The Total Annual Operating Expenses and Net Expenses are reflective of the information disclosed in the Funds’ Prospectus dated January 31, 2024 and may differ from the expense ratios disclosed in this report. |
| † | Marsico Capital Management, LLC (the “Adviser”) has entered into a written expense limitation and fee waiver agreement under which it has agreed (i) to limit the total expenses of the Investor Class of the Fund (excluding taxes, interest, acquired fund fees and expenses, litigation, extraordinary expenses, and brokerage and other transaction expenses relating to the purchase or sale of portfolio investments) to an annual rate of 1.45% of the Fund’s average net assets attributable to Investor Class shares, and (ii) to limit the total expenses of the Institutional Class of the Fund (excluding taxes, interest, acquired fund fees and expenses, litigation, extraordinary expenses, and brokerage and other transaction expenses relating to the purchase or sale of portfolio investments) to an annual rate of 1.20% of the Fund’s average net assets attributable to Institutional Class shares, until January 31, 2025. This expense limitation and fee waiver agreement may be terminated by the Adviser at any time after January 31, 2025, upon 15 days prior notice to the Fund and its administrator. The Adviser may recoup from the Fund (or share class as applicable) any fees previously waived and/or expenses previously reimbursed by the Adviser with respect to the Fund or share class, as applicable, including any applicable waivers which may apply to a specific share class, pursuant to this agreement (including waivers or reimbursements under previous expense limitations), if (1) such recoupment by the Adviser does not cause the Fund’s share class, at the time of recoupment, to exceed the lesser of (a) the expense limitation in effect at the time the relevant amount was waived and/or reimbursed, or (b) the expense limitation in effect at the time of the proposed recoupment, (2) the recoupment is made within three years after the fiscal year end date as of which the amount to be waived or reimbursed was determined and the waiver or reimbursement occurred, and (3) the Adviser has not agreed to forego recoupment. |
| (1) | The performance data quoted here represent past performance, and past performance is not a guarantee of future results. Investment return and principal value of an investment will fluctuate so that an investor’s shares, when redeemed, may be worth more or less than their original cost. Current performance may be lower or higher than the performance information quoted. To obtain performance information current to the most recent month-end, please call 888-860-8686 or visit marsicofunds.com. |
The performance included in the chart and graph does not reflect the deduction of taxes on Fund distributions or the redemption of Fund shares.
All indices are unmanaged and investors cannot invest directly in an index.
| (2) | Periodically, certain fees and expenses have been waived or reimbursed by the Adviser. In the absence of such a waiver or reimbursement, the performance returns reflected would have been reduced. In accordance with the expense limitation and fee waiver agreement, the Adviser may recoup fees and expenses previously waived or reimbursed under certain parameters. Periodically, the Adviser has recouped such fees or expenses, resulting in a lower performance return. |
| (3) | This chart assumes an initial investment of $10,000 made on March 31, 2014 in the Investor Class shares of the Fund. Total returns are based on net change in NAV, assuming reinvestment of distributions. |
| (4) | Institutional Class shares commenced operations on December 6, 2021. The performance attributed to the Institutional Class shares prior to that date is that of the Investor Class shares. Performance prior to December 6, 2021 has not been adjusted to reflect the lower expenses of the Institutional Class shares. During this period, Institutional Class shares would have had returns similar to, but potentially higher than, Investor Class shares due to the fact that Institutional Class shares represent interests in the same portfolio as Investor Class shares but are typically subject to lower expenses than the Investor Class shares. |
| (5) | Sector weightings represent the percentage of the Fund’s investments (excluding cash equivalents) in certain general sectors. These sectors may include more than one industry. The Fund’s portfolio composition is subject to change at any time. |
8
MARSICO FOCUS FUND
SCHEDULE OF INVESTMENTS
As of March 31, 2024 (Unaudited)
| | | Number
of
Shares | | | Value | | | Percent
of Net
Assets | |
| COMMON STOCKS | | | | | | | | | | | | |
| Application Software | | | | | | | | | | | | |
| Synopsys, Inc.* | | | 64,479 | | | $ | 36,849,749 | | | | 3.83 | % |
| | | | | | | | | | | | | |
| Broadline Retail | | | | | | | | | | | | |
| Amazon.com, Inc.* | | | 322,395 | | | | 58,153,610 | | | | 6.04 | |
| | | | | | | | | | | | | |
| Consumer Staples Merchandise Retail | | | | | | | | | | | | |
| Costco Wholesale Corp. | | | 43,148 | | | | 31,611,519 | | | | 3.29 | |
| | | | | | | | | | | | | |
| Financial Exchanges & Data | | | | | | | | | | | | |
| S&P Global, Inc. | | | 50,790 | | | | 21,608,606 | | | | 2.25 | |
| | | | | | | | | | | | | |
| Homebuilding | | | | | | | | | | | | |
| Lennar Corp. - Cl. A | | | 99,819 | | | | 17,166,872 | | | | 1.79 | |
| Toll Brothers, Inc. | | | 197,306 | | | | 25,525,477 | | | | 2.65 | |
| | | | | | | | 42,692,349 | | | | 4.44 | |
| Industrial Conglomerates | | | | | | | | | | | | |
| General Electric Company | | | 191,697 | | | | 33,648,574 | | | | 3.50 | |
| | | | | | | | | | | | | |
| Interactive Media & Services | | | | | | | | | | | | |
| Alphabet, Inc. - Cl. A* | | | 237,440 | | | | 35,836,819 | | | | 3.72 | |
| Meta Platforms, Inc. - Cl. A | | | 175,738 | | | | 85,334,858 | | | | 8.87 | |
| | | | | | | | 121,171,677 | | | | 12.59 | |
| Movies & Entertainment | | | | | | | | | | | | |
| Netflix, Inc.* | | | 47,108 | | | | 28,610,102 | | | | 2.97 | |
| | | | | | | | | | | | | |
| Passenger Ground Transportation | | | | | | | | | | | | |
| Uber Technologies, Inc.* | | | 450,015 | | | | 34,646,655 | | | | 3.60 | |
| | | | | | | | | | | | | |
| Pharmaceuticals | | | | | | | | | | | | |
| Eli Lilly & Company | | | 68,722 | | | | 53,462,967 | | | | 5.56 | |
| | | | | | | | | | | | | |
| Restaurants | | | | | | | | | | | | |
| Chipotle Mexican Grill, Inc.* | | | 15,132 | | | | 43,985,244 | | | | 4.57 | |
| | | | | | | | | | | | | |
| Semiconductor Materials & Equipment | | | | | | | | | | | | |
| ASML Holding N.V. - NY Reg. Shs. | | | 41,861 | | | | 40,624,845 | | | | 4.22 | |
| | | | | | | | | | | | | |
| Semiconductors | | | | | | | | | | | | |
| NVIDIA Corp. | | | 87,702 | | | | 79,244,019 | | | | 8.24 | |
| Taiwan Semiconductor Manufacturing Co., Ltd. Spon. ADR | | | 225,916 | | | | 30,735,872 | | | | 3.19 | |
| | | | | | | | 109,979,891 | | | | 11.43 | |
| Specialty Chemicals | | | | | | | | | | | | |
| The Sherwin-Williams Company | | | 102,810 | | | | 35,708,997 | | | | 3.71 | |
| | | | | | | | | | | | | |
| Systems Software | | | | | | | | | | | | |
| Microsoft Corp. | | | 243,678 | | | | 102,520,208 | | | | 10.66 | |
| ServiceNow, Inc.* | | | 45,313 | | | | 34,546,631 | | | | 3.59 | |
| | | | | | | | 137,066,839 | | | | 14.25 | |
| Technology Hardware, Storage & Peripherals | | | | | | | | | | | | |
| Apple, Inc. | | | 243,155 | | | | 41,696,219 | | | | 4.33 | |
| | | | | | | | | | | | | |
| Transaction & Payment Processing Services | | | | | | | | | | | | |
| Visa, Inc. - Cl. A | | | 119,111 | | | | 33,241,498 | | | | 3.46 | |
| | | | | | | | | | | | | |
| TOTAL COMMON STOCKS | | | | | | | | | | | | |
| (Cost $406,112,747) | | | | | | | 904,759,341 | | | | 94.04 | |
| | | | | | | | | | | | | |
| SHORT-TERM INVESTMENTS | | | | | | | | | | | | |
| State Street Institutional Treasury Money Market Fund - Premier Class, 5.24%# | | | 60,395,701 | | | | 60,395,701 | | | | 6.28 | |
| | | | | | | | | | | | | |
| TOTAL SHORT-TERM INVESTMENTS | | | | | | | | | | | | |
| (Cost $60,395,701) | | | | | | | 60,395,701 | | | | 6.28 | |
| | | | | | | | | | | | | |
| TOTAL INVESTMENTS | | | | | | | | | | | | |
| (Cost $466,508,448) | | | | | | | 965,155,042 | | | | 100.32 | |
| | | | | | | | | | | | | |
| Liabilities, Less Cash and Other Assets | | | | | | | (3,116,229 | ) | | | (0.32 | ) |
| | | | | | | | | | | | | |
| NET ASSETS | | | | | | $ | 962,038,813 | | | | 100.00 | % |
SUMMARY OF FAIR VALUE MEASUREMENTS
As of March 31, 2024, all investments disclosed in the preceding Schedule of Investments were classified as Level 1.
For more information on investment valuation and valuation inputs, refer to Note 2(a) in the Notes to Financial Statements.
| # | Rate shown is the 7-day yield as of March 31, 2024. |
See notes to financial statements.
9
INVESTMENT REVIEW BY TOM MARSICO, PETER MARSICO, AND JIMMY MARSICO (UNAUDITED)
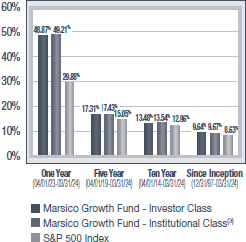
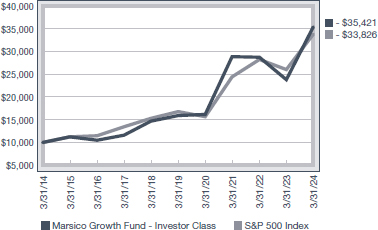
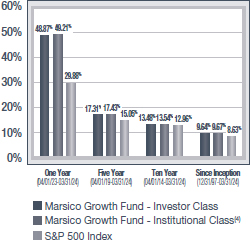
The Marsico Growth Fund’s(1),(2) Investor Class shares and Institutional Class shares posted total returns of +32.88%(3),(4),(5) and +32.94%,(3),(4),(5) respectively, for the six-month fiscal period ended March 31, 2024. The Fund outperformed its benchmark index,(2) the S&P 500 Index, which had a total return of +23.48% over the same period. Please see the Fund’s Overview for more detailed information about the Fund’s longer-term performance for various time periods ended March 31, 2024.
The Growth Fund’s outperformance during the six-month fiscal period ended March 31, 2024, as compared to the S&P 500 Index, can primarily be attributed to stock selection in the Information Technology, Communication Services, and Consumer Discretionary sectors, as defined in the Global Industry Classification Standard (“GICS”),(6) as well as an overweight allocation to the strongest-performing sector of the benchmark index, Information Technology. Additionally, a lack of exposure to the weakest-performing area of the benchmark index, Energy, contributed positively to performance.
Information Technology holding NVIDIA Corp. (“NVIDIA”) (+108%) was a top contributor to the Fund’s performance during the period partly due to an improved spending outlook from NVIDIA’s cloud services customers as well as generally more enthusiasm around the utility of generative artificial intelligence (“GenAI”). NVIDIA is a market leader in GenAI hardware and software and stands to benefit from the adoption of new GenAI applications, which are being announced almost daily, by consumers and enterprises. In addition, NVIDIA surpassed consensus expectations when it reported quarterly earnings in both November and February. Further, in late March, NVIDIA hosted NVIDIA GTC, its annual graphics processing unit technology conference, where it launched the latest datacenter business hardware family called Blackwell. NVIDIA’s CEO Jensen Huang claimed Blackwell is 4x faster at artificial intelligence (“AI”) training and 30x faster at AI inference than the prior generation. We believe that NVIDIA’s lead over the competition in AI hardware and services is widening as a result of these factors.
In the Communication Services sector, Meta Platforms, Inc. – Cl. A (“Meta”) (+62%) was a top contributor to the Fund’s performance during the period as the company continues to generate stronger revenue and free cash flow growth compared to 2022. Meta is also at the forefront of building out its AI infrastructure, which is leading to improved engagement on its core product offerings. With higher levels of engagement, we believe that Meta will be able to continue to realize consistent revenue growth and better returns on capital than in previous periods.
In terms of detractors from Fund performance, stock selection and an underweight allocation to the Financials sector, one of the strongest-performing sectors of the benchmark index, had a negative effect on performance relative to the index during the period. Stock selection in the Health Care sector created an additional drag on relative performance. Also, as the benchmark index returned +23.48% for the period, the Fund’s performance was adversely impacted by maintaining an average cash position of approximately 4%.
Health Care holding Danaher Corp. (+2%), while positive on an absolute basis, was an overall detractor for the Fund’s relative performance during the period as the post COVID-19 business environment remains challenging for the company. Inventories for customers have remained elevated post pandemic as supply/demand dynamics have not yet normalized for the life sciences industry. Although funding is improving for the biotech sector overall, the demand flow still remains challenging and is not anticipated to improve until the second half of 2024 or beginning of 2025.
Also in the Health Care sector, Zoetis Inc. (+0%, prior to being sold) was a detractor from the Fund’s relative performance during the period partly due to reduced levels of veterinary clinical visits generally throughout 2023, the impact of which was compounded by veterinary labor shortages that limited the volume of visits that many clinics could process. Although revenue per visit remains positive, investors have anticipated that the downward trend in veterinary clinical visits may persist. Further, we believe that investor sentiment regarding potential near term growth in treatment product sales is stronger than justified. As a result of these factors, we exited the position.
There were several sector adjustments made to the Fund during the reporting period. The Fund increased its allocation to the Communication Services, Materials, Industrials, Consumer Discretionary, and Financials sectors. Meanwhile, the Fund decreased its exposure to the Health Care and Information Technology sectors. There was no significant change to the Fund’s allocation to the Consumer Staples sector and the Fund continued to have no exposure to the Energy, Real Estate, and Utilities sectors.
10
Fiscal Period-End Investment Posture
As of March 31, 2024, the Fund’s largest economic sector allocations included Information Technology, Communication Services, Consumer Discretionary, and Financials. As of that date, the Fund had no investments in the Energy, Real Estate, or Utilities sectors.
Sincerely,
THOMAS F. MARSICO
PETER C. MARSICO
JAMES D. MARSICO
PORTFOLIO MANAGERS
| (1) | The Fund is subject to broad risks associated with investing in equity securities markets generally, including, without limitation, the risks that the securities and markets in which it invests may experience volatility and instability, that domestic and global economies and markets may undergo periods of cyclical change and decline, that investors may at times avoid investments in equity securities, and that Marsico Capital Management, LLC (the “Adviser”) may select investments for the Fund that do not perform as anticipated. Please see the Prospectus for more information. |
| (2) | The Fund is not managed to track its benchmark index, and may hold a substantially overweight or underweight position in a sector, industry, or security compared to its weight in the benchmark. The Fund may be subject to risks associated with a particular sector or industry in which it is overweight, including the risk that the stocks of companies within one sector or industry could simultaneously decline in price because of an event that affects the entire sector or industry. For informational purposes, the discussion below may compare the benchmark weight or performance of a sector or industry to the investment approach of the Fund. |
| (3) | The performance data quoted here represent past performance, and past performance is not a guarantee of future results. Investment return and principal value of an investment will fluctuate so that an investor’s shares, when redeemed, may be worth more or less than their original cost. Current performance may be lower or higher than the performance information quoted. To obtain performance information current to the most recent month-end, please call 888-860-8686 or visit marsicofunds.com. |
| (4) | This review highlights Fund performance over a six-month fiscal period. Shareholders should keep in mind that the Fund is intended for long-term investors who hold their shares for substantially longer periods of time. You should also keep in mind that our current views and beliefs regarding all investments discussed in this report are subject to change at any time. References to specific securities, industries, and sectors discussed in this report are not recommendations to buy or sell such securities or related investments, and the Fund may not necessarily hold these securities or investments today due to the active management of the Fund. Please see the accompanying Schedule of Investments for the percentage of the Fund’s portfolio represented by the securities mentioned in this report as of the end of the reporting period. |
| (5) | Total returns are based on net change in net asset value assuming reinvestment of distributions. Periodically, certain fees and expenses have been waived or reimbursed by the Adviser. In the absence of such a waiver or reimbursement, the performance returns reflected would have been reduced. In accordance with the expense limitation and fee waiver agreement, the Adviser may recoup fees and expenses previously waived or reimbursed under certain parameters. Periodically, the Adviser has recouped such fees or expenses, resulting in a lower performance return. Please see the Prospectus for more information. |
| (6) | Regarding GICS data cited throughout this report, the Global Industry Classification Standard was developed by and is the exclusive property and service mark of MSCI Inc. (“MSCI”) and Standard & Poor’s (“S&P”) and is licensed for use by the Adviser. Neither MSCI, S&P, nor the Adviser or any third party involved in compiling GICS makes any express or implied warranties or representations with respect to such standard or classification (or the results from use thereof), and all such parties hereby expressly disclaim all warranties of originality, accuracy, completeness, merchantability and fitness for a particular purpose with respect to any such standard or classification. MSCI, S&P, the Adviser, and any of their affiliates or third parties involved in compiling GICS shall not have any liability for any direct, indirect, special, punitive, consequential or any other damages (including lost profits) even if notified of the possibility of such damages. |
11
March 31, 2024 (Unaudited)
The Growth Fund is a diversified mutual fund and invests primarily in the common stocks of large companies that are selected for their long-term growth potential. The Fund will normally hold a core position of up to 50 common stocks.
| | | INVESTOR CLASS | | | INSTITUTIONAL CLASS | |
| | TOTAL ANNUAL OPERATING EXPENSES* | 1.49% | | TOTAL ANNUAL OPERATING EXPENSES* | 1.25% | |
| | NET EXPENSES* † | 1.46% | | NET EXPENSES*† | 1.21% | |
| | | | | | | |
GROWTH OF $10,000(1)(2)(3) | PERFORMANCE COMPARISON(1)(2) |
| | Average Annualized Returns |
 |  |
SECTOR ALLOCATION(5) | TOP FIVE HOLDINGS |
 | | | | |
| | MICROSOFT CORP. | 7.31% | |
| | META PLATFORMS, INC. - CL. A | 7.19% | |
| | NVIDIA CORP. | 7.19% | |
| | AMAZON.COM, INC. | 5.51% | |
| | ALPHABET, INC. - CL. A | 4.86% | |
| | | | |
| * | The Total Annual Operating Expenses and Net Expenses are reflective of the information disclosed in the Funds’ Prospectus dated January 31, 2024 and may differ from the expense ratios disclosed in this report. |
| † | Marsico Capital Management, LLC (the “Adviser”) has entered into a written expense limitation and fee waiver agreement under which it has agreed (i) to limit the total expenses of the Investor Class of the Fund (excluding taxes, interest, acquired fund fees and expenses, litigation, extraordinary expenses, and brokerage and other transaction expenses relating to the purchase or sale of portfolio investments) to an annual rate of 1.45% of the Fund’s average net assets attributable to Investor Class shares, and (ii) to limit the total expenses of the Institutional Class of the Fund (excluding taxes, interest, acquired fund fees and expenses, litigation, extraordinary expenses, and brokerage and other transaction expenses relating to the purchase or sale of portfolio investments) to an annual rate of 1.20% of the Fund’s average net assets attributable to Institutional Class shares, until January 31, 2025. This expense limitation and fee waiver agreement may be terminated by the Adviser at any time after January 31, 2025, upon 15 days prior notice to the Fund and its administrator. The Adviser may recoup from the Fund (or share class as applicable) any fees previously waived and/or expenses previously reimbursed by the Adviser with respect to the Fund or share class, as applicable, including any applicable waivers which may apply to a specific share class, pursuant to this agreement (including waivers or reimbursements under previous expense limitations), if (1) such recoupment by the Adviser does not cause the Fund’s share class, at the time of recoupment, to exceed the lesser of (a) the expense limitation in effect at the time the relevant amount was waived and/or reimbursed, or (b) the expense limitation in effect at the time of the proposed recoupment, (2) the recoupment is made within three years after the fiscal year end date as of which the amount to be waived or reimbursed was determined and the waiver or reimbursement occurred, and (3) the Adviser has not agreed to forego recoupment. |
| (1) | The performance data quoted here represent past performance, and past performance is not a guarantee of future results. Investment return and principal value of an investment will fluctuate so that an investor’s shares, when redeemed, may be worth more or less than their original cost. Current performance may be lower or higher than the performance information quoted. To obtain performance information current to the most recent month-end, please call 888-860-8686 or visit marsicofunds.com. |
The performance included in the chart and graph does not reflect the deduction of taxes on Fund distributions or the redemption of Fund shares.
All indices are unmanaged and investors cannot invest directly in an index.
| (2) | Periodically, certain fees and expenses have been waived or reimbursed by the Adviser. In the absence of such a waiver or reimbursement, the performance returns reflected would have been reduced. In accordance with the expense limitation and fee waiver agreement, the Adviser may recoup fees and expenses previously waived or reimbursed under certain parameters. Periodically, the Adviser has recouped such fees or expenses, resulting in a lower performance return. |
| (3) | This chart assumes an initial investment of $10,000 made on March 31, 2014 in the Investor Class shares of the Fund. Total returns are based on net change in NAV, assuming reinvestment of distributions. |
| (4) | Institutional Class shares commenced operations on December 6, 2021. The performance attributed to the Institutional Class shares prior to that date is that of the Investor Class shares. Performance prior to December 6, 2021 has not been adjusted to reflect the lower expenses of the Institutional Class shares. During this period, Institutional Class shares would have had returns similar to, but potentially higher than, Investor Class shares due to the fact that Institutional Class shares represent interests in the same portfolio as Investor Class shares but are typically subject to lower expenses than the Investor Class shares. |
| (5) | Sector weightings represent the percentage of the Fund’s investments (excluding cash equivalents) in certain general sectors. These sectors may include more than one industry. The Fund’s portfolio composition is subject to change at any time. |
12
MARSICO GROWTH FUND
SCHEDULE OF INVESTMENTS
As of March 31, 2024 (Unaudited)
| | | Number
of
Shares | | | Value | | | Percent
of Net
Assets | |
| COMMON STOCKS | | | | | | | | | | | | |
| Aerospace & Defense | | | | | | | | | | | | |
| HEICO Corp. | | | 38,760 | | | $ | 7,403,160 | | | | 1.78 | % |
| | | | | | | | | | | | | |
| Application Software | | | | | | | | | | | | |
| Intuit, Inc. | | | 14,365 | | | | 9,337,250 | | | | 2.24 | |
| Synopsys, Inc.* | | | 31,258 | | | | 17,863,947 | | | | 4.29 | |
| | | | | | | | 27,201,197 | | | | 6.53 | |
| Broadline Retail | | | | | | | | | | | | |
| Amazon.com, Inc.* | | | 127,113 | | | | 22,928,643 | | | | 5.51 | |
| | | | | | | | | | | | | |
| Consumer Finance | | | | | | | | | | | | |
| American Express Company | | | 54,925 | | | | 12,505,873 | | | | 3.00 | |
| | | | | | | | | | | | | |
| Consumer Staples Merchandise Retail | | | | | | | | | | | | |
| Costco Wholesale Corp. | | | 17,860 | | | | 13,084,772 | | | | 3.14 | |
| | | | | | | | | | | | | |
| Diversified Support Services | | | | | | | | | | | | |
| Cintas Corp. | | | 10,309 | | | | 7,082,592 | | | | 1.70 | |
| | | | | | | | | | | | | |
| Electronic Components | | | | | | | | | | | | |
| Amphenol Corp. - Cl. A | | | 36,186 | | | | 4,174,055 | | | | 1.00 | |
| | | | | | | | | | | | | |
| Financial Exchanges & Data | | | | | | | | | | | | |
| MSCI, Inc. | | | 3,120 | | | | 1,748,604 | | | | 0.42 | |
| S&P Global, Inc. | | | 21,501 | | | | 9,147,600 | | | | 2.20 | |
| | | | | | | | 10,896,204 | | | | 2.62 | |
| Health Care Equipment | | | | | | | | | | | | |
| IDEXX Laboratories, Inc.* | | | 3,550 | | | | 1,916,751 | | | | 0.46 | |
| | | | | | | | | | | | | |
| Homebuilding | | | | | | | | | | | | |
| Toll Brothers, Inc. | | | 50,518 | | | | 6,535,514 | | | | 1.57 | |
| | | | | | | | | | | | | |
| Industrial Conglomerates | | | | | | | | | | | | |
| General Electric Company | | | 11,902 | | | | 2,089,158 | | | | 0.50 | |
| | | | | | | | | | | | | |
| Interactive Media & Services | | | | | | | | | | | | |
| Alphabet, Inc. - Cl. A* | | | 134,103 | | | | 20,240,166 | | | | 4.86 | |
| Meta Platforms, Inc. - Cl. A | | | 61,641 | | | | 29,931,637 | | | | 7.19 | |
| | | | | | | | 50,171,803 | | | | 12.05 | |
| Internet Services & Infrastructure | | | | | | | | | | | | |
| Shopify, Inc. - Cl. A* | | | 52,388 | | | | 4,042,782 | | | | 0.97 | |
| | | | | | | | | | | | | |
| Life Sciences Tools & Services | | | | | | | | | | | | |
| Danaher Corp. | | | 21,392 | | | | 5,342,010 | | | | 1.28 | |
| | | | | | | | | | | | | |
| Movies & Entertainment | | | | | | | | | | | | |
| Netflix, Inc.* | | | 13,997 | | | | 8,500,798 | | | | 2.04 | |
| Spotify Technology S.A.* | | | 21,472 | | | | 5,666,461 | | | | 1.36 | |
| | | | | | | | 14,167,259 | | | | 3.40 | |
| Passenger Ground Transportation | | | | | | | | | | | | |
| Uber Technologies, Inc.* | | | 134,737 | | | | 10,373,402 | | | | 2.49 | |
| | | | | | | | | | | | | |
| Pharmaceuticals | | | | | | | | | | | | |
| Eli Lilly & Company | | | 5,433 | | | | 4,226,657 | | | | 1.02 | |
| | | | | | | | | | | | | |
| Restaurants | | | | | | | | | | | | |
| Chipotle Mexican Grill, Inc.* | | | 6,559 | | | | 19,065,505 | | | | 4.58 | |
| DoorDash, Inc. - Cl. A* | | | 66,021 | | | | 9,092,412 | | | | 2.18 | |
| | | | | | | | 28,157,917 | | | | 6.76 | |
| Semiconductor Materials & Equipment | | | | | | | | | | | | |
| ASML Holding N.V. - NY Reg. Shs. | | | 9,999 | | | | 9,703,730 | | | | 2.33 | |
| | | | | | | | | | | | | |
| Semiconductors | | | | | | | | | | | | |
| Advanced Micro Devices, Inc.* | | | 22,805 | | | | 4,116,074 | | | | 0.99 | |
| NVIDIA Corp. | | | 33,113 | | | | 29,919,582 | | | | 7.19 | |
| Taiwan Semiconductor Manufacturing Co., Ltd. Spon. ADR | | | 110,275 | | | | 15,002,914 | | | | 3.60 | |
| | | | | | | | 49,038,570 | | | | 11.78 | |
| Soft Drinks & Non-alcoholic Beverages | | | | | | | | | | | | |
| Celsius Holdings, Inc.* | | | 51,631 | | | | 4,281,243 | | | | 1.03 | |
| | | | | | | | | | | | | |
| Specialty Chemicals | | | | | | | | | | | | |
| The Sherwin-Williams Company | | | 40,768 | | | | 14,159,949 | | | | 3.40 | |
| | | | | | | | | | | | | |
| Systems Software | | | | | | | | | | | | |
| Microsoft Corp. | | | 72,379 | | | | 30,451,293 | | | | 7.31 | |
| ServiceNow, Inc.* | | | 22,101 | | | | 16,849,802 | | | | 4.05 | |
| | | | | | | | 47,301,095 | | | | 11.36 | |
| Technology Hardware, Storage & Peripherals | | | | | | | | | | | | |
| Apple, Inc. | | | 110,633 | | | | 18,971,347 | | | | 4.56 | |
| | | | | | | | | | | | | |
| Trading Companies & Distributors | | | | | | | | | | | | |
| Watsco, Inc. | | | 8,008 | | | | 3,459,216 | | | | 0.83 | |
| | | | | | | | | | | | | |
| Transaction & Payment Processing Services | | | | | | | | | | | | |
| Mastercard, Inc. - Cl. A | | | 24,838 | | | | 11,961,236 | | | | 2.87 | |
| Visa, Inc. - Cl. A | | | 16,751 | | | | 4,674,869 | | | | 1.13 | |
| | | | | | | | 16,636,105 | | | | 4.00 | |
| TOTAL COMMON STOCKS | | | | | | | | | | | | |
| (Cost $212,231,365) | | | | | | | 395,851,004 | | | | 95.07 | |
| | | | | | | | | | | | | |
| SHORT-TERM INVESTMENTS | | | | | | | | | | | | |
| State Street Institutional Treasury Money Market Fund - Premier Class, 5.24%# | | | 22,880,005 | | | | 22,880,005 | | | | 5.50 | |
| | | | | | | | | | | | | |
| TOTAL SHORT-TERM INVESTMENTS | | | | | | | | | | | | |
| (Cost $22,880,005) | | | | | | | 22,880,005 | | | | 5.50 | |
| | | | | | | | | | | | | |
| TOTAL INVESTMENTS | | | | | | | | | | | | |
| (Cost $235,111,370) | | | | | | | 418,731,009 | | | | 100.57 | |
| | | | | | | | | | | | | |
| Liabilities, Less Cash and Other Assets | | | | | | | (2,357,777 | ) | | | (0.57 | ) |
| | | | | | | | | | | | | |
| NET ASSETS | | | | | | $ | 416,373,232 | | | | 100.00 | % |
13
MARSICO GROWTH FUND
SCHEDULE OF INVESTMENTS (continued)
As of March 31, 2024 (Unaudited)
SUMMARY OF FAIR VALUE MEASUREMENTS
As of March 31, 2024, all investments disclosed in the preceding Schedule of Investments were classified as Level 1.
For more information on investment valuation and valuation inputs, refer to Note 2(a) in the Notes to Financial Statements.
| # | Rate shown is the 7-day yield as of March 31, 2024. |
See notes to financial statements.
14
INVESTMENT REVIEW BY TOM MARSICO, PETER MARSICO, AND JIMMY MARSICO (UNAUDITED)
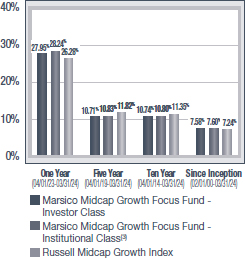
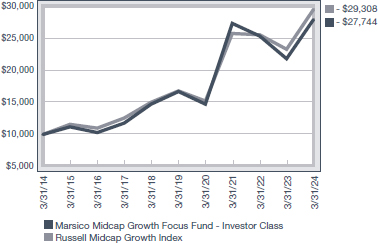
The Marsico Midcap Growth Focus Fund’s(1),(2),(3) Investor Class shares and Institutional Class shares posted total returns of +27.76%(4),(5),(6) and +27.90%,(4),(5),(6) respectively, for the six-month fiscal period ended March 31, 2024. The Fund outperformed its benchmark index,(2) the Russell Midcap Growth Index, which had a total return of +25.42% over the same period. Please see the Fund’s Overview for more detailed information about the Fund’s longer-term performance for various time periods ended March 31, 2024.
The Midcap Growth Focus Fund’s outperformance during the six-month fiscal period ended March 31, 2024, as compared to the Russell Midcap Growth Index, can be primarily attributed to an overweight allocation and stock selection in one of the strongest-performing sectors of the benchmark index, Consumer Discretionary, as defined in the Global Industry Classification Standard (“GICS”).(7) Strong stock selection in the Communication Services sector also boosted the Fund’s performance. A lack of exposure to the weakest-performing sector of the benchmark index, Energy, had an additional positive affect on results relative to the index.
In the Consumer Discretionary sector, Chipotle Mexican Grill, Inc. (“Chipotle”) (+59%) was a significant contributor to the Fund’s performance during the period. Chipotle reported a strong fourth quarter as revenue and earnings beat expectations which contributed to a positive move in the share price. Strong traffic growth of +7.4% year-over-year and expanding restaurant level margins led to earnings per share of $10.37, which was 6.5% above street expectations. The company is experiencing strong traffic growth as initiatives to help throughput during peak demand hours and stability in staffing levels are starting to payoff. In addition to strong sales growth within existing restaurants, the company is aggressively opening new stores and ended the year with 3,437 restaurants, up +7.8% year-over-year.
Communication Services holding Spotify Technology S.A. (“Spotify”) (+71%) was a strong contributor to the Fund’s performance during the period as the company has made very large strides toward improving the efficiency of its business operations. Previously, the company went through a period of aggressive spending to broaden its content offering by acquiring companies and large contracts for exclusivity with talent in the podcasting space. These acquisitions and relative increase of spending in the area led to significant margin degradation for the company. As Spotify realized that the return on this spending was very low, it took steps toward rolling back many of those investments and brought in a new CFO. Investors responded positively to these steps contributing to the stock’s strong performance over the period. Further, we see a better path toward margin improvement and free cash flow generation moving forward, which we believe will be positively viewed by the market.
In terms of detractors from Fund performance, stock selection and an underweight allocation to one of the stronger-performing sectors of the benchmark index, Financials, created a drag on performance relative to the index. Further, certain stock selections also underperformed during the period. Additionally, the Fund’s performance was dampened, relative to its benchmark index, by maintaining an average cash position of approximately 1% as the benchmark index returned +25.42% during the period.
In the Financials sector, MSCI Inc. (+9%), while positive on an absolute basis, was an overall detractor from the Fund’s relative performance during the period partly as a result of a deceleration in the growth of some of its business lines. Specifically, growth in its environmental, social and governance (ESG) and climate business lines diminished throughout the period as retention rates of smaller clients for these business lines dropped and sales cycles elongated for the firm. These factors contributed to underperformance of the stock despite the company having exhibited strong profitability in the most recently reported quarter.
Consumer Discretionary holding Mobileye Global, Inc. – Cl. A (“Mobileye”) (-28%, prior to being sold) was a detractor from the Fund’s performance during the period as investor concerns have grown related to anticipated sales levels throughout 2024. Mobileye has communicated that there is an excess inventory of its core EyeQ chipsets for advanced driving assistance systems (ADAS) at its tier-1 auto supplier customers. Many of these customers built up inventory coming out of the extreme component shortages of the first two years of the pandemic, and when the global automotive industry began to slow in recent months these suppliers decided to reduce that inventory. This inventory reduction by Mobileye’s customers has contributed to much-lower sales expectations for 2024, particularly in the first half of the year. While we believe Mobileye possesses differentiated technology in ADAS and eventual autonomous driving systems, we decided to exit the position until we have more clarity on the inventory situation and overall automotive end-market health.
During the reporting period, the Fund increased its exposure to the Consumer Discretionary, Industrials, and Financials sectors, and added a position in the Real Estate sector. The Fund decreased its allocation to the Information Technology and Health Care sectors. There were no significant changes to the Fund’s allocations to the Consumer Staples and Communication Services sectors, and the Fund continued to have no exposure to the Energy, Materials, and Utilities sectors.
15
Fiscal Period-End Investment Posture
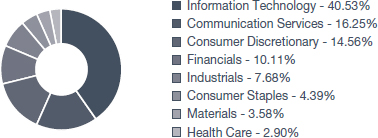
As of March 31, 2024, the Fund’s primary economic sector allocations were to the Consumer Discretionary, Information Technology, and Industrials sectors. At period end, the Fund had no investments in the Energy, Materials, or Utilities sectors.
Sincerely,
THOMAS F. MARSICO
PETER C. MARSICO
JAMES D. MARSICO
PORTFOLIO MANAGERS
| (1) | The Fund is subject to broad risks associated with investing in equity securities markets generally, including, without limitation, the risks that the securities and markets in which it invests may experience volatility and instability, that domestic and global economies and markets may undergo periods of cyclical change and decline, that investors may at times avoid investments in equity securities, and that Marsico Capital Management, LLC (the “Adviser”) may select investments for the Fund that do not perform as anticipated. |
| (2) | The Fund is not managed to track its benchmark index, and may hold a substantially overweight or underweight position in a sector, industry, or security compared to its weight in the benchmark. The Fund may be subject to risks associated with a particular sector or industry in which it is overweight, including the risk that the stocks of companies within one sector or industry could simultaneously decline in price because of an event that affects the entire sector or industry. For informational purposes, the discussion below may compare the benchmark weight or performance of a sector or industry to the investment approach of the Fund. |
| (3) | The Fund’s investments in medium-capitalization or mid-cap companies, as well as any investments in small-capitalization companies, can involve more risk than investments in larger companies because medium-capitalization and small capitalization companies have potentially greater sensitivity to adverse business or economic conditions. Medium-capitalization and small-capitalization companies may have more limited financial resources, markets or product lines, less access to capital markets, and more limited trading in their stocks. This can cause the prices of equity securities of these companies to be more volatile than those of larger companies, or to decline more significantly during market downturns than the market as a whole. Please see the Prospectus for more information. |
| (4) | The performance data quoted here represent past performance, and past performance is not a guarantee of future results. Investment return and principal value of an investment will fluctuate so that an investor’s shares, when redeemed, may be worth more or less than their original cost. Current performance may be lower or higher than the performance information quoted. To obtain performance information current to the most recent month-end, please call 888-860-8686 or visit marsicofunds.com. |
| (5) | This review highlights Fund performance over a six-month fiscal period. Shareholders should keep in mind that the Fund is intended for long-term investors who hold their shares for substantially longer periods of time. You should also keep in mind that our current views and beliefs regarding all investments discussed in this report are subject to change at any time. References to specific securities, industries, and sectors discussed in this report are not recommendations to buy or sell such securities or related investments, and the Fund may not necessarily hold these securities or investments today due to the active management of the Fund. Please see the accompanying Schedule of Investments for the percentage of the Fund’s portfolio represented by the securities mentioned in this report as of the end of the reporting period. |
| (6) | Total returns are based on net change in net asset value assuming reinvestment of distributions. Periodically, certain fees and expenses have been waived or reimbursed by the Adviser. In the absence of such a waiver or reimbursement, the performance returns reflected would have been reduced. In accordance with the expense limitation and fee waiver agreement, the Adviser may recoup fees and expenses previously waived or reimbursed under certain parameters. Periodically, the Adviser has recouped such fees or expenses, resulting in a lower performance return. Please see the Prospectus for more information. |
| (7) | Regarding GICS data cited throughout this report, the Global Industry Classification Standard was developed by and is the exclusive property and service mark of MSCI Inc. (“MSCI”) and Standard & Poor’s (“S&P”) and is licensed for use by the Adviser. Neither MSCI, S&P, nor the Adviser or any third party involved in compiling GICS makes any express or implied warranties or representations with respect to such standard or classification (or the results from use thereof), and all such parties hereby expressly disclaim all warranties of originality, accuracy, completeness, merchantability and fitness for a particular purpose with respect to any such standard or classification. MSCI, S&P, the Adviser, and any of their affiliates or third parties involved in compiling GICS shall not have any liability for any direct, indirect, special, punitive, consequential or any other damages (including lost profits) even if notified of the possibility of such damages. |
16
| MIDCAP GROWTH FOCUS FUND OVERVIEW |
March 31, 2024 (Unaudited)
The Midcap Growth Focus Fund is a diversified mutual fund and invests primarily in common stocks that are selected for their long-term growth potential. The Fund may invest in companies of any size. Under normal circumstances, the Fund will invest at least 80% of the value of its assets in medium-capitalization (or “mid-cap”) growth companies. The Fund will normally hold a core position of between 35 and 50 common stocks.
| | | INVESTOR CLASS | | | INSTITUTIONAL CLASS | |
| | TOTAL ANNUAL OPERATING EXPENSES* | 1.46% | | TOTAL ANNUAL OPERATING EXPENSES* | 1.22% | |
| | | | | NET EXPENSES*† | 1.21% | |
| | | | | | | |
GROWTH OF $10,000(1)(2)(3) | PERFORMANCE COMPARISON(1)(2) |
| | Average Annualized Returns |
 | 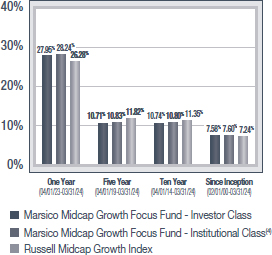 |
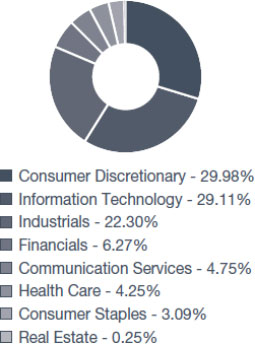
SECTOR ALLOCATION(5) | TOP FIVE HOLDINGS |
 | | | | |
| | CHIPOTLE MEXICAN GRILL, INC. | 6.69% | |
| | SYNOPSYS, INC. | 6.56% | |
| | KLA CORP. | 5.23% | |
| | CONSTELLATION SOFTWARE, INC. | 4.95% | |
| | CINTAS CORP. | 4.80% | |
| | | | |
| * | The Total Annual Operating Expenses and Net Expenses are reflective of the information disclosed in the Funds’ Prospectus dated January 31, 2024 and may differ from the expense ratios disclosed in this report. |
| † | Marsico Capital Management, LLC (the “Adviser”) has entered into a written expense limitation and fee waiver agreement under which it has agreed (i) to limit the total expenses of the Investor Class of the Fund (excluding taxes, interest, acquired fund fees and expenses, litigation, extraordinary expenses, and brokerage and other transaction expenses relating to the purchase or sale of portfolio investments) to an annual rate of 1.45% of the Fund’s average net assets attributable to Investor Class shares, and (ii) to limit the total expenses of the Institutional Class of the Fund (excluding taxes, interest, acquired fund fees and expenses, litigation, extraordinary expenses, and brokerage and other transaction expenses relating to the purchase or sale of portfolio investments) to an annual rate of 1.20% of the Fund’s average net assets attributable to Institutional Class shares, until January 31, 2025. This expense limitation and fee waiver agreement may be terminated by the Adviser at any time after January 31, 2025, upon 15 days prior notice to the Fund and its administrator. The Adviser may recoup from the Fund (or share class as applicable) any fees previously waived and/or expenses previously reimbursed by the Adviser with respect to the Fund or share class, as applicable, including any applicable waivers which may apply to a specific share class, pursuant to this agreement (including waivers or reimbursements under previous expense limitations), if (1) such recoupment by the Adviser does not cause the Fund’s share class, at the time of recoupment, to exceed the lesser of (a) the expense limitation in effect at the time the relevant amount was waived and/or reimbursed, or (b) the expense limitation in effect at the time of the proposed recoupment, (2) the recoupment is made within three years after the fiscal year end date as of which the amount to be waived or reimbursed was determined and the waiver or reimbursement occurred, and (3) the Adviser has not agreed to forego recoupment. |
| (1) | The performance data quoted here represent past performance, and past performance is not a guarantee of future results. Investment return and principal value of an investment will fluctuate so that an investor’s shares, when redeemed, may be worth more or less than their original cost. Current performance may be lower or higher than the performance information quoted. To obtain performance information current to the most recent month-end, please call 888-860-8686 or visit marsicofunds.com. |
The performance included in the chart and graph does not reflect the deduction of taxes on Fund distributions or the redemption of Fund shares.
All indices are unmanaged and investors cannot invest directly in an index.
The Russell Midcap Growth Index (the “Underlying Index”) measures the performance of the mid-capitalization growth sector of the US equity market, and is composed of mid-capitalization US equities that exhibit growth characteristics. It is a subset of the Russell Midcap® Index, which measures the performance of the mid-capitalization sector of the US equity market. The Underlying Index measures the performance of equity securities of Russell Midcap Index issuers with higher price-to-book ratios and higher forecasted growth.
| (2) | Periodically, certain fees and expenses have been waived or reimbursed by the Adviser. In the absence of such a waiver or reimbursement, the performance returns reflected would have been reduced. In accordance with the expense limitation and fee waiver agreement, the Adviser may recoup fees and expenses previously waived or reimbursed under certain parameters. Periodically, the Adviser has recouped such fees or expenses, resulting in a lower performance return. |
| (3) | This chart assumes an initial investment of $10,000 made on March 31, 2014 in the Investor Class shares of the Fund. Total returns are based on net change in NAV, assuming reinvestment of distributions. |
| (4) | Institutional Class shares commenced operations on December 6, 2021. The performance attributed to the Institutional Class shares prior to that date is that of the Investor Class shares. Performance prior to December 6, 2021 has not been adjusted to reflect the lower expenses of the Institutional Class shares. During this period, Institutional Class shares would have had returns similar to, but potentially higher than, Investor Class shares due to the fact that Institutional Class shares represent interests in the same portfolio as Investor Class shares but are typically subject to lower expenses than the Investor Class shares. |
| (5) | Sector weightings represent the percentage of the Fund’s investments (excluding cash equivalents) in certain general sectors. These sectors may include more than one industry. The Fund’s portfolio composition is subject to change at any time. |
17
MARSICO MIDCAP GROWTH FOCUS FUND
SCHEDULE OF INVESTMENTS
As of March 31, 2024 (Unaudited)
| | | Number
of
Shares/
Warrants | | | Value | | | Percent
of Net
Assets | |
| COMMON STOCKS | | | | | | | | | | | | |
| Aerospace & Defense | | | | | | | | | | | | |
| Aerovironment, Inc.* | | | 4,702 | | | $ | 720,723 | | | | 0.25 | % |
| HEICO Corp. | | | 57,011 | | | | 10,889,101 | | | | 3.81 | |
| Rolls-Royce Holdings PLC* | | | 275,226 | | | | 1,482,255 | | | | 0.52 | |
| | | | | | | | 13,092,079 | | | | 4.58 | |
| Apparel, Accessories & Luxury Goods | | | | | | | | | | | | |
| lululemon athletica, inc.* | | | 10,765 | | | | 4,205,347 | | | | 1.47 | |
| | | | | | | | | | | | | |
| Application Software | | | | | | | | | | | | |
| Constellation Software, Inc. | | | 5,185 | | | | 14,163,006 | | | | 4.95 | |
| Palantir Technologies, Inc. - Cl. A* | | | 412,134 | | | | 9,483,203 | | | | 3.32 | |
| Samsara, Inc. - Cl. A* | | | 52,916 | | | | 1,999,696 | | | | 0.70 | |
| Synopsys, Inc.* | | | 32,816 | | | | 18,754,344 | | | | 6.56 | |
| Tyler Technologies, Inc.* | | | 1,677 | | | | 712,742 | | | | 0.25 | |
| | | | | | | | 45,112,991 | | | | 15.78 | |
| Asset Management & Custody Banks | | | | | | | | | | | | |
| KKR & Co., Inc. | | | 86,657 | | | | 8,715,961 | | | | 3.05 | |
| | | | | | | | | | | | | |
| Automotive Retail | | | | | | | | | | | | |
| O’Reilly Automotive, Inc.* | | | 9,076 | | | | 10,245,715 | | | | 3.58 | |
| | | | | | | | | | | | | |
| Biotechnology | | | | | | | | | | | | |
| Neurocrine Biosciences, Inc.* | | | 19,507 | | | | 2,690,405 | | | | 0.94 | |
| | | | | | | | | | | | | |
| Diversified Support Services | | | | | | | | | | | | |
| Cintas Corp. | | | 19,983 | | | | 13,728,920 | | | | 4.80 | |
| | | | | | | | | | | | | |
| Electrical Components & Equipment | | | | | | | | | | | | |
| AMETEK, Inc. | | | 48,635 | | | | 8,895,341 | | | | 3.11 | |
| | | | | | | | | | | | | |
| Electronic Components | | | | | | | | | | | | |
| Amphenol Corp. - Cl. A | | | 79,839 | | | | 9,209,429 | | | | 3.22 | |
| | | | | | | | | | | | | |
| Environmental & Facilities Services | | | | | | | | | | | | |
| Waste Connections, Inc. | | | 4,091 | | | | 703,693 | | | | 0.24 | |
| | | | | | | | | | | | | |
| Financial Exchanges & Data | | | | | | | | | | | | |
| MSCI, Inc. | | | 15,144 | | | | 8,487,455 | | | | 2.97 | |
| | | | | | | | | | | | | |
| Health Care Equipment | | | | | | | | | | | | |
| DexCom, Inc.* | | | 21,390 | | | | 2,966,793 | | | | 1.04 | |
| GE HealthCare Technologies, Inc. | | | 71,386 | | | | 6,489,701 | | | | 2.27 | |
| | | | | | | | 9,456,494 | | | | 3.31 | |
| Home Improvement Retail | | | | | | | | | | | | |
| Floor & Decor Holdings, Inc. - Cl. A* | | | 48,085 | | | | 6,232,778 | | | | 2.18 | |
| | | | | | | | | | | | | |
| Homebuilding | | | | | | | | | | | | |
| D.R. Horton, Inc. | | | 28,904 | | | | 4,756,153 | | | | 1.66 | |
| Lennar Corp. - Cl. A | | | 39,008 | | | | 6,708,596 | | | | 2.35 | |
| NVR, Inc.* | | | 1,287 | | | | 10,424,649 | | | | 3.64 | |
| PulteGroup, Inc. | | | 42,228 | | | | 5,093,541 | | | | 1.78 | |
| Toll Brothers, Inc. | | | 43,329 | | | | 5,605,473 | | | | 1.96 | |
| | | | | | | | 32,588,412 | | | | 11.39 | |
| Insurance Brokers | | | | | | | | | | | | |
| Arthur J. Gallagher & Company | | | 2,746 | | | | 686,610 | | | | 0.24 | |
| | | | | | | | | | | | | |
| Leisure Products | | | | | | | | | | | | |
| Acushnet Holdings Corp. | | | 122,333 | | | | 8,067,861 | | | | 2.82 | |
| | | | | | | | | | | | | |
| Movies & Entertainment | | | | | | | | | | | | |
| Spotify Technology S.A.* | | | 51,343 | | | | 13,549,418 | | | | 4.74 | |
| | | | | | | | | | | | | |
| Passenger Airlines | | | | | | | | | | | | |
| Delta Air Lines, Inc. | | | 206,871 | | | | 9,902,915 | | | | 3.46 | |
| United Airlines Holdings, Inc.* | | | 155,608 | | | | 7,450,511 | | | | 2.61 | |
| | | | | | | | 17,353,426 | | | | 6.07 | |
| Real Estate Services | | | | | | | | | | | | |
| CoStar Group, Inc.* | | | 7,375 | | | | 712,425 | | | | 0.25 | |
| | | | | | | | | | | | | |
| Restaurants | | | | | | | | | | | | |
| Chipotle Mexican Grill, Inc.* | | | 6,582 | | | | 19,132,360 | | | | 6.69 | |
| DoorDash, Inc. - Cl. A* | | | 36,883 | | | | 5,079,527 | | | | 1.78 | |
| | | | | | | | 24,211,887 | | | | 8.47 | |
| Semiconductor Materials & Equipment | | | | | | | | | | | | |
| KLA Corp. | | | 21,400 | | | | 14,949,398 | | | | 5.23 | |
| | | | | | | | | | | | | |
| Semiconductors | | | | | | | | | | | | |
| Marvell Technology, Inc. | | | 56,386 | | | | 3,996,640 | | | | 1.40 | |
| Microchip Technology, Inc. | | | 109,468 | | | | 9,820,374 | | | | 3.43 | |
| | | | | | | | 13,817,014 | | | | 4.83 | |
| Soft Drinks & Non-alcoholic Beverages | | | | | | | | | | | | |
| Celsius Holdings, Inc.* | | | 106,454 | | | | 8,827,166 | | | | 3.09 | |
| | | | | | | | | | | | | |
| Trading Companies & Distributors | | | | | | | | | | | | |
| United Rentals, Inc. | | | 5,041 | | | | 3,635,115 | | | | 1.27 | |
| Watsco, Inc. | | | 14,415 | | | | 6,226,848 | | | | 2.18 | |
| | | | | | | | 9,861,963 | | | | 3.45 | |
| TOTAL COMMON STOCKS | | | | | | | | | | | | |
| (Cost $171,852,614) | | | | | | | 285,402,188 | | | | 99.81 | |
| | | | | | | | | | | | | |
| WARRANTS | | | | | | | | | | | | |
| Application Software | | | | | | | | | | | | |
| Constellation Software, Inc. Warrants, Strike Price: Pending, Expiration Date: March 31, 2040*@^ | | | 5,185 | | | | 0 | | | | 0.00 | |
| | | | | | | | | | | | | |
| TOTAL WARRANTS | | | | | | | | | | | | |
| (Cost $0) | | | | | | | 0 | | | | 0.00 | |
18
| | | Number
of
Shares | | | Value | | | Percent
of Net
Assets | |
| SHORT-TERM INVESTMENTS | | | | | | | | | | | | |
| State Street Institutional Treasury Money Market Fund - Premier Class, 5.24%# | | | 1,540,389 | | | $ | 1,540,389 | | | | 0.54 | % |
| | | | | | | | | | | | | |
| TOTAL SHORT-TERM INVESTMENTS | | | | | | | | | | | | |
| (Cost $1,540,389) | | | | | | | 1,540,389 | | | | 0.54 | |
| | | | | | | | | | | | | |
| TOTAL INVESTMENTS | | | | | | | | | | | | |
| (Cost $173,393,003) | | | | | | | 286,942,577 | | | | 100.35 | |
| | | | | | | | | | | | | |
| Liabilities, Less Cash and Other Assets | | | | | | | (1,001,911 | ) | | | (0.35 | ) |
| | | | | | | | | | | | | |
| NET ASSETS | | | | | | $ | 285,940,666 | | | | 100.00 | % |
SUMMARY OF FAIR VALUE MEASUREMENTS
The following is a summary of the fair values of the Fund’s investments according to the valuation inputs utilized as of March 31, 2024.
Fund Investment by
Major Security Type | | Level 1 -
Quoted Prices | | | Level 2 -
Other Significant
Observable Inputs | | | Level 3 -
Significant
Unobservable Inputs | | | Total | |
| Assets | | | | | | | | | | | | |
| Common Stocks | | $ | 285,402,188 | | | $ | — | | | $ | — | | | $ | 285,402,188 | |
| Warrants | | | | | | | | | | | | | | | | |
| Information Technology | | | — | | | | — | | | | — | ** | | | — | |
| Short-term Investments | | | 1,540,389 | | | | — | | | | — | | | | 1,540,389 | |
| | | $ | 286,942,577 | | | $ | — | | | $ | — | | | $ | 286,942,577 | |
| ** | Constellation Software, Inc. warrants represent the only Level 3 security held by the Fund. |
For more information on investment valuation and valuation inputs, refer to Note 2(a) in the Notes to Financial Statements.
| @ | Security valued at fair value using significant unobservable inputs as determined in good faith by the Adviser, as the Fund’s Board of Trustees’ valuation designee. As of March 31, 2024, the total value of Level 3 securities was $0, which represents 0.00% of the Fund’s net assets. |
| ^ | As of March 31, 2024, certain information for the security, such as the strike price, is pending announcement by the issuer. |
| # | Rate shown is the 7-day yield as of March 31, 2024. |
See notes to financial statements.
19
| INTERNATIONAL OPPORTUNITIES FUND |
INVESTMENT REVIEW BY TOM MARSICO, PETER MARSICO, AND JIMMY MARSICO (UNAUDITED)
The Marsico International Opportunities Fund’s(1),(2) Investor Class shares and Institutional Class shares posted total returns of (US$) +34.97%(3),(4),(5) and +35.17%,(3),(4),(5) respectively, for the six-month fiscal period ended March 31, 2024. The Fund outperformed its benchmark index,(2) the MSCI Europe Australasia Far East Index (“MSCI EAFE Index”), which had a total return of (US$) +16.81% over the same period. Please see the Fund’s Overview for more detailed information about the Fund’s longer-term performance for various time periods ended March 31, 2024.
The International Opportunities Fund’s outperformance during the six-month fiscal period ended March 31, 2024, as compared to the MSCI EAFE Index, can be primarily attributed to stock selection and an overweight allocation to the strongest-performing sector of the benchmark index, Information Technology, as defined in the Global Industry Classification Standard (“GICS”).(6) Stock selection in the Communication Services and Health Care sectors further bolstered the Fund’s performance during the period.
Information Technology holding NVIDIA Corp. (“NVIDIA”) (+105%) was a top contributor to the Fund’s performance during the period partly due to an improved spending outlook from NVIDIA’s cloud services customers as well as generally more enthusiasm around the utility of generative artificial intelligence (“GenAI”). NVIDIA is a market leader in GenAI hardware and software and stands to benefit from the adoption of new GenAI applications, which are being announced almost daily, by consumers and enterprises. In addition, NVIDIA surpassed consensus expectations when it reported quarterly earnings in both November and February. Further, in late March, NVIDIA hosted NVIDIA GTC, its annual graphics processing unit technology conference, where it launched the latest datacenter business hardware family called Blackwell. NVIDIA’s CEO Jensen Huang claimed Blackwell is 4x faster at artificial intelligence (“AI”) training and 30x faster at AI inference than the prior generation. We believe that NVIDIA’s lead over the competition in AI hardware and services is widening as a result of these factors.
Communication Services holding Spotify Technology S.A. (“Spotify”) (+71%) was a strong contributor to the Fund’s performance during the period as the company has made very large strides toward improving the efficiency of its business operations. Previously, the company went through a period of aggressive spending to broaden its content offering by acquiring companies and large contracts for exclusivity with talent in the podcasting space. These acquisitions and relative increase of spending in the area led to significant margin degradation for the company. As Spotify realized that the return on this spending was very low, it took steps toward rolling back many of those investments and brought in a new CFO. Investors responded positively to these steps contributing to the stock’s strong performance over the period. Further, we see a better path toward margin improvement and free cash flow generation moving forward, which we believe will be positively viewed by the market.
On the negative side, the Fund’s relative performance was dampened by select allocation decisions including an overweight allocation to the benchmark index’s weaker-performing Communication Services sector, and an underweight allocation on average to the stronger-performing Financials and Industrials sectors. The Fund’s performance was also adversely impacted by maintaining an average cash position of approximately 3%, as the benchmark index advanced +17% in the period. Certain individual stocks detracted from Fund performance as well.
Health Care holding AstraZeneca PLC (“AstraZeneca”) (-8%, prior to being sold) was a detractor from the Fund’s performance during the period as growth post the pandemic decelerated and investors remained concerned about 2024 guidance. Although AstraZeneca has one of the more exciting oncology treatment portfolios in the pharmaceutical industry, spending to support further development of that portfolio is expected to remain elevated. This spending along with moderating product trends in its other revenue segments, such as cardiovascular, diabetes, and respiratory treatments, contributed to our decision to exit the position.
Also in the Health Care sector, Alcon, Inc. (“Alcon”) (-7%, prior to being sold) was a detractor from the Fund’s performance during the period as the company has delivered inconsistent results with their surgical business post pandemic. One of the major investment drivers for Alcon is the surgical intraocular lens (“IOL”) replacement and cataract surgical markets. Post pandemic, the sales in Alcon’s IOL segment has remained below investor expectations while the other segments of the portfolio have remained in line with or slightly better than expectations. As the surgical business drives higher margins and better cash flow, this adverse balance created concerns among many investors around future growth. This business shift contributed to our decision to exit the Fund’s position in the company.
Although active currency management is not a central facet of the International Opportunities Fund’s investment process, fluctuations in major world currencies can at times affect the Fund’s performance. During the period, the net effect of currency moves had a marginal, negative impact on Fund performance.
During the reporting period, the Fund increased its exposure to the Information Technology, Communication Services, and Consumer Discretionary sectors. The Fund decreased its allocation to the Industrials, Health Care, and Consumer Staples sectors and exited the positions held during the period in the Financials sector. There were no significant changes to the Fund’s allocations to the Energy, Real Estate, and Materials sectors, and the Fund’s lack of exposure to the Utilities sector remained intact.
20
| INTERNATIONAL OPPORTUNITIES FUND |
Fiscal Period-End Investment Posture
As of March 31, 2024, the Fund’s primary economic sector allocations included the Information Technology, Communication Services, Consumer Discretionary, and Industrials sectors. As of that date, the Fund had no investments in the Financials and Utilities sectors.
In terms of country allocations, the Fund’s most significant weightings at period-end, excluding short-term investments, were in the United States, France, the United Kingdom, Canada, the Netherlands, Germany, Denmark, and Taiwan. Country-level weightings generally should be considered a residual of the Fund’s stock selection process rather than a major, proactive facet of its investment strategy.
Sincerely,
THOMAS F. MARSICO
PETER C. MARSICO
JAMES D. MARSICO
PORTFOLIO MANAGERS
| (1) | Foreign investments present additional risks due to currency fluctuations, economic and political factors, lower liquidity, differences in securities regulations and accounting standards, possible changes in taxation, limited public information, and other factors. In addition, the Fund is subject to broad risks associated with investing in equity securities markets generally, including, without limitation, the risks that the securities and markets in which it invests may experience volatility and instability, that domestic and global economies and markets may undergo periods of cyclical change and decline, that investors may at times avoid investments in equity securities, and that Marsico Capital Management, LLC (the “Adviser”) may select investments for the Fund that do not perform as anticipated. Please see the Prospectus for more information. |
| (2) | The Fund is not managed to track its benchmark index, and may hold a substantially overweight or underweight position in a sector, industry, or security compared to its weight in the benchmark. The Fund may be subject to risks associated with a particular sector or industry in which it is overweight, including the risk that the stocks of companies within one sector or industry could simultaneously decline in price because of an event that affects the entire sector or industry. For informational purposes, the discussion below may compare the benchmark weight or performance of a sector or industry to the investment approach of the Fund. |
| (3) | The performance data quoted here represent past performance, and past performance is not a guarantee of future results. Investment return and principal value of an investment will fluctuate so that an investor’s shares, when redeemed, may be worth more or less than their original cost. Current performance may be lower or higher than the performance information quoted. To obtain performance information current to the most recent month-end, please call 888-860-8686 or visit marsicofunds.com. |
| (4) | This review highlights Fund performance over a six-month fiscal period. Shareholders should keep in mind that the Fund is intended for long-term investors who hold their shares for substantially longer periods of time. You should also keep in mind that our current views and beliefs regarding all investments discussed in this report are subject to change at any time. References to specific securities, industries, and sectors discussed in this report are not recommendations to buy or sell such securities or related investments, and the Fund may not necessarily hold these securities or investments today due to the active management of the Fund. Please see the accompanying Schedule of Investments for the percentage of the Fund’s portfolio represented by the securities mentioned in this report as of the end of the reporting period. |
| (5) | Total returns are based on net change in net asset value assuming reinvestment of distributions. Periodically, certain fees and expenses have been waived or reimbursed by the Adviser. In the absence of such a waiver or reimbursement, the performance returns reflected would have been reduced. In accordance with the expense limitation and fee waiver agreement, the Adviser may recoup fees and expenses previously waived or reimbursed under certain parameters. Periodically, the Adviser has recouped such fees or expenses, resulting in a lower performance return. Please see the Prospectus for more information. |
| (6) | Regarding GICS data cited throughout this report, the Global Industry Classification Standard was developed by and is the exclusive property and service mark of MSCI Inc. (“MSCI”) and Standard & Poor’s (“S&P”) and is licensed for use by the Adviser. Neither MSCI, S&P, nor the Adviser or any third party involved in compiling GICS makes any express or implied warranties or representations with respect to such standard or classification (or the results from use thereof), and all such parties hereby expressly disclaim all warranties of originality, accuracy, completeness, merchantability and fitness for a particular purpose with respect to any such standard or classification. MSCI, S&P, the Adviser, and any of their affiliates or third parties involved in compiling GICS shall not have any liability for any direct, indirect, special, punitive, consequential or any other damages (including lost profits) even if notified of the possibility of such damages. |
21
| INTERNATIONAL OPPORTUNITIES FUND OVERVIEW |
March 31, 2024 (Unaudited)
The International Opportunities Fund is a diversified mutual fund and invests primarily (generally, no less than 65% of its net assets) in foreign securities, such as common stocks of foreign companies that are selected for their long-term growth potential, and other foreign securities, whether traded in the US (including as American Depositary Receipts) or in foreign markets or both. The Fund may invest in an unlimited number of companies of any size throughout the world. The Fund normally invests in the securities of issuers that are economically tied to one or more foreign countries, and expects to be invested in various issuers or securities that together have ties to at least four different foreign countries. The Fund may invest in securities of companies economically tied to emerging markets. Some issuers or securities in the Fund’s portfolio may be economically tied to the US.
| | | INVESTOR CLASS | | | INSTITUTIONAL CLASS | |
| | TOTAL ANNUAL OPERATING EXPENSES* | 1.86% | | TOTAL ANNUAL OPERATING EXPENSES* | 1.98% | |
| | NET EXPENSES* † | 1.50% | | NET EXPENSES*† | 1.25% | |
| | | | | | | |
GROWTH OF $10,000(1)(2)(3) | PERFORMANCE COMPARISON(1)(2) |
| | Average Annualized Returns |
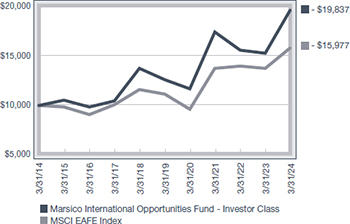 | 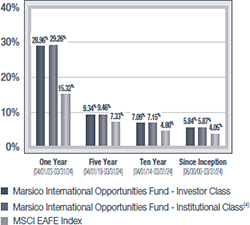 |
SECTOR ALLOCATION(5) | TOP FIVE HOLDINGS |
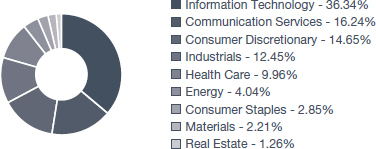
| | | | |
| | ASML HOLDING N.V. | 5.82% | |
| | NVIDIA CORP. | 5.67% | |
| | SAP S.E. | 5.58% | |
| | NOVO NORDISK A/S - CL. B | 5.47% | |
| | TAIWAN SEMICONDUCTOR MANUFACTURING CO., LTD. SPON. ADR | 5.47% | |
| | | | |
| * | The Total Annual Operating Expenses and Net Expenses are reflective of the information disclosed in the Funds’ Prospectus dated January 31, 2024 and may differ from the expense ratios disclosed in this report. |
| † | Marsico Capital Management, LLC (the “Adviser”) has entered into a written expense limitation and fee waiver agreement under which it has agreed (i) to limit the total expenses of the Investor Class of the Fund (excluding taxes, interest, acquired fund fees and expenses, litigation, extraordinary expenses, and brokerage and other transaction expenses relating to the purchase or sale of portfolio investments) to an annual rate of 1.50% of the Fund’s average net assets attributable to Investor Class shares, and (ii) to limit the total expenses of the Institutional Class of the Fund (excluding taxes, interest, acquired fund fees and expenses, litigation, extraordinary expenses, and brokerage and other transaction expenses relating to the purchase or sale of portfolio investments) to an annual rate of 1.25% of the Fund’s average net assets attributable to Institutional Class shares, until January 31, 2025. This expense limitation and fee waiver agreement may be terminated by the Adviser at any time after January 31, 2025, upon 15 days prior notice to the Fund and its administrator. The Adviser may recoup from the Fund (or share class as applicable) any fees previously waived and/or expenses previously reimbursed by the Adviser with respect to the Fund or share class, as applicable, including any applicable waivers which may apply to a specific share class, pursuant to this agreement (including waivers or reimbursements under previous expense limitations), if (1) such recoupment by the Adviser does not cause the Fund’s share class, at the time of recoupment, to exceed the lesser of (a) the expense limitation in effect at the time the relevant amount was waived and/or reimbursed, or (b) the expense limitation in effect at the time of the proposed recoupment, (2) the recoupment is made within three years after the fiscal year end date as of which the amount to be waived or reimbursed was determined and the waiver or reimbursement occurred, and (3) the Adviser has not agreed to forego recoupment. In accordance with the Funds’ Multi-Class Plan, amounts eligible for recoupment from periods prior to the addition of the Institutional Class will continue to be eligible for recoupment from the Investor Class. |
| (1) | The performance data quoted here represent past performance, and past performance is not a guarantee of future results. Investment return and principal value of an investment will fluctuate so that an investor’s shares, when redeemed, may be worth more or less than their original cost. Current performance may be lower or higher than the performance information quoted. To obtain performance information current to the most recent month-end, please call 888-860-8686 or visit marsicofunds.com. |
The performance included in the chart and graph does not reflect the deduction of taxes on Fund distributions or the redemption of Fund shares.
All indices are unmanaged and investors cannot invest directly in an index.
The MSCI EAFE Index tracks the stocks of about 1,000 companies in Europe, Australasia, and the Far East (EAFE).
| (2) | Periodically, certain fees and expenses have been waived or reimbursed by the Adviser. In the absence of such a waiver or reimbursement, the performance returns reflected would have been reduced. In accordance with the expense limitation and fee waiver agreement, the Adviser may recoup fees and expenses previously waived or reimbursed under certain parameters. Periodically, the Adviser has recouped such fees or expenses, resulting in a lower performance return. |
| (3) | This chart assumes an initial investment of $10,000 made on March 31, 2014 in the Investor Class shares of the Fund. Total returns are based on net change in NAV, assuming reinvestment of distributions. |
| (4) | Institutional Class shares commenced operations on December 6, 2021. The performance attributed to the Institutional Class shares prior to that date is that of the Investor Class shares. Performance prior to December 6, 2021 has not been adjusted to reflect the lower expenses of the Institutional Class shares. During this period, Institutional Class shares would have had returns similar to, but potentially higher than, Investor Class shares due to the fact that Institutional Class shares represent interests in the same portfolio as Investor Class shares but are typically subject to lower expenses than the Investor Class shares. |
| (5) | Sector weightings represent the percentage of the Fund’s investments (excluding cash equivalents) in certain general sectors. These sectors may include more than one industry. The Fund’s portfolio composition is subject to change at any time. |
22
MARSICO INTERNATIONAL OPPORTUNITIES FUND
SCHEDULE OF INVESTMENTS
As of March 31, 2024 (Unaudited)
| | | Number
of
Shares/
Warrants | | | Value | | | Percent
of Net
Assets | |
| COMMON STOCKS |
| Aerospace & Defense | | | | | | | | | | | | |
| Airbus S.E. | | | 9,033 | | | $ | 1,663,709 | | | | 3.47 | % |
| Rolls-Royce Holdings PLC* | | | 384,790 | | | | 2,072,323 | | | | 4.32 | |
| Safran S.A. | | | 8,140 | | | | 1,844,625 | | | | 3.85 | |
| | | | | | | | 5,580,657 | | | | 11.64 | |
| Apparel, Accessories & Luxury Goods | | | | | | | | | | | | |
| Hermes International | | | 568 | | | | 1,449,853 | | | | 3.02 | |
| | | | | | | | | | | | | |
| Application Software | | | | | | | | | | | | |
| Constellation Software, Inc. | | | 306 | | | | 835,850 | | | | 1.75 | |
| SAP S.E. | | | 13,737 | | | | 2,674,446 | | | | 5.58 | |
| Synopsys, Inc.* | | | 1,587 | | | | 906,970 | | | | 1.89 | |
| | | | | | | | 4,417,266 | | | | 9.22 | |
| Automobile Manufacturers | | | | | | | | | | | | |
| Ferrari N.V. | | | 3,733 | | | | 1,627,364 | | | | 3.40 | |
| | | | | | | | | | | | | |
| Broadline Retail | | | | | | | | | | | | |
| Amazon.com, Inc.* | | | 7,723 | | | | 1,393,075 | | | | 2.91 | |
| | | | | | | | | | | | | |
| Homebuilding | | | | | | | | | | | | |
| Toll Brothers, Inc. | | | 7,465 | | | | 965,747 | | | | 2.02 | |
| | | | | | | | | | | | | |
| Industrial Gases | | | | | | | | | | | | |
| Air Liquide S.A. | | | 4,757 | | | | 989,672 | | | | 2.06 | |
| | | | | | | | | | | | | |
| Integrated Oil & Gas | | | | | | | | | | | | |
| TotalEnergies S.E. | | | 26,457 | | | | 1,811,633 | | | | 3.78 | |
| | | | | | | | | | | | | |
| Interactive Home Entertainment | | | | | | | | | | | | |
| Nintendo Co., Ltd. | | | 32,900 | | | | 1,794,960 | | | | 3.74 | |
| | | | | | | | | | | | | |
| Interactive Media & Services | | | | | | | | | | | | |
| Meta Platforms, Inc. - Cl. A | | | 4,344 | | | | 2,109,359 | | | | 4.40 | |
| | | | | | | | | | | | | |
| Internet Services & Infrastructure | | | | | | | | | | | | |
| Shopify, Inc. - Cl. A* | | | 21,248 | | | | 1,639,708 | | | | 3.42 | |
| | | | | | | | | | | | | |
| Movies & Entertainment | | | | | | | | | | | | |
| Netflix, Inc.* | | | 2,036 | | | | 1,236,524 | | | | 2.58 | |
| Spotify Technology S.A.* | | | 8,100 | | | | 2,137,590 | | | | 4.46 | |
| | | | | | | | 3,374,114 | | | | 7.04 | |
| Pharmaceuticals | | | | | | | | | | | | |
| Eli Lilly & Company | | | 2,364 | | | | 1,839,097 | | | | 3.84 | |
| Novo Nordisk A/S - Cl. B | | | 20,592 | | | | 2,624,837 | | | | 5.47 | |
| | | | | | | | 4,463,934 | | | | 9.31 | |
| Real Estate Services | | | | | | | | | | | | |
| FirstService Corp. | | | 3,400 | | | | 562,881 | | | | 1.17 | |
| | | | | | | | | | | | | |
| Restaurants | | | | | | | | | | | | |
| Chipotle Mexican Grill, Inc.* | | | 388 | | | | 1,127,827 | | | | 2.35 | |
| | | | | | | | | | | | | |
| Semiconductor Materials & Equipment | | | | | | | | | | | | |
| ASML Holding N.V. | | | 2,897 | | | | 2,788,507 | | | | 5.82 | |
| | | | | | | | | | | | | |
| Semiconductors | | | | | | | | | | | | |
| NVIDIA Corp. | | | 3,010 | | | | 2,719,716 | | | | 5.67 | |
| Taiwan Semiconductor Manufacturing Co., Ltd. Spon. ADR | | | 19,266 | | | | 2,621,139 | | | | 5.47 | |
| | | | | | | | 5,340,855 | | | | 11.14 | |
| Soft Drinks & Non-alcoholic Beverages | | | | | | | | | | | | |
| Coca-Cola Europacific Partners PLC | | | 18,288 | | | | 1,279,246 | | | | 2.67 | |
| | | | | | | | | | | | | |
| Systems Software | | | | | | | | | | | | |
| Microsoft Corp. | | | 3,458 | | | | 1,454,850 | | | | 3.04 | |
| | | | | | | | | | | | | |
| Technology Hardware, Storage & Peripherals | | | | | | | | | | | | |
| Apple, Inc. | | | 3,768 | | | | 646,137 | | | | 1.35 | |
| | | | | | | | | | | | | |
| TOTAL COMMON STOCKS | | | | | | | | | | | | |
| (Cost $28,240,629) | | | | | | | 44,817,645 | | | | 93.50 | |
| | | | | | | | | | | | | |
| WARRANTS | | | | | | | | | | | | |
| Application Software | | | | | | | | | | | | |
| Constellation Software, Inc., Expiration Date: March 31, 2040*@^ | | | 306 | | | | 0 | | | | 0.00 | |
| | | | | | | | | | | | | |
| TOTAL WARRANTS | | | | | | | | | | | | |
| (Cost $0) | | | | | | | 0 | | | | 0.00 | |
| | | | | | | | | | | | | |
| SHORT-TERM INVESTMENTS | | | | | | | | | | | | |
| State Street Institutional Treasury Money Market Fund - Premier Class, 5.24%# | | | 3,226,126 | | | | 3,226,126 | | | | 6.73 | |
| | | | | | | | | | | | | |
| TOTAL SHORT-TERM INVESTMENTS | | | | | | | | | | | | |
| (Cost $3,226,126) | | | | | | | 3,226,126 | | | | 6.73 | |
| | | | | | | | | | | | | |
| TOTAL INVESTMENTS | | | | | | | | | | | | |
| (Cost $31,466,755) | | | | | | | 48,043,771 | | | | 100.23 | |
| | | | | | | | | | | | | |
| Liabilities, Less Cash and Other Assets | | | | | | | (108,390 | ) | | | (0.23 | ) |
| | | | | | | | | | | | | |
| NET ASSETS | | | | | | $ | 47,935,381 | | | | 100.00 | % |
23
MARSICO INTERNATIONAL OPPORTUNITIES FUND
SCHEDULE OF INVESTMENTS (continued)
As of March 31, 2024 (Unaudited)
SUMMARY OF INVESTMENTS BY COUNTRY
| Country | | Market Value | | | Percent of
Investment
Securities | |
| Canada | | $ | 3,038,439 | | | | 6.32 | % |
| Denmark | | | 2,624,837 | | | | 5.46 | |
| France | | | 7,759,492 | | | | 16.15 | |
| Germany | | | 2,674,446 | | | | 5.57 | |
| Italy | | | 1,627,364 | | | | 3.39 | |
| Japan | | | 1,794,960 | | | | 3.74 | |
| Netherlands | | | 2,788,507 | | | | 5.80 | |
| Sweden | | | 2,137,590 | | | | 4.45 | |
| Taiwan | | | 2,621,139 | | | | 5.46 | |
| United Kingdom | | | 3,351,569 | | | | 6.98 | |
| United States(1) | | | 17,625,428 | | | | 36.68 | |
| | | $ | 48,043,771 | | | | 100.00 | % |
| (1) | Includes short-term securities. |
SUMMARY OF FAIR VALUE MEASUREMENTS
The following is a summary of the fair values of the Fund’s investments according to the valuation inputs utilized as of March 31, 2024.
Fund Investment by
Major Security Type | | Level 1 -
Quoted Prices | | | Level 2 -
Other Significant
Observable Inputs | | | Level 3 -
Significant
Unobservable Inputs | | | Total | |
| | | | | | | | | | | | | |
| Assets |
| Common Stocks | | $ | 44,817,645 | | | $ | — | | | $ | — | | | $ | 44,817,645 | |
| Warrants | | | | | | | | | | | | | | | | |
| Information Technology | | | — | | | | — | | | | — | ** | | | — | |
| Short-term Investments | | | 3,226,126 | | | | — | | | | — | | | | 3,226,126 | |
| | | $ | 48,043,771 | | | $ | — | | | $ | — | | | $ | 48,043,771 | |
| ** | Constellation Software, Inc. warrants represent the only Level 3 security held by the Fund. |
For more information on investment valuation and valuation inputs, refer to Note 2(a) in the Notes to Financial Statements.
| @ | Security valued at fair value using significant unobservable inputs as determined in good faith by the Adviser, as the Fund’s Board of Trustees’ valuation designee. As of March 31, 2024, the total value of Level 3 securities was $0, which represents 0.00% of the Fund’s net assets. |
| ^ | As of March 31, 2024, certain information for the security, such as the strike price, is pending announcement by the issuer. |
| # | Rate shown is the 7-day yield as of March 31, 2024. |
See notes to financial statements.
24
INVESTMENT REVIEW BY TOM MARSICO, PETER MARSICO, AND JIMMY MARSICO (UNAUDITED)
The Marsico Global Fund’s(1),(2) Investor Class shares and Institutional Class shares posted total returns of (US$) +36.99%(3),(4),(5) and +37.16%,(3),(4),(5) respectively, for the six-month fiscal period ended March 31, 2024. The Fund outperformed its benchmark index,(2) the MSCI All Country World Index (“MSCI ACWI Index”), which had a total return of (US$) +20.14% over the same period. Please see the Fund’s Overview for more detailed information about the Fund’s longer-term performance for various time periods ended March 31, 2024.
The Global Fund’s outperformance during the six-month fiscal period ended March 31, 2024, as compared to the MSCI ACWI Index, can be primarily attributed to stock selection and an overweight allocation to the strongest-performing sector of the benchmark index, Information Technology, as defined in the Global Industry Classification Standard (“GICS”).(6) Stock selection in the Communication Services, Consumer Discretionary, and Health Care sectors was also strong. The Fund’s relative performance was also bolstered by abstaining from investment in the weakest-performing sector of the benchmark index, Energy.
Information Technology holding NVIDIA Corp. (“NVIDIA”) (+108%) was a top contributor to the Fund’s performance during the period partly due to an improved spending outlook from NVIDIA’s cloud services customers as well as generally more enthusiasm around the utility of generative artificial intelligence (“GenAI”). NVIDIA is a market leader in GenAI hardware and software and stands to benefit from the adoption of new GenAI applications, which are being announced almost daily, by consumers and enterprises. In addition, NVIDIA surpassed consensus expectations when it reported quarterly earnings in both November and February. Further, in late March, NVIDIA hosted NVIDIA GTC, its annual graphics processing unit technology conference, where it launched the latest datacenter business hardware family called Blackwell. NVIDIA’s CEO Jensen Huang claimed Blackwell is 4x faster at artificial intelligence (“AI”) training and 30x faster at AI inference than the prior generation. We believe that NVIDIA’s lead over the competition in AI hardware and services is widening as a result of these factors.
In the Communication Services sector, Meta Platforms, Inc. – Cl. A (“Meta”) (+62%) was a top contributor to the Fund’s performance during the period as the company continues to generate stronger revenue and free cash flow growth compared to 2022. Meta is also at the forefront of building out its AI infrastructure, which is leading to improved engagement on its core product offerings. With higher levels of engagement, we believe that Meta will be able to continue to realize consistent revenue growth and better returns on capital than in previous periods.
On the negative side, an underweight allocation to one of the stronger-performing sectors of the benchmark index, Financials, coupled with weak stock selection therein, detracted from the Fund’s performance results relative to the index. Further, an overweight allocation to one of the benchmark index’s weaker-performing sectors, Consumer Discretionary, created an additional headwind. Lastly, as the benchmark index advanced +20% during the period, Fund results were hindered by maintaining an average cash position of approximately 3%.
In the Financials sector, Blackstone, Inc. (“Blackstone”) (-3%, prior to being sold) detracted from the Fund’s performance during the period partly as a result of the potential for higher long-term interest rates, as indicated by the yield on the U.S. 10-year Treasury note having moved higher during the period. Blackstone was sold during the period as we believe the real estate market will be more challenging than we previously anticipated given the expected increase in supply coming online within the multifamily market, which may stunt rental growth and the investment performance of products tied to multifamily real estate. Further, as noted above, longer term rates could potentially stay higher for longer, which we believe may lead to a more challenging fundraising environment for real estate funds. In turn, these circumstances would likely dampen Blackstone’s future performance fees and fundraising efforts in their real estate asset class.
Consumer Discretionary holding Mobileye Global, Inc. – Cl. A (“Mobileye”) (-28%, prior to being sold) was a detractor from the Fund’s performance during the period as investor concerns have grown related to anticipated sales levels throughout 2024. Mobileye has communicated that there is an excess inventory of its core EyeQ chipsets for advanced driving assistance systems (ADAS) at its tier-1 auto supplier customers. Many of these customers built up inventory coming out of the extreme component shortages of the first two years of the pandemic, and when the global automotive industry began to slow in recent months these suppliers decided to reduce that inventory. This inventory reduction by Mobileye’s customers has contributed to much-lower sales expectations for 2024, particularly in the first half of the year. While we believe Mobileye possesses differentiated technology in ADAS and eventual autonomous driving systems, we decided to exit the position until we have more clarity on the inventory situation and overall automotive end-market health.
Although active currency management is not a central facet of the Global Fund’s investment process, fluctuations in major world currencies can at times affect the Fund’s performance. During the period, the net effect of currency moves had a small, positive impact on Fund performance.
There were several sector adjustments made to the Fund during the reporting period. The Fund increased its exposure to the Industrials and Information Technology sectors and reduced its exposure to the Consumer Discretionary, Health Care, Consumer Staples, and Communication Services sectors. Further, the Fund bought and sold its sole Financials position during the period, and continued to have no exposure to the Energy, Materials, Real Estate, and Utilities sectors.
25
Fiscal Period-End Investment Posture
As of March 31, 2024, the Fund’s primary economic sector allocations included Information Technology, Consumer Discretionary, Industrials, Communication Services, and Health Care. At period end, the Fund had no investments in the Energy, Financials, Materials, Real Estate or Utilities sectors.
The Fund’s most significant country allocation weightings at period-end, excluding short-term investments, were in the United States, France, Denmark, and the Netherlands. Country-level weightings generally should be considered a residual of the Fund’s stock selection process rather than a major, proactive facet of its investment strategy.
Sincerely,
THOMAS F. MARSICO
PETER C. MARSICO
JAMES D. MARSICO
PORTFOLIO MANAGERS
| (1) | Foreign investments present additional risks due to currency fluctuations, economic and political factors, lower liquidity, differences in securities regulations and accounting standards, possible changes in taxation, limited public information, and other factors. In addition, the Fund is subject to broad risks associated with investing in equity securities markets generally, including, without limitation, the risks that the securities and markets in which it invests may experience volatility and instability, that domestic and global economies and markets may undergo periods of cyclical change and decline, that investors may at times avoid investments in equity securities, and that Marsico Capital Management, LLC (the “Adviser”) may select investments for the Fund that do not perform as anticipated. Please see the Prospectus for more information. |
| (2) | The Fund is not managed to track its benchmark index, and may hold a substantially overweight or underweight position in a sector, industry, or security compared to its weight in the benchmark. The Fund may be subject to risks associated with a particular sector or industry in which it is overweight, including the risk that the stocks of companies within one sector or industry could simultaneously decline in price because of an event that affects the entire sector or industry. For informational purposes, the discussion below may compare the benchmark weight or performance of a sector or industry to the investment approach of the Fund. |
| (3) | The performance data quoted here represent past performance, and past performance is not a guarantee of future results. Investment return and principal value of an investment will fluctuate so that an investor’s shares, when redeemed, may be worth more or less than their original cost. Current performance may be lower or higher than the performance information quoted. To obtain performance information current to the most recent month-end, please call 888-860-8686 or visit marsicofunds.com. |
| (4) | This review highlights Fund performance over a six-month fiscal period. Shareholders should keep in mind that the Fund is intended for long-term investors who hold their shares for substantially longer periods of time. You should also keep in mind that our current views and beliefs regarding all investments discussed in this report are subject to change at any time. References to specific securities, industries, and sectors discussed in this report are not recommendations to buy or sell such securities or related investments, and the Fund may not necessarily hold these securities or investments today due to the active management of the Fund. Please see the accompanying Schedule of Investments for the percentage of the Fund’s portfolio represented by the securities mentioned in this report as of the end of the reporting period. |
| (5) | Total returns are based on net change in net asset value assuming reinvestment of distributions. Periodically, certain fees and expenses have been waived or reimbursed by the Adviser. In the absence of such a waiver or reimbursement, the performance returns reflected would have been reduced. In accordance with the expense limitation and fee waiver agreement, the Adviser may recoup fees and expenses previously waived or reimbursed under certain parameters. Periodically, the Adviser has recouped such fees or expenses, resulting in a lower performance return. Please see the Prospectus for more information. |
| (6) | Regarding GICS data cited throughout this report, the Global Industry Classification Standard was developed by and is the exclusive property and service mark of MSCI Inc. (“MSCI”) and Standard & Poor’s (“S&P”) and is licensed for use by the Adviser. Neither MSCI, S&P, nor the Adviser or any third party involved in compiling GICS makes any express or implied warranties or representations with respect to such standard or classification (or the results from use thereof), and all such parties hereby expressly disclaim all warranties of originality, accuracy, completeness, merchantability and fitness for a particular purpose with respect to any such standard or classification. MSCI, S&P, the Adviser, and any of their affiliates or third parties involved in compiling GICS shall not have any liability for any direct, indirect, special, punitive, consequential or any other damages (including lost profits) even if notified of the possibility of such damages. |
26
March 31, 2024 (Unaudited)
The Global Fund is a diversified mutual fund and invests primarily in the common stocks of US and foreign companies that are selected for their long-term growth potential. The Fund may invest in an unlimited number of companies of any size that are economically tied to any countries or markets throughout the world, including securities of companies economically tied to emerging markets. Under normal market conditions, the Fund will invest significantly (generally, at least 40% of its net assets) in the securities of issuers organized or located outside the US, doing business outside the US, or other foreign securities (unless market conditions are not deemed favorable by the Adviser, in which case the Fund generally will invest at least 30% of its net assets in such foreign securities). The Fund will invest its assets in various regions and countries, including the US, which encompass not less than three different countries overall.
| | | INVESTOR CLASS | | | INSTITUTIONAL CLASS | |
| | TOTAL ANNUAL OPERATING EXPENSES* | 1.55% | | TOTAL ANNUAL OPERATING EXPENSES* | 1.29% | |
| | NET EXPENSES* † | 1.50% | | NET EXPENSES* † | 1.25% | |
GROWTH OF $10,000(1)(2)(3) | PERFORMANCE COMPARISON(1)(2) |
| | Average Annualized Returns |
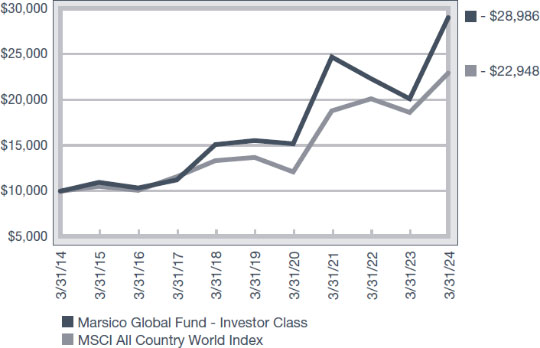
| 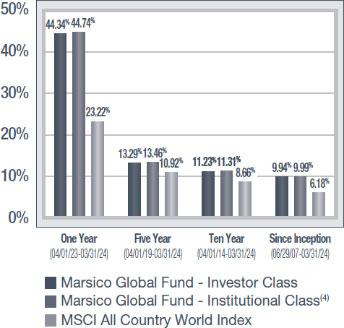
|
SECTOR ALLOCATION(5) | TOP FIVE HOLDINGS |
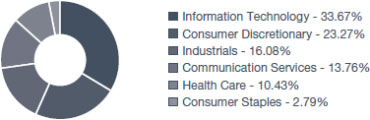
| | | | |
| | META PLATFORMS, INC. - CL. A | 6.75% | |
| | NVIDIA CORP. | 5.83% | |
| | ELI LILLY & COMPANY | 4.74% | |
| | AMAZON.COM, INC. | 4.66% | |
| | NOVO NORDISK A/S - CL. B | 4.63% | |
| | | | |
* | The Total Annual Operating Expenses and Net Expenses are reflective of the information disclosed in the Funds’ Prospectus dated January 31, 2024 and may differ from the expense ratios disclosed in this report. |
† | Marsico Capital Management, LLC (the “Adviser”) has entered into a written expense limitation and fee waiver agreement under which it has agreed (i) to limit the total expenses of the Investor Class of the Fund (excluding taxes, interest, acquired fund fees and expenses, litigation, extraordinary expenses, and brokerage and other transaction expenses relating to the purchase or sale of portfolio investments) to an annual rate of 1.50% of the Fund’s average net assets attributable to Investor Class shares, and (ii) to limit the total expenses of the Institutional Class of the Fund (excluding taxes, interest, acquired fund fees and expenses, litigation, extraordinary expenses, and brokerage and other transaction expenses relating to the purchase or sale of portfolio investments) to an annual rate of 1.25% of the Fund’s average net assets attributable to Institutional Class shares, until January 31, 2025. This expense limitation and fee waiver agreement may be terminated by the Adviser at any time after January 31, 2025, upon 15 days prior notice to the Fund and its administrator. The Adviser may recoup from the Fund (or share class as applicable) any fees previously waived and/or expenses previously reimbursed by the Adviser with respect to the Fund or share class, as applicable, including any applicable waivers which may apply to a specific share class, pursuant to this agreement (including waivers or reimbursements under previous expense limitations), if (1) such recoupment by the Adviser does not cause the Fund’s share class, at the time of recoupment, to exceed the lesser of (a) the expense limitation in effect at the time the relevant amount was waived and/or reimbursed, or (b) the expense limitation in effect at the time of the proposed recoupment, (2) the recoupment is made within three years after the fiscal year end date as of which the amount to be waived or reimbursed was determined and the waiver or reimbursement occurred, and (3) the Adviser has not agreed to forego recoupment. |
(1) | The performance data quoted here represent past performance, and past performance is not a guarantee of future results. Investment return and principal value of an investment will fluctuate so that an investor’s shares, when redeemed, may be worth more or less than their original cost. Current performance may be lower or higher than the performance information quoted. To obtain performance information current to the most recent month-end, please call 888-860-8686 or visit marsicofunds.com. |
| The performance included in the chart and graph does not reflect the deduction of taxes on Fund distributions or the redemption of Fund shares. |
| All indices are unmanaged and investors cannot invest directly in an index. |
| The MSCI ACWI (All Country World Index) Index is a free float-adjusted market capitalization index that is designed to measure equity market performance in the global developed and emerging markets. |
(2) | Periodically, certain fees and expenses have been waived or reimbursed by the Adviser. In the absence of such a waiver or reimbursement, the performance returns reflected would have been reduced. In accordance with the expense limitation and fee waiver agreement, the Adviser may recoup fees and expenses previously waived or reimbursed under certain parameters. Periodically, the Adviser has recouped such fees or expenses, resulting in a lower performance return. |
(3) | This chart assumes an initial investment of $10,000 made on March 31, 2014 in the Investor Class shares of the Fund. Total returns are based on net change in NAV, assuming reinvestment of distributions. |
(4) | Institutional Class shares commenced operations on December 6, 2021. The performance attributed to the Institutional Class shares prior to that date is that of the Investor Class shares. Performance prior to December 6, 2021 has not been adjusted to reflect the lower expenses of the Institutional Class shares. During this period, Institutional Class shares would have had returns similar to, but potentially higher than, Investor Class shares due to the fact that Institutional Class shares represent interests in the same portfolio as Investor Class shares but are typically subject to lower expenses than the Investor Class shares. |
(5) | Sector weightings represent the percentage of the Fund’s investments (excluding cash equivalents) in certain general sectors. These sectors may include more than one industry. The Fund’s portfolio composition is subject to change at any time. |
27
MARSICO GLOBAL FUND
SCHEDULE OF INVESTMENTS
As of March 31, 2024 (Unaudited)
| | | Number
of
Shares | | | Value | | | Percent
of Net
Assets | |
| COMMON STOCKS | | | | | | | | | | | | |
| Aerospace & Defense | | | | | | | | | | | | |
| Airbus S.E. | | | 37,351 | | | $ | 6,879,354 | | | | 2.83 | % |
| Rolls-Royce Holdings PLC* | | | 1,711,420 | | | | 9,217,012 | | | | 3.79 | |
| Safran S.A. | | | 35,421 | | | | 8,026,838 | | | | 3.30 | |
| | | | | | | | 24,123,204 | | | | 9.92 | |
| Apparel, Accessories & Luxury Goods | | | | | | | | | | | | |
| Hermes International | | | 4,121 | | | | 10,519,095 | | | | 4.33 | |
| LVMH Moet Hennessy Louis Vuitton S.E. | | | 5,130 | | | | 4,614,113 | | | | 1.90 | |
| | | | | | | | 15,133,208 | | | | 6.23 | |
| Application Software | | | | | | | | | | | | |
| SAP S.E. Spon. ADR | | | 46,294 | | | | 9,028,719 | | | | 3.71 | |
| Synopsys, Inc.* | | | 14,289 | | | | 8,166,163 | | | | 3.36 | |
| | | | | | | | 17,194,882 | | | | 7.07 | |
| Automobile Manufacturers | | | | | | | | | | | | |
| Ferrari N.V. | | | 10,039 | | | | 4,376,402 | | | | 1.80 | |
| | | | | | | | | | | | | |
| Automotive Retail | | | | | | | | | | | | |
| O’Reilly Automotive, Inc.* | | | 5,638 | | | | 6,364,625 | | | | 2.62 | |
| | | | | | | | | | | | | |
| Broadline Retail | | | | | | | | | | | | |
| Amazon.com, Inc.* | | | 62,761 | | | | 11,320,829 | | | | 4.66 | |
| | | | | | | | | | | | | |
| Consumer Staples Merchandise Retail | | | | | | | | | | | | |
| Costco Wholesale Corp. | | | 8,334 | | | | 6,105,738 | | | | 2.51 | |
| | | | | | | | | | | | | |
| Homebuilding | | | | | | | | | | | | |
| Toll Brothers, Inc. | | | 34,338 | | | | 4,442,307 | | | | 1.83 | |
| | | | | | | | | | | | | |
| Industrial Conglomerates | | | | | | | | | | | | |
| General Electric Company | | | 39,261 | | | | 6,891,483 | | | | 2.84 | |
| | | | | | | | | | | | | |
| Interactive Media & Services | | | | | | | | | | | | |
| Alphabet, Inc. - Cl. A* | | | 41,677 | | | | 6,290,310 | | | | 2.59 | |
| Meta Platforms, Inc. - Cl. A | | | 33,816 | | | | 16,420,373 | | | | 6.75 | |
| | | | | | | | 22,710,683 | | | | 9.34 | |
| Internet Services & Infrastructure | | | | | | | | | | | | |
| Shopify, Inc. - Cl. A* | | | 75,518 | | | | 5,827,724 | | | | 2.40 | |
| | | | | | | | | | | | | |
| Movies & Entertainment | | | | | | | | | | | | |
| Spotify Technology S.A.* | | | 27,809 | | | | 7,338,795 | | | | 3.02 | |
| | | | | | | | | | | | | |
| Passenger Ground Transportation | | | | | | | | | | | | |
| Uber Technologies, Inc.* | | | 53,322 | | | | 4,105,261 | | | | 1.69 | |
| | | | | | | | | | | | | |
| Pharmaceuticals | | | | | | | | | | | | |
| Eli Lilly & Company | | | 14,804 | | | | 11,516,920 | | | | 4.74 | |
| Novo Nordisk A/S - Cl. B | | | 88,386 | | | | 11,266,455 | | | | 4.63 | |
| | | | | | | | 22,783,375 | | | | 9.37 | |
| Restaurants | | | | | | |
| Chipotle Mexican Grill, Inc.* | | | 3,167 | | | | 9,205,741 | | | | 3.79 | |
| | | | | | | | | | | | | |
| Semiconductor Materials & Equipment | | | | | | | | | | | | |
| ASML Holding N.V. - NY Reg. Shs. | | | 11,333 | | | | 10,998,337 | | | | 4.52 | |
| | | | | | | | | | | | | |
| Semiconductors | | | | | | | | | | | | |
| NVIDIA Corp. | | | 15,676 | | | | 14,164,207 | | | | 5.83 | |
| Taiwan Semiconductor Manufacturing Co., Ltd. Spon. ADR | | | 56,103 | | | | 7,632,813 | | | | 3.14 | |
| | | | | | | | 21,797,020 | | | | 8.97 | |
| Systems Software | | | | | | | | | | | | |
| Microsoft Corp. | | | 25,861 | | | | 10,880,240 | | | | 4.48 | |
| | | | | | | | | | | | | |
| Technology Hardware, Storage & Peripherals | | | | | | | | | | | | |
| Apple, Inc. | | | 39,903 | | | | 6,842,567 | | | | 2.81 | |
| | | | | | | | | | | | | |
| TOTAL COMMON STOCKS | | | | | | | | | | | | |
| (Cost $115,115,447) | | | | | | | 218,442,421 | | | | 89.87 | |
| | | | | | | | | | | | | |
| SHORT-TERM INVESTMENTS | | | | | | | | | | | | |
| State Street Institutional Treasury Money Market Fund - Premier Class, 5.24%# | | | 25,196,662 | | | | 25,196,662 | | | | 10.37 | |
| | | | | | | | | | | | | |
| TOTAL SHORT-TERM INVESTMENTS | | | | | | | | | | | | |
| (Cost $25,196,662) | | | | | | | 25,196,662 | | | | 10.37 | |
| | | | | | | | | | | | | |
| TOTAL INVESTMENTS | | | | | | | | | | | | |
| Cost $140,312,109) | | | | | | | 243,639,083 | | | | 100.24 | |
| | | | | | | | | | | | | |
| Liabilities, Less Cash and Other Assets | | | | | | | (591,581 | ) | | | (0.24 | ) |
| | | | | | | | | | | | | |
| NET ASSETS | | | | | | $ | 243,047,502 | | | | 100.00 | % |
28
SUMMARY OF INVESTMENTS BY COUNTRY
| Country | | Market Value | | | Percent of
Investment
Securities | |
| Canada | | $ | 5,827,724 | | | | 2.39 | % |
| Denmark | | | 11,266,455 | | | | 4.62 | |
| France | | | 30,039,400 | | | | 12.33 | |
| Germany | | | 9,028,719 | | | | 3.71 | |
| Italy | | | 4,376,402 | | | | 1.80 | |
| Netherlands | | | 10,998,337 | | | | 4.52 | |
| Sweden | | | 7,338,795 | | | | 3.01 | |
| Taiwan | | | 7,632,813 | | | | 3.13 | |
| United Kingdom | | | 9,217,012 | | | | 3.78 | |
United States(1) | | | 147,913,426 | | | | 60.71 | |
| | | $ | 243,639,083 | | | | 100.00 | % |
(1) | Includes short-term securities. |
SUMMARY OF FAIR VALUE MEASUREMENTS
As of March 31, 2024, all investments disclosed in the preceding Schedule of Investments were classified as Level 1.
For more information on investment valuation and valuation inputs, refer to Note 2(a) in the Notes to Financial Statements.
# | Rate shown is the 7-day yield as of March 31, 2024. |
| See notes to financial statements. |
29
STATEMENTS OF ASSETS AND LIABILITIES
March 31, 2024 (Unaudited)
| (Amounts in thousands) | | MARSICO
FOCUS FUND | | | MARSICO
GROWTH FUND | |
| | | | | | | |
| ASSETS |
| Investments, at value (cost $466,508, $235,111, $173,393, $31,467, and $140,312, respectively) | | $ | 965,155 | | | $ | 418,731 | |
| Cash | | | — | | | | — | |
| Foreign currency (cost $0, $0, $0, $0, and $215, respectively) | | | — | | | | — | |
| Receivable for capital stock sold | | | 520 | | | | 4 | |
| Dividends receivable | | | 437 | | | | 179 | |
| Prepaid expenses and other assets | | | 3,551 | | | | 1,519 | |
| Total Assets | | | 969,663 | | | | 420,433 | |
| | | | | | | | | |
| LIABILITIES | | | | | | | | |
| Payable for investments purchased | | | — | | | | — | |
| Payable for capital stock redeemed | | | 683 | | | | 122 | |
| Due to custodian | | | 11 | | | | 7 | |
| Payable to investment adviser | | | 588 | | | | 274 | |
| Accrued trustees’ fees | | | 3,559 | | | | 1,503 | |
| Accrued distribution fee | | | 2,388 | | | | 1,936 | |
| Accrued transfer agent fees and expenses | | | 107 | | | | 60 | |
| Accrued fund administration fees | | | 65 | | | | 44 | |
| Accrued expenses and other liabilities | | | 223 | | | | 114 | |
| Total Liabilities | | | 7,624 | | | | 4,060 | |
| | | | | | | | | |
| NET ASSETS | | $ | 962,039 | | | $ | 416,373 | |
| | | | | | | | | |
| NET ASSETS CONSIST OF | | | | | | | | |
| Paid-in-capital | | $ | 453,168 | | | $ | 224,154 | |
| Total distributable earnings | | | 508,871 | | | | 192,219 | |
| NET ASSETS | | $ | 962,039 | | | $ | 416,373 | |
| | | | | | | | | |
| | | | | | | | | |
| | | | | | | | | |
| | | | | | | | | |
| NET ASSET VALUE INFORMATION BY CLASS | | | | | | | | |
| | | | | | | | | |
| INVESTOR CLASS: | | | | | | | | |
| Net Assets | | $ | 804,455 | | | $ | 376,471 | |
| Shares Outstanding, $0.001 par value (Unlimited shares authorized) | | | 30,454 | | | | 16,050 | |
| NET ASSET VALUE, REDEMPTION PRICE, AND OFFERING PRICE PER SHARE (NET ASSETS/SHARES OUTSTANDING)* | | $ | 26.42 | | | $ | 23.46 | |
| | | | | | | | | |
| INSTITUTIONAL CLASS: | | | | | | | | |
| Net Assets | | $ | 157,584 | | | $ | 39,902 | |
| Shares Outstanding, $0.001 par value (Unlimited shares authorized) | | | 5,925 | | | | 1,691 | |
| NET ASSET VALUE, REDEMPTION PRICE, AND OFFERING PRICE PER SHARE (NET ASSETS/SHARES OUTSTANDING)* | | $ | 26.60 | | | $ | 23.59 | |
| * | Not in thousands, based on unrounded net assets and shares outstanding. |
See notes to financial statements.
30
MARSICO
MIDCAP GROWTH
FOCUS FUND | | | MARSICO
INTERNATIONAL
OPPORTUNITIES
FUND | | | MARSICO
GLOBAL FUND | |
| | | | | |
| | | | | |
| $ | 286,943 | | | $ | 48,044 | | | $ | 243,639 | |
| | — | | | | — | | | | 1,052 | |
| | — | | | | — | | | | 216 | |
| | 11 | | | | — | | | | 13 | |
| | 58 | | | | 197 | | | | 195 | |
| | 1,315 | | | | 232 | | | | 901 | |
| | 288,327 | | | | 48,473 | | | | 246,016 | |
| | | | | | | | | | | |
| | | | | | | | | | | |
| | — | | | | — | | | | 1,275 | |
| | 30 | | | | 49 | | | | 310 | |
| | 7 | | | | 6 | | | | — | |
| | 191 | | | | 22 | | | | 151 | |
| | 1,305 | | | | 208 | | | | 887 | |
| | 652 | | | | 196 | | | | 194 | |
| | 52 | | | | 19 | | | | 40 | |
| | 44 | | | | 17 | | | | 43 | |
| | 105 | | | | 21 | | | | 68 | |
| | 2,386 | | | | 538 | | | | 2,968 | |
| | | | | | | | | | | |
| $ | 285,941 | | | $ | 47,935 | | | $ | 243,048 | |
| | | | | | | | | | | |
| | | | | | | | | | | |
| $ | 162,514 | | | $ | 31,391 | | | $ | 136,429 | |
| | 123,427 | | | | 16,544 | | | | 106,619 | |
| $ | 285,941 | | | $ | 47,935 | | | $ | 243,048 | |
| | | | | | | | | | | |
| | | | | | | | | | | |
| | | | | | | | | | | |
| | | | | | | | | | | |
| | | | | | | | | | | |
| | | | | | | | | | | |
| | | | | | | | | | | |
| $ | 257,448 | | | $ | 44,191 | | | $ | 175,067 | |
| | 6,020 | | | | 1,962 | | | | 7,722 | |
| $ | 42.77 | | | $ | 22.52 | | | $ | 22.67 | |
| | | | | | | | | | | |
| | | | | | | | | | | |
| $ | 28,493 | | | $ | 3,744 | | | $ | 67,981 | |
| | 662 | | | | 166 | | | | 2,976 | |
| $ | 43.01 | | | $ | 22.61 | | | $ | 22.85 | |
31
STATEMENTS OF OPERATIONS
FOR THE SIX-MONTH PERIOD ENDED March 31, 2024 (Unaudited)
| (Amounts in thousands) | | MARSICO
FOCUS FUND | | | MARSICO
GROWTH FUND | |
| | | | | | | |
| INVESTMENT INCOME | | | | | | | | |
| Dividends (net of $69, $19, $2, $18, and $32, respectively, of non-reclaimable foreign withholding taxes) | | $ | 3,496 | | | $ | 1,480 | |
| Total Investment Income | | | 3,496 | | | | 1,480 | |
| | | | | | | | | |
| EXPENSES | | | | | | | | |
| Investment advisory fees | | | 2,925 | | | | 1,367 | |
| Distribution fees: | | | | | | | | |
| Investor Class | | | 826 | | | | 393 | |
| Trustees’ fees and expenses | | | 346 | (1) | | | 107 | (1) |
| Transfer agent fees and expenses: | | | | | | | | |
| Investor Class | | | 292 | | | | 151 | |
| Institutional Class | | | 42 | | | | 13 | |
| Professional fees | | | 228 | | | | 100 | |
| Recoupment of previously waived expenses (Note 3) | | | 204 | | | | 42 | |
| Fund administration fees: | | | | | | | | |
| Investor Class | | | 75 | | | | 61 | |
| Institutional Class | | | 16 | | | | 8 | |
| Reporting, printing, and postage expenses | | | 65 | | | | 33 | |
| Custody and fund accounting fees | | | 62 | | | | 43 | |
| Federal and state registration fees | | | 25 | | | | 22 | |
| Other expenses | | | 48 | | | | 23 | |
| Total Expenses | | | 5,154 | | | | 2,363 | |
| Less waiver of expenses (Note 3) and expenses paid indirectly (Note 2(b)) | | | — | | | | — | |
| Net Expenses | | | 5,154 | | | | 2,363 | |
| | | | | | | | | |
| NET INVESTMENT LOSS | | | (1,658 | ) | | | (883 | ) |
| | | | | | | | | |
| REALIZED AND UNREALIZED GAIN (LOSS) | | | | | | | | |
| Net realized gain on investments | | | 22,076 | | | | 13,917 | |
| Net realized gain (loss) on foreign currency transactions | | | — | | | | — | |
| Change in unrealized appreciation on investments, foreign currency translations, and non-interested trustees’ deferred compensation | | | 217,436 | | | | 85,299 | |
| | | | | | | | | |
| Net Gain on Investments | | | 239,512 | | | | 99,216 | |
| | | | | | | | | |
| NET INCREASE IN NET ASSETS RESULTING FROM OPERATIONS | | $ | 237,854 | | | $ | 98,333 | |
| (1) | Amounts include Trustees’ fees and expenses and the mark to market unrealized appreciation during the period for shares held in the Non-Interested Trustees’ Deferred Fee Plan, as more fully described in Note 2(g) in the Notes to Financial Statements. |
| | | Trustees’
Fees and
Expenses* | | | Unrealized
Appreciation* | |
| Focus Fund | | $ | 102,425 | | | $ | 243,207 | |
| Growth Fund | | | 44,159 | | | | 62,916 | |
| Midcap Growth Focus Fund | | | 34,442 | | | | 35,939 | |
| International Opportunities Fund | | | 5,370 | | | | 5,907 | |
| Global Fund | | | 23,790 | | | | 41,084 | |
See notes to financial statements.
32
MARSICO
MIDCAP GROWTH
FOCUS FUND | | | MARSICO
INTERNATIONAL
OPPORTUNITIES
FUND | | | MARSICO
GLOBAL FUND | |
| | | | | |
| | | | | |
| $ | 766 | | | $ | 184 | | | $ | 659 | |
| | 766 | | | | 184 | | | | 659 | |
| | | | | | | | | | | |
| | | | | | | | | | | |
| | 1,029 | | | | 164 | | | | 723 | |
| | | | | | | | | | | |
| | 293 | | | | 47 | | | | 195 | |
| | 70 | (1) | | | 11 | (1) | | | 65 | (1) |
| | | | | | | | | | | |
| | 149 | | | | 33 | | | | 114 | |
| | 14 | | | | 6 | | | | 13 | |
| | 76 | | | | 15 | | | | 55 | |
| | — | | | | — | | | | 2 | |
| | | | | | | | | | | |
| | 57 | | | | 21 | | | | 53 | |
| | 7 | | | | 4 | | | | 10 | |
| | 28 | | | | 11 | | | | 23 | |
| | 45 | | | | 40 | | | | 47 | |
| | 18 | | | | 14 | | | | 16 | |
| | 23 | | | | 5 | | | | 14 | |
| | 1,809 | | | | 371 | | | | 1,330 | |
| | — | | | | (68 | ) | | | (5 | ) |
| | 1,809 | | | | 303 | | | | 1,325 | |
| | | | | | | | | | | |
| | (1,043 | ) | | | (119 | ) | | | (666 | ) |
| | | | | | | | | | | |
| | | | | | | | | | | |
| | 12,912 | | | | 1,911 | | | | 6,639 | |
| | 7 | | | | (729 | ) | | | 314 | |
| | 51,691 | | | | 11,234 | | | | 49,566 | |
| | | | | | | | | | | |
| | 64,610 | | | | 12,416 | | | | 56,519 | |
| | | | | | | | | | | |
| $ | 63,567 | | | $ | 12,297 | | | $ | 55,853 | |
33
STATEMENTS OF CHANGES IN NET ASSETS
| | | MARSICO
FOCUS FUND | | | MARSICO
GROWTH FUND | |
| | | | | | | |
| (Amounts in thousands) | | Six-Month
Period Ended
3/31/24
(Unaudited) | | | Year
Ended
9/30/23 | | | Six-Month
Period Ended
3/31/24
(Unaudited) | | | Year
Ended
9/30/23 | |
| | | | | | | | | | | | | |
| OPERATIONS: | | | | | | | | | | | | |
| Net investment income (loss) | | $ | (1,658 | ) | | $ | (3,899 | ) | | $ | (883 | ) | | $ | (1,650 | ) |
| Net realized gain on investments | | | 22,076 | | | | 15,227 | | | | 13,917 | | | | 9,528 | |
| Net realized gain (loss) on foreign currency transactions | | | — | | | | — | | | | — | | | | (333 | ) |
| Change in unrealized appreciation on investments, foreign currency translations, and non-interested trustees’ deferred compensation | | | 217,436 | | | | 135,018 | | | | 85,299 | | | | 54,959 | |
| Increase from payment by service provider | | | — | | | | — | | | | — | | | | — | |
| | | | | | | | | | | | | | | | | |
| Net increase in net assets resulting from operations | | | 237,854 | | | | 146,346 | | | | 98,333 | | | | 62,504 | |
| | | | | | | | | | | | | | | | | |
| DISTRIBUTIONS: | | | | | | | | | | | | | | | | |
| Investor Class | | | (13,561 | ) | | | (73,616 | ) | | | (5,168 | ) | | | — | |
| Institutional Class | | | (2,475 | ) | | | (10,950 | ) | | | (567 | ) | | | — | |
| | | | | | | | | | | | | | | | | |
| Total distributions | | | (16,036 | ) | | | (84,566 | ) | | | (5,735 | ) | | | — | |
| | | | | | | | | | | | | | | | | |
| CAPITAL SHARE TRANSACTIONS: | | | | | | | | | | | | | | | | |
| Investor Class: | | | | | | | | | | | | | | | | |
| Proceeds from sales of shares | | | 77,417 | | | | 20,304 | | | | 51,237 | | | | 19,901 | |
| Proceeds from reinvestment of distributions | | | 13,132 | | | | 70,749 | | | | 4,984 | | | | — | |
| Redemption of shares | | | (39,806 | ) | | | (74,241 | ) | | | (23,846 | ) | | | (38,686 | ) |
| | | | | | | | | | | | | | | | | |
| Net increase (decrease) from Investor Class capital share transactions | | | 50,743 | | | | 16,812 | | | | 32,375 | | | | (18,785 | ) |
| | | | | | | | | | | | | | | | | |
| Institutional Class: | | | | | | | | | | | | | | | | |
| Proceeds from sales of shares | | | 24,110 | | | | 26,512 | | | | 4,705 | | | | 4,348 | |
| Proceeds from reinvestment of distributions | | | 2,332 | | | | 9,085 | | | | 529 | | | | — | |
| Redemption of shares | | | (7,840 | ) | | | (29,195 | ) | | | (1,447 | ) | | | (4,844 | ) |
| | | | | | | | | | | | | | | | | |
| Net increase (decrease) from Institutional Class capital share transactions | | | 18,602 | | | | 6,402 | | | | 3,787 | | | | (496 | ) |
| | | | | | | | | | | | | | | | | |
| TOTAL INCREASE IN NET ASSETS | | | 291,163 | | | | 84,994 | | | | 128,760 | | | | 43,223 | |
| | | | | | | | | | | | | | | | | |
| NET ASSETS: | | | | | | | | | | | | | | | | |
| Beginning of Period | | | 670,876 | | | | 585,882 | | | | 287,613 | | | | 244,390 | |
| | | | | | | | | | | | | | | | | |
| End of Period | | $ | 962,039 | | | $ | 670,876 | | | $ | 416,373 | | | $ | 287,613 | |
| | | | | | | | | | | | | | | | | |
| TRANSACTIONS IN SHARES: | | | | | | | | | | | | | | | | |
| Investor Class: | | | | | | | | | | | | | | | | |
| Shares sold | | | 3,038 | | | | 946 | | | | 2,458 | | | | 1,119 | |
| Shares issued in reinvestment of distributions | | | 600 | | | | 4,466 | | | | 247 | | | | — | |
| Shares redeemed | | | (1,735 | ) | | | (4,052 | ) | | | (1,145 | ) | | | (2,493 | ) |
| | | | | | | | | | | | | | | | | |
| Net increase (decrease) from Investor Class share transactions | | | 1,903 | | | | 1,360 | | | | 1,560 | | | | (1,374 | ) |
| | | | | | | | | | | | | | | | | |
| Institutional Class: | | | | | | | | | | | | | | | | |
| Shares sold | | | 959 | | | | 1,579 | | | | 231 | | | | 256 | |
| Shares issued in reinvestment of distributions | | | 106 | | | | 572 | | | | 26 | | | | — | |
| Shares redeemed | | | (343 | ) | | | (1,570 | ) | | | (71 | ) | | | (280 | ) |
| | | | | | | | | | | | | | | | | |
| Net increase (decrease) from Institutional Class share transactions | | | 722 | | | | 581 | | | | 186 | | | | (24 | ) |
| (1) | Shares issued in reinvestment of distributions were less than one thousand shares. |
See notes to financial statements.
34
MARSICO
MIDCAP GROWTH
FOCUS FUND | | | MARSICO
INTERNATIONAL
OPPORTUNITIES FUND | | | MARSICO
GLOBAL FUND | |
| | | | | | | | |
Six-Month
Period Ended
3/31/24
(Unaudited) | | | Year
Ended
9/30/23 | | | Six-Month
Period Ended
3/31/24
(Unaudited) | | | Year
Ended
9/30/23 | | | Six-Month
Period Ended
3/31/24
(Unaudited) | | | Year
Ended
9/30/23 | |
| | | | | | | | | | | | | | | | | |
| | | | | | | | | | | | | | | | | |
| $ | (1,043 | ) | | $ | (1,252 | ) | | $ | (119 | ) | | $ | 175 | | | $ | (666 | ) | | $ | (700 | ) |
| | 12,912 | | | | 6,093 | | | | 1,911 | | | | 2,472 | | | | 6,639 | | | | 6,149 | |
| | 7 | | | | (275 | ) | | | (729 | ) | | | (389 | ) | | | 314 | | | | 613 | |
| | 51,691 | | | | 26,987 | | | | 11,234 | | | | 4,968 | | | | 49,566 | | | | 29,211 | |
| | — | | | | 6 | | | | — | | | | — | | | | — | | | | — | |
| | | | | | | | | | | | | | | | | | | | | | | |
| | 63,567 | | | | 31,559 | | | | 12,297 | | | | 7,226 | | | | 55,853 | | | | 35,273 | |
| | | | | | | | | | | | | | | | | | | | | | | |
| | | | | | | | | | | | | | | | | | | | | | | |
| | (2,897 | ) | | | — | | | | (140 | ) | | | (58 | ) | | | (3,007 | ) | | | (5,698 | ) |
| | (302 | ) | | | — | | | | (18 | ) | | | (3 | ) | | | (437 | ) | | | (627 | ) |
| | | | | | | | | | | | | | | | | | | | | | | |
| | (3,199 | ) | | | — | | | | (158 | ) | | | (61 | ) | | | (3,444 | ) | | | (6,325 | ) |
| | | | | | | | | | | | | | | | | | | | | | | |
| | | | | | | | | | | | | | | | | | | | | | | |
| | | | | | | | | | | | | | | | | | | | | | | |
| | 1,616 | | | | 9,562 | | | | 1,760 | | | | 2,288 | | | | 3,980 | | | | 2,526 | |
| | 2,817 | | | | — | | | | 133 | | | | 56 | | | | 2,902 | | | | 5,522 | |
| | (21,799 | ) | | | (22,183 | ) | | | (3,237 | ) | | | (4,890 | ) | | | (20,520 | ) | | | (28,894 | ) |
| | | | | | | | | | | | | | | | | | | | | | | |
| | (17,366 | ) | | | (12,621 | ) | | | (1,344 | ) | | | (2,546 | ) | | | (13,638 | ) | | | (20,846 | ) |
| | | | | | | | | | | | | | | | | | | | | | | |
| | | | | | | | | | | | | | | | | | | | | | | |
| | 8,233 | | | | 19,035 | | | | 523 | | | | 350 | | | | 45,772 | | | | 10,641 | |
| | 300 | | | | — | | | | 18 | | | | 2 | | | | 434 | | | | 341 | |
| | (528 | ) | | | (23,644 | ) | | | (245 | ) | | | (2,995 | ) | | | (2,202 | ) | | | (9,523 | ) |
| | | | | | | | | | | | | | | | | | | | | | | |
| | 8,005 | | | | (4,609 | ) | | | 296 | | | | (2,643 | ) | | | 44,004 | | | | 1,459 | |
| | | | | | | | | | | | | | | | | | | | | | | |
| | 51,007 | | | | 14,329 | | | | 11,091 | | | | 1,976 | | | | 82,775 | | | | 9,561 | |
| | | | | | | | | | | | | | | | | | | | | | | |
| | | | | | | | | | | | | | | | | | | | | | | |
| | 234,934 | | | | 220,605 | | | | 36,844 | | | | 34,868 | | | | 160,273 | | | | 150,712 | |
| | | | | | | | | | | | | | | | | | | | | | | |
| $ | 285,941 | | | $ | 234,934 | | | $ | 47,935 | | | $ | 36,844 | | | $ | 243,048 | | | $ | 160,273 | |
| | | | | | | | | | | | | | | | | | | | | | | |
| | | | | | | | | | | | | | | | | | | | | | | |
| | | | | | | | | | | | | | | | | | | | | | | |
| | 41 | | | | 274 | | | | 82 | | | | 128 | | | | 186 | | | | 152 | |
| | 74 | | | | — | | | | 7 | | | | 4 | | | | 156 | | | | 386 | |
| | (583 | ) | | | (661 | ) | | | (174 | ) | | | (289 | ) | | | (1,073 | ) | | | (1,843 | ) |
| | | | | | | | | | | | | | | | | | | | | | | |
| | (468 | ) | | | (387 | ) | | | (85 | ) | | | (157 | ) | | | (731 | ) | | | (1,305 | ) |
| | | | | | | | | | | | | | | | | | | | | | | |
| | | | | | | | | | | | | | | | | | | | | | | |
| | 225 | | | | 574 | | | | 26 | | | | 21 | | | | 2,028 | | | | 706 | |
| | 8 | | | | — | | | | 1 | | | | — | (1) | | | 23 | | | | 24 | |
| | (14 | ) | | | (704 | ) | | | (13 | ) | | | (184 | ) | | | (110 | ) | | | (610 | ) |
| | | | | | | | | | | | | | | | | | | | | | | |
| | 219 | | | | (130 | ) | | | 14 | | | | (163 | ) | | | 1,941 | | | | 120 | |
35
FINANCIAL HIGHLIGHTS
For a Fund Share Outstanding Throughout the Period
| | | MARSICO
FOCUS FUND | |
| Investor Class: | | Six-Month
Period
Ended
3/31/24
(Unaudited) | | | Year
Ended
9/30/23 | | | Year
Ended
9/30/22 | | | Year
Ended
9/30/21 | | | Year
Ended
9/30/20 | | | Year
Ended
9/30/19 | |
| | | | | | | | | | | | | | | | | | | | | | | | | |
| Net Asset Value, Beginning of Period | | $ | 19.86 | | | $ | 18.41 | | | $ | 28.84 | | | $ | 25.92 | | | $ | 18.59 | | | $ | 20.17 | |
| | | | | | | | | | | | | | | | | | | | | | | | | |
| Income from Investment Operations: | | | | | | | | | | | | | | | | | | | | | | | | |
| Net investment loss | | | (0.03 | ) | | | (0.11 | ) | | | (0.09 | ) | | | (0.22 | ) | | | (0.10 | ) | | | (0.04 | ) |
| Net realized and unrealized gains (losses) on investments | | | 7.07 | | | | 4.37 | | | | (7.13 | ) | | | 5.74 | | | | 8.92 | | | | 0.25 | |
| Total from investment operations | | | 7.04 | | | | 4.26 | | | | (7.22 | ) | | | 5.52 | | | | 8.82 | | | | 0.21 | |
| | | | | | | | | | | | | | | | | | | | | | | | | |
| Distributions & Other: | | | | | | | | | | | | | | | | | | | | | | | | |
| Net realized gains | | | (0.48 | ) | | | (2.81 | ) | | | (3.21 | ) | | | (2.60 | ) | | | (1.49 | ) | | | (1.79 | ) |
| Total distributions and other | | | (0.48 | ) | | | (2.81 | ) | | | (3.21 | ) | | | (2.60 | ) | | | (1.49 | ) | | | (1.79 | ) |
| | | | | | | | | | | | | | | | | | | | | | | | | |
| Net Asset Value, End of Period | | $ | 26.42 | | | $ | 19.86 | | | $ | 18.41 | | | $ | 28.84 | | | $ | 25.92 | | | $ | 18.59 | |
| | | | | | | | | | | | | | | | | | | | | | | | | |
| Total Return | | | 35.96 | %(2) | | | 27.04 | % | | | (28.30 | )% | | | 22.52 | % | | | 50.71 | % | | | 2.52 | % |
| | | | | | | | | | | | | | | | | | | | | | | | | |
| Supplemental Data and Ratios: | | | | | | | | | | | | | | | | | | | | | | | | |
| Net assets, end of period (000s) | | $ | 804,455 | | | $ | 567,000 | | | $ | 500,599 | | | $ | 895,641 | | | $ | 806,181 | | | $ | 554,645 | |
| Ratio of net expenses (before expenses paid indirectly) to average net assets(6) | | | 1.36 | %(3) | | | 1.45 | % | | | 1.02 | % | | | 1.26 | % | | | 1.24 | % | | | 1.02 | % |
| Ratio of net investment loss to average net assets(7) | | | (0.47 | )%(3) | | | (0.66 | )% | | | (0.25 | )% | | | (0.79 | )% | | | (0.53 | )% | | | (0.19 | )% |
| Ratio of total expenses to average net assets(8) | | | 1.36 | %(3) | | | 1.50 | % | | | 1.02 | % | | | 1.26 | % | | | 1.24 | % | | | 1.02 | % |
| Ratio of net investment loss (before waivers and expenses paid indirectly) to average net assets(9) | | | (0.47 | )%(3) | | | (0.71 | )% | | | (0.25 | )% | | | (0.79 | )% | | | (0.53 | )% | | | (0.19 | )% |
| Portfolio turnover rate | | | 27 | %(2) | | | 76 | % | | | 102 | % | | | 28 | % | | | 45 | % | | | 42 | % |
| Institutional Class: | | Six-Month
Period
Ended
3/31/24
(Unaudited) | | | Year
Ended
9/30/23 | | | Period
Ended
9/30/22(1) | | | | | | | | | | |
| | | | | | | | | | | | | | | | | | | |
| Net Asset Value, Beginning of Period | | $ | 19.96 | | | $ | 18.45 | | | $ | 26.98 | | | | | | | | | | | | | |
| | | | | | | | | | | | | | | | | | | | | | | | | |
| Income from Investment Operations: | | | | | | | | | | | | | | | | | | | | | | | | |
| Net investment income (loss) | | | (0.03 | ) | | | (0.08 | ) | | | 0.04 | | | | | | | | | | | | | |
| Net realized and unrealized gains (losses) on investments | | | 7.15 | | | | 4.40 | | | | (8.57 | ) | | | | | | | | | | | | |
| Total from investment operations | | | 7.12 | | | | 4.32 | | | | (8.53 | ) | | | | | | | | | | | | |
| | | | | | | | | | | | | | | | | | | | | | | | | |
| Distributions & Other: | | | | | | | | | | | | | | | | | | | | | | | | |
| Net realized gains | | | (0.48 | ) | | | (2.81 | ) | | | — | (4) | | | | | | | | | | | | |
| Increase from payment by service provider | | | — | | | | — | | | | — | | | | | | | | | | | | | |
| Total distributions and other | | | (0.48 | ) | | | (2.81 | ) | | | — | | | | | | | | | | | | | |
| | | | | | | | | | | | | | | | | | | | | | | | | |
| Net Asset Value, End of Period | | $ | 26.60 | | | $ | 19.96 | | | $ | 18.45 | | | | | | | | | | | | | |
| | | | | | | | | | | | | | | | | | | | | | | | | |
| Total Return | | | 36.18 | %(2) | | | 27.34 | % | | | (31.62 | )%(2) | | | | | | | | | | | | |
| | | | | | | | | | | | | | | | | | | | | | | | | |
| Supplemental Data and Ratios: | | | | | | | | | | | | | | | | | | | | | | | | |
| Net assets, end of period (000s) | | $ | 157,584 | | | $ | 103,876 | | | $ | 85,283 | | | | | | | | | | | | | |
| Ratio of net expenses (before expenses paid indirectly) to average net assets(6) | | | 1.07 | %(3) | | | 1.20 | % | | | 0.65 | %(3) | | | | | | | | | | | | |
| Ratio of net investment income (loss) to average net assets(7) | | | (0.18 | )%(3) | | | (0.41 | )% | | | 0.24 | %(3) | | | | | | | | | | | | |
| Ratio of total expenses to average net assets(8) | | | 1.07 | %(3) | | | 1.23 | % | | | 0.65 | %(3) | | | | | | | | | | | | |
| Ratio of net investment income (loss) (before waivers and expenses paid indirectly) to average net assets(9) | | | (0.18 | )%(3) | | | (0.44 | )% | | | 0.24 | %(3) | | | | | | | | | | | | |
| Portfolio turnover rate | | | 27 | %(2) | | | 76 | % | | | 102 | %(2) | | | | | | | | | | | | |
| (1) | Institutional Class shares commenced operations on December 6, 2021. |
| (4) | Distributions occurred prior to the commencement of operations of the Institutional Class shares. |
| (5) | The Fund’s transfer agent reimbursed the Institutional Class $6 (in thousands) for losses incurred. The reimbursement increased the total return by 0.03%. |
| (6) | Ratio of expenses to average net assets, less waivers and before expenses paid indirectly, plus recoupment of previously waived fees or expenses paid. |
| (7) | Ratio of net investment income (loss) to average net assets, net of waivers, recoupment of previously waived fees or expenses paid and expenses paid indirectly. |
| (8) | Ratio of expenses to average net assets, before waivers and expenses paid indirectly, plus recoupment of previously waived fees or expenses paid. |
| (9) | Ratio of net investment income (loss) to average net assets, before waivers and expenses paid indirectly, plus recoupment of previously waived fees or expenses paid. |
See notes to financial statements.
36
MARSICO
GROWTH FUND | | MARSICO
MIDCAP GROWTH FOCUS FUND |
Six-Month
Period
Ended
3/31/24
(Unaudited) | | | Year
Ended
9/30/23 | | | Year
Ended
9/30/22 | | | Year
Ended
9/30/21 | | | Year
Ended
9/30/20 | | | Year
Ended
9/30/19 | | | Six-Month
Period
Ended
3/31/24
(Unaudited) | | | Year
Ended
9/30/23 | | | Year
Ended
9/30/22 | | | Year
Ended
9/30/21 | | | Year
Ended
9/30/20 | | | Year
Ended
9/30/19 | |
| | | | | | | | | | | | | | | | | | | | | | | | | | | | | | | | | | | |
| $ | 17.97 | | | $ | 14.05 | | | $ | 29.78 | | | $ | 25.66 | | | $ | 18.75 | | | $ | 20.69 | | | $ | 33.89 | | | $ | 29.61 | | | $ | 52.48 | | | $ | 39.52 | | | $ | 33.70 | | | $ | 33.18 | |
| | | | | | | | | | | | | | | | | | | | | | | | | | | | | | | | | | | | | | | | | | | | | | | |
| | | | | | | | | | | | | | | | | | | | | | | | | | | | | | | | | | | | | | | | | | | | | | | |
| | (0.03 | ) | | | (0.13 | ) | | | (0.15 | ) | | | (0.35 | ) | | | (0.14 | ) | | | (0.08 | ) | | | (0.19 | ) | | | (0.21 | ) | | | (0.44 | ) | | | (0.47 | ) | | | (0.39 | ) | | | (0.20 | ) |
| | 5.88 | | | | 4.05 | | | | (7.25 | ) | | | 6.85 | | | | 8.92 | | | | 0.34 | | | | 9.54 | | | | 4.49 | | | | (15.83 | ) | | | 14.77 | | | | 7.30 | | | | 2.15 | |
| | 5.85 | | | | 3.92 | | | | (7.40 | ) | | | 6.50 | | | | 8.78 | | | | 0.26 | | | | 9.35 | | | | 4.28 | | | | (16.27 | ) | | | 14.30 | | | | 6.91 | | | | 1.95 | |
| | | | | | | | | | | | | | | | | | | | | | | | | | | | | | | | | | | | | | | | | | | | | | | |
| | | | | | | | | | | | | | | | | | | | | | | | | | | | | | | | | | | | | | | | | | | | | | | |
| | (0.36 | ) | | | — | | | | (8.33 | ) | | | (2.38 | ) | | | (1.87 | ) | | | (2.20 | ) | | | (0.47 | ) | | | — | | | | (6.60 | ) | | | (1.34 | ) | | | (1.09 | ) | | | (1.43 | ) |
| | (0.36 | ) | | | — | | | | (8.33 | ) | | | (2.38 | ) | | | (1.87 | ) | | | (2.20 | ) | | | (0.47 | ) | | | — | | | | (6.60 | ) | | | (1.34 | ) | | | (1.09 | ) | | | (1.43 | ) |
| | | | | | | | | | | | | | | | | | | | | | | | | | | | | | | | | | | | | | | | | | | | | | | |
| $ | 23.46 | | | $ | 17.97 | | | $ | 14.05 | | | $ | 29.78 | | | $ | 25.66 | | | $ | 18.75 | | | $ | 42.77 | | | $ | 33.89 | | | $ | 29.61 | | | $ | 52.48 | | | $ | 39.52 | | | $ | 33.70 | |
| | | | | | | | | | | | | | | | | | | | | | | | | | | | | | | | | | | | | | | | | | | | | | | |
| | 32.88 | %(2) | | | 27.90 | % | | | (34.81 | )% | | | 26.51 | % | | | 51.11 | % | | | 3.16 | % | | | 27.76 | %(2) | | | 14.45 | % | | | (35.52 | )% | | | 36.56 | % | | | 21.15 | % | | | 6.88 | % |
| | | | | | | | | | | | | | | | | | | | | | | | | | | | | | | | | | | | | | | | | | | | | | | |
| | | | | | | | | | | | | | | | | | | | | | | | | | | | | | | | | | | | | | | | | | | | | | | |
| $ | 376,471 | | | $ | 260,436 | | | $ | 222,871 | | | $ | 423,855 | | | $ | 410,592 | | | $ | 259,305 | | | $ | 257,448 | | | $ | 219,855 | | | $ | 203,593 | | | $ | 379,039 | | | $ | 291,976 | | | $ | 282,779 | |
| | 1.38 | %(3) | | | 1.45 | % | | | 1.19 | % | | | 1.37 | % | | | 1.45 | % | | | 1.27 | % | | | 1.43 | %(3) | | | 1.44 | % | | | 1.34 | % | | | 1.33 | % | | | 1.40 | % | | | 1.30 | % |
| | (0.53 | )%(3) | | | (0.65 | )% | | | (0.84 | )% | | | (1.07 | )% | | | (0.85 | )% | | | (0.40 | )% | | | (0.83 | )%(3) | | | (0.54 | )% | | | (1.05 | )% | | | (0.91 | )% | | | (0.96 | )% | | | (0.66 | )% |
| | 1.38 | %(3) | | | 1.48 | % | | | 1.19 | % | | | 1.37 | % | | | 1.50 | % | | | 1.27 | % | | | 1.43 | %(3) | | | 1.45 | % | | | 1.34 | % | | | 1.33 | % | | | 1.40 | % | | | 1.30 | % |
| | (0.53 | )%(3) | | | (0.68 | )% | | | (0.84 | )% | | | (1.07 | )% | | | (0.90 | )% | | | (0.40 | )% | | | (0.83 | )%(3) | | | (0.55 | )% | | | (1.05 | )% | | | (0.91 | )% | | | (0.96 | )% | | | (0.66 | )% |
| | 33 | %(2) | | | 89 | % | | | 117 | % | | | 58 | % | | | 77 | % | | | 39 | % | | | 28 | %(2) | | | 56 | % | | | 55 | % | | | 20 | % | | | 38 | % | | | 34 | % |
Six-Month
Period
Ended
3/31/24
(Unaudited) | | | Year
Ended
9/30/23 | | | Period
Ended
9/30/22(1) | | | | | | | | | | | | Six-Month
Period
Ended
3/31/24
(Unaudited) | | | Year
Ended
9/30/23 | | | Period
Ended
9/30/22(1) | | | | | | | | | | |
| | | | | | | | | | | | | | | | | | | | | | | | | | | | | | | | | | | |
| $ | 18.06 | | | $ | 14.08 | | | $ | 21.57 | | | | | | | | | | | | | | | $ | 34.04 | | | $ | 29.68 | | | $ | 44.83 | | | | | | | | | | | | | |
| | | | | | | | | | | | | | | | | | | | | | | | | | | | | | | | | | | | | | | | | | | | | | | |
| | | | | | | | | | | | | | | | | | | | | | | | | | | | | | | | | | | | | | | | | | | | | | | |
| | (0.04 | ) | | | (0.07 | ) | | | (0.07 | ) | | | | | | | | | | | | | | | (0.13 | ) | | | (0.17 | ) | | | (0.22 | ) | | | | | | | | | | | | |
| | 5.93 | | | | 4.05 | | | | (7.42 | ) | | | | | | | | | | | | | | | 9.57 | | | | 4.52 | | | | (14.93 | ) | | | | | | | | | | | | |
| | 5.89 | | | | 3.98 | | | | (7.49 | ) | | | | | | | | | | | | | | | 9.44 | | | | 4.35 | | | | (15.15 | ) | | | | | | | | | | | | |
| | | | | | | | | | | | | | | | | | | | | | | | | | | | | | | | | | | | | | | | | | | | | | | |
| | | | | | | | | | | | | | | | | | | | | | | | | | | | | | | | | | | | | | | | | | | | | | | |
| | (0.36 | ) | | | — | | | | — | (4) | | | | | | | | | | | | | | | (0.47 | ) | | | — | | | | — | (4) | | | | | | | | | | | | |
| | — | | | | — | | | | — | | | | | | | | | | | | | | | | — | | | | 0.01 | | | | — | | | | | | | | | | | | | |
| | (0.36 | ) | | | — | | | | — | | | | | | | | | | | | | | | | (0.47 | ) | | | 0.01 | | | | — | | | | | | | | | | | | | |
| | | | | | | | | | | | | | | | | | | | | | | | | | | | | | | | | | | | | | | | | | | | | | | |
| $ | 23.59 | | | $ | 18.06 | | | $ | 14.08 | | | | | | | | | | | | | | | $ | 43.01 | | | $ | 34.04 | | | $ | 29.68 | | | | | | | | | | | | | |
| | | | | | | | | | | | | | | | | | | | | | | | | | | | | | | | | | | | | | | | | | | | | | | |
| | 32.94 | %(2) | | | 28.27 | % | | | (34.72 | )%(2) | | | | | | | | | | | | | | | 27.90 | %(2) | | | 14.69 | %(5) | | | (33.79 | )%(2) | | | | | | | | | | | | |
| | | | | | | | | | | | | | | | | | | | | | | | | | | | | | | | | | | | | | | | | | | | | | | |
| | | | | | | | | | | | | | | | | | | | | | | | | | | | | | | | | | | | | | | | | | | | | | | |
| $ | 39,902 | | | $ | 27,177 | | | $ | 21,519 | | | | | | | | | | | | | | | $ | 28,493 | | | $ | 15,079 | | | $ | 17,012 | | | | | | | | | | | | | |
| | 1.15 | %(3) | | | 1.20 | % | | | 0.92 | %(3) | | | | | | | | | | | | | | | 1.18 | %(3) | | | 1.20 | % | | | 1.11 | %(3) | | | | | | | | | | | | |
| | (0.29 | )%(3) | | | (0.40 | )% | | | (0.51 | )%(3) | | | | | | | | | | | | | | | (0.60 | )%(3) | | | (0.32 | )% | | | (0.75 | )%(3) | | | | | | | | | | | | |
| | 1.15 | %(3) | | | 1.24 | % | | | 0.92 | %(3) | | | | | | | | | | | | | | | 1.18 | %(3) | | | 1.21 | % | | | 1.11 | %(3) | | | | | | | | | | | | |
| | (0.29 | )%(3) | | | (0.44 | )% | | | (0.51 | )%(3) | | | | | | | | | | | | | | | (0.60 | )%(3) | | | (0.33 | )% | | | (0.75 | )%(3) | | | | | | | | | | | | |
| | 33 | %(2) | | | 89 | % | | | 117 | %(2) | | | | | | | | | | | | | | | 28 | %(2) | | | 56 | % | | | 55 | %(2) | | | | | | | | | | | | |
37
FINANCIAL HIGHLIGHTS
For a Fund Share Outstanding Throughout the Period
| | | MARSICO
INTERNATIONAL OPPORTUNITIES FUND | |
| Investor Class: | | Six-Month
Period
Ended
3/31/24
(Unaudited) | | | Year
Ended
9/30/23 | | | Year
Ended
9/30/22 | | | Year
Ended
9/30/21 | | | Year
Ended
9/30/20 | | | Year
Ended
9/30/19 | |
| | | | | | | | | | | | | | | | | | | |
| Net Asset Value, Beginning of Period | | $ | 16.75 | | | $ | 13.84 | | | $ | 23.79 | | | $ | 20.57 | | | $ | 18.47 | | | $ | 20.23 | |
| | | | | | | | | | | | | | | | | | | | | | | | | |
| Income from Investment Operations: | | | | | | | | | | | | | | | | | | | | | | | | |
| Net investment income (loss) | | | (0.06 | ) | | | 0.06 | | | | (0.01 | ) | | | (0.04 | ) | | | 0.04 | | | | 0.01 | |
| Net realized and unrealized gains (losses) on investments | | | 5.90 | | | | 2.88 | | | | (7.14 | ) | | | 3.81 | | | | 2.87 | | | | (0.35 | ) |
| Total from investment operations | | | 5.84 | | | | 2.94 | | | | (7.15 | ) | | | 3.77 | | | | 2.91 | | | | (0.34 | ) |
| | | | | | | | | | | | | | | | | | | | | | | | | |
| Distributions & Other: | | | | | | | | | | | | | | | | | | | | | | | | |
| Net investment income | | | (0.07 | ) | | | (0.03 | ) | | | — | | | | — | | | | (0.07 | ) | | | — | |
| Net realized gains | | | — | | | | — | | | | (2.80 | ) | | | (0.55 | ) | | | (0.74 | ) | | | (1.42 | ) |
| Total distributions and other | | | (0.07 | ) | | | (0.03 | ) | | | (2.80 | ) | | | (0.55 | ) | | | (0.81 | ) | | | (1.42 | ) |
| | | | | | | | | | | | | | | | | | | | | | | | | |
| Net Asset Value, End of Period | | $ | 22.52 | | | $ | 16.75 | | | $ | 13.84 | | | $ | 23.79 | | | $ | 20.57 | | | $ | 18.47 | |
| | | | | | | | | | | | | | | | | | | | | | | | | |
| Total Return | | | 34.97 | %(2) | | | 21.23 | % | | | (34.08 | )% | | | 18.48 | % | | | 16.14 | % | | | (0.37 | )% |
| | | | | | | | | | | | | | | | | | | | | | | | | |
| Supplemental Data and Ratios: | | | | | | | | | | | | | | | | | | | | | | | | |
| Net assets, end of period (000s) | | $ | 44,191 | | | $ | 34,278 | | | $ | 30,503 | | | $ | 60,274 | | | $ | 55,024 | | | $ | 53,311 | |
| Ratio of net expenses (before expenses paid indirectly) to average net assets(6) | | | 1.50 | %(3) | | | 1.50 | % | | | 1.50 | % | | | 1.50 | % | | | 1.50 | % | | | 1.50 | % |
| Ratio of net investment income (loss) to average net assets(7) | | | (0.60 | )%(3) | | | 0.44 | % | | | 0.07 | % | | | (0.11 | )% | | | 0.28 | % | | | 0.14 | % |
| Ratio of total expenses to average net assets(8) | | | 1.81 | %(3) | | | 1.86 | % | | | 1.71 | % | | | 1.68 | % | | | 1.81 | % | | | 1.72 | % |
| Ratio of net investment income (loss) (before waivers and expenses paid indirectly) to average net assets(9) | | | (0.91 | )%(3) | | | 0.08 | % | | | (0.14 | )% | | | (0.29 | )% | | | (0.03 | )% | | | (0.08 | )% |
| Portfolio turnover rate | | | 38 | %(2) | | | 52 | % | | | 18 | % | | | 50 | % | | | 60 | % | | | 57 | % |
| Institutional Class: | | Six-Month
Period
Ended
3/31/24
(Unaudited) | | | Year
Ended
9/30/23 | | | Period
Ended
9/30/22(1) | | |
| | | | | | | | | | | |
| Net Asset Value, Beginning of Period | | $ | 16.83 | | | $ | 13.86 | | | $ | 20.20 | | |
| | | | | | | | | | | | | | |
| Income from Investment Operations: | | | | | | | | | | | | | |
| Net investment income (loss) | | | (0.04 | ) | | | 0.13 | | | | 0.03 | | |
| Net realized and unrealized gains (losses) on investments | | | 5.93 | | | | 2.85 | | | | (6.37 | ) | |
| Total from investment operations | | | 5.89 | | | | 2.98 | | | | (6.34 | ) | |
| | | | | | | | | | | | | | |
| Distributions & Other: | | | | | | | | | | | | | |
| Net investment income | | | (0.11 | ) | | | (0.01 | ) | | | — | | |
| Net realized gains | | | — | | | | — | | | | — | (5) | |
| Total distributions and other | | | (0.11 | ) | | | (0.01 | ) | | | — | | |
| | | | | | | | | | | | | | |
| Net Asset Value, End of Period | | $ | 22.61 | | | $ | 16.83 | | | $ | 13.86 | | |
| | | | | | | | | | | | | | |
| Total Return | | | 35.17 | %(2) | | | 21.54 | % | | | (31.39 | )%(2) | |
| | | | | | | | | | | | | | |
| Supplemental Data and Ratios: | | | | | | | | | | | | | |
| Net assets, end of period (000s) | | $ | 3,744 | | | $ | 2,566 | | | $ | 4,365 | | |
| Ratio of net expenses (before expenses paid indirectly) to average net assets(6) | | | 1.25 | %(3) | | | 1.25 | % | | | 1.25 | %(3) | |
| Ratio of net investment income (loss) to average net assets(7) | | | (0.33 | )%(3) | | | 0.53 | % | | | 0.31 | %(3) | |
| Ratio of total expenses to average net assets(8) | | | 1.92 | %(3) | | | 1.98 | % | | | 1.81 | %(3) | |
| Ratio of net investment loss (before waivers and expenses paid indirectly) to average net assets(9) | | | (1.00 | )%(3) | | | (0.20 | )% | | | (0.25 | )%(3) | |
| Portfolio turnover rate | | | 38 | %(2) | | | 52 | % | | | 18 | %(2) | |
| (1) | Institutional Class shares commenced operations on December 6, 2021. |
| (5) | Distributions occurred prior to the commencement of operations of the Institutional Class shares. |
| (6) | Ratio of expenses to average net assets, less waivers and before expenses paid indirectly, plus recoupment of previously waived fees or expenses paid. |
| (7) | Ratio of net investment income (loss) to average net assets, net of waivers, recoupment of previously waived fees or expenses paid and expenses paid indirectly. |
| (8) | Ratio of expenses to average net assets, before waivers and expenses paid indirectly, plus recoupment of previously waived fees or expenses paid. |
| (9) | Ratio of net investment income (loss) to average net assets, before waivers and expenses paid indirectly, plus recoupment of previously waived fees or expenses paid. |
See notes to financial statements.
38
MARSICO
GLOBAL FUND | |
Six-Month
Period
Ended
3/31/24
(Unaudited) | | | Year
Ended
9/30/23 | | | Year
Ended
9/30/22 | | | Year
Ended
9/30/21 | | | Year
Ended
9/30/20 | | | Year
Ended
9/30/19 | |
| | | | | | | | | | | | | | | | | |
| $ | 16.88 | | | $ | 14.12 | | | $ | 25.93 | | | $ | 22.83 | | | $ | 16.06 | | | $ | 17.16 | |
| | | | | | | | | | | | | | | | | | | | | | | |
| | | | | | | | | | | | | | | | | | | | | | | |
| | (0.11 | ) | | | (0.12 | ) | | | (0.17 | ) | | | (0.28 | ) | | | (0.19 | ) | | | (0.12 | ) |
| | 6.27 | | | | 3.50 | | | | (7.58 | ) | | | 3.97 | | | | 6.96 | | | | (0.82 | ) |
| | 6.16 | | | | 3.38 | | | | (7.75 | ) | | | 3.69 | | | | 6.77 | | | | (0.94 | ) |
| | | | | | | | | | | | | | | | | | | | | | | |
| | | | | | | | | | | | | | | | | | | | | | | |
| | — | | | | — | | | | — | | | | — | | | | — | | | | — | |
| | (0.37 | ) | | | (0.62 | ) | | | (4.06 | ) | | | (0.59 | ) | | | — | | | | (0.16 | ) |
| | (0.37 | ) | | | (0.62 | ) | | | (4.06 | ) | | | (0.59 | ) | | | — | | | | (0.16 | ) |
| | | | | | | | | | | | | | | | | | | | | | | |
| $ | 22.67 | | | $ | 16.88 | | | $ | 14.12 | | | $ | 25.93 | | | $ | 22.83 | | | $ | 16.06 | |
| | | | | | | | | | | | | | | | | | | | | | | |
| | 36.99 | %(2) | | | 24.72 | % | | | (35.55 | )% | | | 16.33 | % | | | 42.15 | % | | | (5.36 | )% |
| | | | | | | | | | | | | | | | | | | | | | | |
| | | | | | | | | | | | | | | | | | | | | | | |
| $ | 175,067 | | | $ | 142,683 | | | $ | 137,752 | | | $ | 309,493 | | | $ | 285,033 | | | $ | 228,893 | |
| | 1.50 | %(3) | | | 1.50 | % | | | 1.45 | % | | | 1.45 | % | | | 1.45 | % | | | 1.45 | % |
| | (0.78 | )%(3) | | | (0.46 | )% | | | (0.56 | )% | | | (1.03 | )% | | | (0.84 | )% | | | (0.55 | )% |
| | 1.51 | %(3) | | | 1.55 | % | | | 1.45 | % | | | 1.45 | % | | | 1.73 | % | | | 1.45 | % |
| | (0.79 | )%(3) | | | (0.51 | )% | | | (0.56 | )% | | | (1.03 | )% | | | (1.12 | )% | | | (0.55 | )% |
| | 36 | %(2) | | | 82 | % | | | 100 | % | | | 65 | % | | | 51 | % | | | 67 | % |
Six-Month
Period
Ended
3/31/24
(Unaudited) | | | Year
Ended
9/30/23 | | | Period
Ended
9/30/22(1) | | |
| | | | | | | | | |
| $ | 16.99 | | | $ | 14.17 | | | $ | 22.30 | | |
| | | | | | | | | | | | |
| | | | | | | | | | | | |
| | (0.09 | ) | | | (0.05 | ) | | | — | (4) | |
| | 6.32 | | | | 3.49 | | | | (8.13 | ) | |
| | 6.23 | | | | 3.44 | | | | (8.13 | ) | |
| | | | | | | | | | | | |
| | | | | | | | | | | | |
| | — | | | | — | | | | — | | |
| | (0.37 | ) | | | (0.62 | ) | | | — | (5) | |
| | (0.37 | ) | | | (0.62 | ) | | | — | | |
| | | | | | | | | | | | |
| $ | 22.85 | | | $ | 16.99 | | | $ | 14.17 | | |
| | | | | | | | | | | | |
| | 37.16 | %(2) | | | 25.07 | % | | | (36.46 | )%(2) | |
| | | | | | | | | | | | |
| | | | | | | | | | | | |
| $ | 67,981 | | | $ | 17,590 | | | $ | 12,960 | | |
| | 1.25 | %(3) | | | 1.25 | % | | | 1.06 | %(3) | |
| | (0.46 | )%(3) | | | (0.23 | )% | | | (0.02 | )%(3) | |
| | 1.25 | %(3) | | | 1.29 | % | | | 1.06 | %(3) | |
| | (0.46 | )%(3) | | | (0.27 | )% | | | (0.02 | )%(3) | |
| | 36 | %(2) | | | 82 | % | | | 100 | %(2) | |
39
| NOTES TO FINANCIAL STATEMENTS |
NOTES TO FINANCIAL STATEMENTS March 31, 2024 (Unaudited)
The Marsico Investment Fund (the “Trust”) was organized on October 1, 1997, as a Delaware statutory trust and is registered under the Investment Company Act of 1940, as amended (the “1940 Act”), as an open-end management investment company. The Focus Fund, Growth Fund, Midcap Growth Focus Fund, International Opportunities Fund, and Global Fund (collectively, the “Funds”) are separate investment portfolios of the Trust. The Focus Fund is a non-diversified fund and the Growth Fund, Midcap Growth Focus Fund, International Opportunities Fund, and Global Fund are diversified funds. The Focus Fund and Growth Fund commenced operations on December 31, 1997, the Midcap Growth Focus Fund commenced operations on February 1, 2000, the International Opportunities Fund commenced operations on June 30, 2000, and the Global Fund commenced operations on June 29, 2007. Prior to September 1, 2021, the Midcap Growth Focus Fund was known as the 21ST Century Fund.
On November 17, 2021, the Funds’ Board of Trustees (the “Board”) approved a Multi-Class Plan (“Multi-Class Plan”) pursuant to Rule 18f-3 under the 1940 Act (i) to divide the shares of each Fund into two classes, (ii) to authorize and designate a new Institutional Class of shares for each of the Funds and (iii) to redesignate the existing shares of each of the Funds as Investor Class shares. Effective December 6, 2021, the Institutional Class shares for each of the Funds commenced operations and the existing shares of each of the Funds were redesignated as Investor Class shares. Shares of each class of the Funds represent an equal pro rata interest in such Fund and generally have identical voting, distribution, liquidation and other rights/privileges except that each class shall (a) have a different designation; (b) bear any class expenses; (c) have exclusive voting rights on any matter submitted to shareholders that relates solely to its administration or distribution arrangement; (d) have separate voting rights on any matter submitted to shareholders in which the interests of one class differ from the interests of any other class; and (e) have different shareholder investment minimum requirements.
Trustees and officers of the Trust and employees of Marsico Capital Management, LLC (the “Adviser”) own approximately 14%, 25%, 22%, 61%, and 17% of the outstanding Institutional Class shares of the Focus Fund, Growth Fund, Midcap Growth Focus Fund, International Opportunities Fund, and Global Fund, respectively, as of March 31, 2024. Percentage ownership of each Fund is significant as the Institutional Class of shares for each Fund were initially funded by conversions of Investor Class shares in certain accounts attributed to Trustees and executive officers of the Trust.
| 2. | Significant Accounting Policies |
The Funds qualify as investment companies under Accounting Standards Update No. 2013-08, Accounting Standard Codification Topic 946, “Financial Services — Investment Companies” (“ASC 946"). Certain prior year amounts have been conformed to current year presentation. The following is a summary of significant accounting policies consistently followed by the Funds in the preparation of their financial statements. These policies are in conformity with Generally Accepted Accounting Principles (“GAAP”) in the United States of America for investment companies and follow the accounting guidance provided in ASC 946. The presentation of financial statements in conformity with GAAP requires management to make estimates and assumptions that affect the reported amounts and disclosures of assets and liabilities at the date of the financial statements and the reported amounts and disclosures of income and expenses during the reporting period. Actual results could differ from those estimates.
| (a) | Investment Valuation — A security traded on a recognized stock exchange is generally valued at the last sale price prior to the closing of the principal exchange on which the security is traded. Securities traded on NASDAQ generally will be valued at the NASDAQ Official Closing Price. If no sale price is reported on the valuation date, the most current bid price will generally be used, with the exception of short option positions which will generally utilize the most current ask price. Other securities for which over-the-counter market quotations are readily available are generally valued at the last sale price. Debt securities that will mature in more than 60 days are generally valued at their bid prices furnished by a pricing service. Debt securities that will mature in 60 days or less are valued at amortized cost, if it approximates market value. Any securities for which market quotations are not readily available are valued at their fair value as determined, in accordance with the Funds’ policies and procedures, in good faith by the Adviser, subject to the Board’s general supervision of the Adviser as the Board’s valuation designee (as defined in Rule 2a-5 under the 1940 Act). The Funds’ policies and procedures, including those wherein the Adviser has been approved as the Board’s valuation designee, have been duly approved by the Board. When a security has been “fair valued,” consideration is given to facts and circumstances relevant to the particular situation, including a review of the various factors set forth in the Funds’ policies and procedures. The Funds may use pricing services to assist in determining market value. The Adviser, as the Board’s valuation designee, has proposed and the Board has approved the use of a pricing service to assist the Funds in valuing certain equity securities listed or traded on foreign security exchanges in the Funds’ portfolios in certain circumstances where there is a significant change in the value of related US-traded securities, as represented by, for example, the S&P 500 Index. |
“Fair Value Measurements and Disclosures” (the “Fair Value Statement”) defines fair value, establishes a framework for measuring fair value in GAAP, and expands disclosures about fair value measurements. Under the Fair Value Statement, various inputs are used in determining the value of the Funds’ investments.
40
| NOTES TO FINANCIAL STATEMENTS |
These inputs are summarized into three broad levels and described below:
| ● | Level 1 — unadjusted quoted prices in active markets for identical investments |
| ● | Level 2 — other significant observable inputs (including quoted prices for similar investments, interest rates, and evaluated quotations obtained from pricing services) |
| ● | Level 3 — significant unobservable inputs (including the Fund’s assumptions that market participants would use in determining the fair value of investments) |
The inputs or methodology used for valuing investments are not an indication of the risk associated with investing in those investments. Changes in valuation techniques may result in transfers between the levels during the reporting period. As of March 31, 2024, the fair values of each Fund’s investments according to the valuation inputs utilized are reflected in the “Summary of Fair Value Measurements” on the Fund’s Schedule of Investments. The Funds did not hold a significant amount of Level 3 securities as of March 31, 2024.
| (b) | Expenses — The Funds are charged for those expenses that are directly attributable to each Fund, such as advisory and custodial fees. Expenses that are not directly attributable to a Fund are typically allocated among the Funds in proportion to their respective net assets and are in some cases allocated based on other factors. Each class of shares bears a portion of their respective Fund expenses, which are allocated daily to each class of shares in proportion to their respective net assets of the Fund. Expenses directly attributable to a specific class of shares, such as distribution fees for the Investor Class, are charged directly to that class of shares. The Funds’ expenses may be reduced by advisory fee waivers, brokerage credits and uninvested cash balances earning interest or credits. Such credits are included in “Less waiver of expenses and expenses paid indirectly” on the Statements of Operations. |
Brokerage commissions may be paid to certain brokers which reduce transfer agent fees and expenses. For the six-month period ended March 31, 2024, the Funds received no such brokerage commission credits. The Funds received earnings credits on certain cash account balances which reduced transfer agent fees and expenses by less than $1 (in thousands) for each of the Focus Fund, Growth Fund, Midcap Growth Focus Fund, International Opportunities Fund, and Global Fund for the six-month period ended March 31, 2024. Brokerage commission credits and earnings credits (if any) are included in “Less waiver of expenses and expenses paid indirectly” on the Statements of Operations.
| (c) | Federal Income Taxes — Each Fund intends to comply with the requirements of the Internal Revenue Code of 1986, as amended (the “Internal Revenue Code”), necessary to continue to qualify as a regulated investment company and to make the requisite distributions of income to its shareholders which will be sufficient to relieve it from all or substantially all federal and state income taxes. Certain Funds may utilize earnings and profits on redemption of shares as part of the dividends paid deduction. |
| (d) | Distributions to Shareholders — Dividends from net investment income and net realized capital gains, if any, will be declared and paid at least annually. Distributions to shareholders are recorded on the ex-dividend date. Each Fund may periodically make reclassifications among certain of its capital accounts as a result of the timing and characterization of certain income and capital gains distributions determined in accordance with federal tax regulations, which may differ from GAAP. These reclassifications are due to differing treatment for items such as foreign currency transactions and net investment losses. |
The Funds at times may invest in real estate investment trusts (“REITs”). REITs generally pay dividends to their investors based upon cash available from their operations and this amount may differ significantly from the REITs’ actual earnings and profits (“E&P”) determined for income tax purposes. It is common for these dividends to exceed the REITs’ taxable E&P, resulting in the excess portion of such dividends eventually being designated as a return of capital. Determination of the tax character of dividends made by REITs is typically performed by the REIT several months subsequent to the payment of the dividend. Therefore, due to timing issues, the Funds may be in a position of being required to calculate and pay required distribution amounts to their shareholders based on the best information available from the REITs, which may be prior to the final determination of the REITs’ taxable E&P, and it is possible that a portion of the Funds’ distribution amounts could include a return of capital to shareholders for federal income tax purposes.
| (e) | Foreign Currency Translation — The accounting records of the Funds are maintained in US dollars. For valuation purposes, values of securities denominated in foreign currencies are translated into US dollars at 4:00 p.m. Eastern Time. Amounts related to the purchase and sale of foreign securities and investment income are translated at the rates of exchange prevailing on the respective dates of such transactions. |
Reported realized gains and losses on foreign currency transactions arise from sales of portfolio securities, forward foreign currency contracts, currency gains or losses realized between the trade and settlement dates on securities transactions, and the difference between the amounts of dividends, interest, and foreign withholding taxes recorded on the Funds’ books and the US dollar equivalent of the amounts actually received or paid.
41
| NOTES TO FINANCIAL STATEMENTS |
NOTES TO FINANCIAL STATEMENTS March 31, 2024 (Unaudited) (continued)
The Funds do not isolate that portion of the results of operations resulting from changes in foreign exchange rates on investments from the fluctuations arising from changes in market prices of securities held at the end of the reporting period. Net unrealized appreciation or depreciation on investments and foreign currency translations arises from changes in the value of assets and liabilities, including investments in securities at the end of the reporting period, resulting from changes in the exchange rates and changes in market prices of securities held.
Transactions in foreign-denominated assets may involve greater risks than domestic transactions, including currency risk, political and economic risk, regulatory risk and market risk.
| (f) | Derivative Instruments — “Disclosure about Derivative Instruments and Hedging Activities” (the “Derivatives Statement”) requires enhanced disclosures about the Funds’ derivative and hedging activities, including how such activities are accounted for and their effects on the Funds’ financial position, performance and cash flows. |
The Funds are not intended as vehicles for investing substantially in derivative instruments, and may hold derivative instruments only infrequently. The Funds enter into derivative instruments in order to increase exposure to certain investments, asset classes, or markets, or for hedging purposes to hedge against adverse movements in securities prices, currency rates or interest rates. The Funds can hold various types of derivative instruments such as futures contracts and options on securities, financial indexes, and foreign currencies, options on futures, forward foreign currency contracts, interest rate swaps, credit default swaps, and swap-related products. The use of derivative instruments may involve risks such as the possibility of illiquid markets or imperfect correlation between the value of the derivative instruments and the underlying securities, or that the counterparty will fail to perform its obligations. There were no outstanding derivative instruments held by the Funds as of March 31, 2024 nor did the Funds utilize derivative instruments during the six-month period ended March 31, 2024.
| (g) | Non-Interested Trustees’ Deferred Fee Plan — Effective February 1, 2000, the Board of Trustees adopted the Marsico Investment Fund Deferred Fee Plan (the “Deferred Fee Plan”), amended and restated as of December 30, 2005, which allows the Trustees who are not “interested persons” of the Funds, as defined in the 1940 Act (“non-interested Trustees”), to defer the receipt of all or a portion of their compensation received from the Funds and may be invested as directed by each non-interested Trustee. The Deferred Fee Plan was further amended and restated as of November 10, 2020 to allow for any deferred fees credited to accounts established on behalf of the non-interested Trustees to be invested into the Funds and other investment options allowed under the Deferred Fee Plan, such as a non-affiliated US government money market fund, among other clarifying changes. The amounts credited to these accounts increase or decrease in accordance with the performance of the investments selected by the non-interested Trustees. The market value of the deferred account balances as of March 31, 2024 is shown on the Statements of Assets and Liabilities as part of an asset account, “Prepaid expenses and other assets,” and a liability account, “Accrued trustees’ fees.” Additionally, the fluctuation of the account balances due to the performance of the investments is recorded by the Funds as unrealized appreciation (depreciation), which is shown as part of “Total distributable earnings” on the Statements of Assets and Liabilities, and as compensation expense, which is shown as part of the expense account “Trustees’ fees and expenses” on the Statements of Operations. Fees earned and deferred by the non-interested Trustees for the six-month period ended March 31, 2024 are also included in “Trustees’ fees and expenses” on the Statements of Operations. Amounts contributed to the Deferred Fee Plan will be deferred until distributed in accordance with the Deferred Fee Plan. Unrealized appreciation (depreciation) of the investments held in the Deferred Fee Plan is subject to the Funds’ expense reimbursement agreement with the Adviser. |
| (h) | Other — Investment transactions are accounted for on a trade date basis. Each Fund determines the gain or loss realized from the investment transactions by comparing the original cost of the security lot sold with the net sale proceeds. Dividend income is recognized on the ex-dividend date. Certain dividends from foreign securities are recorded when the Funds are informed of the dividend if such information is obtained subsequent to the ex-dividend date. Interest income, if any, is recognized on an accrual basis and includes amortization of premiums and accretion of discounts. Income, as well as gains and losses, both realized and unrealized, are allocated daily to each class of shares in proportion to their respective net assets of each Fund. |
During the six-month period ended March 31, 2024, the Funds’ fund accountant reimbursed the Funds, including interest, for a historical billing processing issue. The fund accountant reimbursed (in thousands) less than $1 to the Focus Fund and Growth Fund, respectively, and $1, $34, and $9 to the Midcap Growth Focus Fund, International Opportunities Fund, and Global Fund, respectively. These amounts are included in Paid-in-capital on the Statements of Assets and Liabilities and Capital Share Transactions on the Statements of Changes in Net Assets for each of the Funds. The reimbursements did not have a significant effect on the total return for the respective share classes of each of the Funds.
During the year ended September 30, 2023, the Funds’ transfer agent reimbursed the Midcap Growth Focus Fund Institutional Class $6 (in thousands) for a processing issue. The amount is reflected under the caption “Increase from payment by service provider” on the Fund’s Statement of Changes in Net Assets. The impact of the reimbursement to the total return and per share information for the Midcap Growth Focus Fund Institutional Class is reflected on the Financial Highlights for the share class.
| (i) | Indemnifications — In the normal course of business, the Funds enter into contracts that contain provisions indemnifying other parties against specified potential liabilities. Each Fund’s maximum exposure under these arrangements is unknown as this would involve future claims that may be made against the Fund that have not yet occurred. However, based on experience, the Funds expect the risk of loss in connection with these potential indemnification obligations to be remote. There can be no assurance that material liabilities related to such obligations will not arise in the future, which may adversely impact a Fund. |
42
| NOTES TO FINANCIAL STATEMENTS |
| 3. | Investment Advisory Agreement and Transactions with Affiliates |
Each Fund has an agreement with the Adviser to furnish investment advisory services to the Funds. Each Fund calculates and accrues the investment advisory fee daily based on the following rates (expressed as annual rates) and pays the Adviser monthly:
| Annual Rate of Average Daily Net Assets | Asset Threshold |
| 0.80% | First $250 million |
| 0.75% | Next $250 million |
| 0.70% | Next $250 million |
| 0.65% | In excess of $750 million |
The Adviser has entered into a written expense limitation and fee waiver agreement under which it has agreed (i) to limit the total expenses of the Investor Class of each Fund (excluding taxes, interest, acquired fund fees and expenses, litigation, extraordinary expenses, and brokerage and other transaction expenses relating to the purchase or sale of portfolio investments) to an annual rate of 1.50% of the average net assets attributable to Investor Class shares of the International Opportunities Fund and Global Fund, and 1.45% of the average net assets attributable to Investor Class shares of the Focus Fund, Growth Fund and Midcap Growth Focus Fund, and (ii) to limit the total expenses of the Institutional Class of each Fund (excluding taxes, interest, acquired fund fees and expenses, litigation, extraordinary expenses, and brokerage and other transaction expenses relating to the purchase or sale of portfolio investments) to an annual rate of 1.25% of the average net assets attributable to Institutional Class shares of the International Opportunities Fund and Global Fund, and 1.20% of the average net assets attributable to Institutional Class shares of the Focus Fund, Growth Fund and Midcap Growth Focus Fund, until January 31, 2025. This expense limitation and fee waiver agreement may be terminated by the Adviser at any time after January 31, 2025, upon 15 days prior notice to the Fund and its administrator. Amounts waived/reimbursed by the Adviser in accordance with this agreement are included in “Less waiver of expenses and expenses paid indirectly” on the Statements of Operations.
The Adviser may recoup from a Fund (or share class as applicable) any fees previously waived and/or expenses previously reimbursed by the Adviser with respect to that Fund or share class, as applicable, including any applicable waivers which may apply to a specific share class, pursuant to this agreement (including waivers or reimbursements under previous expense limitations), if (1) such recoupment by the Adviser does not cause the Fund’s share class, at the time of recoupment, to exceed the lesser of (a) the expense limitation in effect at the time the relevant amount was waived and/or reimbursed, or (b) the expense limitation in effect at the time of the proposed recoupment, (2) the recoupment is made within three years after the fiscal year end date as of which the amount to be waived or reimbursed was determined and the waiver or reimbursement occurred, and (3) the Adviser has not agreed to forego recoupment. In accordance with the Funds’ Multi-Class Plan, amounts eligible for recoupment from periods prior to the addition of the Institutional Class will continue to be eligible for recoupment from the Investor Class. Amounts received by the Adviser for previously waived or reimbursed expenses are included in “Recoupment of previously waived expenses” on the Statements of Operations.
During the six-month period ended March 31, 2024, the Adviser waived or reimbursed amounts or received reimbursements for previously waived or reimbursed expenses from the respective share class of each of the applicable Funds as follows:
| (Amounts in thousands) | | Fees Waived/Reimbursed
by the Adviser | | | Recoupment of Previously
Waived Expenses | |
| Focus Fund |
| Investor Class | | $ | — | | | $ | 183 | |
| Institutional Class | | $ | — | | | $ | 21 | |
| Growth Fund | | | | | | | | |
| Investor Class | | $ | — | | | $ | 35 | |
| Institutional Class | | $ | — | | | $ | 7 | |
| International Opportunities Fund | | | | | | | | |
| Investor Class | | $ | 58 | | | $ | — | |
| Institutional Class | | $ | 10 | | | $ | — | |
| Global Fund | | | | | | | | |
| Investor Class | | $ | 5 | | | $ | — | |
| Institutional Class | | $ | — | | | $ | 2 | |
43
| NOTES TO FINANCIAL STATEMENTS |
NOTES TO FINANCIAL STATEMENTS March 31, 2024 (Unaudited) (continued)
As of March 31, 2024, recoupment amounts (in thousands) that may potentially be made by the respective share class of each of the applicable Funds to the Adviser are as follows:
| | | | International
Opportunities Fund | | | Global Fund | |
| Year of Expiration | | | Investor Class | | | Institutional Class | | | Investor Class | | | Institutional Class | |
| 2024 | | | $ | 107 | | | $ | — | | | $ | — | | | $ | — | |
| 2025 | | | | 96 | | | | 18 | | | | — | | | | — | |
| 2026 | | | | 126 | | | | 23 | | | | 60 | | | | 4 | |
| 2027 | | | | 58 | | | | 10 | | | | 5 | | | | — | |
| | | | $ | 387 | | | $ | 51 | | | $ | 65 | | | $ | 4 | |
During the year ended September 30, 2023, the Adviser voluntarily reimbursed legal fees of (in thousands) $74, $31, $30, $5, and $20 to the Focus Fund, Growth Fund, Midcap Growth Focus Fund, International Opportunities Fund, and Global Fund, respectively. These amounts are not subject to recoupment by the Adviser.
Certain officers of the Trust are also officers of the Adviser. The Funds pay a portion of the Chief Compliance Officer’s total compensation costs which is shown as part of the expense account “Professional fees” on the Statements of Operations. No other officers of the Trust received compensation from the Funds during the six-month period ended March 31, 2024.
| 4. | Distribution and Service Plan |
The Funds have adopted a Distribution and Service Plan pursuant to Rule 12b-1 under the 1940 Act, and effective November 17, 2021, the Board of Trustees approved a Third Amended and Restated Distribution and Service Plan (as amended, the “Plan”). The Plan authorizes payments by the Funds in connection with the distribution of their Investor Class shares at an annual rate, as determined from time to time by the Board of Trustees, of up to 0.25% of a Fund’s average daily net assets attributable to Investor Class shares. Institutional Class shares of the Funds are not subject to a 12b-1 fee. The Plan clarifies that while the maximum 12b-1 Fee rate remains limited to 0.25% per annum of each Fund’s average daily net assets attributable to Investor Class shares, one or more Funds may be charged a lower rate from time to time upon approval by the Board of Trustees, and the rate may vary by Fund. Each Fund currently accrues 12b-1 Fees for its Investor Class shares at a rate of 0.25% per annum of the average daily net assets attributable to Investor Class shares of the Fund until such time as the Board authorizes a different rate. The Plan also clarifies that previously accrued amounts of the 12b-1 Fee for each Fund may be used by that Fund to pay any current or previously accrued expenses of the Fund authorized by the Plan, including non-distribution expenses, authorized by the Plan.
Payments may be made by the Funds under the Plan for the purpose of financing any activity primarily intended to result in the sales of Investor Class shares of the Funds, as determined by the Board of Trustees, as well as for account maintenance and personal services to Investor Class shareholders and any other non-distribution-related services. The Adviser may, out of its own resources (which may include legitimate profits from providing advisory services to the Funds or other clients) and at its sole discretion, make certain payments on behalf of the Funds or the Plan for expenses incurred by a Fund for distribution of Fund shares and related services or for administrative or other expenses incurred by the Fund.
| 5. | Investment Transactions |
The aggregate purchases and sales of securities, excluding short-term investments, for the Funds for the six-month period ended March 31, 2024, were as follows:
| (Amounts in thousands) | | Focus
Fund | | | Growth
Fund | | | Midcap
Growth Focus
Fund | | | International
Opportunities
Fund | | | Global
Fund | |
| Purchases | | $ | 232,973 | | | $ | 130,475 | | | $ | 71,410 | | | $ | 14,732 | | | $ | 69,992 | |
| Sales | | $ | 204,041 | | | $ | 108,255 | | | $ | 80,590 | | | $ | 17,541 | | | $ | 64,609 | |
There were no purchases or sales of US government securities, excluding short-term investments.
| 6. | Market Developments, Events, and Risks |
Global economies and financial markets increasingly are interconnected, and conditions and events in one country, region or financial market may adversely impact markets, issuers, or economies in different countries, regions or financial markets. These risks may be magnified if certain events or developments adversely affect the safety or health of individuals around the world or interrupt the global supply chain. In these and other circumstances, such risks might affect companies and investments worldwide. As a result, local, regional or global events such as war, acts of terrorism, the spread of infectious illness or other public health issues, inflation, rising interest rates, recessions or other events could have a significant negative impact on global economic and market conditions. Such events could adversely affect the operational and financial performance of the issuers of securities in which the Funds invest, and such uncertainty may in turn continue to impact the value of the Funds’ investments.
44
| NOTES TO FINANCIAL STATEMENTS |
| 7. | Federal Income Tax Information |
“Accounting for Uncertainty in Income Taxes” (the “Income Tax Statement”) requires an evaluation of tax positions taken (or expected to be taken) in the course of preparing a Fund’s tax returns to determine whether these positions meet a “more-likely-than-not” standard that, based on the technical merits, have a more than fifty percent likelihood of being sustained by a taxing authority upon examination. A tax position that meets the “more-likely-than-not” recognition threshold is measured to determine the amount of benefit to recognize in the financial statements. The Funds recognize interest and penalties, if any, related to unrecognized tax benefits as income tax expense in the Statements of Operations.
The Income Tax Statement requires management of the Funds to analyze all open tax years, consisting of fiscal years 2020-2024 as defined by Internal Revenue Service (“IRS”) statute of limitations for all major jurisdictions, including federal tax authorities and certain state tax authorities. As of and during the six-month period ended March 31, 2024, the Funds did not have any liabilities for any unrecognized tax benefits. The Funds have no examinations in progress and are not aware of any tax positions for which it is reasonably possible that the total amounts of unrecognized tax benefits will significantly change in the next twelve months.
At March 31, 2024, gross unrealized appreciation and depreciation of investments, based on cost for federal income tax purposes, were as follows:
| (Amounts in thousands) | | Focus
Fund | | | Growth
Fund | | | Midcap
Growth Focus
Fund | | | International
Opportunities
Fund | | | Global
Fund | |
| Cost of Investments | | $ | 467,663 | | | $ | 236,456 | | | $ | 173,394 | | | $ | 31,475 | | | $ | 140,322 | |
| Gross Unrealized Appreciation | | $ | 499,675 | | | $ | 182,747 | | | $ | 114,600 | | | $ | 16,633 | | | $ | 103,806 | |
| Gross Unrealized Depreciation | | | (2,183 | ) | | | (472 | ) | | | (1,051 | ) | | | (64 | ) | | | (489 | ) |
| Net Unrealized Appreciation on Investments | | $ | 497,492 | | | $ | 182,275 | | | $ | 113,549 | | | $ | 16,569 | | | $ | 103,317 | |
The difference between cost amounts for financial statement and federal income tax purposes is due primarily to wash sale loss deferrals.
At September 30, 2023, for federal income tax purposes, the Funds had accumulated capital loss carryforwards as follows:
| (Amounts in thousands) | | Focus
Fund | | | Growth
Fund | | | Midcap
Growth Focus
Fund | | | International
Opportunities
Fund | | | Global
Fund | |
| Not Subject to Expiration | | $ | — | | | $ | — | | | $ | — | | | $ | 675 | | | $ | — | |
To the extent that a Fund may realize future net capital gains, those gains will be offset by any of its unused capital loss carryforwards if and to the extent a Fund is able to under the Internal Revenue Code. The Funds are permitted to carryforward capital losses incurred indefinitely.
During the year ended September 30, 2023, the Growth Fund utilized capital loss carryforwards of $4,272 (in thousands).
As of September 30, 2023, the Focus Fund, Growth Fund, Midcap Growth Focus Fund, International Opportunities Fund, and Global Fund, respectively, had (in thousands) $2,120, $1,132, $996, $0, and $394 of qualified late-year losses, which are deferred until fiscal year 2024 for tax purposes. Net late-year losses that are deferred are deemed to arise on the first day of the Fund’s next taxable year.
As of September 30, 2023, the components of accumulated earnings on a tax basis were as follows:
| (Amounts in thousands) | | Focus
Fund | | | Growth
Fund | | | Midcap
Growth Focus
Fund | | | International
Opportunities
Fund | | | Global
Fund | |
| Undistributed Ordinary Income | | $ | — | | | $ | — | | | $ | — | | | $ | 128 | | | $ | — | |
| Undistributed Trustees’ Deferred Compensation | | | (5,355 | ) | | | (2,201 | ) | | | (1,030 | ) | | | (354 | ) | | | (2,354 | ) |
| Undistributed Long-Term Capital Gains | | | 16,035 | | | | 5,734 | | | | 3,198 | | | | — | | | | 3,443 | |
| Tax Accumulated Earnings (Loss) | | | 10,680 | | | | 3,533 | | | | 2,168 | | | | (226 | ) | | | 1,089 | |
| Accumulated Capital and Other Losses | | | (2,120 | ) | | | (1,132 | ) | | | (996 | ) | | | (675 | ) | | | (394 | ) |
| Net Unrealized Appreciation on Investments | | | 277,482 | | | | 96,900 | | | | 61,867 | | | | 5,307 | | | | 53,454 | |
Net Unrealized Depreciation on
Foreign Currency Translations | | | — | | | | — | | | | — | | | | (5 | ) | | | (3 | ) |
| Trustees’ Deferred Compensation Mark-to-Market | | | 1,011 | | | | 320 | | | | 20 | | | | 4 | | | | 64 | |
| Total Accumulated Earnings | | $ | 287,053 | | | $ | 99,621 | | | $ | 63,059 | | | $ | 4,405 | | | $ | 54,210 | |
45
| NOTES TO FINANCIAL STATEMENTS |
NOTES TO FINANCIAL STATEMENTS March 31, 2024 (Unaudited) (continued)
The tax character of distributions paid during the fiscal years ended September 30, 2023 and 2022 was as follows:
| | | 2023 | | | 2022 | |
| (Amounts in thousands) | | Ordinary Income | | | Long-Term Capital Gains | | | Ordinary Income | | | Long-Term Capital Gains | |
| Focus Fund | | $ | — | | | $ | 84,566 | | | $ | 11,039 | | | $ | 88,740 | |
| Growth Fund | | | — | | | | — | | | | 27,446 | | | | 92,401 | |
| Midcap Growth Focus Fund | | | — | | | | — | | | | 2,237 | | | | 45,931 | |
| International Opportunities Fund | | | 61 | | | | — | | | | 1,774 | | | | 5,331 | |
| Global Fund | | | — | | | | 6,325 | | | | 3,670 | | | | 45,305 | |
The tax character of dividends paid may differ from that shown in the Financial Highlights due to short-term gains being treated as ordinary income for tax purposes.
Management of the Adviser has determined that there were no material subsequent events that would require disclosure in the Funds’ financial statements.
46
EXPENSE EXAMPLE For the six-month period ended March 31, 2024 (Unaudited)
As a shareholder of the Marsico Funds (the “Funds”), you incur two types of costs: (1) transaction costs, including redemption fees (if any), and (2) ongoing costs, including management fees, distribution (12b-1) fees (if any), and other Fund expenses. This Example is intended to help you understand your ongoing costs (in dollars) of investing in the Funds and to compare these costs with the ongoing costs of investing in other mutual funds.
The Example is based on an investment of $1,000 invested at the beginning of the period and held for the entire period from October 1, 2023 to March 31, 2024 (the “period”).
Actual Expenses
The first line of the table below provides information about actual account values and actual expenses. You may use the information in this line, together with the amount you invested, to estimate the expenses you paid over the period. Simply divide your account value by $1,000 (for example, an $8,600 account value divided by $1,000 equals 8.6), then multiply the result by the number in the first line under the heading entitled “Expenses paid for the six-month period ended March 31, 2024” to estimate the expenses you paid on your account during the period.
Hypothetical Example for Comparison Purposes
The second line of the table below provides information about hypothetical account values and hypothetical expenses based on the respective Fund/Class’s actual expense ratios and an assumed rate of return of 5% per year before expenses, which is not the respective Fund/Class’s actual return of any of the Funds. The hypothetical account values and expenses may not be used to estimate the actual ending account balance or expenses you paid for the period. You may use this information to compare the ongoing costs of investing in the Funds and other funds. To do so, compare this 5% hypothetical example with the 5% hypothetical examples that appear in the shareholder reports of other funds.
Please note that the expenses shown in the table are meant to highlight your ongoing costs only and do not reflect any transactional costs such as redemption fees (if any). Therefore, the second line of the table is useful in comparing the ongoing costs only, and will not help you determine the relative total costs of owning different funds. In addition, if these transactional costs (if any) were included, your costs could have been higher.
| | Annualized
expense ratio | Beginning
account value
October 1, 2023 | Ending
account value
March 31, 2024 | Expenses paid for the
six-month period ended
March 31, 2024(1) |
| FOCUS FUND |
| Investor Class: |
| Actual Example | 1.36% | $ 1,000.00 | $ 1,359.60 | $ 8.02 |
Hypothetical Example, assuming a 5%
return before expenses | | $ 1,000.00 | $ 1,018.20 | $ 6.86 |
| | | | | |
| Institutional Class: |
| Actual Example | 1.07% | $ 1,000.00 | $ 1,361.80 | $ 6.32 |
Hypothetical Example, assuming a 5%
return before expenses | | $ 1,000.00 | $ 1,019.65 | $ 5.40 |
| | | | | |
| GROWTH FUND |
| Investor Class: |
| Actual Example | 1.38% | $ 1,000.00 | $ 1,328.80 | $ 8.04 |
Hypothetical Example, assuming a 5%
return before expenses | | $ 1,000.00 | $ 1,018.09 | $ 6.97 |
| | | | | |
| Institutional Class: |
| Actual Example | 1.15% | $ 1,000.00 | $ 1,329.40 | $ 6.67 |
Hypothetical Example, assuming a 5%
return before expenses | | $ 1,000.00 | $ 1,019.27 | $ 5.79 |
47
EXPENSE EXAMPLE For the six-month period ended March 31, 2024 (Unaudited) (continued)
| | Annualized
expense ratio | Beginning
account value
October 1, 2023 | Ending
account value
March 31, 2024 | Expenses paid for the
six-month period ended
March 31, 2024(1) |
| MIDCAP GROWTH FOCUS FUND |
| Investor Class: |
| Actual Example | 1.43% | $ 1,000.00 | $ 1,277.60 | $ 8.12 |
Hypothetical Example, assuming a 5%
return before expenses | | $ 1,000.00 | $ 1,017.87 | $ 7.19 |
| | | | | |
| Institutional Class: |
| Actual Example | 1.18% | $ 1,000.00 | $ 1,279.00 | $ 6.75 |
Hypothetical Example, assuming a 5%
return before expenses | | $ 1,000.00 | $ 1,019.08 | $ 5.98 |
| | | | | |
| INTERNATIONAL OPPORTUNITIES FUND |
| Investor Class: |
| Actual Example | 1.50% | $ 1,000.00 | $ 1,349.70 | $ 8.81 |
Hypothetical Example, assuming a 5%
return before expenses | | $ 1,000.00 | $ 1,017.50 | $ 7.57 |
| | | | | |
| Institutional Class: |
| Actual Example | 1.25% | $ 1,000.00 | $ 1,351.70 | $ 7.35 |
Hypothetical Example, assuming a 5%
return before expenses | | $ 1,000.00 | $ 1,018.75 | $ 6.31 |
| | | | | |
| GLOBAL FUND |
| Investor Class: |
| Actual Example | 1.50% | $ 1,000.00 | $ 1,369.90 | $ 8.89 |
Hypothetical Example, assuming a 5%
return before expenses | | $ 1,000.00 | $ 1,017.50 | $ 7.57 |
| | | | | |
| Institutional Class: |
| Actual Example | 1.25% | $ 1,000.00 | $ 1,371.60 | $ 7.41 |
Hypothetical Example, assuming a 5%
return before expenses | | $ 1,000.00 | $ 1,018.75 | $ 6.31 |
| (1) | Expenses are equal to the annualized expense ratio for the respective share class multiplied by the average account value over the period, multiplied by 183/366 (to reflect the six-month period). |
48
| CONSIDERATION OF INVESTMENT ADVISORY AGREEMENTS |
CONSIDERATION OF INVESTMENT ADVISORY AGREEMENTS (Unaudited)
At an in-person meeting of the Board of Trustees of the Trust held on November 15, 2023, the Trustees, by a unanimous vote (including a separate vote of those Trustees who are not “interested persons” (as the term is defined in the 1940 Act) of the Trust (the “Independent Trustees”)), approved the renewal of the Investment Advisory and Management Agreements for the Focus Fund, Growth Fund, Midcap Growth Focus Fund, International Opportunities Fund, and Global Fund (the “Advisory Agreements”). In advance of the meeting, the Independent Trustees requested and received extensive materials from Marsico Capital Management, LLC (the “Adviser” or “MCM”) to assist them in considering the renewal of the Advisory Agreements. The materials provided by the Adviser contained information with respect to the factors noted below, including detailed information relating to the performance, advisory fees and other expenses of the Funds, funds sub-advised by the Adviser and non-fund advisory accounts of the Adviser. The materials also included comparisons of the Funds with third party funds of similar size and investment objectives in terms of performance, fees and other expenses, as well as the performance of each Fund versus its benchmark. In addition, the Adviser provided information regarding its overall expenses and profitability, as well as other information requested by the Trustees.
In addition to the materials prepared specifically for contract review analysis, on an ongoing basis the Trustees receive information and reports from the Adviser and other service providers to the Funds regarding the investment performance of the Funds as well as operational, compliance, marketing and other matters.
The Trustees engaged in a detailed discussion of the materials with management of the Adviser. The Independent Trustees then met separately with independent counsel to the Independent Trustees for a review of the materials. Following this session, the full Board reconvened and approved the continuation of the Advisory Agreements for the Focus Fund, Growth Fund, Midcap Growth Focus Fund, International Opportunities Fund, and Global Fund.
Discussion of Certain Factors Considered
1. Nature, Extent, and Quality of Services. The Independent Trustees considered the nature, extent and quality of the services performed by Marsico Capital Management, LLC (“MCM” or the “Adviser”) under the Investment Advisory and Management Agreements (the “Advisory Agreements”) with the Adviser, including portfolio management, supervision of Fund operations, regulatory filings and disclosures to shareholders, compliance functions, general oversight of other service providers, coordination of marketing initiatives, review of Fund legal issues, and other services. The Independent Trustees also considered the personnel who provide these services, which includes a team of individuals collectively having years of experience in their particular areas of expertise. The Independent Trustees reviewed the Adviser’s investment philosophy and experience, noting that the Adviser and its affiliates employ a focused stock-picking strategy that involves extensive research. The Independent Trustees noted MCM’s continued investment in research. The Independent Trustees discussed the Adviser’s ability to continue to provide the same level and quality of services to the Funds, and discussed with members of management of MCM the financial condition of the Adviser and its ability to attract and retain experienced personnel. The Independent Trustees considered the reinvestment in MCM by Mr. T. Marsico and the steps taken to ensure the continued financial viability of the Adviser. The Independent Trustees also discussed MCM’s commitment to devoting substantial resources to the Adviser’s investment management process. The Independent Trustees concluded that the services provided by the Adviser are extensive in nature, that the Adviser employs investment advisory personnel who consistently delivered a high level of service and that, with respect to third-party service providers, the Adviser effectively manages the outsourcing by the Funds of certain services to other service providers and the oversight of those service providers.
2. Investment Performance of the Funds and Adviser. The Independent Trustees considered the Adviser’s substantial investment advisory experience and capabilities. The Independent Trustees considered short-term and long-term investment performance for each Fund over various periods of time as compared to both relevant equity indices and the performance of each Fund’s Morningstar peer group universe. The Independent Trustees noted the positive performance of the Investor Class Shares and the Institutional Class Shares of the Funds over their benchmarks and peer group averages for various time periods, including the positive performance of three of the Funds’ share classes relative to those metrics over the year-to-date (as of September 30, 2023) and 1-year periods, and discussed with representatives of the Adviser the factors underlying the performance of the Funds over various time periods. The Independent Trustees discussed the Funds’ performance with representatives of MCM and concluded that the Adviser was delivering acceptable performance results consistent with the long-term investment strategies being pursued by the Funds. The Independent Trustees took into account that they regularly review each Fund’s performance.
The Independent Trustees noted that the investment performance delivered by the Adviser to the Funds appeared to be generally consistent with the performance delivered for other clients of the Adviser with similar strategies. Based on this review, the Independent Trustees concluded that the performance of the Adviser with respect to each Fund was acceptable for the purposes of approving the Advisory Agreements.
49
| CONSIDERATION OF INVESTMENT ADVISORY AGREEMENTS |
CONSIDERATION OF INVESTMENT ADVISORY AGREEMENTS (Unaudited) (continued)
3. Costs of Services and Profits Realized by the Adviser.
(a) Costs of Services to Funds: Fees and Expenses. The Independent Trustees considered each Fund’s management fee rates and expense ratios relative to industry averages for the Fund’s benchmark category and the advisory fees charged by the Adviser to other clients, including information regarding expense limitation commitments from the Adviser, and the breakpoints in the advisory fee schedule for all of the Funds. The Independent Trustees noted that the information provided by MCM stated that the mix of services under the Advisory Agreements is much more extensive than services provided under the Adviser’s advisory agreements for sub-advised and non-fund clients.
The Independent Trustees also noted previous actions taken by MCM to reduce Fund expenses, including that MCM had waived fees and absorbed expenses from time to time, and that some of those expenditures may not be recouped. The Independent Trustees reviewed various expense information and noted that overall Fund expenses are in a range that continues to be reasonable. The Trustees also noted other recent actions that have been taken to reduce expenses. The Independent Trustees concluded that the investment advisory fees are acceptable based upon the qualifications, experience, reputation, and performance of the Adviser and the overall expense ratios of the Funds.
(b) Profitability and Costs of Services to Adviser. The Independent Trustees reviewed the information provided by MCM regarding its overall profitability and costs and an estimate of the Adviser’s profitability and costs in serving the Funds as part of MCM’s overall investment management business serving many clients. The Independent Trustees noted that MCM’s estimated overall profitability from managing the Funds increased only slightly during the fiscal year ended September 30, 2023, that estimated profit margins were low overall, that the profit margins for two Funds were negative, and that MCM had not reduced its services, but continued to devote substantial resources and personnel to the Funds. The Independent Trustees also noted that the Adviser previously had substantially increased its resources devoted to Fund matters in response to regulatory requirements enacted in prior years. The Independent Trustees discussed the level of estimated profit of MCM from its relationship to the Funds and considered profitability levels reviewed by federal courts that were found to be reasonable. The Independent Trustees concluded that the estimated profits received by the Adviser under the Advisory Agreements were acceptable for purposes of approving the Advisory Agreements.
4. Extent of Economies of Scale as Funds Grow. The Independent Trustees considered whether there have been economies of scale with respect to the management of each Fund and whether such Fund has appropriately benefited from any economies of scale. The Independent Trustees noted that economies of scale may develop for certain Funds as their assets increase and their Fund-level expenses decline as a percentage of assets, but that Fund-level economies of scale may not necessarily result in Adviser-level economies of scale. The Independent Trustees agreed that it was possible that Adviser-level expenses incurred in managing the Funds eventually may decline as a percentage of management fees, especially if the assets of certain Funds continue to grow beyond certain thresholds. The Independent Trustees noted that should economies of scale be realized in the future, the advisory fee schedule contains breakpoints that would benefit shareholders of the Funds as assets increase.
5. Whether Fee Levels Reflect Economies of Scale. The Independent Trustees also considered whether the management fee rate is reasonable in relation to the asset size of each Fund and any economies of scale that may exist. The Independent Trustees noted that the management fee schedule for each Fund contained breakpoints and that MCM had agreed to expense limitations for the Funds that would remain in place until at least January 31, 2025.
6. Other Relevant Considerations. The Independent Trustees considered the character and amount of other incidental benefits received by the Adviser and its affiliates from their association with the Funds. The Independent Trustees concluded that potential ancillary or “fall-out” benefits that the Adviser may receive, such as greater name recognition or increased ability to obtain research or brokerage services, appear to be reasonable, and may in some cases benefit the Funds.
Conclusions.
In considering the Advisory Agreements, the Independent Trustees did not identify any factor as all-important or all-controlling and instead considered these factors collectively in light of each Fund’s surrounding circumstances. Based on this review, it was the judgment of the Independent Trustees that each Fund’s fees were reasonable, the extent and quality of services were acceptable, and performance of the Funds was acceptable. Therefore, re-approval of the Advisory Agreements was in the best interests of each Fund and its shareholders. As a part of their decision-making process, the Independent Trustees noted that the Adviser has managed the Funds since their inception, and the Independent Trustees believe that a long-term relationship with a capable, conscientious adviser is in the best interests of the Funds and their shareholders. The Independent Trustees considered, generally, that shareholders invested in a Fund knowing that the
50
| CONSIDERATION OF INVESTMENT ADVISORY AGREEMENTS |
Adviser managed that Fund. As such, the Independent Trustees considered whether the Adviser managed each Fund in accordance with its investment objectives and policies as disclosed to shareholders. Additionally, as part of its deliberations, the Board also considered the information about the Funds and MCM that had been provided to them throughout the year in connection with their regular Board meetings at which they engage in the ongoing oversight of the Funds and their operations.
Upon conclusion of their review and discussion, the Trustees, including all of the Independent Trustees, unanimously agreed the Advisory Agreements for each of the Funds should be continued.
51
OTHER INFORMATION (Unaudited)
Proxy Voting Guidelines
The Funds exercise the voting rights associated with the securities held by the Funds under the proxy voting policy of the Funds. A description of those policies and procedures of the Funds and a record of the Funds’ proxy votes for the one-year period ended June 30, 2023 are available without charge, upon request, by calling 888-860-8686. It is also available on the Securities and Exchange Commission’s (SEC) website at www.sec.gov.
Quarterly Filing of Portfolio Holdings
The Funds will file their portfolio holdings information for each month in a fiscal quarter within 60 days after the end of the relevant fiscal quarter on Form N-PORT. Portfolio holdings information for the third month of each fiscal quarter will be made available immediately upon filing on the SEC’s website at www.sec.gov.
Cost Basis Information
Federal law requires mutual fund companies to maintain a shareholder’s cost basis by tax lot and report gain/loss information and holding periods for sales of mutual fund shares that are “covered” securities to the IRS and to shareholders on Form 1099. Mutual fund shares, such as shares of the Funds, acquired on or after January 1, 2012 are covered securities. The Funds are not responsible for maintaining and reporting share information for their shares that are not deemed “covered.”
The tax regulations require that the Funds elect a default tax identification methodology in order to perform the required reporting. The Funds have chosen the first-in-first-out method as the default tax lot identification method for its shareholders. This is the method the Funds will use to determine which specific shares are deemed to be sold when a shareholder’s entire position is not sold in a single transaction and is the method in which “covered” share sales will be reported on a shareholder’s Form 1099.
However, at the time of purchase or upon the sale of “covered” shares, shareholders may generally choose a different tax lot identification method. Shareholders should consult a tax advisor with regard to their personal circumstances as the Funds and their service providers do not provide tax advice.
52