UNITED STATES
SECURITIES AND EXCHANGE COMMISSION
Washington, D.C. 20549
FORM N-CSR
CERTIFIED SHAREHOLDER REPORT OF REGISTERED MANAGEMENT INVESTMENT COMPANIES
Investment Company Act File Number: 811-08397
THE MARSICO INVESTMENT FUND
(Exact Name of Registrant as Specified in Charter)
1200 17th Street, Suite 1700
Denver, CO 80202
(Address of Principal Executive Offices) (Zip Code)
The Corporation Trust Company
The Marsico Investment Fund
Corporation Trust Center 1209 Orange Street
Wilmington, Delaware 19802
(Name and address of Agent for Service of Process)
Copies to:
Anthony H. Zacharski
Dechert LLP
1095 6th Avenue
New York, NY 10036
Registrant's Telephone Number, including Area Code: 1-888-860-8686
Date of fiscal year end: September 30
Date of Reporting Period: March 31, 2022
| Item 1. | Reports to Stockholders |
DEAR SHAREHOLDER:
Enclosed is your semi-annual report for each portfolio of The Marsico Investment Fund (the “Marsico Funds”) encompassing the six-month period from October 1, 2021 to March 31, 2022.
The purpose of this report is to provide a review of the Marsico Funds’ six-month investment results by discussing what we believe were the main areas that impacted performance – including the macroeconomic environment, sector and industry positioning, and individual stock selection – as compared to the Funds’ performance benchmark indices.
For updated information regarding each Fund’s overall investment positioning and performance, please refer to the Funds’ website at marsicofunds.com.(1)
Other Developments:
Effective December 6, 2021, the existing shares of each of the Marsico Funds were redesignated as Investor Class shares and the Institutional Class of shares for each of the Marsico Funds commenced operations.
(1) | The references to the Marsico Funds website (marsicofunds.com) included throughout this semi-annual report do not incorporate the website’s contents into this report. |
| | | |
KEY FUND STATISTICS | 2 |
MARKET ENVIRONMENT | 5 |
MARSICO FOCUS FUND |
Investment Review | 6 |
Fund Overview | 8 |
Schedule of Investments | 9 |
MARSICO GROWTH FUND |
Investment Review | 10 |
Fund Overview | 12 |
Schedule of Investments | 13 |
MARSICO MIDCAP GROWTH FOCUS FUND |
Investment Review | 14 |
Fund Overview | 16 |
Schedule of Investments | 17 |
MARSICO INTERNATIONAL OPPORTUNITIES FUND |
Investment Review | 19 |
Fund Overview | 21 |
Schedule of Investments | 22 |
MARSICO GLOBAL FUND | |
Investment Review | 24 |
Fund Overview | 26 |
Schedule of Investments | 27 |
FINANCIAL STATEMENTS | 28 |
NOTES TO FINANCIAL STATEMENTS | 38 |
EXPENSE EXAMPLE | 45 |
CONSIDERATION OF INVESTMENT ADVISORY AGREEMENTS | 47 |
OTHER INFORMATION | 50 |
1
KEY FUND STATISTICS (UNAUDITED) |
Marsico Focus Fund | Marsico Growth Fund | Marsico
Midcap Growth
Focus Fund |
For additional disclosures, please see page 8. | For additional disclosures, please see page 12. | For additional disclosures, please see page 16. |
PERFORMANCE COMPARISON(1) | PERFORMANCE COMPARISON(1)(2) | PERFORMANCE COMPARISON(1)(2) |
Average Annualized Returns | Average Annualized Returns | Average Annualized Returns |
| 
| 
|
INVESTOR CLASS TOTAL ANNUAL OPERATING EXPENSES* 1.34%
INSTITUTIONAL CLASS TOTAL ANNUAL OPERATING EXPENSES* 1.11% | INVESTOR CLASS TOTAL ANNUAL OPERATING EXPENSES* 1.34%
INSTITUTIONAL CLASS TOTAL ANNUAL OPERATING EXPENSES* 1.14% | INVESTOR CLASS TOTAL ANNUAL OPERATING EXPENSES* 1.33%
INSTITUTIONAL CLASS TOTAL ANNUAL OPERATING EXPENSES* 1.15% |
SECTOR ALLOCATION(4) | SECTOR ALLOCATION(4) | SECTOR ALLOCATION(4) |
| 
| 
|
TOP FIVE HOLDINGS | TOP FIVE HOLDINGS | TOP FIVE HOLDINGS |
| | | |
| | Apple, Inc. | 8.87% | | | Alphabet, Inc. - Cl. A | 8.60% | | | DexCom, Inc. | 3.23% |
| | Microsoft Corp. | 8.43% | | | Microsoft Corp. | 7.93% | | | Insulet Corp. | 3.18% |
| | Alphabet, Inc. - Cl. A | 7.47% | | | Apple, Inc. | 6.96% | | | Cintas Corp. | 3.06% |
| | Amazon.com, Inc. | 7.37% | | | Amazon.com, Inc. | 6.56% | | | FirstService Corp. | 2.99% |
| | Meta Platforms, Inc. - Cl. A | 5.38% | | | Mastercard, Inc. - Cl. A | 6.32% | | | Constellation Software, Inc. | 2.87% |
| | | | | | | | | | | |
For additional disclosures about the Marsico Funds, please see page 4. The performance data quoted here represent past performance, and past performance is not a guarantee of future results. Investment return and principal value of an investment will fluctuate so that an investor’s shares, when redeemed, may be worth more or less than their original cost.
2
KEY FUND STATISTICS (UNAUDITED) |
Marsico International
Opportunities Fund | Marsico Global Fund |
For additional disclosures, please see page 21. | For additional disclosures, please see page 26. |
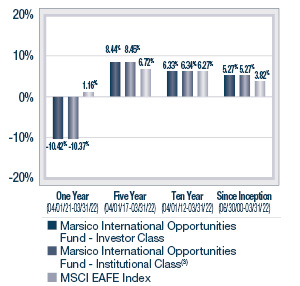
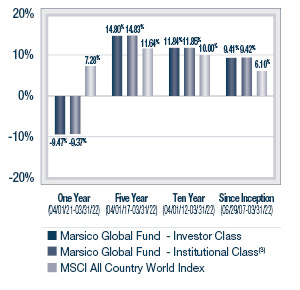
PERFORMANCE COMPARISON(1)(2) | PERFORMANCE COMPARISON(1)(2) |
Average Annualized Returns | Average Annualized Returns |
| 
|
INVESTOR CLASS TOTAL ANNUAL OPERATING EXPENSES* 1.68% NET EXPENSES*† 1.50%
INSTITUTIONAL CLASS TOTAL ANNUAL OPERATING EXPENSES* 1.84% NET EXPENSES*† 1.25% | INVESTOR CLASS TOTAL ANNUAL OPERATING EXPENSES* 1.37% NET EXPENSES*† 1.45%
INSTITUTIONAL CLASS TOTAL ANNUAL OPERATING EXPENSES* 1.16% |
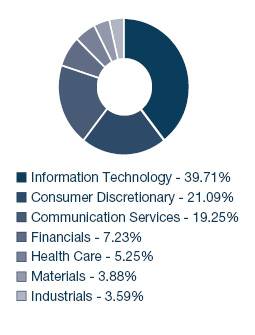
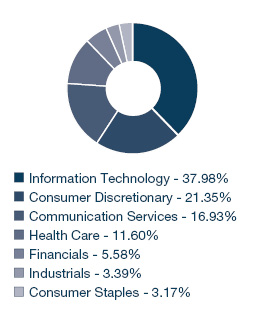
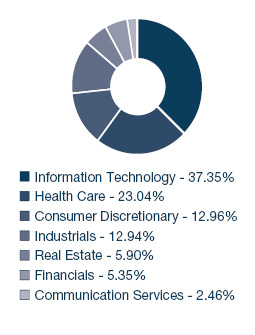
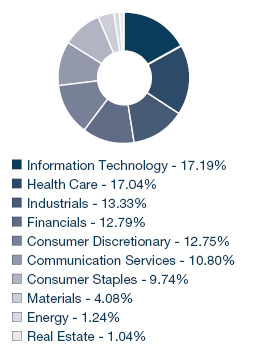
SECTOR ALLOCATION(4) | SECTOR ALLOCATION(4) |
| 
|
TOP FIVE HOLDINGS | TOP FIVE HOLDINGS |
| | | | | | | | |
| | AstraZeneca PLC | 3.77% | | | Apple, Inc. | 8.19% | |
| | Airbus S.E. | 3.66% | | | Amazon.com, Inc. | 8.08% | |
| | Roche Holding A.G. | 3.62% | | | Microsoft Corp. | 7.81% | |
| | ASML Holding N.V. | 3.55% | | | ASML Holding N.V. - NY Reg. Shs. | 5.69% | |
| | Nestlé S.A. | 3.41% | | | Hermes International | 4.57% | |
| | | | | | | | |
Current performance may be lower or higher than the performance information quoted. To obtain performance information current to the most recent month-end, please call 888-860-8686 or visit marsicofunds.com.
3
KEY FUND STATISTICS (UNAUDITED) |
ADDITIONAL DISCLOSURES ABOUT THE MARSICO FUNDS
* | The Total Annual Operating Expenses and Net Expenses are reflective of the information disclosed in the Funds’ Prospectus dated January 31, 2022. The information may differ from the expense ratios disclosed in this report. |
† | Marsico Capital Management, LLC (the “Adviser”) has entered into a written expense limitation and fee waiver agreement under which it has agreed (i) to limit the total expenses of the Investor Class of each Fund (excluding taxes, interest, acquired fund fees and expenses, litigation, extraordinary expenses, and brokerage and other transaction expenses relating to the purchase or sale of portfolio investments) to an annual rate of 1.50% of the average net assets attributable to Investor Class shares of the International Opportunities Fund and Global Fund, and (ii) to limit the total expenses of the Institutional Class of each Fund (excluding taxes, interest, acquired fund fees and expenses, litigation, extraordinary expenses, and brokerage and other transaction expenses relating to the purchase or sale of portfolio investments) to an annual rate of 1.25% of the average net assets attributable to Institutional Class shares of the International Opportunities Fund and Global Fund, until January 31, 2023. This expense limitation and fee waiver agreement may be terminated by the Adviser at any time after January 31, 2023, upon 15 days prior notice to the Fund and its administrator. The Adviser may recoup from a Fund fees previously waived or expenses previously reimbursed by the Adviser with respect to that Fund pursuant to this agreement (or a previous expense limitation agreement) if: (1) such recoupment by the Adviser does not cause the Fund, at the time of recoupment, to exceed the lesser of (a) the expense limitation in effect at the time the relevant amount was waived and/or reimbursed, or (b) the expense limitation in effect at the time of the proposed recoupment, and (2) the recoupment is made within three years after the fiscal year end date as of which the amount to be waived or reimbursed was determined and the waiver or reimbursement occurred. |
(1) | The performance data quoted here represent past performance, and past performance is not a guarantee of future results. Investment return and principal value of an investment will fluctuate so that an investor’s shares, when redeemed, may be worth more or less than their original cost. Current performance may be lower or higher than the performance information quoted. To obtain performance information current to the most recent month-end, please call 888-860-8686 or visit marsicofunds.com. |
| The performance included in the chart does not reflect the deduction of taxes on Fund distributions or the redemption of Fund shares. |
| All indices are unmanaged and investors cannot invest directly in an index. |
(2) | Periodically, certain fees and expenses have been waived or reimbursed by the Adviser for the Growth Fund, Midcap Growth Focus Fund, International Opportunities Fund, and Global Fund. In the absence of such a waiver or reimbursement, the performance returns reflected would have been reduced. In accordance with the expense limitation and fee waiver agreement, the Adviser may recoup fees and expenses previously waived or reimbursed under certain parameters. Periodically, the Adviser has recouped such fees or expenses from the Growth Fund, Midcap Growth Focus Fund, International Opportunities Fund, and Global Fund, resulting in a lower performance return. |
(3) | Institutional Class shares commenced operations on December 6, 2021. The performance attributed to the Institutional Class shares prior to that date is that of the Investor Class shares. Performance prior to December 6, 2021 has not been adjusted to reflect the lower expenses of the Institutional Class shares. During this period, Institutional Class shares would have had returns similar to, but potentially higher than, Investor Class shares due to the fact that Institutional Class shares represent interests in the same portfolio as Investor Class shares but are typically subject to lower expenses than the Investor Class shares. |
(4) | Sector weightings represent the percentage of the respective Fund’s investments (excluding cash equivalents) in certain general sectors. These sectors may include more than one industry. The Fund’s portfolio composition is subject to change at any time. |
4
MARKET ENVIRONMENT: OCTOBER 2021 – MARCH 2022 (UNAUDITED)
Over the course of the last six months the world and likewise capital markets have had to deal with a confluence of issues, such as the rise of yet another variant of COVID-19 (“Omicron”), rising and persistent inflationary pressures driven by imbalances created during the COVID-19 pandemic, and tragically, the outbreak of war between Russia and Ukraine, which has obvious and significant global security and economic implications. While we can envision a path toward improving conditions, the range of outcomes are wide and we anticipate many of these issues will continue to remain front and center for capital markets for the foreseeable future. Within this context, we continue to believe a portfolio of innovative, high-quality growth companies is well-positioned to navigate this uncertain environment.
The war between Russia and Ukraine created a stunning change in global security and economic conditions, upending decades-long globalization trends, which supported low inflation global GDP growth. While the human tragedy seems unimaginable, disruptions to Ukraine’s agriculture sector (which, when combined with Russia’s, is estimated to produce more than 10% of global calories consumed) have significant implications for the global food supply and have led to dramatic price rises in grain commodities. Similarly, Ukraine serves as a manufacturing and technology hub for companies around the world and the war has led companies like BMW and Volkswagen to slow and, in certain cases, halt Western European automobile production. Significant sanctions imposed by Western countries on Russia’s financial, consumer, technology and energy sectors have led to a sharp contraction in the Russian economy and have similarly raised concerns over global energy supply, particularly as it relates to Western Europe, where countries like Germany source roughly 40% of their natural gas needs from Russia. This could put a significant strain on resources across Europe as the need to diversify energy security, improve defense capabilities and undertake humanitarian efforts takes priority.
A consequence of these actions has been a tangible impact on inflation expectations across the globe. Entering the year, we expected year-over-year inflationary trends to peak during the first half of 2022 and subsequently subside as the year progressed due to the combination of base effects, a normalization in goods consumption, improving supply chains, increased labor participation and a change in US Federal Reserve policy. In many respects, this hypothesis is starting to emerge as used car and container shipping prices have begun to moderate, in addition to improving labor participation trends. While we continue to believe these trends will benefit core inflation in 2022, we expect that the recent price spike in energy and grain commodities will likely dampen the improvement and result in inflationary pressures lingering longer than previously anticipated. As a result, the US Federal Reserve has taken a more proactive approach to containing inflation, signaling several interest-rate increases on the horizon as well as a contraction of financial assets on its balance sheet. Across markets, this has resulted in the benchmark 10-Year US Treasury note rate increasing significantly to start the year, creating a divergence in financial asset performance across markets.
These past several years have presented a series of extraordinary events, the likes of which we have never seen. However, during this period, we are generally pleased with our results as we have attempted to stay consistent with our process in identifying high quality growth companies at attractive valuations for investment. While the outlook remains uncertain on many fronts, we will continue to search for opportunities in evolving growth markets in an attempt to drive strong long-term returns for our investors. Thank you for your continued trust.
The performance of US and global markets during the six-month fiscal period ended March 31, 2022 is depicted below. While US markets generally performed well, there was a perceived flight to safety during the time period. Large-capitalization stocks generally performed well, while many stocks perceived to be higher risk were sold due to concerns around inflation, interest rate hikes, labor costs, including wages, and the outbreak of war between Russia and Ukraine.
Index Name(1) | Universe of
Equities Represented | Six-Month Total Return (as of
March 31, 2022) |
US | | |
S&P 500 | US large-capitalization equities | +5.92% |
Russell 3000 | US publicly-traded equities of all capitalizations | +3.51% |
Russell 2000 | US small-capitalization equities | -5.55% |
Russell Mid-Cap Growth | US medium-capitalization equities that exhibit growth characteristics | -10.09% |
Index Name(1) | Universe of
Equities Represented | Six-Month Total Return (as of
March 31, 2022) |
INTERNATIONAL | |
MSCI EAFE (US$) | Equities in developed international equity markets, including Japan, Western Europe, and Australasia | -3.38% |
MSCI Emerging Markets (US$) | Equities in developing international equity markets, including China, India, Eastern Europe, and Latin America | -8.20% |
MSCI ACWI (US$) | Equities in the global developed and emerging markets | +0.96% |
Sincerely,
THE MARSICO INVESTMENT TEAM
(1) | All indices are unmanaged and investors cannot invest directly in an index. Past performance does not guarantee future results. |
5
Investment Review BY TOM MARSICO AND BRANDON GEISLER (UNAUDITED)
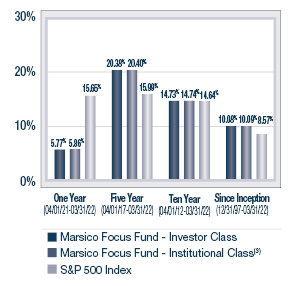
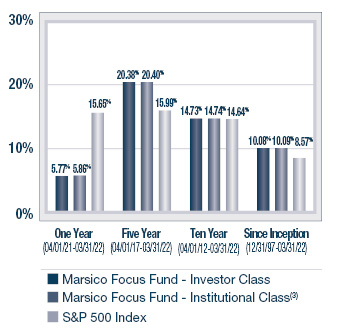
The Marsico Focus Fund’s Investor Class shares and Institutional Class shares posted total returns of -5.60% and -5.52%, respectively, for the six-month fiscal period ended March 31, 2022. The Institutional Class shares commenced operations on December 6, 2021. The performance attributed to the Institutional Class shares prior to that date is that of the Investor Class shares and has not been adjusted to reflect the lower expenses of the Institutional Class shares. During this period, Institutional Class shares would have had returns similar to, but potentially higher than, the Investor Class shares due to the fact that Institutional Class shares represent interests in the same portfolio as Investor Class shares but are subject to lower expenses. The total return information presented here for comparison purposes differs from the total return information disclosed for the Institutional Class shares in the Financial Highlights. The total return information in the Financial Highlights represents the performance for the portion of the fiscal period in which the Institutional Class was operational. The Fund underperformed its benchmark index, the S&P 500 Index, which had a total return of +5.92% over the same time period. Please see the Fund’s Overview for more detailed information about the Fund’s longer-term performance for various time periods ended March 31, 2022.
The performance data quoted here represent past performance, and past performance is not a guarantee of future results. Investment return and principal value of an investment will fluctuate so that an investor’s shares, when redeemed, may be worth more or less than their original cost. Current performance may be lower or higher than the performance information quoted. To obtain performance information current to the most recent month-end, please call 888-860-8686 or visit marsicofunds.com.(1)
This review highlights Fund performance over a six-month fiscal period. Shareholders should keep in mind that the Fund is intended for long-term investors who hold their shares for substantially longer periods of time. You should also keep in mind that our current views and beliefs regarding all investments discussed in this report are subject to change at any time. References to specific securities, industries, and sectors discussed in this report are not recommendations to buy or sell such securities or related investments, and the Fund may not necessarily hold these securities or investments today. Please see the accompanying Schedule of Investments for the percentage of the Fund’s portfolio represented by the securities mentioned in this report as of the end of the reporting period.
The Focus Fund is non-diversified and may hold fewer securities than a diversified fund because it is permitted to invest a greater percentage of its assets in a smaller number of issuers. Holding securities of fewer issuers increases the risk that the value of the Fund could go down because of the poor performance of a single investment or may be more volatile than its benchmark. The Fund is subject to broad risks associated with investing in equity securities markets generally, including the risks that the securities and markets in which it invests may experience volatility and instability, that domestic and global economies and markets may undergo periods of cyclical change and decline, that investors may at times avoid investments in equity securities, and those investments may not perform as anticipated. Please see the Prospectus for more information.
The Fund is not managed to track its benchmark index, and may hold a substantially overweight or underweight position in a sector, industry, or security compared to its weight in the benchmark. The Fund may be subject to risks associated with a particular sector or other area in which it is overweight, including the risk that the stocks of companies within one area could simultaneously decline in price because of an event that affects the entire area. For informational purposes, the discussion below may compare the benchmark weight or performance of a sector or industry to the investment approach of the Fund.
The Focus Fund’s underperformance during the six-month period ended March 31, 2022, as compared to the S&P 500 Index, can be primarily attributed to certain stock selection in the Information Technology and Consumer Discretionary sectors, as defined in the Global Industry Classification Standard (“GICS”)(2). From a sector allocation perspective, the Fund’s relative performance was dampened by maintaining an overweight allocation to the Communication Services sector, the weakest-performing area of the benchmark index, and by having no investments in the Energy sector, which was the strongest-performing sector of the benchmark index.
Despite strong operating results, Consumer Discretionary stock On Holding A.G. – Cl. A (-29%) detracted from overall performance of the Fund due to a broader trade in the market away from high growth, high multiple stocks, given more hawkish commentary from the US Federal Reserve due to inflationary concerns.
Information Technology holding PayPal Holdings, Inc. (-44%) detracted significantly from performance amid growing competition in online checkout options and diminishing e-commerce tailwinds relative to the previous six months, both of which have challenged investor sentiment. Additionally, it remains unclear how cryptocurrencies, blockchain technology, and stablecoins may continue to impact and potentially disrupt the payment ecosystem moving forward.
6
On the positive end of the spectrum, the Fund’s performance was boosted by stock selection in the Industrials sector, as well as certain other individual stocks discussed further below. Additionally, the Fund’s overweight allocation to the Information Technology sector, a solid performer for the benchmark index during the period, provided a tailwind to performance.
Information Technology holding NVIDIA Corp. (“NVIDIA”) (+26%) was a top contributor to the Fund’s performance during the period, reporting a better-than-expected recent fiscal quarter and introducing a host of new products and services at its March Investor Day. Demand by NVIDIA’s customers is tracking well ahead of NVIDIA’s supply in both the key gaming and datacenter businesses, and this dynamic is expected to continue through calendar year 2022. Datacenter strength is broad-based with cloud providers, high-performance computing customers, and enterprises all contributing to growth. In addition, NVIDIA’s recent Investor Day introduced the latest graphics processing unit chip and platform for the datacenter space, named “Hopper.” This new chip is expected to be launched for gaming applications in the fall of 2022, updating a two-year-old product, and we believe it will drive a healthy refresh cycle. In addition to hardware, NVIDIA is leaning into enterprise software and has had several launches in the space targeting industries such as healthcare, manufacturing, and retail. Further, enthusiasm continues to build for NVIDIA’s Omniverse product, which is in beta testing and is aimed at taking advantage of the continued development of and focus on the metaverse.
Industrials sector stock United Parcel Service, Inc. – Cl. B (“UPS”) was also a strong, positive contributor to Fund performance during the period, posting a total return of +24%. UPS was an outperformer over the last six months as the company continues to focus on increasing its profitability metrics and return on investment. The company mantra under CEO Carol Tome is that not all volume is created equally and UPS will no longer chase volume to sacrifice profitability. The COVID-19 pandemic has created supply chain disruptions as well as retail channel shifts which have hurt other companies within the transportation sector. UPS has outperformed many other companies during this time period by focusing on higher growth, higher return market segments, such as small to medium business channels, and business-to-consumer e-commerce, in addition to applying automation to eliminate unnecessary costs for package distribution. This has led to industry-leading growth as well as incremental margin profitability for the company overall.
During the reporting period, the Fund increased its exposure to the Information Technology sector and decreased its allocation to the Health Care sector. There were no significant changes to the Fund’s allocations to the Financials, Consumer Discretionary, Industrials, Materials, or Communication Services sectors.
Fiscal Period-End Investment Posture
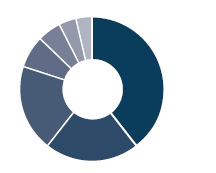
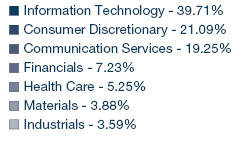
As of March 31, 2022, the Fund’s largest economic sector allocations included Information Technology, Consumer Discretionary, and Communication Services. As of that date, the Fund had no investments in the Consumer Staples, Energy, Real Estate, or Utilities sectors.
Sincerely,
THOMAS F. MARSICO
BRANDON A. GEISLER
PORTFOLIO MANAGERS
(1) | Total returns are based on net change in net asset value assuming reinvestment of distributions. Please see the Prospectus for more information. |
(2) | Regarding GICS data cited throughout this report, the Global Industry Classification Standard was developed by and is the exclusive property and service mark of MSCI Inc. (“MSCI”) and Standard & Poor’s (“S&P”) and is licensed for use by Marsico Capital Management, LLC (the “Adviser”). Neither MSCI, S&P, nor the Adviser or any third party involved in compiling GICS makes any express or implied warranties or representations with respect to such standard or classification (or the results from use thereof), and all such parties hereby expressly disclaim all warranties of originality, accuracy, completeness, merchantability and fitness for a particular purpose with respect to any such standard or classification. MSCI, S&P, the Adviser, and any of their affiliates or third parties involved in compiling GICS shall not have any liability for any direct, indirect, special, punitive, consequential or any other damages (including lost profits) even if notified of the possibility of such damages. |
7
March 31, 2022 (Unaudited)
The Focus Fund is a non-diversified portfolio and invests primarily in the common stocks of large companies that are selected for their long-term growth potential. The Fund will normally hold a core position of between 20 and 35 common stocks.
| | | INVESTOR CLASS | | | INSTITUTIONAL CLASS | |
| | TOTAL ANNUAL OPERATING EXPENSES* | 1.34% | | TOTAL ANNUAL OPERATING EXPENSES* | 1.11% | |
| | | | | | | |
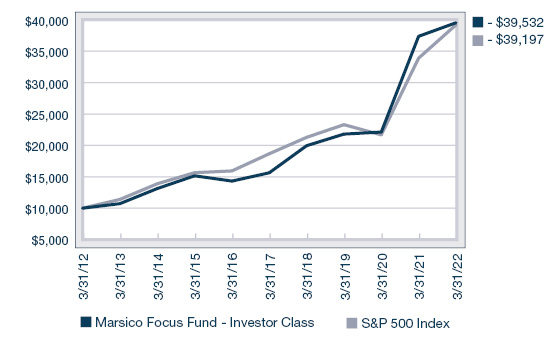
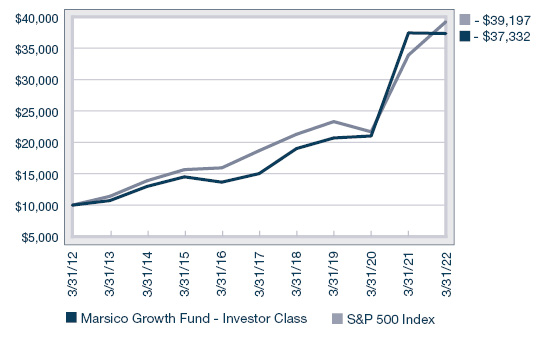
GROWTH OF $10,000(1)(2) | PERFORMANCE COMPARISON(1) |
| | Average Annualized Returns |
| 
|
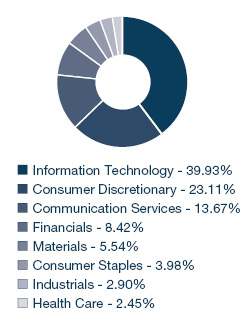
SECTOR ALLOCATION(4) | TOP FIVE HOLDINGS |
| | | | |
| | Apple, Inc. | 8.87% | |
| | Microsoft Corp. | 8.43% | |
| | Alphabet, Inc. - Cl. A | 7.47% | |
| | Amazon.com, Inc. | 7.37% | |
| | Meta Platforms, Inc. - Cl. A | 5.38% | |
| | | | |
* | The Total Annual Operating Expenses are reflective of the information disclosed in the Funds’ Prospectus dated January 31, 2022 and may differ from the expense ratios disclosed in this report. |
(1) | The performance data quoted here represent past performance, and past performance is not a guarantee of future results. Investment return and principal value of an investment will fluctuate so that an investor’s shares, when redeemed, may be worth more or less than their original cost. Current performance may be lower or higher than the performance information quoted. To obtain performance information current to the most recent month-end, please call 888-860-8686 or visit marsicofunds.com. |
| The performance included in the chart and graph does not reflect the deduction of taxes on Fund distributions or the redemption of Fund shares. |
| All indices are unmanaged and investors cannot invest directly in an index. |
(2) | This chart assumes an initial investment of $10,000 made on March 31, 2012 in the Investor Class shares of the Fund. Total returns are based on net change in NAV, assuming reinvestment of distributions. |
(3) | Institutional Class shares commenced operations on December 6, 2021. The performance attributed to the Institutional Class shares prior to that date is that of the Investor Class shares. Performance prior to December 6, 2021 has not been adjusted to reflect the lower expenses of the Institutional Class shares. During this period, Institutional Class shares would have had returns similar to, but potentially higher than, Investor Class shares due to the fact that Institutional Class shares represent interests in the same portfolio as Investor Class shares but are typically subject to lower expenses than the Investor Class shares. |
(4) | Sector weightings represent the percentage of the Fund’s investments (excluding cash equivalents) in certain general sectors. These sectors may include more than one industry. The Fund’s portfolio composition is subject to change at any time. |
8
MARSICO FOCUS FUND
SCHEDULE OF INVESTMENTS
March 31, 2022 (Unaudited)
| | | Number
of
Shares | | | Value | | | Percent
of Net
Assets | |
| COMMON STOCKS |
| Air Freight & Logistics |
| United Parcel Service, Inc. - Cl. B | | | 130,245 | | | $ | 27,932,343 | | | | 3.50 | % |
| | | | | | | | | | | | | |
| Application Software |
| Adobe, Inc.* | | | 45,286 | | | | 20,633,207 | | | | 2.59 | |
| | | | | | | | | | | | | |
| Asset Management & Custody Banks |
| Blackstone, Inc. | | | 251,834 | | | | 31,967,808 | | | | 4.01 | |
| | | | | | | | | | | | | |
| Automobile Manufacturers |
| Tesla, Inc.* | | | 26,967 | | | | 29,059,639 | | | | 3.64 | |
| | | | | | | | | | | | | |
| Data Processing & Outsourced Services |
| PayPal Holdings, Inc.* | | | 306,570 | | | | 35,454,821 | | | | 4.45 | |
| Visa, Inc. - Cl. A | | | 119,111 | | | | 26,415,246 | | | | 3.31 | |
| | | | | | | | 61,870,067 | | | | 7.76 | |
| Financial Exchanges & Data |
| S&P Global, Inc. | | | 59,286 | | | | 24,317,932 | | | | 3.05 | |
| | | | | | | | | | | | | |
| Footwear |
| NIKE, Inc. - Cl. B | | | 180,748 | | | | 24,321,451 | | | | 3.05 | |
| On Holding A.G. - Cl. A* | | | 409,343 | | | | 10,331,817 | | | | 1.29 | |
| | | | | | | | 34,653,268 | | | | 4.34 | |
| Health Care Equipment |
| Intuitive Surgical, Inc.* | | | 53,871 | | | | 16,251,803 | | | | 2.04 | |
| | | | | | | | | | | | | |
| Hotels, Resorts & Cruise Lines |
| Airbnb, Inc. - Cl. A* | | | 125,465 | | | | 21,549,868 | | | | 2.70 | |
| | | | | | | | | | | | | |
| Interactive Media & Services |
| Alphabet, Inc. - Cl. A* | | | 21,429 | | | | 59,601,549 | | | | 7.47 | |
| Meta Platforms, Inc. - Cl. A* | | | 192,847 | | | | 42,881,459 | | | | 5.38 | |
| | | | | | | | 102,483,008 | | | | 12.85 | |
| Internet & Direct Marketing Retail |
| Amazon.com, Inc.* | | | 18,027 | | | | 58,767,119 | | | | 7.37 | |
| | | | | | | | | | | | | |
| Managed Health Care |
| UnitedHealth Group, Inc. | | | 48,264 | | | | 24,613,192 | | | | 3.08 | |
| | | | | | | | | | | | | |
| Movies & Entertainment |
| The Walt Disney Company* | | | 179,573 | | | | 24,630,233 | | | | 3.09 | |
| | | | | | | | | | | | | |
| Restaurants |
| Chipotle Mexican Grill, Inc.* | | | 12,733 | | | | 20,143,988 | | | | 2.52 | |
| | | | | | | | | | | | | |
| Semiconductor Equipment |
| Lam Research Corp. | | | 56,965 | | | | 30,624,954 | | | | 3.84 | |
| | | | | | | | | | | | | |
| COMMON STOCKS (continued) |
| Semiconductors |
| NVIDIA Corp. | | | 116,504 | | | | 31,789,281 | | | | 3.98 | % |
| | | | | | | | | | | | | |
| Specialty Chemicals |
| The Sherwin-Williams Company | | | 120,852 | | | | 30,167,076 | | | | 3.78 | |
| | | | | | | | | | | | | |
| Systems Software |
| Microsoft Corp. | | | 218,088 | | | | 67,238,711 | | | | 8.43 | |
| ServiceNow, Inc.* | | | 46,955 | | | | 26,148,770 | | | | 3.28 | |
| | | | | | | | 93,387,481 | | | | 11.71 | |
| Technology Hardware, Storage & Peripherals |
| Apple, Inc. | | | 405,185 | | | | 70,749,353 | | | | 8.87 | |
| | | | | | | | | | | | | |
| Wireless Telecommunication Services |
| T-Mobile US, Inc.* | | | 176,925 | | | | 22,708,324 | | | | 2.85 | |
| | | | | | | | | | | | | |
| TOTAL COMMON STOCKS |
| (Cost $449,228,544) | | | | | | | 778,299,944 | | | | 97.57 | |
| | | | | | | | | | | | | |
| SHORT-TERM INVESTMENTS |
| State Street Institutional Treasury Money Market Fund - Premier Class, 0.000% | | | 21,652,943 | | | | 21,652,943 | | | | 2.72 | |
| | | | | | | | | | | | | |
| TOTAL SHORT-TERM INVESTMENTS |
| (Cost $21,652,943) | | | | | | | 21,652,943 | | | | 2.72 | |
| | | | | | | | | | | | | |
| TOTAL INVESTMENTS |
| (Cost $470,881,487) | | | | | | | 799,952,887 | | | | 100.29 | |
| | | | | | | | | | | | | |
| Liabilities, Less Cash and Other Assets | | | | | | | (2,275,076 | ) | | | (0.29 | ) |
| | | | | | | | | | | | | |
| NET ASSETS | | | | | | $ | 797,677,811 | | | | 100.00 | % |
See notes to financial statements.
9
Investment Review BY TOM MARSICO, BRANDON GEISLER, PETER MARSICO, AND JIMMY MARSICO (UNAUDITED)
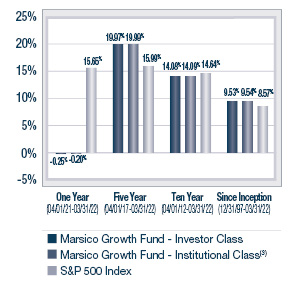
The Marsico Growth Fund’s Investor Class shares and Institutional Class shares posted total returns of -10.03% and -9.98%, respectively, for the six-month fiscal period ended March 31, 2022. The Institutional Class shares commenced operations on December 6, 2021. The performance attributed to the Institutional Class shares prior to that date is that of the Investor Class shares and has not been adjusted to reflect the lower expenses of the Institutional Class shares. During this period, Institutional Class shares would have had returns similar to, but potentially higher than, the Investor Class shares due to the fact that Institutional Class shares represent interests in the same portfolio as Investor Class shares but are subject to lower expenses. The total return information presented here for comparison purposes differs from the total return information disclosed for the Institutional Class shares in the Financial Highlights. The total return information in the Financial Highlights represents the performance for the portion of the fiscal period in which the Institutional Class was operational. The Fund underperformed the S&P 500 Index, the Fund’s benchmark index, which had a total return of +5.92% over the same time period. Please see the Fund’s Overview for more detailed information about the Fund’s longer-term performance for various time periods ended March 31, 2022.
The performance data quoted here represent past performance, and past performance is not a guarantee of future results. Investment return and principal value of an investment will fluctuate so that an investor’s shares, when redeemed, may be worth more or less than their original cost. Current performance may be lower or higher than the performance information quoted. To obtain performance information current to the most recent month-end, please call 888-860-8686 or visit marsicofunds.com.(1)
This review highlights Fund performance over a six-month fiscal period. Shareholders should keep in mind that the Fund is intended for long-term investors who hold their shares for substantially longer periods of time. You should also keep in mind that our current views and beliefs regarding all investments discussed in this report are subject to change at any time. References to specific securities, industries, and sectors discussed in this report are not recommendations to buy or sell such securities or related investments, and the Fund may not necessarily hold these securities or investments today. Please see the accompanying Schedule of Investments for the percentage of the Fund’s portfolio represented by the securities mentioned in this report as of the end of the reporting period.
The Fund is subject to broad risks associated with investing in equity securities markets generally, including the risks that the securities and markets in which it invests may experience volatility and instability, that domestic and global economies and markets may undergo periods of cyclical change and decline, that investors may at times avoid investments in equity securities, and that investments may not perform as anticipated. Please see the Prospectus for more information.
The Fund is not managed to track its benchmark index, and may hold a substantially overweight or underweight position in a sector, industry, or security compared to its weight in the benchmark. The Fund may be subject to risks associated with a particular sector or other area in which it is overweight, including the risk that the stocks of companies within one area could simultaneously decline in price because of an event that affects the entire area. For informational purposes, the discussion below may compare the benchmark weight or performance of a sector or industry to the investment approach of the Fund.
The Growth Fund’s underperformance during the six-month period ended March 31, 2022, as compared to the S&P 500 Index, can primarily be attributed to weak stock selection in several areas, including the Information Technology, Communication Services and Health Care sectors, as defined in the Global Industry Classification Standard (“GICS”)(2). From a sector allocation perspective, the Fund’s relative performance was further dampened by maintaining an overweight allocation to the Communication Services sector, the weakest-performing sector of the benchmark index, and by having no investments in the Energy sector, which was the strongest-performing sector of the benchmark index.
Information Technology holding PayPal Holdings, Inc. (-58%) detracted significantly from performance amid growing competition in online checkout options and diminishing e-commerce tailwinds relative to the previous six months, both of which have challenged investor sentiment. Additionally, it remains unclear how cryptocurrencies, blockchain technology, and stablecoins may continue to impact and potentially disrupt the payment ecosystem moving forward.
In the Communication Services sector, Sea Ltd. ADR (“Sea”) detracted from performance, returning -62% prior to being sold. Sea was a top detractor from the Fund’s relative performance as the company issued guidance that equated to declining revenue from its gaming division. “Free Fire” is Sea’s key gaming franchise and we believe that investors likely fear the franchise has matured. While we see this drawdown for near term issues as being overstated and continue to believe in the long-term growth trajectory for Sea and its myriad of drivers, we exited the position to pursue other attractive investment opportunities.
Health Care sector holding DexCom, Inc. (“DexCom”) (-8%) also hindered the Fund’s results. Dexcom was an underperformer during the period as the company’s US revenue growth was impacted by the resurgence of COVID-19 via Omicron. The company noted that inpatient consultations and physician visits were negatively impacted by the pandemic, which resulted in a domestic revenue growth shortfall for the fourth quarter of 2021. In addition, the company has been switching product distribution from medical equipment
10
distributors to retail pharmacies, which has impacted the company’s average sales price per patient added. We remain optimistic on the company overall as the pandemic fades over time, DexCom’s distribution model shift is completed, and the company receives approval for its next generation device, known as the G7 in the US, in the first half of 2022.
On the positive end of the spectrum, the Fund’s performance was boosted relative to its benchmark index by the positive results of certain individual positions, discussed further below. Additionally, the Fund’s underweight allocation to the Financials sector, one of the weaker-performing sectors of the benchmark index during the period, provided a small tailwind to relative performance.
Consumer Discretionary holding Tesla, Inc. (“Tesla”) (+39%) was one of the largest contributors to the Fund’s performance overall during the period. Tesla contributed positively to Fund performance through the stock’s significant appreciation, as well as the Fund’s overweight position as compared to the benchmark index. Tesla continued to produce and deliver products at a much faster pace than expected, despite headwinds from supply chain issues and COVID-19-related restrictions. As a result, Tesla has furthered its lead in the electronic vehicle space. The company has recently opened factories in Berlin and Austin, which we believe should lead to significant growth in sales and operating profit.
Information Technology holding NVIDIA Corp. (“NVIDIA”) (+33%) was a top contributor to the Fund’s performance during the period, reporting a better-than-expected recent fiscal quarter and introducing a host of new products and services at its March Investor Day. Demand by NVIDIA’s customers is tracking well ahead of NVIDIA’s supply in both the key gaming and datacenter businesses, and this dynamic is expected to continue through calendar year 2022. Datacenter strength is broad-based with cloud providers, high-performance computing customers, and enterprises all contributing to growth. In addition, NVIDIA’s recent Investor Day introduced the latest graphics processing unit chip and platform for the datacenter space, named “Hopper.” This new chip is expected to be launched for gaming applications in the fall of 2022, updating a two-year-old product, and we believe it will drive a healthy refresh cycle. In addition to hardware, NVIDIA is leaning into enterprise software and has had several launches in the space targeting industries such as healthcare, manufacturing, and retail. Further, enthusiasm continues to build for NVIDIA’s Omniverse product, which is in beta testing and is aimed at taking advantage of the continued development of and focus on the metaverse.
There were several sector adjustments made to the Fund during the reporting period. The Fund meaningfully increased its exposure to the Financials and Information Technology sectors and decreased its allocations to the Communication Services and Consumer Discretionary sectors. There were no substantial changes to the Fund’s allocations to the Industrials, Health Care, or Consumer Staples sectors.
Fiscal Period-End Investment Posture
As of March 31, 2022, the Fund’s largest economic sector allocations included Information Technology, Consumer Discretionary, Communication Services, and Health Care. As of that date, the Fund had no investments in the Energy, Materials, Real Estate, or Utilities sectors.
Sincerely,
THOMAS F. MARSICO
BRANDON A. GEISLER
PETER C. MARSICO
JAMES D. MARSICO
PORTFOLIO MANAGERS
(1) | Total returns are based on net change in net asset value assuming reinvestment of distributions. Periodically, certain fees and expenses have been waived or reimbursed by Marsico Capital Management, LLC (the “Adviser”). In the absence of such a waiver or reimbursement, the performance returns reflected would have been reduced. In accordance with the expense limitation and fee waiver agreement, the Adviser may recoup fees and expenses previously waived or reimbursed under certain parameters. Periodically, the Adviser has recouped such fees or expenses, resulting in a lower performance return. Please see the Prospectus for more information. |
(2) | Regarding GICS data cited throughout this report, the Global Industry Classification Standard was developed by and is the exclusive property and service mark of MSCI Inc. (“MSCI”) and Standard & Poor’s (“S&P”) and is licensed for use by the Adviser. Neither MSCI, S&P, nor the Adviser or any third party involved in compiling GICS makes any express or implied warranties or representations with respect to such standard or classification (or the results from use thereof), and all such parties hereby expressly disclaim all warranties of originality, accuracy, completeness, merchantability and fitness for a particular purpose with respect to any such standard or classification. MSCI, S&P, the Adviser, and any of their affiliates or third parties involved in compiling GICS shall not have any liability for any direct, indirect, special, punitive, consequential or any other damages (including lost profits) even if notified of the possibility of such damages. |
11
March 31, 2022 (Unaudited)
The Growth Fund is a diversified portfolio and invests primarily in the common stocks of large companies that are selected for their long-term growth potential. The Growth Fund will normally hold a core position of up to 50 common stocks.
| | | INVESTOR CLASS | | | INSTITUTIONAL CLASS | |
| | TOTAL ANNUAL OPERATING EXPENSES* | 1.34% | | TOTAL ANNUAL OPERATING EXPENSES* | 1.14% | |
| | | | | | | |
GROWTH OF $10,000(1)(2)(3) | PERFORMANCE COMPARISON(1)(2) |
| | Average Annualized Returns |
| 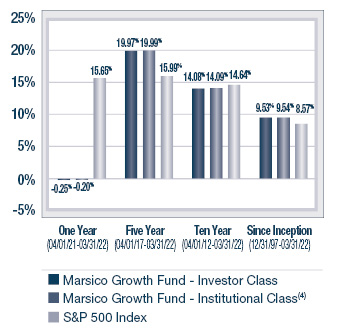
|
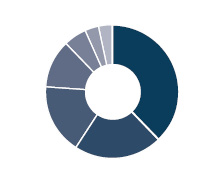
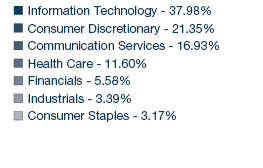
SECTOR ALLOCATION(5) | TOP FIVE HOLDINGS |
| | | | |
| | Alphabet, Inc. - Cl. A | 8.60% | |
| | Microsoft Corp. | 7.93% | |
| | Apple, Inc. | 6.96% | |
| | Amazon.com, Inc. | 6.56% | |
| | Mastercard, Inc. - Cl. A | 6.32% | |
| | | | |
* | The Total Annual Operating Expenses are reflective of the information disclosed in the Funds’ Prospectus dated January 31, 2022 and may differ from the expense ratios disclosed in this report. |
(1) | The performance data quoted here represent past performance, and past performance is not a guarantee of future results. Investment return and principal value of an investment will fluctuate so that an investor’s shares, when redeemed, may be worth more or less than their original cost. Current performance may be lower or higher than the performance information quoted. To obtain performance information current to the most recent month-end, please call 888-860-8686 or visit marsicofunds.com. |
| The performance included in the chart and graph does not reflect the deduction of taxes on Fund distributions or the redemption of Fund shares. |
| All indices are unmanaged and investors cannot invest directly in an index. |
(2) | Periodically, certain fees and expenses have been waived or reimbursed by Marsico Capital Management, LLC (the “Adviser”). In the absence of such a waiver or reimbursement, the performance returns reflected would have been reduced. In accordance with the expense limitation and fee waiver agreement, the Adviser may recoup fees and expenses previously waived or reimbursed under certain parameters. Periodically, the Adviser has recouped such fees or expenses, resulting in a lower performance return. |
(3) | This chart assumes an initial investment of $10,000 made on March 31, 2012 in the Investor Class shares of the Fund. Total returns are based on net change in NAV, assuming reinvestment of distributions. |
(4) | Institutional Class shares commenced operations on December 6, 2021. The performance attributed to the Institutional Class shares prior to that date is that of the Investor Class shares. Performance prior to December 6, 2021 has not been adjusted to reflect the lower expenses of the Institutional Class shares. During this period, Institutional Class shares would have had returns similar to, but potentially higher than, Investor Class shares due to the fact that Institutional Class shares represent interests in the same portfolio as Investor Class shares but are typically subject to lower expenses than the Investor Class shares. |
(5) | Sector weightings represent the percentage of the Fund’s investments (excluding cash equivalents) in certain general sectors. These sectors may include more than one industry. The Fund’s portfolio composition is subject to change at any time. |
12
MARSICO GROWTH FUND
SCHEDULE OF INVESTMENTS
March 31, 2022 (Unaudited)
| | | Number
of
Shares | | | Value | | | Percent
of Net
Assets | |
| COMMON STOCKS |
| Application Software |
| Adobe, Inc.* | | | 19,539 | | | $ | 8,902,359 | | | | 2.54 | % |
| | | | | | | | | | | | | |
| Automobile Manufacturers |
| Tesla, Inc.* | | | 18,982 | | | | 20,455,003 | | | | 5.84 | |
| | | | | | | | | | | | | |
| Consumer Finance |
| American Express Company | | | 44,871 | | | | 8,390,877 | | | | 2.39 | |
| | | | | | | | | | | | | |
| Data Processing & Outsourced Services |
| Block, Inc. - Cl. A* | | | 27,126 | | | | 3,678,286 | | | | 1.05 | |
| Mastercard, Inc. - Cl. A | | | 61,923 | | | | 22,130,042 | | | | 6.32 | |
| PayPal Holdings, Inc.* | | | 58,850 | | | | 6,806,002 | | | | 1.94 | |
| | | | | | | | 32,614,330 | | | | 9.31 | |
| Financial Exchanges & Data |
| S&P Global, Inc. | | | 23,815 | | | | 9,768,437 | | | | 2.79 | |
| | | | | | | | | | | | | |
| Health Care Equipment |
| DexCom, Inc.* | | | 8,063 | | | | 4,125,031 | | | | 1.18 | |
| Edwards Lifesciences Corp.* | | | 72,617 | | | | 8,548,473 | | | | 2.44 | |
| Intuitive Surgical, Inc.* | | | 36,252 | | | | 10,936,503 | | | | 3.12 | |
| | | | | | | | 23,610,007 | | | | 6.74 | |
| Hotels, Resorts & Cruise Lines |
| Airbnb, Inc. - Cl. A* | | | 33,842 | | | | 5,812,702 | | | | 1.66 | |
| Hilton Worldwide Holdings, Inc.* | | | 36,145 | | | | 5,484,642 | | | | 1.56 | |
| | | | | | | | 11,297,344 | | | | 3.22 | |
| Interactive Media & Services |
| Alphabet, Inc. - Cl. A* | | | 10,823 | | | | 30,102,551 | | | | 8.60 | |
| Meta Platforms, Inc. - Cl. A* | | | 58,633 | | | | 13,037,634 | | | | 3.72 | |
| | | | | | | | 43,140,185 | | | | 12.32 | |
| Internet & Direct Marketing Retail |
| Amazon.com, Inc.* | | | 7,052 | | | | 22,989,167 | | | | 6.56 | |
| | | | | | | | | | | | | |
| Life Sciences Tools & Services |
| Danaher Corp. | | | 48,197 | | | | 14,137,626 | | | | 4.04 | |
| | | | | | | | | | | | | |
| Movies & Entertainment |
| Netflix, Inc.* | | | 13,385 | | | | 5,013,887 | | | | 1.43 | |
| The Walt Disney Company* | | | 50,516 | | | | 6,928,775 | | | | 1.98 | |
| | | | | | | | 11,942,662 | | | | 3.41 | |
| Personal Products |
| The Estee Lauder Companies, Inc. – Cl. A | | | 37,903 | | | | 10,321,745 | | | | 2.95 | |
| | | | | | | | | | | | | |
| Restaurants |
| Chipotle Mexican Grill, Inc.* | | | 6,987 | | | | 11,053,644 | | | | 3.16 | |
| Starbucks Corp. | | | 40,115 | | | | 3,649,261 | | | | 1.04 | |
| | | | | | | | 14,702,905 | | | | 4.20 | |
| Semiconductors |
| Advanced Micro Devices, Inc.* | | | 52,167 | | | | 5,703,940 | | | | 1.63 | |
| NVIDIA Corp. | | | 28,829 | | | | 7,866,281 | | | | 2.24 | |
| | | | | | | | 13,570,221 | | | | 3.87 | |
| COMMON STOCKS (continued) |
| Systems Software |
| Microsoft Corp. | | | 90,119 | | | | 27,784,589 | | | | 7.93 | % |
| ServiceNow, Inc.* | | | 29,272 | | | | 16,301,284 | | | | 4.66 | |
| | | | | | | | 44,085,873 | | | | 12.59 | |
| Technology Hardware, Storage & Peripherals |
| Apple, Inc. | | | 139,675 | | | | 24,388,652 | | | | 6.96 | |
| | | | | | | | | | | | | |
| Trucking |
| Uber Technologies, Inc.* | | | 308,881 | | | | 11,020,874 | | | | 3.15 | |
| | | | | | | | | | | | | |
| TOTAL COMMON STOCKS |
| (Cost $203,039,264) | | | | | | | 325,338,267 | | | | 92.88 | |
| | | | | | | | | | | | | |
| SHORT-TERM INVESTMENTS |
| State Street Institutional Treasury Money Market Fund - Premier Class, 0.000% | | | 19,828,314 | | | | 19,828,314 | | | | 5.66 | |
| | | | | | | | | | | | | |
| TOTAL SHORT-TERM INVESTMENTS |
| (Cost $19,828,314) | | | | | | | 19,828,314 | | | | 5.66 | |
| | | | | | | | | | | | | |
| TOTAL INVESTMENTS |
| (Cost $222,867,578) | | | | | | | 345,166,581 | | | | 98.54 | |
| | | | | | | | | | | | | |
| Cash and Other Assets, Less Liabilities | | | | | | | 5,110,129 | | | | 1.46 | |
| | | | | | | | | | | | | |
| NET ASSETS | | | | | | $ | 350,276,710 | | | | 100.00 | % |
See notes to financial statements.
13
Investment Review BY BRANDON GEISLER (UNAUDITED)
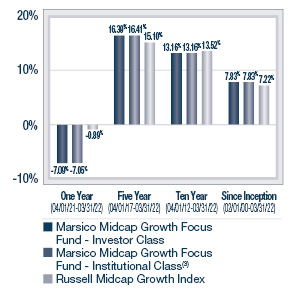
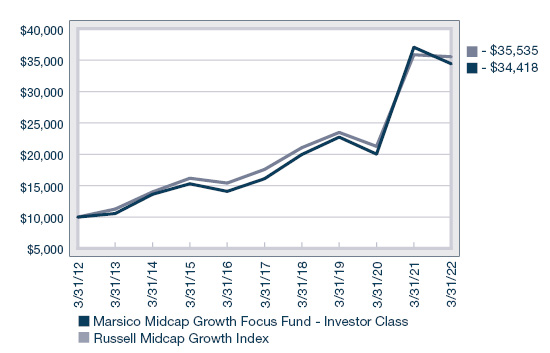
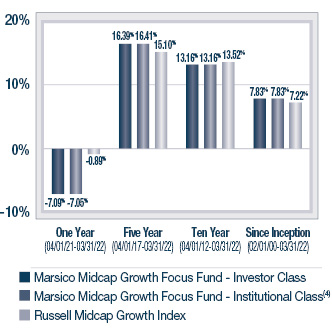
The Marsico Midcap Growth Focus Fund’s Investor Class shares and Institutional Class shares posted total returns of -14.18% and -14.13%, respectively, for the six-month fiscal period ended March 31, 2022. The Institutional Class shares commenced operations on December 6, 2021. The performance attributed to the Institutional Class shares prior to that date is that of the Investor Class shares and has not been adjusted to reflect the lower expenses of the Institutional Class shares. During this period, Institutional Class shares would have had returns similar to, but potentially higher than, the Investor Class shares due to the fact that Institutional Class shares represent interests in the same portfolio as Investor Class shares but are subject to lower expenses. The total return information presented here for comparison purposes differs from the total return information disclosed for the Institutional Class shares in the Financial Highlights. The total return information in the Financial Highlights represents the performance for the portion of the fiscal period in which the Institutional Class was operational. The Fund underperformed the Russell Midcap Growth Index, the Fund’s benchmark index, which had a total return of -10.09% over the same time period. Please see the Fund’s Overview for more detailed information about the Fund’s longer-term performance for various time periods ended March 31, 2022.
The performance data quoted here represent past performance, and past performance is not a guarantee of future results. Investment return and principal value of an investment will fluctuate so that an investor’s shares, when redeemed, may be worth more or less than their original cost. Current performance may be lower or higher than the performance information quoted. To obtain performance information current to the most recent month-end, please call 888-860-8686 or visit marsicofunds.com.(1)
This review highlights Fund performance over a six-month fiscal period. Shareholders should keep in mind that the Fund is intended for long-term investors who hold their shares for substantially longer periods of time. You should also keep in mind that our current views and beliefs regarding all investments discussed in this report are subject to change at any time. References to specific securities, industries, and sectors discussed in this report are not recommendations to buy or sell such securities or related investments, and the Fund may not necessarily hold these securities or investments today. Please see the accompanying Schedule of Investments for the percentage of the Fund’s portfolio represented by the securities mentioned in this report as of the end of the reporting period.
The Fund is subject to broad risks associated with investing in equity securities markets generally, including the risks that the securities and markets in which it invests may experience volatility and instability, that domestic and global economies and markets may undergo periods of cyclical change and decline, that investors may at times avoid investments in equity securities, and that investments may not perform as anticipated.
The Fund’s investments in medium-capitalization or midcap companies, as well as any investments in small-cap companies, can involve more risk than investments in larger companies because medium-capitalization and smaller companies have potentially greater sensitivity to adverse business or economic conditions. Medium-capitalization and smaller companies may have more limited financial resources, markets or product lines, less access to capital markets, and more limited trading in their stocks. This can cause the prices of equity securities of these companies to be more volatile than those of larger companies, or to decline more significantly during market downturns than the market as a whole. Please see the Prospectus for more information.
The Fund is not managed to track its benchmark index, and may hold a substantially overweight or underweight position in a sector, industry, or security compared to its weight in the benchmark. The Fund may be subject to risks associated with a particular sector or other area in which it is overweight, including the risk that the stocks of companies within one area could simultaneously decline in price because of an event that affects the entire area. For informational purposes, the discussion below may compare the benchmark weight or performance of a sector or industry to the investment approach of the Fund.
The Midcap Growth Focus Fund’s underperformance during the six-month period ended March 31, 2022 as compared to its benchmark, the Russell Midcap Growth Index, was due, in part, to weak stock selection in the Health Care and Information Technology sectors, as defined in the Global Industry Classification Standard (“GICS”)(2). From a sector allocation perspective, the Fund’s relative performance was penalized by having no exposure to the strongest-performing sector of the benchmark index, Energy, and an overweight posture in the weaker-performing Health Care sector.
In the Health Care sector, Natera, Inc. (“Natera”) (-64%) emerged as one of the Fund’s largest detractors to performance overall. Natera was an underperformer for the reporting period as company growth prospects in the noninvasive prenatal test (“NIPT”) market were questioned. Natera remains an industry leader in the analysis of circulating DNA to evaluate the potential for genetic disorders, cancer tumor growth, and organ transplant rejection. Although the company’s NIPT products represent a significant majority of Natera’s revenue growth to date, the company is in the early phase of new product launches in the oncology and organ transplant markets. We believe that these new products should generate higher average sales prices and operating margins as these new markets for the company are less penetrated when compared to the NIPT market. Going forward, we believe the company should continue to outpace its respective industry growth overall due to its recent product launches.
14
Information Technology sector holding Twilio, Inc. - Cl. A (“Twilio”) (-48%) was the largest individual detractor to performance for the Fund for the period, as the company issued guidance that pointed to slowing organic revenue and bookings growth. Twilio enables communication between businesses and consumers and benefitted greatly from different use cases during the pandemic. As the effects of COVID-19 and related restrictions have eased, the relative strength of the business-to-consumer mobile communications segment tempered as users started to spend more time outside the home. We still believe in the long-term prospects of the company and see this period as a blip in the growth trajectory for Twilio.
The Fund had some bright spots during the period, including stock selection in the Consumer Discretionary sector and other individual holdings, as discussed further below. The Fund’s underweight allocation to the Communication Services and Consumer Discretionary sectors, two of the weakest-performing sectors of the benchmark index during the period, aided relative performance. Additionally, as the Fund’s benchmark index returned -10.09% during the period, relative Fund performance was boosted by maintaining a 5% cash position on average.
Consumer Discretionary holding Hilton Worldwide Holdings, Inc. (“Hilton”) (+15%) performed well for the Fund. An overweight allocation to this stock as compared to the benchmark index created an additional boost to Fund performance. Hilton was a key contributor to the performance of the Fund as leisure demand for travel recovered exceptionally well after the Omicron wave swept across the globe.
Information Technology sector holding Marvell Technology, Inc. (“Marvell”) (+20%) emerged as a strong individual contributor to performance for the reporting period due to its strong execution in a highly constrained supply environment. Demand by Marvell’s customers is tracking materially ahead of Marvell’s supply, which is expected to continue through calendar year 2022 and into 2023 despite Marvell obtaining incrementally more manufacturing capacity during this time. The company’s datacenter segment has been the primary driver of absolute sales growth over the past two quarters, reflecting Marvell’s successful transition to more advanced semiconductor production along with key strategic acquisitions over the past couple of years. The smaller, but faster-growing automotive and industrial businesses are leveraging technology from the company’s datacenter and networking businesses, and are benefitting from the trends relating to autonomous driving and factory automation. Additionally, Marvell has strong exposure to 5G base station providers, and is seeing meaningful content growth with a broadening out of 5G investment versus the concentration of early spending in the US and China.
During the reporting period, the Fund eliminated its sole holding in the Materials sector and its exposure to the Communication Services sector was reduced. The Fund increased its allocation to the Information Technology sector. There were no significant changes to the Fund’s allocations to the Real Estate, Health Care, Financials, Consumer Discretionary, or Industrials sectors.
Fiscal Period-End Investment Posture
As of March 31, 2022, the Fund’s primary economic sector allocations included Information Technology, Health Care, Consumer Discretionary, and Industrials. At period end, the Fund had no investments in the Consumer Staples, Energy, Materials, or Utilities sectors.
Sincerely,
BRANDON A. GEISLER
PORTFOLIO MANAGER
(1) | Total returns are based on net change in net asset value assuming reinvestment of distributions. Periodically, certain fees and expenses have been waived or reimbursed by Marsico Capital Management, LLC (the “Adviser”). In the absence of such a waiver or reimbursement, the performance returns reflected would have been reduced. In accordance with the expense limitation and fee waiver agreement, the Adviser may recoup fees and expenses previously waived or reimbursed under certain parameters. Periodically, the Adviser has recouped such fees or expenses, resulting in a lower performance return. Please see the Prospectus for more information. |
(2) | Regarding GICS data cited throughout this report, the Global Industry Classification Standard was developed by and is the exclusive property and service mark of MSCI Inc. (“MSCI”) and Standard & Poor’s (“S&P”) and is licensed for use by the Adviser. Neither MSCI, S&P, nor the Adviser or any third party involved in compiling GICS makes any express or implied warranties or representations with respect to such standard or classification (or the results from use thereof), and all such parties hereby expressly disclaim all warranties of originality, accuracy, completeness, merchantability and fitness for a particular purpose with respect to any such standard or classification. MSCI, S&P, the Adviser, and any of their affiliates or third parties involved in compiling GICS shall not have any liability for any direct, indirect, special, punitive, consequential or any other damages (including lost profits) even if notified of the possibility of such damages. |
15
MIDCAP GROWTH FOCUS Fund Overview |
March 31, 2022 (Unaudited)
The Midcap Growth Focus Fund is a diversified portfolio and invests primarily in common stocks that are selected for their long-term growth potential. The Fund may invest in companies of any size. Under normal circumstances, the Fund will invest at least 80% of the value of its assets in medium-capitalization (or “midcap”) growth companies. The Fund will normally hold a core position of between 35 and 50 common stocks.
| | | INVESTOR CLASS | | | INSTITUTIONAL CLASS | |
| | TOTAL ANNUAL OPERATING EXPENSES* | 1.33% | | TOTAL ANNUAL OPERATING EXPENSES* | 1.15% | |
| | | | | | | |
GROWTH OF $10,000(1)(3) | PERFORMANCE COMPARISON(1)(2) |
| | Average Annualized Returns |
| 
|
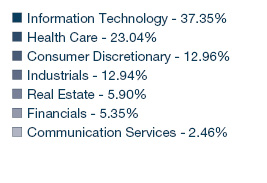
SECTOR ALLOCATION(5) | TOP FIVE HOLDINGS |
| | | | |
| | DexCom, Inc. | 3.23% | |
| | Insulet Corp. | 3.18% | |
| | Cintas Corp. | 3.06% | |
| | FirstService Corp. | 2.99% | |
| | Constellation Software, Inc. | 2.87% | |
| | | | |
* | The Total Annual Operating Expenses are reflective of the information disclosed in the Funds’ Prospectus dated January 31, 2022 and may differ from the expense ratios disclosed in this report. |
(1) | The performance data quoted here represent past performance, and past performance is not a guarantee of future results. Investment return and principal value of an investment will fluctuate so that an investor’s shares, when redeemed, may be worth more or less than their original cost. Current performance may be lower or higher than the performance information quoted. To obtain performance information current to the most recent month-end, please call 888-860-8686 or visit marsicofunds.com. |
| The performance included in the chart and graph does not reflect the deduction of taxes on Fund distributions or the redemption of Fund shares. |
| All indices are unmanaged and investors cannot invest directly in an index. |
| The Russell Midcap Growth Index (the “Underlying Index”) measures the performance of the mid-capitalization growth sector of the US equity market, and is composed of mid-capitalization US equities that exhibit growth characteristics. It is a subset of the Russell Midcap® Index, which measures the performance of the mid-capitalization sector of the US equity market. The Underlying Index measures the performance of equity securities of Russell Midcap Index issuers with higher price-to-book ratios and higher forecasted growth. |
(2) | Periodically, certain fees and expenses have been waived or reimbursed by Marsico Capital Management, LLC (the “Adviser”). In the absence of such a waiver or reimbursement, the performance returns reflected would have been reduced. In accordance with the expense limitation and fee waiver agreement, the Adviser may recoup fees and expenses previously waived or reimbursed under certain parameters. Periodically, the Adviser has recouped such fees or expenses, resulting in a lower performance return. |
(3) | This chart assumes an initial investment of $10,000 made on March 31, 2012 in the Investor Class shares of the Fund. Total returns are based on net change in NAV, assuming reinvestment of distributions. |
(4) | Institutional Class shares commenced operations on December 6, 2021. The performance attributed to the Institutional Class shares prior to that date is that of the Investor Class shares. Performance prior to December 6, 2021 has not been adjusted to reflect the lower expenses of the Institutional Class shares. During this period, Institutional Class shares would have had returns similar to, but potentially higher than, Investor Class shares due to the fact that Institutional Class shares represent interests in the same portfolio as Investor Class shares but are typically subject to lower expenses than the Investor Class shares. |
(5) | Sector weightings represent the percentage of the Fund’s investments (excluding cash equivalents) in certain general sectors. These sectors may include more than one industry. The Fund’s portfolio composition is subject to change at any time. |
16
MARSICO MIDCAP GROWTH FOCUS FUND
SCHEDULE OF INVESTMENTS
March 31, 2022 (Unaudited)
| | | Number
of
Shares | | | Value | | | Percent
of Net
Assets | |
| COMMON STOCKS |
| Aerospace & Defense |
| Axon Enterprise, Inc.* | | | 45,519 | | | $ | 6,269,332 | | | | 2.03 | % |
| HEICO Corp. | | | 48,506 | | | | 7,447,611 | | | | 2.42 | |
| | | | | | | | 13,716,943 | | | | 4.45 | |
| Apparel Retail |
| Burlington Stores, Inc.* | | | 21,173 | | | | 3,857,085 | | | | 1.25 | |
| | | | | | | | | | | | | |
| Application Software |
| Atlassian Corp. PLC - Cl. A* | | | 25,222 | | | | 7,410,980 | | | | 2.40 | |
| Constellation Software, Inc. | | | 5,185 | | | | 8,863,212 | | | | 2.87 | |
| Datadog, Inc. - Cl. A* | | | 38,217 | | | | 5,788,729 | | | | 1.88 | |
| Guidewire Software, Inc.* | | | 51,859 | | | | 4,906,899 | | | | 1.59 | |
| HubSpot, Inc.* | | | 10,845 | | | | 5,150,724 | | | | 1.67 | |
| PTC, Inc.* | | | 16,098 | | | | 1,734,077 | | | | 0.56 | |
| The Descartes Systems Group, Inc.* | | | 115,200 | | | | 8,434,393 | | | | 2.74 | |
| The Trade Desk, Inc. - Cl. A* | | | 33,820 | | | | 2,342,035 | | | | 0.76 | |
| Unity Software, Inc.* | | | 39,842 | | | | 3,952,725 | | | | 1.28 | |
| | | | | | | | 48,583,774 | | | | 15.75 | |
| Biotechnology |
| Exact Sciences Corp.* | | | 75,476 | | | | 5,277,282 | | | | 1.71 | |
| Horizon Therapeutics PLC* | | | 57,724 | | | | 6,073,142 | | | | 1.97 | |
| Natera, Inc.* | | | 66,404 | | | | 2,701,315 | | | | 0.87 | |
| | | | | | | | 14,051,739 | | | | 4.55 | |
| Data Processing & Outsourced Services |
| Global Payments, Inc. | | | 29,135 | | | | 3,986,834 | | | | 1.29 | |
| WEX, Inc.* | | | 40,603 | | | | 7,245,605 | | | | 2.35 | |
| | | | | | | | 11,232,439 | | | | 3.64 | |
| Diversified Support Services |
| Cintas Corp. | | | 22,184 | | | | 9,436,852 | | | | 3.06 | |
| | | | | | | | | | | | | |
| Education Services |
| Bright Horizons Family Solutions, Inc.* | | | 44,346 | | | | 5,884,271 | | | | 1.91 | |
| | | | | | | | | | | | | |
| Electrical Components & Equipment |
| AMETEK, Inc. | | | 48,635 | | | | 6,477,209 | | | | 2.10 | |
| | | | | | | | | | | | | |
| Electronic Components |
| Amphenol Corp. - Cl. A | | | 112,790 | | | | 8,498,726 | | | | 2.75 | |
| | | | | | | | | | | | | |
| Electronic Equipment & Instruments |
| Cognex Corp. | | | 95,603 | | | | 7,375,772 | | | | 2.39 | |
| Novanta, Inc.* | | | 42,470 | | | | 6,043,056 | | | | 1.96 | |
| | | | | | | | 13,418,828 | | | | 4.35 | |
| Financial Exchanges & Data |
| MSCI, Inc. | | | 14,888 | | | | 7,486,877 | | | | 2.43 | |
| | | | | | | | | | | | | |
| Footwear |
| On Holding A.G. - Cl. A* | | | 131,442 | | | | 3,317,596 | | | | 1.08 | |
| | | | | | | | | | | | | |
| Health Care Equipment |
| DexCom, Inc.* | | | 19,509 | | | | 9,980,805 | | | | 3.23 | |
| IDEXX Laboratories, Inc.* | | | 14,839 | | | | 8,117,823 | | | | 2.63 | |
| Insulet Corp.* | | | 36,798 | | | | 9,802,619 | | | | 3.18 | |
| | | | | | | | 27,901,247 | | | | 9.04 | |
| Health Care Supplies |
| The Cooper Companies, Inc. | | | 18,402 | | | | 7,684,491 | | | | 2.49 | |
| COMMON STOCKS (continued) |
| Health Care Technology |
| GoodRx Holdings, Inc. - Cl. A* | | | 91,519 | | | | 1,769,062 | | | | 0.57 | % |
| | | | | | | | | | | | | |
| Home Improvement Retail |
| Floor & Decor Holdings, Inc. - Cl. A* | | | 57,687 | | | | 4,672,647 | | | | 1.51 | |
| | | | | | | | | | | | | |
| Hotels, Resorts & Cruise Lines |
| Hilton Worldwide Holdings, Inc.* | | | 55,339 | | | | 8,397,140 | | | | 2.72 | |
| | | | | | | | | | | | | |
| Interactive Media & Services |
| Snap, Inc. - Cl. A* | | | 135,135 | | | | 4,863,509 | | | | 1.58 | |
| | | | | | | | | | | | | |
| Internet Services & Infrastructure |
| Twilio, Inc. - Cl. A* | | | 35,007 | | | | 5,769,504 | | | | 1.87 | |
| | | | | | | | | | | | | |
| Leisure Facilities |
| Planet Fitness, Inc. - Cl. A* | | | 70,270 | | | | 5,936,410 | | | | 1.92 | |
| | | | | | | | | | | | | |
| Life Sciences Tools & Services |
| Avantor, Inc.* | | | 222,919 | | | | 7,539,121 | | | | 2.44 | |
| Mettler-Toledo International, Inc.* | | | 3,357 | | | | 4,609,799 | | | | 1.49 | |
| Repligen Corp.* | | | 22,893 | | | | 4,305,944 | | | | 1.40 | |
| | | | | | | | 16,454,864 | | | | 5.33 | |
| Movies & Entertainment |
| Spotify Technology S.A.* | | | 15,731 | | | | 2,375,696 | | | | 0.77 | |
| | | | | | | | | | | | | |
| Real Estate Services |
| FirstService Corp. | | | 63,800 | | | | 9,228,456 | | | | 2.99 | |
| | | | | | | | | | | | | |
| Regional Banks |
| First Republic Bank | | | 51,040 | | | | 8,273,584 | | | | 2.68 | |
| | | | | | | | | | | | | |
| Research & Consulting Services |
| CoStar Group, Inc.* | | | 127,355 | | | | 8,483,116 | | | | 2.75 | |
| | | | | | | | | | | | | |
| Restaurants |
| Chipotle Mexican Grill, Inc.* | | | 3,860 | | | | 6,106,636 | | | | 1.98 | |
| | | | | | | | | | | | | |
| Semiconductor Equipment |
| Lam Research Corp. | | | 9,114 | | | | 4,899,777 | | | | 1.59 | |
| | | | | | | | | | | | | |
| Semiconductors |
| Marvell Technology, Inc. | | | 112,007 | | | | 8,032,022 | | | | 2.60 | |
| Microchip Technology, Inc. | | | 73,755 | | | | 5,541,950 | | | | 1.80 | |
| ON Semiconductor Corp.* | | | 41,875 | | | | 2,621,794 | | | | 0.85 | |
| | | | | | | | 16,195,766 | | | | 5.25 | |
| Specialized REITs |
| SBA Communications Corp. - Cl. A | | | 23,673 | | | | 8,145,879 | | | | 2.64 | |
| | | | | | | | | | | | | |
| Systems Software |
| UiPath, Inc. - Cl. A* | | | 65,076 | | | | 1,404,991 | | | | 0.46 | |
| | | | | | | | | | | | | |
| TOTAL COMMON STOCKS |
| (Cost $196,248,631) | | | | | | | 294,525,114 | | | | 95.46 | |
17
MARSICO MIDCAP GROWTH FOCUS FUND
SCHEDULE OF INVESTMENTS (continued)
March 31, 2022 (Unaudited)
| | | Number
of
Shares | | | Value | | | Percent
of Net
Assets | |
| SHORT-TERM INVESTMENTS |
| State Street Institutional Treasury Money Market Fund - Premier Class, 0.000% | | | 15,161,668 | | | $ | 15,161,668 | | | | 4.91 | % |
| | | | | | | | | | | | | |
| TOTAL SHORT-TERM INVESTMENTS |
| (Cost $15,161,668) | | | | | | | 15,161,668 | | | | 4.91 | |
| | | | | | | | | | | | | |
| TOTAL INVESTMENTS |
| (Cost $211,410,299) | | | | | | | 309,686,782 | | | | 100.37 | |
| | | | | | | | | | | | | |
| Liabilities, Less Cash and Other Assets | | | | | | | (1,136,421 | ) | | | (0.37 | ) |
| | | | | | | | | | | | | |
| NET ASSETS | | | | | | $ | 308,550,361 | | | | 100.00 | % |
See notes to financial statements.
18
INTERNATIONAL OPPORTUNITIES FUND |
Investment Review BY TOM MARSICO AND ROB SUSMAN (UNAUDITED)
The Marsico International Opportunities Fund’s Investor Class shares and Institutional Class shares posted total returns of (US$) -14.41% and -14.36%, respectively, for the six-month fiscal period ended March 31, 2022. The Institutional Class shares commenced operations on December 6, 2021. The performance attributed to the Institutional Class shares prior to that date is that of the Investor Class shares and has not been adjusted to reflect the lower expenses of the Institutional Class shares. During this period, Institutional Class shares would have had returns similar to, but potentially higher than, the Investor Class shares due to the fact that Institutional Class shares represent interests in the same portfolio as Investor Class shares but are subject to lower expenses. The total return information presented here for comparison purposes differs from the total return information disclosed for the Institutional Class shares in the Financial Highlights. The total return information in the Financial Highlights represents the performance for the portion of the fiscal period in which the Institutional Class was operational. The Fund underperformed the MSCI Europe Australasia Far East (“EAFE”) Index, the Fund’s benchmark index, which had a total return of (US$) -3.38% over the same time period. Please see the Fund’s Overview for more detailed information about the Fund’s longer-term performance for various time periods ended March 31, 2022.
The performance data quoted here represent past performance, and past performance is not a guarantee of future results. Investment return and principal value of an investment will fluctuate so that an investor’s shares, when redeemed, may be worth more or less than their original cost. Current performance may be lower or higher than the performance information quoted. To obtain performance information current to the most recent month-end, please call 888-860-8686 or visit marsicofunds.com.(1)
This review highlights Fund performance over a six-month fiscal period. Shareholders should keep in mind that the Fund is intended for long-term investors who hold their shares for substantially longer periods of time. You should also keep in mind that our current views and beliefs regarding all investments discussed in this report are subject to change at any time. References to specific securities, industries, and sectors discussed in this report are not recommendations to buy or sell such securities or related investments, and the Fund may not necessarily hold these securities or investments today. Please see the accompanying Schedule of Investments for the percentage of the Fund’s portfolio represented by the securities mentioned in this report as of the end of the reporting period.
Foreign investments present additional risks due to currency fluctuations, economic and political factors, lower liquidity, differences in securities regulations and accounting standards, possible changes in taxation, limited public information, and other factors. In addition, the Fund is subject to broad risks associated with investing in equity securities markets generally, including the risks that the securities and markets in which it invests may experience volatility and instability, that domestic and global economies and markets may undergo periods of cyclical change and decline, that investors may at times avoid investments in equity securities, and that investments may not perform as anticipated. Please see the Prospectus for more information.
The Fund is not managed to track its benchmark index, and may hold a substantially overweight or underweight position in a sector, industry, or security compared to its weight in the benchmark. The Fund may be subject to risks associated with a particular sector or other area in which it is overweight, including the risk that the stocks of companies within one area could simultaneously decline in price because of an event that affects the entire area. For informational purposes, the discussion below may compare the benchmark weight or performance of a sector or industry to the investment approach of the Fund.
The International Opportunities Fund’s underperformance during the six-month period ended March 31, 2022, as compared to the MSCI EAFE Index, was primarily due to stock selection in several sectors, including the Communication Services, Industrials, and Information Technology sectors, as defined in the Global Industry Classification Standard (“GICS”)(2). In addition, the Fund’s relative performance was dampened by having an overweight allocation to the benchmark index’s weakest-performing area, the Information Technology sector, and an underweight allocation to the benchmark index’s strongest-performing areas, the Energy and Materials sectors.
In the Communication Services sector, Sea Ltd. ADR (“Sea”) detracted from performance, returning -61%. Sea was a top detractor from the Fund’s relative performance as the company issued guidance that equated to declining revenue from its gaming division. “Free Fire” is Sea’s key gaming franchise and we believe that investors likely fear the franchise has matured. We see this drawdown for near term issues as being overstated and continue to believe in the long-term growth trajectory for Sea.
Industrials sector holding Wizz Air Holdings PLC (“Wizz Air”) contributed negatively to Fund performance as it returned -43% for the period. We believe Wizz Air remains a strong long-term growth story as a well situated, well capitalized and highly cost efficient Eastern European airline poised to double its fleet capacity over the next three years. Nevertheless, the stock has been weak in recent months given the war in Ukraine and the significant rise of oil prices. We have reduced the size of the Fund’s position in Wizz Air as we wait for more clarity on the longer-term impacts of travel demand trends in Eastern Europe and higher oil prices on the company, but remain confident in Wizz Air given what we believe to be its sound business model and strong growth plan.
Information Technology stock MercadoLibre, Inc. (“MercadoLibre”) (-29%) also detracted from Fund performance for the period. We believe MercadoLibre shares have underperformed recently primarily for two reasons. First, most high growth, unprofitable e-commerce stocks around the world have sold off in recent months as we lap tough COVID-19-related sales comparisons and interest rates rise significantly (depressing long duration growth multiples). This issue is not specific to MercadoLibre and we believe it should have no impact on the company’s long-term growth and earnings prospects—both of which remain very strong. The second issue is that many Brazilian payment stocks have been weak in recent months due to rising Brazilian interest rates and
19
INTERNATIONAL OPPORTUNITIES FUND |
tougher competition. A small part of MercadoLibre’s business is tied to financial technology (fintech) and merchant acquiring, and as rates have risen and made the net interest margin in this business less profitable, the profitability of the fintech side of MercadoLibre has been valued lower. Despite this, the company has now reported two very strong quarters in a row, continues to improve the underlying profitability of its core e-commerce business, and remains a share taker in the growing e-commerce space in Latin America. MercadoLibre’s fintech business also continues to grow nicely, though we believe management has rightly shifted toward a “profit first” strategy. Our medium-term outlook for MercadoLibre remains optimistic given the company’s dominance in Latin America e-commerce, which we believe is in the early innings of growth.
On the positive side, certain holdings in the Consumer Staples sector, along with certain other individual contributors, provided a boost to Fund performance. An overweight allocation to the relatively stronger-performing Health Care sector provided an additional tailwind to performance.
In the Health Care sector, AstraZeneca PLC (“AstraZeneca”) (+13%) performed well for the Fund. During the reporting period, AstraZeneca continued to report industry-leading top line growth as a result of new product innovation in the company’s Oncology, Cardiovascular, Renal and Metabolism divisions. Additionally, as AstraZeneca completed the acquisition of Alexion in June of 2021, the company entered into the marketing of medicines for rare diseases, a market with faster revenue growth and higher operating margins when compared to traditional pharmaceutical manufacturers. We believe this portfolio transition, along with new product innovation, was reflected in the reporting period and should continue to lead to AstraZeneca reporting above-industry top line growth, operating profitability and cash flow for the foreseeable future.
Retailing giant Dollarama, Inc. (“Dollarama”) was another strong contributor to performance, posting +30% for the period. Dollarama was a top contributor to the Fund’s performance due to its strong execution against a very tough backdrop for retailers. Dollarama’s modus operandi involves concurrently contracting with its goods providers, which are primarily in China, 6-12 months ahead of time, contracting the applicable freight for the products and hedging currencies. This sourcing practice of Dollarama’s became a competitive advantage in the current environment of supply shortages, inflation, and greatly increased freight costs. In addition, we believe Dollarama’s demonstrated ability to migrate select items to higher price points to cover higher costs should lead to higher sales growth and margin performance.
Although active currency management is not a central facet of the International Opportunities Fund’s investment process, fluctuations in major world currencies can at times affect the Fund’s performance. During the period, the net effect of currency moves had a positive impact on Fund performance.
There were several shifts in the Fund’s sector allocations during the period. The Fund reduced its allocations to the Consumer Discretionary and Communication Services sectors, and increased its allocations to the Financials and Consumer Staples sectors. There were no significant changes to the Fund’s allocations to the Information Technology, Real Estate, Health Care, Materials, Energy or Industrials sectors.
Fiscal Period-End Investment Posture
As of March 31, 2022, the Fund’s primary economic sector allocations included the Information Technology, Health Care, Industrials, Financials, Consumer Discretionary, and Communication Services sectors. The Fund had no investments in the Utilities sector.
In terms of country allocations, the Fund’s most significant weightings at period-end, excluding short-term investments, were in Japan, Germany, Switzerland, the United Kingdom, France, China/Hong Kong, and Canada. Country-level weightings generally should be considered a residual of the Fund’s stock selection process rather than a major, proactive facet of its investment strategy.
Sincerely,
THOMAS F. MARSICO
ROBERT G. SUSMAN, CFA
PORTFOLIO MANAGERS
(1) | Total returns are based on net change in net asset value assuming reinvestment of distributions. Periodically, certain fees and expenses have been waived or reimbursed by Marsico Capital Management, LLC (the “Adviser”). In the absence of such a waiver or reimbursement, the performance returns reflected would have been reduced. In accordance with the expense limitation and fee waiver agreement, the Adviser may recoup fees and expenses previously waived or reimbursed under certain parameters. Periodically, the Adviser has recouped such fees or expenses, resulting in a lower performance return. Please see the Prospectus for more information. |
(2) | Regarding GICS data cited throughout this report, the Global Industry Classification Standard was developed by and is the exclusive property and service mark of MSCI Inc. (“MSCI”) and Standard & Poor’s (“S&P”) and is licensed for use by the Adviser. Neither MSCI, S&P, nor the Adviser or any third party involved in compiling GICS makes any express or implied warranties or representations with respect to such standard or classification (or the results from use thereof), and all such parties hereby expressly disclaim all warranties of originality, accuracy, completeness, merchantability and fitness for a particular purpose with respect to any such standard or classification. MSCI, S&P, the Adviser, and any of their affiliates or third parties involved in compiling GICS shall not have any liability for any direct, indirect, special, punitive, consequential or any other damages (including lost profits) even if notified of the possibility of such damages. |
20
INTERNATIONAL OPPORTUNITIES Fund Overview |
March 31, 2022 (Unaudited)
The International Opportunities Fund is a diversified portfolio and invests primarily (generally, no less than 65% of its total assets) in common stocks of foreign companies that are selected for their long-term growth potential, and other foreign securities, whether traded in the US (including as American Depositary Receipts) or in foreign markets or both. The Fund may invest in an unlimited number of companies of any size throughout the world. The Fund normally invests in the securities of issuers that are economically tied to one or more foreign countries, and expects to be invested in various issuers or securities that together have ties to at least four different foreign countries. The Fund may invest in securities of companies economically tied to emerging markets. Some issuers or securities in the Fund’s portfolio may be economically tied to the US.
| | | INVESTOR CLASS | | | INSTITUTIONAL CLASS | |
| | TOTAL ANNUAL OPERATING EXPENSES* | 1.68% | | TOTAL ANNUAL OPERATING EXPENSES* | 1.84% | |
| | NET EXPENSES* † | 1.50% | | NET EXPENSES* † | 1.25% | |
GROWTH OF $10,000(1)(2)(3) | PERFORMANCE COMPARISON(1)(2) |
| | Average Annualized Returns |
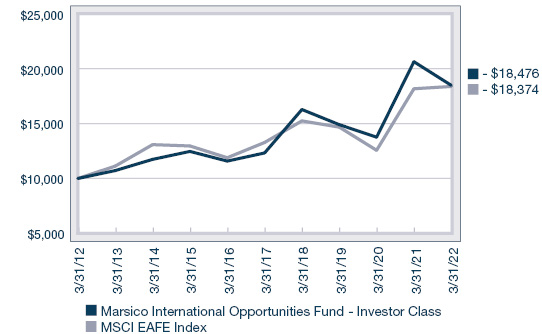
| 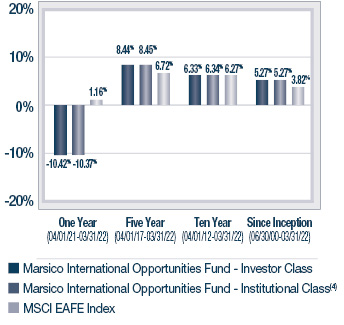
|
SECTOR ALLOCATION(5) | TOP FIVE HOLDINGS |
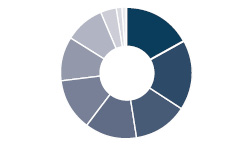 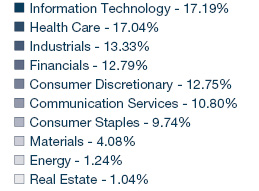
| | | | |
| | AstraZeneca PLC | 3.77% | |
| | Airbus S.E. | 3.66% | |
| | Roche Holding A.G. | 3.62% | |
| | ASML Holding N.V. | 3.55% | |
| | Nestlé S.A. | 3.41% | |
| | | | |
* | The Total Annual Operating Expenses and Net Expenses are reflective of the information disclosed in the Funds’ Prospectus dated January 31, 2022 and may differ from the expense ratios disclosed in this report. |
† | Marsico Capital Management, LLC (the “Adviser”) has entered into a written expense limitation and fee waiver agreement under which it has agreed (i) to limit the total expenses of the Investor Class of the Fund (excluding taxes, interest, acquired fund fees and expenses, litigation, extraordinary expenses, and brokerage and other transaction expenses relating to the purchase or sale of portfolio investments) to an annual rate of 1.50% of the Fund’s average net assets attributable to Investor Class shares, and (ii) to limit the total expenses of the Institutional Class of the Fund (excluding taxes, interest, acquired fund fees and expenses, litigation, extraordinary expenses, and brokerage and other transaction expenses relating to the purchase or sale of portfolio investments) to an annual rate of 1.25% of the Fund’s average net assets attributable to Institutional Class shares, until January 31, 2023. This expense limitation and fee waiver agreement may be terminated by the Adviser at any time after January 31, 2023, upon 15 days prior notice to the Fund and its administrator. The Adviser may recoup from the Fund fees previously waived or expenses previously reimbursed by the Adviser with respect to the Fund pursuant to this agreement (or a previous expense limitation agreement) if: (1) such recoupment by the Adviser does not cause the Fund, at the time of recoupment, to exceed the lesser of (a) the expense limitation in effect at the time the relevant amount was waived and/or reimbursed, or (b) the expense limitation in effect at the time of the proposed recoupment, and (2) the recoupment is made within three years after the fiscal year end date as of which the amount to be waived or reimbursed was determined and the waiver or reimbursement occurred. |
(1) | The performance data quoted here represent past performance, and past performance is not a guarantee of future results. Investment return and principal value of an investment will fluctuate so that an investor’s shares, when redeemed, may be worth more or less than their original cost. Current performance may be lower or higher than the performance information quoted. To obtain performance information current to the most recent month-end, please call 888-860-8686 or visit marsicofunds.com. |
| The performance included in the chart and graph does not reflect the deduction of taxes on Fund distributions or the redemption of Fund shares. |
| All indices are unmanaged and investors cannot invest directly in an index. |
| The MSCI EAFE Index tracks the stocks of about 1,000 companies in Europe, Australasia, and the Far East (EAFE). |
(2) | Periodically, certain fees and expenses have been waived or reimbursed by the Adviser. In the absence of such a waiver or reimbursement, the performance returns reflected would have been reduced. In accordance with the expense limitation and fee waiver agreement, the Adviser may recoup fees and expenses previously waived or reimbursed under certain parameters. Periodically, the Adviser has recouped such fees or expenses, resulting in a lower performance return. |
(3) | This chart assumes an initial investment of $10,000 made on March 31, 2012 in the Investor Class shares of the Fund. Total returns are based on net change in NAV, assuming reinvestment of distributions. |
(4) | Institutional Class shares commenced operations on December 6, 2021. The performance attributed to the Institutional Class shares prior to that date is that of the Investor Class shares. Performance prior to December 6, 2021 has not been adjusted to reflect the lower expenses of the Institutional Class shares. During this period, Institutional Class shares would have had returns similar to, but potentially higher than, Investor Class shares due to the fact that Institutional Class shares represent interests in the same portfolio as Investor Class shares but are typically subject to lower expenses than the Investor Class shares. |
(5) | Sector weightings represent the percentage of the Fund’s investments (excluding cash equivalents) in certain general sectors. These sectors may include more than one industry. The Fund’s portfolio composition is subject to change at any time. |
21
MARSICO INTERNATIONAL OPPORTUNITIES FUND
SCHEDULE OF INVESTMENTS
March 31, 2022 (Unaudited)
| | | Number
of
Shares | | | Value | | | Percent
of Net
Assets | |
| COMMON STOCKS |
| Advertising |
| S4 Capital PLC* | | | 39,185 | | | $ | 147,599 | | | | 0.31 | % |
| | | | | | | | | | | | | |
| Aerospace & Defense |
| Airbus S.E.* | | | 14,603 | | | | 1,762,121 | | | | 3.66 | |
| | | | | | | | | | | | | |
| Airlines |
| Wizz Air Holdings PLC* | | | 11,107 | | | | 418,781 | | | | 0.87 | |
| | | | | | | | | | | | | |
| Apparel, Accessories & Luxury Goods |
| adidas A.G. | | | 1,652 | | | | 384,959 | | | | 0.80 | |
| LVMH Moet Hennessy Louis Vuitton S.E. | | | 1,103 | | | | 787,320 | | | | 1.63 | |
| | | | | | | | 1,172,279 | | | | 2.43 | |
| Application Software |
| Atlassian Corp. PLC - Cl. A* | | | 1,443 | | | | 423,997 | | | | 0.88 | |
| Constellation Software, Inc. | | | 288 | | | | 492,306 | | | | 1.02 | |
| SAP S.E. | | | 8,994 | | | | 996,788 | | | | 2.07 | |
| Xero Ltd.* | | | 4,129 | | | | 312,927 | | | | 0.65 | |
| | | | | | | | 2,226,018 | | | | 4.62 | |
| Asset Management & Custody Banks |
| Julius Baer Group Ltd. | | | 9,167 | | | | 530,719 | | | | 1.10 | |
| | | | | | | | | | | | | |
| Automobile Manufacturers |
| Ferrari N.V. | | | 1,184 | | | | 258,219 | | | | 0.54 | |
| Volkswagen A.G. Preference Shares | | | 1,523 | | | | 261,729 | | | | 0.54 | |
| | | | | | | | 519,948 | | | | 1.08 | |
| Biotechnology |
| CSL Ltd. | | | 3,655 | | | | 729,694 | | | | 1.52 | |
| | | | | | | | | | | | | |
| Broadcasting |
| Nordic Entertainment Group A.B. - Cl. B* | | | 11,107 | | | | 448,489 | | | | 0.93 | |
| | | | | | | | | | | | | |
| Casinos & Gaming |
| Evolution A.B. | | | 2,759 | | | | 280,685 | | | | 0.58 | |
| | | | | | | | | | | | | |
| Consumer Electronics |
| Sony Group Corp. | | | 12,500 | | | | 1,285,945 | | | | 2.67 | |
| | | | | | | | | | | | | |
| Data Processing & Outsourced Services |
| Adyen N.V.* | | | 172 | | | | 340,679 | | | | 0.71 | |
| Mastercard, Inc. - Cl. A | | | 2,215 | | | | 791,597 | | | | 1.64 | |
| | | | | | | | 1,132,276 | | | | 2.35 | |
| Distillers & Vintners |
| Diageo PLC | | | 23,041 | | | | 1,168,744 | | | | 2.43 | |
| | | | | | | | | | | | | |
| Diversified Banks |
| BAWAG Group A.G. | | | 16,949 | | | | 855,231 | | | | 1.78 | |
| HDFC Bank Ltd. Spon. ADR | | | 14,134 | | | | 866,838 | | | | 1.80 | |
| | | | | | | | 1,722,069 | | | | 3.58 | |
| Electronic Equipment & Instruments |
| Keyence Corp. | | | 1,800 | | | | 834,664 | | | | 1.73 | |
| | | | | | | | | | | | | |
| COMMON STOCKS (continued) |
| Financial Exchanges & Data |
| Deutsche Boerse A.G. | | | 7,824 | | | | 1,408,404 | | | | 2.93 | % |
| | | | | | | | | | | | | |
| General Merchandise Stores |
| Dollarama, Inc. | | | 6,219 | | | | 352,699 | | | | 0.73 | |
| | | | | | | | | | | | | |
| Health Care Equipment |
| Olympus Corp. | | | 77,200 | | | | 1,463,140 | | | | 3.04 | |
| | | | | | | | | | | | | |
| Health Care Supplies |
| Alcon, Inc. | | | 17,017 | | | | 1,348,187 | | | | 2.80 | |
| | | | | | | | | | | | | |
| Human Resource & Employment Services |
| Recruit Holdings Company Ltd. | | | 17,500 | | | | 760,323 | | | | 1.58 | |
| | | | | | | | | | | | | |
| Industrial Conglomerates |
| Siemens A.G. | | | 8,173 | | | | 1,131,693 | | | | 2.35 | |
| | | | | | | | | | | | | |
| Industrial Gases |
| Air Liquide S.A. | | | 5,527 | | | | 966,914 | | | | 2.01 | |
| | | | | | | | | | | | | |
| Industrial Machinery |
| MISUMI Group, Inc. | | | 23,900 | | | | 711,523 | | | | 1.48 | |
| | | | | | | | | | | | | |
| Integrated Oil & Gas |
| TotalEnergies S.E. | | | 11,641 | | | | 589,029 | | | | 1.22 | |
| | | | | | | | | | | | | |
| Integrated Telecommunication Services |
| Cellnex Telecom S.A. | | | 29,591 | | | | 1,424,049 | | | | 2.96 | |
| Deutsche Telekom A.G. | | | 19,239 | | | | 358,310 | | | | 0.74 | |
| | | | | | | | 1,782,359 | | | | 3.70 | |
| Interactive Home Entertainment |
| Sea Ltd. ADR* | | | 4,961 | | | | 594,278 | | | | 1.23 | |
| | | | | | | | | | | | | |
| Interactive Media & Services |
| Scout24 S.E. | | | 13,314 | | | | 759,059 | | | | 1.58 | |
| Tencent Holdings Ltd. | | | 22,400 | | | | 1,032,513 | | | | 2.14 | |
| | | | | | | | 1,791,572 | | | | 3.72 | |
| Internet & Direct Marketing Retail |
| Alibaba Group Holding Ltd. Spon. ADR* | | | 6,071 | | | | 660,525 | | | | 1.37 | |
| JD.com, Inc. - Cl. A* | | | 11,866 | | | | 337,171 | | | | 0.70 | |
| Meituan - Cl. B* | | | 24,400 | | | | 462,232 | | | | 0.96 | |
| MercadoLibre, Inc.* | | | 476 | | | | 566,192 | | | | 1.18 | |
| | | | | | | | 2,026,120 | | | | 4.21 | |
| Internet Services & Infrastructure |
| Shopify, Inc. - Cl. A* | | | 259 | | | | 175,074 | | | | 0.36 | |
| | | | | | | | | | | | | |
| Life & Health Insurance |
| AIA Group Ltd. | | | 113,200 | | | | 1,182,020 | | | | 2.46 | |
| | | | | | | | | | | | | |
| Movies & Entertainment |
| Spotify Technology S.A.* | | | 2,388 | | | | 360,636 | | | | 0.75 | |
| | | | | | | | | | | | | |
| Packaged Foods & Meats |
| Nestlé S.A. | | | 12,611 | | | | 1,639,665 | | | | 3.41 | |
22
| | | Number
of
Shares | | | Value | | | Percent
of Net
Assets | |
| COMMON STOCKS (continued) |
| Personal Products |
| L’Oreal S.A. | | | 1,782 | | | $ | 711,811 | | | | 1.48 | % |
| | | | | | | | | | | | | |
| Pharmaceuticals |
| AstraZeneca PLC | | | 13,692 | | | | 1,815,736 | | | | 3.77 | |
| Novo Nordisk A/S - Cl. B | | | 8,922 | | | | 989,593 | | | | 2.06 | |
| Roche Holding A.G. | | | 4,409 | | | | 1,744,472 | | | | 3.62 | |
| | | | | | | | 4,549,801 | | | | 9.45 | |
| Property & Casualty Insurance |
| Intact Financial Corp. | | | 8,300 | | | | 1,226,394 | | | | 2.55 | |
| | | | | | | | | | | | | |
| Real Estate Services |
| FirstService Corp. | | | 3,400 | | | | 491,799 | | | | 1.02 | |
| | | | | | | | | | | | | |
| Research & Consulting Services |
| Experian PLC | | | 26,741 | | | | 1,030,213 | | | | 2.14 | |
| | | | | | | | | | | | | |
| Restaurants |
| Domino’s Pizza Enterprises Ltd. | | | 6,353 | | | | 413,541 | | | | 0.86 | |
| | | | | | | | | | | | | |
| Semiconductor Equipment |
| ASML Holding N.V. | | | 2,557 | | | | 1,708,642 | | | | 3.55 | |
| | | | | | | | | | | | | |
| Semiconductors |
| Infineon Technologies A.G. | | | 15,880 | | | | 537,221 | | | | 1.12 | |
| Taiwan Semiconductor Manufacturing Co., Ltd. Spon. ADR | | | 14,839 | | | | 1,547,114 | | | | 3.21 | |
| | | | | | | | 2,084,335 | | | | 4.33 | |
| Soft Drinks |
| Coca-Cola Europacific Partners PLC | | | 22,714 | | | | 1,104,128 | | | | 2.29 | |
| | | | | | | | | | | | | |
| Specialty Chemicals |
| Shin-Etsu Chemical Company Ltd. | | | 6,400 | | | | 972,373 | | | | 2.02 | |
| | | | | | | | | | | | | |
| Trucking |
| Uber Technologies, Inc.* | | | 14,324 | | | | 511,080 | | | | 1.06 | |
| | | | | | | | | | | | | |
| TOTAL COMMON STOCKS |
| (Cost $38,451,681) | | | | | | | 47,467,784 | | | | 98.59 | |
| | | | | | | | | | | | | |
| SHORT-TERM INVESTMENTS |
| State Street Institutional Treasury Money Market Fund - Premier Class, 0.000% | | | 700,067 | | | | 700,067 | | | | 1.45 | % |
| | | | | | | | | | | | | |
| TOTAL SHORT-TERM INVESTMENTS |
| (Cost $700,067) | | | | | | | 700,067 | | | | 1.45 | |
| | | | | | | | | | | | | |
| TOTAL INVESTMENTS |
| (Cost $39,151,748) | | | | | | | 48,167,851 | | | | 100.04 | |
| | | | | | | | | | | | | |
| Liabilities, Less Cash and Other Assets | | | | | | | (19,003 | ) | | | (0.04 | ) |
| | | | | | | | | | | | | |
| NET ASSETS | | | | | | $ | 48,148,848 | | | | 100.00 | % |
SUMMARY OF INVESTMENTS BY COUNTRY
| Country | | Market Value | | | Percent of
Investment
Securities | |
| Argentina | | $ | 566,192 | | | | 1.18 | % |
| Australia | | | 1,567,232 | | | | 3.25 | |
| Austria | | | 855,231 | | | | 1.78 | |
| Canada | | | 2,738,272 | | | | 5.68 | |
| China/Hong Kong | | | 3,674,461 | | | | 7.63 | |
| Denmark | | | 989,593 | | | | 2.05 | |
| France | | | 4,817,195 | | | | 10.00 | |
| Germany | | | 5,838,162 | | | | 12.12 | |
| India | | | 866,838 | | | | 1.80 | |
| Italy | | | 258,219 | | | | 0.54 | |
| Japan | | | 6,027,968 | | | | 12.52 | |
| Netherlands | | | 2,049,321 | | | | 4.26 | |
| New Zealand | | | 312,927 | | | | 0.65 | |
| Singapore | | | 594,278 | | | | 1.23 | |
| Spain | | | 1,424,049 | | | | 2.96 | |
| Sweden | | | 1,089,810 | | | | 2.26 | |
| Switzerland | | | 5,681,825 | | | | 11.80 | |
| Taiwan | | | 1,547,114 | | | | 3.21 | |
| United Kingdom | | | 5,266,420 | | | | 10.93 | |
United States(1) | | | 2,002,744 | | | | 4.15 | |
| | | $ | 48,167,851 | | | | 100.00 | % |
| (1) | Includes short-term securities. |
See notes to financial statements.
23
Investment Review BY TOM MARSICO, BRANDON GEISLER, AND ROB SUSMAN (UNAUDITED)
The Marsico Global Fund’s Investor Class shares and Institutional Class shares posted total returns of (US$) -15.20% and -15.11%, respectively, for the six-month fiscal period ended March 31, 2022. The Institutional Class shares commenced operations on December 6, 2021. The performance attributed to the Institutional Class shares prior to that date is that of the Investor Class shares and has not been adjusted to reflect the lower expenses of the Institutional Class shares. During this period, Institutional Class shares would have had returns similar to, but potentially higher than, the Investor Class shares due to the fact that Institutional Class shares represent interests in the same portfolio as Investor Class shares but are subject to lower expenses. The total return information presented here for comparison purposes differs from the total return information disclosed for the Institutional Class shares in the Financial Highlights. The total return information in the Financial Highlights represents the performance for the portion of the fiscal period in which the Institutional Class was operational. The Fund underperformed the MSCI All Country World Index (“MSCI ACWI Index”), the Fund’s benchmark index, which had a total return of (US$) +0.96% over the same time period. Please see the Fund’s Overview for more detailed information about the Fund’s longer-term performance for various time periods ended March 31, 2022.
The performance data quoted here represent past performance, and past performance is not a guarantee of future results. Investment return and principal value of an investment will fluctuate so that an investor’s shares, when redeemed, may be worth more or less than their original cost. Current performance may be lower or higher than the performance information quoted. To obtain performance information current to the most recent month-end, please call 888-860-8686 or visit marsicofunds.com.(1)
This review highlights Fund performance over a six-month fiscal period. Shareholders should keep in mind that the Fund is intended for long-term investors who hold their shares for substantially longer periods of time. You should also keep in mind that our current views and beliefs regarding all investments discussed in this report are subject to change at any time. References to specific securities, industries, and sectors discussed in this report are not recommendations to buy or sell such securities or related investments, and the Fund may not necessarily hold these securities or investments today. Please see the accompanying Schedule of Investments for the percentage of the Fund’s portfolio represented by the securities mentioned in this report as of the end of the reporting period.
Foreign investments present additional risks due to currency fluctuations, economic and political factors, lower liquidity, differences in securities regulations and accounting standards, possible changes in taxation, limited public information, and other factors. In addition, the Fund is subject to broad risks associated with investing in equity securities markets generally, including the risks that the securities and markets in which it invests may experience volatility and instability, that domestic and global economies and markets may undergo periods of cyclical change and decline, that investors may at times avoid investments in equity securities, and that investments may not perform as anticipated. Please see the Prospectus for more information.
The Fund is not managed to track its benchmark index, and may hold a substantially overweight or underweight position in a sector, industry, or security compared to its weight in the benchmark. The Fund may be subject to risks associated with a particular sector or other area in which it is overweight, including the risk that the stocks of companies within one area could simultaneously decline in price because of an event that affects the entire area. For informational purposes, the discussion below may compare the benchmark weight or performance of a sector or industry to the investment approach of the Fund.
The Global Fund’s underperformance during the six-month period ended March 31, 2022 as compared to the MSCI ACWI Index was due, in part, to certain weaker-performing stocks in several sectors, most notably in the Information Technology, Communication Services, and Consumer Discretionary sectors, as defined in the Global Industry Classification Standard (“GICS”)(2). The Fund’s relative performance was also hindered by having an overweight allocation in the benchmark index’s weakest-performing areas, the Communication Services and Consumer Discretionary sectors, and by having no exposure to the Energy sector, the benchmark index’s strongest-performing sector.
Information Technology holding Shopify, Inc. – Cl. A (“Shopify”) (-50% prior to being sold) benefitted greatly from the needs of businesses and consumers to move commerce online during the COVID-19 pandemic. As we emerge from lockdowns and other restrictions related to COVID-19, consumers are migrating spending toward services and travel and away from goods. In-person retail traffic is returning, leading to a slowing in online spending as well, which has negatively impacted Shopify’s operating performance. This, in turn, led to poor performance by the stock and ultimately led us to sell the Fund’s position in Shopify.
In the Communication Services sector, Sea Ltd. ADR (“Sea”) detracted from Fund performance in the period, returning -56% prior to being sold. Sea was a top detractor from the Fund’s relative performance as the company issued guidance that equated to declining revenue from its gaming division. “Free Fire” is Sea’s key gaming franchise and we believe that investors likely fear the franchise has matured. While we see this drawdown for near term issues as being overstated and continue to believe in the long-term growth trajectory for Sea and its myriad of drivers, we exited the position to pursue other attractive investment opportunities.
Consumer Discretionary stock Domino’s Pizza Enterprises Ltd. (“Domino’s”) (-39%) was a detractor to the Fund’s performance during the period due to a tougher operating environment for its Japanese business in addition to food and labor inflation seen across its markets in Australia, Europe, and Asia. Domino’s Japanese business had a substantial negative margin impact in the second half of calendar year 2021 as it added the most corporate stores it has ever added in a six-month period (53 new corporate stores). Domino’s Japan typically
24
grows stores by opening them first on a corporate-run basis before then re-franchising them to franchisees when the stores are up and running. The nature of corporate stores is that both store-level revenue and costs are carried on the books of Domino’s and not on those of the franchisees (who would, in a franchise model, pay royalties to the parent). New store openings come with additional costs and revenues take time to ramp. Because of this, we believe the margin hit to Domino’s Japanese business should prove transitory as the stores mature and are re-franchised. In terms of food and labor inflation, Domino’s appears better positioned than most peers that have much slimmer margins to absorb them. In the meantime, select price increases are being taken by the company to pass along higher costs.
On the positive side, there were a few individual contributors to Fund performance, discussed further below. Additionally, as benchmark returns were modestly positive for the period, the Fund’s low 1% cash position on average created a boost to relative Fund performance.
Information Technology holding NVIDIA Corp. (“NVIDIA”) (+26%) was the top contributor to the Fund’s performance during the period, reporting a better-than-expected recent fiscal quarter and introducing a host of new products and services at its March Investor Day. Demand by NVIDIA’s customers is tracking well ahead of NVIDIA’s supply in both the key gaming and datacenter businesses, and this dynamic is expected to continue through calendar year 2022. Datacenter strength is broad-based with cloud providers, high-performance computing customers, and enterprises all contributing to growth. In addition, NVIDIA’s recent Investor Day introduced the latest graphics processing unit chip and platform for the datacenter space, named “Hopper.” This new chip is expected to be launched for gaming applications in the fall of 2022, updating a two-year-old product, and we believe it will drive a healthy refresh cycle. In addition to hardware, NVIDIA is leaning into enterprise software and has had several launches in the space targeting industries such as healthcare, manufacturing, and retail. Further, enthusiasm continues to build for NVIDIA’s Omniverse product, which is in beta testing and is aimed at taking advantage of the continued development of and focus on the metaverse.
Apple, Inc. (“Apple”) (+24%), an Information Technology sector holding, was a strong performer during the period as its services business has begun to inflect, showing the power of a diversified growth platform that has developed around its core iPhone product. “Advertising” and “Payments” divisions are newer large growth drivers for Apple, and the company is in the very early stages of monetizing these vertical business segments.
During the period, the Fund increased exposure to the Financials, Industrials, Materials, Health Care, Consumer Discretionary, and Consumer Staples sectors. The Fund significantly reduced exposure to the Communication Services and Information Technology sectors.
Fiscal Period-End Investment Posture
As of March 31, 2022, the Fund’s primary economic sector allocations included Information Technology, Consumer Discretionary, and Communication Services. At period end, the Fund had no investments in the Energy, Real Estate, or Utilities sectors.
The Fund’s most significant country allocation weightings at period-end, excluding short-term investments, were in the United States, France, Netherlands, and Germany. Country-level weightings generally should be considered a residual of the Fund’s stock selection process rather than a major, proactive facet of its investment strategy.
Sincerely,
THOMAS F. MARSICO
BRANDON A. GEISLER
ROBERT G. SUSMAN, CFA
PORTFOLIO MANAGERS
(1) | Total returns are based on net change in net asset value assuming reinvestment of distributions. Periodically, certain fees and expenses have been waived or reimbursed by Marsico Capital Management, LLC (the “Adviser”). In the absence of such a waiver or reimbursement, the performance returns reflected would have been reduced. In accordance with the expense limitation and fee waiver agreement, the Adviser may recoup fees and expenses previously waived or reimbursed under certain parameters. Periodically, the Adviser has recouped such fees or expenses, resulting in a lower performance return. Please see the Prospectus for more information. |
(2) | Regarding GICS data cited throughout this report, the Global Industry Classification Standard was developed by and is the exclusive property and service mark of MSCI Inc. (“MSCI”) and Standard & Poor’s (“S&P”) and is licensed for use by the Adviser. Neither MSCI, S&P, nor the Adviser or any third party involved in compiling GICS makes any express or implied warranties or representations with respect to such standard or classification (or the results from use thereof), and all such parties hereby expressly disclaim all warranties of originality, accuracy, completeness, merchantability and fitness for a particular purpose with respect to any such standard or classification. MSCI, S&P, the Adviser, and any of their affiliates or third parties involved in compiling GICS shall not have any liability for any direct, indirect, special, punitive, consequential or any other damages (including lost profits) even if notified of the possibility of such damages. |
25
March 31, 2022 (Unaudited)
The Global Fund is a diversified portfolio and invests primarily in the common stocks of US and foreign companies that are selected for their long-term growth potential. The Fund may invest in an unlimited number of companies of any size that are economically tied to any countries or markets throughout the world, including securities of companies economically tied to emerging markets. Under normal market conditions, the Fund will invest significantly (generally, at least 40% of its net assets) in the securities of issuers organized or located outside the US or doing business outside the US or other foreign securities (unless market conditions are not deemed favorable by the Adviser, in which case the Fund generally will invest at least 30% of its assets in such foreign securities). The Fund will invest its assets in various regions and countries, including the US, that encompass not less than three different countries overall.
| | | INVESTOR CLASS | | | INSTITUTIONAL CLASS | |
| | TOTAL ANNUAL OPERATING EXPENSES* | 1.37% | | TOTAL ANNUAL OPERATING EXPENSES* | 1.16% | |
| | NET EXPENSES* † | 1.45% | | | | |
GROWTH OF $10,000(1)(2)(3) | PERFORMANCE COMPARISON(1)(2) |
| | Average Annualized Returns |
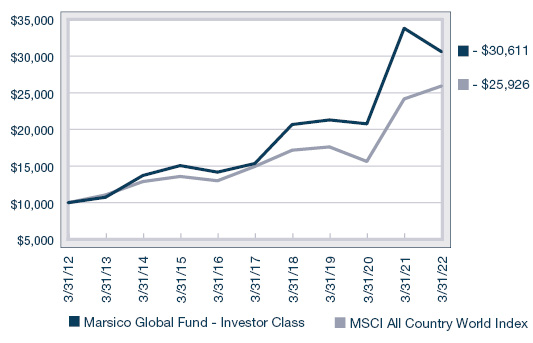
| 
|
SECTOR ALLOCATION(5) | TOP FIVE HOLDINGS |
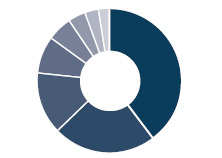 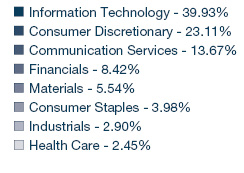
| | | | |
| | Apple, Inc. | 8.19% | |
| | Amazon.com, Inc. | 8.08% | |
| | Microsoft Corp. | 7.81% | |
| | ASML Holding N.V. - NY Reg. Shs. | 5.69% | |
| | Hermes International | 4.57% | |
| | | | |
* | The Total Annual Operating Expenses and Net Expenses are reflective of the information disclosed in the Funds’ Prospectus dated January 31, 2022 and may differ from the expense ratios disclosed in this report. |
† | Marsico Capital Management, LLC (the “Adviser”) has entered into a written expense limitation and fee waiver agreement under which it has agreed (i) to limit the total expenses of the Investor Class of the Fund (excluding taxes, interest, acquired fund fees and expenses, litigation, extraordinary expenses, and brokerage and other transaction expenses relating to the purchase or sale of portfolio investments) to an annual rate of 1.50% of the Fund’s average net assets attributable to Investor Class shares, and (ii) to limit the total expenses of the Institutional Class of the Fund (excluding taxes, interest, acquired fund fees and expenses, litigation, extraordinary expenses, and brokerage and other transaction expenses relating to the purchase or sale of portfolio investments) to an annual rate of 1.25% of the Fund’s average net assets attributable to Institutional Class shares, until January 31, 2023. This expense limitation and fee waiver agreement may be terminated by the Adviser at any time after January 31, 2023, upon 15 days prior notice to the Fund and its administrator. The Adviser may recoup from the Fund fees previously waived or expenses previously reimbursed by the Adviser with respect to the Fund pursuant to this agreement (or a previous expense limitation agreement) if: (1) such recoupment by the Adviser does not cause the Fund, at the time of recoupment, to exceed the lesser of (a) the expense limitation in effect at the time the relevant amount was waived and/or reimbursed, or (b) the expense limitation in effect at the time of the proposed recoupment, and (2) the recoupment is made within three years after the fiscal year end date as of which the amount to be waived or reimbursed was determined and the waiver or reimbursement occurred. |
(1) | The performance data quoted here represent past performance, and past performance is not a guarantee of future results. Investment return and principal value of an investment will fluctuate so that an investor’s shares, when redeemed, may be worth more or less than their original cost. Current performance may be lower or higher than the performance information quoted. To obtain performance information current to the most recent month-end, please call 888-860-8686 or visit marsicofunds.com. |
| The performance included in the chart and graph does not reflect the deduction of taxes on Fund distributions or the redemption of Fund shares. |
| All indices are unmanaged and investors cannot invest directly in an index. |
| The MSCI ACWI (All Country World Index) Index is a free float-adjusted market capitalization index that is designed to measure equity market performance in the global developed and emerging markets. |
(2) | Periodically, certain fees and expenses have been waived or reimbursed by the Adviser. In the absence of such a waiver or reimbursement, the performance returns reflected would have been reduced. In accordance with the expense limitation and fee waiver agreement, the Adviser may recoup fees and expenses previously waived or reimbursed under certain parameters. Periodically, the Adviser has recouped such fees or expenses, resulting in a lower performance return. |
(3) | This chart assumes an initial investment of $10,000 made on March 31, 2012 in the Investor Class shares of the Fund. Total returns are based on net change in NAV, assuming reinvestment of distributions. |
(4) | Institutional Class shares commenced operations on December 6, 2021. The performance attributed to the Institutional Class shares prior to that date is that of the Investor Class shares. Performance prior to December 6, 2021 has not been adjusted to reflect the lower expenses of the Institutional Class shares. During this period, Institutional Class shares would have had returns similar to, but potentially higher than, Investor Class shares due to the fact that Institutional Class shares represent interests in the same portfolio as Investor Class shares but are typically subject to lower expenses than the Investor Class shares. |
(5) | Sector weightings represent the percentage of the Fund’s investments (excluding cash equivalents) in certain general sectors. These sectors may include more than one industry. The Fund’s portfolio composition is subject to change at any time. |
26
MARSICO GLOBAL FUND
SCHEDULE OF INVESTMENTS
March 31, 2022 (Unaudited)
| | | Number
of
Shares | | | Value | | | Percent
of Net
Assets | |
| COMMON STOCKS |
| Apparel, Accessories & Luxury Goods |
| Hermes International | | | 7,090 | | | $ | 10,034,802 | | | | 4.57 | % |
| | | | | | | | | | | | | |
| Application Software |
| Atlassian Corp. PLC - Cl. A* | | | 16,196 | | | | 4,758,871 | | | | 2.17 | |
| SAP S.E. Spon. ADR | | | 36,043 | | | | 3,999,331 | | | | 1.82 | |
| | | | | | | | 8,758,202 | | | | 3.99 | |
| Asset Management & Custody Banks |
| Blackstone, Inc. | | | 47,130 | | | | 5,982,682 | | | | 2.73 | |
| | | | | | | | | | | | | |
| Automobile Manufacturers |
| Tesla, Inc.* | | | 8,588 | | | | 9,254,429 | | | | 4.22 | |
| | | | | | | | | | | | | |
| Data Processing & Outsourced Services |
| Adyen N.V.* | | | 1,775 | | | | 3,515,731 | | | | 1.60 | |
| PayPal Holdings, Inc.* | | | 59,924 | | | | 6,930,210 | | | | 3.16 | |
| | | | | | | | 10,445,941 | | | | 4.76 | |
| Financial Exchanges & Data |
| Deutsche Boerse A.G. | | | 23,749 | | | | 4,275,075 | | | | 1.95 | |
| S&P Global, Inc. | | | 20,053 | | | | 8,225,339 | | | | 3.75 | |
| | | | | | | | 12,500,414 | | | | 5.70 | |
| Hotels, Resorts & Cruise Lines |
| Airbnb, Inc. - Cl. A* | | | 22,018 | | | | 3,781,812 | | | | 1.72 | |
| | | | | | | | | | | | | |
| Industrial Gases |
| Linde PLC | | | 13,562 | | | | 4,332,110 | | | | 1.97 | |
| | | | | | | | | | | | | |
| Integrated Telecommunication Services |
| Cellnex Telecom S.A. | | | 136,713 | | | | 6,579,231 | | | | 3.00 | |
| Deutsche Telekom A.G. | | | 344,597 | | | | 6,417,817 | | | | 2.93 | |
| | | | | | | | 12,997,048 | | | | 5.93 | |
| Interactive Media & Services |
| Alphabet, Inc. - Cl. A* | | | 3,051 | | | | 8,485,899 | | | | 3.87 | |
| Meta Platforms, Inc. - Cl. A* | | | 38,316 | | | | 8,519,946 | | | | 3.88 | |
| | | | | | | | 17,005,845 | | | | 7.75 | |
| Internet & Direct Marketing Retail |
| Amazon.com, Inc.* | | | 5,438 | | | | 17,727,608 | | | | 8.08 | |
| | | | | | | | | | | | | |
| IT Consulting & Other Services |
| Globant S.A.* | | | 28,854 | | | | 7,561,768 | | | | 3.45 | |
| | | | | | | | | | | | | |
| Personal Products |
| L’Oreal S.A. | | | 21,882 | | | | 8,740,657 | | | | 3.98 | |
| | | | | | | | | | | | | |
| Pharmaceuticals |
| Novo Nordisk A/S - Cl. B | | | 48,454 | | | | 5,374,327 | | | | 2.45 | |
| | | | | | | | | | | | | |
| Railroads |
| Canadian Pacific Railway Ltd. | | | 77,091 | | | | 6,363,091 | | | | 2.90 | |
| | | | | | | | | | | | | |
| COMMON STOCKS (continued) |
| Restaurants |
| Chipotle Mexican Grill, Inc.* | | | 3,376 | | | | 5,340,933 | | | | 2.43 | % |
| Domino’s Pizza Enterprises Ltd. | | | 70,319 | | | | 4,577,332 | | | | 2.09 | |
| | | | | | | | 9,918,265 | | | | 4.52 | |
| Semiconductor Equipment |
| ASML Holding N.V. - NY Reg. Shs. | | | 18,675 | | | | 12,473,593 | | | | 5.69 | |
| | | | | | | | | | | | | |
| Semiconductors |
| NVIDIA Corp. | | | 34,049 | | | | 9,290,610 | | | | 4.24 | |
| | | | | | | | | | | | | |
| Specialty Chemicals |
| The Sherwin-Williams Company | | | 31,330 | | | | 7,820,595 | | | | 3.57 | |
| | | | | | | | | | | | | |
| Systems Software |
| Microsoft Corp. | | | 55,586 | | | | 17,137,720 | | | | 7.81 | |
| ServiceNow, Inc.* | | | 6,163 | | | | 3,432,113 | | | | 1.57 | |
| UiPath, Inc. - Cl. A* | | | 25,592 | | | | 552,531 | | | | 0.25 | |
| | | | | | | | 21,122,364 | | | | 9.63 | |
| Technology Hardware, Storage & Peripherals |
| Apple, Inc. | | | 102,900 | | | | 17,967,369 | | | | 8.19 | |
| | | | | | | | | | | | | |
| TOTAL COMMON STOCKS |
| (Cost $148,957,249) | | | | | | | 219,453,532 | | | | 100.04 | |
| | | | | | | | | | | | | |
| TOTAL INVESTMENTS |
| (Cost $148,957,249) | | | | | | | 219,453,532 | | | | 100.04 | |
| | | | | | | | | | | | | |
| Liabilities, Less Cash and Other Assets | | | | | | | (96,182 | ) | | | (0.04 | ) |
| | | | | | | | | | | | | |
| NET ASSETS | | | | | | $ | 219,357,350 | | | | 100.00 | % |
SUMMARY OF INVESTMENTS BY COUNTRY
| Country | | Market Value | | | Percent of
Investment
Securities | |
| Argentina | | $ | 7,561,768 | | | | 3.45 | % |
| Australia | | | 9,336,203 | | | | 4.25 | |
| Canada | | | 6,363,091 | | | | 2.90 | |
| Denmark | | | 5,374,327 | | | | 2.45 | |
| France | | | 18,775,459 | | | | 8.56 | |
| Germany | | | 14,692,223 | | | | 6.69 | |
| Netherlands | | | 15,989,324 | | | | 7.29 | |
| Spain | | | 6,579,231 | | | | 3.00 | |
| United Kingdom | | | 4,332,110 | | | | 1.97 | |
United States(1) | | | 130,449,796 | | | | 59.44 | |
| | | $ | 219,453,532 | | | | 100.00 | % |
| (1) | Includes short-term securities. |
See notes to financial statements.
27
STATEMENTS OF ASSETS AND LIABILITIES
March 31, 2022 (Unaudited)
(Amounts in thousands) | | MARSICO
FOCUS FUND | | | MARSICO
GROWTH FUND | |
| | | | | | | | | |
ASSETS | | | | | | | | |
Investments, at value (cost $470,881, $222,868, $211,410, $39,152, and $148,957, respectively) | | $ | 799,953 | | | $ | 345,167 | |
Foreign currency (cost $0, $0, $0, $6, and $0, respectively) | | | — | | | | — | |
Receivable for investments sold | | | — | | | | 7,171 | |
Receivable for capital stock sold | | | 4,219 | | | | 3,424 | |
Dividends receivable | | | 144 | | | | 14 | |
Prepaid expenses and other assets | | | 7,012 | | | | 1,698 | |
Total Assets | | | 811,328 | | | | 357,474 | |
| | | | | | | | | |
LIABILITIES | | | | | | | | |
Payable for investments purchased | | | — | | | | — | |
Payable for capital stock redeemed | | | 4,252 | | | | 3,411 | |
Due to custodian | | | — | | | | — | |
Payable to investment adviser | | | 487 | | | | 225 | |
Accrued trustees’ fees | | | 7,008 | | | | 1,684 | |
Accrued distribution fee | | | 1,586 | | | | 1,680 | |
Accrued professional fees | | | 83 | | | | 41 | |
Accrued transfer agent fees and expenses | | | 122 | | | | 72 | |
Accrued expenses and other liabilities | | | 112 | | | | 84 | |
Total Liabilities | | | 13,650 | | | | 7,197 | |
| | | | | | | | | |
NET ASSETS | | $ | 797,678 | | | $ | 350,277 | |
| | | | | | | | | |
NET ASSETS CONSIST OF | | | | | | | | |
Paid-in-capital | | $ | 386,879 | | | $ | 221,632 | |
Total distributable earnings | | | 410,799 | | | | 128,645 | |
NET ASSETS | | $ | 797,678 | | | $ | 350,277 | |
| | | | | | | | | |
| | | | | | | | | |
NET ASSET VALUE INFORMATION BY CLASS | | | | | | | | |
| | | | | | | | | |
INVESTOR CLASS: | | | | | | | | |
Net Assets | | $ | 685,213 | | | $ | 320,978 | |
Shares Outstanding, $0.001 par value (Unlimited shares authorized) | | | 28,265 | | | | 16,558 | |
NET ASSET VALUE, REDEMPTION PRICE, AND OFFERING PRICE PER SHARE (NET ASSETS/SHARES OUTSTANDING)* | | $ | 24.24 | | | $ | 19.39 | |
| | | | | | | | | |
INSTITUTIONAL CLASS:(1) | | | | | | | | |
Net Assets | | $ | 112,465 | | | $ | 29,299 | |
Shares Outstanding, $0.001 par value (Unlimited shares authorized) | | | 4,636 | | | | 1,510 | |
NET ASSET VALUE, REDEMPTION PRICE, AND OFFERING PRICE PER SHARE (NET ASSETS/SHARES OUTSTANDING)* | | $ | 24.26 | | | $ | 19.40 | |
| (1) | Institutional Class shares commenced operations on December 6, 2021. |
| * | Not in thousands, based on unrounded net assets and shares outstanding. |
See notes to financial statements.
28
| | MARSICO
MIDCAP GROWTH
FOCUS FUND | | | MARSICO
INTERNATIONAL
OPPORTUNITIES
FUND | | | MARSICO
GLOBAL FUND | |
| | | | | | | | | | | | |
| | | | | | | | | | | | |
| | $ | 309,687 | | | $ | 48,168 | | | $ | 219,454 | |
| | | — | | | | 6 | | | | — | |
| | | — | | | | 247 | | | | 1,029 | |
| | | 969 | | | | 386 | | | | 1,510 | |
| | | 53 | | | | 180 | | | | 84 | |
| | | 616 | | | | 154 | | | | 827 | |
| | | 311,325 | | | | 49,141 | | | | 222,904 | |
| | | | | | | | | | | | |
| | | — | | | | 192 | | | | 557 | |
| | | 1,206 | | | | 380 | | | | 1,551 | |
| | | — | | | | — | | | | 81 | |
| | | 202 | | | | 22 | | | | 124 | |
| | | 602 | | | | 140 | | | | 816 | |
| | | 570 | | | | 180 | | | | 244 | |
| | | 36 | | | | 11 | | | | 31 | |
| | | 77 | | | | 23 | | | | 66 | |
| | | 82 | | | | 44 | | | | 77 | |
| | | 2,775 | | | | 992 | | | | 3,547 | |
| | | | | | | | | | | | |
| | $ | 308,550 | | | $ | 48,149 | | | $ | 219,357 | |
| | | | | | | | | | | | |
| | $ | 205,530 | | | $ | 42,239 | | | $ | 144,852 | |
| | | 103,020 | | | | 5,910 | | | | 74,505 | |
| | $ | 308,550 | | | $ | 48,149 | | | $ | 219,357 | |
| | | | | | | | | | | | |
| | | | | | | | | | | | |
| | $ | 283,620 | | | $ | 44,969 | | | $ | 199,390 | |
| | | 7,197 | | | | 2,502 | | | | 10,733 | |
| | $ | 39.41 | | | $ | 17.97 | | | $ | 18.58 | |
| | | | | | | | | | | | |
| | | | | | | | | | | | |
| | $ | 24,930 | | | $ | 3,180 | | | $ | 19,967 | |
| | | 632 | | | | 177 | | | | 1,074 | |
| | $ | 39.43 | | | $ | 17.98 | | | $ | 18.60 | |
29
STATEMENTS OF OPERATIONS
FOR THE SIX-MONTH PERIOD ENDED March 31, 2022 (Unaudited)
(Amounts in thousands) | | MARSICO
FOCUS FUND | | | MARSICO
GROWTH FUND | |
| | | | | | | | | |
INVESTMENT INCOME | | | | | | | | |
Dividends (net of $21, $0, $5, $28, and $32, respectively, of non-reclaimable foreign withholding taxes) | | $ | 2,319 | | | $ | 440 | |
Total Investment Income | | | 2,319 | | | | 440 | |
| | | | | | | | | |
EXPENSES | | | | | | | | |
Investment advisory fees | | | 3,198 | | | | 1,509 | |
Distribution fees: | | | | | | | | |
Investor Class | | | 1,015 | | | | 464 | |
Transfer agent fees and expenses: | | | | | | | | |
Investor Class | | | 334 | | | | 163 | |
Institutional Class(2) | | | 27 | | | | 10 | |
Professional fees | | | 174 | | | | 78 | |
Fund administration fees: | | | | | | | | |
Investor Class | | | 84 | | | | 66 | |
Institutional Class(2) | | | 7 | | | | 4 | |
Custody and fund accounting fees | | | 74 | | | | 51 | |
Miscellaneous | | | 42 | | | | 24 | |
Reporting, printing, and postage expenses | | | 39 | | | | 21 | |
Federal and state registration fees | | | 16 | | | | 16 | |
Trustees’ fees and expenses | | | (236 | )(1) | | | (84 | )(1) |
Total Expenses | | | 4,774 | | | | 2,322 | |
Recoupment of previously waived expenses | | | — | | | | — | |
Less waiver of expenses and expenses paid indirectly | | | — | | | | — | |
Net Expenses | | | 4,774 | | | | 2,322 | |
| | | | | | | | | |
NET INVESTMENT LOSS | | | (2,455 | ) | | | (1,882 | ) |
| | | | | | | | | |
REALIZED AND UNREALIZED GAIN (LOSS) | | | | | | | | |
Net realized gain (loss) on investments | | | 87,052 | | | | 10,213 | |
Net realized gain (loss) on foreign currency transactions | | | — | | | | — | |
Change in unrealized appreciation (depreciation) on investments, foreign currency translations, and non-interested trustees’ deferred compensation | | | (133,186 | ) | | | (48,348 | ) |
| | | | | | | | | |
Net Loss on Investments | | | (46,134 | ) | | | (38,135 | ) |
| | | | | | | | | |
NET DECREASE IN NET ASSETS RESULTING FROM OPERATIONS | | $ | (48,589 | ) | | $ | (40,017 | ) |
| (1) | Amounts include Trustees’ fees and expenses and the mark to market unrealized depreciation during the period for shares held in the Non-Interested Trustees’ Deferred Fee Plan, as more fully described in Note 2(g) in the Notes to Financial Statements. |
| | | Trustees’
Fees and
Expenses* | | | Unrealized
Depreciation* | |
Focus Fund | | $ | 78,628 | | | $ | (314,927 | ) |
Growth Fund | | | 35,146 | | | | (118,715 | ) |
Midcap Growth Focus Fund | | | 32,583 | | | | (25,321 | ) |
International Opportunities Fund | | | 5,026 | | | | (8,805 | ) |
Global Fund | | | 26,597 | | | | (72,809 | ) |
| (2) | Institutional Class shares commenced operations on December 6, 2021. |
See notes to financial statements.
30
| | MARSICO
MIDCAP GROWTH
FOCUS FUND | | | MARSICO
INTERNATIONAL
OPPORTUNITIES
FUND | | | MARSICO
GLOBAL FUND | |
| | | | | | | | | | | | |
| | $ | 350 | | | $ | 349 | | | $ | 553 | |
| | | 350 | | | | 349 | | | | 553 | |
| | | | | | | | | | | | |
| | | 1,354 | | | | 219 | | | | 1,090 | |
| | | | | | | | | | | | |
| | | 415 | | | | 66 | | | | 322 | |
| | | | | | | | | | | | |
| | | 203 | | | | 42 | | | | 184 | |
| | | 11 | | | | 4 | | | | 15 | |
| | | 72 | | | | 15 | | | | 62 | |
| | | | | | | | | | | | |
| | | 65 | | | | 28 | | | | 71 | |
| | | 4 | | | | 2 | | | | 6 | |
| | | 56 | | | | 55 | | | | 66 | |
| | | 19 | | | | 4 | | | | 16 | |
| | | 20 | | | | 8 | | | | 17 | |
| | | 11 | | | | 8 | | | | 10 | |
| | | 7 | (1) | | | (4 | )(1) | | | (46 | )(1) |
| | | 2,237 | | | | 447 | | | | 1,813 | |
| | | — | | | | — | | | | 145 | |
| | | — | | | | (40 | ) | | | — | |
| | | 2,237 | | | | 407 | | | | 1,958 | |
| | | | | | | | | | | | |
| | | (1,887 | ) | | | (58 | ) | | | (1,405 | ) |
| | | | | | | | | | | | |
| | | 12,263 | | | | (96 | ) | | | 12,946 | |
| | | 17 | | | | (267 | ) | | | (1,372 | ) |
| | | (62,221 | ) | | | (7,875 | ) | | | (55,058 | ) |
| | | | | | | | | | | | |
| | | (49,941 | ) | | | (8,238 | ) | | | (43,484 | ) |
| | | | | | | | | | | | |
| | $ | (51,828 | ) | | $ | (8,296 | ) | | $ | (44,889 | ) |
31
STATEMENTS OF CHANGES IN NET ASSETS
| | | MARSICO
FOCUS
FUND | | | MARSICO
GROWTH
FUND | |
| | | | | | | | | | | | | | | | | |
(Amounts in thousands) | | Six-Month
Period Ended
3/31/22(1)
(Unaudited) | | | Year
Ended
9/30/21 | | | Six-Month
Period Ended
3/31/22(1)
(Unaudited) | | | Year
Ended
9/30/21 | |
| | | | | | | | | | | | | | | | | |
OPERATIONS: | | | | | | | | | | | | | | | | |
Net investment loss | | $ | (2,455 | ) | | $ | (6,861 | ) | | $ | (1,882 | ) | | $ | (4,698 | ) |
Net realized gain (loss) on investments | | | 87,052 | | | | 105,321 | | | | 10,213 | | | | 124,815 | |
Net realized gain (loss) on foreign currency transactions | | | — | | | | — | | | | — | | | | — | |
Change in unrealized appreciation (depreciation) on investments, foreign currency translations, and non-interested trustees’ deferred compensation | | | (133,186 | ) | | | 74,566 | | | | (48,348 | ) | | | (17,797 | ) |
| | | | | | | | | | | | | | | | | |
Net increase (decrease) in net assets resulting from operations | | | (48,589 | ) | | | 173,026 | | | | (40,017 | ) | | | 102,320 | |
| | | | | | | | | | | | | | | | | |
DISTRIBUTIONS: | | | | | | | | | | | | | | | | |
Investor Class(2) | | | (99,779 | ) | | | (79,818 | ) | | | (119,847 | ) | | | (37,975 | ) |
| | | | | | | | | | | | | | | | | |
CAPITAL SHARE TRANSACTIONS: | | | | | | | | | | | | | | | | |
Investor Class: | | | | | | | | | | | | | | | | |
Proceeds from sales of shares | | | 28,738 | | | | 41,524 | | | | 6,994 | | | | 32,032 | |
Proceeds from reinvestment of distributions | | | 94,464 | | | | 77,365 | | | | 111,454 | | | | 36,654 | |
Redemption of shares | | | (195,585 | ) | | | (122,637 | ) | | | (64,298 | ) | | | (119,768 | ) |
| | | | | | | | | | | | | | | | | |
Net increase (decrease) from Investor Class capital share transactions | | | (72,383 | ) | | | (3,748 | ) | | | 54,150 | | | | (51,082 | ) |
| | | | | | | | | | | | | | | | | |
Institutional Class: | | | | | | | | | | | | | | | | |
Proceeds from sales of shares | | | 139,240 | | | | — | | | | 34,669 | | | | — | |
Proceeds from reinvestment of distributions | | | — | | | | — | | | | — | | | | — | |
Redemption of shares | | | (16,452 | ) | | | — | | | | (2,533 | ) | | | — | |
| | | | | | | | | | | | | | | | | |
Net increase from Institutional Class capital share transactions | | | 122,788 | | | | — | | | | 32,136 | | | | — | |
| | | | | | | | | | | | | | | | | |
TOTAL INCREASE (DECREASE) IN NET ASSETS | | | (97,963 | ) | | | 89,460 | | | | (73,578 | ) | | | 13,263 | |
| | | | | | | | | | | | | | | | | |
NET ASSETS: | | | | | | | | | | | | | | | | |
Beginning of Period | | | 895,641 | | | | 806,181 | | | | 423,855 | | | | 410,592 | |
| | | | | | | | | | | | | | | | | |
End of Period | | $ | 797,678 | | | $ | 895,641 | | | $ | 350,277 | | | $ | 423,855 | |
| | | | | | | | | | | | | | | | | |
TRANSACTIONS IN SHARES: | | | | | | | | | | | | | | | | |
Investor Class: | | | | | | | | | | | | | | | | |
Shares sold | | | 1,106 | | | | 1,502 | | | | 322 | | | | 1,144 | |
Shares issued in reinvestment of distributions | | | 3,618 | | | | 3,015 | | | | 5,043 | | | | 1,388 | |
Shares redeemed | | | (7,512 | ) | | | (4,563 | ) | | | (3,040 | ) | | | (4,298 | ) |
| | | | | | | | | | | | | | | | | |
Net increase (decrease) from Investor Class share transactions | | | (2,788 | ) | | | (46 | ) | | | 2,325 | | | | (1,766 | ) |
| | | | | | | | | | | | | | | | | |
Institutional Class: | | | | | | | | | | | | | | | | |
Shares sold | | | 5,345 | | | | — | | | | 1,641 | | | | — | |
Shares issued in reinvestment of distributions | | | — | | | | — | | | | — | | | | — | |
Shares redeemed | | | (709 | ) | | | — | | | | (131 | ) | | | — | |
| | | | | | | | | | | | | | | | | |
Net increase from Institutional Class share transactions | | | 4,636 | | | | — | | | | 1,510 | | | | — | |
| (1) | Institutional Class shares commenced operations on December 6, 2021. |
| (2) | Distributions occurred prior to the commencement of operations of the Institutional Class shares. |
See notes to financial statements.
32
| | MARSICO
MIDCAP
GROWTH
FOCUS
FUND | | | MARSICO
INTERNATIONAL
OPPORTUNITIES FUND | | | MARSICO
GLOBAL
FUND | |
| | | | | | | | | | | | | | | | | | | | | | | | |
| | Six-Month
Period Ended
3/31/22(1)
(Unaudited) | | | Year
Ended
9/30/21 | | | Six-Month
Period Ended
3/31/22(1)
(Unaudited) | | | Year
Ended
9/30/21 | | | Six-Month
Period Ended
3/31/22(1)
(Unaudited) | | | Year
Ended
9/30/21 | |
| | | | | | | | | | | | | | | | | | | | | | | | |
| | $ | (1,887 | ) | | $ | (3,300 | ) | | $ | (58 | ) | | $ | (69 | ) | | $ | (1,405 | ) | | $ | (3,222 | ) |
| | | 12,263 | | | | 52,489 | | | | (96 | ) | | | 6,142 | | | | 12,946 | | | | 49,872 | |
| | | 17 | | | | 43 | | | | (267 | ) | | | 1,199 | | | | (1,372 | ) | | | 1,578 | |
| | | (62,221 | ) | | | 55,538 | | | | (7,875 | ) | | | 2,620 | | | | (55,058 | ) | | | (3,982 | ) |
| | | | | | | | | | | | | | | | | | | | | | | | |
| | | (51,828 | ) | | | 104,770 | | | | (8,296 | ) | | | 9,892 | | | | (44,889 | ) | | | 44,246 | |
| | | | | | | | | | | | | | | | | | | | | | | | |
| | | (48,168 | ) | | | (9,729 | ) | | | (7,105 | ) | | | (1,438 | ) | | | (48,975 | ) | | | (7,258 | ) |
| | | | | | | | | | | | | | | | | | | | | | | | |
| | | 3,521 | | | | 16,851 | | | | 2,634 | | | | 1,664 | | | | 4,335 | | | | 16,569 | |
| | | 45,254 | | | | 9,419 | | | | 6,538 | | | | 1,387 | | | | 43,077 | | | | 7,067 | |
| | | (46,859 | ) | | | (34,248 | ) | | | (9,489 | ) | | | (6,255 | ) | | | (69,905 | ) | | | (36,164 | ) |
| | | | | | | | | | | | | | | | | | | | | | | | |
| | | 1,916 | | | | (7,978 | ) | | | (317 | ) | | | (3,204 | ) | | | (22,493 | ) | | | (12,528 | ) |
| | | | | | | | | | | | | | | | | | | | | | | | |
| | | 27,816 | | | | — | | | | 3,875 | | | | — | | | | 35,025 | | | | — | |
| | | — | | | | — | | | | — | | | | — | | | | — | | | | — | |
| | | (225 | ) | | | — | | | | (282 | ) | | | — | | | | (8,804 | ) | | | — | |
| | | | | | | | | | | | | | | | | | | | | | | | |
| | | 27,591 | | | | — | | | | 3,593 | | | | — | | | | 26,221 | | | | — | |
| | | | | | | | | | | | | | | | | | | | | | | | |
| | | (70,489 | ) | | | 87,063 | | | | (12,125 | ) | | | 5,250 | | | | (90,136 | ) | | | 24,460 | |
| | | | | | | | | | | | | | | | | | | | | | | | |
| | | 379,039 | | | | 291,976 | | | | 60,274 | | | | 55,024 | | | | 309,493 | | | | 285,033 | |
| | | | | | | | | | | | | | | | | | | | | | | | |
| | $ | 308,550 | | | $ | 379,039 | | | $ | 48,149 | | | $ | 60,274 | | | $ | 219,357 | | | $ | 309,493 | |
| | | | | | | | | | | | | | | | | | | | | | | | |
| | | 80 | | | | 342 | | | | 144 | | | | 67 | | | | 198 | | | | 597 | |
| | | 967 | �� | | | 199 | | | | 310 | | | | 62 | | | | 1,915 | | | | 289 | |
| | | (1,073 | ) | | | (705 | ) | | | (486 | ) | | | (270 | ) | | | (3,315 | ) | | | (1,436 | ) |
| | | | | | | | | | | | | | | | | | | | | | | | |
| | | (26 | ) | | | (164 | ) | | | (32 | ) | | | (141 | ) | | | (1,202 | ) | | | (550 | ) |
| | | | | | | | | | | | | | | | | | | | | | | | |
| | | 637 | | | | — | | | | 194 | | | | — | | | | 1,600 | | | | — | |
| | | — | | | | — | | | | — | | | | — | | | | — | | | | — | |
| | | (5 | ) | | | — | | | | (17 | ) | | | — | | | | (526 | ) | | | — | |
| | | | | | | | | | | | | | | | | | | | | | | | |
| | | 632 | | | | — | | | | 177 | | | | — | | | | 1,074 | | | | — | |
33
FINANCIAL HIGHLIGHTS
For a Fund Share Outstanding Throughout the Period
| | | | MARSICO FOCUS FUND | |
Investor Class: | | | Six-Month
Period
Ended
3/31/22
(Unaudited) | | | Year
Ended
9/30/21 | | | Year
Ended
9/30/20 | | | Year
Ended
9/30/19 | | | Year
Ended
9/30/18 | | | Year
Ended
9/30/17 | |
| | | | | | | | | | | | | | | | | | | | | | | | | | |
Net Asset Value, Beginning of Period | | | $ | 28.84 | | | $ | 25.92 | | | $ | 18.59 | | | $ | 20.17 | | | $ | 19.63 | | | $ | 15.96 | |
| | | | | | | | | | | | | | | | | | | | | | | | | | |
Income from Investment Operations: | | | | | | | | | | | | | | | | | | | | | | | | | |
Net investment loss | | | | (0.10 | ) | | | (0.22 | ) | | | (0.10 | ) | | | (0.04 | ) | | | (0.09 | ) | | | (0.17 | ) |
Net realized and unrealized gains (losses) on investments | | | | (1.29 | ) | | | 5.74 | | | | 8.92 | | | | 0.25 | | | | 3.82 | | | | 3.84 | |
Total from investment operations | | | | (1.39 | ) | | | 5.52 | | | | 8.82 | | | | 0.21 | | | | 3.73 | | | | 3.67 | |
| | | | | | | | | | | | | | | | | | | | | | | | | | |
Distributions & Other: | | | | | | | | | | | | | | | | | | | | | | | | | |
Net realized gains | | | | (3.21 | ) | | | (2.60 | ) | | | (1.49 | ) | | | (1.79 | ) | | | (3.19 | ) | | | — | |
Total distributions and other | | | | (3.21 | ) | | | (2.60 | ) | | | (1.49 | ) | | | (1.79 | ) | | | (3.19 | ) | | | — | |
| | | | | | | | | | | | | | | | | | | | | | | | | | |
Net Asset Value, End of Period | | | $ | 24.24 | | | $ | 28.84 | | | $ | 25.92 | | | $ | 18.59 | | | $ | 20.17 | | | $ | 19.63 | |
| | | | | | | | | | | | | | | | | | | | | | | | | | |
Total Return | | | | (5.60 | )%(2) | | | 22.52 | % | | | 50.71 | % | | | 2.52 | % | | | 21.78 | % | | | 22.99 | % |
| | | | | | | | | | | | | | | | | | | | | | | | | | |
Supplemental Data and Ratios: | | | | | | | | | | | | | | | | | | | | | | | | | |
Net assets, end of period (000s) | | | $ | 685,213 | | | $ | 895,641 | | | $ | 806,181 | | | $ | 554,645 | | | $ | 606,014 | | | $ | 559,657 | |
Ratio of net expenses (before expenses paid indirectly) to average net assets(4) | | | | 1.12 | %(3) | | | 1.26 | % | | | 1.24 | % | | | 1.02 | % | | | 1.21 | % | | | 1.37 | % |
Ratio of net investment loss to average net assets(5) | | | | (0.59 | )%(3) | | | (0.79 | )% | | | (0.53 | )% | | | (0.19 | )% | | | (0.48 | )% | | | (0.62 | )% |
Ratio of total expenses to average net assets(6) | | | | 1.12 | %(3) | | | 1.26 | % | | | 1.24 | % | | | 1.02 | % | | | 1.21 | % | | | 1.37 | % |
Ratio of net investment loss (before waivers, recoupment and expenses paid indirectly) to average net assets(7) | | | | (0.59 | )%(3) | | | (0.79 | )% | | | (0.53 | )% | | | (0.19 | )% | | | (0.48 | )% | | | (0.62 | )% |
Portfolio turnover rate | | | | 34 | %(2) | | | 28 | % | | | 45 | % | | | 42 | % | | | 53 | % | | | 67 | % |
Institutional Class: | | | Period
Ended
3/31/22(1)
(Unaudited) | | | | | | | | | | | | | | | | | | | | | |
| | | | | | | | | | | | | | | | | | | | | | | | | | |
Net Asset Value, Beginning of Period | | | $ | 26.98 | | | | | | | | | | | | | | | | | | | | | |
| | | | | | | | | | | | | | | | | | | | | | | | | | |
Income from Investment Operations: | | | | | | | | | | | | | | | | | | | | | | | | | |
Net investment loss | | | | (0.02 | ) | | | | | | | | | | | | | | | | | | | | |
Net realized and unrealized losses on investments | | | | (2.70 | ) | | | | | | | | | | | | | | | | | | | | |
Total from investment operations | | | | (2.72 | ) | | | | | | | | | | | | | | | | | | | | |
| | | | | | | | | | | | | | | | | | | | | | | | | | |
Net Asset Value, End of Period | | | $ | 24.26 | | | | | | | | | | | | | | | | | | | | | |
| | | | | | | | | | | | | | | | | | | | | | | | | | |
Total Return | | | | (10.08) | %(2) | | | | | | | | | | | | | | | | | | | | |
| | | | | | | | | | | | | | | | | | | | | | | | | | |
Supplemental Data and Ratios: | | | | | | | | | | | | | | | | | | | | | | | | | |
Net assets, end of period (000s) | | | $ | 112,465 | | | | | | | | | | | | | | | | | | | | | |
Ratio of net expenses (before expenses paid indirectly) to average net assets(4) | | | | 0.76 | %(3) | | | | | | | | | | | | | | | | | | | | |
Ratio of net investment loss to average net assets(5) | | | | (0.25 | )%(3) | | | | | | | | | | | | | | | | | | | | |
Ratio of total expenses to average net assets(6) | | | | 0.76 | %(3) | | | | | | | | | | | | | | | | | | | | |
Ratio of net investment loss (before waivers, recoupment and expenses paid indirectly) to average net assets(7) | | | | (0.25 | )%(3) | | | | | | | | | | | | | | | | | | | | |
Portfolio turnover rate | | | | 34 | %(2) | | | | | | | | | | | | | | | | | | | | |
(1) | Institutional Class shares commenced operations on December 6, 2021. |
(4) | Ratio of expenses to average net assets, less waivers and before expenses paid indirectly, plus recoupment of previously waived fees or expenses paid. |
(5) | Ratio of net investment loss to average net assets, net of waivers, recoupment of previously waived fees or expenses paid and expenses paid indirectly. |
(6) | Ratio of expenses to average net assets, before waivers, recoupment of previously waived fees or expenses paid and expenses paid indirectly. |
(7) | Ratio of net investment loss to average net assets, before waivers, recoupment of previously waived fees or expenses paid and expenses paid indirectly. |
| See notes to financial statements. |
34
| | | MARSICO
GROWTH FUND | | | | MARSICO
MIDCAP
GROWTH FOCUS FUND | | |
| | | Six-Month
Period
Ended
3/31/22
(Unaudited) | | | Year
Ended
9/30/21 | | | Year
Ended
9/30/20 | | | Year
Ended
9/30/19 | | | Year
Ended
9/30/18 | | | Year
Ended
9/30/17 | | | | Six-Month
Period
Ended
3/31/22
(Unaudited) | | | Year
Ended
9/30/21 | | | Year
Ended
9/30/20 | | | Year
Ended
9/30/19 | | | Year
Ended
9/30/18 | | | Year
Ended
9/30/17 | | |
| | | | | | | | | | | | | | | | | | | | | | | | | | | | | | | | | | | | | | | | | | | | | | | | | | | |
| | | $ | 29.78 | | | $ | 25.66 | | | $ | 18.75 | | | $ | 20.69 | | | $ | 18.47 | | | $ | 15.54 | | | | $ | 52.48 | | | $ | 39.52 | | | $ | 33.70 | | | $ | 33.18 | | | $ | 26.19 | | | $ | 22.04 | | |
| | | | | | | | | | | | | | | | | | | | | | | | | | | | | | | | | | | | | | | | | | | | | | | | | | | |
| | | | | | | | | | | | | | | | | | | | | | | | | | | | | | | | | | | | | | | | | | | | | | | | | | | |
| | | | (0.09 | ) | | | (0.35 | ) | | | (0.14 | ) | | | (0.08 | ) | | | (0.09 | ) | | | (0.14 | ) | | | | (0.26 | ) | | | (0.47 | ) | | | (0.39 | ) | | | (0.20 | ) | | | (0.25 | ) | | | (0.29 | ) | |
| | | | (1.97 | ) | | | 6.85 | | | | 8.92 | | | | 0.34 | | | | 4.06 | | | | 3.19 | | | | | (6.21 | ) | | | 14.77 | | | | 7.30 | | | | 2.15 | | | | 7.24 | | | | 4.44 | | |
| | | | (2.06 | ) | | | 6.50 | | | | 8.78 | | | | 0.26 | | | | 3.97 | | | | 3.05 | | | | | (6.47 | ) | | | 14.30 | | | | 6.91 | | | | 1.95 | | | | 6.99 | | | | 4.15 | | |
| | | | | | | | | | | | | | | | | | | | | | | | | | | | | | | | | | | | | | | | | | | | | | | | | | | |
| | | | | | | | | | | | | | | | | | | | | | | | | | | | | | | | | | | | | | | | | | | | | | | | | | | |
| | | | (8.33 | ) | | | (2.38 | ) | | | (1.87 | ) | | | (2.20 | ) | | | (1.75 | ) | | | (0.12 | ) | | | | (6.60 | ) | | | (1.34 | ) | | | (1.09 | ) | | | (1.43 | ) | | | — | | | | — | | |
| | | | (8.33 | ) | | | (2.38 | ) | | | (1.87 | ) | | | (2.20 | ) | | | (1.75 | ) | | | (0.12 | ) | | | | (6.60 | ) | | | (1.34 | ) | | | (1.09 | ) | | | (1.43 | ) | | | — | | | | — | | |
| | | | | | | | | | | | | | | | | | | | | | | | | | | | | | | | | | | | | | | | | | | | | | | | | | | |
| | | $ | 19.39 | | | $ | 29.78 | | | $ | 25.66 | | | $ | 18.75 | | | $ | 20.69 | | | $ | 18.47 | | | | $ | 39.41 | | | $ | 52.48 | | | $ | 39.52 | | | $ | 33.70 | | | $ | 33.18 | | | $ | 26.19 | | |
| | | | | | | | | | | | | | | | | | | | | | | | | | | | | | | | | | | | | | | | | | | | | | | | | | | |
| | | | (10.03 | )%(2) | | | 26.51 | % | | | 51.11 | % | | | 3.16 | % | | | 23.10 | % | | | 19.85 | % | | | | (14.18 | )%(2) | | | 36.56 | % | | | 21.15 | % | | | 6.88 | % | | | 26.69 | % | | | 18.83 | % | |
| | | | | | | | | | | | | | | | | | | | | | | | | | | | | | | | | | | | | | | | | | | | | | | | | | | |
| | | | | | | | | | | | | | | | | | | | | | | | | | | | | | | | | | | | | | | | | | | | | | | | | | | |
| | | $ | 320,978 | | | $ | 423,855 | | | $ | 410,592 | | | $ | 259,305 | | | $ | 298,940 | | | $ | 266,922 | | | | $ | 283,620 | | | $ | 379,039 | | | $ | 291,976 | | | $ | 282,779 | | | $ | 272,867 | | | $ | 234,322 | | |
| | | | 1.21 | %(3) | | | 1.37 | % | | | 1.45 | % | | | 1.27 | % | | | 1.25 | % | | | 1.42 | % | | | | 1.31 | %(3) | | | 1.33 | % | | | 1.40 | % | | | 1.30 | % | | | 1.21 | % | | | 1.40 | % | |
| | | | (0.98 | )%(3) | | | (1.07 | )% | | | (0.85 | )% | | | (0.40 | )% | | | (0.46 | )% | | | (0.53 | )% | | | | (1.10 | )%(3) | | | (0.91 | )% | | | (0.96 | )% | | | (0.66 | )% | | | (0.74 | )% | | | (0.96 | )% | |
| | | | 1.21 | %(3) | | | 1.34 | % | | | 1.50 | % | | | 1.27 | % | | | 1.25 | % | | | 1.42 | % | | | | 1.31 | %(3) | | | 1.33 | % | | | 1.40 | % | | | 1.30 | % | | | 1.21 | % | | | 1.40 | % | |
| | | | (0.98 | )%(3) | | | (1.04 | )% | | | (0.90 | )% | | | (0.40 | )% | | | (0.46 | )% | | | (0.53 | )% | | | | (1.10 | )%(3) | | | (0.91 | )% | | | (0.96 | )% | | | (0.66 | )% | | | (0.74 | )% | | | (0.96 | )% | |
| | | | 39 | %(2) | | | 58 | % | | | 77 | % | | | 39 | % | | | 40 | % | | | 50 | % | | | | 10 | %(2) | | | 20 | % | | | 38 | % | | | 34 | % | | | 90 | % | | | 28 | % | |
| | | Period
Ended
3/31/22(1)
(Unaudited) | | | | | | | | | | | | | | | | | | | | | | | | Period
Ended
3/31/22(1)
(Unaudited) | | | | | | | | | | | | | | | | | | | | | | |
| | | | | | | | | | | | | | | | | | | | | | | | | | | | | | | | | | | | | | | | | | | | | | | | | | | |
| | | $ | 21.57 | | | | | | | | | | | | | | | | | | | | | | | | $ | 44.83 | | | | | | | | | | | | | | | | | | | | | | |
| | | | | | | | | | | | | | | | | | | | | | | | | | | | | | | | | | | | | | | | | | | | | | | | | | | |
| | | | | | | | | | | | | | | | | | | | | | | | | | | | | | | | | | | | | | | | | | | | | | | | | | | |
| | | | (0.04 | ) | | | | | | | | | | | | | | | | | | | | | | | | (0.09 | ) | | | | | | | | | | | | | | | | | | | | | |
| | | | (2.13 | ) | | | | | | | | | | | | | | | | | | | | | | | | (5.31 | ) | | | | | | | | | | | | | | | | | | | | | |
| | | | (2.17 | ) | | | | | | | | | | | | | | | | | | | | | | | | (5.40 | ) | | | | | | | | | | | | | | | | | | | | | |
| | | | | | | | | | | | | | | | | | | | | | | | | | | | | | | | | | | | | | | | | | | | | | | | | | | |
| | | $ | 19.40 | | | | | | | | | | | | | | | | | | | | | | | | $ | 39.43 | | | | | | | | | | | | | | | | | | | | | | |
| | | | | | | | | | | | | | | | | | | | | | | | | | | | | | | | | | | | | | | | | | | | | | | | | | | |
| | | | (10.06 | )%(2) | | | | | | | | | | | | | | | | | | | | | | | | (12.05 | )%(2) | | | | | | | | | | | | | | | | | | | | | |
| | | | | | | | | | | | | | | | | | | | | | | | | | | | | | | | | | | | | | | | | | | | | | | | | | | |
| | | | | | | | | | | | | | | | | | | | | | | | | | | | | | | | | | | | | | | | | | | | | | | | | | | |
| | | $ | 29,299 | | | | | | | | | | | | | | | | | | | | | | | | $ | 24,930 | | | | | | | | | | | | | | | | | | | | | | |
| | | | 0.97 | %(3) | | | | | | | | | | | | | | | | | | | | | | | | 1.13 | %(3) | | | | | | | | | | | | | | | | | | | | | |
| | | | (0.76 | )%(3) | | | | | | | | | | | | | | | | | | | | | | | | (0.89 | )%(3) | | | | | | | | | | | | | | | | | | | | | |
| | | | 0.97 | %(3) | | | | | | | | | | | | | | | | | | | | | | | | 1.13 | %(3) | | | | | | | | | | | | | | | | | | | | | |
| | | | (0.76 | )%(3) | | | | | | | | | | | | | | | | | | | | | | | | (0.89 | )%(3) | | | | | | | | | | | | | | | | | | | | | |
| | | | 39 | %(2) | | | | | | | | | | | | | | | | | | | | | | | | 10 | %(2) | | | | | | | | | | | | | | | | | | | | | |
35
FINANCIAL HIGHLIGHTS
For a Fund Share Outstanding Throughout the Period
| | | | MARSICO
INTERNATIONAL OPPORTUNITIES FUND | |
Investor Class: | | | Six-Month
Period
Ended
3/31/22
(Unaudited) | | | Year
Ended
9/30/21 | | | Year
Ended
9/30/20 | | | Year
Ended
9/30/19 | | | Year
Ended
9/30/18 | | | Year
Ended
9/30/17 | |
| | | | | | | | | | | | | | | | | | | | | | | | | | |
Net Asset Value, Beginning of Period | | | $ | 23.79 | | | $ | 20.57 | | | $ | 18.47 | | | $ | 20.23 | | | $ | 19.30 | | | $ | 15.64 | |
| | | | | | | | | | | | | | | | | | | | | | | | | | |
Income from Investment Operations: | | | | | | | | | | | | | | | | | | | | | | | | | |
Net investment income (loss) | | | | (0.03 | ) | | | (0.04 | ) | | | 0.04 | | | | 0.01 | | | | (0.09 | ) | | | (0.16 | ) |
Net realized and unrealized gains (losses) on investments | | | | (2.99 | ) | | | 3.81 | | | | 2.87 | | | | (0.35 | ) | | | 1.02 | | | | 3.82 | |
Total from investment operations | | | | (3.02 | ) | | | 3.77 | | | | 2.91 | | | | (0.34 | ) | | | 0.93 | | | | 3.66 | |
| | | | | | | | | | | | | | | | | | | | | | | | | | |
Distributions & Other: | | | | | | | | | | | | | | | | | | | | | | | | | |
Net investment income | | | | — | | | | — | | | | (0.07 | ) | | | — | | | | — | | | | — | |
Net realized gains | | | | (2.80 | ) | | | (0.55 | ) | | | (0.74 | ) | | | (1.42 | ) | | | — | | | | — | |
Total distributions and other | | | | (2.80 | ) | | | (0.55 | ) | | | (0.81 | ) | | | (1.42 | ) | | | — | | | | — | |
| | | | | | | | | | | | | | | | | | | | | | | | | | |
Net Asset Value, End of Period | | | $ | 17.97 | | | $ | 23.79 | | | $ | 20.57 | | | $ | 18.47 | | | $ | 20.23 | | | $ | 19.30 | |
| | | | | | | | | | | | | | | | | | | | | | | | | | |
Total Return | | | | (14.41 | )%(2) | | | 18.48 | % | | | 16.14 | % | | | (0.37 | )% | | | 4.82 | % | | | 23.40 | % |
| | | | | | | | | | | | | | | | | | | | | | | | | | |
Supplemental Data and Ratios: | | | | | | | | | | | | | | | | | | | | | | | | | |
Net assets, end of period (000s) | | | $ | 44,969 | | | $ | 60,274 | | | $ | 55,024 | | | $ | 53,311 | | | $ | 62,152 | | | $ | 63,789 | |
Ratio of net expenses (before expenses paid indirectly) to average net assets(4) | | | | 1.50 | %(3) | | | 1.50 | % | | | 1.50 | % | | | 1.50 | % | | | 1.52 | % | | | 1.60 | % |
Ratio of net investment income (loss) to average net assets(5) | | | | (0.23 | )%(3) | | | (0.11 | )% | | | 0.28 | % | | | 0.14 | % | | | (0.33 | )% | | | (0.77 | )% |
Ratio of total expenses to average net assets(6) | | | | 1.63 | %(3) | | | 1.68 | % | | | 1.81 | % | | | 1.72 | % | | | 1.59 | % | | | 1.79 | % |
Ratio of net investment loss (before waivers, recoupment and expenses paid indirectly) to average net assets(7) | | | | (0.36 | )%(3) | | | (0.29 | )% | | | (0.03 | )% | | | (0.08 | )% | | | (0.40 | )% | | | (0.96 | )% |
Portfolio turnover rate | | | | 11 | %(2) | | | 50 | % | | | 60 | % | | | 57 | % | | | 33 | % | | | 108 | % |
Institutional Class: | | | Period
Ended
3/31/22(1)
(Unaudited) | | | | | | | | | | | | | | | | | | | | | |
| | | | | | | | | | | | | | | | | | | | | | | | | | |
Net Asset Value, Beginning of Period | | | $ | 20.20 | | | | | | | | | | | | | | | | | | | | | |
| | | | | | | | | | | | | | | | | | | | | | | | | | |
Income from Investment Operations: | | | | | | | | | | | | | | | | | | | | | | | | | |
Net investment income (loss) | | | | 0.02 | | | | | | | | | | | | | | | | | | | | | |
Net realized and unrealized losses on investments | | | | (2.24 | ) | | | | | | | | | | | | | | | | | | | | |
Total from investment operations | | | | (2.22 | ) | | | | | | | | | | | | | | | | | | | | |
| | | | | | | | | | | | | | | | | | | | | | | | | | |
Net Asset Value, End of Period | | | $ | 17.98 | | | | | | | | | | | | | | | | | | | | | |
| | | | | | | | | | | | | | | | | | | | | | | | | | |
Total Return | | | | (10.99 | )%(2) | | | | | | | | | | | | | | | | | | | | |
| | | | | | | | | | | | | | | | | | | | | | | | | | |
Supplemental Data and Ratios: | | | | | | | | | | | | | | | | | | | | | | | | | |
Net assets, end of period (000s) | | | $ | 3,180 | | | | | | | | | | | | | | | | | | | | | |
Ratio of net expenses (before expenses paid indirectly) to average net assets(4) | | | | 1.25 | %(3) | | | | | | | | | | | | | | | | | | | | |
Ratio of net investment income (loss) to average net assets(5) | | | | 0.32 | %(3) | | | | | | | | | | | | | | | | | | | | |
Ratio of total expenses to average net assets(6) | | | | 1.79 | %(3) | | | | | | | | | | | | | | | | | | | | |
Ratio of net investment loss (before waivers, recoupment and expenses paid indirectly) to average net assets(7) | | | | (0.22 | )%(3) | | | | | | | | | | | | | | | | | | | | |
Portfolio turnover rate | | | | 11 | %(2) | | | | | | | | | | | | | | | | | | | | |
(1) | Institutional Class shares commenced operations on December 6, 2021. |
(4) | Ratio of expenses to average net assets, less waivers and before expenses paid indirectly, plus recoupment of previously waived fees or expenses paid. |
(5) | Ratio of net investment income (loss) to average net assets, net of waivers, recoupment of previously waived fees or expenses paid and expenses paid indirectly. |
(6) | Ratio of expenses to average net assets, before waivers, recoupment of previously waived fees or expenses paid and expenses paid indirectly. |
(7) | Ratio of net investment loss to average net assets, before waivers, recoupment of previously waived fees or expenses paid and expenses paid indirectly. |
| See notes to financial statements. |
36
| | MARSICO
GLOBAL
FUND | |
| | Six-Month
Period
Ended
3/31/22
(Unaudited) | | | Year
Ended
9/30/21 | | | Year
Ended
9/30/20 | | | Year
Ended
9/30/19 | | | Year
Ended
9/30/18 | | | Year
Ended
9/30/17 | |
| | | | | | | | | | | | | | | | | | | | | | | | |
| | $ | 25.93 | | | $ | 22.83 | | | $ | 16.06 | | | $ | 17.16 | | | $ | 15.13 | | | $ | 12.03 | |
| | | | | | | | | | | | | | | | | | | | | | | | |
| | | | | | | | | | | | | | | | | | | | | | | | |
| | | (0.15 | ) | | | (0.28 | ) | | | (0.19 | ) | | | (0.12 | ) | | | 0.11 | | | | (0.14 | ) |
| | | (3.14 | ) | | | 3.97 | | | | 6.96 | | | | (0.82 | ) | | | 3.26 | | | | 3.24 | |
| | | (3.29 | ) | | | 3.69 | | | | 6.77 | | | | (0.94 | ) | | | 3.37 | | | | 3.10 | |
| | | | | | | | | | | | | | | | | | | | | | | | |
| | | | | | | | | | | | | | | | | | | | | | | | |
| | | — | | | | — | | | | — | | | | — | | | | — | | | | — | |
| | | (4.06 | ) | | | (0.59 | ) | | | — | | | | (0.16 | ) | | | (1.34 | ) | | | — | |
| | | (4.06 | ) | | | (0.59 | ) | | | — | | | | (0.16 | ) | | | (1.34 | ) | | | — | |
| | | | | | | | | | | | | | | | | | | | | | | | |
| | $ | 18.58 | | | $ | 25.93 | | | $ | 22.83 | | | $ | 16.06 | | | $ | 17.16 | | | $ | 15.13 | |
| | | | | | | | | | | | | | | | | | | | | | | | |
| | | (15.20 | )%(2) | | | 16.33 | % | | | 42.15 | % | | | (5.36 | )% | | | 23.94 | % | | | 25.77 | % |
| | | | | | | | | | | | | | | | | | | | | | | | |
| | | | | | | | | | | | | | | | | | | | | | | | |
| | $ | 199,390 | | | $ | 309,493 | | | $ | 285,033 | | | $ | 228,893 | | | $ | 286,514 | | | $ | 44,493 | |
| | | 1.45 | %(3) | | | 1.45 | % | | | 1.45 | % | | | 1.45 | % | | | 1.48 | % | | | 1.60 | % |
| | | (1.05 | )%(3) | | | (1.03 | )% | | | (0.84 | )% | | | (0.55 | )% | | | (0.87 | )% | | | (0.82 | )% |
| | | 1.34 | %(3) | | | 1.37 | % | | | 1.73 | % | | | 1.41 | % | | | 1.59 | % | | | 1.80 | % |
| | | (0.94 | )%(3) | | | (0.95 | )% | | | (1.12 | )% | | | (0.51 | )% | | | (0.98 | )% | | | (1.02 | )% |
| | | 46 | %(2) | | | 65 | % | | | 51 | % | | | 67 | % | | | 89 | % | | | 79 | % |
| | | | | | | | | | | | | | | | | | | | | | | | |
| | Period
Ended
3/31/22(1)
(Unaudited) | | | | | | | | | | | | | | | | | | | | | |
| | | | | | | | | | | | | | | | | | | | | | | | |
| | $ | 22.30 | | | | | | | | | | | | | | | | | | | | | |
| | | | | | | | | | | | | | | | | | | | | | | | |
| | | | | | | | | | | | | | | | | | | | | | | | |
| | | (0.05 | ) | | | | | | | | | | | | | | | | | | | | |
| | | (3.65 | ) | | | | | | | | | | | | | | | | | | | | |
| | | (3.70 | ) | | | | | | | | | | | | | | | | | | | | |
| | | | | | | | | | | | | | | | | | | | | | | | |
| | $ | 18.60 | | | | | | | | | | | | | | | | | | | | | |
| | | | | | | | | | | | | | | | | | | | | | | | |
| | | (16.59 | )%(2) | | | | | | | | | | | | | | | | | | | | |
| | | | | | | | | | | | | | | | | | | | | | | | |
| | | | | | | | | | | | | | | | | | | | | | | | |
| | $ | 19,967 | | | | | | | | | | | | | | | | | | | | | |
| | | 1.09 | %(3) | | | | | | | | | | | | | | | | | | | | |
| | | (0.67 | )%(3) | | | | | | | | | | | | | | | | | | | | |
| | | 1.09 | %(3) | | | | | | | | | | | | | | | | | | | | |
| | | (0.67 | )%(3) | | | | | | | | | | | | | | | | | | | | |
| | | 46 | %(2) | | | | | | | | | | | | | | | | | | | | |
37
NOTES TO FINANCIAL STATEMENTS |
NOTES TO FINANCIAL STATEMENTS March 31, 2022 (Unaudited)
The Marsico Investment Fund (the “Trust”) was organized on October 1, 1997, as a Delaware statutory trust and is registered under the Investment Company Act of 1940, as amended (the “1940 Act”), as an open-end management investment company. The Focus Fund, Growth Fund, Midcap Growth Focus Fund, International Opportunities Fund, and Global Fund (collectively, the “Funds”) are separate investment portfolios of the Trust. The Focus Fund is a non-diversified fund and the Growth Fund, Midcap Growth Focus Fund, International Opportunities Fund, and Global Fund are diversified funds. The Focus Fund and Growth Fund commenced operations on December 31, 1997, the Midcap Growth Focus Fund commenced operations on February 1, 2000, the International Opportunities Fund commenced operations on June 30, 2000, and the Global Fund commenced operations on June 29, 2007. Prior to September 1, 2021, the Midcap Growth Focus Fund was known as the 21st Century Fund.
On November 17, 2021, the Funds’ Board of Trustees approved a Multi-Class Plan (“Multi-Class Plan”) pursuant to Rule 18f-3 under the 1940 Act (i) to divide the shares of each Fund into two classes, (ii) to authorize and designate a new Institutional Class of shares for each of the Funds and (iii) to redesignate the existing shares of each of the Funds as Investor Class shares. Effective December 6, 2021, the Institutional Class shares for each of the Funds commenced operations and the existing shares of each of the Funds were redesignated as Investor Class shares. Shares of each class of the Funds represent an equal pro rata interest in such Fund and generally have identical voting, distribution, liquidation and other rights/privileges except that each class shall (a) have a different designation; (b) bear any class expenses; (c) have exclusive voting rights on any matter submitted to shareholders that relates solely to its administration or distribution arrangement; (d) have separate voting rights on any matter submitted to shareholders in which the interests of one class differ from the interests of any other class; and (e) have different shareholder investment minimum requirements.
Trustees and officers of the Trust and employees of Marsico Capital Management, LLC (the “Adviser”) own approximately 25%, 39%, 38%, 78%, and 65% of the outstanding Institutional Class shares of the Focus Fund, Growth Fund, Midcap Growth Focus Fund, International Opportunities Fund, and Global Fund, respectively, as of March 31, 2022. Percentage ownership of each Fund is significant as the Institutional Class of shares of each Fund only recently commenced operations and the Institutional Class of shares for each Fund were initially funded by conversions of Investor Class shares in certain accounts attributed to Trustees and executive officers of the Trust.
2. | Significant Accounting Policies |
The Funds qualify as investment companies under Accounting Standards Update No. 2013-08, Accounting Standard Codification Topic 946, Financial Services — Investment Companies (“ASC 946”). The following is a summary of significant accounting policies consistently followed by the Funds in the preparation of their financial statements. These policies are in conformity with Generally Accepted Accounting Principles (“GAAP”) in the United States of America for investment companies and follow the accounting guidance provided in ASC 946. The presentation of financial statements in conformity with GAAP requires management to make estimates and assumptions that affect the reported amounts and disclosures of assets and liabilities at the date of the financial statements and the reported amounts and disclosures of income and expenses during the reporting period. Actual results could differ from those estimates.
| | (a) | Investment Valuation — A security traded on a recognized stock exchange is generally valued at the last sale price prior to the closing of the principal exchange on which the security is traded. Securities traded on NASDAQ generally will be valued at the NASDAQ Official Closing Price. If no sale price is reported on the valuation date, the most current bid price will generally be used, with the exception of short option positions which will generally utilize the most current ask price. Other securities for which over-the-counter market quotations are readily available are generally valued at the last sale price. Debt securities that will mature in more than 60 days are generally valued at their bid prices furnished by a pricing service approved by the Funds’ Board of Trustees and subject to review pursuant to procedures established by, and under the general supervision of, the Board of Trustees. Debt securities that will mature in 60 days or less are valued at amortized cost, if it approximates market value. Any securities for which market quotations are not readily available are valued at their fair value as determined in good faith by the Adviser in accordance with procedures established by, and under the general supervision of, the Funds’ Board of Trustees. The Funds may use pricing services to assist in determining market value. The Board of Trustees has authorized the use of a pricing service to assist the Funds in valuing certain equity securities listed or traded on foreign security exchanges in the Funds’ portfolios in certain circumstances where there is a significant change in the value of related US-traded securities, as represented by, for example, the S&P 500 Index. |
“Fair Value Measurements and Disclosures” (the “Fair Value Statement”) defines fair value, establishes a framework for measuring fair value in GAAP, and expands disclosures about fair value measurements. Under the Fair Value Statement, various inputs are used in determining the value of the Funds’ investments.
These inputs are summarized into three broad levels and described below:
| | ● | Level 1 – unadjusted quoted prices in active markets for identical investments |
| | ● | Level 2 – other significant observable inputs (including quoted prices for similar investments, interest rates, and evaluated quotations obtained from pricing services) |
| | ● | Level 3 – significant unobservable inputs (including the Fund’s assumptions that market participants would use in determining the fair value of investments) |
38
NOTES TO FINANCIAL STATEMENTS |
The inputs or methodology used for valuing investments are not an indication of the risk associated with investing in those investments. Changes in valuation techniques may result in transfers between the levels during the reporting period. In accordance with procedures established by, and under the general supervision of, the Funds’ Board of Trustees, certain equity securities listed or traded on foreign security exchanges in the Funds’ portfolios that had a fair valuation adjustment factor applied to their equity prices at the end of the reporting period are categorized as Level 2. There were no transfers into or out of Level 3 during the reporting period. The following is a summary of the fair values of the Funds’ investments in each category and economic sector as of March 31, 2022:
Fund Investments by
Major Security Type | | Level 1 | | | Level 2 | | | Level 3 | | | Total | |
Marsico Focus Fund | | | | | | | | | | | | | | | | |
Assets | | | | | | | | | | | | | | | | |
Common Stocks | | | | | | | | | | | | | | | | |
Communication Services | | $ | 149,821,565 | | | $ | — | | | $ | — | | | $ | 149,821,565 | |
Consumer Discretionary | | | 164,173,882 | | | | — | | | | — | | | | 164,173,882 | |
Financials | | | 56,285,740 | | | | — | | | | — | | | | 56,285,740 | |
Health Care | | | 40,864,995 | | | | — | | | | — | | | | 40,864,995 | |
Industrials | | | 27,932,343 | | | | — | | | | — | | | | 27,932,343 | |
Information Technology | | | 309,054,343 | | | | — | | | | — | | | | 309,054,343 | |
Materials | | | 30,167,076 | | | | — | | | | — | | | | 30,167,076 | |
Short-term Investments | | | 21,652,943 | | | | — | | | | — | | | | 21,652,943 | |
| | | | | | | | | | | | | | | $ | 799,952,887 | |
Marsico Growth Fund | | | | | | | | | | | | | | | | |
Assets | | | | | | | | | | | | | | | | |
Common Stocks | | | | | | | | | | | | | | | | |
Communication Services | | $ | 55,082,847 | | | $ | — | | | $ | — | | | $ | 55,082,847 | |
Consumer Discretionary | | | 69,444,419 | | | | — | | | | — | | | | 69,444,419 | |
Consumer Staples | | | 10,321,745 | | | | — | | | | — | | | | 10,321,745 | |
Financials | | | 18,159,314 | | | | — | | | | — | | | | 18,159,314 | |
Health Care | | | 37,747,633 | | | | — | | | | — | | | | 37,747,633 | |
Industrials | | | 11,020,874 | | | | — | | | | — | | | | 11,020,874 | |
Information Technology | | | 123,561,435 | | | | — | | | | — | | | | 123,561,435 | |
Short-term Investments | | | 19,828,314 | | | | — | | | | — | | | | 19,828,314 | |
| | | | | | | | | | | | | | | $ | 345,166,581 | |
Marsico Midcap Growth Focus Fund | | | | | | | | | | | | | | | | |
Assets | | | | | | | | | | | | | | | | |
Common Stocks | | | | | | | | | | | | | | | | |
Communication Services | | $ | 7,239,205 | | | $ | — | | | $ | — | | | $ | 7,239,205 | |
Consumer Discretionary | | | 38,171,785 | | | | — | | | | — | | | | 38,171,785 | |
Financials | | | 15,760,461 | | | | — | | | | — | | | | 15,760,461 | |
Health Care | | | 67,861,403 | | | | — | | | | — | | | | 67,861,403 | |
Industrials | | | 38,114,120 | | | | — | | | | — | | | | 38,114,120 | |
Information Technology | | | 110,003,805 | | | | — | | | | — | | | | 110,003,805 | |
Real Estate | | | 17,374,335 | | | | — | | | | — | | | | 17,374,335 | |
Short-term Investments | | | 15,161,668 | | | | — | | | | — | | | | 15,161,668 | |
| | | | | | | | | | | | | | | $ | 309,686,782 | |
Marsico International Opportunities Fund | | | | | | | | | | | | | | | | |
Assets | | | | | | | | | | | | | | | | |
Common Stocks | | | | | | | | | | | | | | | | |
Communication Services | | $ | 954,914 | | | $ | 4,170,018 | | | $ | — | | | $ | 5,124,932 | |
Consumer Discretionary | | | 1,837,635 | | | | 4,213,582 | | | | — | | | | 6,051,217 | |
Consumer Staples | | | 1,104,128 | | | | 3,520,220 | | | | — | | | | 4,624,348 | |
Energy | | | — | | | | 589,029 | | | | — | | | | 589,029 | |
Financials | | | 2,093,232 | | | | 3,976,374 | | | | — | | | | 6,069,606 | |
Health Care | | | — | | | | 8,090,823 | | | | — | | | | 8,090,823 | |
Industrials | | | 511,080 | | | | 5,814,654 | | | | — | | | | 6,325,734 | |
Information Technology | | | 3,430,088 | | | | 4,730,921 | | | | — | | | | 8,161,009 | |
Materials | | | — | | | | 1,939,287 | | | | — | | | | 1,939,287 | |
Real Estate | | | 491,799 | | | | — | | | | — | | | | 491,799 | |
Short-term Investments | | | 700,067 | | | | — | | | | — | | | | 700,067 | |
| | | | | | | | | | | | | | | $ | 48,167,851 | |
39
NOTES TO FINANCIAL STATEMENTS |
NOTES TO FINANCIAL STATEMENTS March 31, 2022 (Unaudited) (continued)
Fund Investments by
Major Security Type | | Level 1 | | | Level 2 | | | Level 3 | | | Total | |
Marsico Global Fund | | | | | | | | | | | | | | | | |
Assets | | | | | | | | | | | | | | | | |
Common Stocks | | | | | | | | | | | | | | | | |
Communication Services | | $ | 17,005,845 | | | $ | 12,997,048 | | | $ | — | | | $ | 30,002,893 | |
Consumer Discretionary | | | 36,104,782 | | | | 14,612,134 | | | | — | | | | 50,716,916 | |
Consumer Staples | | | — | | | | 8,740,657 | | | | — | | | | 8,740,657 | |
Financials | | | 14,208,021 | | | | 4,275,075 | | | | — | | | | 18,483,096 | |
Health Care | | | — | | | | 5,374,327 | | | | — | | | | 5,374,327 | |
Industrials | | | 6,363,091 | | | | — | | | | — | | | | 6,363,091 | |
Information Technology | | | 84,104,116 | | | | 3,515,731 | | | | — | | | | 87,619,847 | |
Materials | | | 12,152,705 | | | | — | | | | — | | | | 12,152,705 | |
| | | | | | | | | | | | | | | $ | 219,453,532 | |
| | (b) | Expenses — The Funds are charged for those expenses that are directly attributable to each Fund, such as advisory and custodial fees. Expenses that are not directly attributable to a Fund are typically allocated among the Funds in proportion to their respective net assets and are in some cases allocated based on other factors. Each class of shares bears a portion of their respective Fund expenses, which are allocated daily to each class of shares in proportion to their respective net assets of the Fund. Expenses directly attributable to a specific class of shares, such as distribution fees for the Investor Class, are charged directly to that class of shares. The Funds’ expenses may be reduced by advisory fee waivers, brokerage credits and uninvested cash balances earning interest or credits. Such credits are included in “Less waiver of expenses and expenses paid indirectly” on the Statements of Operations. |
Brokerage commissions may be paid to certain brokers which reduce transfer agent fees and expenses. For the six-month period ended March 31, 2022, the Funds received no such brokerage commission credits. The Funds received earnings credits on certain cash account balances which reduced transfer agent fees and expenses by less than $1 (in thousands) for each of the Focus Fund, Growth Fund, Midcap Growth Focus Fund, International Opportunities Fund, and Global Fund for the six-month period ended March 31, 2022. Brokerage commission credits and earnings credits (if any) are included in “Less waiver of expenses and expenses paid indirectly” on the Statements of Operations.
| | (c) | Federal Income Taxes — Each Fund intends to comply with the requirements of the Internal Revenue Code of 1986, as amended (the “Internal Revenue Code”), necessary to continue to qualify as a regulated investment company and to make the requisite distributions of income to its shareholders which will be sufficient to relieve it from all or substantially all federal and state income taxes. Certain Funds may utilize earnings and profits on redemption of shares as part of the dividends paid deduction. |
| | (d) | Distributions to Shareholders — Dividends from net investment income and net realized capital gains, if any, will be declared and paid at least annually. Distributions to shareholders are recorded on the ex-dividend date. Each Fund may periodically make reclassifications among certain of its capital accounts as a result of the timing and characterization of certain income and capital gains distributions determined in accordance with federal tax regulations, which may differ from GAAP. These reclassifications are due to differing treatment for items such as foreign currency transactions and net investment losses. |
The Funds at times may invest in real estate investment trusts (“REITs”). REITs generally pay dividends to their investors based upon cash available from their operations and this amount may differ significantly from the REITs’ actual earnings and profits (“E&P”) determined for income tax purposes. It is common for these dividends to exceed the REITs’ taxable E&P, resulting in the excess portion of such dividends eventually being designated as a return of capital. Determination of the tax character of dividends made by REITs is typically performed by the REIT several months subsequent to the payment of the dividend. Therefore, due to timing issues, the Funds may be in a position of being required to calculate and pay required distribution amounts to their shareholders based on the best information available from the REITs, which may be prior to the final determination of the REITs’ taxable E&P, and it is possible that a portion of the Funds’ distribution amounts could include a return of capital to shareholders for federal income tax purposes.
| | (e) | Foreign Currency Translation — The accounting records of the Funds are maintained in US dollars. For valuation purposes, values of securities denominated in foreign currencies are translated into US dollars at 4:00 p.m. Eastern Time. Amounts related to the purchase and sale of foreign securities and investment income are translated at the rates of exchange prevailing on the respective dates of such transactions. |
Reported realized gains and losses on foreign currency transactions arise from sales of portfolio securities, forward foreign currency contracts, currency gains or losses realized between the trade and settlement dates on securities transactions, and the difference between the amounts of dividends, interest, and foreign withholding taxes recorded on the Funds’ books and the US dollar equivalent of the amounts actually received or paid.
The Funds do not isolate that portion of the results of operations resulting from changes in foreign exchange rates on investments from the fluctuations arising from changes in market prices of securities held at the end of the reporting period. Net unrealized appreciation or
40
NOTES TO FINANCIAL STATEMENTS |
depreciation on investments and foreign currency translations arises from changes in the value of assets and liabilities, including investments in securities at the end of the reporting period, resulting from changes in the exchange rates and changes in market prices of securities held.
Transactions in foreign-denominated assets may involve greater risks than domestic transactions, including currency risk, political and economic risk, regulatory risk and market risk.
| | (f) | Derivative Instruments — “Disclosure about Derivative Instruments and Hedging Activities” (the “Derivatives Statement”) requires enhanced disclosures about the Funds’ derivative and hedging activities, including how such activities are accounted for and their effects on the Funds’ financial position, performance and cash flows. |
The Funds are not intended as vehicles for investing substantially in derivative instruments, and may hold derivative instruments only infrequently. The Funds enter into derivative instruments in order to increase exposure to certain investments, asset classes, or markets, or for hedging purposes to hedge against adverse movements in securities prices, currency rates or interest rates. The Funds can hold various types of derivative instruments such as futures contracts and options on securities, financial indexes, and foreign currencies, options on futures, forward foreign currency contracts, interest rate swaps, credit default swaps, and swap-related products. The use of derivative instruments may involve risks such as the possibility of illiquid markets or imperfect correlation between the value of the derivative instruments and the underlying securities, or that the counterparty will fail to perform its obligations. There were no outstanding derivative instruments held by the Funds as of March 31, 2022 nor did the Funds utilize derivative instruments during the six-month period ended March 31, 2022.
| | (g) | Non-Interested Trustees’ Deferred Fee Plan — Effective February 1, 2000, the Board of Trustees adopted the Marsico Investment Fund Deferred Fee Plan (the “Deferred Fee Plan”), amended and restated as of December 30, 2005, which allows the Trustees who are not “interested persons” of the Funds, as defined in the 1940 Act (“non-interested Trustees”), to defer the receipt of all or a portion of their compensation received from the Funds and may be invested as directed by each non-interested Trustee. The Deferred Fee Plan was further amended and restated as of November 10, 2020 to allow for any deferred fees credited to accounts established on behalf of the non-interested Trustees to be invested into the Funds and other investment options allowed under the Deferred Fee Plan, such as a non-affiliated US government money market fund, among other clarifying changes. The amounts credited to these accounts increase or decrease in accordance with the performance of the investments selected by the non-interested Trustees. The market value of the deferred account balances as of March 31, 2022 is shown on the Statements of Assets and Liabilities as part of an asset account, “Prepaid expenses and other assets,” and a liability account, “Accrued trustees’ fees.” Additionally, the fluctuation of the account balances due to the performance of the investments is recorded by the Funds as unrealized appreciation (depreciation), which is shown as part of “Total distributable earnings” on the Statements of Assets and Liabilities, and as compensation expense, which is shown as part of the expense account “Trustees’ fees and expenses” on the Statements of Operations. Fees earned and deferred by the non-interested Trustees for the six-month period ended March 31, 2022 are also included in “Trustees’ fees and expenses” on the Statements of Operations. Amounts contributed to the Deferred Fee Plan will be deferred until distributed in accordance with the Deferred Fee Plan. Unrealized appreciation (depreciation) of the investments held in the Deferred Fee Plan is subject to the Funds’ expense reimbursement agreement with the Adviser. |
| | (h) | Other — Investment transactions are accounted for on a trade date basis. Each Fund determines the gain or loss realized from the investment transactions by comparing the original cost of the security lot sold with the net sale proceeds. Dividend income is recognized on the ex-dividend date. Certain dividends from foreign securities are recorded when the Funds are informed of the dividend if such information is obtained subsequent to the ex-dividend date. Interest income is recognized on an accrual basis and includes amortization of premiums and accretion of discounts. Income, as well as gains and losses, both realized and unrealized, are allocated daily to each class of shares in proportion to their respective net assets of each Fund. |
| | (i) | Indemnifications — In the normal course of business, the Funds enter into contracts that contain provisions indemnifying other parties against specified potential liabilities. Each Fund’s maximum exposure under these arrangements is unknown as this would involve future claims that may be made against the Fund that have not yet occurred. However, based on experience, the Funds expect the risk of loss in connection with these potential indemnification obligations to be remote. There can be no assurance that material liabilities related to such obligations will not arise in the future, which may adversely impact a Fund. |
3. | Investment Advisory Agreement and Transactions With Affiliates |
Each Fund has an agreement with the Adviser to furnish investment advisory services to the Funds. Each Fund calculates and accrues the investment advisory fee daily based on the following rates (expressed as annual rates) and pays the Adviser monthly:
Annual Rate of Average Daily Net Assets | Asset Threshold |
0.80% | First $250 million |
0.75% | Next $250 million |
0.70% | Next $250 million |
0.65% | In excess of $750 million |
41
NOTES TO FINANCIAL STATEMENTS |
NOTES TO FINANCIAL STATEMENTS March 31, 2022 (Unaudited) (continued)
The Adviser has entered into a written expense limitation and fee waiver agreement under which it has agreed (i) to limit the total expenses of the Investor Class of each Fund (excluding taxes, interest, acquired fund fees and expenses, litigation, extraordinary expenses, and brokerage and other transaction expenses relating to the purchase or sale of portfolio investments) to an annual rate of 1.50% of the average net assets attributable to Investor Class shares of the International Opportunities Fund and Global Fund, and 1.45% of the average net assets attributable to Investor Class shares of the Focus Fund, Growth Fund, and Midcap Growth Focus Fund, and (ii) to limit the total expenses of the Institutional Class of each Fund (excluding taxes, interest, acquired fund fees and expenses, litigation, extraordinary expenses, and brokerage and other transaction expenses relating to the purchase or sale of portfolio investments) to an annual rate of 1.25% of the average net assets attributable to Institutional Class shares of the International Opportunities Fund and Global Fund, and 1.20% of the average net assets attributable to Institutional Class shares of the Focus Fund, Growth Fund and Midcap Growth Focus Fund, until January 31, 2023. This expense limitation and fee waiver agreement may be terminated by the Adviser at any time after January 31, 2023, upon 15 days prior notice to the Fund and its administrator. Prior to February 1, 2021, the Adviser had agreed to limit the total expenses of the Global Fund (with certain exclusions) to an annual rate of 1.45% of the average net assets attributable to Investor Class shares of the Global Fund.
The Adviser may recoup from a Fund or a share class, as applicable, fees previously waived or expenses previously reimbursed by the Adviser with respect to that Fund or share class, as applicable, pursuant to this agreement (or a previous expense limitation agreement) if: (1) such recoupment by the Adviser does not cause the Fund’s share class, at the time of recoupment, to exceed the lesser of (a) the expense limitation in effect at the time the relevant amount was waived and/or reimbursed, or (b) the expense limitation in effect at the time of the proposed recoupment, and (2) the recoupment is made within three years after the fiscal year end date as of which the amount to be waived or reimbursed was determined and the waiver or reimbursement occurred. Additionally in accordance with the Funds’ Multi-Class Plan, eligible recoupment amounts related to periods prior to the commencement of operations of the Institutional Class may be recouped by the Adviser from the respective Fund’s Investor Class pursuant to this agreement (or a previous expense limitation agreement). Under this arrangement during the six-month period ended March 31, 2022, the Adviser received $145 (in thousands) of reimbursement from the Global Fund’s Investor Class for previously waived or reimbursed expenses. The reimbursement amounts are reflected in “Recoupment of previously waived expenses” on the Statements of Operations. As of March 31, 2022, recoupment amounts (in thousands) that may potentially be made by the respective share class of the International Opportunities Fund and Global Fund to the Adviser are as follows:
| | | International
Opportunities Fund | | | Global Fund | |
Year of Expiration | | Investor Class | | | Institutional Class | | | Investor Class | |
2022 | | $ | 123 | | | $ | — | | | $ | — | |
2023 | | | 167 | | | | — | | | | 396 | |
2024 | | | 107 | | | | — | | | | — | |
2025 | | | 35 | | | | 5 | | | | — | |
| | | $ | 432 | | | $ | 5 | | | $ | 396 | |
Certain officers of the Trust are also officers of the Adviser. The Funds pay a portion of the Chief Compliance Officer’s total compensation costs which is shown as part of the expense account “Professional fees” on the Statements of Operations. No other officers of the Trust received compensation from the Funds during the six-month period ended March 31, 2022.
4. | Distribution and Service Plan |
The Funds have adopted a Distribution and Service Plan pursuant to Rule 12b-1 under the 1940 Act, and effective November 17, 2021, the Board of Trustees approved a Third Amended and Restated Distribution and Service Plan (as amended, the “Plan”). The Plan authorizes payments by the Funds in connection with the distribution of their Investor Class shares at an annual rate, as determined from time to time by the Board of Trustees, of up to 0.25% of a Fund’s average daily net assets attributable to Investor Class shares. Institutional Class shares of the Funds are not subject to a 12b-1 fee. The Plan clarifies that while the maximum 12b-1 Fee rate remains limited to 0.25% per annum of each Fund’s average daily net assets attributable to Investor Class shares, one or more Funds may be charged a lower rate from time to time upon approval by the Board of Trustees, and the rate may vary by Fund. The Plan also clarifies that previously accrued amounts of the 12b-1 Fee for each Fund may be used by that Fund to pay any current or previously accrued expenses of the Fund authorized by the Plan, including non-distribution expenses, authorized by the Plan.
Payments may be made by the Funds under the Plan for the purpose of financing any activity primarily intended to result in the sales of Investor Class shares of the Funds, as determined by the Board of Trustees, as well as for account maintenance and personal services to Investor Class shareholders and any other non-distribution-related services. The Adviser may, out of its own resources (which may include legitimate profits from providing advisory services to the Funds or other clients) and at its sole discretion, make certain payments on behalf of the Funds or the Plan for expenses incurred by a Fund for distribution of Fund shares and related services or for administrative or other expenses incurred by the Fund.
Pursuant to the Plan, the Board of Trustees temporarily eliminated 12b-1 accruals for the Focus Fund’s Investor Class shares for the period from June 1, 2018 to January 31, 2021. Effective February 1, 2021, the Focus Fund began accruing 12b-1 Fees for its Investor Class shares at a rate of 0.25% per annum of the average daily net assets attributable to Investor Class shares of the Fund, continuing until such time as the Board authorizes
42
NOTES TO FINANCIAL STATEMENTS |
a different rate. Each Fund currently accrues 12b-1 Fees for its Investor Class shares at a rate of 0.25% per annum of the average daily net assets attributable to Investor Class shares of the Fund until such time as the Board authorizes a different rate.
5. | Investment Transactions |
The aggregate purchases and sales of securities, excluding short-term investments, for the Funds for the six-month period ended March 31, 2022, were as follows:
(Amounts in thousands) | | Focus
Fund | | | Growth
Fund | | | Midcap
Growth Focus
Fund | | | International
Opportunities
Fund | | | Global
Fund | |
Purchases | | $ | 287,166 | | | $ | 146,035 | | | $ | 32,955 | | | $ | 5,950 | | | $ | 124,733 | |
Sales | | $ | 315,074 | | | $ | 190,097 | | | $ | 55,817 | | | $ | 9,693 | | | $ | 163,557 | |
There were no purchases or sales of US government securities, excluding short-term investments.
The global outbreak of an infectious respiratory illness caused by a novel strain of coronavirus and its variants (“COVID-19”) has disrupted economic and financial markets, resulted in substantial market volatility and impacted the valuations of the Funds’ investments during the reporting period. The prolonged economic impact of COVID-19 remains uncertain. The operational and financial performance of the issuers of securities in which the Funds invest depends on future developments, including the longer-term impact of the COVID-19 pandemic, and such uncertainty may in turn continue to impact the value of the Funds’ investments.
7. | Federal Income Tax Information |
“Accounting for Uncertainty in Income Taxes” (the “Income Tax Statement”) requires an evaluation of tax positions taken (or expected to be taken) in the course of preparing a Fund’s tax returns to determine whether these positions meet a “more-likely-than-not” standard that, based on the technical merits, have a more than fifty percent likelihood of being sustained by a taxing authority upon examination. A tax position that meets the “more-likely-than-not” recognition threshold is measured to determine the amount of benefit to recognize in the financial statements. The Funds recognize interest and penalties, if any, related to unrecognized tax benefits as income tax expense in the Statements of Operations.
The Income Tax Statement requires management of the Funds to analyze all open tax years, consisting of fiscal years 2018-2022 as defined by Internal Revenue Service (“IRS”) statute of limitations for all major jurisdictions, including federal tax authorities and certain state tax authorities. As of and during the six-month period ended March 31, 2022, the Funds did not have any liabilities for any unrecognized tax benefits. The Funds have no examinations in progress and are not aware of any tax positions for which it is reasonably possible that the total amounts of unrecognized tax benefits will significantly change in the next twelve months.
At March 31, 2022, gross unrealized appreciation and depreciation of investments, based on cost for federal income tax purposes, were as follows:
(Amounts in thousands) | | Focus
Fund | | | Growth
Fund | | | Midcap
Growth Focus
Fund | | | International
Opportunities
Fund | | | Global
Fund | |
Cost of Investments | | $ | 473,072 | | | $ | 225,748 | | | $ | 211,411 | | | $ | 39,360 | | | $ | 150,394 | |
| | | | | | | | | | | | | | | | | | | | | |
Gross Unrealized Appreciation | | $ | 340,978 | | | $ | 127,288 | | | $ | 118,399 | | | $ | 12,157 | | | $ | 76,283 | |
Gross Unrealized Depreciation | | | (14,097 | ) | | | (7,869 | ) | | | (20,123 | ) | | | (3,349 | ) | | | (7,223 | ) |
| | | | | | | | | | | | | | | | | | | | | |
Net Unrealized Appreciation on Investments | | $ | 326,881 | | | $ | 119,419 | | | $ | 98,276 | | | $ | 8,808 | | | $ | 69,060 | |
The difference between cost amounts for financial statement and federal income tax purposes is due primarily to wash sale loss deferrals.
43
NOTES TO FINANCIAL STATEMENTS |
NOTES TO FINANCIAL STATEMENTS March 31, 2022 (Unaudited) (continued)
As of September 30, 2021, the components of accumulated earnings on a tax basis were as follows:
(Amounts in thousands) | | Focus
Fund | | | Growth
Fund | | | Midcap
Growth Focus
Fund | | | International
Opportunities
Fund | | | Global
Fund | |
Undistributed Ordinary Income | | $ | 11,039 | | | $ | 27,445 | | | $ | 2,237 | | | $ | 852 | | | $ | 3,670 | |
Undistributed Trustees’ Deferred Compensation | | | (5,924 | ) | | | (2,417 | ) | | | (1,091 | ) | | | (377 | ) | | | (2,458 | ) |
Undistributed Long-Term Capital Gains | | | 88,739 | | | | 92,399 | | | | 41,236 | | | | 4,042 | | | | 42,047 | |
Tax Accumulated Earnings | | | 93,854 | | | | 117,427 | | | | 42,382 | | | | 4,517 | | | | 43,259 | |
Net Unrealized Appreciation on Investments | | | 461,510 | | | | 170,017 | | | | 160,471 | | | | 16,748 | | | | 124,911 | |
Net Unrealized Appreciation on Foreign Currency Translations | | | — | | | | — | | | | — | | | | 1 | | | | 2 | |
Trustees’ Deferred Compensation Mark-to-Market | | | 3,803 | | | | 1,065 | | | | 163 | | | | 45 | | | | 197 | |
Total Accumulated Earnings | | $ | 559,167 | | | $ | 288,509 | | | $ | 203,016 | | | $ | 21,311 | | | $ | 168,369 | |
Undistributed ordinary income consists of net investment income, passive foreign investment company and timing differences related to qualified late-year losses.
The tax character of distributions paid during the fiscal years ended September 30, 2021 and 2020 was as follows:
| | | 2021 | | | | 2020 | |
(Amounts in thousands) | | Ordinary Income | | | Long-Term Capital Gains | | | | Ordinary Income | | | Long-Term Capital Gains | |
Focus Fund | | $ | 13,699 | | | $ | 66,119 | | | | $ | — | | | $ | 43,408 | |
Growth Fund | | | 11,535 | | | | 26,440 | | | | | — | | | | 25,236 | |
Midcap Growth Focus Fund | | | — | | | | 9,729 | | | | | — | | | | 8,884 | |
International Opportunities Fund | | | — | | | | 1,438 | | | | | 191 | | | | 2,090 | |
Global Fund | | | — | | | | 7,258 | | | | | — | | | | — | |
The tax character of dividends paid may differ from that shown in the Financial Highlights due to short-term gains being treated as ordinary income for tax purposes.
Management of the Adviser has determined that there were no material subsequent events that would require disclosure in the Funds’ financial statements.
44
EXPENSE EXAMPLE For the six-month period ended March 31, 2022 (Unaudited)
As a shareholder of the Marsico Funds (the “Funds”), you incur two types of costs: (1) transaction costs, including redemption fees (if any), and (2) ongoing costs, including management fees, distribution (12b-1) fees (if any), and other Fund expenses. This Example is intended to help you understand your ongoing costs (in dollars) of investing in the Funds and to compare these costs with the ongoing costs of investing in other mutual funds.
The Example is based on an investment of $1,000 invested at the beginning of the period and held for the entire period from October 1, 2021 to March 31, 2022 (the “period”).
Actual Expenses
The first line of the table below provides information about actual account values and actual expenses. You may use the information in this line, together with the amount you invested, to estimate the expenses you paid over the period. Simply divide your account value by $1,000 (for example, an $8,600 account value divided by $1,000 equals 8.6), then multiply the result by the number in the first line under the heading entitled “Expenses paid for the six-month period ended March 31, 2022” to estimate the expenses you paid on your account during the period.
Hypothetical Example for Comparison Purposes
The second line of the table below provides information about hypothetical account values and hypothetical expenses based on the respective Fund/Class’s actual expense ratios and an assumed rate of return of 5% per year before expenses, which is not the respective Fund/Class’s actual return of any of the Funds. The hypothetical account values and expenses may not be used to estimate the actual ending account balance or expenses you paid for the period. You may use this information to compare the ongoing costs of investing in the Funds and other funds. To do so, compare this 5% hypothetical example with the 5% hypothetical examples that appear in the shareholder reports of other funds.
Please note that the expenses shown in the table are meant to highlight your ongoing costs only and do not reflect any transactional costs such as redemption fees (if any). Therefore, the second line of the table is useful in comparing the ongoing costs only, and will not help you determine the relative total costs of owning different funds. In addition, if these transactional costs (if any) were included, your costs could have been higher.
| | Annualized
expense ratio | Beginning
account value
October 1, 2021 | Ending
account value
March 31, 2022 | Expenses paid for the
six-month period ended
March 31, 2022(1)(2) |
FOCUS FUND | | | | |
Investor Class: | | | | |
Actual Example | 1.12% | $ 1,000.00 | $ 944.00 | $ 5.44 |
Hypothetical Example, assuming a 5% return before expenses | | $ 1,000.00 | $ 1,019.40 | $ 5.65 |
| | | | | |
Institutional Class: | | | | |
Actual Example | 0.76% | $ 1,000.00 | $ 899.20 | $ 2.30 |
Hypothetical Example, assuming a 5% return before expenses | | $ 1,000.00 | $ 1,022.57 | $ 2.45 |
| | | | | |
GROWTH FUND | | | | |
Investor Class: | | | | |
Actual Example | 1.21% | $ 1,000.00 | $ 899.70 | $ 5.75 |
Hypothetical Example, assuming a 5% return before expenses | | $ 1,000.00 | $ 1,018.95 | $ 6.11 |
| | | | | |
Institutional Class: | | | | |
Actual Example | 0.97% | $ 1,000.00 | $ 899.40 | $ 2.94 |
Hypothetical Example, assuming a 5% return before expenses | | $ 1,000.00 | $ 1,021.90 | $ 3.13 |
45
EXPENSE EXAMPLE
EXPENSE EXAMPLE For the six-month period ended March 31, 2022 (Unaudited) (continued)
| | Annualized
expense ratio | Beginning
account value
October 1, 2021 | Ending
account value
March 31, 2022 | Expenses paid for the
six-month period ended
March 31, 2022(1)(2) |
MIDCAP GROWTH FOCUS FUND | | |
Investor Class: | | | | |
Actual Example | 1.31% | $ 1,000.00 | $ 858.20 | $ 6.05 |
Hypothetical Example, assuming a 5% return before expenses | | $ 1,000.00 | $ 1,018.49 | $ 6.57 |
| | | | | |
Institutional Class: | | | | |
Actual Example | 1.13% | $ 1,000.00 | $ 879.50 | $ 3.38 |
Hypothetical Example, assuming a 5% return before expenses | | $ 1,000.00 | $ 1,021.40 | $ 3.64 |
| | | | | |
INTERNATIONAL OPPORTUNITIES FUND | | | | |
Investor Class: | | | | |
Actual Example | 1.50% | $ 1,000.00 | $ 855.90 | $ 6.94 |
Hypothetical Example, assuming a 5% return before expenses | | $ 1,000.00 | $ 1,017.52 | $ 7.55 |
| | | | | |
Institutional Class: | | | | |
Actual Example | 1.25% | $ 1,000.00 | $ 890.10 | $ 3.76 |
Hypothetical Example, assuming a 5% return before expenses | | $ 1,000.00 | $ 1,021.03 | $ 4.02 |
| | | | | |
GLOBAL FUND | | | | |
Investor Class: | | | | |
Actual Example | 1.45% | $ 1,000.00 | $ 848.00 | $ 6.68 |
Hypothetical Example, assuming a 5% return before expenses | | $ 1,000.00 | $ 1,017.77 | $ 7.30 |
| | | | | |
Institutional Class: | | | | |
Actual Example | 1.09% | $ 1,000.00 | $ 834.10 | $ 3.17 |
Hypothetical Example, assuming a 5% return before expenses | | $ 1,000.00 | $ 1,021.54 | $ 3.49 |
| | | | | |
(1) Expenses are equal to the annualized expense ratio for the Investor Class shares multiplied by the average account value over the period, multiplied by 182/365 (to reflect the six-month period). |
(2) Expenses are equal to the annualized expense ratio for the Institutional Class shares multiplied by the average account value over the period from the commencement of operations on December 6, 2021 to period end, multiplied by 116/365 (to reflect the period from commencement of operations to March 31, 2022). |
46
CONSIDERATION OF INVESTMENT ADVISORY AGREEMENTS |
CONSIDERATION OF INVESTMENT ADVISORY AGREEMENTS (Unaudited)
At an in-person meeting of the Board of Trustees of the Trust held on November 17, 2021, the Trustees, by a unanimous vote (including a separate vote of those Trustees who are not “interested persons” (as the term is defined in the 1940 Act) of the Trust (the “Independent Trustees”)), approved the renewal of the Investment Advisory and Management Agreements for the Focus Fund, Growth Fund, Midcap Growth Focus Fund, International Opportunities Fund, and Global Fund (the “Advisory Agreements”). In advance of the meeting, the Independent Trustees requested and received extensive materials from Marsico Capital Management, LLC (the “Adviser” or “MCM”) to assist them in considering the renewal of the Advisory Agreements. The materials provided by the Adviser contained information with respect to the factors noted below, including detailed information relating to the performance, advisory fees and other expenses of the Funds, funds sub-advised by the Adviser and non-fund advisory accounts of the Adviser. The materials also included comparisons of the Funds with third party funds of similar size and investment objectives in terms of performance, fees and other expenses, as well as the performance of each Fund versus its benchmark. In addition, the Adviser provided information regarding its overall expenses and profitability, as well as other information requested by the Trustees.
In addition to the materials prepared specifically for contract review analysis, on an ongoing basis the Trustees receive information and reports from the Adviser and other service providers to the Funds regarding the investment performance of the Funds as well as operational, compliance, marketing and other matters.
The Trustees engaged in a detailed discussion of the materials with management of the Adviser. The Independent Trustees then met separately with independent counsel to the Independent Trustees for a review of the materials. Following this session, the full Board reconvened and approved the continuation of the Advisory Agreements for the Focus Fund, Growth Fund, Midcap Growth Focus Fund, International Opportunities Fund, and Global Fund.
Discussion of Certain Factors Considered
1. Nature, Extent, and Quality of Services. The Independent Trustees considered the nature, extent and quality of the services performed by Marsico Capital Management, LLC (“MCM” or the “Adviser”) under the Investment Advisory and Management Agreements (the “Advisory Agreements”) with the Adviser, including portfolio management, supervision of Fund operations, regulatory filings and disclosures to shareholders, compliance functions, general oversight of other service providers, coordination of existing and new Fund marketing initiatives, review of Fund legal issues, and other services. The Independent Trustees also considered the personnel who provide these services, which includes a team of individuals collectively having years of experience in their particular areas of expertise. The Independent Trustees reviewed the Adviser’s investment philosophy and experience, noting that the Adviser and its affiliates employ a focused stock-picking strategy that involves extensive research. The Independent Trustees noted MCM’s continued investment in research. The Independent Trustees discussed the Adviser’s ability to continue to provide the same level and quality of services to the Funds, and discussed with members of management of MCM the financial condition of the Adviser and its ability to attract and retain experienced personnel. The Independent Trustees considered the reinvestment in MCM by Mr. T. Marsico and the steps taken to ensure the continued financial viability of the Adviser, including the extinguishment of debt to third parties and elimination of most of MCM’s overall debt in prior years. The Independent Trustees also discussed MCM’s commitment to devoting substantial resources to the Adviser’s investment management process. The Independent Trustees concluded that the services provided by the Adviser are extensive in nature, that the Adviser employs investment advisory personnel who consistently deliver a high level of service and that, with respect to third-party service providers, the Adviser effectively manages the outsourcing by the Funds of certain services to other service providers and the oversight of those service providers.
2. Investment Performance of the Funds and Adviser. The Independent Trustees considered the Adviser’s substantial investment advisory experience and capabilities. The Independent Trustees considered short-term and long-term investment performance for each Fund over various periods of time as compared to both relevant equity indices and the performance of each Fund’s Lipper, Inc. peer group universe. The Independent Trustees noted the strong positive performance of all five of the Funds relative to their benchmark indexes over the three-year, five-year, ten-year, and since inception periods, and discussed with representatives of the Adviser the factors underlying the performance of the Funds over various time periods. The Independent Trustees discussed the Funds’ performance with representatives of MCM and concluded that the Adviser was delivering acceptable performance results consistent with the long-term investment strategies being pursued by the Funds. The Independent Trustees took into account that they regularly review each Fund’s performance.
The Independent Trustees noted that the investment performance delivered by the Adviser to the Funds appeared to be generally consistent with the performance delivered for other clients of the Adviser with similar strategies. Based on this review, the Independent Trustees concluded that the performance of the Adviser with respect to each Fund was acceptable for the purposes of approving the Advisory Agreements.
47
CONSIDERATION OF INVESTMENT ADVISORY AGREEMENTS
CONSIDERATION OF INVESTMENT ADVISORY AGREEMENTS (Unaudited) (continued)
3. Costs of Services and Profits Realized by the Adviser.
(a) Costs of Services to Funds: Fees and Expenses. The Independent Trustees considered each Fund’s management fee rates and expense ratios relative to industry averages for the Fund’s benchmark category and the advisory fees charged by the Adviser to other clients, including information regarding expense limitation commitments from the Adviser, and the breakpoints in the advisory fee schedule for all of the Funds. The Independent Trustees noted that the information provided by MCM stated that the mix of services under the Advisory Agreements is much more extensive than services provided under the Adviser’s advisory agreements for sub-advised and non-fund clients.
The Independent Trustees also noted previous actions taken by MCM to reduce Fund expenses, including that MCM had waived fees and absorbed expenses from time to time, including waiving fees for three of the Funds during the past fiscal year, and that some of those expenditures may not be recouped. The Independent Trustees reviewed various expense information and noted that overall Fund expenses are in a range that continues to be reasonable. The Trustees also noted other actions that have been taken to reduce expenses. The Independent Trustees concluded that the investment advisory fees are acceptable based upon the qualifications, experience, reputation, and performance of the Adviser and the overall expense ratios of the Funds.
(b) Profitability and Costs of Services to Adviser. The Independent Trustees reviewed the information provided by MCM regarding its overall profitability and costs and an estimate of the Adviser’s profitability and costs in serving the Funds as part of MCM’s overall investment management business serving many clients. The Independent Trustees noted that MCM’s estimated overall profitability from managing the Funds increased only slightly during the fiscal year ended September 30, 2021, that estimated profit margins were low to moderate overall, that the profit margin for one Fund was negative, and that MCM had not reduced its services, but continued to devote substantial resources and personnel to the Funds. The Independent Trustees also noted that the Adviser previously had substantially increased its resources devoted to Fund matters in response to regulatory requirements enacted in prior years. The Independent Trustees discussed the level of estimated profit of MCM from its relationship to the Funds and considered profitability levels reviewed by federal courts that were found to be reasonable. The Independent Trustees concluded that the estimated profits received by the Adviser under the Advisory Agreements were acceptable for purposes of approving the Advisory Agreements.
4. Extent of Economies of Scale as Funds Grow. The Independent Trustees considered whether there have been economies of scale with respect to the management of each Fund and whether such Fund has appropriately benefited from any economies of scale. The Independent Trustees noted that economies of scale may develop for certain Funds as their assets increase and their Fund-level expenses decline as a percentage of assets, but that Fund-level economies of scale may not necessarily result in Adviser-level economies of scale. The Independent Trustees agreed that it was possible that Adviser-level expenses incurred in managing the Funds eventually may decline as a percentage of management fees, especially if the assets of certain Funds grow beyond certain thresholds. The Independent Trustees noted that should economies of scale be realized in the future, the advisory fee schedule contains breakpoints that would benefit shareholders of the Funds as assets increase.
5. Whether Fee Levels Reflect Economies of Scale. The Independent Trustees also considered whether the management fee rate is reasonable in relation to the asset size of each Fund and any economies of scale that may exist. The Independent Trustees noted that the management fee schedule for each Fund contained breakpoints and that MCM had agreed to expense limitations for the Funds that would remain in place until at least January 31, 2023.
6. Other Relevant Considerations. The Independent Trustees considered the character and amount of other incidental benefits received by the Adviser and its affiliates from its association with the Funds. The Independent Trustees concluded that potential ancillary or “fall-out” benefits that the Adviser may receive, such as greater name recognition or increased ability to obtain research or brokerage services, appear to be reasonable, and may in some cases benefit the Funds.
48
CONSIDERATION OF INVESTMENT ADVISORY AGREEMENTS
Conclusions.
In considering the Advisory Agreements, the Independent Trustees did not identify any factor as all-important or all-controlling and instead considered these factors collectively in light of each Fund’s surrounding circumstances. Based on this review, it was the judgment of the Independent Trustees that each Fund’s fees were reasonable, the extent and quality of services were acceptable and performance of the Funds was acceptable. Therefore, re-approval of the Advisory Agreements was in the best interests of each Fund and its shareholders. As a part of their decision-making process, the Independent Trustees noted that the Adviser has managed the Funds since their inception, and the Independent Trustees believe that a long-term relationship with a capable, conscientious adviser is in the best interests of the Funds and their shareholders. The Independent Trustees considered, generally, that shareholders invested in a Fund knowing that the Adviser managed that Fund and knowing its investment management fee. As such, the Independent Trustees considered whether the Adviser managed each Fund in accordance with its investment objectives and policies as disclosed to shareholders. Additionally, as part of its deliberations, the Board also considered the information about the Funds and MCM that had been provided to them throughout the year in connection with their regular Board meetings at which they engage in the ongoing oversight of the Funds and their operations.
Upon conclusion of their review and discussion, the Trustees, including all of the Independent Trustees, unanimously agreed the Advisory Agreements for each of the Funds should be continued.
49
OTHER INFORMATION (Unaudited)
Proxy Voting Guidelines
The Funds exercise the voting rights associated with the securities held by the Funds under the proxy voting policy of the Funds. A description of those policies and procedures of the Funds and a record of the Funds’ proxy votes for the one-year period ended June 30, 2021 are available without charge, upon request, by calling 888-860-8686. It is also available on the Securities and Exchange Commission’s (SEC) website at www.sec.gov.
Quarterly Filing of Portfolio Holdings
The Funds will file their portfolio holdings information for each month in a fiscal quarter within 60 days after the end of the relevant fiscal quarter on Form N-PORT. Portfolio holdings information for the third month of each fiscal quarter will be made available immediately upon filing on the SEC’s website at www.sec.gov.
Cost Basis Information
Federal law requires mutual fund companies to maintain a shareholder’s cost basis by tax lot and report gain/loss information and holding periods for sales of mutual fund shares that are “covered” securities to the IRS and to shareholders on Form 1099. Mutual fund shares, such as shares of the Funds, acquired on or after January 1, 2012 are covered securities. The Funds are not responsible for maintaining and reporting share information for their shares that are not deemed “covered.”
The tax regulations require that the Funds elect a default tax identification methodology in order to perform the required reporting. The Funds have chosen the first-in-first-out method as the default tax lot identification method for its shareholders. This is the method the Funds will use to determine which specific shares are deemed to be sold when a shareholder’s entire position is not sold in a single transaction and is the method in which “covered” share sales will be reported on a shareholder’s Form 1099.
However, at the time of purchase or upon the sale of “covered” shares, shareholders may generally choose a different tax lot identification method. Shareholders should consult a tax advisor with regard to their personal circumstances as the Funds and their service providers do not provide tax advice.
50
MARSICO FUNDS
NOTES
51
MARSICO FUNDS
NOTES
52
(b) The Registrant did not disseminate any information to shareholders specified by paragraph (c)(3) of Rule 30e-3 under the Act (17 CFR 270.30e-3).
Not applicable to semi-annual reports.
| Item 3. | Audit Committee Financial Expert |
Not applicable to semi-annual reports.
| Item 4. | Principal Accountant Fees and Services |
Not applicable to semi-annual reports.
| Item 5. | Audit Committee of Listed Registrants |
Not applicable.
| Item 6. | Schedule of Investments |
The schedule of investments in securities of unaffiliated issuers is included as part of the report to shareholders filed under Item 1.
| Item 7. | Disclosure of Proxy Voting Policies and Procedures for Closed-End Management Investment Companies |
Not applicable.
| Item 8. | Portfolio Managers of Closed-End Management Investment Companies |
Not applicable.
| Item 9. | Purchases of Equity Securities by Closed-End Management Investment Company and Affiliated Purchasers |
Not applicable.
Item 10. Submission of Matters to a Vote of Security Holders
Not applicable.
Item 11. Controls and Procedures.
(a) The registrant's principal executive officer and principal financial officer have concluded that the registrant's disclosure controls and procedures (as defined in Rule 30a-3(c) under the Investment Company Act of 1940, as amended) are effective based on their evaluation of these disclosure controls and procedures within 90 days of the filing date of this report on Form N-CSR.
(b) There were no changes in the registrant's internal control over financial reporting (as defined in Rule 30a-3(d) under the Investment Company Act of 1940, as amended) that occurred during the period covered by this report that have materially affected, or are reasonably likely to materially affect, the registrant's internal control over financial reporting.
Item 12. Disclosure of Securities Lending Activities for Closed-End Management Investment Companies.
Not applicable.
Item 13. Exhibits
(a)(1) Code of Ethics
Not applicable to semi-annual reports.
(a)(2) Certification for each principal executive and principal financial officer of the registrant as required by Rule 30a-2(a) under the Act (17 CFR 270.30a-2(a)). Filed as an attachment to this filing.
(a)(3) Any written solicitation to purchase securities under Rule 23c--1 under the Investment Company Act of 1940, as amended, that was sent or given during the period covered by the report by or on behalf of the registrant to 10 or more persons.
Not applicable.
(a)(4) Change in the registrant’s independent public accountant.
Not applicable.
(b) Certifications required by Rule 30a-2(b) under the Act (17 CFR 270.30a-2(b)), Rule 13a-14(b) or Rule 15d-14(b) under the Exchange Act (17 CFR 240.13a-14(b) or 240.15d-14(b)), and Section 1350 of Chapter 63 of Title 18 of the United States Code (18 U.S.C. 1350). Filed as an attachment to this filing.
SIGNATURES
Pursuant to the requirements of the Securities Exchange Act of 1934 and the Investment Company Act of 1940, the registrant has duly caused this report to be signed on its behalf by the undersigned, thereunto duly authorized.
The Marsico Investment Fund
| By: | /s/ Thomas F. Marsico | |
| Thomas F. Marsico, | |
| Trustee, President, Chief Executive Officer and Chief Investment Officer (Principal Executive Officer) |
Date: June 2, 2022
Pursuant to the requirements of the Securities Exchange Act of 1934 and the Investment Company Act of 1940, this report has been signed below by the following persons on behalf of the registrant and in the capacities and on the dates indicated.
| By: | /s/ Thomas F. Marsico | |
| Thomas F. Marsico, | |
| Trustee, President, Chief Executive Officer and Chief Investment Officer (Principal Executive Officer) |
Date: June 2, 2022
| By: | /s/ Neil L. Gloude | |
| Neil L. Gloude, | |
| Vice President, Secretary and Treasurer (Principal Financial Officer) |
Date: June 2, 2022