UNITED STATES
SECURITIES AND EXCHANGE COMMISSION
Washington, D.C. 20549
FORM N-CSR
CERTIFIED SHAREHOLDER REPORT OF REGISTERED
MANAGEMENT INVESTMENT COMPANIES
Investment Company Act file number 811-08397
The Marsico Investment Fund
(Exact name of Registrant as specified in charter)
1200 17th Street, Suite 1600
Denver, Colorado 80202
(Address of principal executive offices) (Zip code)
Christopher J. Marsico
The Marsico Investment Fund
1200 17th Street, Suite 1600
Denver, Colorado 80202
(Name and address of agent for service)
Copies to:
Anthony H. Zacharski
Dechert LLP
90 State House Square
Hartford, CT 06103
Registrant's telephone number, including area code: (303) 454-5600
Date of fiscal year end: September 30
Date of reporting period: March 31, 2018
| Item 1. | Reports to Stockholders |
DEAR SHAREHOLDER:
Enclosed is your semi-annual report for The Marsico Investment Fund, encompassing the six-month fiscal period from October 1, 2017 to March 31, 2018.
The purpose of this report is to provide a review of the Marsico Funds’ six-month investment results by discussing what we believe were the main areas that impacted performance – including the macroeconomic environment, sector and industry positioning, and individual stock selection – as compared to the Funds’ performance benchmark indexes.
For updated information regarding the market environment and the Funds’ overall investment positioning and performance, please refer to the Funds’ most recent monthly fact sheets and quarterly investment updates, which are available in the Investor Resources section of the Funds’ website at marsicofunds.com.(1)
Effective on and after March 6, 2018, Jordon Laycob no longer served as the portfolio manager of the Marsico Flexible Capital Fund, and Thomas F. Marsico, Chief Investment Officer (“CIO”) of the Marsico Funds and CIO of Marsico Capital Management, LLC, the adviser of the Funds, assumed responsibility as the portfolio manager of the Flexible Capital Fund.
(1) | The references to the Marsico Funds website (marsicofunds.com) included throughout this semi-annual report do not incorporate the website’s contents into this report. |
| | KEY FUND STATISTICS | 2 | |
| | MARKET ENVIRONMENT | 5 | |
| | | | |
| | MARSICO FOCUS FUND |
| | Investment Review | 7 | |
| | Fund Overview | 10 | |
| | Schedule of Investments | 11 | |
| | | | |
| | MARSICO GROWTH FUND |
| | Investment Review | 12 | |
| | Fund Overview | 15 | |
| | Schedule of Investments | 16 | |
| | | | |
| | MARSICO 21st CENTURY FUND |
| | Investment Review | 18 | |
| | Fund Overview | 21 | |
| | Schedule of Investments | 22 | |
| | | | |
| | MARSICO INTERNATIONAL OPPORTUNITIES FUND |
| | Investment Review | 24 | |
| | Fund Overview | 26 | |
| | Schedule of Investments | 27 | |
| | | | |
| | MARSICO FLEXIBLE CAPITAL FUND |
| | Investment Review | 29 | |
| | Fund Overview | 31 | |
| | Schedule of Investments | 32 | |
| | | | |
| | MARSICO GLOBAL FUND |
| | Investment Review | 33 | |
| | Fund Overview | 35 | |
| | Schedule of Investments | 36 | |
| | | | |
| | FINANCIAL STATEMENTS | 38 | |
| | NOTES TO FINANCIAL STATEMENTS | 48 | |
| | EXPENSE EXAMPLE | 56 | |
| | CONSIDERATION OF INVESTMENT ADVISORY AGREEMENTS | 57 | |
| | OTHER INFORMATION | 60 | |
1
| KEY FUND STATISTICS (UNAUDITED) |
Marsico Focus Fund | Marsico Growth Fund | Marsico 21st Century
Fund |
| | MFOCX | | | MGRIX | | | MXXIX | |
For additional disclosures, please see page 10. | For additional disclosures, please see page 15. | For additional disclosures, please see page 21. |
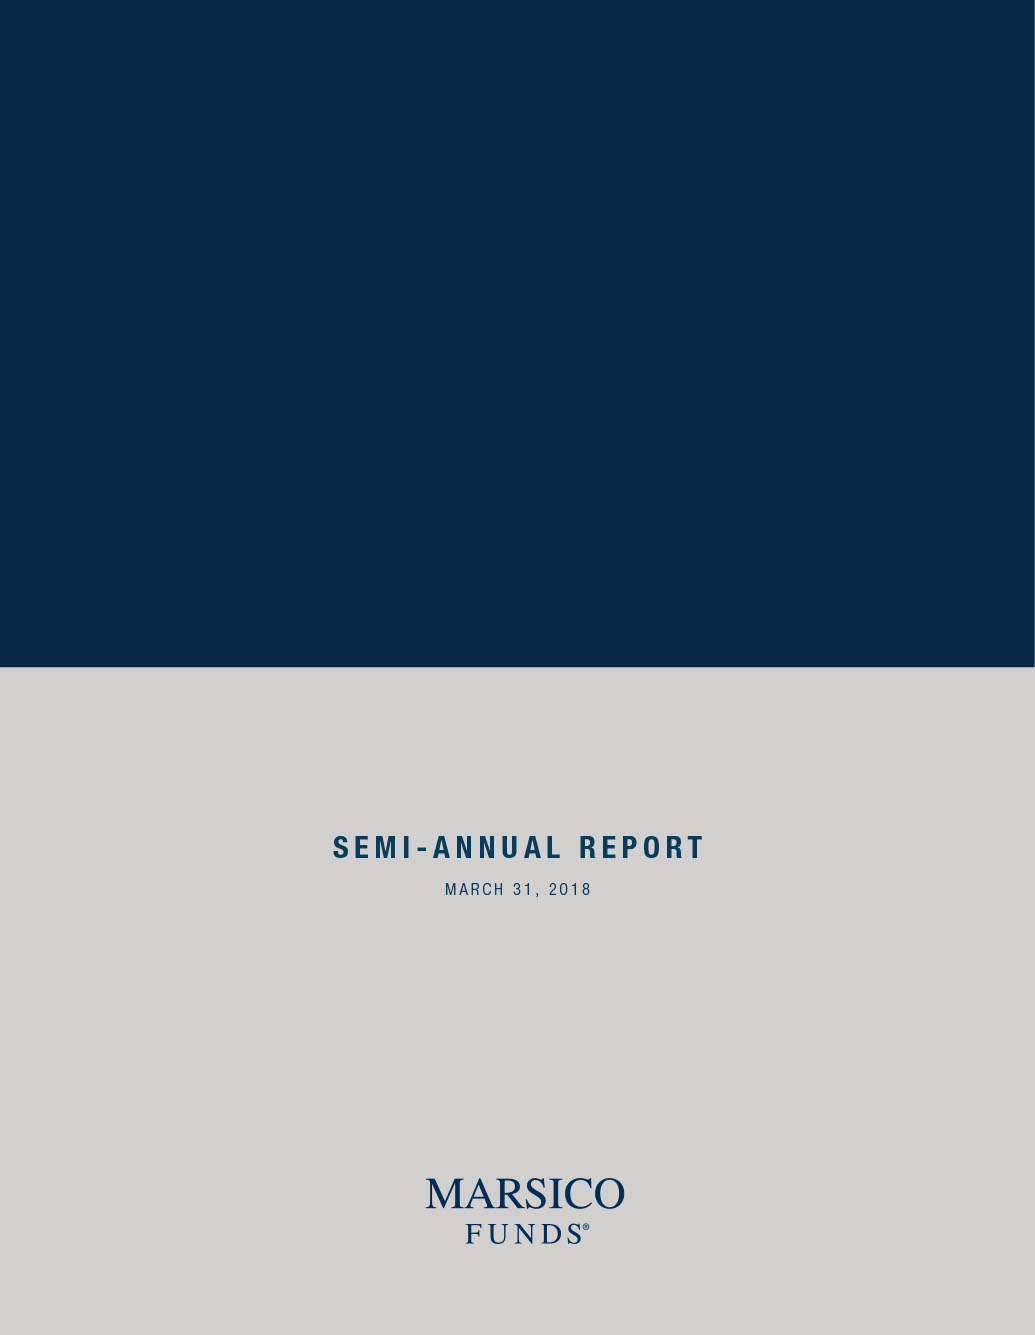
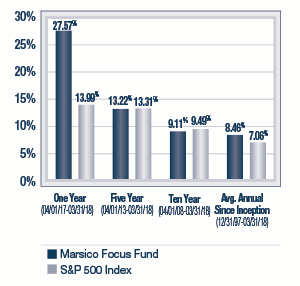
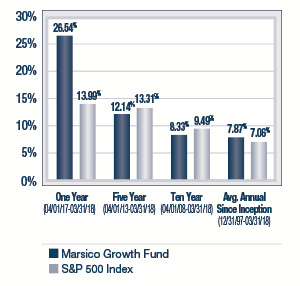
PERFORMANCE COMPARISON(1) | PERFORMANCE COMPARISON(1) | PERFORMANCE COMPARISON(1) |
|  |  |
TOTAL ANNUAL OPERATING EXPENSES* 1.33% | TOTAL ANNUAL OPERATING EXPENSES* 1.37% | TOTAL ANNUAL OPERATING EXPENSES* 1.36% |
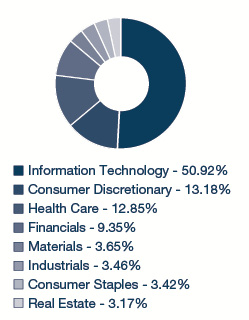
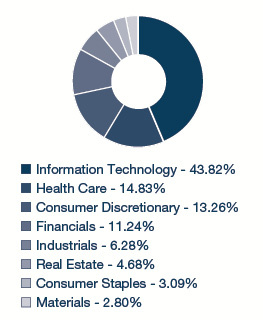
SECTOR ALLOCATION(2) | SECTOR ALLOCATION(2) | SECTOR ALLOCATION(2) |
| 
| 
|
| TOP FIVE HOLDINGS | TOP FIVE HOLDINGS | TOP FIVE HOLDINGS |
| Alibaba Group Holding Ltd. Spon. ADR | 7.36% | Amazon.com, Inc. | 4.94% | CoStar Group, Inc. | 3.25% |
| Amazon.com, Inc. | 6.31% | Alibaba Group Holding Ltd. Spon. ADR | 4.86% | Mastercard, Inc. - Cl. A | 3.23% |
| Visa, Inc. - Cl. A | 5.89% | Adobe Systems, Inc. | 4.36% | salesforce.com, inc. | 3.17% |
| Netflix, Inc. | 5.70% | Visa, Inc. - Cl. A | 3.99% | Intuitive Surgical, Inc. | 3.16% |
| salesforce.com, inc. | 5.65% | salesforce.com, inc. | 3.90% | Constellation Brands, Inc. - Cl. A | 3.05% |
For additional disclosures about the Marsico Funds, please see page 4. The performance data quoted here represent past performance, and past performance is not a guarantee of future results. Investment return and principal value of an investment will fluctuate so that an investor’s shares, when redeemed, may be worth more or less than their original cost.
2
| KEY FUND STATISTICS (UNAUDITED) |
Marsico International
Opportunities Fund | Marsico Flexible Capital
Fund | Marsico Global Fund |
| MIOFX | | | MFCFX | | | MGLBX | |
For additional disclosures, please see page 26. | For additional disclosures, please see page 31. | For additional disclosures, please see page 35. |
PERFORMANCE COMPARISON(1) | PERFORMANCE COMPARISON(1) | PERFORMANCE COMPARISON(1) |
 | 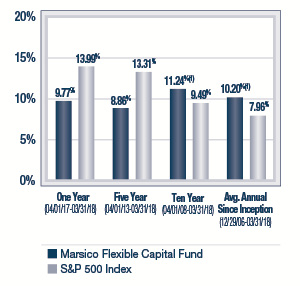 | 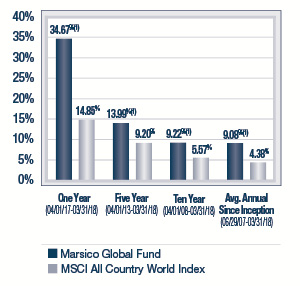 |
TOTAL ANNUAL OPERATING EXPENSES* 1.79% NET EXPENSES*† 1.50% | TOTAL ANNUAL OPERATING EXPENSES* 1.47% NET EXPENSES*† 1.45% | TOTAL ANNUAL OPERATING EXPENSES* 1.80% NET EXPENSES*† 1.50% |
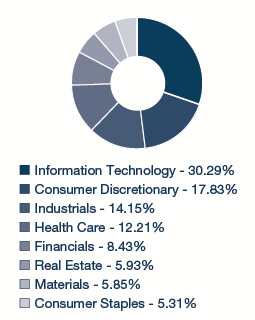
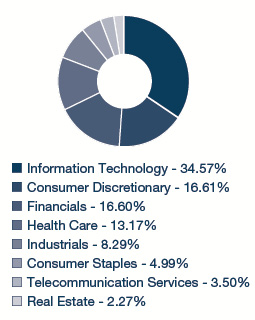
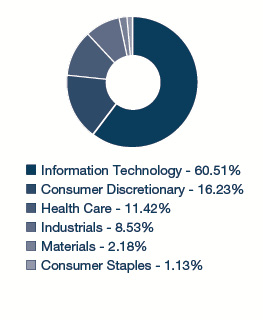
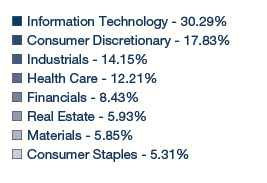
SECTOR ALLOCATION(2) | SECTOR ALLOCATION(2) | SECTOR ALLOCATION(2) |
 | 
|  |
| TOP FIVE HOLDINGS | TOP FIVE HOLDINGS | TOP FIVE HOLDINGS |
| InterXion Holding N.V. | 4.40% | Alibaba Group Holding Ltd. Spon. ADR | 4.94% | Alibaba Group Holding Ltd. Spon. ADR | 4.96% |
| Alibaba Group Holding Ltd. Spon. ADR | 3.76% | Tencent Holdings Ltd. | 4.72% | Amazon.com, Inc. | 4.72% |
| ASML Holding N.V. | 3.62% | Amazon.com, Inc. | 4.72% | Tencent Holdings Ltd. | 4.70% |
| Julius Baer Group Ltd. | 3.42% | Apple, Inc. | 4.42% | salesforce.com, inc. | 4.18% |
| Tencent Holdings Ltd. | 3.41% | Alphabet, Inc. - Cl. A | 4.28% | Facebook, Inc. - Cl. A | 3.65% |
Current performance may be lower or higher than the performance information quoted. To obtain performance information current to the most recent month-end, please call 888-860-8686 or visit marsicofunds.com.
3
| KEY FUND STATISTICS (UNAUDITED) |
ADDITIONAL DISCLOSURES ABOUT THE MARSICO FUNDS
* | The Total Annual Operating Expenses and Net Expenses are reflective of the information disclosed in the Funds’ Prospectus dated January 31, 2018. The information may differ from the expense ratios disclosed in this report. |
† | Marsico Capital Management, LLC (the “Adviser”) has entered into a written expense limitation and fee waiver agreement under which it has agreed to limit the total expenses (excluding taxes, interest, acquired fund fees and expenses, litigation, extraordinary expenses, brokerage and other transaction expenses relating to the purchase or sale of portfolio investments) to an annual rate of 1.50% of the average net assets of the International Opportunities Fund and the Global Fund and 1.45% of the average net assets of the Flexible Capital Fund until January 31, 2019. This expense limitation and fee waiver agreement may be terminated by the Adviser at any time after January 31, 2019, upon 15 days prior notice to the Fund and its administrator. The Adviser may recoup from a Fund fees previously waived or expenses previously reimbursed by the Adviser with respect to that Fund pursuant to this agreement (or a previous expenses limitation agreement) if: (1) such recoupment by the Adviser does not cause the Fund, at the time of recoupment, to exceed the lesser of (a) the expense limitation in effect at the time the relevant amount was waived and/or reimbursed, or (b) the expense limitation in effect at the time of the proposed recoupment, and (2) the recoupment is made within three years after the fiscal year end date as of which the amount to be waived or reimbursed was determined and the waiver or reimbursement occured. |
(1) | The performance data quoted here represent past performance, and past performance is not a guarantee of future results. Investment return and principal value of an investment will fluctuate so that an investor’s shares, when redeemed, may be worth more or less than their original cost. Current performance may be lower or higher than the performance information quoted. To obtain performance information current to the most recent month-end, please call 888-860-8686 or visit marsicofunds.com. |
| The performance included in the chart does not reflect the deduction of taxes on Fund distributions or the redemption of Fund shares. |
| All indices are unmanaged and investors cannot invest directly in an index. |
Periodically, certain fees and expenses have been waived or reimbursed by the Adviser for the 21st Century Fund, the International Opportunities Fund, the Flexible Capital Fund and the Global Fund. In the absence of such a waiver or reimbursement, the performance returns reflected would have been reduced. In accordance with the expense limitation and fee waiver agreement, the Adviser may recoup fees and expenses previously waived or reimbursed under certain parameters. Periodically, the Adviser has recouped such fees or expenses from the 21st Century Fund, the International Opportunities Fund, and the Global Fund, resulting in a lower performance return.
(2) | Sector weightings represent the percentage of the respective Fund’s investments (excluding cash equivalents) in certain general sectors. These sectors may include more than one industry. The Fund’s portfolio composition is subject to change at any time. |
4
MARKET ENVIRONMENT: OCTOBER 2017 – MARCH 2018 (UNAUDITED)
Global equity markets rode a roller coaster in the six-month fiscal period ended March 31, 2018. Enthusiasm for US tax cuts enacted in December 2017 propelled US equity indices sharply higher in late 2017 and early in 2018. This in turn lifted US interest rates, but was met by a falling US dollar. Domestic market momentum spilled over into shares in emerging markets which rose at near double-digit rates. Later in the period, however, fears of a “global trade war” and concerns about technology company breaches of user data privacy catalyzed a broad sell-off in global markets and technology stocks.
US policy headlines, rather than macroeconomic momentum, seemed to dominate market movements during the six-month period. The enactment of major corporate tax cuts led to major upward revisions to after-tax earnings expectations for many companies. This appeared to play a central role in the surge for US shares from mid-December 2017 through January 2018. Subsequently, US decisions to impose tariffs on aluminum and steel and propose placing tariffs on several other Chinese exports raised fears of retaliation and the risk of a full-fledged trade war. Both on the way up and on the way down, stocks seemed buffeted by these policy developments.
Behind the policy headlines, macroeconomic fundamentals in the US continued to strengthen. Economic theory suggests that enacting major tax cuts and spending increases should give a boost to overall economic growth. Strength in the US labor market was consistent with that notion, as February/March monthly job gains averaged 202,000, taking the three-month average gains to around 240,000. Real GDP appears to be expanding at a roughly 3% pace so far during 2018. At least for the moment, it appears that both employment and output gains have accelerated. In addition, Federal Reserve policymakers raised interest rates by a widely expected 25 basis points (i.e., 25 hundredths of a percentage point) in late March, while also signaling that there might be justification for a faster tightening pace if economic momentum exceeds their expectations in the quarters ahead.
In reaction to changing notions that the pace of US growth and Federal Reserve interest rate tightening might accelerate, short-dated US Treasury yields rose appreciably. For the first quarter of 2018, the yield on the US 2-year Treasury note rose by +38 basis points. Longer-dated treasuries also rose in yield, although yields dropped again amid stock market weakness late in the period. By the end of the six-month period, the 10-year Treasury yield rose to 2.74%.
Perhaps the most perplexing performance for the six-month period involved the US dollar. Amid strong stock prices and rising US interest rates, the dollar generally declined relative to the rest of the world’s currencies, perhaps in part because of reductions in Federal Reserve holdings of Treasury securities, the US government’s expanding need to borrow, and uncertainty regarding foreign holders’ potential desire to sell Treasuries or reduced appetite to buy more. At the peak for share prices, the dollar was down -4% versus both the euro and a large basket of currencies. This dollar weakness may provide a partial explanation for the strength in the dollar-denominated price of oil, which rose by +$5 per barrel during the first quarter of 2018.
Going forward, “trade war” anxieties may continue to cause fears of faltering growth. That said, US tariff proposals appear in part to be posturing to pressure other countries to cut their own tariffs, and absent the development of a real escalating trade war, the powerful stimulus of the newly enacted tax cuts seems likely to deliver stronger US economic activity.
5
The performance of global markets during the six-month fiscal period ended March 31, 2018 is depicted below. US markets posted strong gains for the period. Large capitalization US equities outperformed small capitalization stocks, yet both segments lagged medium-capitalization stocks during the period. Emerging market equities performed positively as their currencies strengthened relative to the US dollar, easing import costs for those countries. Developed international markets posted positive returns as well despite uncertain elections in Europe and conflict in the Middle East.
Index Name(1) | Universe of
Equities Represented | Six-Month
Total Return (as of March 31, 2018) |
US | | |
S&P 500 | US large-capitalization equities | +5.84% |
Russell 3000 | US publicly-traded equities of all sizes | +5.65% |
Russell 2000 | US small-capitalization equities | +3.25% |
Russell Mid-Cap Growth | US medium-capitalization equities | +9.13% |
Index Name(1) | Universe of
Equities Represented | Six-Month
Total Return (as of March 31, 2018) |
INTERNATIONAL | |
MSCI EAFE (US$) | Equities in developed international equity markets, including Japan, Western Europe, and Australasia | +2.63% |
MSCI Emerging Markets (US$) | Equities in developing international equity markets, including China, India, Eastern Europe, and Latin America | +8.96% |
MSCI ACWI (US$) | Equities in the global developed and emerging markets | +4.71% |
THE MARSICO INVESTMENT TEAM
(1) | All indices are unmanaged and investors cannot invest directly in an index. |
6
INVESTMENT REVIEW BY TOM MARSICO (UNAUDITED)
The Marsico Focus Fund posted a total return of +9.83% for the six-month fiscal period ended March 31, 2018. The Fund substantially outperformed its benchmark index, the S&P 500 Index, which had a total return of +5.84% over the same time period. Please see the Fund’s Overview for more detailed information about the Fund’s longer-term performance for various time periods ended March 31, 2018.
The performance data for the Fund quoted here represent past performance, and past performance is not a guarantee of future results. Investment return and principal value of an investment will fluctuate so that an investor’s shares, when redeemed, may be worth more or less than their original cost. Current performance may be lower or higher than the performance information quoted. To obtain performance information current to the most recent month-end, please call 888-860-8686 or visit marsicofunds.com.(1)
This review highlights Fund performance over a six-month fiscal period. Shareholders should keep in mind that the Fund is intended for long-term investors who hold their shares for substantially longer periods of time. You should also keep in mind that our current views and beliefs regarding all investments discussed in this report are subject to change at any time. References to specific securities, industries, and sectors discussed in this report are not recommendations to buy or sell such securities or related investments, and the Fund may not necessarily hold these securities or investments today. Please see the accompanying Schedule of Investments for the percentage of the Fund’s portfolio represented by the securities mentioned in this report as of the end of the reporting period.
The Focus Fund is non-diversified and may hold fewer securities than a diversified fund because it is permitted to invest a greater percentage of its assets in a smaller number of securities. Holding fewer securities increases the risk that the value of the Fund could go down because of the poor performance of a single investment or may be more volatile than its benchmark. The Fund is subject to broad risks associated with investing in equity securities markets generally, including the risks that the securities and markets in which it invests may experience volatility and instability, that domestic and global economies and markets may undergo periods of cyclical change and decline, that investors may at times avoid investments in equity securities, and that investments may not perform as anticipated. Please see the Prospectus for more information.
The Fund is not managed to track the benchmark index, and may hold a substantially overweight or underweight position in a sector, industry, or security compared to its weight in the benchmark. The Fund may be subject to risks associated with a particular sector or other area in which it is overweight, including the risk that the stocks of companies within one area could simultaneously decline in price because of an event that affects the entire area. For informational purposes, the discussion below may compare the benchmark weight or performance of a sector or industry to the investment approach of the Fund.
The Focus Fund’s outperformance during the six months ended March 31, 2018, as compared to the S&P 500 Index, was primarily attributable to certain Fund holdings in the Consumer Discretionary and Information Technology sectors, as defined in the Global Industry Classification Standard (“GICS”)(2).
Stock prices of two Consumer Discretionary companies held by the Fund performed strongly during the reporting period. Streaming content provider Netflix, Inc. returned +63% and was the largest positive contributor during the period. The company has continued to penetrate the growing market of streaming content and, in our opinion, is adopting the right strategy in building content as rapidly as possible. Recently, Netflix has begun increasing subscription prices as well, hence improving already high operating margins. The current management team, headed by Reed Hastings and Ted Sarandos, has been extremely successful in securing great talent and high-quality content, and we believe it has the right strategy for continued success.
Online e-commerce platform Amazon.com, Inc. was also a strong positive contributor during the period, returning +51%. Amazon continues to benefit from consumers’ preference to shop online, and has been adding new features to its Prime membership offering, leading to substantial growth. Advertising and cloud computing remain large opportunities for the company.
Several of the Fund’s Information Technology holdings rose during the period, including semiconductor company NVIDIA Corporation (+28%) and customer relationship software maker salesforce.com, inc. (+24%). NVIDIA has become “the” platform for parallel processing (various calculations run at the same time rather than in sequential order) due to its leadership in artificial intelligence and graphics-related hardware and software, as well as its proprietary CUDA language. CUDA was developed 12 years ago by NVIDIA, and is the underlying architecture on all of NVIDIA’s graphics processors. This investment has established CUDA as the language of choice in the developer community, and in the top computer science universities in the US, and around the world. In addition, NVIDIA chips have become essential to render computer game graphics and to train neural networks. In turn, gaming sales are benefitting from an expanding list of immersive video games with rich graphics, in addition to a growing user base, all of which benefit NVIDIA.
7
Customer relationship software maker salesforce.com (also referred to as “CRM”) was a strong performer during the period as the pace of new business acquisition continues to accelerate. This resulted in better growth than expected across the primary metrics we track during the company’s fiscal fourth quarter. Deferred revenue, unbilled revenue, calculated bookings and total backlog all grew 30%+ year over year, illustrating the strength of the demand environment and CRM’s dominant position in facilitating digital transformation for businesses. CRM’s total backlog of booked business now sits at $20.3B, which we believe should help CRM achieve compounded growth of 20%+ over the next 4 years and a doubling of the company’s revenue.
The Fund initiated several new positions during the period. We acquired a position in Tencent Holdings Ltd. (-1%) in March largely due to our belief that the company is in the early stages of monetizing its WeChat asset. With over 1 billion users on the platform, WeChat appears likely to drive significant revenue for Tencent through advertising, cloud, and gaming services faster than expectations given management’s demonstrated ability to extract significant profits from scaled assets.
The Fund also purchased shares of computer software company Adobe Systems, Inc. (+11%). Adobe has executed well recently, and has witnessed a positive inflection in new subscribers to its software, which we believe reflects a trend of increasing corporate budgets allocated to improving business software.
Crown Castle International Corp. (+6%) (“CCI”) also was added to the Fund during the period. CCI is classified as a real estate stock, but we purchased the stock because of the company’s cellular tower business, as we seek to gain exposure to the explosion in data growth and spending associated with telecom investment. Additionally, CCI continues to make investments in fiber and small cell assets to get ahead of the coming 5G (5th generation wireless technology) transition. We believe 5G-impacted companies like CCI initially should benefit from carriers looking to improve mobile data speeds, but later should also benefit from the “Internet of Things” and autonomous driving. Last, CCI is a solid grower of earnings, generates a sizable dividend, and is a defensive-minded stock which complements the Fund’s Information Technology positions.
From a sector allocation perspective, the Fund’s performance was boosted by having an overweight exposure to the Information Technology sector – one of the strongest-performing sectors of the S&P 500 Index during the period. When put in historical context, we don’t believe valuations for the Information Technology sector to be stretched at these levels, especially when considered through the lens of future earnings growth rates. We also continue to believe in the management teams and long-term business models of many of these innovative companies. In addition, Fund performance was aided by an underweight allocation on average to the weak-performing Real Estate sector and no exposure to the Telecommunication Services and Utilities sectors.
A few positions in the Health Care sector didn’t perform as we anticipated and were sold during the period. Celgene Corporation (-33% prior to being sold) halted a drug trial on one product and struggled with another lead product for psoriatic arthritis, which caused us to sell the position. Merck & Co., Inc. (-15% prior to being sold) experienced a recent setback for its lung cancer drug Keytruda which led to Merck’s losing its lead in the lung cancer treatment market.
The sole position in the Energy sector, Schlumberger Ltd. (-16%) slid during the period the Fund held it and was sold to rotate to other ideas where we see longer term upside.
From a sector allocation perspective, the Fund was held back slightly relative to its benchmark index by having an underweight allocation to the Financials sector, and by having a 3% average cash weight during the period.
During the reporting period, the Fund reduced its exposure to the Health Care, Consumer Staples and Consumer Discretionary sectors. The Fund added a position in the Real Estate sector, and increased its allocations to the Financials and Information Technology sectors. There were no significant changes to the Fund’s allocations to the Materials and Industrials sectors.
8
Fiscal Period-End Investment Posture
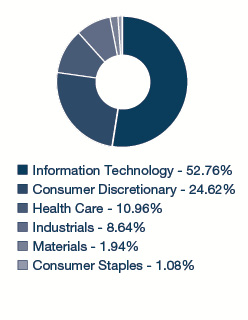
As of March 31, 2018, the Fund’s largest sector allocations included Information Technology, Consumer Discretionary, and Health Care. As of that date, the Fund had no exposure to the Energy, Telecommunication Services or Utilities sectors.
Sincerely,
THOMAS F. MARSICO
PORTFOLIO MANAGER
(1) | Total returns are based on net change in net asset value assuming reinvestment of distributions. Please see the Prospectus for more information. |
(2) | Regarding GICS data cited throughout this report, the Global Industry Classification Standard (“GICS”) was developed by and is the exclusive property and service mark of MSCI Inc. (“MSCI”) and Standard & Poor’s (“S&P”) and is licensed for use by Marsico Capital Management, LLC (the “Adviser”). Neither MSCI, S&P, nor the Adviser or any third party involved in compiling GICS makes any express or implied warranties or representations with respect to such standard or classification (or the results from use thereof), and all such parties hereby expressly disclaim all warranties of originality, accuracy, completeness, merchantability and fitness for a particular purpose with respect to any such standard or classification. MSCI, S&P, the Adviser, and any of their affiliates or third parties involved in compiling GICS shall not have any liability for any direct, indirect, special, punitive, consequential or any other damages (including lost profits) even if notified of the possibility of such damages. |
9
March 31, 2018 (Unaudited)
The Focus Fund is a non-diversified portfolio and invests primarily in the common stocks of large companies that are selected for their long-term growth potential. The Fund will normally hold a core position of between 20 and 35 common stocks.
TOTAL ANNUAL OPERATING EXPENSES* 1.33% | NET ASSETS $567,552,658 | NET ASSET VALUE PER SHARE $18.19 |
GROWTH OF $10,000(1) | PERFORMANCE COMPARISON |
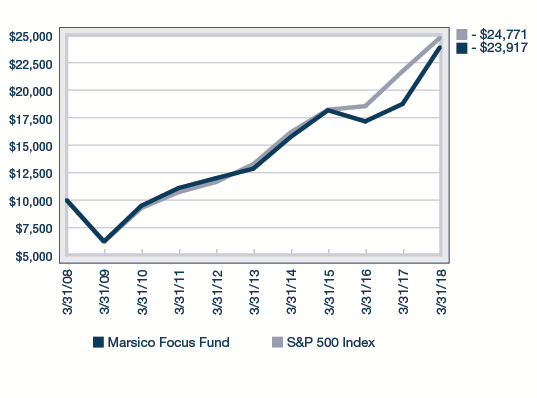
| 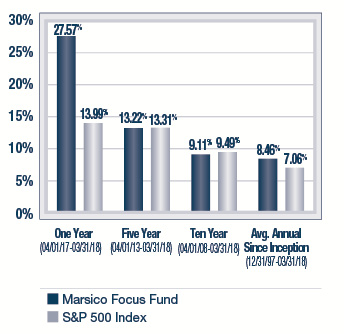
|
SECTOR ALLOCATION(2) | TOP FIVE HOLDINGS |
| | | | |
| | Alibaba Group Holding Ltd. Spon. ADR | 7.36% | |
| | Amazon.com, Inc. | 6.31% | |
| | Visa, Inc. - Cl. A | 5.89% | |
| | Netflix, Inc. | 5.70% | |
| | salesforce.com, inc. | 5.65% | |
| | | | |
* | The Total Annual Operating Expenses are reflective of the information disclosed in the Funds’ Prospectus dated January 31, 2018 and may differ from the expense ratio disclosed in this report. |
| The performance data quoted here represent past performance, and past performance is not a guarantee of future results. Investment return and principal value of an investment will fluctuate so that an investor’s shares, when redeemed, may be worth more or less than their original cost. Current performance may be lower or higher than the performance information quoted. To obtain performance information current to the most recent month-end, please call 888-860-8686 or visit marsicofunds.com. |
| The performance included in the chart and graph does not reflect the deduction of taxes on Fund distributions or the redemption of Fund shares. |
| All indices are unmanaged and investors cannot invest directly in an index. |
(1) | This chart assumes an initial investment of $10,000 made on March 31, 2008. Total returns are based on net change in NAV, assuming reinvestment of distributions. |
(2) | Sector weightings represent the percentage of the Fund’s investments (excluding cash equivalents) in certain general sectors. These sectors may include more than one industry. The Fund’s portfolio composition is subject to change at any time. |
10
MARSICO FOCUS FUND
SCHEDULE OF INVESTMENTS
March 31, 2018 (Unaudited)
| | | Number
of
Shares | | | Value | | | Percent
of Net
Assets | |
| COMMON STOCKS | | | | | | | | | |
| Aerospace & Defense | | | | | | | | | |
| Lockheed Martin Corporation | | | 57,426 | | | $ | 19,405,968 | | | | 3.42 | % |
| | | | | | | | | | | | | |
| Application Software | | | | | | | | | | | | |
| Adobe Systems, Inc.* | | | 82,958 | | | | 17,925,565 | | | | 3.16 | |
| salesforce.com, inc.* | | | 275,963 | | | | 32,094,497 | | | | 5.65 | |
| | | | | | | | 50,020,062 | | | | 8.81 | |
| Biotechnology | | | | | | | | | | | | |
| Vertex Pharmaceuticals, Inc.* | | | 160,623 | | | | 26,178,337 | | | | 4.61 | |
| | | | | | | | | | | | | |
| Data Processing & Outsourced Services | | | | | | | | | | | | |
| PayPal Holdings, Inc.* | | | 392,462 | | | | 29,776,092 | | | | 5.24 | |
| Visa, Inc. - Cl. A | | | 279,338 | | | | 33,414,411 | | | | 5.89 | |
| | | | | | | | 63,190,503 | | | | 11.13 | |
| Distillers & Vintners | | | | | | | | | | | | |
| Constellation Brands, Inc. - Cl. A | | | 84,218 | | | | 19,194,967 | | | | 3.38 | |
| | | | | | | | | | | | | |
| Diversified Banks | | | | | | | | | | | | |
| JPMorgan Chase & Co. | | | 226,076 | | | | 24,861,578 | | | | 4.38 | |
| | | | | | | | | | | | | |
| Financial Exchanges & Data | | | | | | | | | | | | |
| Intercontinental Exchange, Inc. | | | 143,778 | | | | 10,426,781 | | | | 1.84 | |
| | | | | | | | | | | | | |
| Internet & Direct Marketing Retail | | | | | | | | | | | | |
| Amazon.com, Inc.* | | | 24,741 | | | | 35,808,639 | | | | 6.31 | |
| Netflix, Inc.* | | | 109,603 | | | | 32,371,246 | | | | 5.70 | |
| | | | | | | | 68,179,885 | | | | 12.01 | |
| Internet Software & Services | | | | | | | | | | | | |
| Alibaba Group Holding Ltd. Spon. ADR* | | | 227,753 | | | | 41,801,785 | | | | 7.36 | |
| Alphabet, Inc. - Cl. A* | | | 23,998 | | | | 24,889,286 | | | | 4.39 | |
| Facebook, Inc. - Cl. A* | | | 128,600 | | | | 20,548,994 | | | | 3.62 | |
| Tencent Holdings Ltd. | | | 216,400 | | | | 11,616,252 | | | | 2.05 | |
| | | | | | | | 98,856,317 | | | | 17.42 | |
| Managed Health Care | | | | | | | | | | | | |
| Anthem, Inc. | | | 86,087 | | | | 18,913,314 | | | | 3.33 | |
| UnitedHealth Group, Inc. | | | 126,112 | | | | 26,987,968 | | | | 4.76 | |
| | | | | | | | 45,901,282 | | | | 8.09 | |
| Regional Banks | | | | | | | | | | | | |
| First Republic Bank | | | 185,099 | | | | 17,142,018 | | | | 3.02 | |
| | | | | | | | | | | | | |
| Restaurants | | | | | | | | | | | | |
| Domino's Pizza Enterprises Ltd. | | | 177,990 | | | | 5,735,250 | | | | 1.01 | |
| | | | | | | | | | | | | |
| Semiconductor Equipment | | | | | | | | | | | | |
| Applied Materials, Inc. | | | 507,164 | | | | 28,203,390 | | | | 4.97 | |
| | | | | | | | | | | | | |
| Semiconductors | | | | | | | | | | | | |
| NVIDIA Corporation | | | 94,796 | | | | 21,953,806 | | | | 3.87 | |
| | | | | | | | | | | | | |
| Specialized REITs | | | | | | | | | | | | |
| Crown Castle International Corp. | | | 162,412 | | | | 17,801,979 | | | | 3.14 | |
| | | | | | | | | | | | |
| Specialty Chemicals | | | | | | | | | | | | |
| The Sherwin-Williams Company | | | 52,220 | | | $ | 20,476,506 | | | | 3.61 | % |
| | | | | | | | | | | | | |
| Technology Hardware, Storage & Peripherals | | | | | | | | | | | | |
| Apple, Inc. | | | 139,221 | | | | 23,358,499 | | | | 4.12 | |
| | | | | | | | | | | | | |
| TOTAL COMMON STOCKS | | | | | | | | | | | | |
| (Cost $364,876,881) | | | | | | | 560,887,128 | | | | 98.83 | |
| | | | | | | | | | | | | |
| SHORT-TERM INVESTMENTS | | | | | | | | | | | | |
| State Street Institutional U.S. Government Money Market Fund, 0.018% | | | 11,029,309 | | | | 11,029,309 | | | | 1.94 | |
| | | | | | | | | | | | | |
| TOTAL SHORT-TERM INVESTMENTS | | | | | | | | | | | | |
| (Cost $11,029,309) | | | | | | | 11,029,309 | | | | 1.94 | |
| | | | | | | | | | | | | |
| TOTAL INVESTMENTS | | | | | | | | | | | | |
| (Cost $375,906,190) | | | | | | | 571,916,437 | | | | 100.77 | |
| | | | | | | | | | | | | |
| Liabilities, Less Cash and Other Assets | | | | | | | (4,363,779 | ) | | | (0.77 | ) |
| | | | | | | | | | | | | |
| NET ASSETS | | | | | | $ | 567,552,658 | | | | 100.00 | % |
| See notes to financial statements. |
11
INVESTMENT REVIEW BY TOM MARSICO (UNAUDITED)
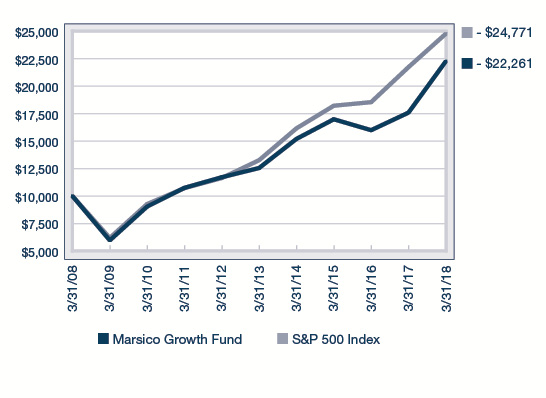
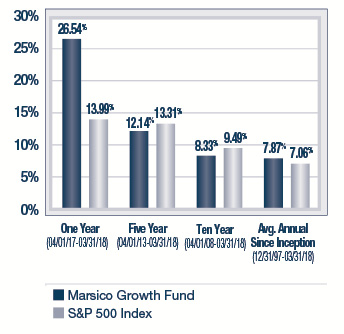
The Marsico Growth Fund posted a total return of +11.20% for the six-month fiscal period ended March 31, 2018. The Fund substantially outperformed the S&P 500 Index, the Fund’s benchmark index, which had a total return of +5.84% over the same time period. Please see the Fund’s Overview for more detailed information about the Fund’s longer-term performance for various time periods ended March 31, 2018.
The performance data for the Fund quoted here represent past performance, and past performance is not a guarantee of future results. Investment return and principal value of an investment will fluctuate so that an investor’s shares, when redeemed, may be worth more or less than their original cost. Current performance may be lower or higher than the performance information quoted. To obtain performance information current to the most recent month-end, please call 888-860-8686 or visit marsicofunds.com.(1)
This review highlights Fund performance over a six-month fiscal period. Shareholders should keep in mind that the Fund is intended for long-term investors who hold their shares for substantially longer periods of time. You should also keep in mind that our current views and beliefs regarding all investments discussed in this report are subject to change at any time. References to specific securities, industries, and sectors discussed in this report are not recommendations to buy or sell such securities or related investments, and the Fund may not necessarily hold these securities or investments today. Please see the accompanying Schedule of Investments for the percentage of the Fund’s portfolio represented by the securities mentioned in this report as of the end of the reporting period.
The Fund is subject to broad risks associated with investing in equity securities markets generally, including the risks that the securities and markets in which it invests may experience volatility and instability, that domestic and global economies and markets may undergo periods of cyclical change and decline, that investors may at times avoid investments in equity securities, and that investments may not perform as anticipated. Please see the Prospectus for more information.
The Fund is not managed to track the benchmark index, and may hold a substantially overweight or underweight position in a sector, industry, or security compared to its weight in the benchmark. The Fund may be subject to risks associated with a particular sector or other area in which it is overweight, including the risk that the stocks of companies within one area could simultaneously decline in price because of an event that affects the entire area. For informational purposes, the discussion below may compare the benchmark weight or performance of a sector or industry to the investment approach of the Fund.
The Growth Fund’s outperformance during the six months ended March 31, 2018, as compared to the S&P 500 Index, was primarily attributable to certain Fund holdings in the Consumer Discretionary, Information Technology and Industrials sectors.
Stock prices of two Consumer Discretionary companies held by the Fund performed strongly during the reporting period. Streaming content provider Netflix, Inc. returned +62% and was a large positive contributor during the period. The company has continued to penetrate the growing market of streaming content and, in our opinion, is adopting the right strategy in building content as rapidly as possible. Recently, Netflix has begun increasing subscription prices as well, hence improving already high operating margins. The current management team, headed by Reed Hastings and Ted Sarandos, has been extremely successful in securing great talent and high-quality content, and we believe it has the right strategy for continued success.
Online e-commerce platform Amazon.com, Inc. was also a strong positive contributor during the period, returning +51%. Amazon continues to benefit from consumers’ preference to shop online, and has been adding new features to its Prime membership offering, leading to substantial growth. Advertising and cloud computing remain large opportunities for the company.
Several of the Fund’s Information Technology holdings rose during the period, including semiconductor company NVIDIA Corporation (+31%) and customer relationship software maker salesforce.com, inc. (+24%). NVIDIA has become “the” platform for parallel processing (various calculations run at the same time rather than in sequential order) due to its leadership in artificial intelligence and graphics-related hardware and software, as well as its proprietary CUDA language. CUDA was developed 12 years ago by NVIDIA, and is the underlying architecture on all of NVIDIA’s graphics processors. This investment has established CUDA as the language of choice in the developer community, and in the top computer science universities in the US, and around the world. In addition, NVIDIA chips have become essential to render computer game graphics and to train neural networks. In turn, gaming sales are benefitting from an expanding list of immersive video games with rich graphics, in addition to a growing user base, all of which benefit NVIDIA.
Customer relationship software maker salesforce.com (also referred to as “CRM”) was a strong performer during the period as the pace of new business acquisition continues to accelerate. This resulted in better growth than expected across the primary metrics we track during the company’s fiscal fourth quarter. Deferred revenue, unbilled revenue, calculated bookings and
12
total backlog all grew 30%+ year over year, illustrating the strength of the demand environment and CRM’s dominant position in facilitating digital transformation for businesses. CRM’s total backlog of booked business now sits at $20.3B, which we believe should help CRM achieve compounded growth of 20%+ over the next 4 years and a doubling of the company’s revenue.
Another Software & Services industry group, computer software company Adobe Systems, Inc. (+45%), was a top positive contributor. Adobe has executed well recently, and has witnessed a positive inflection in new subscribers to its software, which we believe reflects a trend of increasing corporate budgets allocated to improving business software.
Animal health company Zoetis, Inc. (+31%) performed well given the overall favorable trends in both its companion animal health business and its livestock business. In the companion animal business, the company continues to innovate in the treatment of animals, with strength driven by its new product launches in dermatology treatments known as Apoquel and Cytopoint. The uptake for these products has continued to exceed investors’ expectations. For livestock, trends continue to improve as the US is experiencing a recovery in the cattle market and the international markets are experiencing increased growth in both the cattle and swine markets.
From a portfolio positioning standpoint, JPMorgan Chase & Co. (+8%) (“JPM”) was added to the Growth Fund during the period to increase exposure to the Financials sector with a high-quality bank that we expect should continue to compound its earnings. It represents a blue-chip company that appears to offer significant growth potential over the medium to long-term period. First, JPM is an earnings growth and capital return story among large financials, as it continues to take market share across its business units and is starting to level off on its regulatory spending, thereby allowing for more profit to be returned to shareholders. We expect EPS (earnings-per-share) growth in double digits over the next several years. Second, JPM is highly rate-sensitive in benefiting from higher interest rates. As the Federal Reserve looks to raise interest rates several times in 2018, JPM is positioned to be a natural beneficiary. Finally, JPM has a high corporate tax rate, and we believe it will be a strong beneficiary of tax reforms which have lowered that rate for 2018.
From a sector allocation perspective, the Fund’s performance was boosted by having an overweight exposure to the Information Technology sector – one of the strongest-performing sectors of the S&P 500 Index during the period. When put in historical context, we don’t believe valuations for the Information Technology sector to be stretched at these levels, especially when considered through the lens of future earnings growth rates. We also continue to believe in the management teams and long-term business models of many of these innovative companies. In addition, Fund performance was aided by an underweight allocation to the weak-performing Consumer Staples sector and no exposure to the Energy and Utilities sectors.
A few positions in the Health Care sector didn’t perform as we anticipated – Celgene Corporation (-33% prior to being sold), Merck & Co., Inc. (-15% prior to being sold) and Amgen, Inc. (-7%). In particular, Celgene Corporation halted a drug trial on one product and struggled with another lead product for psoriatic arthritis, which caused us to sell the position. Merck & Co., Inc. experienced a recent setback for its lung cancer drug Keytruda which led to Merck’s losing its lead in the lung cancer treatment market.
One position in the Financials sector, First Republic Bank (-11%) was weak during the period. First Republic trades at a higher price/earnings multiple than its peers, is less rate sensitive than other banks (such as JPM), and may benefit less from tax reform than some competitors. Still, we continue to like First Republic as a mid-size consumer bank that may achieve long-term growth through exceptional customer service, including in prospering technology-focused markets. For example, First Republic may attract desirable clients from larger banks by initially offering mortgage banking relationships, and then cross-selling wealth management and other services.
From a sector allocation perspective, the Fund was held back slightly relative to its benchmark index by having an underweight allocation on average to the Financials sector, and by having an overweight stance in the Health Care sector.
During the reporting period, the Fund reduced its exposure to the Health Care and Consumer Staples sectors. The Fund increased its allocations to the Consumer Discretionary, Financials and Information Technology sectors. There were no significant changes to the Fund’s allocations to the Industrials, Real Estate and Materials sectors.
13
Fiscal Period-End Investment Posture
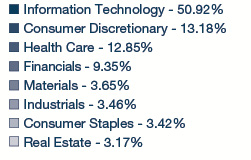
As of March 31, 2018, the Fund’s largest sector allocations included Information Technology, Health Care, Consumer Discretionary, and Financials. As of that date, the Fund had no exposure to the Energy, Telecommunication Services or Utilities sectors.
Sincerely,
THOMAS F. MARSICO
PORTFOLIO MANAGER
| (1) | Total returns are based on net change in net asset value assuming reinvestment of distributions. Please see the Prospectus for more information. |
14
March 31, 2018 (Unaudited)
The Growth Fund is a diversified portfolio and invests primarily in the common stocks of large companies that are selected for their long-term growth potential. The Growth Fund will normally hold a core position of between 35 and 50 common stocks.
TOTAL ANNUAL OPERATING EXPENSES* 1.37% | NET ASSETS $271,396,855 | NET ASSET VALUE PER SHARE $18.69 |
GROWTH OF $10,000(1) | PERFORMANCE COMPARISON |
| 
|
SECTOR ALLOCATION(2) | TOP FIVE HOLDINGS |
| | | | |
| | Amazon.com, Inc. | 4.94% | |
| | Alibaba Group Holding Ltd. Spon. ADR | 4.86% | |
| | Adobe Systems, Inc. | 4.36% | |
| | Visa, Inc. - Cl. A | 3.99% | |
| | salesforce.com, inc. | 3.90% | |
| | | | |
* | The Total Annual Operating Expenses are reflective of the information disclosed in the Funds’ Prospectus dated January 31, 2018 and may differ from the expense ratio disclosed in this report. |
| The performance data quoted here represent past performance, and past performance is not a guarantee of future results. Investment return and principal value of an investment will fluctuate so that an investor’s shares, when redeemed, may be worth more or less than their original cost. Current performance may be lower or higher than the performance information quoted. To obtain performance information current to the most recent month-end, please call 888-860-8686 or visit marsicofunds.com. |
| The performance included in the chart and graph does not reflect the deduction of taxes on Fund distributions or the redemption of Fund shares. |
| All indices are unmanaged and investors cannot invest directly in an index. |
(1) | This chart assumes an initial investment of $10,000 made on March 31, 2008. Total returns are based on net change in NAV, assuming reinvestment of distributions. |
(2) | Sector weightings represent the percentage of the Fund’s investments (excluding cash equivalents) in certain general sectors. These sectors may include more than one industry. The Fund’s portfolio composition is subject to change at any time. |
15
MARSICO GROWTH FUND
SCHEDULE OF INVESTMENTS
March 31, 2018 (Unaudited)
| | | Number
of
Shares | | | Value | | | Percent
of Net
Assets | |
| COMMON STOCKS | | | | | | | | | |
| Aerospace & Defense | | | | | | | | | |
| Lockheed Martin Corporation | | | 25,976 | | | $ | 8,778,070 | | | | 3.23 | % |
| Raytheon Company | | | 31,428 | | | | 6,782,791 | | | | 2.50 | |
| | | | | | | | 15,560,861 | | | | 5.73 | |
| Application Software | | | | | | | | | | | | |
| Adobe Systems, Inc.* | | | 54,800 | | | | 11,841,184 | | | | 4.36 | |
| salesforce.com, inc.* | | | 90,863 | | | | 10,567,367 | | | | 3.90 | |
| | | | | | | | 22,408,551 | | | | 8.26 | |
| Biotechnology | | | | | | | | | | | | |
| Amgen, Inc. | | | 47,266 | | | | 8,057,908 | | | | 2.97 | |
| G1 Therapeutics, Inc.* | | | 68,948 | | | | 2,554,523 | | | | 0.94 | |
| | | | | | | | 10,612,431 | | | | 3.91 | |
| Data Processing & Outsourced Services | | | | | | | | | | | | |
| PayPal Holdings, Inc.* | | | 106,064 | | | | 8,047,076 | | | | 2.97 | |
| Visa, Inc. - Cl. A | | | 90,543 | | | | 10,830,753 | | | | 3.99 | |
| | | | | | | | 18,877,829 | | | | 6.96 | |
| Distillers & Vintners | | | | | | | | | | | | |
| Constellation Brands, Inc. - Cl. A | | | 33,546 | | | | 7,645,804 | | | | 2.82 | |
| | | | | | | | | | | | | |
| Diversified Banks | | | | | | | | | | | | |
| JPMorgan Chase & Co. | | | 67,673 | | | | 7,442,000 | | | | 2.74 | |
| | | | | | | | | | | | | |
| Financial Exchanges & Data | | | | | | | | | | | | |
| Intercontinental Exchange, Inc. | | | 57,579 | | | | 4,175,629 | | | | 1.54 | |
| | | | | | | | | | | | | |
| Health Care Services | | | | | | | | | | | | |
| Laboratory Corporation of America Holdings* | | | 34,930 | | | | 5,649,927 | | | | 2.08 | |
| | | | | | | | | | | | | |
| Home Entertainment Software | | | | | | | | | | | | |
| Take-Two Interactive Software, Inc.* | | | 30,982 | | | | 3,029,420 | | | | 1.12 | |
| | | | | | | | | | | | | |
| Hotel & Resort REITs | | | | | | | | | | | | |
| MGM Growth Properties LLC - Cl. A | | | 103,079 | | | | 2,735,717 | | | | 1.01 | |
| | | | | | | | | | | | | |
| Hotels, Resorts & Cruise Lines | | | | | | | | | | | | |
| Norwegian Cruise Line Holdings Ltd.* | | | 104,541 | | | | 5,537,537 | | | | 2.04 | |
| | | | | | | | | | | | | |
| Internet & Direct Marketing Retail | | | | | | | | | | | | |
| Amazon.com, Inc.* | | | 9,266 | | | | 13,411,053 | | | | 4.94 | |
| Netflix, Inc.* | | | 35,612 | | | | 10,518,004 | | | | 3.88 | |
| | | | | | | | 23,929,057 | | | | 8.82 | |
| Internet Software & Services | | | | | | | | | | | | |
| Alibaba Group Holding Ltd. Spon. ADR* | | | 71,873 | | | $ | 13,191,570 | | | | 4.86 | % |
| Alphabet, Inc. - Cl. A* | | | 9,493 | | | | 9,845,570 | | | | 3.63 | |
| Facebook, Inc. - Cl. A* | | | 43,577 | | | | 6,963,169 | | | | 2.57 | |
| Tencent Holdings Ltd. | | | 149,400 | | | | 8,019,723 | | | | 2.95 | |
| | | | | | | | 38,020,032 | | | | 14.01 | |
| Investment Banking & Brokerage | | | | | | | | | | | | |
| The Charles Schwab Corporation | | | 99,291 | | | | 5,184,976 | | | | 1.91 | |
| | | | | | | | | | | | | |
| Managed Health Care | | | | | | | | | | | | |
| Anthem, Inc. | | | 23,056 | | | | 5,065,403 | | | | 1.86 | |
| UnitedHealth Group, Inc. | | | 35,115 | | | | 7,514,610 | | | | 2.77 | |
| | | | | | | | 12,580,013 | | | | 4.63 | |
| Multi-Sector Holdings | | | | | | | | | | | | |
| Berkshire Hathaway, Inc. - Cl. B* | | | 28,564 | | | | 5,697,947 | | | | 2.10 | |
| | | | | | | | | | | | | |
| Pharmaceuticals | | | | | | | | | | | | |
| Zoetis, Inc. | | | 94,413 | | | | 7,884,429 | | | | 2.90 | |
| | | | | | | | | | | | | |
| Regional Banks | | | | | | | | | | | | |
| First Republic Bank | | | 57,608 | | | | 5,335,077 | | | | 1.97 | |
| | | | | | | | | | | | | |
| Semiconductor Equipment | | | | | | | | | | | | |
| Applied Materials, Inc. | | | 127,624 | | | | 7,097,171 | | | | 2.61 | |
| | | | | | | | | | | | | |
| Semiconductors | | | | | | | | | | | | |
| NVIDIA Corporation | | | 41,027 | | | | 9,501,443 | | | | 3.50 | |
| | | | | | | | | | | | | |
| Specialized REITs | | | | | | | | | | | | |
| Crown Castle International Corp. | | | 80,646 | | | | 8,839,608 | | | | 3.26 | |
| | | | | | | | | | | | | |
| Specialty Chemicals | | | | | | | | | | | | |
| The Sherwin-Williams Company | | | 17,682 | | | | 6,933,466 | | | | 2.55 | |
| | | | | | | | | | | | | |
| Specialty Stores | | | | | | | | | | | | |
| Ulta Beauty, Inc.* | | | 16,526 | | | | 3,375,766 | | | | 1.24 | |
| | | | | | | | | | | | | |
| Technology Hardware, Storage & Peripherals |
| Apple, Inc. | | | 56,960 | | | | 9,556,749 | | | | 3.52 | |
| | | | | | | | | | | | | |
| TOTAL COMMON STOCKS | | | | | | | | | | | | |
| (Cost $154,327,560) | | | | | | | 247,611,440 | | | | 91.23 | |
| See notes to financial statements. |
16
| | | Number
of
Shares | | | Value | | | Percent
of Net
Assets | |
| SHORT-TERM INVESTMENTS | | | |
| State Street Institutional Treasury Money Market Fund, 0.017% | | | 25,642,947 | | | $ | 25,642,947 | | | | 9.45 | % |
| | | | | | | | | | | | | |
| TOTAL SHORT-TERM INVESTMENTS | | | | | | | | | | | | |
| (Cost $25,642,947) | | | | | | | 25,642,947 | | | | 9.45 | |
| | | | | | | | | | | | | |
| TOTAL INVESTMENTS | | | | | | | | | | | | |
| (Cost $179,970,507) | | | | | | | 273,254,387 | | | | 100.68 | |
| | | | | | | | | | | | | |
| Liabilities, Less Cash and Other Assets | | | | | | | (1,857,532 | ) | | | (0.68 | ) |
| | | | | | | | | | | | | |
| NET ASSETS | | | | | | $ | 271,396,855 | | | | 100.00 | % |
| See notes to financial statements. |
17
INVESTMENT REVIEW BY BRANDON GEISLER (UNAUDITED)
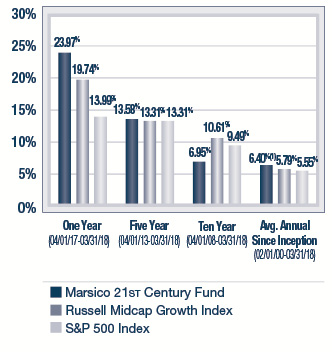
The Marsico 21st Century Fund posted a total return of +11.57% for the six-month fiscal period ended March 31, 2018. The Fund substantially outperformed the S&P 500 Index, the Fund’s primary benchmark index at the beginning of the period, which had a total return of +5.84% over the same time period. The Russell Midcap Growth Index, a proxy for the performance of medium-capitalization US equity securities (which may be a useful comparison in light of the Fund’s current medium-capitalization positioning), became the primary benchmark for the Fund effective January 31, 2018, and had a total return of +9.13% during the six-month fiscal period. Please see the Fund’s Overview for more detailed information about the Fund’s longer-term performance for various time periods ended March 31, 2018.
The performance data for the Fund quoted here represent past performance, and past performance is not a guarantee of future results. Investment return and principal value of an investment will fluctuate so that an investor’s shares, when redeemed, may be worth more or less than their original cost. Current performance may be lower or higher than the performance information quoted. To obtain performance information current to the most recent month-end, please call 888-860-8686 or visit marsicofunds.com.(1)
This review highlights Fund performance over a six-month fiscal period. Shareholders should keep in mind that the Fund is intended for long-term investors who hold their shares for substantially longer periods of time. You should also keep in mind that our current views and beliefs regarding all investments discussed in this report are subject to change at any time. References to specific securities, industries, and sectors discussed in this report are not recommendations to buy or sell such securities or related investments, and the Fund may not necessarily hold these securities or investments today. Please see the accompanying Schedule of Investments for the percentage of the Fund’s portfolio represented by the securities mentioned in this report as of the end of the reporting period.
The Fund is subject to broad risks associated with investing in equity securities markets generally, including the risks that the securities and markets in which it invests may experience volatility and instability, that domestic and global economies and markets may undergo periods of cyclical change and decline, that investors may at times avoid investments in equity securities, and that investments may not perform as anticipated. Please see the Prospectus for more information.
The Fund is not managed to track the benchmark index, and may hold a substantially overweight or underweight position in a sector, industry, or security compared to its weight in the benchmark. The Fund may be subject to risks associated with a particular sector or other area in which it is overweight, including the risk that the stocks of companies within one area could simultaneously decline in price because of an event that affects the entire area. For informational purposes, the discussion below may compare the benchmark weight or performance of a sector or industry to the investment approach of the Fund.
The 21st Century Fund’s outperformance during the six-month period ended March 31, 2018 as compared to the Russell Midcap Growth Index was primarily attributable to certain holdings in the Consumer Discretionary and Information Technology sectors.
Stock prices of several Consumer Discretionary companies performed strongly during the reporting period, primarily in the Retailing industry group. One Consumer Discretionary company, streaming content provider Netflix, Inc. returned +63% and was a large positive contributor during the period. The company has continued to penetrate the growing market of streaming content and, in our opinion, is adopting the right strategy in building content as rapidly as possible. Recently, Netflix has begun increasing subscription prices as well, hence improving already high operating margins. The current management team, headed by Reed Hastings and Ted Sarandos, has been extremely successful in securing great talent and high-quality content, and we believe it has the right strategy for continued success.
Retailer Burlington Stores, Inc. (+39%) outperformed during the period, driven by continued momentum in sales trends, improving new store economics, strong operational execution, and effective capital deployment. Looking ahead, we anticipate continued strong execution as the company continues to close the operating performance gap with competitors.
Several of the Fund’s Information Technology holdings rose during the period, including computer software company Adobe Systems, Inc. (+44%). Adobe has executed well recently, and has witnessed a positive inflection in new subscribers to its software, which we believe reflects a trend of increasing corporate budgets allocated to improving business software.
Customer relationship software maker salesforce.com, inc. (+24%) (also referred to as “CRM”) was a strong performer during the period as the pace of new business acquisition continues to accelerate. This resulted in better growth than expected across the primary metrics we track during the company’s fiscal fourth quarter. Deferred revenue, unbilled revenue, calculated bookings and total backlog all grew 30%+ year over year, illustrating the strength of the demand environment and CRM’s
18
dominant position in facilitating digital transformation for businesses. CRM’s total backlog of booked business now sits at $20.3B, which we believe should help CRM achieve compounded growth of 20%+ over the next 4 years and a doubling of the company’s revenue.
A holding in the Industrials sector, CoStar Group, Inc. (+36%), performed well. CoStar is a real estate data and analytics company and is also the owner of Apartments.com, the largest online listing site for apartment rentals. CoStar reworked its sales team and process last year and is now seeing the effect as cross-sales of real estate analytics are accelerating. The stock appears to have a potentially huge global runway ahead of it.
From a positioning standpoint, there were limited new additions to the portfolio during the period. One new position was semiconductor company Lam Research Corporation (-1%). Lam Research is a leading producer of equipment used to make semiconductors. The company has dominant market share in multi-million dollar tools that deposit materials on wafers and etch away unwanted materials. The company’s expertise is supported by substantial research and development, and Lam Research’s tools create features on silicon wafers at the precision of a nanometer (one billionth of a meter). Lam Research generates substantial cash flow and returns to shareholders with a healthy balance of dividend and share repurchases.
From a sector allocation perspective, the Fund’s performance was boosted by having no exposure to the Energy sector – one of the weakest-performing sectors of the Russell Midcap Growth Index during the period. We continue to believe the supply/demand dynamics for commodities such as oil don’t support higher prices, especially given the trend we have witnessed in China over the last several years, as the country transitions to a consumer-led economy and away from a construction and infrastructure focus.
A position in the Health Care sector didn’t perform as we anticipated during the period. Acadia Healthcare Company, Inc.’s performance (-18%) was impacted by the integration of Priory Group, a UK-based behavioral health facility. After the Priory Group deal closed, the newly-acquired UK facilities experienced weaker than expected patient census data as well as rising labor costs. This weaker performance led to Acadia’s reducing its 2017 revenues and EPS (earnings-per-share) guidance going forward.
One position in the Financials sector, First Republic Bank (-11%) was weak during the period. First Republic trades at a higher price/earnings multiple than its peers, is less rate sensitive than other banks, and may benefit less from tax reform than some competitors. Still, we continue to like First Republic as a mid-size consumer bank that may achieve long-term growth through exceptional customer service, including in prospering technology-focused markets. For example, First Republic may attract desirable clients from larger banks by initially offering mortgage banking relationships, and then cross-selling wealth management and other services.
From a sector allocation perspective, the Fund was held back relative to its benchmark index by maintaining a 6% average cash weight during the period, and was slightly impaired by having an overweight allocation to the Real Estate sector. A Fund occasionally may hold more cash than usual as a temporary defensive measure, or as a strategic measure enabling it to take rapid advantage of opportunities to buy stocks at favorable prices.
The 21st Century Fund experienced elevated portfolio turnover during the period, which primarily related to the Fund changing its portfolio composition to reinvest in other positions that we believe may have more upside potential, take advantage of new opportunities, and other portfolio management decisions. Increased portfolio turnover increases transaction-related expenses, which could reduce Fund returns. Increased portfolio turnover also may result in higher taxes when Fund shares are held in a taxable account.
During the reporting period, the Fund reduced its exposure to the Information Technology and Consumer Staples sectors and increased its allocation to the Industrials sector. There were no significant changes to the Fund’s allocations to the Health Care, Real Estate, Consumer Discretionary, Materials and Financials sectors.
19
Fiscal Period-End Investment Posture
As of March 31, 2018, the Fund’s primary economic sector allocations included Information Technology, Consumer Discretionary, Industrials and Health Care. The Fund had no investments in the Energy, Telecommunication Services or Utilities sectors.
Sincerely,
BRANDON A. GEISLER
PORTFOLIO MANAGER
| (1) | Total returns are based on net change in net asset value assuming reinvestment of distributions. Periodically, certain fees and expenses have been waived or reimbursed by the Adviser for the 21st Century Fund. In the absence of such a waiver or reimbursement, the performance returns reflected would have been reduced. In accordance with the expense limitation and fee waiver agreement, the Adviser may recoup fees and expenses previously waived or reimbursed under certain parameters. Periodically, the Adviser has recouped such fees or expenses from the 21st Century Fund, resulting in a lower performance return. Please see the Prospectus for more information. |
20
| 21st CENTURY FUND OVERVIEW |
March 31, 2018 (Unaudited)
The 21st Century Fund is a diversified portfolio and invests primarily in common stocks that are selected for their long-term growth potential. The Fund may invest in companies of any size. The portions of Fund assets invested in large-capitalization, medium-capitalization, or small-capitalization companies will vary based on market conditions, depending on the portfolio manager’s judgment as to how to achieve the Fund’s investment objective. Under current market conditions the portfolio manager expects to invest substantially in medium-capitalization companies. The Fund will normally hold a core position of between 35 and 60 common stocks.
TOTAL ANNUAL OPERATING EXPENSES* 1.36% | NET ASSETS $248,938,975 | NET ASSET VALUE PER SHARE $29.22 |
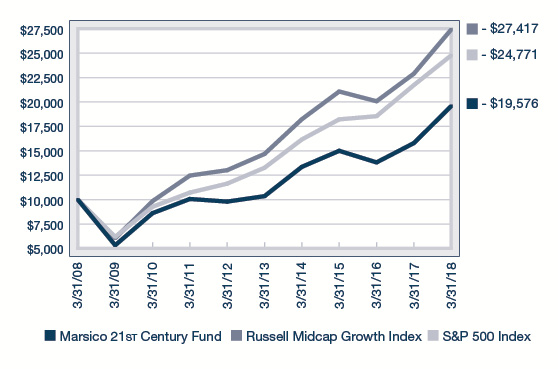
GROWTH OF $10,000(2) | PERFORMANCE COMPARISON |
| 
|
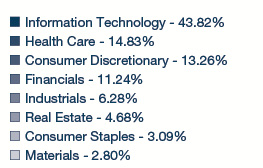
SECTOR ALLOCATION(3) | TOP FIVE HOLDINGS |
| | | | |
| | CoStar Group, Inc. | 3.25% | |
| | Mastercard, Inc. - Cl. A | 3.23% | |
| | salesforce.com, inc. | 3.17% | |
| | Intuitive Surgical, Inc. | 3.16% | |
| | Constellation Brands, Inc. - Cl. A | 3.05% | |
| | | | |
* | The Total Annual Operating Expenses are reflective of the information disclosed in the Funds’ Prospectus dated January 31, 2018 and may differ from the expense ratio disclosed in this report. |
| The performance data quoted here represent past performance, and past performance is not a guarantee of future results. Investment return and principal value of an investment will fluctuate so that an investor’s shares, when redeemed, may be worth more or less than their original cost. Current performance may be lower or higher than the performance information quoted. To obtain performance information current to the most recent month-end, please call 888-860-8686 or visit marsicofunds.com. |
| The performance included in the chart and graph does not reflect the deduction of taxes on Fund distributions or the redemption of Fund shares. |
| All indices are unmanaged and investors cannot invest directly in an index. |
| Effective January 31, 2018, the Russell Midcap Growth Index was made the primary benchmark index and the S&P 500 Index was made a supplemental benchmark index of the Fund because under current market conditions the Fund is invested substantially in medium-capitalization securities. The Russell Midcap Growth Index (the “Underlying Index”) measures the performance of the mid-capitalization growth sector of the US equity market, and is composed of mid-capitalization US equities that exhibit growth characteristics. It is a subset of the Russell Midcap® Index, which measures the performance of the mid-capitalization sector of the US equity market. The Underlying Index measures the performance of equity securities of Russell Midcap Index issuers with higher price-to-book ratios and higher forecasted growth. |
(1) | Periodically, certain fees and expenses have been waived or reimbursed by the Adviser for the 21st Century Fund. In the absence of such a waiver or reimbursement, the performance returns reflected would have been reduced. In accordance with the expense limitation and fee waiver agreement, the Adviser may recoup fees and expenses previously waived or reimbursed under certain parameters. Periodically, the Adviser has recouped such fees or expenses from the 21st Century Fund, resulting in a lower performance return. |
(2) | This chart assumes an initial investment of $10,000 made on March 31, 2008. Total returns are based on net change in NAV, assuming reinvestment of distributions. |
(3) | Sector weightings represent the percentage of the Fund’s investments (excluding cash equivalents) in certain general sectors. These sectors may include more than one industry. The Fund’s portfolio composition is subject to change at any time. |
21
MARSICO 21st CENTURY FUND
SCHEDULE OF INVESTMENTS
March 31, 2018 (Unaudited)
| | | Number
of
Shares | | | Value | | | Percent
of Net
Assets | |
| COMMON STOCKS | | | | | | | | | |
| Aerospace & Defense | | | | | | | | | |
| HEICO Corporation | | | 16,033 | | | $ | 1,391,825 | | | | 0.56 | % |
| | | | | | | | | | | | | |
| Airlines | | | | | | | | | | | | |
| Ryanair Holdings PLC Spon. ADR* | | | 32,718 | | | | 4,019,406 | | | | 1.61 | |
| | | | | | | | | | | | | |
| Apparel Retail | | | | | | | | | | | | |
| Burlington Stores, Inc.* | | | 48,805 | | | | 6,498,386 | | | | 2.61 | |
| | | | | | | | | | | | | |
| Application Software | | | | | | | | | | | | |
| Adobe Systems, Inc.* | | | 19,467 | | | | 4,206,429 | | | | 1.69 | |
| Atlassian Corporation PLC - Cl. A* | | | 39,927 | | | | 2,152,864 | | | | 0.87 | |
| Guidewire Software, Inc.* | | | 52,452 | | | | 4,239,695 | | | | 1.70 | |
| PTC, Inc.* | | | 71,905 | | | | 5,609,309 | | | | 2.25 | |
| salesforce.com, inc.* | | | 67,792 | | | | 7,884,210 | | | | 3.17 | |
| Snap, Inc. - Cl. A* | | | 105,099 | | | | 1,667,921 | | | | 0.67 | |
| The Descartes Systems Group, Inc.* | | | 107,200 | | | | 3,063,689 | | | | 1.23 | |
| | | | | | | | 28,824,117 | | | | 11.58 | |
| Automobile Manufacturers | | | | | | | | | | | | |
| Tesla, Inc.* | | | 5,823 | | | | 1,549,675 | | | | 0.62 | |
| | | | | | | | | | | | | |
| Automotive Retail | | | | | | | | | | | | |
| O'Reilly Automotive, Inc.* | | | 16,990 | | | | 4,202,986 | | | | 1.69 | |
| | | | | | | | | | | | | |
| Biotechnology | | | | | | | | | | | | |
| Alkermes PLC* | | | 59,843 | | | | 3,468,500 | | | | 1.39 | |
| Exact Sciences Corporation* | | | 24,717 | | | | 996,837 | | | | 0.40 | |
| | | | | | | | 4,465,337 | | | | 1.79 | |
| Construction Materials | | | | | | | | | | | | |
| Vulcan Materials Company | | | 40,483 | | | | 4,621,944 | | | | 1.86 | |
| | | | | | | | | | | | | |
| Data Processing & Outsourced Services | | | | | | | | | | | | |
| Broadridge Financial Solutions, Inc. | | | 55,281 | | | | 6,063,773 | | | | 2.44 | |
| FleetCor Technologies, Inc.* | | | 24,639 | | | | 4,989,398 | | | | 2.00 | |
| Mastercard, Inc. - Cl. A | | | 45,839 | | | | 8,029,159 | | | | 3.23 | |
| Worldpay, Inc. - Cl. A* | | | 77,568 | | | | 6,379,192 | | | | 2.56 | |
| | | | | | | | 25,461,522 | | | | 10.23 | |
| Distillers & Vintners | | | | | | | | | | | | |
| Constellation Brands, Inc. - Cl. A | | | 33,287 | | | | 7,586,773 | | | | 3.05 | |
| | | | | | | | | | | | | |
| Diversified Support Services | | | | | | | | | | | | |
| Healthcare Services Group, Inc. | | | 87,217 | | | | 3,792,195 | | | | 1.52 | |
| | | | | | | | | | | | | |
| Electrical Components & Equipment | | | | | | | | | | | | |
| AMETEK, Inc. | | | 56,218 | | | | 4,270,881 | | | | 1.72 | |
| | | | | | | | | | | | | |
| Electronic Equipment & Instruments | | | | | | | | | | | | |
| Cognex Corporation | | | 24,736 | | | | 1,286,025 | | | | 0.52 | |
| | | | | | | | | | | | | |
| General Merchandise Stores | | | | | | | | | | | | |
| Ollie's Bargain Outlet Holdings, Inc.* | | | 71,420 | | | | 4,306,626 | | | | 1.73 | |
| | | | | | | | | | | | |
| Health Care Equipment | | | | | | | | | | | | |
| Hologic, Inc.* | | | 84,388 | | | $ | 3,152,736 | | | | 1.27 | % |
| IDEXX Laboratories, Inc.* | | | 18,011 | | | | 3,447,125 | | | | 1.38 | |
| Intuitive Surgical, Inc.* | | | 19,048 | | | | 7,863,586 | | | | 3.16 | |
| LivaNova PLC* | | | 24,902 | | | | 2,203,827 | | | | 0.88 | |
| Teleflex, Inc. | | | 22,925 | | | | 5,845,416 | | | | 2.35 | |
| | | | | | | | 22,512,690 | | | | 9.04 | |
| Health Care Facilities | | | | | | | | | | | | |
| Acadia Healthcare Company, Inc.* | | | 38,479 | | | | 1,507,607 | | | | 0.61 | |
| | | | | | | | | | | | | |
| Home Entertainment Software | | | | | | | | | | | | |
| Take-Two Interactive Software, Inc.* | | | 59,883 | | | | 5,855,360 | | | | 2.35 | |
| | | | | | | | | | | | | |
| Hotels, Resorts & Cruise Lines | | | | | | | | | | | | |
| Marriott International, Inc. - Cl. A | | | 33,630 | | | | 4,573,008 | | | | 1.84 | |
| Norwegian Cruise Line Holdings Ltd.* | | | 114,387 | | | | 6,059,079 | | | | 2.43 | |
| | | | | | | | 10,632,087 | | | | 4.27 | |
| Industrial Machinery | | | | | | | | | | | | |
| RBC Bearings, Inc.* | | | 9,507 | | | | 1,180,769 | | | | 0.47 | |
| | | | | | | | | | | | | |
| Internet & Direct Marketing Retail | | | | | | | | | | | | |
| Ctrip.com International, Ltd. ADR* | | | 77,128 | | | | 3,595,708 | | | | 1.45 | |
| Netflix, Inc.* | | | 20,332 | | | | 6,005,056 | | | | 2.41 | |
| | | | | | | | 9,600,764 | | | | 3.86 | |
| Investment Banking & Brokerage | | | | | | | | | | | | |
| The Charles Schwab Corporation | | | 133,916 | | | | 6,993,094 | | | | 2.81 | |
| | | | | | | | | | | | | |
| IT Consulting & Other Services | | | | | | | | | | | | |
| Gartner, Inc.* | | | 46,840 | | | | 5,509,321 | | | | 2.21 | |
| | | | | | | | | | | | | |
| Metal & Glass Containers | | | | | | | | | | | | |
| Ball Corporation | | | 49,292 | | | | 1,957,385 | | | | 0.79 | |
| | | | | | | | | | | | | |
| Railroads | | | | | | | | | | | | |
| Genesee & Wyoming, Inc. - Cl. A* | | | 63,960 | | | | 4,527,728 | | | | 1.82 | |
| | | | | | | | | | | | | |
| Real Estate Services | | | | | | | | | | | | |
| FirstService Corporation | | | 18,100 | | | | 1,326,364 | | | | 0.53 | |
| | | | | | | | | | | | | |
| Regional Banks | | | | | | | | | | | | |
| First Republic Bank | | | 76,842 | | | | 7,116,338 | | | | 2.86 | |
| Signature Bank* | | | 39,099 | | | | 5,550,103 | | | | 2.23 | |
| | | | | | | | 12,666,441 | | | | 5.09 | |
| Research & Consulting Services | | | | | | | | | | | | |
| CoStar Group, Inc.* | | | 22,289 | | | | 8,083,774 | | | | 3.25 | |
| Verisk Analytics, Inc.* | | | 55,173 | | | | 5,737,992 | | | | 2.30 | |
| | | | | | | | 13,821,766 | | | | 5.55 | |
| Restaurants | | | | | | | | | | | | |
| Domino's Pizza, Inc. | | | 20,606 | | | | 4,812,737 | | | | 1.93 | |
| | | | | | | | | | | | | |
| Semiconductor Equipment | | | | | | | | | | | | |
| Lam Research Corporation | | | 18,349 | | | | 3,727,783 | | | | 1.50 | |
| See notes to financial statements. |
22
| | | Number
of
Shares | | | Value | | | Percent
of Net
Assets | |
| COMMON STOCKS (continued) | | | | | | |
| Soft Drinks | | | | | | | | | |
| Monster Beverage Corporation* | | | 83,895 | | | $ | 4,799,633 | | | | 1.93 | % |
| | | | | | | | | | | | | |
| Specialized REITs | | | | | | | | | | | | |
| Crown Castle International Corp. | | | 46,674 | | | | 5,115,937 | | | | 2.06 | |
| SBA Communications Corporation - Cl. A* | | | 43,307 | | | | 7,402,033 | | | | 2.97 | |
| | | | | | | | 12,517,970 | | | | 5.03 | |
| Specialty Chemicals | | | | | | | | | | | | |
| The Sherwin-Williams Company | | | 15,007 | | | | 5,884,545 | | | | 2.36 | |
| | | | | | | | | | | | | |
| Steel | | | | | | | | | | | | |
| Steel Dynamics, Inc. | | | 26,557 | | | | 1,174,351 | | | | 0.47 | |
| | | | | | | | | | | | | |
| TOTAL COMMON STOCKS | | | | | | | | | | | | |
| (Cost $204,578,509) | | | | | | | 233,286,093 | | | | 93.71 | |
| | | | | | | | | | | | | |
| SHORT-TERM INVESTMENTS | | | | | | | | | | | | |
| State Street Institutional Treasury Money Market Fund, 0.017% | | | 14,139,665 | | | $ | 14,139,665 | | | | 5.68 | % |
| | | | | | | | | | | | | |
| TOTAL SHORT-TERM INVESTMENTS | | | | | | | | | | | | |
| (Cost $14,139,665) | | | | | | | 14,139,665 | | | | 5.68 | |
| | | | | | | | | | | | | |
| TOTAL INVESTMENTS | | | | | | | | | | | | |
| (Cost $218,718,174) | | | | | | | 247,425,758 | | | | 99.39 | |
| | | | | | | | | | | | | |
| Cash and Other Assets, Less Liabilities | | | | | | | 1,513,217 | | | | 0.61 | |
| | | | | | | | | | | | | |
| NET ASSETS | | | | | | $ | 248,938,975 | | | | 100.00 | % |
| See notes to financial statements. |
23
| INTERNATIONAL OPPORTUNITIES FUND |
INVESTMENT REVIEW BY TOM MARSICO AND ROB SUSMAN (UNAUDITED)
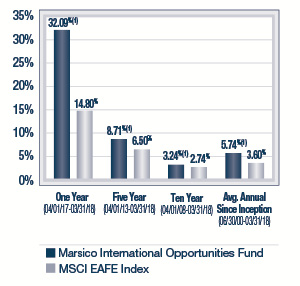
The Marsico International Opportunities Fund posted a total return of (US$) +8.34% for the six-month fiscal period ended March 31, 2018. The Fund substantially outperformed the MSCI EAFE Index, the Fund’s benchmark index, which had a total return of (US$) +2.63% over the same time period. Please see the Fund’s Overview for more detailed information about the Fund’s longer-term performance for various time periods ended March 31, 2018.
The performance data for the Fund quoted here represent past performance, and past performance is not a guarantee of future results. Investment return and principal value of an investment will fluctuate so that an investor’s shares, when redeemed, may be worth more or less than their original cost. Current performance may be lower or higher than the performance information quoted. To obtain performance information current to the most recent month-end, please call 888-860-8686 or visit marsicofunds.com.(1)
This review highlights Fund performance over a six-month fiscal period. Shareholders should keep in mind that the Fund is intended for long-term investors who hold their shares for substantially longer periods of time. You should also keep in mind that our current views and beliefs regarding all investments discussed in this report are subject to change at any time. References to specific securities, industries, and sectors discussed in this report are not recommendations to buy or sell such securities or related investments, and the Fund may not necessarily hold these securities or investments today. Please see the accompanying Schedule of Investments for the percentage of the Fund’s portfolio represented by the securities mentioned in this report as of the end of the reporting period.
Foreign investments present additional risks due to currency fluctuations, economic and political factors, lower liquidity, differences in securities regulations and accounting standards, possible changes in taxation, limited public information, and other factors. In addition, the Fund is subject to broad risks associated with investing in equity securities markets generally, including the risks that the securities and markets in which it invests may experience volatility and instability, that domestic and global economies and markets may undergo periods of cyclical change and decline, that investors may at times avoid investments in equity securities, and that investments may not perform as anticipated. Please see the Prospectus for more information.
The Fund is not managed to track the benchmark index, and may hold a substantially overweight or underweight position in a sector, industry, or security compared to its weight in the benchmark. The Fund may be subject to risks associated with a particular sector or other area in which it is overweight, including the risk that the stocks of companies within one area could simultaneously decline in price because of an event that affects the entire area. For informational purposes, the discussion below may compare the benchmark weight or performance of a sector or industry to the investment approach of the Fund.
The International Opportunities Fund’s outperformance during the six-month period ended March 31, 2018 as compared to the MSCI EAFE Index was primarily attributable to strong stock selection in the Information Technology, Financials and Industrials sectors.
Several of the Fund’s positions in the Information Technology industry contributed positively to performance. European data center provider InterXion Holding N.V. (+22%) continues to produce consistent quarterly results. As more enterprises move to a hybrid cloud structure, InterXion is seeing increased demand for its colocation and interconnect offerings. This trend is in early innings (as Europe appears to be about 2 years behind the US in these areas), and we expect continued revenue growth and operating margin expansion as enterprises, content providers and Telecommunication Services companies take more data center space as data usage grows.
Also in the Software & Services industry group, global payments company Wirecard A.G. (+29%) posted strong returns. Wirecard benefits as cash payments give way to electronic payments around the world, e-commerce grows, and Wirecard assists in processing these transactions. Wirecard has been consistently winning global accounts and taking market share from legacy competitors and continues to grow revenues by +20% annually.
Chinese conglomerate Tencent Holdings Ltd. (+22%) performed well as we believe the company is in the early stages of monetizing its WeChat asset. With over 1 billion users on the platform, WeChat appears likely to drive significant revenue for Tencent through advertising, cloud, and gaming services faster than expectations given management’s demonstrated ability to extract significant profits from scaled assets.
In the Financials sector, Deutsche Boerse A.G. (+25%) was a standout performer as rising global volatility led to improved revenue at the company’s European equities and derivatives trading and clearing businesses. Beyond cyclical factors, the company is also benefiting from secular growth as more trading flows from over-the-counter to electronic venues, driven by regulatory change. Last, the ongoing prospect of some form of Brexit continues to foster greater potential for more trading/clearing services to be performed in Continental Europe rather than London, which should benefit Deutsche Boerse if it occurs.
In the Industrials sector, robot maker FANUC Corporation (+26%) is a factory automation story. Global demand for robots to automate manufacturing around the world continues to accelerate, particularly as wage cost pressures grow globally. FANUC is the industry leader and is benefiting globally, with notable incremental demand from China’s semiconductor and Telecommunication Services industries.
The Fund added a few new positions in the Software & Services industry group during the period, one of which was Nintendo Co., Ltd. (+12%). Nintendo was added for two reasons. First, sales of the Nintendo Switch console appear to be going well. The last time Nintendo launched a successful device (the Wii) the stock reacted well. Second, and more importantly, it appears that
24
| INTERNATIONAL OPPORTUNITIES FUND |
Nintendo is finally following the lead of the rest of the video gaming industry and moving toward a more digital, recurring revenue model focused on online sales of software. As sales move away from physical devices and toward digital software, gaming companies see more recurring revenue as it’s easier to buy more goods via micro transactions online.
In terms of sector allocation, the Fund was rewarded for an overweight stance in the Information Technology sector and the Consumer Discretionary sector, which were two of the stronger-performing sectors in the MSCI EAFE Index during the six-month period, and for having an underweight stance in the Telecommunication Services sector, the weakest performing sector during the period.
The stock prices of select Health Care holdings fell during the period – Bayer A.G. (-17%), Eurofins Scientific S.E. (-12%) and Koninklijke Philips N.V. (-7%). In particular, Bayer AG was impacted due to the pending acquisition of Monsanto. Bayer has experienced softer results in its internal crop protection portfolio, although prospects are expected to improve after the Monsanto acquisition closes. The timeline for the acquisition has been extended due to regulatory scrutiny, but the company is moving closer to resolution as approval is anticipated by mid-year.
In the Consumer Discretionary sector there were a few positions that were down during the period, two of which were Ctrip.com International, Ltd. ADR (-12%) and Domino’s Pizza Enterprises Ltd. (-10%). Ctrip underperformed over the period due to a change in Chinese regulations that restricted the sale of premium add-on features along with airline tickets. This change in regulation impacted the entire Chinese online travel agency industry as well as the broader airline industry. As the largest player in Chinese transportation and hotel booking, Ctrip is best equipped to adjust to the regulatory changes and take market share. We are encouraged by Ctrip’s position as the leader in the Chinese travel market, and revenue growth should accelerate as the year continues.
Australia-based Domino’s Pizza Enterprises Ltd. has been an underperformer for the last 6 months because of an overhanging labor relations issue in various countries and weakness in its Japanese business. A new wage agreement has since been finalized, which should remove uncertainty around labor. Domino’s reduced its menu offering in Japan over the very important month of December to increase order fulfillment, which led to the short-term loss of some Japanese customers that had specific tastes. We have spoken with the company’s CEO, and believe that the team has learned from the oversight and that it will not be repeated.
From a sector allocation perspective, the Fund was penalized for an underweight stance in the Energy sector, a strong performing sector in the MSCI EAFE Index during the period.
Although active currency management is not a central facet of the Fund’s investment process, fluctuations in major world currencies can at times affect the Fund’s performance. During the period, the net effect of currency moves was negative for the Fund to a limited degree.
There were a few shifts in the Fund’s sector allocations during the period. The Fund reduced its allocations to the Information Technology and Consumer Discretionary sectors and increased its allocations to the Financials, Telecommunication Services and Real Estate sectors. There were no significant changes to the Fund’s allocations to the Health Care, Consumer Staples and Industrials sectors.
Fiscal Period-End Investment Posture
As of March 31, 2018, the Fund’s primary economic sector allocations included Information Technology, Consumer Discretionary, Financials and Health Care. The Fund had no exposure to the Energy, Materials or Utilities sectors.
In terms of country allocations, the Fund’s most significant weightings at period-end, excluding short-term investments, were in Germany, Netherlands, United Kingdom, China/Hong Kong, Japan, and France. Country-level weightings generally should be considered a residual of the Fund’s stock selection process rather than a major, proactive facet of its investment strategy.
Sincerely,
THOMAS F. MARSICO
ROBERT G. SUSMAN, CFA
PORTFOLIO MANAGERS
(1) | Total returns are based on net change in net asset value assuming reinvestment of distributions. Periodically, certain fees and expenses have been waived or reimbursed by the Adviser for the International Opportunities Fund. In the absence of such a waiver or reimbursement, the performance returns reflected would have been reduced. In accordance with the expense limitation and fee waiver agreement, the Adviser may recoup fees and expenses previously waived or reimbursed under certain parameters. Periodically, the Adviser has recouped such fees or expenses from the International Opportunities Fund, resulting in a lower performance return. Please see the Prospectus for more information. |
25
| INTERNATIONAL OPPORTUNITIES FUND OVERVIEW |
March 31, 2018 (Unaudited)
The International Opportunities Fund is a diversified portfolio and invests primarily (no less than 65% of its total assets) in common stocks of foreign companies that are selected for their long-term growth potential, including foreign securities, whether traded in the US (including as American Depositary Receipts) or in foreign markets or both. The Fund may invest in an unlimited number of companies of any size throughout the world. It normally invests in the securities of issuers that are economically tied to one or more foreign countries, and expects to be invested in various issuers or securities that together have ties to at least four different foreign countries. The Fund may invest in securities of companies economically tied to emerging markets. Some issuers or securities in the Fund’s portfolio may be economically tied to the US.
TOTAL ANNUAL OPERATING EXPENSES* 1.79% NET EXPENSES*† 1.50% | NET ASSETS $68,742,254 | NET ASSET VALUE PER SHARE $20.91 |
GROWTH OF $10,000(1)(2) | PERFORMANCE COMPARISON |

| 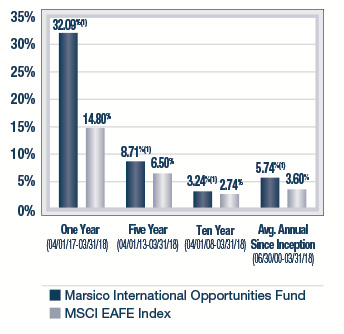
|
SECTOR ALLOCATION(3) | TOP FIVE HOLDINGS |
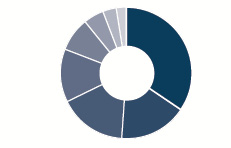 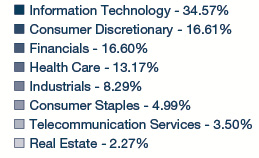
| | | | |
| | InterXion Holding N.V. | 4.40% | |
| | Alibaba Group Holding Ltd. Spon. ADR | 3.76% | |
| | ASML Holding N.V. | 3.62% | |
| | Julius Baer Group Ltd. | 3.42% | |
| | Tencent Holdings Ltd. | 3.41% | |
| | | | |
* | The Total Annual Operating Expenses and Net Expenses are reflective of the information disclosed in the Funds’ Prospectus dated January 31, 2018 and may differ from the expense ratios disclosed in this report. |
† | Marsico Capital Management, LLC (“the Adviser”) has entered into a written expense limitation and fee waiver agreement under which it has agreed to limit the total expenses of the International Opportunities Fund (excluding taxes, interest, acquired fund fees and expenses, litigation, extraordinary expenses, brokerage and other transaction expenses relating to the purchase or sale of portfolio investments) to an annual rate of 1.50% of the Fund’s average net assets until January 31, 2019. This expense limitation and fee waiver agreement may be terminated by the Adviser at any time after January 31, 2019 upon 15 days prior notice to the Fund and its administrator. The Adviser may recoup from the Fund fees previously waived or expenses previously reimbursed by the Adviser with respect to that Fund pursuant to this agreement (or a previous expense limitation agreement) if: (1) such recoupment by the Adviser does not cause the Fund, at the time of recoupment, to exceed the lesser of (a) the expense limitation in effect at the time the relevant amount was waived and/or reimbursed, or (b) the expense limitation in effect at the time of the proposed recoupment, and (2) the recoupment is made within three years after the fiscal year end date as of which the amount to be waived or reimbursed was determined and the waiver or reimbursement occurred. |
| The performance data quoted here represent past performance, and past performance is not a guarantee of future results. Investment return and principal value of an investment will fluctuate so that an investor’s shares, when redeemed, may be worth more or less than their original cost. Current performance may be lower or higher than the performance information quoted. To obtain performance information current to the most recent month-end, please call 888-860-8686 or visit marsicofunds.com. |
| The performance included in the chart and graph does not reflect the deduction of taxes on Fund distributions or the redemption of Fund shares. |
| All indices are unmanaged and investors cannot invest directly in an index. |
| The MSCI EAFE Index tracks the stocks of about 1,000 companies in Europe, Australasia, and the Far East (EAFE). |
(1) | Periodically, certain fees and expenses have been waived or reimbursed by the Adviser for the International Opportunities Fund. In the absence of such a waiver or reimbursement, the performance returns reflected would have been reduced. In accordance with the expense limitation and fee waiver agreement, the Adviser may recoup fees and expenses previously waived or reimbursed under certain parameters. Periodically, the Adviser has recouped such fees or expenses from the International Opportunities Fund, resulting in a lower performance return. |
(2) | This chart assumes an initial investment of $10,000 made on March 31, 2008. Total returns are based on net change in NAV, assuming reinvestment of distributions. |
(3) | Sector weightings represent the percentage of the Fund’s investments (excluding cash equivalents) in certain general sectors. These sectors may include more than one industry. The Fund’s portfolio composition is subject to change at any time. |
26
MARSICO INTERNATIONAL OPPORTUNITIES FUND
SCHEDULE OF INVESTMENTS
March 31, 2018 (Unaudited)
| | | Number
of
Shares | | | Value | | | Percent
of Net
Assets | |
| COMMON STOCKS | | | | | | | | | |
| Airlines | | | | | | | | | |
| Ryanair Holdings PLC Spon. ADR* | | | 15,691 | | | $ | 1,927,639 | | | | 2.81 | % |
| | | | | | | | | | | | | |
| Application Software | | | | | | | | | | | | |
| Constellation Software, Inc. | | | 1,824 | | | | 1,237,590 | | | | 1.80 | |
| Dassault Systemes | | | 9,558 | | | | 1,299,825 | | | | 1.89 | |
| SAP S.E. | | | 11,329 | | | | 1,189,338 | | | | 1.73 | |
| | | | | | | | 3,726,753 | | | | 5.42 | |
| Asset Management & Custody Banks | | | | | | | | | | | | |
| Hargreaves Lansdown PLC | | | 60,622 | | | | 1,391,494 | | | | 2.02 | |
| Julius Baer Group Ltd. | | | 38,198 | | | | 2,350,761 | | | | 3.42 | |
| | | | | | | | 3,742,255 | | | | 5.44 | |
| Biotechnology | | | | | | | | | | | | |
| Genmab A/S* | | | 2,433 | | | | 524,177 | | | | 0.76 | |
| | | | | | | | | | | | | |
| Brewers | | | | | | | | | | | | |
| Anheuser-Busch InBev S.A./N.V. | | | 15,984 | | | | 1,757,388 | | | | 2.56 | |
| | | | | | | | | | | | | |
| Casinos & Gaming | | | | | | | | | | | | |
| MGM China Holdings Ltd. | | | 523,600 | | | | 1,361,824 | | | | 1.98 | |
| | | | | | | | | | | | | |
| Data Processing & Outsourced Services | | | | | | | | | | | | |
| Pagseguro Digital Ltd. - Cl. A* | | | 10,061 | | | | 385,538 | | | | 0.56 | |
| Wirecard A.G. | | | 15,062 | | | | 1,785,473 | | | | 2.60 | |
| Worldpay, Inc. - Cl. A* | | | 23,352 | | | | 1,920,468 | | | | 2.79 | |
| | | | | | | | 4,091,479 | | | | 5.95 | |
| Diversified Banks | | | | | | | | | | | | |
| BAWAG Group A.G.* | | | 13,839 | | | | 759,117 | | | | 1.10 | |
| HDFC Bank Ltd. ADR | | | 14,020 | | | | 1,384,755 | | | | 2.02 | |
| ING Groep N.V. | | | 41,630 | | | | 702,515 | | | | 1.02 | |
| Sumitomo Mitsui Financial Group, Inc. | | | 20,900 | | | | 886,667 | | | | 1.29 | |
| UniCredit SpA* | | | 57,162 | | | | 1,194,750 | | | | 1.74 | |
| | | | | | | | 4,927,804 | | | | 7.17 | |
| Financial Exchanges & Data | | | | | | | | | | | | |
| Bolsa Mexicana de Valores S.A.B. de C.V. | | | 294,700 | | | | 563,626 | | | | 0.82 | |
| Deutsche Boerse A.G. | | | 13,619 | | | | 1,861,762 | | | | 2.71 | |
| | | | | | | | 2,425,388 | | | | 3.53 | |
| General Merchandise Stores | | | | | | | | | | | | |
| B&M European Value Retail S.A. | | | 207,766 | | | | 1,140,488 | | | | 1.66 | |
| Dollarama, Inc. | | | 10,858 | | | | 1,319,630 | | | | 1.92 | |
| | | | | | | | 2,460,118 | | | | 3.58 | |
| Health Care Distributors | | | | | | | | | | | | |
| Sinopharm Group Company Ltd. - Cl. H | | | 106,000 | | | | 530,800 | | | | 0.77 | |
| | | | | | | | | | | | | |
| Health Care Equipment | | | | | | | | | | | | |
| Koninklijke Philips N.V. | | | 53,361 | | | | 2,043,298 | | | | 2.97 | |
| | | | | | | | | | | | | |
| Home Entertainment Software | | | | | | | | | | | | |
| Nintendo Co., Ltd. | | | 1,900 | | | | 844,119 | | | | 1.23 | |
| Ubisoft Entertainment S.A.* | | | 15,591 | | | | 1,319,497 | | | | 1.92 | |
| | | | | | | | 2,163,616 | | | | 3.15 | |
| | | | | | | | | | | | |
| Household Products | | | | | | | | | | | | |
| Reckitt Benckiser Group PLC | | | 18,672 | | | $ | 1,576,063 | | | | 2.29 | % |
| | | | | | | | | | | | | |
| Industrial Machinery | | | | | | | | | | | | |
| FANUC Corporation | | | 7,700 | | | | 1,981,619 | | | | 2.88 | |
| | | | | | | | | | | | | |
| Integrated Telecommunication Services | | | | | | | | | | | | |
| Cellnex Telecom SA | | | 31,615 | | | | 845,192 | | | | 1.23 | |
| Orange S.A. | | | 50,360 | | | | 856,012 | | | | 1.25 | |
| | | | | | | | 1,701,204 | | | | 2.48 | |
| Internet & Direct Marketing Retail | | | | | | | | | | | | |
| ASOS PLC* | | | 7,418 | | | | 725,677 | | | | 1.06 | |
| Ctrip.com International, Ltd. ADR* | | | 27,155 | | | | 1,265,966 | | | | 1.84 | |
| MakeMyTrip Ltd.* | | | 27,198 | | | | 943,770 | | | | 1.37 | |
| Start Today Company Ltd. | | | 22,800 | | | | 593,427 | | | | 0.86 | |
| | | | | | | | 3,528,840 | | | | 5.13 | |
| Internet Software & Services | | | | | | | | | | | | |
| Alibaba Group Holding Ltd. Spon. ADR* | | | 14,069 | | | | 2,582,224 | | | | 3.76 | |
| Just Eat PLC* | | | 94,061 | | | | 921,081 | | | | 1.34 | |
| Scout24 A.G. | | | 37,625 | | | | 1,754,337 | | | | 2.55 | |
| Tencent Holdings Ltd. | | | 43,700 | | | | 2,345,796 | | | | 3.41 | |
| | | | | | | | 7,603,438 | | | | 11.06 | |
| IT Consulting & Other Services | | | | | | | | | | | | |
| InterXion Holding N.V.* | | | 48,738 | | | | 3,027,117 | | | | 4.40 | |
| | | | | | | | | | | | | |
| Life Sciences Tools & Services | | | | | | | | | | | | |
| Eurofins Scientific S.E. | | | 2,565 | | | | 1,351,687 | | | | 1.97 | |
| QIAGEN N.V.* | | | 30,180 | | | | 975,116 | | | | 1.42 | |
| | | | | | | | 2,326,803 | | | | 3.39 | |
| Movies & Entertainment | | | | | | | | | | | | |
| iQIYI, Inc. ADR* | | | 12,986 | | | | 201,932 | | | | 0.29 | |
| | | | | | | | | | | | | |
| Pharmaceuticals | | | | | | | | | | | | |
| Bayer A.G. | | | 17,889 | | | | 2,016,693 | | | | 2.93 | |
| Dechra Pharmaceuticals PLC | | | 36,898 | | | | 1,359,751 | | | | 1.98 | |
| | | | | | | | 3,376,444 | | | | 4.91 | |
| Publishing | | | | | | | | | | | | |
| Lifull Company Ltd. | | | 73,500 | | | | 651,991 | | | | 0.95 | |
| | | | | | | | | | | | | |
| Real Estate Operating Companies | | | | | | | | | | | | |
| Aroundtown S.A. | | | 196,011 | | | | 1,518,423 | | | | 2.21 | |
| | | | | | | | | | | | | |
| Restaurants | | | | | | | | | | | | |
| Domino's Pizza Enterprises Ltd. | | | 47,439 | | | | 1,528,594 | | | | 2.23 | |
| Domino's Pizza Group PLC | | | 294,839 | | | | 1,368,452 | | | | 1.99 | |
| | | | | | | | 2,897,046 | | | | 4.22 | |
| Semiconductor Equipment | | | | | | | | | | | | |
| ASML Holding N.V. | | | 12,557 | | | | 2,489,971 | | | | 3.62 | |
| | | | | | | | | | | | | |
| Trading Companies & Distributors | | | | | | | | | | | | |
| MISUMI Group, Inc. | | | 58,800 | | | | 1,628,503 | | | | 2.37 | |
| See notes to financial statements. |
27
MARSICO INTERNATIONAL OPPORTUNITIES FUND
SCHEDULE OF INVESTMENTS (continued)
March 31, 2018 (Unaudited)
| | | Number
of
Shares | | | Value | | | Percent
of Net
Assets | |
| COMMON STOCKS (continued) | | | | | | |
| Wireless Telecommunication Services | | | |
| SoftBank Group Corporation | | | 8,500 | | | $ | 634,026 | | | | 0.92 | % |
| | | | | | | | | | | | | |
| TOTAL COMMON STOCKS | | | | | | | | | | | | |
| (Cost $51,248,684) | | | | | | | 66,825,959 | | | | 97.21 | |
| | | | | | | | | | | | | |
| SHORT-TERM INVESTMENTS | | | | | | | | | | | | |
| State Street Institutional Treasury Money Market Fund, 0.017% | | | 2,369,753 | | | | 2,369,753 | | | | 3.45 | |
| | | | | | | | | | | | | |
| TOTAL SHORT-TERM INVESTMENTS | | | | | | | | | | | | |
| (Cost $2,369,753) | | | | | | | 2,369,753 | | | | 3.45 | |
| | | | | | | | | | | | | |
| TOTAL INVESTMENTS | | | | | | | | | | | | |
| (Cost $53,618,437) | | | | | | | 69,195,712 | | | | 100.66 | |
| | | | | | | | | | | | | |
| Liabilities, Less Cash and Other Assets | | | | | | | (453,458 | ) | | | (0.66 | ) |
| | | | | | | | | | | | | |
| NET ASSETS | | | | | | $ | 68,742,254 | | | | 100.00 | % |
| SUMMARY OF INVESTMENTS BY COUNTRY |
| Country | | Market Value | | | Percent of
Investment
Securities | |
| Australia | | $ | 1,528,594 | | | | 2.21 | % |
| Austria | | | 759,117 | | | | 1.10 | |
| Belgium | | | 1,757,388 | | | | 2.54 | |
| Brazil | | | 385,538 | | | | 0.56 | |
| Canada | | | 2,557,220 | | | | 3.69 | |
| China/Hong Kong | | | 8,288,542 | | | | 11.98 | |
| Denmark | | | 524,177 | | | | 0.76 | |
| France | | | 4,827,021 | | | | 6.98 | |
| Germany | | | 10,126,026 | | | | 14.63 | |
| India | | | 2,328,525 | | | | 3.36 | |
| Ireland | | | 1,927,639 | | | | 2.79 | |
| Italy | | | 1,194,750 | | | | 1.73 | |
| Japan | | | 7,220,352 | | | | 10.43 | |
| Mexico | | | 563,626 | | | | 0.81 | |
| Netherlands | | | 9,238,017 | | | | 13.35 | |
| Spain | | | 845,192 | | | | 1.22 | |
| Switzerland | | | 2,350,761 | | | | 3.40 | |
| United Kingdom | | | 8,483,006 | | | | 12.26 | |
United States(1) | | | 4,290,221 | | | | 6.20 | |
| | | $ | 69,195,712 | | | | 100.00 | % |
(1) | Includes short-term securities. |
| See notes to financial statements. |
28
INVESTMENT REVIEW BY TOM MARSICO (UNAUDITED)
The Marsico Flexible Capital Fund posted a total return of +3.11% for the six-month fiscal period ended March 31, 2018. The Fund underperformed the S&P 500 Index, the Fund’s benchmark index, which had a total return of +5.84% over the same time period. Please see the Fund’s Overview for more detailed information about the Fund’s longer-term performance for various time periods ended March 31, 2018.
The performance data for the Fund quoted here represent past performance, and past performance is not a guarantee of future results. Investment return and principal value of an investment will fluctuate so that an investor’s shares, when redeemed, may be worth more or less than their original cost. Current performance may be lower or higher than the performance information quoted. To obtain performance information current to the most recent month-end, please call 888-860-8686 or visit marsicofunds.com. (1)
This review highlights Fund performance over a six-month fiscal period. Shareholders should keep in mind that the Fund is intended for long-term investors who hold their shares for substantially longer periods of time. You should also keep in mind that our current views and beliefs regarding all investments discussed in this report are subject to change at any time. References to specific securities, industries, and sectors discussed in this report are not recommendations to buy or sell such securities or related investments, and the Fund may not necessarily hold these securities or investments today. Please see the accompanying Schedule of Investments for the percentage of the Fund’s portfolio represented by the securities mentioned in this report as of the end of the reporting period.
The Fund is subject to broad risks associated with investing in equity securities markets generally, including the risks that the securities and markets in which it invests may experience volatility and instability, that domestic and global economies and markets may undergo periods of cyclical change and decline, that investors may at times avoid investments in equity securities, and that investments may not perform as anticipated. Please see the Prospectus for more information.
The Fund is not managed to track the benchmark index, and may hold a substantially overweight or underweight position in a sector, industry, or security compared to its weight in the benchmark. The Fund may be subject to risks associated with a particular sector or other area in which it is overweight, including the risk that the stocks of companies within one area could simultaneously decline in price because of an event that affects the entire area. For informational purposes, the discussion below may compare the benchmark weight or performance of a sector or industry to the investment approach of the Fund.
The Flexible Capital Fund’s underperformance during the six-month period ended March 31, 2018 versus the S&P 500 Index was largely attributable to certain holdings in the Consumer Discretionary, Industrials, and Information Technology sectors.
During the period, there was a change in emphasis within the strategy and positioning of the Fund, which has a flexible mandate. After Tom Marsico became the portfolio manager of the Fund on March 6, 2018, he reconfigured the portfolio to reflect his view of the strongest performing assets in light of current market conditions, as well as the best fit for the Fund’s mandate. In particular, Tom Marsico shifted the focus of the portfolio to purchase stocks with more long-term growth potential, including some international growth companies. Conversely, some other securities in the Fund with less growth potential were sold during the period, including fixed income securities, preferred stocks, and more dividend focused-equity holdings.
As mentioned above, several stocks in the Consumer Discretionary sector hampered Fund returns. Although several of these investments posted positive returns, they underperformed versus the Index during the period that they were held by the Fund. For example, online retailer Amazon.com, Inc. (-6%) and streaming content provider Netflix, Inc. (-4%) were weak near the end of the reporting period and hurt returns, but we believe their long-term growth prospects remain solid, and they are now core holdings for the Fund.
Industrials position Macquarie Infrastructure Corporation, an owner of infrastructure assets including energy and transportation, posted a return of -44% and was sold during the period. This weakness resulted from the company’s announcing a cut in its dividend and overall weakness in oil-related assets.
Due to the timing of the shift within the portfolio, the Fund’s Information Technology holdings, in aggregate, lagged the benchmark sector return. Several positions (including Tencent Holdings Ltd. (-7%), Snap, Inc. – Cl. A (-13%) and salesforce.com, inc. (-6%)) posted negative returns during the period since being acquired by the Fund, but we continue to like their long-term growth potential.
Starwood Property Trust, Inc. (-1%) was a holding in the Financials sector that had a negative impact on Fund performance and was sold from the Fund. This position was owned by the Fund primarily for its dividend yield, but it struggled as the Federal Reserve raised the overnight Fed Funds rate, and was liquidated from the Fund as part of the shift in emphasis toward more international growth stocks.
From a sector allocation perspective, the Fund’s performance was impaired by having an underweight posture to the Information Technology sector for the earlier portion of the period, although by period-end the Fund had significantly increased its holdings in the sector. In addition, the Fund was slightly held back by being overweight on average in the weak-performing Real Estate sector (prior to the Fund’s selling its sole position), and by maintaining a 4% average cash position.
29
On the brighter side, one of the Fund’s holdings in the Financials sector was a strong positive contributor to the Fund’s performance for the six-month period ended March 31, 2018. CME Group, Inc. posted a return of +23% (prior to being sold) as interest rate volatility picked up, benefiting CME’s interest rate derivatives offerings.
Another strong-performing individual Fund holding was payment-processing company Visa, Inc. – Cl. A (+15%). Visa continues to benefit from the shift from cash payments to electronic payments as well as the growing proportion of spending coming from e-commerce (where 100% is electronic payment). Additionally, Visa’s acquisition of Visa Europe continues to yield revenue and overall synergies better than forecasted.
From a portfolio positioning standpoint, another positive performer was Health Care company G1 Therapeutics, Inc. (+37%), which was added during the period. The company announced positive results for its leading drug for the treatment of small cell lung cancer. The data appeared in a proof-of-concept study for the use of the drug in combination with chemotherapy, with the goal of reducing serious side effects seen with chemotherapy alone. As a result of the study, the company will continue to research the treatment in additional small cell lung cancer patients and breast cancer as well.
The Fund maintained no exposure to the Energy sector during the period, thereby benefitting relative to the S&P 500 Index in which Energy is a 6% average weight. The sector return was flat for the period, and significantly trailed the overall Index return of 6%. We continue to see little to no growth for companies in the Energy sector, as technology developments increase the supply of oil and other potentially cleaner sources of energy for cars and homes. The Fund also was rewarded for an overweight stance in the Consumer Discretionary sector, one of the strong performing sectors within the benchmark index.
The Fund experienced elevated portfolio turnover during the period, which primarily related to the Fund’s changing its portfolio composition to reinvest in other positions that we believe may have more upside potential and to take advantage of new opportunities, as previously discussed. Increased portfolio turnover increases transaction-related expenses, which could reduce Fund returns. Increased portfolio turnover also may result in higher taxes when Fund shares are held in a taxable account.
As noted above, the Fund has a flexible mandate, and its allocation to securities and cash may vary substantially over time. The Fund’s cash position was slightly elevated (4% on average), as we assessed the volatility of the markets. In a generally rising equity market, the Fund’s cash position was a modest drag on performance when measured over the full six-month period.
During the period, the Fund decreased all exposure to fixed-income and preferred stock securities and liquidated its positons in the Financials and Real Estate sectors. The Fund significantly increased its holdings in the Information Technology sector, and trimmed its allocations to the Consumer Discretionary, Consumer Staples, Industrials and Health Care sectors. There was no significant change to the Fund’s allocation to the Materials sector.
Fiscal Period-End Investment Posture
As of March 31, 2018, the Fund’s primary economic sector allocations included Information Technology, Consumer Discretionary and Health Care. At period-end, the Fund had no exposure to the Energy, Financials, Real Estate, Telecommunication Services or Utilities sectors.
With the shift in the Fund’s portfolio to include more international growth companies, as previously discussed, the Fund’s most significant country weightings at period-end, excluding short-term investments, were in the United States, China/Hong Kong, France, Netherlands and Japan. Country-level weightings generally should be considered a residual of the Fund’s stock selection process rather than a major, proactive facet of its investment strategy.
Effective on and after March 6, 2018, Jordon Laycob no longer served as the portfolio manager of the Marsico Flexible Capital Fund, and Thomas F. Marsico, Chief Investment Officer (“CIO”) of the Funds and CIO of Marsico Capital Management, LLC, the adviser of the Funds, assumed responsibility as the portfolio manager of the Flexible Capital Fund.
Sincerely,
THOMAS F. MARSICO
PORTFOLIO MANAGER
(1) | Total returns are based on net change in net asset value assuming reinvestment of distributions. Periodically, certain fees and expenses have been waived or reimbursed by the Adviser for the Flexible Capital Fund. In the absence of such a waiver or reimbursement, the performance returns reflected would have been reduced. In accordance with the expense limitation and fee waiver agreement, the Adviser may recoup fees and expenses previously waived or reimbursed under certain parameters. Please see the Prospectus for more information. |
30
| FLEXIBLE CAPITAL FUND OVERVIEW |
March 31, 2018 (Unaudited)
The Flexible Capital Fund is a diversified portfolio and invests primarily in equity securities and other investments that are selected primarily for their long-term growth potential. The Fund may invest in issuers of any size throughout the world, and will normally hold a core position of between 20 and 50 securities or other investments.
TOTAL ANNUAL OPERATING EXPENSES* 1.47% NET EXPENSES*† 1.45% | NET ASSETS $223,517,301 | NET ASSET VALUE PER SHARE $14.11 |
GROWTH OF $10,000(1)(2) | PERFORMANCE COMPARISON |
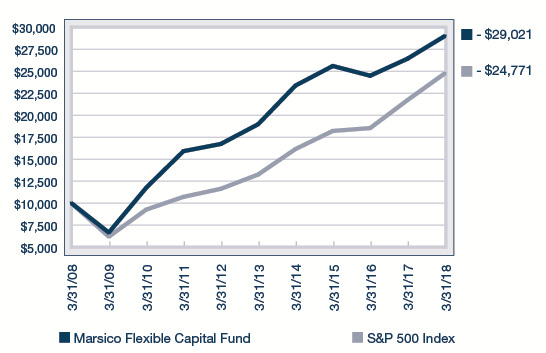
| 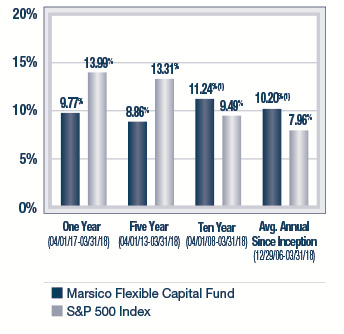
|
SECTOR ALLOCATION(3) | TOP FIVE HOLDINGS |
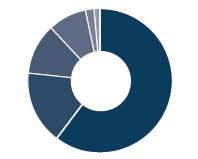 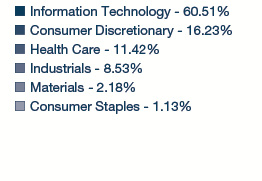
| | | | |
| | Alibaba Group Holding Ltd. Spon. ADR | 4.94% | |
| | Tencent Holdings Ltd. | 4.72% | |
| | Amazon.com, Inc. | 4.72% | |
| | Apple, Inc. | 4.42% | |
| | Alphabet, Inc. - Cl. A | 4.28% | |
| | | | |
* | The Total Annual Operating Expenses and Net Expenses are reflective of the information disclosed in the Funds’ Prospectus dated January 31, 2018 and may differ from the expense ratios disclosed in this report. |
† | Marsico Capital Management, LLC (“the Adviser”) has entered into a written expense limitation and fee waiver agreement under which it has agreed to limit the total expenses of the Flexible Capital Fund (excluding taxes, interest, acquired fund fees and expenses, litigation, extraordinary expenses, brokerage and other transaction expenses relating to the purchase or sale of portfolio investments) to an annual rate of 1.45% of the Fund’s average net assets until January 31, 2019. This expense limitation and fee waiver agreement may be terminated by the Adviser at any time after January 31, 2019 upon 15 days prior notice to the Fund and its administrator. The Adviser may recoup from the Fund fees previously waived or expenses previously reimbursed by the Adviser with respect to that Fund pursuant to this agreement (or a previous expense limitation agreement) if: (1) such recoupment by the Adviser does not cause the Fund, at the time of recoupment, to exceed the lesser of (a) the expense limitation in effect at the time the relevant amount was waived and/or reimbursed, or (b) the expense limitation in effect at the time of the proposed recoupment, and (2) the recoupment is made within three years after the fiscal year end date as of which the amount to be waived or reimbursed was determined and the waiver or reimbursement occurred. |
| The performance data quoted here represent past performance, and past performance is not a guarantee of future results. Investment return and principal value of an investment will fluctuate so that an investor’s shares, when redeemed, may be worth more or less than their original cost. Current performance may be lower or higher than the performance information quoted. To obtain performance information current to the most recent month-end, please call 888-860-8686 or visit marsicofunds.com. |
| The performance included in the chart and graph does not reflect the deduction of taxes on Fund distributions or the redemption of Fund shares. |
| All indices are unmanaged and investors cannot invest directly in an index. |
(1) | Periodically, certain fees and expenses have been waived or reimbursed by the Adviser for the Flexible Capital Fund. In the absence of such a waiver or reimbursement, the performance returns reflected would have been reduced. In accordance with the expense limitation and fee waiver agreement, the Adviser may recoup fees and expenses previously waived or reimbursed under certain parameters. |
(2) | This chart assumes an initial investment of $10,000 made on March 31, 2008. Total returns are based on change in NAV, assuming reinvestment of distributions. |
(3) | Sector weightings represent the percentage of the Fund’s investments (excluding cash equivalents) in certain general sectors. These sectors may include more than one industry. The Fund’s portfolio composition is subject to change at any time. |
31
MARSICO FLEXIBLE CAPITAL FUND
SCHEDULE OF INVESTMENTS
March 31, 2018 (Unaudited)
| | | Number
of
Shares | | | Value | | | Percent
of Net
Assets | |
| COMMON STOCKS | | | | | | | | | |
| Aerospace & Defense | | | | | | | | | |
| Airbus SE | | | 53,929 | | | $ | 6,242,697 | | | | 2.79 | % |
| | | | | | | | | | | | | |
| Airlines | | | | | | | | | | | | |
| Ryanair Holdings PLC Spon. ADR* | | | 55,854 | | | | 6,861,664 | | | | 3.07 | |
| | | | | | | | | | | | | |
| Apparel, Accessories & Luxury Goods | | | | | | | | | | | | |
| Hermes International | | | 11,583 | | | | 6,865,838 | | | | 3.07 | |
| | | | | | | | | | | | | |
| Application Software | | | | | | | | | | | | |
| salesforce.com, inc.* | | | 77,296 | | | | 8,989,525 | | | | 4.02 | |
| Snap, Inc. - Cl. A* | | | 252,156 | | | | 4,001,715 | | | | 1.79 | |
| | | | | | | | 12,991,240 | | | | 5.81 | |
| Biotechnology | | | | | | | | | | | | |
| G1 Therapeutics, Inc.* | | | 83,152 | | | | 3,080,782 | | | | 1.38 | |
| Vertex Pharmaceuticals, Inc.* | | | 40,825 | | | | 6,653,658 | | | | 2.98 | |
| | | | | | | | 9,734,440 | | | | 4.36 | |
| Data Processing & Outsourced Services |
| Visa, Inc. - Cl. A | | | 57,216 | | | | 6,844,178 | | | | 3.06 | |
| Wirecard A.G. | | | 65,909 | | | | 7,812,956 | | | | 3.50 | |
| | | | | | | | 14,657,134 | | | | 6.56 | |
| Distillers & Vintners | | | | | | | | | | | | |
| Constellation Brands, Inc. - Cl. A | | | 10,334 | | | | 2,355,325 | | | | 1.05 | |
| | | | | | | | | | | | | |
| General Merchandise Stores | | | | | | | | | | | | |
| Dollarama, Inc. | | | 37,840 | | | | 4,598,896 | | | | 2.06 | |
| | | | | | | | | | | | | |
| Health Care Equipment | | | | | | | | | | | | |
| Intuitive Surgical, Inc.* | | | 18,196 | | | | 7,511,855 | | | | 3.36 | |
| | | | | | | | | | | | | |
| Home Entertainment Software | | | | | | | | | | | | |
| Nintendo Co., Ltd. | | | 13,000 | | | | 5,775,550 | | | | 2.58 | |
| Ubisoft Entertainment S.A.* | | | 79,110 | | | | 6,695,236 | | | | 3.00 | |
| | | | | | | | 12,470,786 | | | | 5.58 | |
| Industrial Machinery | | | | | | | | | | | | |
| FANUC Corporation | | | 18,000 | | | | 4,632,355 | | | | 2.07 | |
| | | | | | | | | | | | | |
| Internet & Direct Marketing Retail | | | | | | | | | | | | |
| Amazon.com, Inc.* | | | 7,294 | | | | 10,556,898 | | | | 4.72 | |
| Netflix, Inc.* | | | 25,179 | | | | 7,436,618 | | | | 3.33 | |
| | | | | | | | 17,993,516 | | | | 8.05 | |
| Internet Software & Services | | | | | | | | | | | | |
| Alibaba Group Holding Ltd. Spon. ADR* | | | 60,214 | | | | 11,051,678 | | | | 4.94 | |
| Alphabet, Inc. - Cl. A* | | | 9,218 | | | | 9,560,356 | | | | 4.28 | |
| Facebook, Inc. - Cl. A* | | | 51,168 | | | | 8,176,135 | | | | 3.66 | |
| Match Group, Inc.* | | | 105,852 | | | | 4,704,063 | | | | 2.11 | |
| Tencent Holdings Ltd. | | | 196,700 | | | | 10,558,765 | | | | 4.72 | |
| | | | | | | | 44,050,997 | | | | 19.71 | |
| IT Consulting & Other Services | | | | | | | | | | | | |
| InterXion Holding N.V.* | | | 94,932 | | | | 5,896,226 | | | | 2.64 | |
| | | | | | | | | | | | | |
| Managed Health Care | | | | | | | | | | | | |
| UnitedHealth Group, Inc. | | | 30,295 | | | | 6,483,130 | | | | 2.90 | |
| | | | | | | | | | | | |
| Restaurants | | | | | | | | | | | | |
| Domino's Pizza Enterprises Ltd. | | | 132,563 | | | $ | 4,271,487 | | | | 1.91 | % |
| | | | | | | | | | | | | |
| Semiconductor Equipment | | | | | | | | | | | | |
| Applied Materials, Inc. | | | 114,303 | | | | 6,356,390 | | | | 2.84 | |
| ASML Holding N.V. | | | 28,641 | | | | 5,679,322 | | | | 2.54 | |
| | | | | | | | 12,035,712 | | | | 5.38 | |
| Semiconductors | | | | | | | | | | | | |
| NVIDIA Corporation | | | 28,426 | | | | 6,583,177 | | | | 2.95 | |
| | | | | | | | | | | | | |
| Specialty Chemicals | | | | | | | | | | | | |
| The Sherwin-Williams Company | | | 11,529 | | | | 4,520,751 | | | | 2.02 | |
| | | | | | | | | | | | | |
| Systems Software | | | | | | | | | | | | |
| Microsoft Corporation | | | 78,582 | | | | 7,172,179 | | | | 3.21 | |
| | | | | | | | | | | | | |
| Technology Hardware, Storage & Peripherals |
| Apple, Inc. | | | 58,928 | | | | 9,886,940 | | | | 4.42 | |
| | | | | | | | | | | | | |
| TOTAL COMMON STOCKS | | | | | | | | | | | | |
| (Cost $193,242,714) | | | | | | | 207,816,345 | | | | 92.97 | |
| | | | | | | | | | | | | |
| SHORT-TERM INVESTMENTS |
| State Street Institutional Treasury Money Market Fund, 0.017% | | | 18,505,161 | | | | 18,505,161 | | | | 8.28 | |
| | | | | | | | | | | | | |
| TOTAL SHORT-TERM INVESTMENTS | | | | | | | | | | | | |
| (Cost $18,505,161) | | | | | | | 18,505,161 | | | | 8.28 | |
| | | | | | | | | | | | | |
| TOTAL INVESTMENTS | | | | | | | | | | | | |
| (Cost $211,747,875) | | | | | | | 226,321,506 | | | | 101.25 | |
| | | | | | | | | | | | | |
| Liabilities, Less Cash and Other Assets | | | | | | | (2,804,205 | ) | | | (1.25 | ) |
| | | | | | | | | | | | | |
| NET ASSETS | | | | | | $ | 223,517,301 | | | | 100.00 | % |
| SUMMARY OF INVESTMENTS BY COUNTRY |
| Country | | Market Value | | | Percent of
Investment
Securities | |
| Australia | | $ | 4,271,487 | | | | 1.89 | % |
| Canada | | | 4,598,896 | | | | 2.03 | |
| China/Hong Kong | | | 21,610,443 | | | | 9.55 | |
| France | | | 19,803,771 | | | | 8.75 | |
| Germany | | | 7,812,956 | | | | 3.45 | |
| Ireland | | | 6,861,664 | | | | 3.03 | |
| Japan | | | 10,407,905 | | | | 4.60 | |
| Netherlands | | | 11,575,548 | | | | 5.12 | |
United States(1) | | | 139,378,836 | | | | 61.58 | |
| | | $ | 226,321,506 | | | | 100.00 | % |
(1) | Includes short-term securities. |
| See notes to financial statements. |
32
INVESTMENT REVIEW BY TOM MARSICO (UNAUDITED)
The Marsico Global Fund posted a total return of (US$) +11.08% for the six-month fiscal period ended March 31, 2018. The Fund substantially outperformed the MSCI All Country World Index (“MSCI ACWI Index”), the Fund’s benchmark index, which had a total return of (US$) +4.71% over the same time period. The MSCI ACWI Index measures equity market performance in the global developed and emerging markets. Please see the Fund’s Overview for more detailed information about the Fund’s longer-term performance for various time periods ended March 31, 2018.
The performance data for the Fund quoted here represent past performance, and past performance is not a guarantee of future results. Investment return and principal value of an investment will fluctuate so that an investor’s shares, when redeemed, may be worth more or less than their original cost. Current performance may be lower or higher than the performance information quoted. To obtain performance information current to the most recent month-end, please call 888-860-8686 or visit marsicofunds.com.(1)
This review highlights Fund performance over a six-month fiscal period. Shareholders should keep in mind that the Fund is intended for long-term investors who hold their shares for substantially longer periods of time. You should also keep in mind that our current views and beliefs regarding all investments discussed in this report are subject to change at any time. References to specific securities, industries, and sectors discussed in this report are not recommendations to buy or sell such securities or related investments, and the Fund may not necessarily hold these securities or investments today. Please see the accompanying Schedule of Investments for the percentage of the Fund’s portfolio represented by the securities mentioned in this report as of the end of the reporting period.
Foreign investments present additional risks due to currency fluctuations, economic and political factors, lower liquidity, differences in securities regulations and accounting standards, possible changes in taxation, limited public information, and other factors. In addition, the Fund is subject to broad risks associated with investing in equity securities markets generally, including the risks that the securities and markets in which it invests may experience volatility and instability, that domestic and global economies and markets may undergo periods of cyclical change and decline, that investors may at times avoid investments in equity securities, and that investments may not perform as anticipated. Please see the Prospectus for more information.
The Fund is not managed to track the benchmark index, and may hold a substantially overweight or underweight position in a sector, industry, or security compared to its weight in the benchmark. The Fund may be subject to risks associated with a particular sector or other area in which it is overweight, including the risk that the stocks of companies within one area could simultaneously decline in price because of an event that affects the entire area. For informational purposes, the discussion below may compare the benchmark weight or performance of a sector or industry to the investment approach of the Fund.
The Global Fund’s strong outperformance during the six-month period ended March 31, 2018 versus the MSCI ACWI Index was primarily attributable to stock selection in the Consumer Discretionary and Information Technology sectors.
Stock prices of several Consumer Discretionary companies performed strongly during the reporting period, primarily in the Retailing industry group. Streaming content provider Netflix, Inc. returned +63% and was the largest positive contributor during the period. The company has continued to penetrate the growing market of streaming content and, in our opinion, is adopting the right strategy in building content as rapidly as possible. Recently, Netflix has begun increasing subscription prices as well, hence improving already high operating margins. The current management team, headed by Reed Hastings and Ted Sarandos, has been extremely successful in securing great talent and high-quality content, and we believe it has the right strategy for continued success.
Online e-commerce platform Amazon.com, Inc. was also a strong positive contributor during the period, returning +50%. Amazon continues to benefit from consumers’ preference to shop online, and has been adding new features to its Prime membership offering, leading to substantial growth. Advertising and cloud computing remain large opportunities for the company.
The Fund’s holdings in the Information Technology sector, in aggregate, beat the return of the MSCI ACWI Index and boosted returns. Chinese conglomerate Tencent Holdings Ltd. (+22%) performed well as we believe the company is in the early stages of monetizing its WeChat asset. With over 1 billion users on the platform, WeChat appears likely to drive significant revenue for Tencent through advertising, cloud, and gaming services faster than expectations given management’s demonstrated ability to extract significant profits from scaled assets.
Also in the Software & Services Industry Group, global payments company Wirecard A.G. (+29%) posted strong returns. Wirecard benefits as cash payments give way to electronic payments around the world, e-commerce grows, and Wirecard assists in processing these transactions. Wirecard has been consistently winning global accounts and taking share from legacy competitors and continues to grow revenues by +20% annually.
33
From a portfolio positioning standpoint, another positive performer was Health Care company G1 Therapeutics, Inc. (+26%), which was added during the period. The company announced positive results for its leading drug for the treatment of small cell lung cancer. The data appeared in a proof-of-concept study for the use of the drug in combination with chemotherapy with the goal of reducing serious side effects seen with chemotherapy alone. As a result of the study, the company will continue to research the treatment in additional small cell lung cancer patients and breast cancer as well.
The Fund’s performance also was aided by having overweight allocations to the strongest-performing sectors of the MSCI ACWI Index, Information Technology and Consumer Discretionary. In addition, the Fund’s returns were assisted by an underweight allocation in the Consumer Staples sector, and by having no exposure to the Telecommunication Services and Utilities sectors, which were weak performing sectors during the period.
A position in the Health Care sector didn’t perform as we anticipated and was sold during the period. Celgene Corporation (-33% prior to being sold) halted a drug trial on one product and struggled with another lead product for psoriatic arthritis, which caused us to sell the position.
One position in the Retailing sector, Ctrip.com International, Ltd. ADR (-12%) underperformed over the period due to a change in Chinese regulations restricting the sale of premium add-on features along with airline tickets. This change in regulation impacted the entire Chinese online travel agency industry as well as the broader airline industry. Nevertheless, as the largest player in Chinese transportation and hotel booking, Ctrip is best equipped to adjust to the regulatory changes and take market share. We are encouraged by Ctrip’s position as the leader in the Chinese travel market, and revenue growth should accelerate as we progress through the year.
The Fund’s performance was minimally held back by having an underweight allocation to the Financials and Energy sectors of the MSCI ACWI Index. Additionally, the Fund was slightly held back relative to its benchmark index by maintaining a 5% average cash weight during the period. A Fund occasionally may hold more cash than usual as a temporary defensive measure, or as a strategic measure enabling it to take rapid advantage of opportunities to buy stocks at favorable prices.
Although active currency management is not a central facet of the Fund’s investment process, fluctuations in major world currencies can at times affect the Fund’s performance. During the period, the net effect of currency moves had no discernible significant effect on Fund performance.
During the period, the Fund increased its allocations to the Industrials and Consumer Discretionary sectors. The Fund reduced its positions in the Consumer Staples, Health Care and Information Technology sectors and liquidated its positions in the Financials sector. There was no significant change to the Fund’s allocation to the Materials sector.
Fiscal Period-End Investment Posture
As of March 31, 2018, the Fund’s primary economic sector allocations were Information Technology, Consumer Discretionary, and Health Care. The Fund had no investments in the Real Estate, Energy, Telecommunication Services, Financials or Utilities sectors.
The Fund’s most significant country allocations were in the United States, China/Hong Kong, France, Netherlands and Japan. Country-level weightings generally should be considered a residual of the Fund’s stock selection process rather than a major, proactive facet of its investment strategy.
Sincerely,
THOMAS F. MARSICO
PORTFOLIO MANAGER
(1) | Total returns are based on net change in net asset value assuming reinvestment of distributions. Periodically, certain fees and expenses have been waived or reimbursed by the Adviser for the Global Fund. In the absence of such a waiver or reimbursement, the performance returns reflected would have been reduced. In accordance with the expense limitation and fee waiver agreement, the Adviser may recoup fees and expenses previously waived or reimbursed under certain parameters. Periodically, the Adviser has recouped such fees or expenses from the Global Fund, resulting in a lower performance return. Please see the Prospectus for more information. |
34
March 31, 2018 (Unaudited)
The Global Fund is a diversified portfolio and invests primarily in the common stocks of US and foreign companies that are selected for their long-term growth potential. The Fund may invest in an unlimited number of companies of any size that are economically tied to any countries or markets throughout the world, including securities of companies economically tied to emerging markets. Under normal market conditions, the Fund will invest significantly (generally, at least 40% of its net assets) in the securities of issuers organized or located outside the US or doing business outside the US or other foreign securities (unless market conditions are not deemed favorable by the Adviser, in which case the Fund generally will invest at least 30% of its assets in such foreign securities). The Fund will invest its assets in various regions and countries, including the US, that encompass not less than three different countries overall.
TOTAL ANNUAL OPERATING EXPENSES* 1.80% NET EXPENSES*† 1.50% | NET ASSETS $51,813,945 | NET ASSET VALUE PER SHARE $15.38 |
GROWTH OF $10,000(1)(2) | PERFORMANCE COMPARISON |
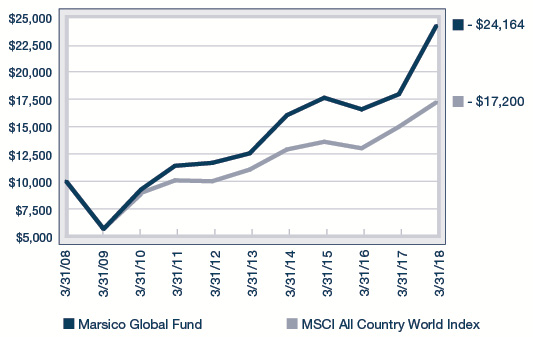 | 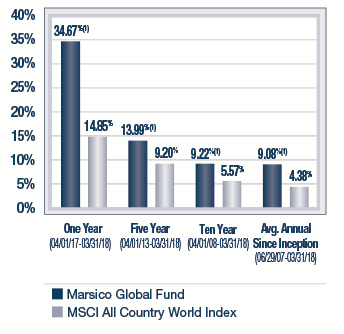 |
SECTOR ALLOCATION(3) | TOP FIVE HOLDINGS |
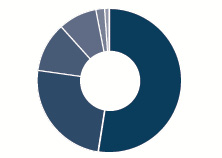 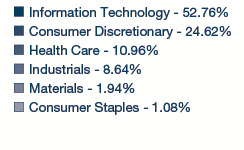
| | | | |
| | Alibaba Group Holding Ltd. Spon. ADR | 4.96% | |
| | Amazon.com, Inc. | 4.72% | |
| | Tencent Holdings Ltd. | 4.70% | |
| | salesforce.com, inc. | 4.18% | |
| | Facebook, Inc. - Cl. A | 3.65% | |
| | | | |
* | The Total Annual Operating Expenses and Net Expenses are reflective of the information disclosed in the Funds’ Prospectus dated January 31, 2018 and may differ from the expense ratios disclosed in this report. |
† | Marsico Captial Management, LLC (“the Adviser”) has entered into a written expense limitation and fee waiver agreement under which it has agreed to limit the total expenses of the Global Fund (excluding taxes, interest, acquired fund fees and expenses, litigation, extraordinary expenses, brokerage and other transaction expenses relating to the purchase or sale of portfolio investments) to an annual rate of 1.50% of the Fund’s average net assets until January 31, 2019. This expense limitation and fee waiver agreement may be terminated by the Adviser at any time after January 31, 2019 upon 15 days prior notice to the Fund and its administrator. The Adviser may recoup from the Fund fees previously waived or expenses previously reimbursed by the Adviser with respect to that Fund pursuant to this agreement (or a previous expense limitation agreement) if: (1) such recoupment by the Adviser does not cause the Fund, at the time of recoupment, to exceed the lesser of (a) the expense limitation in effect at the time the relevant amount was waived and/or reimbursed, or (b) the expense limitation in effect at the time of the proposed recoupment, and (2) the recoupment is made within three years after the fiscal year end date as of which the amount to be waived or reimbursed was determined and the waiver or reimbursement occurred. |
| The performance data quoted here represent past performance, and past performance is not a guarantee of future results. Investment return and principal value of an investment will fluctuate so that an investor’s shares, when redeemed, may be worth more or less than their original cost. Current performance may be lower or higher than the performance information quoted. To obtain performance information current to the most recent month-end, please call 888-860-8686 or visit marsicofunds.com. |
| The performance included in the chart and graph does not reflect the deduction of taxes on Fund distributions or the redemption of Fund shares. |
| All indices are unmanaged and investors cannot invest directly in an index. |
| The MSCI ACWI (All Country World Index) Index is a free float-adjusted market capitalization index that is designed to measure equity market performance in the global developed and emerging markets. |
(1) | Periodically, certain fees and expenses have been waived or reimbursed by the Adviser for the Global Fund. In the absence of such a waiver or reimbursement, the performance returns reflected would have been reduced. In accordance with the expense limitation and fee waiver agreement, the Adviser may recoup fees and expenses previously waived or reimbursed under certain parameters. Periodically, the Adviser has recouped such fees or expenses from the Global Fund, resulting in a lower performance return. |
(2) | This chart assumes an initial investment of $10,000 made on March 31, 2008. Total returns are based on change in NAV, assuming reinvestment of distributions. |
(3) | Sector weightings represent the percentage of the Fund’s investments (excluding cash equivalents) in certain general sectors. These sectors may include more than one industry. The Fund’s portfolio composition is subject to change at any time. |
35
MARSICO GLOBAL FUND
SCHEDULE OF INVESTMENTS
March 31, 2018 (Unaudited)
| | | Number
of
Shares | | | Value | | | Percent
of Net
Assets | |
| COMMON STOCKS | | | | | | | | | |
| Aerospace & Defense | | | | | | | | | |
| Airbus SE | | | 12,920 | | | $ | 1,495,589 | | | | 2.89 | % |
| | | | | | | | | | | | | |
| Airlines | | | | | | | | | | | | |
| Ryanair Holdings PLC Spon. ADR* | | | 12,677 | | | | 1,557,369 | | | | 3.01 | |
| | | | | | | | | | | | | |
| Apparel, Accessories & Luxury Goods | | | | | | | | | | | | |
| Hermes International | | | 2,665 | | | | 1,579,682 | | | | 3.05 | |
| | | | | | | | | | | | | |
| Application Software | | | | | | | | | | | | |
| salesforce.com, inc.* | | | 18,643 | | | | 2,168,181 | | | | 4.18 | |
| Snap, Inc. - Cl. A* | | | 60,087 | | | | 953,581 | | | | 1.84 | |
| | | | | | | | 3,121,762 | | | | 6.02 | |
| Biotechnology | | | | | | | | | | | | |
| G1 Therapeutics, Inc.* | | | 15,487 | | | | 573,793 | | | | 1.11 | |
| Vertex Pharmaceuticals, Inc.* | | | 9,627 | | | | 1,569,009 | | | | 3.03 | |
| | | | | | | | 2,142,802 | | | | 4.14 | |
| Data Processing & Outsourced Services | | | | | | | | | | | | |
| Visa, Inc. - Cl. A | | | 13,173 | | | | 1,575,754 | | | | 3.04 | |
| Wirecard A.G. | | | 14,895 | | | | 1,765,677 | | | | 3.41 | |
| | | | | | | | 3,341,431 | | | | 6.45 | |
| Distillers & Vintners | | | | | | | | | | | | |
| Constellation Brands, Inc. - Cl. A | | | 2,364 | | | | 538,803 | | | | 1.04 | |
| | | | | | | | | | | | | |
| General Merchandise Stores | | | | | | | | | | | | |
| B&M European Value Retail S.A. | | | 176,088 | | | | 966,598 | | | | 1.87 | |
| Dollarama, Inc. | | | 8,914 | | | | 1,083,365 | | | | 2.09 | |
| | | | | | | | 2,049,963 | | | | 3.96 | |
| Health Care Equipment | | | | | | | | | | | | |
| Intuitive Surgical, Inc.* | | | 4,356 | | | | 1,798,288 | | | | 3.47 | |
| | | | | | | | | | | | | |
| Home Entertainment Software | | | | | | | | | | | | |
| Nintendo Co., Ltd. | | | 2,900 | | | | 1,288,392 | | | | 2.49 | |
| Ubisoft Entertainment S.A.* | | | 18,459 | | | | 1,562,222 | | | | 3.01 | |
| | | | | | | | 2,850,614 | | | | 5.50 | |
| Hotels, Resorts & Cruise Lines | | | | | | | | | | | | |
| Norwegian Cruise Line Holdings Ltd.* | | | 17,815 | | | | 943,661 | | | | 1.82 | |
| | | | | | | | | | | | | |
| Industrial Machinery | | | | | | | | | | | | |
| FANUC Corporation | | | 4,900 | | | | 1,261,030 | | | | 2.43 | |
| | | | | | | | | | | | | |
| Internet & Direct Marketing Retail | | | | | | | | | | | | |
| Amazon.com, Inc.* | | | 1,687 | | | | 2,441,662 | | | | 4.72 | |
| Ctrip.com International, Ltd. ADR* | | | 19,019 | | | | 886,666 | | | | 1.71 | |
| Netflix, Inc.* | | | 6,074 | | | | 1,793,956 | | | | 3.46 | |
| | | | | | | | 5,122,284 | | | | 9.89 | |
| Internet Software & Services | | | | | | | | | | | | |
| Alibaba Group Holding Ltd. Spon. ADR* | | | 14,000 | | | $ | 2,569,560 | | | | 4.96 | % |
| Alphabet, Inc. - Cl. A* | | | 1,645 | | | | 1,706,095 | | | | 3.29 | |
| Facebook, Inc. - Cl. A* | | | 11,824 | | | | 1,889,357 | | | | 3.65 | |
| Match Group, Inc.* | | | 23,724 | | | | 1,054,295 | | | | 2.04 | |
| Tencent Holdings Ltd. | | | 45,400 | | | | 2,437,051 | | | | 4.70 | |
| | | | | | | | 9,656,358 | | | | 18.64 | |
| IT Consulting & Other Services | | | | | | | | | | | | |
| InterXion Holding N.V.* | | | 25,202 | | | | 1,565,296 | | | | 3.02 | |
| | | | | | | | | | | | | |
| Managed Health Care | | | | | | | | | | | | |
| UnitedHealth Group, Inc. | | | 7,156 | | | | 1,531,384 | | | | 2.95 | |
| | | | | | | | | | | | | |
| Restaurants | | | | | | | | | | | | |
| Domino's Pizza Enterprises Ltd. | | | 42,226 | | | | 1,360,619 | | | | 2.62 | |
| Domino's Pizza, Inc. | | | 5,319 | | | | 1,242,306 | | | | 2.40 | |
| | | | | | | | 2,602,925 | | | | 5.02 | |
| Semiconductor Equipment | | | | | | | | | | | | |
| Applied Materials, Inc. | | | 25,422 | | | | 1,413,718 | | | | 2.73 | |
| ASML Holding N.V. | | | 6,752 | | | | 1,338,877 | | | | 2.58 | |
| | | | | | | | 2,752,595 | | | | 5.31 | |
| Semiconductors | | | | | | | | | | | | |
| NVIDIA Corporation | | | 6,375 | | | | 1,476,386 | | | | 2.85 | |
| | | | | | | | | | | | | |
| Specialty Chemicals | | | | | | | | | | | | |
| The Sherwin-Williams Company | | | 2,469 | | | | 968,144 | | | | 1.87 | |
| | | | | | | | | | | | | |
| Systems Software | | | | | | | | | | | | |
| Microsoft Corporation | | | 17,331 | | | | 1,581,800 | | | | 3.05 | |
| | | | | | | | | | | | | |
| TOTAL COMMON STOCKS | | | | | | | | | | | | |
| (Cost $34,647,485) | | | | | | | 49,938,166 | | | | 96.38 | |
| | | | | | | | | | | | | |
| SHORT-TERM INVESTMENTS | | | | | | | | | | | | |
| State Street Institutional Treasury Money Market Fund, 0.017% | | | 1,517,642 | | | | 1,517,642 | | | | 2.93 | |
| | | | | | | | | | | | | |
| TOTAL SHORT-TERM INVESTMENTS | | | | | | | | | | | | |
| (Cost $1,517,642) | | | | | | | 1,517,642 | | | | 2.93 | |
| | | | | | | | | | | | | |
| TOTAL INVESTMENTS | | | | | | | | | | | | |
| (Cost $36,165,127) | | | | | | | 51,455,808 | | | | 99.31 | |
| | | | | | | | | | | | | |
| Cash and Other Assets, Less Liabilities | | | | | | | 358,137 | | | | 0.69 | |
| | | | | | | | | | | | | |
| NET ASSETS | | | | | | $ | 51,813,945 | | | | 100.00 | % |
| See notes to financial statements. |
36
| SUMMARY OF INVESTMENTS BY COUNTRY |
| Country | | Market Value | | | Percent of
Investment
Securities | |
| Australia | | $ | 1,360,619 | | | | 2.64 | % |
| Canada | | | 1,083,365 | | | | 2.11 | |
| China/Hong Kong | | | 5,893,277 | | | | 11.45 | |
| France | | | 4,637,493 | | | | 9.01 | |
| Germany | | | 1,765,677 | | | | 3.43 | |
| Ireland | | | 1,557,369 | | | | 3.03 | |
| Japan | | | 2,549,422 | | | | 4.96 | |
| Netherlands | | | 2,904,173 | | | | 5.64 | |
| United Kingdom | | | 966,598 | | | | 1.88 | |
United States(1) | | | 28,737,815 | | | | 55.85 | |
| | | $ | 51,455,808 | | | | 100.00 | % |
(1) | Includes short-term securities. |
| See notes to financial statements. |
37
STATEMENTS OF ASSETS AND LIABILITIES
March 31, 2018 (Unaudited)
| (Amounts in thousands) | | MARSICO
FOCUS FUND | | | MARSICO
GROWTH FUND | |
| | | | | | | |
| ASSETS | | | | | | |
| Investments, at value (cost $375,906, $179,971, $218,718, $53,618, $211,748, and $36,165, respectively) | | $ | 571,916 | | | $ | 273,254 | |
| Cash | | | 171 | | | | 85 | |
| Foreign currency (cost $0, $0, $0, $3, $1,256, and $0, respectively) | | | — | | | | — | |
| Receivable for investments sold | | | — | | | | — | |
| Receivable for capital stock sold | | | 52 | | | | 94 | |
| Interest and dividends receivable | | | 328 | | | | 67 | |
| Prepaid expenses and other assets | | | 3,036 | | | | 1,098 | |
| Total Assets | | | 575,503 | | | | 274,598 | |
| | | | | | | | | |
| LIABILITIES | | | | | | | | |
| Payable for investments purchased | | | — | | | | — | |
| Payable for capital stock redeemed | | | 344 | | | | 173 | |
| Payable to investment adviser | | | 381 | | | | 187 | |
| Accrued trustees' fees | | | 3,039 | | | | 1,084 | |
| Accrued distribution fee | | | 4,033 | | | | 1,681 | |
| Accrued professional fees | | | 47 | | | | 23 | |
| Accrued transfer agent fees and expenses | | | 26 | | | | 13 | |
| Accrued printing expenses | | | 40 | | | | 18 | |
| Accrued expenses and other liabilities | | | 40 | | | | 22 | |
| Total Liabilities | | | 7,950 | | | | 3,201 | |
| | | | | | | | | |
| NET ASSETS | | $ | 567,553 | | | $ | 271,397 | |
| | | | | | | | | |
| NET ASSETS CONSIST OF | | | | | | | | |
| Paid-in-capital | | $ | 351,544 | | | $ | 161,408 | |
| Accumulated net investment loss | | | (5,964 | ) | | | (2,986 | ) |
| Accumulated net realized gain (loss) on investments and foreign currency transactions | | | 24,658 | | | | 19,149 | |
| Net unrealized appreciation on investments and foreign currency translations | | | 197,315 | | | | 93,826 | |
| NET ASSETS | | $ | 567,553 | | | $ | 271,397 | |
| | | | | | | | | |
| SHARES OUTSTANDING, $0.001 par value | | | | | | | | |
| (Unlimited shares authorized) | | | 31,197 | | | | 14,519 | |
| | | | | | | | | |
| NET ASSET VALUE, REDEMPTION PRICE, AND OFFERING PRICE PER SHARE (NET ASSETS/SHARES OUTSTANDING)* | | $ | 18.19 | | | $ | 18.69 | |
* | Not in thousands, based on unrounded net assets and shares outstanding. |
| See notes to financial statements. |
38
MARSICO
21st CENTURY FUND | | | MARSICO
INTERNATIONAL
OPPORTUNITIES
FUND | | | MARSICO
FLEXIBLE
CAPITAL FUND | | | MARSICO
GLOBAL FUND | |
| | | | | | | | | | | |
| $ | 247,426 | | | $ | 69,196 | | | $ | 226,322 | | | $ | 51,456 | |
| | 71 | | | | — | | | | 67 | | | | 3 | |
| | — | | | | 3 | | | | 1,246 | | | | — | |
| | 2,479 | | | | — | | | | 4,466 | | | | 2,040 | |
| | 8 | | | | 4 | | | | 5 | | | | 21 | |
| | 58 | | | | 117 | | | | 241 | | | | 62 | |
| | 331 | | | | 217 | | | | 1,655 | | | | 145 | |
| | 250,373 | | | | 69,537 | | | | 234,002 | | | | 53,727 | |
| | | | | | | | | | | | | | | |
| | — | | | | 234 | | | | 8,246 | | | | 1,556 | |
| | 11 | | | | 75 | | | | 103 | | | | 11 | |
| | 172 | | | | 47 | | | | 206 | | | | 38 | |
| | 323 | | | | 208 | | | | 1,648 | | | | 136 | |
| | 851 | | | | 198 | | | | 177 | | | | 146 | |
| | 19 | | | | 5 | | | | 24 | | | | 4 | |
| | 12 | | | | 6 | | | | 46 | | | | 4 | |
| | 13 | | | | 1 | | | | 12 | | | | 3 | |
| | 33 | | | | 21 | | | | 23 | | | | 15 | |
| | 1,434 | | | | 795 | | | | 10,485 | | | | 1,913 | |
| | | | | | | | | | | | | | | |
| $ | 248,939 | | | $ | 68,742 | | | $ | 223,517 | | | $ | 51,814 | |
| | | | | | | | | | | | | | | |
| $ | 542,703 | | | $ | 144,240 | | | $ | 166,672 | | | $ | 34,987 | |
| | (3,502 | ) | | | (884 | ) | | | (775 | ) | | | (826 | ) |
| | (319,154 | ) | | | (90,281 | ) | | | 42,367 | | | | 2,271 | |
| | 28,892 | | | | 15,667 | | | | 15,253 | | | | 15,382 | |
| $ | 248,939 | | | $ | 68,742 | | | $ | 223,517 | | | $ | 51,814 | |
| | | | | | | | | | | | | | | |
| | 8,519 | | | | 3,288 | | | | 15,843 | | | | 3,370 | |
| | | | | | | | | | | | | | | |
| $ | 29.22 | | | $ | 20.91 | | | $ | 14.11 | | | $ | 15.38 | |
39
STATEMENTS OF OPERATIONS
FOR THE SIX-MONTH PERIOD ENDED March 31, 2018 (Unaudited)
| (Amounts in thousands) | | MARSICO
FOCUS FUND | | | MARSICO
GROWTH FUND | |
| | | | | | | |
| INVESTMENT INCOME | | | | | | |
| Dividends (net of $34, $15, $1, $18, $16, and $8, respectively, of non-reclaimable foreign withholding taxes) | | $ | 2,043 | | | $ | 1,105 | |
| Interest | | | — | | | | — | |
| Total Investment Income | | | 2,043 | | | | 1,105 | |
| | | | | | | | | |
| EXPENSES | | | | | | | | |
| Investment advisory fees | | | 2,182 | | | | 1,088 | |
| Distribution fees | | | 618 | | | | 298 | |
| Trustees' fees and expenses | | | 316 | (1) | | | 142 | (1) |
| Professional fees | | | 156 | | | | 76 | |
| Transfer agent fees and expenses | | | 105 | | | | 54 | |
| Fund administration fees | | | 84 | | | | 68 | |
| Custody and fund accounting fees | | | 65 | | | | 45 | |
| Printing and postage expenses | | | 51 | | | | 25 | |
| Miscellaneous | | | 42 | | | | 20 | |
| Federal and state registration fees | | | 15 | | | | 13 | |
| Total Expenses | | | 3,634 | | | | 1,829 | |
| Less waiver of expenses and expenses paid indirectly | | | — | | | | — | |
| Net Expenses | | | 3,634 | | | | 1,829 | |
| | | | | | | | | |
| NET INVESTMENT INCOME (LOSS) | | | (1,591 | ) | | | (724 | ) |
| | | | | | | | | |
| REALIZED AND UNREALIZED GAIN (LOSS) | | | | | | | | |
| Net realized gain on investments | | | 24,454 | | | | 18,846 | |
| Net realized gain (loss) on foreign currency transactions | | | 587 | | | | 280 | |
| Change in unrealized appreciation (depreciation) on investments and foreign currency translations | | | 29,859 | | | | 10,365 | |
| | | | | | | | | |
| Net Gain on Investments | | | 54,900 | | | | 29,491 | |
| | | | | | | | | |
| NET INCREASE IN NET ASSETS RESULTING FROM OPERATIONS | | $ | 53,309 | | | $ | 28,767 | |
(1) | Amounts include Trustees’ fees and expenses and the mark to market unrealized appreciation during the period for shares held in the Trustees’ Deferred Fee Plan, as more fully described in Note 2(g) in the Notes to Financial Statements. |
| | | | Trustees’
Fees and
Expenses* | | | Unrealized
Appreciation* | |
Focus Fund | | | $ | 65,501 | | | $ | 250,320 | |
Growth Fund | | | | 31,647 | | | | 109,917 | |
21st Century Fund | | | | 27,303 | | | | 34,227 | |
International Opportunities Fund | | | | 7,570 | | | | 15,424 | |
Flexible Capital Fund | | | | 27,369 | | | | 32,126 | |
Global Fund | | | | 5,615 | | | | 12,044 | |
| See notes to financial statements. |
40
MARSICO
21st CENTURY FUND | | | MARSICO
INTERNATIONAL
OPPORTUNITIES
FUND | | | MARSICO
FLEXIBLE
CAPITAL FUND | | | MARSICO
GLOBAL FUND | |
| | | | | | | | | | | |
| $ | 533 | | | $ | 187 | | | $ | 2,447 | | | $ | 123 | |
| | — | | | | — | | | | 422 | | | | — | |
| | 533 | | | | 187 | | | | 2,869 | | | | 123 | |
| | | | | | | | | | | | | | | |
| | 980 | | | | 270 | | | | 953 | | | | 196 | |
| | 258 | | | | 85 | | | | 298 | | | | 61 | |
| | 62 | (1) | | | 23 | (1) | | | 59 | (1) | | | 18 | (1) |
| | 65 | | | | 20 | | | | 68 | | | | 15 | |
| | 47 | | | | 21 | | | | 198 | | | | 15 | |
| | 66 | | | | 50 | | | | 66 | | | | 39 | |
| | 51 | | | | 54 | | | | 49 | | | | 36 | |
| | 21 | | | | 6 | | | | 22 | | | | 4 | |
| | 17 | | | | 6 | | | | 23 | | | | 4 | |
| | 11 | | | | 11 | | | | 13 | | | | 10 | |
| | 1,578 | | | | 546 | | | | 1,749 | | | | 398 | |
| | — | | | | (28 | ) | | | — | | | | (23 | ) |
| | 1,578 | | | | 518 | | | | 1,749 | | | | 375 | |
| | | | | | | | | | | | | | | |
| | (1,045 | ) | | | (331 | ) | | | 1,120 | | | | (252 | ) |
| | | | | | | | | | | | | | | |
| | 64,390 | | | | 3,823 | | | | 43,834 | | | | 2,207 | |
| | 149 | | | | 127 | | | | (796 | ) | | | 416 | |
| | (36,909 | ) | | | 1,671 | | | | (36,247 | ) | | | 2,547 | |
| | | | | | | | | | | | | | | |
| | 27,630 | | | | 5,621 | | | | 6,791 | | | | 5,170 | |
| | | | | | | | | | | | | | | |
| $ | 26,585 | | | $ | 5,290 | | | $ | 7,911 | | | $ | 4,918 | |
41
STATEMENTS OF CHANGES IN NET ASSETS
| | | MARSICO
FOCUS FUND | | | MARSICO
GROWTH FUND | |
| | | | | | | | | | | | | |
| (Amounts in thousands) | | Six-Month
Period Ended
3/31/18
(Unaudited) | | | Year
Ended
9/30/17 | | | Six-Month
Period Ended
3/31/18
(Unaudited) | | | Year
Ended
9/30/17 | |
| | | | | | | | | | | | | |
| OPERATIONS: | | | | | | | | | | | | |
| Net investment income (loss) | | $ | (1,591 | ) | | $ | (3,378 | ) | | $ | (724 | ) | | $ | (1,396 | ) |
| Net realized gain on investments | | | 24,454 | | | | 91,438 | | | | 18,846 | | | | 25,336 | |
| Net realized gain (loss) on foreign currency transactions | | | 587 | | | | 222 | | | | 280 | | | | — | |
| Change in unrealized appreciation (depreciation) on investments and foreign currency translations | | | 29,859 | | | | 20,700 | | | | 10,365 | | | | 21,972 | |
| | | | | | | | | | | | | | | | | |
| Net increase in net assets resulting from operations | | | 53,309 | | | | 108,982 | | | | 28,767 | | | | 45,912 | |
| | | | | | | | | | | | | | | | | |
| DISTRIBUTIONS: | | | | | | | | | | | | | | | | |
| Net investment income | | | — | | | | — | | | | — | | | | — | |
| Net realized gains | | | (87,734 | ) | | | — | | | | (25,153 | ) | | | (2,136 | ) |
| | | | | | | | | | | | | | | | | |
| Total distributions | | | (87,734 | ) | | | — | | | | (25,153 | ) | | | (2,136 | ) |
| | | | | | | | | | | | | | | | | |
| CAPITAL SHARE TRANSACTIONS: | | | | | | | | | | | | | | | | |
| Proceeds from sales of shares | | | 18,403 | | | | 30,112 | | | | 20,344 | | | | 14,269 | |
| Proceeds from reinvestment of distributions | | | 85,196 | | | | — | | | | 24,655 | | | | 2,048 | |
| Redemption of shares | | | (61,278 | ) | | | (193,307 | ) | | | (44,138 | ) | | | (81,384 | ) |
| | | | | | | | | | | | | | | | | |
| Net increase (decrease) from capital share transactions | | | 42,321 | | | | (163,195 | ) | | | 861 | | | | (65,067 | ) |
| | | | | | | | | | | | | | | | | |
| TOTAL INCREASE (DECREASE) IN NET ASSETS | | | 7,896 | | | | (54,213 | ) | | | 4,475 | | | | (21,291 | ) |
| | | | | | | | | | | | | | | | | |
| NET ASSETS: | | | | | | | | | | | | | | | | |
| Beginning of Period | | | 559,657 | | | | 613,870 | | | | 266,922 | | | | 288,213 | |
| | | | | | | | | | | | | | | | | |
| End of Period | | $ | 567,553 | | | $ | 559,657 | | | $ | 271,397 | | | $ | 266,922 | |
| | | | | | | | | | | | | | | | | |
| Undistributed net investment income (Accumulated net investment loss) | | $ | (5,964 | ) | | $ | (4,373 | ) | | $ | (2,986 | ) | | $ | (2,262 | ) |
| | | | | | | | | | | | | | | | | |
| TRANSACTIONS IN SHARES: | | | | | | | | | | | | | | | | |
| Shares sold | | | 970 | | | | 1,762 | | | | 1,067 | | | | 864 | |
| Shares issued in reinvestment of distributions | | | 4,953 | | | | — | | | | 1,391 | | | | 137 | |
| Shares redeemed | | | (3,243 | ) | | | (11,719 | ) | | | (2,390 | ) | | | (5,100 | ) |
| | | | | | | | | | | | | | | | | |
| NET INCREASE (DECREASE) | | | 2,680 | | | | (9,957 | ) | | | 68 | | | | (4,099 | ) |
| See notes to financial statements. |
42
MARSICO
21st CENTURY FUND | | | MARSICO
INTERNATIONAL
OPPORTUNITIES FUND | | | MARSICO
FLEXIBLE
CAPITAL FUND | | | MARSICO
GLOBAL FUND | |
| | | | | | | | | | | | | | | | | | | | | | | |
Six-Month
Period Ended
3/31/18
(Unaudited) | | | Year
Ended
9/30/17 | | | Six-Month
Period Ended
3/31/18
(Unaudited) | | | Year
Ended
9/30/17 | | | Six-Month
Period Ended
3/31/18
(Unaudited) | | | Year
Ended
9/30/17 | | | Six-Month
Period Ended
3/31/18
(Unaudited) | | | Year
Ended
9/30/17 | |
| | | | | | | | | | | | | | | | | | | | | | | |
| $ | (1,045 | ) | | $ | (2,178 | ) | | $ | (331 | ) | | $ | (444 | ) | | $ | 1,120 | | | $ | 3,995 | | | $ | (252 | ) | | $ | (316 | ) |
| | 64,390 | | | | 34,718 | | | | 3,823 | | | | 9,143 | | | | 43,834 | | | | 30,234 | | | | 2,207 | | | | 4,701 | |
| | 149 | | | | (353 | ) | | | 127 | | | | (402 | ) | | | (796 | ) | | | (2,164 | ) | | | 416 | | | | 36 | |
| | (36,909 | ) | | | 6,689 | | | | 1,671 | | | | 3,642 | | | | (36,247 | ) | | | (11,428 | ) | | | 2,547 | | | | 4,001 | |
| | | | | | | | | | | | | | | | | | | | | | | | | | | | | | | |
| | 26,585 | | | | 38,876 | | | | 5,290 | | | | 11,939 | | | | 7,911 | | | | 20,637 | | | | 4,918 | | | | 8,422 | |
| | | | | | | | | | | | | | | | | | | | | | | | | | | | | | | |
| | | | | | | | | | | | | | | | | | | | | | | | | | | | | | | |
| | — | | | | — | | | | — | | | | — | | | | (3,802 | ) | | | (4,808 | ) | | | — | | | | — | |
| | — | | | | — | | | | — | | | | — | | | | (24,796 | ) | | | (21,758 | ) | | | (4,068 | ) | | | — | |
| | | | | | | | | | | | | | | | | | | | | | | | | | | | | | | |
| | — | | | | — | | | | — | | | | — | | | | (28,598 | ) | | | (26,566 | ) | | | (4,068 | ) | | | — | |
| | | | | | | | | | | | | | | | | | | | | | | | | | | | | | | |
| | 1,907 | | | | 6,114 | | | | 6,071 | | | | 3,027 | | | | 10,541 | | | | 13,810 | | | | 6,796 | | | | 3,764 | |
| | — | | | | — | | | | — | | | | — | | | | 26,998 | | | | 23,955 | | | | 3,948 | | | | — | |
| | (13,875 | ) | | | (45,448 | ) | | | (6,408 | ) | | | (14,010 | ) | | | (39,318 | ) | | | (138,944 | ) | | | (4,273 | ) | | | (11,966 | ) |
| | | | | | | | | | | | | | | | | | | | | | | | | | | | | | | |
| | (11,968 | ) | | | (39,334 | ) | | | (337 | ) | | | (10,983 | ) | | | (1,779 | ) | | | (101,179 | ) | | | 6,471 | | | | (8,202 | ) |
| | | | | | | | | | | | | | | | | | | | | | | | | | | | | | | |
| | 14,617 | | | | (458 | ) | | | 4,953 | | | | 956 | | | | (22,466 | ) | | | (107,108 | ) | | | 7,321 | | | | 220 | |
| | | | | | | | | | | | | | | | | | | | | | | | | | | | | | | |
| | 234,322 | | | | 234,780 | | | | 63,789 | | | | 62,833 | | | | 245,983 | | | | 353,091 | | | | 44,493 | | | | 44,273 | |
| | | | | | | | | | | | | | | | | | | | | | | | | | | | | | | |
| $ | 248,939 | | | $ | 234,322 | | | $ | 68,742 | | | $ | 63,789 | | | $ | 223,517 | | | $ | 245,983 | | | $ | 51,814 | | | $ | 44,493 | |
| | | | | | | | | | | | | | | | | | | | | | | | | | | | | | | |
| $ | (3,502 | ) | | $ | (2,457 | ) | | $ | (884 | ) | | $ | (553 | ) | | $ | (775 | ) | | $ | 1,907 | | | $ | (826 | ) | | $ | (574 | ) |
| | | | | | | | | | | | | | | | | | | | | | | | | | | | | | | |
| | 65 | | | | 256 | | | | 295 | | | | 181 | | | | 710 | | | | 944 | | | | 437 | | | | 267 | |
| | — | | | | — | | | | — | | | | — | | | | 1,880 | | | | 1,738 | | | | 274 | | | | — | |
| | (493 | ) | | | (1,963 | ) | | | (312 | ) | | | (893 | ) | | | (2,612 | ) | | | (9,521 | ) | | | (282 | ) | | | (1,007 | ) |
| | | | | | | | | | | | | | | | | | | | | | | | | | | | | | | |
| | (428 | ) | | | (1,707 | ) | | | (17 | ) | | | (712 | ) | | | (22 | ) | | | (6,839 | ) | | | 429 | | | | (740 | ) |
43
FINANCIAL HIGHLIGHTS
| | | MARSICO FOCUS FUND | |
For a Fund Share Outstanding
Throughout the Period | | Six-Month
Period Ended
3/31/18
(Unaudited) | | | Year
Ended
9/30/17 | | | Year
Ended
9/30/16 | | | Year
Ended
9/30/15 | | | Year
Ended
9/30/14 | | | Year
Ended
9/30/13 | |
| | | | | | | | | | | | | | | | | | | |
| Net Asset Value, Beginning of Period | | $ | 19.63 | | | $ | 15.96 | | | $ | 18.83 | | | $ | 22.41 | | | $ | 21.47 | | | $ | 20.02 | |
| | | | | | | | | | | | | | | | | | | | | | | | | |
| | | | | | | | | | | | | | | | | | | | | | | | | |
| Income from Investment Operations: | | | | | | | | | | | | | | | | | | | | | | | | |
| Net investment loss | | | (0.04 | ) | | | (0.17 | ) | | | (0.13 | ) | | | (0.10 | ) | | | (0.07 | ) | | | (0.03 | ) |
| Net realized and unrealized gains (losses) on investments | | | 1.79 | | | | 3.84 | | | | 1.25 | | | | (0.62 | ) | | | 4.46 | | | | 3.84 | |
| | | | | | | | | | | | | | | | | | | | | | | | | |
| Total from investment operations | | | 1.75 | | | | 3.67 | | | | 1.12 | | | | (0.72 | ) | | | 4.39 | | | | 3.81 | |
| | | | | | | | | | | | | | | | | | | | | | | | | |
| Distributions & Other: | | | | | | | | | | | | | | | | | | | | | | | | |
| Net investment income | | | — | | | | — | | | | — | | | | — | | | | — | | | | (0.03 | ) |
| Net realized gains | | | (3.19 | ) | | | — | | | | (3.99 | ) | | | (2.86 | ) | | | (3.45 | ) | | | (2.33 | ) |
| Redemption fees [See Note 2(h)] | | | — | | | | — | | | | — | | | | — | | | | — | (1) | | | — | (1) |
| | | | | | | | | | | | | | | | | | | | | | | | | |
| Total distributions and other | | | (3.19 | ) | | | — | | | | (3.99 | ) | | | (2.86 | ) | | | (3.45 | ) | | | (2.36 | ) |
| | | | | | | | | | | | | | | | | | | | | | | | | |
| Net Asset Value, End of Period | | $ | 18.19 | | | $ | 19.63 | | | $ | 15.96 | | | $ | 18.83 | | | $ | 22.41 | | | $ | 21.47 | |
| | | | | | | | | | | | | | | | | | | | | | | | | |
| | | | | | | | | | | | | | | | | | | | | | | | | |
| Total Return | | | 9.83 | %(2) | | | 22.99 | % | | | 5.75 | % | | | (4.15 | )% | | | 22.27 | % | | | 21.86 | % |
| | | | | | | | | | | | | | | | | | | | | | | | | |
| | | | | | | | | | | | | | | | | | | | | | | | | |
| Supplemental Data and Ratios: | | | | | | | | | | | | | | | | | | | | | | | | |
| | | | | | | | | | | | | | | | | | | | | | | | | |
| Net assets, end of period (000s) | | $ | 567,553 | | | $ | 559,657 | | | $ | 613,870 | | | $ | 788,851 | | | $ | 933,054 | | | $ | 854,708 | |
| | | | | | | | | | | | | | | | | | | | | | | | | |
| Ratio of expenses to average net assets, less waivers and before expenses paid indirectly, plus recoupment of previously waived fees or expenses paid | | | 1.27 | %(3) | | | 1.37 | % | | | 1.29 | % | | | 1.31 | % | | | 1.34 | % | | | 1.35 | % |
| | | | | | | | | | | | | | | | | | | | | | | | | |
| Ratio of net investment income (loss) to average net assets, net of waivers, recoupment of previously waived fees or expenses paid and expenses paid indirectly | | | (0.56 | )%(3) | | | (0.62 | )% | | | (0.63 | )% | | | (0.45 | )% | | | (0.35 | )% | | | (0.10 | )% |
| | | | | | | | | | | | | | | | | | | | | | | | | |
| Ratio of expenses to average net assets, before waivers, recoupment of previously waived fees or expenses paid and expenses paid indirectly | | | 1.27 | %(3) | | | 1.37 | % | | | 1.29 | % | | | 1.31 | % | | | 1.34 | % | | | 1.35 | % |
| | | | | | | | | | | | | | | | | | | | | | | | | |
| Ratio of net investment income (loss) to average net assets, before waivers, recoupment of previously waived fees or expenses paid and expenses paid indirectly | | | (0.56 | )%(3) | | | (0.62 | )% | | | (0.63 | )% | | | (0.45 | )% | | | (0.35 | )% | | | (0.10 | )% |
| | | | | | | | | | | | | | | | | | | | | | | | | |
| Portfolio turnover rate | | | 27 | %(2) | | | 67 | % | | | 45 | % | | | 68 | % | | | 71 | % | | | 92 | % |
| See notes to financial statements. |
44
MARSICO
GROWTH FUND | | | MARSICO
21st CENTURY FUND | |
Six-Month
Period Ended
3/31/18
(Unaudited) | | | Year
Ended
9/30/17 | | | Year
Ended
9/30/16 | | | Year
Ended
9/30/15 | | | Year
Ended
9/30/14 | | | Year
Ended
9/30/13 | | | Six-Month
Period Ended
3/31/18
(Unaudited) | | | Year
Ended
9/30/17 | | | Year
Ended
9/30/16 | | | Year
Ended
9/30/15 | | | Year
Ended
9/30/14 | | | Year
Ended
9/30/13 | |
| | | | | | | | | | | | | | | | | | | | | | | | | | | | | | | | | | | |
| $ | 18.47 | | | $ | 15.54 | | | $ | 20.11 | | | $ | 23.63 | | | $ | 25.03 | | | $ | 21.96 | | | $ | 26.19 | | | $ | 22.04 | | | $ | 20.38 | | | $ | 20.90 | | | $ | 18.05 | | | $ | 14.24 | |
| | | | | | | | | | | | | | | | | | | | | | | | | | | | | | | | | | | | | | | | | | | | | | | |
| | | | | | | | | | | | | | | | | | | | | | | | | | | | | | | | | | | | | | | | | | | | | | | |
| | | | | | | | | | | | | | | | | | | | | | | | | | | | | | | | | | | | | | | | | | | | | | | |
| | (0.05 | ) | | | (0.14 | ) | | | (0.13 | ) | | | (0.15 | ) | | | (0.08 | ) | | | — | (1) | | | (0.14 | ) | | | (0.29 | ) | | | (0.29 | ) | | | (0.21 | ) | | | (0.21 | ) | | | (0.09 | ) |
| | 2.02 | | | | 3.19 | | | | 1.33 | | | | (0.62 | ) | | | 4.01 | | | | 4.30 | | | | 3.17 | | | | 4.44 | | | | 1.95 | | | | (0.31 | ) | | | 3.06 | | | | 3.90 | |
| | | | | | | | | | | | | | | | | | | | | | | | | | | | | | | | | | | | | | | | | | | | | | | |
| | 1.97 | | | | 3.05 | | | | 1.20 | | | | (0.77 | ) | | | 3.93 | | | | 4.30 | | | | 3.03 | | | | 4.15 | | | | 1.66 | | | | (0.52 | ) | | | 2.85 | | | | 3.81 | |
| | | | | | | | | | | | | | | | | | | | | | | | | | | | | | | | | | | | | | | | | | | | | | | |
| | | | | | | | | | | | | | | | | | | | | | | | | | | | | | | | | | | | | | | | | | | | | | | |
| | — | | | | — | | | | — | | | | — | | | | (0.06 | ) | | | (0.04 | ) | | | — | | | | — | | | | — | | | | — | | | | — | | | | — | |
| | (1.75 | ) | | | (0.12 | ) | | | (5.77 | ) | | | (2.75 | ) | | | (5.27 | ) | | | (1.19 | ) | | | — | | | | — | | | | — | | | | — | | | | — | | | | — | |
| | — | | | | — | | | | — | | | | — | | | | — | (1) | | | — | (1) | | | — | | | | — | | | | — | | | | — | | | | — | (1) | | | — | (1) |
| | | | | | | | | | | | | | | | | | | | | | | | | | | | | | | | | | | | | | | | | | | | | | | |
| | (1.75 | ) | | | (0.12 | ) | | | (5.77 | ) | | | (2.75 | ) | | | (5.33 | ) | | | (1.23 | ) | | | — | | | | — | | | | — | | | | — | | | | — | | | | — | |
| | | | | | | | | | | | | | | | | | | | | | | | | | | | | | | | | | | | | | | | | | | | | | | |
| $ | 18.69 | | | $ | 18.47 | | | $ | 15.54 | | | $ | 20.11 | | | $ | 23.63 | | | $ | 25.03 | | | $ | 29.22 | | | $ | 26.19 | | | $ | 22.04 | | | $ | 20.38 | | | $ | 20.90 | | | $ | 18.05 | |
| | | | | | | | | | | | | | | | | | | | | | | | | | | | | | | | | | | | | | | | | | | | | | | |
| | | | | | | | | | | | | | | | | | | | | | | | | | | | | | | | | | | | | | | | | | | | | | | |
| | 11.20 | %(2) | | | 19.85 | % | | | 5.94 | % | | | (4.10 | )% | | | 17.51 | % | | | 20.92 | % | | | 11.57 | %(2) | | | 18.83 | % | | | 8.15 | % | | | (2.49 | )% | | | 15.79 | % | | | 26.76 | % |
| | | | | | | | | | | | | | | | | | | | | | | | | | | | | | | | | | | | | | | | | | | | | | | |
| | | | | | | | | | | | | | | | | | | | | | | | | | | | | | | | | | | | | | | | | | | | | | | |
| | | | | | | | | | | | | | | | | | | | | | | | | | | | | | | | | | | | | | | | | | | | | | | |
| | | | | | | | | | | | | | | | | | | | | | | | | | | | | | | | | | | | | | | | | | | | | | | |
| $ | 271,397 | | | $ | 266,922 | | | $ | 288,213 | | | $ | 410,442 | | | $ | 562,653 | | | $ | 564,766 | | | $ | 248,939 | | | $ | 234,322 | | | $ | 234,780 | | | $ | 268,384 | | | $ | 316,293 | | | $ | 312,215 | |
| | | | | | | | | | | | | | | | | | | | | | | | | | | | | | | | | | | | | | | | | | | | | | | |
| | 1.34 | %(3) | | | 1.42 | % | | | 1.37 | % | | | 1.35 | % | | | 1.37 | % | | | 1.37 | % | | | 1.29 | %(3) | | | 1.40 | % | | | 1.41 | % | | | 1.38 | % | | | 1.42 | % | | | 1.45 | % |
| | | | | | | | | | | | | | | | | | | | | | | | | | | | | | | | | | | | | | | | | | | | | | | |
| | (0.53 | )%(3) | | | (0.53 | )% | | | (0.61 | )% | | | (0.52 | )% | | | (0.34 | )% | | | 0.01 | % | | | (0.85 | )%(3) | | | (0.96 | )% | | | (1.01 | )% | | | (0.78 | )% | | | (0.88 | )% | | | (0.33 | )% |
| | | | | | | | | | | | | | | | | | | | | | | | | | | | | | | | | | | | | | | | | | | | | | | |
| | 12 | %(2) | | | 50 | % | | | 52 | % | | | 81 | % | | | 80 | % | | | 114 | % | | | 69 | %(2) | | | 28 | % | | | 44 | % | | | 94 | % | | | 83 | % | | | 102 | % |
45
FINANCIAL HIGHLIGHTS
| | | MARSICO
INTERNATIONAL OPPORTUNITIES FUND | |
For a Fund Share Outstanding
Throughout the Period | | Six-Month
Period Ended
3/31/18
(Unaudited) | | | Year
Ended
9/30/17 | | | Year
Ended
9/30/16 | | | Year
Ended
9/30/15 | | | Year
Ended
9/30/14 | | | Year
Ended
9/30/13 | |
| | | | | | | | | | | | | | | | | | | |
| Net Asset Value, Beginning of Period | | $ | 19.30 | | | $ | 15.64 | | | $ | 14.51 | | | $ | 14.72 | | | $ | 15.30 | | | $ | 12.50 | |
| | | | | | | | | | | | | | | | | | | | | | | | | |
| | | | | | | | | | | | | | | | | | | | | | | | | |
| Income from Investment Operations: | | | | | | | | | | | | | | | | | | | | | | | | |
| Net investment income (loss) | | | (0.10 | ) | | | (0.16 | ) | | | (0.20 | ) | | | (0.21 | ) | | | (0.06 | ) | | | 0.09 | |
| Net realized and unrealized gains (losses) on investments | | | 1.71 | | | | 3.82 | | | | 1.33 | | | | — | (1) | | | (0.42 | ) | | | 2.71 | |
| | | | | | | | | | | | | | | | | | | | | | | | | |
| Total from investment operations | | | 1.61 | | | | 3.66 | | | | 1.13 | | | | (0.21 | ) | | | (0.48 | ) | | | 2.80 | |
| | | | | | | | | | | | | | | | | | | | | | | | | |
| Distributions & Other: | | | | | | | | | | | | | | | | | | | | | | | | |
| Net investment income | | | — | | | | — | | | | — | | | | — | | | | (0.10 | ) | | | — | |
| Net realized gains | | | — | | | | — | | | | — | | | | — | | | | — | | | | — | |
| Redemption fees [See Note 2(h)] | | | — | | | | — | | | | — | | | | — | | | | — | (1) | | | — | (1) |
| | | | | | | | | | | | | | | | | | | | | | | | | |
| Total distributions and other | | | — | | | | — | | | | — | | | | — | | | | (0.10 | ) | | | — | |
| | | | | | | | | | | | | | | | | | | | | | | | | |
| Net Asset Value, End of Period | | $ | 20.91 | | | $ | 19.30 | | | $ | 15.64 | | | $ | 14.51 | | | $ | 14.72 | | | $ | 15.30 | |
| | | | | | | | | | | | | | | | | | | | | | | | | |
| | | | | | | | | | | | | | | | | | | | | | | | | |
| Total Return | | | 8.34 | %(2) | | | 23.40 | % | | | 7.79 | % | | | (1.43 | )% | | | (3.18 | )% | | | 22.40 | % |
| | | | | | | | | | | | | | | | | | | | | | | | | |
| | | | | | | | | | | | | | | | | | | | | | | | | |
| Supplemental Data and Ratios: | | | | | | | | | | | | | | | | | | | | | | | | |
| | | | | | | | | | | | | | | | | | | | | | | | | |
| Net assets, end of period (000s) | | $ | 68,742 | | | $ | 63,789 | | | $ | 62,833 | | | $ | 89,141 | | | $ | 175,984 | | | $ | 119,522 | |
| | | | | | | | | | | | | | | | | | | | | | | | | |
| Ratio of expenses to average net assets, less waivers and before expenses paid indirectly, plus recoupment of previously waived fees or expenses paid | | | 1.53 | %(3) | | | 1.60 | % | | | 1.60 | % | | | 1.60 | % | | | 1.60 | % | | | 1.60 | % |
| | | | | | | | | | | | | | | | | | | | | | | | | |
| Ratio of net investment income (loss) to average net assets, net of waivers, recoupment of previously waived fees or expenses paid and expenses paid indirectly | | | (0.98 | )%(3) | | | (0.77 | )% | | | (0.71 | )% | | | (0.86 | )% | | | (0.55 | )% | | | 0.61 | % |
| | | | | | | | | | | | | | | | | | | | | | | | | |
| Ratio of expenses to average net assets, before waivers, recoupment of previously waived fees or expenses paid and expenses paid indirectly | | | 1.61 | %(3) | | | 1.79 | % | | | 1.78 | % | | | 1.63 | % | | | 1.52 | % | | | 1.74 | % |
| | | | | | | | | | | | | | | | | | | | | | | | | |
| Ratio of net investment income (loss) to average net assets, before waivers, recoupment of previously waived fees or expenses paid and expenses paid indirectly | | | (1.06 | )%(3) | | | (0.96 | )% | | | (0.89 | )% | | | (0.89 | )% | | | (0.47 | )% | | | 0.47 | % |
| | | | | | | | | | | | | | | | | | | | | | | | | |
| Portfolio turnover rate | | | 20 | %(2) | | | 108 | % | | | 223 | % | | | 217 | % | | | 178 | % | | | 121 | % |
| See notes to financial statements. |
46
MARSICO
FLEXIBLE CAPITAL FUND | | | MARSICO
GLOBAL FUND | |
Six-Month
Period Ended
3/31/18
(Unaudited) | | | Year
Ended
9/30/17 | | | Year
Ended
9/30/16 | | | Year
Ended
9/30/15 | | | Year
Ended
9/30/14 | | | Year
Ended
9/30/13 | | | Six-Month
Period Ended
3/31/18
(Unaudited) | | | Year
Ended
9/30/17 | | | Year
Ended
9/30/16 | | | Year
Ended
9/30/15 | | | Year
Ended
9/30/14 | | | Year
Ended
9/30/13 | |
| | | | | | | | | | | | | | | | | | | | | | | | | | | | | | | | | | | |
| $ | 15.50 | | | $ | 15.55 | | | $ | 16.59 | | | $ | 18.39 | | | $ | 18.21 | | | $ | 15.79 | | | $ | 15.13 | | | $ | 12.03 | | | $ | 12.37 | | | $ | 14.45 | | | $ | 14.74 | | | $ | 11.51 | |
| | | | | | | | | | | | | | | | | | | | | | | | | | | | | | | | | | | | | | | | | | | | | | | |
| | | | | | | | | | | | | | | | | | | | | | | | | | | | | | | | | | | | | | | | | | | | | | | |
| | | | | | | | | | | | | | | | | | | | | | | | | | | | | | | | | | | | | | | | | | | | | | | |
| | 0.08 | | | | 0.23 | | | | 0.24 | | | | 0.09 | | | | (0.04 | ) | | | 0.04 | | | | (0.05 | ) | | | (0.14 | ) | | | (0.16 | ) | | | (0.10 | ) | | | (0.05 | ) | | | (0.02 | ) |
| | 0.43 | | | | 1.05 | | | | 0.96 | | | | (0.15 | ) | | | 2.18 | | | | 3.28 | | | | 1.64 | | | | 3.24 | | | | 1.14 | | | | (0.32 | ) | | | 1.93 | | | | 3.25 | |
| | | | | | | | | | | | | | | | | | | | | | | | | | | | | | | | | | | | | | | | | | | | | | | |
| | 0.51 | | | | 1.28 | | | | 1.20 | | | | (0.06 | ) | | | 2.14 | | | | 3.32 | | | | 1.59 | | | | 3.10 | | | | 0.98 | | | | (0.42 | ) | | | 1.88 | | | | 3.23 | |
| | | | | | | | | | | | | | | | | | | | | | | | | | | | | | | | | | | | | | | | | | | | | | | |
| | | | | | | | | | | | | | | | | | | | | | | | | | | | | | | | | | | | | | | | | | | | | | | |
| | (0.25 | ) | | | (0.24 | ) | | | (0.11 | ) | | | — | | | | — | | | | (0.09 | ) | | | — | | | | — | | | | — | | | | — | | | | — | | | | — | |
| | (1.65 | ) | | | (1.09 | ) | | | (2.13 | ) | | | (1.74 | ) | | | (1.96 | ) | | | (0.81 | ) | | | (1.34 | ) | | | — | | | | (1.32 | ) | | | (1.66 | ) | | | (2.17 | ) | | | — | |
| | — | | | | — | | | | — | | | | — | | | | — | (1) | | | — | (1) | | | — | | | | — | | | | — | | | | — | | | | — | (1) | | | — | (1) |
| | | | | | | | | | | | | | | | | | | | | | | | | | | | | | | | | | | | | | | | | | | | | | | |
| | (1.90 | ) | | | (1.33 | ) | | | (2.24 | ) | | | (1.74 | ) | | | (1.96 | ) | | | (0.90 | ) | | | (1.34 | ) | | | — | | | | (1.32 | ) | | | (1.66 | ) | | | (2.17 | ) | | | — | |
| | | | | | | | | | | | | | | | | | | | | | | | | | | | | | | | | | | | | | | | | | | | | | | |
| $ | 14.11 | | | $ | 15.50 | | | $ | 15.55 | | | $ | 16.59 | | | $ | 18.39 | | | $ | 18.21 | | | $ | 15.38 | | | $ | 15.13 | | | $ | 12.03 | | | $ | 12.37 | | | $ | 14.45 | | | $ | 14.74 | |
| | | | | | | | | | | | | | | | | | | | | | | | | | | | | | | | | | | | | | | | | | | | | | | |
| | | | | | | | | | | | | | | | | | | | | | | | | | | | | | | | | | | | | | | | | | | | | | | |
| | 3.11 | %(2) | | | 9.32 | % | | | 7.79 | % | | | (0.81 | )% | | | 12.15 | % | | | 22.34 | % | | | 11.08 | %(2) | | | 25.77 | % | | | 8.05 | % | | | (3.51 | )% | | | 13.23 | % | | | 28.06 | % |
| | | | | | | | | | | | | | | | | | | | | | | | | | | | | | | | | | | | | | | | | | | | | | | |
| | | | | | | | | | | | | | | | | �� | | | | | | | | | | | | | | | | | | | | | | | | | | | | | | |
| | | | | | | | | | | | | | | | | | | | | | | | | | | | | | | | | | | | | | | | | | | | | | | |
| | | | | | | | | | | | | | | | | | | | | | | | | | | | | | | | | | | | | | | | | | | | | | | |
| $ | 223,517 | | | $ | 245,983 | | | $ | 353,091 | | | $ | 549,213 | | | $ | 806,448 | | | $ | 805,735 | | | $ | 51,814 | | | $ | 44,493 | | | $ | 44,273 | | | $ | 66,612 | | | $ | 73,475 | | | $ | 61,383 | |
| | | | | | | | | | | | | | | | | | | | | | | | | | | | | | | | | | | | | | | | | | | | | | | |
| | 1.47 | %(3) | | | 1.47 | % | | | 1.38 | % | | | 1.37 | % | | | 1.38 | % | | | 1.41 | % | | | 1.53 | %(3) | | | 1.60 | % | | | 1.60 | % | | | 1.60 | % | | | 1.60 | % | | | 1.60 | % |
| | | | | | | | | | | | | | | | | | | | | | | | | | | | | | | | | | | | | | | | | | | | | | | |
| | 0.94 | %(3) | | | 1.46 | % | | | 1.25 | % | | | 0.53 | % | | | (0.21 | )% | | | 0.16 | % | | | (1.03 | )%(3) | | | (0.82 | )% | | | (0.60 | )% | | | (0.80 | )% | | | (0.42 | )% | | | (0.06 | )% |
| | | | | | | | | | | | | | | | | | | | | | | | | | | | | | | | | | | | | | | | | | | | | | | |
| | 1.47 | %(3) | | | 1.47 | % | | | 1.38 | % | | | 1.37 | % | | | 1.38 | % | | | 1.41 | % | | | 1.63 | %(3) | | | 1.80 | % | | | 1.69 | % | | | 1.54 | % | | | 1.66 | % | | | 1.86 | % |
| | | | | | | | | | | | | | | | | | | | | | | | | | | | | | | | | | | | | | | | | | | | | | | |
| | 0.94 | %(3) | | | 1.46 | % | | | 1.25 | % | | | 0.53 | % | | | (0.21 | )% | | | 0.16 | % | | | (1.13 | )%(3) | | | (1.02 | )% | | | (0.69 | )% | | | (0.74 | )% | | | (0.48 | )% | | | (0.32 | )% |
| | | | | | | | | | | | | | | | | | | | | | | | | | | | | | | | | | | | | | | | | | | | | | | |
| | 85 | %(2) | | | 20 | % | | | 35 | % | | | 69 | % | | | 118 | % | | | 145 | % | | | 45 | %(2) | | | 79 | % | | | 82 | % | | | 110 | % | | | 129 | % | | | 134 | % |
47
| NOTES TO FINANCIAL STATEMENTS |
NOTES TO FINANCIAL STATEMENTS March 31, 2018 (Unaudited)
The Marsico Investment Fund (the “Trust”) was organized on October 1, 1997, as a Delaware statutory trust and is registered under the Investment Company Act of 1940 (the “1940 Act”) as an open-end management investment company. The Focus Fund, Growth Fund, 21st Century Fund, International Opportunities Fund, Flexible Capital Fund, and Global Fund (collectively, the “Funds”) are separate investment portfolios of the Trust. The Focus Fund is a non-diversified fund and the Growth Fund, the 21st Century Fund, the International Opportunities Fund, the Flexible Capital Fund, and the Global Fund are diversified funds. The Focus Fund and Growth Fund commenced operations on December 31, 1997, the 21st Century Fund commenced operations on February 1, 2000, the International Opportunities Fund commenced operations on June 30, 2000, the Flexible Capital Fund commenced operations on December 29, 2006, and the Global Fund commenced operations on June 29, 2007. Trustees and officers of the Trust and employees of Marsico Capital Management, LLC (the “Adviser”) own approximately 5%, 5%, 5% and 15% of the Focus Fund’s, International Opportunities Fund’s, Flexible Capital Fund’s and Global Fund’s outstanding shares, respectively, as of March 31, 2018.
2. | Significant Accounting Policies |
The Funds qualify as investment companies under Accounting Standards Update No. 2013-08, Accounting Standard Codification Topic 946, Financial Services — Investment Companies (“ASC 946”). The following is a summary of significant accounting policies consistently followed by the Funds in the preparation of their financial statements. These policies are in conformity with Generally Accepted Accounting Principles (“GAAP”) in the United States of America for investment companies and follow the accounting guidance provided in ASC 946. The presentation of financial statements in conformity with GAAP requires management to make estimates and assumptions that affect the reported amounts and disclosures of assets and liabilities at the date of the financial statements and the reported amounts and disclosures of income and expenses during the reporting period. Actual results could differ from those estimates.
| | (a) | Investment Valuation — A security traded on a recognized stock exchange is generally valued at the last sale price prior to the closing of the principal exchange on which the security is traded. Securities traded on NASDAQ generally will be valued at the NASDAQ Official Closing Price. If no sale price is reported on the valuation date, the most current bid price will generally be used, with the exception of short option positions which will generally utilize the most current ask price. Other securities for which over-the-counter market quotations are readily available are generally valued at the last sale price. Debt securities that will mature in more than 60 days are generally valued at their bid prices furnished by a pricing service approved by the Funds’ Board of Trustees and subject to review pursuant to procedures established by, and under the general supervision of, the Board of Trustees. Debt securities that will mature in 60 days or less are valued at amortized cost, if it approximates market value. Any securities for which market quotations are not readily available are valued at their fair value as determined in good faith by the Adviser in accordance with procedures established by, and under the general supervision of, the Funds’ Board of Trustees. The Funds may use pricing services to assist in determining market value. The Board of Trustees has authorized the use of a pricing service to assist the Funds in valuing certain equity securities listed or traded on foreign security exchanges in the Funds’ portfolios in certain circumstances where there is a significant change in the value of related US-traded securities, as represented by, for example, the S&P 500 Index. |
“Fair Value Measurements and Disclosures” (the “Fair Value Statement”) defines fair value, establishes a framework for measuring fair value in GAAP, and expands disclosures about fair value measurements. Under the Fair Value Statement, various inputs are used in determining the value of the Funds’ investments.
These inputs are summarized into three broad levels and described below:
| | ● | Level 1 – quoted prices in active markets for identical investments |
| | ● | Level 2 – other significant observable inputs (including quoted prices for similar investments, interest rates, and evaluated quotations obtained from pricing services) |
| | ● | Level 3 – significant unobservable inputs (including the Fund’s assumptions that market participants would use in determining the fair value of investments) |
48
| NOTES TO FINANCIAL STATEMENTS |
The inputs or methodology used for valuing investments are not an indication of the risk associated with investing in those investments. Changes in valuation techniques may result in transfers between the levels during the reporting period. The Funds recognize transfers between the levels as of the end of each reporting period and consider securities that are purchased during the reporting period as not having transferred between levels as of the end of the reporting period. In accordance with procedures established by, and under the general supervision of, the Funds’ Board of Trustees, certain equity securities listed or traded on foreign security exchanges in the Funds’ portfolios had a fair valuation adjustment factor applied to their equity prices at the end of the reporting period and were categorized as Level 2. Application of fair valuation adjustment factors was not deemed necessary at the beginning of the reporting period and, as such, those equity securities were categorized as Level 1. These securities represent the only significant transfers between each of the three levels. As of March 31, 2018, the market value of these security transfers from Level 1 to Level 2 were (in thousands) $5,735, $8,020, $42,019, and $11,333 for the Focus Fund, Growth Fund, International Opportunities Fund, and Global Fund, respectively. The following is a summary of the fair values of the Funds’ investments in each category and economic sector as of March 31, 2018:
Fund Investments by
Major Security Type | | Level 1 | | | Level 2 | | | Level 3 | | | Total | |
| Marsico Focus Fund | | | | | | | | | | | | |
| Assets | | | | | | | | | | | | |
| Common Stocks | | | | | | | | | | | | |
| Consumer Discretionary | | $ | 68,179,885 | | | $ | 5,735,250 | | | $ | — | | | $ | 73,915,135 | |
| Consumer Staples | | | 19,194,967 | | | | — | | | | — | | | | 19,194,967 | |
| Financials | | | 52,430,377 | | | | — | | | | — | | | | 52,430,377 | |
| Health Care | | | 72,079,619 | | | | — | | | | — | | | | 72,079,619 | |
| Industrials | | | 19,405,968 | | | | — | | | | — | | | | 19,405,968 | |
| Information Technology | | | 273,966,325 | | | | 11,616,252 | | | | — | | | | 285,582,577 | |
| Materials | | | 20,476,506 | | | | — | | | | — | | | | 20,476,506 | |
| Real Estate | | | 17,801,979 | | | | — | | | | — | | | | 17,801,979 | |
| Short-term Investments | | | 11,029,309 | | | | — | | | | — | | | | 11,029,309 | |
| | | | | | | | | | | | | | | $ | 571,916,437 | |
| Marsico Growth Fund | | | | | | | | | | | | | | | | |
| Assets | | | | | | | | | | | | | | | | |
| Common Stocks | | | | | | | | | | | | | | | | |
| Consumer Discretionary | | $ | 32,842,360 | | | $ | — | | | $ | — | | | $ | 32,842,360 | |
| Consumer Staples | | | 7,645,804 | | | | — | | | | — | | | | 7,645,804 | |
| Financials | | | 27,835,629 | | | | — | | | | — | | | | 27,835,629 | |
| Health Care | | | 36,726,800 | | | | — | | | | — | | | | 36,726,800 | |
| Industrials | | | 15,560,861 | | | | — | | | | — | | | | 15,560,861 | |
| Information Technology | | | 100,471,472 | | | | 8,019,723 | | | | — | | | | 108,491,195 | |
| Materials | | | 6,933,466 | | | | — | | | | — | | | | 6,933,466 | |
| Real Estate | | | 11,575,325 | | | | — | | | | — | | | | 11,575,325 | |
| Short-term Investments | | | 25,642,947 | | | | — | | | | — | | | | 25,642,947 | |
| | | | | | | | | | | | | | | $ | 273,254,387 | |
| Marsico 21st Century Fund | | | | | | | | | | | | | | | | |
| Assets | | | | | | | | | | | | | | | | |
| Common Stocks | | | | | | | | | | | | | | | | |
| Consumer Discretionary | | $ | 41,603,261 | | | $ | — | | | $ | — | | | $ | 41,603,261 | |
| Consumer Staples | | | 12,386,406 | | | | — | | | | — | | | | 12,386,406 | |
| Financials | | | 19,659,535 | | | | — | | | | — | | | | 19,659,535 | |
| Health Care | | | 28,485,634 | | | | — | | | | — | | | | 28,485,634 | |
| Industrials | | | 33,004,570 | | | | — | | | | — | | | | 33,004,570 | |
| Information Technology | | | 70,664,128 | | | | — | | | | — | | | | 70,664,128 | |
| Materials | | | 13,638,225 | | | | — | | | | — | | | | 13,638,225 | |
| Real Estate | | | 13,844,334 | | | | — | | | | — | | | | 13,844,334 | |
| Short-term Investments | | | 14,139,665 | | | | — | | | | — | | | | 14,139,665 | |
| | | | | | | | | | | | | | | $ | 247,425,758 | |
| Marsico International Opportunities Fund | | | | | | | | | | | | | | | | |
| Assets | | | | | | | | | | | | | | | | |
| Common Stocks | | | | | | | | | | | | | | | | |
| Consumer Discretionary | | $ | 3,731,298 | | | $ | 7,370,453 | | | $ | — | | | $ | 11,101,751 | |
| Consumer Staples | | | — | | | | 3,333,451 | | | | — | | | | 3,333,451 | |
| Financials | | | 2,707,498 | | | | 8,387,949 | | | | — | | | | 11,095,447 | |
| Health Care | | | 1,505,916 | | | | 7,295,606 | | | | — | | | | 8,801,522 | |
| Industrials | | | 1,927,639 | | | | 3,610,122 | | | | — | | | | 5,537,761 | |
| Information Technology | | | 9,152,937 | | | | 13,949,437 | | | | — | | | | 23,102,374 | |
| Real Estate | | | — | | | | 1,518,423 | | | | — | | | | 1,518,423 | |
| Telecommunication Services | | | — | | | | 2,335,230 | | | | — | | | | 2,335,230 | |
| Short-term Investments | | | 2,369,753 | | | | — | | | | — | | | | 2,369,753 | |
| | | | | | | | | | | | | | | $ | 69,195,712 | |
49
| NOTES TO FINANCIAL STATEMENTS |
NOTES TO FINANCIAL STATEMENTS March 31, 2018 (Unaudited) (continued)
Fund Investments by
Major Security Type | | Level 1 | | | Level 2 | | | Level 3 | | | Total | |
| Marsico Flexible Capital Fund | | | | | | | | | | | | |
| Assets | | | | | | | | | | | | |
| Common Stocks | | | | | | | | | | | | |
| Consumer Discretionary | | $ | 22,592,412 | | | $ | 11,137,325 | | | $ | — | | | $ | 33,729,737 | |
| Consumer Staples | | | 2,355,325 | | | | — | | | | — | | | | 2,355,325 | |
| Health Care | | | 23,729,425 | | | | — | | | | — | | | | 23,729,425 | |
| Industrials | | | 6,861,664 | | | | 10,875,052 | | | | — | | | | 17,736,716 | |
| Information Technology | | | 89,222,562 | | | | 36,521,829 | | | | — | | | | 125,744,391 | |
| Materials | | | 4,520,751 | | | | — | | | | — | | | | 4,520,751 | |
| Short-term Investments | | | 18,505,161 | | | | — | | | | — | | | | 18,505,161 | |
| | | | | | | | | | | | | | | $ | 226,321,506 | |
| Marsico Global Fund | | | | | | | | | | | | | | | | |
| Assets | | | | | | | | | | | | | | | | |
| Common Stocks | | | | | | | | | | | | | | | | |
| Consumer Discretionary | | $ | 8,391,616 | | | $ | 3,906,899 | | | $ | — | | | $ | 12,298,515 | |
| Consumer Staples | | | 538,803 | | | | — | | | | — | | | | 538,803 | |
| Health Care | | | 5,472,474 | | | | — | | | | — | | | | 5,472,474 | |
| Industrials | | | 1,557,369 | | | | 2,756,619 | | | | — | | | | 4,313,988 | |
| Information Technology | | | 17,954,023 | | | | 8,392,219 | | | | — | | | | 26,346,242 | |
| Materials | | | 968,144 | | | | — | | | | — | | | | 968,144 | |
| Short-term Investments | | | 1,517,642 | | | | — | | | | — | | | | 1,517,642 | |
| | | | | | | | | | | | | | | $ | 51,455,808 | |
| | (b) | Expenses — The Funds are charged for those expenses that are directly attributable to each Fund, such as advisory and custodial fees. Expenses that are not directly attributable to a Fund are typically allocated among the Funds in proportion to their respective net assets and are in some cases allocated based on other factors. The Funds’ expenses may be reduced by advisory fee waivers, brokerage credits and uninvested cash balances earning interest or credits. Such credits are included in “Less waiver of expenses and expenses paid indirectly” on the Statements of Operations. |
Brokerage commissions may be paid to certain brokers which reduce transfer agent fees and expenses. For the six-month period ended March 31, 2018, the Funds received no such brokerage commission credits. The Funds received earnings credits on certain cash account balances which reduced transfer agent fees and expenses by less than $1 (in thousands) for the Focus Fund, Growth Fund, 21st Century Fund, International Opportunities Fund, Flexible Capital Fund, and Global Fund, respectively, for the six-month period ended March 31, 2018. Brokerage commission credits and earnings credits (if any) are included in “Less waiver of expenses and expenses paid indirectly” on the Statements of Operations.
| | (c) | Federal Income Taxes — Each Fund intends to comply with the requirements of the Internal Revenue Code of 1986, as amended (the “Internal Revenue Code”), necessary to continue to qualify as a regulated investment company and to make the requisite distributions of income to its shareholders which will be sufficient to relieve it from all or substantially all federal and state income taxes. Certain Funds may utilize earnings and profits on redemption of shares as part of the dividends paid deduction. |
| | (d) | Distributions to Shareholders — Dividends from net investment income and net realized capital gains, if any, will be declared and paid at least annually. Distributions to shareholders are recorded on the ex-dividend date. Each Fund may periodically make reclassifications among certain of its capital accounts as a result of the timing and characterization of certain income and capital gains distributions determined in accordance with federal tax regulations, which may differ from GAAP. These reclassifications are due to differing treatment for items such as foreign currency transactions, passive foreign investment companies and net investment losses. |
The Funds at times may invest in real estate investment trusts (“REITs”). REITs generally pay dividends to their investors based upon cash available from their operations and this amount may differ significantly from the REITs’ actual earnings and profits (“E&P”) determined for income tax purposes. It is common for these dividends to exceed the REITs’ taxable E&P, resulting in the excess portion of such dividends eventually being designated as a return of capital. Determination of the tax character of dividends made by REITs is typically performed by the REIT several months subsequent to the payment of the dividend. Therefore, due to timing issues, the Funds may be in a position of being required to calculate and pay required distribution amounts to their shareholders based on the best information available from the REITs, which may be prior to the final determination of the REITs’ taxable E&P, and it is possible that a portion of the Funds’ distribution amounts could include a return of capital to shareholders for federal income tax purposes.
| | (e) | Foreign Currency Translation — The accounting records of the Funds are maintained in US dollars. For valuation purposes, values of securities denominated in foreign currencies are translated into US dollars at 4:00 p.m. Eastern Time. Amounts related to the purchase and sale of foreign securities and investment income are translated at the rates of exchange prevailing on the respective dates of such transactions. |
50
| NOTES TO FINANCIAL STATEMENTS |
Reported realized gains and losses on foreign currency transactions arise from sales of portfolio securities, forward foreign currency contracts, currency gains or losses realized between the trade and settlement dates on securities transactions, and the difference between the amounts of dividends, interest, and foreign withholding taxes recorded on the Funds’ books and the US dollar equivalent of the amounts actually received or paid.
The Funds do not isolate that portion of the results of operations resulting from changes in foreign exchange rates on investments from the fluctuations arising from changes in market prices of securities held at the end of the reporting period. Net unrealized appreciation or depreciation on investments and foreign currency translations arises from changes in the value of assets and liabilities, including investments in securities at the end of the reporting period, resulting from changes in the exchange rates and changes in market prices of securities held. Transactions in foreign-denominated assets may involve greater risks than domestic transactions, including currency risk, political and economic risk, regulatory risk and market risk.
| | (f) | Derivative Instruments — “Disclosure about Derivative Instruments and Hedging Activities” (the “Derivatives Statement”) requires enhanced disclosures about the Funds’ derivative and hedging activities, including how such activities are accounted for and their effects on the Funds’ financial position, performance and cash flows. |
The Funds are not intended as vehicles for investing substantially in derivative instruments, and may hold derivative instruments only infrequently. The Funds enter into derivative instruments in order to increase exposure to certain investments, asset classes, or markets, or for hedging purposes to hedge against adverse movements in securities prices, currency rates or interest rates. The Funds can hold various types of derivative instruments such as futures contracts and options on securities, financial indexes, and foreign currencies, options on futures, forward foreign currency contracts, interest rate swaps, credit default swaps, and swap-related products. The use of derivative instruments may involve risks such as the possibility of illiquid markets or imperfect correlation between the value of the derivative instruments and the underlying securities, or that the counterparty will fail to perform its obligations. There were no outstanding derivative instruments held by the Funds as of March 31, 2018 nor did the Funds utilize derivative instruments during the six-month period ended March 31, 2018.
| | (g) | Trustees’ Deferred Fee Plan — Effective February 1, 2000, the Board of Trustees adopted the Marsico Investment Fund Deferred Fee Plan (the “Deferred Fee Plan”), amended and restated as of December 30, 2005, which allows the Trustees to defer the receipt of all or a portion of their compensation received from the Funds. Any deferred fees are credited to accounts established on behalf of the Trustees into the Funds as directed by each Trustee. The amounts credited to these accounts increase or decrease in accordance with the performance of the Funds selected by the Trustees. The market value of the deferred account balances as of March 31, 2018 is shown on the Statements of Assets and Liabilities as part of an asset account, “Prepaid expenses and other assets”, and a liability account, “Accrued trustees’ fees”. Additionally, the fluctuation of the account balances due to the Funds’ performance is recorded by the Funds as unrealized appreciation (depreciation), which is shown as part of “Net unrealized appreciation on investments and foreign currency translations” on the Statements of Assets and Liabilities, and as compensation expense, which is shown as part of the expense account “Trustees’ fees and expenses” on the Statements of Operations. Fees earned and deferred by the Trustees for the six-month period ended March 31, 2018 are also included in “Trustees’ fees and expenses” on the Statements of Operations. Amounts contributed to the Deferred Fee Plan will be deferred until distributed in accordance with the Deferred Fee Plan. Unrealized appreciation (depreciation) of Fund shares held in the Deferred Fee Plan is subject to the Funds’ expense reimbursement agreement with the Adviser. |
| | (h) | Redemption Fee — Effective January 31, 2014, the Funds’ Board of Trustees approved the elimination of redemption fees from Fund share transactions placed on and after January 31, 2014. Prior to January 31, 2014, a 2.00% redemption fee was retained by the Funds to offset transaction costs and other expenses associated with short-term investing. The fee was imposed on certain redemptions or exchanges of shares held 30 days or less from their purchase date. Redemption fees were recorded by the Funds as a reduction of shares redeemed and as a credit to paid-in-capital. |
| | (i) | Other — Investment transactions are accounted for on a trade date basis. Each Fund determines the gain or loss realized from the investment transactions by comparing the original cost of the security lot sold with the net sale proceeds. Dividend income is recognized on the ex-dividend date. Certain dividends from foreign securities are recorded when the Funds are informed of the dividend if such information is obtained subsequent to the ex-dividend date. Interest income is recognized on an accrual basis and includes amortization of premiums and accretion of discounts. |
| | (j) | Indemnifications — In the normal course of business, the Funds enter into contracts that contain provisions indemnifying other parties against specified potential liabilities. Each Fund’s maximum exposure under these arrangements is unknown as this would involve future claims that may be made against the Fund that have not yet occurred. However, based on experience, the Funds expect the risk of loss in connection with these potential indemnification obligations to be remote. There can be no assurance that material liabilities related to such obligations will not arise in the future, which may adversely impact a Fund. |
51
| NOTES TO FINANCIAL STATEMENTS |
NOTES TO FINANCIAL STATEMENTS March 31, 2018 (Unaudited) (continued)
3. | Investment Advisory Agreement and Transactions With Affiliates |
Each Fund has an agreement with the Adviser to furnish investment advisory services to the Funds. Each Fund pays the Adviser a fee calculated using the following rates:
Annual Rate of Average Daily Net Assets | Asset Threshold |
0.80% | First $250 million |
0.75% | Next $250 million |
0.70% | Next $250 million |
0.65% | In excess of $750 million |
The Adviser has entered into a written expense limitation and fee waiver agreement under which it has agreed to limit the total expenses of each Fund (excluding taxes, interest, acquired fund fees and expenses, litigation, extraordinary expenses, brokerage and other transaction expenses relating to the purchase or sale of portfolio investments) to an annual rate of 1.50% of the average net assets of the International Opportunities Fund and the Global Fund, and 1.45% of the average net assets of the Focus Fund, the Growth Fund, the 21st Century Fund, and the Flexible Capital Fund, until January 31, 2019. This expense limitation and fee waiver agreement may be terminated by the Adviser at any time after January 31, 2019, upon 15 days prior notice to the Fund and its administrator. Prior to December 1, 2017, the Adviser had agreed to limit the total expenses of each Fund (with certain exclusions) to an annual rate of 1.60% of the average net assets of the Focus Fund, the International Opportunities Fund, the Flexible Capital Fund, and the Global Fund, and 1.50% of the average net assets of the Growth Fund and the 21st Century Fund.
The Adviser may recoup from a Fund fees previously waived or expenses previously reimbursed by the Adviser with respect to that Fund pursuant to this agreement (or a previous expense limitation agreement) if: (1) such recoupment by the Adviser does not cause the Fund, at the time of recoupment, to exceed the lesser of (a) the expense limitation in effect at the time the relevant amount was waived and/or reimbursed, or (b) the expense limitation in effect at the time of the proposed recoupment, and (2) the recoupment is made within three years after the fiscal year end date as of which the amount to be waived or reimbursed was determined and the waiver or reimbursement occurred. As of March 31, 2018, recoupment amounts (in thousands) that may potentially be made by the International Opportunities Fund and Global Fund to the Adviser are as follows:
| Year of Expiration | | | International
Opportunities Fund | | | Global Fund | |
| 2018 | | | $ | 32 | | | $ | — | |
| 2019 | | | | 128 | | | | 53 | |
| 2020 | | | | 106 | | | | 76 | |
| 2021 | | | | 28 | | | | 23 | |
| | | | $ | 294 | | | $ | 152 | |
Certain officers of the Trust are also officers of the Adviser. The Funds pay a portion of the Chief Compliance Officer’s total compensation costs which is shown as part of the expense account “Professional fees” on the Statements of Operations. No other officers of the Trust received compensation from the Funds during the six-month period ended March 31, 2018.
4. | Distribution and Service Plan |
The Funds have adopted a Distribution and Service Plan (the “Plan”) pursuant to Rule 12b-1 under the 1940 Act. The Plan authorizes payments by the Funds in connection with the distribution of their shares at an annual rate, as determined from time to time by the Board of Trustees, of 0.25% of a Fund’s average daily net assets.
Payments may be made by the Funds under the Plan for the purpose of financing any activity primarily intended to result in the sale of shares of the Funds, as determined by the Board of Trustees, as well as for account maintenance and personal services to shareholders and any other non-distribution-related services. The Adviser may, out of its own resources (which may include legitimate profits from providing advisory services to the Funds or other clients) and at its sole discretion, make certain payments on behalf of the Funds or the Plan for expenses incurred by a Fund for distribution of Fund shares and related services or for administrative or other expenses incurred by the Fund.
The Plan was amended in November 2016 to reflect certain non-material changes, which were intended to clarify the types of non-distribution expenses, such as administrative fees charged by supermarket intermediaries, that may be paid for through 12b-1 fees under the Plan. Prior to May 1, 2017, the Funds utilized 12b-1 fees to pay for only a portion of the administrative fees charged by supermarket intermediaries. Any remaining amounts were expensed by the Funds and included in “Transfer agent fees and expenses” on the Statements of Operations. Subsequent to amending the Plan in November 2016, the Board of Trustees authorized the Funds to utilize available 12b-1 fees for payment of the entire balance of administrative fees charged by supermarket intermediaries if and to the extent a Fund had sufficient accrued 12b-1 fee balances available.
52
| NOTES TO FINANCIAL STATEMENTS |
The Plan was also amended effective December 1, 2017 to reflect additional non-material changes which were intended to clarify that while the maximum 12b-1 Fee rate remains limited to 0.25% per annum of each Fund’s average daily net assets, one or more Funds may be charged a lower rate from time to time upon approval by the Board of Trustees, and the rate may vary by Fund. The Plan, as amended, also clarifies that previously accrued amounts of the 12b-1 Fee for each Fund may be used by that Fund to pay any current or previously accrued expenses of the Fund authorized by the amended Plan, including non-distribution expenses, authorized by the Plan.
Effective December 1, 2017, pursuant to the amended Plan, the Board of Trustees has determined to cause the Focus Fund, Growth Fund, and 21st Century Fund to accrue 12b-1 Fees at a rate of 0.20% per annum of the average daily net assets of each Fund, until such time as the Board authorizes a different rate (not exceeding 0.25% per annum). The International Opportunities Fund, Flexible Capital Fund, and Global Fund, continue to accrue 12b-1 Fees at the rate of 0.25% per annum of the average daily net assets of each Fund until such time as the Board authorizes a different rate.
5. | Investment Transactions |
The aggregate purchases and sales of securities, excluding short-term investments, for the Funds for the six-month period ended March 31, 2018, were as follows:
| (Amounts in thousands) | | Focus
Fund | | | Growth
Fund | | | 21st
Century
Fund | | | International
Opportunities
Fund | | | Flexible
Capital
Fund | | | Global
Fund | |
| Purchases | | $ | 148,717 | | | $ | 31,658 | | | $ | 159,136 | | | $ | 13,084 | | | $ | 192,516 | | | $ | 22,770 | |
| Sales | | $ | 173,346 | | | $ | 76,325 | | | $ | 171,516 | | | $ | 14,120 | | | $ | 221,352 | | | $ | 20,794 | |
There were no purchases or sales of US government securities, excluding short-term investments.
6. | Federal Income Tax Information |
“Accounting for Uncertainty in Income Taxes” (the “Income Tax Statement”) requires an evaluation of tax positions taken (or expected to be taken) in the course of preparing a Fund’s tax returns to determine whether these positions meet a “more-likely-than-not” standard that, based on the technical merits, have a more than fifty percent likelihood of being sustained by a taxing authority upon examination. A tax position that meets the “more-likely-than-not” recognition threshold is measured to determine the amount of benefit to recognize in the financial statements. The Funds recognize interest and penalties, if any, related to unrecognized tax benefits as income tax expense in the Statements of Operations.
The Income Tax Statement requires management of the Funds to analyze all open tax years, fiscal years 2014-2018 as defined by Internal Revenue Service (“IRS”) statute of limitations for all major jurisdictions, including federal tax authorities and certain state tax authorities. As of and during the six-month period ended March 31, 2018, the Funds did not have any liabilities for any unrecognized tax benefits. The Funds have no examinations in progress and are not aware of any tax positions for which it is reasonably possible that the total amounts of unrecognized tax benefits will significantly change in the next twelve months.
At March 31, 2018, gross unrealized appreciation and depreciation of investments, based on cost for federal income tax purposes were as follows:
| (Amounts in thousands) | | Focus
Fund | | | Growth
Fund | | | 21st
Century
Fund | | | International
Opportunities
Fund | | | Flexible
Capital
Fund | | | Global
Fund | |
| Cost of Investments | | $ | 376,227 | | | $ | 179,957 | | | $ | 218,804 | | | $ | 54,199 | | | $ | 211,814 | | | $ | 36,494 | |
| | | | | | | | | | | | | | | | | | | | | | | | | |
| Gross Unrealized Appreciation | | $ | 199,911 | | | $ | 94,407 | | | $ | 33,523 | | | $ | 16,034 | | | $ | 19,847 | | | $ | 15,373 | |
| Gross Unrealized Depreciation | | | (4,222 | ) | | | (1,110 | ) | | | (4,901 | ) | | | (1,037 | ) | | | (5,339 | ) | | | (411 | ) |
| | | | | | | | | | | | | | | | | | | | | | | | | |
| Net Unrealized Appreciation on Investments | | $ | 195,689 | | | $ | 93,297 | | | $ | 28,622 | | | $ | 14,997 | | | $ | 14,508 | | | $ | 14,962 | |
The difference between cost amounts for financial statement and federal income tax purposes is due primarily to wash sale loss deferrals.
At September 30, 2017, for federal income tax purposes, the Funds had accumulated capital loss carryforwards as follows:
| (Amounts in thousands) | | Focus
Fund | | | Growth
Fund | | | 21st
Century
Fund | | | International
Opportunities
Fund | | | Flexible
Capital
Fund | | | Global
Fund | |
| For losses expiring September 30, | | | | | | | | | | | | | | | | | | |
| 2018 | | $ | — | | | $ | — | | | $ | 383,616 | | | $ | 93,558 | | | $ | — | | | $ | — | |
| Not Subject to Expiration | | | — | | | | — | | | | — | | | | — | | | | — | | | | — | |
| | | $ | — | | | $ | — | | | $ | 383,616 | | | $ | 93,558 | | | $ | — | | | $ | — | |
53
| NOTES TO FINANCIAL STATEMENTS |
NOTES TO FINANCIAL STATEMENTS March 31, 2018 (Unaudited) (continued)
To the extent that a Fund may realize future net capital gains, those gains will be offset by any of its unused capital loss carryforwards if and to the extent a Fund is able to under the Internal Revenue Code. Amounts reflected in the table above are not available to offset any future net capital gains for excise tax purposes.
Future capital loss carryforward utilization in any given year may be subject to Internal Revenue Code limitations. The 21st Century Fund and International Opportunities Fund anticipate that a significant portion of the capital loss carryforwards reflected in the table above will not be utilized prior to their expiration.
The Funds are permitted to carryforward capital losses incurred in taxable years beginning after December 22, 2010 for an unlimited period, and such capital losses will retain their character as either short-term or long-term capital losses. Capital losses incurred by the Funds in taxable years beginning before December 23, 2010 may only be carried forward eight taxable years as short-term capital losses.
During the year ended September 30, 2017, the Focus Fund, 21st Century Fund, International Opportunities Fund, and Global Fund utilized capital loss carryforwards of (in thousands) $1,199, $34,343, $8,663 and $416, respectively.
As of September 30, 2017, the Focus Fund, Growth Fund, 21st Century Fund, International Opportunities Fund, Flexible Capital Fund, and Global Fund, respectively, had (in thousands) $1,870, $894, $1,560, $144, $0 and $192 of qualified late-year losses, which are deferred until fiscal year 2018 for tax purposes. Net late-year losses that are deferred, are deemed to arise on the first day of the Fund’s next taxable year.
As of September 30, 2017, the components of accumulated earnings (deficit) on a tax basis were as follows:
| (Amounts in thousands) | | Focus
Fund | | | Growth
Fund | | | 21st
Century
Fund | | | International
Opportunities
Fund | | | Flexible
Capital
Fund | | | Global
Fund | |
| Undistributed Ordinary Income | | $ | — | | | $ | — | | | $ | — | | | $ | — | | | $ | 2,975 | | | $ | 362 | |
| Undistributed Trustees’ Deferred Compensation | | | (2,503 | ) | | | (1,368 | ) | | | (897 | ) | | | (347 | ) | | | (1,068 | ) | | | (382 | ) |
| Undistributed Long-Term Capital Gains | | | 87,734 | | | | 25,152 | | | | — | | | | — | | | | 24,025 | | | | 3,705 | |
| Tax Accumulated Earnings (Deficit) | | | 85,231 | | | | 23,784 | | | | (897 | ) | | | (347 | ) | | | 25,932 | | | | 3,685 | |
| Accumulated Capital and Other Losses | | | (1,870 | ) | | | (894 | ) | | | (385,176 | ) | | | (93,702 | ) | | | — | | | | (192 | ) |
| Net Unrealized Appreciation on Investments and on Foreign Currency Translations | | | 165,923 | | | | 82,965 | | | | 65,492 | | | | 13,189 | | | | 50,487 | | | | 12,408 | |
| Trustees' Deferred Compensation Mark-to-Market | | | 1,112 | | | | 488 | | | | 209 | | | | 72 | | | | 761 | | | | 73 | |
| Total Accumulated Earnings (Deficit) | | $ | 250,396 | | | $ | 106,343 | | | $ | (320,372 | ) | | $ | (80,788 | ) | | $ | 77,180 | | | $ | 15,974 | |
Undistributed ordinary income consists of net investment income and timing differences related to qualified late-year losses.
The tax character of distributions paid during the fiscal years ended September 30, 2017 and 2016 was as follows:
| | | 2017 | | | 2016 | |
| (Amounts in thousands) | | Ordinary Income | | | Long-Term Capital Gains | | | Ordinary Income | | | Long-Term Capital Gains | |
| Focus Fund | | $ | — | | | $ | — | | | $ | — | | | $ | 157,703 | |
| Growth Fund | | | — | | | | 2,136 | | | | — | | | | 111,369 | |
| 21st Century Fund | | | — | | | | — | | | | — | | | | — | |
| International Opportunities Fund | | | — | | | | — | | | | — | | | | — | |
| Flexible Capital Fund | | | 4,808 | | | | 21,758 | | | | 3,373 | | | | 64,551 | |
| Global Fund | | | — | | | | — | | | | — | | | | 6,835 | |
The tax character of dividends paid may differ from that shown in the Statements of Changes in Net Assets due to short-term gains being treated as ordinary income for tax purposes.
54
| NOTES TO FINANCIAL STATEMENTS |
On May 9, 2018, the Board of Trustees approved a plan of reorganization (“Plan of Reorganization”) to transfer all of the assets of the Marsico Flexible Capital Fund (“Acquired Fund”) to the Marsico Global Fund (“Surviving Fund”) in exchange for Surviving Fund shares having an aggregate value equal to the net assets of the Acquired Fund at the valuation time of the Reorganization and the assumption by the Surviving Fund of all of the liabilities of the Acquired Fund, followed immediately by the distribution of those Surviving Fund shares to Acquired Fund shareholders in complete liquidation of the Acquired Fund. The Plan of Reorganization is structured to qualify as a tax-free reorganization. The Reorganization of the Acquired Fund into the Surviving Fund is anticipated to occur in the third quarter of 2018.
In connection with the Plan of Reorganization, the Board of Trustees approved the Adviser’s decision to amend the written expense limitation and fee waiver agreement between the Surviving Fund and the Adviser. Under the amended written expense limitation and fee waiver agreement, the Adviser has agreed to further reduce the limit of total expenses of the Surviving Fund (excluding interest, taxes, acquired fund fees and expenses, litigation, brokerage, and extraordinary expenses) through at least September 30, 2019 or one year after the completion date of the Plan of Reorganization, whichever is later, to the below noted annual rate based on the average net assets of the Surviving Fund. Upon consummation of the reorganization, the amended total expense limitation will be as follows:
Fund | Current Total
Expense Limitation | Amended Total
Expense Limitation
Upon Completion
of the Reorganization |
Global Fund | 1.50% | 1.45% |
Additionally on May 9, 2018 and in accordance with the Funds’ Distribution and Service Plan, as amended, pursuant to Rule 12b-1 under the 1940 Act, the Board of Trustees approved a reduction in the annual rate of accrual of 12b-1 fees for the Focus Fund, Growth Fund and 21st Century Fund from an annual rate of 0.20% of each Fund’s average daily net assets to an annual rate of 0.00% of each Fund’s average daily net assets. These reduced annual rates will be effective June 1, 2018. Future changes to these rates as well as the annual rates established for the other Marsico Funds may be approved by the Board of Trustees from time to time.
Management of the Adviser has determined that there were no other material subsequent events that would require disclosure in the Funds’ financial statements.
| 8. | New Accounting Pronouncements |
The FASB issued Accounting Standards Update No. 2017-08, Receivables – Nonrefundable Fees and Other Costs (Subtopic 310-20), Premium Amortization on Purchased Callable Debt Securities (“ASU 2017-08”) to amend the amortization period for certain purchased callable debt securities held at a premium. The guidance requires certain premiums on callable debt securities to be amortized to the earliest call date. The amortization period for callable debt securities purchased at a discount will not be impacted. The guidance is effective for fiscal years beginning after December 15, 2018, and interim periods within those fiscal years, with early adoption permitted. Management is currently evaluating the impact these changes may have on the Funds’ financial statements.
55
EXPENSE EXAMPLE For the six-month period ended March 31, 2018 (Unaudited)
As a shareholder of the Marsico Funds (the “Funds”), you incur two types of costs: (1) transaction costs, including redemption fees (if any), and (2) ongoing costs, including management fees, distribution (12b-1) fees, and other Fund expenses. This Example is intended to help you understand your ongoing costs (in dollars) of investing in the Funds and to compare these costs with the ongoing costs of investing in other mutual funds.
The Example is based on an investment of $1,000 invested at the beginning of the period and held for the entire period from October 1, 2017 to March 31, 2018 (the “period”).
Actual Expenses
The first line of the table below provides information about actual account values and actual expenses. You may use the information in this line, together with the amount you invested, to estimate the expenses you paid over the period. Simply divide your account value by $1,000 (for example, an $8,600 account value divided by $1,000 equals 8.6), then multiply the result by the number in the first line under the heading entitled “Expenses paid for the six-month period ended March 31, 2018” to estimate the expenses you paid on your account during the period.
Hypothetical Example for Comparison Purposes
The second line of the table below provides information about hypothetical account values and hypothetical expenses based on the Funds’ actual expense ratios and an assumed rate of return of 5% per year before expenses, which is not the actual return of any of the Funds. The hypothetical account values and expenses may not be used to estimate the actual ending account balance or expenses you paid for the period. You may use this information to compare the ongoing costs of investing in the Funds and other funds. To do so, compare this 5% hypothetical example with the 5% hypothetical examples that appear in the shareholder reports of other funds.
Please note that the expenses shown in the table are meant to highlight your ongoing costs only and do not reflect any transactional costs such as redemption fees (if any). Therefore, the second line of the table is useful in comparing the ongoing costs only, and will not help you determine the relative total costs of owning different funds. In addition, if these transactional costs (if any) were included, your costs could have been higher.
Expenses Paid During the Period | Beginning
account value
October 1, 2017 | Ending
account value
March 31, 2018 | Expenses paid for the
six-month period ended
March 31, 2018(1) |
FOCUS FUND | | | |
Actual Example | $ 1,000.00 | $ 1,098.30 | $ 6.67 |
Hypothetical Example, assuming a 5% return before expenses | $ 1,000.00 | $ 1,018.65 | $ 6.41 |
| | | | |
GROWTH FUND | | | |
Actual Example | $ 1,000.00 | $ 1,112.00 | $ 7.04 |
Hypothetical Example, assuming a 5% return before expenses | $ 1,000.00 | $ 1,018.33 | $ 6.73 |
| | | | |
21st CENTURY FUND | | | |
Actual Example | $ 1,000.00 | $ 1,115.70 | $ 6.80 |
Hypothetical Example, assuming a 5% return before expenses | $ 1,000.00 | $ 1,018.58 | $ 6.48 |
| | | | |
INTERNATIONAL OPPORTUNITIES FUND | | | |
Actual Example | $ 1,000.00 | $ 1,083.40 | $ 7.96 |
Hypothetical Example, assuming a 5% return before expenses | $ 1,000.00 | $ 1,017.36 | $ 7.70 |
| | | | |
FLEXIBLE CAPITAL FUND | | | |
Actual Example | $ 1,000.00 | $ 1,031.10 | $ 7.43 |
Hypothetical Example, assuming a 5% return before expenses | $ 1,000.00 | $ 1,017.68 | $ 7.38 |
| | | | |
GLOBAL FUND | | | |
Actual Example | $ 1,000.00 | $ 1,110.80 | $ 8.06 |
Hypothetical Example, assuming a 5% return before expenses | $ 1,000.00 | $ 1,017.36 | $ 7.70 |
(1) | Expenses are equal to the Funds’ annualized expense ratios (1.27% for the Focus Fund, 1.34% for the Growth Fund, 1.29% for the 21st Century Fund, 1.53% for the International Opportunities Fund, 1.47% for the Flexible Capital Fund, and 1.53% for the Global Fund), multiplied by the average account value over the period, multiplied by 182/365 (to reflect the six-month period). |
56
| CONSIDERATION OF INVESTMENT ADVISORY AGREEMENTS |
CONSIDERATION OF INVESTMENT ADVISORY AGREEMENTS (Unaudited)
At a meeting of the Board of Trustees of the Trust held on November 15, 2017, the Trustees, by a unanimous vote (including a separate vote of those Trustees who are not “interested persons” (as the term is defined in the 1940 Act) of the Trust (the “Independent Trustees”)), approved the renewal of the Investment Advisory and Management Agreements for the Focus Fund, Growth Fund, 21st Century Fund, International Opportunities Fund, Flexible Capital Fund, and Global Fund (the “Advisory Agreements”). In advance of the meeting, the Independent Trustees requested and received extensive materials from Marsico Capital Management, LLC (the “Adviser” or “MCM”) to assist them in considering the renewal of the Agreements. The materials provided by the Adviser contained information with respect to the factors noted below, including detailed information relating to the performance, advisory fees and other expenses of the Funds, other funds sub-advised by the Adviser and non-fund advisory accounts of the Adviser. The materials also included comparisons of the Funds with third party funds of similar size and investment objectives in terms of performance, fees and other expenses, as well as the performance of each Fund versus its benchmark. In addition, the Adviser provided information regarding its overall expenses and profitability, as well as other information requested by the Trustees.
In addition to the materials prepared specifically for contract review analysis, on an ongoing basis the Trustees receive information and reports from the Adviser and other service providers to the Funds regarding the investment performance of the Funds as well as operational, compliance, marketing and other matters.
The Trustees engaged in a detailed discussion of the materials with management of the Adviser. The Independent Trustees then met separately with independent counsel to the Independent Trustees for a full review of the materials. Following this session, the full Board reconvened and approved the continuation of the Agreements for the Focus Fund, Growth Fund, 21st Century Fund, International Opportunities Fund, Flexible Capital Fund, and Global Fund.
Discussion of Certain Factors Considered
1. Nature, Extent, and Quality of Services.
The Independent Trustees considered the nature, quality and extent of the services performed by the Adviser under the Advisory Agreements with the Adviser, including portfolio management, supervision of Fund operations, regulatory filings and disclosures to shareholders, compliance functions, general oversight of other service providers, review of Fund legal issues, and other services. The Independent Trustees also considered the personnel who provide these services, which include teams of individuals collectively having years of experience in their particular areas of expertise. The Independent Trustees reviewed the Adviser’s investment philosophy and experience, noting that the Adviser and its affiliates employ a focused stock-picking strategy that involves extensive research. The Independent Trustees noted MCM’s continued investment in research. The Independent Trustees discussed the Adviser’s ability to continue to provide the same level and quality of services to the Funds, and discussed with members of management of MCM the financial condition of the Adviser and its ability to attract and retain experienced personnel. The Independent Trustees considered the reinvestment in MCM by Mr. Tom Marsico and the steps taken to ensure the financial viability of the Adviser, including the extinguishment of debt to third parties and elimination of most of MCM’s overall debt in 2016. The Independent Trustees also discussed MCM’s commitment to devoting substantial resources to the Adviser’s investment management process. The Independent Trustees concluded that the services are extensive in nature, that the Adviser employs investment advisory personnel who consistently delivered a high level of service and that, with respect to third party service providers, the Adviser effectively manages the outsourcing by the Funds of certain services to other service providers and the oversight of those service providers.
2. Investment Performance of the Funds and Adviser.
The Independent Trustees considered the Adviser’s substantial investment advisory experience and capabilities. The Independent Trustees considered short-term and long-term investment performance for each Fund over various periods of time as compared to both relevant equity indices and the performance of each Fund’s Lipper, Inc. peer group universe. The Independent Trustees noted the strong performance of most of the Funds relative to their peers and benchmarks during the year-to-date period, and discussed with representatives of the Adviser the factors underlying the performance of the Funds over various time periods. The Independent Trustees discussed the Funds’ performance with representatives of MCM and concluded that the Adviser was delivering acceptable performance results consistent with the long-term investment strategies being pursued by the Funds. The Independent Trustees took into account that they regularly review each Fund’s performance.
The Independent Trustees noted that the investment performance delivered by the Adviser to the Funds appeared to be generally consistent with the performance delivered for other clients of the Adviser with similar strategies. Based on this review, the Independent Trustees concluded that the performance of the Adviser with respect to each Fund was acceptable for the purposes of approving the Advisory Agreements.
57
| CONSIDERATION OF INVESTMENT ADVISORY AGREEMENTS |
CONSIDERATION OF INVESTMENT ADVISORY AGREEMENTS (Unaudited) (continued)
3. Costs of Services and Profits Realized by the Adviser.
(a) Costs of Services to Funds: Fees and Expenses. The Independent Trustees considered each Fund’s management fee rates and expense ratios relative to industry averages for the Fund’s benchmark category and the advisory fees charged by the Adviser to other clients, including information regarding expense limitation commitments from the Adviser, and the breakpoints in the advisory fee schedule for all of the Funds. The Independent Trustees noted the information provided by MCM stated that the mix of services under the Advisory Agreements are much more extensive than those under the Adviser’s advisory agreements for sub-advised and non-fund clients.
The Independent Trustees also noted previous actions taken by MCM to reduce Fund expenses, including that MCM had waived fees and absorbed expenses from time to time, and that some of those expenditures may not be recouped. It was noted that on December 1, 2015, as requested by the Independent Trustees, the Adviser implemented reduced fees and new breakpoints for the management fee rates of all of the Funds resulting in overall reductions in the management fee rates. The Independent Trustees reviewed various expense information and noted that the lower management fee rates and breakpoints reduced advisory fees and as such were a positive factor in maintaining overall Fund expenses in a range that continues to be reasonable. The Trustees also noted other recent actions that have been taken to reduce expenses including (1) applying certain previously accrued 12b-1 balances to pay for certain administrative fees charged by intermediaries; (2) a reduction in the 12b-1 fees accrued by the Focus Fund, Growth Fund, and 21st Century Fund effective December 1, 2017; and (3) that MCM agreed to lower expense caps for all of the Funds for the benefit of all shareholders effective December 1, 2017. The Independent Trustees concluded that the investment advisory fees are acceptable based upon the qualifications, experience, reputation, and performance of the Adviser and the overall expense ratios of the Funds.
(b) Profitability and Costs of Services to Adviser. The Independent Trustees reviewed the information provided by MCM regarding its overall profitability and costs and an estimate of the Adviser’s profitability and costs in serving the Funds as part of MCM’s overall investment management business serving many clients. The Independent Trustees noted that MCM’s fee revenue from the Funds had decreased in 2017 as a result of lower net assets and that MCM had not reduced its services, but continued to devote substantial resources and personnel to the Funds. The Independent Trustees also noted that the Adviser previously had substantially increased its resources devoted to Fund matters in response to regulatory requirements enacted in prior years. The Independent Trustees discussed the level of estimated profit of MCM from its relationship to the Funds and considered profitability levels reviewed by federal courts that were found to be reasonable. The Independent Trustees concluded that the estimated profits received by the Adviser under the Advisory Agreements were acceptable for purposes of approving the Advisory Agreements.
4. Extent of Economies of Scale as Funds Grow.
The Independent Trustees considered whether there have been economies of scale with respect to the management of each Fund and whether such Fund has appropriately benefited from any economies of scale. The Independent Trustees noted that economies of scale may develop for certain Funds as their assets increase and their Fund-level expenses decline as a percentage of assets, but that Fund-level economies of scale may not necessarily result in Adviser-level economies of scale. It was reported to the Independent Trustees that the resources devoted by the Adviser relating to management of the Funds had increased substantially in prior years, and that the average net asset levels of each of the Funds had decreased over the past year. The Independent Trustees agreed that it was possible that if trends changed and Fund assets began growing again beyond certain thresholds, Adviser-level expenses incurred in managing the Funds eventually could level off or decline as a percentage of management fees in the future, potentially resulting in economies of scale. The Independent Trustees noted that should economies of scale be realized in the future, the advisory fee schedule contains breakpoints that would benefit shareholders of the Funds as assets increase.
5. Whether Fee Levels Reflect Economies of Scale.
The Independent Trustees also considered whether the management fee rate is reasonable in relation to the asset size of each Fund and any economies of scale that may exist. The Independent Trustees noted that, at the request of the Independent Trustees, lower management fee rates and breakpoints had been introduced for all of the Funds effective December 1, 2015. The Independent Trustees noted that MCM agreed to the breakpoints and a fee reduction in an effort to maintain overall Fund expenses in a range that continues to be reasonable. The Independent Trustees also took note that the Adviser agreed to implement new, lower expense limitations for all Funds effective December 1, 2017 which would remain in place until at least January 31, 2019.
58
| CONSIDERATION OF INVESTMENT ADVISORY AGREEMENTS |
6. Other Relevant Considerations.
The Independent Trustees considered the character and amount of other incidental benefits received by the Adviser and its affiliates from its association with the Funds. The Independent Trustees concluded that potential “fall-out” benefits that the Adviser may receive, such as greater name recognition or increased ability to obtain research or brokerage services, appear to be reasonable, and may in some cases benefit the Funds.
Conclusions
In considering the Advisory Agreements, the Independent Trustees did not identify any factor as all-important or all-controlling and instead considered these factors collectively in light of each Fund’s surrounding circumstances. Based on this review, it was the judgment of the Independent Trustees that each Fund’s fees were reasonable, the extent and quality of services were acceptable and performance of the Funds was acceptable. Therefore, re-approval of the Advisory Agreements was in the best interests of each Fund and its shareholders. As a part of their decision-making process, the Independent Trustees noted that the Adviser has managed the Funds since their inception, and the Independent Trustees believe that a long-term relationship with a capable, conscientious adviser is in the best interests of the Funds and their shareholders. The Independent Trustees considered, generally, that shareholders invested in a Fund knowing that the Adviser managed that Fund and knowing its investment management fee. As such, the Independent Trustees considered whether the Adviser managed each Fund in accordance with its investment objectives and policies as disclosed to shareholders. Additionally, as part of its deliberations, the Board also considered the information about the Funds and MCM that had been provided to them throughout the year in connection with their regular Board meetings at which they engage in the ongoing oversight of the Funds and their operations.
Upon conclusion of their review and discussion, the Trustees, including all of the Independent Trustees, unanimously agreed the Advisory Agreements for each of the Funds should be continued.
59
OTHER INFORMATION (Unaudited)
Proxy Voting Guidelines
The Funds exercise the voting rights associated with the securities held by the Funds under the proxy voting policy of the Funds. A description of those policies and procedures of the Funds and a record of the Funds’ proxy votes for the one-year period ended June 30, 2017 are available without charge, upon request, by calling 888-860-8686. It is also available on the Securities and Exchange Commission’s (SEC) website at www.sec.gov.
Quarterly Filing of Portfolio Holdings
The Funds will file their complete schedule of investments with the SEC for the first and third quarters of each fiscal year on Form N-Q. The Funds’ Form N-Q will be available (i) on the SEC’s website at www.sec.gov; (ii) at the SEC’s Public Reference Room; and (iii) by calling 800-SEC-0330.
Cost Basis Information
Federal law requires mutual fund companies to maintain a shareholder’s cost basis by tax lot and report gain/loss information and holding periods for sales of mutual fund shares that are “covered” securities to the IRS and to shareholders on Form 1099. Mutual fund shares, such as shares of the Funds, acquired on or after January 1, 2012 are covered securities. The Funds are not responsible for maintaining and reporting share information for their shares that are not deemed “covered.”
The tax regulations require that the Funds elect a default tax identification methodology in order to perform the required reporting. The Funds have chosen the first-in-first-out (“FIFO”) method as the default tax lot identification method for its shareholders. This is the method the Funds will use to determine which specific shares are deemed to be sold when a shareholder’s entire position is not sold in a single transaction and is the method in which “covered” share sales will be reported on a shareholder’s Form 1099.
However, at the time of purchase or upon the sale of “covered” shares, shareholders may generally choose a different tax lot identification method. Shareholders should consult a tax advisor with regard to their personal circumstances as the Funds and their service providers do not provide tax advice.
60

Not applicable to semi-annual reports.
| Item 3. | Audit Committee Financial Expert |
Not applicable to semi-annual reports.
| Item 4. | Principal Accountant Fees and Services |
Not applicable to semi-annual reports.
| Item 5. | Audit Committee of Listed Registrants |
Not applicable.
| Item 6. | Schedule of Investments |
The schedule of investments in securities of unaffiliated issuers is included as part of the report to shareholders filed under Item 1.
| Item 7. | Disclosure of Proxy Voting Policies and Procedures for Closed-End Management Investment Companies |
Not applicable.
| Item 8. | Portfolio Managers of Closed-End Management Investment Companies |
Not applicable.
| Item 9. | Purchases of Equity Securities by Closed-End Management Investment Company and Affiliated Purchasers |
Not applicable.
| Item 10. | Submission of Matters to a Vote of Security Holders |
Not applicable.
| Item 11. | Controls and Procedures. |
(a) The registrant's principal executive officer and principal financial officer have concluded that the registrant's disclosure controls and procedures (as defined in Rule 30a-3(c) under the Investment Company Act of 1940, as amended) are effective based on their evaluation of these disclosure controls and procedures within 90 days of the filing date of this report on Form N-CSR.
(b) There were no changes in the registrant's internal control over financial reporting (as defined in Rule 30a-3(d) under the Investment Company Act of 1940, as amended) that occurred during the last fiscal quarter of the period covered by this report that have materially affected, or are reasonably likely to materially affect, the registrant's internal control over financial reporting.
| Item 12. | Disclosure of Securities Lending Activities for Closed-End Management Investment Companies. |
Not applicable.
(a)(1) Code of Ethics
Not applicable to semi-annual reports.
(a)(2) Certification for each principal executive and principal financial officer of the registrant as required by Rule 30a-2(a) under the Act (17 CFR 270.30a-2(a)). Filed as an attachment to this filing.
(a)(3) Any written solicitation to purchase securities under Rule 23c--1 under the Investment Company Act of 1940, as amended, that was sent or given during the period covered by the report by or on behalf of the registrant to 10 or more persons.
Not applicable.
(b) Certifications required by Rule 30a-2(b) under the Act (17 CFR 270.30a-2(b)), Rule 13a-14(b) or Rule 15d-14(b) under the Exchange Act (17 CFR 240.13a-14(b) or 240.15d-14(b)), and Section 1350 of Chapter 63 of Title 18 of the United States Code (18 U.S.C. 1350). Filed as an attachment to this filing.
SIGNATURES
Pursuant to the requirements of the Securities Exchange Act of 1934 and the Investment Company Act of 1940, the registrant has duly caused this report to be signed on its behalf by the undersigned, thereunto duly authorized.
The Marsico Investment Fund
| By: | /s/ Christopher J. Marsico | |
| Christopher J. Marsico, | |
| Executive Vice President and Chief Operating Officer | |
| | | |
| Date: | May 31, 2018 | |
| | | |
| Pursuant to the requirements of the Securities Exchange Act of 1934 and the Investment Company Act of 1940, this report has been signed below by the following persons on behalf of the registrant and in the capacities and on the dates indicated. |
| | | |
| By: | /s/ Christopher J. Marsico | |
| Christopher J. Marsico, | |
| Executive Vice President and Chief Operating Officer | |
| | | |
| Date: | May 31, 2018 | |
| | | |
| By: | /s/ Neil L. Gloude | |
| | Neil L. Gloude, | |
| | Vice President, Secretary and Treasurer | |
| | | |
| Date: | May 31, 2018 | |