UNITED STATES
SECURITIES AND EXCHANGE COMMISSION
Washington, D.C. 20549
FORM N-CSR
CERTIFIED SHAREHOLDER REPORT OF REGISTERED MANAGEMENT INVESTMENT COMPANIES
Investment Company Act file number 811-08397 |
| |
| The Marsico Investment Fund |
| (Exact name of Registrant as specified in charter) |
| |
1200 17th Street, Suite 1600 |
| Denver, Colorado 80202 |
| (Address of principal executive offices) (Zip code) |
| |
| Christopher J. Marsico |
| The Marsico Investment Fund |
1200 17th Street, Suite 1600 |
| Denver, Colorado 80202 |
| (Name and address of agent for service) |
| |
| Copies to: |
| Sander M. Bieber, Esq. |
| Dechert LLP |
| 1775 I Street, N.W. |
| Washington, D.C. 20006 |
| |
Registrant's telephone number, including area code: (303) 454-5600 |
| |
Date of fiscal year end: September 30 |
| |
Date of reporting period: March 31, 2010 |
Item 1. Reports to Stockholders
SEMI-ANNUAL REPORT
MARCH 31, 2010
Exploring the world around us can help identify
new investment opportunities.
DEAR SHAREHOLDER:
Enclosed is your semi annual report for The Marsico Investment Fund, encompassing the six month fiscal period from October 1, 2009 to March 31, 2010.
The purpose of this report is to provide a retrospective for the Marsico Funds’ six month investment results by discussing what we believe were the main areas that impacted performance including the macroeconomic environment, sector and industry positioning, and individual stock selection as compared to the Funds’ performance benchmark indexes. For our updated information regarding the market environment and the Funds’ overall investment postures and performance, please refer to the Funds’ most recent monthly fact sheets and quarterly investor updates, which are available under the name of each Fund on the Funds’ website at www.marsicofunds.com.
| KEY FUND STATISTICS | 4 |
| MARKET ENVIRONMENT | 7 |
| | |
| MARSICO FOCUS FUND | |
| Investment Review | 9 |
| Fund Overview | 12 |
| Schedule of Investments | 13 |
| | |
| MARSICO GROWTH FUND | |
| Investment Review | 9 |
| Fund Overview | 14 |
| Schedule of Investments | 15 |
| | |
MARSICO 21ST CENTURY FUND | |
| Investment Review | 16 |
| Fund Overview | 18 |
| Schedule of Investments | 19 |
| | |
| MARSICO INTERNATIONAL | |
| OPPORTUNITIES FUND | |
| Investment Review | 21 |
| Fund Overview | 23 |
| Schedule of Investments | 24 |
| | |
| MARSICO FLEXIBLE CAPITAL FUND | |
| Investment Review | 26 |
| Fund Overview | 28 |
| Schedule of Investments | 29 |
| | |
| MARSICO GLOBAL FUND | |
| Investment Review | 31 |
| Fund Overview | 33 |
| Schedule of Investments | 34 |
| | |
| FINANCIAL STATEMENTS | 36 |
| NOTES TO FINANCIAL STATEMENTS | 46 |
| EXPENSE EXAMPLE | 54 |
| CONSIDERATION OF INVESTMENT | |
| ADVISORY AGREEMENTS | 55 |
| OTHER INFORMATION | 58 |
| KEY FUND STATISTICS (UNAUDITED) |
Marsico Focus Fund MFOCX | Marsico Growth Fund MGRIX | Marsico 21st Century Fund MXXIX |
| | | |
| For additional disclosures, please see page 12. | For additional disclosures, please see page 14. | For additional disclosures, please see page 18. |
| | | |
PERFORMANCE COMPARISON(1) | PERFORMANCE COMPARISON(1) | PERFORMANCE COMPARISON(1) |
| | | |
| | |
| | | |
TOTAL ANNUAL OPERATING EXPENSES* 1.32% | TOTAL ANNUAL OPERATING EXPENSES* 1.31% | TOTAL ANNUAL OPERATING EXPENSES* 1.38% |
| | | |
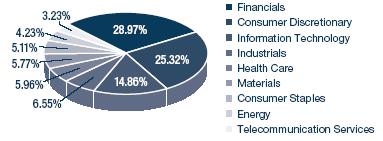
SECTOR ALLOCATION(2) | SECTOR ALLOCATION(2) | SECTOR ALLOCATION(2) |
| | | |
| | |
| | | |
| TOP FIVE HOLDINGS | TOP FIVE HOLDINGS | TOP FIVE HOLDINGS |
| | | |
| THE DOW CHEMICAL COMPANY | 7.08% | APPLE, INC. | 5.54% | WELLS FARGO & COMPANY | 6.27% |
| APPLE, INC. | 6.55% | WELLS FARGO & COMPANY | 4.14% | JPMORGAN CHASE & CO. | 5.10% |
| WELLS FARGO & COMPANY | 5.19% | THE DOW CHEMICAL COMPANY | 4.12% | CROWN CASTLE INTERNATIONAL CORP. | 4.45% |
| UNION PACIFIC CORPORATION | 5.03% | UNION PACIFIC CORPORATION | 4.08% | THE WALT DISNEY COMPANY | 4.15% |
| JPMORGAN CHASE & CO. | 4.78% | TRANSOCEAN LTD. | 3.90% | THE PNC FINANCIAL SERVICES GROUP, INC. | 4.10% |
| | | | | | |
For additional disclosures about the Marsico Funds, please see page 6. The performance data quoted here represent past performance, and past performance is not a guarantee of future results. Investment return and principal value of an investment will fluctuate so that an investor’s shares, when redeemed, may be worth more or less than their original cost.
| KEY FUND STATISTICS (UNAUDITED) |
Marsico International Opportunities Fund MIOFX | Marsico Flexible Capital Fund MFCFX | Marsico Global Fund MGLBX |
| For additional disclosures, please see page 23. | For additional disclosures, please see page 28. | For additional disclosures, please see page 33. |
| | | |
PERFORMANCE COMPARISON(1) | PERFORMANCE COMPARISON(1) | PERFORMANCE COMPARISON(1) |
| | | |
| | |
| | | |
TOTAL ANNUAL OPERATING EXPENSES* 1.50% | TOTAL ANNUAL OPERATING EXPENSES* 2.86% NET EXPENSES*† 0.77% | TOTAL ANNUAL OPERATING EXPENSES* 1.60% |
| | | |
SECTOR ALLOCATION(2) | SECTOR ALLOCATION(2) | SECTOR ALLOCATION(2) |
| | | |
| | |
| | | |
| TOP FIVE HOLDINGS | TOP FIVE HOLDINGS | TOP FIVE HOLDINGS |
| | | |
| BASF S.E. | 3.05% | THE HARTFORD FINANCIAL SERVICES GROUP, INC., 7.250% | 3.95% | WELLS FARGO & COMPANY | 5.85% |
| ANHEUSER-BUSCH INBEV N.V. | 3.03% | COUNTRYWIDE CAPITAL V, CAPITAL SECURITIES, 7.000% | 3.47% | JPMORGAN CHASE & CO. | 4.85% |
| TELEFONICA, SA | 3.00% | MASTERCARD, INC. - CL. A | 2.97% | INDUSTRIA DE DISENO TEXTILE S.A. (INDITEX) | 3.25% |
| CREDIT SUISSE GROUP AG | 2.54% | SCHWAB CAPITAL TRUST I, TRUST PREFERRED SECURITY 7.500%, 11/15/37 | 2.90% | CROWN CASTLE INTERNATIONAL CORP. | 3.16% |
| RESEARCH IN MOTION LTD. | 2.53% | ODONTOPREV S.A. | 2.83% | INTUITIVE SURGICAL, INC. | 3.11% |
Current performance may be lower or higher than the performance information quoted. To obtain performance information current to the most recent month-end, please call 888-860-8686 or visit www.marsicofunds.com. A redemption fee may be imposed on redemptions or exchanges of Fund shares held for 30 days or less.
| KEY FUND STATISTICS (UNAUDITED) |
| * | The Total Annual Operating Expenses and Net Expenses are reflective of the information disclosed in the Funds’ Prospectus dated February 1, 2010. The information may differ from the expense ratios disclosed in this report. |
| † | Marsico Capital Management, LLC (the “Adviser”) has entered into a written expense limitation agreement under which it has agreed to limit the total expenses (excluding interest, taxes, acquired fund fees and expenses, litigation, brokerage and extraordinary expenses) to an annual rate of 0.75% of the Flexible Capital Fund’s average net assets until January 31, 2011. This fee waiver may be terminated at any time after January 31, 2011. The Adviser may recoup any waived amount from a Fund pursuant to this arrangement if such reimbursement does not cause the Fund to exceed existing expense limitations and the reimbursement is made within three years after the year in which the Adviser incurred the expense. |
| (1) | The performance data quoted here represent past performance, and past performance is not a guarantee of future results. Investment return and principal value of an investment will fluctuate so that an investor’s shares, when redeemed, may be worth more or less than their original cost. Current performance may be lower or higher than the performance information quoted. To obtain performance information current to the most recent month-end, please call 888-860-8686 or visit www.marsicofunds.com. A redemption fee may be imposed on redemptions or exchanges of Fund shares held for 30 days or less. |
The performance included in the chart does not reflect the deduction of taxes on Fund distributions or the redemption of Fund shares.
All indices are unmanaged and investors cannot invest directly in an index.
The performance returns for the 21st Century Fund (for the period prior to March 31, 2004), the International Opportunities Fund (for the period prior to September 30, 2004), the Flexible Capital Fund (for the periods ended March 31, 2010), and the Global Fund (for the period prior to December 31, 2008 and from April through May 2009) reflect a fee waiver in effect; in the absence of such a waiver, the returns would be reduced. The performance returns for the 21st Century Fund (for the period beginning April 2004 through January 2005), the International Opportunities Fund (for the period beginning October 2004 through December 2005) and the Global Fund (for the one-month period June 2009) would have been higher but for the reimbursement of fees waived previously.
| (2) | Sector weightings represent the percentage of the respective Fund’s investments (excluding cash equivalents) in certain general sectors. These sectors may include more than one industry. The Fund’s portfolio composition is subject to change at any time. |
MARKET ENVIRONMENT: OCTOBER 2009 – MARCH 2010 (UNAUDITED)
Broad-market equity indices posted positive returns for the six-month period ended March 31, 2010. US equities were aided by generally improving economic data and signs of reinvigorated corporate capital spending. Gross Domestic Product (“GDP”) turned positive during the period, which bolstered views that the US recovery would be sustainable, and that company earnings, consumer spending, and employment would continue on a positive trajectory.
While the overall trend of the US economic releases pointed to continued recovery and improvement, several areas continued to shadow the market. Labor markets, despite showing tentative signs of stabilization, were anemic and the US unemployment rate remained near 10% as of March 31, 2010. The housing market was another sore spot and remained stubbornly weak, despite government incentives for homebuyers and a low interest rate environment. Additionally, government policy re-emerged as a significant influence on the capital markets, including areas such as regulatory reform in the financial services industry and mortgage modification programs.
US equity markets produced broad gains, as discussed above and in greater detail below. International equities posted more modest gains than their US counterparts. Although a global growth recovery seemed on balance to be gaining further traction, there were some signs that it was becoming asynchronous, with some countries (including emerging markets such as Brazil, India, and China and developed markets such as Australia) beginning to implement plans to temper very strong economic growth, while other countries faced slowing growth and were starting to confront budgetary issues. In particular, Greece, Spain, Portugal, and Italy were under pressure as a result of their significant budget deficits and the potential for those deficits to dampen economic growth. Sovereign debt spreads widened significantly as credit rating agencies issued subdued outlooks and threatened to downgrade some government debt in certain countries. Further, there was some concern that Greece’s fiscal issues could “spill over” to the Eurozone.
As depicted in the table below, US markets and emerging markets posted strong returns, while other developed markets made only slight gains:
| | Universe of | Six-Month |
Index Name(1) | Equities Represented | Total Return |
| US | | |
| | | |
| S&P 500 | US large-capitalization equities | +11.75% |
| | | |
| Russell 3000 | US publicly-traded equities of all sizes | +12.19% |
| | | |
| Russell 2000 | US small-capitalization equities | +13.07% |
| | | |
| Russell Mid-Cap | US medium-capitalization equities | +15.10% |
| | | |
| | Universe of | Six-Month |
Index Name(1) | Equities Represented | Total Return |
| INTERNATIONAL | | |
| | | |
| MSCI EAFE (US$) | Equities in developed international equity markets, including Japan, Western Europe, and Australasia | +3.06% |
| | | |
MSCI Emerging Markets (US$) | Equities in developing international equity markets, including China, India, Eastern Europe, and Latin America | +11.16% |
| | | |
| MSCI ACWI (US$) | Equities in the global developed and emerging markets | +7.90% |
US LARGE-CAPITALIZATION EQUITIES
US large-cap stocks posted strong returns for the six-month period ended March 31, 2010. Stock price appreciation was broad-based, bolstered by a backdrop of stronger economic data and an improving corporate profit outlook. Investor risk appetite began to return to the market and the stock prices of many companies punished in the market downturn of 2008 and early 2009 rallied off their lows. All of the ten S&P 500 Index economic sectors, as defined under the Global Industry Classification Standard (“GICS”), posted positive returns. Consumer Discretionary (+21%), Industrials (+19%), Information Technology (+13%), and Health Care (+13%) were the strongest-performing sectors. Telecommunications Services (+3%) and Utilities (+3%) were the laggards.
At an industry level, the performance picture was similar. All industry groups had positive performance, though the results ranged widely from +2% to +45%. Diversified Financials was the weakest-performing industry with a return of +2%. Automobiles & Components (+45%), Transportation (+23%), and Real Estate (+23%) industries led performance.
US ALL-CAPITALIZATION EQUITIES
Performance of the broad US equity market, as measured by the Russell 3000 Index which encompasses publicly-traded companies of all sizes, was strong for the six-month period. Similar to the S&P 500 Index, sector-and industry-level performance was positive across the board within the Russell 3000 Index. Consumer Discretionary (+21%), Industrials (+18%), Health Care (+13%), Materials (+13%), and Information Technology (+13%) were the best-performing sectors of the Russell 3000 Index. Utilities and Telecommunication Services sectors, however, posted gains of just +4%.
At an industry group-level within the Russell 3000 Index, Automobiles & Components soared +42%. Transportation (+24%), Media, (+21%), and Retailing (+20%) also posted strong gains. Diversified Financials was the weakest-performing industry group, with a return of +2%.
The mid-capitalization and small-capitalization areas of the US equity market were comparatively stronger than large-capitalization equities. Smaller-capitalization equities sometimes out-perform large-capitalization equities during early stages of an economic recovery cycle, as investors’ risk appetite increases.
INTERNATIONAL EQUITIES
Developed market international equities posted modest gains for the six-month period ended March 31, 2010, while emerging market equities garnered strong returns.
The MSCI EAFE Index posted mixed performance across the ten GICS sectors. Materials (+16%) and Consumer Staples (+10%) were the strongest-performing sectors of the Index with double-digit gains. Meanwhile, the Financials, (-5%), Utilities (-4%), and Telecommunication Services (-3%) sectors posted negative returns. All other sectors posted returns ranging from +3% to +9%.
Many GICS industry groups in the MSCI EAFE Index experienced positive returns. The most significant industry gains were: Hotels, Restaurant & Leisure (+20%), Consumer Durables & Apparel (+13%), Semiconductors & Semiconductor Equipment (+12%), and Household & Personal Products (+12%). Financial-related industries were the weakest-performing industry groups, including Banks (-6%), Diversified Financials (-6%), and Insurance (-3%).
The MSCI EAFE Index’s largest country-level constituents posted positive returns for the period. The United Kingdom and Japan, which together comprise approximately 40% of the Index, posted returns of +7% and +5%, respectively.
Emerging markets fared better than their developed-market counterparts. As noted above, the MSCI Emerging Markets Index posted a six-month return of +11%.
Overall, US-based investors in international equities did not get the benefit of a significant currency “lift” during the six-month period, as the US dollar strengthened as compared to certain foreign currencies including the euro, the British pound, and the Japanese yen. Some of this currency effect was offset by the US dollar’s weakness versus the Australian dollar and the Canadian dollar.
THE MARSICO INVESTMENT TEAM
| (1) | All indices are unmanaged and investors cannot invest directly in an index. |
| (2) | The Global Industry Classification Standard (“GICS”) was developed by and is the exclusive property and service mark of MSCI, Inc. (“MSCI”) and Standard & Poor’s (“S&P”) and is licensed for use by Marsico Capital Management, LLC (“MCM”). Neither MSCI, S&P, nor MCM or any third party involved in compiling GICS makes any express or implied warranties or representations with respect to such standard or classification (or the results from use thereof), and all such parties hereby expressly disclaim all warranties of originality, accuracy, completeness, merchantability and fitness for a particular purpose with respect to any of such standard or classification. MSCI, S&P, MCM, and any of their affiliates or third parties involved in compiling GICS shall not have any liability for any direct, indirect, special, punitive, consequential or any other damages (including lost profits) even if notified of the possibility of such damages. |
INVESTMENT REVIEW BY TOM MARSICO AND DOUG RAO (UNAUDITED)
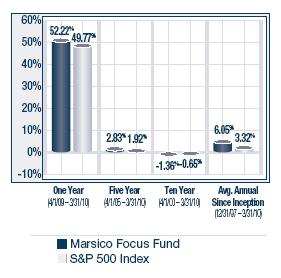
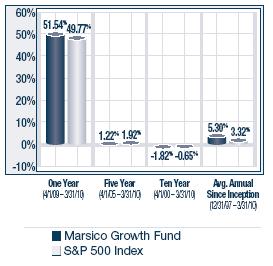
The Marsico Focus Fund and the Marsico Growth Fund outperformed their primary benchmark index for the six-month fiscal period ended March 31, 2010. The Marsico Focus Fund generated a total return of +12.73%, while the Marsico Growth Fund posted a return of +12.66%. For comparative purposes, the S&P 500 Index – which we consider to be the Funds’ primary benchmark index – had a total return of +11.75% for the period ended March 31, 2010. Please see the Funds’ Overviews for more detailed information about each Fund’s longer-term performance for various periods ended March 31, 2010.
The performance data for the Funds quoted here represent past performance, and past performance is not a guarantee of future results. Investment return and principal value of an investment will fluctuate so that an investor’s shares, when redeemed, may be worth more or less than their original cost. Current performance may be lower or higher than the performance information quoted. To obtain performance information current to the most recent month-end, please call 888-860-8686 or visit www.marsicofunds.com.(1)
This review highlights Fund performance over a six-month fiscal period. Shareholders should keep in mind that the Funds are intended for long-term investors who hold their shares for substantially longer periods of time. You should also keep in mind that our views on all investments discussed in this report are subject to change at any time. References to specific securities, industries, and sectors discussed in this report are not recommendations to buy or sell such securities or related investments, and the Funds may not necessarily hold these securities or investments today. Please see the accompanying Schedules of Investments for the percentage of each Fund’s portfolio represented by the securities mentioned in this report as of the end of the reporting period.
The Focus Fund and the Growth Fund often invest in similar growth companies. Their performance may differ at times, however, because of a variety of factors. Among other factors, the Focus Fund is a non-diversified mutual fund that may invest in a more concentrated portfolio and may hold the securities of fewer issuers than the Growth Fund. As a result, the Focus Fund may hold some securities that are different from those held by the Growth Fund, and may be more exposed to individual stock volatility than the Growth Fund or other mutual funds that invest in a larger number of securities.
FOCUS FUND
The six-month performance of the Marsico Focus Fund for the period ended March 31, 2010 exceeded the return of the S&P 500 Index. The Fund’s performance was positively impacted by stock selection in several sectors, most notably Information Technology, Materials, and Industrials.
The Fund’s technology positions were led by Baidu, Inc. Spon. ADR, a China-based website search engine, which posted a return of +53%. Other strong-performing holdings included Apple, Inc. (+27%), and financial transactions processor Visa, Inc. – Cl. A (+32%).
Stock selection in the Materials and Industrials sectors was strong. BHP Billiton PLC ADR, one of the world’s largest mining companies, posted a return of +26%. The Dow Chemical Company, a leading manufacturer of chemicals, polymers, and agricultural products, gained +15%. Leading Industrials positions included railroad operator Union Pacific Corporation (+27%) and aerospace/defense company General Dynamics Corporation (+21%).
Finally, the Fund benefitted from abstaining from investments in the Utilities and Telecommunication Services sectors, which were the weakest-performing sectors of the S&P 500 Index.
There were several areas of weakness for the Focus Fund during the semi-annual period. The Fund’s Energy holdings were material detractors from performance. Southwestern Energy Company and Petroleo Brasiliero S.A. ADR slid -16% and -14%, respectively. Petroleo Brasiliero was sold from the Fund. The Fund’s Consumer Discretionary positions posted a collective return of nearly +17%. While positive, the return lagged the +21% return of the benchmark index sector. While many of the Fund’s technology-related positions posted strong gains, the Fund was negatively impacted by its position in wireless communications company QUALCOMM, Inc. which slid -14% prior to being sold from the Fund. The Fund’s performance was further hampered by having an overweight allocation to the Financials sector, a sector that failed to keep pace with the overall S&P 500 Index return. The Fund’s position in The Goldman Sachs Group, Inc. (-7%) further detracted from performance results.
During the period, the Fund reduced its exposure to the Information Technology, Financials, and Energy sectors while increasing its exposure to the Industrials, Consumer Discretionary, and Materials sectors.
GROWTH FUND
The Marsico Growth Fund shared many of the Focus Fund’s performance attributes for the six-month period ended March 31, 2010. Like the Focus Fund, certain of the Growth Fund’s Information Technology positions posted strong gains, most notably Baidu, Inc. Spon. ADR (+54%), Visa, Inc. – Cl. A (+31%), and Apple, Inc. (+27%).
Also similar to the Focus Fund, the Growth Fund’s stock selection in the Materials and Industrials sectors was strong. BHP Billiton PLC ADR (+26%) and fertilizer company Potash Corporation of Saskatchewan, Inc. (+32%) were among the Fund’s strongest-performing Materials holdings. Union Pacific Corporation (+27%) and General Dynamics Corporation (+21%) were among the Fund’s best-performing Industrials positions.
The Growth Fund also benefitted from having little or no exposure to the weak-performing Utilities sector while maintaining an overweight allocation, on average, to the strong-performing Consumer Discretionary sector.
The Growth Fund’s areas of weakness were similar to those of the Focus Fund. Financials-related investments negatively impacted the Fund’s performance on two levels. The Fund was penalized by having an overweight allocation, on average, to the weakest-performing sector of the S&P 500 Index. Several of the Fund’s holdings within the sector posted disappointing performance results, including The Goldman Sachs Group, Inc. (-7%) and Bank of America Corporation (-9% prior to being sold).
The Fund’s Energy holdings struggled. Transocean Ltd. eked out a modest gain of just 1%. As one of the Fund’s largest individual positions, Transocean Ltd. had a material, adverse impact on performance results. Petroleo Brasiliero S.A. ADR dipped -2% and was sold from the Fund.
Wireless communications company QUALCOMM, Inc. (-13% prior to being sold) was one of the single largest detractors from the Fund’s performance during the period. Biotechnology holding, Gilead Sciences, Inc., posted a weak return of -1% and further dampened performance results.
The Fund increased its exposure to the Consumer Discretionary, Industrials, and Materials sectors during the period, while reducing exposure to the Information Technology, Financials, and Energy sectors.
Fiscal Period-End Investment Posture
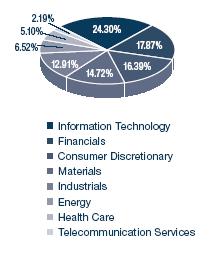
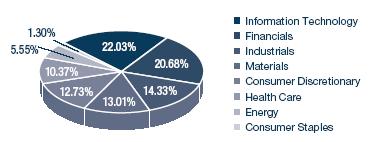
As of March 31, 2010, the Focus Fund’s and the Growth Fund’s primary sector allocations included Information Technology, Financials, Consumer Discretionary, Materials, and Industrials. The Funds had no significant exposure to the Utilities or Consumer Staples sectors.
On a separate note, Doug was promoted to serve as co-portfolio manager for the Focus Fund and the Growth Fund effective February 1, 2010. Doug is a senior analyst with Marsico Capital Management, and is also the portfolio manager of the Marsico Flexible Capital Fund. Doug joined Marsico Capital Management in August 2005, and became the portfolio manager of the Marsico Flexible Capital Fund in 2007. Doug has 10 years of experience as a securities analyst. Prior to joining Marsico Capital Management, he spent more than four years at Trust Company of the West, where he was a Senior Vice President and Financial Services Analyst for US equities.
Sincerely,
THOMAS F. MARSICO
PORTFOLIO MANAGER
A. DOUGLAS RAO
PORTFOLIO MANAGER
| (1) | Total returns are based on net change in net asset value assuming reinvestment of distributions. A redemption fee of 2% may be imposed on redemptions or exchanges of Fund shares owned for 30 days or less. Please see the Prospectus for more information. |
March 31, 2010 (Unaudited)
The Focus Fund invests primarily in the common stocks of large companies, normally a core position of 20–30 common stocks that are selected for their long-term growth potential.
| TOTAL ANNUAL OPERATING EXPENSES* | 1.32% | NET ASSETS | $2,093,772,044 | NET ASSET VALUE PER SHARE | $16.18 |
| | |
GROWTH OF $10,000(1) | PERFORMANCE COMPARISON |
| | |
| |
| | |
SECTOR ALLOCATION(2) | TOP FIVE HOLDINGS |
| | | |
| | |
| |
| |
UNION PACIFIC CORPORATION | |
| |
| | | |
| * | The Total Annual Operating Expenses are reflective of the information disclosed in the Funds’ Prospectus dated February 1, 2010 and may differ from the expense ratio disclosed in this report. |
The performance data quoted here represent past performance, and past performance is not a guarantee of future results. Investment return and principal value of an investment will fluctuate so that an investor’s shares, when redeemed, may be worth more or less than their original cost. Current performance may be lower or higher than the performance information quoted. To obtain performance information current to the most recent month-end, please call 888-860-8686 or visit www.marsicofunds.com. A redemption fee may be imposed on redemptions or exchanges of Fund shares held for 30 days or less.
The performance included in the chart and graph does not reflect the deduction of taxes on Fund distributions or the redemption of Fund shares.
All indices are unmanaged and investors cannot invest directly in an index.
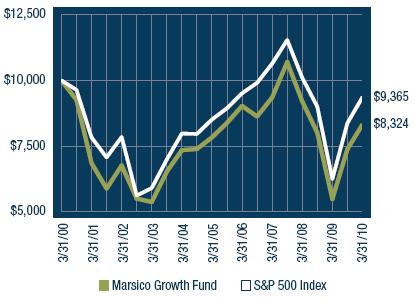
| (1) | This chart assumes an initial investment of $10,000 made on March 31, 2000. Total returns are based on net change in NAV, assuming reinvestment of distributions. |
| (2) | Sector weightings represent the percentage of the Fund’s investments (excluding cash equivalents) in certain general sectors. These sectors may include more than one industry. The Fund’s portfolio composition is subject to change at any time. |
MARSICO FOCUS FUND
SCHEDULE OF INVESTMENTS
March 31, 2010 (Unaudited)
| | | Number | | | | | | Percent | |
| | | of | | | | | | of Net | |
| | | Shares | | | Value | | | Assets | |
| COMMON STOCKS | | | | | | | | | |
| Aerospace & Defense | | | | | | | | | |
| General Dynamics Corporation | | | 966,886 | | | $ | 74,643,599 | | | | 3.56 | % |
| Goodrich Corporation | | | 859,624 | | | | 60,620,685 | | | | 2.90 | |
| | | | | | | | 135,264,284 | | | | 6.46 | |
| Air Freight & Logistics | | | | | | | | | | | | |
| FedEx Corporation | | | 607,379 | | | | 56,729,199 | | | | 2.71 | |
| | | | | | | | | | | | | |
| Biotechnology | | | | | | | | | | | | |
| Gilead Sciences, Inc.* | | | 761,948 | | | | 34,653,395 | | | | 1.65 | |
| | | | | | | | | | | | | |
| Casinos & Gaming | | | | | | | | | | | | |
| Wynn Resorts Ltd. | | | 298,951 | | | | 22,669,454 | | | | 1.08 | |
| | | | | | | | | | | | | |
| Communications Equipment | | | | | | | | | |
| Cisco Systems, Inc.* | | | 2,388,908 | | | | 62,183,275 | | | | 2.97 | |
| | | | | | | | | | | | | |
| Computer Hardware | | | | | | | | | | | | |
| Apple, Inc.* | | | 583,822 | | | | 137,157,302 | | | | 6.55 | |
| | | | | | | | | | | | | |
| Consumer Finance | | | | | | | | | | | | |
| American Express Company | | | 1,604,438 | | | | 66,199,112 | | | | 3.16 | |
| | | | | | |
| Data Processing & Outsourced Services | | | | | |
| MasterCard, Inc. - Cl. A | | | 263,850 | | | | 67,017,900 | | | | 3.20 | |
| Visa, Inc. - Cl. A | | | 659,061 | | | | 59,994,323 | | | | 2.87 | |
| | | | | | | | 127,012,223 | | | | 6.07 | |
| Diversified Banks | | | | | | | | | | | | |
| U.S. Bancorp | | | 2,811,977 | | | | 72,773,965 | | | | 3.48 | |
| Wells Fargo & Company | | | 3,493,634 | | | | 108,721,890 | | | | 5.19 | |
| | | | | | | | 181,495,855 | | | | 8.67 | |
| Diversified Chemicals | | | | | | | | | | | | |
| The Dow Chemical Company | | | 5,014,080 | | | | 148,266,346 | | | | 7.08 | |
| | | | | | | | | | | | | |
| Diversified Metals & Mining | | | | | | | | | |
| BHP Billiton PLC ADR | | | 1,323,016 | | | | 90,533,985 | | | | 4.32 | |
| | | | | | | | | | | | | |
| Fertilizers & Agricultural Chemicals | | | | | | | | | |
| Potash Corporation of | | | | | | | | | | | | |
| Saskatchewan, Inc. | | | 259,514 | | | | 30,972,996 | | | | 1.48 | |
| | | | | | | | | | | | | |
| Health Care Equipment | | | | | | | | | | | | |
| Intuitive Surgical, Inc.* | | | 149,596 | | | | 52,078,855 | | | | 2.49 | |
| | | | | | | | | | | | | |
| Internet Retail | | | | | | | | | | | | |
| Amazon.com, Inc.* | | | 418,867 | | | | 56,852,818 | | | | 2.72 | |
| priceline.com, Inc.* | | | 200,337 | | | | 51,085,935 | | | | 2.44 | |
| | | | | | | | 107,938,753 | | | | 5.16 | |
| Internet Software & Services | | | | | | | | | |
| Baidu, Inc. Spon. ADR* | | | 99,509 | | | | 59,406,873 | | | | 2.84 | |
| Google, Inc. - Cl. A* | | | 125,539 | | | | 71,181,868 | | | | 3.40 | |
| | | | | | | | 130,588,741 | | | | 6.24 | |
| Investment Banking & Brokerage | | | | | | | |
| The Goldman Sachs Group, Inc. | | | 475,789 | | | | 81,183,877 | | | | 3.88 | |
| | | | | | | | | | | | | |
| Movies & Entertainment | | | | | | | | | | | | |
| The Walt Disney Company | | | 1,789,466 | | | | 62,470,258 | | | | 2.98 | |
| | | | | | | | | | | | | |
| Oil & Gas Drilling | | | | | | | | | | | | |
| Transocean Ltd.* | | | 968,676 | | | | 83,674,233 | | | | 4.00 | |
| | | | | | |
| Oil & Gas Exploration & Production | | | | | |
| Southwestern Energy Company* | | | 774,053 | | | | 31,519,438 | | | | 1.51 | |
| | | | | | |
| Other Diversified Financial Services | | | | | |
| JPMorgan Chase & Co. | | | 2,237,449 | | | | 100,125,843 | | | | 4.78 | |
| | | | | | | | | | | | | |
| Packaged Foods & Meats | | | | | | | | | | | | |
| Mead Johnson Nutrition Company | | | 516,475 | | | | 26,872,194 | | | | 1.28 | |
| | | | | | | | | | | | | |
| Pharmaceuticals | | | | | | | | | | | | |
| Johnson & Johnson | | | 907,616 | | | | 59,176,563 | | | | 2.82 | |
| Merck & Co., Inc. | | | 1,854,558 | | | | 69,267,741 | | | | 3.31 | |
| | | | | | | | 128,444,304 | | | | 6.13 | |
| Railroads | | | | | | | | | | | | |
| Union Pacific Corporation | | | 1,435,612 | | | | 105,230,360 | | | | 5.03 | |
| | | | | | | | | | | | | |
| Restaurants | | | | | | | | | | | | |
| McDonald’s Corporation | | | 1,062,095 | | | | 70,862,978 | | | | 3.38 | |
| | | | | | | | | | | | | |
| TOTAL COMMON STOCKS | | | | | | | | | | | | |
| (Cost $1,568,453,373) | | | | | | | 2,074,127,260 | | | | 99.06 | |
| | | | | | | | | | | | | |
| TOTAL INVESTMENTS | | | | | | | | | | | | |
| (Cost $1,568,453,373) | | | | | | | 2,074,127,260 | | | | 99.06 | |
| | | | | | | | | | | | | |
| Cash and Other Assets, Less Liabilities | | | | | | | 19,644,784 | | | | 0.94 | |
| | | | | | | | | | | | | |
| NET ASSETS | | | | | | $ | 2,093,772,044 | | | | 100.00 | % |
See notes to financial statements.
March 31, 2010 (Unaudited)
The Growth Fund invests primarily in the common stocks of large companies that are selected for their long-term growth potential. The Growth Fund will normally hold a core position of between 35 and 50 common stocks.
| TOTAL ANNUAL OPERATING EXPENSES* | 1.31% | NET ASSETS | $1,036,071,277 | NET ASSET VALUE PER SHARE | $17.18 |
| | |
GROWTH OF $10,000(1) | PERFORMANCE COMPARISON |
| | |
| |
| | |
SECTOR ALLOCATION(2) | TOP FIVE HOLDINGS |
| | | |
| | |
| |
THE DOW CHEMICAL COMPANY | |
UNION PACIFIC CORPORATION | |
| |
| | | |
| * | The Total Annual Operating Expenses are reflective of the information disclosed in the Funds’ Prospectus dated February 1, 2010 and may differ from the expense ratio disclosed in this report. |
The performance data quoted here represent past performance, and past performance is not a guarantee of future results. Investment return and principal value of an investment will fluctuate so that an investor’s shares, when redeemed, may be worth more or less than their original cost. Current performance may be lower or higher than the performance information quoted. To obtain performance information current to the most recent month-end, please call 888-860-8686 or visit www.marsicofunds.com. A redemption fee may be imposed on redemptions or exchanges of Fund shares held for 30 days or less.
The performance included in the chart and graph does not reflect the deduction of taxes on Fund distributions or the redemption of Fund shares.
All indices are unmanaged and investors cannot invest directly in an index.
| (1) | This chart assumes an initial investment of $10,000 made on March 31, 2000. Total returns are based on net change in NAV, assuming reinvestment of distributions. |
| (2) | Sector weightings represent the percentage of the Fund’s investments (excluding cash equivalents) in certain general sectors. These sectors may include more than one industry. The Fund’s portfolio composition is subject to change at any time. |
| MARSICO GROWTH FUND |
| SCHEDULE OF INVESTMENTS |
| March 31, 2010 (Unaudited) |
| | | Number | | | | | | Percent | |
| | | of | | | | | | of Net | |
| | | Shares | | | Value | | | Assets | |
| COMMON STOCKS | | | | | | | | | |
| | | | | | | | | | |
| Aerospace & Defense | | | | | | | | | |
| General Dynamics Corporation | | | 483,646 | | | $ | 37,337,471 | | | | 3.60 | % |
| | | | | | | | | | | | | |
| Air Freight & Logistics | | | | | | | | | | | | |
| FedEx Corporation | | | 301,557 | | | | 28,165,424 | | | | 2.72 | |
| | | | | | | | | | | | | |
| Apparel, Accessories & Luxury Goods | | | | | | | | | |
| Polo Ralph Lauren Corporation | | | 62,318 | | | | 5,299,523 | | | | 0.51 | |
| | | | | | | | | | | | | |
| Biotechnology | | | | | | | | | | | | |
| Gilead Sciences, Inc.* | | | 224,633 | | | | 10,216,309 | | | | 0.99 | |
| | | | | | | | | | | | | |
| Cable & Satellite | | | | | | | | | | | | |
| The DIRECTV Group, Inc.* | | | 293,560 | | | | 9,925,264 | | | | 0.96 | |
| | | | | | | | | | | | | |
| Casinos & Gaming | | | | | | | | | | | | |
| Wynn Resorts Ltd. | | | 253,157 | | | | 19,196,895 | | | | 1.85 | |
| | | | | | | | | | | | | |
| Communications Equipment | | | | | | | | | |
| Cisco Systems, Inc.* | | | 1,275,642 | | | | 33,204,962 | | | | 3.21 | |
| Research In Motion Ltd.* | | | 102,755 | | | | 7,598,732 | | | | 0.73 | |
| | | | | | | | 40,803,694 | | | | 3.94 | |
| Computer Hardware | | | | | | | | | | | | |
| Apple, Inc.* | | | 244,483 | | | | 57,436,391 | | | | 5.54 | |
| | | | | | | | | | | | | |
| Computer Storage & Peripherals | | | | | | | | | |
| EMC Corporation* | | | 963,263 | | | | 17,377,265 | | | | 1.68 | |
| | | | | | | | | | | | | |
| Consumer Finance | | | | | | | | | | | | |
| American Express Company | | | 476,221 | | | | 19,648,878 | | | | 1.90 | |
| | | | | | |
| Data Processing & Outsourced Services | | | | | |
| MasterCard, Inc. - Cl. A | | | 142,830 | | | | 36,278,820 | | | | 3.50 | |
| Visa, Inc. - Cl. A | | | 326,004 | | | | 29,676,144 | | | | 2.87 | |
| | | | | | | | 65,954,964 | | | | 6.37 | |
| Department Stores | | | | | | | | | | | | |
| Nordstrom, Inc. | | | 214,761 | | | | 8,772,987 | | | | 0.85 | |
| | | | | | | | | | | | | |
| Diversified Banks | | | | | | | | | | | | |
| U.S. Bancorp | | | 896,597 | | | | 23,203,930 | | | | 2.24 | |
| Wells Fargo & Company | | | 1,378,172 | | | | 42,888,713 | | | | 4.14 | |
| | | | | | | | 66,092,643 | | | | 6.38 | |
| Diversified Chemicals | | | | | | | | | | | | |
| PPG Industries, Inc. | | | 313,045 | | | | 20,473,143 | | | | 1.98 | |
| The Dow Chemical Company | | | 1,443,591 | | | | 42,686,986 | | | | 4.12 | |
| | | | | | | | 63,160,129 | | | | 6.10 | |
| Diversified Metals & Mining | | | | | | | | | |
| BHP Billiton PLC ADR | | | 542,815 | | | | 37,144,830 | | | | 3.58 | |
| | | | | | | | | | | | | |
| Fertilizers & Agricultural Chemicals | | | | | | | | | |
| Potash Corporation of | | | | | | | | | | | | |
| Saskatchewan, Inc. | | | 147,050 | | | | 17,550,418 | | | | 1.69 | |
| | | | | | | | | | | | | |
| Footwear | | | | | | | | | | | | |
| NIKE, Inc. - Cl. B | | | 429,052 | | | | 31,535,322 | | | | 3.04 | |
| | | | | | | | | | | | | |
| Industrial Gases | | | | | | | | | | | | |
| Praxair, Inc. | | | 377,912 | | | | 31,366,696 | | | | 3.03 | |
| | | | | | | | | | | | | |
| Industrial Machinery | | | | | | | | | | | | |
| Danaher Corporation | | | 79,645 | | | | 6,364,432 | | | | 0.61 | |
| Internet Retail | | | | | | | | | |
| Amazon.com, Inc.* | | | 238,108 | | | | 32,318,399 | | | | 3.12 | |
| priceline.com, Inc.* | | | 50,572 | | | | 12,895,860 | | | | 1.24 | |
| | | | | | | | 45,214,259 | | | | 4.36 | |
| Internet Software & Services | | | | | | | | | |
| Baidu, Inc. Spon. ADR* | | | 47,679 | | | | 28,464,363 | | | | 2.75 | |
| Google, Inc. - Cl. A* | | | 64,065 | | | | 36,325,496 | | | | 3.50 | |
| | | | | | | | 64,789,859 | | | | 6.25 | |
| Investment Banking & Brokerage | | | | | | | | | |
| The Goldman Sachs Group, Inc. | | | 212,245 | | | | 36,215,364 | | | | 3.49 | |
| | | | | | | | | | | | | |
| Oil & Gas Drilling | | | | | | | | | | | | |
| Transocean Ltd.* | | | 467,722 | | | | 40,401,826 | | | | 3.90 | |
| | | | | | |
| Oil & Gas Exploration & Production | | | | | |
| EOG Resources, Inc. | | | 276,819 | | | | 25,727,558 | | | | 2.48 | |
| | | | | | |
| Other Diversified Financial Services | | | | | |
| JPMorgan Chase & Co. | | | 652,810 | | | | 29,213,247 | | | | 2.82 | |
| | | | | | | | | | | | | |
| Pharmaceuticals | | | | | | | | | | | | |
| Johnson & Johnson | | | 320,142 | | | | 20,873,259 | | | | 2.02 | |
| Merck & Co., Inc. | | | 552,489 | | | | 20,635,464 | | | | 1.99 | |
| | | | | | | | 41,508,723 | | | | 4.01 | |
| Railroads | | | | | | | | | | | | |
| Norfolk Southern Corporation | | | 300,942 | | | | 16,819,648 | | | | 1.62 | |
| Union Pacific Corporation | | | 576,203 | | | | 42,235,680 | | | | 4.08 | |
| | | | | | | | 59,055,328 | | | | 5.70 | |
| Regional Banks | | | | | | | | | | | | |
| The PNC Financial Services Group, Inc. | | | 348,400 | | | | 20,799,480 | | | | 2.01 | |
| | | | | | | | | | | | | |
| Restaurants | | | | | | | | | | | | |
| McDonald’s Corporation | | | 552,834 | | | | 36,885,084 | | | | 3.56 | |
| | | | | | | | | | | | | |
| Specialty Stores | | | | | | | | | | | | |
| Tiffany & Co. | | | 196,847 | | | | 9,348,264 | | | | 0.90 | |
| | | | | | |
| Wireless Telecommunication Services | | | | | |
| American Tower Corporation - Cl. A* | | | 374,452 | | | | 15,955,400 | | | | 1.54 | |
| Crown Castle International Corp.* | | | 164,195 | | | | 6,277,175 | | | | 0.61 | |
| | | | | | | | 22,232,575 | | | | 2.15 | |
| TOTAL COMMON STOCKS | | | | | | | | | | | | |
| (Cost $714,992,269) | | | | | | | 1,004,741,102 | | | | 96.97 | |
| | | | | | | | | | | | | |
| PREFERRED STOCKS | | | | | | | | | | | | |
| | | | | | | | | | | | | |
| Diversified Banks | | | | | | | | | | | | |
| Wells Fargo & Company, | | | | | | | | | | | | |
| Series J Pref., 8.000% | | | 337,000 | | | | 9,200,100 | | | | 0.89 | |
| | | | | | | | | | | | | |
| TOTAL PREFERRED STOCKS | | | | | | | | | |
| (Cost $5,954,707) | | | | | | | 9,200,100 | | | | 0.89 | |
| | | | | | | | | | | | | |
| SHORT-TERM INVESTMENTS | | | | | | | | | |
| SSgA U.S. Government | | | | | | | | | | | | |
| Money Market Fund, 0.000% | | | 21,322,637 | | | | 21,322,637 | | | | 2.06 | |
| | | | | | |
| TOTAL SHORT-TERM INVESTMENTS | | | | | |
| (Cost $21,322,637) | | | | | | | 21,322,637 | | | | 2.06 | |
| | | | | | | | | | | | | |
| TOTAL INVESTMENTS | | | | | | | | | | | | |
| (Cost $742,269,613) | | | | | | | 1,035,263,839 | | | | 99.92 | |
| | | | | | | | | | | | | |
| Cash and Other Assets, Less Liabilities | | | | | | | 807,438 | | | | 0.08 | |
| | | | | | | | | | | | | |
| NET ASSETS | | | | | | $ | 1,036,071,277 | | | | 100.00 | % |
See notes to financial statements.
INVESTMENT REVIEW BY CORY GILCHRIST (UNAUDITED)
The Marsico 21st Century Fund posted a return of +11.25% for the six-month fiscal period ended March 31, 2010. The Fund modestly underperformed the S&P 500 Index, which we consider to be the Fund’s primary benchmark index and which had a total return of +11.75% over the same time period. For comparative purposes, the Russell 3000 Index, a proxy for the performance of all publicly-traded US equity securities including smaller capitalization companies (which may be a useful representation of the Fund’s ability to invest across the entire market capitalization spectrum), had a total return of +12.19%. Please see the Fund Overview for more detailed information about the Fund’s longer-term performance for various time periods ended March 31, 2010.
The performance data for the Fund quoted here represent past performance, and past performance is not a guarantee of future results. Investment return and principal value of an investment will fluctuate so that an investor’s shares, when redeemed, may be worth more or less than their original cost. Current performance may be lower or higher than the performance information quoted. To obtain performance information current to the most recent month-end, please call 888-860-8686 or visit www.marsicofunds.com.(1)
This review highlights Fund performance over a six-month fiscal period. Shareholders should keep in mind that the Fund is intended for long-term investors who hold their shares for substantially longer periods of time. You should also keep in mind that our views on all investments discussed in this report are subject to change at any time. References to specific securities, industries, and sectors discussed in this report are not recommendations to buy or sell such securities or related investments, and the Fund may not necessarily hold these securities or investments today. Please see the accompanying Schedule of Investments for the percentage of the Fund’s portfolio represented by the securities mentioned in this report as of the end of the reporting period.
There were several primary factors that negatively impacted the 21st Century Fund’s investment results. The Fund’s performance was negatively impacted by having an overweight allocation to the Financials sector, which was a relatively weak-performing sector of the S&P 500 Index. A few of the Fund’s Financials positions posted negative returns, most notably The Goldman Sachs Group, Inc. (-17% prior to being sold), Jefferies Group, Inc. (-13%), and State Street Corporation (-14%).
Stock selection in the Industrials, Energy, and Consumer Discretionary sectors did not keep pace with the performance results of their sector counterparts in the S&P 500 Index. In the Industrials sector, wind energy turbine manufacturer Vestas Wind Systems A/S fell significantly in value and was sold from the Fund. The Fund’s Energy positions posted negative returns, including Range Resources Corporation (-5%), National Oilwell Varco, Inc. (-3%), and Petroleo Brasiliero S.A. ADR (-6% prior to being sold). Brazilian real estate company Cyrela Brazil Realty S.A. and Brazil-based home builder Gafisa S.A. ADR declined -9% and -10%, respectively. The Fund sold its position in Gafisa during the period.
There were some significant areas of strength for the Fund. The Fund’s stock selection in the Information Technology and Telecommunication Services sectors was strong. Crown Castle International Corp., the wireless communications tower company, soared +21%. Crown Castle was one of the Fund’s largest individual positions and, as such, had a material, positive effect on performance. The Fund’s investment results were also helped by strong performance of several technology-related positions, including Apple, Inc. (+26%), financial transaction processor MasterCard, Inc. – Cl. A (+26%), light emitting diode (LED) company Cree, Inc. (+25%), virtual computing solutions provider Citrix Systems, Inc. (+21% prior to being sold), and Google, Inc. – Cl. A (+15%).
While a number of the Fund’s Consumer Discretionary positions struggled, as discussed earlier, there were a few holdings that posted sizeable gains. Positions in Ford Motor Company common stock and a Ford Motor Company convertible bond (4.250% 11/15/2016) soared +88% and +59%, respectively, prior to being sold. (The Fund purchased the Ford Motor convertible bond at its initial public offering.) Entertainment company The Walt Disney Company appreciated +29%.
Other leading individual positions for the Fund included surgical systems company Intuitive Surgical, Inc. (+33%) and regional bank City National Corporation (+39%).
The Fund was also aided by having a significant portion of its net assets allocated to the Consumer Discretionary sector, the strongest-performing sector of the benchmark index, while abstaining from investments in Utilities, one of the weakest-performing sectors of the S&P 500 Index.
During the period, the Fund increased its exposure to the Consumer Discretionary sector while reducing its exposure to the Information Technology, Materials, and Energy sectors.
The 21st Century Fund has tended to have a relatively high portfolio turnover level because of its investment style. Although the Fund may hold core positions for some time, it may change its portfolio composition quickly to take advantage of new opportunities, or to address issues affecting particular holdings.
Fiscal Period-End Investment Posture
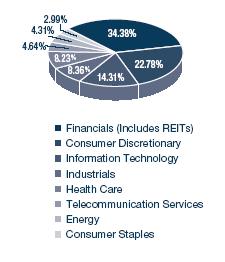
As of March 31, 2010, the Fund’s primary economic sector allocations were in the Financials, Consumer Discretionary, and Information Technology sectors. As of period-end, the Fund had no significant investments in the Utilities and Materials sectors.
Sincerely,
CORYDON J. GILCHRIST, CFA
PORTFOLIO MANAGER
| (1) | Total returns are based on net change in net asset value assuming reinvestment of distributions. For the period prior to March 31, 2004, the performance returns for the 21st Century Fund reflect a fee waiver in effect; in the absence of such a waiver, the returns would have been reduced. For the period beginning April 2004 through January 2005, performance returns for the Fund would have been higher but for the reimbursement of fees waived previously. A redemption fee of 2% may be imposed on redemptions or exchanges of Fund shares owned for 30 days or less. Please see the Prospectus for more information. |
21ST CENTURY FUND OVERVIEW |
March 31, 2010 (Unaudited)
The 21st Century Fund invests primarily in common stocks that are selected for their long-term growth potential. The Fund may invest in companies of any size, and will normally hold a core position of between 35 and 50 common stocks.
| TOTAL ANNUAL OPERATING EXPENSES* | 1.38% | NET ASSETS | | NET ASSET VALUE PER SHARE | $12.86 |
| | |
GROWTH OF $10,000(1)(2) | PERFORMANCE COMPARISON |
| | |
| |
| | |
SECTOR ALLOCATION(2) | TOP FIVE HOLDINGS |
| | | |
| | |
| |
CROWN CASTLE INTERNATIONAL CORP. | |
| |
THE PNC FINANCIAL SERVICES GROUP, INC. | |
| | | |
| * | The Total Annual Operating Expenses are reflective of the information disclosed in the Funds’ Prospectus dated February 1, 2010 and may differ from the expense ratio disclosed in this report. |
The performance data quoted here represent past performance, and past performance is not a guarantee of future results. Investment return and principal value of an investment will fluctuate so that an investor’s shares, when redeemed, may be worth more or less than their original cost. Current performance may be lower or higher than the performance information quoted. To obtain performance information current to the most recent month-end, please call 888-860-8686 or visit www.marsicofunds.com. A redemption fee may be imposed on redemptions or exchanges of Fund shares held for 30 days or less.
The performance included in the chart and graph does not reflect the deduction of taxes on Fund distributions or the redemption of Fund shares.
All indices are unmanaged and investors cannot invest directly in an index.
| (1) | The performance returns for the 21st Century Fund (for the period prior to March 31, 2004) reflect a fee waiver in effect; in the absence of such a waiver, the returns would be reduced. For the period beginning April 2004 through January 2005, performance returns for the 21st Century Fund would be higher but for the reimbursement of fees waived previously. |
| (2) | This chart assumes an initial investment of $10,000 made on March 31, 2000. Total returns are based on net change in NAV, assuming reinvestment of distributions. |
| (3) | Sector weightings represent the percentage of the Fund’s investments (excluding cash equivalents) in certain general sectors. These sectors may include more than one industry. The Fund’s portfolio composition is subject to change at any time. |
MARSICO 21ST CENTURY FUND
SCHEDULE OF INVESTMENTS
March 31, 2010 (Unaudited)
| | | Number | | | | | | Percent | |
| | | of | | | | | | of Net | |
| | | Shares | | | Value | | | Assets | |
| COMMON STOCKS | | | | | | | | | |
| | | | | | | | | | |
| Aerospace & Defense | | | | | | | | | |
| Precision Castparts Corp. | | | 154,041 | | | $ | 19,518,535 | | | | 2.26 | % |
| | | | | | | | | | | | | |
| Apparel Retail | | | | | | | | | | | | |
| J. Crew Group, Inc.* | | | 469,348 | | | | 21,543,073 | | | | 2.49 | |
| rue21, inc.* | | | 133,218 | | | | 4,618,668 | | | | 0.53 | |
| | | | | | | | 26,161,741 | | | | 3.02 | |
| Apparel, Accessories & Luxury Goods | | | | | |
| Polo Ralph Lauren Corporation | | | 218,300 | | | | 18,564,232 | | | | 2.15 | |
| | | | | | | | | | | | | |
| Application Software | | | | | | | | | | | | |
| ANSYS, Inc.* | | | 236,539 | | | | 10,204,292 | | | | 1.18 | |
| | | | | | |
| Asset Management & Custody Banks | | | | | |
| State Street Corporation | | | 460,045 | | | | 20,766,431 | | | | 2.40 | |
| | | | | | | | | | | | | |
| Biotechnology | | | | | | | | | | | | |
| Celgene Corporation* | | | 273,664 | | | | 16,956,221 | | | | 1.96 | |
| Gilead Sciences, Inc.* | | | 366,722 | | | | 16,678,517 | | | | 1.93 | |
| | | | | | | | 33,634,738 | | | | 3.89 | |
| Brewers | | | | | | | | | | | | |
| Anheuser-Busch InBev N.V. | | | 492,210 | | | | 24,793,853 | | | | 2.87 | |
| | | | | | | | | | | | | |
| Broadcasting | | | | | | | | | | | | |
| CBS Corporation - Cl. B | | | 1,897,933 | | | | 26,457,186 | | | | 3.06 | |
| | | | | | | | | | | | | |
| Casinos & Gaming | | | | | | | | | | | | |
| Wynn Resorts Ltd. | | | 113,737 | | | | 8,624,677 | | | | 1.00 | |
| | | | | | | | | | | | | |
| Computer Hardware | | | | | | | | | | | | |
| Apple, Inc.* | | | 117,227 | | | | 27,540,139 | | | | 3.18 | |
| | | | | | | | | | |
| Construction & Engineering | | | | | | | | | |
| AECOM Technology Corporation* | | | 168,842 | | | | 4,790,048 | | | | 0.55 | |
| | | | | | |
| Data Processing & Outsourced Services | | | | | |
| MasterCard, Inc. - Cl. A | | | 138,848 | | | | 35,267,392 | | | | 4.08 | |
| | | | | | | | | | | | | |
| Diversified Banks | | | | | | | | | | | | |
| U.S. Bancorp | | | 1,227,766 | | | | 31,774,584 | | | | 3.68 | |
| Wells Fargo & Company | | | 1,743,359 | | | | 54,253,332 | | | | 6.27 | |
| | | | | | | | 86,027,916 | | | | 9.95 | |
| Diversified Support Services | | | | | | | | | |
| Ritchie Bros. Auctioneers, Inc. | | | 198,066 | | | | 4,264,361 | | | | 0.49 | |
| | | | | | | | | | |
| Electrical Components & Equipment | | | | | | | | | |
| Sensata Technologies Holding N.V.* | | | 349,600 | | | | 6,278,816 | | | | 0.72 | |
| | | | | | | | | | | | | |
| Health Care Equipment | | | | | | | | | | | | |
| Intuitive Surgical, Inc.* | | | 91,335 | | | | 31,796,454 | | | | 3.68 | |
| | | | | | | | | | | | | |
| Health Care Services | | | | | | | | | | | | |
| Emergency Medical | | | | | | | | | | | | |
| Services Corporation - Cl. A* | | | 49,469 | | | | 2,797,472 | | | | 0.32 | |
| Homebuilding | | | | | | | | | |
| Cyrela Brazil Realty S.A. | | | 488,473 | | | | 5,784,712 | | | | 0.67 | |
| PDG Realty S.A. | | | | | | | | | | | | |
| Empreendimentos e Participações | | | 671,962 | | | | 5,596,062 | | | | 0.64 | |
| | | | | | | | 11,380,774 | | | | 1.31 | |
| Homefurnishing Retail | | | | | | | | | | | | |
| Williams-Sonoma, Inc. | | | 157,265 | | | | 4,134,497 | | | | 0.48 | |
| | | | | | | | | | |
| Hotels, Resorts & Cruise Lines | | | | | | | | | |
| Starwood Hotels & | | | | | | | | | | | | |
| Resorts Worldwide, Inc. | | | 278,116 | | | | 12,971,330 | | | | 1.50 | |
| | | | | | | | | | | | | |
| Internet Retail | | | | | | | | | | | | |
| Amazon.com, Inc.* | | | 108,922 | | | | 14,783,983 | | | | 1.71 | |
| priceline.com, Inc.* | | | 17,826 | | | | 4,545,630 | | | | 0.52 | |
| | | | | | | | 19,329,613 | | | | 2.23 | |
| Internet Software & Services | | | | | | | | | |
| Google, Inc. - Cl. A* | | | 50,604 | | | | 28,692,974 | | | | 3.32 | |
| OpenTable, Inc.* | | | 72,331 | | | | 2,757,981 | | | | 0.32 | |
| | | | | | | | 31,450,955 | | | | 3.64 | |
| Investment Banking & Brokerage | | | | | | | | | |
| Jefferies Group, Inc. | | | 936,164 | | | | 22,159,002 | | | | 2.56 | |
| | | | | | | | | | | | | |
| Leisure Facilities | | | | | | | | | | | | |
| Vail Resorts, Inc.* | | | 514,986 | | | | 20,645,789 | | | | 2.39 | |
| | | | | | | | | | | | | |
| Movies & Entertainment | | | | | | | | | | | | |
| The Walt Disney Company | | | 1,028,008 | | | | 35,887,759 | | | | 4.15 | |
| | | | | | | | | | |
| Oil & Gas Equipment & Services | | | | | | | | | |
| National Oilwell Varco, Inc. | | | 439,557 | | | | 17,837,223 | | | | 2.06 | |
| | | | | | | | | | |
| Oil & Gas Exploration & Production | | | | | | | | | |
| Range Resources Corporation | | | 382,438 | | | | 17,924,869 | | | | 2.07 | |
| | | | | | | | | | |
| Other Diversified Financial Services | | | | | | | | | |
| JPMorgan Chase & Co. | | | 985,368 | | | | 44,095,218 | | | | 5.10 | |
| | | | | | | | | | | | | |
| Railroads | | | | | | | | | | | | |
| CSX Corporation | | | 677,856 | | | | 34,502,870 | | | | 3.99 | |
| | | | | | | | | | | | | |
| Regional Banks | | | | | | | | | | | | |
| City National Corporation | | | 326,897 | | | | 17,642,631 | | | | 2.04 | |
| CVB Financial Corp. | | | 717,402 | | | | 7,123,802 | | | | 0.82 | |
| First Horizon National Corporation* | | | 1,067,629 | | | | 15,000,187 | | | | 1.74 | |
| First Midwest Bancorp, Inc. | | | 307,751 | | | | 4,170,026 | | | | 0.48 | |
| Glacier Bancorp, Inc. | | | 280,520 | | | | 4,272,320 | | | | 0.50 | |
| The PNC Financial Services Group, Inc. | | | 594,522 | | | | 35,492,963 | | | | 4.10 | |
| | | | | | | | 83,701,929 | | | | 9.68 | |
| Restaurants | | | | | | | | | | | | |
| Chipotle Mexican Grill, Inc. - Cl. A* | | | 42,552 | | | | 4,794,334 | | | | 0.55 | |
| | | | | | | | | | | | | |
| Retail REITs | | | | | | | | | | | | |
| Colony Financial, Inc. | | | 157,543 | | | | 3,150,860 | | | | 0.36 | |
| Taubman Centers, Inc. | | | 113,597 | | | | 4,534,792 | | | | 0.53 | |
| | | | | | | | 7,685,652 | | | | 0.89 | |
See notes to financial statements.
MARSICO 21ST CENTURY FUND | |
| SCHEDULE OF INVESTMENTS (continued) |
| March 31, 2010 (Unaudited) | | |
| | | Number | | | | | | Percent | |
| | | of | | | | | | of Net | |
| | | Shares | | | Value | | | Assets | |
COMMON STOCKS (continued) | | | | | | | |
| | | | | | | | | | |
| Semiconductors | | | | | | | | | |
| Cree, Inc.* | | | 202,053 | | | $ | 14,188,162 | | | | 1.64 | % |
| | | | | | | | | | |
| Thrifts & Mortgage Finance | | | | | | | | | |
| First Niagara Financial Group, Inc. | 1,080,422 | | | | 15,363,601 | | | | 1.78 | |
| | | | | | |
| Wireless Telecommunication Services | | | | | |
| Crown Castle International Corp.* | | | 1,005,898 | | | | 38,455,481 | | | | 4.45 | |
| | | | | | | | | | |
| TOTAL COMMON STOCKS | | | | | | | | | |
| (Cost $620,771,329) | | | | | | | 823,997,341 | | | | 95.27 | |
| | | | | | | | | | | | | |
| WARRANTS | | | | | | | | | | | | |
| | | | | | | | | | |
| Other Diversified Financial Services | | | | | | | | | |
| JPMorgan Chase & Co., | | | | | | | | | | | | |
| Strike Price: $42.42, | | | | | | | | | | | | |
| Expiration Date: October 28, 2018* | 343,827 | | | | 5,284,621 | | | | 0.61 | |
| | | | | | | | | | | | | |
| TOTAL WARRANTS | | | | | | | | | | | | |
| (Cost $4,306,712) | | | | | | | 5,284,621 | | | | 0.61 | |
| | | | | | | | | | |
| SHORT-TERM INVESTMENTS | | | | | | | | | |
| SSgA U.S. Government | | | | | | | | | | | | |
| Money Market Fund, 0.000% | | | 35,314,032 | | | | 35,314,032 | | | | 4.08 | |
| | | | | | | | | | |
| TOTAL SHORT-TERM INVESTMENTS | | | | | | | | | |
| (Cost $35,314,032) | | | | | | | 35,314,032 | | | | 4.08 | |
| | | | | | | | | | | | | |
| TOTAL INVESTMENTS | | | | | | | | | | | | |
| (Cost $660,392,073) | | | | | | | 864,595,994 | | | | 99.96 | |
| | | | | | | | | | |
| Cash and Other Assets, Less Liabilities | | | | 331,768 | | | | 0.04 | |
| | | | | | | | | | | | | |
| NET ASSETS | | | | | | $ | 864,927,762 | | | | 100.00 | % |
See notes to financial statements.
| INTERNATIONAL OPPORTUNITIES FUND |
INVESTMENT REVIEW BY JIM GENDELMAN (UNAUDITED)
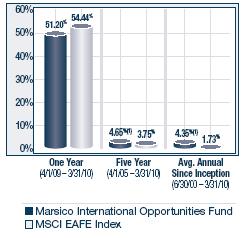
The Marsico International Opportunities Fund posted a total return of (US$) +2.25% for the six-month fiscal period ended March 31, 2010. The Fund’s return lagged the MSCI EAFE Index, which we consider to be the Fund’s primary benchmark index and which had a total return of (US$) +3.06%. Please see the Fund Overview for more detailed information about the Fund’s longer-term performance for various time periods ended March 31, 2010.
The performance data for the Fund quoted here represent past performance, and past performance is not a guarantee of future results. Investment return and principal value of an investment will fluctuate so that an investor’s shares, when redeemed, may be worth more or less than their original cost. Current performance may be lower or higher than the performance information quoted. To obtain performance information current to the most recent month-end, please call 888-860-8686 or visit www.marsicofunds.com.(1)
This review highlights Fund performance over a six-month fiscal period. Shareholders should keep in mind that the Fund is intended for long-term investors who hold their shares for substantially longer periods of time. You should also keep in mind that our views on all investments discussed in this report are subject to change at any time. References to specific securities, industries, and sectors discussed in this report are not recommendations to buy or sell such securities or related investments, and the Fund may not necessarily hold these securities or investments today. Please see the accompanying Schedule of Investments for the percentage of the Fund’s portfolio represented by the securities mentioned in this report as of the end of the reporting period.
The Fund’s performance was negatively impacted by stock selection in several sectors. Two Materials holdings posted sharp declines: Akzo Nobel N.V. dropped -16% and CEMEX S.A.B. de C.V. Spon. ADR skidded -29% prior to being sold. In the Industrials sector, wind energy companies Vestas Wind Systems A/S and Gamesa Corporación Tecnológica S.A. posted double-digit losses and were sold from the Fund. The primary blemishes in the Consumer Discretionary sector included automobile manufacturer and real estate positions. Daimler A.G. posted a return of -7% and Fiat SpA declined -22%. (Fiat was sold from the Fund prior to period-end). Brazil-based home builder Gafisa S.A. and Brazilian real estate company Cyrela Brazil Realty S.A. posted negative returns of -8% and -9%, respectively, during the period. Certain other individual holdings had disappointing results. Spain-headquartered telecommunications company Telefonica, SA (-13%) and Swiss drug manufacturer Lonza Group AG (-24%) each had a material, adverse affect on performance results.
There were several positive areas in the Fund’s performance. A primary area of strength was the Fund’s investments in the Banks industry. These included Switzerland-headquartered Julius Baer Group Ltd. (+53%), India-based ICICI Bank Ltd. Spon. ADR (+11%), and Brazil-headquartered Itaú Unibanco Holding S.A. ADR (+11% prior to being sold). The Fund further benefitted from a decision to underweight the Financials sector, as it was one of the weakest-performing sectors of the benchmark index.
A second major positive contributor to the Fund’s performance was its Information Technology holdings. These included Nintendo Co., Ltd. (+35%), semiconductor company Infineon Technologies AG (+24%), and China-based website search engine Baidu, Inc. Spon. ADR (+52% prior to being sold). The Fund’s investment results were further aided as a result of our decision to have a substantially overweighted allocation, on average, to the strong-performing Information Technology sector.
Although currency management is not a central facet of the Fund’s investment process, fluctuations in major world currencies can sometimes affect the Fund’s performance results. During the six-month fiscal period, the Fund generally benefitted from currency effects. Currencies such as the Canadian dollar and Swiss franc strengthened as compared to certain other major developed market currencies, and the Fund benefitted from having investments in securities of companies traded in Canadian and Swiss currencies. Some of the positive impact of these investments was offset by the Fund’s limited investments in companies whose securities trade in the Australian dollar, as the Australian dollar appreciated sharply during the period.
| INTERNATIONAL OPPORTUNITIES FUND |
The International Opportunities Fund has tended to have a relatively high portfolio turnover level because of its investment style. Although the Fund may hold core positions for some time, it may change its portfolio composition quickly to take advantage of new opportunities, or to address issues affecting particular holdings.
Fiscal Period-End Investment Posture
As of March 31, 2010, the Fund’s primary economic sector allocations included Consumer Discretionary, Financials, Consumer Staples, Information Technology, Health Care, and Materials. The Fund had no significant exposure to the Utilities sector. In terms of country allocations, the Fund’s most significant weightings at period-end were Japan, Switzerland, Germany, France, the United Kingdom, Spain, and Brazil, although exposure to Japan and the United Kingdom represented significantly underweighted postures relative to the benchmark index. The Fund held several positions domiciled in emerging markets including Brazil, India, China, Israel, and Taiwan. Such emerging markets exposure represented approximately 15% of the Fund’s net assets as of March 31, 2010. Country-level weightings generally should be considered a residual of the Fund’s stock selection process rather than a major, proactive facet of its investment strategy.
Sincerely,
JAMES G. GENDELMAN
PORTFOLIO MANAGER
| (1) | Total returns are based on net change in net asset value assuming reinvestment of distributions. For the period prior to September 30, 2004, the performance returns for the International Opportunities Fund reflect a fee waiver in effect; in the absence of such a waiver, the returns would have been reduced. For the period beginning October 2004 through December 2005, performance returns for the International Opportunities Fund would have been higher but for the reimbursement of fees waived previously. A redemption fee of 2% may be imposed on redemptions or exchanges of Fund shares owned for 30 days or less. Please see the Prospectus for more information. |
| INTERNATIONAL OPPORTUNITIES FUND OVERVIEW |
March 31, 2010 (Unaudited)
The International Opportunities Fund invests primarily in common stocks of foreign companies that are selected for their long-term growth potential. The Fund may invest in companies of any size throughout the world. It normally invests in the securities of issuers that are economically tied to one or more foreign countries, and expects to be invested in various issuers or securities that together have ties to at least four different foreign countries. Some issuers or securities in the Fund’s portfolio may be based in or economically tied to the United States. The Fund may hold an unlimited number of common stocks.
| TOTAL ANNUAL OPERATING EXPENSES* | 1.50% | NET ASSETS | | NET ASSET VALUE PER SHARE | $12.07 |
| | |
GROWTH OF $10,000(1)(2) | PERFORMANCE COMPARISON |
| | |
| |
| | |
SECTOR ALLOCATION(2) | TOP FIVE HOLDINGS |
| | | |
| | |
ANHEUSER-BUSCH INBEV N.V. | |
TELEFONICA, SA | |
| |
| |
| | | |
| * | The Total Annual Operating Expenses are reflective of the information disclosed in the Funds’ Prospectus dated February 1, 2010 and may differ from the expense ratio disclosed in this report. |
The performance data quoted here represent past performance, and past performance is not a guarantee of future results. Investment return and principal value of an investment will fluctuate so that an investor’s shares, when redeemed, may be worth more or less than their original cost. Current performance may be lower or higher than the performance information quoted. To obtain performance information current to the most recent month-end, please call 888-860-8686 or visit www.marsicofunds.com. A redemption fee may be imposed on redemptions or exchanges of Fund shares held for 30 days or less.
The performance included in the chart and graph does not reflect the deduction of taxes on Fund distributions or the redemption of Fund shares.
All indices are unmanaged and investors cannot invest directly in an index.
| (1) | The performance returns for the International Opportunities Fund (for the period prior to September 30, 2004) reflect a fee waiver in effect; in the absence of such a waiver, the returns would be reduced. For the period beginning October 2004 through December 2005, performance returns for the International Opportunities Fund would be higher but for the reimbursement of fees waived previously. |
| (2) | This chart assumes an initial investment of $10,000 made on June 30, 2000 (inception). Total returns are based on net change in NAV, assuming reinvestment of distributions. |
| (3) | Sector weightings represent the percentage of the Fund’s investments (excluding cash equivalents) in certain general sectors. These sectors may include more than one industry. The Fund’s portfolio composition is subject to change at any time. |
The Morgan Stanley Capital International (MSCI) EAFE Index tracks the stocks of about 1,000 companies in Europe, Australasia, and the Far East (EAFE).
MARSICO INTERNATIONAL OPPORTUNITIES FUND SCHEDULE OF INVESTMENTS
March 31, 2010 (Unaudited)
| | | Number | | | | | | Percent | |
| | | of | | | | | | of Net | |
| | | Shares | | | Value | | | Assets | |
| COMMON STOCKS | | | | | | | | | |
| | | | | | | | | | |
| Advertising | | | | | | | | | |
| Publicis Groupe S.A. | | | 109,573 | | | $ | 4,688,476 | | | | 1.08 | % |
| | | | | | | | | | | | | |
| Aerospace & Defense | | | | | | | | | | | | |
| Rolls-Royce Group PLC* | | | 242,163 | | | | 2,188,356 | | | | 0.50 | |
| | | | | | | | | | | | | |
| Apparel Retail | | | | | | | | | | | | |
| Industria de Diseno Textile S.A. (Inditex) | | | 163,106 | | | | 10,751,702 | | | | 2.47 | |
| | | | | | | | | |
| Apparel, Accessories & Luxury Goods | | | | | | | | |
| Adidas A.G. | | | 82,863 | | | | 4,431,990 | | | | 1.02 | |
| Swatch Group AG | | | 10,085 | | | | 3,215,646 | | | | 0.74 | |
| | | | | | | | 7,647,636 | | | | 1.76 | |
| Application Software | | | | | | | | | | | | |
| Autonomy Corporation PLC* | | | 197,768 | | | | 5,471,056 | | | | 1.26 | |
| Longtop Financial Technologies Ltd. ADR* | 73,778 | | | | 2,376,389 | | | | 0.54 | |
| | | | | | | | 7,847,445 | | | | 1.80 | |
| Asset Management & Custody Banks | | | | | | | | |
| Julius Baer Group Ltd. | | | 125,064 | | | | 4,536,891 | | | | 1.04 | |
| | | | | | | | | | |
| Automobile Manufacturers | | | | | | | | | |
| Daimler A.G. | | | 123,070 | | | | 5,793,757 | | | | 1.33 | |
| Honda Motor Co., Ltd. | | | 178,900 | | | | 6,314,793 | | | | 1.45 | |
| | | | | | | | 12,108,550 | | | | 2.78 | |
| Biotechnology | | | | | | | | | | | | |
| CSL Ltd. | | | 137,467 | | | | 4,595,521 | | | | 1.06 | |
| | | | | | | | | | | | | |
| Brewers | | | | | | | | | | | | |
| Anheuser-Busch InBev N.V. | | | 261,686 | | | | 13,181,781 | | | | 3.03 | |
| Heineken N.V. | | | 127,728 | | | | 6,564,229 | | | | 1.51 | |
| | | | | | | | 19,746,010 | | | | 4.54 | |
| Building Products | | | | | | | | | | | | |
| Daikin Industries, Ltd. | | | 57,073 | | | | 2,335,054 | | | | 0.54 | |
| | | | | | | | | | |
| Communications Equipment | | | | | | | | | |
| Research In Motion Ltd.* | | | 148,492 | | | | 10,980,983 | | | | 2.53 | |
| | | | | | | | | | | | | |
| Consumer Electronics | | | | | | | | | | | | |
| Panasonic Corporation | | | 322,200 | | | | 4,928,292 | | | | 1.13 | |
| | | | | | | | | | | | | |
| Distillers & Vintners | | | | | | | | | | | | |
| Pernod-Ricard S.A. | | | 75,934 | | | | 6,447,966 | | | | 1.48 | |
| | | | | | | | | | | | | |
| Distributors | | | | | | | | | | | | |
| Li & Fung Ltd. | | | 1,202,000 | | | | 5,906,082 | | | | 1.36 | |
| | | | | | | | | | | | | |
| Diversified Banks | | | | | | | | | | | | |
| Banco Bilbao Vizcaya Argentaria S.A. | | | 541,561 | | | | 7,409,686 | | | | 1.70 | |
| BNP Paribas | | | 70,217 | | | | 5,392,524 | | | | 1.24 | |
| HSBC Holdings PLC | | | 996,654 | | | | 10,102,975 | | | | 2.32 | |
| ICICI Bank Ltd. Spon. ADR | | | 155,228 | | | | 6,628,236 | | | | 1.53 | |
| Mizuho Financial Group, Inc. | | | 2,086,300 | | | | 4,128,415 | | | | 0.95 | |
| Standard Chartered PLC | | | 169,978 | | | | 4,636,498 | | | | 1.07 | |
| The Toronto-Dominion Bank | | | 61,805 | | | | 4,606,546 | | | | 1.06 | |
| | | | | | | | 42,904,880 | | | | 9.87 | |
| Diversified Capital Markets | | | | | | | | | |
| Credit Suisse Group AG | | | 213,967 | | | | 11,029,122 | | | | 2.54 | |
| Diversified Chemicals | | | | | | | | | |
| Akzo Nobel N.V. | | | 80,708 | | | | 4,599,605 | | | | 1.06 | |
| BASF S.E. | | | 213,897 | | | | 13,266,292 | | | | 3.05 | |
| | | | | | | | 17,865,897 | | | | 4.11 | |
| Diversified Metals & Mining | | | | | | | | | |
| Teck Resources Ltd. – Cl. B* | | | 52,322 | | | | 2,279,573 | | | | 0.52 | |
| Vale SA Spon. ADR | | | 215,500 | | | | 6,936,945 | | | | 1.60 | |
| | | | | | | | 9,216,518 | | | | 2.12 | |
| Diversified Real Estate Activities | | | | | | | | | |
| CapitaLand Ltd. | | | 2,552,000 | | | | 7,242,174 | | | | 1.67 | |
| Hang Lung Properties Ltd. | | | 627,000 | | | | 2,523,586 | | | | 0.58 | |
| | | | | | | | 9,765,760 | | | | 2.25 | |
| Electrical Components & Equipment | | | | | | | | | |
| Schneider Electric S.A. | | | 73,869 | | | | 8,664,131 | | | | 1.99 | |
| | | | | | | | | | |
| Electronic Manufacturing Services | | | | | | | | | |
| Hon Hai Precision Industry Co., Ltd. | | | 1,494,982 | | | | 6,472,701 | | | | 1.49 | |
| | | | | | | | | | |
| Fertilizers & Agricultural Chemicals | | | | | | | | | |
| Syngenta A.G. | | | 33,481 | | | | 9,297,455 | | | | 2.14 | |
| | | | | | | | | | | | | |
| Food Retail | | | | | | | | | | | | |
| China Resources Enterprise Ltd. | | | 630,000 | | | | 2,328,751 | | | | 0.53 | |
| FamilyMart Co., Ltd. | | | 139,600 | | | | 4,442,293 | | | | 1.02 | |
| Tesco PLC | | | 648,848 | | | | 4,287,555 | | | | 0.99 | |
| | | | | | | | 11,058,599 | | | | 2.54 | |
| Health Care Equipment | | | | | | | | | | | | |
| Covidien PLC | | | 135,700 | | | | 6,822,996 | | | | 1.57 | |
| | | | | | | | | | |
| Heavy Electrical Equipment | | | | | | | | | |
| ABB Ltd.* | | | 219,032 | | | | 4,784,054 | | | | 1.10 | |
| ALSTOM S.A. | | | 100,849 | | | | 6,288,897 | | | | 1.45 | |
| | | | | | | | 11,072,951 | | | | 2.55 | |
| Home Entertainment Software | | | | | | | | | |
| Nintendo Co., Ltd. | | | 18,500 | | | | 6,193,711 | | | | 1.42 | |
| | | | | | | | | | | | | |
| Homebuilding | | | | | | | | | | | | |
| Cyrela Brazil Realty S.A. | | | 413,900 | | | | 4,901,585 | | | | 1.13 | |
| Gafisa S.A. | | | 766,462 | | | | 5,296,943 | | | | 1.22 | |
| PDG Realty S.A. | | | | | | | | | | | | |
| Empreendimentos e Participações | | | 508,700 | | | | 4,236,425 | | | | 0.97 | |
| | | | | | | | 14,434,953 | | | | 3.32 | |
| Hotels, Resorts & Cruise Lines | | | | | | | | | |
| Accor S.A. | | | 94,508 | | | | 5,228,432 | | | | 1.20 | |
| Ctrip.com International, Ltd. ADR* | | | 49,400 | | | | 1,936,480 | | | | 0.45 | |
| | | | | | | | 7,164,912 | | | | 1.65 | |
| Household Products | | | | | | | | | | | | |
| Reckitt Benckiser Group PLC | | | 80,650 | | | | 4,426,712 | | | | 1.02 | |
| | | | | | | | | | |
| Hypermarkets & Super Centers | | | | | | | | | |
| Metro AG | | | 121,923 | | | | 7,232,542 | | | | 1.66 | |
| | | | | | |
| Integrated Telecommunication Services | | | | | |
| Telefonica, SA | | | 550,928 | | | | 13,051,710 | | | | 3.00 | |
See notes to financial statements.
| | | Number | | | | | | Percent | |
| | | of | | | | | | of Net | |
| | | Shares | | | Value | | | Assets | |
COMMON STOCKS (continued) | | | | | | | | | |
| | | | | | | | |
| Investment Banking & Brokerage | | | | | | | |
| Daiwa Securities Group, Inc. | | | 824,000 | | | $ | 4,336,378 | | | | 1.00 | % |
| | | | | | | | | | |
| Life Sciences Tools & Services | | | | | | | | | |
| Lonza Group AG | | | 51,923 | | | | 4,234,994 | | | | 0.97 | |
| | | | | | | | | | | | | |
| Office Electronics | | | | | | | | | | | | |
| Canon, Inc. | | | 191,500 | | | | 8,869,344 | | | | 2.04 | |
| | | | | | | | | | | | | |
| Oil & Gas Drilling | | | | | | | | | | | | |
| Transocean Ltd.* | | | 101,213 | | | | 8,742,779 | | | | 2.01 | |
| | | | | | | | | | |
| Oil & Gas Exploration & Production | | | | | | | | | |
| CNOOC Ltd. | | | 2,630,800 | | | | 4,316,759 | | | | 0.99 | |
| OGX Petróleo e Gás | | | | | | | | | | | | |
| Participações S.A. | | | 731,900 | | | | 6,852,495 | | | | 1.58 | |
| | | | | | | | 11,169,254 | | | | 2.57 | |
| Oil & Gas Refining & Marketing | | | | | | | | | |
| Reliance Industries Ltd. | | | | | | | | | | | | |
| Spon. GDR, 144A | | | 97,000 | | | | 4,675,400 | | | | 1.08 | |
| | | | | | | | | | | | | |
| Packaged Foods & Meats | | | | | | | | | | | | |
| Nestlé S.A. | | | 126,980 | | | | 6,503,149 | | | | 1.50 | |
| | | | | | | | | | | | | |
| Pharmaceuticals | | | | | | | | | | | | |
| Novartis AG | | | 161,609 | | | | 8,728,787 | | | | 2.01 | |
| Novo Nordisk A/S - Cl. B | | | 108,646 | | | | 8,430,620 | | | | 1.94 | |
| Teva Pharmaceutical | | | | | | | | | | | | |
| Industries Ltd. Spon. ADR | | | 170,832 | | | | 10,776,083 | | | | 2.48 | |
| | | | | | | | 27,935,490 | | | | 6.43 | |
| Railroads | | | | | | | | | | | | |
| Canadian National Railway Company | | | 104,400 | | | | 6,325,596 | | | | 1.45 | |
| | | | | | | | | | | | | |
| Restaurants | | | | | | | | | | | | |
| Compass Group PLC | | | 699,484 | | | | 5,583,313 | | | | 1.28 | |
| | | | | | | | | | |
| Semiconductor Equipment | | | | | | | | | |
| SUMCO CORPORATION* | | | 126,100 | | | | 2,681,429 | | | | 0.62 | |
| | | | | | | | | | | | | |
| Semiconductors | | | | | | | | | | | | |
| Infineon Technologies AG* | | | 640,819 | | | | 4,447,920 | | | | 1.02 | |
| | | | | | | | | | | | | |
| Specialty Chemicals | | | | | | | | | | | | |
| Novozymes A/S - Cl. B | | | 24,235 | | | | 2,682,127 | | | | 0.62 | |
| | | | | | | | | | | | | |
| Steel | | | | | | | | | | | | |
| ThyssenKrupp AG | | | 128,404 | | | | 4,414,633 | | | | 1.02 | |
| | | | | | | | | | |
| Trading Companies & Distributors | | | | | | | | | |
| Marubeni Corporation | | | 1,413,000 | | | | 8,781,185 | | | | 2.02 | |
| Noble Group Ltd. | | | 983,000 | | | | 2,150,170 | | | | 0.49 | |
| | | | | | | | 10,931,355 | | | | 2.51 | |
| TOTAL COMMON STOCKS | | | | | | | | | | | | |
| (Cost $343,651,953) | | | | | | | 414,917,675 | | | | 95.43 | |
| PREFERRED STOCKS | | | | | | | | | |
| | | | | | | | | | |
| Cable & Satellite | | | | | | | | | |
| Net Servicos de Comunicacao S.A. | | | 166,800 | | | | 2,185,419 | | | | 0.50 | |
| | | | | | | | | | | | | |
| Health Care Equipment | | | | | | | | | | | | |
| Fresenius S.E. | | | 29,718 | | | | 2,243,750 | | | | 0.52 | |
| | | | | | | | | | |
| TOTAL PREFERRED STOCKS | | | | | | | | | |
| (Cost $4,344,458) | | | | | | | 4,429,169 | | | | 1.02 | |
| | | | | | | | | | |
| SHORT-TERM INVESTMENTS | | | | | | | | | |
| SSgA U.S. Government | | | | | | | | | | | | |
| Money Market Fund, 0.000% | | | 15,586,577 | | | | 15,586,577 | | | | 3.58 | |
| | | | | | | | | | |
| TOTAL SHORT-TERM INVESTMENTS | | | | | | | | | |
| (Cost $15,586,577) | | | | | | | 15,586,577 | | | | 3.58 | |
| | | | | | | | | | | | | |
| TOTAL INVESTMENTS | | | | | | | | | | | | |
| (Cost $363,582,988) | | | | | | | 434,933,421 | | | | 100.03 | |
| | | | | | | | | | | | | |
| Liabilities, Less Cash and Other Assets | | | | | | | (127,050 | ) | | | (0.03 | ) |
| | | | | | | | | | | | | |
| NET ASSETS | | | | | | $ | 434,806,371 | | | | 100.00 | % |
SUMMARY OF INVESTMENTS BY COUNTRY
| | | | | | Percent of | |
| | | | | | Investment | |
| Country | | Market Value | | | Securities | |
| Australia | | $ | 4,595,521 | | | | 1.06 | % |
| Belgium | | | 13,181,781 | | | | 3.03 | |
| Brazil | | | 30,409,812 | | | | 6.99 | |
| Canada | | | 24,192,698 | | | | 5.56 | |
| China | | | 4,312,869 | | | | 0.99 | |
| Denmark | | | 11,112,747 | | | | 2.55 | |
| France | | | 36,710,426 | | | | 8.44 | |
| Germany | | | 41,830,884 | | | | 9.62 | |
| Hong Kong | | | 17,225,348 | | | | 3.96 | |
| India | | | 11,303,636 | | | | 2.60 | |
| Ireland | | | 6,822,996 | | | | 1.57 | |
| Israel | | | 10,776,083 | | | | 2.48 | |
| Japan | | | 53,010,894 | | | | 12.19 | |
| Netherlands | | | 11,163,834 | | | | 2.57 | |
| Singapore | | | 7,242,174 | | | | 1.66 | |
| Spain | | | 31,213,098 | | | | 7.18 | |
| Switzerland | | | 52,330,098 | | | | 12.03 | |
| Taiwan | | | 6,472,701 | | | | 1.49 | |
| United Kingdom | | | 36,696,465 | | | | 8.44 | |
United States(1) | | | 24,329,356 | | | | 5.59 | |
| | | $ | 434,933,421 | | | | 100.00 | % |
(1) Includes short-term securities.
See notes to financial statements.
INVESTMENT REVIEW BY DOUG RAO (UNAUDITED)
The Marsico Flexible Capital Fund posted a total return of +15.24% for the six-month fiscal period ended March 31, 2010. That result substantially outpaced the S&P 500 Index, which we consider to be the Fund’s primary benchmark index and which had a total return of +11.75%. Please see the Fund Overview for more detailed information about the Fund’s performance for various time periods ended March 31, 2010.
The performance data for the Fund quoted here represent past performance, and past performance is not a guarantee of future results. Investment return and principal value of an investment will fluctuate so that an investor’s shares, when redeemed, may be worth more or less than their original cost. Current performance may be lower or higher than the performance information quoted. To obtain performance information current to the most recent month-end, please call 888-860-8686 or visit www.marsicofunds.com.(1)
This review highlights Fund performance over a six-month fiscal period. Shareholders should keep in mind that the Fund is intended for long-term investors who hold their shares for substantially longer periods of time. You should also keep in mind that our views on all investments discussed in this report are subject to change at any time. References to specific securities, industries, and sectors discussed in this report are not recommendations to buy or sell such securities or related investments, and the Fund may not necessarily hold these securities or investments today. Please see the accompanying Schedule of Investments for the percentage of the Fund’s portfolio represented by the securities mentioned in this report as of the end of the reporting period.
The Fund’s performance during the six-month period ended March 31, 2010 benefitted primarily from strong stock selection in the Information Technology and Financials sectors.
The Fund’s Information Technology holdings posted a collective return of +30%, while the S&P 500 Index Information Technology sector returned +13%. Two of the Fund’s China-based software and services holdings had a material, positive impact on the Fund’s performance. Kingdee International Software Group Company Ltd. soared nearly +130% and Baidu, Inc. Spon. ADR gained +58%. Other strong-performing positions included internet marketing and sales company GSI Commerce, Inc. (+28%) and online restaurant reservation service provider OpenTable, Inc. (+52%).
Financials positions were led by JPMorgan Chase & Co. warrants and a position in Citigroup, Inc. Tangible Dividend Enhanced Common Stock (T-DECS), a hybrid security with both equity and fixed income characteristics. Other strong-performing positions included regional bank CVB Financial Corp. (+35%) and credit card company American Express Company (+23% prior to being sold from the Fund).
Additional areas of strength for the Fund included stock selection in the Telecommunication Services and Materials sectors.
There were a few areas of weakness for the Fund during the reporting period. Many of the Fund’s Energy positions struggled. Hardy Oil & Gas PLC skidded -58% prior to being sold and was a material detractor from performance. Certain Consumer Discretionary holdings disappointed. China-based jewelry manufacturer Fuqi International, Inc. and media holding New York Times Company – Cl. A each posted double-digit negative returns prior to being sold from the Fund.
A further area of weakness in terms of the Fund’s performance was its sector allocations. The Fund’s sector weightings are primarily a residual of the stock selection process. Such weightings, however, may sometimes have a material impact on the Fund’s performance. While the Fund’s stock selection within the Financials sector was strong, its performance was hampered by having an overweighted allocation to the sector, as Financials was a weak-performing sector of the benchmark index. The Fund also was hurt by having a limited number of investments in the Industrials sector, which was one of the best-performing sectors of the benchmark index.
The Flexible Capital Fund has tended to have a relatively high portfolio turnover level. This is attributable in part to the Fund’s investment style and its relatively small base of assets under management. Although the Fund may hold core positions for some time, it may change its portfolio composition quickly to take advantage of new opportunities, or to address issues affecting particular holdings.
Fiscal Period-End Investment Posture
As of March 31, 2010, the Fund’s primary economic sector allocations included Financials, Information Technology, Consumer Discretionary, and Health Care. At period-end, the Fund had no significant exposure to the Utilities sector.
On a final note, the Trustees of the Fund recently approved changes in the Fund’s investment policies allowing the Fund to invest up to 40% of total Fund assets in fixed income and variable income securities (an increase from 25%), of which up to 25% may be invested in high-yield securities (previously limited to 10%). We think these changes will enhance the ability of the Fund to take advantage of potentially attractive investment opportunities that are consistent with the overall investment objectives of the Fund. The changes will become effective June 15, 2010.
Sincerely,
A. DOUGLAS RAO
PORTFOLIO MANAGER
| (1) | Total returns are based on net change in net asset value assuming reinvestment of distributions. The performance returns for the Flexible Capital Fund reflect a fee waiver in effect; in the absence of such a waiver, the returns would have been reduced. A redemption fee of 2% may be imposed on redemptions or exchanges of Fund shares owned for 30 days or less. Please see the Prospectus for more information. |
| FLEXIBLE CAPITAL FUND OVERVIEW |
March 31, 2010 (Unaudited)
The Flexible Capital Fund invests primarily in equity securities and other investments that are selected primarily for their long-term growth potential. The Fund may invest in issuers of any size throughout the world, and will normally hold a core position of between 20 and 50 securities or other investments.
| TOTAL ANNUAL OPERATING EXPENSES* | 2.86% | | | | |
NET EXPENSES*† | 0.77% | NET ASSETS | | NET ASSET VALUE PER SHARE | $10.72 |
| | |
GROWTH OF $10,000(1)(2) | PERFORMANCE COMPARISON |
| | |
| |
| | |
SECTOR ALLOCATION(2) | TOP FIVE HOLDINGS |
| | | |
| THE HARTFORD FINANCIAL SERVICES GROUP, INC. 7.250% | |
COUNTRYWIDE CAPITAL V, CAPITAL SECURITIES, 7.000% | |
MASTERCARD, INC. - CL. A | |
SCHWAB CAPITAL TRUST I, TRUST PREFERRED SECURITY 7.500%, 11/15/37 | |
| |
| | | |
| * | The Total Annual Operating Expenses and Net Expenses are reflective of the information disclosed in the Funds’ Prospectus dated February 1, 2010 and may differ from the expense ratios disclosed in this report. |
| † | The Adviser has entered into a written expense limitation agreement under which it has agreed to limit the total expenses of the Fund (excluding interest, taxes, acquired fund fees and expenses, litigation, brokerage and extraordinary expenses) to an annual rate of 0.75% of the Flexible Capital Fund’s average net assets until January 31, 2011. This fee waiver may be terminated at any time after January 31, 2011. The Adviser may recoup any waived amount from the Fund pursuant to this arrangement if such reimbursement does not cause the Fund to exceed existing expense limitations and the reimbursement is made within three years after the year in which the Adviser incurred the expense. |
The performance data quoted here represent past performance, and past performance is not a guarantee of future results. Investment return and principal value of an investment will fluctuate so that an investor’s shares, when redeemed, may be worth more or less than their original cost. Current performance may be lower or higher than the performance information quoted. To obtain performance information current to the most recent month-end, please call 888-860-8686 or visit www.marsicofunds.com. A redemption fee may be imposed on redemptions or exchanges of Fund shares owned for 30 days or less.
The performance included in the chart and graph does not reflect the deduction of taxes on Fund distributions or the redemption of Fund shares.
All indices are unmanaged and investors cannot invest directly in an index.
| (1) | The performance returns for the Flexible Capital Fund reflect a fee waiver in effect; in the absence of such a waiver, the returns would be reduced. |
| (2) | This chart assumes an initial investment of $10,000 made on December 29, 2006 (inception). Total returns are based on change in NAV, assuming reinvestment of distributions. |
| (3) | Sector weightings represent the percentage of the Fund’s investments (excluding cash equivalents) in certain general sectors. These sectors may include more than one industry. The Fund’s portfolio composition is subject to change at any time. |
MARSICO FLEXIBLE CAPITAL FUND
SCHEDULE OF INVESTMENTS
March 31, 2010 (Unaudited)
| | | Number | | | | | | Percent | |
| | | of | | | | | | of Net | |
| | | Shares | | | Value | | | Assets | |
| COMMON STOCKS | | | | | | | | | |
| | | | | | | | | | |
| Aerospace & Defense | | | | | | | | | |
| BE Aerospace, Inc.* | | | 31,777 | | | $ | 967,610 | | | | 1.90 | % |
| | | | | | | | | | |
| Apparel, Accessories & Luxury Goods | | | | | | | | | |
| lululemon athletica, inc.* | | | 12,488 | | | | 518,252 | | | | 1.02 | |
| | | | | | | | | | | | | |
| Application Software | | | | | | | | | | | | |
| Kingdee International | | | | | | | | | | | | |
| Software Group Company Ltd. | | | 756,000 | | | | 293,082 | | | | 0.57 | |
| Nuance Communications, Inc.* | | | 44,713 | | | | 744,024 | | | | 1.46 | |
| | | | | | | | 1,037,106 | | | | 2.03 | |
| Broadcasting | | | | | | | | | | | | |
| Discovery Communications, Inc. - Cl. A* | | | 33,194 | | | | 1,121,625 | | | | 2.20 | |
| | | | | | | | | | | | | |
| Cable & Satellite | | | | | | | | | | | | |
| The DIRECTV Group, Inc.* | | | 21,072 | | | | 712,444 | | | | 1.40 | |
| | | | | | | | | | | | | |
| Computer Hardware | | | | | | | | | | | | |
| Apple, Inc.* | | | 3,999 | | | | 939,485 | | | | 1.84 | |
| | | | | | | | | | |
| Computer Storage & Peripherals | | | | | | | | | |
| Compellent Technologies, Inc.* | | | 39,092 | | | | 686,065 | | | | 1.34 | |
| | | | | | | | | | | | | |
| Construction Materials | | | | | | | | | | | | |
| Holcim Ltd.* | | | 12,383 | | | | 923,088 | | | | 1.81 | |
| | | | | | | | | | | | | |
| Consumer Finance | | | | | | | | | | | | |
| Capital One Financial Corporation | | | 29,736 | | | | 1,231,368 | | | | 2.41 | |
| | | | | | |
| Data Processing & Outsourced Services | | | | | |
| MasterCard, Inc. - Cl. A | | | 5,976 | | | | 1,517,904 | | | | 2.97 | |
| | | | | | | | | | | | | |
| Department Stores | | | | | | | | | | | | |
| Nordstrom, Inc. | | | 10,399 | | | | 424,799 | | | | 0.83 | |
| | | | | | | | | | | | | |
| Diversified Banks | | | | | | | | | | | | |
| U.S. Bancorp | | | 29,059 | | | | 752,047 | | | | 1.47 | |
| Wells Fargo & Company | | | 44,813 | | | | 1,394,580 | | | | 2.73 | |
| | | | | | | | 2,146,627 | | | | 4.20 | |
| Diversified Chemicals | | | | | | | | | | | | |
| PPG Industries, Inc. | | | 12,942 | | | | 846,407 | | | | 1.66 | |
| | | | | | | | | | |
| Diversified Real Estate Activities | | | | | | | | | |
| Hang Lung Properties Ltd. | | | 165,000 | | | | 664,101 | | | | 1.30 | |
| | | | | | | | | | | | | |
| Education Services | | | | | | | | | | | | |
| Anhanguera Educacional | | | | | | | | | | | | |
| Participacoes S.A.* | | | 66,900 | | | | 970,198 | | | | 1.90 | |
| | | | | | | | | | |
| Electrical Components & Equipment | | | | | | | | | |
| Sensata Technologies Holding N.V.* | | | 49,200 | | | | 883,632 | | | | 1.73 | |
| | | | | | | | | | | | | |
| Electronic Components | | | | | | | | | | | | |
| Byd Company Ltd. - Cl. H* | | | 13,000 | | | | 129,427 | | | | 0.25 | |
| | | | | | | | | | |
| Electronic Equipment & Instruments | | | | | | | | | |
| Hollysys Automation Technologies Ltd.* | | | 59,979 | | | | 690,358 | | | | 1.35 | |
| | | | | | | | | | | | | |
| Health Care Equipment | | | | | | | | | | | | |
| Baxter International, Inc. | | | 10,691 | | | | 622,216 | | | | 1.22 | |
| Internet Retail | | | | | | | | | |
| priceline.com, Inc.* | | | 2,521 | | | | 642,855 | | | | 1.26 | |
| | | | | | | | | | |
| Internet Software & Services | | | | | | | | | |
| Baidu, Inc. Spon. ADR* | | | 1,893 | | | | 1,130,121 | | | | 2.21 | |
| eBay, Inc.* | | | 17,417 | | | | 469,388 | | | | 0.92 | |
| GSI Commerce, Inc.* | | | 42,171 | | | | 1,166,871 | | | | 2.29 | |
| OpenTable, Inc.* | | | 11,482 | | | | 437,809 | | | | 0.86 | |
| | | | | | | | 3,204,189 | | | | 6.28 | |
| Investment Banking & Brokerage | | | | | | | | | |
| The Goldman Sachs Group, Inc. | | | 6,463 | | | | 1,102,782 | | | | 2.16 | |
| | | | | | | | | | | | | |
| Life & Health Insurance | | | | | | | | | | | | |
| Primerica, Inc.* | | | 75,000 | | | | 1,125,000 | | | | 2.20 | |
| | | | | | | | | | | | | |
| Managed Health Care | | | | | | | | | | | | |
| Odontoprev S.A. | | | 41,600 | | | | 1,444,485 | | | | 2.83 | |
| | | | | | | | | | | | | |
| Office REITs | | | | | | | | | | | | |
| Ascendas India Trust | | | 1,894,000 | | | | 1,313,256 | | | | 2.57 | |
| | | | | | | | | | |
| Oil & Gas Equipment & Services | | | | | | | | | |
| Baker Hughes, Inc. | | | 11,120 | | | | 520,861 | | | | 1.02 | |
| National Oilwell Varco, Inc. | | | 11,257 | | | | 456,809 | | | | 0.90 | |
| | | | | | | | 977,670 | | | | 1.92 | |
| Oil & Gas Exploration & Production | | | | | | | | | |
| OGX Petróleo e Gás Participações S.A. | | | 128,300 | | | | 1,201,223 | | | | 2.35 | |
| Range Resources Corporation | | | 13,106 | | | | 614,278 | | | | 1.21 | |
| | | | | | | | 1,815,501 | | | | 3.56 | |
| Packaged Foods & Meats | | | | | | | | | | | | |
| Mead Johnson Nutrition Company | | | 21,591 | | | | 1,123,380 | | | | 2.20 | |
| | | | | | | | | | | | | |
| Pharmaceuticals | | | | | | | | | | | | |
| Abbott Laboratories | | | 16,696 | | | | 879,545 | | | | 1.72 | |
| Johnson & Johnson | | | 10,620 | | | | 692,424 | | | | 1.36 | |
| | | | | | | | 1,571,969 | | | | 3.08 | |
| Real Estate Operating Companies | | | | | | | | | |
| BR Malls Participacoes S.A.* | | | 89,600 | | | | 1,058,059 | | | | 2.07 | |
| | | | | | | | | | | | | |
| Regional Banks | | | | | | | | | | | | |
| CVB Financial Corp. | | | 40,211 | | | | 399,295 | | | | 0.78 | |
| Glacier Bancorp, Inc. | | | 56,015 | | | | 853,109 | | | | 1.67 | |
| | | | | | | | 1,252,404 | | | | 2.45 | |
| Restaurants | | | | | | | | | | | | |
| Morton’s Restaurant Group, Inc.* | | | 40,334 | | | | 246,441 | | | | 0.48 | |
| The Cheesecake Factory, Inc.* | | | 36,198 | | | | 979,518 | | | | 1.92 | |
| | | | | | | | 1,225,959 | | | | 2.40 | |
| Semiconductor Equipment | | | | | | | | | |
| MEMC Electronic Materials, Inc.* | | | 24,800 | | | | 380,184 | | | | 0.74 | |
| | | | | | | | | | | | | |
| Specialty Chemicals | | | | | | | | | | | | |
| Novozymes A/S - Cl. B | | | 7,169 | | | | 793,405 | | | | 1.55 | |
| | | | | | | | | | |
| Thrifts & Mortgage Finance | | | | | | | | | |
| TFS Financial Corporation | | | 83,019 | | | | 1,108,304 | | | | 2.17 | |
See notes to financial statements.
MARSICO FLEXIBLE CAPITAL FUND
SCHEDULE OF INVESTMENTS (continued)
March 31, 2010 (Unaudited)
| | | Number | | | | | | Percent | |
| | | of Shares/ | | | | | | of Net | |
| | | Par Value | | | Value | | | Assets | |
COMMON STOCKS (continued) | | | | | | | | | |
| | | | | |
| Wireless Telecommunication Services | | | | |
| Crown Castle International Corp.* | | | 20,146 | | | $ | 770,182 | | | | 1.51 | % |
| | | | | | | | | | | | | |
| TOTAL COMMON STOCKS | | | | | | | | | | | | |
| (Cost $32,410,189) | | | | | | | 37,942,296 | | | | 74.31 | |
| | | | | | | | | | | | | |
| CONVERTIBLE PREFERRED STOCKS | | | | | | | | | |
| | | | | | | | | | | | | |
| Other Diversified Financial Services | | | | | | | | | |
| Citigroup, Inc. Tangible Dividend | | | | | | | | | | | | |
| Enhanced Common Stock, | | | | | | | | | | | | |
| 7.500%, 12/15/12 | | | 4,868 | | | | 593,312 | | | | 1.16 | |
| | | | | | |
| TOTAL CONVERTIBLE PREFERRED STOCKS | | | | | |
| (Cost $487,888) | | | | | | | 593,312 | | | | 1.16 | |
| | | | | | | | | | | | | |
| CORPORATE BONDS | | | | | | | | | | | | |
| | | | | | | | | | | | | |
| Investment Banking & Brokerage | | | | | | | | | |
| Schwab Capital Trust I, | | | | | | | | | | | | |
| Trust Preferred Security | | | | | | | | | | | | |
| 7.500%, 11/15/37 | | | 1,490,000 | | | | 1,483,027 | | | | 2.90 | |
| | | | | | | | | | | | | |
| Regional Banks | | | | | | | | | | | | |
| City National Capital Trust I, | | | | | | | | | | | | |
| Trust Preferred Security | | | | | | | | | | | | |
| 9.625%, 02/01/40 | | | 696,000 | | | | 773,277 | | | | 1.51 | |
| | | | | | |
| Wireless Telecommunication Services | | | | | |
| Crown Castle International Corp., | | | | | | | | | | | | |
| 9.000%, 01/15/15 | | | 630,000 | | | | 681,975 | | | | 1.34 | |
| | | | | | | | | | | | | |
| TOTAL CORPORATE BONDS | | | | | | | | | |
| (Cost $2,690,306) | | | | | | | 2,938,279 | | | | 5.75 | |
| | | | | | | | | | | | | |
| PREFERRED STOCKS | | | | | | | | | | | | |
| | | | | | | | | | | | | |
| Multi-Line Insurance | | | | | | | | | | | | |
| The Hartford Financial Services | | | | | | | | | | | | |
| Group, Inc., 7.250% | | | 76,183 | | | | 2,015,802 | | | | 3.95 | |
| | | | | | | | | | | | | |
| Other Diversified Financial Services | | | | | | | | | |
| Countrywide Capital V, | | | | | | | | | | | | |
| Capital Securities, 7.000% | | | 79,025 | | | | 1,774,111 | | | | 3.47 | |
| | | | | | | | | | | | | |
| TOTAL PREFERRED STOCKS | | | | | | | | | |
| (Cost $3,192,833) | | | | | | | 3,789,913 | | | | 7.42 | |
| | | | | | | | | | | | | |
| WARRANTS | | | | | | | | | | | | |
| | | | | | | | | | | | | |
| Other Diversified Financial Services | | | | | | | | | |
| JPMorgan Chase & Co., | | | | | | | | | | | | |
| Strike Price: $42.42, | | | | | | | | | | | | |
| Expiration Date: October 28, 2018* | | | 61,411 | | | | 943,887 | | | | 1.85 | |
| | | | | | | | | | | | | |
| TOTAL WARRANTS | | | | | | | | | | | | |
| (Cost $660,168) | | | | | | | 943,887 | | | | 1.85 | |
SHORT-TERM INVESTMENTS | | | | | | | | | |
| Federal Home Loan Bank | | | | | | | | | |
| Discount Note, 0.001%, 04/01/10 | | | 1,400,000 | | | | 1,400,000 | | | | 2.74 | |
| SSgA Prime | | | | | | | | | | | | |
| Money Market Fund, 0.059% | | | 2,288,777 | | | | 2,288,777 | | | | 4.49 | |
| SSgA U.S. Government | | | | | | | | | | | | |
| Money Market Fund, 0.000% | | | 2,298,765 | | | | 2,298,765 | | | | 4.50 | |
| | | | | | | | | | | | | |
| TOTAL SHORT-TERM INVESTMENTS | | | | | | | | | |
| (Cost $5,987,542) | | | | | | | 5,987,542 | | | | 11.73 | |
| | | | | | | | | | | | | |
| TOTAL INVESTMENTS | | | | | | | | | | | | |
| (Cost $45,428,926) | | | | | | | 52,195,229 | | | | 102.22 | |
| | | | | | | | | | | | | |
| Liabilities, Less Cash and Other Assets | | | | | | | (1,134,298 | ) | | | (2.22 | ) |
| | | | | | | | | | | | | |
| NET ASSETS | | | | | | $ | 51,060,931 | | | | 100.00 | % |
SUMMARY OF INVESTMENTS BY COUNTRY
| | | | | | Percent of | |
| | | | | | Investment | |
| Country | | Market Value | | | Securities | |
| Brazil | | $ | 4,673,965 | | | | 8.95 | % |
| Canada | | | 518,252 | | | | 0.99 | |
| China | | | 2,242,988 | | | | 4.30 | |
| Denmark | | | 793,405 | | | | 1.52 | |
| Hong Kong | | | 664,101 | | | | 1.27 | |
| Netherlands | | | 883,632 | | | | 1.69 | |
| Singapore | | | 1,313,256 | | | | 2.52 | |
| Switzerland | | | 923,088 | | | | 1.77 | |
United States(1) | | | 40,182,542 | | | | 76.99 | |
| | | $ | 52,195,229 | | | | 100.00 | % |
(1) Includes short-term securities.
See notes to financial statements.
INVESTMENT REVIEW BY CORY GILCHRIST, TOM MARSICO AND JIM GENDELMAN (UNAUDITED)
The Marsico Global Fund posted a total return of +10.03% for the six-month fiscal period ended March 31, 2010. The Fund’s return substantially surpassed that of the MSCI All Country World Index (“MSCI ACWI Index”), which we consider to be the Fund’s primary benchmark index and which had a total return of +7.90%. The MSCI ACWI Index measures equity market performance in the global developed and emerging markets. Please see the Fund Overview for more detailed information about the Fund’s performance for various time periods ended March 31, 2010.
The performance data for the Fund quoted here represent past performance, and past performance is not a guarantee of future results. Investment return and principal value of an investment will fluctuate so that an investor’s shares, when redeemed, may be worth more or less than their original cost. Current performance may be lower or higher than the performance information quoted. To obtain performance information current to the most recent month-end, please call 888-860-8686 or visit www.marsicofunds.com.(1)
This review highlights Fund performance over a six-month fiscal period. Shareholders should keep in mind that the Fund is intended for long-term investors who hold their shares for substantially longer periods of time. You should also keep in mind that our views on all investments discussed in this report are subject to change at any time. References to specific securities, industries, and sectors discussed in this report are not recommendations to buy or sell such securities or related investments, and the Fund may not necessarily hold these securities or investments today. Please see the accompanying Schedule of Investments for the percentage of the Fund’s portfolio represented by the securities mentioned in this report as of the end of the reporting period.
There were a number of factors that contributed to the Global Fund’s outperformance for the six-month period ended March 31, 2010 (as compared with the MSCI ACWI Index).
The most significant contributor to performance results was stock selection in the Financials sector. Many of the Fund’s banking-related positions posted strong returns. Brazil-based Itaú Unibanco Holding S.A. ADR and Industrial and Commercial Bank of China – Cl. H each posted double-digit gains prior to being sold from the Fund. The PNC Financial Services Group, Inc. soared nearly +28%, while Wells Fargo & Company posted a return of +11%. As one of the Fund’s largest individual holdings, Wells Fargo had a material, positive effect on performance results. Credit Suisse Group AG, a diversified financials company, was another leading holding with a return of +21%.
Several of the Fund’s Information Technology positions posted strong returns. Financial transaction processor MasterCard, Inc. – Cl. A (+25%), China-headquartered Internet search services company Baidu, Inc. Spon. ADR (+53%), Apple, Inc. (+27%), and technology solutions company Citrix Systems, Inc. (+21% prior to being sold) each posted sizeable gains.
Other leading individual positions included Canada-headquartered athletic apparel company lululemon athletica, inc. (+82%), medical surgical specialty systems manufacturer Intuitive Surgical, Inc. (+33%), wireless communications tower company Crown Castle International Corp. (+19%), The Walt Disney Company (+29%), and London-headquartered metals and mining company BHP Billiton PLC (+27%).
The Fund did well by emphasizing investments in the Consumer Discretionary sector, as it was among the strongest-performing sectors of the benchmark index. The Fund also benefitted from abstaining from investing in the weak-performing Utilities sector.
The main areas of weakness for the Fund’s performance over the past six months were stock selection and underweighted posture in the Industrials sector, an underweighted posture in the Materials sector, and certain Consumer Discretionary holdings.
Industrials and Materials were among the strongest-performing sectors of the MSCI ACWI index. The Fund’s performance was penalized by having an underweighted allocation to these sectors. In addition, one of the Fund’s Industrials holdings, wind energy turbine company Vestas Wind Systems A/S, was a material detractor from performance. Vestas Wind Systems declined -23% prior to being sold from the Fund.
Certain of the Fund’s Consumer Discretionary positions struggled. Preferred non-voting shares of auto manufacturer Volkswagen A.G. slid -24% and the position was sold from the Fund. Brazilian real estate related positions Gafisa S.A. ADR and Cyrela Brazil Realty S.A. declined -10% and -9%, respectively.
Other individual positions also struggled, most notably Swiss pharmaceutical manufacturer Lonza Group AG and financials companies HSBC Holdings PLC and The Goldman Sachs Group, Inc. The Fund sold its positions in Lonza and Goldman Sachs during the period.
The Global Fund has tended to have a fairly high portfolio turnover level. This is mainly attributable to the Fund’s investment style. Although the Fund may hold core positions for some time, it may change its portfolio composition quickly to take advantage of new opportunities, or to address issues affecting particular holdings.
The Fund invested in a number of initial public offerings of securities during the six-month period ended March 31, 2010. These investments did not have a significant impact on the overall return of the Fund.
Fiscal Period-End Investment Posture
As of March 31, 2010, the Fund’s primary economic sector allocations were in the following areas: Financials, Consumer Discretionary, and Information Technology. The Fund’s most significant country allocations were the US, Brazil, Switzerland, United Kingdom, and Hong Kong. The Fund held several positions domiciled in emerging markets including Brazil, China, India, and Taiwan. Such emerging markets exposure represented approximately 18% of the Fund’s net assets as of March 31, 2010.
Sincerely,
CORYDON J. GILCHRIST, CFA
THOMAS F. MARSICO
JAMES G. GENDELMAN
PORTFOLIO MANAGERS
| (1) | Total returns are based on net change in net asset value assuming reinvestment of distributions. For the period prior to December 31, 2008 and from April through May 2009, the performance returns for the Global Fund reflect a fee waiver in effect; in the absence of such a waiver, the returns would have been reduced. For the one-month period of June 2009, performance returns for the Global Fund would have been higher but for the reimbursement of fees waived previously. A redemption fee of 2% may be imposed on redemptions or exchanges of Fund shares owned for 30 days or less. Please see the Prospectus for more information. |
March 31, 2010 (Unaudited)
The Global Fund invests primarily in common stocks that are selected for their long-term growth potential. The Fund invests in the securities of companies of any size that are economically tied to any countries or markets throughout the world, including the securities of companies economically tied to emerging markets. Under normal market conditions, the Fund will invest significantly (generally, at least 40% of its net assets) in the securities of issuers organized or located outside the U.S. or doing business outside the U.S. (unless market conditions are not deemed favorable by the Adviser, in which case the Fund generally will invest at least 30% of its assets in such foreign securities). The Fund will invest its assets in various regions and countries, including the U.S., that encompass not less than three different countries overall. The Fund may hold an unlimited number of common stocks.
| TOTAL ANNUAL OPERATING EXPENSES* | 1.60% | NET ASSETS | | NET ASSET VALUE PER SHARE | $9.39 |
| | |
GROWTH OF $10,000(1)(2) | PERFORMANCE COMPARISON |
| | |
| |
| | |
SECTOR ALLOCATION(2) | TOP FIVE HOLDINGS |
| | | |
| | |
| |
INDUSTRIA DE DISENO TEXTILE S.A. (INDITEX) | |
CROWN CASTLE INTERNATIONAL CORP. | |
| |
| | | |
| * | The Total Annual Operating Expenses are reflective of the information disclosed in the Funds’ Prospectus dated February 1, 2010 and may differ from the expense ratio disclosed in this report. |
The performance data quoted here represent past performance, and past performance is not a guarantee of future results. Investment return and principal value of an investment will fluctuate so that an investor’s shares, when redeemed, may be worth more or less than their original cost. Current performance may be lower or higher than the performance information quoted. To obtain performance information current to the most recent month-end, please call 888-860-8686 or visit www.marsicofunds.com. A redemption fee may be imposed on redemptions or exchanges of Fund shares held for 30 days or less.
The performance included in the chart and graph does not reflect the deduction of taxes on Fund distributions or the redemption of Fund shares.
All indices are unmanaged and investors cannot invest directly in an index.
| (1) | The performance returns for the Global Fund (for the period prior to December 31, 2008 and from April through May 2009) reflect a fee waiver in effect; in absence of such a waiver, the returns would be reduced. For the one-month period June 2009, performance returns for the Global Fund would have been higher but for reimbursement of fees waived previously. |
| (2) | This chart assumes an initial investment of $10,000 made on June 29, 2007 (inception). Total returns are based on change in NAV, assuming reinvestment of distributions. |
| (3) | Sector weightings represent the percentage of the Fund’s equity investments in certain general sectors. These sectors may include more than one industry. The Fund’s portfolio composition is subject to change at any time. |
The MSCI ACWI (All Country World Index) Index is a free float-adjusted market capitalization index that is designed to measure equity market performance in the global developed and emerging markets.
MARSICO GLOBAL FUND
SCHEDULE OF INVESTMENTS
March 31, 2010 (Unaudited)
| | | Number | | | | | | Percent | |
| | | of | | | | | | of Net | |
| | | Shares | | | Value | | | Assets | |
| COMMON STOCKS | | | | | | | | | |
| | | | | | | | | | |
| Aerospace & Defense | | | | | | | | | |
| Precision Castparts Corp. | | | 17,948 | | | $ | 2,274,191 | | | | 1.99 | % |
| | | | | | | | | | | | | |
| Apparel Retail | | | | | | | | | | | | |
| Industria de Diseno Textile S.A. (Inditex) | | | 56,304 | | | | 3,711,475 | | | | 3.25 | |
| rue21, inc.* | | | 20,023 | | | | 694,197 | | | | 0.61 | |
| | | | | | | | 4,405,672 | | | | 3.86 | |
| Apparel, Accessories & Luxury Goods | | | | | | | | | |
| Compagnie Financière Richemont SA | | | 62,929 | | | | 2,436,828 | | | | 2.14 | |
| lululemon athletica, inc.* | | | 35,438 | | | | 1,470,677 | | | | 1.29 | |
| Polo Ralph Lauren Corporation | | | 20,731 | | | | 1,762,964 | | | | 1.54 | |
| | | | | | | | 5,670,469 | | | | 4.97 | |
| Asset Management & Custody Banks | | | | | | | | | |
| Julius Baer Group Ltd. | | | 66,732 | | | | 2,420,807 | | | | 2.12 | |
| | | | | | | | | | | | | |
| Biotechnology | | | | | | | | | | | | |
| Celgene Corporation* | | | 24,213 | | | | 1,500,237 | | | | 1.31 | |
| Gilead Sciences, Inc.* | | | 35,641 | | | | 1,620,953 | | | | 1.42 | |
| | | | | | | | 3,121,190 | | | | 2.73 | |
| Brewers | | | | | | | | | | | | |
| Anheuser-Busch InBev N.V. | | | 68,505 | | | | 3,450,769 | | | | 3.02 | |
| | | | | | | | | | |
| Communications Equipment | | | | | | | | | |
| Calix, Inc.* | | | 28,116 | | | | 378,160 | | | | 0.33 | |
| Research In Motion Ltd.* | | | 27,361 | | | | 2,023,346 | | | | 1.77 | |
| | | | | | | | 2,401,506 | | | | 2.10 | |
| Computer Hardware | | | | | | | | | | | | |
| Apple, Inc.* | | | 12,793 | | | | 3,005,459 | | | | 2.63 | |
| | | | | | | | | | |
| Computer Storage & Peripherals | | | | | | | | | |
| Compellent Technologies, Inc.* | | | 27,677 | | | | 485,731 | | | | 0.42 | |
| | | | | | | | | | |
| Construction & Engineering | | | | | | | | | |
| AECOM Technology Corporation* | | | 14,996 | | | | 425,437 | | | | 0.37 | |
| | | | | | |
| Data Processing & Outsourced Services | | | | | |
| MasterCard, Inc. - Cl. A | | | 13,622 | | | | 3,459,988 | | | | 3.03 | |
| | | | | | | | | | | | | |
| Department Stores | | | | | | | | | | | | |
| Lojas Renner S.A. | | | 47,527 | | | | 1,090,394 | | | | 0.95 | |
| | | | | | | | | | | | | |
| Distributors | | | | | | | | | | | | |
| Li & Fung Ltd. | | | 576,000 | | | | 2,830,203 | | | | 2.48 | |
| | | | | | | | | | | | | |
| Diversified Banks | | | | | | | | | | | | |
| HSBC Holdings PLC | | | 290,465 | | | | 2,944,413 | | | | 2.58 | |
| ICICI Bank Ltd. Spon. ADR | | | 34,213 | | | | 1,460,895 | | | | 1.28 | |
| Standard Chartered PLC | | | 42,050 | | | | 1,129,746 | | | | 0.99 | |
| Wells Fargo & Company | | | 214,635 | | | | 6,679,441 | | | | 5.85 | |
| | | | | | | | 12,214,495 | | | | 10.70 | |
| Diversified Capital Markets | | | | | | | | | | | | |
| Credit Suisse Group AG | | | 52,186 | | | | 2,689,974 | | | | 2.36 | |
| | | | | | | | | | |
| Diversified Metals & Mining | | | | | | | | | |
| BHP Billiton PLC | | | 102,646 | | | | 3,520,294 | | | | 3.08 | |
| | | | | | | | | | | | | |
| Diversified Real Estate Activities | | | | | | | | | | | | |
| Hang Lung Properties Ltd. | | | 529,000 | | | | 2,129,150 | | | | 1.86 | |
| | | | | | | | | | | | | |
| Diversified Support Services | | | | | | | | | | | | |
| Ritchie Bros. Auctioneers, Inc. | | | 28,835 | | | | 620,818 | | | | 0.54 | |
| | | | | | | | | | | | | |
| Electrical Components & Equipment | | | | | | | | | | | | |
| Sensata Technologies Holding N.V.* | | | 45,500 | | | | 817,180 | | | | 0.72 | |
| | | | | | | | | | | | | |
| Health Care Equipment | | | | | | | | | | | | |
| Intuitive Surgical, Inc.* | | | 10,200 | | | | 3,550,926 | | | | 3.11 | |
| | | | | | | | | | | | | |
| Heavy Electrical Equipment | | | | | | | | | | | | |
| ABB Ltd.* | | | 81,994 | | | | 1,790,897 | | | | 1.57 | |
| | | | | | | | | | | | | |
| Homebuilding | | | | | | | | | | | | |
| Cyrela Brazil Realty S.A. | | | 163,969 | | | | 1,941,793 | | | | 1.70 | |
| Gafisa S.A. | | | 169,734 | | | | 1,173,015 | | | | 1.03 | |
| Gafisa S.A. ADR | | | 152,220 | | | | 2,091,503 | | | | 1.83 | |
| PDG Realty S.A. | | | | | | | | | | | | |
| Empreendimentos e Participações | | | 121,400 | | | | 1,011,012 | | | | 0.88 | |
| | | | | | | | 6,217,323 | | | | 5.44 | |
| Hotels, Resorts & Cruise Lines | | | | | | | | | | | | |
| China Lodging Group Ltd. Spon. ADS* | | | 15,800 | | | | 236,684 | | | | 0.21 | |
| Ctrip.com International, Ltd. ADR* | | | 29,100 | | | | 1,140,720 | | | | 1.00 | |
| | | | | | | | 1,377,404 | | | | 1.21 | |
| Industrial Gases | | | | | | | | | | | | |
| Praxair, Inc. | | | 15,315 | | | | 1,271,145 | | | | 1.11 | |
| | | | | | | | | | | | | |
| Internet Retail | | | | | | | | | | | | |
| Amazon.com, Inc.* | | | 8,570 | | | | 1,163,206 | | | | 1.02 | |
| priceline.com, Inc.* | | | 2,285 | | | | 582,675 | | | | 0.51 | |
| | | | | | | | 1,745,881 | | | | 1.53 | |
| Internet Software & Services | | | | | | | | | | | | |
| Baidu, Inc. Spon. ADR* | | | 2,137 | | | | 1,275,789 | | | | 1.12 | |
| Google, Inc. - Cl. A* | | | 4,642 | | | | 2,632,061 | | | | 2.30 | |
| OpenTable, Inc.* | | | 16,218 | | | | 618,392 | | | | 0.54 | |
| | | | | | | | 4,526,242 | | | | 3.96 | |
| Marine | | | | | | | | | | | | |
| Kuehne + Nagel International AG | | | 13,859 | | | | 1,402,461 | | | | 1.23 | |
| | | | | | | | | | | | | |
| Movies & Entertainment | | | | | | | | | | | | |
| The Walt Disney Company | | | 99,461 | | | | 3,472,184 | | | | 3.04 | |
| | | | | | | | | | | | | |
| Oil & Gas Equipment & Services | | | | | | | | | | | | |
| National Oilwell Varco, Inc. | | | 37,584 | | | | 1,525,159 | | | | 1.34 | |
| | | | | | | | | | | | | |
| Oil & Gas Exploration & Production | | | | | | | | | | | | |
| OGX Petróleo e Gás Participações S.A. | | | 343,400 | | | | 3,215,121 | | | | 2.82 | |
See notes to financial statements.
| | | Number | | | | | | Percent | |
| | | of | | | | | | of Net | |
| | | Shares | | | Value | | | Assets | |
COMMON STOCKS (continued) | | | | | | | | | |
| | | | | | | | |
| Other Diversified Financial Services | | | | | | | |
| JPMorgan Chase & Co. | | | 123,814 | | | $ | 5,540,676 | | | | 4.85 | % |
| | | | | | | | | | | | | |
| Packaged Foods & Meats | | | | | | | | | | | | |
| Nestlé S.A. | | | 44,351 | | | | 2,271,390 | | | | 1.99 | |
| | | | | | | | | | | | | |
| Real Estate Operating Companies | | | | | | | | | |
| BR Malls Participacoes S.A.* | | | 216,500 | | | | 2,556,583 | | | | 2.24 | |
| | | | | | | | | | | | | |
| Real Estate Services | | | | | | | | | | | | |
| IFM Investments Ltd. ADR* | | | 105,000 | | | | 735,000 | | | | 0.64 | |
| | | | | | | | | | | | | |
| Regional Banks | | | | | | | | | | | | |
| First Midwest Bancorp, Inc. | | | 67,242 | | | | 911,129 | | | | 0.80 | |
| The PNC Financial Services Group, Inc. | | | 54,316 | | | | 3,242,665 | | | | 2.84 | |
| | | | | | | | 4,153,794 | | | | 3.64 | |
| Restaurants | | | | | | | | | | | | |
| Chipotle Mexican Grill, Inc. - Cl. A* | | | 4,117 | | | | 463,862 | | | | 0.41 | |
| | | | | | | | | | | | | |
| Semiconductors | | | | | | | | | | | | |
| Cree, Inc.* | | | 18,549 | | | | 1,302,511 | | | | 1.14 | |
| Taiwan Semiconductor | | | | | | | | | | | | |
| Manufacturing Co., Ltd. Spon. ADR | | | 110,503 | | | | 1,159,176 | | | | 1.02 | |
| | | | | | | | 2,461,687 | | | | 2.16 | |
| Specialty Chemicals | | | | | | | | | | | | |
| Novozymes A/S - Cl. B | | | 15,150 | | | | 1,676,676 | | | | 1.47 | |
| | | | | | | | | | | | | |
| Technology Distributors | | | | | | | | | | | | |
| Digital China Holdings Ltd. | | | 180,000 | | | | 303,700 | | | | 0.27 | |
| | | | | | |
| Wireless Telecommunication Services | | | | | |
| Crown Castle International Corp.* | | | 94,530 | | | | 3,613,882 | | | | 3.16 | |
| | | | | | | | | | | | | |
| TOTAL COMMON STOCKS | | | | | | | | | | | | |
| (Cost $85,882,348) | | | | | | | 110,905,720 | | | | 97.12 | |
| | | | | | | | | | | | | |
| PREFERRED STOCKS | | | | | | | | | | | | |
| | | | | | | | | | | | | |
| General Merchandise Stores | | | | | | | | | |
| Lojas Americans S.A. Pref. | | | 145,200 | | | | 1,081,846 | | | | 0.95 | |
| | | | | | | | | | | | | |
| TOTAL PREFERRED STOCKS | | | | | | | | | |
| (Cost $912,653) | | | | | | | 1,081,846 | | | | 0.95 | |
| | | | | | | | | | | | | |
| SHORT-TERM INVESTMENTS | | | | | | | | | |
| SSgA U.S. Government | | | | | | | | | | | | |
| Money Market Fund, 0.000% | | | 2,735,912 | | | | 2,735,912 | | | | 2.39 | |
| | | | | | | | | | | | | |
| TOTAL SHORT-TERM INVESTMENTS | | | | | | | | | |
| (Cost $2,735,912) | | | | | | | 2,735,912 | | | | 2.39 | |
| | | | | | | | | | | | | |
| TOTAL INVESTMENTS | | | | | | | | | | | | |
| (Cost $89,530,913) | | | | | | | 114,723,478 | | | | 100.46 | |
| | | | | | | | | | | | | |
| Liabilities, Less Cash and Other Assets | | | | | | | (530,228 | ) | | | (0.46 | ) |
| | | | | | | | | | | | | |
| NET ASSETS | | | | | | $ | 114,193,250 | | | | 100.00 | % |
SUMMARY OF INVESTMENTS BY COUNTRY
| | | | | | Percent of | |
| | | | | | Investment | |
| Country | | Market Value | | | Securities | |
| Belgium | | $ | 3,450,769 | | | | 3.01 | % |
| Brazil | | | 14,161,267 | | | | 12.34 | |
| Canada | | | 4,114,841 | | | | 3.59 | |
| China | | | 3,388,193 | | | | 2.95 | |
| Denmark | | | 1,676,676 | | | | 1.46 | |
| Hong Kong | | | 5,263,053 | | | | 4.59 | |
| India | | | 1,460,895 | | | | 1.27 | |
| Netherlands | | | 817,180 | | | | 0.71 | |
| Spain | | | 3,711,475 | | | | 3.24 | |
| Switzerland | | | 13,012,357 | | | | 11.34 | |
| Taiwan | | | 1,159,176 | | | | 1.01 | |
| United Kingdom | | | 7,594,453 | | | | 6.62 | |
United States(1) | | | 54,913,143 | | | | 47.87 | |
| | | $ | 114,723,478 | | | | 100.00 | % |
(1) Includes short-term securities.
See notes to financial statements.
STATEMENTS OF ASSETS AND LIABILITIES
March 31, 2010 (Unaudited)
| | | MARSICO FOCUS FUND | | | MARSICO GROWTH FUND | |
| (Amounts in thousands) | | | | | | |
| | | | | | | |
| ASSETS | | | | | | |
Investments, at value (cost $1,568,453, $742,270, $660,392, $363,583, $45,429 and $89,531 respectively) | | $ | 2,074,127 | | | $ | 1,035,264 | |
| Foreign currency (cost $0, $0, $0, $645, $0, and, $0 respectively) | | | — | | | | — | |
| Receivable for investments sold | | | 43,544 | | | | 11,349 | |
| Receivable for capital stock sold | | | 1,816 | | | | 553 | |
| Interest and dividends receivable | | | 2,604 | | | | 906 | |
| Due from adviser | | | — | | | | — | |
| Prepaid expenses and other assets | | | 720 | | | | 375 | |
| Total Assets | | | 2,122,811 | | | | 1,048,447 | |
| | | | | | | | | |
| LIABILITIES | | | | | | | | |
| Payable for investments purchased | | | 20,387 | | | | 8,959 | |
| Due to custodian | | | 3,323 | | | | — | |
| Payable for capital stock redeemed | | | 1,866 | | | | 1,375 | |
| Accrued investment advisory fee | | | 1,542 | | | | 743 | |
| Accrued trustees’ fees | | | 689 | | | | 347 | |
| Accrued distribution fee | | | 657 | | | | 488 | |
| Accrued transfer agent fees and expenses | | | 291 | | | | 227 | |
| Accrued printing expenses | | | 200 | | | | 186 | |
| Accrued expenses and other liabilities | | | 84 | | | | 51 | |
| Total Liabilities | | | 29,039 | | | | 12,376 | |
| | | | | | | | | |
| NET ASSETS | | $ | 2,093,772 | | | $ | 1,036,071 | |
| | | | | | | | | |
| NET ASSETS CONSIST OF | | | | | | | | |
| Paid-in-capital | | $ | 1,993,192 | | | $ | 1,045,833 | |
| Accumulated net investment income (loss) | | | (851 | ) | | | 518 | |
| Accumulated net realized loss on investments and | | | | | | | | |
| foreign currency transactions | | | (404,278 | ) | | | (303,298 | ) |
| Net unrealized appreciation on investments | | | | | | | | |
| and foreign currency translations | | | 505,709 | | | | 293,018 | |
| NET ASSETS | | $ | 2,093,772 | | | $ | 1,036,071 | |
| | | | | | | | | |
| SHARES OUTSTANDING, $0.001 par value | | | | | | | | |
| (Unlimited shares authorized) | | | 129,371 | | | | 60,314 | |
| | | | | | | | | |
| NET ASSET VALUE, REDEMPTION PRICE, | | | | | | | | |
| AND OFFERING PRICE PER SHARE | | | | | | | | |
| (NET ASSETS/SHARES OUTSTANDING)* | | $ | 16.18 | | | $ | 17.18 | |
| * | Not in thousands, based on unrounded net assets and shares outstanding. |
See notes to financial statements.
| | | | MARSICO | | | MARSICO | | | | |
| MARSICO | | | INTERNATIONAL | | | FLEXIBLE | | | MARSICO | |
| 21st CENTURY FUND | | | OPPORTUNITIES FUND | | | CAPITAL FUND | | | GLOBAL FUND | |
| | | | | | | | | | | | | | | |
| | | | | | | | | | | | | | | |
| $ | 864,596 | | | $ | 434,933 | | | $ | 52,195 | | | $ | 114,723 | |
| | — | | | | 652 | | | | — | | | | — | |
| | 2,333 | | | | 264 | | | | — | | | | — | |
| | 231 | | | | 693 | | | | 212 | | | | 25 | |
| | 1,077 | | | | 1,059 | | | | 180 | | | | 121 | |
| | — | | | | — | | | | 22 | | | | — | |
| | 433 | | | | 306 | | | | 382 | | | | 239 | |
| | 868,670 | | | | 437,907 | | | | 52,991 | | | | 115,108 | |
| | | | | | | | | | | | | | | |
| | | | | | | | | | | | | | | |
| | 1,033 | | | | 1,861 | | | | 1,506 | | | | 476 | |
| | — | | | | — | | | | — | | | | — | |
| | 995 | | | | 272 | | | | 2 | | | | 14 | |
| | 627 | | | | 310 | | | | — | | | | 82 | |
| | 411 | | | | 290 | | | | 371 | | | | 226 | |
| | 270 | | | | 166 | | | | 31 | | | | 62 | |
| | 173 | | | | 81 | | | | 3 | | | | 9 | |
| | 123 | | | | 54 | | | | 4 | | | | 17 | |
| | 110 | | | | 67 | | | | 13 | | | | 29 | |
| | 3,742 | | | | 3,101 | | | | 1,930 | | | | 915 | |
| | | | | | | | | | | | | | | |
| $ | 864,928 | | | $ | 434,806 | | | $ | 51,061 | | | $ | 114,193 | |
| | | | | | | | | | | | | | | |
| | | | | | | | | | | | | | | |
| $ | 1,428,814 | | | $ | 575,612 | | | $ | 46,006 | | | $ | 122,527 | |
| | (3,007 | ) | | | (1,775 | ) | | | (745 | ) | | | (865 | ) |
| | | | | | | | | | | | | | | |
| | (765,115 | ) | | | (210,373 | ) | | | (1,023 | ) | | | (32,698 | ) |
| | | | | | | | | | | | | | | |
| | 204,236 | | | | 71,342 | | | | 6,823 | | | | 25,229 | |
| $ | 864,928 | | | $ | 434,806 | | | $ | 51,061 | | | $ | 114,193 | |
| | | | | | | | | | | | | | | |
| | | | | | | | | | | | | | | |
| | 67,255 | | | | 36,013 | | | | 4,762 | | | | 12,167 | |
| | | | | | | | | | | | | | | |
| | | | | | | | | | | | | | | |
| | | | | | | | | | | | | | | |
| $ | 12.86 | | | $ | 12.07 | | | $ | 10.72 | | | $ | 9.39 | |
STATEMENTS OF OPERATIONS
FOR THE SIX-MONTHS ENDED March 31, 2010 (Unaudited)
| | | MARSICO | | | MARSICO | |
| (Amounts in thousands) | | FOCUS FUND | | | GROWTH FUND | |
| | | | | | | |
| INVESTMENT INCOME | | | | | | |
| Interest | | $ | 16 | | | $ | — | |
| Dividends (net of $198, $99, $101, $228, $2 and $16 of non-reclaimable foreign withholding taxes) | | | 13,860 | | | | 8,536 | |
| | | | | | | | | |
| Total Investment Income | | | 13,876 | | | | 8,536 | |
| | | | | | | | | |
| | | | | | | | | |
| EXPENSES | | | | | | | | |
| Investment advisory fees | | | 8,748 | | | | 4,681 | |
| Distribution fees | | | 2,573 | | | | 1,377 | |
| Transfer agent fees and expenses | | | 1,427 | | | | 790 | |
| Printing and postage expenses | | | 305 | | | | 169 | |
| Trustees’ fees and expenses | | | 158 | (1) | | | 86 | (1) |
| Custody and fund accounting fees | | | 137 | | | | 104 | |
| Fund administration fees | | | 125 | | | | 101 | |
| Professional fees | | | 99 | | | | 58 | |
| Miscellaneous | | | 98 | | | | 55 | |
| Federal and state registration fees | | | 41 | | | | 27 | |
| | | | | | | | | |
| Total Expenses | | | 13,711 | | | | 7,448 | |
| Less waiver of expenses and expenses paid indirectly | | | (1 | ) | | | (1 | ) |
| | | | | | | | | |
| Net Expenses | | | 13,710 | | | | 7,447 | |
| | | | | | | | | |
| | | | | | | | | |
| NET INVESTMENT INCOME / (LOSS) | | | 166 | | | | 1,089 | |
| | | | | | | | | |
| | | | | | | | | |
| REALIZED AND UNREALIZED GAIN / LOSS | | | | | | | | |
| Net realized gain on investments | | | 155,843 | | | | 90,045 | |
| Net realized gain (loss) on foreign currency transactions | | | (34 | ) | | | — | |
| Change in unrealized appreciation/depreciation on | | | | | | | | |
| investments and foreign currency translations | | | 93,197 | | | | 42,686 | |
| | | | | | | | | |
| Net Gain on Investments | | | 249,006 | | | | 132,731 | |
| | | | | | | | | |
| | | | | | | | | |
| NET INCREASE IN NET ASSETS | | | | | | | | |
| RESULTING FROM OPERATIONS | | $ | 249,172 | | | $ | 133,820 | |
| (1) | Amounts include trustees’ fees and expenses and the mark to market unrealized appreciation (depreciation) during the period for shares held in the Trustees’ Deferred Plan, as more fully described in Note 2(g) in the Notes to Financial Statements. |
| | | Trustees’ | | | Unrealized | |
| | | Fees and | | | Appreciation | |
| | | Expenses* | | | (Depreciation)* | |
| Focus Fund | | $ | 88,462 | | | $ | 69,830 | |
| Growth Fund | | | 51,643 | | | | 34,738 | |
| 21st Century Fund | | | 39,362 | | | | 39,739 | |
| International Opportunities Fund | | | 20,538 | | | | 4,837 | |
| Flexible Capital Fund | | | 1,717 | | | | 37,422 | |
| Global Fund | | | 5,133 | | | | 17,737 | |
* Not in thousands.
See notes to financial statements.
| | | | MARSICO | | | MARSICO | | | | |
| MARSICO | | | INTERNATIONAL | | | FLEXIBLE | | | MARSICO | |
| 21st CENTURY FUND | | | OPPORTUNITIES FUND | | | CAPITAL FUND | | | GLOBAL FUND | |
| | | | | | | | | | | |
| $ | 69 | | | $ | — | | | $ | 83 | | | $ | — | |
| | 3,598 | | | | 2,199 | | | | 375 | | | | 363 | |
| | | | | | | | | | | | | | | |
| | 3,667 | | | | 2,199 | | | | 458 | | | | 363 | |
| | | | | | | | | | | | | | | |
| | | | | | | | | | | | | | | |
| | | | | | | | | | | | | | | |
| | 3,765 | | | | 1,865 | | | | 163 | | | | 468 | |
| | 1,107 | | | | 549 | | | | 48 | | | | 138 | |
| | 731 | | | | 354 | | | | 21 | | | | 48 | |
| | 132 | | | | 70 | | | | 6 | | | | 17 | |
| | 79 | (1) | | | 25 | (1) | | | 39 | (1) | | | 23 | (1) |
| | 124 | | | | 282 | | | | 46 | | | | 65 | |
| | 96 | | | | 89 | | | | 25 | | | | 52 | |
| | 52 | | | | 24 | | | | 2 | | | | 6 | |
| | 47 | | | | 20 | | | | 1 | | | | 4 | |
| | 22 | | | | 15 | | | | 8 | | | | 9 | |
| | 6,155 | | | | 3,293 | | | | 359 | | | | 830 | |
| | | | | | | | | | | | | | | |
| | — | | | | — | | | | (215 | ) | | | — | |
| | | | | | | | | | | | | | | |
| | 6,155 | | | | 3,293 | | | | 144 | | | | 830 | |
| | | | | | | | | | | | | | | |
| | | | | | | | | | | | | | | |
| | (2,488 | ) | | | (1,094 | ) | | | 314 | | | | (467 | ) |
| | | | | | | | | | | | | | | |
| | | | | | | | | | | | | | | |
| | | | | | | | | | | | | | | |
| | 127,772 | | | | 19,162 | | | | 4,016 | | | | 14,374 | |
| | 3,601 | | | | 7,028 | | | | 134 | | | | 358 | |
| | | | | | | | | | | | | | | |
| | (34,662 | ) | | | (14,803 | ) | | | 986 | | | | (3,600 | ) |
| | | | | | | | | | | | | | | |
| | 96,711 | | | | 11,387 | | | | 5,136 | | | | 11,132 | |
| | | | | | | | | | | | | | | |
| | | | | | | | | | | | | | | |
| | | | | | | | | | | | | | | |
| $ | 94,223 | | | $ | 10,293 | | | $ | 5,450 | | | $ | 10,665 | |
STATEMENTS OF CHANGES IN NET ASSETS
| | | MARSICO | | | MARSICO | |
| | | FOCUS FUND | | | GROWTH FUND | |
| | | | | | | | | | | | | |
| | | Six-Months | | | | | | Six-Months | | | | |
| | | Ended | | | Year | | | Ended | | | Year | |
| | | 3/31/10 | | | Ended | | | 3/31/10 | | | Ended | |
| (Amounts in thousands) | | (Unaudited) | | | 9/30/09 | | | (Unaudited) | | | 9/30/09 | |
| | | | | | | | | | | | | |
| OPERATIONS: | | | | | | | | | | | | |
| Net investment income (loss) | | $ | 166 | | | $ | 5,951 | | | $ | 1,089 | | | $ | 5,112 | |
| Net realized gain (loss) on investments | | | 155,843 | | | | (494,446 | ) | | | 90,045 | | | | (232,123 | ) |
| Net realized loss on written option contracts | | | — | | | | (573 | ) | | | — | | | | (333 | ) |
| Net realized gain (loss) on foreign currency transactions | | | (34 | ) | | | 265 | | | | — | | | | (3,386 | ) |
| Change in unrealized appreciation/depreciation | | | | | | | | | | | | | | | | |
| on investments and foreign currency translations | | | 93,197 | | | | 52,697 | | | | 42,686 | | | | (60,958 | ) |
| | | | | | | | | | | | | | | | | |
| Net increase (decrease) in net assets resulting from operations | | | 249,172 | | | | (436,106 | ) | | | 133,820 | | | | (291,688 | ) |
| | | | | | | | | | | | | | | | | |
| DISTRIBUTIONS: | | | | | | | | | | | | | | | | |
| Net investment income | | | (3,909 | ) | | | (18,239 | ) | | | (5,169 | ) | | | (9,299 | ) |
| Tax return of capital | | | — | | | | — | | | | — | | | | — | |
| Net realized gains | | | — | | | | (2,822 | ) | | | — | | | | (634 | ) |
| | | | | | | | | | | | | | | | | |
| Total distributions | | | (3,909 | ) | | | (21,061 | ) | | | (5,169 | ) | | | (9,933 | ) |
| | | | | | | | | | | | | | | | | |
| CAPITAL SHARE TRANSACTIONS: | | | | | | | | | | | | | | | | |
| Proceeds from sale of shares | | | 229,387 | | | | 588,756 | | | | 80,457 | | | | 283,460 | |
| Proceeds from reinvestment of distributions | | | 3,863 | | | | 20,657 | | | | 5,054 | | | | 9,571 | |
| Redemption fees | | | 7 | | | | 41 | | | | 83 | | | | 111 | |
| Redemption of shares | | | (385,789 | ) | | | (1,582,059 | ) | | | (371,405 | ) | | | (895,861 | ) |
| | | | | | | | | | | | | | | | | |
| Net increase (decrease) from capital share transactions | | | (152,532 | ) | | | (972,605 | ) | | | (285,811 | ) | | | (602,719 | ) |
| | | | | | | | | | | | | | | | | |
| TOTAL INCREASE (DECREASE) IN NET ASSETS | | | 92,731 | | | | (1,429,772 | ) | | | (157,160 | ) | | | (904,340 | ) |
| | | | | | | | | | | | | | | | | |
| NET ASSETS: | | | | | | | | | | | | | | | | |
| Beginning of period | | | 2,001,041 | | | | 3,430,813 | | | | 1,193,231 | | | | 2,097,571 | |
| | | | | | | | | | | | | | | | | |
| End of period | | $ | 2,093,772 | | | $ | 2,001,041 | | | $ | 1,036,071 | | | $ | 1,193,231 | |
| | | | | | | | | | | | | | | | | |
| Accumulated net investment income (loss) | | | (851 | ) | | | 2,892 | | | | 518 | | | | 4,597 | |
| | | | | | | | | | | | | | | | | |
| TRANSACTIONS IN SHARES: | | | | | | | | | | | | | | | | |
| Shares sold | | | 15,010 | | | | 49,096 | | | | 4,982 | | | | 22,391 | |
| Shares issued in reinvestment of distributions | | | 257 | | | | 1,808 | | | | 317 | | | | 782 | |
| Shares redeemed | | | (25,064 | ) | | | (134,063 | ) | | | (22,869 | ) | | | (70,685 | ) |
| | | | | | | | | | | | | | | | | |
| NET INCREASE (DECREASE) | | | (9,797 | ) | | | (83,159 | ) | | | (17,570 | ) | | | (47,512 | ) |
See notes to financial statements.
| | | | | | | MARSICO | | | MARSICO | | | | |
| MARSICO | | | INTERNATIONAL | | | FLEXIBLE | | | MARSICO | |
| 21st CENTURY FUND | | | OPPORTUNITIES FUND | | | CAPITAL FUND | | | GLOBAL FUND | |
| | | | | | | | | | | | | | | | | | | | | | | |
| Six-Months | | | | | | Six-Months | | | | | | Six-Months | | | | | | Six-Months | | | | |
| Ended | | | Year | | | Ended | | | Year | | | Ended | | | Year | | | Ended | | | Year | |
| 3/31/10 | | | Ended | | | 3/31/10 | | | Ended | | | 3/31/10 | | | Ended | | | 3/31/10 | | | Ended | |
| (Unaudited) | | | 9/30/09 | | | (Unaudited) | | | 9/30/09 | | | (Unaudited) | | | 9/30/09 | | | (Unaudited) | | | 9/30/09 | |
| | | | | | | | | | | | | | | | | | | | | | | | | | | | | | | |
| $ | (2,488 | ) | | $ | 632 | | | $ | (1,094 | ) | | $ | 2,129 | | | $ | 314 | | | $ | 201 | | | $ | (467 | ) | | $ | 447 | |
| | 127,772 | | | | (631,997 | ) | | | 19,162 | | | | (145,120 | ) | | | 4,016 | | | | (2,351 | ) | | | 14,374 | | | | (29,833 | ) |
| | — | | | | — | | | | — | | | | — | | | | — | | | | — | | | | — | | | | — | |
| | 3,601 | | | | (6,258 | ) | | | 7,028 | | | | (28,332 | ) | | | 134 | | | | (87 | ) | | | 358 | | | | (2,001 | ) |
| | | | | | | | | | | | | | | | | | | | | | | | | | | | | | | |
| | (34,662 | ) | | | 291,278 | | | | (14,803 | ) | | | 124,337 | | | | 986 | | | | 5,768 | | | | (3,600 | ) | | | 34,202 | |
| | | | | | | | | | | | | | | | | | | | | | | | | | | | | | | |
| | 94,223 | | | | (346,345 | ) | | | 10,293 | | | | (46,986 | ) | | | 5,450 | | | | 3,531 | | | | 10,665 | | | | 2,815 | |
| | | | | | | | | | | | | | | | | | | | | | | | | | | | | | | |
| | | | | | | | | | | | | | | | | | | | | | | | | | | | | | | |
| | — | | | | (2,148 | ) | | | (2,073 | ) | | | (6,419 | ) | | | (1,302 | ) | | | (116 | ) | | | (721 | ) | | | (734 | ) |
| | — | | | | (2,082 | ) | | | — | | | | — | | | | — | | | | — | | | | — | | | | — | |
| | — | | | | — | | | | — | | | | — | | | | — | | | | — | | | | — | | | | — | |
| | | | | | | | | | | | | | | | | | | | | | | | | | | | | | | |
| | — | | | | (4,230 | ) | | | (2,073 | ) | | | (6,419 | ) | | | (1,302 | ) | | | (116 | ) | | | (721 | ) | | | (734 | ) |
| | | | | | | | | | | | | | | | | | | | | | | | | | | | | | | |
| | | | | | | | | | | | | | | | | | | | | | | | | | | | | | | |
| | 34,279 | | | | 192,918 | | | | 52,889 | | | | 120,047 | | | | 16,315 | | | | 16,961 | | | | 15,803 | | | | 82,507 | |
| | — | | | | 4,133 | | | | 2,034 | | | | 6,241 | | | | 1,293 | | | | 114 | | | | 718 | | | | 728 | |
| | 5 | | | | 86 | | | | 23 | | | | 43 | | | | 2 | | | | — | | | | 4 | | | | 7 | |
| | (185,255 | ) | | | (778,321 | ) | | | (79,286 | ) | | | (219,603 | ) | | | (2,028 | ) | | | (3,620 | ) | | | (21,425 | ) | | | (58,717 | ) |
| | | | | | | | | | | | | | | | | | | | | | | | | | | | | | | |
| | (150,971 | ) | | | (581,184 | ) | | | (24,340 | ) | | | (93,272 | ) | | | 15,582 | | | | 13,455 | | | | (4,900 | ) | | | 24,525 | |
| | | | | | | | | | | | | | | | | | | | | | | | | | | | | | | |
| | (56,748 | ) | | | (931,759 | ) | | | (16,120 | ) | | | (146,677 | ) | | | 19,730 | | | | 16,870 | | | | 5,044 | | | | 26,606 | |
| | | | | | | | | | | | | | | | | | | | | | | | | | | | | | | |
| | | | | | | | | | | | | | | | | | | | | | | | | | | | | | | |
| | 921,676 | | | | 1,853,435 | | | | 450,926 | | | | 597,603 | | | | 31,331 | | | | 14,461 | | | | 109,149 | | | | 82,543 | |
| | | | | | | | | | | | | | | | | | | | | | | | | | | | | | | |
| $ | 864,928 | | | $ | 921,676 | | | $ | 434,806 | | | $ | 450,926 | | | $ | 51,061 | | | $ | 31,331 | | | $ | 114,193 | | | $ | 109,149 | |
| | | | | | | | | | | | | | | | | | | | | | | | | | | | | | | |
| | (3,007 | ) | | | (520 | ) | | | (1,775 | ) | | | 1,392 | | | | (745 | ) | | | 242 | | | | (865 | ) | | | 323 | |
| | | | | | | | | | | | | | | | | | | | | | | | | | | | | | | |
| | | | | | | | | | | | | | | | | | | | | | | | | | | | | | | |
| | 2,817 | | | | 20,568 | | | | 4,463 | | | | 13,281 | | | | 1,587 | | | | 2,102 | | | | 1,765 | | | | 12,114 | |
| | — | | | | 455 | | | | 174 | | | | 754 | | | | 131 | | | | 17 | | | | 82 | | | | 114 | |
| | (15,317 | ) | | | (85,404 | ) | | | (6,633 | ) | | | (24,733 | ) | | | (201 | ) | | | (528 | ) | | | (2,388 | ) | | | (8,822 | ) |
| | | | | | | | | | | | | | | | | | | | | | | | | | | | | | | |
| | (12,500 | ) | | | (64,381 | ) | | | (1,996 | ) | | | (10,698 | ) | | | 1,517 | | | | 1,591 | | | | (541 | ) | | | 3,406 | |
FINANCIAL HIGHLIGHTS
| | | | | | | | | MARSICO | | | | | | | |
| | | | | | | | | FOCUS FUND | | | | | | | |
| | | | | | | | | | | | | | | | | | | |
| | | Six-Months | | | | | | | | | | | | | | | | |
| | | Ended | | | Year | | | Year | | | Year | | | Year | | | Year | |
For a Fund Share Outstanding | | 3/31/10 | | | Ended | | | Ended | | | Ended | | | Ended | | | Ended | |
Throughout the Period | | (Unaudited) | | | 9/30/09 | | | 9/30/08 | | | 9/30/07 | | | 9/30/06 | | | 9/30/05 | |
| | | | | | | | | | | | | | | | | | | | | | | | | |
Net Asset Value, Beginning of Period | | $ | 14.38 | | | $ | 15.43 | | | $ | 21.75 | | | $ | 18.19 | | | $ | 17.45 | | | $ | 14.83 | |
| | | | | | | | | | | | | | | | | | | | | | | | | |
Income from Investment Operations: | | | | | | | | | | | | | | | | | | | | | | | | |
Net investment income (loss) | | | — | (1) | | | 0.04 | | | | 0.08 | | | | (0.04 | ) | | | (0.02 | ) | | | (0.03 | ) |
Net realized and unrealized gains (losses) on investments | | | 1.83 | | | | (0.99 | ) | | | (4.60 | ) | | | 4.09 | | | | 0.76 | | | | 2.65 | |
| | | | | | | | | | | | | | | | | | | | | | | | | |
Total from investment operations | | | 1.83 | | | | (0.95 | ) | | | (4.52 | ) | | | 4.05 | | | | 0.74 | | | | 2.62 | |
| | | | | | | | | | | | | | | | | | | | | | | | | |
Distributions & Other: | | | | | | | | | | | | | | | | | | | | | | | | |
Net investment income | | | (0.03 | ) | | | (0.09 | ) | | | — | | | | (0.02 | ) | | | — | | | | — | |
Tax return of capital | | | — | | | | — | | | | — | | | | — | | | | — | | | | — | |
Net realized gains | | | — | | | | (0.01 | ) | | | (1.80 | ) | | | (0.47 | ) | | | — | | | | — | |
Redemption fees [See Note 2(h)] | | | — | (1) | | | — | (1) | | | — | (1) | | | — | (1) | | | — | (1) | | | — | (1) |
| | | | | | | | | | | | | | | | | | | | | | | | | |
Total distributions and other | | | (0.03 | ) | | | (0.10 | ) | | | (1.80 | ) | | | (0.49 | ) | | | — | | | | — | |
| | | | | | | | | | | | | | | | | | | | | | | | | |
Net Asset Value, End of Period | | $ | 16.18 | | | $ | 14.38 | | | $ | 15.43 | | | $ | 21.75 | | | $ | 18.19 | | | $ | 17.45 | |
| | | | | | | | | | | | | | | | | | | | | | | | | |
Total Return | | | 12.73 | %(2) | | | (5.98 | )% | | | (22.69 | )% | | | 22.65 | % | | | 4.24 | % | | | 17.67 | % |
| | | | | | | | | | | | | | | | | | | | | | | | | |
Supplemental Data and Ratios: | | | | | | | | | | | | | | | | | | | | | | | | |
| | | | | | | | | | | | | | | | | | | | | | | | | |
Net assets, end of Period (000s) | | $ | 2,093,772 | | | $ | 2,001,041 | | | $ | 3,430,813 | | | $ | 5,051,662 | | | $ | 4,616,455 | | | $ | 3,740,191 | |
| | | | | | | | | | | | | | | | | | | | | | | | | |
Ratio of expenses to average net assets, less | | | | | | | | | | | | | | | | | | | | | | | | |
waivers and before expenses paid indirectly, plus reimbursements of previously waived expenses | | | 1.33 | %(3) | | | 1.31 | % | | | 1.21 | % | | | 1.23 | % | | | 1.24 | % | | | 1.25 | % |
| | | | | | | | | | | | | | | | | | | | | | | | | |
Ratio of net investment income (loss) to average net | | | | | | | | | | | | | | | | | | | | | | | | |
assets, net of waivers, reimbursements of previously waived expenses and expenses paid indirectly | | | 0.02 | %(3) | | | 0.27 | % | | | 0.41 | % | | | (0.20 | )% | | | (0.13 | )% | | | (0.18 | )% |
| | | | | | | | | | | | | | | | | | | | | | | | | |
Ratio of expenses to average net assets, before | | | | | | | | | | | | | | | | | | | | | | | | |
waivers, reimbursements of previously waived expenses and expenses paid indirectly | | | 1.33 | %(3) | | | 1.31 | % | | | 1.21 | % | | | 1.23 | % | | | 1.24 | % | | | 1.25 | % |
| | | | | | | | | | | | | | | | | | | | | | | | | |
Ratio of net investment income (loss) to average net | | | | | | | | | | | | | | | | | | | | | | | | |
assets, before waivers, reimbursements of previously waived expenses and expenses paid indirectly | | | 0.02 | %(3) | | | 0.27 | % | | | 0.41 | % | | | (0.21 | )% | | | (0.15 | )% | | | (0.21 | )% |
| | | | | | | | | | | | | | | | | | | | | | | | | |
Portfolio turnover rate | | | 45 | %(2) | | | 90 | % | | | 78 | % | | | 69 | % | | | 80 | % | | | 84 | % |
(1) Less than $0.01.
(2) Not annualized.
(3) Annualized.
(4) Portfolio turnover is greater than most funds due to the investment style of the Fund.
See notes to financial statements.
MARSICO GROWTH FUND | | | MARSICO 21st CENTURY FUND | |
| | | | | | | | | | | | | | | | | | | | | | | | | | | | | | | | | | | |
Six Months | | | | | | | | | | | | | | | | | | Six Months | | | | | | | | | | | | | | | | |
| Ended | | | Year | | | Year | | | Year | | | Year | | | Year | | | Eded | | | Year | | | Year | | | Year | | | Year | | | Year | |
| 3/31/10 | | | Ended | | | Ended | | | Ended | | | Ended | | | Ended | | | 3/31/10 | | | Ended | | | Ended | | | Ended | | | Ended | | | Ended | |
| (Unaudited) | | | 9/30/09 | | | 9/30/08 | | | 9/30/07 | | | 9/30/06 | | | 9/30/05 | | | (Unaudited) | | | 9/30/09 | | | 9/30/08 | | | 9/30/07 | | | 9/30/06 | | | 9/30/05 | |
| | | | | | | | | | | | | | | | | | | | | | | | | | | | | | | | | | | | | | | | | | | | | | | |
| $ | 15.32 | | | $ | 16.73 | | | $ | 23.07 | | | $ | 18.61 | | | $ | 18.09 | | | $ | 15.95 | | | $ | 11.56 | | | $ | 12.86 | | | $ | 18.07 | | | $ | 13.89 | | | $ | 12.07 | | | $ | 10.20 | |
| | | | | | | | | | | | | | | | | | | | | | | | | | | | | | | | | | | | | | | | | | | | | | | |
| | | | | | | | | | | | | | | | | | | | | | | | | | | | | | | | | | | | | | | | | | | | | | | |
| | 0.02 | | | | 0.07 | | | | 0.07 | | | | (0.05 | ) | | | (0.04 | ) | | | (0.02 | ) | | | (0.04 | ) | | | — | (1) | | | 0.01 | | | | 0.05 | | | | 0.02 | | | | (0.01 | ) |
| | 1.91 | | | | (1.38 | ) | | | (5.69 | ) | | | 4.51 | | | | 0.56 | | | | 2.16 | | | | 1.34 | | | | (1.27 | ) | | | (4.48 | ) | | | 4.26 | | | | 1.80 | | | | 1.88 | |
| | | | | | | | | | | | | | | | | | | | | | | | | | | | | | | | | | | | | | | | | | | | | | | |
| | 1.93 | | | | (1.31 | ) | | | (5.62 | ) | | | 4.46 | | | | 0.52 | | | | 2.14 | | | | 1.30 | | | | (1.27 | ) | | | (4.47 | ) | | | 4.31 | | | | 1.82 | | | | 1.87 | |
| | | | | | | | | | | | | | | | | | | | | | | | | | | | | | | | | | | | | | | | | | | | | | | |
| | (0.07 | ) | | | (0.09 | ) | | | — | | | | — | | | | — | | | | — | | | | — | | | | (0.01 | ) | | | — | | | | (0.13 | ) | | | — | (1) | | | — | |
| | — | | | | — | | | | — | | | | — | | | | — | | | | — | | | | — | | | | (0.02 | ) | | | — | | | | — | | | | — | | | | — | |
| | — | | | | (0.01 | ) | | | (0.72 | ) | | | — | | | | — | | | | — | | | | — | | | | — | | | | (0.74 | ) | | | — | (1) | | | — | | | | — | |
| | — | (1) | | | — | (1) | | | — | (1) | | | — | (1) | | | — | (1) | | | — | (1) | | | — | (1) | | | — | (1) | | | — | (1) | | | — | (1) | | | — | (1) | | | — | (1) |
| | | | | | | | | | | | | | | | | | | | | | | | | | | | | | | | | | | | | | | | | | | | | | | |
| | (0.07 | ) | | | (0.10 | ) | | | (0.72 | ) | | | — | | | | — | | | | — | | | | — | | | | (0.03 | ) | | | (0.74 | ) | | | (0.13 | ) | | | — | | | | — | |
| | | | | | | | | | | | | | | | | | | | | | | | | | | | | | | | | | | | | | | | | | | | | | | |
| $ | 17.18 | | | $ | 15.32 | | | $ | 16.73 | | | $ | 23.07 | | | $ | 18.61 | | | $ | 18.09 | | | $ | 12.86 | | | $ | 11.56 | | | $ | 12.86 | | | $ | 18.07 | | | $ | 13.89 | | | $ | 12.07 | |
| | | | | | | | | | | | | | | | | | | | | | | | | | | | | | | | | | | | | | | | | | | | | | | |
| | 12.66 | %(2) | | | (7.74 | )% | | | (25.14 | )% | | | 23.97 | % | | | 2.87 | % | | | 13.42 | % | | | 11.25 | %(2) | | | (9.79 | )% | | | (25.83 | )% | | | 31.25 | % | | | 15.10 | % | | | 18.33 | % |
| | | | | | | | | | | | | | | | | | | | | | | | | | | | | | | | | | | | | | | | | | | | | | | |
| | | | | | | | | | | | | | | | | | | | | | | | | | | | | | | | | | | | | | | | | | | | | | | |
| | | | | | | | | | | | | | | | | | | | | | | | | | | | | | | | | | | | | | | | | | | | | | | |
| $ | 1,036,071 | | | $ | 1,193,231 | | | $ | 2,097,571 | | | $ | 3,087,904 | | | $ | 2,550,641 | | | $ | 2,125,668 | | | $ | 864,928 | | | $ | 921,676 | | | $ | 1,853,435 | | | $ | 2,467,126 | | | $ | 871,459 | | | $ | 379,328 | |
| | | | | | | | | | | | | | | | | | | | | | | | | | | | | | | | | | | | | | | | | | | | | | | |
| | | | | | | | | | | | | | | | | | | | | | | | | | | | | | | | | | | | | | | | | | | | | | | |
| | | | | | | | | | | | | | | | | | | | | | | | | | | | | | | | | | | | | | | | | | | | | | | |
| | 1.35 | %(3) | | | 1.30 | % | | | 1.24 | % | | | 1.24 | % | | | 1.26 | % | | | 1.26 | % | | | 1.39 | %(3) | | | 1.37 | % | | | 1.29 | % | | | 1.31 | % | | | 1.33 | % | | | 1.39 | % |
| | | | | | | | | | | | | | | | | | | | | | | | | | | | | | | | | | | | | | | | | | | | | | | |
| | | | | | | | | | | | | | | | | | | | | | | | | | | | | | | | | | | | | | | | | | | | | | | |
| | | | | | | | | | | | | | | | | | | | | | | | | | | | | | | | | | | | | | | | | | | | | | | |
| | 0.20 | %(3) | | | 0.42 | % | | | 0.33 | % | | | (0.25 | )% | | | (0.26 | )% | | | (0.14 | )% | | | (0.56 | )%(3) | | | 0.06 | % | | | 0.07 | % | | | 0.43 | % | | | 0.20 | % | | | (0.19 | )% |
| | | | | | | | | | | | | | | | | | | | | | | | | | | | | | | | | | | | | | | | | | | | | | | |
| | | | | | | | | | | | | | | | | | | | | | | | | | | | | | | | | | | | | | | | | | | | | | | |
| | | | | | | | | | | | | | | | | | | | | | | | | | | | | | | | | | | | | | | | | | | | | | | |
| | 1.35 | %(3) | | | 1.30 | % | | | 1.24 | % | | | 1.24 | % | | | 1.26 | % | | | 1.26 | % | | | 1.39 | %(3) | | | 1.37 | % | | | 1.29 | % | | | 1.31 | % | | | 1.33 | % | | | 1.36 | % |
| | | | | | | | | | | | | | | | | | | | | | | | | | | | | | | | | | | | | | | | | | | | | | | |
| | | | | | | | | | | | | | | | | | | | | | | | | | | | | | | | | | | | | | | | | | | | | | | |
| | | | | | | | | | | | | | | | | | | | | | | | | | | | | | | | | | | | | | | | | | | | | | | |
| | 0.20 | %(3) | | | 0.41 | % | | | 0.33 | % | | | (0.25 | )% | | | (0.27 | )% | | | (0.16 | )% | | | (0.56 | )%(3) | | | 0.06 | % | | | 0.07 | % | | | 0.43 | % | | | 0.20 | % | | | (0.22 | )% |
| | | | | | | | | | | | | | | | | | | | | | | | | | | | | | | | | | | | | | | | | | | | | | | |
| | 32 | %(2) | | | 77 | % | | | 72 | % | | | 53 | % | | | 59 | % | | | 73 | % | | | 49 | %(2)(4) | | | 135 | %(4) | | | 143 | %(4) | | | 105 | %(4) | | | 136 | %(4) | | | 175 | %(4) |
FINANCIAL HIGHLIGHTS
| | | | | | | | | MARSICO | | | | | | | |
| | | INTERNATIONAL OPPORTUNITIES FUND | |
| | | | | | | | | | | | | | | | | | | |
| | | Six-Months | | | | | | | | | | | | | | | | |
| | | Ended | | | Year | | | Year | | | Year | | | Year | | | Year | |
| For a Fund Share Outstanding | | 3/31/10 | | | Ended | | | Ended | | | Ended | | | Ended | | | Ended | |
| Throughout the Period | | (Unaudited) | | | 9/30/09 | | | 9/30/08 | | | 9/30/07 | | | 9/30/06 | | | 9/30/05 | |
| | | | | | | | | | | | | | | | | | | | | | | | | |
| Net Asset Value, Beginning of Period | | $ | 11.86 | | | $ | 12.27 | | | $ | 20.10 | | | $ | 15.81 | | | $ | 13.00 | | | $ | 10.63 | |
| | | | | | | | | | | | | | | | | | | | | | | | | |
| Income from Investment Operations: | | | | | | | | | | | | | | | | | | | | | | | | |
Net investment income (loss) | | | (0.03 | ) | | | 0.06 | | | | 0.16 | | | | 0.16 | | | | 0.04 | | | | 0.12 | |
Net realized and unrealized gains (losses) on investments | | | 0.29 | | | | (0.33 | ) | | | (5.66 | ) | | | 4.81 | | | | 2.87 | | | | 2.25 | |
| | | | | | | | | | | | | | | | | | | | | | | | | |
Total from investment operations | | | 0.26 | | | | (0.27 | ) | | | (5.50 | ) | | | 4.97 | | | | 2.91 | | | | 2.37 | |
| | | | | | | | | | | | | | | | | | | | | | | | | |
| Distributions & Other: | | | | | | | | | | | | | | | | | | | | | | | | |
Net investment income | | | (0.05 | ) | | | (0.14 | ) | | | (0.18 | ) | | | (0.03 | ) | | | (0.10 | ) | | | — | |
Net realized gains | | | — | | | | — | | | | (2.15 | ) | | | (0.65 | ) | | | — | | | | — | |
Redemption fees [See Note 2(h)] | | | — | (1) | | | — | (1) | | | — | (1) | | | — | (1) | | | — | (1) | | | — | (1) |
| | | | | | | | | | | | | | | | | | | | | | | | | |
Total distributions and other | | | (0.05 | ) | | | (0.14 | ) | | | (2.33 | ) | | | (0.68 | ) | | | (0.10 | ) | | | — | |
| | | | | | | | | | | | | | | | | | | | | | | | | |
| Net Asset Value, End of Period | | $ | 12.07 | | | $ | 11.86 | | | $ | 12.27 | | | $ | 20.10 | | | $ | 15.81 | | | $ | 13.00 | |
| | | | | | | | | | | | | | | | | | | | | | | | | |
| Total Return | | | 2.25 | %(2) | | | (1.68 | )% | | | (30.95 | )% | | | 32.42 | % | | | 22.46 | % | | | 22.30 | % |
| | | | | | | | | | | | | | | | | | | | | | | | | |
| Supplemental Data and Ratios: | | | | | | | | | | | | | | | | | | | | | | | | |
| | | | | | | | | | | | | | | | | | | | | | | | | |
| Net assets, end of Period (000s) | | $ | 434,806 | | | $ | 450,926 | | | $ | 597,603 | | | $ | 822,073 | | | $ | 571,684 | | | $ | 262,522 | |
| | | | | | | | | | | | | | | | | | | | | | | | | |
Ratio of expenses to average net assets, less waivers and before expenses paid indirectly, plus eimbursements of previously waived expenses | | | 1.50 | %(3) | | | 1.48 | % | | | 1.35 | % | | | 1.37 | % | | | 1.44 | % | | | 1.60 | % |
| | | | | | | | | | | | | | | | | | | | | | | | | |
Ratio of net investment income (loss) to average net assets, net of waivers, reimbursements of previously waived expenses and expenses paid indirectly | | | (0.50 | %(3) | | | 0.54 | % | | | 1.00 | % | | | 0.92 | % | | | 0.33 | % | | | 1.19 | % |
| | | | | | | | | | | | | | | | | | | | | | | | | |
Ratio of expenses to average net assets, before waivers, reimbursements of previously waived expenses and expenses paid indirectly | | | 1.50 | %(3) | | | 1.48 | % | | | 1.35 | % | | | 1.37 | % | | | 1.41 | % | | | 1.49 | % |
| | | | | | | | | | | | | | | | | | | | | | | | | |
Ratio of net investment income (loss) to average net assets, before waivers, reimbursements of previously waived expenses and expenses paid indirectly | | | (0.50 | %(3) | | | 0.54 | % | | | 1.00 | % | | | 0.92 | % | | | 0.36 | % | | | 1.30 | % |
| | | | | | | | | | | | | | | | | | | | | | | | | |
| Portfolio turnover rate | | | 73 | %(2)(4) | | | 108 | %(4) | | | 115 | %(4) | | | 125 | %(4) | | | 101 | %(4) | | | 156 | %(4) |
* Commencement of operations.
(1) Less than $0.01.
(2) Not annualized.
(3) Annualized.
(4) Portfolio turnover is greater than most funds due to the investment style of the Fund.
See notes to financial statements.
MARSICOFLEXIBLE CAPITAL FUND | MARSICO GLOBAL FUND | |
| | | | | | | | | | | | | | | | | | | | | | | |
| Six-Months | | | | | | | | | | | | Six-Months | | | | | | | | | | |
| Ended | | | Year | | | Year | | | 12/29/2006* | | | Ended | | | Year | | | Year | | | 6/29/2007* | |
| 3/31/10 | | | Ended | | | Ended | | | to | | | 3/31/10 | | | Ended | | | Ended | | | to | |
| (Unaudited) | | | 9/30/09 | | | 9/30/08 | | | 9/30/07 | | | (Unaudited) | | | 9/30/09 | | | 9/30/08 | | | 9/30/07 | |
| | | | | | | | | | | | | | | | | | | | | | | | | | | | | | | |
| $ | 9.65 | | | $ | 8.74 | | | $ | 11.32 | | | $ | 10.00 | | | $ | 8.59 | | | $ | 8.87 | | | $ | 11.46 | | | $ | 10.00 | |
| | | | | | | | | | | | | | | | | | | | | | | | | | | | | | | |
| | | | | | | | | | | | | | | | | | | | | | | | | | | | | | | |
| | 0.14 | | | | 0.06 | | | | 0.14 | | | | 0.22 | | | | (0.04 | ) | | | 0.04 | | | | 0.08 | | | | 0.02 | |
| | 1.30 | | | | 0.93 | | | | (1.93 | ) | | | 1.10 | | | | 0.90 | | | | (0.24 | ) | | | (2.46 | ) | | | 1.44 | |
| | | | | | | | | | | | | | | | | | | | | | | | | | | | | | | |
| | 1.44 | | | | 0.99 | | | | (1.79 | ) | | | 1.32 | | | | 0.86 | | | | (0.20 | ) | | | (2.38 | ) | | | 1.46 | |
| | | | | | | | | | | | | | | | | | | | | | | | | | | | | | | |
| | | | | | | | | | | | | | | | | | | | | | | | | | | | | | | |
| | (0.37 | ) | | | (0.08 | ) | | | (0.35 | ) | | | — | | | | (0.06 | ) | | | (0.08 | ) | | | (0.05 | ) | | | — | |
| | — | | | | — | | | | (0.44 | ) | | | — | | | | — | | | | — | | | | (0.17 | ) | | | — | |
| | — | (1) | | | — | (1) | | | — | (1) | | | — | (1) | | | — | (1) | | | — | (1) | | | 0.01 | | | | — | (1) |
| | | | | | | | | | | | | | | | | | | | | | | | | | | | | | | |
| | (0.37 | ) | | | (0.08 | ) | | | (0.79 | ) | | | — | | | | (0.06 | ) | | | (0.08 | ) | | | (0.21 | ) | | | — | |
| | | | | | | | | | | | | | | | | | | | | | | | | | | | | | | |
| | 10.72 | | | $ | 9.65 | | | $ | 8.74 | | | $ | 11.32 | | | $ | 9.39 | | | $ | 8.59 | | | $ | 8.87 | | | $ | 11.46 | |
| | | | | | | | | | | | | | | | | | | | | | | | | | | | | | | |
| | 15.24 | %(2) | | | 11.68 | % | | | (17.10 | )% | | | 13.20 | %(2) | | | 10.03 | %(2) | | | (1.93 | )% | | | (21.13 | )% | | | 14.60 | %(2) |
| | | | | | | | | | | | | | | | | | | | | | | | | | | | | | | |
| | | | | | | | | | | | | | | | | | | | | | | | | | | | | | | |
| | | | | | | | | | | | | | | | | | | | | | | | | | | | | | | |
| $ | 51,061 | | | $ | 31,331 | | | $ | 14,461 | | | $ | 24,741 | | | $ | 114,193 | | | $ | 109,149 | | | $ | 82,543 | | | $ | 31,477 | |
| | | | | | | | | | | | | | | | | | | | | | | | | | | | | | | |
| | | | | | | | | | | | | | | | | | | | | | | | | | | | | | | |
| | | | | | | | | | | | | | | | | | | | | | | | | | | | | | | |
| | 0.75 | %(3) | | | 0.75 | % | | | 0.75 | % | | | 1.22 | %(3) | | | 1.51 | %(3) | | | 1.40 | % | | | 0.75 | % | | | 0.75 | %(3) |
| | | | | | | | | | | | | | | | | | | | | | | | | | | | | | | |
| | | | | | | | | | | | | | | | | | | | | | | | | | | | | | | |
| | | | | | | | | | | | | | | | | | | | | | | | | | | | | | | |
| | 1.64 | %(3) | | | 1.44 | % | | | 1.15 | % | | | 2.62 | %(3) | | | (0.85 | )%(3) | | | 0.52 | % | | | 0.88 | % | | | 1.06 | %(3) |
| | | | | | | | | | | | | | | | | | | | | | | | | | | | | | | |
| | | | | | | | | | | | | | | | | | | | | | | | | | | | | | | |
| | | | | | | | | | | | | | | | | | | | | | | | | | | | | | | |
| | 1.87 | %(3) | | | 2.84 | % | | | 1.71 | % | | | 2.47 | %(3) | | | 1.51 | %(3) | | | 1.58 | % | | | 1.49 | % | | | 4.48 | %(3) |
| | | | | | | | | | | | | | | | | | | | | | | | | | | | | | | |
| | | | | | | | | | | | | | | | | | | | | | | | | | | | | | | |
| | | | | | | | | | | | | | | | | | | | | | | | | | | | | | | |
| | 0.52 | %(3) | | | (0.65 | )% | | | 0.19 | % | | | 1.37 | %(3) | | | (0.85 | )%(3) | | | 0.34 | % | | | 0.14 | % | | | (2.67 | )%(3) |
| | | | | | | | | | | | | | | | | | | | | | | | | | | | | | | |
| | 88 | %(2)(4) | | | 259 | %(4) | | | 207 | %(4) | | | 237 | %(2)(4) | | | 58 | %(2)(4) | | | 185 | %(4) | | | 201 | %(4) | | | 56 | %(2)(4) |
| NOTES TO FINANCIAL STATEMENTS |
��
The Marsico Investment Fund (the “Trust”) was organized on October 1, 1997, as a Delaware Statutory Trust and is registered under the Investment Company Act of 1940 (the “1940 Act”) as an open-end management investment company. The Focus Fund, Growth Fund, 21st Century Fund, International Opportunities Fund, Flexible Capital Fund, and Global Fund (collectively, the “Funds”) are separate investment portfolios of the Trust. The Focus Fund and the Flexible Capital Fund are non-diversified funds and the Growth Fund, the 21st Century Fund, the International Opportunities Fund, and the Global Fund are diversified funds. The Focus and Growth Funds commenced operations on December 31, 1997, the 21st Century Fund commenced operations on February 1, 2000, the International Opportunities Fund commenced operations on June 30, 2000, the Flexible Capital Fund commenced operations on December 29, 2006, and the Global Fund commenced operations on June 29, 2007. Affiliates of Marsico Capital Management, LLC (the “Adviser”) hold approximately 49% of the Flexible Capital Fund’s outstanding shares as of March 31, 2010.
| 2. | Significant Accounting Policies |
The following is a summary of significant accounting policies consistently followed by the Funds in the preparation of their financial statements. These policies are in conformity with Generally Accepted Accounting Principles (“GAAP”) for investment companies. The presentation of financial statements in conformity with GAAP requires management to make estimates and assumptions that affect the reported amounts of assets and liabilities at the date of the financial statements and the reported amounts of income and expenses during the reporting period. Actual results could differ from those estimates.
| | (a) | Investment Valuation—A security traded on a recognized stock exchange is valued at the last sale price prior to the closing of the principal exchange on which the security is traded. Securities traded on NASDAQ generally will be valued at the NASDAQ Official Closing Price. If no sale price is reported on the valuation date, the most current bid price will generally be used. Other securities for which over-the-counter market quotations are readily available are generally valued at the last sale price. Debt securities that will mature in more than 60 days are generally valued at their bid prices furnished by a pricing service approved by the Funds’ Board of Trustees and subject to review and determination of the appropriate price by the Adviser. Debt securities that will mature in 60 days or less are valued at amortized cost, if it approximates market value. Any securities for which market quotations are not readily available are valued at their fair value as determined in good faith by the Adviser in accordance with procedures established by, and under the general supervision of, the Funds’ Board of Trustees. The Funds may use pricing services to assist in determining market value. The Board of Trustees has authorized the use of a pricing service to assist the Funds in valuing certain equity securities listed or traded on foreign security exchanges in the Funds’ portfolios in certain circumstances where there is a significant change in the value of related U.S.- traded securities, as represented by, for example, the S&P 500 Index. |
In September 2006, the Financial Accounting Standards Board (“FASB”) issued “Fair Value Measurements and Disclosures” (the “Fair Value Statement”) effective for fiscal years beginning after November 15, 2007. The Fair Value Statement defines fair value, establishes a framework for measuring fair value in GAAP, and expands disclosures about fair value measurements. The Trust adopted the Fair Value Statement as of the beginning of its fiscal year on October 1, 2008. Under the Fair Value Statement, various inputs are used in determining the value of the Funds’ investments.
These inputs are summarized into three broad levels and described below:
| | • | Level 1 – quoted prices in active markets for identical investments |
| | • | Level 2 – other significant observable inputs (including quoted prices for similar investments, interest rates, and evaluated quotations obtained from pricing services) |
| | • | Level 3 – significant unobservable inputs (including the Fund’s own assumptions in determining the fair value of investments). |
| NOTES TO FINANCIAL STATEMENTS |
The inputs or methodology used for valuing investments are not an indication of the risk associated with investing in those investments. The following is a summary of the fair values of the Funds’ investments in each category and economic sector as of March 31, 2010:
| Fund Investments by | | | | | | | | | | | | |
| Major Security Type | | Level 1 | | | Level 2 | | | Level 3 | | | Total | |
| Marsico Focus Fund | | | | | | | | | | | | |
| Common Stocks | | | | | | | | | | | | |
| Consumer Discretionary | | $ | 263,941,443 | | | $ | — | | | $ | — | | | $ | 263,941,443 | |
| Consumer Staples | | | 26,872,194 | | | | — | | | | — | | | | 26,872,194 | |
| Energy | | | 115,193,671 | | | | — | | | | — | | | | 115,193,671 | |
| Financials | | | 429,004,687 | | | | — | | | | — | | | | 429,004,687 | |
| Health Care | | | 215,176,554 | | | | — | | | | — | | | | 215,176,554 | |
| Industrials | | | 297,223,843 | | | | — | | | | — | | | | 297,223,843 | |
| Information Technology | | | 456,941,541 | | | | — | | | | — | | | | 456,941,541 | |
| Materials | | | 269,773,327 | | | | — | | | | — | | | | 269,773,327 | |
| | | | | | | | | | | | | | | $ | 2,074,127,260 | |
| | | | | | | | | | | | | | | | | |
| Marsico Growth Fund | | | | | | | | | | | | | | | | |
| Common Stocks | | | | | | | | | | | | | | | | |
| Consumer Discretionary | | | 166,177,598 | | | | — | | | | — | | | | 166,177,598 | |
| Energy | | | 66,129,384 | | | | — | | | | — | | | | 66,129,384 | |
| Financials | | | 171,969,612 | | | | — | | | | — | | | | 171,969,612 | |
| Health Care | | | 51,725,032 | | | | — | | | | — | | | | 51,725,032 | |
| Industrials | | | 130,922,655 | | | | — | | | | — | | | | 130,922,655 | |
| Information Technology | | | 246,362,173 | | | | — | | | | — | | | | 246,362,173 | |
| Materials | | | 149,222,073 | | | | — | | | | — | | | | 149,222,073 | |
| Telecommunication Services | | | 22,232,575 | | | | — | | | | — | | | | 22,232,575 | |
| Preferred Stocks | | | 9,200,100 | | | | — | | | | — | | | | 9,200,100 | |
| Short-term Investments | | | 21,322,637 | | | | — | | | | — | | | | 21,322,637 | |
| | | | | | | | | | | | | | | $ | 1,035,263,839 | |
| | | | | | | | | | | | | | | | | |
| Marsico 21st Century Fund | | | | | | | | | | | | | | | | |
| Common Stocks | | | | | | | | | | | | | | | | |
| Consumer Discretionary | | | 188,951,932 | | | | — | | | | — | | | | 188,951,932 | |
| Consumer Staples | | | 24,793,853 | | | | — | | | | — | | | | 24,793,853 | |
| Energy | | | 35,762,092 | | | | — | | | | — | | | | 35,762,092 | |
| Financials | | | 279,799,749 | | | | — | | | | — | | | | 279,799,749 | |
| Health Care | | | 68,228,664 | | | | — | | | | — | | | | 68,228,664 | |
| Industrials | | | 69,354,630 | | | | — | | | | — | | | | 69,354,630 | |
| Information Technology | | | 118,650,940 | | | | — | | | | — | | | | 118,650,940 | |
| Telecommunication Services | | | 38,455,481 | | | | — | | | | — | | | | 38,455,481 | |
| Warrants | | | 5,284,621 | | | | — | | | | — | | | | 5,284,621 | |
| Short-term Investments | | | 35,314,032 | | | | — | | | | — | | | | 35,314,032 | |
| | | | | | | | | | | | | | | $ | 864,595,994 | |
| | | | | | | | | | | | | | | | | |
| Marsico International Opportunities Fund | | | | | | | | | | | | | | | | |
| Common Stocks | | | | | | | | | | | | | | | | |
| Consumer Discretionary | | | 73,213,916 | | | | — | | | | — | | | | 73,213,916 | |
| Consumer Staples | | | 55,414,978 | | | | — | | | | — | | | | 55,414,978 | |
| Energy | | | 24,587,433 | | | | — | | | | — | | | | 24,587,433 | |
| Financials | | | 72,573,031 | | | | — | | | | — | | | | 72,573,031 | |
| Health Care | | | 43,589,001 | | | | — | | | | — | | | | 43,589,001 | |
| Industrials | | | 41,517,443 | | | | — | | | | — | | | | 41,517,443 | |
| Information Technology | | | 47,493,533 | | | | — | | | | — | | | | 47,493,533 | |
| Materials | | | 43,476,630 | | | | — | | | | — | | | | 43,476,630 | |
| Telecommunication Services | | | 13,051,710 | | | | — | | | | — | | | | 13,051,710 | |
| Preferred Stocks | | | 4,429,169 | | | | — | | | | — | | | | 4,429,169 | |
| Short-term Investments | | | 15,586,577 | | | | — | | | | — | | | | 15,586,577 | |
| | | | | | | | | | | | | | | $ | 434,933,421 | |
| NOTES TO FINANCIAL STATEMENTS |
| Fund Investments by | | | | | | | | | | | | |
| Major Security Type | | Level 1 | | | Level 2 | | | Level 3 | | | Total | |
| Marsico Flexible Capital Fund | | | | | | | | | | | | |
| Common Stocks | | | | | | | | | | | | |
| Consumer Discretionary | | $ | 5,616,132 | | | $ | — | | | $ | — | | | $ | 5,616,132 | |
| Consumer Staples | | | 1,123,380 | | | | — | | | | — | | | | 1,123,380 | |
| Energy | | | 2,793,171 | | | | — | | | | — | | | | 2,793,171 | |
| Financials | | | 11,001,901 | | | | — | | | | — | | | | 11,001,901 | |
| Health Care | | | 3,638,670 | | | | — | | | | — | | | | 3,638,670 | |
| Industrials | | | 1,851,242 | | | | — | | | | — | | | | 1,851,242 | |
| Information Technology | | | 8,584,718 | | | | — | | | | — | | | | 8,584,718 | |
| Materials | | | 2,562,900 | | | | — | | | | — | | | | 2,562,900 | |
| Telecommunication Services | | | 770,182 | | | | — | | | | — | | | | 770,182 | |
| Convertible Preferred Stocks | | | 593,312 | | | | — | | | | — | | | | 593,312 | |
| Corporate Bonds | | | — | | | | 2,938,279 | | | | — | | | | 2,938,279 | |
| Preferred Stocks | | | 3,789,913 | | | | — | | | | — | | | | 3,789,913 | |
| Warrants | | | 943,887 | | | | — | | | | — | | | | 943,887 | |
| Short-term Investments | | | 5,987,542 | | | | — | | | | — | | | | 5,987,542 | |
| | | | | | | | | | | | | | | $ | 52,195,229 | |
| | | | | | | | | | | | | | | | | |
| Marsico Global Fund | | | | | | | | | | | | | | | | |
| Common Stocks | | | | | | | | | | | | | | | | |
| Consumer Discretionary | | | 27,273,392 | | | | — | | | | — | | | | 27,273,392 | |
| Consumer Staples | | | 5,722,159 | | | | — | | | | — | | | | 5,722,159 | |
| Energy | | | 4,740,280 | | | | — | | | | — | | | | 4,740,280 | |
| Financials | | | 32,440,479 | | | | — | | | | — | | | | 32,440,479 | |
| Health Care | | | 6,672,116 | | | | — | | | | — | | | | 6,672,116 | |
| Industrials | | | 7,330,984 | | | | — | | | | — | | | | 7,330,984 | |
| Information Technology | | | 16,644,313 | | | | — | | | | — | | | | 16,644,313 | |
| Materials | | | 6,468,115 | | | | — | | | | — | | | | 6,468,115 | |
| Telecommunication Services | | | 3,613,882 | | | | — | | | | — | | | | 3,613,882 | |
| Preferred Stocks | | | 1,081,846 | | | | — | | | | — | | | | 1,081,846 | |
| Short-term Investments | | | 2,735,912 | | | | — | | | | — | | | | 2,735,912 | |
| | | | | | | | | | | | | | | $ | 114,723,478 | |
| | (b) | Expenses—The Funds are charged for those expenses that are directly attributable to each Fund, such as advisory and custodial fees. Expenses that are not directly attributable to a Fund are typically allocated among the Funds in proportion to their respective net assets and in some cases allocated based on other factors. The Funds’ expenses may be reduced by voluntary advisory fee waivers, brokerage credits and uninvested cash balances earning interest or credits. Such credits are included in “Less waiver of expenses and expenses paid indirectly” on the Statements of Operations. |
Brokerage commissions were paid to certain brokers which reduced certain transfer agent fees and expenses in the amount of $110 and $110 for the Focus Fund and Growth Fund, respectively, for the six-months ended March 31, 2010. The Funds also received earnings credits on certain cash account balances which reduced transfer agent fees and expenses in the amount of $755, $404, $325, $161, $14, and $40 for the Focus Fund, Growth Fund, 21st Century Fund, International Opportunities Fund, Flexible Capital Fund and Global Fund, respectively, for the six-months ended March 31, 2010. Brokerage commission credits and earnings credits are included in “Less waiver of expenses and expenses paid indirectly” on the Statements of Operations.
| | (c) | Federal Income Taxes—Each Fund intends to comply with the requirements of the Internal Revenue Code necessary to qualify as a regulated investment company and to make the requisite distributions of income to its shareholders which will be sufficient to relieve it from all or substantially all federal and state income taxes. Certain funds may utilize earnings and profits on redemption of shares as part of the dividends paid deduction. |
| | (d) | Distributions to Shareholders—Dividends from net investment income and net realized capital gains, if any, will be declared and paid at least annually. Distributions to shareholders are recorded on the ex-dividend date. Each Fund may periodically make reclassifications among certain of its capital accounts as a result of the timing and characterization of certain income and capital gains distributions determined in accordance with federal tax regulations, which may differ from GAAP. These reclassifications are due to differing treatment for items such as foreign currency transactions, net investment losses and investments in partnerships and REITs. |
| NOTES TO FINANCIAL STATEMENTS |
| | (e) | Foreign Currency Translation—The accounting records of the Funds are maintained in U.S. dollars. Values of securities denominated in foreign currencies are translated into U.S. dollars at 4:00 p.m. ET. Amounts related to the purchase and sale of foreign securities and investment income are translated at the rates of exchange prevailing on the respective dates of such transactions. |
Reported realized gains on foreign currency transactions arise from sales of portfolio securities, forward currency contracts, currency gains or losses realized between the trade and settlement dates on securities transactions, the difference between the amounts of dividends, interest, and foreign withholding taxes recorded on the Funds’ books, and the U.S. dollar equivalent of the amounts actually received or paid.
The Funds do not isolate that portion of the results of operations resulting from changes in foreign exchange rates on investments from the fluctuations arising from changes in market prices of securities held at fiscal year-end. Net unrealized appreciation or depreciation on investments and foreign currency translations arise from changes in the value of assets and liabilities, including investments in securities at period-end, resulting from changes in the exchange rates and changes in market prices of securities held.
| | (f) | Derivative Instruments — In March 2008, the FASB issued “Disclosure about Derivative Instruments and Hedging Activities” (the “Derivatives Statement”). The Derivatives Statement is effective for interim and annual periods beginning after November 15, 2008. The Derivatives Statement requires enhanced disclosures about the Funds’ derivative and hedging activities, including how such activities are accounted for and their effects on the Funds’ financial position, performance and cash flows. The Funds adopted the Derivatives Statement during fiscal year 2009. |
The Funds may enter into futures contracts and options on securities, financial indexes and foreign currencies, options on futures, forward contracts, interest rate swaps, credit default swaps and swap-related products. The Funds intend to use such derivative instruments primarily to hedge or protect from adverse movements in securities prices, currency rates or interest rates. The use of futures contracts and options may involve risks such as the possibility of illiquid markets or imperfect correlation between the value of the contracts and the underlying securities, or that the counterparty will fail to perform its obligations. The Funds did not hold any derivative or hedging positions as of March 31, 2010 and there was no use of derivatives by the Funds during the six-month period ended March 31, 2010.
Forward Currency Contracts — The Funds may enter into forward currency contracts to reduce their exposure to changes in foreign currency exchange rates on their foreign holdings and to lock in the U.S. dollar cost of firm purchase and sale commitments for securities denominated in foreign currencies. A forward currency contract is a commitment to purchase or sell a foreign currency at a future date at a negotiated forward rate. The gain or loss arising from the difference between the U.S. dollar cost of the original contract and the value of the foreign currency in U.S. dollars upon closing of such contract is included in net realized gain or loss from foreign currency transactions.
Forward currency contracts held by the Funds are fully collateralized by other securities. If held by the Funds, such collateral would be in the possession of the Funds’ custodian. The collateral would be evaluated daily to ensure its market value equals or exceeds the current market value of the corresponding forward currency contracts.
Foreign-denominated assets and forward currency contracts may involve more risks than domestic transactions, including currency risk, political and economic risk, regulatory risk and market risk. Risks may arise from the potential inability of a counterparty to meet the terms of a contract and from unanticipated movements in the value of foreign currencies relative to the U.S. dollar.
Futures Contracts — Futures contracts are marked to market daily and the resultant variation margin is recorded as an unrealized gain or loss. When a contract is closed, a realized gain or loss is recorded equal to the difference between the opening
| NOTES TO FINANCIAL STATEMENTS |
NOTES TO FINANCIAL STATEMENTS March 31, 2010 (Unaudited) (continued)
and closing value of the contract. Generally, open forward and futures contracts are marked to market (i.e., treated as realized and subject to distribution) for federal income tax purposes at fiscal year-end.
Options Contracts — The Funds may purchase and write (sell) put and call options on foreign and domestic stock indices, foreign currencies, and U.S. and foreign securities that are traded on a securities exchange or an over-the-counter market. These transactions are for hedging purposes or for the purpose of earning additional income. In addition, the Funds may enter into such transactions for cross-hedging purposes.
The risk associated with purchasing an option is that the Fund pays a premium whether or not the option is exercised. Additionally, the Fund bears the risk of loss of premium and change in market value should the counterparty not perform under the contract. Put and call options purchased are accounted for in the same manner as portfolio securities. The cost of securities acquired through the exercise of call options is increased by premiums paid. The proceeds from securities sold through the exercise of put options are decreased by the premiums paid.
When the Fund writes an option, the premium received by the Fund is recorded as a liability and is subsequently adjusted to the current market value of the option written. Premiums received from writing options that expire are recorded by the Fund on the expiration date as realized gains from option transactions. The difference between the premium and the amount paid on effecting a closing purchase transaction, including brokerage commissions, is also treated as a realized gain, or if the premium is less than the amount paid for the closing purchase transaction, as a realized loss. If a call option is exercised, the premium is added to the proceeds from the sale of the underlying security or currency in determining whether the Fund has realized a gain or loss. If a put option is exercised, the premium reduces the cost basis of the security or currency purchased by the Fund. In writing an option, the Fund bears the market risk of an unfavorable change in the price of the security or currency underlying the written option. Exercise of an option written by the Fund could result in the Fund selling or buying a security or currency at a price different from the current market value.
| | (g) | Trustees’ Deferred Fee Plan— Effective February 1, 2000, the Board of Trustees adopted the Marsico Investment Fund Deferred Fee Plan (the “Deferred Fee Plan”), amended and restated as of December 30, 2005, which allows the Trustees to defer the receipt of all or a portion of their compensation received from the Funds. Any deferred fees are credited to accounts established on behalf of the Trustees into the Funds as directed by each Trustee. The amounts credited to these accounts increase or decrease in accordance with the performance of the Funds selected by the Trustees. The market value of the deferred account balances as of March 31, 2010 is shown on the Statements of Assets and Liabilities as part of an asset account, “Prepaid expenses and other assets,” and a liability account, “Accrued trustees’ fees.” Additionally, the fluctuation of the account balances due to the Funds’ performance is recorded by the Funds as unrealized appreciation/(depreciation) which is shown as part of “Net unrealized appreciation on investments and foreign currency translations” on the Statements of Assets and Liabilities and as compensation expense which is shown as part of the expense account “Trustees’ fees and expenses” on the Statements of Operations. Fees earned and deferred by the Trustees for the six-months ended March 31, 2010 are also included in “Trustees’ fees and expenses” on the Statements of Operations. Amounts credited to the Deferred Fee Plan will be deferred until distributed in accordance with the Deferred Fee Plan. Unrealized appreciation/depreciation of Fund shares held in the Deferred Fee Plan is subject to the Funds’ expense reimbursement agreement with the Adviser. |
| | (h) | Redemption Fee—A 2.00% redemption fee is retained by the Funds to offset transaction costs and other expenses associated with short-term investing. The fee is imposed on certain redemptions or exchanges of shares held 30 days or less from their purchase date. Redemption fees are recorded by the Funds as a reduction of shares redeemed and as a credit to paid-in-capital. For the six-months ended March 31, 2010, the Focus Fund, Growth Fund, 21st Century Fund, International Opportunities Fund, Flexible Capital Fund, and Global Fund received $6,994, $82,659, $4,897, $23,447, $2,022 and $4,027, respectively, in redemption fees. |
| | (i) | Other—Investment transactions are accounted for on a trade date basis. Each Fund determines the gain or loss realized from the investment transactions by comparing the original cost of the security lot sold with the net sale proceeds. Dividend income |
| NOTES TO FINANCIAL STATEMENTS |
is recognized on the ex-dividend date. Certain dividends from foreign securities will be recorded as soon as the Trust is informed of the dividend if such information is obtained subsequent to the ex-dividend date. Interest income is recognized on an accrual basis.
| | (j) | Indemnifications—In the normal course of business, the Funds enter into contracts that contain provisions indemnifying other parties against specified potential liabilities. Each Fund’s maximum exposure under these arrangements is unknown as this would involve future claims that may be made against the Fund that have not yet occurred. However, based on experience, the Funds expect the risk of loss to be remote. |
| 3. | Investment Advisory Agreement and Transactions With Affiliates |
Each Fund has an agreement with the Adviser to furnish investment advisory services to the Funds. Under the terms of these agreements, the Adviser is compensated for managing the Focus Fund and the Growth Fund at the rate of 0.85% per year of average daily net assets up to $3 billion in each Fund, and 0.75% per year of average daily net assets exceeding $3 billion in each Fund; and at a rate of 0.85% of the average daily net assets of the 21st Century Fund, the International Opportunities Fund, the Flexible Capital Fund, and the Global Fund. The Adviser has voluntarily agreed to limit the total expenses of each Fund (excluding interest, taxes, acquired fund fees and expenses, litigation, brokerage and extraordinary expenses) to an annual rate of 1.60% of the average net assets of the Focus Fund, the International Opportunities Fund and the Global Fund, 1.50% of the average net assets of the Growth Fund and the 21st Century Fund, and 0.75% of the average net assets of the Flexible Capital Fund until January 31, 2011. This expense limitation and fee waiver agreement is voluntary and may be terminated at any time after January 31, 2011. Prior to January 1, 2009, the Adviser’s voluntary expense limitation agreement relating to the Global Fund limited total expenses of the Global Fund (excluding interest, taxes, acquired fund fees and expenses, litigation, brokerage and extraordinary expenses) to an annual rate of 0.75% of the Global Fund’s average net assets.
The Adviser is entitled to reimbursement from a Fund of any fees waived pursuant to this arrangement if such reimbursements do not cause a Fund to exceed current expense limitations and the reimbursement is made within three years after the year in which the Adviser incurred the expense. As of March 31, 2010, reimbursements that may potentially be made by the Flexible Capital Fund to the Adviser are $922,322, which expire between 2010 and 2013.
The Adviser waived fees and reimbursed the Global Fund in the total amount of $944,636 for Fund expenses attributable to the period from the Fund’s inception on June 29, 2007 through December 31, 2008. During that period, Global Fund expenses were limited to an annual rate of 0.75% of average net assets. The Adviser has elected not to seek recoupment from the Global Fund in the future for fees waived or expenses reimbursed during that period. The Adviser has returned to the Global Fund $31,527 representing all recoupments received from the Fund for any fee waivers or expense reimbursements made by the Adviser before January 1, 2009.
For the period from January 1, 2009 through March 31, 2010, during which Global Fund expenses were limited to an annual rate of 1.60% of average net assets, $7,586 in fees was waived by the Adviser and subsequently recouped. As of March 31, 2010, there are $0 in recoupments remaining that the Adviser may receive from the Global Fund for any waivers of fees or reimbursement of Fund expenses by the Adviser during this period.
| 4. | Service and Distribution Plan |
The Funds have adopted a Service and Distribution Plan (the “Plan”) pursuant to Rule 12b-1 under the 1940 Act. The Plan authorizes payments by the Funds in connection with the distribution of their shares at an annual rate, as determined from time to time by the Board of Trustees, of up to 0.25% of a Fund’s average daily net assets. The Adviser may, out of its own resources and at its sole discretion, make certain payments on behalf of the Plan for expenses incurred by a Fund for distribution of Fund shares and related services.
| NOTES TO FINANCIAL STATEMENTS |
NOTES TO FINANCIAL STATEMENTS March 31, 2010 (Unaudited) (continued)
| 5. | Investment Transactions |
The aggregate purchases and sales of securities, excluding short-term investments, for the Funds for the six-months ended March 31, 2010, were as follows:
| | | | | | | | | 21st | | | International | | | Flexible | | | | |
| | | Focus | | | Growth | | | Century | | | Opportunities | | | Capital | | | Global | |
| (Amounts in thousands) | | Fund | | | Fund | | | Fund | | | Fund | | | Fund | | | Fund | |
| Purchases | | $ | 886,535 | | | $ | 337,912 | | | $ | 410,655 | | | $ | 302,831 | | | $ | 41,869 | | | $ | 60,807 | |
| Sales | | $ | 1,020,303 | | | $ | 608,882 | | | $ | 569,364 | | | $ | 325,970 | | | $ | 31,148 | | | $ | 65,770 | |
There were no purchases or sales of U.S. government securities, excluding short-term investments.
| 6. | Federal Income Tax Information |
The Focus Fund, Growth Fund, 21st Century Fund and International Opportunities Fund adopted the provisions of Accounting for Uncertainty in Income Taxes (the “Income Tax Statement”) on October 1, 2007. The Flexible Capital Fund and Global Fund adopted the Income Tax Statement at their respective inception dates. The Income Tax Statement requires an evaluation of tax positions taken (or expected to be taken) in the course of preparing a Fund’s tax returns to determine whether these positions meet a “more-likely-than-not” standard that, based on the technical merits, have a more than fifty percent likelihood of being sustained by a taxing authority upon examination. A tax position that meets the “more-likely-than-not” recognition threshold is measured to determine the amount of benefit to recognize in the financial statements. The Funds recognize interest and penalties, if any, related to unrecognized tax benefits as income tax expense in the Statements of Operations.
The Income Tax Statement requires management of the Funds to analyze all open tax years, fiscal years 2006-2009 as defined by IRS statute of limitations for all major jurisdictions, including federal tax authorities and certain state tax authorities. As of and during the six-months ended March 31, 2010, the Funds did not have a liability for any unrecognized tax benefits. The Funds have no examination in progress and are not aware of any tax positions for which it is reasonably possible that the total amounts of unrecognized tax benefits will significantly change in the next twelve months.
At March 31, 2010 gross unrealized appreciation and depreciation of investments, based on cost for federal income tax purposes were as follows:
| | | | | | | | | 21st | | | International | | | Flexible | | | | |
| | | Focus | | | Growth | | | Century | | | Opportunities | | | Capital | | | Global | |
| (Amounts in thousands) | | Fund | | | Fund | | | Fund | | | Fund | | | Fund | | | Fund | |
| | | | | | | | | | | | | | | | | | | | | | | | | |
| Cost of investments | | $ | 1,643,525 | | | $ | 769,780 | | | $ | 706,938 | | | $ | 379,409 | | | $ | 45,762 | | | $ | 94,608 | |
| | | | | | | | | | | | | | | | | | | | | | | | | |
| Gross unrealized appreciation | | $ | 459,421 | | | $ | 275,603 | | | $ | 173,203 | | | $ | 69,408 | | | $ | 6,455 | | | $ | 21,552 | |
| | | | | | | | | | | | | | | | | | | | | | | | | |
| Gross unrealized depreciation | | | (28,819 | ) | | | (10,119 | ) | | | (15,545 | ) | | | (13,884 | ) | | | (22 | ) | | | (1,437 | ) |
| | | | | | | | | | | | | | | | | | | | | | | | | |
| Net unrealized appreciation | | | | | | | | | | | | | | | | | | | | | | | | |
| (depreciation) on investments | | $ | 430,602 | | | $ | 265,484 | | | $ | 157,658 | | | $ | 55,524 | | | $ | 6,433 | | | $ | 20,115 | |
The difference between cost amounts for financial statement and federal income tax purposes is due primarily to wash sale loss deferrals and passive foreign investment companies (“PFICs”).
The 21st Century Fund, International Opportunities Fund, and Flexible Capital Fund had realized currency losses (in thousands) from transactions between November 1, 2008 and September 30, 2009 of $203, $5 and $9, respectively. Post-October currency losses are treated as arising in the Fund’s next fiscal year.
The Focus Fund, Growth Fund, 21st Century Fund, International Opportunities Fund, Flexible Capital Fund, and Global Fund had realized capital losses (in thousands) from transactions between November 1, 2008 and September 30, 2009 of $378,389, $109,462, $543,621, $113,544, $1,722 and $24,572, respectively. Post-October capital losses are treated as arising in the Fund’s next fiscal year.
| NOTES TO FINANCIAL STATEMENTS |
At September 30, 2009, the Focus Fund, Growth Fund, 21st Century Fund, International Opportunities Fund, Flexible Capital Fund and Global Fund had accumulated capital loss carryforwards (in thousands) of $92,393, $250,019, $287,847, $99,570, $3,310, and $17,393 expiring in 2017, respectively. To the extent that a fund may realize future net capital gains, those gains will be offset by any of its unused capital loss carryforward. Future capital loss carryover utilization in any given year may be subject to Internal Revenue Code limitations.
As of September 30, 2009, the components of accumulated earnings (deficit) on a tax basis were as follows:
| | | | | | | | | 21st | | | International | | | Flexible | | | | |
| | | Focus | | | Growth | | | Century | | | Opportunities | | | Capital | | | Global | |
| (Amounts in thousands) | | Fund | | | Fund | | | Fund | | | Fund | | | Fund | | | Fund | |
| | | | | | | | | | | | | | | | | | | |
| Undistributed ordinary | | | | | | | | | | | | | | | | | | |
| income (deficit) | | $ | 2,877 | | | $ | 4,598 | | | $ | (312 | ) | | $ | 1,975 | | | $ | 989 | | | $ | 713 | |
| | | | | | | | | | | | | | | | | | | | | | | | | |
| Undistributed long-term | | | | | | | | | | | | | | | | | | | | | | | | |
| capital gains | | | — | | | | — | | | | — | | | | — | | | | — | | | | — | |
| Tax accumulated earnings | | | 2,877 | | | | 4,598 | | | | (312 | ) | | | 1,975 | | | | 989 | | | | 713 | |
| | | | | | | | | | | | | | | | | | | | | | | | | |
| Accumulated Capital and | | | | | | | | | | | | | | | | | | | | | | | | |
| Other Losses | | | (470,782 | ) | | | (359,481 | ) | | | (831,671 | ) | | | (213,119 | ) | | | (5,041 | ) | | | (41,965 | ) |
| | | | | | | | | | | | | | | | | | | | | | | | | |
| Unrealized appreciation | | | | | | | | | | | | | | | | | | | | | | | | |
| (depreciation) on investments | | | 323,222 | | | | 216,470 | | | | 173,874 | | | | 62,119 | | | | 4,959 | | | | 22,975 | |
| | | | | | | | | | | | | | | | | | | | | | | | | |
| Total accumulated | | | | | | | | | | | | | | | | | | | | | | | | |
| earnings (deficit) | | $ | (144,683 | ) | | $ | (138,413 | ) | | $ | (658,109 | ) | | $ | (149,025 | ) | | $ | 907 | | | $ | (18,277 | ) |
Undistributed ordinary income (deficit) consists of net investment income, short-term capital gains and timing differences related to post-October currency losses, deferred Trustees’ compensation and PFICs.
The tax character of distributions paid during the fiscal years ended September 30, 2009 and 2008 were as follows:
| (Amounts in thousands) | | 2009 | | | 2008 | |
| | | Ordinary | | | Tax Return | | | Long-Term | | | Ordinary | | | Long-Term | |
| Fund | | Income | | | of Capital | | | Capital Gains | | | Income | | | Capital Gains | |
| Focus Fund | | $ | 20,688 | | | $ | — | | | $ | 373 | | | $ | 43,537 | | | $ | 372,506 | |
| Growth Fund | | | 9,933 | | | | — | | | | — | | | | — | | | | 97,785 | |
| 21st Century Fund | | | 2,148 | | | | 2,082 | | | | — | | | | 85,691 | | | | 23,339 | |
| International Opportunities Fund | | | 6,419 | | | | — | | | | — | | | | 42,800 | | | | 53,336 | |
| Flexible Capital Fund | | | 116 | | | | — | | | | — | | | | 1,395 | | | | 43 | |
| Global Fund | | | 734 | | | | — | | | | — | | | | 998 | | | | 1 | |
The tax character of dividends paid may differ from that shown in the Statements of Changes in Net Assets due to short-term gains being treated as ordinary income for tax purposes.
In May 2009, the FASB issued “Subsequent Events” (the “Subsequent Events Statement”), a statement outlining disclosure requirements related to certain events occurring after the date of financial statements. The Subsequent Events Statement is effective for interim and annual periods after June 15, 2009. The Funds adopted the Subsequent Events Statement during fiscal year 2009. Events and transactions have been evaluated by management for subsequent events. Management has determined that there were no material events that would require disclosure in the Funds’ financial statements.
EXPENSE EXAMPLE For the six-months ended March 31, 2010 (Unaudited)
As a shareholder of the Marsico Funds (the “Funds”), you incur two types of costs: (1) transaction costs, including redemption fees on certain redemptions; and (2) ongoing costs, including management fees, distribution (12b-1) fees, and other Fund expenses. This Example is intended to help you understand your ongoing costs (in dollars) of investing in the Funds and to compare these costs with the ongoing costs of investing in other mutual funds.
The Example is based on an investment of $1,000 invested at the beginning of the period and held for the entire period from October 1, 2009 to March 31, 2010 (the “period”).
Actual Expenses
The first line of the table below provides information about actual account values and actual expenses. You may use the information in this line, together with the amount you invested, to estimate the expenses you paid over the period. Simply divide your account value by $1,000 (for example, an $8,600 account value divided by $1,000 equals 8.6), then multiply the result by the number in the first line under the heading entitled “Expenses paid for the six-month period ended March 31, 2010” to estimate the expenses you paid on your account during the period.
Hypothetical Example for Comparison Purposes
The second line of the table below provides information about hypothetical account values and hypothetical expenses based on the Funds’ actual expense ratios and an assumed rate of return of 5% per year before expenses, which is not the actual return of any of the Funds. The hypothetical account values and expenses may not be used to estimate the actual ending account balance or expenses you paid for the period. You may use this information to compare the ongoing costs of investing in the Funds and other funds. To do so, compare this 5% hypothetical example with the 5% hypothetical examples that appear in the shareholder reports of other funds.
Please note that the expenses shown in the table are meant to highlight your ongoing costs only and do not reflect any transactional costs, such as redemption fees. Therefore, the second line of the table is useful in comparing the ongoing costs only, and will not help you determine the relative total costs of owning different funds. In addition, if these transactional costs were included, your costs could have been higher.
| Expenses Paid During the Period | Beginning | Ending | Expenses paid for the |
| | | | account value | account value | six-month period ended |
| | | | October 1, 2009 | March 31, 2010 | March 31, 2010(1) |
| FOCUS FUND | | | | | |
| Actual Example | $1,000.00 | $1,127.30 | $7.06 |
| Hypothetical Example, assuming a 5%return before expenses | $1,000.00 | $1,018.36 | $6.70 |
| | | | | | |
| GROWTH FUND | | | | | |
| Actual Example | $1,000.00 | $1,126.60 | $7.17 |
| Hypothetical Example, assuming a 5% return before expenses | $1,000.00 | $1,018.26 | $6.80 |
| | | | | | |
21ST CENTURY FUND | | | | | |
| Actual Example | $1,000.00 | $1,112.50 | $7.32 |
| Hypothetical Example, assuming a 5% return before expenses | $1,000.00 | $1,018.07 | $6.99 |
| | | | |
| INTERNATIONAL OPPORTUNITIES FUND | | | |
| Actual Example | $1,000.00 | $1,022.50 | $7.56 |
| Hypothetical Example, assuming a 5% return before expenses | $1,000.00 | $1,017.52 | $7.55 |
| | | |
| FLEXIBLE CAPITAL FUND | | |
| Actual Example | $1,000.00 | $1,152.40 | $4.02 |
| Hypothetical Example, assuming a 5% return before expenses | $1,000.00 | $1,021.26 | $3.78 |
| | | | | | |
| GLOBAL FUND | | | | | |
| Actual Example | $1,000.00 | $1,100.30 | $7.90 |
| Hypothetical Example, assuming a 5% return before expenses | $1,000.00 | $1,017.48 | $7.58 |
| (1) | Expenses are equal to the Funds’ annualized expense ratios (1.332% for the Focus Fund, 1.352% for the Growth Fund, 1.390% for the 21st Century Fund, 1.500% for the International Opportunities Fund, 0.750% for the Flexible Capital Fund, and 1.508% for the Global Fund), multiplied by the average account value over the period, multiplied by 182/365 (to reflect the six-month period). |
| CONSIDERATION OF INVESTMENT ADVISORY AGREEMENTS |
CONSIDERATION OF INVESTMENT ADVISORY AGREEMENTS (Unaudited)
At a meeting of the Board of Trustees of the Trust held on November 11, 2009 the Trustees, by a unanimous vote (including a separate vote of those Trustees who are not “interested persons” (as the term is defined in the 1940 Act) (the “Independent Trustees”), approved the renewal of the Investment Advisory and Management Agreements (the “Agreements”) for the Focus Fund, Growth Fund, 21st Century Fund, International Opportunities Fund, Flexible Capital Fund and Global Fund. In advance of the meeting, the Independent Trustees requested and received extensive materials from the Adviser to assist them in considering the renewal of the Agreements for the Focus Fund, Growth Fund, 21st Century Fund, International Opportunities Fund, Flexible Capital Fund and Global Fund. The materials provided by the Adviser contained information with respect to the factors noted below, including detailed comparative information relating to the performance, advisory fees and other expenses of the Funds, other funds sub-advised by the Adviser and non-fund advisory accounts of the Adviser. The materials also included comparisons of the Funds with other funds and non-fund accounts of similar size and investment objectives in terms of performance, fees and other expenses, as well as the performance of each Fund versus its benchmark. In addition, the Adviser provided information regarding its overall expenses and profitability, as well as estimates of its costs and profitability relating to managing the Funds.
In addition to the materials prepared specifically for contract review analysis, on an ongoing basis the Trustees receive information and reports from the Adviser and other service providers to the Funds on investment performance as well as operational, compliance and other matters.
The Trustees engaged in a detailed discussion of the materials with management of the Adviser. The Independent Trustees then met separately with independent counsel to the Independent Trustees for a full review of the materials. Following this session, the full Board reconvened and approved the continuation of the Agreements for the Focus Fund, Growth Fund, 21st Century Fund, International Opportunities Fund, Flexible Capital Fund and Global Fund.
Discussion of Factors Considered
In connection with the consideration of the Agreements, the Trustees, including the Independent Trustees, requested and received from the Adviser, and reviewed, a wide variety of information, including information about (1) the nature, extent, and quality of the services provided by the Adviser; (2) the investment performance of the Funds and the Adviser; (3) the costs of the services to be provided and profits realized by the Adviser and its affiliates from the relationship with the Funds; (4) the extent to which economies of scale may be realized as the Funds grow; and (5) whether fee levels reflect these economies of scale for the benefit of Fund investors; as well as other relevant considerations such as the management fees and expense ratios of each Fund; potential fall-out benefits to the Adviser from its relationship to each Fund; and other general information about the Adviser. The following is a summary of the Board’s discussion and views regarding these factors.
| 1. | Nature, Extent, and Quality of Services. |
The Independent Trustees considered the nature, quality and extent of the services performed by the Adviser, including portfolio management, supervision of Fund operations and compliance and regulatory filings and disclosures to shareholders, general oversight of other service providers, coordination of Fund marketing initiatives, review of Fund legal issues, assisting the Trustees in that capacity and other services. The Independent Trustees concluded that the services are extensive in nature, that the Adviser effectively manages the outsourcing by the Funds to other service providers and that the Adviser consistently delivered a high level of service.
| 2. | Investment Performance of the Funds and Adviser. |
The Independent Trustees considered short-term and long-term investment performance for each Fund over various periods of time as compared to both relevant equity indices and the performance of such Fund’s Lipper, Inc. peer group universe. The peer group information may not be fully comparable as it is based on data from the peer funds’ most recent available fiscal year, which could have ended before all or part of the market downturn. The Funds’ information, in contrast, is current information fully reflecting current markets. The Independent Trustees also considered that the Funds are typically managed in a tax-efficient manner, which could also make peer group performance information not comparable to the Funds. The Independent Trustees also noted the
| CONSIDERATION OF INVESTMENT ADVISORY AGREEMENTS |
CONSIDERATION OF INVESTMENT ADVISORY AGREEMENTS (Unaudited) (continued)
Adviser’s continued investment in research, despite a reduction in fee revenue due to a decline in Fund assets. The Independent Trustees concluded that the Adviser was delivering satisfactory performance results consistent with the long-term investment strategies being pursued by the Funds. The Independent Trustees also noted that the satisfactory investment performance delivered by the Adviser to the Funds appeared to be consistent with the performance delivered for other clients of the Adviser.
| 3. | Costs of Services and Profits Realized by the Adviser. |
(a) Costs of Services to Funds: Fees and Expenses. The Independent Trustees considered each Fund’s management fee rates and expense ratios relative to industry averages for such Fund’s benchmark category and the advisory fees charged by the Adviser to other sub-advised funds and non-fund clients, including information regarding expense limitation commitments from the Adviser, and the breakpoints for certain Fund’s advisory services. The Independent Trustees noted that the mix of services under the Agreements are much more extensive than those under the Adviser’s advisory agreements for sub-advised funds as well as non-fund clients. While the Independent Trustees noted that the investment advisory fees paid by the Funds are generally in the upper quartile of their peer groups, they were cognizant that it is difficult to know whether the services provided by advisers to peer funds are as extensive as those provided by the Adviser to the Funds. The Independent Trustees noted actions taken by the Adviser to reduce Fund expenses, including that the Adviser had waived fees and absorbed expenses from time to time, and that some of those expenditures were not expected to be recouped. The Independent Trustees concluded that the investment advisory fees are acceptable based upon the qualifications, experience, reputation, and performance of the Adviser and the low-to-moderate overall expense ratios of the Funds.
(b) Profitability and Costs of Services to Adviser. The Independent Trustees considered the Adviser’s overall profitability and costs and a pro forma estimate of the Adviser’s profitability and costs if the Funds constituted the Adviser’s only assets under management. The Independent Trustees took into consideration that the Adviser’s fee revenue from the Funds had declined as Fund assets had declined, but that the Adviser had not reduced services or investment personnel as a result. The Independent Trustees also considered whether the amount of profit is a fair entrepreneurial profit for the management of each Fund, and noted that the Adviser has substantially increased its resources devoted to Fund matters in response to regulatory requirements enacted during the last few years and Fund policies and procedures that were adopted or enhanced in late 2004 and thereafter. The Independent Trustees concluded that the Adviser’s profitability was at an acceptable level, particularly in light of the quality of the services being provided to the Funds.
| 4. | Extent of Economies of Scale as Funds Grow. |
The Independent Trustees considered whether there have been economies of scale with respect to the management of each Fund and whether such Fund has appropriately benefited from any economies of scale. The Independent Trustees noted that economies of scale may develop for certain Funds as their assets increase and their Fund-level expenses decline as a percentage of assets, but that Fund-level economies of scale may not necessarily result in Adviser-level economies of scale. The written materials presented to the Independent Trustees indicate that the expenses incurred by the Adviser relating to management of the Funds have increased substantially in recent years as a percentage of management fees and that the asset levels of certain Funds had decreased over the past year. The Independent Trustees agreed that it was possible that Adviser-level expenses incurred in managing the Funds eventually may level off or decline as a percentage of management fees, if the assets of the Funds grow beyond certain thresholds.
| 5. | Whether Fee Levels Reflect Economies of Scale. |
The Independent Trustees also considered whether the management fee rate is reasonable in relation to the asset size of each Fund and any economies of scale that may exist. The Independent Trustees noted that, effective November 11, 2004, at the behest of the Independent Trustees, breakpoints had been introduced for the two larger Funds, the Focus Fund and the Growth Fund, for assets in excess of $3 billion in each Fund. Under the breakpoints, investment management fees are 0.85% per year of average daily net assets up to $3 billion in each of those two Funds, and 0.75% per year of average daily net assets exceeding $3 billion in each Fund. The Independent Trustees also noted the fee waivers adopted under which the Adviser voluntarily agreed to temporarily limit
| CONSIDERATION OF INVESTMENT ADVISORY AGREEMENTS |
fund expenses including advisory fees for the Flexible Capital Fund to 0.75% on an annual basis until at least January 31, 2011, subject to possible future recoupment of previously waived fees or other expenses under certain conditions. Given the decline in assets in the Funds over the past year, the Independent Trustees did not consider there to have been economies of scale realized. The Independent Trustees agreed to continue to monitor whether any additional breakpoints for any of the Funds may be appropriate in the future.
| 6. | Other Relevant Considerations. |
(a) Adviser Personnel and Methods. The Independent Trustees considered information about the financial condition of the Adviser provided and the Adviser’s stated commitment to maintaining a high quality investment management operation, including in the areas of investment analysis, compliance, and operations. They also considered the size, education and experience of the Adviser’s staff. There was also a review of the Adviser’s “top down” economic analysis with “bottom up” stock selection. This two-pronged approach, considering both macro-economic factors, such as interest rates, inflation and the global competitive landscape, and seeking to identify individual companies with unique market presence and potential earnings growth that may not be recognized by the market at-large, was regarded by the Trustees as consistent with the Funds’ disclosure documents and, therefore, investor expectation. The Adviser’s corporate culture and investment team structure were further viewed as facilitating the recruitment, training and retention of portfolio managers and other research and management personnel.
(b) Other Benefits to the Adviser. The Independent Trustees also considered the character and amount of other incidental benefits received by the Adviser and its affiliates from its association with the Funds. The Independent Trustees concluded that potential “fall-out” benefits that the Adviser may receive, such as greater name recognition or increased ability to obtain research or brokerage services, appear to be reasonable, and may in some cases benefit the Funds.
Conclusions
In considering the Agreements, the Independent Trustees did not identify any factor as all-important or all-controlling and instead considered these factors collectively in light of each Fund’s surrounding circumstances. Based on this review, it was the judgment of the Independent Trustees that shareholders had received satisfactory absolute and relative performance at reasonable fees and, therefore, re-approval of the Agreements was in the best interests of each Fund and its shareholders. As a part of their decision-making process, the Independent Trustees noted that the Adviser has managed the Funds since their inception, and the Independent Trustees believe that a long-term relationship with a capable, conscientious adviser is in the best interests of the Funds and their shareholders. The Independent Trustees considered, generally, that shareholders invested in a Fund knowing that the Adviser managed that Fund and knowing its investment management fee schedule. As such, the Independent Trustees considered, in particular, whether the Adviser managed each Fund in accordance with its investment objectives and policies as disclosed to shareholders. The Independent Trustees concluded that each Fund was managed by the Adviser consistent with its investment objectives and policies. Additionally, as part of its deliberations, the Board also considered and relied upon the information about the Funds and the Adviser that had been provided to them throughout the year in connection with their regular Board meetings at which they engage in the ongoing oversight of the Funds and their operations.
Upon conclusion of their review and discussion, the Independent Trustees unanimously agreed the Agreements for each of the Funds were appropriate.
OTHER INFORMATION (Unaudited)
Proxy Voting Guidelines
The Funds exercise the voting rights associated with the securities held by the Funds under the proxy voting policy of the Funds. A description of those policies and procedures of the Funds and a record of the Funds’ proxy votes for the one-year period ended June 30, 2009 are available without charge, upon request, by calling 888-860-8686. It is also available on the Securities and Exchange Commission’s website at www.sec.gov.
Quarterly Filing of Portfolio Holdings
The Funds will file their complete schedule of investments with the SEC for the first and third quarters of each fiscal year on Form N-Q. The Funds’ Form N-Q will be available (i) on the SEC’s Website at www.sec.gov; (ii) at the SEC’s Public Reference Room; and (iii) by calling 800-SEC-0330.
The Marsico Investment Fund
UMB Distribution Services, LLC, Distributor
P.O. Box 3210, Milwaukee, WI 53201-3210
www.marsicofunds.com ● 888.860.8686
©2010 MARSICO CAPITAL MANAGEMENT, LLC
Not authorized for distribution unless preceded or accompanied by an effective Marsico Funds prospectus.
The ticker symbols on page one are fictitious and do not refer to existing securities.
| | Not applicable to semi-annual reports. |
| Item 3. | Audit Committee Financial Expert |
| | Not applicable to semi-annual reports. |
| Item 4. | Principal Accountant Fees and Services |
| | Not applicable to semi-annual reports. |
| Item 5. | Audit Committee of Listed Registrants |
| Item 6. | Schedule of Investments |
| | The schedule of investments in securities of unaffiliated issuers is included as part of the report to shareholders filed under Item 1. |
| Item 7. | Disclosure of Proxy Voting Policies and Procedures for Closed-End Management Investment Companies |
| Item 8. | Portfolio Managers of Closed-End Management Investment Companies |
| Item 9. | Purchases of Equity Securities by Closed-End Management Investment Company and Affiliated |
| Item 10. | Submission of Matters to a Vote of Security Holders |
| Item 11. | Controls and Procedures. |
(a) The registrant's principal executive officer and principal financial officer have concluded that the registrant's disclosure controls and procedures (as defined in Rule 30a-3(c) under the Investment Company Act of 1940, as amended) are effective based on their evaluation of these disclosure controls and procedures within 90 days of the filing date of this report on Form N-CSR.
(b) There were no changes in the registrant's internal control over financial reporting (as defined in Rule 30a-3(d) under the Investment Company Act of 1940, as amended) that occurred during the second fiscal quarter of the period covered by this report that has materially affected, or is reasonably likely to materially affect, the registrant's internal control over financial reporting.
(a)(1) Code of Ethics
Not applicable to semi-annual reports.
(a)(2) Certification for each principal executive and principal financial officer of the registrant as required by Rule 30a-2(a) under the Act (17 CFR 270.30a-2(a)) – Filed as an attachment to this filing.
(a)(3) Any written solicitation to purchase securities under Rule 23c-1 under the Investment Company Act of 1940, as amended, that was sent or given during the period covered by the report by or on behalf of the registrant to 10 or more persons.
Not applicable.
(b) Certifications required by Rule 30a-2(b) under the Act (17 CFR 270.30a-2(b)), Rule 13a-14(b) or Rule 15d-14(b) under the Exchange Act (17 CFR 240.13a-14(b) or 240.15d-14(b)), and Section 1350 of Chapter 63 of Title 18 of the United States Code (18 U.S.C. 1350) – Filed as an attachment to this filing.
SIGNATURES
Pursuant to the requirements of the Securities Exchange Act of 1934 and the Investment Company Act of 1940, the registrant has duly caused this report to be signed on its behalf by the undersigned, thereunto duly authorized.
The Marsico Investment Fund
By: /s/ Christopher J. Marsico
Christopher J. Marsico,
Executive Vice President and Chief Operating Officer
Date: May 24, 2010
Pursuant to the requirements of the Securities Exchange Act of 1934 and the Investment Company Act of 1940, this report has been signed below by the following persons on behalf of the registrant and in the capacities and on the dates indicated.
By: /s/ Christopher J. Marsico
Christopher J. Marsico,
Executive Vice President and Chief Operating Officer
Date: May 24, 2010
By: /s/ Neil L. Gloude
Neil L. Gloude,
Vice President, Secretary and Treasurer
Date: May 24, 2010