UNITED STATES
SECURITIES AND EXCHANGE COMMISSION
Washington, D.C. 20549
FORM N-CSR
CERTIFIED SHAREHOLDER REPORT OF REGISTERED MANAGEMENT
INVESTMENT COMPANIES
Investment Company Act file number: 811-8399
PIMCO Variable Insurance Trust
(Exact name of registrant as specified in charter)
840 Newport Center Drive, Newport Beach, CA 92660
(Address of principal executive offices)
John P. Hardaway
Treasurer
PIMCO Funds
840 Newport Center Drive
Newport Beach, CA 92660
(Name and address of agent for service)
Copies to:
Brendan Fox
Dechert LLP
1775 I Street, N.W.
Washington, D.C. 20006
Registrant’s telephone number, including area code: (949) 720-4761
Date of fiscal year end: December 31
Date of reporting period: January 1, 2003–June 30, 2003
Form N-CSR is to be used by management investment companies to file reports with the Commission not later than 10 days after the transmission to stockholders of any report that is required to be transmitted to stockholders under Rule 30e-1 under the Investment Company Act of 1940 (17 CFR 270.30e-1). The Commission may use the information provided on Form N-CSR in its regulatory, disclosure review, inspection, and policymaking roles.
A registrant is required to disclose the information specified by Form N-CSR, and the Commission will make this information public. A registrant is not required to respond to the collection of information contained in Form N-CSR unless the Form displays a currently valid Office of Management and Budget (“OMB”) control number. Please direct comments concerning the accuracy of the information collection burden estimate and any suggestions for reducing the burden to Secretary, Securities and Exchange Commission, 450 Fifth Street, NW, Washington, DC 20549-0609. The OMB has reviewed this collection of information under the clearance requirements of 44 U.S.C. § 3507.
Item 1. Reports to Stockholders.
The following is a copy of the report transmitted to stockholders pursuant to Rule 30e-1 under the Act (17 CFR 270.30e-1).
P I M C O PIMCO VARIABLE INSURANCE TRUST SHORT-TERM PORTFOLIO ADMINISTRATIVE CLASS
SEMI-ANNUAL REPORT June 30, 2003 |
Contents
| | | Fund Summary
| | Schedule of Investments
|
Short-Term Portfolio (Administrative Class) | | 2 | | 7 |
Chairman’s Letter
Dear PIMCO Variable Insurance Trust Shareholder:
Financial assets gained during the first half of 2003 amid a revival of risk appetites as anxiety about the war in Iraq faded. Assets that generally benefit from economic growth, such as stocks, corporate bonds and emerging market debt, fared the best year-to-date as investors returned to these sectors in anticipation of a recovery in the second half of 2003. Reflationary forces that investors expected to fuel a rebound included federal tax cuts and a weak dollar, as well as low borrowing rates that eased the burden of high personal and corporate indebtedness. Low mortgage rates kept refinancings booming in the second quarter and put more money in consumers’ pockets.
U.S. Treasuries lagged their riskier counterparts but still enjoyed a modest rally. Yields fell to levels not seen in 45 years early in the second quarter before bouncing off their lows in June as hopes for recovery increased. The yield on the benchmark 10-year Treasury closed the six-month period 0.30% lower to 3.51%, after nearing 3% earlier in the period. Buyers were encouraged that inflation would remain tame amid low capacity utilization and weak employment growth. Asian central banks bought U.S. Treasuries to limit the rise in their currencies versus the dollar in an effort to protect their export industries. In June, the Federal Reserve cut the federal funds rate by 0.25% to 1%, its 13th easing since 2001, in an effort to boost the economy and ward off deflation. Although the cut was less than expected, the Fed suggested that rates would stay low until deflation risks abated.
On the following pages you will find specific details as to the Portfolio’s total return investment performance and a discussion of those factors that affected performance.
We appreciate the trust you have placed in us, and we will continue to focus our efforts to meet your investment needs.
Sincerely,

Brent R. Harris
Chairman
July 31, 2003
1
Short-Term Portfolio
TOTAL RETURN INVESTMENT PERFORMANCE For the period ended June 30, 2003
| | | 1 Year | | | Since Inception* | |
Short-Term Portfolio Administrative Class | | 3.40 | % | | 5.00 | % |
Citigroup 3-Month Treasury Bill Index | | 1.41 | % | | — | |
| * | | Annualized (All Portfolio returns are net of fees and expenses) |
CUMULATIVE RETURNS THROUGH JUNE 30, 2003
$ 10,000 invested at inception
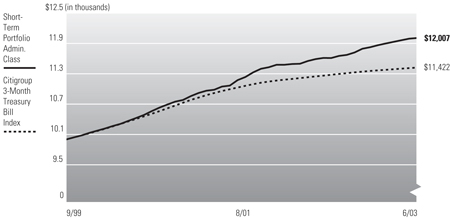
Past performance is no guarantee of future results. Investment return and principal value will fluctuate so that Portfolio shares, when redeemed, may be worth more or less than their original cost. The line graph above assumes the investment of $10,000 on 10/01/1999, the first full month following the Portfolio’s Administrative Class inception on 9/30/1999, compared to the Citigroup 3-Month Treasury Bill Index, an unmanaged market index. It is not possible to invest directly in the Index. Prior to 4/7/03 the Citigroup 3-Month Treasury Bill Index was known as the Saloman Smith Barney 3-Month Treasury Bill Index. Whereas money market funds attempt to maintain a stable share price, the Short-Term Portfolio’s share price will fluctuate in response to market conditions. The Portfolio may invest in foreign securities which involve potentially higher risks including foreign currency fluctuations and political or economic uncertainty. These risks may be enhanced when investing in emerging market securities.
PORTFOLIO INSIGHTS
| • | | The Short-Term Portfolio seeks to achieve its investment objective by investing under normal circumstances at least 65% of its total assets in a diversified portfolio of Fixed Income Instruments of varying maturities. |
| • | | The total return performance of the Portfolio was 1.54% for the six-month period ended June 30, 2003, outperforming the 0.59% return of the Citigroup 3-Month Treasury Bill Index. |
| • | | A duration longer than the effective benchmark was modestly positive for performance as rates fell. |
| • | | Mortgages enhanced the Portfolio’s yield and credit quality. |
| • | | Corporate holdings provided high relative yields and positive price performance as credit risk premiums fell. |
| • | | An allocation to real return bonds was neutral as real yields fell roughly in line with those on nominal bonds. |
| • | | Emerging market bonds helped returns. This asset class continued to gain amid strong demand from investors drawn to relatively high yields and improving credit quality. |
| • | | Asset-backed bonds helped returns, providing attractive relative yields. |
| • | | Short maturity Eurozone exposure was a slight positive as these maturities fell more than U.S. rates amid expectations of more easing by the European Central Bank. |
| • | | Option strategies added incremental income and contributed positively to overall performance. |
2
Financial Highlights
Short-Term Portfolio (Administrative Class)
| Selected Per Share Data for the Year or Period Ended: | | 06/30/2003 +
| | | 12/31/2002
| | | 12/31/2001
| | | 12/31/2000
| | | 09/30/1999- 12/31/1999
| |
Net asset value beginning of period | | $ | 10.08 | | | $ | 10.08 | | | $ | 10.01 | | | $ | 10.00 | | | $ | 10.00 | |
Net investment income (a) | | | 0.09 | | | | 0.28 | | | | 0.48 | | | | 0.53 | | | | 0.13 | |
Net realized/unrealized gain on investments (a) | | | 0.06 | | | | 0.02 | | | | 0.15 | | | | 0.09 | | | | 0.00 | |
Total income from investment operations | | | 0.15 | | | | 0.30 | | | | 0.63 | | | | 0.62 | | | | 0.13 | |
Dividends from net investment income | | | (0.10 | ) | | | (0.29 | ) | | | (0.52 | ) | | | (0.61 | ) | | | (0.13 | ) |
Distributions from net realized capital gains | | | 0.00 | | | | (0.01 | ) | | | (0.04 | ) | | | 0.00 | | | | 0.00 | |
Total distributions | | | (0.10 | ) | | | (0.30 | ) | | | (0.56 | ) | | | (0.61 | ) | | | (0.13 | ) |
Net asset value end of period | | $ | 10.13 | | | $ | 10.08 | | | $ | 10.08 | | | $ | 10.01 | | | $ | 10.00 | |
Total return | | | 1.54 | % | | | 3.02 | % | | | 6.45 | % | | | 6.42 | % | | | 1.32 | % |
Net assets end of period (000s) | | $ | 6,027 | | | $ | 4,340 | | | $ | 1,683 | | | $ | 37 | | | $ | 3,040 | |
Ratio of expenses to average net assets | | | 0.60 | %* | | | 0.60 | %(e) | | | 0.61 | %(c)(d) | | | 0.60 | % | | | 0.60 | %(b)* |
Ratio of net investment income to average net assets | | | 1.80 | %* | | | 2.81 | % | | | 4.74 | % | | | 5.27 | % | | | 5.17 | %* |
Portfolio turnover rate | | | 68 | % | | | 60 | % | | | 94 | % | | | 281 | % | | | N/A | |
| (a) | | Per share amounts based on average number of shares outstanding during the period. |
| (b) | | If the investment manager had not reimbursed expenses, the ratio of operating expenses to average net assets would have been 1.42% for the period ended December 31, 1999. |
| (c) | | Ratio of expenses to average net assets excluding interest expense is 0.60%. |
| (d) | | If the investment manager had not reimbursed expenses, the ratio of operating expenses to average net assets would have been 0.62% for the year ended December 31, 2001. |
| (e) | | If the investment manager had not reimbursed expenses, the ratio of operating expenses to average net assets would have been 0.61% for the year ended December 31, 2002. |
See accompanying notes
3
Statement of Assets and Liabilities
Short-Term Portfolio
June 30, 2003 (Unaudited)
Amounts in thousands, except per share amounts
Assets: | | | | |
Investments, at value | | $ | 16,185 | |
Cash | | | 1 | |
Foreign currency, at value | | | 12 | |
Receivable for Portfolio shares sold | | | 1 | |
Interest receivable | | | 71 | |
Variation margin receivable | | | 2 | |
Unrealized appreciation on swap agreements | | | 13 | |
| | |
|
|
|
| | | | 16,285 | |
| | |
|
|
|
Liabilities: | | | | |
Payable for investments purchased | | $ | 110 | |
Written options outstanding | | | 11 | |
Payable for Portfolio shares redeemed | | | 11 | |
Accrued investment advisory fee | | | 3 | |
Accrued administration fee | | | 3 | |
Accrued servicing fee | | | 1 | |
| | |
|
|
|
| | | | 139 | |
| | |
|
|
|
Net Assets | | $ | 16,146 | |
| | |
|
|
|
Net Assets Consist of: | | | | |
Paid in capital | | $ | 16,047 | |
Undistributed (overdistributed) net investment income | | | (9 | ) |
Accumulated undistributed net realized gain | | | 39 | |
Net unrealized appreciation | | | 69 | |
| | |
|
|
|
| | | $ | 16,146 | |
| | |
|
|
|
Net Assets: | | | | |
Institutional Class | | $ | 10,119 | |
Administrative Class | | | 6,027 | |
Shares Issued and Outstanding: | | | | |
Institutional Class | | | 999 | |
Administrative Class | | | 595 | |
Net Asset Value and Redemption Price Per Share (Net Assets Per Share Outstanding) | | | | |
Institutional Class | | $ | 10.13 | |
Administrative Class | | | 10.13 | |
Cost of Investments Owned | | $ | 16,162 | |
Cost of Foreign Currency Held | | $ | 12 | |
See accompanying notes
4
Statement of Operations
Short-Term Portfolio
For the six months ended June 30, 2003 (Unaudited)
Amounts in thousands
Investment Income: | | | | |
Interest | | $ | 136 | |
Miscellaneous income | | | 7 | |
| | |
|
|
|
Total Income | | | 143 | |
| | |
|
|
|
Expenses: | | | | |
Investment advisory fees | | | 15 | |
Administration fees | | | 12 | |
Distribution and/or servicing fees - Administrative Class | | | 4 | |
| | |
|
|
|
Total Expenses | | | 31 | |
| | |
|
|
|
Net Investment Income | | | 112 | |
| | |
|
|
|
Net Realized and Unrealized Gain (Loss): | | | | |
Net realized gain on investments | | | 6 | |
Net realized gain on futures contracts, written options, and swaps | | | 62 | |
Net realized (loss) on foreign currency transactions | | | (2 | ) |
Net change in unrealized appreciation on investments | | | 1 | |
Net change in unrealized appreciation on futures contracts, written options, and swaps | | | 5 | |
Net change in unrealized appreciation on translation of assets and liabilities denominated in foreign currencies | | | 1 | |
Net Gain | | | 73 | |
| | |
|
|
|
Net Increase in Assets Resulting from Operations | | $ | 185 | |
| | |
|
|
|
See accompanying notes
5
Statements of Changes in Net Assets
Short-Term Portfolio
Amounts in thousands
| Increase (Decrease) in Net Assets from: | | Six Months Ended June 30, 2003
| | | Year Ended December 31, 2002
| |
| | | (Unaudited) | | | | |
Operations: | | | | | | | | |
Net investment income | | $ | 112 | | | $ | 227 | |
Net realized gain (loss) | | | 66 | | | | (25 | ) |
Net change in unrealized appreciation | | | 7 | | | | 50 | |
| | |
|
|
| |
|
|
|
Net increase resulting from operations | | | 185 | | | | 252 | |
| | |
|
|
| |
|
|
|
Distributions to Shareholders: | | | | | | | | |
From net investment income | | | | | | | | |
Institutional Class | | | (69 | ) | | | (136 | ) |
Administrative Class | | | (58 | ) | | | (91 | ) |
From net realized capital gains | | | | | | | | |
Institutional Class | | | 0 | | | | (7 | ) |
Administrative Class | | | 0 | | | | (6 | ) |
| | |
|
|
| |
|
|
|
Total Distributions | | | (127 | ) | | | (240 | ) |
| | |
|
|
| |
|
|
|
Portfolio Share Transactions: | | | | | | | | |
Receipts for shares sold | | | | | | | | |
Institutional Class | | | 6,317 | | | | 945 | |
Administrative Class | | | 2,511 | | | | 3,406 | |
Issued as reinvestment of distributions | | | | | | | | |
Institutional Class | | | 69 | | | | 142 | |
Administrative Class | | | 58 | | | | 97 | |
Cost of shares redeemed | | | | | | | | |
Institutional Class | | | (1,188 | ) | | | (290 | ) |
Administrative Class | | | (912 | ) | | | (855 | ) |
| | |
|
|
| |
|
|
|
Net increase resulting from Portfolio share transactions | | | 6,855 | | | | 3,445 | |
| | |
|
|
| |
|
|
|
Total Increase in Net Assets | | | 6,913 | | | | 3,457 | |
| | |
|
|
| |
|
|
|
Net Assets: | | | | | | | | |
Beginning of period | | | 9,233 | | | | 5,776 | |
End of period* | | $ | 16,146 | | | $ | 9,233 | |
*Including undistributed (overdistributed) net investment income of: | | $ | (9 | ) | | $ | 6 | |
See accompanying notes
6
Schedule of Investments
Short-Term Portfolio
June 30, 2003 (Unaudited)
| | | Principal Amount (000s)
| | Value (000s)
|
CORPORATE BONDS & NOTES 20.2% | | | | | | |
Banking & Finance 7.0% | | | | | | |
Bear Stearns Cos., Inc. | | | | | | |
1.676% due 09/21/2004 (a) | | $ | 100 | | $ | 100 |
CIT Group, Inc. | | | | | | |
5.500% due 02/15/2004 | | | 130 | | | 133 |
Deutsche Telekom International Finance BV | | | | | | |
8.250% due 06/15/2005 | | | 80 | | | 89 |
Ford Motor Credit Co. | | | | | | |
2.040% due 03/08/2004 (a) | | | 100 | | | 100 |
General Motors Acceptance Corp. | | | | | | |
1.390% due 08/18/2003 (a) | | | 104 | | | 104 |
1.990% due 05/17/2004 (a) | | | 100 | | | 99 |
4.500% due 07/15/2006 | | | 30 | | | 30 |
Household International Netherlands BV | | | | | | |
6.200% due 12/01/2003 | | | 105 | | | 107 |
Merrill Lynch & Co., Inc. | | | | | | |
1.578% due 05/21/2004 (a) | | | 105 | | | 105 |
Popular North America, Inc. | | | | | | |
6.625% due 01/15/2004 | | | 60 | | | 62 |
U.S. Bank National Association | | | | | | |
1.360% due 11/14/2003 (a) | | | 90 | | | 90 |
Unibank A/S | | | | | | |
1.680% due 05/28/2007 (a) | | | 50 | | | 50 |
Verizon Wireless Capital LLC | | | | | | |
1.658% due 12/17/2003 (a) | | | 60 | | | 60 |
| | | | | |
|
|
| | | | | | | 1,129 |
| | | | | |
|
|
Industrials 7.0% | | | | | | |
Clear Channel Communications, Inc. | | | | | | |
7.250% due 09/15/2003 | | | 50 | | | 51 |
DaimlerChrysler North America Holding Corp. | | | | | | |
1.810% due 08/01/2003 (a) | | | 200 | | | 200 |
HCA, Inc. | | | | | | |
6.730% due 07/15/2045 | | | 50 | | | 50 |
Kellogg Co. | | | | | | |
6.625% due 01/29/2004 | | | 60 | | | 62 |
Kraft Foods, Inc. | | | | | | |
2.080% due 02/27/2004 (a) | | | 100 | | | 99 |
Newell Co. | | | | | | |
5.700% due 09/22/2003 | | | 50 | | | 50 |
Norfolk Southern Corp. | | | | | | |
7.875% due 02/15/2004 | | | 100 | | | 104 |
Park Place Entertainment Corp. | | | | | | |
7.950% due 08/01/2003 | | | 90 | | | 90 |
Raytheon Co. | | | | | | |
5.700% due 11/01/2003 | | | 50 | | | 50 |
Safeway, Inc. | | | | | | |
6.050% due 11/15/2003 | | | 80 | | | 81 |
TCI Communications, Inc. | | | | | | |
8.650% due 09/15/2004 | | | 40 | | | 43 |
Time Warner, Inc. | | | | | | |
7.975% due 08/15/2004 | | | 100 | | | 106 |
Weyerhaeuser Co. | | | | | | |
2.243% due 09/15/2003 (a) | | | 150 | | | 150 |
| | | | | |
|
|
| | | | | | | 1,136 |
| | | | | |
|
|
Utilities 6.2% | | | | | | |
ALLETE, Inc. | | | | | | |
2.179% due 10/20/2003 (a) | | | 100 | | | 100 |
Appalachian Power Co. | | | | | | |
1.990% due 08/20/2003 (a) | | | 90 | | | 90 |
AT&T Corp. | | | | | | |
6.375% due 03/15/2004 | | | 110 | | | 113 |
Baltimore Gas & Electric Co. | | | | | | |
6.125% due 07/01/2003 | | | 60 | | | 60 |
British Telecom PLC | | | | | | |
2.413% due 12/15/2003 (a) | | | 100 | | | 100 |
Commonwealth Edison Co. | | | | | | |
1.915% due 09/30/2003 (a) | | | 100 | | | 100 |
DTE Energy Co. | | | | | | |
6.000% due 06/01/2004 | | | 25 | | | 26 |
Entergy Gulf States Inc | | | | | | |
3.600% due 06/01/2008 | | | 100 | | | 100 |
Florida Power Corp. | | | | | | |
6.000% due 07/01/2003 | | | 50 | | | 50 |
Niagara Mohawk Power Co. | | | | | | |
7.375% due 07/01/2003 | | | 76 | | | 76 |
Ohio Edison Co | | | | | | |
4.000% due 05/01/2008 | | | 30 | | | 31 |
Sprint Capital Corp. | | | | | | |
5.700% due 11/15/2003 | | | 150 | | | 151 |
| | | | | |
|
|
| | | | | | | 997 |
| | | | | |
|
|
Total Corporate Bonds & Notes
(Cost $3,243) | | | | | | 3,262 |
| | | | | |
|
|
U.S. GOVERNMENT AGENCIES 2.4% | | | | | | |
Federal Home Loan Bank | | | | | | |
6.270% due 08/26/2004 | | | 175 | | | 184 |
3.250% due 09/26/2005 | | | 200 | | | 201 |
| | | | | |
|
|
Total U.S. Government Agencies
(Cost $385) | | | | | | 385 |
| | | | | |
|
|
U.S. TREASURY OBLIGATIONS 3.6% | | | | | | |
Treasury Inflation Protected Securities (c) | | | | | | |
3.375% due 01/15/2007 | | | 35 | | | 38 |
3.625% due 01/15/2008 | | | 478 | | | 536 |
| | | | | |
|
|
Total U.S. Treasury Obligations
(Cost $580) | | | | | | 574 |
| | | | | |
|
|
MORTGAGE-BACKED SECURITIES 14.4% | | | | | | |
Collateralized Mortgage Obligations 6.8% | | | | | | |
Bank of America Mortgage Securities, Inc. | | | | | | |
6.357% due 07/25/2032 (a) | | | 64 | | | 66 |
5.768% due 10/20/2032 (a) | | | 49 | | | 51 |
Bear Stearns Adjustable Rate Mortgage Trust | | | | | | |
6.158% due 01/25/2032 (a) | | | 15 | | | 15 |
Countrywide Home Loans, Inc. | | | | | | |
4.855% due 09/19/2032 (a) | | | 41 | | | 42 |
CS First Boston Mortgage Securities Corp. | | | | | | |
1.931% due 03/25/2032 (a) | | | 230 | | | 226 |
5.726% due 05/25/2032 (a) | | | 39 | | | 40 |
1.375% due 07/25/2032 (a) | | | 68 | | | 68 |
First Republic Mortgage Loan Trust | | | | | | |
1.480% due 08/15/2032 (a) | | | 96 | | | 95 |
Freddie Mac | | | | | | |
5.500% due 08/15/2004 | | | 21 | | | 21 |
5.625% due 07/15/2028 | | | 55 | | | 56 |
5.750% due 06/15/2029 | | | 39 | | | 40 |
5.750% due 05/15/2031 | | | 50 | | | 50 |
Sequoia Mortgage Trust | | | | | | |
1.668% due 04/20/2033 (a)(g) | | | 60 | | | 60 |
Structured Asset Mortgage Investments, Inc. | | | | | | |
1.422% due 09/19/2032 (a) | | | 94 | | | 94 |
Wachovia Bank Commercial Mortgage Trust | | | | | | |
1.225% due 06/15/2013 (a) | | | 40 | | | 40 |
Washington Mutual Mortgage Securities Corp. | | | | | | |
5.780% due 02/25/2031 | | | 88 | | | 89 |
5.207% due 10/25/2032 (a) | | | 40 | | | 41 |
| | | | | |
|
|
| | | | | | | 1,094 |
| | | | | |
|
|
Fannie Mae 4.9% | | | | | | |
5.500% due 11/01/2016-09/01/2017 (b) | | | 650 | | | 676 |
6.000% due 06/01/2017 | | | 117 | | | 122 |
| | | | | |
|
|
| | | | | | | 798 |
| | | | | |
|
|
Freddie Mac 1.2% | | | | | | |
6.500% due 08/01/2032 | | | 51 | | | 54 |
9.500% due 12/01/2019 | | | 121 | | | 135 |
| | | | | |
|
|
| | | | | | | 189 |
| | | | | |
|
|
Government National Mortgage Association 1.5% | | | | | | |
4.000% due 02/20/2032 (a) | | | 195 | | | 202 |
6.000% due 03/15/2032 | | | 36 | | | 38 |
| | | | | |
|
|
| | | | | | | 240 |
| | | | | |
|
|
Total Mortgage-Backed Securities
(Cost $2,317) | | | | | | 2,321 |
| | | | | |
|
|
ASSET-BACKED SECURITIES 3.2% | | | | | | |
Bear Stearns Asset-Backed Securities, Inc. | | | | | | |
1.365% due 10/25/2032 (a) | | | 28 | | | 28 |
CDC Mortgage Capital Trust | | | | | | |
1.375% due 01/25/2032 (a) | | | 80 | | | 80 |
Contimortgage Home Equity Loan Trust | | | | | | |
1.360% due 04/15/2029 (a) | | | 100 | | | 100 |
CS First Boston Mortgage Securities Corp. | | | | | | |
1.475% due 08/25/2032 (a) | | | 27 | | | 27 |
Financial Asset Securities Corp. AAA Trust | | | | | | |
1.310% due 09/25/2033 (a) | | | 38 | | | 38 |
First Franklin Mortgage Loan Trust | | | | | | |
Asset-Backed Certificates | | | | | | |
1.385% due 09/25/2032 (a) | | | 75 | | | 76 |
Irwin Home Equity Loan Trust | | | | | | |
1.305% due 07/25/2032 (a) | | | 60 | | | 60 |
Morgan Stanley Dean Witter Capital I | | | | | | |
1.405% due 07/25/2030 (a) | | | 25 | | | 25 |
Renaissance Home Equity Loan Trust | | | | | | |
1.475% due 08/25/2033 (a) | | | 20 | | | 20 |
Saxon Asset Securities Trust | | | | | | |
1.435% due 12/25/2032 (a) | | | 26 | | | 26 |
Terwin Mortgage Trust | | | | | | |
1.000% due 06/25/2033 (a) | | | 30 | | | 30 |
| | | | | |
|
|
Total Asset-Backed Securities
(Cost $509) | | | | | | 510 |
| | | | | |
|
|
SOVEREIGN ISSUES 1.6% | | | | | | |
Province of Alberta | | | | | | |
4.875% due 10/29/2003 | | | 100 | | | 101 |
Republic of Brazil | | | | | | |
2.125% due 04/15/2006 (a) | | | 106 | | | 99 |
10.000% due 01/16/2007 | | | 30 | | | 31 |
2.187% due 04/15/2009 (a) | | | 35 | | | 30 |
| | | | | |
|
|
Total Sovereign Issues
(Cost $256) | | | | | | 261 |
| | | | | |
|
|
SHORT-TERM INSTRUMENTS 54.9% | | | | | | |
Commercial Paper 53.8% | | | | | | |
Barclays U.S. Funding Corp. | | | | | | |
0.930% due 08/25/2003 | | | 200 | | | 200 |
CBA Finance, Inc. | | | | | | |
1.220% due 08/01/2003 | | | 400 | | | 400 |
Danske Corp. | | | | | | |
1.190% due 08/21/2003 | | | 300 | | | 299 |
0.915% due 09/19/2003 | | | 100 | | | 100 |
Fannie Mae | | | | | | |
1.200% due 07/16/2003 | | | 500 | | | 500 |
1.135% due 08/13/2003 | | | 200 | | | 200 |
1.150% due 08/13/2003 | | | 1,000 | | | 999 |
1.165% due 08/13/2003 | | | 500 | | | 499 |
Federal Home Loan Bank | | | | | | |
1.175% due 07/02/2003 | | | 1,300 | | | 1,300 |
1.135% due 11/05/2003 | | | 200 | | | 199 |
Freddie Mac | | | | | | |
1.195% due 07/17/2003 | | | 600 | | | 600 |
1.110% due 08/21/2003 | | | 1,800 | | | 1,797 |
HBOS Treasury Services PLC | | | | | | |
1.195% due 08/20/2003 | | | 300 | | | 299 |
Royal Bank of Scotland PLC | | | | | | |
1.215% due 07/08/2003 | | | 500 | | | 500 |
Shell Finance PLC | | | | | | |
1.190% due 08/14/2003 | | | 400 | | | 399 |
UBS Finance, Inc. | | | | | | |
1.210% due 07/08/2003 | | | 400 | | | 400 |
| | | | | |
|
|
| | | | | | | 8,691 |
| | | | | |
|
|
Repurchase Agreement 0.6% | | | | | | |
State Street Bank | | | | | | |
0.800% due 07/01/2003 | | | 91 | | | 91 |
| | | | | |
|
|
(Dated 06/30/2003. Collateralized by Federal Home Loan Bank 3.375% due 05/14/2004 valued at $97. Repurchase proceeds are $91.) | | | | | | |
See accompanying notes
7
| | | Principal Amount (000s)
| | Value (000s)
| |
U.S. Treasury Bills 0.5% | | | | | | | |
1.079% due 08/07/2003-08/14/2003 (b)(d) | | $ | 90 | | $ | 90 | |
| | | | | |
|
|
|
Total Short-Term Instruments
(Cost $8,872) | | | | | | 8,872 | |
| | | | | |
|
|
|
Total Investments 100.3%
(Cost $16,162) | | | | | $ | 16,185 | |
Written Options (e) (0.1%)
(Premiums $26) | | | | | | (11 | ) |
Other Assets and Liabilities (Net) (0.2%) | | | | | | (28 | ) |
| | | | | |
|
|
|
Net Assets 100.0% | | | | | $ | 16,146 | |
| | | | | |
|
|
|
Notes to Schedule of Investments
(amounts in thousands, except number of contracts):
| (a) | | Variable rate security. The rate listed is as of June 30, 2003. |
| (b) | | Securities are grouped by coupon or range of coupons and represent a range of maturities. |
| (c) | | Principal amount of security is adjusted for inflation. |
| (d) | | Securities with an aggregate market value of $90 have been segregated with the custodian to cover margin requirements for the following open futures contracts at June 30, 2003: |
Type
| | # of Contracts
| | Unrealized Appreciation/ (Depreciation)
| |
Euribor Written Put Options Strike @ 97.250 (03/2004) - Short | | 14 | | $ | 10 | |
Euribor Written Put Options Strike @ 97.500 (03/2004) - Short | | 7 | | | 5 | |
Euribor Purchase Put Options Strike @ 95.125 (03/2004) - Long | | 21 | | | 0 | |
Euribor Written Put Options Strike @ 97.000 (12/2004) - Short | | 14 | | | 4 | |
Euribor Purchase Put Options Strike @ 93.750 (12/2004) - Long | | 14 | | | 0 | |
Euribor Written Put Options Strike @ 97.500 (12/2004) - Short | | 3 | | | (2 | ) |
Euribor Purchase Put Options Strike @ 95.000 (12/2004) - Long | | 4 | | | 0 | |
Euribor March Futures (03/2005) - Long | | 1 | | | 0 | |
Euribor June Futures (06/2005) - Long | | 1 | | | (1 | ) |
Euribor September Futures (09/2005) - Long | | 1 | | | (1 | ) |
Eurodollar March Futures (03/2006) - Long | | 1 | | | 0 | |
Eurodollar June Futures (06/2005) - Long | | 1 | | | 1 | |
Eurodollar September Futures (09/2005) - Long | | 1 | | | 1 | |
Eurodollar December Futures (12/2005) - Long | | 1 | | | 0 | |
| | | | |
|
|
|
| | | | | $ | 17 | |
| | | | |
|
|
|
| (e) | | Premiums received on written options: |
Type
| | Notional Amount
| | Premium
| | Value
|
Put - OTC 7 Year Interest Rate Swap | | | | | | | | | |
Strike @ 7.000%** Exp. 01/07/2005 | | $ | 140,000 | | $ | 3 | | $ | 1 |
Call - OTC 7 Year Interest Rate Swap | | | | | | | | | |
Strike @ 5.000%* Exp. 01/07/2005 | | | 140,000 | | | 3 | | | 10 |
| | | | | |
|
| |
|
|
| | | | | | $ | 6 | | $ | 11 |
| | | | | |
|
| |
|
|
| | | |
Type
| | # of Contracts
| | Premium
| | Value
|
Put - CME Eurodollar March Futures | | | | | | | | | |
Strike @ 97.250 Exp. 03/15/2004 | | | 4 | | $ | 3 | | $ | 0 |
Put - CME Eurodollar June Futures | | | | | | | | | |
Strike @ 97.000 Exp. 06/14/2004 | | | 8 | | | 9 | | | 0 |
Put - CME Eurodollar June Futures | | | | | | | | | |
Strike @ 97.250 Exp. 06/14/2004 | | | 6 | | | 8 | | | 0 |
| | | | | |
|
| |
|
|
| | | | | | $ | 20 | | $ | 0 |
| | | | | |
|
| |
|
|
| * | | The Portfolio will receive a floating rate based on 3-month LIBOR. |
| ** | | The Portfolio will pay a floating rate based on 3-month LIBOR. |
| (f) | | Swap agreements outstanding at June 30, 2003: |
Type
| | Notional Amount
| | Unrealized Appreciation
|
Receive a fixed rate equal to 0.360% and the Portfolio will pay to the counterparty at par in the event of default of General Electric Capital Corp. 5.875% due 02/15/2012. Counterparty: ABN AMRO Bank, N.V. | | | | | | |
Exp. 07/11/2003 | | $ | 50 | | $ | 0 |
Receive a fixed rate equal to 0.410% and the Portfolio will pay to the counterparty at par in the event of default of General Electric Capital Corp. 5.875% due 02/15/2012. Counterparty: Goldman Sachs & Co. | | | | | | |
Exp. 06/07/2004 | | | 100 | | | 0 |
Receive a fixed rate equal to 0.730% and the Portfolio will pay to the counterparty at par in the event of default of the United Mexican States 11.500% due 05/15/2026. Counterparty: Bear, Stearns & Co., Inc. | | | | | | |
Exp. 06/20/2005 | | | 80 | | | 0 |
Receive a fixed rate equal to 0.750% and the Portfolio will pay to the counterparty at par in the event of default of the United Mexican States 8.375% due 01/14/2011. Counterparty: Merrill Lynch & Co., Inc. | | | | | | |
Exp. 12/16/2003 | | | 90 | | | 0 |
Receive a fixed rate equal to 1.450% and the Portfolio will pay to the counterparty at par in the event of default of Republic of Bulgaria 2.813% due 07/28/2011. Counterparty: Goldman Sachs & Co. | | | | | | |
Exp. 04/15/2004 | | | 30 | | | 0 |
Receive a fixed rate equal to 16.500% and the Portfolio will pay to the counterparty at par in the event of default of Federative Republic of Brazil 2.563% due 04/15/2006. Counterparty: Merrill Lynch & Co., Inc. | | | | | | |
Exp. 01/16/2005 | | | 75 | | | 13 |
| | | | | |
|
|
| | | | | | $ | 13 |
| | | | | |
|
|
| (g) | | Indicates a fair valued security which has not been valued utilizing an independent quote and which is valued pursuant to guidelines established by the Trustees. The aggregate value of fair valued securities is $60, which is 0.37% of net assets. |
See accompanying notes
8
Notes to Financial Statements
June 30, 2003 (Unaudited)
1. Organization
The Short-Term Portfolio (the “Portfolio”) is a series of the PIMCO Variable Insurance Trust (the “Trust”). The Trust is registered under the Investment Company Act of 1940 (the “Act”), as amended, as an open-end investment company organized as a Delaware business trust on October 3, 1997. The Trust may offer up to two classes of shares: Institutional and Administrative. Each share class has identical voting rights (except that shareholders of a class have exclusive voting rights regarding any matter relating solely to that class of shares). Information presented in these financial statements pertains to the Administrative Class of the Trust. Certain detailed financial information for the Institutional Class is provided separately and is available upon request. The Trust is designed to be used as an investment vehicle by Separate Accounts of insurance companies that fund variable annuity contracts and variable life insurance policies and by qualified pension and retirement plans. The Portfolio commenced operations on September 30, 1999.
2. Significant Accounting Policies
The following is a summary of significant accounting policies consistently followed by the Trust in the preparation of its financial statements in conformity with accounting principles generally accepted in the United States of America. The preparation of financial statements in accordance with accounting principles generally accepted in the United States of America requires management to make estimates and assumptions that affect the reported amounts and disclosures in the financial statements. Actual results could differ from those estimates.
Security Valuation. Portfolio securities and other financial instruments for which market quotations are readily available are stated at market value. Market value is determined at the close of regular trading (normally, 4:00 p.m., Eastern Time) on the New York Stock Exchange on each day the New York Stock Exchange is open, or if no sales are reported, as is the case for most securities traded over-the-counter, the mean between representative bid and asked quotations obtained from a quotation reporting system or from established market makers. Fixed income securities, including those to be purchased under firm commitment agreements, are normally valued on the basis of quotes obtained from brokers and dealers or pricing services. Short-term investments, which mature in 60 days or less are valued at amortized cost, which approximates market value. Certain fixed income securities for which daily market quotations are not readily available may be valued, pursuant to guidelines established by the Board of Trustees, with reference to fixed income securities whose prices are more readily obtainable. Prices may be obtained from independent pricing services which use information provided by market makers or estimates of market values obtained from yield data relating to investments or securities with similar characteristics. The prices used by the Portfolio may differ from the value that would be realized if the securities were sold and the differences could be material to the financial statements.
Securities Transactions and Investment Income. Securities transactions are recorded as of the trade date. Securities purchased or sold on a when-issued or delayed delivery basis may be settled a month or more after the trade date. Realized gains and losses from securities sold are recorded on the identified cost basis. Dividend income is recorded on the ex-dividend date, except certain dividends from foreign securities where the ex-dividend date may have passed, are recorded as soon as the Portfolio is informed of the ex-dividend date. Interest income, adjusted for the accretion of discounts and amortization of premiums, is recorded on the accrual basis. Paydowns gains and losses on mortgage- and asset-backed securities are recorded as adjustments to interest income in the Statement of Operations.
Dividends and Distributions to Shareholders. Dividends from net investment income, if any, are declared on each day the Trust is open for business and are distributed to shareholders monthly. All dividends are reinvested in additional shares of the Portfolio. Net realized capital gains earned by the Portfolio, if any, will be distributed no less frequently than once each year.
Income dividends and capital gain distributions are determined in accordance with income tax regulations which may differ from accounting principles generally accepted in the United States of America. These differences are primarily due to differing treatments for such items as wash sales, foreign currency transactions, net operating losses and capital loss carryforwards.
Distributions classified as a tax basis return of capital, if any, are reflected in the accompanying Statements of Changes in Net Assets and have been reclassified to paid in capital. In addition, other amounts have been reclassified between undistributed net investment income, accumulated undistributed net realized gains or losses and/or paid in capital to more appropriately conform financial accounting to tax characterizations of dividend distributions.
Foreign Currency. The accounting records of the Portfolio are maintained in U.S. dollars. The market values of foreign securities, currency holding and other assets and liabilities are translated into U.S. dollars based on the current exchange rates each business day. Fluctuations in the value of these assets and liabilities resulting from changes in exchange rates are recorded as unrealized foreign currency gains or losses. Realized gains or losses and unrealized appreciation (depreciation) on investment securities and income and expenses are translated on the respective dates of such transactions. The effect of changes in foreign currency exchange rates on investments in securities are not
9
segregated in the Statement of Operations from the effects of changes in market prices of those securities, but are included with the net realized and unrealized gain or loss on investment securities.
Multiclass Operations. Each class offered by the Trust has equal rights as to assets. Income, non-class specific expenses, and realized and unrealized capital gains and losses are allocated to each class of shares based on the relative net assets of each class.
Federal Income Taxes. The Portfolio intends to qualify as a regulated investment company and distribute all of its taxable income and net realized gains, if applicable, to shareholders. Accordingly, no provision for Federal income taxes has been made.
Futures Contracts. The Portfolio is authorized to enter into futures contracts. The Portfolio may use futures contracts to manage its exposure to the securities markets or to movements in interest rates and currency values. The primary risks associated with the use of futures contracts are imperfect correlation between the change in market value of the securities held by the Portfolio and the prices of futures contracts, the possibility of an illiquid market, and the inability of the counterparty to meet the terms of the contract. Futures contracts are valued based upon their quoted daily settlement prices. Upon entering into a futures contract, the Portfolio may be required to deposit with its custodian, in a segregated account in the name of the futures broker, an amount of cash or U.S. Government and Agency Obligations in accordance with the initial margin requirements of the broker or exchange. Futures contracts are marked to market daily and an appropriate payable or receivable for the change in value (“variation margin”) is recorded by the Portfolio. Gains or losses are recognized but not considered realized until the contracts expire or are closed. Futures contracts involve, to varying degrees, risk of loss in excess of the variation margin disclosed in the Statement of Assets and Liabilities.
Options Contracts. The Portfolio may write call and put options on futures, securities or currencies it owns or in which it may invest. Writing put options tends to increase the Portfolio’s exposure to the underlying instrument. Writing call options tends to decrease the Portfolio’s exposure to the underlying instrument. When the Portfolio writes a call or put option, an amount equal to the premium received is recorded as a liability and subsequently marked to market to reflect the current value of the option written. Payment received or made, if any, from writing options with premiums to be determined on a future date are reflected as such on the Statement of Assets and Liabilities. Premiums received from writing options which expire are treated as realized gains. Premiums received from writing options which are exercised or closed are added to the proceeds or offset against amounts paid on the underlying future, security or currency transaction to determine the realized gain or loss. The Portfolio as a writer of an option has no control over whether the underlying future, security or currency may be sold (call) or purchased (put) and as a result bears the market risk of an unfavorable change in the price of the future, security or currency underlying the written option. There is the risk the Portfolio may not be able to enter into a closing transaction because of an illiquid market.
The Portfolio may also purchase put and call options. Purchasing call options tends to increase the Portfolio’s exposure to the underlying instrument. Purchasing put options tends to decrease the Portfolio’s exposure to the underlying instrument. The Portfolio pays a premium which is included in the Portfolio’s Statement of Assets and Liabilities as an investment and subsequently marked to market to reflect the current value of the option. Premiums paid for purchasing options which expire are treated as realized losses. The risk associated with purchasing put and call options is limited to the premium paid. Premiums paid for purchasing options which are exercised or closed are added to the amounts paid or offset against the proceeds on the underlying future, security or currency transaction to determine the realized gain or loss.
Swap Agreements. The Portfolio may invest in swap agreements. A swap is an agreement to exchange the return generated by one instrument for the return generated by another instrument. The Portfolio may enter into interest rate, total return, forward swap spread lock and credit default swap agreements to manage its exposure to interest rates and credit risk. Interest rate swap agreements involve the exchange by the Portfolio with another party of their respective commitments to pay or receive interest, e.g., an exchange of floating rate payments for fixed rate payments with respect to a notional amount of principal. Total return swap agreements involve commitments to pay interest in exchange for a market-linked return, both based on notional amounts. To the extent the total return of the security or index underlying the transaction exceeds or falls short of the offsetting interest rate obligation, the Portfolio will receive a payment from or make a payment to the counterparty. Forward spread lock swap agreements involve commitments to pay or receive a settlement amount calculated as the difference between the swap spread and a fixed spread, multiplied by the notional amount times the duration of the swap. The swap spread is the difference between the benchmark swap rate (market rate) and the specific Treasury rate. In a credit default swap, one party makes a stream of payments to another party in exchange for the right to receive a specified return in the event of a default by a third party, typically corporate issues or sovereign issues of an emerging country, on its obligation. The Portfolio may use credit default swaps to provide a measure of protection against defaults of
10
sovereign issuers (i.e., to reduce risk where the Portfolio owns or has exposure to the sovereign issuer) or to take an active long or short position with respect to the likelihood of a particular issuer’s default. Swaps are marked to market daily based upon quotations from market makers and vendors and the change in value, if any, is recorded as unrealized gain or loss in the Statement of Operations. Payments received or made at the beginning of the measurement period are reflected as such on the Statement of Assets and Liabilities. A liquidation payment received or made at the termination of the swap is recorded as realized gain or loss in the Statement of Operations. Net periodic payments are included as part of miscellaneous income on the Statement of Operations. Entering into these agreements involves, to varying degrees, elements of credit, market and documentation risk in excess of the amounts recognized on the Statement of Assets and Liabilities. Such risks involve the possibility that there will be no liquid market for these agreements, that the counterparty to the agreements may default on its obligation to perform or disagree as to the meaning of contractual terms in the agreements, and that there may be unfavorable changes in interest rates.
Delayed Delivery Transactions. The Portfolio may purchase or sell securities on a when-issued or delayed delivery basis. These transactions involve a commitment by the Portfolio to purchase or sell securities for a predetermined price or yield, with payment and delivery taking place beyond the customary settlement period. When delayed delivery purchases are outstanding, the Portfolio will set aside and maintain until the settlement date in a segregated account, liquid assets in an amount sufficient to meet the purchase price. When purchasing a security on a delayed delivery basis, the Portfolio assumes the rights and risks of ownership of the security, including the risk of price and yield fluctuations, and takes such fluctuations into account when determining its net asset value. The Portfolio may dispose of or renegotiate a delayed delivery transaction after it is entered into, and may sell when-issued securities before they are delivered, which may result in a capital gain or loss. When the Portfolio has sold a security on a delayed delivery basis, the Portfolio does not participate in future gains and losses with respect to the security.
Inflation-Indexed Bonds. Inflation-indexed bonds are fixed income securities whose principal value is periodically adjusted to the rate of inflation. The interest rate on these bonds is generally fixed at issuance at a rate lower than typical bonds. Over the life of an inflation-indexed bond, however, interest will be paid based on a principal value, which is adjusted for inflation. Any increase in the principal amount of an inflation-indexed bond will be included as interest income in the Statement of Operations, even though investors do not receive their principal until maturity.
Repurchase Agreements. The Portfolio may engage in repurchase transactions. Under the terms of a typical repurchase agreement, the Portfolio takes possession of an underlying debt obligation subject to an obligation of the seller to repurchase, and the Portfolio to resell, the obligation at an agreed-upon price and time. The market value of the collateral must be equal at all times to the total amount of the repurchase obligations, including interest. Generally, in the event of counterparty default, the Portfolio has the right to use the collateral to offset losses incurred.
3. Fees, Expenses, and Related Party Transactions
Investment Advisory Fee. Pacific Investment Management Company LLC (PIMCO) is a majority owned subsidiary partnership of Allianz Dresdner Asset Management of America L.P. (formerly PIMCO Advisors L.P.) and serves as investment adviser (the “Adviser”) to the Trust, pursuant to an investment advisory contract. The Adviser receives a monthly fee at an annual rate based on average daily net assets of the Portfolio. The Advisory Fee is charged at an annual rate of 0.25%.
Administration Fee. PIMCO serves as administrator (the “Administrator”) and provides administrative services to the Trust for which it receives a monthly administrative fee based on average daily net assets of the Portfolio. The Administration Fee is charged at the annual rate of 0.20%.
Servicing Fee. PIMCO Advisors Distributors LLC (“PAD”), is an indirect wholly-owned subsidiary of Allianz Dresdner Asset Management of America L.P. and serves as the distributor of the Trust’s shares. The Trust is permitted to reimburse PAD on a quarterly basis, out of the Administrative Class assets of the Portfolio in the amount of 0.15% on an annual basis of the average daily net assets of that class, for payments made to financial intermediaries that provide services in connection with the distribution of shares or administration of plans or programs that use Portfolio shares as their funding medium. The effective rate paid to PAD during the current fiscal year is 0.15%.
Expenses. The Portfolio is responsible for the following expenses: (i) salaries and other compensation of any of the Trust’s executive officers and employees who are not officers, directors, stockholders or employees of PIMCO or its subsidiaries or affiliates; (ii) taxes and governmental fees; (iii) brokerage fees and commissions and other portfolio transaction expenses; (iv) the cost of borrowing money, including interest expense; (v) fees and expenses of the Trustees who are not “interested persons” of PIMCO or the Trust, and any counsel retained exclusively for their benefit; (vi) extraordinary expenses, including costs of litigation and indemnification expenses; (vii) organization expenses and (viii) any expenses allocated or allocable to a specific class of shares, which include service fees payable with respect to
11
the Administrative Class shares and may include certain other expenses as permitted by the Trust’s Multiple Class Plan adopted pursuant to Rule 18f-3 under the Act and subject to review and approval by the Trustees. The ratio of expenses to average net assets per share class, as disclosed in the Financial Highlights, may differ from the annual Portfolio operating expenses per share class as disclosed in the Prospectus for the reasons set forth above. PIMCO has agreed to waive a portion of its administrative fees to the extent that the payment of the Portfolio’s pro rata share of Trustees’ fees causes the actual expense ratio to rise above the rates disclosed in the current prospectus plus 0.49 basis points as set forth below (calculated as a percentage of the Portfolio’s average daily net assets attributable to each class):
| | | Institutional
Class
| | | Administrative
Class
| |
Short-Term Portfolio | | 0.45 | % | | 0.60 | % |
PIMCO may be reimbursed for these waived amounts in future periods. The Trust pays no compensation directly to any Trustee or any other officer who is affiliated with the Administrator, all of whom receive renumeration for their services to the Trust from the Administrator or its affiliates.
Each unaffiliated Trustee receives an annual retainer of $4,000, plus $1,500 for each Board of Trustees meeting attended in person and $250 for each meeting attended telephonically, plus reimbursement of related expenses. In addition, each committee chair receives an additional annual retainer of $500. These expenses are allocated on a pro-rata basis to each Portfolio of the Trust according to its respective net assets.
4. Purchases and Sales of Securities
Purchases and sales of securities (excluding short-term investments) for the period ended June 30, 2003 were as follows (amounts in thousands):
| | | U.S Government/
Agency
| | All Other
|
| | | Purchases
| | Sales
| | Purchases
| | Sales
|
Short-Term Portfolio | | $ | 2,716 | | $ | 1,641 | | $ | 2,903 | | $ | 2,898 |
5. Transactions in Written Call and Put Options
Transactions in written call and put options were as follows (amounts in thousands):
| | | Short-Term Portfolio
| |
| | | Premium
| |
Balance at 12/31/2002 | | $ | 37 | |
Sales | | | 30 | |
Closing Buys | | | (41 | ) |
Expirations | | | 0 | |
Exercised | | | 0 | |
| | |
|
|
|
Balance at 06/30/2003 | | $ | 26 | |
| | |
|
|
|
12
6. Federal Income Tax Matters
At June 30, 2003, the aggregate cost of investments was the same for federal income tax and financial statement purposes. The net unrealized appreciation (depreciation) of investments securities for federal income tax purposes is as follows (amounts in thousands):
| | | Aggregate
Gross Unrealized Appreciation
| | Aggregate
Gross Unrealized (Depreciation)
| | | Net
Unrealized Appreciation
|
Short-Term Portfolio | | $ | 41 | | $ | (18 | ) | | $ | 23 |
7. Shares of Beneficial Interest
The Trust may issue an unlimited number of shares of beneficial interest with a $.0001 par value. Changes in shares of beneficial interest were as follows (shares and amounts in thousands):
| | | Short-Term Portfolio
| |
| | | Six Months Ended 06/30/2003
| | | Year Ended 12/31/2002
| |
| | | Shares
| | | Amount
| | | Shares
| | | Amount
| |
Receipts for shares sold | | | | | | | | | | | | | | |
Institutional Class | | 624 | | | $ | 6,317 | | | 95 | | | $ | 945 | |
Administrative Class | | 248 | | | | 2,511 | | | 339 | | | | 3,406 | |
Issued as reinvestment of distributions | | | | | | | | | | | | | | |
Institutional Class | | 7 | | | | 69 | | | 14 | | | | 142 | |
Administrative Class | | 6 | | | | 58 | | | 10 | | | | 97 | |
Cost of shares redeemed | | | | | | | | | | | | | | |
Institutional Class | | (118 | ) | | | (1,188 | ) | | (29 | ) | | | (290 | ) |
Administrative Class | | (90 | ) | | | (912 | ) | | (85 | ) | | | (855 | ) |
| | |
|
| |
|
|
| |
|
| |
|
|
|
Net increase resulting from Portfolio share transactions | | 677 | | | $ | 6,855 | | | 344 | | | $ | 3,445 | |
| | |
|
| |
|
|
| |
|
| |
|
|
|
The following schedule shows the number of shareholders each owning 5% or more of the Portfolio and the total percentage of the Portfolio held by such shareholders:
| | | Number
| | % of Portfolio
Held
|
Short-Term Portfolio | | | | |
Institutional Class | | 3 | | 99 |
Administrative Class | | 4 | | 92 |
13
Trustees and Officers
Brent R. Harris, Chairman and Trustee
R. Wesley Burns, President and Trustee
E. Philip Cannon, Trustee
Vern O. Curtis, Trustee
J. Michael Hagan, Trustee
William J. Popejoy, Trustee
Garlin G. Flynn, Secretary
John P. Hardaway, Treasurer
Investment Adviser and Administrator
Pacific Investment Management Company LLC
840 Newport Center Drive
Newport Beach, California 92660
Transfer Agent
National Financial Data Services
330 W. 9th Street, 4th Floor
Kansas City, Missouri 64105
Custodian
State Street Bank & Trust Company
801 Pennsylvania
Kansas City, Missouri 64105
Counsel
Dechert LLP
1775 I Street, N.W.
Washington, D.C. 20006
Independent Accountants
PricewaterhouseCoopers LLP
1055 Broadway
Kansas City, Missouri 64105
PIMCO VARIABLE INSURANCE TRUST
This report is submitted for the general information of the shareholders of the PIMCO Variable Insurance Trust. It is not authorized for distribution to prospective investors unless accompanied or preceded by an effective prospectus for the PIMCO Variable Insurance Trust, which contains information covering its investment policies as well as other pertinent information.
All Funds distributed by PIMCO ADVISORS DISTRIBUTORS LLC, member NASD
840 NEWPORT CENTER DRIVE
NEWPORT BEACH, CA 92660
800.927.4648
WWW.PIMCOADVISORS.COM
WWW.PIMCO.COM
P I M C O PIMCO VARIABLE INSURANCE TRUST MONEY MARKET PORTFOLIO ADMINISTRATIVE CLASS |
SEMI-ANNUAL REPORT June 30, 2003 |
| | | Fund
Summary
| | Schedule of
Investments
|
Money Market Portfolio (Administrative Class) | | 2 | | 7 |
Chairman’s Letter
Dear PIMCO Variable Insurance Trust Shareholder:
Financial assets gained during the first half of 2003 amid a revival of risk appetites as anxiety about the war in Iraq faded. Assets that generally benefit from economic growth, such as stocks, corporate bonds and emerging market debt, fared the best year-to-date as investors returned to these sectors in anticipation of a recovery in the second half of 2003. Reflationary forces that investors expected to fuel a rebound included federal tax cuts and a weak dollar, as well as low borrowing rates that eased the burden of high personal and corporate indebtedness. Low mortgage rates kept refinancings booming in the second quarter and put more money in consumers’ pockets.
U.S. Treasuries lagged their riskier counterparts but still enjoyed a modest rally. Yields fell to levels not seen in 45 years early in the second quarter before bouncing off their lows in June as hopes for recovery increased. The yield on the benchmark 10-year Treasury closed the six-month period 0.30% lower to 3.51%, after nearing 3% earlier in the period. Buyers were encouraged that inflation would remain tame amid low capacity utilization and weak employment growth. Asian central banks bought U.S. Treasuries to limit the rise in their currencies versus the dollar in an effort to protect their export industries. In June, the Federal Reserve cut the federal funds rate by 0.25% to 1%, its 13th easing since 2001, in an effort to boost the economy and ward off deflation. Although the cut was less than expected, the Fed suggested that rates would stay low until deflation risks abated.
On the following pages you will find specific details as to the Portfolio’s total return investment performance and a discussion of those factors that affected performance.
We appreciate the trust you have placed in us, and we will continue to focus our efforts to meet your investment needs.
Sincerely, |
|
 |
|
Brent R. Harris Chairman |
|
July 31, 2003 |
1
Money Market Portfolio
TOTAL RETURN INVESTMENT PERFORMANCE For the period ended June 30, 2003
| | | 1 Year | | | Since Inception* | |
Money Market Portfolio Administrative Class | | 1.06 | % | | 3.44 | % |
Citigroup 3-Month Treasury Bill Index | | 1.41 | % | | — | |
| * | | Annualized (All Portfolio returns are net of fees and expenses) |
CUMULATIVE RETURNS THROUGH JUNE 30, 2003
$10,000 invested at inception
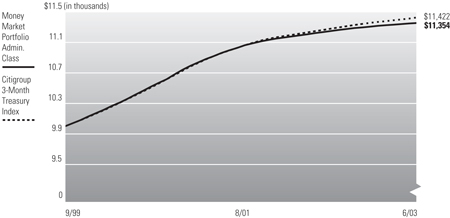
Past performance is no guarantee of future results. Investment return and principal value will fluctuate so that Portfolio shares, when redeemed, may be worth more or less than their original cost. The line graph above assumes the investment of $10,000 on 10/01/1999, the first full month following the Portfolio’s Administrative Class inception on 9/30/1999, compared to the Citigroup 3-Month Treasury Bill Index, an unmanaged market index. It is not possible to invest directly in the Index. Prior to 4/7/03 the Citigroup 3-Month Treasury Bill Index was known as the Salomon Smith Barney 3-Month Treasury Bill Index. An investment in the Money Market Portfolio is neither insured nor guaranteed by the Federal Deposit Insurance Corporation or any other U.S. Government Agency. Although the Portfolio seeks to preserve the value of your investment at $1.00 per share, it is possible to lose money by investing in the Portfolio. If there is a material difference between the quoted total return and the quoted current yield, the yield quotation more closely reflects the current earnings of the Money Market Portfolio than the total return quotation.
PORTFOLIO INSIGHTS
| • | | The Money Market Portfolio seeks to achieve its investment objective by investing at least 95% of its total assets in a diversified portfolio of money market securities that are in the highest rating category for short-term obligations. |
| • | | The total return performance of the Portfolio was 0.42% for the six-month period ended June 30, 2003, versus a return of 0.59% for its benchmark, the Citigroup 3-Month Treasury Bill Index. |
| • | | Already low interest rates plunged to levels not seen in 45 years as investors had anticipated that inflation would remain tame. |
| • | | The Portfolio’s average duration was maintained at about one-month, providing for ample liquidity and limiting the price effects from increasing yields. |
| • | | The 3-month Treasury sector outperformed short maturity securities from other sectors. |
| • | | U.S.-issued high quality (A1/P1) commercial paper was emphasized due to attractive yields, limited interest rate sensitivity, and low credit exposure. |
| • | | The Investment Adviser used high quality U.S. agency and shorter-term, fixed and floating rate U.S. corporates to boost portfolio income, while limiting credit risk. |
| • | | Seven-day and thirty-day SEC yields were 0.83% and 0.91%, respectively, at the end of the period. These yields were competitive with yields on similar duration portfolios. |
2
Financial Highlights
Money Market Portfolio (Administrative Class)
| Selected Per Share Data for the Year or Period Ended: | | 06/30/2003 +
| | | 12/31/2002
| | | 12/31/2001
| | | 12/31/2000
| | | 09/30/1999-12/31/1999
| |
Net asset value beginning of period | | $ | 1.00 | | | $ | 1.00 | | | $ | 1.00 | | | $ | 1.00 | | | $ | 1.00 | |
Net investment income (a) | | | 0.01 | | | | 0.01 | | | | 0.04 | | | | 0.06 | | | | 0.01 | |
Total income from investment operations | | | 0.01 | | | | 0.01 | | | | 0.04 | | | | 0.06 | | | | 0.01 | |
Dividends from net investment income | | | (0.01 | ) | | | (0.01 | ) | | | (0.04 | ) | | | (0.06 | ) | | | (0.01 | ) |
Total distributions | | | (0.01 | ) | | | (0.01 | ) | | | (0.04 | ) | | | (0.06 | ) | | | (0.01 | ) |
Net asset value end of period | | $ | 1.00 | | | $ | 1.00 | | | $ | 1.00 | | | $ | 1.00 | | | $ | 1.00 | |
Total return | | | 0.42 | % | | | 1.41 | % | | | 3.83 | % | | | 6.01 | % | | | 1.30 | % |
Net assets end of period (000s) | | $ | 27,879 | | | $ | 25,850 | | | $ | 12,860 | | | $ | 4,334 | | | $ | 3,605 | |
Ratio of expenses to average net assets | | | 0.50 | %* | | | 0.50 | % | | | 0.50 | %(c) | | | 0.50 | % | | | 0.50 | %(b)* |
Ratio of net investment income to average net assets | | | 0.83 | %* | | | 1.41 | % | | | 3.37 | % | | | 5.88 | % | | | 5.14 | %* |
Portfolio turnover rate | | | N/A | | | | N/A | | | | N/A | | | | N/A | | | | N/A | |
| (a) | | Per share amounts based on average number of shares outstanding during the period. |
| (b) | | If the investment manager had not reimbursed expenses, the ratio of operating expenses to average net assets would have been 1.27% for the period ended December 31, 1999. |
| (c) | | If the investment manager had not reimbursed expenses, the ratio of operating expenses to average net assets would have been 0.51% for the year ended December 31, 2001. |
See accompanying notes
3
Statement of Assets and Liabilities
Money Market Portfolio
June 30, 2003 (Unaudited)
Amounts in thousands, except per share amounts
Assets: | | | | |
Investments, at value | | $ | 26,779 | |
Cash | | | 1 | |
Receivable for investments sold | | | 1,029 | |
Receivable for Portfolio shares sold | | | 21 | |
Interest receivable | | | 74 | |
| | |
|
|
|
| | | | 27,904 | |
| | |
|
|
|
Liabilities: | | | | |
Dividends payable | | | 1 | |
Accrued investment advisory fee | | | 4 | |
Accrued administration fee | | | 5 | |
Accrued servicing fee | | | 3 | |
| | |
|
|
|
| | | | 13 | |
| | |
|
|
|
Net Assets | | $ | 27,891 | |
| | |
|
|
|
Net Assets Consist of: | | | | |
Paid in capital | | $ | 27,891 | |
Undistributed net investment income | | | 6 | |
Accumulated undistributed net realized (loss) | | | (6 | ) |
| | |
|
|
|
| | | $ | 27,891 | |
| | |
|
|
|
Net Assets: | | | | |
Institutional Class | | $ | 12 | |
Administrative Class | | | 27,879 | |
Shares Issued and Outstanding: | | | | |
Institutional Class | | | 12 | |
Administrative Class | | | 27,879 | |
Net Asset Value and Redemption Price Per Share (Net Assets Per Share Outstanding) | | | | |
Institutional Class | | $ | 1.00 | |
Administrative Class | | | 1.00 | |
Cost of Investments Owned | | $ | 26,779 | |
See accompanying notes
4
Statement of Operations
Money Market Portfolio
For the six months ended June 30, 2003 (Unaudited)
Amounts in thousands
Investment Income: | | | |
Interest | | $ | 182 |
| | |
|
|
Total Income | | | 182 |
| | |
|
|
Expenses: | | | |
Investment advisory fees | | | 20 |
Administration fees | | | 27 |
Distribution and/or servicing fees - Administrative Class | | | 20 |
| | |
|
|
Total Expenses | | | 67 |
| | |
|
|
Net Investment Income | | | 115 |
| | |
|
|
Net Realized Gain: | | | |
Net realized gain on investments | | | 3 |
Net Gain | | | 3 |
| | |
|
|
Net Increase in Assets Resulting from Operations | | $ | 118 |
| | |
|
|
See accompanying notes
5
Statements of Changes in Net Assets
Money Market Portfolio
Amounts in thousands
| Increase (Decrease) in Net Assets from: | | Six Months Ended
June 30, 2003
| | | Year Ended
December 31, 2002
| |
| | | (Unaudited) | | | | |
Operations: | | | | | | | | |
Net investment income | | $ | 115 | | | $ | 291 | |
Net realized gain | | | 3 | | | | 0 | |
| | |
|
|
| |
|
|
|
Net increase resulting from operations | | | 118 | | | | 291 | |
| | |
|
|
| |
|
|
|
Distributions to Shareholders: | | | | | | | | |
From net investment income | | | | | | | | |
Institutional Class | | | 0 | | | | 0 | |
Administrative Class | | | (118 | ) | | | (291 | ) |
| | |
|
|
| |
|
|
|
Total Distributions | | | (118 | ) | | | (291 | ) |
| | |
|
|
| |
|
|
|
Portfolio Share Transactions: | | | | | | | | |
Receipts for shares sold | | | | | | | | |
Institutional Class | | | 1 | | | | 0 | |
Administrative Class | | | 8,976 | | | | 38,288 | |
Issued as reinvestment of distributions | | | | | | | | |
Institutional Class | | | 0 | | | | 0 | |
Administrative Class | | | 118 | | | | 291 | |
Cost of shares redeemed | | | | | | | | |
Institutional Class | | | 0 | | | | 0 | |
Administrative Class | | | (7,065 | ) | | | (25,589 | ) |
| | |
|
|
| |
|
|
|
Net increase resulting from Portfolio share transactions | | | 2,030 | | | | 12,990 | |
| | |
|
|
| |
|
|
|
Total Increase in Net Assets | | | 2,030 | | | | 12,990 | |
| | |
|
|
| |
|
|
|
Net Assets: | | | | | | | | |
Beginning of period | | | 25,861 | | | | 12,871 | |
End of period* | | $ | 27,891 | | | $ | 25,861 | |
*Including undistributed net investment income of: | | $ | 6 | | | $ | 9 | |
See accompanying notes
6
Schedule of Investments
Money Market Portfolio
June 30, 2003 (Unaudited)
| | | Principal
Amount
(000s)
| | Value
(000s)
|
SHORT-TERM INSTRUMENTS 96.0% | | | | | | |
Commercial Paper 84.7% | | | | | | |
ABN AMRO Mortgage Corp. | | | | | | |
1.040% due 07/16/2003 | | $ | 400 | | $ | 400 |
Australia and New Zealand Banking Group Ltd. | | | | | | |
1.330% due 03/05/2004 | | | 300 | | | 300 |
Bell Atlantic New Jersey, Inc. | | | | | | |
5.875% due 02/01/2004 | | | 350 | | | 359 |
Bristol-Myers Squibb Co. | | | | | | |
0.920% due 10/28/2003 | | | 400 | | | 399 |
CBA Finance, Inc. | | | | | | |
1.230% due 07/23/2003 | | | 900 | | | 899 |
Danske Corp. | | | | | | |
1.280% due 07/10/2003 | | | 200 | | | 200 |
Dupont De Nemours & Co. | | | | | | |
8.125% due 03/15/2004 | | | 330 | | | 345 |
Fannie Mae | | | | | | |
1.050% due 07/31/2003 | | | 1,600 | | | 1,599 |
1.170% due 08/27/2003 | | | 200 | | | 200 |
1.175% due 08/27/2003 | | | 300 | | | 299 |
0.990% due 10/22/2003 | | | 3,700 | | | 3,688 |
5.625% due 05/14/2004 | | | 400 | | | 415 |
Federal Home Loan Bank | | | | | | |
1.010% due 07/01/2003 | | | 5,100 | | | 5,100 |
5.195% due 01/29/2004 | | | 165 | | | 169 |
4.750% due 06/28/2004 | | | 400 | | | 415 |
Freddie Mac | | | | | | |
3.750% due 04/15/2004 | | | 900 | | | 918 |
General Electric Capital Corp. | | | | | | |
1.220% due 07/09/2003 | | | 200 | | | 200 |
1.140% due 07/10/2003 | | | 600 | | | 600 |
6.267% due 07/23/2003 | | | 300 | | | 301 |
HBOS Treasury Services PLC | | | | | | |
1.250% due 07/16/2003 | | | 500 | | | 500 |
0.970% due 08/27/2003 | | | 100 | | | 100 |
1.401% due 01/16/2004 | | | 500 | | | 500 |
Lloyds Bank PLC | | | | | | |
1.250% due 07/10/2003 | | | 100 | | | 100 |
National Westminster Bank PLC | | | | | | |
9.375% due 11/15/2003 | | | 500 | | | 515 |
Nestle Capital Corp. | | | | | | |
1.195% due 08/01/2003 | | | 500 | | | 499 |
Oesterreichische Kontrollbank AG | | | | | | |
4.625% due 11/03/2003 | | | 100 | | | 101 |
Procter & Gamble Co. | | | | | | |
5.250% due 09/15/2003 | | | 300 | | | 302 |
Province of Alberta | | | | | | |
4.875% due 10/29/2003 | | | 250 | | | 253 |
Queensland Treasury Corp. | | | | | | |
1.170% due 07/11/2003 | | | 800 | | | 800 |
Rabobank Nederland NV | | | | | | |
1.230% due 07/07/2003 | | | 600 | | | 600 |
Royal Bank of Scotland PLC | | | | | | |
1.255% due 07/02/2003 | | | 100 | | | 100 |
1.225% due 07/09/2003 | | | 600 | | | 600 |
Svenska Handelsbank, Inc. | | | | | | |
1.250% due 07/01/2003 | | | 300 | | | 300 |
Toyota Motor Credit Corp. | | | | | | |
5.625% due 11/13/2003 | | | 175 | | | 178 |
Wells Fargo Financial, Inc. | | | | | | |
7.250% due 07/14/2003 | | | 460 | | | 461 |
5.375% due 09/30/2003 | | | 300 | | | 303 |
Westpac Trust Securities NZ Ltd. | | | | | | |
1.250% due 07/10/2003 | | | 200 | | | 200 |
1.200% due 08/27/2003 | | | 400 | | | 399 |
| | | | | |
|
|
| | | | | | | 23,617 |
| | | | | |
|
|
Repurchase Agreement 11.3% | | | | | | |
State Street Bank | | | | | | |
0.800% due 07/01/2003 | | $ | 3,162 | | $ | 3,162 |
(Dated 06/30/2003. Collateralized by Fannie Mae 3.125% due 10/01/2003 valued at $3,227. Repurchase proceeds are $3,162.) | | | | | | |
| | | | | |
|
|
Total Short-Term Instruments
(Cost $26,779) | | | | | | 26,779 |
| | | | | |
|
|
Total Investments 96.0%
(Cost $26,779) | | | | | $ | 26,779 |
Other Assets and Liabilities (Net) 4.0% | | | | | | 1,112 |
| | | | | |
|
|
Net Assets 100.0% | | | | | $ | 27,891 |
| | | | | |
|
|
See accompanying notes
7
Notes to Financial Statements
June 30, 2003 (Unaudited)
1. Organization
The Money Market Portfolio (the “Portfolio”) is a series of the PIMCO Variable Insurance Trust (the “Trust”). The Trust is registered under the Investment Company Act of 1940 (the “Act”), as amended, as an open-end investment company organized as a Delaware business trust on October 3, 1997. The Trust may offer up to two classes of shares: Institutional and Administrative. Each share class has identical voting rights (except that shareholders of a class have exclusive voting rights regarding any matter relating solely to that class of shares). Information presented in these financial statements pertains to the Administrative Class of the Trust. Certain detailed financial information for the Institutional Class is provided separately and is available upon request. The Trust is designed to be used as an investment vehicle by Separate Accounts of insurance companies that fund variable annuity contracts and variable life insurance policies and by qualified pension and retirement plans. The Portfolio commenced operations on September 30, 1999.
2. Significant Accounting Policies
The following is a summary of significant accounting policies consistently followed by the Trust in the preparation of its financial statements in conformity with accounting principles generally accepted in the United States of America. The preparation of financial statements in accordance with accounting principles generally accepted in the United States of America requires management to make estimates and assumptions that affect the reported amounts and disclosures in the financial statements. Actual results could differ from those estimates.
Security Valuation. Portfolio securities held by the Portfolio are valued at amortized cost, which approximates current market value. When valuations are not readily available, securities are valued at fair value as determined in accordance with procedures adopted by the Board of Trustees.
Securities Transactions and Investment Income. Securities transactions are recorded as of the trade date. Securities purchased or sold on a when-issued or delayed delivery basis may be settled a month or more after the trade date. Realized gains and losses from securities sold are recorded on the identified cost basis. Dividend income is recorded on the ex-dividend date. Interest income, adjusted for the accretion of discounts and amortization of premiums, is recorded on the accrual basis. Paydowns gains and losses on mortgage- and asset-backed securities are recorded as adjustments to interest income in the Statement of Operations.
Dividends and Distributions to Shareholders. Dividends from net investment income, if any, are declared on each day the Trust is open for business and are distributed to shareholders monthly. All dividends are reinvested in additional shares of the Portfolio. Net realized capital gains earned by the Portfolio, if any, will be distributed no less frequently than once each year.
Income dividends and capital gain distributions are determined in accordance with income tax regulations which may differ from accounting principles generally accepted in the United States of America. These differences are primarily due to differing treatments for such items as wash sales, foreign currency transactions, net operating losses and capital loss carryforwards.
Distributions classified as a tax basis return of capital, if any, are reflected in the accompanying Statements of Changes in Net Assets and have been reclassified to paid in capital. In addition, other amounts have been reclassified between undistributed net investment income, accumulated undistributed net realized gains or losses and/or paid in capital to more appropriately conform financial accounting to tax characterizations of dividend distributions.
Multiclass Operations. Each class offered by the Trust has equal rights as to assets. Income, non-class specific expenses, and realized and unrealized capital gains and losses are allocated to each class of shares based on the relative net assets of each class.
Federal Income Taxes. The Portfolio intends to qualify as a regulated investment company and distribute all of its taxable income and net realized gains, if applicable, to shareholders. Accordingly, no provision for Federal income taxes has been made.
Repurchase Agreements. The Portfolio may engage in repurchase transactions. Under the terms of a typical repurchase agreement, the Portfolio takes possession of an underlying debt obligation subject to an obligation of the seller to repurchase, and the Portfolio to resell, the obligation at an agreed-upon price and time. The market value of the collateral must be equal at all times to the total amount of the repurchase obligations, including interest. Generally, in the event of counterparty default, the Portfolio has the right to use the collateral to offset losses incurred.
3. Fees, Expenses, and Related Party Transactions
Investment Advisory Fee. Pacific Investment Management Company LLC (PIMCO) is a majority owned subsidiary partnership of Allianz Dresdner Asset Management of America L.P. (formerly PIMCO Advisors L.P.) and serves as investment adviser (the “Adviser”) to the Trust, pursuant to an investment advisory contract. The Adviser receives a monthly fee at an annual rate based on average daily net assets of the Portfolio. The Advisory Fee is charged at an annual rate of 0.15%.
Administration Fee. PIMCO serves as administrator (the “Administrator”) and provides administrative services to the Trust for which it receives a monthly administrative fee based on average daily net assets of the Portfolio. The Administration Fee is charged at the annual rate of 0.20%.
8
Servicing Fee. PIMCO Advisors Distributors LLC (“PAD”), is an indirect wholly-owned subsidiary of Allianz Dresdner Asset Management of America L.P. and serves as the distributor of the Trust’s shares. The Trust is permitted to reimburse PAD on a quarterly basis, out of the Administrative Class assets of the Portfolio in the amount of 0.15% on an annual basis of the average daily net assets of that class, for payments made to financial intermediaries that provide services in connection with the distribution of shares or administration of plans or programs that use Portfolio shares as their funding medium. The effective rate paid to PAD during the current fiscal year is 0.15%.
Expenses. The Portfolio is responsible for the following expenses: (i) salaries and other compensation of any of the Trust’s executive officers and employees who are not officers, directors, stockholders or employees of PIMCO or its subsidiaries or affiliates; (ii) taxes and governmental fees; (iii) brokerage fees and commissions and other portfolio transaction expenses; (iv) the cost of borrowing money, including interest expense; (v) fees and expenses of the Trustees who are not “interested persons” of PIMCO or the Trust, and any counsel retained exclusively for their benefit; (vi) extraordinary expenses, including costs of litigation and indemnification expenses; (vii) organization expenses and (viii) any expenses allocated or allocable to a specific class of shares, which include service fees payable with respect to the Administrative Class shares and may include certain other expenses as permitted by the Trust’s Multiple Class Plan adopted pursuant to Rule 18f-3 under the Act and subject to review and approval by the Trustees. The ratio of expenses to average net assets per share class, as disclosed in the Financial Highlights, may differ from the annual Portfolio operating expenses per share class as disclosed in the Prospectus for the reasons set forth above. PIMCO has agreed to waive a portion of its administrative fees to the extent that the payment of the Portfolio’s pro rata share of Trustees’ fees causes the actual expense ratio to rise above the rates disclosed in the current prospectus plus 0.49 basis points as set forth below (calculated as a percentage of the Portfolio’s average daily net assets attributable to each class):
| | | Institutional
Class
| | | Administrative
Class
| |
Money Market Portfolio | | 0.35 | % | | 0.50 | % |
PIMCO may be reimbursed for these waived amounts in future periods. The Trust pays no compensation directly to any Trustee or any other officer who is affiliated with the Administrator, all of whom receive renumeration for their services to the Trust from the Administrator or its affiliates.
Each unaffiliated Trustee receives an annual retainer of $4,000, plus $1,500 for each Board of Trustees meeting attended in person and $250 for each meeting attended telephonically, plus reimbursement of related expenses. In addition, each committee chair receives an additional annual retainer of $500. These expenses are allocated on a pro-rata basis to each Portfolio of the Trust according to its respective net assets.
4. Shares of Beneficial Interest
The Trust may issue an unlimited number of shares of beneficial interest with a $.0001 par value. Changes in shares of beneficial interest were as follows (shares and amounts in thousands):
| | | Money Market Portfolio
| |
| | | Six Months Ended
06/30/2003 | | | Year Ended
12/31/2002 | |
| | | Shares
| | | Amount
| | | Shares
| | | Amount
| |
Receipts for shares sold | | | | | | | | | | | | | | |
Institutional Class | | 1 | | | $ | 1 | | | 0 | | | $ | 0 | |
Administrative Class | | 8,976 | | | | 8,976 | | | 38,288 | | | | 38,288 | |
Issued as reinvestment of distributions | | | | | | | | | | | | | | |
Institutional Class | | 0 | | | | 0 | | | 0 | | | | 0 | |
Administrative Class | | 118 | | | | 118 | | | 291 | | | | 291 | |
Cost of shares redeemed | | | | | | | | | | | | | | |
Institutional Class | | 0 | | | | 0 | | | 0 | | | | 0 | |
Administrative Class | | (7,065 | ) | | | (7,065 | ) | | (25,589 | ) | | | (25,589 | ) |
| | |
|
| |
|
|
| |
|
| |
|
|
|
Net increase resulting from Portfolio share transactions | | 2,030 | | | $ | 2,030 | | | 12,990 | | | $ | 12,990 | |
| | |
|
| |
|
|
| |
|
| |
|
|
|
The following schedule shows the number of shareholders each owning 5% or more of the Portfolio and the total percentage of the Portfolio held by such shareholders:
| | | Number
| | % of Portfolio
Held
|
Money Market Portfolio | | | | |
Institutional Class | | 1 | | 100 |
Administrative Class | | 1 | | 99 |
9
Trustees and Officers
Brent R. Harris, Chairman and Trustee
R. Wesley Burns, President and Trustee
E. Philip Cannon, Trustee
Vern O. Curtis, Trustee
J. Michael Hagan, Trustee
William J. Popejoy, Trustee
Garlin G. Flynn, Secretary
John P. Hardaway, Treasurer
Investment Adviser and Administrator
Pacific Investment Management Company LLC
840 Newport Center Drive
Newport Beach, California 92660
Transfer Agent
National Financial Data Services
330 W. 9th Street, 4th Floor
Kansas City, Missouri 64105
Custodian
State Street Bank & Trust Company
801 Pennsylvania
Kansas City, Missouri 64105
Counsel
Dechert LLP
1775 I Street, N.W.
Washington, D.C. 20006
Independent Accountants
PricewaterhouseCoopers LLP
1055 Broadway
Kansas City, Missouri 64105
PIMCO VARIABLE INSURANCE TRUST
This report is submitted for the general information of the shareholders of the PIMCO Variable Insurance Trust. It is not authorized for distribution to prospective investors unless accompanied or preceded by an effective prospectus for the PIMCO Variable Insurance Trust, which contains information covering its investment policies as well as other pertinent information.
All Funds distributed by PIMCO ADVISORS DISTRIBUTORS LLC, member NASD
840 NEWPORT CENTER DRIVE
NEWPORT BEACH, CA 92660
800.927.4648
WWW.PIMCOADVISORS.COM
WWW.PIMCO.COM
| P I M C O |
| PIMCO VARIABLE INSURANCE TRUST |
| GLOBAL BOND PORTFOLIO |
| ADMINISTRATIVE CLASS |
|
| SEMI-ANNUAL REPORT |
| June 30, 2003 |
Contents
| | | Fund
Summary
| | Schedule of Investments
|
Global Bond Portfolio (Administrative Class) | | 2 | | 7 |
Chairman’s Letter
Dear PIMCO Variable Insurance Trust Shareholder:
Financial assets gained during the first half of 2003 amid a revival of risk appetites as anxiety about the war in Iraq faded. Assets that generally benefit from economic growth, such as stocks, corporate bonds and emerging market debt, fared the best year-to-date as investors returned to these sectors in anticipation of a recovery in the second half of 2003. Reflationary forces that investors expected to fuel a rebound included federal tax cuts and a weak dollar, as well as low borrowing rates that eased the burden of high personal and corporate indebtedness. Low mortgage rates kept refinancings booming in the second quarter and put more money in consumers’ pockets.
U.S. Treasuries lagged their riskier counterparts but still enjoyed a modest rally. Yields fell to levels not seen in 45 years early in the second quarter before bouncing off their lows in June as hopes for recovery increased. The yield on the benchmark 10-year Treasury closed the six-month period 0.30% lower to 3.51%, after nearing 3% earlier in the period. Buyers were encouraged that inflation would remain tame amid low capacity utilization and weak employment growth. Asian central banks bought U.S. Treasuries to limit the rise in their currencies versus the dollar in an effort to protect their export industries. In June, the Federal Reserve cut the federal funds rate by 0.25% to 1%, its 13th easing since 2001, in an effort to boost the economy and ward off deflation. Although the cut was less than expected, the Fed suggested that rates would stay low until deflation risks abated.
On the following pages you will find specific details as to the Portfolio’s total return investment performance and a discussion of those factors that affected performance.
We appreciate the trust you have placed in us, and we will continue to focus our efforts to meet your investment needs.
Sincerely,

Brent R. Harris
Chairman
July 31, 2003
1
Global Bond Portfolio
TOTAL RETURN INVESTMENT PERFORMANCE For the period ended June 30, 2003
| | | 1 Year | | | Since Inception* | |
Global Bond Portfolio Adminstrative Class | | 16.89 | % | | 19.03 | % |
J.P. Morgan Global Index (Unhedged) | | 16.56 | % | | — | |
| * | | Annualized (All Portfolio returns are net of fees and expenses) |
CUMULATIVE RETURNS THROUGH JUNE 30, 2003
$10,000 invested at inception
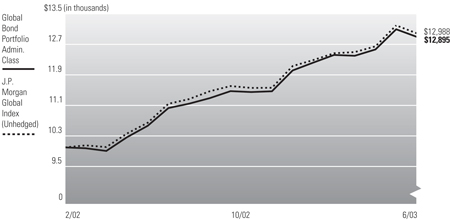
Past performance is no guarantee of future results. Investment return and principal value will fluctuate so that Portfolio shares, when redeemed, may be worth more or less than their original cost. The line graph above assumes the investment of $10,000 on 2/01/02, the first full month following the Portfolio’s Administrative Class inception on 1/10/02, compared to the J.P. Morgan Global Index (Unhedged), an unmanaged market index. It is not possible to invest directly in the Index. The Portfolio may invest in foreign securities which involve potentially higher risks including foreign currency fluctuations and political or economic uncertainty. These risks may be enhanced when investing in emerging market securities.
PORTFOLIO INSIGHTS
| • | | The Global Bond Portfolio seeks to achieve its investment objective by investing under normal circumstances at least 80% of its assets in Fixed Income Instruments of issuers located in at least three countries (one of which may be the United States), which may be represented by futures contracts (including related options) with respect to such securities, and options on such securities. |
| • | | The Portfolio returned 7.32% for the six-month period ended June 30, 2003, outperforming the 7.07% return of the J.P. Morgan Global Index (Unhedged). |
| • | | Above-Index duration on an ex-Japan basis was positive for performance as interest rates declined worldwide. |
| • | | An underweight to intermediate U.S. bonds detracted from performance as these yields fell in response to the Fed’s commitment to fight deflation. |
| • | | An overweight in short and intermediate maturity Euroland bonds was a positive as these yields fell on weak growth, falling inflation and two rate cuts by the European Central Bank. |
| • | | A long position in the euro versus the U.S. dollar was very positive for returns, as the burgeoning U.S. deficit and outflow of U.S. investment weakened the dollar relative to most major currencies. |
| • | | An underweight to Japanese government bonds was a strong positive. JGBs ended the second quarter with a sell-off that took 10-year yields from historic lows to multi-year highs. |
2
Financial Highlights
Global Bond Portfolio (Administrative Class)
| Selected Per Share Data for the Year or Period Ended: | | 06/30/2003 +
| | | 01/10/2002-12/31/2002
| |
Net asset value beginning of period | | $ | 11.69 | | | $ | 10.00 | |
Net investment income (a) | | | 0.11 | | | | 0.27 | |
Net realized/unrealized gain (loss) on investments (a) | | | 0.74 | | | | 1.74 | |
Total income from investment operations | | | 0.85 | | | | 2.01 | |
Dividends from net investment income | | | (0.11 | ) | | | (0.27 | ) |
Distributions from net realized capital gains | | | (0.00 | ) | | | (0.05 | ) |
Total distributions | | | (0.11 | ) | | | (0.32 | ) |
Net asset value end of period | | $ | 12.43 | | | $ | 11.69 | |
Total return | | | 7.32 | % | | | 20.35 | % |
Net assets end of period (000s) | | $ | 25,572 | | | $ | 20,456 | |
Ratio of expenses to average net assets | | | 0.92 | %*(c) | | | 0.90 | %*(b) |
Ratio of net investment income to average net assets | | | 1.83 | %* | | | 2.58 | %* |
Portfolio turnover rate | | | 255 | % | | | 581 | % |
| (a) | | Per share amounts based on average number of shares outstanding during the period. |
| (b) | | If the investment manager had not reimbursed expenses, the ratio of operating expenses to average net assets would have been 1.01%. |
| (c) | | Ratio of expenses to average net assets excluding interest expense is 0.90%. |
See accompanying notes
3
Statement of Assets and Liabilities
Global Bond Portfolio
June 30, 2003 (Unaudited)
Amounts in thousands, except per share amounts
Assets: | | | | |
Investments, at value | | $ | 28,397 | |
Cash | | | 1 | |
Foreign currency, at value | | | 400 | |
Receivable for investments sold | | | 2,318 | |
Unrealized appreciation on forward foreign currency contracts | | | 24 | |
Receivable for Portfolio shares sold | | | 274 | |
Interest receivable | | | 301 | |
Variation margin receivable | | | 17 | |
Swap premiums paid | | | 38 | |
Unrealized appreciation on swap agreements | | | 46 | |
Unrealized appreciation on forward volatility options | | | 3 | |
| | |
|
|
|
| | | | 31,819 | |
| | |
|
|
|
Liabilities: | | | | |
Payable for investments purchased | | $ | 2,113 | |
Unrealized depreciation on forward foreign currency contracts | | | 105 | |
Payable for financing transactions | | | 1,539 | |
Payable for short sale | | | 2,302 | |
Written options outstanding | | | 50 | |
Payable for Portfolio shares redeemed | | | 20 | |
Accrued investment advisory fee | | | 5 | |
Accrued administration fee | | | 10 | |
Accrued servicing fee | | | 5 | |
Swap premiums received | | | 52 | |
Unrealized depreciation on swap agreements | | | 38 | |
Other liabilities | | | 8 | |
| | |
|
|
|
| | | | 6,247 | |
| | |
|
|
|
Net Assets | | $ | 25,572 | |
| | |
|
|
|
Net Assets Consist of: | | | | |
Paid in capital | | $ | 23,590 | |
Undistributed (overdistributed) net investment income | | | (64 | ) |
Accumulated undistributed net realized gain | | | 918 | |
Net unrealized appreciation | | | 1,128 | |
| | |
|
|
|
| | | $ | 25,572 | |
| | |
|
|
|
Net Assets: | | | | |
Administrative Class | | | 25,572 | |
Shares Issued and Outstanding: | | | | |
Administrative Class | | | 2,057 | |
Net Asset Value and Redemption Price Per Share (Net Assets Per Share Outstanding) | | | | |
Administrative Class | | | 12.43 | |
Cost of Investments Owned | | $ | 27,146 | |
Cost of Foreign Currency Held | | $ | 401 | |
See accompanying notes
4
Statement of Operations
Global Bond Portfolio
For the six months ended June 30, 2003 (Unaudited)
Amounts in thousands
Investment Income: | | | | |
Interest | | $ | 266 | |
Miscellaneous income | | | 1 | |
| | |
|
|
|
Total Income | | | 267 | |
| | |
|
|
|
Expenses: | | | | |
Investment advisory fees | | | 24 | |
Administration fees | | | 48 | |
Distribution and/or servicing fees - Administrative Class | | | 14 | |
Interest expense | | | 2 | |
| | |
|
|
|
Total Expenses | | | 88 | |
| | |
|
|
|
Net Investment Income | | | 179 | |
| | |
|
|
|
Net Realized and Unrealized Gain (Loss): | | | | |
Net realized (loss) on investments | | | (12 | ) |
Net realized gain on futures contracts, written options, and swaps | | | 381 | |
Net realized gain on foreign currency transactions | | | 491 | |
Net change in unrealized appreciation on investments | | | 486 | |
Net change in unrealized (depreciation) on futures contracts, written options, and swaps | | | (139 | ) |
Net change in unrealized (depreciation) on translation of assets and liabilities denominated in foreign currencies | | | (213 | ) |
Net Gain | | | 994 | |
| | |
|
|
|
Net Increase in Assets Resulting from Operations | | $ | 1,173 | |
| | |
|
|
|
See accompanying notes
5
Statements of Changes in Net Assets
Global Bond Portfolio
Amounts in thousands
| Increase (Decrease) in Net Assets from: | | Six Months Ended June 30, 2003
| | | Period from January 10, 2002 to December 31, 2002
| |
| | | (Unaudited) | | | | |
Operations: | | | | | | | | |
Net investment income | | $ | 179 | | | $ | 145 | |
Net realized gain | | | 860 | | | | 36 | |
Net change in unrealized appreciation | | | 134 | | | | 994 | |
| | |
|
|
| |
|
|
|
Net increase resulting from operations | | | 1,173 | | | | 1,175 | |
| | |
|
|
| |
|
|
|
Distributions to Shareholders: | | | | | | | | |
From net investment income | | | | | | | | |
Administrative Class | | | (182 | ) | | | (144 | ) |
From net realized capital gains | | | | | | | | |
Administrative Class | | | 0 | | | | (40 | ) |
| | |
|
|
| |
|
|
|
Total Distributions | | | (182 | ) | | | (184 | ) |
| | |
|
|
| |
|
|
|
Portfolio Share Transactions: | | | | | | | | |
Receipts for shares sold | | | | | | | | |
Administrative Class | | | 13,454 | | | | 24,269 | |
Issued as reinvestment of distributions | | | | | | | | |
Administrative Class | | | 182 | | | | 184 | |
Cost of shares redeemed | | | | | | | | |
Administrative Class | | | (9,511 | ) | | | (4,988 | ) |
| | |
|
|
| |
|
|
|
Net increase resulting from Portfolio share transactions | | | 4,125 | | | | 19,465 | |
| | |
|
|
| |
|
|
|
Total Increase in Net Assets | | | 5,116 | | | | 20,456 | |
| | |
|
|
| |
|
|
|
Net Assets: | | | | | | | | |
Beginning of period | | | 20,456 | | | | 0 | |
End of period* | | $ | 25,572 | | | $ | 20,456 | |
*Including (overdistributed) net investment income of: | | $ | (64 | ) | | $ | (61 | ) |
See accompanying notes
6
Schedule of Investments
Global Bond Portfolio
June 30, 2003 (Unaudited)
| | | Principal Amount (000s)
| | Value (000s)
|
CANADA 3.1% | | | | | | |
Commonwealth of Canada | | | | | | |
6.000% due 06/01/2008 | | C$ | 800 | | $ | 647 |
5.500% due 06/01/2009 | | | 100 | | | 79 |
5.500% due 06/01/2010 | | | 100 | | | 79 |
| | | | | |
|
|
Total Canada
(Cost $766) | | | | | | 805 |
| | | | | |
|
|
FRANCE 0.2% | | | | | | |
France Telecom S.A. | | | | | | |
1.010% due 07/16/2003 (a) | | JY | 5,000 | | | 42 |
| | | | | |
|
|
Total France
(Cost $37) | | | | | | 42 |
| | | | | |
|
|
GERMANY 9.2% | | | | | | |
Republic of Germany | | | | | | |
5.000% due 08/19/2005 | | EC | 100 | | | 121 |
6.000% due 01/05/2006 (b) | | | 300 | | | 375 |
6.250% due 04/26/2006 | | | 100 | | | 127 |
5.250% due 07/04/2010 (b) | | | 1,120 | | | 1,430 |
6.500% due 07/04/2027 (b) | | | 200 | | | 289 |
| | | | | |
|
|
Total Germany
(Cost $1,767) | | | | | | 2,342 |
| | | | | |
|
|
ITALY 4.2% | | | | | | |
Republic of Italy | | | | | | |
9.500% due 02/01/2006 | | EC | 650 | | | 879 |
Seashell Securities PLC | | | | | | |
2.852% due 10/25/2028 (a) | | | 100 | | | 115 |
Telecom Italia SpA | | | | | | |
5.625% due 02/01/2007 | | | 60 | | | 73 |
| | | | | |
|
|
Total Italy
(Cost $813) | | | | | | 1,067 |
| | | | | |
|
|
JAPAN 5.8% | | | | | | |
Government of Japan | | | | | | |
1.500% due 12/20/2011 (b) | | JY | 100,000 | | | 886 |
1.300% due 09/20/2012 (b) | | | 30,000 | | | 261 |
2.600% due 03/20/2019 (b) | | | 30,000 | | | 307 |
1.900% due 09/20/2022 (b) | | | 3,000 | | | 28 |
| | | | | |
|
|
Total Japan
(Cost $1,516) | | | | | | 1,482 |
| | | | | |
|
|
NETHERLANDS 3.4% | | | | | | |
Kingdom of Netherlands | | | | | | |
6.000% due 01/15/2006 | | EC | 700 | | | 876 |
| | | | | |
|
|
Total Netherlands
(Cost $682) | | | | | | 876 |
| | | | | |
|
|
SPAIN 4.5% | | | | | | |
Kingdom of Spain | | | | | | |
5.150% due 07/30/2009 | | EC | 900 | | | 1,142 |
| | | | | |
|
|
Total Spain
(Cost $1,154) | | | | | | 1,142 |
| | | | | |
|
|
UNITED KINGDOM 8.7% | | | | | | |
Holmes Financing PLC | | | | | | |
2.782% due 07/25/2010 (a) | | EC | 100 | | | 115 |
United Kingdom Gilt | | | | | | |
7.250% due 12/07/2007 | | BP | 850 | | | 1,601 |
5.000% due 03/07/2008 | | | 300 | | | 521 |
| | | | | |
|
|
Total United Kingdom
(Cost $2,170) | | | | | | 2,237 |
| | | | | |
|
|
UNITED STATES 37.0% | | | | | | |
Asset-Backed Securities 0.4% | | | | | | |
Amortizing Residential Collateral Trust | | | | | | |
1.385% due 10/25/2031 (a) | | $ | 48 | | $ | 48 |
Morgan Stanley Dean Witter Capital I | | | | | | |
1.405% due 07/25/2030 (a) | | | 51 | | | 51 |
| | | | | |
|
|
| | | | | | | 99 |
| | | | | |
|
|
Corporate Bonds & Notes 1.7% | | | | | | |
CIT Group, Inc. | | | | | | |
5.625% due 05/17/2004 | | | 40 | | | 41 |
Comcast Corp. | | | | | | |
7.050% due 03/15/2033 | | | 100 | | | 112 |
Entergy Gulf States, Inc. | | | | | | |
2.040% due 06/18/2007 (a) | | | 50 | | | 50 |
Pemex Project Funding Master Trust | | | | | | |
8.625% due 02/01/2022 | | | 200 | | | 229 |
| | | | | |
|
|
| | | | | | | 432 |
| | | | | |
|
|
Mortgage-Backed Securities 16.1% | | | | | | |
Countrywide Home Loans, Inc. | | | | | | |
5.521% due 03/19/2032 (a) | | | 7 | | | 7 |
4.855% due 09/19/2032 (a) | | | 41 | | | 42 |
Fannie Mae | | | | | | |
5.500% due 10/01/2016 | | | 200 | | | 208 |
5.500% due 01/01/2018 | | | 1,200 | | | 1,247 |
5.500% due 04/01/2018 | | | 400 | | | 416 |
6.250% due 05/25/2027 | | | 26 | | | 27 |
5.371% due 04/01/2033 (a) | | | 89 | | | 91 |
5.000% due 12/31/2099 | | | 1,300 | | | 1,343 |
Freddie Mac | | | | | | |
5.000% due 09/15/2016 | | | 84 | | | 87 |
4.395% due 02/01/2029 (a) | | | 80 | | | 83 |
4.500% due 08/15/2031 | | | 98 | | | 99 |
GMAC Commercial Mortgage Securities, Inc. | | | | | | |
6.420% due 05/15/2035 | | | 100 | | | 115 |
Government National Mortgage Association | | | | | | |
5.625% due 11/20/2024 (a) | | | 25 | | | 26 |
GSR Mortgage Loan Trust | | | | | | |
6.000% due 07/25/2032 | | | 57 | | | 58 |
Sequoia Mortgage Trust | | | | | | |
1.403% due 08/20/2032 (a) | | | 73 | | | 73 |
1.670% due 04/20/2033(a)(j) | | | 100 | | | 100 |
Structured Asset Securities Corp. | | | | | | |
1.485% due 06/25/2017 (a) | | | 27 | | | 27 |
Washington Mutual Mortgage Securities Corp. | | | | | | |
6.000% due 03/25/2032 | | | 31 | | | 32 |
5.207% due 10/25/2032 (a) | | | 50 | | | 51 |
| | | | | |
|
|
| | | | | | | 4,132 |
| | | | | |
|
|
Municipal Bonds & Notes 1.3% | | | | | | |
Connecticut State General Obligation Bonds, Series 2001 | | | | | | |
5.500% due 12/15/2013 | | | 100 | | | 119 |
New York City, New York Transitional Finance Authority Revenue Bonds, Series 2002 | | | | | | |
5.250% due 08/01/2011 | | | 100 | | | 115 |
New York, New York General Obligation Bonds, Series 2003 | | | | | | |
5.250% due 06/01/2028 | | | 100 | | | 103 |
| | | | | |
|
|
| | | | | | | 337 |
| | | | | |
|
|
U.S. Government Agencies 4.8% | | | | | | |
Fannie Mae | | | | | | |
3.250% due 11/14/2005 | | | 100 | | | 101 |
3.875% due 11/21/2005 | | | 100 | | | 101 |
3.200% due 02/06/2007 | | | 100 | | | 100 |
5.250% due 03/22/2007 | | | 100 | | | 103 |
4.640% due 01/30/2008 | | | 200 | | | 207 |
6.250% due 02/17/2011 | | | 200 | | | 205 |
Federal Home Loan Bank | | | | | | |
2.340% due 12/15/2005 | | | 100 | | | 100 |
4.375% due 08/15/2007 | | | 100 | | | 100 |
Freddie Mac | | | | | | |
2.875% due 09/26/2005 | | $ | 100 | | $ | 100 |
6.000% due 05/25/2012 | | | 100 | | | 104 |
| �� | | | | |
|
|
| | | | | | | 1,221 |
| | | | | |
|
|
U.S. Treasury Obligations 12.7% | | | | | | |
Treasury Inflation Protected Securities (d) | | | | | | |
3.375% due 01/15/2007 | | | 232 | | | 255 |
3.625% due 01/15/2008 | | | 114 | | | 128 |
3.875% due 01/15/2009 | | | 112 | | | 128 |
U.S. Treasury Bonds | | | | | | |
6.250% due 08/15/2023 | | | 1,000 | | | 1,225 |
U.S. Treasury Notes | | | | | | |
6.500% due 02/15/2010 | | | 300 | | | 364 |
U.S. Treasury Strips | | | | | | |
0.000% due 05/15/2017 | | | 430 | | | 234 |
0.000% due 05/15/2017 | | | 1,700 | | | 918 |
| | | | | |
|
|
| | | | | | | 3,252 |
| | | | | |
|
|
Total United States
(Cost $9,310) | | | | | | 9,473 |
| | | | | |
|
|
PURCHASED PUT OPTIONS 0.0% | | | | | | |
Euro-Bobl June Futures (OTC) | | | | | | |
Strike @ 100.000 Exp. 07/07/2003 | | $ | 1,600 | | | 0 |
| | | | | |
|
|
Total Purchased Put Options
(Cost $0) | | | | | | 0 |
| | | | | |
|
|
SHORT-TERM INSTRUMENTS 34.9% | | | | | | |
Commercial Paper 33.2% | | | | | | |
CBA Finance, Inc. | | | | | | |
1.220% due 07/08/2003 | | $ | 600 | | | 600 |
CDC Commercial Corp. | | | | | | |
1.050% due 07/23/2003 | | | 400 | | | 400 |
Danske Corp. | | | | | | |
1.230% due 07/28/2003 | | | 600 | | | 599 |
Fannie Mae | | | | | | |
1.170% due 07/02/2003 | | | 100 | | | 100 |
1.210% due 07/09/2003 | | | 400 | | | 400 |
1.165% due 08/13/2003 | | | 300 | | | 300 |
1.180% due 08/25/2003 | | | 800 | | | 798 |
1.135% due 09/30/2003 | | | 700 | | | 698 |
Federal Home Loan Bank | | | | | | |
1.165% due 08/01/2003 | | | 600 | | | 599 |
1.140% due 08/06/2003 | | | 800 | | | 799 |
HBOS Treasury Services PLC | | | | | | |
1.220% due 08/05/2003 | | | 900 | | | 899 |
Royal Bank of Scotland PLC | | | | | | |
1.245% due 07/03/2003 | | | 600 | | | 600 |
Svenska Handelsbank, Inc. | | | | | | |
1.010% due 07/25/2003 | | | 300 | | | 300 |
UBS Finance, Inc. | | | | | | |
1.030% due 08/29/2003 | | | 300 | | | 299 |
Westpac Capital Corp. | | | | | | |
1.190% due 08/12/2003 | | | 700 | | | 699 |
World Bank | | | | | | |
1.010% due 07/21/2003 | | | 400 | | | 400 |
| | | | | |
|
|
| | | | | | | 8,490 |
| | | | | |
|
|
Repurchase Agreement 0.8% | | | | | | |
State Street Bank | | | | | | |
0.800% due 07/01/2003 | | | 201 | | | 201 |
(Dated 06/30/2003. Collateralized by Federal Home Loan Bank 3.000% due 01/30/2004 valued at $210. Repurchase proceeds are $201.) | | | | | | |
| | | | | |
|
|
U.S. Treasury Bills 0.9% | | | | | | |
1.075% due 08/07/2003-08/14/2003 (c)(e) | | | 240 | | | 240 |
| | | | | |
|
|
Total Short-Term Instruments
(Cost $8,931) | | | | | | 8,931 |
| | | | | |
|
|
See accompanying notes
7
Total Investments 111.0%
(Cost $27,146) | | $ | 28,397 | |
Written Options (f) (0.2%)
(Premiums $29) | | | (50 | ) |
Other Assets and Liabilities (Net) (10.8%) | | | (2,775 | ) |
| | |
|
|
|
Net Assets 100.0% | | $ | 25,572 | |
| | |
|
|
|
Notes to Schedule of Investments
(amounts in thousands, except number of contracts):
| (a) | | Variable rate security. The rate listed is as of June 30, 2003. |
| (b) | | Security, or a portion thereof, subject to financing transaction. |
| (c) | | Securities are grouped by coupon or range of coupons and represent a range of maturities. |
| (d) | | Principal amount of security is adjusted for inflation. |
| (e) | | Securities with an aggregate market value of $240 have been segregated with the custodian to cover margin requirements for the following open futures contracts at June 30, 2003: |
Type
| | # of Contracts
| | Unrealized Appreciation/ (Depreciation)
| |
Euribor March Futures (03/2004) - Long | | 2 | | $ | 8 | |
Euro-Bobl 5 Year Note (09/2003) - Long | | 21 | | | (23 | ) |
Euro-Bund 10 Year Note (09/2003) - Long | | 39 | | | (69 | ) |
U.S. Treasury 10 year Note (09/2003) - Long | | 12 | | | (13 | ) |
| | | | |
|
|
|
| | | | | $ | (97 | ) |
| | | | |
|
|
|
| (f) | | Premiums received on written options: |
Type
| | Notional Amount
| | Premium
| | Value
|
Call - OTC 10 Year Interest Rate Swap | | | | | | | | | |
Strike @ 5.130%* Exp. 11/10/2003 | | $ | 400,000 | | $ | 8 | | $ | 37 |
Put - OTC 10 Year Interest Rate Swap | | | | | | | | | |
Strike @ 6.000%** Exp. 09/23/2005 | | | 100,000 | | | 3 | | | 2 |
Call - OTC 7 Year Interest Rate Swap | | | | | | | | | |
Strike @ 4.000%* Exp. 09/23/2005 | | | 100,000 | | | 2 | | | 3 |
Put - OTC 10 Year Interest Rate Swap | | | | | | | | | |
Strike @ 6.000%** Exp. 03/05/2004 | | | 200,000 | | | 1 | | | 1 |
Call - OTC 10 Year Interest Rate Swap | | | | | | | | | |
Strike @ 4.000%* Exp. 03/05/2004 | | | 10,000 | | | 2 | | | 2 |
Call - OTC 10 Year Interest Rate Swap | | | | | | | | | |
Strike @ 3.250%* Exp. 10/20/2003 | | | 150,000 | | | 2 | | | 0 |
| | | | | |
|
| |
|
|
| | | | | | $ | 18 | | $ | 45 |
| | | | | |
|
| |
|
|
Type
| | # of Contracts
| | Premium
| | Value
|
Call - CBOT U.S. Treasury Note September Futures | | | | | | | | |
Strike @ 117.000 Exp. 08/23/2003 | | 1 | | $ | 0 | | $ | 2 |
Call - CBOT U.S. Treasury Note September Futures | | | | | | | | |
Strike @ 121.000 Exp. 08/23/2003 | | 15 | | | 11 | | | 3 |
| | | | |
|
| |
|
|
| | | | | $ | 11 | | $ | 5 |
| | | | |
|
| |
|
|
| * | | The Portfolio will receive a floating rate based on 3-month LIBOR. |
| ** | | The Portfolio will pay a floating rate based on 3-month LIBOR. |
| (g) | | Written options with premiums to be determined on a future date: |
Type
| | # of Contracts
| | Unrealized Appreciation
|
Call & Put - OTC% U.S. Dollar Forward Delta / Neutral | | | | | |
Straddle vs. Japanese Yen Strike and premium determined on 12/18/2007, based upon implied volatility parameter of 18.5000% Counterparty: AIG International, Inc. Exp. 12/18/2012 | | 50 | | $ | 3 |
| | | | |
|
|
| (h) | | Swap agreements outstanding at June 30, 2003: |
Type
| | Notional Amount
| | Unrealized Appreciation/ (Depreciation)
| |
Receive a fixed rate equal to 4.500% and pay floating rate based on 6-month BP-LIBOR. Counterparty: Merrill Lynch & Co., Inc. | | | | | | | |
Exp. 03/18/2009 | | BP | 200 | | $ | 7 | |
Receive floating rate based on 6-month BP-LIBOR and pay a fixed rate equal to 5.000%.
Counterparty: Morgan Stanley Dean Witter & Co. | | | | | | | |
Exp. 03/15/2017 | | | 800 | | | (2 | ) |
Receive floating rate based on 6-month BP-LIBOR and pay a fixed rate equal to 5.000%.
Counterparty: J.P. Morgan Chase & Co. | | | | | | | |
Exp. 03/20/2018 | | | 600 | | | (1 | ) |
Receive floating rate based on 6-month BP-LIBOR and pay a fixed rate equal to 5.500%.
Counterparty: Merrill Lynch & Co., Inc. | | | | | | | |
Exp. 03/15/2016 | | | 300 | | | (6 | ) |
Receive a fixed rate equal to 4.000% and pay floating rate based on 6 month EC-LIBOR.
Counterparty: Merrill Lynch & Co., Inc. | | | | | | | |
Exp. 03/15/2007 | | EC | 400 | | | 1 | |
Receive a fixed rate equal to 4.000% and pay floating rate based on 6-month EC-LIBOR.
Counterparty: Goldman Sachs & Co. | | | | | | | |
Exp. 03/15/2007 | | | 100 | | | 0 | |
Receive a fixed rate equal to 6.000% and pay floating rate based on 6-month EC-LIBOR.
Counterparty: Morgan Stanley Dean Witter & Co. | | | | | | | |
Exp. 03/15/2017 | | | 1,200 | | | 10 | |
Receive a fixed rate equal to 6.000% and pay floating rate based on 6-month EC-LIBOR.
Counterparty: J.P. Morgan Chase & Co. | | | | | | | |
Exp. 03/20/2018 | | | 700 | | | 2 | |
Receive floating rate based on 6-month EC-LIBOR and pay a fixed rate equal to 5.000%.
Counterparty: Goldman Sachs & Co. | | | | | | | |
Exp. 06/17/2012 | | EC | 100 | | $ | (10 | ) |
Receive floating rate based on 6-month EC-LIBOR and pay a fixed rate equal to 5.500%.
Counterparty: Morgan Stanley Dean Witter & Co. | | | | | | | |
Exp. 12/15/2031 | | | 100 | | | (14 | ) |
Receive floating rate based on 3-month H$-HIBOR and pay a fixed rate equal to 5.753%.
Counterparty: Goldman Sachs & Co. | | | | | | | |
Exp. 02/28/2006 | | H$ | 1,200 | | | (5 | ) |
Receive a fixed rate equal to 4.800% and the Portfolio will pay to the counterparty at par in the event of default of Time Warner, Inc. 0.000% due 12/06/2019.
Counterparty: Merrill Lynch & Co., Inc. | | | | | | | |
Exp. 12/06/2004 | | $ | 50 | | | 3 | |
Receive floating rate based on 3-month LIBOR and pay a fixed rate equal to 4.000%.
Counterparty: Goldman Sachs & Co. | | | | | | | |
Exp. 12/17/2013 | | | 100 | | | 3 | |
Receive floating rate based on 3-month LIBOR and pay a fixed rate equal to 4.000%.
Counterparty: Bank of America, N.A. | | | | | | | |
Exp. 12/17/2008 | | | 200 | | | 4 | |
Receive floating rate based on 3-month LIBOR and pay a fixed rate equal to 5.000%.
Counterparty: Merrill Lynch & Co., Inc. | | | | | | | |
Exp. 12/17/2023 | | | 400 | | | 16 | |
| | | | | |
|
|
|
| | | | | | $ | 8 | |
| | | | | |
|
|
|
| (i) | | Principal amount denoted in indicated currency: |
A$ – Australian Dollar
BP – British Pound
C$ – Canadian Dollar
DK – Danish Krone
EC – Euro
H$ – Hong Kong Dollar
JY – Japanese Yen
SK – Swedish Krona
| (j) | | Indicates a fair valued security which has not been valued utilizing an independent quote and which is valued pursuant to guidelines established by the Trustees. The aggregate value of fair valued securities is $100, which is 0.39% of net assets. |
See accompanying notes
8
| (j) | | Foreign forward currency contracts outstanding at June 30, 2003: |
Type
| | Currency
| | Principal Amount Covered by Contract
| | Settlement Month
| | Unrealized Appreciation
| | Unrealized (Depreciation)
| | | Net Unrealized Appreciation/ (Depreciation)
| |
Buy | | A$ | | 168 | | 09/2003 | | $ | 1 | | $ | 0 | | | $ | 1 | |
Buy | | BP | | 40 | | 07/2003 | | | 0 | | | 0 | | | | 0 | |
Sell | | BP | | 294 | | 07/2003 | | | 9 | | | 0 | | | | 9 | |
Sell | | C$ | | 315 | | 07/2003 | | | 2 | | | 0 | | | | 2 | |
Buy | | DK | | 1,974 | | 09/2003 | | | 0 | | | (6 | ) | | | (6 | ) |
Buy | | EC | | 4,444 | | 07/2003 | | | 0 | | | (22 | ) | | | (22 | ) |
Sell | | EC | | 1,044 | | 07/2003 | | | 12 | | | 0 | | | | 12 | |
Buy | | JY | | 444,925 | | 07/2003 | | | 0 | | | (45 | ) | | | (45 | ) |
Buy | | JY | | 362,128 | | 09/2003 | | | 0 | | | (27 | ) | | | (27 | ) |
Buy | | SK | | 1,422 | | 09/2003 | | | 0 | | | (5 | ) | | | (5 | ) |
| | | | | | | | |
|
| |
|
|
| |
|
|
|
| | | | | | | | | $ | 24 | | $ | (105 | ) | | $ | (81 | ) |
| | | | | | | | |
|
| |
|
|
| |
|
|
|
| (k) | | Short sales open at June 30, 2003 were as follows: |
Type
| | Coupon (%)
| | Maturity
| | Par
| | Value
| | Proceeds
|
U.S. Treasury Note | | 4.875 | | 02/15/2012 | | $ | 300 | | $ | 334 | | $ | 338 |
U.S. Treasury Note | | 4.375 | | 08/15/2012 | | | 200 | | | 214 | | | 220 |
U.S. Treasury Note | | 3.000 | | 11/15/2007 | | | 1,700 | | | 1,754 | | | 1,760 |
| | | | | | | | | |
|
| |
|
|
| | | | | | | | | | $ | 2,302 | | $ | 2,318 |
| | | | | | | | | |
|
| |
|
|
See accompanying notes
9
Notes to Financial Statements
June 30, 2003 (Unaudited)
1. Organization
The Global Bond Portfolio (the “Portfolio”) is a series of the PIMCO Variable Insurance Trust (the “Trust”). The Trust is registered under the Investment Company Act of 1940 (the “Act”), as amended, as an open-end investment company organized as a Delaware business trust on October 3, 1997. The Trust may offer up to two classes of shares: Institutional and Administrative. Each share class has identical voting rights (except that shareholders of a class have exclusive voting rights regarding any matter relating solely to that class of shares). Information presented in these financial statements pertains to the Administrative Class of the Trust. The Trust is designed to be used as an investment vehicle by Separate Accounts of insurance companies that fund variable annuity contracts and variable life insurance policies and by qualified pension and retirement plans. The Portfolio commenced operations on January 10, 2002.
2. Significant Accounting Policies
The following is a summary of significant accounting policies consistently followed by the Trust in the preparation of its financial statements in conformity with accounting principles generally accepted in the United States of America. The preparation of financial statements in accordance with accounting principles generally accepted in the United States of America requires management to make estimates and assumptions that affect the reported amounts and disclosures in the financial statements. Actual results could differ from those estimates.
Security Valuation. Portfolio securities and other financial instruments for which market quotations are readily available are stated at market value. Market value is determined at the close of regular trading (normally, 4:00 p.m., Eastern Time) on the New York Stock Exchange on each day the New York Stock Exchange is open, or if no sales are reported, as is the case for most securities traded over-the-counter, the mean between representative bid and asked quotations obtained from a quotation reporting system or from established market makers. Fixed income securities, including those to be purchased under firm commitment agreements, are normally valued on the basis of quotes obtained from brokers and dealers or pricing services. Short-term investments, which mature in 60 days or less are valued at amortized cost, which approximates market value. Certain fixed income securities for which daily market quotations are not readily available may be valued, pursuant to guidelines established by the Board of Trustees, with reference to fixed income securities whose prices are more readily obtainable. Prices may be obtained from independent pricing services which use information provided by market makers or estimates of market values obtained from yield data relating to investments or securities with similar characteristics. The prices used by the Portfolio may differ from the value that would be realized if the securities were sold and the differences could be material to the financial statements.
Securities Transactions and Investment Income. Securities transactions are recorded as of the trade date. Securities purchased or sold on a when-issued or delayed delivery basis may be settled a month or more after the trade date. Realized gains and losses from securities sold are recorded on the identified cost basis. Dividend income is recorded on the ex-dividend date, except certain dividends from foreign securities where the ex-dividend date may have passed, are recorded as soon as the Portfolio is informed of the ex-dividend date. Interest income, adjusted for the accretion of discounts and amortization of premiums, is recorded on the accrual basis. Paydowns gains and losses on mortgage- and asset-backed securities are recorded as adjustments to interest income in the Statement of Operations.
Dividends and Distributions to Shareholders. Dividends from net investment income, if any, are declared on each day the Trust is open for business and are distributed to shareholders monthly. All dividends are reinvested in additional shares of the Portfolio. Net realized capital gains earned by the Portfolio, if any, will be distributed no less frequently than once each year.
Income dividends and capital gain distributions are determined in accordance with income tax regulations which may differ from accounting principles generally accepted in the United States of America. These differences are primarily due to differing treatments for such items as wash sales, foreign currency transactions, net operating losses and capital loss carryforwards.
Distributions classified as a tax basis return of capital, if any, are reflected in the accompanying Statements of Changes in Net Assets and have been reclassified to paid in capital. In addition, other amounts have been reclassified between undistributed net investment income, accumulated undistributed net realized gains or losses and/or paid in capital to more appropriately conform financial accounting to tax characterizations of dividend distributions.
Foreign Currency. The accounting records of the Portfolio are maintained in U.S. dollars. The market values of foreign securities, currency holding and other assets and liabilities are translated into U.S. dollars based on the current exchange rates each business day. Fluctuations in the value of these assets and liabilities resulting from changes in exchange rates are recorded as unrealized foreign currency gains or losses. Realized gains or losses and unrealized appreciation (depreciation) on investment securities and income and expenses are translated on the respective dates of such transactions. The effect of changes in foreign currency exchange rates on investments in securities are not segregated in the Statement of Operations from the effects
10
of changes in market prices of those securities, but are included with the net realized and unrealized gain or loss on investment securities.
Federal Income Taxes. The Portfolio intends to qualify as a regulated investment company and distribute all of its taxable income and net realized gains, if applicable, to shareholders. Accordingly, no provision for Federal income taxes has been made.
Financing Transactions. The Portfolio may enter into financing transactions consisting of the sale by the Portfolio of securities, together with a commitment to repurchase similar securities at a future date. The difference between the selling price and the future purchase price is an adjustment to interest income in the Statement of Operations. If the counterparty to whom the Portfolio sells the security becomes insolvent, the Portfolio’s right to repurchase the security may be restricted; the value of the security may change over the term of the financing transaction; and the return earned by the Portfolio with the proceeds of a financing transaction may not exceed transaction costs. The Portfolio will designate assets determined to be liquid by PIMCO or otherwise cover its obligations under financing transactions.
Futures Contracts. The Portfolio is authorized to enter into futures contracts. The Portfolio may use futures contracts to manage its exposure to the securities markets or to movements in interest rates and currency values. The primary risks associated with the use of futures contracts are imperfect correlation between the change in market value of the securities held by the Portfolio and the prices of futures contracts, the possibility of an illiquid market, and the inability of the counterparty to meet the terms of the contract. Futures contracts are valued based upon their quoted daily settlement prices. Upon entering into a futures contract, the Portfolio may be required to deposit with its custodian, in a segregated account in the name of the futures broker, an amount of cash or U.S. Government and Agency Obligations in accordance with the initial margin requirements of the broker or exchange. Futures contracts are marked to market daily and an appropriate payable or receivable for the change in value (“variation margin”) is recorded by the Portfolio. Gains or losses are recognized but not considered realized until the contracts expire or are closed. Futures contracts involve, to varying degrees, risk of loss in excess of the variation margin disclosed in the Statement of Assets and Liabilities.
Options Contracts. The Portfolio may write call and put options on futures, securities or currencies it owns or in which it may invest. Writing put options tends to increase the Portfolio’s exposure to the underlying instrument. Writing call options tends to decrease the Portfolio’s exposure to the underlying instrument. When the Portfolio writes a call or put option, an amount equal to the premium received is recorded as a liability and subsequently marked to market to reflect the current value of the option written. Payment received or made, if any, from writing options with premiums to be determined on a future date are reflected as such on the Statement of Assets and Liabilities. Premiums received from writing options which expire are treated as realized gains. Premiums received from writing options which are exercised or closed are added to the proceeds or offset against amounts paid on the underlying future, security or currency transaction to determine the realized gain or loss. The Portfolio as a writer of an option has no control over whether the underlying future, security or currency may be sold (call) or purchased (put) and as a result bears the market risk of an unfavorable change in the price of the future, security or currency underlying the written option. There is the risk the Portfolio may not be able to enter into a closing transaction because of an illiquid market.
The Portfolio may also purchase put and call options. Purchasing call options tends to increase the Portfolio’s exposure to the underlying instrument. Purchasing put options tends to decrease the Portfolio’s exposure to the underlying instrument. The Portfolio pays a premium which is included in the Portfolio’s Statement of Assets and Liabilities as an investment and subsequently marked to market to reflect the current value of the option. Premiums paid for purchasing options which expire are treated as realized losses. The risk associated with purchasing put and call options is limited to the premium paid. Premiums paid for purchasing options which are exercised or closed are added to the amounts paid or offset against the proceeds on the underlying future, security or currency transaction to determine the realized gain or loss.
Forward Currency Transactions. The Portfolio may enter into forward currency contracts and forward cross-currency contracts in connection with settling planned purchases or sales of securities or to hedge the currency exposure associated with some or all of the Portfolio’s securities. A forward currency contract is an agreement between two parties to buy and sell a currency at a set price on a future date. The market value of a forward currency contract fluctuates with changes in forward currency exchange rates. Forward currency contracts are marked to market daily and the change in value is recorded by the Portfolio as an unrealized gain or loss. Realized gains or losses equal to the difference between the value of the contract at the time it was opened and the value at the time it was closed are recorded upon delivery or receipt of the currency or, if a forward currency contract is offset by entering into another forward currency contract with the same broker, upon settlement of the net gain or loss. These contracts may involve market risk in excess of the unrealized gain or loss reflected in the Portfolio’s Statement of Assets and Liabilities.
11
In addition, the Portfolio could be exposed to risk if the counterparties are unable to meet the terms of the contracts or if the value of the currency changes unfavorably to the U.S. dollar.
Short Sales. The Portfolio has entered into short sales transactions during the fiscal year. A short sale is a transaction in which a Portfolio sells securities it does not own in anticipation of a decline in the market price of the securities. The Portfolio is obligated to deliver securities at the market price at the time the short position is closed. Possible losses from short sales may be unlimited, whereas losses from purchases cannot exceed the total amount invested.
Swap Agreements. The Portfolio may invest in swap agreements. A swap is an agreement to exchange the return generated by one instrument for the return generated by another instrument. The Portfolio may enter into interest rate, total return, forward swap spread lock and credit default swap agreements to manage its exposure to interest rates and credit risk. Interest rate swap agreements involve the exchange by the Portfolio with another party of their respective commitments to pay or receive interest, e.g., an exchange of floating rate payments for fixed rate payments with respect to a notional amount of principal. Total return swap agreements involve commitments to pay interest in exchange for a market-linked return, both based on notional amounts. To the extent the total return of the security or index underlying the transaction exceeds or falls short of the offsetting interest rate obligation, the Portfolio will receive a payment from or make a payment to the counterparty. Forward spread lock swap agreements involve commitments to pay or receive a settlement amount calculated as the difference between the swap spread and a fixed spread, multiplied by the notional amount times the duration of the swap. The swap spread is the difference between the benchmark swap rate (market rate) and the specific Treasury rate. In a credit default swap, one party makes a stream of payments to another party in exchange for the right to receive a specified return in the event of a default by a third party, typically corporate issues or sovereign issues of an emerging country, on its obligation. The Portfolio may use credit default swaps to provide a measure of protection against defaults of sovereign issuers (i.e., to reduce risk where the Portfolio owns or has exposure to the sovereign issuer) or to take an active long or short position with respect to the likelihood of a particular issuer’s default. Swaps are marked to market daily based upon quotations from market makers and vendors and the change in value, if any, is recorded as unrealized gain or loss in the Statement of Operations. Payments received or made at the beginning of the measurement period are reflected as such on the Statement of Assets and Liabilities. A liquidation payment received or made at the termination of the swap is recorded as realized gain or loss in the Statement of Operations. Net periodic payments are included as part of miscellaneous income on the Statement of Operations. Entering into these agreements involves, to varying degrees, elements of credit, market and documentation risk in excess of the amounts recognized on the Statement of Assets and Liabilities. Such risks involve the possibility that there will be no liquid market for these agreements, that the counterparty to the agreements may default on its obligation to perform or disagree as to the meaning of contractual terms in the agreements, and that there may be unfavorable changes in interest rates.
Delayed Delivery Transactions. The Portfolio may purchase or sell securities on a when-issued or delayed delivery basis. These transactions involve a commitment by the Portfolio to purchase or sell securities for a predetermined price or yield, with payment and delivery taking place beyond the customary settlement period. When delayed delivery purchases are outstanding, the Portfolio will set aside and maintain until the settlement date in a segregated account, liquid assets in an amount sufficient to meet the purchase price. When purchasing a security on a delayed delivery basis, the Portfolio assumes the rights and risks of ownership of the security, including the risk of price and yield fluctuations, and takes such fluctuations into account when determining its net asset value. The Portfolio may dispose of or renegotiate a delayed delivery transaction after it is entered into, and may sell when-issued securities before they are delivered, which may result in a capital gain or loss. When the Portfolio has sold a security on a delayed delivery basis, the Portfolio does not participate in future gains and losses with respect to the security.
Inflation-Indexed Bonds. Inflation-indexed bonds are fixed income securities whose principal value is periodically adjusted to the rate of inflation. The interest rate on these bonds is generally fixed at issuance at a rate lower than typical bonds. Over the life of an inflation-indexed bond, however, interest will be paid based on a principal value, which is adjusted for inflation. Any increase in the principal amount of an inflation-indexed bond will be included as interest income in the Statement of Operations, even though investors do not receive their principal until maturity.
Repurchase Agreements. The Portfolio may engage in repurchase transactions. Under the terms of a typical repurchase agreement, the Portfolio takes possession of an underlying debt obligation subject to an obligation of the seller to repurchase, and the Portfolio to resell, the obligation at an agreed-upon price and time. The market value of the collateral must be equal at all times to the total amount of the repurchase obligations, including interest. Generally, in the event of counterparty default, the Portfolio has the right to use the collateral to offset losses incurred.
12
3. Fees, Expenses, and Related Party Transactions
Investment Advisory Fee. Pacific Investment Management Company LLC (PIMCO) is a majority owned subsidiary partnership of Allianz Dresdner Asset Management of America L.P. (formerly PIMCO Advisors L.P.) and serves as investment adviser (the “Adviser”) to the Trust, pursuant to an investment advisory contract. The Adviser receives a monthly fee at an annual rate based on average daily net assets of the Portfolio. The Advisory Fee is charged at an annual rate of 0.25%.
Administration Fee. PIMCO serves as administrator (the “Administrator”) and provides administrative services to the Trust for which it receives a monthly administrative fee based on average daily net assets of the Portfolio. The Administration Fee is charged at the annual rate of 0.50%.
Servicing Fee. PIMCO Advisors Distributors LLC (“PAD”), is an indirect wholly-owned subsidiary of Allianz Dresdner Asset Management of America L.P. and serves as the distributor of the Trust’s shares. The Trust is permitted to reimburse PAD on a quarterly basis, out of the Administrative Class assets of the Portfolio in the amount of 0.15% on an annual basis of the average daily net assets of that class, for payments made to financial intermediaries that provide services in connection with the distribution of shares or administration of plans or programs that use Portfolio shares as their funding medium. The effective rate paid to PAD during the current fiscal year is 0.15%.
Expenses. The Portfolio is responsible for the following expenses: (i) salaries and other compensation of any of the Trust’s executive officers and employees who are not officers, directors, stockholders or employees of PIMCO or its subsidiaries or affiliates; (ii) taxes and governmental fees; (iii) brokerage fees and commissions and other portfolio transaction expenses; (iv) the cost of borrowing money, including interest expense; (v) fees and expenses of the Trustees who are not “interested persons” of PIMCO or the Trust, and any counsel retained exclusively for their benefit; (vi) extraordinary expenses, including costs of litigation and indemnification expenses; (vii) organization expenses and (viii) any expenses allocated or allocable to a specific class of shares, which include service fees payable with respect to the Administrative Class shares and may include certain other expenses as permitted by the Trust’s Multiple Class Plan adopted pursuant to Rule 18f-3 under the Act and subject to review and approval by the Trustees. The ratio of expenses to average net assets per share class, as disclosed in the Financial Highlights, may differ from the annual Portfolio operating expenses per share class as disclosed in the Prospectus for the reasons set forth above. PIMCO has agreed to waive a portion of its administrative fees to the extent that the payment of the Portfolio’s pro rata share of Trustees’ fees causes the actual expense ratio to rise above the rates disclosed in the current prospectus plus 0.49 basis points as set forth below (calculated as a percentage of the Portfolio’s average daily net assets attributable to the class):
| | | Administrative
Class
| |
Global Bond Portfolio | | 0.90 | % |
PIMCO may be reimbursed for these waived amounts in future periods. The Trust pays no compensation directly to any Trustee or any other officer who is affiliated with the Administrator, all of whom receive renumeration for their services to the Trust from the Administrator or its affiliates.
Each unaffiliated Trustee receives an annual retainer of $4,000, plus $1,500 for each Board of Trustees meeting attended in person and $250 for each meeting attended telephonically, plus reimbursement of related expenses. In addition, each committee chair receives an additional annual retainer of $500. These expenses are allocated on a pro-rata basis to each Portfolio of the Trust according to its respective net assets.
4. Purchases and Sales of Securities
Purchases and sales of securities (excluding short-term investments) for the period ended June 30, 2003 were as follows (amounts in thousands):
| | | U.S Government/Agency
| | All Other
|
| | | Purchases
| | Sales
| | Purchases
| | Sales
|
Global Bond Portfolio | | $ | 35,928 | | $ | 33,223 | | $ | 6,817 | | $ | 1,555 |
5. Transactions in Written Call and Put Options
Transactions in written call and put options were as follows (amounts in thousands):
| | | Global Bond Portfolio
| |
| | | | | Premium
| |
Balance at 12/31/2002 | | | | $ | 34 | |
Sales | | | | | 28 | |
Closing Buys | | | | | (28 | ) |
Expirations | | | | | (5 | ) |
Exercised | | | | | 0 | |
| | | | |
|
|
|
Balance at 06/30/2003 | | | | $ | 29 | |
| | | | |
|
|
|
13
6. Federal Income Tax Matters
At June 30, 2003, the aggregate cost of investments was the same for federal income tax and financial statement purposes. The net unrealized appreciation (depreciation) of investments securities for federal income tax purposes is as follows (amounts in thousands):
| | | Aggregate Gross Unrealized Appreciation
| | Aggregate Gross Unrealized (Depreciation)
| | | Net Unrealized Appreciation
|
Global Bond Portfolio | | $ | 1,326 | | $ | (75 | ) | | $ | 1,251 |
7. Shares of Beneficial Interest
The Trust may issue an unlimited number of shares of beneficial interest with a $.0001 par value. Changes in shares of beneficial interest were as follows (shares and amounts in thousands):
| | | Global Bond Portfolio
| |
| | | Six Months Ended 06/30/2003 | | | Year Ended 12/31/2002 | |
| | | Shares
| | | Amount
| | | Shares
| | | Amount
| |
Receipts for shares sold | | | | | | | | | | | | | | |
Administrative Class | | 1,103 | | | $ | 13,454 | | | 2,182 | | | $ | 24,269 | |
Issued as reinvestment of distributions Administrative Class | | 15 | | | | 182 | | | 17 | | | | 184 | |
Cost of shares redeemed Administrative Class | | (811 | ) | | | (9,511 | ) | | (449 | ) | | | (4,988 | ) |
| | |
|
| |
|
|
| |
|
| |
|
|
|
Net increase resulting from Portfolio share transactions | | 307 | | | $ | 4,125 | | | 1,750 | | | $ | 19,465 | |
| | |
|
| |
|
|
| |
|
| |
|
|
|
The following schedule shows the number of shareholders each owning 5% or more of the Portfolio and the total percentage of the Portfolio held by such shareholders:
| | | Number
| | % of Portfolio
Held
|
Global Bond Portfolio | | | | |
Administrative Class | | 3 | | 84 |
14
Trustees and Officers
Brent R. Harris, Chairman and Trustee
R. Wesley Burns, President and Trustee
E. Philip Cannon, Trustee
Vern O. Curtis, Trustee
J. Michael Hagan, Trustee
William J. Popejoy, Trustee
Garlin G. Flynn, Secretary
John P. Hardaway, Treasurer
Investment Adviser and Administrator
Pacific Investment Management Company LLC
840 Newport Center Drive
Newport Beach, California 92660
Transfer Agent
National Financial Data Services
330 W. 9th Street, 4th Floor
Kansas City, Missouri 64105
Custodian
State Street Bank & Trust Company
801 Pennsylvania
Kansas City, Missouri 64105
Counsel
Dechert LLP
1775 I Street, N.W.
Washington, D.C. 20006
Independent Accountants
PricewaterhouseCoopers LLP
1055 Broadway
Kansas City, Missouri 64105
PIMCO VARIABLE INSURANCE TRUST
This report is submitted for the general information of the shareholders of the PIMCO Variable Insurance Trust. It is not authorized for distribution to prospective investors unless accompanied or preceded by an effective prospectus for the PIMCO Variable Insurance Trust, which contains information covering its investment policies as well as other pertinent information.
All Funds distributed by PIMCO ADVISORS DISTRIBUTORS LLC, member NASD
840 NEWPORT CENTER DRIVE
NEWPORT BEACH, CA 92660
800.927.4648
WWW.PIMCOADVISORS.COM
WWW.PIMCO.COM
P I M C O PIMCO VARIABLE INSURANCE TRUST FOREIGN BOND PORTFOLIO ADMINISTRATIVE CLASS
SEMI-ANNUAL REPORT June 30, 2003 |
Contents
| | | Fund Summary
| | Schedule of
Investments
|
Foreign Bond Portfolio (Administrative Class) | | 2 | | 8 |
Chairman’s Letter
Dear PIMCO Variable Insurance Trust Shareholder:
Financial assets gained during the first half of 2003 amid a revival of risk appetites as anxiety about the war in Iraq faded. Assets that generally benefit from economic growth, such as stocks, corporate bonds and emerging market debt, fared the best year-to-date as investors returned to these sectors in anticipation of a recovery in the second half of 2003. Reflationary forces that investors expected to fuel a rebound included federal tax cuts and a weak dollar, as well as low borrowing rates that eased the burden of high personal and corporate indebtedness. Low mortgage rates kept refinancings booming in the second quarter and put more money in consumers’ pockets.
U.S. Treasuries lagged their riskier counterparts but still enjoyed a modest rally. Yields fell to levels not seen in 45 years early in the second quarter before bouncing off their lows in June as hopes for recovery increased. The yield on the benchmark 10-year Treasury closed the six-month period 0.30% lower to 3.51%, after nearing 3% earlier in the period. Buyers were encouraged that inflation would remain tame amid low capacity utilization and weak employment growth. Asian central banks bought U.S. Treasuries to limit the rise in their currencies versus the dollar in an effort to protect their export industries. In June, the Federal Reserve cut the federal funds rate by 0.25% to 1%, its 13th easing since 2001, in an effort to boost the economy and ward off deflation. Although the cut was less than expected, the Fed suggested that rates would stay low until deflation risks abated.
On the following pages you will find specific details as to the Portfolio’s total return investment performance and a discussion of those factors that affected performance.
We appreciate the trust you have placed in us, and we will continue to focus our efforts to meet your investment needs.
Sincerely,

Brent R. Harris
Chairman
July 31, 2003
1
Foreign Bond Portfolio
TOTAL RETURN INVESTMENT PERFORMANCE For the period ended June 30, 2003
| | | 1 Year | | | Since Inception* | |
Foreign Bond Portfolio Administrative Class | | 8.37 | % | | 6.07 | % |
J.P Morgan Non-U.S. Index (Hedged) | | 7.77 | % | | — | |
| * | | Annualized (All Portfolio returns are net of fees and expenses) |
CUMULATIVE RETURNS THROUGH JUNE 30, 2003
$10,000 invested at inception
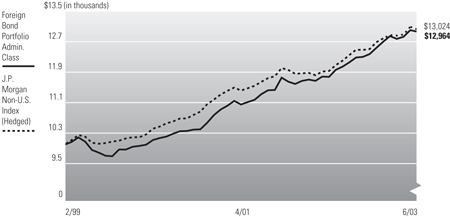
Past performance is no guarantee of future results. Investment return and principal value will fluctuate so that Portfolio shares, when redeemed, may be worth more or less than their original cost. The line graph above assumes the investment of $10,000 on 3/01/1999, the first full month following the Portfolio’s Administrative Class inception on 2/16/1999, compared to the J.P. Morgan Non-U.S. Index (Hedged), an unmanaged market index. It is not possible to invest directly in the Index. The Portfolio may invest in foreign securities which involve potentially higher risks including foreign currency fluctuations and political or economic uncertainty. These risks may be enhanced when investing in emerging market securities.
PORTFOLIO INSIGHTS
| • | | The Foreign Bond Portfolio seeks to achieve its investment objective by investing under normal circumstances at least 80% of its assets in Fixed Income Instruments of issuers located outside the United States, representing at least three foreign countries, which may be represented by futures contracts (including related options) with respect to such securities, and options on such securities. |
| • | | The Portfolio returned 3.38% for the six-month period ended June 30, 2003, outperforming the 2.65% return of the J.P. Morgan Non-U.S. Index (Hedged) for the same period. |
| • | | Above-Index duration on an ex-Japan basis was positive for performance as interest rates declined worldwide. |
| • | | An overweight in short and intermediate maturity Euroland bonds versus the U.S., was a positive as Euroland yields fell on weak growth, falling inflation and two rate cuts by the European Central Bank. |
| • | | A long position in the euro versus the U.S. dollar was strongly positive for returns, as the burgeoning U.S. deficit and outflow of U.S. investment weakened the dollar relative to most major currencies. |
| • | | An underweight to Japanese government bonds was a strong positive. JGBs ended the second quarter with a sell-off that took 10-year yields from historic lows to multi-year highs. |
2
Financial Highlights
Foreign Bond Portfolio (Administrative Class)
| Selected Per Share Data for the Year or Period Ended: | | 06/30/2003 +
| | | 12/31/2002
| | | 12/31/2001
| | | 12/31/2000
| | | 02/16/1999- 12/31/1999
| |
Net asset value beginning of period | | $ | 10.07 | | | $ | 9.69 | | | $ | 9.40 | | | $ | 9.42 | | | $ | 10.00 | |
Net investment income (a) | | | 0.14 | | | | 0.35 | | | | 0.40 | | | | 0.51 | | | | 0.41 | |
Net realized/unrealized gain (loss) on investments (a) | | | 0.20 | | | | 0.43 | | | | 0.30 | | | | 0.25 | | | | (0.49 | ) |
Total income (loss) from investment operations | | | 0.34 | | | | 0.78 | | | | 0.70 | | | | 0.76 | | | | (0.08 | ) |
Dividends from net investment income | | | (0.14 | ) | | | (0.36 | ) | | | (0.41 | ) | | | (0.52 | ) | | | (0.41 | ) |
Distributions from net realized capital gains | | | 0.00 | | | | (0.04 | ) | | | 0.00 | | | | (0.26 | ) | | | (0.09 | ) |
Total distributions | | | (0.14 | ) | | | (0.40 | ) | | | (0.41 | ) | | | (0.78 | ) | | | (0.50 | ) |
Net asset value end of period | | $ | 10.27 | | | $ | 10.07 | | | $ | 9.69 | | | $ | 9.40 | | | $ | 9.42 | |
Total return | | | 3.38 | % | | | 8.19 | % | | | 7.59 | % | | | 8.36 | % | | | (0.78 | )% |
Net assets end of period (000s) | | $ | 30,845 | | | $ | 16,776 | | | $ | 4,856 | | | $ | 924 | | | $ | 5,215 | |
Ratio of expenses to average net assets | | | 0.92 | %*(c) | | | 0.92 | %(c)(e) | | | 0.90 | %(d) | | | 0.90 | % | | | 1.10 | %(b)(c)* |
Ratio of net investment income to average net assets | | | 2.67 | %* | | | 3.57 | % | | | 4.17 | % | | | 5.38 | % | | | 4.83 | %* |
Portfolio turnover rate | | | 223 | % | | | 321 | % | | | 285 | % | | | 306 | % | | | 285 | % |
| (a) | | Per share amounts based on average number of shares outstanding during the period. |
| (b) | | If the investment manager had not reimbursed expenses, the ratio of operating expenses to average net assets would have been 1.25% for the period ended December 31, 1999. |
| (c) | | Ratio of expenses to average net assets excluding interest expense is 0.90%. |
| (d) | | If the investment manager had not reimbursed expenses, the ratio of operating expenses to average net assets would have been 0.91% for the year ended December 31, 2001. |
| (e) | | If the investment manager had not reimbursed expenses, the ratio of operating expenses to average net assets would have been 0.94% for the year ended December 31, 2002. |
See accompanying notes
3
Statement of Assets and Liabilities
Foreign Bond Portfolio
June 30, 2003 (Unaudited)
Amounts in thousands, except per share amounts
Assets: | | | | |
Investments, at value | | $ | 44,732 | |
Foreign currency, at value | | | 239 | |
Receivable for investments sold | | | 9,642 | |
Unrealized appreciation on forward foreign currency contracts | | | 131 | |
Receivable for Portfolio shares sold | | | 69 | |
Interest receivable | | | 486 | |
Variation margin receivable | | | 10 | |
Swap premiums paid | | | 35 | |
Unrealized appreciation on forward volatility options | | | 6 | |
Unrealized appreciation on swap agreements | | | 81 | |
| | |
|
|
|
| | | | 55,431 | |
| | |
|
|
|
Liabilities: | | | | |
Payable for investments purchased | | $ | 18,399 | |
Unrealized depreciation on forward foreign currency contracts | | | 2 | |
Payable for financing transactions | | | 1,020 | |
Payable for short sale | | | 4,830 | |
Written options outstanding | | | 36 | |
Accrued investment advisory fee | | | 6 | |
Accrued administration fee | | | 12 | |
Accrued servicing fee | | | 3 | |
Variation margin payable | | | 3 | |
Swap premiums received | | | 69 | |
Unrealized depreciation on swap agreements | | | 176 | |
Other liabilities | | | 18 | |
| | |
|
|
|
| | | | 24,574 | |
| | |
|
|
|
Net Assets | | $ | 30,857 | |
| | |
|
|
|
Net Assets Consist of: | | | | |
Paid in capital | | $ | 29,871 | |
Undistributed (overdistributed) net investment income | | | (504 | ) |
Accumulated undistributed net realized (loss) | | | (600 | ) |
Net unrealized appreciation | | | 2,090 | |
| | |
|
|
|
| | | $ | 30,857 | |
| | |
|
|
|
Net Assets: | | | | |
Institutional Class | | $ | 12 | |
Administrative Class | | | 30,845 | |
Shares Issued and Outstanding: | | | | |
Institutional Class | | | 1 | |
Administrative Class | | | 3,004 | |
Net Asset Value and Redemption Price Per Share (Net Assets Per Share Outstanding) | | | | |
Institutional Class | | $ | 10.27 | |
Administrative Class | | | 10.27 | |
Cost of Investments Owned | | $ | 42,886 | |
Cost of Foreign Currency Held | | $ | 240 | |
See accompanying notes
4
Statement of Operations
Foreign Bond Portfolio
For the six months ended June 30, 2003 (Unaudited)
Amounts in thousands
Investment Income: | | | | |
Interest | | $ | 398 | |
Dividends, net of foreign taxes | | | 2 | |
Miscellaneous income | | | 6 | |
| | |
|
|
|
Total Income | | | 406 | |
| | |
|
|
|
Expenses: | | | | |
Investment advisory fees | | | 28 | |
Administration fees | | | 56 | |
Distribution and/or servicing fees - Administrative Class | | | 17 | |
Interest expense | | | 3 | |
| | |
|
|
|
Total Expenses | | | 104 | |
| | |
|
|
|
Net Investment Income | | | 302 | |
| | |
|
|
|
Net Realized and Unrealized Gain (Loss): | | | | |
Net realized gain on investments | | | 451 | |
Net realized gain on futures contracts, written options, and swaps | | | 198 | |
Net realized (loss) on foreign currency transactions | | | (779 | ) |
Net change in unrealized (depreciation) on investments | | | (270 | ) |
Net change in unrealized (depreciation) on futures contracts, written options, and swaps | | | (115 | ) |
Net change in unrealized appreciation on translation of assets and liabilities denominated in foreign currencies | | | 838 | |
Net Gain | | | 323 | |
| | |
|
|
|
Net Increase in Assets Resulting from Operations | | $ | 625 | |
| | |
|
|
|
See accompanying notes
5
Statements of Changes in Net Assets
Foreign Bond Portfolio
Amounts in thousands
| Increase (Decrease) in Net Assets from: | | Six Months Ended June 30, 2003
| | | Year Ended December 31, 2002
| |
| | | (Unaudited) | | | | |
Operations: | | | | | | | | |
Net investment income | | $ | 302 | | | $ | 361 | |
Net realized loss | | | (130 | ) | | | (1,323 | ) |
Net change in unrealized appreciation | | | 453 | | | | 1,842 | |
| | |
|
|
| |
|
|
|
Net increase resulting from operations | | | 625 | | | | 880 | |
| | |
|
|
| |
|
|
|
Distributions to Shareholders: | | | | | | | | |
From net investment income | | | | | | | | |
Institutional Class | | | 0 | | | | (2 | ) |
Administrative Class | | | (310 | ) | | | (353 | ) |
From net realized capital gains | | | | | | | | |
Institutional Class | | | 0 | | | | 0 | |
Administrative Class | | | 0 | | | | (61 | ) |
Tax basis return of capital | | | | | | | | |
Institutional Class | | | 0 | | | | 0 | |
Administrative Class | | | 0 | | | | (4 | ) |
| | |
|
|
| |
|
|
|
Total Distributions | | | (310 | ) | | | (420 | ) |
| | |
|
|
| |
|
|
|
Portfolio Share Transactions: | | | | | | | | |
Receipts for shares sold | | | | | | | | |
Institutional Class | | | 0 | | | | 0 | |
Administrative Class | | | 16,300 | | | | 19,462 | |
Issued as reinvestment of distributions | | | | | | | | |
Institutional Class | | | 0 | | | | 3 | |
Administrative Class | | | 310 | | | | 417 | |
Cost of shares redeemed | | | | | | | | |
Institutional Class | | | 0 | | | | (930 | ) |
Administrative Class | | | (2,856 | ) | | | (8,415 | ) |
| | |
|
|
| |
|
|
|
Net increase resulting from Portfolio share transactions | | | 13,754 | | | | 10,537 | |
| | |
|
|
| |
|
|
|
Total Increase in Net Assets | | | 14,069 | | | | 10,997 | |
| | |
|
|
| |
|
|
|
Net Assets: | | | | | | | | |
Beginning of period | | | 16,788 | | | | 5,791 | |
End of period* | | $ | 30,857 | | | $ | 16,788 | |
*Including (overdistributed) net investment income of: | | $ | (504 | ) | | $ | (497 | ) |
See accompanying notes
6
Statement of Cash Flows
Foreign Bond Portfolio
For six months ended June 30, 2003 (Unaudited)
Amounts in thousands
Increase (Decrease) in Cash and Foreign Currency from:
Financing Activities: | | | | |
Sales of Portfolio shares | | $ | 16,272 | |
Redemptions of Portfolio shares | | | (2,895 | ) |
Proceeds from financing transactions | | | (9,175 | ) |
| | |
|
|
|
Net increase from financing activities | | | 4,202 | |
| | |
|
|
|
Operating Activities: | | | | |
Purchases of long-term securities and foreign currency | | | (60,000 | ) |
Proceeds from sales of long-term securities and foreign currency | | | 59,727 | |
Purchases of short-term securities (net) | | | (3,281 | ) |
Net investment income | | | 302 | |
Change in other receivables/payables (net) | | | (1,046 | ) |
Net (decrease) from operating activities | | | (4,298 | ) |
| | |
|
|
|
Net (Decrease) in Cash and Foreign Currency | | | (96 | ) |
| | |
|
|
|
Cash and Foreign Currency: | | | | |
Beginning of period | | | 335 | |
End of period | | $ | 239 | |
See accompanying notes
7
Schedule of Investments
Foreign Bond Portfolio
June 30, 2003 (Unaudited)
| | | Principal Amount (000s)
| | Value (000s)
|
AUSTRALIA 0.4% Crusade Global Trust | | | | | | |
1.620% due 05/15/2021 (a) | | $ | 31 | | $ | 31 |
Medallion Trust | | | | | | |
1.510% due 07/12/2031 (a) | | | 39 | | | 39 |
National Australia Bank Ltd. | | | | | | |
1.915% due 05/19/2010 (a) | | | 50 | | | 50 |
| | | | | |
|
|
Total Australia
(Cost $120) | | | | | | 120 |
| | | | | |
|
|
AUSTRIA (i)(j) 1.6% Republic of Austria | | | | | | |
5.250% due 01/04/2011 | | EC | 300 | | | 383 |
3.800% due 10/20/2013 | | | 100 | | | 114 |
| | | | | |
|
|
Total Austria
(Cost $450) | | | | | | 497 |
| | | | | |
|
|
BRAZIL 0.1% Republic of Brazil | | | | | | |
2.125% due 04/15/2006 (a) | | $ | 48 | | | 45 |
| | | | | |
|
|
Total Brazil
(Cost $46) | | | | | | 45 |
| | | | | |
|
|
CANADA (i)(j) 2.9% Commonwealth of Canada | | | | | | |
5.500% due 06/01/2009 | | C$ | 200 | | | 159 |
5.500% due 06/01/2010 | | | 300 | | | 238 |
6.000% due 06/01/2011 | | | 600 | | | 490 |
| | | | | |
|
|
Total Canada
(Cost $771) | | | | | | 887 |
| | | | | |
|
|
DENMARK (i)(j) 0.3% Nykredit | | | | | | |
6.000% due 10/01/2029 | | DK | 680 | | | 108 |
| | | | | |
|
|
Total Denmark
(Cost $74) | | | | | | 108 |
| | | | | |
|
|
FRANCE (i)(j) 2.3% France Telecom S.A. | | | | | | |
1.010% due 07/16/2003 (a) | | JY | 10,000 | | | 83 |
Republic of France | | | | | | |
6.000% due 04/25/2004 | | EC | 310 | | | 367 |
4.000% due 04/25/2009 | | | 80 | | | 96 |
4.000% due 10/25/2009 | | | 30 | | | 36 |
5.500% due 04/25/2010 | | | 110 | | | 142 |
| | | | | |
|
|
Total France
(Cost $546) | | | | | | 724 |
| | | | | |
|
|
GERMANY (i)(j) 22.9% KFW International Finance, Inc. | | | | | | |
3.500% due 11/15/2005 | | EC | 100 | | | 118 |
Landesbank Baden-Wuerttemberg AG | | | | | | |
5.500% due 04/02/2007 | | | 30 | | | 38 |
Republic of Germany | | | | | | |
6.500% due 10/14/2005 | | | 2,200 | | | 2,761 |
5.000% due 02/17/2006 | | | 300 | | | 368 |
6.250% due 04/26/2006 (b) | | | 600 | | | 760 |
5.250% due 01/04/2008 | | | 210 | | | 265 |
4.500% due 07/04/2009 (b) | | | 400 | | | 491 |
5.375% due 01/04/2010 (b) | | | 400 | | | 513 |
5.250% due 07/04/2010 (b) | | | 300 | | | 383 |
5.250% due 01/04/2011 | | | 100 | | | 128 |
5.000% due 01/04/2012 | | | 100 | | | 126 |
4.500% due 01/04/2013 | | | 80 | | | 97 |
5.000% due 07/04/2027 (b) | | | 590 | | | 854 |
4.750% due 07/04/2028 | | | 30 | | | 35 |
5.500% due 01/04/2031 | | | 100 | | | 129 |
| | | | | |
|
|
Total Germany
(Cost $6,066) | | | | | | 7,066 |
| | | | | |
|
|
ITALY (i)(j) 19.3% First Italian Auto Transaction | | | | | | |
2.809% due 07/12/2008 (a) | | EC | 70 | | | 80 |
Republic of Italy | | | | | | |
2.125% due 02/01/2006 (b) | | | 400 | | | 541 |
3.500% due 01/15/2008 (b) | | | 3,700 | | | 4,354 |
4.500% due 05/01/2009 (b) | | | 360 | | | 441 |
4.250% due 11/01/2009 (b) | | | 60 | | | 73 |
5.500% due 11/01/2010 (b) | | | 110 | | | 142 |
Seashell Securities PLC | | | | | | |
2.852% due 10/25/2028 (a) | | | 200 | | | 230 |
Telecom Italia SpA | | | | | | |
5.625% due 02/01/2007 | | | 70 | | | 86 |
| | | | | |
|
|
Total Italy
(Cost $5,957) | | | | | | 5,947 |
| | | | | |
|
|
JAPAN (i)(j) 11.4% Government of Japan | | | | | | |
1.900% due 12/20/2010 (b) | | JY | 48,000 | | | 437 |
1.500% due 12/20/2011 | | | 107,000 | | | 948 |
1.300% due 09/20/2012 | | | 40,000 | | | 348 |
2.600% due 03/20/2019 (b) | | | 50,000 | | | 512 |
1.900% due 09/20/2022 (b) | | | 3,000 | | | 28 |
Japan Finance Corp. for Municipal Enterprises | | | | | | |
1.550% due 02/21/2012 | | | 130,000 | | | 1,152 |
Japan Financial Corp. | | | | | | |
5.875% due 03/14/2011 | | $ | 80 | | | 90 |
| | | | | |
|
|
Total Japan
(Cost $3,575) | | | | | | 3,515 |
| | | | | |
|
|
MEXICO 0.9% Bancomext Trust | | | | | | |
8.000% due 08/05/2003 | | $ | 10 | | | 10 |
Petroleos Mexicanos | | | | | | |
8.850% due 09/15/2007 | | | 20 | | | 24 |
9.375% due 12/02/2008 | | | 30 | | | 37 |
United Mexican States | | | | | | |
6.375% due 01/16/2013 | | | 200 | | | 212 |
| | | | | |
|
|
Total Mexico
(Cost $255) | | | | | | 283 |
| | | | | |
|
|
NETHERLANDS (i)(j) 0.8% Kingdom of Netherlands | | | | | | |
6.000% due 01/15/2006 | | EC | 200 | | | 250 |
| | | | | |
|
|
Total Netherlands
(Cost $195) | | | | | | 250 |
| | | | | |
|
|
NEW ZEALAND (i)(j) 0.2% Commonwealth of New Zealand | | | | | | |
4.500% due 02/15/2016 | | N$ | 86 | | | 65 |
| | | | | |
|
|
Total New Zealand
(Cost $48) | | | | | | 65 |
| | | | | |
|
|
PANAMA 0.1% Republic of Panama | | | | | | |
9.375% due 01/16/2023 | | $ | 40 | | | 45 |
| | | | | |
|
|
Total Panama
(Cost $40) | | | | | | 45 |
| | | | | |
|
|
PERU 0.2% Republic of Peru | | | | | | |
9.125% due 02/21/2012 | | $ | 30 | | | 32 |
5.000% due 03/07/2017 (a) | | | 38 | | | 33 |
| | | | | |
|
|
Total Peru
(Cost $57) | | | | | | 65 |
| | | | | |
|
|
SPAIN (i)(j) 5.5% Kingdom of Spain | | | | | | |
4.950% due 07/30/2005 | | EC | 30 | | | 36 |
5.150% due 07/30/2009 | | | 1,210 | | | 1,535 |
4.000% due 01/31/2010 | | | 100 | | | 119 |
| | | | | |
|
|
Total Spain
(Cost $1,629) | | | | | | 1,690 |
| | | | | |
|
|
SUPRANATIONAL (i)(j) 0.2% Eurofima | | | | | | |
4.750% due 07/07/2004 | | SK | 600 | | | 76 |
| | | | | |
|
|
Total Supranational
(Cost $69) | | | | | | 76 |
| | | | | |
|
|
SWEDEN (i)(j) 0.2% Kingdom of Sweden | | | | | | |
5.000% due 01/28/2009 | | SK | 400 | | | 53 |
| | | | | |
|
|
Total Sweden
(Cost $40) | | | | | | 53 |
| | | | | |
|
|
UNITED KINGDOM (i)(j) 13.6% British Telecom PLC | | | | | | |
2.413% due 12/15/2003 (a) | | $ | 50 | | | 50 |
Haus Ltd. | | | | | | |
2.458% due 12/14/2037 (a) | | EC | 85 | | | 98 |
Lloyds TSB Bank PLC | | | | | | |
5.625% due 07/15/2049 (a) | | | 40 | | | 49 |
1.437% due 11/29/2049 (a) | | $ | 100 | | | 79 |
Residential Mortgage Securities | | | | | | |
1.651% due 05/12/2032 (a) | | | 22 | | | 22 |
United Kingdom Gilt | | | | | | |
7.250% due 12/07/2007 (b) | | BP | 1,150 | | | 2,166 |
5.000% due 03/07/2008 | | | 1,000 | | | 1,735 |
| | | | | |
|
|
Total United Kingdom
(Cost $4,108) | | | | | | 4,199 |
| | | | | |
|
|
UNITED STATES (i)(j) 42.5% Asset-Backed Securities 1.8% | | | | | | |
Ameriquest Mortgage Securities, Inc. | | | | | | |
1.500% due 06/15/2030 (a) | | $ | 9 | | | 9 |
Amortizing Residential Collateral Trust | | | | | | |
1.385% due 10/25/2031 (a) | | | 48 | | | 48 |
AMRESCO Residential Securities Corp. | | | | | | |
Mortgage Loan Trust | | | | | | |
1.505% due 06/25/2029 (a) | | | 9 | | | 9 |
Credit-Based Asset Servicing and Securities | | | | | | |
1.355% due 06/25/2032 (a) | | | 71 | | | 71 |
CS First Boston Mortgage Securities Corp. | | | | | | |
1.440% due 12/15/2030 (a) | | | 12 | | | 12 |
First Alliance Mortgage Loan Trust | | | | | | |
1.333% due 12/20/2027 (a) | | | 10 | | | 10 |
Household Mortgage Loan Trust | | | | | | |
1.403% due 05/20/2032 (a) | | | 63 | | | 63 |
Long Beach Auto Receivables Trust | | | | | | |
3.114% due 03/13/2005 (a) | | | 3 | | | 3 |
MLCC Mortgage Investors, Inc. | | | | | | |
1.560% due 03/15/2025 (a) | | | 45 | | | 45 |
Morgan Stanley Dean Witter Capital I | | | | | | |
1.405% due 07/25/2030 (a) | | | 51 | | | 51 |
1.365% due 07/25/2032 (a) | | | 72 | | | 72 |
Novastar Home Equity Loan | | | | | | |
1.310% due 04/25/2028 (a) | | | 18 | | | 18 |
1.315% due 01/25/2031 (a) | | | 26 | | | 26 |
Providian Home Equity Loan Trust | | | | | | |
1.325% due 06/25/2025 (a) | | | 16 | | | 16 |
Residential Asset Securities Corp. | | | | | | |
1.285% due 07/25/2032 (a) | | | 120 | | | 120 |
| | | | | |
|
|
| | | | | | | 573 |
| | | | | |
|
|
See accompanying notes
8
| | | Principal Amount (000s)
| | Value (000s)
| |
Corporate Bonds & Notes 2.9% AOL Time Warner, Inc. | | | | | | | |
5.625% due 05/01/2005 | | $ | 00 | | $ | 106 | |
AT&T Corp. | | | | | | | |
4.381% due 11/21/2003 (a) | | EC | 100 | | | 115 | |
CIT Group, Inc. | | | | | | | |
5.625% due 05/17/2004 | | $ | 60 | | | 62 | |
Comcast Corp. | | | | | | | |
7.050% due 03/15/2033 | | | 100 | | | 111 | |
DaimlerChrysler North America Holding Corp. | | | | | | | |
6.400% due 05/15/2006 | | | 60 | | | 66 | |
Entergy Gulf States, Inc. | | | | | | | |
1.960% due 06/18/2007 (a) | | | 100 | | | 100 | |
Ford Motor Credit Co. | | | | | | | |
1.000% due 12/22/2003 (a) | | JY | 1,000 | | | 8 | |
General Motors Acceptance Corp. | | | | | | | |
6.875% due 09/09/2004 | | BP | 75 | | | 126 | |
J.P. Morgan Chase & Co. | | | | | | | |
5.385% due 02/15/2012 (a) | | $ | 10 | | | 11 | |
KFW International Finance, Inc. | | | | | | | |
1.750% due 03/23/2010 | | JY | 11,000 | | | 99 | |
Pemex Project Funding Master Trust | | | | | | | |
8.625% due 02/01/2022 | | | 20 | | | 23 | |
Pfizer, Inc. | | | | | | | |
0.800% due 03/18/2008 | | JY | 6,000 | | | 51 | |
Sprint Capital Corp. | | | | | | | |
5.875% due 05/01/2004 | | $ | 10 | | | 10 | |
| | | | | |
|
|
|
| | | | | | | 888 | |
| | | | | |
|
|
|
Mortgage-Backed Securities 20.3% Bear Stearns Adjustable Rate Mortgage Trust | | | | | | | |
6.863% due 02/25/2031 (a) | | | 7 | | | 7 | |
6.158% due 01/25/2032 (a) | | | 15 | | | 15 | |
5.700% due 03/25/2032 (a) | | | 35 | | | 35 | |
Countrywide Home Loans, Inc. | | | | | | | |
6.500% due 08/25/2032 (a) | | | 15 | | | 15 | |
CS First Boston Mortgage Securities Corp. | | | | | | | |
1.375% due 07/25/2032 (a) | | | 38 | | | 38 | |
1.886% due 08/25/2033 (a) | | | 93 | | | 92 | |
Fannie Mae | | | | | | | |
1.385% due 01/25/2016 (a) | | | 52 | | | 52 | |
5.500% due 11/01/2016 | | | 590 | | | 614 | |
5.500% due 12/01/2017 | | | 140 | | | 145 | |
5.500% due 02/01/2018 | | | 300 | | | 312 | |
5.500% due 03/01/2018 | | | 1,170 | | | 1,216 | |
5.390% due 04/01/2033 (a) | | | 89 | | | 91 | |
5.000% due 12/31/2099 | | | 1,000 | | | 1,019 | |
6.000% due 12/31/2099 | | | 1,300 | | | 1,350 | |
First Horizon Asset Securities, Inc. | | | | | | | |
7.000% due 05/25/2030 | | | 13 | | | 13 | |
Freddie Mac | | | | | | | |
5.000% due 09/15/2016 | | | 84 | | | 87 | |
4.867% due 02/01/2029 (a) | | | 80 | | | 83 | |
4.500% due 08/15/2031 | | | 98 | | | 99 | |
GMAC Commercial Mortgage Securities, Inc. | | | | | | | |
6.420% due 05/15/2035 | | | 100 | | | 115 | |
Government National Mortgage Association | | | | | | | |
5.375% due 04/20/2028 (a) | | | 9 | | | 9 | |
5.000% due 04/20/2030 (a) | | | 25 | | | 26 | |
5.000% due 05/20/2030 (a) | | | 28 | | | 29 | |
4.250% due 06/20/2030 (a) | | | 57 | | | 58 | |
GSR Mortgage Loan Trust | | | | | | | |
6.000% due 07/25/2032 | | | 57 | | | 58 | |
J.P. Morgan Commercial Mortgage Finance Corp. | | | | | | | |
1.460% due 04/15/2010 (a) | | | 12 | | | 12 | |
Sequoia Mortgage Trust | | | | | | | |
1.403% due 08/20/2032 (a) | | | 91 | | | 91 | |
1.668% due 04/20/2033 (a)(l) | | | 100 | | | 100 | |
Structured Asset Mortgage Investments, Inc. | | | | | | | |
1.422% due 09/19/2032 (a) | | | 94 | | | 94 | |
Structured Asset Securities Corp. | | | | | | | |
1.325% due 02/25/2032 (a) | | | 64 | | | 64 | |
Wachovia Bank Commercial Mortgage Trust | | | | | | | |
1.225% due 06/15/2013 (a) | | | 200 | | | 200 | |
Washington Mutual Mortgage Securities Corp. | | | | | | | |
6.000% due 03/25/2017 | | | 31 | | | 31 | |
6.010% due 04/25/2031 (a) | | | 23 | | | 24 | |
5.207% due 10/25/2032 (a) | | | 50 | | | 51 | |
Wells Fargo Mortgage-Backed Securities Trust | | | | | | | |
4.881% due 09/25/2032 (a) | | | 18 | | | 18 | |
| | | | | |
|
|
|
| | | | | | | 6,263 | |
| | | | | |
|
|
|
Municipal Bonds & Notes 1.1% Connecticut State General Obligation Bonds, Series 2001 | | | | | | | |
5.500% due 12/15/2013 | | | 100 | | | 119 | |
Lower Colorado River Authority Revenue Bonds, (FSA Insured), Series 2003 | | | | | | | |
5.000% due 05/15/2023 | | | 100 | | | 105 | |
Seattle, Washington Water System Revenue Bonds, (MBIA Insured), Series 2003 | | | | | | | |
5.000% due 09/01/2033 | | | 100 | | | 104 | |
| | | | | |
|
|
|
| | | | | | | 328 | |
| | | | | |
|
|
|
U.S. Government Agencies 5.5% Fannie Mae | | | | | | | |
3.250% due 11/14/2005 | | | 100 | | | 101 | |
5.250% due 03/22/2007 | | | 100 | | | 103 | |
4.640% due 01/30/2008 | | | 200 | | | 207 | |
6.250% due 02/17/2011 | | | 200 | | | 205 | |
Federal Home Loan Bank | | | | | | | |
2.340% due 12/15/2005 | | | 200 | | | 200 | |
4.375% due 08/15/2007 | | | 100 | | | 100 | |
Freddie Mac | | | | | | | |
6.000% due 05/25/2012 | | | 100 | | | 104 | |
6.530% due 11/26/2012 | | | 300 | | | 347 | |
Tennessee Valley Authority | | | | | | | |
4.875% due 12/15/2016 | | | 300 | | | 331 | |
| | | | | |
|
|
|
| | | | | | | 1,698 | |
| | | | | |
|
|
|
U.S. Treasury Obligations 10.2% Treasury Inflation Protected Securities (c) | | | | | | | |
3.625% due 01/15/2008 | | | 114 | | | 128 | |
3.625% due 04/15/2028 | | | 114 | | | 139 | |
U.S. Treasury Bonds | | | | | | | |
6.250% due 08/15/2023 | | | 800 | | | 980 | |
U.S. Treasury Notes | | | | | | | |
6.500% due 02/15/2010 | | | 300 | | | 364 | |
5.000% due 08/15/2011 | | | 800 | | | 914 | |
U.S. Treasury Strips | | | | | | | |
0.000% due 02/15/2019 | | | 900 | | | 436 | |
0.000% due 08/15/2020 | | | 400 | | | 176 | |
| | | | | |
|
|
|
| | | | | | | 3,137 | |
| | | | | |
|
|
|
| | | Shares
| | | |
Preferred Security 0.7% DG Funding Trust | | | | | | | |
3.350% due 12/29/2049 (a) | | | 20 | | | 206 | |
| | | | | |
|
|
|
Total United States
(Cost $12,836) | | | | | | 13,093 | |
| | | | | |
|
|
|
| | | Principal Amount (000s)
| | | |
PURCHASED CALL OPTIONS 0.0% | | | | | | | |
Euro-Bund 10 Year Note September Futures (OTC) | | | | | | | |
Strike @ 102.000 Exp. 09/03/2003 | | $ | 1,000 | | $ | 0 | |
| | | | | |
|
|
|
Total Purchased Call Options
(Cost $0) | | | | | | 0 | |
| | | | | |
|
|
|
SHORT-TERM INSTRUMENTS 19.5% Commercial Paper 17.5% CBA Finance, Inc. | | | | | | | |
1.220% due 08/01/2003 | | | 800 | | | 799 | |
Fannie Mae | | | | | | | |
1.170% due 08/27/2003 | | | 300 | | | 299 | |
1.130% due 09/03/2003 | | | 500 | | | 499 | |
1.010% due 09/10/2003 | | | 1,100 | | | 1,098 | |
Federal Home Loan Bank | | | | | | | |
1.140% due 08/06/2003 | | | 900 | | | 899 | |
General Electric Capital Corp. | | | | | | | |
1.200% due 07/11/2003 | | | 200 | | | 200 | |
HBOS Treasury Services PLC | | | | | | | |
1.100% due 09/12/2003 | | | 600 | | | 599 | |
Westpac Trust Securities Ltd. | | | | | | | |
1.190% due 08/07/2003 | | | 1,000 | | | 999 | |
| | | | | |
|
|
|
| | | | | | | 5,392 | |
| | | | | |
|
|
|
Repurchase Agreement 0.6% State Street Bank | | | | | | | |
0.800% due 07/01/2003 | | | 178 | | | 178 | |
(Dated 06/30/2003. Collateralized by Fannie Mae 2.000% due 01/14/2005 valued at $183. Repurchase proceeds are $178.) | | | | | | | |
U.S. Treasury Bills 1.4% | | | | | | | |
1.064% due 08/07/2003-08/14/2003 (d)(e) | | | 435 | | | 434 | |
| | | | | |
|
|
|
Total Short-Term Instruments
(Cost $6,004) | | | | | | 6,004 | |
| | | | | |
|
|
|
Total Investments 144.9%
(Cost $42,886) | | | | | $ | 44,732 | |
Written Options (g) (0.1%)
(Premiums $64) | | | | | | (36 | ) |
Other Assets and Liabilities (Net) (44.8%) | | | | | | (13,839 | ) |
| | | | | |
|
|
|
Net Assets 100.0% | | | | | $ | 30,857 | |
| | | | | |
|
|
|
Notes to Schedule of Investments
(amounts in thousands, except number of contracts):
| (a) | | Variable rate security. The rate listed is as of June 30, 2003. |
| (b) | | Security, or a portion thereof, subject to financing transaction. |
| (c) | | Principal amount of security is adjusted for inflation. |
| (d) | | Securities are grouped by coupon or range of coupons and represent a range of maturities. |
| (e) | | Securities with an aggregate market value of $185 have been segregated with the custodian to cover margin requirements for the following open futures contracts at June 30, 2003: |
Type
| | # of
Contracts
| | Unrealized Appreciation/ (Depreciation)
| |
Euro-Bobl 5 Year Note (09/2003) - Long | | 20 | | $ | (21 | ) |
Euro-Bund 10 Year Note (09/2003) - Long | | 28 | | | (50 | ) |
U.S. Treasury 5 Year Note (09/2003) - Short | | 8 | | | 5 | |
U.S. Treasury 10 Year Note (09/2003) - Short | | 1 | | | 1 | |
| | | | |
|
|
|
| | | | | $ | (65 | ) |
| | | | |
|
|
|
See accompanying notes
9
| (f) | | Swap agreements outstanding at June 30, 2003: |
Type
| | Notional Amount
| | Unrealized Appreciation/ (Depreciation)
| |
Receive a fixed rate equal to 4.000% and pay floating rate based on 6 month BP-LIBOR. Counterparty: Morgan Stanley Dean Witter & Co. | | | | | | | |
Exp. 09/15/2007 | | BP | 200 | | $ | (2 | ) |
Receive a fixed rate equal to 4.000% and pay floating rate based on 6 month BP-LIBOR. Counterparty: Morgan Stanley Dean Witter & Co. | | | | | | | |
Exp. 06/17/2008 | | | 700 | | | 0 | |
Receive a fixed rate equal to 5.500% and pay floating rate based on 6 month BP-LIBOR. Counterparty: Morgan Stanley Dean Witter & Co. | | | | | | | |
Exp. 03/15/2008 | | | 100 | | | 12 | |
Receive a fixed rate equal to 5.500% and pay floating rate based on 6-month BP-LIBOR. Counterparty: Morgan Stanley Dean Witter & Co. | | | | | | | |
Exp. 03/15/2004 | | | 200 | | | 6 | |
Receive floating rate based on 6-month BP-LIBOR and pay a fixed rate equal to 5.000%. Counterparty: Morgan Stanley Dean Witter & Co. | | | | | | | |
Exp. 03/15/2017 | | | 300 | | | (1 | ) |
Receive floating rate based on 6-month BP-LIBOR and pay a fixed rate equal to 5.000%. Counterparty: UBS Warburg LLC | | | | | | | |
Exp. 03/15/2032 | | | 200 | | | 4 | |
Receive floating rate based on 6-month BP-LIBOR and pay a fixed rate equal to 5.000%. Counterparty: UBS Warburg LLC | | | | | | | |
Exp. 06/17/2013 | | | 200 | | | (4 | ) |
Receive floating rate based on 6-month BP-LIBOR and pay a fixed rate equal to 5.000%. Counterparty: J.P. Morgan Chase & Co. | | | | | | | |
Exp. 03/20/2018 | | | 600 | | | (1 | ) |
Receive floating rate based on 6-month BP-LIBOR and pay a fixed rate equal to 5.500% Counterparty: Morgan Stanley Dean Witter & Co. | | | | | | | |
Exp. 03/15/2016 | | | 500 | | | (13 | ) |
Receive floating rate based on 6-month BP-LIBOR and pay a fixed rate equal to 5.500%. Counterparty: Goldman Sachs & Co. | | | | | | | |
Exp. 03/15/2016 | | | 100 | | | (2 | ) |
Receive floating rate based on 6-month LIBOR and pay a fixed rate equal to 5.000%. Counterparty: Morgan Stanley Dean Witter & Co. | | | | | | | |
Exp. 06/17/2013 | | | 300 | | | (5 | ) |
Receive a fixed rate equal to 4.000% and pay floating rate based on 6 month EC-LIBOR. Counterparty: Merrill Lynch & Co., Inc. | | | | | | | |
Exp. 03/15/2007 | | EC | 100 | | | 0 | |
Receive a fixed rate equal to 6.000% and pay floating rate based on 6-month EC-LIBOR. Counterparty: Morgan Stanley Dean Witter & Co. | | | | | | | |
Exp. 03/15/2017 | | | 500 | | | 4 | |
Receive a fixed rate equal to 6.000% and pay floating rate based on 6-month EC-LIBOR. Counterparty: UBS Warburg LLC | | | | | | | |
Exp. 03/15/2032 | | | 400 | | | 5 | |
Receive a fixed rate equal to 6.000% and pay floating rate based on 6-month EC-LIBOR. Counterparty: J.P. Morgan Chase & Co. | | | | | | | |
Exp. 03/20/2018 | | | 800 | | $ | 2 | |
Receive floating rate based on 6-month EC-LIBOR and pay a fixed rate equal to 5.000%. Counterparty: Citibank N.A., London | | | | | | | |
Exp. 06/17/2012 | | | 200 | | | (24 | ) |
Receive floating rate based on 6-month EC-LIBOR and pay a fixed rate equal to 5.000%. Counterparty: J.P. Morgan Chase & Co. | | | | | | | |
Exp. 06/17/2012 | | | 100 | | | (14 | ) |
Receive floating rate based on 6-month EC-LIBOR and pay a fixed rate equal to 6.000%. Counterparty: Morgan Stanley Dean Witter & Co. | | | | | | | |
Exp. 03/15/2031 | | | 100 | | | (22 | ) |
Receive floating rate based on 6-month EC-LIBOR and pay a fixed rate equal to 6.000%. Counterparty: J.P. Morgan Chase & Co. | | | | | | | |
Exp. 03/15/2031 | | | 100 | | | (23 | ) |
Receive floating rate based on 3-month H$-HIBOR and pay a fixed rate equal to 5.753%. Counterparty: Goldman Sachs & Co. | | | | | | | |
Exp. 02/28/2006 | | H$ | 3,000 | | | (35 | ) |
Receive floating rate based on 6-month JY-LIBOR and pay a fixed rate equal to 1.300%. Counterparty: Goldman Sachs & Co. | | | | | | | |
Exp. 09/21/2011 | | JY | 40,000 | | | (16 | ) |
Receive floating rate based on 6-month JY-LIBOR and pay a fixed rate equal to 2.020%. Counterparty: Goldman Sachs & Co. | | | | | | | |
Exp. 05/18/2010 | | | 17,000 | | | (14 | ) |
Receive a fixed rate equal to 0.460% and the Fund will pay to the counterparty at par in the event of default of Vodafone Group PLC 7.750% due 02/15/2010. Counterparty: Lehman Brothers, Inc. | | | | | | | |
Exp. 09/10/2003 | | $ | 100 | | | 0 | |
Receive floating rate based on 3-month LIBOR and pay a fixed rate equal to 4.000%. Counterparty: Goldman Sachs & Co. | | | | | | | |
Exp. 12/17/2013 | | | 100 | | | 3 | |
Receive floating rate based on 3-month LIBOR and pay a fixed rate equal to 4.000%. Counterparty: Bank of America, N.A. | | | | | | | |
Exp. 12/17/2013 | | | 500 | | | 4 | |
Receive floating rate based on 3-month LIBOR and pay a fixed rate equal to 4.000%. Counterparty: J.P. Morgan Chase & Co. | | | | | | | |
Exp. 12/17/2013 | | | 300 | | | 5 | |
Receive floating rate based on 3-month LIBOR and pay a fixed rate equal to 5.000%. Counterparty: Merrill Lynch & Co., Inc. | | | | | | | |
Exp. 12/17/2023 | | | 900 | | | 36 | |
| | | | | |
|
|
|
| | | | | | $ | (95 | ) |
| | | | | |
|
|
|
| (g) | | Premiums received on written options: |
Type
| | Notional Amount
| | Premium
| | Value
|
Put - OTC 10 Year Interest Rate Swap | | | | | | | | | |
Strike @ 6.000%** Exp. 10/20/2003 | | $ | 300,000 | | $ | 15 | | $ | 0 |
Call - OTC 7 Year Interest Rate Swap | | | | | | | | | |
Strike @ 6.000%* Exp. 09/23/2005 | | | 300,000 | | | 11 | | | 6 |
Call - OTC 7 Year Interest Rate Swap | | | | | | | | | |
Strike @ 4.000%* Exp. 09/23/2005 | | | 300,000 | | | 8 | | | 8 |
Put - OTC 7 Year Interest Rate Swap | | | | | | | | | |
Strike @ 5.500%** Exp. 12/17/2003 | | | 200,000 | | | 3 | | | 0 |
Call - OTC 7 Year Interest Rate Swap | | | | | | | | | |
Strike @ 3.500%* Exp. 12/17/2003 | | | 200,000 | | | 2 | | | 4 |
Call - OTC 7 Year Interest Rate Swap | | | | | | | | | |
Strike @ 4.000%* Exp. 03/03/2004 | | | 200,000 | | | 4 | | | 5 |
Put - OTC 10 Year Interest Rate Swap | | | | | | | | | |
Strike @ 6.000%** Exp. 03/05/2004 | | | 600,000 | | | 2 | | | 2 |
Call - OTC 10 Year Interest Rate Swap | | | | | | | | | |
Strike @ 4.000%* Exp. 03/05/2004 | | | 200,000 | | | 4 | | | 5 |
Call - OTC 10 Year Interest Rate Swap | | | | | | | | | |
Strike @ 3.250%* Exp. 10/20/2003 | | | 300,000 | | | 3 | | | 1 |
| | | | | |
|
| |
|
|
| | | | | | $ | 52 | | $ | 31 |
| | | | | |
|
| |
|
|
Type
| | # of Contracts
| | Premium
| | Value
|
Call - CBOT U.S. Treasury Note September Futures | | | | | | | | |
Strike @ 117.000 Exp. 08/23/2003 | | 2 | | $ | 2 | | $ | 3 |
Call - CBOT U.S. Treasury Note September Futures | | | | | | | | |
Strike @ 121.000 Exp. 08/23/2003 | | 12 | | | 10 | | | 2 |
| | | | |
|
| |
|
|
| | | | | $ | 12 | | $ | 5 |
| | | | |
|
| |
|
|
| * | | The Portfolio will receive a floating rate based on 3-month LIBOR. |
| ** | | The Portfolio will pay a floating rate based on 3-month LIBOR. |
| (h) | | Written options with premiums to be determined on a future date: |
Type
| | # of Contracts
| | Unrealized Appreciation
|
Call & Put - OTC % U.S. Dollar Forward Delta / Neutral | | | | | |
Straddle vs. Japanese Yen Strike and premium determined on 12/18/2007, based upon implied volatility parameter of 18.5000% Counterparty: AIG International, Inc. Exp. 12/18/2012 | | 80 | | $ | 6 |
| (i) | | Principal amount denoted in indicated currency: |
BP – British Pound
C$ – Canadian Dollar
DK – Danish Krone
EC – Euro
H$ – Hong Kong Dollar
JY – Japanese Yen
MP – Mexican Peso
N$ – New Zealand Dollar
SK – Swedish Krona
See accompanying notes
10
| (j) | | Foreign forward currency contracts outstanding at June 30, 2003: |
Type
| | Currency
| | Principal Amount
Covered by
Contract
| | Settlement
Month
| | Unrealized
Appreciation
| | Unrealized
(Depreciation)
| | | Net Unrealized
Appreciation/
(Depreciation)
| |
Sell | | BP | | 1,440 | | 07/2003 | | $ | 46 | | $ | 0 | | | $ | 46 | |
Sell | | C$ | | 1,239 | | 07/2003 | | | 8 | | | 0 | | | | 8 | |
Sell | | DK | | 930 | | 09/2003 | | | 3 | | | 0 | | | | 3 | |
Buy | | EC | | 45 | | 07/2003 | | | 0 | | | (1 | ) | | | (1 | ) |
Sell | | EC | | 7,930 | | 07/2003 | | | 45 | | | 0 | | | | 45 | |
Buy | | H$ | | 272 | | 07/2003 | | | 0 | | | 0 | | | | 0 | |
Buy | | JY | | 3,735 | | 07/2003 | | | 0 | | | 0 | | | | 0 | |
Sell | | JY | | 43,264 | | 07/2003 | | | 8 | | | 0 | | | | 8 | |
Sell | | JY | | 166,380 | | 09/2003 | | | 12 | | | 0 | | | | 12 | |
Buy | | MP | | 616 | | 09/2003 | | | 6 | | | 0 | | | | 6 | |
Sell | | MP | | 616 | | 09/2003 | | | 0 | | | (1 | ) | | | (1 | ) |
Sell | | N$ | | 87 | | 07/2003 | | | 0 | | | 0 | | | | 0 | |
Sell | | SK | | 985 | | 09/2003 | | | 3 | | | 0 | | | | 3 | |
| | | | | | | | |
|
| |
|
|
| |
|
|
|
| | | | | | | | | $ | 131 | | $ | (2 | ) | | $ | 129 | |
| | | | | | | | |
|
| |
|
|
| |
|
|
|
| (k) | | Short sales open at June 30, 2003 were as follows: |
Type
| | Coupon (%)
| | Maturity
| | Par
| | Value
| | Proceeds
|
U.S. Treasury Note | | 5.000 | | 08/15/2011 | | $ | 800 | | $ | 914 | | $ | 908 |
U.S. Treasury Note | | 4.875 | | 02/15/2012 | | | 800 | | | 890 | | | 900 |
U.S. Treasury Note | | 4.375 | | 07/15/2007 | | | 1,100 | | | 1,195 | | | 1,199 |
U.S. Treasury Note | | 4.375 | | 08/15/2012 | | | 1,300 | | | 1,394 | | | 1,395 |
U.S. Treasury Note | | 4.000 | | 11/15/2012 | | | 420 | | | 437 | | | 443 |
| | | | | | | | | |
|
| |
|
|
| | | | | | | | | | $ | 4,830 | | $ | 4,845 |
| | | | | | | | | |
|
| |
|
|
| (l) | | Indicates a fair valued security which has not been valued utilizing an independent quote and which is valued pursuant to guidelines established by the Trustees. The aggregate value of fair valued securities is $100, which is 0.32% of net assets. |
See accompanying notes
11
Notes to Financial Statements
June 30, 2003 (Unaudited)
1. Organization
The Foreign Bond Portfolio (the “Portfolio”) is a series of the PIMCO Variable Insurance Trust (the “Trust”). The Trust is registered under the Investment Company Act of 1940 (the “Act”), as amended, as an open-end investment company organized as a Delaware business trust on October 3, 1997. The Trust may offer up to two classes of shares: Institutional and Administrative. Each share class has identical voting rights (except that shareholders of a class have exclusive voting rights regarding any matter relating solely to that class of shares). Information presented in these financial statements pertains to the Administrative Class of the Trust. Certain detailed financial information for the Institutional Class is provided separately and is available upon request. The Trust is designed to be used as an investment vehicle by Separate Accounts of insurance companies that fund variable annuity contracts and variable life insurance policies and by qualified pension and retirement plans. The Portfolio commenced operations on February 16, 1999.
2. Significant Accounting Policies
The following is a summary of significant accounting policies consistently followed by the Trust in the preparation of its financial statements in conformity with accounting principles generally accepted in the United States of America. The preparation of financial statements in accordance with accounting principles generally accepted in the United States of America requires management to make estimates and assumptions that affect the reported amounts and disclosures in the financial statements. Actual results could differ from those estimates.
Security Valuation. Portfolio securities and other financial instruments for which market quotations are readily available are stated at market value. Market value is determined at the close of regular trading (normally, 4:00 p.m., Eastern Time) on the New York Stock Exchange on each day the New York Stock Exchange is open, or if no sales are reported, as is the case for most securities traded over-the-counter, the mean between representative bid and asked quotations obtained from a quotation reporting system or from established market makers. Fixed income securities, including those to be purchased under firm commitment agreements, are normally valued on the basis of quotes obtained from brokers and dealers or pricing services. Short-term investments, which mature in 60 days or less are valued at amortized cost, which approximates market value. Certain fixed income securities for which daily market quotations are not readily available may be valued, pursuant to guidelines established by the Board of Trustees, with reference to fixed income securities whose prices are more readily obtainable. Prices may be obtained from independent pricing services which use information provided by market makers or estimates of market values obtained from yield data relating to investments or securities with similar characteristics. The prices used by the Portfolio may differ from the value that would be realized if the securities were sold and the differences could be material to the financial statements.
Securities Transactions and Investment Income. Securities transactions are recorded as of the trade date. Securities purchased or sold on a when-issued or delayed delivery basis may be settled a month or more after the trade date. Realized gains and losses from securities sold are recorded on the identified cost basis. Dividend income is recorded on the ex-dividend date, except certain dividends from foreign securities where the ex-dividend date may have passed, are recorded as soon as the Portfolio is informed of the ex-dividend date. Interest income, adjusted for the accretion of discounts and amortization of premiums, is recorded on the accrual basis. Paydowns gains and losses on mortgage- and asset-backed securities are recorded as adjustments to interest income in the Statement of Operations.
Dividends and Distributions to Shareholders. Dividends from net investment income, if any, are declared on each day the Trust is open for business and are distributed to shareholders monthly. All dividends are reinvested in additional shares of the Portfolio. Net realized capital gains earned by the Portfolio, if any, will be distributed no less frequently than once each year.
Income dividends and capital gain distributions are determined in accordance with income tax regulations which may differ from accounting principles generally accepted in the United States of America. These differences are primarily due to differing treatments for such items as wash sales, foreign currency transactions, net operating losses and capital loss carryforwards.
Distributions classified as a tax basis return of capital, if any, are reflected in the accompanying Statements of Changes in Net Assets and have been reclassified to paid in capital. In addition, other amounts have been reclassified between undistributed net investment income, accumulated undistributed net realized gains or losses and/or paid in capital to more appropriately conform financial accounting to tax characterizations of dividend distributions.
Foreign Currency. The accounting records of the Portfolio are maintained in U.S. dollars. The market values of foreign securities, currency holding and other assets and liabilities are translated into U.S. dollars based on the current exchange rates each business day. Fluctuations in the value of these assets and liabilities resulting from changes in exchange rates are recorded as unrealized foreign currency gains or losses. Realized gains or losses and unrealized appreciation (depreciation) on investment securities and income and expenses are translated on the respective dates of such transactions. The effect of changes in foreign currency exchange rates on investments in securities are not
12
segregated in the Statement of Operations from the effects of changes in market prices of those securities, but are included with the net realized and unrealized gain or loss on investment securities.
Multiclass Operations. Each class offered by the Trust has equal rights as to assets. Income, non-class specific expenses, and realized and unrealized capital gains and losses are allocated to each class of shares based on the relative net assets of each class.
Federal Income Taxes. The Portfolio intends to qualify as a regulated investment company and distribute all of its taxable income and net realized gains, if applicable, to shareholders. Accordingly, no provision for Federal income taxes has been made.
Financing Transactions. The Portfolio may enter into financing transactions consisting of the sale by the Portfolio of securities, together with a commitment to repurchase similar securities at a future date. The difference between the selling price and the future purchase price is an adjustment to interest income in the Statement of Operations. If the counterparty to whom the Portfolio sells the security becomes insolvent, the Portfolio’s right to repurchase the security may be restricted; the value of the security may change over the term of the financing transaction; and the return earned by the Portfolio with the proceeds of a financing transaction may not exceed transaction costs. The Portfolio will designate assets determined to be liquid by PIMCO or otherwise cover its obligations under financing transactions.
Futures Contracts. The Portfolio is authorized to enter into futures contracts. The Portfolio may use futures contracts to manage its exposure to the securities markets or to movements in interest rates and currency values. The primary risks associated with the use of futures contracts are imperfect correlation between the change in market value of the securities held by the Portfolio and the prices of futures contracts, the possibility of an illiquid market, and the inability of the counterparty to meet the terms of the contract. Futures contracts are valued based upon their quoted daily settlement prices. Upon entering into a futures contract, the Portfolio may be required to deposit with its custodian, in a segregated account in the name of the futures broker, an amount of cash or U.S. Government and Agency Obligations in accordance with the initial margin requirements of the broker or exchange. Futures contracts are marked to market daily and an appropriate payable or receivable for the change in value (“variation margin”) is recorded by the Portfolio. Gains or losses are recognized but not considered realized until the contracts expire or are closed. Futures contracts involve, to varying degrees, risk of loss in excess of the variation margin disclosed in the Statement of Assets and Liabilities.
Options Contracts. The Portfolio may write call and put options on futures, securities or currencies it owns or in which it may invest. Writing put options tends to increase the Portfolio’s exposure to the underlying instrument. Writing call options tends to decrease the Portfolio’s exposure to the underlying instrument. When the Portfolio writes a call or put option, an amount equal to the premium received is recorded as a liability and subsequently marked to market to reflect the current value of the option written. Payment received or made, if any, from writing options with premiums to be determined on a future date are reflected as such on the Statement of Assets and Liabilities. Premiums received from writing options which expire are treated as realized gains. Premiums received from writing options which are exercised or closed are added to the proceeds or offset against amounts paid on the underlying future, security or currency transaction to determine the realized gain or loss. The Portfolio as a writer of an option has no control over whether the underlying future, security or currency may be sold (call) or purchased (put) and as a result bears the market risk of an unfavorable change in the price of the future, security or currency underlying the written option. There is the risk the Portfolio may not be able to enter into a closing transaction because of an illiquid market.
The Portfolio may also purchase put and call options. Purchasing call options tends to increase the Portfolio’s exposure to the underlying instrument. Purchasing put options tends to decrease the Portfolio’s exposure to the underlying instrument. The Portfolio pays a premium which is included in the Portfolio’s Statement of Assets and Liabilities as an investment and subsequently marked to market to reflect the current value of the option. Premiums paid for purchasing options which expire are treated as realized losses. The risk associated with purchasing put and call options is limited to the premium paid. Premiums paid for purchasing options which are exercised or closed are added to the amounts paid or offset against the proceeds on the underlying future, security or currency transaction to determine the realized gain or loss.
Forward Currency Transactions. The Portfolio may enter into forward currency contracts and forward cross-currency contracts in connection with settling planned purchases or sales of securities or to hedge the currency exposure associated with some or all of the Portfolio’s securities. A forward currency contract is an agreement between two parties to buy and sell a currency at a set price on a future date. The market value of a forward currency contract fluctuates with changes in forward currency exchange rates. Forward currency contracts are marked to market daily and the change in value is recorded by the Portfolio as an unrealized gain or loss. Realized gains or losses equal to the difference between the value of the contract at the time it was opened and the value at the time it was closed are recorded upon delivery or receipt of the currency or, if a
13
forward currency contract is offset by entering into another forward currency contract with the same broker, upon settlement of the net gain or loss. These contracts may involve market risk in excess of the unrealized gain or loss reflected in the Portfolio’s Statement of Assets and Liabilities. In addition, the Portfolio could be exposed to risk if the counterparties are unable to meet the terms of the contracts or if the value of the currency changes unfavorably to the U.S. dollar.
Short Sales. The Portfolio has entered into short sales transactions during the fiscal year. A short sale is a transaction in which a Portfolio sells securities it does not own in anticipation of a decline in the market price of the securities. The Portfolio is obligated to deliver securities at the market price at the time the short position is closed. Possible losses from short sales may be unlimited, whereas losses from purchases cannot exceed the total amount invested.
Swap Agreements. The Portfolio may invest in swap agreements. A swap is an agreement to exchange the return generated by one instrument for the return generated by another instrument. The Portfolio may enter into interest rate, total return, forward swap spread lock and credit default swap agreements to manage its exposure to interest rates and credit risk. Interest rate swap agreements involve the exchange by the Portfolio with another party of their respective commitments to pay or receive interest, e.g., an exchange of floating rate payments for fixed rate payments with respect to a notional amount of principal. Total return swap agreements involve commitments to pay interest in exchange for a market-linked return, both based on notional amounts. To the extent the total return of the security or index underlying the transaction exceeds or falls short of the offsetting interest rate obligation, the Portfolio will receive a payment from or make a payment to the counterparty. Forward spread lock swap agreements involve commitments to pay or receive a settlement amount calculated as the difference between the swap spread and a fixed spread, multiplied by the notional amount times the duration of the swap. The swap spread is the difference between the benchmark swap rate (market rate) and the specific Treasury rate. In a credit default swap, one party makes a stream of payments to another party in exchange for the right to receive a specified return in the event of a default by a third party, typically corporate issues or sovereign issues of an emerging country, on its obligation. The Portfolio may use credit default swaps to provide a measure of protection against defaults of sovereign issuers (i.e., to reduce risk where the Portfolio owns or has exposure to the sovereign issuer) or to take an active long or short position with respect to the likelihood of a particular issuer’s default. Swaps are marked to market daily based upon quotations from market makers and vendors and the change in value, if any, is recorded as unrealized gain or loss in the Statement of Operations. Payments received or made at the beginning of the measurement period are reflected as such on the Statement of Assets and Liabilities. A liquidation payment received or made at the termination of the swap is recorded as realized gain or loss in the Statement of Operations. Net periodic payments are included as part of miscellaneous income on the Statement of Operations. Entering into these agreements involves, to varying degrees, elements of credit, market and documentation risk in excess of the amounts recognized on the Statement of Assets and Liabilities. Such risks involve the possibility that there will be no liquid market for these agreements, that the counterparty to the agreements may default on its obligation to perform or disagree as to the meaning of contractual terms in the agreements, and that there may be unfavorable changes in interest rates.
Delayed Delivery Transactions. The Portfolio may purchase or sell securities on a when-issued or delayed delivery basis. These transactions involve a commitment by the Portfolio to purchase or sell securities for a predetermined price or yield, with payment and delivery taking place beyond the customary settlement period. When delayed delivery purchases are outstanding, the Portfolio will set aside and maintain until the settlement date in a segregated account, liquid assets in an amount sufficient to meet the purchase price. When purchasing a security on a delayed delivery basis, the Portfolio assumes the rights and risks of ownership of the security, including the risk of price and yield fluctuations, and takes such fluctuations into account when determining its net asset value. The Portfolio may dispose of or renegotiate a delayed delivery transaction after it is entered into, and may sell when-issued securities before they are delivered, which may result in a capital gain or loss. When the Portfolio has sold a security on a delayed delivery basis, the Portfolio does not participate in future gains and losses with respect to the security.
Repurchase Agreements. The Portfolio may engage in repurchase transactions. Under the terms of a typical repurchase agreement, the Portfolio takes possession of an underlying debt obligation subject to an obligation of the seller to repurchase, and the Portfolio to resell, the obligation at an agreed-upon price and time. The market value of the collateral must be equal at all times to the total amount of the repurchase obligations, including interest. Generally, in the event of counterparty default, the Portfolio has the right to use the collateral to offset losses incurred.
3. Fees, Expenses, and Related Party Transactions
Investment Advisory Fee. Pacific Investment Management Company LLC (PIMCO) is a majority owned subsidiary partnership of Allianz Dresdner Asset Management of America L.P. (formerly PIMCO Advisors L.P.) and serves as investment adviser (the “Adviser”) to the Trust, pursuant to an investment
14
advisory contract. The Adviser receives a monthly fee at an annual rate based on average daily net assets of the Portfolio. The Advisory Fee is charged at an annual rate of 0.25%.
Administration Fee. PIMCO serves as administrator (the “Administrator”) and provides administrative services to the Trust for which it receives a monthly administrative fee based on average daily net assets of the Portfolio. The Administration Fee is charged at the annual rate of 0.50%.
Servicing Fee. PIMCO Advisors Distributors LLC (“PAD”), is an indirect wholly-owned subsidiary of Allianz Dresdner Asset Management of America L.P. and serves as the distributor of the Trust’s shares. The Trust is permitted to reimburse PAD on a quarterly basis, out of the Administrative Class assets of the Portfolio in the amount of 0.15% on an annual basis of the average daily net assets of that class, for payments made to financial intermediaries that provide services in connection with the distribution of shares or administration of plans or programs that use Portfolio shares as their funding medium. The effective rate paid to PAD during the current fiscal year is 0.15% .
Expenses. The Portfolio is responsible for the following expenses: (i) salaries and other compensation of any of the Trust’s executive officers and employees who are not officers, directors, stockholders or employees of PIMCO or its subsidiaries or affiliates; (ii) taxes and governmental fees; (iii) brokerage fees and commissions and other portfolio transaction expenses; (iv) the cost of borrowing money, including interest expense; (v) fees and expenses of the Trustees who are not “interested persons” of PIMCO or the Trust, and any counsel retained exclusively for their benefit; (vi) extraordinary expenses, including costs of litigation and indemnification expenses; (vii) organization expenses and (viii) any expenses allocated or allocable to a specific class of shares, which include service fees payable with respect to the Administrative Class shares and may include certain other expenses as permitted by the Trust’s Multiple Class Plan adopted pursuant to Rule 18f-3 under the Act and subject to review and approval by the Trustees. The ratio of expenses to average net assets per share class, as disclosed in the Financial Highlights, may differ from the annual Portfolio operating expenses per share class as disclosed in the Prospectus for the reasons set forth above. PIMCO has agreed to waive a portion of its administrative fees to the extent that the payment of the Portfolio’s pro rata share of Trustees’ fees causes the actual expense ratio to rise above the rates disclosed in the current prospectus plus 0.49 basis points as set forth below (calculated as a percentage of the Portfolio’s average daily net assets attributable to each class):
| | | Institutional Class
| | | Administrative Class
| |
Foreign Bond Portfolio | | 0.75 | % | | 0.90 | % |
PIMCO may be reimbursed for these waived amounts in future periods. The Trust pays no compensation directly to any Trustee or any other officer who is affiliated with the Administrator, all of whom receive renumeration for their services to the Trust from the Administrator or its affiliates.
Each unaffiliated Trustee receives an annual retainer of $4,000, plus $1,500 for each Board of Trustees meeting attended in person and $250 for each meeting attended telephonically, plus reimbursement of related expenses. In addition, each committee chair receives an additional annual retainer of $500. These expenses are allocated on a pro-rata basis to each Portfolio of the Trust according to its respective net assets.
4. Purchases and Sales of Securities
Purchases and sales of securities (excluding short-term investments) for the period ended June 30, 2003 were as follows (amounts in thousands):
| | | U.S Government/Agency
| | All Other
|
| | | Purchases
| | Sales
| | Purchases
| | Sales
|
Foreign Bond Portfolio | | $ | 52,149 | | $ | 48,315 | | $ | 24,418 | | $ | 15,381 |
5. Transactions in Written Call and Put Options
Transactions in written call and put options were as follows (amounts in thousands):
| | | Foreign Bond Portfolio
| |
| | | | | Premium
| |
Balance at 12/31/2002 | | | | $ | 76 | |
Sales | | | | | 41 | |
Closing Buys | | | | | (51 | ) |
Expirations | | | | | (2 | ) |
Exercised | | | | | 0 | |
| | | | |
|
|
|
Balance at 06/30/2003 | | | | $ | 64 | |
| | | | |
|
|
|
15
6. Federal Income Tax Matters
At June 30, 2003, the aggregate cost of investments was the same for federal income tax and financial statement purposes. The net unrealized appreciation (depreciation) of investments securities for federal income tax purposes is as follows (amounts in thousands):
| | | Aggregate Gross Unrealized Appreciation
| | Aggregate Gross Unrealized (Depreciation)
| | | Net Unrealized Appreciation
|
Foreign Bond Portfolio | | $ | 2,201 | | $ | (355 | ) | | $ | 1,846 |
7. Shares of Beneficial Interest
The Trust may issue an unlimited number of shares of beneficial interest with a $.0001 par value. Changes in shares of beneficial interest were as follows (shares and amounts in thousands):
| | | Foreign Bond Portfolio
| |
| | | Six Months Ended 06/30/2003
| | | Year Ended
12/31/2002
| |
| | | Shares
| | | Amount
| | �� | Shares
| | | Amount
| |
Receipts for shares sold | | | | | | | | | | | | | | |
Institutional Class | | 0 | | | $ | 0 | | | 0 | | | $ | 0 | |
Administrative Class | | 1,589 | | | | 16,300 | | | 1,985 | | | | 19,462 | |
Issued as reinvestment of distributions | | | | | | | | | | | | | | |
Institutional Class | | 0 | | | | 0 | | | 1 | | | | 3 | |
Administrative Class | | 30 | | | | 310 | | | 42 | | | | 417 | |
Cost of shares redeemed | | | | | | | | | | | | | | |
Institutional Class | | 0 | | | | 0 | | | (96 | ) | | | (930 | ) |
Administrative Class | | (280 | ) | | | (2,856 | ) | | (863 | ) | | | (8,415 | ) |
| | |
|
| |
|
|
| |
|
| |
|
|
|
Net increase resulting from Portfolio share transactions | | 1,339 | | | $ | 13,754 | | | 1,069 | | | $ | 10,537 | |
| | |
|
| |
|
|
| |
|
| |
|
|
|
The following schedule shows the number of shareholders each owning 5% or more of the Portfolio and the total percentage of the Portfolio held by such shareholders:
| | | Number
| | % of Portfolio
Held
|
Foreign Bond Portfolio | | | | |
Institutional Class | | 1 | | 100 |
Administrative Class | | 3 | | 96 |
16
Trustees and Officers
Brent R. Harris, Chairman and Trustee
R. Wesley Burns, President and Trustee
E. Philip Cannon, Trustee
Vern O. Curtis, Trustee
J. Michael Hagan, Trustee
William J. Popejoy, Trustee
Garlin G. Flynn, Secretary
John P. Hardaway, Treasurer
Investment Adviser and Administrator
Pacific Investment Management Company LLC
840 Newport Center Drive
Newport Beach, California 92660
Transfer Agent
National Financial Data Services
330 W. 9th Street, 4th Floor
Kansas City, Missouri 64105
Custodian
State Street Bank & Trust Company
801 Pennsylvania
Kansas City, Missouri 64105
Counsel
Dechert LLP
1775 I Street, N.W.
Washington, D.C. 20006
Independent Accountants
PricewaterhouseCoopers LLP
1055 Broadway
Kansas City, Missouri 64105
PIMCO VARIABLE INSURANCE TRUST
This report is submitted for the general information of the shareholders of the PIMCO Variable Insurance Trust. It is not authorized for distribution to prospective investors unless accompanied or preceded by an effective prospectus for the PIMCO Variable Insurance Trust, which contains information covering its investment policies as well as other pertinent information.
All Funds distributed by PIMCO ADVISORS DISTRIBUTORS LLC, member NASD
840 NEWPORT CENTER DRIVE
NEWPORT BEACH, CA 92660
800.927.4648
WWW.PIMCOADVISORS.COM
WWW.PIMCO.COM
| | | P I M C O |
| | | PIMCO VARIABLE INSURANCE TRUST |
| | | HIGH YIELD PORTFOLIO |
| | | ADMINISTRATIVE CLASS |
| | |
|
SEMI-ANNUAL REPORT
June 30, 2003
| | | Fund
Summary
| | Schedule of
Investments
|
High Yield Portfolio (Administrative Class) | | 2 | | 7 |
Chairman’s Letter
Dear PIMCO Variable Insurance Trust Shareholder:
Financial assets gained during the first half of 2003 amid a revival of risk appetites as anxiety about the war in Iraq faded. Assets that generally benefit from economic growth, such as stocks, corporate bonds and emerging market debt, fared the best year-to-date as investors returned to these sectors in anticipation of a recovery in the second half of 2003. Reflationary forces that investors expected to fuel a rebound included federal tax cuts and a weak dollar, as well as low borrowing rates that eased the burden of high personal and corporate indebtedness. Low mortgage rates kept refinancings booming in the second quarter and put more money in consumers’ pockets.
U.S. Treasuries lagged their riskier counterparts but still enjoyed a modest rally. Yields fell to levels not seen in 45 years early in the second quarter before bouncing off their lows in June as hopes for recovery increased. The yield on the benchmark 10-year Treasury closed the six-month period 0.30% lower to 3.51%, after nearing 3% earlier in the period. Buyers were encouraged that inflation would remain tame amid low capacity utilization and weak employment growth. Asian central banks bought U.S. Treasuries to limit the rise in their currencies versus the dollar in an effort to protect their export industries. In June, the Federal Reserve cut the federal funds rate by 0.25% to 1%, its 13th easing since 2001, in an effort to boost the economy and ward off deflation. Although the cut was less than expected, the Fed suggested that rates would stay low until deflation risks abated.
On the following pages you will find specific details as to the Portfolio’s total return investment performance and a discussion of those factors that affected performance.
We appreciate the trust you have placed in us, and we will continue to focus our efforts to meet your investment needs.
Sincerely,

Brent R. Harris
Chairman
July 31, 2003
1
High Yield Portfolio
TOTAL RETURN INVESTMENT PERFORMANCE For the period ended June 30, 2003
| | | 1 Year | | | 5 Year | | | Since Inception* | |
High Yield Portfolio Administrative Class | | 18.57 | % | | 3.64 | % | | 3.72 | % |
Merrill Lynch U.S. High Yield BB-B Rated Index | | 18.47 | % | | 3.14 | % | | — | |
| * | | Annualized (All Portfolio returns are net of fees and expenses) |
CUMULATIVE RETURNS THROUGH JUNE 30, 2003
$10,000 invested at inception
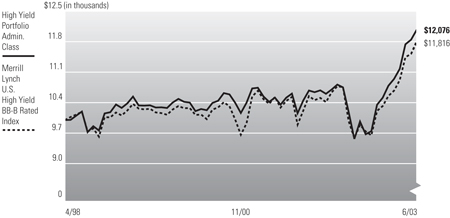
Past performance is no guarantee of future results. Investment return and principal value will fluctuate so that Portfolio shares, when redeemed, may be worth more or less than their original cost. The line graph above assumes the investment of $10,000 on 5/01/1998, the first full month following the Portfolio’s Administrative Class inception on 4/30/1998, compared to the Merrill Lynch U.S. High Yield BB-B Rated Index, an unmanaged market index. It is not possible to invest directly in the Index. The Portfolio may invest in foreign securities which involve potentially higher risks including foreign currency fluctuations and political or economic uncertainty. These risks may be enhanced when investing in emerging market securities. The investments made by the Portfolio may involve high risk and may have speculative characteristics.
PORTFOLIO INSIGHTS
| • | | The High Yield Portfolio seeks to achieve its investment objective by investing under normal circumstances at least 80% of its assets in a diversified portfolio of high yield securities (“junk bonds”) rated below investment grade but rated at least B by Moody’s or S&P, or, if unrated, determined by PIMCO to be of comparable quality. |
| • | | The Portfolio’s Administrative Class shares returned 14.86% for the six-month period ended June 30, 2003, outperforming the 14.48% of the Merrill Lynch U.S. High Yield BB-B Rated Index. |
| • | | The Portfolio’s exposure to B-rated issues contributed to performance as B-rated issues outperformed BBs by 4.16%. |
| • | | An emphasis on large-cap telecom companies contributed to returns as telecom credits continued their positive momentum for the ninth consecutive month. |
| • | | An underweight to the consumer cyclical sector was a notable positive, as the war in Iraq weighed heavily on the economy and consumer confidence during the first part of the period. |
| • | | Security selection in the cable & pay TV sector was a strong contributor to relative performance, as lower-rated issues performed the best. |
| • | | An underweight to transportation was a positive early in the year. However, as airlines began to recover from setbacks due to the war in Iraq and the outbreak of SARS, an underweight to this sector detracted from performance for the six-month period. |
| • | | An underweight to the utility sector for most of the period hurt performance as the sector continued the positive trend it began in late 2002. |
2
Financial Highlights
High Yield Portfolio (Administrative Class)
Selected Per Share Data for the Year or Period
Ended: | | 06/30/2003 +
| | | 12/31/2002
| | | 12/31/2001
| | | 12/31/2000
| | | 12/31/1999
| | | 04/30/1998- 12/31/1998
| |
Net asset value beginning of period | | $ | 7.17 | | | $ | 7.88 | | | $ | 8.33 | | | $ | 9.18 | | | $ | 9.67 | | | $ | 10.00 | |
Net investment income (a) | | | 0.29 | | | | 0.60 | | | | 0.64 | | | | 0.77 | | | | 0.77 | | | | 0.51 | |
Net realized/unrealized (loss) on investments (a) | | | 0.76 | | | | (0.71 | ) | | | (0.45 | ) | | | (0.85 | ) | | | (0.49 | ) | | | (0.34 | ) |
Total income (loss) from investment operations | | | 1.05 | | | | (0.11 | ) | | | 0.19 | | | | (0.08 | ) | | | 0.28 | | | | 0.17 | |
Dividends from net investment income | | | (0.29 | ) | | | (0.60 | ) | | | (0.64 | ) | | | (0.77 | ) | | | (0.77 | ) | | | (0.50 | ) |
Distributions from net realized capital gains | | | 0.00 | | | | 0.00 | | | | 0.00 | | | | 0.00 | | | | 0.00 | | | | 0.00 | |
Total distributions | | | (0.29 | ) | | | (0.60 | ) | | | (0.64 | ) | | | (0.77 | ) | | | (0.77 | ) | | | (0.50 | ) |
Net asset value end of period | | $ | 7.93 | | | $ | 7.17 | | | $ | 7.88 | | | $ | 8.33 | | | $ | 9.18 | | | $ | 9.67 | |
Total return | | | 14.86 | % | | | (1.19 | )% | | | 2.35 | % | | | (0.86 | )% | | | 3.01 | % | | | 1.80 | % |
Net assets end of period (000s) | | $ | 809,852 | | | $ | 481,473 | | | $ | 264,718 | | | $ | 169,557 | | | $ | 151,020 | | | $ | 49,761 | |
Ratio of expenses to average net assets | | | 0.75 | %* | | | 0.75 | %(d) | | | 0.75 | %(c) | | | 0.75 | % | | | 0.75 | %(b) | | | 0.75 | %* |
Ratio of net investment income to average net assets | | | 7.59 | %* | | | 8.27 | % | | | 7.88 | % | | | 8.81 | % | | | 8.25 | % | | | 7.90 | %* |
Portfolio turnover rate | | | 201 | % | | | 102 | % | | | 129 | % | | | 59 | % | | | 13 | % | | | 13 | % |
| (a) | | Per share amounts based on average number of shares outstanding during the period. |
| (b) | | If the investment manager had not reimbursed expenses, the ratio of operating expenses to average net assets would have been 0.76% for the year ended December 31, 1999. |
| (c) | | If the investment manager had not reimbursed expenses, the ratio of operating expenses to average net assets would have been 0.76% for the year ended December 31, 2001. |
| (d) | | If the investment manager had not reimbursed expenses, the ratio of operating expenses to average net assets would have been 0.76% for the year ended December 31, 2002. |
See accompanying notes
3
Statement of Assets and Liabilities
High Yield Portfolio
June 30, 2003 (Unaudited)
Amounts in thousands, except per share amounts
| Assets: | | | | |
Investments, at value | | $ | 790,243 | |
Cash | | | 69 | |
Foreign currency, at value | | | 3,427 | |
Receivable for investments sold | | | 13,989 | |
Unrealized appreciation on forward foreign currency contracts | | | 71 | |
Interest receivable | | | 14,264 | |
Variation margin receivable | | | 68 | |
Unrealized appreciation on swap agreements | | | 4 | |
Other assets | | | 1 | |
| | |
|
|
|
| | | | 822,136 | |
| | |
|
|
|
| Liabilities: | | | | |
Payable for investments purchased | | $ | 9,374 | |
Written options outstanding | | | 2,398 | |
Accrued investment advisory fee | | | 158 | |
Accrued administration fee | | | 221 | |
Accrued servicing fee | | | 90 | |
Recoupment payable to Manager | | | 14 | |
Unrealized depreciation on swap agreements | | | 17 | |
| | |
|
|
|
| | | | 12,272 | |
| | |
|
|
|
| Net Assets | | $ | 809,864 | |
| | |
|
|
|
| Net Assets Consist of: | | | | |
Paid in capital | | $ | 805,242 | |
Undistributed (overdistributed) net investment income | | | (81 | ) |
Accumulated undistributed net realized (loss) | | | (35,575 | ) |
Net unrealized appreciation | | | 40,278 | |
| | |
|
|
|
| | | $ | 809,864 | |
| | |
|
|
|
| Net Assets: | | | | |
Institutional Class | | $ | 12 | |
Administrative Class | | | 809,852 | |
| |
| Shares Issued and Outstanding: | | | | |
Institutional Class | | | 1 | |
Administrative Class | | | 102,109 | |
| Net Asset Value and Redemption Price Per Share (Net Assets Per Share Outstanding) | | | | |
Institutional Class | | $ | 7.93 | |
Administrative Class | | | 7.93 | |
| Cost of Investments Owned | | $ | 750,575 | |
| Cost of Foreign Currency Held | | $ | 3,451 | |
See accompanying notes
4
Statement of Operations
High Yield Portfolio
For the six months ended June 30, 2003 (Unaudited)
Amounts in thousands
| Investment Income: | | | | |
Interest | | $ | 24,901 | |
Dividends, net of foreign taxes | | | 171 | |
Miscellaneous income | | | 273 | |
| | |
|
|
|
Total Income | | | 25,345 | |
| | |
|
|
|
| Expenses: | | | | |
Investment advisory fees | | | 753 | |
Administration fees | | | 1,055 | |
Servicing fees | | | 452 | |
Trustees’ fees | | | 3 | |
Organization costs | | | 1 | |
Miscellaneous expense | | | 14 | |
| | |
|
|
|
Total Expenses | | | 2,278 | |
| | |
|
|
|
| Net Investment Income | | | 23,067 | |
| | |
|
|
|
| Net Realized and Unrealized Gain (Loss): | | | | |
Net realized gain on investments | | | 7,093 | |
Net realized (loss) on futures contracts, written options, and swaps | | | (376 | ) |
Net realized (loss) on foreign currency transactions | | | (1,454 | ) |
Net change in unrealized appreciation on investments | | | 53,634 | |
Net change in unrealized appreciation on futures contracts, written options, and swaps | | | 1,165 | |
Net change in unrealized appreciation on translation of assets and liabilities denominated in foreign currencies | | | 711 | |
Net Gain | | | 60,773 | |
| | |
|
|
|
| Net Increase in Assets Resulting from Operations | | $ | 83,840 | |
| | |
|
|
|
See accompanying notes
5
Statements of Changes in Net Assets
High Yield Portfolio
Amounts in thousands
| Increase (Decrease) in Net Assets from: | | Six Months Ended
June 30, 2003
| | | Year Ended
December 31, 2002
| |
| | | (Unaudited) | | | | |
| Operations: | | | | | | | | |
Net investment income | | $ | 23,067 | | | $ | 26,664 | |
Net realized gain (loss) | | | 5,263 | | | | (18,122 | ) |
Net change in unrealized appreciation (depreciation) | | | 55,510 | | | | (3,211 | ) |
| | |
|
|
| |
|
|
|
Net increase resulting from operations | | | 83,840 | | | | 5,331 | |
| | |
|
|
| |
|
|
|
| Distributions to Shareholders: | | | | | | | | |
From net investment income | | | | | | | | |
Institutional Class | | | 0 | | | | 0 | |
Administrative Class | | | (23,020 | ) | | | (26,547 | ) |
Tax Basis Return of Capital | | | | | | | | |
Institutional Class | | | 0 | | | | 0 | |
Administrative Class | | | 0 | | | | (108 | ) |
| | |
|
|
| |
|
|
|
| Total Distributions | | | (23,020 | ) | | | (26,655 | ) |
| | |
|
|
| |
|
|
|
| Portfolio Share Transactions: | | | | | | | | |
Receipts for shares sold | | | | | | | | |
Institutional Class | | | 0 | | | | 10 | |
Administrative Class | | | 530,792 | | | | 418,977 | |
Issued as reinvestment of distributions | | | | | | | | |
Institutional Class | | | 0 | | | | 0 | |
Administrative Class | | | 23,020 | | | | 26,655 | |
Cost of shares redeemed | | | | | | | | |
Institutional Class | | | 0 | | | | 0 | |
Administrative Class | | | (286,251 | ) | | | (207,553 | ) |
| | |
|
|
| |
|
|
|
Net increase resulting from Portfolio share transactions | | | 267,561 | | | | 238,089 | |
| | |
|
|
| |
|
|
|
| Total Increase in Net Assets | | | 328,381 | | | | 216,765 | |
| | |
|
|
| |
|
|
|
| Net Assets: | | | | | | | | |
Beginning of period | | | 481,483 | | | | 264,718 | |
End of period* | | $ | 809,864 | | | $ | 481,483 | |
*Including (overdistributed) net investment income of: | | $ | (81 | ) | | $ | (128 | ) |
See accompanying notes
6
Schedule of Investments
High Yield Portfolio
June 30, 2003 (Unaudited)
| | | Principal
Amount
(000s)
| | Value
(000s)
|
| CORPORATE BONDS & NOTES 77.8% | | | | | | |
| Banking & Finance 9.7% | | | | | | |
Arch Western Finance LLC | | | | | | |
6.750% due 07/01/2013 | | $ | 2,300 | | $ | 2,369 |
Arvin Capital I | | | | | | |
9.500% due 02/01/2027 | | | 700 | | | 730 |
Bluewater Finance Ltd. | | | | | | |
10.250% due 02/15/2012 | | | 3,600 | | | 3,581 |
Bombardier Capital, Inc. | | | | | | |
7.500% due 08/15/2004 | | | 3,650 | | | 3,787 |
Cedar Brakes II, LLC | | | | | | |
9.875% due 09/01/2013 | | | 1,465 | | | 1,461 |
Choctaw Resort Development Enterprise | | | | | | |
9.250% due 04/01/2009 | | | 2,300 | | | 2,493 |
Credit & Repackaged Securities Ltd. | | | | | | |
10.250% due 10/30/2006 (l) | | | 1,250 | | | 1,399 |
Finova Group, Inc. | | | | | | |
7.500% due 11/15/2009 | | | 11,500 | | | 5,060 |
Forest City Enterprises, Inc. | | | | | | |
7.625% due 06/01/2015 | | | 1,175 | | | 1,238 |
Fuji Bank Ltd. | | | | | | |
9.870% due 06/30/2008 (a) | | | 1,400 | | | 1,477 |
Gemstone Investors Ltd. | | | | | | |
7.710% due 10/31/2004 | | | 1,500 | | | 1,500 |
J.P. Morgan - HYDI | | | | | | |
8.750% due 11/15/2007 | | | 107 | | | 115 |
9.700% due 11/15/2007 | | | 84 | | | 91 |
8.000% due 06/20/2008 | | | 8,720 | | | 9,047 |
9.000% due 06/20/2008 | | | 7,000 | | | 7,332 |
JET Equipment Trust | | | | | | |
10.000% due 06/15/2012 | | | 800 | | | 236 |
7.630% due 08/15/2012 | | | 403 | | | 155 |
MDP Acquisition PLC | | | | | | |
9.625% due 10/01/2012 | | | 1,900 | | | 2,109 |
Mizuho Preferred Capital Co. LLC | | | | | | |
8.790% due 12/29/2049 (a) | | | 2,000 | | | 2,020 |
Morgan Stanley Dean Witter & Co. | | | | | | |
1.341% due 05/01/2012 | | | 5,950 | | | 6,572 |
Qwest Capital Funding, Inc. | | | | | | |
7.900% due 08/15/2010 | | | 2,000 | | | 1,680 |
7.250% due 02/15/2011 | | | 7,000 | | | 5,775 |
7.750% due 02/15/2031 | | | 440 | | | 345 |
Reliance Group Holdings, Inc. | | | | | | |
0.000% due 11/15/2049 (b)(l) | | | 1,200 | | | 30 |
Riggs Capital Trust II | | | | | | |
8.875% due 03/15/2027 | | | 2,600 | | | 2,548 |
Rotech Healthcare, Inc. | | | | | | |
9.500% due 04/01/2012 | | | 3,050 | | | 3,149 |
Tokai Capital Corp. | | | | | | |
9.980% due 12/29/2049 (a) | | | 2,700 | | | 2,872 |
Trains HY-2003-1 | | | | | | |
7.293% due 05/15/2013 | | | 4,663 | | | 5,028 |
Universal City Development Partners | | | | | | |
11.750% due 04/01/2010 | | | 1,700 | | | 1,874 |
Ventas Capital Corp. | | | | | | |
8.750% due 05/01/2009 | | | 2,175 | | | 2,360 |
| | | | | |
|
|
| | | | | | | 78,433 |
| | | | | |
|
|
| Industrials 54.8% | | | | | | |
Abitibi-Consolidated, Inc. | | | | | | |
6.000% due 06/20/2013 | | | 1,500 | | | 1,431 |
8.850% due 08/01/2030 | | | 3,600 | | | 3,837 |
AEC Ironwood LLC | | | | | | |
8.857% due 11/30/2025 | | | 3,549 | | | 3,713 |
Allbritton Communications Co. | | | | | | |
7.750% due 12/15/2012 | | | 2,500 | | | 2,594 |
Allied Waste North America, Inc. | | | | | | |
8.875% due 04/01/2008 | | | 1,150 | | | 1,253 |
8.500% due 12/01/2008 | | | 1,400 | | | 1,512 |
7.875% due 01/01/2009 | | | 2,990 | | | 3,143 |
10.000% due 08/01/2009 | | | 2,525 | | | 2,695 |
9.250% due 09/01/2012 | | | 4,950 | | | 5,482 |
7.875% due 04/15/2013 | | | 2,700 | | | 2,838 |
American Cellular Corp. | | | | | | |
9.500% due 10/15/2009 | | | 1,750 | | | 884 |
American Media Operations, Inc. | | | | | | |
10.250% due 05/01/2009 | | | 3,500 | | | 3,797 |
American Media, Inc. | | | | | | |
8.875% due 01/15/2011 | | | 500 | | | 544 |
AmeriGas Partners LP | | | | | | |
10.000% due 04/15/2006 | | | 320 | | | 350 |
8.830% due 04/19/2010 | | | 1,250 | | | 1,347 |
8.875% due 05/20/2011 | | | 600 | | | 657 |
ANR Pipeline Co | | | | | | |
8.875% due 03/15/2010 | | | 3,000 | | | 3,292 |
Arco Chemical Co. | | | | | | |
9.375% due 12/15/2005 | | | 950 | | | 964 |
10.250% due 11/01/2010 | | | 1,400 | | | 1,361 |
Avecia Group PLC | | | | | | |
11.000% due 07/01/2009 | | | 2,050 | | | 1,865 |
Beverly Enterprises, Inc. | | | | | | |
9.000% due 02/15/2006 | | | 2,100 | | | 2,063 |
9.625% due 04/15/2009 | | | 1,500 | | | 1,447 |
Boyd Gaming Corp. | | | | | | |
7.750% due 12/15/2012 | | | 3,900 | | | 4,158 |
BRL Universal Equipment | | | | | | |
8.875% due 02/15/2008 | | | 615 | | | 670 |
Building Materials Corp. | | | | | | |
7.750% due 07/15/2005 | | | 200 | | | 197 |
8.000% due 10/15/2007 | | | 2,950 | | | 2,806 |
8.000% due 12/01/2008 | | | 1,000 | | | 930 |
Cadmus Communications Corp. | | | | | | |
9.750% due 06/01/2009 | | | 2,225 | | | 2,384 |
Canwest Media, Inc. | | | | | | |
10.625% due 05/15/2011 | | | 3,375 | | | 3,864 |
Case Corp. | | | | | | |
6.250% due 12/01/2003 | | | 5,650 | | | 5,721 |
Century Aluminum Co. | | | | | | |
11.750% due 04/15/2008 | | | 400 | | | 410 |
CF Cable TV, Inc. | | | | | | |
9.125% due 07/15/2007 | | | 250 | | | 262 |
Charter Communications Holdings LLC | | | | | | |
8.250% due 04/01/2007 | | | 600 | | | 465 |
10.000% due 04/01/2009 | | | 1,225 | | | 943 |
9.625% due 11/15/2009 | | | 2,150 | | | 1,580 |
0.000% due 01/15/2011 (c) | | | 500 | | | 262 |
0.000% due 04/01/2011 (c) | | | 4,005 | | | 2,653 |
Chesapeake Energy Corp. | | | | | | |
8.500% due 03/15/2012 | | | 500 | | | 531 |
9.000% due 08/15/2012 | | | 600 | | | 672 |
7.500% due 09/15/2013 | | | 2,300 | | | 2,455 |
7.750% due 01/15/2015 | | | 1,300 | | | 1,394 |
Circus & Eldorado Joint Venture Silver Legacy Capital Corp. | | | | | | |
10.125% due 03/01/2012 | | | 2,800 | | | 2,765 |
CMS Panhandle Holding Co. | | | | | | |
6.500% due 07/15/2009 | | | 1,000 | | | 1,110 |
7.000% due 07/15/2029 | | | 300 | | | 317 |
Coastal Corp. | | | | | | |
7.750% due 06/15/2010 | | | 650 | | | 609 |
9.625% due 05/15/2012 | | | 500 | | | 504 |
7.750% due 10/15/2035 | | | 1,000 | | | 845 |
Colorado Interstate Gas Co. | | | | | | |
6.850% due 06/15/2037 | | | 1,500 | | | 1,571 |
Commonwealth Brands, Inc. | | | | | | |
9.750% due 04/15/2008 | | | 2,000 | | | 2,080 |
Compass Minerals Group, Inc. | | | | | | |
10.000% due 08/15/2011 | | | 1,125 | | | 1,266 |
Continental Airlines, Inc. | | | | | | |
7.461% due 04/01/2015 | | | 251 | | | 237 |
7.373% due 12/15/2015 | | | 1,000 | | | 812 |
Crown Castle International Corp. | | | | | | |
10.625% due 11/15/2007 | | | 200 | | | 211 |
10.750% due 08/01/2011 | | | 1,650 | | | 1,807 |
Crown European Holdings S.A. | | | | | | |
9.500% due 03/01/2011 | | | 3,425 | | | 3,716 |
10.875% due 03/01/2013 | | | 1,900 | | | 2,080 |
CSC Holdings, Inc. | | | | | | |
8.125% due 07/15/2009 | | | 800 | | | 830 |
8.125% due 08/15/2009 | | | 2,505 | | | 2,605 |
7.625% due 04/01/2011 | | | 7,000 | | | 7,105 |
Danka Business Systems PLC | | | | | | |
11.000% due 06/15/2010 | | | 1,000 | | | 987 |
Dex Media East LLC | | | | | | |
9.875% due 11/15/2009 | | | 2,325 | | | 2,604 |
12.125% due 11/15/2012 | | | 1,425 | | | 1,692 |
7.375% due 12/15/2012 | | | 700 | | | 630 |
DirecTV Holdings LLC | | | | | | |
8.375% due 03/15/2013 | | | 4,000 | | | 4,480 |
Dresser, Inc. | | | | | | |
9.375% due 04/15/2011 | | | 5,400 | | | 5,589 |
Dunlop Stand Aerospace Holdings | | | | | | |
11.875% due 05/15/2009 | | | 2,000 | | | 2,160 |
Dura Operating Corp. | | | | | | |
8.625% due 04/15/2012 | | | 3,850 | | | 3,965 |
Dynegy Danskammer & Roseton LLC | | | | | | |
7.270% due 11/08/2010 | | | 1,700 | | | 1,531 |
7.670% due 11/08/2016 | | | 4,900 | | | 3,972 |
EchoStar DBS Corp. | | | | | | |
10.375% due 10/01/2007 | | | 600 | | | 668 |
9.375% due 02/01/2009 | | | 2,225 | | | 2,384 |
Equistar Chemicals LP | | | | | | |
10.125% due 09/01/2008 | | | 2,750 | | | 2,846 |
8.750% due 02/15/2009 | | | 1,000 | | | 975 |
Extended Stay America, Inc. | | | | | | |
9.875% due 06/15/2011 | | | 4,095 | | | 4,423 |
Extendicare Health Services | | | | | | |
9.350% due 12/15/2007 | | | 1,050 | | | 1,005 |
9.500% due 07/01/2010 | | | 2,200 | | | 2,321 |
Ferrellgas Partners LP | | | | | | |
6.990% due 08/01/2005 | | | 1,000 | | | 1,052 |
8.780% due 08/01/2007 (d) | | | 2,500 | | | 2,769 |
8.870% due 08/01/2009 (d) | | | 1,250 | | | 1,411 |
8.750% due 06/15/2012 | | | 2,000 | | | 2,180 |
Fiat Finance Luxembourg S.A. | | | | | | |
3.250% due 01/09/2007 | | | 4,400 | | | 4,230 |
Fimep S.A. | | | | | | |
10.500% due 02/15/2013 | | | 1,100 | | | 1,232 |
Foamex L.P. | | | | | | |
10.750% due 04/01/2009 | | | 600 | | | 483 |
Fresenius Medical Care | | | | | | |
7.875% due 06/15/2011 | | | 2,300 | | | 2,438 |
Garden State Newspapers, Inc. | | | | | | |
8.750% due 10/01/2009 | | | 3,300 | | | 3,424 |
8.625% due 07/01/2011 | | | 400 | | | 419 |
General Motors Corp. | | | | | | |
7.125% due 07/15/2013 | | | 1,000 | | | 1,006 |
Georgia-Pacific Corp. | | | | | | |
6.700% due 11/15/2003 | | | 2,230 | | | 2,258 |
9.875% due 11/01/2021 | | | 2,250 | | | 2,284 |
9.625% due 03/15/2022 | | | 2,900 | | | 2,886 |
9.500% due 05/15/2022 | | | 1,300 | | | 1,287 |
9.125% due 07/01/2022 | | | 2,000 | | | 1,940 |
8.125% due 06/15/2023 | | | 1,800 | | | 1,647 |
8.875% due 05/15/2031 | | | 2,450 | | | 2,413 |
Giant Industries, Inc. | | | | | | |
11.000% due 05/15/2012 | | | 400 | | | 388 |
Golden Northwest Aluminum | | | | | | |
12.000% due 12/15/2006 | | | 125 | | | 8 |
Gray Television, Inc. | | | | | | |
9.250% due 12/15/2011 | | | 1,800 | | | 1,998 |
Grief Brothers Corp. | | | | | | |
8.875% due 08/01/2012 | | | 1,350 | | | 1,458 |
H&E Equipment Services LLC | | | | | | |
11.125% due 06/15/2012 | | | 2,390 | | | 2,115 |
Hanover Equipment Trust | | | | | | |
8.500% due 09/01/2008 | | | 4,800 | | | 5,064 |
HCA, Inc. | | | | | | |
7.875% due 02/01/2011 | | | 2,800 | | | 3,140 |
6.300% due 10/01/2012 | | | 2,300 | | | 2,356 |
See accompanying notes
7
| | | Principal
Amount
(000s)
| | Value
(000s)
|
HEALTHSOUTH Corp. | | | | | | |
8.500% due 02/01/2008 (b) | | $ | 110 | | $ | 87 |
8.375% due 10/01/2011 (b) | | | 2,100 | | | 1,659 |
Hilton Hotels Corp. | | | | | | |
7.625% due 12/01/2012 | | | 3,500 | | | 3,850 |
HMH Properties, Inc. | | | | | | |
7.875% due 08/01/2008 | | | 2,750 | | | 2,805 |
Hollinger International Publishing, Inc. | | | | | | |
9.000% due 12/15/2010 | | | 4,300 | | | 4,623 |
Hollinger Participation Trust | | | | | | |
12.125% due 11/15/2010 (e) | | | 1,013 | | | 1,142 |
Host Marriott LP | | | | | | |
8.375% due 02/15/2006 (a) | | | 1,100 | | | 1,144 |
9.250% due 10/01/2007 | | | 2,100 | | | 2,268 |
Houghton Mifflin Co. | | | | | | |
8.250% due 02/01/2011 | | | 1,650 | | | 1,749 |
9.875% due 02/01/2013 | | | 750 | | | 818 |
Ingles Markets, Inc. | | | | | | |
8.875% due 12/01/2011 | | | 3,050 | | | 3,084 |
Insight Midwest, L.P. | | | | | | |
9.750% due 10/01/2009 | | | 4,045 | | | 4,298 |
10.500% due 11/01/2010 | | | 150 | | | 165 |
ISP Chemco, Inc. | | | | | | |
10.250% due 07/01/2011 | | | 2,990 | | | 3,394 |
Jefferson Smurfit Corp. | | | | | | |
7.500% due 06/01/2013 | | | 900 | | | 923 |
Johnsondiversey, Inc. | | | | | | |
9.625% due 05/15/2012 | | | 1,100 | | | 1,235 |
K&F Industries ,Inc. | | | | | | |
9.625% due 12/15/2010 | | | 1,000 | | | 1,115 |
Leviathan Gas Corp. | | | | | | |
10.375% due 06/01/2009 | | | 550 | | | 590 |
Lyondell Chemical Co. | | | | | | |
9.500% due 12/15/2008 | | | 2,360 | | | 2,254 |
Mail Well I Corp. | | | | | | |
9.625% due 03/15/2012 | | | 1,650 | | | 1,745 |
Mandalay Resort Group | | | | | | |
6.750% due 07/15/2003 | | | 1,100 | | | 1,101 |
9.375% due 02/15/2010 | | | 5,500 | | | 6,243 |
7.625% due 07/15/2013 | | | 500 | | | 514 |
6.700% due 11/15/2096 | | | 350 | | | 355 |
Mediacom Broadband LLC | | | | | | |
11.000% due 07/15/2013 | | | 3,050 | | | 3,408 |
Merisant Co | | | | | | |
9.500% due 07/15/2013 | | | 465 | | | 484 |
MGM Mirage, Inc. | | | | | | |
8.375% due 02/01/2011 | | | 4,200 | | | 4,799 |
Midwest Generation LLC | | | | | | |
8.300% due 07/02/2009 | | | 800 | | | 796 |
8.560% due 01/02/2016 | | | 9,500 | | | 9,358 |
Millennium America, Inc. | | | | | | |
9.250% due 06/15/2008 | | | 3,050 | | | 3,294 |
Newpark Resources, Inc. | | | | | | |
8.625% due 12/15/2007 | | | 2,440 | | | 2,513 |
Norampac, Inc. | | | | | | |
6.750% due 06/01/2013 | | | 1,500 | | | 1,583 |
OM Group, Inc. | | | | | | |
9.250% due 12/15/2011 | | | 1,300 | | | 1,274 |
Omnicare, Inc. | | | | | | |
6.125% due 06/01/2013 | | | 3,000 | | | 2,954 |
Owens-Brockway Glass Container, Inc. | | | | | | |
7.750% due 05/15/2011 | | | 700 | | | 740 |
8.750% due 11/15/2012 | | | 3,800 | | | 4,142 |
8.250% due 05/15/2013 | | | 700 | | | 732 |
PacifiCare Health Systems, Inc. | | | | | | |
10.750% due 06/01/2009 | | | 3,550 | | | 4,091 |
Packaging Corp. of America | | | | | | |
9.625% due 04/01/2009 | | | 1,500 | | | 1,659 |
PanAmSat Corp. | | | | | | |
8.500% due 02/01/2012 | | | 4,900 | | | 5,329 |
6.875% due 01/15/2028 | | | 3,000 | | | 2,955 |
Park Place Entertainment Corp. | | | | | | |
9.375% due 02/15/2007 | | | 1,500 | | | 1,665 |
7.000% due 04/15/2013 | | | 4,350 | | | 4,676 |
Peabody Energy Corp. | | | | | | |
6.875% due 03/15/2013 | | | 4,700 | | | 4,947 |
Pride International, Inc. | | | | | | |
9.375% due 05/01/2007 | | | 5,950 | | | 6,173 |
Primedia, Inc. | | | | | | |
8.000% due 05/15/2013 | | | 3,650 | | | 3,760 |
Quebecor Media, Inc. | | | | | | |
11.125% due 07/15/2011 | | | 3,850 | | | 4,428 |
Qwest Corp. | | | | | | |
7.500% due 11/01/2008 | | | 500 | | | 465 |
8.875% due 03/15/2012 | | | 5,650 | | | 6,342 |
7.200% due 11/10/2026 | | | 400 | | | 377 |
RH Donnelley Finance Corp. | | | | | | |
8.875% due 12/15/2010 | | | 175 | | | 194 |
10.875% due 12/15/2012 | | | 825 | | | 965 |
Rogers Cable, Inc. | | | | | | |
6.250% due 06/15/2013 | | | 1,100 | | | 1,103 |
Rogers Cablesystems, Inc. | | | | | | |
10.000% due 03/15/2005 | | | 785 | | | 856 |
11.000% due 12/01/2015 | | | 727 | | | 825 |
Rogers Cantel, Inc. | | | | | | |
8.300% due 10/01/2007 | | | 3,000 | | | 3,094 |
9.375% due 06/01/2008 | | | 1,750 | | | 1,833 |
Roundy’s, Inc. | | | | | | |
8.875% due 06/15/2012 | | | 2,450 | | | 2,573 |
Safety-Kleen Corp. | | | | | | |
0.000% due 06/01/2008 (b) | | | 1,450 | | | 4 |
0.000% due 05/15/2009 (b) | | | 250 | | | 14 |
Salem Communications Holding Corp. | | | | | | |
7.750% due 12/15/2010 | | | 3,000 | | | 3,120 |
Shaw Communications, Inc. | | | | | | |
8.250% due 04/11/2010 | | | 2,400 | | | 2,682 |
Silgan Holdings, Inc. | | | | | | |
9.000% due 06/01/2009 | | | 1,000 | | | 1,040 |
Six Flags, Inc. | | | | | | |
9.750% due 04/15/2013 | | | 4,100 | | | 4,080 |
Sonat, Inc. | | | | | | |
7.625% due 07/15/2011 | | | 2,000 | | | 1,830 |
SPX Corp. | | | | | | |
9.400% due 06/14/2005 | | | 2,000 | | | 2,059 |
6.250% due 06/15/2011 | | | 2,000 | | | 2,050 |
7.500% due 01/01/2013 | | | 850 | | | 924 |
Starwood Hotels & Resorts Worldwide, Inc. | | | | | | |
7.375% due 05/01/2007 | | | 1,698 | | | 1,795 |
7.875% due 05/01/2012 | | | 3,246 | | | 3,570 |
Stone Container Corp. | | | | | | |
11.500% due 08/15/2006 | | | 1,000 | | | 1,073 |
TeleCorp PCS, Inc. | | | | | | |
7.500% due 06/01/2007 | | | 2,185 | | | 2,447 |
1.000% due 04/15/2009 (c) | | | 1,750 | | | 1,820 |
10.625% due 07/15/2010 | | | 2,060 | | | 2,498 |
Tesoro Petroleum Corp. | | | | | | |
9.625% due 04/01/2012 | | | 1,220 | | | 1,122 |
Time Warner Telecom, Inc. | | | | | | |
9.750% due 07/15/2008 | | | 1,100 | | | 1,067 |
10.125% due 02/01/2011 | | | 200 | | | 194 |
Tritel PCS, Inc. | | | | | | |
0.000% due 05/15/2009 (c) | | | 4,292 | | | 4,485 |
10.375% due 01/15/2011 | | | 1,833 | | | 2,250 |
Triton PCS, Inc. | | | | | | |
8.750% due 11/15/2011 | | | 2,450 | | | 2,456 |
TRW Automotive, Inc. | | | | | | |
9.375% due 02/15/2013 | | | 5,075 | | | 5,532 |
Tyco International Group S.A. | | | | | | |
6.125% due 01/15/2009 | | | 1,000 | | | 1,045 |
6.750% due 02/15/2011 | | | 3,500 | | | 3,728 |
6.375% due 10/15/2011 | | | 1,900 | | | 2,014 |
U.S. Airways, Inc. | | | | | | |
9.625% due 09/01/2003 (b) | | | 1,075 | | | 274 |
9.330% due 01/01/2006 (b) | | | 90 | | | 19 |
United Airlines, Inc. | | | | | | |
6.201% due 09/01/2008 | | | 225 | | | 189 |
7.730% due 07/01/2010 | | | 1,400 | | | 1,105 |
7.186% due 04/01/2011 | | | 491 | | | 420 |
6.602% due 09/01/2013 | | | 1,400 | | | 1,176 |
Vintage Petroleum, Inc. | | | | | | |
7.875% due 05/15/2011 | | | 3,400 | | | 3,664 |
8.250% due 05/01/2012 | | | 2,300 | | | 2,542 |
Vivendi Universal S.A. | | | | | | |
9.250% due 04/15/2010 | | | 1,050 | | | 1,223 |
VoiceStream Wireless Corp. | | | | | | |
10.375% due 11/15/2009 | | | 1,530 | | | 1,786 |
Western Gas Resources, Inc. | | | | | | |
10.000% due 06/15/2009 | | | 1,700 | | | 1,862 |
Williams Cos., Inc. | | | | | | |
9.250% due 03/15/2004 | | | 4,600 | | | 4,738 |
8.625% due 06/01/2010 | | | 3,400 | | | 3,570 |
7.625% due 07/15/2019 | | | 4,300 | | | 4,193 |
7.875% due 09/01/2021 | | | 300 | | | 294 |
7.500% due 01/15/2031 | | | 1,100 | | | 1,045 |
7.750% due 06/15/2031 | | | 1,400 | | | 1,358 |
8.750% due 03/15/2032 | | | 2,200 | | | 2,299 |
Xerox Capital Europe PLC | | | | | | |
5.875% due 05/15/2004 | | | 4,500 | | | 4,545 |
Xerox Corp. | | | | | | |
5.500% due 11/15/2003 | | | 1,200 | | | 1,212 |
Young Broadcasting, Inc. | | | | | | |
9.000% due 01/15/2006 | | | 475 | | | 480 |
8.750% due 06/15/2007 | | | 1,000 | | | 1,020 |
8.500% due 12/15/2008 | | | 2,100 | | | 2,258 |
10.000% due 03/01/2011 | | | 1,830 | | | 1,990 |
| | | | | |
|
|
| | | | | | | 443,723 |
| | | | | |
|
|
| Utilities 13.3% | | | | | | |
AES Corp. | | | | | | |
8.750% due 05/15/2013 | | | 6,400 | | | 6,688 |
AT&T Corp. | | | | | | |
8.500% due 11/15/2031 | | | 2,400 | | | 2,731 |
Calpine Corp. | | | | | | |
7.625% due 04/15/2006 | | | 1,390 | | | 1,213 |
8.750% due 07/15/2007 | | | 700 | | | 576 |
7.875% due 04/01/2008 | | | 1,500 | | | 1,155 |
8.625% due 08/15/2010 | | | 800 | | | 604 |
CenterPoint Energy Resources Corp. | | | | | | |
7.875% due 04/01/2013 | | | 3,000 | | | 3,457 |
CMS Energy Corp. | | | | | | |
8.375% due 07/01/2003 | | | 1,000 | | | 1,000 |
7.625% due 11/15/2004 | | | 975 | | | 995 |
7.000% due 01/15/2005 | | | 3,325 | | | 3,288 |
8.900% due 07/15/2008 | | | 300 | | | 315 |
7.500% due 01/15/2009 | | | 1,000 | | | 994 |
Edison International, Inc. | | | | | | |
6.875% due 09/15/2004 | | | 4,000 | | | 4,040 |
El Paso Corp. | | | | | | |
7.000% due 05/15/2011 | | | 400 | | | 366 |
7.875% due 06/15/2012 | | | 3,550 | | | 3,306 |
7.750% due 01/15/2032 | | | 2,250 | | | 1,907 |
El Paso Energy Partners | | | | | | |
8.500% due 06/01/2010 | | | 1,900 | | | 2,047 |
8.500% due 06/01/2011 | | | 1,300 | | | 1,398 |
El Paso Production Holding Co. | | | | | | |
7.750% due 06/01/2013 | | | 1,050 | | | 1,053 |
IPALCO Enterprises, Inc. | | | | | | |
8.375% due 11/14/2008 | | | 2,000 | | | 2,200 |
7.625% due 11/14/2011 | | | 1,340 | | | 1,474 |
Niagara Mohawk Power Co. | | | | | | |
8.500% due 07/01/2010 (c) | | | 1,000 | | | 1,048 |
NorAm Energy Corp. | | | | | | |
6.375% due 11/01/2003 | | | 500 | | | 505 |
7.750% due 02/15/2011 | | | 4,300 | | | 4,907 |
Pinnacle Partners | | | | | | |
8.830% due 08/15/2004 | | | 5,975 | | | 6,229 |
PSEG Energy Holdings, Inc. | | | | | | |
7.750% due 04/16/2007 | | | 1,500 | | | 1,588 |
10.000% due 10/01/2009 | | | 2,040 | | | 2,319 |
8.500% due 06/15/2011 | | | 4,350 | | | 4,684 |
Reliant Energy Resources Corp. | | | | | | |
8.125% due 07/15/2005 | | | 3,000 | | | 3,251 |
Rogers Communication, Inc. | | | | | | |
8.875% due 07/15/2007 | | | 250 | | | 259 |
See accompanying notes
8
| | | Principal
Amount
(000s)
| | Value
(000s)
| |
Rural Cellular Corp. | | | | | | | |
9.625% due 05/15/2008 | | $ | 1,425 | | $ | 1,268 | |
9.750% due 01/15/2010 | | | 350 | | | 312 | |
SESI, LLC | | | | | | | |
8.875% due 05/15/2011 | | | 1,765 | | | 1,906 | |
South Point Energy Corp. | | | | | | | |
8.400% due 05/30/2012 | | | 4,083 | | | 4,065 | |
Southern California Edison Co. | | | | | | | |
8.000% due 02/15/2007 | | | 4,600 | | | 5,066 | |
Sprint Capital Corp. | | | | | | | |
6.125% due 11/15/2008 | | | 850 | | | 924 | |
7.625% due 01/30/2011 | | | 500 | | | 572 | |
8.375% due 03/15/2012 | | | 2,470 | | | 2,963 | |
6.900% due 05/01/2019 | | | 2,000 | | | 2,101 | |
6.875% due 11/15/2028 | | | 2,270 | | | 2,286 | |
8.750% due 03/15/2032 | | | 3,750 | | | 4,505 | |
TECO Energy, Inc. | | | | | | | |
7.500% due 06/15/2010 | | | 3,000 | | | 3,075 | |
Tesoro Petroleum Corp. | | | | | | | |
9.625% due 11/01/2008 | | | 1,200 | | | 1,116 | |
Texas Utilities Corp. | | | | | | | |
5.520% due 08/16/2003 | | | 5,805 | | | 5,834 | |
TSI Telecommunication Services, Inc. | | | | | | | |
12.750% due 02/01/2009 | | | 600 | | | 597 | |
TXU Corp. | | | | | | | |
6.375% due 01/01/2008 | | | 500 | | | 536 | |
7.000% due 03/15/2013 | | | 3,400 | | | 3,771 | |
WorldCom, Inc. - WorldCom Group | | | | | | | |
6.950% due 08/15/2028 (b) | | | 550 | | | 164 | |
8.250% due 05/15/2031 (b) | | | 4,500 | | | 1,339 | |
| | | | | |
|
|
|
| | | | | | | 107,997 | |
| | | | | |
|
|
|
Total Corporate Bonds & Notes
(Cost $598,498) | | | | | | 630,153 | |
| | | | | |
|
|
|
| MUNICIPAL BONDS & NOTES 0.2% | | | | | | | |
New Jersey 0.2% | | | | | | | |
New Jersey Tobacco Settlement Funding Corp. Revenue Bonds, Series 2003 | | | | | | | |
6.375% due 06/01/2032 | | | 2,000 | | | 1,818 | |
| | | | | |
|
|
|
Total Municipal Bonds & Notes
(Cost $1,917) | | | | | | 1,818 | |
| | | | | |
|
|
|
| U.S. TREASURY OBLIGATIONS 0.5% | | | | | | | |
Treasury Inflation Protected Securities (f) | | | | | | | |
3.375% due 01/15/2007 | | | 1,392 | | | 1,529 | |
3.625% due 01/15/2008 | | | 740 | | | 830 | |
3.500% due 01/15/2011 | | | 475 | | | 540 | |
3.000% due 07/15/2012 | | | 1,022 | | | 1,127 | |
| | | | | |
|
|
|
Total U.S. Treasury Obligations
(Cost $4,002) | | | | | | 4,026 | |
| | | | | |
|
|
|
| ASSET-BACKED SECURITIES 3.0% | | | | | | | |
Alpharma, Inc. | | | | | | | |
4.650% due 09/08/2008 (d) | | | 340 | | | 340 | |
5.110% due 09/18/2008 (d) | | | 154 | | | 154 | |
4.600% due 10/09/2008 (d) | | | 617 | | | 617 | |
4.600% due 10/09/2008 (d) | | | 520 | | | 521 | |
Aquila, Inc. | | | | | | | |
7.000% due 04/15/2004 | | | 174 | | | 175 | |
7.250% due 04/15/2004 | | | 173 | | | 174 | |
8.750% due 04/15/2006 | | | 1,365 | | | 1,372 | |
Charter Communications Holdings LLC | | | | | | | |
4.090% due 03/18/2008 (a) | | | 2,000 | | | 1,877 | |
CMS Energy Corp. | | | | | | | |
9.000% due 10/30/2004 | | | 1,500 | | | 1,505 | |
Commonwealth Brands | | | | | | | |
5.375% due 08/28/2007 (a) | | | 635 | | | 636 | |
DirecTV Holdings LLC | | | | | | | |
4.770% due 03/06/2010 | | | 777 | | | 783 | |
4.740% due 04/06/2010 | | | 777 | | | 783 | |
4.830% due 06/30/2010 (a) | | | 446 | | | 449 | |
MGM Mirage, Inc. | | | | | | | |
4.390% due 06/30/2008 | | | 2,000 | | | 2,003 | |
Nextel Partners, Inc. | | | | | | | |
4.750% due 06/30/2008 (a) | | | 3,476 | | | 3,469 | |
6.625% due 06/30/2008 | | | 9 | | | 9 | |
5.000% due 12/31/2008 (a) | | | 3,476 | | | 3,469 | |
6.875% due 12/31/2008 | | | 9 | | | 9 | |
Qwest Corp. | | | | | | | |
6.500% due 06/05/2007 | | | 5,000 | | | 5,060 | |
Tucson Electric Power | | | | | | | |
6.808% due 10/25/2007 (a) | | | 1,000 | | | 1,009 | |
| | | | | |
|
|
|
Total Asset-Backed Securities
(Cost $23,563) | | | | | | 24,414 | |
| | | | | |
|
|
|
| SOVEREIGN ISSUES 8.4% | | | | | | | |
Republic of Brazil | | | | | | | |
2.125% due 04/15/2006 (a) | | | 7,320 | | | 6,881 | |
11.000% due 01/11/2012 | | | 2,300 | | | 2,294 | |
8.000% due 04/15/2014 | | | 14,777 | | | 12,986 | |
10.125% due 05/15/2027 | | | 700 | | | 605 | |
11.000% due 08/17/2040 | | | 300 | | | 271 | |
Republic of Colombia | | | | | | | |
7.625% due 02/15/2007 | | | 700 | | | 751 | |
9.750% due 04/23/2009 | | | 1,500 | | | 1,712 | |
10.000% due 01/23/2012 | | | 3,300 | | | 3,704 | |
11.750% due 02/25/2020 | | | 3,800 | | | 4,741 | |
10.375% due 01/28/2033 | | | 700 | | | 807 | |
Republic of Egypt | | | | | | | |
8.750% due 07/11/2011 | | | 0 | | | 0 | |
Republic of Panama | | | | | | | |
9.625% due 02/08/2011 | | | 2,500 | | | 2,906 | |
9.375% due 07/23/2012 | | | 3,200 | | | 3,720 | |
5.000% due 07/17/2014 | | | 256 | | | 230 | |
2.250% due 07/17/2016 (a) | | | 1,947 | | | 1,548 | |
8.875% due 09/30/2027 | | | 2,900 | | | 3,168 | |
Republic of Peru | | | | | | | |
9.125% due 01/15/2008 | | | 2,000 | | | 2,175 | |
9.125% due 02/21/2012 | | | 6,775 | | | 7,239 | |
9.875% due 02/06/2015 | | | 1,000 | | | 1,100 | |
4.500% due 03/07/2017 | | | 1,700 | | | 1,322 | |
Russian Federation | | | | | | | |
5.000% due 03/31/2030 | | | 700 | | | 680 | |
United Mexican States | | | | | | | |
8.375% due 01/14/2011 | | | 3,900 | | | 4,682 | |
6.375% due 01/16/2013 | | | 500 | | | 531 | |
6.625% due 03/03/2015 | | | 4,000 | | | 4,260 | |
| | | | | |
|
|
|
Total Sovereign Issues
(Cost $63,969) | | | | | | 68,313 | |
| | | | | |
|
|
|
| FOREIGN CURRENCY-DENOMINATED ISSUES 1.9% | | | | | | | |
Barry Callebaut Services NV | | | | | | | |
9.250% due 03/15/2010 | | EC | 1,090 | | | 1,336 | |
El Paso Corp. | | | | | | | |
5.750% due 03/14/2006 | | | 2,000 | | | 1,944 | |
Fimep S.A. | | | | | | | |
11.000% due 02/15/2013 | | | 1,600 | | | 2,092 | |
Fort James Corp. | | | | | | | |
4.750% due 06/29/2004 | | | 500 | | | 560 | |
Johnsondiversey, Inc. | | | | | | | |
9.625% due 05/15/2012 | | | 1,000 | | | 1,238 | |
MDP Acquisitions PLC | | | | | | | |
10.125% due 10/01/2012 | | | 1,800 | | | 2,212 | |
Remy Cointreau S.A. | | | | | | | |
10.000% due 07/30/2005 | | | 300 | | | 353 | |
Tyco International Group S.A. | | | | | | | |
4.375% due 11/19/2004 | | | 1,000 | | | 1,143 | |
6.125% due 04/04/2007 | | | 2,400 | | | 2,744 | |
5.500% due 11/19/2008 | | | 1,250 | | | 1,425 | |
| | | | | |
|
|
|
Total Foreign Currency-Denominated Issues
(Cost $12,411) | | | | | | 15,047 | |
| | | | | |
|
|
|
| CONVERTIBLE BONDS & NOTES 1.1% | | | | | | | |
| Healthcare 0.5% | | | | | | | |
HEALTHSOUTH Corp. | | | | | | | |
3.250% due 04/01/2049 (b) | | $ | 1,550 | | $ | 798 | |
Total Renal Care Holdings | | | | | | | |
7.000% due 05/15/2009 | | | 3,200 | | | 3,380 | |
| | | | | |
|
|
|
| | | | | | | 4,178 | |
| | | | | |
|
|
|
| Industrials 0.3% | | | | | | | |
Dimon, Inc. | | | | | | | |
6.250% due 03/31/2007 | | | 2,500 | | | 2,421 | |
| | | | | |
|
|
|
| Utilities 0.3% | | | | | | | |
Rogers Communication, Inc. | | | | | | | |
2.000% due 11/26/2005 | | | 2,015 | | | 1,836 | |
| | | | | |
|
|
|
Total Convertible Bonds & Notes
(Cost $8,507) | | | | | | 8,435 | |
| | | | | |
|
|
|
| | | Shares
| | | |
| PREFERRED STOCK 0.5% | | | | | | | |
Fresenius Medical Care | | | | | | | |
7.875% due 02/01/2008 | | | 3,600 | | | 3,798 | |
| | | | | |
|
|
|
Total Preferred Stock
(Cost $3,472) | | | | | | 3,798 | |
| | | | | |
|
|
|
| | | Principal
Amount
(000s)
| | | |
| SHORT-TERM INSTRUMENTS 4.2% | | | | | | | |
| Commercial Paper 3.0% | | | | | | | |
Danske Corp. | | | | | | | |
1.210% due 08/20/2003 | | $ | 500 | | | 499 | |
1.070% due 09/10/2003 | | | 6,800 | | | 6,786 | |
Freddie Mac | | | | | | | |
1.135% due 10/30/2003 | | | 5,700 | | | 5,680 | |
General Electric Capital Corp. | | | | | | | |
1.030% due 07/23/2003 | | | 1,000 | | | 999 | |
HBOS Treasury Services PLC | | | | | | | |
1.100% due 09/12/2003 | | | 3,900 | | | 3,892 | |
Kraft Foods, Inc. | | | | | | | |
2.080% due 02/27/2004 | | | 3,700 | | | 3,700 | |
Royal Bank of Scotland PLC | | | | | | | |
1.230% due 08/06/2003 | | | 500 | | | 499 | |
Westpac Capital Corp. | | | | | | | |
1.200% due 07/29/2003 | | | 500 | | | 499 | |
Westpac Trust | | | | | | | |
1.200% due 08/14/2003 | | | 1,400 | | | 1,398 | |
| | | | | |
|
|
|
| | | | | | | 23,952 | |
| | | | | |
|
|
|
| Repurchase Agreement 0.6% | | | | | | | |
State Street Bank | | | | | | | |
0.800% due 07/01/2003 | | | 5,277 | | | 5,277 | |
(Dated 06/30/2003. Collateralized by Fannie Mae 2.000% due 11/19/2004 valued at $5,384. Repurchase proceeds are $5,277.) | | | | | | | |
| | | | | |
|
|
|
| U.S. Treasury Bill 0.6% | | | | | | | |
1.049% due 08/14/2003 (g) | | | 5,015 | | | 5,010 | |
| | | | | |
|
|
|
Total Short-Term Instruments
(Cost $34,236) | | | | | | 34,239 | |
| | | | | |
|
|
|
Total Investments 97.6%
(Cost $750,575) | | | | | $ | 790,243 | |
Written Options (h) (0.3%)
(Premiums $2,014) | | | | | | (2,398 | ) |
Other Assets and Liabilities (Net) 2.7% | | | | | | 22,019 | |
| | | | | |
|
|
|
Net Assets 100.0% | | | | | $ | 809,864 | |
| | | | | |
|
|
|
See accompanying notes
9
Notes to Schedule of Investments
(amounts in thousands, except number of contracts):
| (a) | | Variable rate security. The rate listed is as of June 30, 2003. |
| (b) | | Security is in default. |
| (c) | | Security becomes interest bearing at a future date. |
| (e) | | Payment in-kind bond security. |
| (f) | | Principal amount of security is adjusted for inflation. |
| (g) | | Securities with an aggregate market value of $2,513 have been segregated with the custodian to cover margin requirements for the following open futures contracts at June 30, 2003: |
Type
| | # of
Contracts
| | Unrealized
Appreciation
|
Euribor March Futures (03/2004) - Long | | 166 | | $ | 280 |
Euribor December Futures (12/2004) - Long | | 189 | | | 307 |
Eurodollar September Futures (09/2004) - Long | | 100 | | | 196 |
Eurodollar December Futures (12/2004) - Long | | 100 | | | 218 |
| | | | |
|
|
| | | | | $ | 1,001 |
| | | | |
|
|
| (h) | | Premiums received on written options: |
Type
| | Notional
Amount
| | Premium
| | Value
|
Put - OTC 7 Year Interest Rate Swap | | | | | | | | | |
Strike @ 7.000%** Exp. 01/07/2005 | | $ | 9,100,000 | | $ | 190 | | $ | 47 |
Call - OTC 7 Year Interest Rate Swap | | | | | | | | | |
Strike @ 5.500%* Exp. 01/07/2005 | | | 5,900,000 | | | 122 | | | 546 |
Call - OTC 7 Year Interest Rate Swap | | | | | | | | | |
Strike @ 5.000 %* Exp. 01/07/2005 | | | 9,100,000 | | | 215 | | | 631 |
Put - OTC 10 Year Interest Rate Swap | | | | | | | | | |
Strike @ 6.500%** Exp. 10/07/2004 | | | 27,000,000 | | | 796 | | | 220 |
Call - OTC 10 Year Interest Rate Swap | | | | | | | | | |
Strike @ 4.000%* Exp. 10/07/2004 | | | 27,000,000 | | | 416 | | | 697 |
| | | | | |
|
| |
|
|
| | | | | | $ | 1,739 | | $ | 2,141 |
| | | | | |
|
| |
|
|
Type
| | # of
Contracts
| | Premium
| | Value
|
Call - CBOT U.S. Treasury Note September Futures | | | | | | | | | |
Strike @ 121.000 Exp. 08/23/2003 | | | 220 | | $ | 148 | | $ | 45 |
Put - CBOT U.S. Treasury Bond September Futures | | | | | | | | | |
Strike @ 117.000 Exp. 08/23/2003 | | | 116 | | | 127 | | | 212 |
| | | | | |
|
| |
|
|
| | | | | | $ | 275 | | $ | 257 |
| | | | | |
|
| |
|
|
| * | | The Portfolio will receive a floating rate based on 3-month LIBOR. |
| ** | | The Portfolio will pay a floating rate based on 3-month LIBOR. |
| (i) | | Swap agreements outstanding at June 30, 2003: |
Type
| | Notional
Amount
| | Unrealized
Appreciation/
(Depreciation)
| |
Receive a fixed rate equal to 1.820% and the Portfolio will pay to the counterparty at par in the event of default of Republic of Panama 9.625% due 02/08/2011. Counterparty: Goldman Sachs & Co. | | | | | | | |
Exp. 11/30/2003 | | $ | 1,500 | | $ | 4 | |
Receive a fixed rate equal to 3.270% and the Portfolio will pay to the counterparty at par in the event of default of Russian Federation 5.000% due 03/31/2030. Counterparty: Morgan Stanley Dean Witter & Co. | | | | | | | |
Exp. 06/28/2013 | | | 3,000 | | | (17 | ) |
| | | | | |
|
|
|
| | | | | | $ | (13 | ) |
| | | | | |
|
|
|
| (j) | | Principal amount denoted in indicated currency: |
EC – Euro
| (k) | | Foreign forward currency contracts outstanding at June 30, 2003: |
Type
| | Currency
| | Principal
Amount
Covered by
Contract
| | Settlement
Month
| | Unrealized
Appreciation
| | Unrealized
(Depreciation)
| | Net
Unrealized
Appreciation
|
Sell | | EC | | 15,175 | | 07/2003 | | $ | 71 | | $ | 0 | | $ | 71 |
| | | | | | | | |
|
| |
|
| |
|
|
| (l) | | Indicates a fair valued security which has not been utilizing an independent quote and which is valued pursuant to guidelines established by the Trustees. The aggregate value of fair valued securities is $1,429, which is 0.18% of net assets. |
See accompanying notes
10
Notes to Financial Statements
June 30, 2003 (Unaudited)
1. Organization
The High Yield Portfolio (the “Portfolio”) is a series of the PIMCO Variable Insurance Trust (the “Trust”). The Trust is registered under the Investment Company Act of 1940 (the “Act”), as amended, as an open-end investment company organized as a Delaware business trust on October 3, 1997. The Trust may offer up to two classes of shares: Institutional and Administrative. Each share class has identical voting rights (except that shareholders of a class have exclusive voting rights regarding any matter relating solely to that class of shares). Information presented in these financial statements pertains to the Administrative Class of the Trust. Certain detailed financial information for the Institutional Class is provided separately and is available upon request. The Trust is designed to be used as an investment vehicle by Separate Accounts of insurance companies that fund variable annuity contracts and variable life insurance policies and by qualified pension and retirement plans. The Portfolio commenced operations on April 30, 1998.
2. Significant Accounting Policies
The following is a summary of significant accounting policies consistently followed by the Trust in the preparation of its financial statements in conformity with accounting principles generally accepted in the United States of America. The preparation of financial statements in accordance with accounting principles generally accepted in the United States of America requires management to make estimates and assumptions that affect the reported amounts and disclosures in the financial statements. Actual results could differ from those estimates.
Security Valuation. Portfolio securities and other financial instruments for which market quotations are readily available are stated at market value. Market value is determined at the close of regular trading (normally, 4:00 p.m., Eastern Time) on the New York Stock Exchange on each day the New York Stock Exchange is open, or if no sales are reported, as is the case for most securities traded over-the-counter, the mean between representative bid and asked quotations obtained from a quotation reporting system or from established market makers. Fixed income securities, including those to be purchased under firm commitment agreements, are normally valued on the basis of quotes obtained from brokers and dealers or pricing services. Short-term investments, which mature in 60 days or less are valued at amortized cost, which approximates market value. Certain fixed income securities for which daily market quotations are not readily available may be valued, pursuant to guidelines established by the Board of Trustees, with reference to fixed income securities whose prices are more readily obtainable. Prices may be obtained from independent pricing services which use information provided by market makers or estimates of market values obtained from yield data relating to investments or securities with similar characteristics. The prices used by the Portfolio may differ from the value that would be realized if the securities were sold and the differences could be material to the financial statements.
Securities Transactions and Investment Income. Securities transactions are recorded as of the trade date. Securities purchased or sold on a when-issued or delayed delivery basis may be settled a month or more after the trade date. Realized gains and losses from securities sold are recorded on the identified cost basis. Dividend income is recorded on the ex-dividend date, except certain dividends from foreign securities where the ex-dividend date may have passed, are recorded as soon as the Portfolio is informed of the ex-dividend date. Interest income, adjusted for the accretion of discounts and amortization of premiums, is recorded on the accrual basis. Paydowns gains and losses on mortgage- and asset-backed securities are recorded as adjustments to interest income in the Statement of Operations.
Dividends and Distributions to Shareholders. Dividends from net investment income, if any, are declared on each day the Trust is open for business and are distributed to shareholders monthly. All dividends are reinvested in additional shares of the Portfolio. Net realized capital gains earned by the Portfolio, if any, will be distributed no less frequently than once each year.
Income dividends and capital gain distributions are determined in accordance with income tax regulations which may differ from accounting principles generally accepted in the United States of America. These differences are primarily due to differing treatments for such items as wash sales, foreign currency transactions, net operating losses and capital loss carryforwards.
Distributions classified as a tax basis return of capital, if any, are reflected in the accompanying Statements of Changes in Net Assets and have been reclassified to paid in capital. In addition, other amounts have been reclassified between undistributed net investment income, accumulated undistributed net realized gains or losses and/or paid in capital to more appropriately conform financial accounting to tax characterizations of dividend distributions.
Foreign Currency. The accounting records of the Portfolio are maintained in U.S. dollars. The market values of foreign securities, currency holding and other assets and liabilities are translated into U.S. dollars based on the current exchange rates each business day. Fluctuations in the value of these assets and liabilities resulting from changes in exchange rates are recorded as unrealized foreign currency gains or losses. Realized gains or losses and unrealized appreciation (depreciation) on investment securities and income and expenses are translated on the respective dates of such transactions. The effect of changes in foreign currency exchange rates on investments in securities are not
11
segregated in the Statement of Operations from the effects of changes in market prices of those securities, but are included with the net realized and unrealized gain or loss on investment securities.
Multiclass Operations. Each class offered by the Trust has equal rights as to assets. Income, non-class specific expenses, and realized and unrealized capital gains and losses are allocated to each class of shares based on the relative net assets of each class.
Federal Income Taxes. The Portfolio intends to qualify as a regulated investment company and distribute all of its taxable income and net realized gains, if applicable, to shareholders. Accordingly, no provision for Federal income taxes has been made.
Futures Contracts. The Portfolio is authorized to enter into futures contracts. The Portfolio may use futures contracts to manage its exposure to the securities markets or to movements in interest rates and currency values. The primary risks associated with the use of futures contracts are imperfect correlation between the change in market value of the securities held by the Portfolio and the prices of futures contracts, the possibility of an illiquid market, and the inability of the counterparty to meet the terms of the contract. Futures contracts are valued based upon their quoted daily settlement prices. Upon entering into a futures contract, the Portfolio may be required to deposit with its custodian, in a segregated account in the name of the futures broker, an amount of cash or U.S. Government and Agency Obligations in accordance with the initial margin requirements of the broker or exchange. Futures contracts are marked to market daily and an appropriate payable or receivable for the change in value (“variation margin”) is recorded by the Portfolio. Gains or losses are recognized but not considered realized until the contracts expire or are closed. Futures contracts involve, to varying degrees, risk of loss in excess of the variation margin disclosed in the Statement of Assets and Liabilities.
Options Contracts. The Portfolio may write call and put options on futures, securities or currencies it owns or in which it may invest. Writing put options tends to increase the Portfolio’s exposure to the underlying instrument. Writing call options tends to decrease the Portfolio’s exposure to the underlying instrument. When the Portfolio writes a call or put option, an amount equal to the premium received is recorded as a liability and subsequently marked to market to reflect the current value of the option written. Payment received or made, if any, from writing options with premiums to be determined on a future date are reflected as such on the Statement of Assets and Liabilities. Premiums received from writing options which expire are treated as realized gains. Premiums received from writing options which are exercised or closed are added to the proceeds or offset against amounts paid on the underlying future, security or currency transaction to determine the realized gain or loss. The Portfolio as a writer of an option has no control over whether the underlying future, security or currency may be sold (call) or purchased (put) and as a result bears the market risk of an unfavorable change in the price of the future, security or currency underlying the written option. There is the risk the Portfolio may not be able to enter into a closing transaction because of an illiquid market.
The Portfolio may also purchase put and call options. Purchasing call options tends to increase the Portfolio’s exposure to the underlying instrument. Purchasing put options tends to decrease the Portfolio’s exposure to the underlying instrument. The Portfolio pays a premium which is included in the Portfolio’s Statement of Assets and Liabilities as an investment and subsequently marked to market to reflect the current value of the option. Premiums paid for purchasing options which expire are treated as realized losses. The risk associated with purchasing put and call options is limited to the premium paid. Premiums paid for purchasing options which are exercised or closed are added to the amounts paid or offset against the proceeds on the underlying future, security or currency transaction to determine the realized gain or loss.
Forward Currency Transactions. The Portfolio may enter into forward currency contracts and forward cross-currency contracts in connection with settling planned purchases or sales of securities or to hedge the currency exposure associated with some or all of the Portfolio’s securities. A forward currency contract is an agreement between two parties to buy and sell a currency at a set price on a future date. The market value of a forward currency contract fluctuates with changes in forward currency exchange rates. Forward currency contracts are marked to market daily and the change in value is recorded by the Portfolio as an unrealized gain or loss. Realized gains or losses equal to the difference between the value of the contract at the time it was opened and the value at the time it was closed are recorded upon delivery or receipt of the currency or, if a forward currency contract is offset by entering into another forward currency contract with the same broker, upon settlement of the net gain or loss. These contracts may involve market risk in excess of the unrealized gain or loss reflected in the Portfolio’s Statement of Assets and Liabilities. In addition, the Portfolio could be exposed to risk if the counterparties are unable to meet the terms of the contracts or if the value of the currency changes unfavorably to the U.S. dollar.
Loan Agreements. The Portfolio may invest in direct debt instruments which are interests in amounts owed by a corporate, governmental, or other borrower to lenders or lending syndicates. The Portfolio’s investments in loans may be in the form of participations in loans or assignments
12
of all or a portion of loans from third parties. A loan is often administered by a bank or other financial institution (the “lender”) that acts as agent for all holders. The agent administers the terms of the loan, as specified in the loan agreement. When investing in a loan participation, the Portfolio has the right to receive payments of principal, interest and any fees to which it is entitled only from the lender selling the loan agreement and only upon receipt by the lender of payments from the borrower. The portfolio generally has no right to enforce compliance with the terms of the loan agreement with the borrower. As a result, the Portfolio may be subject to the credit risk of both the borrower and the lender that is selling the loan agreement. When the Portfolio purchases assignments from lenders it acquires direct rights against the borrower on the loan.
Swap Agreements. The Portfolio may invest in swap agreements. A swap is an agreement to exchange the return generated by one instrument for the return generated by another instrument. The Portfolio may enter into interest rate, total return, forward swap spread lock and credit default swap agreements to manage its exposure to interest rates and credit risk. Interest rate swap agreements involve the exchange by the Portfolio with another party of their respective commitments to pay or receive interest, e.g., an exchange of floating rate payments for fixed rate payments with respect to a notional amount of principal. Total return swap agreements involve commitments to pay interest in exchange for a market-linked return, both based on notional amounts. To the extent the total return of the security or index underlying the transaction exceeds or falls short of the offsetting interest rate obligation, the Portfolio will receive a payment from or make a payment to the counterparty. Forward spread lock swap agreements involve commitments to pay or receive a settlement amount calculated as the difference between the swap spread and a fixed spread, multiplied by the notional amount times the duration of the swap. The swap spread is the difference between the benchmark swap rate (market rate) and the specific Treasury rate. In a credit default swap, one party makes a stream of payments to another party in exchange for the right to receive a specified return in the event of a default by a third party, typically corporate issues or sovereign issues of an emerging country, on its obligation. The Portfolio may use credit default swaps to provide a measure of protection against defaults of sovereign issuers (i.e., to reduce risk where the Portfolio owns or has exposure to the sovereign issuer) or to take an active long or short position with respect to the likelihood of a particular issuer’s default. Swaps are marked to market daily based upon quotations from market makers and vendors and the change in value, if any, is recorded as unrealized gain or loss in the Statement of Operations. Payments received or made at the beginning of the measurement period are reflected as such on the Statement of Assets and Liabilities. A liquidation payment received or made at the termination of the swap is recorded as realized gain or loss in the Statement of Operations. Net periodic payments are included as part of miscellaneous income on the Statement of Operations. Entering into these agreements involves, to varying degrees, elements of credit, market and documentation risk in excess of the amounts recognized on the Statement of Assets and Liabilities. Such risks involve the possibility that there will be no liquid market for these agreements, that the counterparty to the agreements may default on its obligation to perform or disagree as to the meaning of contractual terms in the agreements, and that there may be unfavorable changes in interest rates.
Delayed Delivery Transactions. The Portfolio may purchase or sell securities on a when-issued or delayed delivery basis. These transactions involve a commitment by the Portfolio to purchase or sell securities for a predetermined price or yield, with payment and delivery taking place beyond the customary settlement period. When delayed delivery purchases are outstanding, the Portfolio will set aside and maintain until the settlement date in a segregated account, liquid assets in an amount sufficient to meet the purchase price. When purchasing a security on a delayed delivery basis, the Portfolio assumes the rights and risks of ownership of the security, including the risk of price and yield fluctuations, and takes such fluctuations into account when determining its net asset value. The Portfolio may dispose of or renegotiate a delayed delivery transaction after it is entered into, and may sell when-issued securities before they are delivered, which may result in a capital gain or loss. When the Portfolio has sold a security on a delayed delivery basis, the Portfolio does not participate in future gains and losses with respect to the security.
Inflation-Indexed Bonds. Inflation-indexed bonds are fixed income securities whose principal value is periodically adjusted to the rate of inflation. The interest rate on these bonds is generally fixed at issuance at a rate lower than typical bonds. Over the life of an inflation-indexed bond, however, interest will be paid based on a principal value, which is adjusted for inflation. Any increase in the principal amount of an inflation-indexed bond will be included as interest income in the Statement of Operations, even though investors do not receive their principal until maturity.
Repurchase Agreements. The Portfolio may engage in repurchase transactions. Under the terms of a typical repurchase agreement, the Portfolio takes possession of an underlying debt obligation subject to an obligation of the seller to repurchase, and the Portfolio to resell, the obligation at an agreed-upon price and time. The market value of the collateral must be equal at all times to the total amount of the repurchase obligations, including interest. Generally, in the event of counterparty default, the Portfolio has the right to use the collateral to offset losses incurred.
13
Restricted Securities. The Portfolio is permitted to invest in securities that are subject to legal or contractual restrictions on resale. These securities generally may be resold in transactions exempt from registration or to the public if the securities are registered. Disposal of these securities may involve time-consuming negotiations and expenses, and prompt sale at an acceptable price may be difficult.
3. Fees, Expenses, and Related Party Transactions
Investment Advisory Fee. Pacific Investment Management Company LLC (PIMCO) is a majority owned subsidiary partnership of Allianz Dresdner Asset Management of America L.P. (formerly PIMCO Advisors L.P.) and serves as investment adviser (the “Adviser”) to the Trust, pursuant to an investment advisory contract. The Adviser receives a monthly fee at an annual rate based on average daily net assets of the Portfolio. The Advisory Fee is charged at an annual rate of 0.25%.
Administration Fee. PIMCO serves as administrator (the “Administrator”) and provides administrative services to the Trust for which it receives a monthly administrative fee based on average daily net assets of the Portfolio. The Administration Fee is charged at the annual rate of 0.35%.
Servicing Fee. PIMCO Advisors Distributors LLC (“PAD”), is an indirect wholly-owned subsidiary of Allianz Dresdner Asset Management of America L.P. and serves as the distributor of the Trust’s shares. The Trust is permitted to reimburse PAD on a quarterly basis, out of the Administrative Class assets of the Portfolio in the amount of 0.15% on an annual basis of the average daily net assets of that class, for payments made to financial intermediaries that provide services in connection with the distribution of shares or administration of plans or programs that use Portfolio shares as their funding medium. The effective rate paid to PAD during the current fiscal year is 0.15%.
Expenses. The Portfolio is responsible for the following expenses: (i) salaries and other compensation of any of the Trust’s executive officers and employees who are not officers, directors, stockholders or employees of PIMCO or its subsidiaries or affiliates; (ii) taxes and governmental fees; (iii) brokerage fees and commissions and other portfolio transaction expenses; (iv) the cost of borrowing money, including interest expense; (v) fees and expenses of the Trustees who are not “interested persons” of PIMCO or the Trust, and any counsel retained exclusively for their benefit; (vi) extraordinary expenses, including costs of litigation and indemnification expenses; (vii) organization expenses and (viii) any expenses allocated or allocable to a specific class of shares, which include service fees payable with respect to the Administrative Class shares and may include certain other expenses as permitted by the Trust’s Multiple Class Plan adopted pursuant to Rule 18f-3 under the Act and subject to review and approval by the Trustees. The ratio of expenses to average net assets per share class, as disclosed in the Financial Highlights, may differ from the annual Portfolio operating expenses per share class as disclosed in the Prospectus for the reasons set forth above. PIMCO has agreed to waive a portion of its administrative fees to the extent that the payment of the Portfolio’s pro rata share of Trustees’ fees causes the actual expense ratio to rise above the rates disclosed in the current prospectus plus 0.49 basis points as set forth below (calculated as a percentage of the Portfolio’s average daily net assets attributable to each class):
| | | Institutional
Class
| | | Administrative Class
| |
High Yield Portfolio | | 0.60 | % | | 0.75 | % |
PIMCO may be reimbursed for these waived amounts in future periods. The Trust pays no compensation directly to any Trustee or any other officer who is affiliated with the Administrator, all of whom receive renumeration for their services to the Trust from the Administrator or its affiliates.
Each unaffiliated Trustee receives an annual retainer of $4,000, plus $1,500 for each Board of Trustees meeting attended in person and $250 for each meeting attended telephonically, plus reimbursement of related expenses. In addition, each committee chair receives an additional annual retainer of $500. These expenses are allocated on a pro-rata basis to each Portfolio of the Trust according to its respective net assets.
Organization Expenses. Costs incurred in connection with the organization of the Portfolio and its initial registration are amortized on a straight-line basis over a five-year period from the Portfolio’s commencement of operations.
4. Purchases and Sales of Securities
Purchases and sales of securities (excluding short-term investments) for the period ended June 30, 2003 were as follows (amounts in thousands):
| | | U.S. Government/Agency
| | All Other
|
| | | Purchases
| | Sales
| | Purchases
| | Sales
|
High Yield Portfolio | | $ | 27,768 | | $ | 24,013 | | $ | 491,935 | | $ | 219,200 |
5. Transactions in Written Call and Put Options
Transactions in written call and put options were as follows (amounts in thousands):
| | | High Yield Portfolio
| |
| | | Premium
| |
Balance at 12/31/2002 | | $ | 1,794 | |
Sales | | | 682 | |
Closing Buys | | | (244 | ) |
Expirations | | | (218 | ) |
Exercised | | | 0 | |
| | |
|
|
|
Balance at 06/30/2003 | | $ | 2,014 | |
| | |
|
|
|
14
6. Federal Income Tax Matters
At June 30, 2003, the aggregate cost of investments was the same for federal income tax and financial statement purposes. The net unrealized appreciation (depreciation) of investments securities for federal income tax purposes is as follows (amounts in thousands):
| | | Aggregate Gross
Unrealized
Appreciation
| | Aggregate Gross
Unrealized
(Depreciation)
| | | Net Unrealized
Appreciation
|
High Yield Portfolio | | $ | 49,452 | | $ | (9,784 | ) | | $ | 39,668 |
7. Shares of Beneficial Interest
The Trust may issue an unlimited number of shares of beneficial interest with a $.0001 par value. Changes in shares of beneficial interest were as follows (shares and amounts in thousands):
| | | High Yield Portfolio
| |
| | | Six Months Ended
06/30/2003 | | | Year Ended
12/31/2002 | |
| | | Shares
| | | Amount
| | | Shares
| | | Amount
| |
Receipts for shares sold | | | | | | | | | | | | | | |
Institutional Class | | 0 | | | $ | 0 | | | 1 | | | $ | 10 | |
Administrative Class | | 70,246 | | | | 530,792 | | | 58,343 | | | | 418,977 | |
Issued as reinvestment of distributions | | | | | | | | | | | | | | |
Institutional Class | | 0 | | | | 0 | | | 0 | | | | 0 | |
Administrative Class | | 3,017 | | | | 23,020 | | | 3,675 | | | | 26,655 | |
Cost of shares redeemed | | | | | | | | | | | | | | |
Institutional Class | | 0 | | | | 0 | | | 0 | | | | 0 | |
Administrative Class | | (38,268 | ) | | | (286,251 | ) | | (28,512 | ) | | | (207,553 | ) |
| | |
|
| |
|
|
| |
|
| |
|
|
|
Net increase resulting from Portfolio share transactions | | 34,995 | | | $ | 267,561 | | | 33,507 | | | $ | 238,089 | |
| | |
|
| |
|
|
| |
|
| |
|
|
|
The following schedule shows the number of shareholders each owning 5% or more of the Portfolio and the total percentage of the Portfolio held by such shareholders:
| | | Number
| | % of Portfolio
Held
|
High Yield Portfolio | | | | |
Institutional Class | | 1 | | 100 |
Administrative Class | | 5 | | 92 |
15
Trustees and Officers
Brent R. Harris, Chairman and Trustee
R. Wesley Burns, President and Trustee
E. Philip Cannon, Trustee
Vern O. Curtis, Trustee
J. Michael Hagan, Trustee
William J. Popejoy, Trustee
Garlin G. Flynn, Secretary
John P. Hardaway, Treasurer
Investment Adviser and Administrator
Pacific Investment Management Company LLC
840 Newport Center Drive
Newport Beach, California 92660
Transfer Agent
National Financial Data Services
330 W. 9th Street, 4th Floor
Kansas City, Missouri 64105
Custodian
State Street Bank & Trust Company
801 Pennsylvania
Kansas City, Missouri 64105
Counsel
Dechert LLP
1775 I Street, N.W.
Washington, D.C. 20006
Independent Accountants
PricewaterhouseCoopers LLP
1055 Broadway
Kansas City, Missouri 64105
PIMCO VARIABLE INSURANCE TRUST
This report is submitted for the general information of the shareholders of the PIMCO Variable Insurance Trust. It is not authorized for distribution to prospective investors unless accompanied or preceded by an effective prospectus for the PIMCO Variable Insurance Trust, which contains information covering its investment policies as well as other pertinent information.
All Funds distributed by PIMCO ADVISORS DISTRIBUTORS LLC, member NASD
840 NEWPORT CENTER DRIVE
NEWPORT BEACH, CA 92660
800.927.4648
WWW.PIMCOADVISORS.COM
WWW.PIMCO.COM
| P I M C O |
| PIMCO VARIABLE INSURANCE TRUST |
| TOTAL RETURN PORTFOLIO |
| ADMINISTRATIVE CLASS |
|
| SEMI-ANNUAL REPORT |
| June 30, 2003 |
Contents
| | | Fund
Summary
| | Schedule of
Investments
|
Total Return Portfolio (Administrative Class) | | 2 | | 7 |
Chairman’s Letter
Dear PIMCO Variable Insurance Trust Shareholder:
Financial assets gained during the first half of 2003 amid a revival of risk appetites as anxiety about the war in Iraq faded. Assets that generally benefit from economic growth, such as stocks, corporate bonds and emerging market debt, fared the best year-to-date as investors returned to these sectors.in anticipation of a recovery in the second half of 2003. Reflationary forces that investors expected to fuel a rebound included federal tax cuts and a weak dollar, as well as low borrowing rates that eased the burden of high personal and corporate indebtedness. Low mortgage rates kept refinancings booming in the second quarter and put more money in consumers’ pockets.
U.S. Treasuries lagged their riskier counterparts but still enjoyed a modest rally. Yields fell to levels not seen in 45 years early in the second quarter before bouncing off their lows in June as hopes for recovery increased. The yield on the benchmark 10-year Treasury closed the six-month period 0.30% lower to 3.51%, after nearing 3% earlier in the period. Buyers were encouraged that inflation would remain tame amid low capacity utilization and weak employment growth. Asian central banks bought U.S.Treasuries to limit the rise in their currencies versus the dollar in an effort to protect their export industries. In June, the Federal Reserve cut the federal funds rate by 0.25% to 1%, its 13th easing since 2001, in an effort to boost the economy and ward off deflation. Although the cut was less than expected, the Fed suggested that rates would stay low until deflation risks abated.
On the following pages you will find specific details as to the Portfolio’s total return investment performance and a discussion of those factors that affected performance.
We appreciate the trust you have placed in us, and we will continue to focus our efforts to meet your investment needs.
Sincerely,

Brent R. Harris
Chairman
July 31, 2003
1
Total Return Portfolio
TOTAL RETURN INVESTMENT PERFORMANCE For the period ended June 30, 2003
| | | 1 Year | | | 5 Years* | | | Since Inception* | |
Total Return Portfolio Administrative Class | | 10.30 | % | | 7.36 | % | | 7.25 | % |
Lehman Brothers Aggregate Bond Index | | 10.40 | % | | 7.55 | % | | — | |
| * | | Annualized (All Portfolio returns are net of fees and expenses) |
CUMULATIVE RETURNS THROUGH JUNE 30, 2003
$10,000 invested at inception
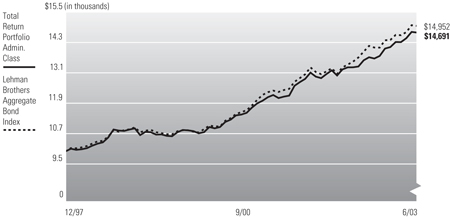
Past performance is no guarantee of future results. Investment return and principal value will fluctuate so that Portfolio shares, when redeemed, may be worth more or less than their original cost. The line graph above assumes the investment of $10,000 on 1/01/1998, the first full month following the Portfolio’s Administrative Class inception on 12/31/1997, compared to the Lehman Brothers Aggregate Bond Index, an unmanaged market index. It is not possible to invest directly in the Index. The Portfolio may invest in foreign securities which involve potentially higher risks including foreign currency fluctuations and political or economic uncertainty. These risks may be enhanced when investing in emerging market securities.
PORTFOLIO INSIGHTS
| • | | The Total Return Portfolio seeks to achieve its investment objective by investing under normal circumstances at least 65% of its total assets in a diversified portfolio of Fixed Income Instruments of varying maturities. |
| • | | The Portfolio’s Administrative Class returned 4.49% for the six-month period ended June 30, 2003, outperforming its benchmark, the Lehman Brothers Aggregate Bond Index, which returned 3.93% for the period. |
| • | | Portfolio duration was near the benchmark throughout the period and had little effect on relative performance. An emphasis on both short and long maturities had a minimal impact on returns as yield curve shape changed little over the period. |
| • | | Near benchmark exposure to mortgages had little impact on relative performance. An overweight of lower coupon mortgages, which are less vulnerable to prepayment risk, helped returns as these issues outperformed. |
| • | | A corporate underweight was negative as corporates outperformed, but positive security selection of telecom and energy pipeline issues mitigated this impact. |
| • | | Eurozone exposure added modestly to returns. While Europe lagged Treasuries overall, short Eurozone maturities outperformed due to expectations of more easing by the European Central Bank. |
| • | | As the emerging market sector’s economic fundamentals continued to improve, sustaining a recovery that began late last year, emerging market bonds added to returns, especially those from Brazil. |
2
Financial Highlights
Total Return Portfolio (Administrative Class)
Selected Per Share Data for the Year or
Period Ended: | | 06/30/2003 +
| | | 12/31/2002
| | | 12/31/2001
| | | 12/31/2000
| | | 12/31/1999
| | | 12/31/1998
| |
Net asset value beginning of period | | $ | 10.23 | | | $ | 9.89 | | | $ | 9.77 | | | $ | 9.45 | | | $ | 10.09 | | | $ | 10.00 | |
Net investment income (a) | | | 0.15 | | | | 0.41 | | | | 0.45 | | | | 0.62 | | | | 0.58 | | | | 0.56 | |
Net realized/unrealized gain (loss) on investments (a) | | | 0.31 | | | | 0.47 | | | | 0.35 | | | | 0.30 | | | | (0.64 | ) | | | 0.28 | |
Total income (loss) from investment operations | | | 0.46 | | | | 0.88 | | | | 0.80 | | | | 0.92 | | | | (0.06 | ) | | | 0.84 | |
Dividends from net investment income | | | (0.17 | ) | | | (0.41 | ) | | | (0.49 | ) | | | (0.60 | ) | | | (0.58 | ) | | | (0.56 | ) |
Distributions from net realized capital gains | | | 0.00 | | | | (0.13 | ) | | | (0.19 | ) | | | 0.00 | | | | 0.00 | | | | (0.19 | ) |
Total distributions | | | (0.17 | ) | | | (0.54 | ) | | | (0.68 | ) | | | (0.60 | ) | | | (0.58 | ) | | | (0.75 | ) |
Net asset value end of period | | $ | 10.52 | | | $ | 10.23 | | | $ | 9.89 | | | $ | 9.77 | | | $ | 9.45 | | | $ | 10.09 | |
Total return | | | 4.49 | % | | | 9.07 | % | | | 8.37 | % | | | 10.15 | % | | | (0.58 | )% | | | 8.61 | % |
Net assets end of period (000s) | | $ | 1,672,858 | | | $ | 1,161,299 | | | $ | 332,823 | | | $ | 55,533 | | | $ | 3,877 | | | $ | 3,259 | |
Ratio of expenses to average net assets | | | 0.65 | %* | | | 0.65 | %(e) | | | 0.65 | %(d) | | | 0.65 | %(c) | | | 0.65 | %(b) | | | 0.65 | % |
Ratio of net investment income to average net assets | | | 2.92 | %* | | | 4.08 | % | | | 4.55 | % | | | 6.46 | % | | | 5.96 | % | | | 5.55 | % |
Portfolio turnover rate | | | 110 | % | | | 222 | % | | | 217 | % | | | 415 | % | | | 102 | % | | | 139 | % |
| (a) | | Per share amounts based on average number of shares outstanding during the period. |
| (b) | | If the investment manager had not reimbursed expenses, the ratio of operating expenses to average net assets would have been 0.69% for the year ended December 31, 1999. |
| (c) | | If the investment manager had not reimbursed expenses, the ratio of operating expenses to average net assets would have been 0.66% for the year ended December 31, 2000. |
| (d) | | If the investment manager had not reimbursed expenses, the ratio of operating expenses to average net assets would have been 0.66% for the year ended December 31, 2001. |
| (e) | | If the investment manager had not reimbursed expenses, the ratio of operating expenses to average net assets would have been 0.66% for the year ended December 31, 2002. |
See accompanying notes
3
Statement of Assets and Liabilities
Total Return Portfolio
June 30, 2003 (Unaudited)
Amounts in thousands, except per share amounts
Assets: | | | |
Investments, at value | | $ | 2,005,748 |
Foreign currency, at value | | | 4,609 |
Receivable for investments sold | | | 231,505 |
Unrealized appreciation on forward foreign currency contracts | | | 82 |
Interest receivable | | | 8,906 |
Variation margin receivable | | | 743 |
Swap premiums paid | | | 167 |
Unrealized appreciation on swap agreements | | | 244 |
Other assets | | | 1 |
| | |
|
|
| | | | 2,252,005 |
| | |
|
|
Liabilities: | | | |
Payable for investments purchased | | $ | 498,864 |
Unrealized depreciation on forward foreign currency contracts | | | 51 |
Due to Custodian | | | 42 |
Written options outstanding | | | 4,397 |
Dividends payable | | | 614 |
Accrued investment advisory fee | | | 340 |
Accrued administration fee | | | 340 |
Accrued servicing fee | | | 182 |
Swap premiums received | | | 56 |
Unrealized depreciation on swap agreements | | | 53 |
| | |
|
|
| | | | 504,939 |
| | |
|
|
Net Assets | | $ | 1,747,066 |
| | |
|
|
Net Assets Consist of: | | | |
Paid in capital | | $ | 1,681,047 |
Undistributed net investment income | | | 3,283 |
Accumulated undistributed net realized gain | | | 31,174 |
Net unrealized appreciation | | | 31,562 |
| | |
|
|
| | | $ | 1,747,066 |
| | |
|
|
Net Assets: | | | |
Institutional Class | | $ | 74,208 |
Administrative Class | | | 1,672,858 |
Shares Issued and Outstanding: | | | |
Institutional Class | | | 7,050 |
Administrative Class | | | 158,932 |
Net Asset Value and Redemption Price Per Share (Net Assets Per Share Outstanding) | | | |
Institutional Class | | $ | 10.52 |
Administrative Class | | | 10.52 |
Cost of Investments Owned | | $ | 1,972,249 |
Cost of Foreign Currency Held | | $ | 4,597 |
See accompanying notes
4
Statement of Operations
Total Return Portfolio
For the six months ended June 30, 2003 (Unaudited)
Amounts in thousands
Investment Income: | | | | |
Interest | | $ | 26,140 | |
Miscellaneous income | | | 15 | |
| | |
|
|
|
Total Income | | | 26,155 | |
| | |
|
|
|
Expenses: | | | | |
Investment advisory fees | | | 1,820 | |
Administration fees | | | 1,820 | |
Servicing fees | | | 1,045 | |
Trustees’ fees | | | 9 | |
Organization costs | | | 1 | |
| | |
|
|
|
Total Expenses | | | 4,695 | |
| | |
|
|
|
Net Investment Income | | | 21,460 | |
| | |
|
|
|
Net Realized and Unrealized Gain (Loss): | | | | |
Net realized gain on investments | | | 11,362 | |
Net realized gain on futures contracts, written options, and swaps | | | 18,255 | |
Net realized gain on foreign currency transactions | | | 1,401 | |
Net change in unrealized appreciation on investments | | | 18,437 | |
Net change in unrealized (depreciation) on futures contracts, written options, and swaps | | | (5,135 | ) |
Net change in unrealized (depreciation) on translation of assets and liabilities denominated in foreign currencies | | | (445 | ) |
Net Gain | | | 43,875 | |
| | |
|
|
|
Net Increase in Assets Resulting from Operations | | $ | 65,335 | |
| | |
|
|
|
See accompanying notes
5
Statements of Changes in Net Assets
Total Return Portfolio
Amounts in thousands
| Increase (Decrease) in Net Assets from: | | Six Months Ended June 30, 2003
| | | Year Ended December 31, 2002
| |
| | | (Unaudited) | | | | |
Operations: | | | | | | | | |
Net investment income | | $ | 21,460 | | | $ | 29,591 | |
Net realized gain | | | 31,018 | | | | 21,933 | |
Net change in unrealized appreciation | | | 12,857 | | | | 17,135 | |
| | |
|
|
| |
|
|
|
Net increase resulting from operations | | | 65,335 | | | | 68,659 | |
| | |
|
|
| |
|
|
|
Distributions to Shareholders: | | | | | | | | |
From net investment income | | | | | | | | |
Institutional Class | | | (1,066 | ) | | | (1,571 | ) |
Administrative Class | | | (22,551 | ) | | | (28,021 | ) |
From net realized capital gains | | | | | | | | |
Institutional Class | | | 0 | | | | (558 | ) |
Administrative Class | | | 0 | | | | (13,143 | ) |
| | |
|
|
| |
|
|
|
Total Distributions | | | (23,617 | ) | | | (43,293 | ) |
| | |
|
|
| |
|
|
|
Portfolio Share Transactions: | | | | | | | | |
Receipts for shares sold | | | | | | | | |
Institutional Class | | | 56,936 | | | | 18,993 | |
Administrative Class | | | 538,861 | | | | 946,200 | |
Issued as reinvestment of distributions | | | | | | | | |
Institutional Class | | | 1,066 | | | | 2,129 | |
Administrative Class | | | 18,310 | | | | 37,015 | |
Cost of shares redeemed | | | | | | | | |
Institutional Class | | | (32,059 | ) | | | (11,077 | ) |
Administrative Class | | | (85,613 | ) | | | (178,833 | ) |
| | |
|
|
| |
|
|
|
Net increase resulting from Portfolio share transactions | | | 497,501 | | | | 814,427 | |
| | |
|
|
| |
|
|
|
Total Increase in Net Assets | | | 539,219 | | | | 839,793 | |
| | |
|
|
| |
|
|
|
Net Assets: | | | | | | | | |
Beginning of period | | | 1,207,847 | | | | 368,054 | |
End of period* | | $ | 1,747,066 | | | $ | 1,207,847 | |
*Including undistributed net investment income of: | | $ | 3,283 | | | $ | 5,440 | |
See accompanying notes
6
Schedule of Investments
Total Return Portfolio
June 30, 2003 (Unaudited)
| | | Principal Amount (000s)
| | Value (000s)
|
CORPORATE BONDS & NOTES 11.3% | | | | | | |
Banking & Finance 3.7% | | | | | | |
Atlas Reinsurance PLC | | | | | | |
4.877% due 01/07/2005 (a) | | $ | 1,000 | | $ | 1,009 |
Banco Nacional de Comercio Exterior | | | | | | |
7.250% due 02/02/2004 | | | 700 | | | 725 |
Bear Stearns Cos., Inc. | | | | | | |
1.630% due 12/01/2003 (a) | | | 2,000 | | | 2,003 |
CIT Group, Inc. | | | | | | |
2.618% due 07/30/2004 (a) | | | 2,220 | | | 2,243 |
Credit Suisse First Boston USA, Inc. | | | | | | |
4.625% due 01/15/2008 | | | 1,300 | | | 1,390 |
Deutsche Telekom International Finance BV | | | | | | |
8.500% due 06/15/2010 | | | 6,300 | | | 7,751 |
8.750% due 06/15/2030 | | | 7,300 | | | 9,334 |
EOP Operating L.P. | | | | | | |
5.875% due 01/15/2013 | | | 6,100 | | | 6,589 |
Gemstone Investors Ltd. | | | | | | |
7.710% due 10/31/2004 | | | 700 | | | 700 |
General Motors Acceptance Corp. | | | | | | |
1.604% due 07/21/2003 (a) | | | 500 | | | 500 |
1.630% due 08/04/2003 (a) | | | 1,900 | | | 1,900 |
1.390% due 08/18/2003 (a) | | | 1,600 | | | 1,599 |
2.250% due 03/22/2004 (a) | | | 1,500 | | | 1,497 |
2.100% due 05/04/2004 (a) | | | 2,500 | | | 2,490 |
1.981% due 05/10/2004 (a) | | | 500 | | | 497 |
1.990% due 05/17/2004 (a) | | | 700 | | | 696 |
1.759% due 07/20/2004 (a) | | | 500 | | | 495 |
1.679% due 07/21/2004 (a) | | | 200 | | | 198 |
1.698% due 07/30/2004 (a) | | | 600 | | | 594 |
8.000% due 11/01/2031 | | | 5,300 | | | 5,215 |
Pemex Finance Ltd. | | | | | | |
5.720% due 11/15/2003 | | | 25 | | | 25 |
Phoenix Quake Ltd. | | | | | | |
3.515% due 07/03/2008 | | | 1,600 | | | 1,598 |
4.565% due 07/03/2008 | | | 400 | | | 400 |
PNC Funding Corp. | | | | | | |
6.125% due 09/01/2003 | | | 100 | | | 101 |
Popular North America, Inc. | | | | | | |
6.625% due 01/15/2004 | | | 500 | | | 514 |
Premium Asset Trust | | | | | | |
1.605% due 11/27/2004 (a) | | | 100 | | | 100 |
1.692% due 09/08/2007 (a) | | | 100 | | | 100 |
Qwest Capital Funding, Inc. | | | | | | |
7.250% due 02/15/2011 | | | 657 | | | 542 |
Residential Reinsurance Ltd. | | | | | | |
6.415% due 06/01/2004 (a) | | | 100 | | | 100 |
6.230% due 06/08/2006 (a) | | | 8,100 | | | 8,110 |
Studio Re Ltd. | | | | | | |
6.378% due 07/07/2006 (a) | | | 1,300 | | | 1,303 |
Verizon Global Funding Corp. | | | | | | |
6.125% due 06/15/2007 | | | 3,700 | | | 4,170 |
| | | | | |
|
|
| | | | | | | 64,488 |
| | | | | |
|
|
Industrials 2.6% | | | | | | |
Amerada Hess Corp. | | | | | | |
6.650% due 08/15/2011 | | | 2,000 | | | 2,311 |
AOL Time Warner, Inc. | | | | | | |
7.625% due 04/15/2031 | | | 8,600 | | | 9,963 |
7.700% due 05/01/2032 | | | 3,300 | | | 3,867 |
Continental Airlines, Inc. | | | | | | |
7.256% due 03/15/2020 | | | 414 | | | 410 |
DaimlerChrysler North America Holding Corp. | | | | | | |
1.508% due 08/21/2003 (a) | | | 2,300 | | | 2,300 |
General Motors Corp. | | | | | | |
7.125% due 07/15/2013 | | | 1,600 | | | 1,610 |
Hutchison Whampoa International Ltd. | | | | | | |
6.500% due 02/13/2013 | | | 500 | | | 526 |
ITT Corp. | | | | | | |
6.750% due 11/15/2005 | | | 250 | | | 262 |
Kerr-McGee Corp. | | | | | | |
2.040% due 06/28/2004 (a) | | | 150 | | | 149 |
Northwest Airlines, Inc. | | | | | | |
6.841% due 10/01/2012 | | | 3,300 | | | 3,273 |
Pemex Project Funding Master Trust | | | | | | |
8.000% due 11/15/2011 | | | 100 | | | 115 |
8.625% due 02/01/2022 | | | 1,800 | | | 2,061 |
Singapore Telecommunications Ltd. | | | | | | |
7.375% due 12/01/2031 | | | 1,700 | | | 2,084 |
Tyco International Group S.A. | | | | | | |
6.750% due 02/15/2011 | | | 157 | | | 167 |
United Airlines, Inc. | | | | | | |
1.558% due 03/02/2004 (a) | | | 1,365 | | | 1,031 |
8.030% due 07/01/2011 | | | 465 | | | 117 |
6.071% due 03/01/2013 | | | 6,920 | | | 5,806 |
Waste Management, Inc. | | | | | | |
6.375% due 11/15/2012 | | | 2,600 | | | 2,962 |
Weyerhaeuser Co. | | | | | | |
7.950% due 03/15/2025 | | | 900 | | | 1,056 |
Williams Cos., Inc. | | | | | | |
7.875% due 09/01/2021 | | | 5,500 | | | 5,390 |
| | | | | |
|
|
| | | | | | | 45,460 |
| | | | | |
|
|
Utilities 5.0% | | | | | | |
AEP Texas Central Co. | | | | | | |
2.590% due 02/15/2005 (a) | | | 900 | | | 901 |
ALLETE, Inc. | | | | | | |
2.179% due 10/20/2003 (a) | | | 100 | | | 100 |
AT&T Wireless Services, Inc. | | | | | | |
7.875% due 03/01/2011 | | | 100 | | | 118 |
British Telecom PLC | | | | | | |
2.553% due 12/15/2003 (a) | | | 1,900 | | | 1,906 |
8.125% due 12/15/2010 | | | 100 | | | 127 |
DTE Energy Co. | | | | | | |
7.110% due 11/15/2038 (a) | | | 500 | | | 506 |
El Paso Corp. | | | | | | |
6.750% due 05/15/2009 | | | 6,000 | | | 5,520 |
7.875% due 06/15/2012 | | | 8,600 | | | 8,009 |
7.800% due 08/01/2031 | | | 1,500 | | | 1,271 |
7.750% due 01/15/2032 | | | 300 | | | 254 |
Entergy Gulf States, Inc. | | | | | | |
8.250% due 04/01/2004 | | | 5,500 | | | 5,763 |
2.638% due 09/01/2004 (a) | | | 3,400 | | | 3,398 |
6.000% due 12/01/2012 | | | 6,500 | | | 6,806 |
France Telecom S.A. | | | | | | |
1.906% due 07/16/2003 (a) | | | 200 | | | 200 |
9.250% due 03/01/2011 | | | 7,600 | | | 9,582 |
10.000% due 03/01/2031 | | | 900 | | | 1,250 |
Oncor Electric Delivery Co. | | | | | | |
6.375% due 01/15/2015 | | | 5,500 | | | 6,252 |
Pacific Gas & Electric Co. | | | | | | |
7.958% due 10/31/2049 (a) | | | 400 | | | 406 |
PSEG Power LLC | | | | | | |
7.750% due 04/15/2011 | | | 5,700 | | | 6,814 |
Sprint Capital Corp. | | | | | | |
6.000% due 01/15/2007 | | | 100 | | | 108 |
6.125% due 11/15/2008 | | | 900 | | | 978 |
7.625% due 01/30/2011 | | | 5,200 | | | 5,946 |
8.375% due 03/15/2012 | | | 3,200 | | | 3,839 |
8.750% due 03/15/2032 | | | 14,000 | | | 16,818 |
Telekomunikacja Polska S.A. | | | | | | |
7.125% due 12/10/2003 | | | 100 | | | 101 |
Verizon Florida, Inc. | | | | | | |
6.125% due 01/15/2013 | | | 700 | | | 794 |
Vodafone Group PLC | | | | | | |
6.250% due 11/30/2032 | | | 300 | | | 326 |
| | | | | |
|
|
| | | | | | | 88,093 |
| | | | | |
|
|
Total Corporate Bonds & Notes
(Cost $182,842) | | | | | | 198,041 |
| | | | | |
|
|
MUNICIPAL BONDS & NOTES 3.9% | | | | | | |
California 0.6% | | | | | | |
California State Revenue Bonds, Series 2003 | | | | | | |
2.000% due 06/16/2004 | | | 3,600 | | | 3,630 |
Los Angeles, California Unified School District General Obligation Bonds,
(MBIA Insured), Series 2003 | | | | | | |
5.000% due 01/01/2028 | | | 7,300 | | | 7,651 |
| | | | | |
|
|
| | | | | | | 11,281 |
| | | | | |
|
|
Illinois 1.1% | | | | | | |
Illinois State General Obligation Bonds, Series 2003 | | | | | | |
5.100% due 06/01/2033 | | | 20,000 | | | 19,667 |
| | | | | |
|
|
Massachusetts 0.1% | | | | | | |
Massachusetts State Water Reserve Authority Revenue Bonds,
(FSA Insured), Series 2002 | | | | | | |
5.000% due 08/01/2032 | | | 1,000 | | | 1,045 |
| | | | | |
|
|
New Jersey 0.6% | | | | | | |
Tobacco Settlement Financing Corp., Series 2003 | | | | | | |
4.375% due 06/01/2019 | | | 4,870 | | | 4,605 |
6.000% due 06/01/2037 | | | 1,530 | | | 1,254 |
6.750% due 06/01/2039 | | | 5,450 | | | 4,943 |
| | | | | |
|
|
| | | | | | | 10,802 |
| | | | | |
|
|
New York 0.8% | | | | | | |
New York City, New York Municipal Water Finance Authority Revenue Bonds,
(FGIC Insured), Series 2003-E | | | | | | |
5.000% due 06/15/2034 | | | 1,400 | | | 1,459 |
New York City, New York Municipal Water Finance Authority Revenue Bonds,
(FSA-CR Insured), Series 2002 | | | | | | |
5.125% due 06/15/2034 | | | 10,460 | | | 11,040 |
New York State Environmental Facilities Corporate Revenue Bonds, Series 2002 | | | | | | |
8.760% due 06/15/2023 (a) | | | 850 | | | 975 |
| | | | | |
|
|
| | | | | | | 13,474 |
| | | | | |
|
|
North Carolina 0.2% | | | | | | |
Durham County, North Carolina General Obligation Revenue Bonds, Series 2002 | | | | | | |
8.750% due 04/01/2021 (a) | | | 2,733 | | | 3,113 |
| | | | | |
|
|
Texas 0.1% | | | | | | |
University of Texas Revenue Bonds, Series 2003 | | | | | | |
5.000% due 08/15/2033 | | | 1,200 | | | 1,246 |
| | | | | |
|
|
Washington 0.1% | | | | | | |
Energy Northwest Washington Electric Revenue Bonds, Series 2003 | | | | | | |
5.500% due 07/01/2013 | | | 1,700 | | | 1,968 |
5.500% due 07/01/2014 | | | 1,300 | | | 1,510 |
| | | | | |
|
|
| | | | | | | 3,478 |
| | | | | |
|
|
Wisconsin 0.2% | | | | | | |
Badger Asset Securitization Corporate Revenue Bonds, Series 2002 | | | | | | |
6.000% due 06/01/2017 | | | 3,700 | | | 3,526 |
| | | | | |
|
|
Total Municipal Bonds & Notes
(Cost $67,458) | | | | | | 67,632 |
| | | | | |
|
|
U.S. GOVERNMENT AGENCIES 1.3% | | | | | | |
Small Business Administration | | | | | | |
8.017% due 02/10/2010 | | | 633 | | | 725 |
7.449% due 08/01/2010 | | | 77 | | | 86 |
6.344% due 08/01/2011 | | | 2,270 | | | 2,460 |
6.030% due 02/10/2012 | | | 14,626 | | | 15,766 |
7.500% due 04/01/2017 | | | 3,023 | | | 3,441 |
6.290% due 01/01/2021 | | | 356 | | | 398 |
| | | | | |
|
|
Total U.S. Government Agencies
(Cost $21,069) | | | | | | 22,876 |
| | | | | |
|
|
U.S. TREASURY OBLIGATIONS 11.5% | | | | | | |
Treasury Inflation Protected Securities (f) | | | | | | |
3.375% due 01/15/2007 (b) | | | 4,061 | | | 4,461 |
3.625% due 01/15/2008 | | | 16,499 | | | 18,515 |
3.875% due 01/15/2009 | | | 16,141 | | | 18,491 |
4.250% due 01/15/2010 | | | 2,185 | | | 2,572 |
3.500% due 01/15/2011 | | | 6,548 | | | 7,440 |
See accompanying notes
7
| | | Principal
Amount
(000s)
| | Value
(000s)
|
3.375% due 01/15/2012 | | $ | 2,071 | | $ | 2,343 |
3.000% due 07/15/2012 | | | 818 | | | 902 |
3.875% due 04/15/2029 | | | 31,757 | | | 40,525 |
U.S. Treasury Bonds | | | | | | |
7.250% due 05/15/2016 | | | 33,700 | | | 44,829 |
7.500% due 11/15/2016 | | | 22,400 | | | 30,414 |
8.750% due 05/15/2017 | | | 10,000 | | | 14,971 |
8.875% due 08/15/2017 | | | 6,900 | | | 10,441 |
U.S. Treasury Strips | | | | | | |
0.000% due 11/15/2016 | | | 1,900 | | | 1,056 |
0.000% due 05/15/2017 | | | 6,300 | | | 3,403 |
| | | | | |
|
|
Total U.S. Treasury Obligations
(Cost $194,366) | | | | | | 200,363 |
| | | | | |
|
|
MORTGAGE-BACKED SECURITIES 38.3% | | | | | | |
Collateralized Mortgage Obligations 8.3% | | | | | | |
Aurora Loan Services | | | | | | |
2.020% due 05/25/2030 (a) | | | 205 | | | 205 |
Bank of America Mortgage Securities, Inc. | | | | | | |
6.250% due 03/25/2032 | | | 1,124 | | | 1,128 |
5.772% due 10/20/2032 (a) | | | 2,600 | | | 2,686 |
Bear Stearns Adjustable Rate Mortgage Trust | | | | | | |
6.750% due 03/25/2028 | | | 934 | | | 939 |
4.405% due 11/25/2030 (a) | | | 37 | | | 38 |
6.477% due 10/25/2031 (a) | | | 260 | | | 261 |
6.592% due 11/25/2031 (a) | | | 408 | | | 413 |
6.191% due 01/25/2032 (a) | | | 503 | | | 506 |
6.050% due 02/25/2032 (a) | | | 126 | | | 127 |
6.090% due 02/25/2032 (a) | | | 237 | | | 239 |
6.159% due 08/25/2032 (a) | | | 393 | | | 402 |
5.395% due 10/25/2032 (a) | | | 675 | | | 688 |
5.376% due 01/25/2033 (a) | | | 5,045 | | | 5,147 |
5.673% due 01/25/2033 (a) | | | 1,832 | | | 1,865 |
5.234% due 03/25/2033 (a) | | | 8,184 | | | 8,362 |
Cendant Mortgage Corp. | | | | | | |
1.970% due 08/25/2030 (a) | | | 270 | | | 270 |
Chase Mortgage Finance Corp. | | | | | | |
6.200% due 12/25/2029 (a) | | | 590 | | | 600 |
Countrywide Home Loans, Inc. | | | | | | |
6.500% due 08/25/2032 (a) | | | 231 | | | 231 |
Credit-Based Asset Servicing & Securitization LLC | | | | | | |
1.730% due 09/25/2029 (a) | | | 204 | | | 204 |
CS First Boston Mortgage Securities Corp. | | | | | | |
6.750% due 12/27/2028 | | | 100 | | | 104 |
1.670% due 08/25/2031 (a) | | | 319 | | | 320 |
6.249% due 04/25/2032 (a) | | | 494 | | | 505 |
6.182% due 06/25/2032 (a) | | | 6,750 | | | 6,952 |
5.767% due 10/25/2032 (a)(i) | | | 2,969 | | | 2,978 |
Fannie Mae | | | | | | |
7.000% due 04/25/2023 | | | 12,128 | | | 12,767 |
6.000% due 02/25/2029 | | | 1,363 | | | 1,372 |
5.000% due 04/25/2033 | | | 20,505 | | | 20,953 |
Federal Home Loan Bank | | | | | | |
5.500% due 03/15/2015 | | | 886 | | | 902 |
First Horizon Asset Securities, Inc. | | | | | | |
6.750% due 11/25/2031 | | | 111 | | | 113 |
6.500% due 11/25/2032 | | | 1,969 | | | 1,981 |
First Nationwide Trust | | | | | | |
6.750% due 08/21/2031 | | | 633 | | | 650 |
Freddie Mac | | | | | | |
5.000% due 09/15/2016 | | | 1,680 | | | 1,735 |
7.500% due 11/15/2016 | | | 50 | | | 50 |
6.250% due 08/25/2022 | | | 5,186 | | | 5,317 |
7.000% due 06/15/2023 | | | 9,286 | | | 9,679 |
8.500% due 08/01/2024 | | | 71 | | | 77 |
6.500% due 04/15/2029 | | | 648 | | | 700 |
7.500% due 07/15/2030 | | | 300 | | | 314 |
1.810% due 09/15/2030 (a) | | | 207 | | | 208 |
1.760% due 11/15/2030 (a) | | | 345 | | | 344 |
GMAC Commercial Mortgage Securities, Inc. | | | | | | |
2.459% due 09/11/2006 (a) | | | 1,000 | | | 976 |
Government National Mortgage Association | | | | | | |
7.500% due 11/20/2029 | | | 520 | | | 567 |
1.718% due 06/20/2030 (a) | | | 26 | | | 26 |
1.818% due 09/20/2030 (a) | | | 222 | | | 223 |
GSR Mortgage Loan Trust | | | | | | |
5.626% due 04/25/2032 (a) | | | 5,474 | | | 5,530 |
2.882% due 10/25/2032 (a) | | | 373 | | | 374 |
G-Wing Ltd. | | | | | | |
3.950% due 05/06/2004 (a) | | | 1,730 | | | 1,697 |
Indymac Adjustable Rate Mortgage Trust | | | | | | |
6.506% due 01/25/2032 (a) | | | 157 | | | 162 |
PNC Mortgage Securities Corp. | | | | | | |
7.500% due 02/25/2031 | | | 34 | | | 34 |
Resecuritization Mortgage Trust | | | | | | |
6.500% due 04/19/2029 | | | 166 | | | 168 |
Residential Asset Securitization Trust | | | | | | |
7.130% due 07/25/2031 | | | 3,400 | | | 3,529 |
Residential Funding Mortgage Securities I, Inc. | | | | | | |
6.500% due 12/25/2023 | | | 4,632 | | | 4,716 |
6.500% due 03/25/2032 | | | 12,120 | | | 12,257 |
5.649% due 09/25/2032 (a) | | | 1,164 | | | 1,178 |
6.250% due 09/25/2032 | | | 820 | | | 827 |
Structured Asset Mortgage Investments, Inc. | | | | | | |
1.647% due 09/19/2032 (a) | | | 1,317 | | | 1,312 |
Structured Asset Securities Corp. | | | | | | |
7.000% due 02/25/2016 | | | 76 | | | 77 |
1.770% due 06/25/2017 (a) | | | 4,491 | | | 4,497 |
1.770% due 05/25/2031 (a) | | | 117 | | | 117 |
5.800% due 09/25/2031 | | | 187 | | | 189 |
6.500% due 10/25/2031 (a) | | | 253 | | | 263 |
6.170% due 02/25/2032 (a) | | | 348 | | | 356 |
6.150% due 07/25/2032 (a) | | | 765 | | | 784 |
1.610% due 01/25/2033 (a) | | | 1,086 | | | 1,085 |
5.600% due 01/25/2033 | | | 383 | | | 383 |
Superannuation Members Home Loans Global Fund | | | | | | |
1.513% due 06/15/2026 (a) | | | 392 | | | 393 |
Torrens Trust | | | | | | |
1.570% due 07/15/2031 (a) | | | 1,283 | | | 1,284 |
Washington Mutual Mortgage Securities Corp. | | | | | | |
5.224% due 10/25/2032 (a) | | | 3,954 | | | 4,018 |
6.396% due 10/19/2039 | | | 2,547 | | | 2,557 |
4.054% due 01/25/2041 (a) | | | 51 | | | 52 |
Wells Fargo Mortgage-Backed Securities Trust | | | | | | |
6.542% due 10/25/2031 (a) | | | 280 | | | 281 |
5.176% due 09/25/2032 (a) | | | 765 | | | 772 |
5.250% due 01/25/2033 | | | 2,094 | | | 2,114 |
| | | | | |
|
|
| | | | | | | 145,130 |
| | | | | |
|
|
Fannie Mae 23.0% | | | | | | |
3.258% due 09/01/2040 (a) | | | 353 | | | 360 |
4.265% due 11/01/2025 (a) | | | 7 | | | 7 |
4.359% due 10/01/2032 (a) | | | 3,952 | | | 4,047 |
4.417% due 11/01/2035 (a) | | | 784 | | | 803 |
5.000% due 07/17/2018 | | | 25,000 | | | 25,828 |
5.500% due 04/01/2014-01/01/2018 (c) | | | 146,439 | | | 152,159 |
6.000% due 04/01/2013-08/13/2033 (c) | | | 206,582 | | | 214,969 |
6.500% due 06/01/2029-07/01/2032 (c) | | | 1,752 | | | 1,829 |
6.569% due 09/01/2039 (a) | | | 815 | | | 844 |
| | | | | |
|
|
| | | | | | | 400,846 |
| | | | | |
|
|
Federal Housing Administration 0.0% | | | | | | |
7.430% due 01/25/2023 | | | 530 | | | 543 |
| | | | | |
|
|
Freddie Mac 6.1% | | | | | | |
4.366% due 01/01/2028 (a) | | | 10 | | | 11 |
4.584% due 07/01/2027 (a) | | | 11 | | | 11 |
5.000% due 08/18/2018 | | | 7,000 | | | 7,212 |
5.500% due 08/13/2033 | | | 51,000 | | | 52,482 |
6.000% due 07/01/2016-08/13/2033 (c) | | | 40,169 | | | 41,654 |
6.500% due 08/01/2032 | | | 5,195 | | | 5,408 |
7.850% due 07/01/2030 (a) | | | 15 | | | 15 |
| | | | | |
|
|
| | | | | | | 106,793 |
| | | | | |
|
|
Government National Mortgage Association 0.9% | | | | | | |
4.500% due 05/20/2030-02/20/2032 (a)(c) | | | 4,752 | | | 4,848 |
5.000% due 10/20/2029-07/20/2030 (a)(c) | | | 1,659 | | | 1,724 |
5.375% due 04/20/2026-02/20/2027 (a)(c) | | | 454 | | | 471 |
5.500% due 07/22/2033 | | | 3,000 | | | 3,124 |
6.500% due 02/15/2029-10/15/2032 (c) | | | 5,464 | | | 5,740 |
7.000% due 11/15/2026 (c) | | | 424 | | | 449 |
7.500% due 07/15/2029 | | | 23 | | | 25 |
| | | | | |
|
|
| | | | | | | 16,381 |
| | | | | |
|
|
Total Mortgage-Backed Securities
(Cost $665,350) | | | | | | 669,693 |
| | | | | |
|
|
ASSET-BACKED SECURITIES 1.3% | | | | | | |
Ace Securities Corp. | | | | | | |
1.660% due 06/25/2032 (a) | | | 942 | | | 943 |
Ameriquest Mortgage Securities, Inc. | | | | | | |
1.630% due 06/15/2030 (a) | | | 9 | | | 9 |
1.610% due 07/15/2030 (a) | | | 30 | | | 30 |
Amortizing Residential Collateral Trust | | | | | | |
1.590% due 06/25/2032 (a) | | | 4,692 | | | 4,687 |
Bayview Financial Acquisition Trust | | | | | | |
1.710% due 07/25/2030 (a) | | | 37 | | | 37 |
1.720% due 04/25/2031 (a) | | | 145 | | | 145 |
1.600% due 07/25/2031 (a) | | | 93 | | | 93 |
CDC Mortgage Capital Trust | | | | | | |
1.610% due 01/25/2033 (a) | | | 5,492 | | | 5,494 |
Conseco Finance Corp. | | | | | | |
3.220% due 09/01/2023 | | | 887 | | | 888 |
1.680% due 10/15/2031 (a) | | | 247 | | | 247 |
CS First Boston Mortgage Securities Corp. | | | | | | |
1.570% due 12/15/2030 (a) | | | 136 | | | 137 |
EMC Mortgage Loan Trust | | | | | | |
1.690% due 05/25/2040 (a) | | | 2,950 | | | 2,955 |
GRMT II Mortgage Loan Trust | | | | | | |
1.568% due 06/20/2032 (a) | | | 100 | | | 100 |
Household Mortgage Loan Trust | | | | | | |
1.618% due 05/20/2032 (a) | | | 943 | | | 945 |
Irwin Home Equity Loan Trust | | | | | | |
1.695% due 06/25/2021 (a) | | | 13 | | | 13 |
1.610% due 06/25/2029 (a) | | | 880 | | | 880 |
Morgan Stanley Dean Witter Capital I | | | | | | |
1.650% due 07/25/2032 (a) | | | 2,089 | | | 2,090 |
Salomon Brothers Mortgage Securities VII, Inc. | | | | | | |
1.720% due 09/25/2029 (a) | | | 51 | | | 51 |
Vanderbilt Acquisition Loan Trust | | | | | | |
3.280% due 01/07/2013 | | | 2,838 | | | 2,868 |
| | | | | |
|
|
Total Asset-Backed Securities
(Cost $22,575) | | | | | | 22,612 |
| | | | | |
|
|
SOVEREIGN ISSUES 3.5% | | | | | | |
Province of Quebec | | | | | | |
7.500% due 09/15/2029 | | | 75 | | | 100 |
Republic of Brazil | | | | | | |
2.125% due 04/15/2006 (a) | | | 2,304 | | | 2,166 |
11.500% due 03/12/2008 | | | 2,300 | | | 2,415 |
2.187% due 04/15/2009 (a) | | | 685 | | | 575 |
11.000% due 01/11/2012 | | | 2,840 | | | 2,833 |
8.000% due 04/15/2014 | | | 7,376 | | | 6,482 |
11.000% due 08/17/2040 | | | 2,400 | | | 2,172 |
Republic of Panama | | | | | | |
9.625% due 02/08/2011 | | | 800 | | | 930 |
9.375% due 01/16/2023 | | | 330 | | | 369 |
8.875% due 09/30/2027 | | | 5,200 | | | 5,681 |
Republic of Peru | | | | | | |
9.125% due 02/21/2012 | | | 1,400 | | | 1,496 |
9.875% due 02/06/2015 | | | 5,100 | | | 5,610 |
Republic of South Africa | | | | | | |
9.125% due 05/19/2009 | | | 500 | | | 621 |
See accompanying notes
8
| | | Principal Amount (000s)
| | Value (000s)
| |
United Mexican States | | | | | | | |
9.875% due 02/01/2010 | | $ | 100 | | $ | 128 | |
8.375% due 01/14/2011 | | | 300 | | | 360 | |
6.375% due 01/16/2013 | | | 930 | | | 988 | |
11.375% due 09/15/2016 | | | 5,100 | | | 7,408 | |
8.300% due 08/15/2031 | | | 17,700 | | | 20,426 | |
| | | | | |
|
|
|
Total Sovereign Issues (Cost $54,903) | | | | | | 60,760 | |
| | | | | |
|
|
|
PURCHASED PUT OPTIONS 0.0% | | | | | | | |
7 Year Interest Rate Swap (OTC) | | | | | | | |
Strike @ 0.760% Exp. 05/31/2005 | | | 400,000 | | | 71 | |
| | | | | |
|
|
|
Total Purchased Put Options (Cost $23) | | | | | | 71 | |
| | | | | |
|
|
|
SHORT-TERM INSTRUMENTS 43.7% | | | | | | | |
Commercial Paper 42.2% | | | | | | | |
ABN AMRO North America Finance | | | | | | | |
1.200% due 07/07/2003 | | | 2,500 | | | 2,499 | |
1.040% due 07/16/2003 | | | 14,000 | | | 13,994 | |
0.915% due 08/25/2003 | | | 5,600 | | | 5,592 | |
Anz, Inc. | | | | | | | |
1.235% due 07/09/2003 | | | 9,900 | | | 9,897 | |
Bank of America Corp. | | | | | | | |
1.150% due 07/14/2003 | | | 2,100 | | | 2,100 | |
Barclays U.S. Funding Corp. | | | | | | | |
0.930% due 08/25/2003 | | | 10,200 | | | 10,186 | |
Danske Corp. | | | | | | | |
1.220% due 07/02/2003 | | | 5,700 | | | 5,700 | |
1.210% due 07/10/2003 | | | 3,400 | | | 3,399 | |
1.220% due 07/10/2003 | | | 9,900 | | | 9,897 | |
1.240% due 07/28/2003 | | | 2,700 | | | 2,697 | |
1.210% due 08/20/2003 | | | 15,000 | | | 14,975 | |
0.915% due 09/19/2003 | | | 1,900 | | | 1,896 | |
Fannie Mae | | | | | | | |
1.230% due 07/01/2003 | | | 15,300 | | | 15,300 | |
1.195% due 08/11/2003 | | | 33,800 | | | 33,754 | |
1.165% due 08/13/2003 | | | 10,400 | | | 10,386 | |
1.170% due 08/27/2003 | | | 20,000 | | | 19,963 | |
1.080% due 09/30/2003 | | | 44,700 | | | 44,581 | |
1.140% due 10/15/2003 | | | 75,000 | | | 74,768 | |
1.110% due 12/11/2003 | | | 9,500 | | | 9,455 | |
Federal Home Loan Bank | | | | | | | |
1.145% due 08/08/2003 | | | 50,000 | | | 49,940 | |
1.170% due 08/29/2003 | | | 20,000 | | | 19,962 | |
1.140% due 11/17/2003 | | | 30,000 | | | 29,879 | |
Freddie Mac | | | | | | | |
1.160% due 07/10/2003 | | | 23,200 | | | 23,193 | |
1.080% due 08/05/2003 | | | 26,800 | | | 26,772 | |
1.170% due 08/28/2003 | | | 12,000 | | | 11,977 | |
1.135% due 10/30/2003 | | | 10,500 | | | 10,463 | |
General Electric Capital Corp. | | | | | | | |
1.200% due 07/11/2003 | | | 23,400 | | | 23,392 | |
1.250% due 07/23/2003 | | | 2,900 | | | 2,898 | |
1.200% due 08/21/2003 | | | 7,000 | | | 6,988 | |
HBOS Treasury Services PLC | | | | | | | |
1.200% due 08/14/2003 | | | 20,000 | | | 19,971 | |
1.195% due 08/27/2003 | | | 6,200 | | | 6,188 | |
1.100% due 09/12/2003 | | | 15,000 | | | 14,968 | |
Rabobank Nederland NV | | | | | | | |
1.310% due 07/01/2003 | | | 50,000 | | | 50,000 | |
Royal Bank of Scotland PLC | | | | | | | |
1.245% due 07/03/2003 | | | 8,600 | | | 8,599 | |
Shell Finance | | | | | | | |
0.970% due 08/19/2003 | | | 19,900 | | | 19,874 | |
Svenska Handelsbank, Inc. | | | | | | | |
1.220% due 07/01/2003 | | | 8,800 | | | 8,800 | |
1.250% due 07/07/2003 | | | 21,200 | | | 21,196 | |
TotalFinaElf Capital S.A. | | | | | | | |
1.300% due 07/01/2003 | | | 21,000 | | | 21,000 | |
UBS Finance, Inc. | | | | | | | |
1.210% due 07/08/2003 | | | 20,000 | | | 19,995 | |
0.920% due 09/24/2003 | | | 11,700 | | | 11,671 | |
Westpac Capital Corp. | | | | | | | |
1.190% due 08/07/2003 | | | 30,000 | | | 29,963 | |
1.180% due 08/20/2003 | | | 7,900 | | | 7,887 | |
| | | | | |
|
|
|
| | | | | | | 736,615 | |
| | | | | |
|
|
|
Repurchase Agreement 0.7% | | | | | | | |
State Street Bank | | | | | | | |
0.800% due 07/01/2003 | | | 13,282 | | | 13,282 | |
| | | | | |
|
|
|
(Dated 06/30/2003. Collateralized by Federal Farm Credit Banks 2.000% due 11/19/2004 valued at $13,548. Repurchase proceeds are $13,282.) | | | | | | | |
| | | | | | | | |
U.S. Treasury Bills 0.8% | | | | | | | |
1.043% due 08/07/2003-08/14/2003 (b)(c) | | | 13,820 | | | 13,803 | |
| | | | | |
|
|
|
Total Short-Term Instruments (Cost $763,663) | | | | | | 763,700 | |
| | | | | |
|
|
|
Total Investments 114.8% (Cost $1,972,249) | | | | | $ | 2,005,748 | |
Written Options (d) (0.3%)
(Premiums $4,073) | | | | | | (4,397 | ) |
Other Assets and Liabilities (Net) (14.5%) | | | | | | (254,285 | ) |
| | | | | |
|
|
|
Net Assets 100.0% | | | | | $ | 1,747,066 | |
| | | | | |
|
|
|
Notes to Schedule of Investments
(amounts in thousands, except number of contracts):
| (a) | | Variable rate security. The rate listed is as of June 30, 2003. |
| (b) | | Securities with an aggregate market value of $9,322 have been segregated with the custodian to cover margin requirements for the following open futures contracts at June 30, 2003: |
Type
| | # of Contracts
| | Unrealized Appreciation/ (Depreciation)
| |
Euribor Written Put Options Strike @ 97.500 (03/2004) - Short | | 74 | | $ | 52 | |
Euribor Written Put Options Strike @ 97.500 (09/2003) - Short | | 107 | | | 53 | |
Euribor Written Put Options Strike @ 96.500 (12/2003) - Short | | 89 | | | 77 | |
Euribor Written Put Options Strike @ 97.375 (12/2003) - Short | | 71 | | | 56 | |
Euribor Written Put Options Strike @ 97.500 (12/2003) - Short | | 143 | | | 104 | |
Euribor Written Put Options Strike @ 95.500 (12/2003) - Long | | 411 | | | (6 | ) |
Euribor March Futures (03/2004) - Long | | 25 | | | 19 | |
Euribor September Futures (09/2003) - Long | | 73 | | | 100 | |
Euribor September Futures (09/2005) - Long | | 100 | | | (60 | ) |
Euribor December Futures (12/2004) - Long | | 12 | | | 2 | |
Euro-Bobl 5 Year Note (09/2003) - Long | | 412 | | | (75 | ) |
United Kingdom 90 Day LIBOR Futures (12/2003) - Long | | 25 | | | (9 | ) |
Eurodollar June Futures (06/2004) - Long | | 17 | | | 28 | |
U.S. Treasury 30 Year Bond (09/2003) - Long | | 504 | | | (2,048 | ) |
Eurodollar March Futures (03/2004) - Long | | 188 | | | 325 | |
Eurodollar September Futures (09/2004) - Long | | 35 | | | 68 | |
Eurodollar December Futures (12/2004) - Long | | 73 | | | 135 | |
U.S. Treasury 10 Year Note (09/2003) - Long | | 565 | | | (670 | ) |
| | | | |
|
|
|
| | | | | $ | (1,849 | ) |
| | | | |
|
|
|
| (c) | | Securities are grouped by coupon or range of coupons and represent a range of maturities. |
| (d) | | Premiums received on written options: |
Type
| | Notional
Amount
| | Premium
| | Value
|
Call - OTC 7 Year Interest Rate Swap | | | | | | | | | |
Strike @ 5.970%* Exp. 10/04/2004 | | $ | 6,400,000 | | $ | 257 | | $ | 787 |
Put - OTC 7 Year Interest Rate Swap | | | | | | | | | |
Strike @ 6.000%** Exp. 10/19/2004 | | | 1,700,000 | | | 69 | | | 14 |
Call - OTC 7 Year Interest Rate Swap | | | | | | | | | |
Strike @ 6.000%* Exp. 10/19/2004 | | | 1,700,000 | | | 69 | | | 210 |
Put - OTC 7 Year Interest Rate Swap | | | | | | | | | |
Strike @ 5.970%** Exp. 10/04/2004 | | | 6,400,000 | | | 257 | | | 49 |
Call - OTC 7 Year Interest Rate Swap | | | | | | | | | |
Strike @ 5.500%* Exp. 01/07/2005 | | | 3,900,000 | | | 95 | | | 361 |
Put - OTC 7 Year Interest Rate Swap | | | | | | | | | |
Strike @ 7.000%** Exp. 01/07/2005 | | | 3,900,000 | | | 132 | | | 20 |
Call - OTC 7 Year Interest Rate Swap | | | | | | | | | |
Strike @ 3.500%* Exp. 12/17/2003 | | | 6,700,000 | | | 62 | | | 119 |
Call - OTC 5 Year Interest Rate Swap | | | | | | | | | |
Strike @ 3.500%* Exp. 12/15/2003 | | | 5,500,000 | | | 58 | | | 155 |
Call - OTC 10 Year Interest Rate Swap | | | | | | | | | |
Strike @ 4.000%* Exp. 07/22/2003 | | | 9,800,000 | | | 88 | | | 138 |
Call - OTC 5 Year Interest Rate Swap | | | | | | | | | |
Strike @ 3.500%* Exp. 12/16/2003 | | | 9,700,000 | | | 104 | | | 273 |
Call - OTC 10 Year Interest Rate Swap | | | | | | | | | |
Strike @ 4.000%* Exp. 08/01/2003 | | | 5,200,000 | | | 49 | | | 79 |
Put - OTC 7 Year Interest Rate Swap | | | | | | | | | |
Strike @ 5.500%** Exp. 12/17/2003 | | | 4,000,000 | | | 57 | | | 3 |
See accompanying notes
9
Call - OTC 7 Year Interest Rate Swap | | | | | | | | |
Strike @ 5.500%* Exp. 12/17/2003 | | 1,400,000 | | $ | 24 | | $ | 1 |
Call - OTC 7 Year Interest Rate Swap | | | | | | | | |
Strike @ 3.500%* Exp. 12/17/2003 | | 1,400,000 | | | 10 | | | 25 |
Call - OTC 10 Year Interest Rate Swap | | | | | | | | |
Strike @ 4.000%* Exp. 08/01/2003 | | 3,900,000 | | | 32 | | | 60 |
Call - OTC 10 Year Interest Rate Swap | | | | | | | | |
Strike @ 4.000%* Exp. 03/03/2004 | | 8,200,000 | | | 136 | | | 201 |
Call - OTC 10 Year Interest Rate Swap | | | | | | | | |
Strike @ 4.000%* Exp. 03/03/2004 | | 5,100,000 | | | 112 | | | 125 |
Call - OTC 5 Year Interest Rate Swap | | | | | | | | |
Strike @ 3.250%* Exp. 03/03/2004 | | 25,600,000 | | | 393 | | | 500 |
Call - OTC 10 Year Interest Rate Swap | | | | | | | | |
Strike @ 4.000%* Exp. 03/03/2004 | | 8,300,000 | | | 119 | | | 204 |
| | | | |
|
| |
|
|
| | | | | $ | 2,123 | | $ | 3,324 |
| | | | |
|
| |
|
|
| | | |
Type
| | # of
Contracts
| | Premium
| | Value
|
Call - CME Eurodollar March Futures | | | | | | | | |
Strike @ 98.50 Exp. 03/15/2004 | | 18 | | $ | 9 | | $ | 15 |
Put - CME Eurodollar March Futures | | | | | | | | |
Strike @ 97.250 Exp. 03/15/2004 | | 9 | | | 7 | | | 0 |
Put - CME Eurodollar March Futures | | | | | | | | |
Strike @ 97.750 Exp. 03/15/2004 | | 81 | | | 48 | | | 2 |
Put - CME Eurodollar December Futures | | | | | | | | |
Strike @ 98.000 Exp. 12/15/2003 | | 200 | | | 108 | | | 1 |
Call - CBOT 5 Year September Futures | | | | | | | | |
Strike @ 119.000 Exp. 08/23/2003 | | 84 | | | 15 | | | 3 |
Call - TSE Japanese Yen 10 Year September Futures | | | | | | | | |
Strike @ 145.000 Exp. 08/29/2003 | | 4 | | | 8 | | | 1 |
Call - CBOT U.S. Treasury Note September Futures | | | | | | | | |
Strike @ 117.000 Exp. 08/23/2003 | | 23 | | | 13 | | | 34 |
Call - CBOT U.S. Treasury Note September Futures | | | | | | | | |
Strike @ 120.000 Exp. 08/23/2003 | | 80 | | | 46 | | | 29 |
Call - CBOT U.S. Treasury Note September Futures | | | | | | | | |
Strike @ 122.000 Exp. 08/23/2003 | | 86 | | | 25 | | | 9 |
Call - CBOT U.S. Treasury Note September Futures | | | | | | | | |
Strike @ 123.000 Exp. 08/23/2003 | | 321 | | | 106 | | | 20 |
Put - CBOT U.S. Treasury Note September Futures | | | | | | | | |
Strike @ 110.000 Exp. 08/23/2003 | | 543 | | | 546 | | | 17 |
Put - CBOT U.S. Treasury Note September Futures | | | | | | | | |
Strike @ 114.000 Exp. 08/23/2003 | | 80 | | | 39 | | | 23 |
Put - CBOT U.S. Treasury Note September Futures | | | | | | | | |
Strike @ 116.000 Exp. 08/23/2003 | | 303 | | | 129 | | | 208 |
Call - CBOT U.S. Treasury Bond September Futures | | | | | | | | |
Strike @ 128.000 Exp. 08/23/2003 | | 194 | | | 66 | | | 9 |
Call - CBOT U.S. Treasury Bond September Futures | | | | | | | | |
Strike @ 126.000 Exp. 08/23/2003 | | 566 | | | 226 | | | 62 |
Put - CBOT U.S. Treasury Bond September Futures | | | | | | | | |
Strike @ 114.000 Exp. 08/23/2003 | | 818 | | | 559 | | | 640 |
| | | | |
|
| |
|
|
| | | | | $ | 1,950 | | $ | 1073 |
| | | | |
|
| |
|
|
| * | | The Portfolio will receive a floating rate based on 3-month LIBOR. |
| ** | | The Portfolio will pay a floating rate based on 3-month LIBOR. |
| (e) | | Swap agreements outstanding at June 30, 2003: |
Type
| | Notional Amount
| | Unrealized Appreciation/ (Depreciation)
| |
Receive a fixed rate equal to 4.000% and pay floating rate based on 6-month BP-LIBOR. Counterparty: Morgan Stanley Dean Witter & Co. | | | | | | | |
Exp. 03/17/2005 | | BP | 22,500 | | $ | 65 | |
Receive floating rate based on 6-month BP-LIBOR and pay a fixed rate equal to 5.000%. Counterparty: UBS Warburg LLC | | | | | | | |
Exp. 03/15/2017 | | | 700 | | | (6 | ) |
Receive floating rate based on 6-month BP-LIBOR and pay a fixed rate equal to 5.000%. Counterparty: J.P. Morgan Chase & Co. | | | | | | | |
Exp. 03/15/2017 | | | 300 | | | (2 | ) |
Receive floating rate based on 6-month BP-LIBOR and pay a fixed rate equal to 5.000%. Counterparty: Goldman Sachs & Co. | | | | | | | |
Exp. 03/15/2017 | | | 1,700 | | | (7 | ) |
Receive floating rate based on 6-month BP-LIBOR and pay a fixed rate equal to 5.000%. Counterparty: J.P. Morgan Chase & Co. | | | | | | | |
Exp. 03/15/2032 | | | 900 | | | 29 | |
Receive floating rate based on 6-month BP-LIBOR and pay a fixed rate equal to 5.000%. Counterparty: UBS Warburg LLC | | | | | | | |
Exp. 03/15/2032 | | | 1,100 | | | 26 | |
Receive a fixed rate equal to 3.250% and pay floating rate based on 6-month EC-LIBOR. Counterparty: J.P. Morgan Chase & Co. | | | | | | | |
Exp. 03/15/2007 | | EC | 700 | | | (38 | ) |
Receive a fixed rate equal to 6.000% and pay floating rate based on 6-month EC-LIBOR. Counterparty: J.P. Morgan Chase & Co. | | | | | | | |
Exp. 03/15/2017 | | | 500 | | | 10 | |
Receive a fixed rate equal to 6.000% and pay floating rate based on 6-month EC-LIBOR. Counterparty: J.P. Morgan Chase & Co. | | | | | | | |
Exp. 03/15/2032 | | | 1,500 | | | 18 | |
Receive a fixed rate equal to 6.000% and pay floating rate based on 6-month EC-LIBOR. Counterparty: Goldman Sachs & Co. | | | | | | | |
Exp. 03/15/2017 | | | 4,000 | | | 77 | |
Receive a fixed rate equal to 6.000% and pay floating rate based on 6-month EC-LIBOR. Counterparty: UBS Warburg LLC | | | | | | | |
| | |
Exp. 03/15/2032 | | | 1,800 | | | 12 | |
Receive a fixed rate equal to 0.610% and the Portfolio will pay to the counterparty at par in the event of default of General Electric Capital Corp. 6.000% due 06/15/2012. Counterparty: Merrill Lynch & Co., Inc. | | | | | | | |
| | |
Exp. 05/19/2004 | | $ | 1,900 | | | 6 | |
Receive a fixed rate equal to 1.750% and the Portfolio will pay to the counterparty at par in the event of default of Republic of Peru 9.125% due 02/21/2012. Counterparty: Morgan Stanley Dean Witter & Co. | | | | | | | |
| | |
Exp. 06/20/2004 | | | 900 | | | 0 | |
Receive a fixed rate equal to 1.800% and the Portfolio will pay to the counterparty at par in the event of default of Republic of Panama 9.375% due 04/01/2029. Counterparty: Morgan Stanley Dean Witter & Co. | | | | | | | |
| | |
Exp. 06/20/2005 | | | 300 | | | 1 | |
| | | | | |
|
|
|
| | | | | | $ | 191 | |
| | | | | |
|
|
|
| (f) | | Principal amount of security is adjusted for inflation. |
| (g) | | Principal amount denoted in indicated currency: |
BP – British Pound
EC – Euro
MP – Mexican Peso
| (h) | | Foreign forward currency contracts outstanding at June 30, 2003: |
Type
| | Currency
| | Principal
Amount
Covered by
Contract
| | Settlement
Month
| | Unrealized
Appreciation
| | Unrealized (Depreciation)
| | | Net Unrealized
Appreciation/
(Depreciation)
| |
Sell | | EC | | 3,003 | | 07/2003 | | $ | 14 | | $ | 0 | | | $ | 14 | |
Buy | | MP | | 8,082 | | 09/2003 | | | 68 | | | 0 | | | | 68 | |
Sell | | MP | | 8,082 | | 09/2003 | | | 0 | | | (51 | ) | | | (51 | ) |
| | | | | | | | |
|
| |
|
|
| |
|
|
|
| | | | | | | | | $ | 82 | | $ | (51 | ) | | $ | 31 | |
| | | | | | | | |
|
| |
|
|
| |
|
|
|
| (i) | | Indicates a fair valued security which has not been valued utilizing an independent quote and which is valued pursuant to guidelines established by the Trustees. The aggregate value of fair valued securities is $2,978, which is 0.17% of net assets. |
See accompanying notes
10
Notes to Financial Statements
June 30, 2003 (Unaudited)
1. Organization
The Total Return Portfolio (the “Portfolio”) is a series of the PIMCO Variable Insurance Trust (the “Trust”). The Trust is registered under the Investment Company Act of 1940 (the “Act”), as amended, as an open-end investment company organized as a Delaware business trust on October 3, 1997. The Trust may offer up to two classes of shares: Institutional and Administrative. Each share class has identical voting rights (except that shareholders of a class have exclusive voting rights regarding any matter relating solely to that class of shares). Information presented in these financial statements pertains to the Administrative Class of the Trust. Certain detailed financial information for the Institutional Class is provided separately and is available upon request. The Trust is designed to be used as an investment vehicle by Separate Accounts of insurance companies that fund variable annuity contracts and variable life insurance policies and by qualified pension and retirement plans. The Portfolio commenced operations on December 31, 1997.
2. Significant Accounting Policies
The following is a summary of significant accounting policies consistently followed by the Trust in the preparation of its financial statements in conformity with accounting principles generally accepted in the United States of America. The preparation of financial statements in accordance with accounting principles generally accepted in the United States of America requires management to make estimates and assumptions that affect the reported amounts and disclosures in the financial statements. Actual results could differ from those estimates.
Security Valuation. Portfolio securities and other financial instruments for which market quotations are readily available are stated at market value. Market value is determined at the close of regular trading (normally, 4:00 p.m., Eastern Time) on the New York Stock Exchange on each day the New York Stock Exchange is open, or if no sales are reported, as is the case for most securities traded over-the-counter, the mean between representative bid and asked quotations obtained from a quotation reporting system or from established market makers. Fixed income securities, including those to be purchased under firm commitment agreements, are normally valued on the basis of quotes obtained from brokers and dealers or pricing services. Short-term investments, which mature in 60 days or less are valued at amortized cost, which approximates market value. Certain fixed income securities for which daily market quotations are not readily available may be valued, pursuant to guidelines established by the Board of Trustees, with reference to fixed income securities whose prices are more readily obtainable. Prices may be obtained from independent pricing services which use information provided by market makers or estimates of market values obtained from yield data relating to investments or securities with similar characteristics. The prices used by the Portfolio may differ from the value that would be realized if the securities were sold and the differences could be material to the financial statements.
Securities Transactions and Investment Income. Securities transactions are recorded as of the trade date. Securities purchased or sold on a when-issued or delayed delivery basis may be settled a month or more after the trade date. Realized gains and losses from securities sold are recorded on the identified cost basis. Dividend income is recorded on the ex-dividend date, except certain dividends from foreign securities where the ex-dividend date may have passed, are recorded as soon as the Portfolio is informed of the ex-dividend date. Interest income, adjusted for the accretion of discounts and amortization of premiums, is recorded on the accrual basis. Paydowns gains and losses on mortgage- and asset-backed securities are recorded as adjustments to interest income in the Statement of Operations.
Dividends and Distributions to Shareholders. Dividends from net investment income, if any, are declared on each day the Trust is open for business and are distributed to shareholders monthly. All dividends are reinvested in additional shares of the Portfolio. Net realized capital gains earned by the Portfolio, if any, will be distributed no less frequently than once each year.
Income dividends and capital gain distributions are determined in accordance with income tax regulations which may differ from accounting principles generally accepted in the United States of America. These differences are primarily due to differing treatments for such items as wash sales, foreign currency transactions, net operating losses and capital loss carryforwards.
Distributions classified as a tax basis return of capital, if any, are reflected in the accompanying Statements of Changes in Net Assets and have been reclassified to paid in capital. In addition, other amounts have been reclassified between undistributed net investment income, accumulated undistributed net realized gains or losses and/or paid in capital to more appropriately conform financial accounting to tax characterizations of dividend distributions.
Foreign Currency. The accounting records of the Portfolio are maintained in U.S. dollars. The market values of foreign securities, currency holding and other assets and liabilities are translated into U.S. dollars based on the current exchange rates each business day. Fluctuations in the value of these assets and liabilities resulting from changes in exchange rates are recorded as unrealized foreign currency gains or losses. Realized gains or losses and unrealized appreciation (depreciation) on investment securities and income and expenses are translated on the respective dates of such transactions. The effect of changes in foreign currency exchange rates on investments in securities are not
11
segregated in the Statement of Operations from the effects of changes in market prices of those securities, but are included with the net realized and unrealized gain or loss on investment securities.
Multiclass Operations. Each class offered by the Trust has equal rights as to assets. Income, non-class specific expenses, and realized and unrealized capital gains and losses are allocated to each class of shares based on the relative net assets of each class.
Federal Income Taxes. The Portfolio intends to qualify as a regulated investment company and distribute all of its taxable income and net realized gains, if applicable, to shareholders. Accordingly, no provision for Federal income taxes has been made.
Financing Transactions. The Portfolio may enter into financing transactions consisting of the sale by the Portfolio of securities, together with a commitment to repurchase similar securities at a future date. The difference between the selling price and the future purchase price is an adjustment to interest income in the Statement of Operations. If the counterparty to whom the Portfolio sells the security becomes insolvent, the Portfolio’s right to repurchase the security may be restricted; the value of the security may change over the term of the financing transaction; and the return earned by the Portfolio with the proceeds of a financing transaction may not exceed transaction costs. The Portfolio will designate assets determined to be liquid by PIMCO or otherwise cover its obligations under financing transactions.
Futures Contracts. The Portfolio is authorized to enter into futures contracts. The Portfolio may use futures contracts to manage its exposure to the securities markets or to movements in interest rates and currency values. The primary risks associated with the use of futures contracts are imperfect correlation between the change in market value of the securities held by the Portfolio and the prices of futures contracts, the possibility of an illiquid market, and the inability of the counterparty to meet the terms of the contract. Futures contracts are valued based upon their quoted daily settlement prices. Upon entering into a futures contract, the Portfolio may be required to deposit with its custodian, in a segregated account in the name of the futures broker, an amount of cash or U.S. Government and Agency Obligations in accordance with the initial margin requirements of the broker or exchange. Futures contracts are marked to market daily and an appropriate payable or receivable for the change in value (“variation margin”) is recorded by the Portfolio. Gains or losses are recognized but not considered realized until the contracts expire or are closed. Futures contracts involve, to varying degrees, risk of loss in excess of the variation margin disclosed in the Statement of Assets and Liabilities.
Options Contracts. The Portfolio may write call and put options on futures, securities or currencies it owns or in which it may invest. Writing put options tends to increase the Portfolio’s exposure to the underlying instrument. Writing call options tends to decrease the Portfolio’s exposure to the underlying instrument. When the Portfolio writes a call or put option, an amount equal to the premium received is recorded as a liability and subsequently marked to market to reflect the current value of the option written. Payment received or made, if any, from writing options with premiums to be determined on a future date are reflected as such on the Statement of Assets and Liabilities. Premiums received from writing options which expire are treated as realized gains. Premiums received from writing options which are exercised or closed are added to the proceeds or offset against amounts paid on the underlying future, security or currency transaction to determine the realized gain or loss. The Portfolio as a writer of an option has no control over whether the underlying future, security or currency may be sold (call) or purchased (put) and as a result bears the market risk of an unfavorable change in the price of the future, security or currency underlying the written option. There is the risk the Portfolio may not be able to enter into a closing transaction because of an illiquid market.
The Portfolio may also purchase put and call options. Purchasing call options tends to increase the Portfolio’s exposure to the underlying instrument. Purchasing put options tends to decrease the Portfolio’s exposure to the underlying instrument. The Portfolio pays a premium which is included in the Portfolio’s Statement of Assets and Liabilities as an investment and subsequently marked to market to reflect the current value of the option. Premiums paid for purchasing options which expire are treated as realized losses. The risk associated with purchasing put and call options is limited to the premium paid. Premiums paid for purchasing options which are exercised or closed are added to the amounts paid or offset against the proceeds on the underlying future, security or currency transaction to determine the realized gain or loss.
Forward Currency Transactions. The Portfolio may enter into forward currency contracts and forward cross-currency contracts in connection with settling planned purchases or sales of securities or to hedge the currency exposure associated with some or all of the Portfolio’s securities. A forward currency contract is an agreement between two parties to buy and sell a currency at a set price on a future date. The market value of a forward currency contract fluctuates with changes in forward currency exchange rates. Forward currency contracts are marked to market daily and the change in value is recorded by the Portfolio as an unrealized gain or loss. Realized gains or losses equal to the difference between the value of the contract at the time it was opened and the value at the time it was closed are recorded upon delivery or receipt of the currency or, if a
12
forward currency contract is offset by entering into another forward currency contract with the same broker, upon settlement of the net gain or loss. These contracts may involve market risk in excess of the unrealized gain or loss reflected in the Portfolio’s Statement of Assets and Liabilities. In addition, the Portfolio could be exposed to risk if the counterparties are unable to meet the terms of the contracts or if the value of the currency changes unfavorably to the U.S. dollar.
Swap Agreements. The Portfolio may invest in swap agreements. A swap is an agreement to exchange the return generated by one instrument for the return generated by another instrument. The Portfolio may enter into interest rate, total return, forward swap spread lock and credit default swap agreements to manage its exposure to interest rates and credit risk. Interest rate swap agreements involve the exchange by the Portfolio with another party of their respective commitments to pay or receive interest, e.g., an exchange of floating rate payments for fixed rate payments with respect to a notional amount of principal. Total return swap agreements involve commitments to pay interest in exchange for a market-linked return, both based on notional amounts. To the extent the total return of the security or index underlying the transaction exceeds or falls short of the offsetting interest rate obligation, the Portfolio will receive a payment from or make a payment to the counterparty. Forward spread lock swap agreements involve commitments to pay or receive a settlement amount calculated as the difference between the swap spread and a fixed spread, multiplied by the notional amount times the duration of the swap. The swap spread is the difference between the benchmark swap rate (market rate) and the specific Treasury rate. In a credit default swap, one party makes a stream of payments to another party in exchange for the right to receive a specified return in the event of a default by a third party, typically corporate issues or sovereign issues of an emerging country, on its obligation. The Portfolio may use credit default swaps to provide a measure of protection against defaults of sovereign issuers (i.e., to reduce risk where the Portfolio owns or has exposure to the sovereign issuer) or to take an active long or short position with respect to the likelihood of a particular issuer’s default. Swaps are marked to market daily based upon quotations from market makers and vendors and the change in value, if any, is recorded as unrealized gain or loss in the Statement of Operations. Payments received or made at the beginning of the measurement period are reflected as such on the Statement of Assets and Liabilities. A liquidation payment received or made at the termination of the swap is recorded as realized gain or loss in the Statement of Operations. Net periodic payments are included as part of miscellaneous income on the Statement of Operations. Entering into these agreements involves, to varying degrees, elements of credit, market and documentation risk in excess of the amounts recognized on the Statement of Assets and Liabilities. Such risks involve the possibility that there will be no liquid market for these agreements, that the counterparty to the agreements may default on its obligation to perform or disagree as to the meaning of contractual terms in the agreements, and that there may be unfavorable changes in interest rates.
Delayed Delivery Transactions. The Portfolio may purchase or sell securities on a when-issued or delayed delivery basis. These transactions involve a commitment by the Portfolio to purchase or sell securities for a predetermined price or yield, with payment and delivery taking place beyond the customary settlement period. When delayed delivery purchases are outstanding, the Portfolio will set aside and maintain until the settlement date in a segregated account, liquid assets in an amount sufficient to meet the purchase price. When purchasing a security on a delayed delivery basis, the Portfolio assumes the rights and risks of ownership of the security, including the risk of price and yield fluctuations, and takes such fluctuations into account when determining its net asset value. The Portfolio may dispose of or renegotiate a delayed delivery transaction after it is entered into, and may sell when-issued securities before they are delivered, which may result in a capital gain or loss. When the Portfolio has sold a security on a delayed delivery basis, the Portfolio does not participate in future gains and losses with respect to the security.
Inflation-Indexed Bonds. Inflation-indexed bonds are fixed income securities whose principal value is periodically adjusted to the rate of inflation. The interest rate on these bonds is generally fixed at issuance at a rate lower than typical bonds. Over the life of an inflation-indexed bond, however, interest will be paid based on a principal value, which is adjusted for inflation. Any increase in the principal amount of an inflation-indexed bond will be included as interest income in the Statement of Operations, even though investors do not receive their principal until maturity.
Repurchase Agreements. The Portfolio may engage in repurchase transactions. Under the terms of a typical repurchase agreement, the Portfolio takes possession of an underlying debt obligation subject to an obligation of the seller to repurchase, and the Portfolio to resell, the obligation at an agreed-upon price and time. The market value of the collateral must be equal at all times to the total amount of the repurchase obligations, including interest. Generally, in the event of counterparty default, the Portfolio has the right to use the collateral to offset losses incurred.
13
3. Fees, Expenses, and Related Party Transactions
Investment Advisory Fee. Pacific Investment Management Company LLC (PIMCO) is a majority owned subsidiary partnership of Allianz Dresdner Asset Management of America L.P. (formerly PIMCO Advisors L.P.) and serves as investment adviser (the “Adviser”) to the Trust, pursuant to an investment advisory contract. The Adviser receives a monthly fee at an annual rate based on average daily net assets of the Portfolio. The Advisory Fee is charged at an annual rate of 0.25%.
Administration Fee. PIMCO serves as administrator (the “Administrator”) and provides administrative services to the Trust for which it receives a monthly administrative fee based on average daily net assets of the Portfolio. The Administration Fee is charged at the annual rate of 0.25%.
Servicing Fee. PIMCO Advisors Distributors LLC (“PAD”), is an indirect wholly-owned subsidiary of Allianz Dresdner Asset Management of America L.P. and serves as the distributor of the Trust’s shares. The Trust is permitted to reimburse PAD on a quarterly basis, out of the Administrative Class assets of the Portfolio in the amount of 0.15% on an annual basis of the average daily net assets of that class, for payments made to financial intermediaries that provide services in connection with the distribution of shares or administration of plans or programs that use Portfolio shares as their funding medium. The effective rate paid to PAD during the current fiscal year is 0.15%
Expenses. The Portfolio is responsible for the following expenses: (i) salaries and other compensation of any of the Trust’s executive officers and employees who are not officers, directors, stockholders or employees of PIMCO or its subsidiaries or affiliates; (ii) taxes and governmental fees; (iii) brokerage fees and commissions and other portfolio transaction expenses; (iv) the cost of borrowing money, including interest expense; (v) fees and expenses of the Trustees who are not “interested persons” of PIMCO or the Trust, and any counsel retained exclusively for their benefit; (vi) extraordinary expenses, including costs of litigation and indemnification expenses; (vii) organization expenses and (viii) any expenses allocated or allocable to a specific class of shares, which include service fees payable with respect to the Administrative Class shares and may include certain other expenses as permitted by the Trust’s Multiple Class Plan adopted pursuant to Rule 18f-3 under the Act and subject to review and approval by the Trustees. The ratio of expenses to average net assets per share class, as disclosed in the Financial Highlights, may differ from the annual Portfolio operating expenses per share class as disclosed in the Prospectus for the reasons set forth above. PIMCO has agreed to waive a portion of its administrative fees to the extent that the payment of the Portfolio’s pro rata share of Trustees’ fees causes the actual expense ratio to rise above the rates disclosed in the current prospectus plus 0.49 basis points as set forth below (calculated as a percentage of the Portfolio’s average daily net assets attributable to each class):
| | | Institutional
Class
| | | Administrative
Class
| |
Total Return Portfolio | | 0.50 | % | | 0.65 | % |
PIMCO may be reimbursed for these waived amounts in future periods.
The Trust pays no compensation directly to any Trustee or any other officer who is affiliated with the Administrator, all of whom receive renumeration for their services to the Trust from the Administrator or its affiliates.
Each unaffiliated Trustee receives an annual retainer of $4,000, plus $1,500 for each Board of Trustees meeting attended in person and $250 for each meeting attended telephonically, plus reimbursement of related expenses. In addition, each committee chair receives an additional annual retainer of $500. These expenses are allocated on a pro-rata basis to each Portfolio of the Trust according to its respective net assets.
Organization Expenses. Costs incurred in connection with the organization of the Portfolio and its initial registration are amortized on a straight-line basis over a five-year period from the Portfolio’s commencement of operations.
4. Purchases and Sales of Securities
Purchases and sales of securities (excluding short-term investments) for the period ended June 30, 2003 were as follows (amounts in thousands):
| | | U.S Government/Agency
| | All Other
|
| | | Purchases
| | Sales
| | Purchases
| | Sales
|
Total Return Portfolio | | $ | 1,291,505 | | $ | 1,090,547 | | $ | 209,250 | | $ | 97,856 |
5. Transactions in Written Call and Put Options
Transactions in written call and put options were as follows (amounts in thousands):
| | | Total Return Portfolio
| |
| | | Premium
| |
Balance at 12/31/2002 | | $ | 2,008 | |
Sales | | | 3,442 | |
Closing Buys | | | (417 | ) |
Expirations | | | (960 | ) |
Exercised | | | 0 | |
| | |
|
|
|
Balance at 06/30/2003 | | $ | 4,073 | |
| | |
|
|
|
14
6. Federal Income Tax Matters
At June 30, 2003, the aggregate cost of investments was the same for federal income tax and financial statement purposes. The net unrealized appreciation (depreciation) of investments securities for federal income tax purposes is as follows (amounts in thousands):
| | | Aggregate Gross Unrealized Appreciation
| | Aggregate Gross Unrealized (Depreciation)
| | | Net Unrealized
Appreciation
|
Total Return Portfolio | | $ | 38,587 | | $ | (5,088 | ) | | $ | 33,499 |
7. Shares of Beneficial Interest
The Trust may issue an unlimited number of shares of beneficial interest with a $.0001 par value. Changes in shares of beneficial interest were as follows (shares and amounts in thousands):
| | | Total Return Portfolio
| |
| | | Six Months Ended 06/30/2003
| | | Year Ended 12/31/2002
| |
| | | Shares
| | | Amount
| | | Shares
| | | Amount
| |
Receipts for shares sold | | | | | | | | | | | | | | |
Institutional Class | | 5,488 | | | $ | 56,936 | | | 1,882 | | | $ | 18,993 | |
Administrative Class | | 51,939 | | | | 538,861 | | | 93,895 | | | | 946,200 | |
Issued as reinvestment of distributions | | | | | | | | | | | | | | |
Institutional Class | | 102 | | | | 1,066 | | | 211 | | | | 2,129 | |
Administrative Class | | 1,760 | | | | 18,310 | | | 3,662 | | | | 37,015 | |
Cost of shares redeemed | | | | | | | | | | | | | | |
Institutional Class | | (3,089 | ) | | | (32,059 | ) | | (1,106 | ) | | | (11,077 | ) |
Administrative Class | | (8,269 | ) | | | (85,613 | ) | | (17,705 | ) | | | (178,833 | ) |
| | |
|
| |
|
|
| |
|
| |
|
|
|
Net increase resulting from Portfolio share transactions | | 47,931 | | | $ | 497,501 | | | 80,839 | | | $ | 814,427 | |
| | |
|
| |
|
|
| |
|
| |
|
|
|
The following schedule shows the number of shareholders each owning 5% or more of the Portfolio and the total percentage of the Portfolio held by such shareholders:
| | | Number
| | % of Portfolio Held
|
Total Return Portfolio | | | | |
Institutional Class | | 1 | | 28 |
Administrative Class | | 5 | | 70 |
15
Trustees and Officers
Brent R. Harris, Chairman and Trustee
R. Wesley Burns, President and Trustee
E. Philip Cannon, Trustee
Vern O. Curtis, Trustee
J. Michael Hagan, Trustee
William J. Popejoy, Trustee
Garlin G. Flynn, Secretary
John P. Hardaway, Treasurer
Investment Adviser and Administrator
Pacific Investment Management Company LLC
840 Newport Center Drive
Newport Beach, California 92660
Transfer Agent
National Financial Data Services
330 W. 9th Street, 4th Floor
Kansas City, Missouri 64105
Custodian
State Street Bank & Trust Company
801 Pennsylvania
Kansas City, Missouri 64105
Counsel
Dechert LLP
1775 I Street, N.W.
Washington, D.C. 20006
Independent Accountants
PricewaterhouseCoopers LLP
1055 Broadway
Kansas City, Missouri 64105
PIMCO VARIABLE INSURANCE TRUST
This report is submitted for the general information of the shareholders of the PIMCO Variable Insurance Trust. It is not authorized for distribution to prospective investors unless accompanied or preceded by an effective prospectus for the PIMCO Variable Insurance Trust, which contains information covering its investment policies as well as other pertinent information.
All Funds distributed by PIMCO ADVISORS DISTRIBUTORS LLC, member NASD
840 NEWPORT CENTER DRIVE
NEWPORT BEACH , CA 92660
800.927.4648
WWW. PIMCOADVISORS.COM
WWW. PIMCO.COM
P I M C O
PIMCO VARIABLE INSURANCE TRUST
EMERGING MARKETS BOND PORTFOLIO
ADMINISTRATIVE CLASS
SEMI-ANNUAL REPORT
June 30, 2003
| | |
| | | Fund
Summary
| | Schedule of
Investments
|
Emerging Markets Bond Portfolio (Administrative Class) | | 2 | | 8 |
Chairman’s Letter
Dear PIMCO Variable Insurance Trust Shareholder:
Financial assets gained during the first half of 2003 amid a revival of risk appetites as anxiety about the war in Iraq faded. Assets that generally benefit from economic growth, such as stocks, corporate bonds and emerging market debt, fared the best year-to-date as investors returned to these sectors in anticipation of a recovery in the second half of 2003. Reflationary forces that investors expected to fuel a rebound included federal tax cuts and a weak dollar, as well as low borrowing rates that eased the burden of high personal and corporate indebtedness. Low mortgage rates kept refinancings booming in the second quarter and put more money in consumers’ pockets.
U.S. Treasuries lagged their riskier counterparts but still enjoyed a modest rally. Yields fell to levels not seen in 45 years early in the second quarter before bouncing off their lows in June as hopes for recovery increased. The yield on the benchmark 10-year Treasury closed the six-month period 0.30% lower to 3.51%, after nearing 3% earlier in the period. Buyers were encouraged that inflation would remain tame amid low capacity utilization and weak employment growth. Asian central banks bought U.S. Treasuries to limit the rise in their currencies versus the dollar in an effort to protect their export industries. In June, the Federal Reserve cut the federal funds rate by 0.25% to 1%, its 13th easing since 2001, in an effort to boost the economy and ward off deflation. Although the cut was less than expected, the Fed suggested that rates would stay low until deflation risks abated.
On the following pages you will find specific details as to the Portfolio’s total return investment performance and a discussion of those factors that affected performance.
We appreciate the trust you have placed in us, and we will continue to focus our efforts to meet your investment needs.
Sincerely,

Brent R. Harris
Chairman
July 31, 2003
1
Emerging Markets Bond Portfolio
TOTAL RETURN INVESTMENT PERFORMANCE For the period ended June 30, 2003
| | | Since Inception** | |
Emerging Markets Bond Portfolio Administrative Class | | 42.25 | % |
J.P. Morgan Emerging Markets Bond Index Global | | — | |
| ** | | Cumulative (All Portfolio returns are net of fees and expenses.) |
CUMULATIVE RETURNS THROUGH JUNE 30, 2003
$10,000 invested at inception
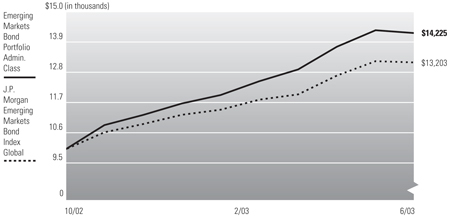
Past performance is no guarantee of future results. Investment return and principal value will fluctuate so that Portfolio shares, when redeemed, may be worth more or less than their original cost. The line graph above assumes the investment of $10,000 on 10/1/2002, the first full month following the Portfolio’s Administrative Class inception on 9/30/02, compared to the J.P. Morgan Emerging Markets Bond Index Global, an unmanaged market index. It is not possible to invest directly in the index. The Portfolio may invest in foreign securities which involve potentially higher risks including foreign currency fluctuations and political or economic uncertainty. Investing in emerging market securities imposes even greater risks including smaller capitalization of securities markets, which can experience illiquidity, price volatility, foreign restrictions, and repatriation of investment income and capital. The high recent performance of the Portfolio is due to various factors including, but not limited to improving credit fundamentals, higher oil prices and capital flows into the asset class. This level of performance is not guaranteed and should not be expected in the future.
PORTFOLIO INSIGHTS
| • | | The Emerging Markets Bond Portfolio seeks to achieve its investment objective by investing under normal circumstances at least 80% of its assets in Fixed Income Instruments of issuers that economically are tied to countries with emerging securities markets. |
| • | | The Portfolio returned 21.95% for the six-month period ended June 30, 2003, outperforming the J.P. Morgan Emerging Markets Bond Index Global return of 17.33%. |
| • | | A continuation of favorable investor responses to solid economic and financial performance led to significant debt repricing among countries affected by last year’s dislocation in global credit markets. |
| • | | The Portfolio benefited significantly from an overweight position in Brazil where bonds returned over 40% year-to-date in response to sound policy management and improving economic and financial fundamentals. |
| • | | Similarly, an overweight position in Ecuador boosted performance as the country benefited from continued cooperation with the IMF on fiscal policy and the high level of oil prices. |
| • | | Our continued avoidance of countries with weak economic fundamentals, including Argentina and Venezuela, detracted from relative performance as these countries benefited from large inflows of capital into the asset class despite their poor underlying financial and economic situations. |
2
Financial Highlights
Emerging Markets Bond Portfolio (Administrative Class)
| Selected Per Share Data for the Year or Period Ended: | | 06/30/2003 +
| | | 09/30/2002-12/31/2002
| |
Net asset value beginning of period | | $ | 11.48 | | | $ | 10.00 | |
Net investment income (a) | | | 0.39 | | | | 0.18 | |
Net realized/unrealized gain (loss) on investments (a) | | | 2.10 | | | | 1.48 | |
Total income from investment operations | | | 2.49 | | | | 1.66 | |
Dividends from net investment income | | | (0.39 | ) | | | (0.18 | ) |
Distributions from net realized capital gains | | | 0.00 | | | | 0.00 | |
Total distributions | | | (0.39 | ) | | | (0.18 | ) |
Net asset value end of period | | $ | 13.58 | | | $ | 11.48 | |
Total return | | | 21.95 | % | | | 16.65 | % |
Net assets end of period (000s) | | $ | 44,704 | | | $ | 32,767 | |
Ratio of expenses to average net assets | | | 1.02 | %*(b) | | | 1.02 | %*(b)(c) |
Ratio of net investment income to average net assets | | | 6.18 | %* | | | 6.58 | %* |
Portfolio turnover rate | | | 228 | % | | | 91 | % |
| (a) | | Per share amounts based on average number of shares outstanding during the period. |
| (b) | | Ratio of expenses to average net assets excluding interest expense is 1.00%. |
| (c) | | If the investment manager had not reimbursed expenses, the ratio of operating expenses to average net assets would have been 1.11%. |
See accompanying notes
3
Statement of Assets and Liabilities
Emerging Markets Bond Portfolio
June 30, 2003 (Unaudited)
Amounts in thousands, except per share amounts
Assets: | | | |
Investments, at value | | $ | 59,042 |
Cash | | | 19 |
Receivable for investments sold | | | 16,138 |
Unrealized appreciation on forward foreign currency contracts | | | 33 |
Receivable for Portfolio shares sold | | | 130 |
Interest receivable | | | 1,337 |
Unrealized appreciation on swap agreements | | | 87 |
| | |
|
|
| | | | 76,786 |
| | |
|
|
Liabilities: | | | |
Payable for investments purchased | | $ | 18,706 |
Unrealized depreciation on forward foreign currency contracts | | | 3 |
Payable for financing transactions | | | 13,286 |
Accrued investment advisory fee | | | 16 |
Accrued administration fee | | | 14 |
Accrued servicing fee | | | 5 |
Recoupment payable to Manager | | | 1 |
Other liabilities | | | 51 |
| | |
|
|
| | | | 32,082 |
| | |
|
|
Net Assets | | $ | 44,704 |
| | |
|
|
Net Assets Consist of: | | | |
Paid in capital | | $ | 35,315 |
Undistributed net investment income | | | 918 |
Accumulated undistributed net realized gain | | | 6,532 |
Net unrealized appreciation | | | 1,939 |
| | |
|
|
| | | $ | 44,704 |
| | |
|
|
Net Assets: | | | |
Administrative Class | | | 44,704 |
Shares Issued and Outstanding: | | | |
Administrative Class | | | 3,292 |
Net Asset Value and Redemption Price Per Share (Net Assets Per Share Outstanding) | | | |
Administrative Class | | | 13.58 |
Cost of Investments Owned | | $ | 57,179 |
See accompanying notes
4
Statement of Operations
Emerging Markets Bond Portfolio
For the six months ended June 30, 2003 (Unaudited)
Amounts in thousands
Investment Income: | | | | |
Interest | | $ | 1,330 | |
Miscellaneous income | | | 24 | |
| | |
|
|
|
Total Income | | | 1,354 | |
| | |
|
|
|
Expenses: | | | | |
Investment advisory fees | | | 84 | |
Administration fees | | | 75 | |
Distribution and/or servicing fees - Administrative Class | | | 28 | |
Interest expense | | | 3 | |
Miscellaneous expense | | | 1 | |
| | |
|
|
|
Total Expenses | | | 191 | |
| | |
|
|
|
Net Investment Income | | | 1,163 | |
| | |
|
|
|
Net Realized and Unrealized Gain (Loss): | | | | |
Net realized gain on investments | | | 6,542 | |
Net realized gain on foreign currency transactions | | | 6 | |
Net change in unrealized (depreciation) on investments | | | (413 | ) |
Net change in unrealized appreciation on futures contracts, written options, and swaps | | | 45 | |
Net change in unrealized appreciation on translation of assets and liabilities denominated in foreign currencies | | | 30 | |
Net Gain | | | 6,210 | |
| | |
|
|
|
Net Increase in Assets Resulting from Operations | | $ | 7,373 | |
| | |
|
|
|
See accompanying notes
5
Statements of Changes in Net Assets
Emerging Markets Bond Portfolio
Amounts in thousands
| Increase (Decrease) in Net Assets from: | | Six Months Ended
June 30, 2003
| | | Year Ended
December 31, 2002
| |
| | | (Unaudited) | | | | |
Operations: | | | | | | | | |
Net investment income | | $ | 1,163 | | | $ | 474 | |
Net realized gain | | | 6,548 | | | | 904 | |
Net change in unrealized appreciation (depreciation) | | | (338 | ) | | | 2,277 | |
| | |
|
|
| |
|
|
|
Net increase resulting from operations | | | 7,373 | | | | 3,655 | |
| | |
|
|
| |
|
|
|
Distributions to Shareholders: | | | | | | | | |
From net investment income | | | | | | | | |
Administrative Class | | | (1,165 | ) | | | (474 | ) |
| | |
|
|
| |
|
|
|
Total Distributions | | | (1,165 | ) | | | (474 | ) |
| | |
|
|
| |
|
|
|
Portfolio Share Transactions: | | | | | | | | |
Receipts for shares sold | | | | | | | | |
Administrative Class | | | 12,840 | | | | 30,695 | |
Issued as reinvestment of distributions | | | | | | | | |
Administrative Class | | | 1,165 | | | | 473 | |
Cost of shares redeemed | | | | | | | | |
Administrative Class | | | (8,276 | ) | | | (1,582 | ) |
| | |
|
|
| |
|
|
|
Net increase resulting from Portfolio share transactions | | | 5,729 | | | | 29,586 | |
| | |
|
|
| |
|
|
|
Total Increase in Net Assets | | | 11,937 | | | | 32,767 | |
| | |
|
|
| |
|
|
|
Net Assets: | | | | | | | | |
Beginning of period | | | 32,767 | | | | 0 | |
End of period* | | $ | 44,704 | | | $ | 32,767 | |
*Including undistributed net investment income of: | | $ | 918 | | | $ | 920 | |
See accompanying notes
6
Statement of Cash Flows
Emerging Markets Bond Portfolio
For the six months ended June 30, 2003 (Unaudited)
Amounts in thousands
Increase (Decrease) in Cash from:
Financing Activities: | | | | |
Sales of Portfolio shares | | $ | 12,755 | |
Redemptions of Portfolio shares | | | (8,276 | ) |
Proceeds from financing transactions | | | 6,271 | |
| | |
|
|
|
Net increase from financing activities | | | 10,750 | |
| | |
|
|
|
Operating Activities: | | | | |
Purchases of long-term securities and foreign currency | | | (74,611 | ) |
Proceeds from sales of long-term securities and foreign currency | | | 66,094 | |
Purchases of short-term securities (net) | | | (2,904 | ) |
Net investment income | | | 1,163 | |
Change in other receivables/payables (net) | | | (486 | ) |
| | |
|
|
|
Net (decrease) from operating activities | | | (10,744 | ) |
| | |
|
|
|
Net Increase in Cash | | | 6 | |
| | |
|
|
|
Cash: | | | | |
Beginning of period | | | 13 | |
End of period | | $ | 19 | |
See accompanying notes
7
Schedule of Investments
Emerging Markets Bond Portfolio
June 30, 2003 (Unaudited)
| | | Principal
Amount
(000s)
| | Value
(000s)
| |
BRAZIL 24.4% | | | | | | | |
Republic of Brazil | | | | | | | |
2.125% due 04/15/2006 (a) | | $ | 2,338 | | $ | 2,198 | |
11.500% due 03/12/2008 | | | 410 | | | 431 | |
2.187% due 04/15/2009 (a) | | | 918 | | | 771 | |
11.000% due 01/11/2012 (b) | | | 810 | | | 808 | |
2.187% due 04/15/2012 (a) | | | 650 | | | 488 | |
8.000% due 04/15/2014 | | | 2,180 | | | 1,915 | |
3.062% due 04/15/2024 (a) | | | 130 | | | 96 | |
6.000% due 04/15/2024 | | | 150 | | | 122 | |
8.875% due 04/15/2024 | | | 1,000 | | | 781 | |
8.875% due 04/15/2024 (b) | | | 400 | | | 310 | |
11.000% due 08/17/2040 (b) | | | 3,290 | | | 2,977 | |
| | | | | |
|
|
|
Total Brazil
(Cost $10,856) | | | | | | 10,897 | |
| | | | | |
|
|
|
BULGARIA 0.6% | | | | | | | |
Republic of Bulgaria | | | | | | | |
2.687% due 07/28/2011 (a) | | $ | 178 | | | 168 | |
2.687% due 07/28/2012 (a) | | | 109 | | | 105 | |
| | | | | |
|
|
|
Total Bulgaria
(Cost $265) | | | | | | 273 | |
| | | | | |
|
|
|
CHILE 2.0% | | | | | | | |
Republic of Chile | | | | | | | |
6.875% due 04/28/2009 | | $ | 150 | | | 173 | |
7.125% due 01/11/2012 | | | 435 | | | 507 | |
5.500% due 01/15/2013 | | | 210 | | | 223 | |
| | | | | |
|
|
|
Total Chile
(Cost $834) | | | | | | 903 | |
| | | | | |
|
|
|
COLOMBIA 8.9% | | | | | | | |
Republic of Colombia | | | | | | | |
7.625% due 02/15/2007 | | $ | 250 | | | 268 | |
10.750% due 01/15/2013 | | | 1,250 | | | 1,466 | |
10.375% due 01/28/2033 | | | 1,960 | | | 2,259 | |
| | | | | |
|
|
|
Total Colombia
(Cost $3,488) | | | | | | 3,993 | |
| | | | | |
|
|
|
ECUADOR 3.0% | | | | | | | |
Republic of Ecuador | | | | | | | |
12.000% due 11/15/2012 | | $ | 100 | | | 80 | |
6.000% due 08/15/2030 (a) | | | 400 | | | 245 | |
6.000% due 08/15/2030 | | | 1,710 | | | 1,026 | |
| | | | | |
|
|
|
Total Ecuador
(Cost $936) | | | | | | 1,351 | |
| | | | | |
|
|
|
MALAYSIA 2.5% | | | | | | | |
Republic of Malaysia | | | | | | | |
7.500% due 07/15/2011 (b) | | $ | 930 | | | 1,134 | |
| | | | | |
|
|
|
Total Malaysia
(Cost $1,122) | | | | | | 1,134 | |
| | | | | |
|
|
|
MEXICO 13.0% | | | | | | | |
United Mexican States | | | | | | | |
8.500% due 02/01/2006 | | $ | 290 | | | 337 | |
8.375% due 01/14/2011 (b) | | | 180 | | | 216 | |
7.500% due 01/14/2012 | | | 350 | | | 401 | |
6.375% due 01/16/2013 | | | 1,300 | | | 1,381 | |
6.625% due 03/03/2015 | | | 360 | | | 383 | |
11.375% due 09/15/2016 | | | 250 | | | 364 | |
8.125% due 12/30/2019 | | | 450 | | | 514 | |
8.000% due 09/24/2022 | | | 1,030 | | | 1,156 | |
8.300% due 08/15/2031 (b) | | | 925 | | | 1,068 | |
| | | | | |
|
|
|
Total Mexico
(Cost $5,493) | | | | | | 5,820 | |
| | | | | |
|
|
|
MOROCCO 0.7% | | | | | | | |
Kingdom of Morocco | | | | | | | |
2.562% due 01/05/2009 | | $ | 300 | | $ | 288 | |
| | | | | |
|
|
|
Total Morocco
(Cost $270) | | | | | | 288 | |
| | | | | |
|
|
|
PANAMA 5.1% | | | | | | | |
Republic of Panama | | | | | | | |
8.250% due 04/22/2008 | | $ | 75 | | | 83 | |
9.625% due 02/08/2011 | | | 25 | | | 29 | |
9.375% due 07/23/2012 | | | 845 | | | 982 | |
2.250% due 07/17/2016 (a) | | | 401 | | | 319 | |
9.375% due 01/16/2023 | | | 680 | | | 760 | |
8.875% due 09/30/2027 | | | 100 | | | 109 | |
| | | | | |
|
|
|
Total Panama
(Cost $2,081) | | | | | | 2,282 | |
| | | | | |
|
|
|
PERU 5.6% | | | | | | | |
Republic of Peru | | | | | | | |
9.125% due 02/21/2012 (b) | | $ | 2,110 | | | 2,255 | |
4.500% due 03/07/2017 | | | 300 | | | 233 | |
| | | | | |
|
|
|
Total Peru
(Cost $2,394) | | | | | | 2,488 | |
| | | | | |
|
|
|
POLAND 0.6% | | | | | | | |
Republic of Poland | | | | | | | |
3.750% due 10/27/2024 | | $ | 300 | | | 282 | |
| | | | | |
|
|
|
Total Poland
(Cost $247) | | | | | | 282 | |
| | | | | |
|
|
|
RUSSIA 17.7% | | | | | | | |
Russian Federation | | | | | | | |
5.000% due 03/31/2030 (b) | | $ | 7,885 | | | 7,660 | |
5.000% due 03/31/2030 | | | 250 | | | 243 | |
| | | | | |
|
|
|
Total Russia
(Cost $7,914) | | | | | | 7,903 | |
| | | | | |
|
|
|
SOUTH AFRICA 2.2% | | | | | | | |
Republic of South Africa | | | | | | | |
7.375% due 04/25/2012 | | $ | 380 | | | 437 | |
5.250% due 05/16/2013 | | EC | 500 | | | 555 | |
| | | | | |
|
|
|
Total South Africa
(Cost $1,001) | | | | | | 992 | |
| | | | | |
|
|
|
SOUTH KOREA 1.5% | | | | | | | |
Republic of Korea | | | | | | | |
8.875% due 04/15/2008 | | $ | 525 | | | 656 | |
| | | | | |
|
|
|
Total South Korea
(Cost $631) | | | | | | 656 | |
| | | | | |
|
|
|
TUNISIA 2.6% | | | | | | | |
Banque Centrale De Tunisie | | | | | | | |
7.375% due 04/25/2012 (b) | | $ | 980 | | | 1,144 | |
| | | | | |
|
|
|
Total Tunisia
(Cost $1,073) | | | | | | 1,144 | |
| | | | | |
|
|
|
UKRAINE 0.9% | | | | | | | |
Republic of Ukraine | | | | | | | |
11.000% due 03/15/2007 | | $ | 355 | | | 389 | |
| | | | | |
|
|
|
Total Ukraine
(Cost $373) | | | | | | 389 | |
| | | | | |
|
|
|
UNITED STATES 1.1% | | | | | | | |
Pemex Project Funding Master Trust | | | | | | | |
7.375% due 12/15/2014 | | $ | 150 | | $ | 165 | |
8.625% due 02/01/2022 | | | 300 | | | 344 | |
| | | | | |
|
|
|
Total United States
(Cost $463) | | | | | | 509 | |
| | | | | |
|
|
|
SHORT-TERM INSTRUMENTS 39.7% | | | | | | | |
Commercial Paper 38.9% | | | | | | | |
Barclays U.S. Funding Corp. | | | | | | | |
1.200% due 08/27/2003 | | $ | 1,200 | | | 1,198 | |
CBA Finance, Inc. | | | | | | | |
1.220% due 08/01/2003 | | | 600 | | | 599 | |
El Dupont | | | | | | | |
1.170% due 08/21/2003 | | | 1,200 | | | 1,198 | |
Fannie Mae | | | | | | | |
1.200% due 07/16/2003 | | | 500 | | | 500 | |
1.150% due 08/13/2003 | | | 2,500 | | | 2,496 | |
1.180% due 08/25/2003 | | | 500 | | | 499 | |
0.900% due 10/30/2003 | | | 1,300 | | | 1,296 | |
Federal Home Loan Bank | | | | | | | |
1.175% due 07/02/2003 | | | 700 | | | 700 | |
1.160% due 07/09/2003 | | | 1,000 | | | 1,000 | |
Freddie Mac | | | | | | | |
1.200% due 08/01/2003 | | | 600 | | | 599 | |
1.150% due 08/28/2003 | | | 1,600 | | | 1,597 | |
General Electric Capital Corp. | | | | | | | |
1.200% due 08/21/2003 | | | 100 | | | 100 | |
HBOS Treasury Services PLC | | | | | | | |
1.180% due 08/26/2003 | | | 1,200 | | | 1,198 | |
Rabobank Nederland NV | | | | | | | |
1.310% due 07/01/2003 | | | 1,000 | | | 1,000 | |
Royal Bank of Scotland PLC | | | | | | | |
1.255% due 07/02/2003 | | | 1,000 | | | 1,000 | |
Shell Finance PLC | | | | | | | |
1.120% due 07/10/2003 | | | 800 | | | 800 | |
TotalFinaElf Capital S.A. | | | | | | | |
1.300% due 07/01/2003 | | | 700 | | | 700 | |
Westpac Trust Securities Ltd. | | | | | | | |
1.200% due 07/02/2003 | | | 500 | | | 500 | |
1.200% due 07/10/2003 | | | 400 | | | 400 | |
| | | | | |
|
|
|
| | | | | | | 17,380 | |
| | | | | |
|
|
|
Repurchase Agreement 0.8% | | | | | | | |
State Street Bank | | | | | | | |
0.800% due 07/01/2003 | | | 358 | | | 358 | |
(Dated 06/30/2003. Collateralized by Fannie Mae 2.500% due 10/01/2004 valued at $369. Repurchase proceeds are $358.) | | | | | | | |
| | | | | |
|
|
|
Total Short-Term Instruments
(Cost $17,738) | | | | | | 17,738 | |
| | | | | |
|
|
|
Total Investments 132.1%
(Cost $57,179) | | | | | $ | 59,042 | |
Other Assets and Liabilities (Net) (32.1%) | | | | | | (14,338 | ) |
| | | | | |
|
|
|
Net Assets 100.0% | | | | | $ | 44,704 | |
| | | | | |
|
|
|
Notes to Schedule of Investments (amounts in thousands):
| (a) | | Variable rate security. The rate listed is as of June 30, 2003. |
| (b) | | Security, or a portion thereof, subject to financing transaction. |
See accompanying notes
8
| (c) | | Swap agreements outstanding at June 30, 2003: |
Type
| | Notional
Amount
| | Unrealized
Appreciation
|
Receive a fixed rate equal to 1.250% and the Portfolio will pay to the counterparty at par in the event of default of United Mexican States 11.375% due 09/15/2016. Counterparty: Merrill Lynch & Co., Inc. | | | | | | |
Exp. 12/22/2005 | | $ | 100 | | $ | 1 |
Receive a fixed rate equal to 1.310% and the Portfolio will pay to the counterparty at par in the event of default of United Mexican States 11.500% due 05/15/2026. Counterparty: Goldman Sachs & Co. | | | | | | |
Exp. 01/29/2005 | | | 300 | | | 3 |
Receive a fixed rate equal to 2.840% and the Portfolio will pay to the counterparty at par in the event of default of United Mexican States 9.750% due 04/06/2005. Counterparty: J.P. Morgan Chase & Co. | | | | | | |
Exp. 01/04/2013 | | | 1,600 | | | 83 |
| | | | | |
|
|
| | | | | | $ | 87 |
| | | | | |
|
|
| (d) | | Principal amount denoted in indicated currency: |
EC – Euro
MP – Mexican Peso
| (e) | | Foreign forward currency contracts outstanding at June 30, 2003: |
Type
| | Currency
| | Principal
Amount
Covered by
Contract
| | Settlement
Month
| | Unrealized
Appreciation
| | Unrealized
(Depreciation)
| | | Net
Unrealized
Appreciation/
(Depreciation)
| |
Sell | | EC | | 496 | | 07/2003 | | $ | 2 | | $ | 0 | | | $ | 2 | |
Buy | | MP | | 3,687 | | 09/2003 | | | 30 | | | 0 | | | | 30 | |
Sell | | MP | | 3,687 | | 09/2003 | | | 1 | | | (3 | ) | | | (2 | ) |
| | | | | | | | |
|
| |
|
|
| |
|
|
|
| | | | | | | | | $ | 33 | | $ | (3 | ) | | $ | 30 | |
| | | | | | | | |
|
| |
|
|
| |
|
|
|
See accompanying notes
9
Notes to Financial Statements
June 30, 2003 (Unaudited)
1. Organization
The Emerging Markets Bond Portfolio (the “Portfolio”) is a series of the PIMCO Variable Insurance Trust (the “Trust”). The Trust is registered under the Investment Company Act of 1940 (the “Act”), as amended, as an open-end investment company organized as a Delaware business trust on October 3, 1997. The Trust may offer up to two classes of shares: Institutional and Administrative. Each share class has identical voting rights (except that shareholders of a class have exclusive voting rights regarding any matter relating solely to that class of shares). Information presented in these financial statements pertains to the Administrative Class of the Trust. The Trust is designed to be used as an investment vehicle by Separate Accounts of insurance companies that fund variable annuity contracts and variable life insurance policies and by qualified pension and retirement plans. The Portfolio commenced operations on September 30, 2002.
2. Significant Accounting Policies
The following is a summary of significant accounting policies consistently followed by the Trust in the preparation of its financial statements in conformity with accounting principles generally accepted in the United States of America. The preparation of financial statements in accordance with accounting principles generally accepted in the United States of America requires management to make estimates and assumptions that affect the reported amounts and disclosures in the financial statements. Actual results could differ from those estimates.
Security Valuation. Portfolio securities and other financial instruments for which market quotations are readily available are stated at market value. Market value is determined at the close of regular trading (normally, 4:00 p.m., Eastern Time) on the New York Stock Exchange on each day the New York Stock Exchange is open, or if no sales are reported, as is the case for most securities traded over-the-counter, the mean between representative bid and asked quotations obtained from a quotation reporting system or from established market makers. Fixed income securities, including those to be purchased under firm commitment agreements, are normally valued on the basis of quotes obtained from brokers and dealers or pricing services. Short-term investments, which mature in 60 days or less are valued at amortized cost, which approximates market value. Certain fixed income securities for which daily market quotations are not readily available may be valued, pursuant to guidelines established by the Board of Trustees, with reference to fixed income securities whose prices are more readily obtainable. Prices may be obtained from independent pricing services which use information provided by market makers or estimates of market values obtained from yield data relating to investments or securities with similar characteristics. The prices used by the Portfolio may differ from the value that would be realized if the securities were sold and the differences could be material to the financial statements.
Securities Transactions and Investment Income. Securities transactions are recorded as of the trade date. Securities purchased or sold on a when-issued or delayed delivery basis may be settled a month or more after the trade date. Realized gains and losses from securities sold are recorded on the identified cost basis. Dividend income is recorded on the ex-dividend date, except certain dividends from foreign securities where the ex-dividend date may have passed, are recorded as soon as the Portfolio is informed of the ex-dividend date. Interest income, adjusted for the accretion of discounts and amortization of premiums, is recorded on the accrual basis. Paydowns gains and losses on mortgage- and asset-backed securities are recorded as adjustments to interest income in the Statement of Operations.
Dividends and Distributions to Shareholders. Dividends from net investment income, if any, are declared on each day the Trust is open for business and are distributed to shareholders monthly. All dividends are reinvested in additional shares of the Portfolio. Net realized capital gains earned by the Portfolio, if any, will be distributed no less frequently than once each year.
Income dividends and capital gain distributions are determined in accordance with income tax regulations which may differ from accounting principles generally accepted in the United States of America. These differences are primarily due to differing treatments for such items as wash sales, foreign currency transactions, net operating losses and capital loss carryforwards.
Distributions classified as a tax basis return of capital, if any, are reflected in the accompanying Statements of Changes in Net Assets and have been reclassified to paid in capital. In addition, other amounts have been reclassified between undistributed net investment income, accumulated undistributed net realized gains or losses and/or paid in capital to more appropriately conform financial accounting to tax characterizations of dividend distributions.
Foreign Currency. The accounting records of the Portfolio are maintained in U.S. dollars. The market values of foreign securities, currency holding and other assets and liabilities are translated into U.S. dollars based on the current exchange rates each business day. Fluctuations in the value of these assets and liabilities resulting from changes in exchange rates are recorded as unrealized foreign currency gains or losses. Realized gains or losses and unrealized appreciation (depreciation) on investment securities and income and expenses are translated on the respective dates of such transactions. The effect of changes in foreign currency
10
exchange rates on investments in securities are not segregated in the Statement of Operations from the effects of changes in market prices of those securities, but are included with the net realized and unrealized gain or loss on investment securities.
Federal Income Taxes. The Portfolio intends to qualify as a regulated investment company and distribute all of its taxable income and net realized gains, if applicable, to shareholders. Accordingly, no provision for Federal income taxes has been made.
Financing Transactions. The Portfolio may enter into financing transactions consisting of the sale by the Portfolio of securities, together with a commitment to repurchase similar securities at a future date. The difference between the selling price and the future purchase price is an adjustment to interest income in the Statement of Operations. If the counterparty to whom the Portfolio sells the security becomes insolvent, the Portfolio’s right to repurchase the security may be restricted; the value of the security may change over the term of the financing transaction; and the return earned by the Portfolio with the proceeds of a financing transaction may not exceed transaction costs. The Portfolio will designate assets determined to be liquid by PIMCO or otherwise cover its obligations under financing transactions.
Forward Currency Transactions. The Portfolio may enter into forward currency contracts and forward cross-currency contracts in connection with settling planned purchases or sales of securities or to hedge the currency exposure associated with some or all of the Portfolio’s securities. A forward currency contract is an agreement between two parties to buy and sell a currency at a set price on a future date. The market value of a forward currency contract fluctuates with changes in forward currency exchange rates. Forward currency contracts are marked to market daily and the change in value is recorded by the Portfolio as an unrealized gain or loss. Realized gains or losses equal to the difference between the value of the contract at the time it was opened and the value at the time it was closed are recorded upon delivery or receipt of the currency or, if a forward currency contract is offset by entering into another forward currency contract with the same broker, upon settlement of the net gain or loss. These contracts may involve market risk in excess of the unrealized gain or loss reflected in the Portfolio’s Statement of Assets and Liabilities. In addition, the Portfolio could be exposed to risk if the counterparties are unable to meet the terms of the contracts or if the value of the currency changes unfavorably to the U.S. dollar.
Options Contracts. The Portfolio may write call and put options on futures, securities or currencies it owns or in which it may invest. Writing put options tends to increase the Portfolio’s exposure to the underlying instrument. Writing call options tends to decrease the Portfolio’s exposure to the underlying instrument. When the Portfolio writes a call or put option, an amount equal to the premium received is recorded as a liability and subsequently marked to market to reflect the current value of the option written. Payment received or made, if any, from writing options with premiums to be determined on a future date are reflected as such on the Statement of Assets and Liabilities. Premiums received from writing options which expire are treated as realized gains. Premiums received from writing options which are exercised or closed are added to the proceeds or offset against amounts paid on the underlying future, security or currency transaction to determine the realized gain or loss. The Portfolio as a writer of an option has no control over whether the underlying future, security or currency may be sold (call) or purchased (put) and as a result bears the market risk of an unfavorable change in the price of the future, security or currency underlying the written option. There is the risk the Portfolio may not be able to enter into a closing transaction because of an illiquid market.
The Portfolio may also purchase put and call options. Purchasing call options tends to increase the Portfolio’s exposure to the underlying instrument. Purchasing put options tends to decrease the Portfolio’s exposure to the underlying instrument. The Portfolio pays a premium which is included in the Portfolio’s Statement of Assets and Liabilities as an investment and subsequently marked to market to reflect the current value of the option. Premiums paid for purchasing options which expire are treated as realized losses. The risk associated with purchasing put and call options is limited to the premium paid. Premiums paid for purchasing options which are exercised or closed are added to the amounts paid or offset against the proceeds on the underlying future, security or currency transaction to determine the realized gain or loss.
Swap Agreements. The Portfolio may invest in swap agreements. A swap is an agreement to exchange the return generated by one instrument for the return generated by another instrument. The Portfolio may enter into interest rate, total return, forward swap spread lock and credit default swap agreements to manage its exposure to interest rates and credit risk. Interest rate swap agreements involve the exchange by the Portfolio with another party of their respective commitments to pay or receive interest, e.g., an exchange of floating rate payments for fixed rate payments with respect to a notional amount of principal. Total return swap agreements involve commitments to pay interest in exchange for a market-linked return, both based on notional amounts. To the extent the total return of the security or index
11
underlying the transaction exceeds or falls short of the offsetting interest rate obligation, the Portfolio will receive a payment from or make a payment to the counterparty. Forward spread lock swap agreements involve commitments to pay or receive a settlement amount calculated as the difference between the swap spread and a fixed spread, multiplied by the notional amount times the duration of the swap. The swap spread is the difference between the benchmark swap rate (market rate) and the specific Treasury rate. In a credit default swap, one party makes a stream of payments to another party in exchange for the right to receive a specified return in the event of a default by a third party, typically corporate issues or sovereign issues of an emerging country, on its obligation. The Portfolio may use credit default swaps to provide a measure of protection against defaults of sovereign issuers (i.e., to reduce risk where the Portfolio owns or has exposure to the sovereign issuer) or to take an active long or short position with respect to the likelihood of a particular issuer’s default. Swaps are marked to market daily based upon quotations from market makers and vendors and the change in value, if any, is recorded as unrealized gain or loss in the Statement of Operations. Payments received or made at the beginning of the measurement period are reflected as such on the Statement of Assets and Liabilities. A liquidation payment received or made at the termination of the swap is recorded as realized gain or loss in the Statement of Operations. Net periodic payments are included as part of miscellaneous income on the Statement of Operations. Entering into these agreements involves, to varying degrees, elements of credit, market and documentation risk in excess of the amounts recognized on the Statement of Assets and Liabilities. Such risks involve the possibility that there will be no liquid market for these agreements, that the counterparty to the agreements may default on its obligation to perform or disagree as to the meaning of contractual terms in the agreements, and that there may be unfavorable changes in interest rates.
Delayed Delivery Transactions. The Portfolio may purchase or sell securities on a when-issued or delayed delivery basis. These transactions involve a commitment by the Portfolio to purchase or sell securities for a predetermined price or yield, with payment and delivery taking place beyond the customary settlement period. When delayed delivery purchases are outstanding, the Portfolio will set aside and maintain until the settlement date in a segregated account, liquid assets in an amount sufficient to meet the purchase price. When purchasing a security on a delayed delivery basis, the Portfolio assumes the rights and risks of ownership of the security, including the risk of price and yield fluctuations, and takes such fluctuations into account when determining its net asset value. The Portfolio may dispose of or renegotiate a delayed delivery transaction after it is entered into, and may sell when-issued securities before they are delivered, which may result in a capital gain or loss. When the Portfolio has sold a security on a delayed delivery basis, the Portfolio does not participate in future gains and losses with respect to the security.
Repurchase Agreements. The Portfolio may engage in repurchase transactions. Under the terms of a typical repurchase agreement, the Portfolio takes possession of an underlying debt obligation subject to an obligation of the seller to repurchase, and the Portfolio to resell, the obligation at an agreed-upon price and time. The market value of the collateral must be equal at all times to the total amount of the repurchase obligations, including interest. Generally, in the event of counterparty default, the Portfolio has the right to use the collateral to offset losses incurred.
3. Fees, Expenses, and Related Party Transactions
Investment Advisory Fee. Pacific Investment Management Company LLC (PIMCO) is a majority owned subsidiary partnership of Allianz Dresdner Asset Management of America L.P. (formerly PIMCO Advisors L.P.) and serves as investment adviser (the “Adviser”) to the Trust, pursuant to an investment advisory contract. The Adviser receives a monthly fee at an annual rate based on average daily net assets of the Portfolio. The Advisory Fee is charged at an annual rate of 0.45%.
Administration Fee. PIMCO serves as administrator (the “Administrator”) and provides administrative services to the Trust for which it receives a monthly administrative fee based on average daily net assets of the Portfolio. The Administration Fee is charged at the annual rate of 0.40%.
Servicing Fee. PIMCO Advisors Distributors LLC (“PAD”), is an indirect wholly-owned subsidiary of Allianz Dresdner Asset Management of America L.P. and serves as the distributor of the Trust’s shares. The Trust is permitted to reimburse PAD on a quarterly basis, out of the Administrative Class assets of the Portfolio in the amount of 0.15% on an annual basis of the average daily net assets of that class, for payments made to financial intermediaries that provide services in connection with the distribution of shares or administration of plans or programs that use Portfolio shares as their funding medium. The effective rate paid to PAD during the current fiscal year is 0.15%.
Expenses. The Portfolio is responsible for the following expenses: (i) salaries and other compensation of any of the Trust’s executive officers and employees who are not officers, directors, stockholders or employees of PIMCO or its subsidiaries or affiliates; (ii) taxes and governmental fees; (iii) brokerage fees and commissions and other portfolio transaction expenses; (iv) the cost of borrowing money, including interest expense; (v) fees and expenses of the Trustees who are not “interested persons” of PIMCO or the
12
Trust, and any counsel retained exclusively for their benefit; (vi) extraordinary expenses, including costs of litigation and indemnification expenses; (vii) organization expenses and (viii) any expenses allocated or allocable to a specific class of shares, which include service fees payable with respect to the Administrative Class shares and may include certain other expenses as permitted by the Trust’s Multiple Class Plan adopted pursuant to Rule 18f-3 under the Act and subject to review and approval by the Trustees. The ratio of expenses to average net assets per share class, as disclosed in the Financial Highlights, may differ from the annual Portfolio operating expenses per share class as disclosed in the Prospectus for the reasons set forth above. PIMCO has agreed to waive a portion of its administrative fees to the extent that the payment of the Portfolio’s pro rata share of Trustees’ fees causes the actual expense ratio to rise above the rates disclosed in the current prospectus plus 0.49 basis points as set forth below (calculated as a percentage of the Portfolio’s average daily net assets attributable to the class):
| | | Administrative
Class
| |
Emerging Markets Bond Portfolio | | 1.00 | % |
PIMCO may be reimbursed for these waived amounts in future periods. The Trust pays no compensation directly to any Trustee or any other officer who is affiliated with the Administrator, all of whom receive renumeration for their services to the Trust from the Administrator or its affiliates.
Each unaffiliated Trustee receives an annual retainer of $4,000, plus $1,500 for each Board of Trustees meeting attended in person and $250 for each meeting attended telephonically, plus reimbursement of related expenses. In addition, each committee chair receives an additional annual retainer of $500. These expenses are allocated on a pro-rata basis to each Portfolio of the Trust according to its respective net assets.
4. Purchases and Sales of Securities
Purchases and sales of securities (excluding short-term investments) for the period ended June 30, 2003 were as follows (amounts in thousands):
| | | U.S Government/Agency
| | All Other
|
| | | Purchases
| | Sales
| | Purchases
| | Sales
|
Emerging Markets Bond Portfolio | | $ | 3,443 | | $ | 3,376 | | $ | 80,950 | | $ | 78,192 |
5. Transactions in Written Call and Put Options
Transactions in written call and put options were as follows (amounts in thousands):
Emerging Markets Bond Portfolio
| |
| | | Premium
| |
Balance at 12/31/2002 | | $ | 6 | |
Sales | | | 0 | |
Closing Buys | | | (6 | ) |
Expirations | | | 0 | |
Exercised | | | 0 | |
| | |
|
|
|
Balance at 06/30/2003 | | $ | 0 | |
| | |
|
|
|
6. Federal Income Tax Matters
At June 30, 2003, the aggregate cost of investments was the same for federal income tax and financial statement purposes. The net unrealized appreciation (depreciation) of investments securities for federal income tax purposes is as follows (amounts in thousands):
| | | Aggregate Gross
Unrealized
Appreciation
| | Aggregate Gross
Unrealized
(Depreciation)
| | | Net
Unrealized
Appreciation
|
Emerging Markets Bond Portfolio | | $ | 2,217 | | $ | (354 | ) | | $ | 1,863 |
13
7. Shares of Beneficial Interest
The Trust may issue an unlimited number of shares of beneficial interest with a $.0001 par value. Changes in shares of beneficial interest were as follows (shares and amounts in thousands):
| | | Emerging Markets Bond Portfolio
| |
| | | Six Months Ended
06/30/2003
| | | Period from
09/30/2002 to
12/31/2002
| |
| | | Shares
| | | Amount
| | | Shares
| | | Amount
| |
Receipts for shares sold | | | | | | | | | | | | | | |
Administrative Class | | 1,014 | | | $ | 12,840 | | | 2,953 | | | $ | 30,695 | |
Issued as reinvestment of distributions Administrative Class | | 91 | | | | 1,165 | | | 42 | | | | 473 | |
Cost of shares redeemed Administrative Class | | (668 | ) | | | (8,276 | ) | | (140 | ) | | | (1,582 | ) |
| | |
|
| |
|
|
| |
|
| |
|
|
|
Net increase resulting from Portfolio share transactions | | 437 | | | $ | 5,729 | | | 2,855 | | | $ | 29,586 | |
| | |
|
| |
|
|
| |
|
| |
|
|
|
The following schedule shows the number of shareholders each owning 5% or more of the Portfolio and the total percentage of the Portfolio held by such shareholders:
| | | Number
| | % of Portfolio
Held
|
Emerging Markets Bond Portfolio | | | | |
Administrative Class | | 1 | | 99 |
14
Trustees and Officers
Brent R. Harris, Chairman and Trustee
R. Wesley Burns, President and Trustee
E. Philip Cannon, Trustee
Vern O. Curtis, Trustee
J. Michael Hagan, Trustee
William J. Popejoy, Trustee
Garlin G. Flynn, Secretary
John P. Hardaway, Treasurer
Investment Adviser and Administrator
Pacific Investment Management Company LLC
840 Newport Center Drive
Newport Beach, California 92660
Transfer Agent
National Financial Data Services
330 W. 9th Street, 4th Floor
Kansas City, Missouri 64105
Custodian
State Street Bank & Trust Company
801 Pennsylvania
Kansas City, Missouri 64105
Counsel
Dechert LLP
1775 I Street, N.W.
Washington, D.C. 20006
Independent Accountants
PricewaterhouseCoopers LLP
1055 Broadway
Kansas City, Missouri 64105
PIMCO VARIABLE INSURANCE TRUST
This report is submitted for the general information of the shareholders of the PIMCO Variable Insurance Trust. It is not authorized for distribution to prospective investors unless accompanied or preceded by an effective prospectus for the PIMCO Variable Insurance Trust, which contains information covering its investment policies as well as other pertinent information.
All Funds distributed by PIMCO ADVISORS DISTRIBUTORS LLC, member NASD
840 NEWPORT CENTER DRIVE
NEWPORT BEACH, CA 92660
800.927.4648
WWW.PIMCOADVISORS.COM
WWW.PIMCO.COM
| P I M C O |
| PIMCO VARIABLE INSURANCE TRUST |
| REAL RETURN PORTFOLIO |
| ADMINISTRATIVE CLASS |
|
| SEMI-ANNUAL REPORT |
| June 30, 2003 |
Contents
| | | Fund Summary
| | Schedule of Investments
|
Real Return Portfolio (Administrative Class) | | 2 | | 8 |
Chairman’s Letter
Dear PIMCO Variable Insurance Trust Shareholder:
Financial assets gained during the first half of 2003 amid a revival of risk appetites as anxiety about the war in Iraq faded. Assets that generally benefit from economic growth, such as stocks, corporate bonds and emerging market debt, fared the best year-to-date as investors returned to these sectors in anticipation of a recovery in the second half of 2003. Reflationary forces that investors expected to fuel a rebound included federal tax cuts and a weak dollar, as well as low borrowing rates that eased the burden of high personal and corporate indebtedness. Low mortgage rates kept refinancings booming in the second quarter and put more money in consumers’ pockets.
U.S. Treasuries lagged their riskier counterparts but still enjoyed a modest rally. Yields fell to levels not seen in 45 years early in the second quarter before bouncing off their lows in June as hopes for recovery increased. The yield on the benchmark 10-year Treasury closed the six-month period 0.30% lower to 3.51%, after nearing 3% earlier in the period. Buyers were encouraged that inflation would remain tame amid low capacity utilization and weak employment growth. Asian central banks bought U.S. Treasuries to limit the rise in their currencies versus the dollar in an effort to protect their export industries. In June, the Federal Reserve cut the federal funds rate by 0.25% to 1%, its 13th easing since 2001, in an effort to boost the economy and ward off deflation. Although the cut was less than expected, the Fed suggested that rates would stay low until deflation risks abated.
On the following pages you will find specific details as to the Portfolio’s total return investment performance and a discussion of those factors that affected performance.
We appreciate the trust you have placed in us, and we will continue to focus our efforts to meet your investment needs.
Sincerely,

Brent R. Harris
Chairman
July 31, 2003
1
Real Return Portfolio
TOTAL RETURN INVESTMENT PERFORMANCE For the period ended June 30, 2003
| | | 1 Year | | | Since Inception* | |
Real Return Portfolio Administrative Class | | 17.07 | % | | 12.84 | % |
Lehman Brothers Global Real: U.S. TIPS Index | | 15.39 | % | | — | |
| * | | Annualized (All Portfolio returns are net of fees and expenses) |
CUMULATIVE RETURNS THROUGH JUNE 30, 2003
$10,000 invested at inception
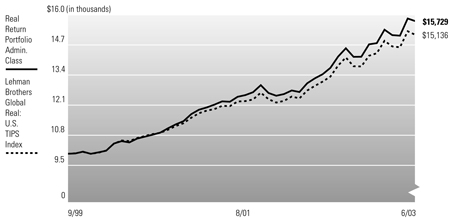
Past performance is no guarantee of future results. Investment return and principal value will fluctuate so that Portfolio shares, when redeemed, may be worth more or less than their original cost. The line graph above assumes the investment of $10,000 on 10/01/1999, the first full month following the Portfolio’s Administrative Class inception on 9/30/1999, compared to the Lehman Brothers Global Real: U.S. TIPS Index, an unmanaged market index, formerly the Lehman Brothers Inflation Linked Treasury Index. It is not possible to invest directly in the Index. The Portfolio may invest in foreign securities which involve potentially higher risks including foreign currency fluctuations and political or economic uncertainty. These risks may be enhanced when investing in emerging markets. Treasury Inflation Protection Securities (TIPS) are guaranteed by the U.S. government (for timely payment of principal and interest), however, shares of the Portfolio are not.
PORTFOLIO INSIGHTS
| • | | The Real Return Portfolio seeks to achieve its investment objective by investing under normal circumstances at least 65% of its total assets in inflation-indexed bonds of varying maturities issued by the U.S. and non-U.S. governments, their agencies or government-sponsored enterprises and corporations. |
| • | | For the six months ended June 30, 2003, the Administrative Class shares of the Portfolio returned 6.80%, outperforming the 6.34% return of the Lehman Brothers Global Real: U.S. TIPS Index. |
| • | | For the six month period, real yields decreased by 0.50%, compared to 0.37% for conventional U.S. Treasury issues of similar maturities. |
| • | | Breakeven inflation, defined as the difference between a real yield on a TIPS and a nominal yield on a Treasury of the same maturity, was 1.69% at June 30, 2003 for the 10-year maturity. This compares to a breakeven yield of 1.57% on December 31, 2002. The 12-month CPI-U change for the period ending June 30, 2003, was 2.11%. |
| • | | The effective duration of the Portfolio was 6.9 years on June 30, 2003, compared to a duration of 7.5 years for the benchmark. |
| • | | The Portfolio’s duration was lower than the benchmark for most of the period, which was negative for performance as real yields dropped. |
| • | | The Portfolio was overweight on the front end of the yield curve during the period, which benefited performance. |
| • | | The Portfolio’s yield was improved by using a combination of TIPS buy-forward agreements and low duration, high quality conventional yield debt instruments. The steepness of the real yield curve made this an attractive option for the Portfolio. |
2
Financial Highlights
Real Return Portfolio (Administrative Class)
Selected Per Share Data for the Year or Period
Ended: | | 06/30/2003 +
| | | 12/31/2002
| | | 12/31/2001
| | | 12/31/2000
| | | 09/30/1999-12/31/1999
| |
Net asset value beginning of period | | $ | 11.90 | | | $ | 10.56 | | | $ | 10.34 | | | $ | 9.80 | | | $ | 10.00 | |
Net investment income (a) | | | 0.29 | | | | 0.48 | | | | 0.61 | | | | 0.64 | | | | 0.20 | |
Net realized/unrealized gain (loss) on investments (a) | | | 0.51 | | | | 1.36 | | | | 0.38 | | | | 0.69 | | | | (0.20 | ) |
Total income from investment operations | | | 0.80 | | | | 1.84 | | | | 0.99 | | | | 1.33 | | | | 0.00 | |
Dividends from net investment income | | | (0.28 | ) | | | (0.48 | ) | | | (0.63 | ) | | | (0.79 | ) | | | (0.20 | ) |
Distributions from net realized capital gains | | | 0.00 | | | | (0.02 | ) | | | (0.14 | ) | | | 0.00 | | | | 0.00 | |
Total distributions | | | (0.28 | ) | | | (0.50 | ) | | | (0.77 | ) | | | (0.79 | ) | | | (0.20 | ) |
Net asset value end of period | | $ | 12.42 | | | $ | 11.90 | | | $ | 10.56 | | | $ | 10.34 | | | $ | 9.80 | |
Total return | | | 6.80 | % | | | 17.77 | % | | | 9.63 | % | | | 14.11 | % | | | (0.03 | )% |
Net assets end of period (000s) | | $ | 184,513 | | | $ | 90,724 | | | $ | 7,406 | | | $ | 448 | | | $ | 3,000 | |
Ratio of expenses to average net assets | | | 0.65 | %* | | | 0.66 | %(d) | | | 0.66 | %(c)(d) | | | 0.65 | % | | | 0.65 | %(b)* |
Ratio of net investment income to average net assets | | | 4.76 | %* | | | 4.19 | % | | | 5.63 | % | | | 6.69 | % | | | 7.72 | %* |
Portfolio turnover rate | | | 169 | % | | | 87 | % | | | 58 | % | | | 18 | % | | | 23 | % |
| (a) | | Per share amounts based on average number of shares outstanding during the period. |
| (b) | | If the investment manager had not reimbursed expenses, the ratio of operating expenses to average net assets would have been 0.92% for the period ended December 31, 1999. |
| (c) | | If the investment manager had not reimbursed expenses, the ratio of operating expenses to average net assets would have been 0.67% for the year ended December 31, 2001. |
| (d) | | Ratio of expenses to average net assets excluding interest expense is 0.65%. |
See accompanying notes
3
Statement of Assets and Liabilities
Real Return Portfolio
June 30, 2003 (Unaudited)
Amounts in thousands, except per share amounts
Assets: | | | | |
Investments, at value | | $ | 405,422 | |
Cash | | | 1,464 | |
Receivable for investments sold | | | 527 | |
Receivable for Portfolio shares sold | | | 36 | |
Interest receivable | | | 1,034 | |
| | |
|
|
|
| | | | 408,483 | |
| | |
|
|
|
Liabilities: | | | | |
Payable for investments purchased | | $ | 195,174 | |
Payable for short sale | | | 520 | |
Written options outstanding | | | 112 | |
Accrued investment advisory fee | | | 41 | |
Accrued administration fee | | | 41 | |
Accrued servicing fee | | | 19 | |
Variation margin payable | | | 38 | |
Other liabilities | | | 1,500 | |
| | |
|
|
|
| | | | 197,445 | |
| | |
|
|
|
Net Assets | | $ | 211,038 | |
| | |
|
|
|
Net Assets Consist of: | | | | |
Paid in capital | | $ | 201,248 | |
Undistributed net investment income | | | 110 | |
Accumulated undistributed net realized gain | | | 10,536 | |
Net unrealized (depreciation) | | | (856 | ) |
| | |
|
|
|
| | | $ | 211,038 | |
| | |
|
|
|
Net Assets: | | | | |
Institutional Class | | $ | 26,525 | |
Administrative Class | | | 184,513 | |
Shares Issued and Outstanding: | | | | |
Institutional Class | | | 2,135 | |
Administrative Class | | | 14,854 | |
Net Asset Value and Redemption Price Per Share (Net Assets Per Share Outstanding) | | | | |
Institutional Class | | $ | 12.42 | |
Administrative Class | | | 12.42 | |
Cost of Investments Owned | | $ | 406,407 | |
See accompanying notes
4
Statement of Operations
Real Return Portfolio
For the six months ended June 30, 2003 (Unaudited)
Amounts in thousands
Investment Income: | | | | |
Interest | | $ | 3,906 | |
Miscellaneous income | | | 1 | |
| | |
|
|
|
Total Income | | | 3,907 | |
| | |
|
|
|
Expenses: | | | | |
Investment advisory fees | | | 179 | |
Administration fees | | | 179 | |
Distribution and/or servicing fees - Administrative Class | | | 100 | |
Trustees’ fees | | | 1 | |
| | |
|
|
|
Total Expenses | | | 459 | |
| | |
|
|
|
Net Investment Income | | | 3,448 | |
| | |
|
|
|
Net Realized and Unrealized Gain (Loss): | | | | |
Net realized gain on investments | | | 10,697 | |
Net realized (loss) on futures contracts, written options, and swaps | | | (90 | ) |
Net change in unrealized (depreciation) on investments | | | (4,606 | ) |
Net change in unrealized appreciation on futures contracts, written options, and swaps | | | 119 | |
Net Gain | | | 6,120 | |
| | |
|
|
|
Net Increase in Assets Resulting from Operations | | $ | 9,568 | |
| | |
|
|
|
See accompanying notes
5
Statements of Changes in Net Assets
Real Return Portfolio
Amounts in thousands
| Increase (Decrease) in Net Assets from: | | Six Months Ended
June 30, 2003
| | | Year Ended
December 31, 2002
| |
| | | (Unaudited) | | | | |
Operations: | | | | | | | | |
Net investment income | | $ | 3,448 | | | $ | 1,329 | |
Net realized gain | | | 10,607 | | | | 231 | |
Net change in unrealized appreciation (depreciation) | | | (4,487 | ) | | | 3,524 | |
| | |
|
|
| |
|
|
|
Net increase resulting from operations | | | 9,568 | | | | 5,084 | |
| | |
|
|
| |
|
|
|
Distributions to Shareholders: | | | | | | | | |
From net investment income | | | | | | | | |
Institutional Class | | | (271 | ) | | | (1 | ) |
Administrative Class | | | (3,229 | ) | | | (1,328 | ) |
From net realized capital gains | | | | | | | | |
Institutional Class | | | 0 | | | | 0 | |
Administrative Class | | | 0 | | | | (140 | ) |
| | |
|
|
| |
|
|
|
Total Distributions | | | (3,500 | ) | | | (1,469 | ) |
| | |
|
|
| |
|
|
|
Portfolio Share Transactions: | | | | | | | | |
Receipts for shares sold | | | | | | | | |
Institutional Class | | | 25,391 | | | | 0 | |
Administrative Class | | | 107,172 | | | | 88,409 | |
Issued as reinvestment of distributions | | | | | | | | |
Institutional Class | | | 271 | | | | 1 | |
Administrative Class | | | 3,229 | | | | 1,468 | |
Cost of shares redeemed | | | | | | | | |
Institutional Class | | | (17 | ) | | | 0 | |
Administrative Class | | | (21,816 | ) | | | (10,173 | ) |
| | |
|
|
| |
|
|
|
Net increase resulting from Portfolio share transactions | | | 114,230 | | | | 79,705 | |
| | |
|
|
| |
|
|
|
Total Increase in Net Assets | | | 120,298 | | | | 83,320 | |
| | |
|
|
| |
|
|
|
Net Assets: | | | | | | | | |
Beginning of period | | | 90,740 | | | | 7,420 | |
End of period* | | $ | 211,038 | | | $ | 90,740 | |
*Including undistributed net investment income of: | | $ | 110 | | | $ | 162 | |
See accompanying notes
6
Statement of Cash Flows
Real Return Portfolio
For six months ended June 30, 2003 (Unaudited)
Amounts in thousands
Increase (Decrease) in Cash from:
Financing Activities: | | | | |
Sales of Portfolio shares | | $ | 132,834 | |
Redemptions of Portfolio shares | | | (21,879 | ) |
Proceeds from financing transactions | | | (76,275 | ) |
| | |
|
|
|
Net increase from financing activities | | | 34,680 | |
| | |
|
|
|
Operating Activities: | | | | |
Purchases of long-term securities and foreign currency | | | (195,488 | ) |
Proceeds from sales of long-term securities and foreign currency | | | 270,940 | |
Purchases of short-term securities (net) | | | (115,066 | ) |
Net investment income | | | 3,448 | |
Change in other receivables/payables (net) | | | 2,949 | |
| | |
|
|
|
Net (decrease) from operating activities | | | (33,217 | ) |
| | |
|
|
|
Net Increase in Cash | | | 1,463 | |
| | |
|
|
|
Cash: | | | | |
Beginning of period | | | 1 | |
End of period | | $ | 1,464 | |
See accompanying notes
7
Schedule of Investments
Real Return Portfolio
June 30, 2003 (Unaudited)
| | | Principal Amount (000s)
| | Value (000s)
| |
CORPORATE BONDS & NOTES 5.3% | | | | | | | |
Banking & Finance 4.0% | | | | | | | |
CIT Group, Inc. | | | | | | | |
2.540% due 01/09/2004 (a) | | $ | 2,300 | | $ | 2,312 | |
Ford Motor Credit Co. | | | | | | | |
3.195% due 10/25/2004 (a) | | | 200 | | | 201 | |
1.769% due 07/18/2005 (a) | | | 200 | | | 193 | |
General Motors Acceptance Corp. | | | | | | | |
1.630% due 08/04/2003 (a) | | | 200 | | | 200 | |
2.049% due 01/20/2004 (a) | | | 1,600 | | | 1,599 | |
Phoenix Quake Ltd. | | | | | | | |
3.515% due 07/03/2008 | | | 2,000 | | | 1,998 | |
Residential Reinsurance Ltd. | | | | | | | |
6.230% due 06/08/2006 (a) | | | 1,000 | | | 1,001 | |
Studio Re Ltd. | | | | | | | |
6.378% due 07/07/2006 (a) | | | 750 | | | 752 | |
Travelers Property Casualty Corp. | | | | | | | |
3.750% due 03/15/2008 | | | 100 | | | 103 | |
| | | | | |
|
|
|
| | | | | | | 8,359 | |
| | | | | |
|
|
|
Industrials 0.4% | | | | | | | |
DaimlerChrysler North America Holding Corp. | | | | | | | |
7.750% due 06/15/2005 | | | 100 | | | 109 | |
Pemex Project Funding Master Trust | | | | | | | |
7.375% due 12/15/2014 | | | 500 | | | 549 | |
8.625% due 02/01/2022 | | | 200 | | | 229 | |
| | | | | |
|
|
|
| | | | | | | 887 | |
| | | | | |
|
|
|
Utilities 0.9% | | | | | | | |
British Telecom PLC | | | | | | | |
2.413% due 12/15/2003 (a) | | | 300 | | | 301 | |
Cleveland Electric Illuminating Co. | | | | | | | |
6.860% due 10/01/2008 | | | 100 | | | 115 | |
Entergy Gulf States, Inc. | | | | | | | |
2.040% due 06/18/2007 | | | 1,500 | | | 1,500 | |
| | | | | |
|
|
|
| | | | | | | 1,916 | |
| | | | | |
|
|
|
Total Corporate Bonds & Notes
(Cost $11,092) | | | | | | 11,162 | |
| | | | | |
|
|
|
U.S. TREASURY OBLIGATIONS 99.3% | | | | | | | |
Treasury Inflation Protected Securities (c) | | | | | | | |
3.375% due 01/15/2007 | | | 2,897 | | | 3,182 | |
3.625% due 01/15/2008 | | | 40,234 | | | 45,150 | |
3.875% due 01/15/2009 | | | 21,267 | | | 24,364 | |
4.250% due 01/15/2010 | | | 36,826 | | | 43,351 | |
3.500% due 01/15/2011 | | | 3,691 | | | 4,194 | |
3.375% due 01/15/2012 | | | 2,068 | | | 2,340 | |
3.000% due 07/15/2012 | | | 25,842 | | | 28,487 | |
3.625% due 04/15/2028 | | | 15,845 | | | 19,318 | |
3.875% due 04/15/2029 | | | 30,709 | | | 39,188 | |
| | | | | |
|
|
|
Total U.S. Treasury Obligations
(Cost $210,872) | | | | | | 209,574 | |
| | | | | |
|
|
|
MORTGAGE-BACKED SECURITIES 0.0% | | | | | | | |
Fannie Mae 0.0% | | | | | | | |
4.497% due 11/01/2024 (a) | | | 26 | | | 26 | |
| | | | | |
|
|
|
Total Mortgage-Backed Securities
(Cost $26) | | | | | | 26 | |
| | | | | |
|
|
|
ASSET-BACKED SECURITIES 0.9% | | | | | | | |
Bear Stearns Asset-Backed Securities, Inc. | | | | | | | |
1.470% due 07/25/2033 (g) | | | 2,000 | | | 1,999 | |
| | | | | |
|
|
|
Total Asset-Backed Securities
(Cost $2,000) | | | | | | 1,999 | |
| | | | | |
|
|
|
SOVEREIGN ISSUES 2.8% | | | | | | | |
Republic of Brazil | | | | | | | |
2.125% due 04/15/2006 (a) | | | 192 | | | 180 | |
2.187% due 04/15/2009 (a) | | | 141 | | | 119 | |
8.000% due 04/15/2014 | | | 616 | | | 541 | |
11.000% due 08/17/2040 | | | 200 | | | 181 | |
Republic of Colombia | | | | | | | |
10.000% due 01/23/2012 | | | 2,100 | | | 2,357 | |
Republic of Italy | | | | | | | |
1.175% due 10/22/2003 | | | 1,800 | | | 1,794 | |
United Mexican States | | | | | | | |
6.375% due 01/16/2013 | | | 700 | | | 744 | |
| | | | | |
|
|
|
Total Sovereign Issues
(Cost $5,664) | | | | | | 5,916 | |
| | | | | |
|
|
|
PURCHASED CALL OPTIONS 0.0% | | | | | | | |
U.S. Treasury Note September Futures (CBOT) | | | | | | | |
Strike @ 132.000 Exp. 08/23/2003 | | | 7,000 | | | 1 | |
| | | | | |
|
|
|
Total Purchased Call Options
(Cost $1) | | | | | | 1 | |
| | | | | |
|
|
|
PURCHASED PUT OPTIONS 0.0% | | | | | | | |
Treasury Inflated Protected Securities (OTC) | | | | | | | |
3.875% due 01/15/2009 | | | | | | | |
Strike @ 99.000 Exp. 08/06/2003 | | | 10,000 | | | 0 | |
| | | | | |
|
|
|
Total Purchased Put Options
(Cost $2) | | | | | | 0 | |
| | | | | |
|
|
|
SHORT-TERM INSTRUMENTS 83.8% | | | | | | | |
Commercial Paper 81.9% | | | | | | | |
ABN AMRO Mortgage Corp. | | | | | | | |
1.240% due 07/02/2003 | | | 5,000 | | | 5,000 | |
Anz, Inc. | | | | | | | |
1.225% due 07/30/2003 | | | 5,200 | | | 5,195 | |
Barclays U.S. Funding Corp. | | | | | | | |
0.920% due 09/22/2003 | | | 6,000 | | | 5,985 | |
CBA Finance, Inc. | | | | | | | |
1.220% due 07/08/2003 | | | 3,700 | | | 3,699 | |
1.220% due 08/01/2003 | | | 1,000 | | | 999 | |
Danske Corp. | | | | | | | |
1.230% due 07/07/2003 | | | 7,500 | | | 7,498 | |
1.240% due 07/28/2003 | | | 5,000 | | | 4,995 | |
Fannie Mae | | | | | | | |
0.950% due 07/01/2003 | | | 15,000 | | | 15,000 | |
1.130% due 09/03/2003 | | | 10,000 | | | 9,981 | |
0.980% due 09/10/2003 | | | 10,000 | | | 9,979 | |
0.900% due 09/17/2003 | | | 8,000 | | | 7,982 | |
0.990% due 09/17/2003 | | | 12,000 | | | 11,973 | |
0.980% due 09/24/2003 | | | 12,000 | | | 11,970 | |
Federal Home Loan Bank | | | | | | | |
0.950% due 07/01/2003 | | | 15,000 | | | 15,000 | |
1.205% due 07/16/2003 | | | 1,600 | | | 1,599 | |
0.970% due 07/25/2003 | | | 8,900 | | | 8,894 | |
1.165% due 08/01/2003 | | | 8,200 | | | 8,192 | |
1.150% due 10/29/2003 | | | 8,300 | | | 8,271 | |
Freddie Mac | | | | | | | |
1.170% due 07/10/2003 | | | 1,200 | | | 1,200 | |
1.195% due 07/17/2003 | | | 800 | | | 800 | |
General Electric Capital Corp. | | | | | | | |
1.250% due 07/23/2003 | | | 300 | | | 300 | |
1.200% due 08/21/2003 | | | 300 | | | 299 | |
HBOS Treasury Services PLC | | | | | | | |
0.960% due 08/01/2003 | | | 4,000 | | | 3,997 | |
1.210% due 08/28/2003 | | | 1,500 | | | 1,497 | |
Royal Bank of Scotland PLC | | | | | | | |
1.220% due 07/16/2003 | | | 3,000 | | | 2,998 | |
1.230% due 08/06/2003 | | | 500 | | | 499 | |
Svenska Handelsbank, Inc. | | | | | | | |
1.250% due 07/07/2003 | | | 5,000 | | | 4,999 | |
UBS Finance, Inc. | | | | | | | |
0.930% due 09/18/2003 | | | 6,000 | | | 5,986 | |
0.920% due 09/24/2003 | | | 200 | | | 200 | |
Westpac Trust Securities Ltd. | | | | | | | |
1.200% due 07/02/2003 | | | 6,000 | | | 6,000 | |
1.200% due 07/09/2003 | | | 1,900 | | | 1,900 | |
| | | | | |
|
|
|
| | | | | | | 172,887 | |
| | | | | |
|
|
|
Repurchase Agreement 1.0% | | | | | | | |
State Street Bank | | | | | | | |
0.800% due 07/01/2003 | | | 2,068 | | | 2,068 | |
(Dated 06/30/2003. Collateralized by Fannie Mae 1.910% due 04/29/2005 valued at $2,113. Repurchase proceeds are $2,068.) | | | | | | | |
| | | | | |
|
|
|
U.S. Treasury Bills 0.9% | | | | | | | |
1.021% due 08/07/2003-08/14/2003 (b)(d) | | | 1,790 | | | 1,789 | |
| | | | | |
|
|
|
Total Short-Term Instruments
(Cost $176,750) | | | | | | 176,744 | |
| | | | | |
|
|
|
Total Investments 192.1%
(Cost $406,407) | | | | | $ | 405,422 | |
Written Options (e) (0.1%)
(Premiums $92) | | | | | | (112 | ) |
Other Assets and Liabilities (Net) (92.0%) | | | | | | (194,272 | ) |
| | | | | |
|
|
|
Net Assets 100.0% | | | | | $ | 211,038 | |
| | | | | |
|
|
|
Notes to Schedule of Investments
(amounts in thousands, except number of contracts):
| (a) | | Variable rate security. The rate listed is as of June 30, 2003. |
| (b) | | Securities with an aggregate market value of $689 have been segregated with the custodian to cover margin requirements for the following open futures contracts at June 30, 2003: |
Type
| | # of Contracts
| | Unrealized Appreciation
|
U.S. Treasury 10 Year Note (09/2003 ) - Short | | 100 | | $ | 140 |
| | | | |
|
|
| (c) | | Principal amount of security is adjusted for inflation. |
| (d) | | Securities are grouped by coupon or range of coupons and represent a range of maturities. |
| (e) | | Premiums received on written options: |
Type
| | # of Contracts
| | Premium
| | Value
|
Call - CBOT U.S. Treasury Note September Futures | | | | | | | | |
Strike @ 116.000 Exp. 08/23/2003 | | 52 | | $ | 46 | | $ | 110 |
Call - CBOT U.S. Treasury Note September Futures | | | | | | | | |
Strike @ 110.000 Exp. 08/23/2003 | | 55 | | | 46 | | | 2 |
| | | | |
|
| |
|
|
| | | | | $ | 92 | | $ | 112 |
| | | | |
|
| |
|
|
| (f) | | Short sales open at June 30, 2003 were as follows: |
Type
| | Coupon (%)
| | Maturity
| | Par
| | Value
| | Proceeds
|
U.S. Treasury Note | | 4.000 | | 11/15/2012 | | $ | 500 | | $ | 520 | | $ | 527 |
| | | | | | | | | |
|
| |
|
|
| (g) | | Indicates a fair valued security which has not been valued utilizing an independent quote and which is valued pursuant to guidelines established by the Trustees. The aggregate value of fair valued securities is $1,999, which is 0.9% of net assets. |
See accompanying notes
8
Notes to Financial Statements
June 30, 2003 (Unaudited)
1. Organization
The Real Return Portfolio (the “Portfolio”) is a series of the PIMCO Variable Insurance Trust (the “Trust”). The Trust is registered under the Investment Company Act of 1940 (the “Act”), as amended, as an open-end investment company organized as a Delaware business trust on October 3, 1997. The Trust may offer up to two classes of shares: Institutional and Administrative. Each share class has identical voting rights (except that shareholders of a class have exclusive voting rights regarding any matter relating solely to that class of shares). Information presented in these financial statements pertains to the Administrative Class of the Trust. Certain detailed financial information for the Institutional Class is provided separately and is available upon request. The Trust is designed to be used as an investment vehicle by Separate Accounts of insurance companies that fund variable annuity contracts and variable life insurance policies and by qualified pension and retirement plans. The Portfolio commenced operations on September 30, 1999.
2. Significant Accounting Policies
The following is a summary of significant accounting policies consistently followed by the Trust in the preparation of its financial statements in conformity with accounting principles generally accepted in the United States of America. The preparation of financial statements in accordance with accounting principles generally accepted in the United States of America requires management to make estimates and assumptions that affect the reported amounts and disclosures in the financial statements. Actual results could differ from those estimates.
Security Valuation. Portfolio securities and other financial instruments for which market quotations are readily available are stated at market value. Market value is determined at the close of regular trading (normally, 4:00 p.m., Eastern Time) on the New York Stock Exchange on each day the New York Stock Exchange is open, or if no sales are reported, as is the case for most securities traded over-the-counter, the mean between representative bid and asked quotations obtained from a quotation reporting system or from established market makers. Fixed income securities, including those to be purchased under firm commitment agreements, are normally valued on the basis of quotes obtained from brokers and dealers or pricing services. Short-term investments, which mature in 60 days or less are valued at amortized cost, which approximates market value. Certain fixed income securities for which daily market quotations are not readily available may be valued, pursuant to guidelines established by the Board of Trustees, with reference to fixed income securities whose prices are more readily obtainable. Prices may be obtained from independent pricing services which use information provided by market makers or estimates of market values obtained from yield data relating to investments or securities with similar characteristics. The prices used by the Portfolio may differ from the value that would be realized if the securities were sold and the differences could be material to the financial statements.
Securities Transactions and Investment Income. Securities transactions are recorded as of the trade date. Securities purchased or sold on a when-issued or delayed delivery basis may be settled a month or more after the trade date. Realized gains and losses from securities sold are recorded on the identified cost basis. Dividend income is recorded on the ex-dividend date, except certain dividends from foreign securities where the ex-dividend date may have passed, are recorded as soon as the Portfolio is informed of the ex-dividend date. Interest income, adjusted for the accretion of discounts and amortization of premiums, is recorded on the accrual basis. Paydowns gains and losses on mortgage- and asset-backed securities are recorded as adjustments to interest income in the Statement of Operations.
Dividends and Distributions to Shareholders. Dividends from net investment income, if any, are declared on each day the Trust is open for business and are distributed to shareholders monthly. All dividends are reinvested in additional shares of the Portfolio. Net realized capital gains earned by the Portfolio, if any, will be distributed no less frequently than once each year.
Income dividends and capital gain distributions are determined in accordance with income tax regulations which may differ from accounting principles generally accepted in the United States of America. These differences are primarily due to differing treatments for such items as wash sales, foreign currency transactions, net operating losses and capital loss carryforwards.
Distributions classified as a tax basis return of capital, if any, are reflected in the accompanying Statements of Changes in Net Assets and have been reclassified to paid in capital. In addition, other amounts have been reclassified between undistributed net investment income, accumulated undistributed net realized gains or losses and/or paid in capital to more appropriately conform financial accounting to tax characterizations of dividend distributions.
Foreign Currency. The accounting records of the Portfolio are maintained in U.S. dollars. The market values of foreign securities, currency holding and other assets and liabilities are translated into U.S. dollars based on the current exchange rates each business day. Fluctuations in the value of these assets and liabilities resulting from changes in exchange rates are recorded as unrealized foreign currency gains or losses. Realized gains or losses and unrealized appreciation (depreciation) on investment securities and income and expenses are translated on the respective dates of such transactions. The effect of changes in foreign currency exchange rates on investments in securities are not
9
segregated in the Statement of Operations from the effects of changes in market prices of those securities, but are included with the net realized and unrealized gain or loss on investment securities.
Multiclass Operations. Each class offered by the Trust has equal rights as to assets. Income, non-class specific expenses, and realized and unrealized capital gains and losses are allocated to each class of shares based on the relative net assets of each class.
Federal Income Taxes. The Portfolio intends to qualify as a regulated investment company and distribute all of its taxable income and net realized gains, if applicable, to shareholders. Accordingly, no provision for Federal income taxes has been made.
Financing Transactions. The Portfolio may enter into financing transactions consisting of the sale by the Portfolio of securities, together with a commitment to repurchase similar securities at a future date. The difference between the selling price and the future purchase price is an adjustment to interest income in the Statement of Operations. If the counterparty to whom the Portfolio sells the security becomes insolvent, the Portfolio’s right to repurchase the security may be restricted; the value of the security may change over the term of the financing transaction; and the return earned by the Portfolio with the proceeds of a financing transaction may not exceed transaction costs. The Portfolio will designate assets determined to be liquid by PIMCO or otherwise cover its obligations under financing transactions.
Futures Contracts. The Portfolio is authorized to enter into futures contracts. The Portfolio may use futures contracts to manage its exposure to the securities markets or to movements in interest rates and currency values. The primary risks associated with the use of futures contracts are imperfect correlation between the change in market value of the securities held by the Portfolio and the prices of futures contracts, the possibility of an illiquid market, and the inability of the counterparty to meet the terms of the contract. Futures contracts are valued based upon their quoted daily settlement prices. Upon entering into a futures contract, the Portfolio may be required to deposit with its custodian, in a segregated account in the name of the futures broker, an amount of cash or U.S. Government and Agency Obligations in accordance with the initial margin requirements of the broker or exchange. Futures contracts are marked to market daily and an appropriate payable or receivable for the change in value (“variation margin”) is recorded by the Portfolio. Gains or losses are recognized but not considered realized until the contracts expire or are closed. Futures contracts involve, to varying degrees, risk of loss in excess of the variation margin disclosed in the Statement of Assets and Liabilities.
Options Contracts. The Portfolio may write call and put options on futures, securities or currencies it owns or in which it may invest. Writing put options tends to increase the Portfolio’s exposure to the underlying instrument. Writing call options tends to decrease the Portfolio’s exposure to the underlying instrument. When the Portfolio writes a call or put option, an amount equal to the premium received is recorded as a liability and subsequently marked to market to reflect the current value of the option written. Payment received or made, if any, from writing options with premiums to be determined on a future date are reflected as such on the Statement of Assets and Liabilities. Premiums received from writing options which expire are treated as realized gains. Premiums received from writing options which are exercised or closed are added to the proceeds or offset against amounts paid on the underlying future, security or currency transaction to determine the realized gain or loss. The Portfolio as a writer of an option has no control over whether the underlying future, security or currency may be sold (call) or purchased (put) and as a result bears the market risk of an unfavorable change in the price of the future, security or currency underlying the written option. There is the risk the Portfolio may not be able to enter into a closing transaction because of an illiquid market.
The Portfolio may also purchase put and call options. Purchasing call options tends to increase the Portfolio’s exposure to the underlying instrument. Purchasing put options tends to decrease the Portfolio’s exposure to the underlying instrument. The Portfolio pays a premium which is included in the Portfolio’s Statement of Assets and Liabilities as an investment and subsequently marked to market to reflect the current value of the option. Premiums paid for purchasing options which expire are treated as realized losses. The risk associated with purchasing put and call options is limited to the premium paid. Premiums paid for purchasing options which are exercised or closed are added to the amounts paid or offset against the proceeds on the underlying future, security or currency transaction to determine the realized gain or loss.
Delayed Delivery Transactions. The Portfolio may purchase or sell securities on a when-issued or delayed delivery basis. These transactions involve a commitment by the Portfolio to purchase or sell securities for a predetermined price or yield, with payment and delivery taking place beyond the customary settlement period. When delayed delivery purchases are outstanding, the Portfolio will set aside and maintain until the settlement date in a segregated account, liquid assets in an amount sufficient to meet the purchase price. When purchasing a security on a delayed delivery basis, the Portfolio assumes the rights and risks of ownership of the security, including the risk of price and yield fluctuations, and takes such fluctuations into account when determining its net asset value. The Portfolio may dispose of or renegotiate a delayed delivery transaction after it is entered into, and may sell
10
when-issued securities before they are delivered, which may result in a capital gain or loss. When the Portfolio has sold a security on a delayed delivery basis, the Portfolio does not participate in future gains and losses with respect to the security.
Inflation-Indexed Bonds. Inflation-indexed bonds are fixed income securities whose principal value is periodically adjusted to the rate of inflation. The interest rate on these bonds is generally fixed at issuance at a rate lower than typical bonds. Over the life of an inflation-indexed bond, however, interest will be paid based on a principal value, which is adjusted for inflation. Any increase in the principal amount of an inflation-indexed bond will be included as interest income in the Statement of Operations, even though investors do not receive their principal until maturity.
Repurchase Agreements. The Portfolio may engage in repurchase transactions. Under the terms of a typical repurchase agreement, the Portfolio takes possession of an underlying debt obligation subject to an obligation of the seller to repurchase, and the Portfolio to resell, the obligation at an agreed-upon price and time. The market value of the collateral must be equal at all times to the total amount of the repurchase obligations, including interest. Generally, in the event of counterparty default, the Portfolio has the right to use the collateral to offset losses incurred.
Short Sales. The Portfolio has entered into short sales transactions during the fiscal year. A short sale is a transaction in which a Portfolio sells securities it does not own in anticipation of a decline in the market price of the securities. The Portfolio is obligated to deliver securities at the market price at the time the short position is closed. Possible losses from short sales may be unlimited, whereas losses from purchases cannot exceed the total amount invested.
3. Fees, Expenses, and Related Party Transactions
Investment Advisory Fee. Pacific Investment Management Company LLC (PIMCO) is a majority owned subsidiary partnership of Allianz Dresdner Asset Management of America L.P. (formerly PIMCO Advisors L.P.) and serves as investment adviser (the “Adviser”) to the Trust, pursuant to an investment advisory contract. The Adviser receives a monthly fee at an annual rate based on average daily net assets of the Portfolio. The Advisory Fee is charged at an annual rate of 0.25%.
Administration Fee. PIMCO serves as administrator (the “Administrator”) and provides administrative services to the Trust for which it receives a monthly administrative fee based on average daily net assets of the Portfolio. The Administration Fee is charged at the annual rate of 0.25%.
Servicing Fee. PIMCO Advisors Distributors LLC (“PAD”), is an indirect wholly-owned subsidiary of Allianz Dresdner Asset Management of America L.P. and serves as the distributor of the Trust’s shares. The Trust is permitted to reimburse PAD on a quarterly basis, out of the Administrative Class assets of the Portfolio in the amount of 0.15% on an annual basis of the average daily net assets of that class, for payments made to financial intermediaries that provide services in connection with the distribution of shares or administration of plans or programs that use Portfolio shares as their funding medium. The effective rate paid to PAD during the current fiscal year is 0.15%.
Expenses. The Portfolio is responsible for the following expenses: (i) salaries and other compensation of any of the Trust’s executive officers and employees who are not officers, directors, stockholders or employees of PIMCO or its subsidiaries or affiliates; (ii) taxes and governmental fees; (iii) brokerage fees and commissions and other portfolio transaction expenses; (iv) the cost of borrowing money, including interest expense; (v) fees and expenses of the Trustees who are not “interested persons” of PIMCO or the Trust, and any counsel retained exclusively for their benefit; (vi) extraordinary expenses, including costs of litigation and indemnification expenses; (vii) organization expenses and (viii) any expenses allocated or allocable to a specific class of shares, which include service fees payable with respect to the Administrative Class shares and may include certain other expenses as permitted by the Trust’s Multiple Class Plan adopted pursuant to Rule 18f-3 under the Act and subject to review and approval by the Trustees. The ratio of expenses to average net assets per share class, as disclosed in the Financial Highlights, may differ from the annual Portfolio operating expenses per share class as disclosed in the Prospectus for the reasons set forth above. PIMCO has agreed to waive a portion of its administrative fees to the extent that the payment of the Portfolio’s pro rata share of Trustees’ fees causes the actual expense ratio to rise above the rates disclosed in the current prospectus plus 0.49 basis points as set forth below (calculated as a percentage of the Portfolio’s average daily net assets attributable to each class):
| | | Institutional
Class
| | | Administrative
Class
| |
Real Return Portfolio | | 0.50 | % | | 0.65 | % |
PIMCO may be reimbursed for these waived amounts in future periods. The Trust pays no compensation directly to any Trustee or any other officer who is affiliated with the Administrator, all of whom receive renumeration for their services to the Trust from the Administrator or its affiliates.
Each unaffiliated Trustee receives an annual retainer of $4,000, plus $1,500 for each Board of Trustees meeting attended in person and $250 for each meeting attended telephonically, plus reimbursement of related expenses.
11
In addition, each committee chair receives an additional annual retainer of $500. These expenses are allocated on a pro-rata basis to each Portfolio of the Trust according to its respective net assets.
4. Purchases and Sales of Securities
Purchases and sales of securities (excluding short-term investments) for the period ended June 30, 2003 were as follows (amounts in thousands):
| | | U.S Government/Agency
| | All Other
|
| | | Purchases
| | Sales
| | Purchases
| | Sales
|
Real Return Portfolio | | $ | 371,007 | | $ | 269,150 | | $ | 15,820 | | $ | 1,192 |
5. Transactions in Written Call and Put Options
Transactions in written call and put options were as follows (amounts in thousands):
| | | Real Return Portfolio
| |
| | | | | Premium
| |
Balance at 12/31/2002 | | | | $ | 0 | |
Sales | | | | | 153 | |
Closing Buys | | | | | 0 | |
Expirations | | | | | (61 | ) |
Exercised | | | | | 0 | |
| | | | |
|
|
|
Balance at 06/30/2003 | | | | $ | 92 | |
| | | | |
|
|
|
6. Federal Income Tax Matters
At June 30, 2003, the aggregate cost of investments was the same for federal income tax and financial statement purposes. The net unrealized appreciation (depreciation) of investments securities for federal income tax purposes is as follows (amounts in thousands):
| | | Aggregate Gross
Unrealized
Appreciation
| | Aggregate Gross
Unrealized
(Depreciation)
| | | Net Unrealized
(Depreciation)
| |
Real Return Portfolio | | $ | 587 | | $ | (1,572 | ) | | $ | (985 | ) |
7. Shares of Beneficial Interest
The Trust may issue an unlimited number of shares of beneficial interest with a $.0001 par value. Changes in shares of beneficial interest were as follows (shares and amounts in thousands):
| | | Real Return Portfolio
| |
| | | Six Months Ended
06/30/2003 | | | Year Ended 12/31/2002 | |
| | | Shares
| | | Amount
| | | Shares
| | | Amount
| |
Receipts for shares sold | | | | | | | | | | | | | | |
Institutional Class | | 2,113 | | | $ | 25,391 | | | 0 | | | $ | 0 | |
Administrative Class | | 8,760 | | | | 107,172 | | | 7,686 | | | | 88,409 | |
Issued as reinvestment of distributions | | | | | | | | | | | | | | |
Institutional Class | | 22 | | | | 271 | | | 0 | | | | 1 | |
Administrative Class | | 265 | | | | 3,229 | | | 128 | | | | 1,468 | |
Cost of shares redeemed | | | | | | | | | | | | | | |
Institutional Class | | (1 | ) | | | (17 | ) | | 0 | | | | 0 | |
Administrative Class | | (1,796 | ) | | | (21,816 | ) | | (890 | ) | | | (10,173 | ) |
| | |
|
| |
|
|
| |
|
| |
|
|
|
Net increase resulting from Portfolio share transactions | | 9,363 | | | $ | 114,230 | | | 6,924 | | | $ | 79,705 | |
| | |
|
| |
|
|
| |
|
| |
|
|
|
The following schedule shows the number of shareholders each owning 5% or more of the Portfolio and the total percentage of the Portfolio held by such shareholders:
| | | Number
| | % of Portfolio Held
|
Real Return Portfolio | | | | |
Institutional Class | | 1 | | 100 |
Administrative Class | | 5 | | 62 |
12
Trustees and Officers
Brent R. Harris, Chairman and Trustee
R. Wesley Burns, President and Trustee
E. Philip Cannon, Trustee
Vern O. Curtis, Trustee
J. Michael Hagan, Trustee
William J. Popejoy, Trustee
Garlin G. Flynn, Secretary
John P. Hardaway, Treasurer
Investment Adviser and Administrator
Pacific Investment Management Company LLC
840 Newport Center Drive
Newport Beach, California 92660
Transfer Agent
National Financial Data Services
330 W. 9th Street, 4th Floor
Kansas City, Missouri 64105
Custodian
State Street Bank & Trust Company
801 Pennsylvania
Kansas City, Missouri 64105
Counsel
Dechert LLP
1775 I Street, N.W.
Washington, D.C. 20006
Independent Accountants
PricewaterhouseCoopers LLP
1055 Broadway
Kansas City, Missouri 64105
PIMCO VARIABLE INSURANCE TRUST
This report is submitted for the general information of the shareholders of the PIMCO Variable Insurance Trust. It is not authorized for distribution to prospective investors unless accompanied or preceded by an effective prospectus for the PIMCO Variable Insurance Trust, which contains information covering its investment policies as well as other pertinent information.
All Funds distributed by PIMCO ADVISORS DISTRIBUTORS LLC, member NASD
840 NEWPORT CENTER DRIVE
NEWPORT BEACH, CA 92660
800.927.4648
WWW.PIMCOADVISORS.COM
WWW.PIMCO.COM
P I M C O PIMCO VARIABLE INSURANCE TRUST STOCKSPLUS GROWTHAND INCOME PORTFOLIO ADMINISTRATIVE CLASS
SEMI-ANNUAL REPORT June 30, 2003 |
| | | Fund
Summary
| | Schedule of
Investments
|
StocksPLUS Growth and Income Portfolio (Administrative Class) | | 2 | | 7 |
Chairman’s Letter
Dear PIMCO Variable Insurance Trust Shareholder:
Financial assets gained during the first half of 2003 amid a revival of risk appetites as anxiety about the war in Iraq faded. Assets that generally benefit from economic growth, such as stocks, corporate bonds and emerging market debt, fared the best year-to-date as investors returned to these sectors in anticipation of a recovery in the second half of 2003. Reflationary forces that investors expected to fuel a rebound included federal tax cuts and a weak dollar, as well as low borrowing rates that eased the burden of high personal and corporate indebtedness. Low mortgage rates kept refinancings booming in the second quarter and put more money in consumers’ pockets.
U.S. Treasuries lagged their riskier counterparts but still enjoyed a modest rally. Yields fell to levels not seen in 45 years early in the second quarter before bouncing off their lows in June as hopes for recovery increased. The yield on the benchmark 10-year Treasury closed the six-month period 0.30% lower to 3.51%, after nearing 3% earlier in the period. Buyers were encouraged that inflation would remain tame amid low capacity utilization and weak employment growth. Asian central banks bought U.S. Treasuries to limit the rise in their currencies versus the dollar in an effort to protect their export industries. In June, the Federal Reserve cut the federal funds rate by 0.25% to 1%, its 13th easing since 2001, in an effort to boost the economy and ward off deflation. Although the cut was less than expected, the Fed suggested that rates would stay low until deflation risks abated.
On the following pages you will find specific details as to the Portfolio’s total return investment performance and a discussion of those factors that affected performance.
We appreciate the trust you have placed in us, and we will continue to focus our efforts to meet your investment needs.
Sincerely,

Brent R. Harris
Chairman
July 31, 2003
1
StocksPLUS Growth and Income Portfolio
TOTAL RETURN INVESTMENT PERFORMANCE For the period ended June 30, 2003
| | | 1 Year | | | 5 Years* | | | Since Inception* | |
StocksPLUS Growth and Income Portfolio Administrative Class | | 3.22 | % | | -0.69 | % | | 2.25 | % |
S&P 500 Index | | 0.25 | % | | -1.61 | % | | — | |
| * | | Annualized (All Portfolio returns are net of fees and expenses) |
CUMULATIVE RETURNS THROUGH JUNE 30, 2003
$10,000 invested at inception
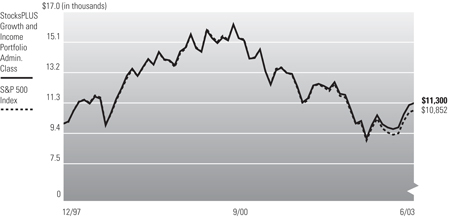
Past performance is no guarantee of future results. Investment return and principal value will fluctuate so that Portfolio shares, when redeemed, may be worth more or less than their original cost. The line graph above assumes the investment of $10,000 on 1/01/1998, the first full month following the Portfolio’s Administrative Class inception on 12/31/1997, compared to the S&P 500 Index, which is an unmanaged market index. It is not possible to invest directly in the Index. The Portfolio may invest in foreign securities which involve potentially higher risks including foreign currency fluctuations and political or economic uncertainty. These risks may be enhanced when investing in emerging market securities.
PORTFOLIO INSIGHTS
| • | | The StocksPLUS Growth & Income Portfolio seeks to exceed the total return of the S&P 500 by investing under normal circumstances substantially all of its assets in S&P 500 derivatives, backed by a portfolio of Fixed Income Instruments. |
| • | | The S&P 500 Index delivered a total return of 11.76% in the first half of 2003, as the stock market rallied in association with fading concern about the war in Iraq and increasing investor confidence. |
| • | | The Portfolio’s Administrative Class posted a total return of 13.32%, outperforming the S&P 500 Index by 1.56% in the first half of 2003. |
| • | | A duration longer than the effective benchmark was positive for performance as short-term interest rates fell modestly due to Fed easing and continued economic uncertainty. |
| • | | Mortgage-backed securities enhanced the Portfolio’s yield and credit quality, although the sector detracted from overall performance due to increased prepayment risk. |
| • | | Corporate holdings provided high relative yields and generally positive price performance as credit risk premiums fell. |
| • | | A small position in emerging market bonds boosted returns. This asset class continued to gain amid strong demand from investors drawn to relatively high yields and improving credit quality. |
| • | | Short maturity Eurozone exposure was a slight positive for performance; yields on these maturities fell more than U.S. rates amid expectations of more easing by the European Central Bank. |
2
Financial Highlights
StocksPLUS Growth and Income Portfolio (Administrative Class)
| Selected Per Share Data for the Year or Period Ended: | | 06/30/2003 +
| | | 12/31/2002
| | | 12/31/2001
| | | 12/31/2000
| | | 12/31/1999
| | | 12/31/1998
| |
Net asset value beginning of period | | $ | 7.25 | | | $ | 9.35 | | | $ | 11.05 | | | $ | 13.56 | | | $ | 12.58 | | | $ | 10.00 | |
Net investment income (a) | | | 0.10 | | | | 0.22 | | | | 0.46 | | | | 0.76 | | | | 0.76 | | | | 0.30 | |
Net realized/unrealized gain (loss) on investments (a) | | | 0.99 | | | | (2.10 | ) | | | (1.74 | ) | | | (1.98 | ) | | | 1.65 | | | | 2.68 | |
Total income (loss) from investment operations | | | 1.09 | | | | (1.88 | ) | | | (1.28 | ) | | | (1.22 | ) | | | 2.41 | | | | 2.98 | |
Dividends from net investment income | | | (0.19 | ) | | | (0.22 | ) | | | (0.42 | ) | | | (0.75 | ) | | | (0.61 | ) | | | (0.29 | ) |
Distributions from net realized capital gains | | | 0.00 | | | | 0.00 | | | | 0.00 | | | | (0.54 | ) | | | (0.82 | ) | | | (0.11 | ) |
Total distributions | | | (0.19 | ) | | | (0.22 | ) | | | (0.42 | ) | | | (1.29 | ) | | | (1.43 | ) | | | (0.40 | ) |
Net asset value end of period | | $ | 8.15 | | | $ | 7.25 | | | $ | 9.35 | | | $ | 11.05 | | | $ | 13.56 | | | $ | 12.58 | |
Total return | | | 13.32 | % | | | (20.22 | )% | | | (11.43 | )% | | | (9.50 | )% | | | 19.85 | % | | | 30.11 | % |
Net assets end of period (000s) | | $ | 242,947 | | | $ | 218,993 | | | $ | 259,926 | | | $ | 272,751 | | | $ | 230,412 | | | $ | 58,264 | |
Ratio of expenses to average net assets | | | 0.65 | %* | | | 0.65 | %(e) | | | 0.67 | %(c)(d) | | | 0.65 | %(b) | | | 0.65 | % | | | 0.65 | % |
Ratio of net investment income to average net assets | | | 2.56 | %* | | | 2.69 | % | | | 4.60 | % | | | 5.86 | % | | | 5.69 | % | | | 5.30 | % |
Portfolio turnover rate | | | 69 | % | | | 192 | % | | | 547 | % | | | 350 | % | | | 34 | % | | | 61 | % |
| (a) | | Per share amounts based on average number of shares outstanding during the period. |
| (b) | | If the investment manager had not reimbursed expenses, the ratio of operating expenses to average net assets would have been 0.66% for the year ended December 31, 2000. |
| (c) | | Ratio of expenses to average net assets excluding interest expense is 0.65%. |
| (d) | | If the investment manager had not reimbursed expenses, the ratio of operating expenses to average net assets would have been 0.67% for the year ended December 31, 2001. |
| (e) | | If the investment manager had not reimbursed expenses, the ratio of operating expenses to average net assets would have been 0.66% for the year ended December 31, 2002. |
See accompanying notes
3
Statement of Assets and Liabilities
StocksPLUS Growth and Income Portfolio
June 30, 2003 (Unaudited)
Amounts in thousands, except per share amounts
Assets: | | | | |
Investments, at value | | $ | 263,199 | |
Cash | | | 2 | |
Foreign currency, at value | | | 978 | |
Receivable for investments sold | | | 9,030 | |
Unrealized appreciation on forward foreign currency contracts | | | 4 | |
Receivable for Portfolio shares sold | | | 140 | |
Interest receivable | | | 707 | |
Variation margin receivable | | | 750 | |
Swap premiums paid | | | 3 | |
Unrealized appreciation on swap agreements | | | 161 | |
Other assets | | | 1 | |
| | |
|
|
|
| | | | 274,975 | |
| | |
|
|
|
Liabilities: | | | | |
Payable for investments purchased | | $ | 28,040 | |
Written options outstanding | | | 67 | |
Payable for Portfolio shares redeemed | | | 1,333 | |
Accrued investment advisory fee | | | 80 | |
Accrued administration fee | | | 20 | |
Accrued servicing fee | | | 31 | |
Variation margin payable | | | 742 | |
Unrealized depreciation on swap agreements | | | 5 | |
Other liabilities | | | 5 | |
| | |
|
|
|
| | | | 30,323 | |
| | |
|
|
|
Net Assets | | $ | 244,652 | |
| | |
|
|
|
Net Assets Consist of: | | | | |
Paid in capital | | $ | 364,842 | |
Undistributed net investment income | | | 1,891 | |
Accumulated undistributed net realized (loss) | | | (124,018 | ) |
Net unrealized appreciation | | | 1,937 | |
| | |
|
|
|
| | | $ | 244,652 | |
| | |
|
|
|
Net Assets: | | | | |
Institutional Class | | $ | 1,705 | |
Administrative Class | | | 242,947 | |
Shares Issued and Outstanding: | | | | |
Institutional Class | | | 209 | |
Administrative Class | | | 29,825 | |
Net Asset Value and Redemption Price Per Share (Net Assets Per Share Outstanding) | | | | |
Institutional Class | | $ | 8.17 | |
Administrative Class | | | 8.15 | |
Cost of Investments Owned | | $ | 262,660 | |
Cost of Foreign Currency Held | | $ | 985 | |
See accompanying notes
4
Statement of Operations
StocksPLUS Growth and Income Portfolio
For the six months ended June 30, 2003 (Unaudited)
Amounts in thousands
Investment Income: | | | | |
Interest | | $ | 2,980 | |
Miscellaneous income | | | 721 | |
| | |
|
|
|
Total Income | | | 3,701 | |
| | |
|
|
|
Expenses: | | | | |
Investment advisory fees | | | 458 | |
Administration fees | | | 115 | |
Distribution and/or servicing fees - Administrative Class | | | 171 | |
Trustees’ fees | | | 2 | |
Organization costs | | | 1 | |
| | |
|
|
|
Total Expenses | | | 747 | |
| | |
|
|
|
Net Investment Income | | | 2,954 | |
| | |
|
|
|
Net Realized and Unrealized Gain (Loss): | | | | |
Net realized gain on investments | | | 77 | |
Net realized gain on futures contracts, written options, and swaps | | | 24,438 | |
Net realized (loss) on foreign currency transactions | | | (72 | ) |
Net change in unrealized appreciation on investments | | | 974 | |
Net change in unrealized appreciation on futures contracts, written options, and swaps | | | 1,412 | |
Net change in unrealized appreciation on translation of assets and liabilities denominated in foreign currencies | | | 82 | |
Net Gain | | | 26,911 | |
| | |
|
|
|
Net Increase in Assets Resulting from Operations | | $ | 29,865 | |
| | |
|
|
|
See accompanying notes
5
Statements of Changes in Net Assets
StocksPLUS Growth and Income Portfolio
Amounts in thousands
| Increase (Decrease) in Net Assets from: | | Six Months Ended
June 30, 2003
| | | Year Ended
December 31, 2002
| |
| | | (Unaudited) | | | | |
Operations: | | | | | | | | |
Net investment income | | $ | 2,954 | | | $ | 6,234 | |
Net realized gain (loss) | | | 24,443 | | | | (56,743 | ) |
Net change in unrealized appreciation (depreciation) | | | 2,468 | | | | (3,568 | ) |
| | |
|
|
| |
|
|
|
Net increase (decrease) resulting from operations | | | 29,865 | | | | (54,077 | ) |
| | |
|
|
| |
|
|
|
Distributions to Shareholders: | | | | | | | | |
From net investment income | | | | | | | | |
Institutional Class | | | (13 | ) | | | (21 | ) |
Administrative Class | | | (1,889 | ) | | | (6,408 | ) |
| | |
|
|
| |
|
|
|
Total Distributions | | | (1,902 | ) | | | (6,429 | ) |
| | |
|
|
| |
|
|
|
Portfolio Share Transactions: | | | | | | | | |
Receipts for shares sold | | | | | | | | |
Institutional Class | | | 749 | | | | 847 | |
Administrative Class | | | 42,498 | | | | 121,856 | |
Issued as reinvestment of distributions | | | | | | | | |
Institutional Class | | | 13 | | | | 21 | |
Administrative Class | | | 1,889 | | | | 6,408 | |
Cost of shares redeemed | | | | | | | | |
Institutional Class | | | (22 | ) | | | (76 | ) |
Administrative Class | | | (48,217 | ) | | | (108,884 | ) |
| | |
|
|
| |
|
|
|
Net increase (decrease) resulting from Portfolio share transactions | | | (3,090 | ) | | | 20,172 | |
| | |
|
|
| |
|
|
|
Total Increase (Decrease) in Net Assets | | | 24,873 | | | | (40,334 | ) |
| | |
|
|
| |
|
|
|
Net Assets: | | | | | | | | |
Beginning of period | | | 219,779 | | | | 260,113 | |
End of period* | | $ | 244,652 | | | $ | 219,779 | |
*Including undistributed net investment income of: | | $ | 1,891 | | | $ | 839 | |
See accompanying notes
6
Schedule of Investments
StocksPLUS Growth and Income Portfolio
June 30, 2003 (Unaudited)
| | | Principal Amount (000s)
| | Value (000s)
|
CORPORATE BONDS & NOTES 10.6% | | | | | | |
Banking & Finance 3.6% | | | | | | |
CIT Group, Inc. | | | | | | |
5.625% due 05/17/2004 | | $ | 700 | | $ | 723 |
General Motors Acceptance Corp. | | | | | | |
3.280% due 03/04/2005 (a) | | | 900 | | | 902 |
Goldman Sachs Group, Inc. | | | | | | |
7.009% due 02/10/2004 (a) | | | 0 | | | 0 |
Household Finance Corp. | | | | | | |
4.625% due 01/15/2008 | | | 1,000 | | | 1,068 |
National Rural Utilities Cooperative Finance Corp. | | | | | | |
2.320% due 04/26/2004 (a) | | | 2,100 | | | 2,114 |
Pemex Project Funding Master Trust | | | | | | |
2.778% due 01/07/2005 (a) | | | 3,900 | | | 3,948 |
| | | | | |
|
|
| | | | | | | 8,755 |
| | | | | |
|
|
Industrials 4.7% | | | | | | |
Coastal Corp. | | | | | | |
6.200% due 05/15/2004 | | | 3,000 | | | 2,985 |
Enron Corp. | | | | | | |
8.000% due 08/15/2005 (b) | | | 1,700 | | | 485 |
Kraft Foods, Inc. | | | | | | |
2.080% due 02/27/2004 (a) | | | 3,600 | | | 3,552 |
Park Place Entertainment Corp. | | | | | | |
7.950% due 08/01/2003 | | | 1,430 | | | 1,435 |
Walt Disney Co. | | | | | | |
3.900% due 09/15/2003 | | | 1,200 | | | 1,206 |
Waste Management, Inc. | | | | | | |
7.000% due 10/01/2004 | | | 300 | | | 318 |
Weyerhaeuser Co. | | | | | | |
2.243% due 09/15/2003 (a) | | | 1,700 | | | 1,700 |
| | | | | |
|
|
| | | | | | | 11,681 |
| | | | | |
|
|
Utilities 2.3% | | | | | | |
Entergy Gulf States, Inc. | | | | | | |
2.040% due 06/18/2007 (a) | | | 2,500 | | | 2,500 |
Niagara Mohawk Power Co. | | | | | | |
7.375% due 07/01/2003 | | | 529 | | | 529 |
Sprint Capital Corp. | | | | | | |
5.700% due 11/15/2003 | | | 2,100 | | | 2,108 |
7.900% due 03/15/2005 | | | 400 | | | 434 |
| | | | | |
|
|
| | | | | | | 5,571 |
| | | | | |
|
|
Total Corporate Bonds & Notes (Cost $26,909) | | | | | | 26,007 |
| | | | | |
|
|
MUNICIPAL BONDS & NOTES 0.4% | | | | | | |
California 0.4% | | | | | | |
Golden State Tobacco Securitization Corporate Revenue Bonds, Series 2003 | | | | | | |
5.000% due 06/01/2021 | | | 1,100 | | | 1,074 |
| | | | | |
|
|
Total Municipal Bonds & Notes (Cost $1,095) | | | | | | 1,074 |
| | | | | |
|
|
U.S. TREASURY OBLIGATIONS 6.2% | | | | | | |
Treasury Inflation Protected Securities (e) | | | | | | |
3.625% due 01/15/2008 (c) | | | 12,857 | | | 14,428 |
3.875% due 01/15/2009 | | | 112 | | | 128 |
3.500% due 01/15/2011 | | | 422 | | | 480 |
| | | | | |
|
|
Total U.S. Treasury Obligations (Cost $13,799) | | | | | | 15,036 |
| | | | | |
|
|
MORTGAGE-BACKED SECURITIES 26.0% | | | | | | |
Collateralized Mortgage Obligations 12.4% | | | | | | |
Bear Stearns Adjustable Rate Mortgage Trust | | | | | | |
6.158% due 01/25/2032 (a) | | | 281 | | | 283 |
6.003% due 06/25/2032 (a) | | | 771 | | | 788 |
5.367% due 01/25/2033 (a) | | | 1,842 | | | 1,879 |
Countrywide Alternative Loan Trust | | | | | | |
5.875% due 07/25/2032 | | | 683 | | | 698 |
CS First Boston Mortgage Securities Corp. | | | | | | |
1.435% due 02/25/2032 (a) | | | 784 | | | 787 |
1.266% due 03/25/2032 (a) | | | 1,009 | | | 997 |
1.330% due 03/25/2032 (a) | | | 2,290 | | | 2,248 |
5.726% due 05/25/2032 (a) | | | 1,249 | | | 1,286 |
5.917% due 06/25/2032 (a) | | | 325 | | | 332 |
6.181% due 06/25/2032 (a) | | | 806 | | | 830 |
4.370% due 12/19/2039 (a) | | | 448 | | | 450 |
DLJ Mortgage Acceptance Corp. | | | | | | |
1.535% due 06/25/2026 (a) | | | 249 | | | 249 |
Fannie Mae | | | | | | |
8.000% due 05/01/2030 | | | 81 | | | 87 |
8.000% due 06/01/2030 | | | 77 | | | 83 |
Federal Home Loan Bank | | | | | | |
6.000% due 08/15/2026 | | | 955 | | | 965 |
Freddie Mac | | | | | | |
5.500% due 11/15/2015 | | | 586 | | | 599 |
5.750% due 12/15/2016 | | | 232 | | | 232 |
5.250% due 04/15/2026 | | | 716 | | | 722 |
6.000% due 01/15/2029 | | | 1,120 | | | 1,132 |
GE Capital Mortgage Services, Inc. | | | | | | |
6.500% due 12/25/2023 | | | 46 | | | 46 |
GSR Mortgage Loan Trust | | | | | | |
5.626% due 04/25/2032 (a) | | | 901 | | | 910 |
Housing Securities, Inc. | | | | | | |
2.036% due 07/25/2032 (a)(j) | | | 218 | | | 218 |
Master Asset Securitization Trust | | | | | | |
5.375% due 10/25/2032 | | | 460 | | | 470 |
Morgan Stanley Dean Witter Capital I | | | | | | |
5.500% due 04/25/2017 | | | 1,408 | | | 1,405 |
PNC Mortgage Securities Corp. | | | | | | |
7.375% due 05/25/2040 (a) | | | 61 | | | 60 |
Resecuritization Mortgage Trust | | | | | | |
1.277% due 04/26/2021 (a)(j) | | | 36 | | | 36 |
Residential Funding Mortgage Securities I, Inc. | | | | | | |
6.500% due 03/25/2032 | | | 1,853 | | | 1,874 |
Salomon Brothers Mortgage Securities VII, Inc. | | | | | | |
5.596% due 12/25/2030 (a) | | | 913 | | | 922 |
Structured Asset Mortgage Investments, Inc. | | | | | | |
7.000% due 07/28/2028 | | | 168 | | | 168 |
Structured Asset Securities Corp. | | | | | | |
1.335% due 10/25/2027 (a) | | | 889 | | | 874 |
6.500% due 10/25/2031 (a) | | | 2,088 | | | 2,169 |
Washington Mutual Loan Trust | | | | | | |
6.019% due 10/19/2039 (a) | | | 1,229 | | | 1,231 |
Washington Mutual Mortgage Securities Corp. | | | | | | |
6.000% due 03/25/2017 | | | 430 | | | 441 |
6.010% due 04/25/2031 (a) | | | 280 | | | 283 |
5.458% due 02/25/2033 (a) | | | 4,319 | | | 4,449 |
| | | | | |
|
|
| | | | | | | 30,203 |
| | | | | |
|
|
Fannie Mae 5.6% | | | | | | |
5.000% due 07/17/2018 | | | 2,000 | | | 2,066 |
5.371% due 04/01/2033 (a) | | | 1,067 | | | 1,095 |
6.000% due 04/01/2013-08/13/2033 (d) | | | 10,006 | | | 10,422 |
6.500% due 09/01/2005 | | | 54 | | | 55 |
8.000% due 09/01/2031 | | | 136 | | | 146 |
| | | | | |
|
|
| | | | | | | 13,784 |
| | | | | |
|
|
Freddie Mac 2.5% | | | | | | |
6.000% due 07/01/2016-08/13/2033 (d) | | | 5,150 | | | 5,339 |
6.500% due 08/01/2032 | | | 823 | | | 857 |
| | | | | |
|
|
| | | | | | | 6,196 |
| | | | | |
|
|
Government National Mortgage Association 5.5% | | | | | | |
4.375% due 02/20/2027 (a) | | | 559 | | | 577 |
4.500% due 05/20/2028 (a) | | | 1,106 | | | 1,129 |
5.000% due 11/20/2029 (a) | | | 720 | | | 748 |
5.375% due 04/20/2024-04/20/2027 (a)(d) | | | 2,516 | | | 2,608 |
5.750% due 08/20/2024 (a) | | | 63 | | | 64 |
6.000% due 08/20/2033 | | | 6,000 | | | 6,279 |
7.500% due 07/15/2030-12/15/2030 (d) | | | 72 | | | 76 |
8.000% due 04/15/2027-02/15/2031 (d) | | | 1,833 | | | 1,980 |
8.500% due 04/20/2030 | | | 29 | | | 31 |
| | | | | |
|
|
| | | | | | | 13,492 |
| | | | | |
|
|
Total Mortgage-Backed Securities (Cost $63,446) | | | | | | 63,675 |
| | | | | |
|
|
ASSET-BACKED SECURITIES 3.5% | | | | | | |
Ameriquest Mortgage Securities, Inc. | | | | | | |
1.345% due 05/25/2032 (a) | | $ | 543 | | $ | 544 |
Countrywide Asset-Backed Certificates | | | | | | |
1.295% due 05/25/2032 (a) | | | 3,363 | | | 3,359 |
Green Tree Recreational, Equipment, & Consumer Trust | | | | | | |
6.550% due 07/15/2028 | | | 79 | | | 79 |
Home Equity Mortgage Trust | | | | | | |
1.365% due 11/25/2032 (a) | | | 1,626 | | | 1,628 |
North Carolina State Education Authority | | | | | | |
1.440% due 06/01/2009 (a) | | | 2,819 | | | 2,818 |
Option One Mortgage Loan Trust | | | | | | |
1.365% due 04/25/2030 (a) | | | 207 | | | 206 |
| | | | | |
|
|
Total Asset-Backed Securities (Cost $8,638) | | | | | | 8,634 |
| | | | | |
|
|
SOVEREIGN ISSUES 0.5% | | | | | | |
Republic of Brazil | | | | | | |
2.125% due 04/15/2006 (a) | | | 1,056 | | | 993 |
2.187% due 04/15/2009 (a) | | | 141 | | | 118 |
| | | | | |
|
|
Total Sovereign Issues (Cost $1,109) | | | | | | 1,111 |
| | | | | |
|
|
PURCHASED PUT OPTIONS 0.0% | | | | | | |
Eurodollar June Futures (OTC) | | | | | | |
Strike @ 94.000 Exp. 12/15/2003 | | | 106,000 | | | 0 |
PNC Mortgage Securities Corp. (OTC) | | | | | | |
2.243% due 01/00/1900 | | | | | | |
Strike @ 100.000 Exp. 04/01/2005 | | | 1,300 | | | 0 |
S&P 500 Index September Futures (OTC) | | | | | | |
Strike @ 550.000 Exp. 09/19/2003 | | | 56 | | | 6 |
| | | | | |
|
|
Total Purchased Put Options (Cost $8) | | | | | | 6 |
| | | | | |
|
|
SHORT-TERM INSTRUMENTS 60.4% | | | | | | |
Commercial Paper 53.4% | | | | | | |
ABN AMRO North America | | | | | | |
1.200% due 07/07/2003 | | | 800 | | | 800 |
ABN AMRO North America Finance | | | | | | |
1.040% due 07/16/2003 | | | 6,000 | | | 5,997 |
Anz (Delaware), Inc. | | | | | | |
1.235% due 07/09/2003 | | | 4,800 | | | 4,799 |
1.225% due 07/30/2003 | | | 2,000 | | | 1,998 |
Barclays U.S. Funding Corp. | | | | | | |
1.200% due 08/27/2003 | | | 1,900 | | | 1,896 |
CBA Finance, Inc. | | | | | | |
1.220% due 07/08/2003 | | | 3,800 | | | 3,799 |
Fannie Mae | | | | | | |
1.170% due 07/02/2003 | | | 1,500 | | | 1,500 |
1.165% due 07/23/2003 | | | 900 | | | 899 |
1.195% due 08/11/2003 | | | 5,800 | | | 5,792 |
1.150% due 08/13/2003 | | | 2,000 | | | 1,997 |
1.180% due 08/25/2003 | | | 7,100 | | | 7,087 |
1.080% due 09/30/2003 | | | 3,500 | | | 3,491 |
Federal Home Loan Bank | | | | | | |
1.180% due 07/11/2003 | | | 2,000 | | | 1,999 |
1.200% due 07/16/2003 | | | 5,800 | | | 5,797 |
1.165% due 08/01/2003 | | | 12,000 | | | 11,988 |
Freddie Mac | | | | | | |
1.155% due 07/03/2003 | | | 13,000 | | | 12,999 |
1.195% due 07/17/2003 | | | 5,100 | | | 5,097 |
1.185% due 09/03/2003 | | | 2,300 | | | 2,296 |
General Electric Capital Corp. | | | | | | |
1.030% due 07/23/2003 | | | 2,000 | | | 1,999 |
1.050% due 08/11/2003 | | | 4,100 | | | 4,095 |
See accompanying notes
7
| | | Principal
Amount (000s)
| | Value (000s)
| |
HBOS Treasury Services PLC | | | | | | | |
1.250% due 07/16/2003 | | $ | 1,100 | | $ | 1,100 | |
1.240% due 07/24/2003 | | | 2,000 | | | 1,999 | |
1.120% due 08/28/2003 | | | 2,400 | | | 2,395 | |
1.000% due 09/15/2003 | | | 600 | | | 599 | |
Lloyds Bank PLC | | | | | | | |
0.980% due 09/09/2003 | | | 1,900 | | | 1,896 | |
Rabobank Nederland NV | | | | | | | |
1.310% due 07/01/2003 | | | 7,000 | | | 7,000 | |
Royal Bank of Scotland PLC | | | | | | | |
1.220% due 07/16/2003 | | | 6,200 | | | 6,197 | |
1.230% due 08/06/2003 | | | 4,800 | | | 4,794 | |
Shell Finance | | | | | | | |
1.120% due 07/10/2003 | | | 6,800 | | | 6,798 | |
Svenska Handelsbank, Inc. | | | | | | | |
1.220% due 07/01/2003 | | | 3,000 | | | 3,000 | |
TotalFinaElf Capital S.A. | | | | | | | |
1.300% due 07/01/2003 | | | 5,600 | | | 5,600 | |
Westpac Trust Securities Ltd. | | | | | | | |
1.200% due 08/27/2003 | | | 3,000 | | | 2,994 | |
| | | | | |
|
|
|
| | | | | | | 130,697 | |
| | | | | |
|
|
|
Repurchase Agreement 2.4% | | | | | | | |
State Street Bank | | | | | | | |
0.800% due 07/01/2003 | | | 5,766 | | | 5,766 | |
(Dated 06/30/2003. Collateralized by Federal Farm Credit Banks 3.125% due 10/01/2003 valued at $5,886. Repurchase proceeds are $5,766.) | | | | | | | |
| | | | | |
|
|
|
U.S. Treasury Bills 4.6% | | | | | | | |
1.091% due 08/07/2003-08/14/2003 (c)(d) | | | 11,205 | | | 11,193 | |
| | | | | |
|
|
|
Total Short-Term Instruments
(Cost $147,656) | | | | | | 147,656 | |
| | | | | |
|
|
|
Total Investments 107.6%
(Cost $262,660) | | | | | $ | 263,199 | |
Written Options (g) (0.0%)
(Premiums $108) | | | | | | (67 | ) |
Other Assets and Liabilities (Net) (7.6%) | | | | | | (18,480 | ) |
| | | | | |
|
|
|
Net Assets 100.0% | | | | | $ | 244,652 | |
| | | | | |
|
|
|
Notes to Schedule of Investments
(amounts in thousands, except number of contracts):
| (a) | | Variable rate security. The rate listed is as of June 30, 2003. |
| (b) | | Security is in default. |
| (c) | | Securities with an aggregate market value of $22,459 have been segregated with the custodian to cover margin requirements for the following open futures contracts at June 30, 2003: |
Type
| | # of
Contracts
| | Unrealized
Appreciation/
(Depreciation)
| |
Euribor Purchased Put Options Strike @ 96.375 (06/2004) - Long | | 106 | | $ | 0 | |
Euribor Written Put Options Strike @ 97.500 (09/2003) - Short | | 147 | | | 83 | |
Euribor Purchased Put Options Strike @ 96.250 (12/2003) - Long | | 60 | | | (1 | ) |
Euribor Purchased Put Options Strike @ 93.000 (12/2004) - Long | | 55 | | | (1 | ) |
United Kingdom Purchase Put Options Strike @ 93.750 (06/2004) - Long | | 6 | | | 0 | |
Euribor March Futures (03/2004) - Long | | 3 | | | 2 | |
Euribor September Futures (09/2003) - Long | | 11 | | | 17 | |
Euribor September Futures (09/2005) - Long | | 53 | | | (33 | ) |
Euribor December Futures (12/2004) - Long | | 7 | | | 1 | |
United Kingdom 90 Day LIBOR Futures (03/2004) - Long | | 3 | | | (1 | ) |
United Kingdom 90 Day LIBOR Futures (12/2003) - Long | | 3 | | | (1 | ) |
S & P 500 Index (09/2003) - Long | | 1,003 | | | 1,099 | |
Eurodollar March Futures (03/2004) - Long | | 14 | | | 27 | |
Eurodollar March Futures (03/2005) - Long | | 1 | | | 2 | |
Eurodollar September Futures (09/2004) - Long | | 1 | | | 2 | |
Eurodollar December Futures (12/2004) - Long | | 5 | | | 9 | |
| | | | |
|
|
|
| | | | | $ | 1,205 | |
| | | | |
|
|
|
| (d) | | Securities are grouped by coupon or range of coupons and represent a range of maturities. |
| (e) | | Principal amount of security is adjusted for inflation. |
| (f) | | Swap agreements outstanding at June 30, 2003: |
Type
| | Notional
Amount
| | Unrealized
Appreciation/
(Depreciation)
| |
Receive a fixed rate equal to 3.250% and pay floating rate based on 6-month EC-LIBOR. | | | | | | | |
| | |
Counterparty: J.P. Morgan Chase & Co. | | | | | | | |
Exp. 03/15/2007 | | EC | 1,400 | | $ | (5 | ) |
Receive a fixed rate equal to 0.610% and the Portfolio will pay to the counterparty at par in the event of default of General Electric Capital Corp. 6.000% due 06/15/2012. | | | | | | | |
| | |
Counterparty: Merrill Lynch & Co., Inc. | | | | | | | |
Exp. 05/19/2004 | | $ | 400 | | $ | 2 | |
Receive a fixed rate equal to 5.000% and the Portfolio will pay to the counterparty at par in the event of default of Sprint Capital Corp. 7.625% due 01/30/2011. | | | | | | | |
| | |
Counterparty: Morgan Stanley Dean Witter & Co. | | | | | | | |
Exp. 05/28/2004 | | | 5,000 | | | 159 | |
Received total return on S&P 500 Index and pay floating rate based on 1-month LIBOR plus 0.700% | | | | | | | |
| | |
Counterparty: J.P. Morgan Chase & Co. | | | | | | | |
Exp. 04/30/2004 | | | 4,734 | | | 0 | |
| | | | | |
|
|
|
| | | | | | $ | 156 | |
| | | | | |
|
|
|
| (g) | | Premiums received on written options: |
Type
| | Notional
Amount
| | Premium
| | Value
|
Call - OTC 7 Year Interest Rate Swap | | | | | | | | | |
Strike @ 3.500%* Exp. 12/17/2003 | | $ | 3,000 | | $ | 31 | | $ | 53 |
Put - OTC 7 Year Interest Rate Swap | | | | | | | | | |
Strike @ 5.500%** Exp. 12/17/2003 | | | 3,000 | | | 39 | | | 3 |
| | | | | |
|
| |
|
|
| | | | | | $ | 70 | | $ | 56 |
| | | | | |
|
| |
|
|
| | | |
Type
| | # of
Contracts
| | Premium
| | Value
|
Put - CME Eurodollar December Futures | | | | | | | | | |
Strike @ 98.750 Exp. 12/15/2003 | | | 86 | | $ | 38 | | $ | 11 |
| | | | | |
|
| |
|
|
| * | | The Portfolio will receive a floating rate based on 3-month LIBOR. |
| ** | | The Portfolio will pay a floating rate based on 3-month LIBOR. |
| (h) | | Principal amount denoted in indicated currency: |
EC – Euro
| (i) | | Foreign forward currency contracts outstanding at June 30, 2003: |
Type
| | Currency
| | Principal
Amount
Covered by
Contract
| | Settlement
Month
| | Unrealized
Appreciation
| | Unrealized
(Depreciation)
| | Net
Unrealized
Appreciation
|
Sell | | EC | | 751 | | 07/2003 | | $ | 4 | | $ | 0 | | $ | 4 |
| | | | | | | | |
|
| |
|
| |
|
|
| (j) | | Indicates a fair valued security which has not been valued utilizing an independent quote and which is valued pursuant to guidelines established by the Trustees. The aggregate value of fair valued securities is $254, which is 0.10% of net assets. |
See accompanying notes
8
Notes to Financial Statements
June 30, 2003 (Unaudited)
1. Organization
The StocksPLUS Growth and Income Portfolio (the “Portfolio”) is a series of the PIMCO Variable Insurance Trust (the “Trust”). The Trust is registered under the Investment Company Act of 1940 (the “Act”), as amended, as an open-end investment company organized as a Delaware business trust on October 3, 1997. The Trust may offer up to two classes of shares: Institutional and Administrative. Each share class has identical voting rights (except that shareholders of a class have exclusive voting rights regarding any matter relating solely to that class of shares). Information presented in these financial statements pertains to the Administrative Class of the Trust. Certain detailed financial information for the Institutional Class is provided separately and is available upon request. The Trust is designed to be used as an investment vehicle by Separate Accounts of insurance companies that fund variable annuity contracts and variable life insurance policies and by qualified pension and retirement plans. The Portfolio commenced operations on December 31, 1997.
2. Significant Accounting Policies
The following is a summary of significant accounting policies consistently followed by the Trust in the preparation of its financial statements in conformity with accounting principles generally accepted in the United States of America. The preparation of financial statements in accordance with accounting principles generally accepted in the United States of America requires management to make estimates and assumptions that affect the reported amounts and disclosures in the financial statements. Actual results could differ from those estimates.
Security Valuation. Portfolio securities and other financial instruments for which market quotations are readily available are stated at market value. Market value is determined at the close of regular trading (normally, 4:00 p.m., Eastern Time) on the New York Stock Exchange on each day the New York Stock Exchange is open, or if no sales are reported, as is the case for most securities traded over-the-counter, the mean between representative bid and asked quotations obtained from a quotation reporting system or from established market makers. Fixed income securities, including those to be purchased under firm commitment agreements, are normally valued on the basis of quotes obtained from brokers and dealers or pricing services. Short-term investments, which mature in 60 days or less are valued at amortized cost, which approximates market value. Certain fixed income securities for which daily market quotations are not readily available may be valued, pursuant to guidelines established by the Board of Trustees, with reference to fixed income securities whose prices are more readily obtainable. Prices may be obtained from independent pricing services which use information provided by market makers or estimates of market values obtained from yield data relating to investments or securities with similar characteristics. The prices used by the Portfolio may differ from the value that would be realized if the securities were sold and the differences could be material to the financial statements.
Securities Transactions and Investment Income. Securities transactions are recorded as of the trade date. Securities purchased or sold on a when-issued or delayed delivery basis may be settled a month or more after the trade date. Realized gains and losses from securities sold are recorded on the identified cost basis. Dividend income is recorded on the ex-dividend date, except certain dividends from foreign securities where the ex-dividend date may have passed, are recorded as soon as the Portfolio is informed of the ex-dividend date. Interest income, adjusted for the accretion of discounts and amortization of premiums, is recorded on the accrual basis. Paydowns gains and losses on mortgage- and asset-backed securities are recorded as adjustments to interest income in the Statement of Operations.
Dividends and Distributions to Shareholders. Dividends from net investment income, if any, are declared and distributed to shareholders quarterly. All dividends are reinvested in additional shares of the Portfolio. Net realized capital gains earned by the Portfolio, if any, will be distributed no less frequently than once each year.
Income dividends and capital gain distributions are determined in accordance with income tax regulations which may differ from accounting principles generally accepted in the United States of America. These differences are primarily due to differing treatments for such items as wash sales, foreign currency transactions, net operating losses and capital loss carryforwards.
Distributions classified as a tax basis return of capital, if any, are reflected in the accompanying Statements of Changes in Net Assets and have been reclassified to paid in capital. In addition, other amounts have been reclassified between undistributed net investment income, accumulated undistributed net realized gains or losses and/or paid in capital to more appropriately conform financial accounting to tax characterizations of dividend distributions.
Foreign Currency. The accounting records of the Portfolio are maintained in U.S. dollars. The market values of foreign securities, currency holding and other assets and liabilities are translated into U.S. dollars based on the current exchange rates each business day. Fluctuations in the value of these assets and liabilities resulting from changes in exchange rates are recorded as unrealized foreign currency gains or losses. Realized gains or losses and unrealized appreciation (depreciation) on investment securities and income and expenses are translated on the respective dates of such transactions. The effect of changes in foreign currency exchange rates on investments in securities are not segregated in the Statement of Operations from the effects
9
of changes in market prices of those securities, but are included with the net realized and unrealized gain or loss on investment securities.
Multiclass Operations. Each class offered by the Trust has equal rights as to assets. Income, non-class specific expenses, and realized and unrealized capital gains and losses are allocated to each class of shares based on the relative net assets of each class.
Federal Income Taxes. The Portfolio intends to qualify as a regulated investment company and distribute all of its taxable income and net realized gains, if applicable, to shareholders. Accordingly, no provision for Federal income taxes has been made.
Futures Contracts. The Portfolio is authorized to enter into futures contracts. The Portfolio may use futures contracts to manage its exposure to the securities markets or to movements in interest rates and currency values. The primary risks associated with the use of futures contracts are imperfect correlation between the change in market value of the securities held by the Portfolio and the prices of futures contracts, the possibility of an illiquid market, and the inability of the counterparty to meet the terms of the contract. Futures contracts are valued based upon their quoted daily settlement prices. Upon entering into a futures contract, the Portfolio may be required to deposit with its custodian, in a segregated account in the name of the futures broker, an amount of cash or U.S. Government and Agency Obligations in accordance with the initial margin requirements of the broker or exchange. Futures contracts are marked to market daily and an appropriate payable or receivable for the change in value (“variation margin”) is recorded by the Portfolio. Gains or losses are recognized but not considered realized until the contracts expire or are closed. Futures contracts involve, to varying degrees, risk of loss in excess of the variation margin disclosed in the Statement of Assets and Liabilities.
Options Contracts. The Portfolio may write call and put options on futures, securities or currencies it owns or in which it may invest. Writing put options tends to increase the Portfolio’s exposure to the underlying instrument. Writing call options tends to decrease the Portfolio’s exposure to the underlying instrument. When the Portfolio writes a call or put option, an amount equal to the premium received is recorded as a liability and subsequently marked to market to reflect the current value of the option written. Payment received or made, if any, from writing options with premiums to be determined on a future date are reflected as such on the Statement of Assets and Liabilities. Premiums received from writing options which expire are treated as realized gains. Premiums received from writing options which are exercised or closed are added to the proceeds or offset against amounts paid on the underlying future, security or currency transaction to determine the realized gain or loss. The Portfolio as a writer of an option has no control over whether the underlying future, security or currency may be sold (call) or purchased (put) and as a result bears the market risk of an unfavorable change in the price of the future, security or currency underlying the written option. There is the risk the Portfolio may not be able to enter into a closing transaction because of an illiquid market.
The Portfolio may also purchase put and call options. Purchasing call options tends to increase the Portfolio’s exposure to the underlying instrument. Purchasing put options tends to decrease the Portfolio’s exposure to the underlying instrument. The Portfolio pays a premium which is included in the Portfolio’s Statement of Assets and Liabilities as an investment and subsequently marked to market to reflect the current value of the option. Premiums paid for purchasing options which expire are treated as realized losses. The risk associated with purchasing put and call options is limited to the premium paid. Premiums paid for purchasing options which are exercised or closed are added to the amounts paid or offset against the proceeds on the underlying future, security or currency transaction to determine the realized gain or loss.
Forward Currency Transactions. The Portfolio may enter into forward currency contracts and forward cross-currency contracts in connection with settling planned purchases or sales of securities or to hedge the currency exposure associated with some or all of the Portfolio’s securities. A forward currency contract is an agreement between two parties to buy and sell a currency at a set price on a future date. The market value of a forward currency contract fluctuates with changes in forward currency exchange rates. Forward currency contracts are marked to market daily and the change in value is recorded by the Portfolio as an unrealized gain or loss. Realized gains or losses equal to the difference between the value of the contract at the time it was opened and the value at the time it was closed are recorded upon delivery or receipt of the currency or, if a forward currency contract is offset by entering into another forward currency contract with the same broker, upon settlement of the net gain or loss. These contracts may involve market risk in excess of the unrealized gain or loss reflected in the Portfolio’s Statement of Assets and Liabilities. In addition, the Portfolio could be exposed to risk if the counterparties are unable to meet the terms of the contracts or if the value of the currency changes unfavorably to the U.S. dollar.
Swap Agreements. The Portfolio may invest in swap agreements. A swap is an agreement to exchange the return generated by one instrument for the return generated by another instrument. The Portfolio may enter into interest rate, total return, forward swap spread lock and credit default
10
swap agreements to manage its exposure to interest rates and credit risk. Interest rate swap agreements involve the exchange by the Portfolio with another party of their respective commitments to pay or receive interest, e.g., an exchange of floating rate payments for fixed rate payments with respect to a notional amount of principal. Total return swap agreements involve commitments to pay interest in exchange for a market-linked return, both based on notional amounts. To the extent the total return of the security or index underlying the transaction exceeds or falls short of the offsetting interest rate obligation, the Portfolio will receive a payment from or make a payment to the counterparty. Forward spread lock swap agreements involve commitments to pay or receive a settlement amount calculated as the difference between the swap spread and a fixed spread, multiplied by the notional amount times the duration of the swap. The swap spread is the difference between the benchmark swap rate (market rate) and the specific Treasury rate. In a credit default swap, one party makes a stream of payments to another party in exchange for the right to receive a specified return in the event of a default by a third party, typically corporate issues or sovereign issues of an emerging country, on its obligation. The Portfolio may use credit default swaps to provide a measure of protection against defaults of sovereign issuers (i.e., to reduce risk where the Portfolio owns or has exposure to the sovereign issuer) or to take an active long or short position with respect to the likelihood of a particular issuer’s default. Swaps are marked to market daily based upon quotations from market makers and vendors and the change in value, if any, is recorded as unrealized gain or loss in the Statement of Operations. Payments received or made at the beginning of the measurement period are reflected as such on the Statement of Assets and Liabilities. A liquidation payment received or made at the termination of the swap is recorded as realized gain or loss in the Statement of Operations. Net periodic payments are included as part of miscellaneous income on the Statement of Operations. Entering into these agreements involves, to varying degrees, elements of credit, market and documentation risk in excess of the amounts recognized on the Statement of Assets and Liabilities. Such risks involve the possibility that there will be no liquid market for these agreements, that the counterparty to the agreements may default on its obligation to perform or disagree as to the meaning of contractual terms in the agreements, and that there may be unfavorable changes in interest rates.
Delayed Delivery Transactions. The Portfolio may purchase or sell securities on a when-issued or delayed delivery basis. These transactions involve a commitment by the Portfolio to purchase or sell securities for a predetermined price or yield, with payment and delivery taking place beyond the customary settlement period. When delayed delivery purchases are outstanding, the Portfolio will set aside and maintain until the settlement date in a segregated account, liquid assets in an amount sufficient to meet the purchase price. When purchasing a security on a delayed delivery basis, the Portfolio assumes the rights and risks of ownership of the security, including the risk of price and yield fluctuations, and takes such fluctuations into account when determining its net asset value. The Portfolio may dispose of or renegotiate a delayed delivery transaction after it is entered into, and may sell when-issued securities before they are delivered, which may result in a capital gain or loss. When the Portfolio has sold a security on a delayed delivery basis, the Portfolio does not participate in future gains and losses with respect to the security.
Inflation-Indexed Bonds. Inflation-indexed bonds are fixed income securities whose principal value is periodically adjusted to the rate of inflation. The interest rate on these bonds is generally fixed at issuance at a rate lower than typical bonds. Over the life of an inflation-indexed bond, however, interest will be paid based on a principal value, which is adjusted for inflation. Any increase in the principal amount of an inflation-indexed bond will be included as interest income in the Statement of Operations, even though investors do not receive their principal until maturity.
Repurchase Agreements. The Portfolio may engage in repurchase transactions. Under the terms of a typical repurchase agreement, the Portfolio takes possession of an underlying debt obligation subject to an obligation of the seller to repurchase, and the Portfolio to resell, the obligation at an agreed-upon price and time. The market value of the collateral must be equal at all times to the total amount of the repurchase obligations, including interest. Generally, in the event of counterparty default, the Portfolio has the right to use the collateral to offset losses incurred.
3. Fees, Expenses, and Related Party Transactions
Investment Advisory Fee. Pacific Investment Management Company LLC (PIMCO) is a majority owned subsidiary partnership of Allianz Dresdner Asset Management of America L.P. (formerly PIMCO Advisors L.P.) and serves as investment adviser (the “Adviser”) to the Trust, pursuant to an investment advisory contract. The Adviser receives a monthly fee at an annual rate based on average daily net assets of the Portfolio. The Advisory Fee is charged at an annual rate of 0.40%.
Administration Fee. PIMCO serves as administrator (the “Administrator”) and provides administrative services to the Trust for which it receives a monthly administrative fee based on average daily net assets of the Portfolio. The Administration Fee is charged at the annual rate of 0.10%.
Servicing Fee. PIMCO Advisors Distributors LLC (“PAD”), is an indirect wholly-owned subsidiary of Allianz Dresdner Asset Management of America L.P. and serves as the distributor of the Trust’s shares. The Trust is permitted to reimburse PAD on a quarterly basis, out of the Administrative Class assets of the
11
Portfolio in the amount of 0.15% on an annual basis of the average daily net assets of that class, for payments made to financial intermediaries that provide services in connection with the distribution of shares or administration of plans or programs that use Portfolio shares as their funding medium. The effective rate paid to PAD during the current fiscal year is 0.15%.
Expenses. The Portfolio is responsible for the following expenses: (i) salaries and other compensation of any of the Trust’s executive officers and employees who are not officers, directors, stockholders or employees of PIMCO or its subsidiaries or affiliates; (ii) taxes and governmental fees; (iii) brokerage fees and commissions and other portfolio transaction expenses; (iv) the cost of borrowing money, including interest expense; (v) fees and expenses of the Trustees who are not “interested persons” of PIMCO or the Trust, and any counsel retained exclusively for their benefit; (vi) extraordinary expenses, including costs of litigation and indemnification expenses; (vii) organization expenses and (viii) any expenses allocated or allocable to a specific class of shares, which include service fees payable with respect to the Administrative Class shares and may include certain other expenses as permitted by the Trust’s Multiple Class Plan adopted pursuant to Rule 18f-3 under the Act and subject to review and approval by the Trustees. The ratio of expenses to average net assets per share class, as disclosed in the Financial Highlights, may differ from the annual Portfolio operating expenses per share class as disclosed in the Prospectus for the reasons set forth above. PIMCO has agreed to waive a portion of its administrative fees to the extent that the payment of the Portfolio’s pro rata share of Trustees’ fees causes the actual expense ratio to rise above the rates disclosed in the current prospectus plus 0.49 basis points as set forth below (calculated as a percentage of the Portfolio’s average daily net assets attributable to each class):
| | | Institutional
Class
| | | Administrative
Class
| |
StocksPLUS Growth and Income Portfolio | | 0.50 | % | | 0.65 | % |
PIMCO may be reimbursed for these waived amounts in future periods. The Trust pays no compensation directly to any Trustee or any other officer who is affiliated with the Administrator, all of whom receive renumeration for their services to the Trust from the Administrator or its affiliates.
Each unaffiliated Trustee receives an annual retainer of $4,000, plus $1,500 for each Board of Trustees meeting attended in person and $250 for each meeting attended telephonically, plus reimbursement of related expenses. In addition, each committee chair receives an additional annual retainer of $500. These expenses are allocated on a pro-rata basis to each Portfolio of the Trust according to its respective net assets.
Organization Expenses. Costs incurred in connection with the organization of the Portfolio and its initial registration are amortized on a straight-line basis over a five-year period from the Portfolio’s commencement of operations.
4. Purchases and Sales of Securities
Purchases and sales of securities (excluding short-term investments) for the period ended June 30, 2003 were as follows (amounts in thousands):
| | | U.S Government/Agency
| | All Other
|
| | | Purchases
| | Sales
| | Purchases
| | Sales
|
StocksPLUS Growth and Income Portfolio | | $ | 63,507 | | $ | 57,262 | | $ | 19,329 | | $ | 38,800 |
5. Transactions in Written Call and Put Options
Transactions in written call and put options were as follows (amounts in thousands):
| | | StocksPLUS Growth
and Income Portfolio
| |
| | | Premium
| |
Balance at 12/31/2002 | | $ | 74 | |
Sales | | | 228 | |
Closing Buys | | | 0 | |
Expirations | | | (194 | ) |
Exercised | | | 0 | |
| | |
|
|
|
Balance at 06/30/2003 | | $ | 108 | |
| | |
|
|
|
6. Federal Income Tax Matters
12
At June 30, 2003, the aggregate cost of investments was the same for federal income tax and financial statement purposes. The net unrealized appreciation (depreciation) of investments securities for federal income tax purposes is as follows (amounts in thousands):
| | | Aggregate Gross
Unrealized
Appreciation
| | Aggregate Gross
Unrealized
(Depreciation)
| | | Net Unrealized
Appreciation
|
StocksPLUS Growth and Income Portfolio | | $ | 2,031 | | $ | (1,492 | ) | | $ | 539 |
7. Shares of Beneficial Interest
The Trust may issue an unlimited number of shares of beneficial interest with a $.0001 par value. Changes in shares of beneficial interest were as follows (shares and amounts in thousands):
| | | StocksPLUS Growth and Income Portfolio
| |
| | | Six Months Ended
06/30/2003 | | | Year Ended
12/31/2002 | |
| | | Shares
| | | Amount
| | | Shares
| | | Amount
| |
Receipts for shares sold | | | | | | | | | | | | | | |
Institutional Class | | 102 | | | $ | 749 | | | 95 | | | $ | 847 | |
Administrative Class | | 5,773 | | | | 42,498 | | | 15,080 | | | | 121,856 | |
Issued as reinvestment of distributions
| | | | | | | | | | | | | | |
Institutional Class | | 2 | | | | 13 | | | 3 | | | | 21 | |
Administrative Class | | 248 | | | | 1,889 | | | 823 | | | | 6,408 | |
Cost of shares redeemed | | | | | | | | | | | | | | |
Institutional Class | | (3 | ) | | | (22 | ) | | (10 | ) | | | (76 | ) |
Administrative Class | | (6,400 | ) | | | (48,217 | ) | | (13,486 | ) | | | (108,884 | ) |
| | |
|
| |
|
|
| |
|
| |
|
|
|
Net increase (decrease) resulting from Portfolio share transactions | | (278 | ) | | $ | (3,090 | ) | | 2,505 | | | $ | 20,172 | |
| | |
|
| |
|
|
| |
|
| |
|
|
|
The following schedule shows the number of shareholders each owning 5% or more of the Portfolio and the total percentage of the Portfolio held by such shareholders:
| | | Number
| | % of Portfolio
Held
|
StocksPLUS Growth and Income Portfolio | | | | |
Institutional Class | | 1 | | 100 |
Administrative Class | | 3 | | 91 |
13
Trustees and Officers
Brent R. Harris, Chairman and Trustee
R. Wesley Burns, President and Trustee
E. Philip Cannon, Trustee
Vern O. Curtis, Trustee
J. Michael Hagan, Trustee
William J. Popejoy, Trustee
Garlin G. Flynn, Secretary
John P. Hardaway, Treasurer
Investment Adviser and Administrator
Pacific Investment Management Company LLC
840 Newport Center Drive
Newport Beach, California 92660
Transfer Agent
National Financial Data Services
330 W. 9th Street, 4th Floor
Kansas City, Missouri 64105
Custodian
State Street Bank & Trust Company
801 Pennsylvania
Kansas City, Missouri 64105
Counsel
Dechert LLP
1775 I Street, N.W.
Washington, D.C. 20006
Independent Accountants
PricewaterhouseCoopers LLP
1055 Broadway
Kansas City, Missouri 64105
PIMCO VARIABLE INSURANCE TRUST
This report is submitted for the general information of the shareholders of the PIMCO Variable Insurance Trust. It is not authorized for distribution to prospective investors unless accompanied or preceded by an effective prospectus for the PIMCO Variable Insurance Trust, which contains information covering its investment policies as well as other pertinent information.
All Funds distributed by PIMCO ADVISORS DISTRIBUTORS LLC, member NASD
840 NEWPORT CENTER DRIVE
NEWPORT BEACH, CA 92660
800.927.4648
WWW.PIMCOADVISORS.COM
WWW.PIMCO.COM
| P I M C O |
| PIMCO VARIABLE INSURANCE TRUST |
| ALL ASSET PORTFOLIO |
| ADMINISTRATIVE CLASS |
|
| SEMI-ANNUAL REPORT |
| June 30, 2003 |
| | | Schedule of
Investments
|
All Asset Portfolio (Administrative Class) | | 6 |
Chairman’s Letter
Dear PIMCO Variable Insurance Trust Shareholder:
Financial assets gained during the first half of 2003 amid a revival of risk appetites as anxiety about the war in Iraq faded. Assets that generally benefit from economic growth, such as stocks, corporate bonds and emerging market debt, fared the best year-to-date as investors returned to these sectors in anticipation of a recovery in the second half of 2003. Reflationary forces that investors expected to fuel a rebound included federal tax cuts and a weak dollar, as well as low borrowing rates that eased the burden of high personal and corporate indebtedness. Low mortgage rates kept refinancings booming in the second quarter and put more money in consumers’ pockets.
U.S. Treasuries lagged their riskier counterparts but still enjoyed a modest rally. Yields fell to levels not seen in 45 years early in the second quarter before bouncing off their lows in June as hopes for recovery increased. The yield on the benchmark 10-year Treasury closed the six-month period 0.30% lower to 3.51%, after nearing 3% earlier in the period. Buyers were encouraged that inflation would remain tame amid low capacity utilization and weak employment growth. Asian central banks bought U.S. Treasuries to limit the rise in their currencies versus the dollar in an effort to protect their export industries. In June, the Federal Reserve cut the federal funds rate by 0.25% to 1%, its 13th easing since 2001, in an effort to boost the economy and ward off deflation. Although the cut was less than expected, the Fed suggested that rates would stay low until deflation risks abated.
The All Asset Portfolio seeks to achieve its investment objective by investing under normal circumstances its assets in Institutional Class shares of the PIMCO Funds: Pacific Investment Management Series, an affiliated open-end investment company, except the All Asset and Strategic Balanced Funds (“Underlying PIMS Funds”). The Portfolio is a “fund of funds”, which is a term used to describe mutual funds that pursue their investment objective by investing in other mutual funds. The Portfolio’s Administrative Class returned 4.64% since its inception on April 30, 2003. The Portfolio’s benchmark is the Lehman Global U.S. TIPS 1-10 Index. All Portfolio returns are net of fees and expenses. Past performance is no guarantee of future results.
On the following pages you will find the Portfolio’s financial statements for the period.
We appreciate the trust you have placed in us, and we will continue to focus our efforts to meet your investment needs.
Sincerely,

Brent R. Harris
Chairman
July 31, 2003
6.30.03 | Semi-Annual Report | | 1 |
Financial Highlights
All Asset Portfolio (Administrative Class)
| Selected Per Share Data for the Period Ended: | | 04/30/2003 - 06/30/2003 +
| |
Net asset value beginning of period | | $ | 10.00 | |
Net investment income (a) | | | 0.08 | |
Net realized/unrealized gain on investments (a) | | | 0.39 | |
Total income from investment operations | | | 0.47 | |
Dividends from net investment income | | | (0.06 | ) |
Distributions from net realized capital gains | | | 0.00 | |
Total distributions | | | (0.06 | ) |
Net asset value end of period | | $ | 10.41 | |
Total return | | | 4.64 | % |
Net assets end of period (000s) | | $ | 559 | |
Ratio of net expenses to average net assets | | | 0.60 | %*(b) |
Ratio of net investment income to average net assets | | | 4.50 | %* |
Portfolio turnover rate | | | 28 | % |
| (a) | | Per share amounts based on average number of shares outstanding during the period. |
| (b) | | Ratio of expenses to average net assets excluding Underlying PIMS Funds’ expenses in which the Portfolio invests. |
2 | | Semi-Annual Report | 6.30.03 | | | See accompanying notes |
Statement of Assets and Liabilities
All Asset Portfolio
June 30, 2003 (Unaudited)
Amounts in thousands, except per share amounts
Assets: | | | |
Investments, at value | | $ | 559 |
Dividends receivable | | | 1 |
| | |
|
|
| | | | 560 |
| | |
|
|
Liabilities: | | | |
Payable for investments purchased | | $ | 1 |
| | |
|
|
| | | | 1 |
| | |
|
|
Net Assets | | $ | 559 |
| | |
|
|
Net Assets Consist of: | | | |
Paid in capital | | $ | 538 |
Undistributed net investment income | | | 2 |
Accumulated undistributed net realized gain | | | 3 |
Net unrealized appreciation | | | 16 |
| | |
|
|
| | | $ | 559 |
| | |
|
|
Net Assets: | | | |
Administrative Class | | | 559 |
Shares Issued and Outstanding: | | | |
Administrative Class | | | 54 |
Net Asset Value and Redemption Price Per Share (Net Assets Per Share Outstanding) | | | |
Administrative Class | | | 10.41 |
Cost of Investments Owned | | $ | 543 |
See accompanying notes | | | 6.30.03 | Semi-Annual Report | | 3 |
Statement of Operations
All Asset Portfolio
For the period ended June 30, 2003 (Unaudited)
Amounts in thousands
Investment Income: | | | |
Dividends | | $ | 6 |
| | |
|
|
Expenses: | | | |
Investment advisory, administration and distribution fees | | | 1 |
| | |
|
|
Net Investment Income | | | 5 |
| | |
|
|
Net Realized and Unrealized Gain (Loss): | | | |
Net realized gain on investments | | | 3 |
Net change in unrealized appreciation on investments | | | 16 |
Net Gain | | | 19 |
| | |
|
|
Net Increase in Assets Resulting from Operations | | $ | 24 |
| | |
|
|
4 | | Semi-Annual Report | 6.30.03 | | | See accompanying notes |
Statements of Changes in Net Assets
All Asset Portfolio
Amounts in thousands
| Increase (Decrease) in Net Assets from: | | Period from
April 30, 2003 to
June 30, 2003
| |
| | | (Unaudited) | |
Operations: | | | | |
Net investment income | | $ | 5 | |
Net realized gain | | | 3 | |
Net change in unrealized appreciation | | | 16 | |
| | |
|
|
|
Net increase resulting from operations | | | 24 | |
| | |
|
|
|
Distributions to Shareholders: | | | | |
From net investment income | | | | |
Administrative Class | | | (3 | ) |
| | |
|
|
|
Total Distributions | | | (3 | ) |
| | |
|
|
|
Portfolio Share Transactions: | | | | |
Receipts for shares sold | | | | |
Administrative Class | | | 586 | |
Issued as reinvestment of distributions | | | | |
Administrative Class | | | 3 | |
Cost of shares redeemed | | | | |
Administrative Class | | | (51 | ) |
| | |
|
|
|
Net increase resulting from Portfolio share transactions | | | 538 | |
| | |
|
|
|
Total Increase in Net Assets | | | 559 | |
| | |
|
|
|
Net Assets: | | | | |
Beginning of period | | | 0 | |
End of period* | | $ | 559 | |
*Including undistributed net investment income of: | | $ | 2 | |
See accompanying notes | | | 6.30.03 | Semi-Annual Report | | 5 |
Schedule of Investments
All Asset Portfolio
June 30, 2003 (Unaudited)
| | | Shares
| | Value
(000s)
|
PIMCO FUNDS (a) 100.0% | | | | | |
CommodityRealReturn Strategy | | 620 | | $ | 8 |
Emerging Markets Bond | | 3,350 | | | 37 |
European Convertible | | 1,069 | | | 12 |
Global | | 138 | | | 1 |
GNMA | | 3,788 | | | 42 |
High Yield | | 2,673 | | | 25 |
Low Duration | | 206 | | | 2 |
Real Return | | 14,101 | | | 164 |
Real Return Asset | | 15,942 | | | 185 |
StocksPLUS | | 2,324 | | | 21 |
StocksPLUS Total Return | | 5,787 | | | 62 |
| | | | |
|
|
Total Investments 100.0%
(Cost $543) | | | | $ | 559 |
Other Assets and Liabilities (Net) 0.0% | | | | | 0 |
| | | | |
|
|
Net Assets 100.0% | | | | $ | 559 |
| | | | |
|
|
Notes to Schedule of Investments:
| (a) | | Institutional Class of each PIMCO Fund. |
6 | | Semi-Annual Report | 6.30.03 | | | See accompanying notes |
Notes to Financial Statements
June 30, 2003 (Unaudited)
1. Organization
The All Asset Portfolio (the “Portfolio”) is a series of the PIMCO Variable Insurance Trust (the “Trust”). The Trust is registered under the Investment Company Act of 1940 (the “Act”), as amended, as an open-end investment company organized as a Delaware business trust on October 3, 1997. The Trust may offer up to two classes of shares: Institutional and Administrative. Each share class has identical voting rights (except that shareholders of a class have exclusive voting rights regarding any matter relating solely to that class of shares). Information presented in these financial statements pertains to the Administrative Class of the Trust. The Trust is designed to be used as an investment vehicle by Separate Accounts of insurance companies that fund variable annuity contracts and variable life insurance policies and by qualified pension and retirement plans. The Portfolio commenced operations on April 30, 2003.
2. Significant Accounting Policies
The following is a summary of significant accounting policies consistently followed by the Trust in the preparation of its financial statements in conformity with accounting principles generally accepted in the United States of America. The preparation of financial statements in accordance with accounting principles generally accepted in the United States of America requires management to make estimates and assumptions that affect the reported amounts and disclosures in the financial statements. Actual results could differ from those estimates.
Security Valuation. Portfolio securities and other financial instruments for which market quotations are readily available are stated at market value. Market value is determined at the close of regular trading (normally, 4:00 p.m., Eastern Time) on the New York Stock Exchange on each day the New York Stock Exchange is open, or if no sales are reported, as is the case for most securities traded over-the-counter, the mean between representative bid and asked quotations obtained from a quotation reporting system or from established market makers. Fixed income securities, including those to be purchased under firm commitment agreements, are normally valued on the basis of quotes obtained from brokers and dealers or pricing services. Short-term investments, which mature in 60 days or less are valued at amortized cost, which approximates market value. Certain fixed income securities for which daily market quotations are not readily available may be valued, pursuant to guidelines established by the Board of Trustees, with reference to fixed income securities whose prices are more readily obtainable. Prices may be obtained from independent pricing services which use information provided by market makers or estimates of market values obtained from yield data relating to investments or securities with similar characteristics. The prices used by the Portfolio may differ from the value that would be realized if the securities were sold and the differences could be material to the financial statements.
Securities Transactions and Investment Income. Securities transactions are recorded as of the trade date. Securities purchased or sold on a when-issued or delayed delivery basis may be settled a month or more after the trade date. Realized gains and losses from securities sold are recorded on the identified cost basis. Dividend income is recorded on the ex-dividend date, except certain dividends from foreign securities where the ex-dividend date may have passed, are recorded as soon as the Portfolio is informed of the ex-dividend date. Interest income, adjusted for the accretion of discounts and amortization of premiums, is recorded on the accrual basis. Paydowns gains and losses on mortgage- and asset-backed securities are recorded as adjustments to interest income in the Statement of Operations.
Dividends and Distributions to Shareholders. Dividends from net investment income, if any, are declared and distributed to shareholders quarterly. All dividends are reinvested in additional shares of the Portfolio. Net realized capital gains earned by the Portfolio, if any, will be distributed no less frequently than once each year.
Income dividends and capital gain distributions are determined in accordance with income tax regulations which may differ from accounting principles generally accepted in the United States of America. These differences are primarily due to differing treatments for such items as wash sales, foreign currency transactions, net operating losses and capital loss carryforwards.
Distributions classified as a tax basis return of capital, if any, are reflected in the accompanying Statement of Changes in Net Assets and have been reclassified to paid in capital. In addition, other amounts have been reclassified between undistributed net investment income, accumulated undistributed net realized gains or losses and/or paid in capital to more appropriately conform financial accounting to tax characterizations of dividend distributions.
Federal Income Taxes. The Portfolio intends to qualify as a regulated investment company and distribute all of its taxable income and net realized gains, if applicable, to shareholders. Accordingly, no provision for Federal income taxes has been made.
3. Fees, Expenses, and Related Party Transactions
Investment Advisory Fee. Pacific Investment Management Company LLC (PIMCO) is a majority owned subsidiary partnership of Allianz Dresdner Asset Management of America L.P. (formerly PIMCO Advisors L.P.) and serves as investment adviser (the “Adviser”) to the Trust, pursuant to an investment
6.30.03 | Semi-Annual Report | | 7 |
advisory contract. The Adviser receives a monthly fee at an annual rate based on average daily net assets of the Portfolio. The Advisory Fee is charged at an annual rate of 0.20%.
PIMCO has contractually agreed, for the All Asset Portfolio’s current fiscal year, to reduce its Advisory Fee to the extent that the Underlying PIMS Fund Expenses (the expenses associated with investing in a “fund of funds”) attributable to Advisory and Administrative Fees exceed 0.60%. PIMCO may recoup these waivers in a future period, not to exceed three years, provided total expenses, including such recoupment, do not exceed the annual expense limit.
Administration Fee. PIMCO serves as administrator (the “Administrator”) and provides administrative services to the Trust for which it receives a monthly administrative fee based on average daily net assets of the Portfolio. The Administration Fee is charged at the annual rate of 0.25%.
Servicing Fee. PIMCO Advisors Distributors LLC (“PAD”), is an indirect wholly-owned subsidiary of Allianz Dresdner Asset Management of America L.P. and serves as the distributor of the Trust’s shares. The Trust is permitted to reimburse PAD on a quarterly basis, out of the Administrative Class assets of the Portfolio in the amount of 0.15% on an annual basis of the average daily net assets of that class, for payments made to financial intermediaries that provide services in connection with the distribution of shares or administration of plans or programs that use Portfolio shares as their funding medium. The effective rate paid to PAD during the current fiscal year is 0.15%.
Expenses. The Portfolio is responsible for the following expenses: (i) salaries and other compensation of any of the Trust’s executive officers and employees who are not officers, directors, stockholders or employees of PIMCO or its subsidiaries or affiliates; (ii) taxes and governmental fees; (iii) brokerage fees and commissions and other portfolio transaction expenses; (iv) the cost of borrowing money, including interest expense; (v) fees and expenses of the Trustees who are not “interested persons” of PIMCO or the Trust, and any counsel retained exclusively for their benefit; (vi) extraordinary expenses, including costs of litigation and indemnification expenses; (vii) organization expenses and (viii) any expenses allocated or allocable to a specific class of shares, which include service fees payable with respect to the Administrative Class shares and may include certain other expenses as permitted by the Trust’s Multiple Class Plan adopted pursuant to Rule 18f-3 under the Act and subject to review and approval by the Trustees. The ratio of expenses to average net assets per share class, as disclosed in the Financial Highlights, may differ from the annual Portfolio operating expenses per share class as disclosed in the Prospectus for the reasons set forth above. PIMCO has agreed to waive a portion of its administrative fees to the extent that the payment of the Portfolio’s pro rata share of Trustees’ fees causes the actual expense ratio to rise above the rates disclosed in the current prospectus plus 0.49 basis points as set forth below (calculated as a percentage of the Portfolio’s average daily net assets attributable to each class) excluding the Underlying Funds’ expenses in which the Portfolio invests:
| | | Administrative
Class
| |
All Asset Portfolio | | 0.60 | % |
PIMCO may be reimbursed for these waived amounts in future periods. The Trust pays no compensation directly to any Trustee or any other officer who is affiliated with the Administrator, all of whom receive renumeration for their services to the Trust from the Administrator or its affiliates.
Each unaffiliated Trustee receives an annual retainer of $4,000, plus $1,500 for each Board of Trustees meeting attended in person and $250 for each meeting attended telephonically, plus reimbursement of related expenses. In addition, each committee chair receives an additional annual retainer of $500. These expenses are allocated on a pro-rata basis to each Portfolio of the Trust according to its respective net assets.
4. Risk Factors of the Portfolio
Investing in the Underlying Funds through the All Asset Portfolio involves certain additional expenses and tax results that would not be present in a direct investment in the Underlying Funds. Under certain circumstances, an Underlying Fund may pay a redemption request by the All Asset Portfolio wholly or partly by a distribution in kind of securities from its portfolio, instead of cash, in accordance with the rules of the Securities and Exchange Commission. In such cases, the Portfolio may hold securities distributed by an Underlying Fund until the Adviser determines that it is appropriate to dispose of such securities.
Each of the Underlying Funds may invest in certain specified derivative securities, including: interest rate swaps; caps and floors for hedging purposes; exchange-traded options; over-the-counter options executed with primary dealers, including long calls and puts and covered calls and financial futures and options. Certain of the Underlying Funds may invest in restricted securities, instruments issued by trusts, partnerships or other issuers, including pass-through certificates representing participation in, or debt instruments backed by, the securities owned by such issuers. The Underlying Funds also may engage in securities lending, reverse repurchase agreements and dollar roll transactions. In addition, certain of the Underlying Funds may invest in below-investment grade debt, debt obligations of foreign issuers and stocks of foreign corporations, securities in foreign investment funds or trusts, foreign derivatives securities including future contracts, options, interest rate and currency swap transactions, and various other investment vehicles, each with inherent risks.
8 | | Semi-Annual Report | 6.30.03 |
The officers and directors of the Trust also serve as officers and directors/trustees of the Underlying Funds. Conflicts may arise as these companies seek to fulfill their fiduciary responsibilities to both the Portfolio and the Underlying Funds.
5. Federal Income Tax Matters
At June 30, 2003, the aggregate cost of investments was the same for federal income tax and financial statement purposes. The net unrealized appreciation (depreciation) of investments securities for federal income tax purposes is as follows (amounts in thousands):
| | | Aggregate Gross
Unrealized
Appreciation
| | Aggregate Gross
Unrealized
(Depreciation)
| | Net Unrealized
Appreciation
|
All Asset Portfolio | | $ | 16 | | $ | 0 | | $ | 16 |
6. Shares of Beneficial Interest
The Trust may issue an unlimited number of shares of beneficial interest with a $.0001 par value. Changes in shares of beneficial interest were as follows (shares and amounts in thousands):
| | | All Asset Portfolio
| |
| | | Period from
04/30/2003 to 06/30/2003 | |
| | | Shares
| | | Amount
| |
Receipts for shares sold | | | | | | | |
Administrative Class | | 59 | | | $ | 586 | |
Issued as reinvestment of distributions
Administrative Class | | 0 | | | | 3 | |
Cost of shares redeemed
Administrative Class | | (5 | ) | | | (51 | ) |
| | |
|
| |
|
|
|
Net increase resulting from Portfolio share transactions | | 54 | | | $ | 538 | |
| | |
|
| |
|
|
|
The following schedule shows the number of shareholders each owning 5% or more of the Portfolio and the total percentage of the Portfolio held by such shareholders:
| | | Number
| | % of Portfolio
Held
|
All Asset Portfolio | | 2 | | 99 |
6.30.03 | Semi-Annual Report | | 9 |
Trustees and Officers
Brent R. Harris, Chairman and Trustee
R. Wesley Burns, President and Trustee
E. Philip Cannon, Trustee
Vern O. Curtis, Trustee
J. Michael Hagan, Trustee
William J. Popejoy, Trustee
Garlin G. Flynn, Secretary
John P. Hardaway, Treasurer
Investment Adviser and Administrator
Pacific Investment Management Company LLC
840 Newport Center Drive
Newport Beach, California 92660
Transfer Agent
National Financial Data Services
330 W. 9th Street, 4th Floor
Kansas City, Missouri 64105
Custodian
State Street Bank & Trust Company
801 Pennsylvania
Kansas City, Missouri 64105
Counsel
Dechert LLP
1775 I Street, N.W.
Washington, D.C. 20006
Independent Accountants
PricewaterhouseCoopers LLP
1055 Broadway
Kansas City, Missouri 64105
PIMCO VARIABLE INSURANCE TRUST
This report is submitted for the general information of the shareholders of the PIMCO Variable Insurance Trust. It is not authorized for distribution to prospective investors unless accompanied or preceded by an effective prospectus for the PIMCO Variable Insurance Trust, which contains information covering its investment policies as well as other pertinent information.
All Funds distributed by PIMCO ADVISORS DISTRIBUTORS LLC, member NASD
840 NEWPORT CENTER DRIVE
NEWPORT BEACH, CA 92660
800.927.4648
WWW.PIMCOADVISORS.COM
WWW.PIMCO.COM
| P I M C O |
| PIMCO VARIABLE INSURANCE TRUST |
| FOREIGN BOND PORTFOLIO |
| INSTITUTIONAL CLASS |
|
| SEMI-ANNUAL REPORT |
| June 30, 2003 |
| | | Fund Summary
| | Schedule of Investments
|
Foreign Bond Portfolio (Institutional Class) | | 2 | | 8 |
Chairman’s Letter
Dear PIMCO Variable Insurance Trust Shareholder:
Financial assets gained during the first half of 2003 amid a revival of risk appetites as anxiety about the war in Iraq faded. Assets that generally benefit from economic growth, such as stocks, corporate bonds and emerging market debt, fared the best year-to-date as investors returned to these sectors in anticipation of a recovery in the second half of 2003. Reflationary forces that investors expected to fuel a rebound included federal tax cuts and a weak dollar, as well as low borrowing rates that eased the burden of high personal and corporate indebtedness. Low mortgage rates kept refinancings booming in the second quarter and put more money in consumers’ pockets.
U.S. Treasuries lagged their riskier counterparts but still enjoyed a modest rally. Yields fell to levels not seen in 45 years early in the second quarter before bouncing off their lows in June as hopes for recovery increased. The yield on the benchmark 10-year Treasury closed the six-month period 0.30% lower to 3.51%, after nearing 3% earlier in the period. Buyers were encouraged that inflation would remain tame amid low capacity utilization and weak employment growth. Asian central banks bought U.S. Treasuries to limit the rise in their currencies versus the dollar in an effort to protect their export industries. In June, the Federal Reserve cut the federal funds rate by 0.25% to 1%, its 13th easing since 2001, in an effort to boost the economy and ward off deflation. Although the cut was less than expected, the Fed suggested that rates would stay low until deflation risks abated.
On the following pages you will find specific details as to the Portfolio’s total return investment performance and a discussion of those factors that affected performance.
We appreciate the trust you have placed in us, and we will continue to focus our efforts to meet your investment needs.
Sincerely,
Brent R. Harris
Chairman
July 31, 2003
6.30.03 | Semi-Annual Report | | 1 |
Foreign Bond Portfolio
TOTAL RETURN INVESTMENT PERFORMANCE For the period ended June 30, 2003
| | | 1 Year | | | Since Inception* | |
Foreign Bond Portfolio Institutional Class | | 8.52 | % | | 8.03 | % |
J.P. Morgan Non-U.S. Index (Hedged) | | 7.77 | % | | — | |
| * | | Annualized (All Portfolio returns are net of fees and expenses) |
CUMULATIVE RETURNS THROUGH JUNE 30, 2003
$10,000 invested at inception
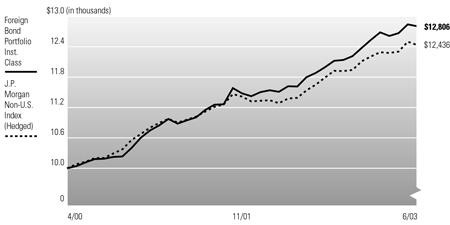
Past performance is no guarantee of future results. Investment return and principal value will fluctuate so that Portfolio shares, when redeemed, may be worth more or less than their original cost. The line graph above assumes the investment of $10,000 on 5/01/2000, the first full month following the Portfolio’s Institutional Class inception on 4/10/2000, compared to the J.P. Morgan Non-U.S. Index (Hedged), an unmanaged market index. It is not possible to invest directly in the Index. The Portfolio may invest in foreign securities which involve potentially higher risks including foreign currency fluctuations and political or economic uncertainty. These risks may be enhanced when investing in emerging market securities.
PORTFOLIO INSIGHTS
| • | | The Foreign Bond Portfolio seeks to achieve its investment objective by investing under normal circumstances at least 80% of its assets in Fixed Income Instruments of issuers located outside the United States, representing at least three foreign countries, which may be represented by futures contracts (including related options) with respect to such securities, and options on such securities. |
| • | | The Portfolio returned 3.38% for the six-month period ended June 30, 2003, outperforming the 2.65% return of the J.P. Morgan Non-U.S. Index (Hedged) for the same period. |
| • | | Above-Index duration on an ex-Japan basis was positive for performance as interest rates declined worldwide. |
| • | | An overweight in short and intermediate maturity Euroland bonds versus the U.S., was a positive as Euroland yields fell on weak growth, falling inflation and two rate cuts by the European Central Bank. |
| • | | A long position in the euro versus the U.S. dollar was strongly positive for returns, as the burgeoning U.S. deficit and outflow of U.S. investment weakened the dollar relative to most major currencies. |
| • | | An underweight to Japanese government bonds was a strong positive. JGBs ended the second quarter with a sell-off that took 10-year yields from historic lows to multi-year highs. |
2 | | Semi-Annual Report | 6.30.03 |
Financial Highlights
Foreign Bond Portfolio (Institutional Class)
| Selected Per Share Data for the Year or Period Ended: | | 06/30/2003 +
| | | 12/31/2002
| | | 12/31/2001
| | | 04/10/2000-12/31/2000
| |
Net asset value beginning of period | | $ | 10.07 | | | $ | 9.69 | | | $ | 9.40 | | | $ | 9.48 | |
Net investment income (a) | | | 0.14 | | | | 0.41 | | | | 0.44 | | | | 0.39 | |
Net realized/unrealized gain on investments (a) | | | 0.21 | | | | 0.38 | | | | 0.28 | | | | 0.18 | |
Total income from investment operations | | | 0.35 | | | | 0.79 | | | | 0.72 | | | | 0.57 | |
Dividends from net investment income | | | (0.15 | ) | | | (0.37 | ) | | | (0.43 | ) | | | (0.39 | ) |
Distributions from net realized capital gains | | | 0.00 | | | | (0.04 | ) | | | 0.00 | | | | (0.26 | ) |
Total distributions | | | (0.15 | ) | | | (0.41 | ) | | | (0.43 | ) | | | (0.65 | ) |
Net asset value end of period | | $ | 10.27 | | | $ | 10.07 | | | $ | 9.69 | | | $ | 9.40 | |
Total return | | | 3.45 | % | | | 8.36 | % | | | 7.75 | % | | | 6.18 | % |
Net assets end of period (000s) | | $ | 12 | | | $ | 12 | | | $ | 935 | | | $ | 5,185 | |
Ratio of expenses to average net assets | | | 0.75 | %* | | | 0.75 | % | | | 0.75 | % | | | 0.74 | %* |
Ratio of net investment income to average net assets | | | 2.81 | %* | | | 4.24 | % | | | 4.56 | % | | | 5.58 | %* |
Portfolio turnover rate | | | 223 | % | | | 321 | % | | | 285 | % | | | 306 | % |
| (a) | | Per share amounts based on average number of shares outstanding during the period. |
See accompanying notes | | | 6.30.03 | Semi-Annual Report | | 3 |
Statement of Assets and Liabilities
Foreign Bond Portfolio
June 30, 2003 (Unaudited)
Amounts in thousands, except per share amounts
Assets: | | | | |
Investments, at value | | $ | 44,732 | |
Foreign currency, at value | | | 239 | |
Receivable for investments sold | | | 9,642 | |
Unrealized appreciation on forward foreign currency contracts | | | 131 | |
Receivable for Portfolio shares sold | | | 69 | |
Interest receivable | | | 486 | |
Variation margin receivable | | | 10 | |
Swap premiums paid | | | 35 | |
Unrealized appreciation on forward volatility options | | | 6 | |
Unrealized appreciation on swap agreements | | | 81 | |
| | |
|
|
|
| | | | 55,431 | |
| | |
|
|
|
Liabilities: | | | | |
Payable for investments purchased | | $ | 18,399 | |
Unrealized depreciation on forward foreign currency contracts | | | 2 | |
Payable for financing transactions | | | 1,020 | |
Payable for short sale | | | 4,830 | |
Written options outstanding | | | 36 | |
Accrued investment advisory fee | | | 6 | |
Accrued administration fee | | | 12 | |
Accrued servicing fee | | | 3 | |
Variation margin payable | | | 3 | |
Swap premiums received | | | 69 | |
Unrealized depreciation on swap agreements | | | 176 | |
Other liabilities | | | 18 | |
| | |
|
|
|
| | | | 24,574 | |
| | |
|
|
|
Net Assets | | $ | 30,857 | |
| | |
|
|
|
Net Assets Consist of: | | | | |
Paid in capital | | $ | 29,871 | |
Undistributed (overdistributed) net investment income | | | (504 | ) |
Accumulated undistributed net realized (loss) | | | (600 | ) |
Net unrealized appreciation | | | 2,090 | |
| | |
|
|
|
| | | $ | 30,857 | |
| | |
|
|
|
Net Assets: | | | | |
Institutional Class | | $ | 12 | |
Administrative Class | | | 30,845 | |
Shares Issued and Outstanding: | | | | |
Institutional Class | | | 1 | |
Administrative Class | | | 3,004 | |
Net Asset Value and Redemption Price Per Share (Net Assets Per Share Outstanding) | | | | |
Institutional Class | | $ | 10.27 | |
Administrative Class | | | 10.27 | |
Cost of Investments Owned | | $ | 42,886 | |
Cost of Foreign Currency Held | | $ | 240 | |
4 | | Semi-Annual Report | 6.30.03 | | | See accompanying notes |
Statement of Operations
Foreign Bond Portfolio
For the six months ended June 30, 2003 (Unaudited)
Amounts in thousands
Investment Income: | | | | |
Interest | | $ | 398 | |
Dividends, net of foreign taxes | | | 2 | |
Miscellaneous income | | | 6 | |
| | |
|
|
|
Total Income | | | 406 | |
| | |
|
|
|
Expenses: | | | | |
Investment advisory fees | | | 28 | |
Administration fees | | | 56 | |
Distribution and/or servicing fees - Administrative Class | | | 17 | |
Interest expense | | | 3 | |
| | |
|
|
|
Total Expenses | | | 104 | |
| | |
|
|
|
Net Investment Income | | | 302 | |
| | |
|
|
|
Net Realized and Unrealized Gain (Loss): | | | | |
Net realized gain on investments | | | 451 | |
Net realized gain on futures contracts, written options, and swaps | | | 198 | |
Net realized (loss) on foreign currency transactions | | | (779 | ) |
Net change in unrealized (depreciation) on investments | | | (270 | ) |
Net change in unrealized (depreciation) on futures contracts, written options, and swaps | | | (115 | ) |
Net change in unrealized appreciation on translation of assets and liabilities denominated in foreign currencies | | | 838 | |
Net Gain | | | 323 | |
| | |
|
|
|
Net Increase in Assets Resulting from Operations | | $ | 625 | |
| | |
|
|
|
See accompanying notes | | | 6.30.03 | Semi-Annual Report | | 5 |
Statements of Changes in Net Assets
Foreign Bond Portfolio
Amounts in thousands
| Increase (Decrease) in Net Assets from: | | Six Months Ended June 30, 2003
| | | Year Ended December 31, 2002
| |
| | | (Unaudited) | | | | |
Operations: | | | | | | | | |
Net investment income | | $ | 302 | | | $ | 361 | |
Net realized loss | | | (130 | ) | | | (1,323 | ) |
Net change in unrealized appreciation | | | 453 | | | | 1,842 | |
| | |
|
|
| |
|
|
|
Net increase resulting from operations | | | 625 | | | | 880 | |
| | |
|
|
| |
|
|
|
Distributions to Shareholders: | | | | | | | | |
From net investment income | | | | | | | | |
Institutional Class | | | 0 | | | | (2 | ) |
Administrative Class | | | (310 | ) | | | (353 | ) |
From net realized capital gains | | | | | | | | |
Institutional Class | | | 0 | | | | 0 | |
Administrative Class | | | 0 | | | | (61 | ) |
Tax basis return of capital | | | | | | | | |
Institutional Class | | | 0 | | | | 0 | |
Administrative Class | | | 0 | | | | (4 | ) |
| | |
|
|
| |
|
|
|
Total Distributions | | | (310 | ) | | | (420 | ) |
| | |
|
|
| |
|
|
|
Portfolio Share Transactions: | | | | | | | | |
Receipts for shares sold | | | | | | | | |
Institutional Class | | | 0 | | | | 0 | |
Administrative Class | | | 16,300 | | | | 19,462 | |
Issued as reinvestment of distributions | | | | | | | | |
Institutional Class | | | 0 | | | | 3 | |
Administrative Class | | | 310 | | | | 417 | |
Cost of shares redeemed | | | | | | | | |
Institutional Class | | | 0 | | | | (930 | ) |
Administrative Class | | | (2,856 | ) | | | (8,415 | ) |
| | |
|
|
| |
|
|
|
Net increase resulting from Portfolio share transactions | | | 13,754 | | | | 10,537 | |
| | |
|
|
| |
|
|
|
Total Increase in Net Assets | | | 14,069 | | | | 10,997 | |
| | |
|
|
| |
|
|
|
Net Assets: | | | | | | | | |
Beginning of period | | | 16,788 | | | | 5,791 | |
End of period* | | $ | 30,857 | | | $ | 16,788 | |
*Including (overdistributed) net investment income of: | | $ | (504 | ) | | $ | (497 | ) |
6 | | Semi-Annual Report | 6.30.03 | | | See accompanying notes |
Statement of Cash Flows
Foreign Bond Portfolio
For six months ended June 30, 2003 (Unaudited)
Amounts in thousands
| Increase (Decrease) in Cash and Foreign Currency from: | | | |
| |
Financing Activities: | | | | |
Sales of Portfolio shares | | $ | 16,272 | |
Redemptions of Portfolio shares | | | (2,895 | ) |
Proceeds from financing transactions | | | (9,175 | ) |
| | |
|
|
|
Net increase from financing activities | | | 4,202 | |
| | |
|
|
|
Operating Activities: | | | | |
Purchases of long-term securities and foreign currency | | | (60,000 | ) |
Proceeds from sales of long-term securities and foreign currency | | | 59,727 | |
Purchases of short-term securities (net) | | | (3,281 | ) |
Net investment income | | | 302 | |
Change in other receivables/payables (net) | | | (1,046 | ) |
| | |
|
|
|
Net (decrease) from operating activities | | | (4,298 | ) |
| | |
|
|
|
Net (Decrease) in Cash and Foreign Currency | | | (96 | ) |
| | |
|
|
|
Cash and Foreign Currency: | | | | |
Beginning of period | | | 335 | |
End of period | | $ | 239 | |
See accompanying notes | | | 6.30.03 | Semi-Annual Report | | 7 |
Schedule of Investments
Foreign Bond Portfolio
June 30, 2003 (Unaudited)
| | | Principal Amount (000s)
| | Value (000s)
|
AUSTRALIA 0.4% | | | | | | |
Crusade Global Trust | | | | | | |
1.620% due 05/15/2021 (a) | | $ | 31 | | $ | 31 |
Medallion Trust | | | | | | |
1.510% due 07/12/2031 (a) | | | 39 | | | 39 |
National Australia Bank Ltd. | | | | | | |
1.915% due 05/19/2010 (a) | | | 50 | | | 50 |
| | | | | |
|
|
Total Australia
(Cost $120) | | | | | | 120 |
| | | | | |
|
|
AUSTRIA (i)(j) 1.6% | | | | | | |
Republic of Austria | | | | | | |
5.250% due 01/04/2011 | | EC | 300 | | | 383 |
3.800% due 10/20/2013 | | | 100 | | | 114 |
| | | | | |
|
|
Total Austria
(Cost $450) | | | | | | 497 |
| | | | | |
|
|
BRAZIL 0.1% | | | | | | |
Republic of Brazil | | | | | | |
2.125% due 04/15/2006 (a) | | $ | 48 | | | 45 |
| | | | | |
|
|
Total Brazil
(Cost $46) | | | | | | 45 |
| | | | | |
|
|
CANADA (i)(j) 2.9% | | | | | | |
Commonwealth of Canada | | | | | | |
5.500% due 06/01/2009 | | C$ | 200 | | | 159 |
5.500% due 06/01/2010 | | | 300 | | | 238 |
6.000% due 06/01/2011 | | | 600 | | | 490 |
| | | | | |
|
|
Total Canada
(Cost $771) | | | | | | 887 |
| | | | | |
|
|
DENMARK (i)(j) 0.3% | | | | | | |
Nykredit | | | | | | |
6.000% due 10/01/2029 | | DK | 680 | | | 108 |
| | | | | |
|
|
Total Denmark
(Cost $74) | | | | | | 108 |
| | | | | |
|
|
FRANCE (i)(j) 2.3% | | | | | | |
France Telecom S.A. | | | | | | |
1.010% due 07/16/2003 (a) | | JY | 10,000 | | | 83 |
Republic of France | | | | | | |
6.000% due 04/25/2004 | | EC | 310 | | | 367 |
4.000% due 04/25/2009 | | | 80 | | | 96 |
4.000% due 10/25/2009 | | | 30 | | | 36 |
5.500% due 04/25/2010 | | | 110 | | | 142 |
| | | | | |
|
|
Total France
(Cost $546) | | | | | | 724 |
| | | | | |
|
|
GERMANY (i)(j) 22.9% | | | | | | |
KFW International Finance, Inc. | | | | | | |
3.500% due 11/15/2005 | | EC | 100 | | | 118 |
Landesbank Baden-Wuerttemberg AG | | | | | | |
5.500% due 04/02/2007 | | | 30 | | | 38 |
Republic of Germany | | | | | | |
6.500% due 10/14/2005 | | | 2,200 | | | 2,761 |
5.000% due 02/17/2006 | | | 300 | | | 368 |
6.250% due 04/26/2006 (b) | | | 600 | | | 760 |
5.250% due 01/04/2008 | | | 210 | | | 265 |
4.500% due 07/04/2009 (b) | | | 400 | | | 491 |
5.375% due 01/04/2010 (b) | | | 400 | | | 513 |
5.250% due 07/04/2010 (b) | | | 300 | | | 383 |
5.250% due 01/04/2011 | | | 100 | | | 128 |
5.000% due 01/04/2012 | | | 100 | | | 126 |
4.500% due 01/04/2013 | | | 80 | | | 97 |
5.000% due 07/04/2027 (b) | | | 590 | | | 854 |
4.750% due 07/04/2028 | | | 30 | | | 35 |
5.500% due 01/04/2031 | | | 100 | | | 129 |
| | | | | |
|
|
Total Germany
(Cost $6,066) | | | | | | 7,066 |
| | | | | |
|
|
ITALY (i)(j) 19.3% | | | | | | |
First Italian Auto Transaction | | | | | | |
2.809% due 07/12/2008 (a) | | EC | 70 | | $ | 80 |
Republic of Italy | | | | | | |
2.125% due 02/01/2006 (b) | | | 400 | | | 541 |
3.500% due 01/15/2008 (b) | | | 3,700 | | | 4,354 |
4.500% due 05/01/2009 (b) | | | 360 | | | 441 |
4.250% due 11/01/2009 (b) | | | 60 | | | 73 |
5.500% due 11/01/2010 (b) | | | 110 | | | 142 |
Seashell Securities PLC | | | | | | |
2.852% due 10/25/2028 (a) | | | 200 | | | 230 |
Telecom Italia SpA | | | | | | |
5.625% due 02/01/2007 | | | 70 | | | 86 |
| | | | | |
|
|
Total Italy
(Cost $5,957) | | | | | | 5,947 |
| | | | | |
|
|
JAPAN (i)(j) 11.4% | | | | | | |
Government of Japan | | | | | | |
1.900% due 12/20/2010 (b) | | JY | 48,000 | | | 437 |
1.500% due 12/20/2011 | | | 107,000 | | | 948 |
1.300% due 09/20/2012 | | | 40,000 | | | 348 |
2.600% due 03/20/2019 (b) | | | 50,000 | | | 512 |
1.900% due 09/20/2022 (b) | | | 3,000 | | | 28 |
Japan Finance Corp. for Municipal Enterprises | | | | | | |
1.550% due 02/21/2012 | | | 130,000 | | | 1,152 |
Japan Financial Corp. | | | | | | |
5.875% due 03/14/2011 | | $ | 80 | | | 90 |
| | | | | |
|
|
Total Japan
(Cost $3,575) | | | | | | 3,515 |
| | | | | |
|
|
MEXICO 0.9% | | | | | | |
Bancomext Trust | | | | | | |
8.000% due 08/05/2003 | | $ | 10 | | | 10 |
Petroleos Mexicanos | | | | | | |
8.850% due 09/15/2007 | | | 20 | | | 24 |
9.375% due 12/02/2008 | | | 30 | | | 37 |
United Mexican States | | | | | | |
6.375% due 01/16/2013 | | | 200 | | | 212 |
| | | | | |
|
|
Total Mexico
(Cost $255) | | | | | | 283 |
| | | | | |
|
|
NETHERLANDS (i)(j) 0.8% | | | | | | |
Kingdom of Netherlands | | | | | | |
6.000% due 01/15/2006 | | EC | 200 | | | 250 |
| | | | | |
|
|
Total Netherlands
(Cost $195) | | | | | | 250 |
| | | | | |
|
|
NEW ZEALAND (i)(j) 0.2% | | | | | | |
Commonwealth of New Zealand | | | | | | |
4.500% due 02/15/2016 | | N$ | 86 | | | 65 |
| | | | | |
|
|
Total New Zealand
(Cost $48) | | | | | | 65 |
| | | | | |
|
|
PANAMA 0.1% | | | | | | |
Republic of Panama | | | | | | |
9.375% due 01/16/2023 | | $ | 40 | | | 45 |
| | | | | |
|
|
Total Panama
(Cost $40) | | | | | | 45 |
| | | | | |
|
|
PERU 0.2% | | | | | | |
Republic of Peru | | | | | | |
9.125% due 02/21/2012 | | $ | 30 | | | 32 |
5.000% due 03/07/2017 (a) | | | 38 | | | 33 |
| | | | | |
|
|
Total Peru
(Cost $57) | | | | | | 65 |
| | | | | |
|
|
SPAIN (i)(j) 5.5% | | | | | | |
Kingdom of Spain | | | | | | |
4.950% due 07/30/2005 | | EC | 30 | | $ | 36 |
5.150% due 07/30/2009 | | | 1,210 | | | 1,535 |
4.000% due 01/31/2010 | | | 100 | | | 119 |
| | | | | |
|
|
Total Spain
(Cost $1,629) | | | | | | 1,690 |
| | | | | |
|
|
SUPRANATIONAL (i)(j) 0.2% | | | | | | |
Eurofima | | | | | | |
4.750% due 07/07/2004 | | SK | 600 | | | 76 |
| | | | | |
|
|
Total Supranational
(Cost $69) | | | | | | 76 |
| | | | | |
|
|
SWEDEN (i)(j) 0.2% | | | | | | |
Kingdom of Sweden | | | | | | |
5.000% due 01/28/2009 | | SK | 400 | | | 53 |
| | | | | |
|
|
Total Sweden
(Cost $40) | | | | | | 53 |
| | | | | |
|
|
UNITED KINGDOM (i)(j) 13.6% | | | | | | |
British Telecom PLC | | | | | | |
2.413% due 12/15/2003 (a) | | $ | 50 | | | 50 |
Haus Ltd. | | | | | | |
2.458% due 12/14/2037 (a) | | EC | 85 | | | 98 |
Lloyds TSB Bank PLC | | | | | | |
5.625% due 07/15/2049 (a) | | | 40 | | | 49 |
1.437% due 11/29/2049 (a) | | $ | 100 | | | 79 |
Residential Mortgage Securities | | | | | | |
1.651% due 05/12/2032 (a) | | | 22 | | | 22 |
United Kingdom Gilt | | | | | | |
7.250% due 12/07/2007 (b) | | BP | 1,150 | | | 2,166 |
5.000% due 03/07/2008 | | | 1,000 | | | 1,735 |
| | | | | |
|
|
Total United Kingdom
(Cost $4,108) | | | | | | 4,199 |
| | | | | |
|
|
UNITED STATES (i)(j) 42.5% | | | | | | |
Asset-Backed Securities 1.8% | | | | | | |
Ameriquest Mortgage Securities, Inc. | | | | | | |
1.500% due 06/15/2030 (a) | | $ | 9 | | | 9 |
Amortizing Residential Collateral Trust | | | | | | |
1.385% due 10/25/2031 (a) | | | 48 | | | 48 |
AMRESCO Residential Securities Corp. | | | | | | |
Mortgage Loan Trust | | | | | | |
1.505% due 06/25/2029 (a) | | | 9 | | | 9 |
Credit-Based Asset Servicing and Securities | | | | | | |
1.355% due 06/25/2032 (a) | | | 71 | | | 71 |
CS First Boston Mortgage Securities Corp. | | | | | | |
1.440% due 12/15/2030 (a) | | | 12 | | | 12 |
First Alliance Mortgage Loan Trust | | | | | | |
1.333% due 12/20/2027 (a) | | | 10 | | | 10 |
Household Mortgage Loan Trust | | | | | | |
1.403% due 05/20/2032 (a) | | | 63 | | | 63 |
Long Beach Auto Receivables Trust | | | | | | |
3.114% due 03/13/2005 (a) | | | 3 | | | 3 |
MLCC Mortgage Investors, Inc. | | | | | | |
1.560% due 03/15/2025 (a) | | | 45 | | | 45 |
Morgan Stanley Dean Witter Capital I | | | | | | |
1.405% due 07/25/2030 (a) | | | 51 | | | 51 |
1.365% due 07/25/2032 (a) | | | 72 | | | 72 |
Novastar Home Equity Loan | | | | | | |
1.310% due 04/25/2028 (a) | | | 18 | | | 18 |
1.315% due 01/25/2031 (a) | | | 26 | | | 26 |
Providian Home Equity Loan Trust | | | | | | |
1.325% due 06/25/2025 (a) | | | 16 | | | 16 |
Residential Asset Securities Corp. | | | | | | |
1.285% due 07/25/2032 (a) | | | 120 | | | 120 |
| | | | | |
|
|
| | | | | | | 573 |
| | | | | |
|
|
8 | | Semi-Annual Report | 6.30.03 | | | See accompanying notes |
| | | Principal Amount (000s)
| | Value (000s)
| |
Corporate Bonds & Notes 2.9% | | | | | | | |
AOL Time Warner, Inc. | | | | | | | |
5.625% due 05/01/2005 | | $ | 00 | | $ | 106 | |
AT&T Corp. | | | | | | | |
4.381% due 11/21/2003 (a) | | EC | 100 | | | 115 | |
CIT Group, Inc. | | | | | | | |
5.625% due 05/17/2004 | | $ | 60 | | | 62 | |
Comcast Corp. | | | | | | | |
7.050% due 03/15/2033 | | | 100 | | | 111 | |
DaimlerChrysler North America Holding Corp. | | | | | | | |
6.400% due 05/15/2006 | | | 60 | | | 66 | |
Entergy Gulf States, Inc. | | | | | | | |
1.960% due 06/18/2007 (a) | | | 100 | | | 100 | |
Ford Motor Credit Co. | | | | | | | |
1.000% due 12/22/2003 (a) | | JY | 1,000 | | | 8 | |
General Motors Acceptance Corp. | | | | | | | |
6.875% due 09/09/2004 | | BP | 75 | | | 126 | |
J.P. Morgan Chase & Co. | | | | | | | |
5.385% due 02/15/2012 (a) | | $ | 10 | | | 11 | |
KFW International Finance, Inc. | | | | | | | |
1.750% due 03/23/2010 | | JY | 11,000 | | | 99 | |
Pemex Project Funding Master Trust | | | | | | | |
8.625% due 02/01/2022 | | | 20 | | | 23 | |
Pfizer, Inc. | | | | | | | |
0.800% due 03/18/2008 | | JY | 6,000 | | | 51 | |
Sprint Capital Corp. | | | | | | | |
5.875% due 05/01/2004 | | $ | 10 | | | 10 | |
| | | | | |
|
|
|
| | | | | | | 888 | |
| | | | | |
|
|
|
Mortgage-Backed Securities 20.3% | | | | | | | |
Bear Stearns Adjustable Rate Mortgage Trust | | | | | | | |
6.863% due 02/25/2031 (a) | | | 7 | | | 7 | |
6.158% due 01/25/2032 (a) | | | 15 | | | 15 | |
5.700% due 03/25/2032 (a) | | | 35 | | | 35 | |
Countrywide Home Loans, Inc. | | | | | | | |
6.500% due 08/25/2032 (a) | | | 15 | | | 15 | |
CS First Boston Mortgage Securities Corp. | | | | | | | |
1.375% due 07/25/2032 (a) | | | 38 | | | 38 | |
1.886% due 08/25/2033 (a) | | | 93 | | | 92 | |
Fannie Mae | | | | | | | |
1.385% due 01/25/2016 (a) | | | 52 | | | 52 | |
5.500% due 11/01/2016 | | | 590 | | | 614 | |
5.500% due 12/01/2017 | | | 140 | | | 145 | |
5.500% due 02/01/2018 | | | 300 | | | 312 | |
5.500% due 03/01/2018 | | | 1,170 | | | 1,216 | |
5.390% due 04/01/2033 (a) | | | 89 | | | 91 | |
5.000% due 12/31/2099 | | | 1,000 | | | 1,019 | |
6.000% due 12/31/2099 | | | 1,300 | | | 1,350 | |
First Horizon Asset Securities, Inc. | | | | | | | |
7.000% due 05/25/2030 | | | 13 | | | 13 | |
Freddie Mac | | | | | | | |
5.000% due 09/15/2016 | | | 84 | | | 87 | |
4.867% due 02/01/2029 (a) | | | 80 | | | 83 | |
4.500% due 08/15/2031 | | | 98 | | | 99 | |
GMAC Commercial Mortgage Securities, Inc. | | | | | | | |
6.420% due 05/15/2035 | | | 100 | | | 115 | |
Government National Mortgage Association | | | | | | | |
5.375% due 04/20/2028 (a) | | | 9 | | | 9 | |
5.000% due 04/20/2030 (a) | | | 25 | | | 26 | |
5.000% due 05/20/2030 (a) | | | 28 | | | 29 | |
4.250% due 06/20/2030 (a) | | | 57 | | | 58 | |
GSR Mortgage Loan Trust | | | | | | | |
6.000% due 07/25/2032 | | | 57 | | | 58 | |
J.P. Morgan Commercial Mortgage Finance Corp. | | | | | | | |
1.460% due 04/15/2010 (a) | | | 12 | | | 12 | |
Sequoia Mortgage Trust | | | | | | | |
1.403% due 08/20/2032 (a) | | | 91 | | | 91 | |
1.668% due 04/20/2033 (a)(l) | | | 100 | | | 100 | |
Structured Asset Mortgage Investments, Inc. | | | | | | | |
1.422% due 09/19/2032 (a) | | | 94 | | | 94 | |
Structured Asset Securities Corp. | | | | | | | |
1.325% due 02/25/2032 (a) | | | 64 | | | 64 | |
Wachovia Bank Commercial Mortgage Trust | | | | | | | |
1.225% due 06/15/2013 (a) | | | 200 | | | 200 | |
Washington Mutual Mortgage Securities Corp. | | | | | | | |
6.000% due 03/25/2017 | | | 31 | | | 31 | |
6.010% due 04/25/2031 (a) | | | 23 | | | 24 | |
5.207% due 10/25/2032 (a) | | | 50 | | | 51 | |
Wells Fargo Mortgage-Backed Securities Trust | | | | | | | |
4.881% due 09/25/2032 (a) | | | 18 | | | 18 | |
| | | | | |
|
|
|
| | | | | | | 6,263 | |
| | | | | |
|
|
|
Municipal Bonds & Notes 1.1% | | | | | | | |
Connecticut State General Obligation Bonds, Series 2001 | | | | | | | |
5.500% due 12/15/2013 | | | 100 | | | 119 | |
Lower Colorado River Authority Revenue Bonds, | | | | | | | |
(FSA Insured), Series 2003 | | | | | | | |
5.000% due 05/15/2023 | | | 100 | | | 105 | |
Seattle, Washington Water System Revenue Bonds, | | | | | | | |
(MBIA Insured), Series 2003 | | | | | | | |
5.000% due 09/01/2033 | | | 100 | | | 104 | |
| | | | | |
|
|
|
| | | | | | | 328 | |
| | | | | |
|
|
|
U.S. Government Agencies 5.5% | | | | | | | |
Fannie Mae | | | | | | | |
3.250% due 11/14/2005 | | | 100 | | | 101 | |
5.250% due 03/22/2007 | | | 100 | | | 103 | |
4.640% due 01/30/2008 | | | 200 | | | 207 | |
6.250% due 02/17/2011 | | | 200 | | | 205 | |
Federal Home Loan Bank | | | | | | | |
2.340% due 12/15/2005 | | | 200 | | | 200 | |
4.375% due 08/15/2007 | | | 100 | | | 100 | |
Freddie Mac | | | | | | | |
6.000% due 05/25/2012 | | | 100 | | | 104 | |
6.530% due 11/26/2012 | | | 300 | | | 347 | |
Tennessee Valley Authority | | | | | | | |
4.875% due 12/15/2016 | | | 300 | | | 331 | |
| | | | | |
|
|
|
| | | | | | | 1,698 | |
| | | | | |
|
|
|
U.S. Treasury Obligations 10.2% | | | | | | | |
Treasury Inflation Protected Securities (c) | | | | | | | |
3.625% due 01/15/2008 | | | 114 | | | 128 | |
3.625% due 04/15/2028 | | | 114 | | | 139 | |
U.S. Treasury Bonds | | | | | | | |
6.250% due 08/15/2023 | | | 800 | | | 980 | |
U.S. Treasury Notes | | | | | | | |
6.500% due 02/15/2010 | | | 300 | | | 364 | |
5.000% due 08/15/2011 | | | 800 | | | 914 | |
U.S. Treasury Strips | | | | | | | |
0.000% due 02/15/2019 | | | 900 | | | 436 | |
0.000% due 08/15/2020 | | | 400 | | | 176 | |
| | | | | |
|
|
|
| | | | | | | 3,137 | |
| | | | | |
|
|
|
| | | Shares
| | | |
Preferred Security 0.7% | | | | | | | |
DG Funding Trust | | | | | | | |
3.350% due 12/29/2049 (a) | | | 20 | | | 206 | |
| | | | | |
|
|
|
Total United States
(Cost $12,836) | | | | | | 13,093 | |
| | | | | |
|
|
|
| | | Principal
Amount
(000s)
| | | |
PURCHASED CALL OPTIONS 0.0% | | | | | | | |
Euro-Bund 10 Year Note September Futures (OTC) | | | | | | | |
Strike @ 102.000 Exp. 09/03/2003 | | $ | 1,000 | | $ | 0 | |
| | | | | |
|
|
|
Total Purchased Call Options
(Cost $0) | | | | | | 0 | |
| | | | | |
|
|
|
SHORT-TERM INSTRUMENTS 19.5% | | | | | | | |
Commercial Paper 17.5% | | | | | | | |
CBA Finance, Inc. | | | | | | | |
1.220% due 08/01/2003 | | | 800 | | | 799 | |
Fannie Mae | | | | | | | |
1.170% due 08/27/2003 | | $ | 300 | | $ | 299 | |
1.130% due 09/03/2003 | | | 500 | | | 499 | |
1.010% due 09/10/2003 | | | 1,100 | | | 1,098 | |
Federal Home Loan Bank | | | | | | | |
1.140% due 08/06/2003 | | | 900 | | | 899 | |
General Electric Capital Corp. | | | | | | | |
1.200% due 07/11/2003 | | | 200 | | | 200 | |
HBOS Treasury Services PLC | | | | | | | |
1.100% due 09/12/2003 | | | 600 | | | 599 | |
Westpac Trust Securities Ltd. | | | | | | | |
1.190% due 08/07/2003 | | | 1,000 | | | 999 | |
| | | | | |
|
|
|
| | | | | | | 5,392 | |
| | | | | |
|
|
|
Repurchase Agreement 0.6% | | | | | | | |
State Street Bank | | | | | | | |
0.800% due 07/01/2003 | | | 178 | | | 178 | |
(Dated 06/30/2003. Collateralized by Fannie Mae 2.000% due 01/14/2005 valued at $183. Repurchase proceeds are $178.) | | | | | | | |
| | | | | |
|
|
|
U.S. Treasury Bills 1.4% | | | | | | | |
1.064% due 08/07/2003- 08/14/2003 (d)(e) | | | 435 | | | 434 | |
| | | | | |
|
|
|
Total Short-Term Instruments
(Cost $6,004) | | | | | | 6,004 | |
| | | | | |
|
|
|
Total Investments 144.9%
(Cost $42,886) | | | | | $ | 44,732 | |
| | | | | | | | |
Written Options (g) (0.1%)
(Premiums $64) | | | | | | (36 | ) |
Other Assets and Liabilities (Net) (44.8%) | | | | | | (13,839 | ) |
| | | | | |
|
|
|
Net Assets 100.0% | | | | | $ | 30,857 | |
| | | | | |
|
|
|
Notes to Schedule of Investments
(amounts in thousands, except number of contracts):
| (a) | | Variable rate security. The rate listed is as of June 30, 2003. |
| (b) | | Security, or a portion thereof, subject to financing transaction. |
| (c) | | Principal amount of security is adjusted for inflation. |
| (d) | | Securities are grouped by coupon or range of coupons and represent a range of maturities. |
| (e) | | Securities with an aggregate market value of $185 have been segregated with the custodian to cover margin requirements for the following open futures contracts at June 30, 2003: |
Type
| | # of Contracts
| | Unrealized Appreciation/ (Depreciation)
| |
Euro-Bobl 5 Year Note (09/2003) - Long | | 20 | | $ | (21 | ) |
Euro-Bund 10 Year Note (09/2003) - Long | | 28 | | | (50 | ) |
U.S. Treasury 5 Year Note (09/2003) - Short | | 8 | | | 5 | |
U.S. Treasury 10 Year Note (09/2003) - Short | | 1 | | | 1 | |
| | | | |
|
|
|
| | | | | $ | (65 | ) |
| | | | |
|
|
|
See accompanying notes | | | 6.30.03 | Semi-Annual Report | | 9 |
| (f) | | Swap agreements outstanding at June 30, 2003: |
Type
| | Notional Amount
| | Unrealized Appreciation/ (Depreciation)
| |
Receive a fixed rate equal to 4.000% and pay floating rate based on 6 month BP-LIBOR. | | | | | | | |
| | |
Counterparty: Morgan Stanley Dean Witter & Co. | | | | | | | |
Exp. 09/15/2007 | | BP | 200 | | $ | (2 | ) |
Receive a fixed rate equal to 4.000% and pay floating rate based on 6 month BP-LIBOR. | | | | | | | |
| | |
Counterparty: Morgan Stanley Dean Witter & Co. | | | | | | | |
Exp. 06/17/2008 | | | 700 | | | 0 | |
Receive a fixed rate equal to 5.500% and pay floating rate based on 6 month BP-LIBOR. | | | | | | | |
| | |
Counterparty: Morgan Stanley Dean Witter & Co. | | | | | | | |
Exp. 03/15/2008 | | | 100 | | | 12 | |
Receive a fixed rate equal to 5.500% and pay floating rate based on 6-month BP-LIBOR. | | | | | | | |
| | |
Counterparty: Morgan Stanley Dean Witter & Co. | | | | | | | |
Exp. 03/15/2004 | | | 200 | | | 6 | |
Receive floating rate based on 6-month BP-LIBOR and pay a fixed rate equal to 5.000%. | | | | | | | |
| | |
Counterparty: Morgan Stanley Dean Witter & Co. | | | | | | | |
Exp. 03/15/2017 | | | 300 | | | (1 | ) |
Receive floating rate based on 6-month BP-LIBOR and pay a fixed rate equal to 5.000%. | | | | | | | |
| | |
Counterparty: UBS Warburg LLC | | | | | | | |
Exp. 03/15/2032 | | | 200 | | | 4 | |
Receive floating rate based on 6-month BP-LIBOR and pay a fixed rate equal to 5.000%. | | | | | | | |
| | |
Counterparty: UBS Warburg LLC | | | | | | | |
Exp. 06/17/2013 | | | 200 | | | (4 | ) |
Receive floating rate based on 6-month BP-LIBOR and pay a fixed rate equal to 5.000%. | | | | | | | |
| | |
Counterparty: J.P. Morgan Chase & Co. | | | | | | | |
Exp. 03/20/2018 | | | 600 | | | (1 | ) |
Receive floating rate based on 6-month BP-LIBOR and pay a fixed rate equal to 5.500% | | | | | | | |
| | |
Counterparty: Morgan Stanley Dean Witter & Co. | | | | | | | |
Exp. 03/15/2016 | | | 500 | | | (13 | ) |
Receive floating rate based on 6-month BP-LIBOR and pay a fixed rate equal to 5.500%. | | | | | | | |
| | |
Counterparty: Goldman Sachs & Co. | | | | | | | |
Exp. 03/15/2016 | | | 100 | | | (2 | ) |
Receive floating rate based on 6-month LIBOR and pay a fixed rate equal to 5.000%. | | | | | | | |
| | |
Counterparty: Morgan Stanley Dean Witter & Co. | | | | | | | |
Exp. 06/17/2013 | | | 300 | | | (5 | ) |
Receive a fixed rate equal to 4.000% and pay floating rate based on 6 month EC-LIBOR. | | | | | | | |
| | |
Counterparty: Merrill Lynch & Co., Inc. | | | | | | | |
Exp. 03/15/2007 | | EC | 100 | | | 0 | |
Receive a fixed rate equal to 6.000% and pay floating rate based on 6-month EC-LIBOR. | | | | | | | |
| | |
Counterparty: Morgan Stanley Dean Witter & Co. | | | | | | | |
Exp. 03/15/2017 | | | 500 | | | 4 | |
Receive a fixed rate equal to 6.000% and pay floating rate based on 6-month EC-LIBOR. | | | | | | | |
| | |
Counterparty: UBS Warburg LLC | | | | | | | |
Exp. 03/15/2032 | | | 400 | | | 5 | |
Receive a fixed rate equal to 6.000% and pay floating rate based on 6-month EC-LIBOR. | | | | | | | |
| | |
Counterparty: J.P. Morgan Chase & Co. | | | | | | | |
Exp. 03/20/2018 | | | 800 | | | 2 | |
Receive floating rate based on 6-month EC-LIBOR and pay a fixed rate equal to 5.000%. | | | | | | | |
| | |
Counterparty: Citibank N.A., London | | | | | | | |
Exp. 06/17/2012 | | | 200 | | | (24 | ) |
Receive floating rate based on 6-month EC-LIBOR and pay a fixed rate equal to 5.000%. | | | | | | | |
| | |
Counterparty: J.P. Morgan Chase & Co. | | | | | | | |
Exp. 06/17/2012 | | | 100 | | | (14 | ) |
Receive floating rate based on 6-month EC-LIBOR and pay a fixed rate equal to 6.000%. | | | | | | | |
| | |
Counterparty: Morgan Stanley Dean Witter & Co. | | | | | | | |
Exp. 03/15/2031 | | | 100 | | | (22 | ) |
Receive floating rate based on 6-month EC-LIBOR and pay a fixed rate equal to 6.000%. | | | | | | | |
| | |
Counterparty: J.P. Morgan Chase & Co. | | | | | | | |
Exp. 03/15/2031 | | | 100 | | | (23 | ) |
Receive floating rate based on 3-month H$-HIBOR and pay a fixed rate equal to 5.753%. | | | | | | | |
| | |
Counterparty: Goldman Sachs & Co. | | | | | | | |
Exp. 02/28/2006 | | H$ | 3,000 | | | (35 | ) |
Receive floating rate based on 6-month JY-LIBOR and pay a fixed rate equal to 1.300%. | | | | | | | |
| | |
Counterparty: Goldman Sachs & Co. | | | | | | | |
Exp. 09/21/2011 | | JY | 40,000 | | | (16 | ) |
Receive floating rate based on 6-month JY-LIBOR and pay a fixed rate equal to 2.020%. | | | | | | | |
| | |
Counterparty: Goldman Sachs & Co. | | | | | | | |
Exp. 05/18/2010 | | | 17,000 | | | (14 | ) |
Receive a fixed rate equal to 0.460% and The Fund will pay to the counterparty at par in the event of default of Vodafone Group PLC 7.750% due 02/15/2010. | | | | | | | |
| | |
Counterparty: Lehman Brothers, Inc. | | | | | | | |
Exp. 09/10/2003 | | $ | 100 | | | 0 | |
Receive floating rate based on 3-month LIBOR and pay a fixed rate equal to 4.000%. | | | | | | | |
| | |
Counterparty: Goldman Sachs & Co. | | | | | | | |
Exp. 12/17/2013 | | | 100 | | | 3 | |
Receive floating rate based on 3-month LIBOR and pay a fixed rate equal to 4.000%. | | | | | | | |
| | |
Counterparty: Bank of America, N.A. | | | | | | | |
Exp. 12/17/2013 | | | 500 | | | 4 | |
Receive floating rate based on 3-month LIBOR and pay a fixed rate equal to 4.000%. | | | | | | | |
| | |
Counterparty: J.P. Morgan Chase & Co. | | | | | | | |
Exp. 12/17/2013 | | | 300 | | | 5 | |
Receive floating rate based on 3-month LIBOR and pay a fixed rate equal to 5.000%. | | | | | | | |
| | |
Counterparty: Merrill Lynch & Co., Inc. | | | | | | | |
Exp. 12/17/2023 | | | 900 | | | 36 | |
| | | | | |
|
|
|
| | | | | | $ | (95 | ) |
| | | | | |
|
|
|
| (g) | | Premiums received on written options: |
Type
| | Notional Amount
| | Premium
| | Value
|
Put - OTC 10 Year Interest Rate Swap
| | | | | | | | | |
Strike @ 6.000%** Exp. 10/20/2003 | | $ | 300,000 | | $ | 15 | | $ | 0 |
Call - OTC 7 Year Interest Rate Swap
| | | | | | | | | |
Strike @ 6.000%* Exp. 09/23/2005 | | | 300,000 | | | 11 | | | 6 |
Call - OTC 7 Year Interest Rate Swap
| | | | | | | | | |
Strike @ 4.000%* Exp. 09/23/2005 | | | 300,000 | | | 8 | | | 8 |
Put - OTC 7 Year Interest Rate Swap
| | | | | | | | | |
Strike @ 5.500%** Exp. 12/17/2003 | | | 200,000 | | | 3 | | | 0 |
Call - OTC 7 Year Interest Rate Swap
| | | | | | | | | |
Strike @ 3.500%* Exp. 12/17/2003 | | | 200,000 | | | 2 | | | 4 |
Call - OTC 7 Year Interest Rate Swap
| | | | | | | | | |
Strike @ 4.000%* Exp. 03/03/2004 | | | 200,000 | | | 4 | | | 5 |
Put - OTC 10 Year Interest Rate Swap
| | | | | | | | | |
Strike @ 6.000%** Exp. 03/05/2004 | | | 600,000 | | | 2 | | | 2 |
Call - OTC 10 Year Interest Rate Swap
| | | | | | | | | |
Strike @ 4.000%* Exp. 03/05/2004 | | | 200,000 | | | 4 | | | 5 |
Call - OTC 10 Year Interest Rate Swap
| | | | | | | | | |
Strike @ 3.250%* Exp.10/20/2003 | | | 300,000 | | | 3 | | | 1 |
| | | | | |
|
| |
|
|
| | | | | | $ | 52 | | $ | 31 |
| | | | | |
|
| |
|
|
| | | |
Type
| | # of
Contracts
| | Premium
| | Value
|
Call - CBOT U.S. Treasury Note September Futures
| | | | | | | | | |
Strike @ 117.000 Exp. 08/23/2003 | | | 2 | | $ | 2 | | $ | 3 |
Call - CBOT U.S. Treasury Note September Futures
| | | | | | | | | |
Strike @ 121.000 Exp. 08/23/2003 | | | 12 | | | 10 | | | 2 |
| | | | | |
|
| |
|
|
| | | | | | $ | 12 | | $ | 5 |
| | | | | |
|
| |
|
|
| * | | The Portfolio will receive a floating rate based on 3-month LIBOR. |
| ** | | The Portfolio will pay a floating rate based on 3-month LIBOR. |
| (h) | | Written options with premiums to be determined on a future date: |
Type
| | # of
Contracts
| | Unrealized
Appreciation
|
Call & Put - OTC % U.S. Dollar Forward Delta / Neutral Straddle vs. Japanese Yen | | | | | |
Strike and premium determined on 12/18/2007, based upon implied volatility parameter of 18.5000% | | | | | |
| | |
Counterparty: AIG International, Inc. | | | | | |
Exp. 12/18/2012 | | 80 | | $ | 6 |
| (i) | | Principal amount denoted in indicated currency: |
BP – British Pound
C$ – Canadian Dollar
DK – Danish Krone
EC – Euro
H$ – Hong Kong Dollar
JY – Japanese Yen
MP – Mexican Peso
N$ – New Zealand Dollar
SK – Swedish Krona
10 | | Semi-Annual Report | 6.30.03 | | | See accompanying notes |
| (j) | | Foreign forward currency contracts outstanding at June 30, 2003: |
Type
| | Currency
| | Principal Amount Covered by
Contract
| | Settlement Month
| | Unrealized Appreciation
| | Unrealized (Depreciation)
| | | Net Unrealized Appreciation/ (Depreciation)
| |
Sell | | BP | | 1,440 | | 07/2003 | | $ | 46 | | $ | 0 | | | $ | 46 | |
Sell | | C$ | | 1,239 | | 07/2003 | | | 8 | | | 0 | | | | 8 | |
Sell | | DK | | 930 | | 09/2003 | | | 3 | | | 0 | | | | 3 | |
Buy | | EC | | 45 | | 07/2003 | | | 0 | | | (1 | ) | | | (1 | ) |
Sell | | EC | | 7,930 | | 07/2003 | | | 45 | | | 0 | | | | 45 | |
Buy | | H$ | | 272 | | 07/2003 | | | 0 | | | 0 | | | | 0 | |
Buy | | JY | | 3,735 | | 07/2003 | | | 0 | | | 0 | | | | 0 | |
Sell | | JY | | 43,264 | | 07/2003 | | | 8 | | | 0 | | | | 8 | |
Sell | | JY | | 166,380 | | 09/2003 | | | 12 | | | 0 | | | | 12 | |
Buy | | MP | | 616 | | 09/2003 | | | 6 | | | 0 | | | | 6 | |
Sell | | MP | | 616 | | 09/2003 | | | 0 | | | (1 | ) | | | (1 | ) |
Sell | | N$ | | 87 | | 07/2003 | | | 0 | | | 0 | | | | 0 | |
Sell | | SK | | 985 | | 09/2003 | | | 3 | | | 0 | | | | 3 | |
| | | | | | | | |
|
| |
|
|
| |
|
|
|
| | | | | | | | | $ | 131 | | $ | (2 | ) | | $ | 129 | |
| | | | | | | | |
|
| |
|
|
| |
|
|
|
| (k) | | Short sales open at June 30, 2003 were as follows: |
Type
| | Coupon (%)
| | Maturity
| | Par
| | Value
| | Proceeds
|
U.S. Treasury Note | | 5.000 | | 08/15/2011 | | $ | 800 | | $ | 914 | | $ | 908 |
U.S. Treasury Note | | 4.875 | | 02/15/2012 | | | 800 | | | 890 | | | 900 |
U.S. Treasury Note | | 4.375 | | 07/15/2007 | | | 1,100 | | | 1,195 | | | 1,199 |
U.S. Treasury Note | | 4.375 | | 08/15/2012 | | | 1,300 | | | 1,394 | | | 1,395 |
U.S. Treasury Note | | 4.000 | | 11/15/2012 | | | 420 | | | 437 | | | 443 |
| | | | | | | | | |
|
| |
|
|
| | | | | | | | | | $ | 4,830 | | $ | 4,845 |
| | | | | | | | | |
|
| |
|
|
| (l) | | Indicates a fair valued security which has not been valued utilizing an independent quote and which is valued pursuant to guidelines established by the Trustees. The aggregate value of fair valued securities is $100, which is 0.32% of net assets. |
See accompanying notes | | | 6.30.03 | Semi-Annual Report | | 11 |
Notes to Financial Statements
June 30, 2003 (Unaudited)
1. Organization
The Foreign Bond Portfolio (the “Portfolio”) is a series of the PIMCO Variable Insurance Trust (the “Trust”). The Trust is registered under the Investment Company Act of 1940 (the “Act”), as amended, as an open-end investment company organized as a Delaware business trust on October 3, 1997. The Trust may offer up to two classes of shares: Institutional and Administrative. Each share class has identical voting rights (except that shareholders of a class have exclusive voting rights regarding any matter relating solely to that class of shares). Information presented in these financial statements pertains to the Institutional Class of the Trust. Certain detailed financial information for the Administrative Class is provided separately and is available upon request. The Trust is designed to be used as an investment vehicle by Separate Accounts of insurance companies that fund variable annuity contracts and variable life insurance policies and by qualified pension and retirement plans. The Portfolio commenced operations on February 16, 1999.
2. Significant Accounting Policies
The following is a summary of significant accounting policies consistently followed by the Trust in the preparation of its financial statements in conformity with accounting principles generally accepted in the United States of America. The preparation of financial statements in accordance with accounting principles generally accepted in the United States of America requires management to make estimates and assumptions that affect the reported amounts and disclosures in the financial statements. Actual results could differ from those estimates.
Security Valuation. Portfolio securities and other financial instruments for which market quotations are readily available are stated at market value. Market value is determined at the close of regular trading (normally, 4:00 p.m., Eastern Time) on the New York Stock Exchange on each day the New York Stock Exchange is open, or if no sales are reported, as is the case for most securities traded over-the-counter, the mean between representative bid and asked quotations obtained from a quotation reporting system or from established market makers. Fixed income securities, including those to be purchased under firm commitment agreements, are normally valued on the basis of quotes obtained from brokers and dealers or pricing services. Short-term investments, which mature in 60 days or less are valued at amortized cost, which approximates market value. Certain fixed income securities for which daily market quotations are not readily available may be valued, pursuant to guidelines established by the Board of Trustees, with reference to fixed income securities whose prices are more readily obtainable. Prices may be obtained from independent pricing services which use information provided by market makers or estimates of market values obtained from yield data relating to investments or securities with similar characteristics. The prices used by the Portfolio may differ from the value that would be realized if the securities were sold and the differences could be material to the financial statements.
Securities Transactions and Investment Income. Securities transactions are recorded as of the trade date. Securities purchased or sold on a when-issued or delayed delivery basis may be settled a month or more after the trade date. Realized gains and losses from securities sold are recorded on the identified cost basis. Dividend income is recorded on the ex-dividend date, except certain dividends from foreign securities where the ex-dividend date may have passed, are recorded as soon as the Portfolio is informed of the ex-dividend date. Interest income, adjusted for the accretion of discounts and amortization of premiums, is recorded on the accrual basis. Paydowns gains and losses on mortgage- and asset-backed securities are recorded as adjustments to interest income in the Statement of Operations.
Dividends and Distributions to Shareholders. Dividends from net investment income, if any, are declared on each day the Trust is open for business and are distributed to shareholders monthly. All dividends are reinvested in additional shares of the Portfolio. Net realized capital gains earned by the Portfolio, if any, will be distributed no less frequently than once each year.
Income dividends and capital gain distributions are determined in accordance with income tax regulations which may differ from accounting principles generally accepted in the United States of America. These differences are primarily due to differing treatments for such items as wash sales, foreign currency transactions, net operating losses and capital loss carryforwards.
Distributions classified as a tax basis return of capital, if any, are reflected in the accompanying Statements of Changes in Net Assets and have been reclassified to paid in capital. In addition, other amounts have been reclassified between undistributed net investment income, accumulated undistributed net realized gains or losses and/or paid in capital to more appropriately conform financial accounting to tax characterizations of dividend distributions.
Foreign Currency. The accounting records of the Portfolio are maintained in U.S. dollars. The market values of foreign securities, currency holding and other assets and liabilities are translated into U.S. dollars based on the current exchange rates each business day. Fluctuations in the value of these assets and liabilities resulting from changes in exchange rates are recorded as unrealized foreign currency gains or losses. Realized gains or losses and unrealized appreciation (depreciation) on investment securities and income and expenses are translated on the respective dates of such transactions. The effect of changes in foreign currency exchange rates on investments in securities are not
12 | | Semi-Annual Report | 6.30.03 |
segregated in the Statement of Operations from the effects of changes in market prices of those securities, but are included with the net realized and unrealized gain or loss on investment securities.
Multiclass Operations. Each class offered by the Trust has equal rights as to assets. Income, non-class specific expenses, and realized and unrealized capital gains and losses are allocated to each class of shares based on the relative net assets of each class.
Federal Income Taxes. The Portfolio intends to qualify as a regulated investment company and distribute all of its taxable income and net realized gains, if applicable, to shareholders. Accordingly, no provision for Federal income taxes has been made.
Financing Transactions. The Portfolio may enter into financing transactions consisting of the sale by the Portfolio of securities, together with a commitment to repurchase similar securities at a future date. The difference between the selling price and the future purchase price is an adjustment to interest income in the Statement of Operations. If the counterparty to whom the Portfolio sells the security becomes insolvent, the Portfolio’s right to repurchase the security may be restricted; the value of the security may change over the term of the financing transaction; and the return earned by the Portfolio with the proceeds of a financing transaction may not exceed transaction costs. The Portfolio will designate assets determined to be liquid by PIMCO or otherwise cover its obligations under financing transactions.
Futures Contracts. The Portfolio is authorized to enter into futures contracts. The Portfolio may use futures contracts to manage its exposure to the securities markets or to movements in interest rates and currency values. The primary risks associated with the use of futures contracts are imperfect correlation between the change in market value of the securities held by the Portfolio and the prices of futures contracts, the possibility of an illiquid market, and the inability of the counterparty to meet the terms of the contract. Futures contracts are valued based upon their quoted daily settlement prices. Upon entering into a futures contract, the Portfolio may be required to deposit with its custodian, in a segregated account in the name of the futures broker, an amount of cash or U.S. Government and Agency Obligations in accordance with the initial margin requirements of the broker or exchange. Futures contracts are marked to market daily and an appropriate payable or receivable for the change in value (“variation margin”) is recorded by the Portfolio. Gains or losses are recognized but not considered realized until the contracts expire or are closed. Futures contracts involve, to varying degrees, risk of loss in excess of the variation margin disclosed in the Statement of Assets and Liabilities.
Options Contracts. The Portfolio may write call and put options on futures, securities or currencies it owns or in which it may invest. Writing put options tends to increase the Portfolio’s exposure to the underlying instrument. Writing call options tends to decrease the Portfolio’s exposure to the underlying instrument. When the Portfolio writes a call or put option, an amount equal to the premium received is recorded as a liability and subsequently marked to market to reflect the current value of the option written. Payment received or made, if any, from writing options with premiums to be determined on a future date are reflected as such on the Statement of Assets and Liabilities. Premiums received from writing options which expire are treated as realized gains. Premiums received from writing options which are exercised or closed are added to the proceeds or offset against amounts paid on the underlying future, security or currency transaction to determine the realized gain or loss. The Portfolio as a writer of an option has no control over whether the underlying future, security or currency may be sold (call) or purchased (put) and as a result bears the market risk of an unfavorable change in the price of the future, security or currency underlying the written option. There is the risk the Portfolio may not be able to enter into a closing transaction because of an illiquid market.
The Portfolio may also purchase put and call options. Purchasing call options tends to increase the Portfolio’s exposure to the underlying instrument. Purchasing put options tends to decrease the Portfolio’s exposure to the underlying instrument. The Portfolio pays a premium which is included in the Portfolio’s Statement of Assets and Liabilities as an investment and subsequently marked to market to reflect the current value of the option. Premiums paid for purchasing options which expire are treated as realized losses. The risk associated with purchasing put and call options is limited to the premium paid. Premiums paid for purchasing options which are exercised or closed are added to the amounts paid or offset against the proceeds on the underlying future, security or currency transaction to determine the realized gain or loss.
Forward Currency Transactions. The Portfolio may enter into forward currency contracts and forward cross-currency contracts in connection with settling planned purchases or sales of securities or to hedge the currency exposure associated with some or all of the Portfolio’s securities. A forward currency contract is an agreement between two parties to buy and sell a currency at a set price on a future date. The market value of a forward currency contract fluctuates with changes in forward currency exchange rates. Forward currency contracts are marked to market daily and the change in value is recorded by the Portfolio as an unrealized gain or loss. Realized gains or losses equal to the difference between the value of the contract at the time it was opened and the value at the time it was closed are recorded upon delivery or receipt of the currency or, if a
6.30.03 | Semi-Annual Report | | 13 |
forward currency contract is offset by entering into another forward currency contract with the same broker, upon settlement of the net gain or loss. These contracts may involve market risk in excess of the unrealized gain or loss reflected in the Portfolio’s Statement of Assets and Liabilities. In addition, the Portfolio could be exposed to risk if the counterparties are unable to meet the terms of the contracts or if the value of the currency changes unfavorably to the U.S. dollar.
Short Sales. The Portfolio has entered into short sales transactions during the fiscal year. A short sale is a transaction in which a Portfolio sells securities it does not own in anticipation of a decline in the market price of the securities. The Portfolio is obligated to deliver securities at the market price at the time the short position is closed. Possible losses from short sales may be unlimited, whereas losses from purchases cannot exceed the total amount invested.
Swap Agreements. The Portfolio may invest in swap agreements. A swap is an agreement to exchange the return generated by one instrument for the return generated by another instrument. The Portfolio may enter into interest rate, total return, forward swap spread lock and credit default swap agreements to manage its exposure to interest rates and credit risk. Interest rate swap agreements involve the exchange by the Portfolio with another party of their respective commitments to pay or receive interest, e.g., an exchange of floating rate payments for fixed rate payments with respect to a notional amount of principal. Total return swap agreements involve commitments to pay interest in exchange for a market-linked return, both based on notional amounts. To the extent the total return of the security or index underlying the transaction exceeds or falls short of the offsetting interest rate obligation, the Portfolio will receive a payment from or make a payment to the counterparty. Forward spread lock swap agreements involve commitments to pay or receive a settlement amount calculated as the difference between the swap spread and a fixed spread, multiplied by the notional amount times the duration of the swap. The swap spread is the difference between the benchmark swap rate (market rate) and the specific Treasury rate. In a credit default swap, one party makes a stream of payments to another party in exchange for the right to receive a specified return in the event of a default by a third party, typically corporate issues or sovereign issues of an emerging country, on its obligation. The Portfolio may use credit default swaps to provide a measure of protection against defaults of sovereign issuers (i.e., to reduce risk where the Portfolio owns or has exposure to the sovereign issuer) or to take an active long or short position with respect to the likelihood of a particular issuer’s default. Swaps are marked to market daily based upon quotations from market makers and vendors and the change in value, if any, is recorded as unrealized gain or loss in the Statement of Operations. Payments received or made at the beginning of the measurement period are reflected as such on the Statement of Assets and Liabilities. A liquidation payment received or made at the termination of the swap is recorded as realized gain or loss in the Statement of Operations. Net periodic payments are included as part of miscellaneous income on the Statement of Operations. Entering into these agreements involves, to varying degrees, elements of credit, market and documentation risk in excess of the amounts recognized on the Statement of Assets and Liabilities. Such risks involve the possibility that there will be no liquid market for these agreements, that the counterparty to the agreements may default on its obligation to perform or disagree as to the meaning of contractual terms in the agreements, and that there may be unfavorable changes in interest rates.
Delayed Delivery Transactions. The Portfolio may purchase or sell securities on a when-issued or delayed delivery basis. These transactions involve a commitment by the Portfolio to purchase or sell securities for a predetermined price or yield, with payment and delivery taking place beyond the customary settlement period. When delayed delivery purchases are outstanding, the Portfolio will set aside and maintain until the settlement date in a segregated account, liquid assets in an amount sufficient to meet the purchase price. When purchasing a security on a delayed delivery basis, the Portfolio assumes the rights and risks of ownership of the security, including the risk of price and yield fluctuations, and takes such fluctuations into account when determining its net asset value. The Portfolio may dispose of or renegotiate a delayed delivery transaction after it is entered into, and may sell when-issued securities before they are delivered, which may result in a capital gain or loss. When the Portfolio has sold a security on a delayed delivery basis, the Portfolio does not participate in future gains and losses with respect to the security.
Repurchase Agreements. The Portfolio may engage in repurchase transactions. Under the terms of a typical repurchase agreement, the Portfolio takes possession of an underlying debt obligation subject to an obligation of the seller to repurchase, and the Portfolio to resell, the obligation at an agreed-upon price and time. The market value of the collateral must be equal at all times to the total amount of the repurchase obligations, including interest. Generally, in the event of counterparty default, the Portfolio has the right to use the collateral to offset losses incurred.
3. Fees, Expenses, and Related Party Transactions
Investment Advisory Fee. Pacific Investment Management Company LLC (PIMCO) is a majority owned subsidiary partnership of Allianz Dresdner Asset Management of America L.P. (formerly PIMCO Advisors L.P.) and serves as investment adviser (the “Adviser”) to the Trust, pursuant to an investment
14 | | Semi-Annual Report | 6.30.03 |
advisory contract. The Adviser receives a monthly fee at an annual rate based on average daily net assets of the Portfolio. The Advisory Fee is charged at an annual rate of 0.25%.
Administration Fee. PIMCO serves as administrator (the “Administrator”) and provides administrative services to the Trust for which it receives a monthly administrative fee based on average daily net assets of the Portfolio. The Administration Fee is charged at the annual rate of 0.50%.
Servicing Fee. PIMCO Advisors Distributors LLC (“PAD”), is an indirect wholly-owned subsidiary of Allianz Dresdner Asset Management of America L.P. and serves as the distributor of the Trust’s shares. The Trust is permitted to reimburse PAD on a quarterly basis, out of the Administrative Class assets of the Portfolio in the amount of 0.15% on an annual basis of the average daily net assets of that class, for payments made to financial intermediaries that provide services in connection with the distribution of shares or administration of plans or programs that use Portfolio shares as their funding medium. The effective rate paid to PAD during the current fiscal year is 0.15%.
Expenses. The Portfolio is responsible for the following expenses: (i) salaries and other compensation of any of the Trust’s executive officers and employees who are not officers, directors, stockholders or employees of PIMCO or its subsidiaries or affiliates; (ii) taxes and governmental fees; (iii) brokerage fees and commissions and other portfolio transaction expenses; (iv) the cost of borrowing money, including interest expense; (v) fees and expenses of the Trustees who are not “interested persons” of PIMCO or the Trust, and any counsel retained exclusively for their benefit; (vi) extraordinary expenses, including costs of litigation and indemnification expenses; (vii) organization expenses and (viii) any expenses allocated or allocable to a specific class of shares, which include service fees payable with respect to the Administrative Class shares and may include certain other expenses as permitted by the Trust’s Multiple Class Plan adopted pursuant to Rule 18f-3 under the Act and subject to review and approval by the Trustees. The ratio of expenses to average net assets per share class, as disclosed in the Financial Highlights, may differ from the annual Portfolio operating expenses per share class as disclosed in the Prospectus for the reasons set forth above. PIMCO has agreed to waive a portion of its administrative fees to the extent that the payment of the Portfolio’s pro rata share of Trustees’ fees causes the actual expense ratio to rise above the rates disclosed in the current prospectus plus 0.49 basis points as set forth below (calculated as a percentage of the Portfolio’s average daily net assets attributable to each class):
| | | Institutional
Class
| | | Administrative
Class
| |
Foreign Bond Portfolio | | 0.75 | % | | 0.90 | % |
PIMCO may be reimbursed for these waived amounts in future periods. The Trust pays no compensation directly to any Trustee or any other officer who is affiliated with the Administrator, all of whom receive renumeration for their services to the Trust from the Administrator or its affiliates.
Each unaffiliated Trustee receives an annual retainer of $4,000, plus $1,500 for each Board of Trustees meeting attended in person and $250 for each meeting attended telephonically, plus reimbursement of related expenses. In addition, each committee chair receives an additional annual retainer of $500. These expenses are allocated on a pro-rata basis to each Portfolio of the Trust according to its respective net assets.
4. Purchases and Sales of Securities
Purchases and sales of securities (excluding short-term investments) for the period ended June 30, 2003 were as follows (amounts in thousands):
| | | U.S Government/Agency
| | All Other
|
| | | Purchases
| | Sales
| | Purchases
| | Sales
|
Foreign Bond Portfolio | | $ | 52,149 | | $ | 48,315 | | $ | 24,418 | | $ | 15,381 |
5. Transactions in Written Call and Put Options
Transactions in written call and put options were as follows (amounts in thousands):
| | | Foreign Bond Portfolio
| |
| | | | | Premium
| |
Balance at 12/31/2002 | | | | $ | 76 | |
Sales | | | | | 41 | |
Closing Buys | | | | | (51 | ) |
Expirations | | | | | (2 | ) |
Exercised | | | | | 0 | |
| | | | |
|
|
|
Balance at 06/30/2003 | | | | $ | 64 | |
| | | | |
|
|
|
6.30.03 | Semi-Annual Report | | 15 |
6. Federal Income Tax Matters
At June 30, 2003, the aggregate cost of investments was the same for federal income tax and financial statement purposes. The net unrealized appreciation (depreciation) of investments securities for federal income tax purposes is as follows (amounts in thousands):
| | | Aggregate Gross Unrealized Appreciation
| | Aggregate Gross Unrealized (Depreciation)
| | | Net Unrealized Appreciation
|
Foreign Bond Portfolio | | $ | 2,201 | | $ | (355 | ) | | $ | 1,846 |
7. Shares of Beneficial Interest
The Trust may issue an unlimited number of shares of beneficial interest with a $.0001 par value. Changes in shares of beneficial interest were as follows (shares and amounts in thousands):
| | | Foreign Bond Portfolio
| |
| | | Six Months Ended 06/30/2003 | | | Year Ended
12/31/2002 | |
| | | Shares
| | | Amount
| | | Shares
| | | Amount
| |
Receipts for shares sold | | | | | | | | | | | | | | |
Institutional Class | | 0 | | | $ | 0 | | | 0 | | | $ | 0 | |
Administrative Class | | 1,589 | | | | 16,300 | | | 1,985 | | | | 19,462 | |
Issued as reinvestment of distributions | �� | | | | | | | | | | | | | |
Institutional Class | | 0 | | | | 0 | | | 1 | | | | 3 | |
Administrative Class | | 30 | | | | 310 | | | 42 | | | | 417 | |
Cost of shares redeemed | | | | | | | | | | | | | | |
Institutional Class | | 0 | | | | 0 | | | (96 | ) | | | (930 | ) |
Administrative Class | | (280 | ) | | | (2,856 | ) | | (863 | ) | | | (8,415 | ) |
| | |
|
| |
|
|
| |
|
| |
|
|
|
Net increase resulting from Portfolio share transactions | | 1,339 | | | $ | 13,754 | | | 1,069 | | | $ | 10,537 | |
| | |
|
| |
|
|
| |
|
| |
|
|
|
The following schedule shows the number of shareholders each owning 5% or more of the Portfolio and the total percentage of the Portfolio held by such shareholders:
| | | Number
| | % of Portfolio
Held
|
Foreign Bond Portfolio | | | | |
Institutional Class | | 1 | | 100 |
Administrative Class | | 3 | | 96 |
16 | | Semi-Annual Report | 6.30.03 |
Trustees and Officers
Brent R. Harris, Chairman and Trustee
R. Wesley Burns, President and Trustee
E. Philip Cannon, Trustee
Vern O. Curtis, Trustee
J. Michael Hagan, Trustee
William J. Popejoy, Trustee
Garlin G. Flynn, Secretary
John P. Hardaway, Treasurer
Investment Adviser and Administrator
Pacific Investment Management Company LLC
840 Newport Center Drive
Newport Beach, California 92660
Transfer Agent
National Financial Data Services
330 W. 9th Street, 4th Floor
Kansas City, Missouri 64105
Custodian
State Street Bank & Trust Company
801 Pennsylvania
Kansas City, Missouri 64105
Counsel
Dechert LLP
1775 I Street, N.W.
Washington, D.C. 20006
Independent Accountants
PricewaterhouseCoopers LLP
1055 Broadway
Kansas City, Missouri 64105
PIMCO VARIABLE INSURANCE TRUST
This report is submitted for the general information of the shareholders of the PIMCO Variable Insurance Trust. It is not authorized for distribution to prospective investors unless accompanied or preceded by an effective prospectus for the PIMCO Variable Insurance Trust, which contains information covering its investment policies as well as other pertinent information.
All Funds distributed by PIMCO ADVISORS DISTRIBUTORS LLC, member NASD
840 NEWPORT CENTER DRIVE
NEWPORT BEACH, CA 92660
800.927.4648
WWW.PIMCOADVISORS.COM
WWW.PIMCO.COM
P I M C O
| PIMCO VARIABLE INSURANCE TRUST |
| HIGH YIELD PORTFOLIO |
| INSTITUTIONAL CLASS |
|
| SEMI-ANNUAL REPORT |
| June 30, 2003 |
| | | Fund Summary
| | Schedule of Investments
|
High Yield Portfolio (Institutional Class) | | 2 | | 7 |
Chairman’s Letter
Dear PIMCO Variable Insurance Trust Shareholder:
Financial assets gained during the first half of 2003 amid a revival of risk appetites as anxiety about the war in Iraq faded. Assets that generally benefit from economic growth, such as stocks, corporate bonds and emerging market debt, fared the best year-to-date as investors returned to these sectors in anticipation of a recovery in the second half of 2003. Reflationary forces that investors expected to fuel a rebound included federal tax cuts and a weak dollar, as well as low borrowing rates that eased the burden of high personal and corporate indebtedness. Low mortgage rates kept refinancings booming in the second quarter and put more money in consumers’ pockets.
U.S. Treasuries lagged their riskier counterparts but still enjoyed a modest rally. Yields fell to levels not seen in 45 years early in the second quarter before bouncing off their lows in June as hopes for recovery increased. The yield on the benchmark 10-year Treasury closed the six-month period 0.30% lower to 3.51%, after nearing 3% earlier in the period. Buyers were encouraged that inflation would remain tame amid low capacity utilization and weak employment growth. Asian central banks bought U.S. Treasuries to limit the rise in their currencies versus the dollar in an effort to protect their export industries. In June, the Federal Reserve cut the federal funds rate by 0.25% to 1%, its 13th easing since 2001, in an effort to boost the economy and ward off deflation. Although the cut was less than expected, the Fed suggested that rates would stay low until deflation risks abated.
On the following pages you will find specific details as to the Portfolio’s total return investment performance and a discussion of those factors that affected performance.
We appreciate the trust you have placed in us, and we will continue to focus our efforts to meet your investment needs.
Sincerely,
Brent R. Harris
Chairman
July 31, 2003
6.30.03 | Semi-Annual Report | | 1 |
High Yield Portfolio
TOTAL RETURN INVESTMENT PERFORMANCE For the period ended June 30, 2003
| | | 1 Year | | | Since Inception* | |
High Yield Portfolio Institutional Class | | 18.94 | % | | 18.94 | % |
Merrill Lynch U.S. High Yield BB-B Rated Index | | 18.47 | % | | — | |
| * | | Annualized (All Portfolio returns are net of fees and expenses) |
CUMULATIVE RETURNS THROUGH JUNE 30, 2003
$10,000 invested at inception
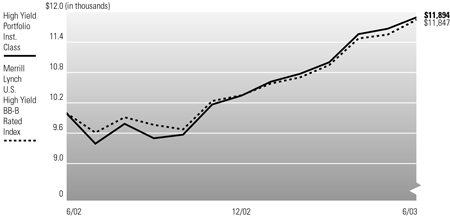
Past performance is no guarantee of future results. Investment return and principal value will fluctuate so that Portfolio shares, when redeemed, may be worth more or less than their original cost. The line graph above assumes the investment of $10,000 on 7/01/2002, the Portfolio’s Institutional Class inception date, compared to the Merrill Lynch U.S. High Yield BB-B Rated Index, an unmanaged market index. It is not possible to invest directly in the Index. The Portfolio may invest in foreign securities which involve potentially higher risks including foreign currency fluctuations and political economic uncertainty. These risks may be enhanced when investing in emerging market securities. The investments made by the High Yield Portfolio may involve high risk and may have speculative characteristics.
PORTFOLIO INSIGHTS
| • | | The High Yield Portfolio seeks to achieve its investment objective by investing under normal circumstances at least 80% of its assets in a diversified portfolio of high yield securities (“junk bonds”) rated below investment grade but rated at least B by Moody’s or S&P, or, if unrated, determined by PIMCO to be of comparable quality. |
| • | | The Portfolio’s Institutional Class shares returned 14.99% for the six-month period ended June 30, 2003, outperforming the 14.48% of the Merrill Lynch U.S. High Yield BB-B Rated Index. |
| • | | The Portfolio’s exposure to B-rated issues contributed to performance as B-rated issues outperformed BBs by 4.16%. |
| • | | An emphasis on large-cap telecom companies contributed to returns as telecom credits continued their positive momentum for the ninth consecutive month. |
| • | | An underweight to the consumer cyclical sector was a notable positive, as the war in Iraq weighed heavily on the economy and consumer confidence during the first part of the period. |
| • | | Security selection in the cable & pay TV sector was a strong contributor to relative performance, as lower-rated issues performed the best. |
| • | | An underweight to transportation was a positive early in the year. However, as airlines began to recover from setbacks due to the war in Iraq and the outbreak of SARS, an underweight to this sector detracted from performance for the six-month period. |
| • | | An underweight to the utility sector for most of the period hurt performance as the sector continued the positive trend it began in late 2002. |
2 | | Semi-Annual Report | 6.30.03 |
Financial Highlights
High Yield Portfolio (Institutional Class)
| Selected Per Share Data for the Year or Period Ended: | | 06/30/2003 +
| | | 07/01/2002-12/31/2002
| |
Net asset value beginning of period | | $ | 7.17 | | | $ | 7.25 | |
Net investment income (a) | | | 0.29 | | | | 0.30 | |
Net realized/unrealized (loss) on investments (a) | | | 0.77 | | | | (0.07 | ) |
Total income from investment operations | | | 1.06 | | | | 0.23 | |
Dividends from net investment income | | | (0.30 | ) | | | (0.31 | ) |
Distributions from net realized capital gains | | | 0.00 | | | | 0.00 | |
Total distributions | | | (0.30 | ) | | | (0.31 | ) |
Net asset value end of period | | $ | 7.93 | | | $ | 7.17 | |
Total return | | | 14.99 | % | | | 3.43 | % |
Net assets end of period (000s) | | $ | 12 | | | $ | 10 | |
Ratio of expenses to average net assets | | | 0.60 | %* | | | 0.60 | %*(b) |
Ratio of net investment income to average net assets | | | 7.83 | %* | | | 8.70 | %* |
Portfolio turnover rate | | | 201 | % | | | 102 | % |
| (a) | | Per share amounts based on average number of shares outstanding during the period. |
| (b) | | If the investment manager had not reimbursed expenses, the ratio of operating expenses to average net assets would have been 0.61%. |
See accompanying notes | | | 6.30.03 | Semi-Annual Report | | 3 |
Statement of Assets and Liabilities
High Yield Portfolio
June 30, 2003 (Unaudited)
Amounts in thousands, except per share amounts
Assets: | | | | |
Investments, at value | | $ | 790,243 | |
Cash | | | 69 | |
Foreign currency, at value | | | 3,427 | |
Receivable for investments sold | | | 13,989 | |
Unrealized appreciation on forward foreign currency contracts | | | 71 | |
Interest receivable | | | 14,264 | |
Variation margin receivable | | | 68 | |
Unrealized appreciation on swap agreements | | | 4 | |
Other assets | | | 1 | |
| | |
|
|
|
| | | | 822,136 | |
| | |
|
|
|
Liabilities: | | | | |
Payable for investments purchased | | $ | 9,374 | |
Written options outstanding | | | 2,398 | |
Accrued investment advisory fee | | | 158 | |
Accrued administration fee | | | 221 | |
Accrued servicing fee | | | 90 | |
Recoupment payable to Manager | | | 14 | |
Unrealized depreciation on swap agreements | | | 17 | |
| | |
|
|
|
| | | | 12,272 | |
| | |
|
|
|
Net Assets | | $ | 809,864 | |
| | |
|
|
|
Net Assets Consist of: | | | | |
Paid in capital | | $ | 805,242 | |
Undistributed (overdistributed) net investment income | | | (81 | ) |
Accumulated undistributed net realized (loss) | | | (35,575 | ) |
Net unrealized appreciation | | | 40,278 | |
| | |
|
|
|
| | | $ | 809,864 | |
| | |
|
|
|
Net Assets: | | | | |
Institutional Class | | $ | 12 | |
Administrative Class | | | 809,852 | |
Shares Issued and Outstanding: | | | | |
Institutional Class | | | 1 | |
Administrative Class | | | 102,109 | |
Net Asset Value and Redemption Price Per Share (Net Assets Per Share Outstanding) | | | | |
Institutional Class | | $ | 7.93 | |
Administrative Class | | | 7.93 | |
Cost of Investments Owned | | $ | 750,575 | |
Cost of Foreign Currency Held | | $ | 3,451 | |
4 | | Semi-Annual Report | 6.30.03 | | | See accompanying notes |
Statement of Operations
High Yield Portfolio
For the six months ended June 30, 2003 (Unaudited)
Amounts in thousands
Investment Income: | | | | |
Interest | | $ | 24,901 | |
Dividends, net of foreign taxes | | | 171 | |
Miscellaneous income | | | 273 | |
| | |
|
|
|
Total Income | | | 25,345 | |
| | |
|
|
|
Expenses: | | | | |
Investment advisory fees | | | 753 | |
Administration fees | | | 1,055 | |
Servicing fees | | | 452 | |
Trustees’ fees | | | 3 | |
Organization costs | | | 1 | |
Miscellaneous expense | | | 14 | |
| | |
|
|
|
Total Expenses | | | 2,278 | |
| | |
|
|
|
Net Investment Income | | | 23,067 | |
| | |
|
|
|
Net Realized and Unrealized Gain (Loss): | | | | |
Net realized gain on investments | | | 7,093 | |
Net realized (loss) on futures contracts, written options, and swaps | | | (376 | ) |
Net realized (loss) on foreign currency transactions | | | (1,454 | ) |
Net change in unrealized appreciation on investments | | | 53,634 | |
Net change in unrealized appreciation on futures contracts, written options, and swaps | | | 1,165 | |
Net change in unrealized appreciation on translation of assets and liabilities denominated in foreign currencies | | | 711 | |
Net Gain | | | 60,773 | |
| | |
|
|
|
Net Increase in Assets Resulting from Operations | | $ | 83,840 | |
| | |
|
|
|
See accompanying notes | | | 6.30.03 | Semi-Annual Report | | 5 |
Statements of Changes in Net Assets
High Yield Portfolio
Amounts in thousands
| Increase (Decrease) in Net Assets from: | | Six Months Ended June 30, 2003
| | | Year Ended December 31, 2002
| |
| | | (Unaudited) | | | | |
Operations: | | | | | | | | |
Net investment income | | $ | 23,067 | | | $ | 26,664 | |
Net realized gain (loss) | | | 5,263 | | | | (18,122 | ) |
Net change in unrealized appreciation (depreciation) | | | 55,510 | | | | (3,211 | ) |
| | |
|
|
| |
|
|
|
Net increase resulting from operations | | | 83,840 | | | | 5,331 | |
| | |
|
|
| |
|
|
|
Distributions to Shareholders: | | | | | | | | |
From net investment income | | | | | | | | |
Institutional Class | | | 0 | | | | 0 | |
Administrative Class | | | (23,020 | ) | | | (26,547 | ) |
Tax Basis Return of Capital | | | | | | | | |
Institutional Class | | | 0 | | | | 0 | |
Administrative Class | | | 0 | | | | (108 | ) |
| | |
|
|
| |
|
|
|
Total Distributions | | | (23,020 | ) | | | (26,655 | ) |
| | |
|
|
| |
|
|
|
Portfolio Share Transactions: | | | | | | | | |
Receipts for shares sold | | | | | | | | |
Institutional Class | | | 0 | | | | 10 | |
Administrative Class | | | 530,792 | | | | 418,977 | |
Issued as reinvestment of distributions | | | | | | | | |
Institutional Class | | | 0 | | | | 0 | |
Administrative Class | | | 23,020 | | | | 26,655 | |
Cost of shares redeemed | | | | | | | | |
Institutional Class | | | 0 | | | | 0 | |
Administrative Class | | | (286,251 | ) | | | (207,553 | ) |
| | |
|
|
| |
|
|
|
Net increase resulting from Portfolio share transactions | | | 267,561 | | | | 238,089 | |
| | |
|
|
| |
|
|
|
Total Increase in Net Assets | | | 328,381 | | | | 216,765 | |
| | |
|
|
| |
|
|
|
Net Assets: | | | | | | | | |
Beginning of period | | | 481,483 | | | | 264,718 | |
End of period* | | $ | 809,864 | | | $ | 481,483 | |
*Including (overdistributed) net investment income of: | | $ | (81 | ) | | $ | (128 | ) |
6 | | Semi-Annual Report | 6.30.03 | | | See accompanying notes |
Schedule of Investments
High Yield Portfolio
June 30, 2003 (Unaudited)
| | | Principal Amount (000s)
| | Value (000s)
|
CORPORATE BONDS & NOTES 77.8% | | | | | | |
Banking & Finance 9.7% | | | | | | |
Arch Western Finance LLC | | | | | | |
6.750% due 07/01/2013 | | $ | 2,300 | | $ | 2,369 |
Arvin Capital I | | | | | | |
9.500% due 02/01/2027 | | | 700 | | | 730 |
Bluewater Finance Ltd. | | | | | | |
10.250% due 02/15/2012 | | | 3,600 | | | 3,581 |
Bombardier Capital, Inc. | | | | | | |
7.500% due 08/15/2004 | | | 3,650 | | | 3,787 |
Cedar Brakes II, LLC | | | | | | |
9.875% due 09/01/2013 | | | 1,465 | | | 1,461 |
Choctaw Resort Development Enterprise | | | | | | |
9.250% due 04/01/2009 | | | 2,300 | | | 2,493 |
Credit & Repackaged Securities Ltd. | | | | | | |
10.250% due 10/30/2006 (l) | | | 1,250 | | | 1,399 |
Finova Group, Inc. | | | | | | |
7.500% due 11/15/2009 | | | 11,500 | | | 5,060 |
Forest City Enterprises, Inc. | | | | | | |
7.625% due 06/01/2015 | | | 1,175 | | | 1,238 |
Fuji Bank Ltd. | | | | | | |
9.870% due 06/30/2008 (a) | | | 1,400 | | | 1,477 |
Gemstone Investors Ltd. | | | | | | |
7.710% due 10/31/2004 | | | 1,500 | | | 1,500 |
J.P. Morgan - HYDI | | | | | | |
8.750% due 11/15/2007 | | | 107 | | | 115 |
9.700% due 11/15/2007 | | | 84 | | | 91 |
8.000% due 06/20/2008 | | | 8,720 | | | 9,047 |
9.000% due 06/20/2008 | | | 7,000 | | | 7,332 |
JET Equipment Trust | | | | | | |
10.000% due 06/15/2012 | | | 800 | | | 236 |
7.630% due 08/15/2012 | | | 403 | | | 155 |
MDP Acquisition PLC | | | | | | |
9.625% due 10/01/2012 | | | 1,900 | | | 2,109 |
Mizuho Preferred Capital Co. LLC | | | | | | |
8.790% due 12/29/2049 (a) | | | 2,000 | | | 2,020 |
Morgan Stanley Dean Witter & Co. | | | | | | |
1.341% due 05/01/2012 | | | 5,950 | | | 6,572 |
Qwest Capital Funding, Inc. | | | | | | |
7.900% due 08/15/2010 | | | 2,000 | | | 1,680 |
7.250% due 02/15/2011 | | | 7,000 | | | 5,775 |
7.750% due 02/15/2031 | | | 440 | | | 345 |
Reliance Group Holdings, Inc. | | | | | | |
0.000% due 11/15/2049 (b)(l) | | | 1,200 | | | 30 |
Riggs Capital Trust II | | | | | | |
8.875% due 03/15/2027 | | | 2,600 | | | 2,548 |
Rotech Healthcare, Inc. | | | | | | |
9.500% due 04/01/2012 | | | 3,050 | | | 3,149 |
Tokai Capital Corp. | | | | | | |
9.980% due 12/29/2049 (a) | | | 2,700 | | | 2,872 |
Trains HY-2003-1 | | | | | | |
7.293% due 05/15/2013 | | | 4,663 | | | 5,028 |
Universal City Development Partners | | | | | | |
11.750% due 04/01/2010 | | | 1,700 | | | 1,874 |
Ventas Capital Corp. | | | | | | |
8.750% due 05/01/2009 | | | 2,175 | | | 2,360 |
| | | | | |
|
|
| | | | | | | 78,433 |
| | | | | |
|
|
Industrials 54.8% | | | | | | |
Abitibi-Consolidated, Inc. | | | | | | |
6.000% due 06/20/2013 | | | 1,500 | | | 1,431 |
8.850% due 08/01/2030 | | | 3,600 | | | 3,837 |
AEC Ironwood LLC | | | | | | |
8.857% due 11/30/2025 | | | 3,549 | | | 3,713 |
Allbritton Communications Co. | | | | | | |
7.750% due 12/15/2012 | | | 2,500 | | | 2,594 |
Allied Waste North America, Inc. | | | | | | |
8.875% due 04/01/2008 | | | 1,150 | | | 1,253 |
8.500% due 12/01/2008 | | | 1,400 | | | 1,512 |
7.875% due 01/01/2009 | | | 2,990 | | | 3,143 |
10.000% due 08/01/2009 | | | 2,525 | | | 2,695 |
9.250% due 09/01/2012 | | | 4,950 | | | 5,482 |
7.875% due 04/15/2013 | | | 2,700 | | | 2,838 |
American Cellular Corp. | | | | | | |
9.500% due 10/15/2009 | | | 1,750 | | | 884 |
American Media Operations, Inc. | | | | | | |
10.250% due 05/01/2009 | | | 3,500 | | | 3,797 |
American Media, Inc. | | | | | | |
8.875% due 01/15/2011 | | | 500 | | | 544 |
AmeriGas Partners LP | | | | | | |
10.000% due 04/15/2006 | | | 320 | | | 350 |
8.830% due 04/19/2010 | | | 1,250 | | | 1,347 |
8.875% due 05/20/2011 | | | 600 | | | 657 |
ANR Pipeline Co | | | | | | |
8.875% due 03/15/2010 | | | 3,000 | | | 3,292 |
Arco Chemical Co. | | | | | | |
9.375% due 12/15/2005 | | | 950 | | | 964 |
10.250% due 11/01/2010 | | | 1,400 | | | 1,361 |
Avecia Group PLC | | | | | | |
11.000% due 07/01/2009 | | | 2,050 | | | 1,865 |
Beverly Enterprises, Inc. | | | | | | |
9.000% due 02/15/2006 | | | 2,100 | | | 2,063 |
9.625% due 04/15/2009 | | | 1,500 | | | 1,447 |
Boyd Gaming Corp. | | | | | | |
7.750% due 12/15/2012 | | | 3,900 | | | 4,158 |
BRL Universal Equipment | | | | | | |
8.875% due 02/15/2008 | | | 615 | | | 670 |
Building Materials Corp. | | | | | | |
7.750% due 07/15/2005 | | | 200 | | | 197 |
8.000% due 10/15/2007 | | | 2,950 | | | 2,806 |
8.000% due 12/01/2008 | | | 1,000 | | | 930 |
Cadmus Communications Corp. | | | | | | |
9.750% due 06/01/2009 | | | 2,225 | | | 2,384 |
Canwest Media, Inc. | | | | | | |
10.625% due 05/15/2011 | | | 3,375 | | | 3,864 |
Case Corp. | | | | | | |
6.250% due 12/01/2003 | | | 5,650 | | | 5,721 |
Century Aluminum Co. | | | | | | |
11.750% due 04/15/2008 | | | 400 | | | 410 |
CF Cable TV, Inc. | | | | | | |
9.125% due 07/15/2007 | | | 250 | | | 262 |
Charter Communications Holdings LLC | | | | | | |
8.250% due 04/01/2007 | | | 600 | | | 465 |
10.000% due 04/01/2009 | | | 1,225 | | | 943 |
9.625% due 11/15/2009 | | | 2,150 | | | 1,580 |
0.000% due 01/15/2011 (c) | | | 500 | | | 262 |
0.000% due 04/01/2011 (c) | | | 4,005 | | | 2,653 |
Chesapeake Energy Corp. | | | | | | |
8.500% due 03/15/2012 | | | 500 | | | 531 |
9.000% due 08/15/2012 | | | 600 | | | 672 |
7.500% due 09/15/2013 | | | 2,300 | | | 2,455 |
7.750% due 01/15/2015 | | | 1,300 | | | 1,394 |
Circus & Eldorado Joint Venture | | | | | | |
Silver Legacy Capital Corp. | | | | | | |
10.125% due 03/01/2012 | | | 2,800 | | | 2,765 |
CMS Panhandle Holding Co. | | | | | | |
6.500% due 07/15/2009 | | | 1,000 | | | 1,110 |
7.000% due 07/15/2029 | | | 300 | | | 317 |
Coastal Corp. | | | | | | |
7.750% due 06/15/2010 | | | 650 | | | 609 |
9.625% due 05/15/2012 | | | 500 | | | 504 |
7.750% due 10/15/2035 | | | 1,000 | | | 845 |
Colorado Interstate Gas Co. | | | | | | |
6.850% due 06/15/2037 | | | 1,500 | | | 1,571 |
Commonwealth Brands, Inc. | | | | | | |
9.750% due 04/15/2008 | | | 2,000 | | | 2,080 |
Compass Minerals Group, Inc. | | | | | | |
10.000% due 08/15/2011 | | | 1,125 | | | 1,266 |
Continental Airlines, Inc. | | | | | | |
7.461% due 04/01/2015 | | | 251 | | | 237 |
7.373% due 12/15/2015 | | | 1,000 | | | 812 |
Crown Castle International Corp. | | | | | | |
10.625% due 11/15/2007 | | | 200 | | | 211 |
10.750% due 08/01/2011 | | | 1,650 | | | 1,807 |
Crown European Holdings S.A. | | | | | | |
9.500% due 03/01/2011 | | | 3,425 | | | 3,716 |
10.875% due 03/01/2013 | | | 1,900 | | | 2,080 |
CSC Holdings, Inc. | | | | | | |
8.125% due 07/15/2009 | | | 800 | | | 830 |
8.125% due 08/15/2009 | | | 2,505 | | | 2,605 |
7.625% due 04/01/2011 | | | 7,000 | | | 7,105 |
Danka Business Systems PLC | | | | | | |
11.000% due 06/15/2010 | | | 1,000 | | | 987 |
Dex Media East LLC | | | | | | |
9.875% due 11/15/2009 | | | 2,325 | | | 2,604 |
12.125% due 11/15/2012 | | | 1,425 | | | 1,692 |
7.375% due 12/15/2012 | | | 700 | | | 630 |
DirecTV Holdings LLC | | | | | | |
8.375% due 03/15/2013 | | | 4,000 | | | 4,480 |
Dresser, Inc. | | | | | | |
9.375% due 04/15/2011 | | | 5,400 | | | 5,589 |
Dunlop Stand Aerospace Holdings | | | | | | |
11.875% due 05/15/2009 | | | 2,000 | | | 2,160 |
Dura Operating Corp. | | | | | | |
8.625% due 04/15/2012 | | | 3,850 | | | 3,965 |
Dynegy Danskammer & Roseton LLC | | | | | | |
7.270% due 11/08/2010 | | | 1,700 | | | 1,531 |
7.670% due 11/08/2016 | | | 4,900 | | | 3,972 |
EchoStar DBS Corp. | | | | | | |
10.375% due 10/01/2007 | | | 600 | | | 668 |
9.375% due 02/01/2009 | | | 2,225 | | | 2,384 |
Equistar Chemicals LP | | | | | | |
10.125% due 09/01/2008 | | | 2,750 | | | 2,846 |
8.750% due 02/15/2009 | | | 1,000 | | | 975 |
Extended Stay America, Inc. | | | | | | |
9.875% due 06/15/2011 | | | 4,095 | | | 4,423 |
Extendicare Health Services | | | | | | |
9.350% due 12/15/2007 | | | 1,050 | | | 1,005 |
9.500% due 07/01/2010 | | | 2,200 | | | 2,321 |
Ferrellgas Partners LP | | | | | | |
6.990% due 08/01/2005 | | | 1,000 | | | 1,052 |
8.780% due 08/01/2007 (d) | | | 2,500 | | | 2,769 |
8.870% due 08/01/2009 (d) | | | 1,250 | | | 1,411 |
8.750% due 06/15/2012 | | | 2,000 | | | 2,180 |
Fiat Finance Luxembourg S.A. | | | | | | |
3.250% due 01/09/2007 | | | 4,400 | | | 4,230 |
Fimep S.A. | | | | | | |
10.500% due 02/15/2013 | | | 1,100 | | | 1,232 |
Foamex L.P. | | | | | | |
10.750% due 04/01/2009 | | | 600 | | | 483 |
Fresenius Medical Care | | | | | | |
7.875% due 06/15/2011 | | | 2,300 | | | 2,438 |
Garden State Newspapers, Inc. | | | | | | |
8.750% due 10/01/2009 | | | 3,300 | | | 3,424 |
8.625% due 07/01/2011 | | | 400 | | | 419 |
General Motors Corp. | | | | | | |
7.125% due 07/15/2013 | | | 1,000 | | | 1,006 |
Georgia-Pacific Corp. | | | | | | |
6.700% due 11/15/2003 | | | 2,230 | | | 2,258 |
9.875% due 11/01/2021 | | | 2,250 | | | 2,284 |
9.625% due 03/15/2022 | | | 2,900 | | | 2,886 |
9.500% due 05/15/2022 | | | 1,300 | | | 1,287 |
9.125% due 07/01/2022 | | | 2,000 | | | 1,940 |
8.125% due 06/15/2023 | | | 1,800 | | | 1,647 |
8.875% due 05/15/2031 | | | 2,450 | | | 2,413 |
Giant Industries, Inc. | | | | | | |
11.000% due 05/15/2012 | | | 400 | | | 388 |
Golden Northwest Aluminum | | | | | | |
12.000% due 12/15/2006 | | | 125 | | | 8 |
Gray Television, Inc. | | | | | | |
9.250% due 12/15/2011 | | | 1,800 | | | 1,998 |
Grief Brothers Corp. | | | | | | |
8.875% due 08/01/2012 | | | 1,350 | | | 1,458 |
H&E Equipment Services LLC | | | | | | |
11.125% due 06/15/2012 | | | 2,390 | | | 2,115 |
Hanover Equipment Trust | | | | | | |
8.500% due 09/01/2008 | | | 4,800 | | | 5,064 |
HCA, Inc. | | | | | | |
7.875% due 02/01/2011 | | | 2,800 | | | 3,140 |
6.300% due 10/01/2012 | | | 2,300 | | | 2,356 |
See accompanying notes | | | 6.30.03 | Semi-Annual Report | | 7 |
| | | Principal Amount (000s)
| | Value (000s)
|
HEALTHSOUTH Corp. | | | | | | |
8.500% due 02/01/2008 (b) | | $ | 110 | | $ | 87 |
8.375% due 10/01/2011 (b) | | | 2,100 | | | 1,659 |
Hilton Hotels Corp. | | | | | | |
7.625% due 12/01/2012 | | | 3,500 | | | 3,850 |
HMH Properties, Inc. | | | | | | |
7.875% due 08/01/2008 | | | 2,750 | | | 2,805 |
Hollinger International Publishing, Inc. | | | | | | |
9.000% due 12/15/2010 | | | 4,300 | | | 4,623 |
Hollinger Participation Trust | | | | | | |
12.125% due 11/15/2010 (e) | | | 1,013 | | | 1,142 |
Host Marriott LP | | | | | | |
8.375% due 02/15/2006 (a) | | | 1,100 | | | 1,144 |
9.250% due 10/01/2007 | | | 2,100 | | | 2,268 |
Houghton Mifflin Co. | | | | | | |
8.250% due 02/01/2011 | | | 1,650 | | | 1,749 |
9.875% due 02/01/2013 | | | 750 | | | 818 |
Ingles Markets, Inc. | | | | | | |
8.875% due 12/01/2011 | | | 3,050 | | | 3,084 |
Insight Midwest, L.P. | | | | | | |
9.750% due 10/01/2009 | | | 4,045 | | | 4,298 |
10.500% due 11/01/2010 | | | 150 | | | 165 |
ISP Chemco, Inc. | | | | | | |
10.250% due 07/01/2011 | | | 2,990 | | | 3,394 |
Jefferson Smurfit Corp. | | | | | | |
7.500% due 06/01/2013 | | | 900 | | | 923 |
Johnsondiversey, Inc. | | | | | | |
9.625% due 05/15/2012 | | | 1,100 | | | 1,235 |
K&F Industries ,Inc. | | | | | | |
9.625% due 12/15/2010 | | | 1,000 | | | 1,115 |
Leviathan Gas Corp. | | | | | | |
10.375% due 06/01/2009 | | | 550 | | | 590 |
Lyondell Chemical Co. | | | | | | |
9.500% due 12/15/2008 | | | 2,360 | | | 2,254 |
Mail Well I Corp. | | | | | | |
9.625% due 03/15/2012 | | | 1,650 | | | 1,745 |
Mandalay Resort Group | | | | | | |
6.750% due 07/15/2003 | | | 1,100 | | | 1,101 |
9.375% due 02/15/2010 | | | 5,500 | | | 6,243 |
7.625% due 07/15/2013 | | | 500 | | | 514 |
6.700% due 11/15/2096 | | | 350 | | | 355 |
Mediacom Broadband LLC | | | | | | |
11.000% due 07/15/2013 | | | 3,050 | | | 3,408 |
Merisant Co | | | | | | |
9.500% due 07/15/2013 | | | 465 | | | 484 |
MGM Mirage, Inc. | | | | | | |
8.375% due 02/01/2011 | | | 4,200 | | | 4,799 |
Midwest Generation LLC | | | | | | |
8.300% due 07/02/2009 | | | 800 | | | 796 |
8.560% due 01/02/2016 | | | 9,500 | | | 9,358 |
Millennium America, Inc. | | | | | | |
9.250% due 06/15/2008 | | | 3,050 | | | 3,294 |
Newpark Resources, Inc. | | | | | | |
8.625% due 12/15/2007 | | | 2,440 | | | 2,513 |
Norampac, Inc. | | | | | | |
6.750% due 06/01/2013 | | | 1,500 | | | 1,583 |
OM Group, Inc. | | | | | | |
9.250% due 12/15/2011 | | | 1,300 | | | 1,274 |
Omnicare, Inc. | | | | | | |
6.125% due 06/01/2013 | | | 3,000 | | | 2,954 |
Owens-Brockway Glass Container, Inc. | | | | | | |
7.750% due 05/15/2011 | | | 700 | | | 740 |
8.750% due 11/15/2012 | | | 3,800 | | | 4,142 |
8.250% due 05/15/2013 | | | 700 | | | 732 |
PacifiCare Health Systems, Inc. | | | | | | |
10.750% due 06/01/2009 | | | 3,550 | | | 4,091 |
Packaging Corp. of America | | | | | | |
9.625% due 04/01/2009 | | | 1,500 | | | 1,659 |
PanAmSat Corp. | | | | | | |
8.500% due 02/01/2012 | | | 4,900 | | | 5,329 |
6.875% due 01/15/2028 | | | 3,000 | | | 2,955 |
Park Place Entertainment Corp. | | | | | | |
9.375% due 02/15/2007 | | | 1,500 | | | 1,665 |
7.000% due 04/15/2013 | | | 4,350 | | | 4,676 |
Peabody Energy Corp. | | | | | | |
6.875% due 03/15/2013 | | | 4,700 | | | 4,947 |
Pride International, Inc. | | | | | | |
9.375% due 05/01/2007 | | | 5,950 | | | 6,173 |
Primedia, Inc. | | | | | | |
8.000% due 05/15/2013 | | | 3,650 | | | 3,760 |
Quebecor Media, Inc. | | | | | | |
11.125% due 07/15/2011 | | | 3,850 | | | 4,428 |
Qwest Corp. | | | | | | |
7.500% due 11/01/2008 | | | 500 | | | 465 |
8.875% due 03/15/2012 | | | 5,650 | | | 6,342 |
7.200% due 11/10/2026 | | | 400 | | | 377 |
RH Donnelley Finance Corp. | | | | | | |
8.875% due 12/15/2010 | | | 175 | | | 194 |
10.875% due 12/15/2012 | | | 825 | | | 965 |
Rogers Cable, Inc. | | | | | | |
6.250% due 06/15/2013 | | | 1,100 | | | 1,103 |
Rogers Cablesystems, Inc. | | | | | | |
10.000% due 03/15/2005 | | | 785 | | | 856 |
11.000% due 12/01/2015 | | | 727 | | | 825 |
Rogers Cantel, Inc. | | | | | | |
8.300% due 10/01/2007 | | | 3,000 | | | 3,094 |
9.375% due 06/01/2008 | | | 1,750 | | | 1,833 |
Roundy’s, Inc. | | | | | | |
8.875% due 06/15/2012 | | | 2,450 | | | 2,573 |
Safety-Kleen Corp. | | | | | | |
0.000% due 06/01/2008 (b) | | | 1,450 | | | 4 |
0.000% due 05/15/2009 (b) | | | 250 | | | 14 |
Salem Communications Holding Corp. | | | | | | |
7.750% due 12/15/2010 | | | 3,000 | | | 3,120 |
Shaw Communications, Inc. | | | | | | |
8.250% due 04/11/2010 | | | 2,400 | | | 2,682 |
Silgan Holdings, Inc. | | | | | | |
9.000% due 06/01/2009 | | | 1,000 | | | 1,040 |
Six Flags, Inc. | | | | | | |
9.750% due 04/15/2013 | | | 4,100 | | | 4,080 |
Sonat, Inc. | | | | | | |
7.625% due 07/15/2011 | | | 2,000 | | | 1,830 |
SPX Corp. | | | | | | |
9.400% due 06/14/2005 | | | 2,000 | | | 2,059 |
6.250% due 06/15/2011 | | | 2,000 | | | 2,050 |
7.500% due 01/01/2013 | | | 850 | | | 924 |
Starwood Hotels & Resorts Worldwide, Inc. | | | | | | |
7.375% due 05/01/2007 | | | 1,698 | | | 1,795 |
7.875% due 05/01/2012 | | | 3,246 | | | 3,570 |
Stone Container Corp. | | | | | | |
11.500% due 08/15/2006 | | | 1,000 | | | 1,073 |
TeleCorp PCS, Inc. | | | | | | |
7.500% due 06/01/2007 | | | 2,185 | | | 2,447 |
1.000% due 04/15/2009 (c) | | | 1,750 | | | 1,820 |
10.625% due 07/15/2010 | | | 2,060 | | | 2,498 |
Tesoro Petroleum Corp. | | | | | | |
9.625% due 04/01/2012 | | | 1,220 | | | 1,122 |
Time Warner Telecom, Inc. | | | | | | |
9.750% due 07/15/2008 | | | 1,100 | | | 1,067 |
10.125% due 02/01/2011 | | | 200 | | | 194 |
Tritel PCS, Inc. | | | | | | |
0.000% due 05/15/2009 (c) | | | 4,292 | | | 4,485 |
10.375% due 01/15/2011 | | | 1,833 | | | 2,250 |
Triton PCS, Inc. | | | | | | |
8.750% due 11/15/2011 | | | 2,450 | | | 2,456 |
TRW Automotive, Inc. | | | | | | |
9.375% due 02/15/2013 | | | 5,075 | | | 5,532 |
Tyco International Group S.A. | | | | | | |
6.125% due 01/15/2009 | | | 1,000 | | | 1,045 |
6.750% due 02/15/2011 | | | 3,500 | | | 3,728 |
6.375% due 10/15/2011 | | | 1,900 | | | 2,014 |
U.S. Airways, Inc. | | | | | | |
9.625% due 09/01/2003 (b) | | | 1,075 | | | 274 |
9.330% due 01/01/2006 (b) | | | 90 | | | 19 |
United Airlines, Inc. | | | | | | |
6.201% due 09/01/2008 | | | 225 | | | 189 |
7.730% due 07/01/2010 | | | 1,400 | | | 1,105 |
7.186% due 04/01/2011 | | | 491 | | | 420 |
6.602% due 09/01/2013 | | | 1,400 | | | 1,176 |
Vintage Petroleum, Inc. | | | | | | |
7.875% due 05/15/2011 | | | 3,400 | | | 3,664 |
8.250% due 05/01/2012 | | | 2,300 | | | 2,542 |
Vivendi Universal S.A. | | | | | | |
9.250% due 04/15/2010 | | | 1,050 | | | 1,223 |
VoiceStream Wireless Corp. | | | | | | |
10.375% due 11/15/2009 | | | 1,530 | | | 1,786 |
Western Gas Resources, Inc. | | | | | | |
10.000% due 06/15/2009 | | | 1,700 | | | 1,862 |
Williams Cos., Inc. | | | | | | |
9.250% due 03/15/2004 | | | 4,600 | | | 4,738 |
8.625% due 06/01/2010 | | | 3,400 | | | 3,570 |
7.625% due 07/15/2019 | | | 4,300 | | | 4,193 |
7.875% due 09/01/2021 | | | 300 | | | 294 |
7.500% due 01/15/2031 | | | 1,100 | | | 1,045 |
7.750% due 06/15/2031 | | | 1,400 | | | 1,358 |
8.750% due 03/15/2032 | | | 2,200 | | | 2,299 |
Xerox Capital Europe PLC | | | | | | |
5.875% due 05/15/2004 | | | 4,500 | | | 4,545 |
Xerox Corp. | | | | | | |
5.500% due 11/15/2003 | | | 1,200 | | | 1,212 |
Young Broadcasting, Inc. | | | | | | |
9.000% due 01/15/2006 | | | 475 | | | 480 |
8.750% due 06/15/2007 | | | 1,000 | | | 1,020 |
8.500% due 12/15/2008 | | | 2,100 | | | 2,258 |
10.000% due 03/01/2011 | | | 1,830 | | | 1,990 |
| | | | | |
|
|
| | | | | | | 443,723 |
| | | | | |
|
|
Utilities 13.3% | | | | | | |
AES Corp. | | | | | | |
8.750% due 05/15/2013 | | | 6,400 | | | 6,688 |
AT&T Corp. | | | | | | |
8.500% due 11/15/2031 | | | 2,400 | | | 2,731 |
Calpine Corp. | | | | | | |
7.625% due 04/15/2006 | | | 1,390 | | | 1,213 |
8.750% due 07/15/2007 | | | 700 | | | 576 |
7.875% due 04/01/2008 | | | 1,500 | | | 1,155 |
8.625% due 08/15/2010 | | | 800 | | | 604 |
CenterPoint Energy Resources Corp. | | | | | | |
7.875% due 04/01/2013 | | | 3,000 | | | 3,457 |
CMS Energy Corp. | | | | | | |
8.375% due 07/01/2003 | | | 1,000 | | | 1,000 |
7.625% due 11/15/2004 | | | 975 | | | 995 |
7.000% due 01/15/2005 | | | 3,325 | | | 3,288 |
8.900% due 07/15/2008 | | | 300 | | | 315 |
7.500% due 01/15/2009 | | | 1,000 | | | 994 |
Edison International, Inc. | | | | | | |
6.875% due 09/15/2004 | | | 4,000 | | | 4,040 |
El Paso Corp. | | | | | | |
7.000% due 05/15/2011 | | | 400 | | | 366 |
7.875% due 06/15/2012 | | | 3,550 | | | 3,306 |
7.750% due 01/15/2032 | | | 2,250 | | | 1,907 |
El Paso Energy Partners | | | | | | |
8.500% due 06/01/2010 | | | 1,900 | | | 2,047 |
8.500% due 06/01/2011 | | | 1,300 | | | 1,398 |
El Paso Production Holding Co. | | | | | | |
7.750% due 06/01/2013 | | | 1,050 | | | 1,053 |
IPALCO Enterprises, Inc. | | | | | | |
8.375% due 11/14/2008 | | | 2,000 | | | 2,200 |
7.625% due 11/14/2011 | | | 1,340 | | | 1,474 |
Niagara Mohawk Power Co. | | | | | | |
8.500% due 07/01/2010 (c) | | | 1,000 | | | 1,048 |
NorAm Energy Corp. | | | | | | |
6.375% due 11/01/2003 | | | 500 | | | 505 |
7.750% due 02/15/2011 | | | 4,300 | | | 4,907 |
Pinnacle Partners | | | | | | |
8.830% due 08/15/2004 | | | 5,975 | | | 6,229 |
PSEG Energy Holdings, Inc. | | | | | | |
7.750% due 04/16/2007 | | | 1,500 | | | 1,588 |
10.000% due 10/01/2009 | | | 2,040 | | | 2,319 |
8.500% due 06/15/2011 | | | 4,350 | | | 4,684 |
Reliant Energy Resources Corp. | | | | | | |
8.125% due 07/15/2005 | | | 3,000 | | | 3,251 |
Rogers Communication, Inc. | | | | | | |
8.875% due 07/15/2007 | | | 250 | | | 259 |
8 | | Semi-Annual Report | 6.30.03 | | | See accompanying notes |
| | | Principal Amount (000s)
| | Value (000s)
| |
Rural Cellular Corp. | | | | | | | |
9.625% due 05/15/2008 | | $ | 1,425 | | $ | 1,268 | |
9.750% due 01/15/2010 | | | 350 | | | 312 | |
SESI, LLC | | | | | | | |
8.875% due 05/15/2011 | | | 1,765 | | | 1,906 | |
South Point Energy Corp. | | | | | | | |
8.400% due 05/30/2012 | | | 4,083 | | | 4,065 | |
Southern California Edison Co. | | | | | | | |
8.000% due 02/15/2007 | | | 4,600 | | | 5,066 | |
Sprint Capital Corp. | | | | | | | |
6.125% due 11/15/2008 | | | 850 | | | 924 | |
7.625% due 01/30/2011 | | | 500 | | | 572 | |
8.375% due 03/15/2012 | | | 2,470 | | | 2,963 | |
6.900% due 05/01/2019 | | | 2,000 | | | 2,101 | |
6.875% due 11/15/2028 | | | 2,270 | | | 2,286 | |
8.750% due 03/15/2032 | | | 3,750 | | | 4,505 | |
TECO Energy, Inc. | | | | | | | |
7.500% due 06/15/2010 | | | 3,000 | | | 3,075 | |
Tesoro Petroleum Corp. | | | | | | | |
9.625% due 11/01/2008 | | | 1,200 | | | 1,116 | |
Texas Utilities Corp. | | | | | | | |
5.520% due 08/16/2003 | | | 5,805 | | | 5,834 | |
TSI Telecommunication Services, Inc. | | | | | | | |
12.750% due 02/01/2009 | | | 600 | | | 597 | |
TXU Corp. | | | | | | | |
6.375% due 01/01/2008 | | | 500 | | | 536 | |
7.000% due 03/15/2013 | | | 3,400 | | | 3,771 | |
WorldCom, Inc. - WorldCom Group | | | | | | | |
6.950% due 08/15/2028 (b) | | | 550 | | | 164 | |
8.250% due 05/15/2031 (b) | | | 4,500 | | | 1,339 | |
| | | | | |
|
|
|
| | | | | | | 107,997 | |
| | | | | |
|
|
|
Total Corporate Bonds & Notes
(Cost $598,498) | | | | | | 630,153 | |
| | | | | |
|
|
|
MUNICIPAL BONDS & NOTES 0.2% | | | | | | | |
New Jersey 0.2% | | | | | | | |
New Jersey Tobacco Settlement Funding Corp. | | | | | | | |
Revenue Bonds, Series 2003 | | | | | | | |
6.375% due 06/01/2032 | | | 2,000 | | | 1,818 | |
| | | | | |
|
|
|
Total Municipal Bonds & Notes
(Cost $1,917) | | | | | | 1,818 | |
| | | | | |
|
|
|
U.S. TREASURY OBLIGATIONS 0.5% | | | | | | | |
Treasury Inflation Protected Securities (f) | | | | | | | |
3.375% due 01/15/2007 | | | 1,392 | | | 1,529 | |
3.625% due 01/15/2008 | | | 740 | | | 830 | |
3.500% due 01/15/2011 | | | 475 | | | 540 | |
3.000% due 07/15/2012 | | | 1,022 | | | 1,127 | |
| | | | | |
|
|
|
Total U.S. Treasury Obligations
(Cost $4,002) | | | | | | 4,026 | |
| | | | | |
|
|
|
ASSET-BACKED SECURITIES 3.0% | | | | | | | |
Alpharma, Inc. | | | | | | | |
4.650% due 09/08/2008 (d) | | | 340 | | | 340 | |
5.110% due 09/18/2008 (d) | | | 154 | | | 154 | |
4.600% due 10/09/2008 (d) | | | 617 | | | 617 | |
4.600% due 10/09/2008 (d) | | | 520 | | | 521 | |
Aquila, Inc. | | | | | | | |
7.000% due 04/15/2004 | | | 174 | | | 175 | |
7.250% due 04/15/2004 | | | 173 | | | 174 | |
8.750% due 04/15/2006 | | | 1,365 | | | 1,372 | |
Charter Communications Holdings LLC | | | | | | | |
4.090% due 03/18/2008 (a) | | | 2,000 | | | 1,877 | |
CMS Energy Corp. | | | | | | | |
9.000% due 10/30/2004 | | | 1,500 | | | 1,505 | |
Commonwealth Brands | | | | | | | |
5.375% due 08/28/2007 (a) | | | 635 | | | 636 | |
DirecTV Holdings LLC | | | | | | | |
4.770% due 03/06/2010 | | | 777 | | | 783 | |
4.740% due 04/06/2010 | | | 777 | | | 783 | |
4.830% due 06/30/2010 (a) | | | 446 | | | 449 | |
MGM Mirage, Inc. | | | | | | | |
4.390% due 06/30/2008 | | | 2,000 | | | 2,003 | |
Nextel Partners, Inc. | | | | | | | |
4.750% due 06/30/2008 (a) | | | 3,476 | | | 3,469 | |
6.625% due 06/30/2008 | | | 9 | | | 9 | |
5.000% due 12/31/2008 (a) | | | 3,476 | | | 3,469 | |
6.875% due 12/31/2008 | | | 9 | | | 9 | |
Qwest Corp. | | | | | | | |
6.500% due 06/05/2007 | | | 5,000 | | | 5,060 | |
Tucson Electric Power | | | | | | | |
6.808% due 10/25/2007 (a) | | | 1,000 | | | 1,009 | |
| | | | | |
|
|
|
Total Asset-Backed Securities
(Cost $23,563) | | | | | | 24,414 | |
| | | | | |
|
|
|
SOVEREIGN ISSUES 8.4% | | | | | | | |
Republic of Brazil | | | | | | | |
2.125% due 04/15/2006 (a) | | | 7,320 | | | 6,881 | |
11.000% due 01/11/2012 | | | 2,300 | | | 2,294 | |
8.000% due 04/15/2014 | | | 14,777 | | | 12,986 | |
10.125% due 05/15/2027 | | | 700 | | | 605 | |
11.000% due 08/17/2040 | | | 300 | | | 271 | |
Republic of Colombia | | | | | | | |
7.625% due 02/15/2007 | | | 700 | | | 751 | |
9.750% due 04/23/2009 | | | 1,500 | | | 1,712 | |
10.000% due 01/23/2012 | | | 3,300 | | | 3,704 | |
11.750% due 02/25/2020 | | | 3,800 | | | 4,741 | |
10.375% due 01/28/2033 | | | 700 | | | 807 | |
Republic of Egypt | | | | | | | |
8.750% due 07/11/2011 | | | 0 | | | 0 | |
Republic of Panama | | | | | | | |
9.625% due 02/08/2011 | | | 2,500 | | | 2,906 | |
9.375% due 07/23/2012 | | | 3,200 | | | 3,720 | |
5.000% due 07/17/2014 | | | 256 | | | 230 | |
2.250% due 07/17/2016 (a) | | | 1,947 | | | 1,548 | |
8.875% due 09/30/2027 | | | 2,900 | | | 3,168 | |
Republic of Peru | | | | | | | |
9.125% due 01/15/2008 | | | 2,000 | | | 2,175 | |
9.125% due 02/21/2012 | | | 6,775 | | | 7,239 | |
9.875% due 02/06/2015 | | | 1,000 | | | 1,100 | |
4.500% due 03/07/2017 | | | 1,700 | | | 1,322 | |
Russian Federation | | | | | | | |
5.000% due 03/31/2030 | | | 700 | | | 680 | |
United Mexican States | | | | | | | |
8.375% due 01/14/2011 | | | 3,900 | | | 4,682 | |
6.375% due 01/16/2013 | | | 500 | | | 531 | |
6.625% due 03/03/2015 | | | 4,000 | | | 4,260 | |
| | | | | |
|
|
|
Total Sovereign Issues
(Cost $63,969) | | | | | | 68,313 | |
| | | | | |
|
|
|
FOREIGN CURRENCY-DENOMINATED ISSUES 1.9% | | | | | | | |
Barry Callebaut Services NV | | | | | | | |
9.250% due 03/15/2010 | | EC | 1,090 | | | 1,336 | |
El Paso Corp. | | | | | | | |
5.750% due 03/14/2006 | | | 2,000 | | | 1,944 | |
Fimep S.A. | | | | | | | |
11.000% due 02/15/2013 | | | 1,600 | | | 2,092 | |
Fort James Corp. | | | | | | | |
4.750% due 06/29/2004 | | | 500 | | | 560 | |
Johnsondiversey, Inc. | | | | | | | |
9.625% due 05/15/2012 | | | 1,000 | | | 1,238 | |
MDP Acquisitions PLC | | | | | | | |
10.125% due 10/01/2012 | | | 1,800 | | | 2,212 | |
Remy Cointreau S.A. | | | | | | | |
10.000% due 07/30/2005 | | | 300 | | | 353 | |
Tyco International Group S.A. | | | | | | | |
4.375% due 11/19/2004 | | | 1,000 | | | 1,143 | |
6.125% due 04/04/2007 | | | 2,400 | | | 2,744 | |
5.500% due 11/19/2008 | | | 1,250 | | | 1,425 | |
| | | | | |
|
|
|
Total Foreign Currency-Denominated Issues
(Cost $12,411) | | | | | | 15,047 | |
| | | | | |
|
|
|
CONVERTIBLE BONDS & NOTES 1.1% | | | | | | | |
Healthcare 0.5% | | | | | | | |
HEALTHSOUTH Corp. | | | | | | | |
3.250% due 04/01/2049 (b) | | $ | 1,550 | | $ | 798 | |
Total Renal Care Holdings | | | | | | | |
7.000% due 05/15/2009 | | | 3,200 | | | 3,380 | |
| | | | | |
|
|
|
| | | | | | | 4,178 | |
| | | | | |
|
|
|
Industrials 0.3% | | | | | | | |
Dimon, Inc. | | | | | | | |
6.250% due 03/31/2007 | | | 2,500 | | | 2,421 | |
| | | | | |
|
|
|
Utilities 0.3% | | | | | | | |
Rogers Communication, Inc. | | | | | | | |
2.000% due 11/26/2005 | | | 2,015 | | | 1,836 | |
| | | | | |
|
|
|
Total Convertible Bonds & Notes
(Cost $8,507) | | | | | | 8,435 | |
| | | | | |
|
|
|
| | |
| | | Shares
| | | |
PREFERRED STOCK 0.5% | | | | | | | |
Fresenius Medical Care | | | | | | | |
7.875% due 02/01/2008 | | | 3,600 | | | 3,798 | |
| | | | | |
|
|
|
Total Preferred Stock
(Cost $3,472) | | | | | | 3,798 | |
| | | | | |
|
|
|
| | |
| | | Principal Amount (000s)
| | | |
SHORT-TERM INSTRUMENTS 4.2% | | | | | | | |
Commercial Paper 3.0% | | | | | | | |
Danske Corp. | | | | | | | |
1.210% due 08/20/2003 | | $ | 500 | | | 499 | |
1.070% due 09/10/2003 | | | 6,800 | | | 6,786 | |
Freddie Mac | | | | | | | |
1.135% due 10/30/2003 | | | 5,700 | | | 5,680 | |
General Electric Capital Corp. | | | | | | | |
1.030% due 07/23/2003 | | | 1,000 | | | 999 | |
HBOS Treasury Services PLC | | | | | | | |
1.100% due 09/12/2003 | | | 3,900 | | | 3,892 | |
Kraft Foods, Inc. | | | | | | | |
2.080% due 02/27/2004 | | | 3,700 | | | 3,700 | |
Royal Bank of Scotland PLC | | | | | | | |
1.230% due 08/06/2003 | | | 500 | | | 499 | |
Westpac Capital Corp. | | | | | | | |
1.200% due 07/29/2003 | | | 500 | | | 499 | |
Westpac Trust | | | | | | | |
1.200% due 08/14/2003 | | | 1,400 | | | 1,398 | |
| | | | | |
|
|
|
| | | | | | | 23,952 | |
| | | | | |
|
|
|
Repurchase Agreement 0.6% | | | | | | | |
State Street Bank | | | | | | | |
0.800% due 07/01/2003 | | | 5,277 | | | 5,277 | |
(Dated 06/30/2003. Collateralized by Fannie Mae 2.000% due 11/19/2004 valued at $5,384. Repurchase proceeds are $5,277.) | | | | | | | |
| | | | | |
|
|
|
U.S. Treasury Bill 0.6% | | | | | | | |
1.049% due 08/14/2003 (g) | | | 5,015 | | | 5,010 | |
| | | | | |
|
|
|
Total Short-Term Instruments
(Cost $34,236) | | | | | | 34,239 | |
| | | | | |
|
|
|
Total Investments 97.6%
(Cost $750,575) | | | | | $ | 790,243 | |
Written Options (h) (0.3%)
(Premiums $2,014) | | | | | | (2,398 | ) |
Other Assets and Liabilities (Net) 2.7% | | | | | | 22,019 | |
| | | | | |
|
|
|
Net Assets 100.0% | | | | | $ | 809,864 | |
| | | | | |
|
|
|
See accompanying notes | | | 6.30.03 | Semi-Annual Report | | 9 |
Notes to Schedule of Investments
(amounts in thousands, except number of contracts):
| (a) | | Variable rate security. The rate listed is as of June 30, 2003. |
| (b) | | Security is in default. |
| (c) | | Security becomes interest bearing at a future date. |
| (e) | | Payment in-kind bond security. |
| (f) | | Principal amount of security is adjusted for inflation. |
| (g) | | Securities with an aggregate market value of $2,513 have been segregated with the custodian to cover margin requirements for the following open futures contracts at June 30, 2003: |
Type
| | # of Contracts
| | Unrealized Appreciation
|
Euribor March Futures (03/2004) - Long | | 166 | | $ | 280 |
Euribor December Futures (12/2004) - Long | | 189 | | | 307 |
Eurodollar September Futures (09/2004) - Long | | 100 | | | 196 |
Eurodollar December Futures (12/2004) - Long | | 100 | | | 218 |
| | | | |
|
|
| | | | | $ | 1,001 |
| | | | |
|
|
| (h) | | Premiums received on written options: |
Type
| | Notional Amount
| | Premium
| | Value
|
Put - OTC 7 Year Interest Rate Swap | | | | | | | | | |
Strike @ 7.000%** Exp. 01/07/2005 | | $ | 9,100,000 | | $ | 190 | | $ | 47 |
Call - OTC 7 Year Interest Rate Swap | | | | | | | | | |
Strike @ 5.500%* Exp. 01/07/2005 | | | 5,900,000 | | | 122 | | | 546 |
Call - OTC 7 Year Interest Rate Swap | | | | | | | | | |
Strike @ 5.000 %* Exp. 01/07/2005 | | | 9,100,000 | | | 215 | | | 631 |
Put - OTC 10 Year Interest Rate Swap | | | | | | | | | |
Strike @ 6.500%** Exp. 10/07/2004 | | | 27,000,000 | | | 796 | | | 220 |
Call - OTC 10 Year Interest Rate Swap | | | | | | | | | |
Strike @ 4.000%* Exp. 10/07/2004 | | | 27,000,000 | | | 416 | | | 697 |
| | | | | |
|
| |
|
|
| | | | | | $ | 1,739 | | $ | 2,141 |
| | | | | |
|
| |
|
|
Type
| | # of Contracts
| | Premium
| | Value
|
Call - CBOT U.S. Treasury Note September Futures | | | | | | | | |
Strike @ 121.000 Exp. 08/23/2003 | | 220 | | $ | 148 | | $ | 45 |
Put - CBOT U.S. Treasury Bond September Futures | | | | | | | | |
Strike @ 117.000 Exp. 08/23/2003 | | 116 | | | 127 | | | 212 |
| | | | |
|
| |
|
|
| | | | | $ | 275 | | $ | 257 |
| | | | |
|
| |
|
|
| * | | The Portfolio will receive a floating rate based on 3-month LIBOR. |
| ** | | The Portfolio will pay a floating rate based on 3-month LIBOR. |
| (i) | | Swap agreements outstanding at June 30, 2003: |
Type
| | Notional Amount
| | Unrealized Appreciation/ (Depreciation)
| |
Receive a fixed rate equal to 1.820% and the Portfolio will pay to the counterparty at par in the event of default of Republic of Panama 9.625% due 02/08/2011. | | | | | | | |
| | |
Counterparty: Goldman Sachs & Co. | | | | | | | |
Exp. 11/30/2003 | | $ | 1,500 | | $ | 4 | |
Receive a fixed rate equal to 3.270% and the Portfolio will pay to the counterparty at par in the event of default of Russian Federation 5.000% due 03/31/2030. | | | | | | | |
| | |
Counterparty: Morgan Stanley Dean Witter & Co. | | | | | | | |
Exp. 06/28/2013 | | | 3,000 | | | (17 | ) |
| | | | | |
|
|
|
| | | | | | $ | (13 | ) |
| | | | | |
|
|
|
| (j) | | Principal amount denoted in indicated currency: |
EC – Euro
| (k) | | Foreign forward currency contracts outstanding at June 30, 2003: |
Type
| | Currency
| | Principal Amount Covered
by
Contract
| | Settlement Month
| | Unrealized Appreciation
| | Unrealized (Depreciation)
| | Net
Unrealized Appreciation
|
Sell | | EC | | 15,175 | | 07/2003 | | $ | 71 | | $ | 0 | | $ | 71 |
| | | | | | | | |
|
| |
|
| |
|
|
| (l) | | Indicates a fair valued security which has not been valued utilizing an independent quote and which is valued pursuant to guidelines established by the Trustees. The aggregate value of fair valued securities is $1,429, which is 0.18% of net assets. |
10 | | Semi-Annual Report | 6.30.03 | | | See accompanying notes |
Notes to Financial Statements
June 30, 2003 (Unaudited)
1. Organization
The High Yield Portfolio (the “Portfolio”) is a series of the PIMCO Variable Insurance Trust (the “Trust”). The Trust is registered under the Investment Company Act of 1940 (the “Act”), as amended, as an open-end investment company organized as a Delaware business trust on October 3, 1997. The Trust may offer up to two classes of shares: Institutional and Administrative. Each share class has identical voting rights (except that shareholders of a class have exclusive voting rights regarding any matter relating solely to that class of shares). Information presented in these financial statements pertains to the Institutional Class of the Trust. Certain detailed financial information for the Administrative Class is provided separately and is available upon request. The Trust is designed to be used as an investment vehicle by Separate Accounts of insurance companies that fund variable annuity contracts and variable life insurance policies and by qualified pension and retirement plans. The Portfolio commenced operations on April 30, 1998.
2. Significant Accounting Policies
The following is a summary of significant accounting policies consistently followed by the Trust in the preparation of its financial statements in conformity with accounting principles generally accepted in the United States of America. The preparation of financial statements in accordance with accounting principles generally accepted in the United States of America requires management to make estimates and assumptions that affect the reported amounts and disclosures in the financial statements. Actual results could differ from those estimates.
Security Valuation. Portfolio securities and other financial instruments for which market quotations are readily available are stated at market value. Market value is determined at the close of regular trading (normally, 4:00 p.m., Eastern Time) on the New York Stock Exchange on each day the New York Stock Exchange is open, or if no sales are reported, as is the case for most securities traded over-the-counter, the mean between representative bid and asked quotations obtained from a quotation reporting system or from established market makers. Fixed income securities, including those to be purchased under firm commitment agreements, are normally valued on the basis of quotes obtained from brokers and dealers or pricing services. Short-term investments, which mature in 60 days or less are valued at amortized cost, which approximates market value. Certain fixed income securities for which daily market quotations are not readily available may be valued, pursuant to guidelines established by the Board of Trustees, with reference to fixed income securities whose prices are more readily obtainable. Prices may be obtained from independent pricing services which use information provided by market makers or estimates of market values obtained from yield data relating to investments or securities with similar characteristics. The prices used by the Portfolio may differ from the value that would be realized if the securities were sold and the differences could be material to the financial statements.
Securities Transactions and Investment Income. Securities transactions are recorded as of the trade date. Securities purchased or sold on a when-issued or delayed delivery basis may be settled a month or more after the trade date. Realized gains and losses from securities sold are recorded on the identified cost basis. Dividend income is recorded on the ex-dividend date, except certain dividends from foreign securities where the ex-dividend date may have passed, are recorded as soon as the Portfolio is informed of the ex-dividend date. Interest income, adjusted for the accretion of discounts and amortization of premiums, is recorded on the accrual basis. Paydowns gains and losses on mortgage- and asset-backed securities are recorded as adjustments to interest income in the Statement of Operations.
Dividends and Distributions to Shareholders. Dividends from net investment income, if any, are declared on each day the Trust is open for business and are distributed to shareholders monthly. All dividends are reinvested in additional shares of the Portfolio. Net realized capital gains earned by the Portfolio, if any, will be distributed no less frequently than once each year.
Income dividends and capital gain distributions are determined in accordance with income tax regulations which may differ from accounting principles generally accepted in the United States of America. These differences are primarily due to differing treatments for such items as wash sales, foreign currency transactions, net operating losses and capital loss carryforwards.
Distributions classified as a tax basis return of capital, if any, are reflected in the accompanying Statements of Changes in Net Assets and have been reclassified to paid in capital. In addition, other amounts have been reclassified between undistributed net investment income, accumulated undistributed net realized gains or losses and/or paid in capital to more appropriately conform financial accounting to tax characterizations of dividend distributions.
Foreign Currency. The accounting records of the Portfolio are maintained in U.S. dollars. The market values of foreign securities, currency holding and other assets and liabilities are translated into U.S. dollars based on the current exchange rates each business day. Fluctuations in the value of these assets and liabilities resulting from changes in exchange rates are recorded as unrealized foreign currency gains or losses. Realized gains or losses and unrealized appreciation (depreciation) on investment securities and income and expenses are translated on the respective dates of such transactions. The effect of changes in foreign currency exchange rates on investments in securities are not
6.30.03 | Semi-Annual Report | | 11 |
segregated in the Statement of Operations from the effects of changes in market prices of those securities, but are included with the net realized and unrealized gain or loss on investment securities.
Multiclass Operations. Each class offered by the Trust has equal rights as to assets. Income, non-class specific expenses, and realized and unrealized capital gains and losses are allocated to each class of shares based on the relative net assets of each class.
Federal Income Taxes. The Portfolio intends to qualify as a regulated investment company and distribute all of its taxable income and net realized gains, if applicable, to shareholders. Accordingly, no provision for Federal income taxes has been made.
Futures Contracts. The Portfolio is authorized to enter into futures contracts. The Portfolio may use futures contracts to manage its exposure to the securities markets or to movements in interest rates and currency values. The primary risks associated with the use of futures contracts are imperfect correlation between the change in market value of the securities held by the Portfolio and the prices of futures contracts, the possibility of an illiquid market, and the inability of the counterparty to meet the terms of the contract. Futures contracts are valued based upon their quoted daily settlement prices. Upon entering into a futures contract, the Portfolio may be required to deposit with its custodian, in a segregated account in the name of the futures broker, an amount of cash or U.S. Government and Agency Obligations in accordance with the initial margin requirements of the broker or exchange. Futures contracts are marked to market daily and an appropriate payable or receivable for the change in value (“variation margin”) is recorded by the Portfolio. Gains or losses are recognized but not considered realized until the contracts expire or are closed. Futures contracts involve, to varying degrees, risk of loss in excess of the variation margin disclosed in the Statement of Assets and Liabilities.
Options Contracts. The Portfolio may write call and put options on futures, securities or currencies it owns or in which it may invest. Writing put options tends to increase the Portfolio’s exposure to the underlying instrument. Writing call options tends to decrease the Portfolio’s exposure to the underlying instrument. When the Portfolio writes a call or put option, an amount equal to the premium received is recorded as a liability and subsequently marked to market to reflect the current value of the option written. Payment received or made, if any, from writing options with premiums to be determined on a future date are reflected as such on the Statement of Assets and Liabilities. Premiums received from writing options which expire are treated as realized gains. Premiums received from writing options which are exercised or closed are added to the proceeds or offset against amounts paid on the underlying future, security or currency transaction to determine the realized gain or loss. The Portfolio as a writer of an option has no control over whether the underlying future, security or currency may be sold (call) or purchased (put) and as a result bears the market risk of an unfavorable change in the price of the future, security or currency underlying the written option. There is the risk the Portfolio may not be able to enter into a closing transaction because of an illiquid market.
The Portfolio may also purchase put and call options. Purchasing call options tends to increase the Portfolio’s exposure to the underlying instrument. Purchasing put options tends to decrease the Portfolio’s exposure to the underlying instrument. The Portfolio pays a premium which is included in the Portfolio’s Statement of Assets and Liabilities as an investment and subsequently marked to market to reflect the current value of the option. Premiums paid for purchasing options which expire are treated as realized losses. The risk associated with purchasing put and call options is limited to the premium paid. Premiums paid for purchasing options which are exercised or closed are added to the amounts paid or offset against the proceeds on the underlying future, security or currency transaction to determine the realized gain or loss.
Forward Currency Transactions. The Portfolio may enter into forward currency contracts and forward cross-currency contracts in connection with settling planned purchases or sales of securities or to hedge the currency exposure associated with some or all of the Portfolio’s securities. A forward currency contract is an agreement between two parties to buy and sell a currency at a set price on a future date. The market value of a forward currency contract fluctuates with changes in forward currency exchange rates. Forward currency contracts are marked to market daily and the change in value is recorded by the Portfolio as an unrealized gain or loss. Realized gains or losses equal to the difference between the value of the contract at the time it was opened and the value at the time it was closed are recorded upon delivery or receipt of the currency or, if a forward currency contract is offset by entering into another forward currency contract with the same broker, upon settlement of the net gain or loss. These contracts may involve market risk in excess of the unrealized gain or loss reflected in the Portfolio’s Statement of Assets and Liabilities. In addition, the Portfolio could be exposed to risk if the counterparties are unable to meet the terms of the contracts or if the value of the currency changes unfavorably to the U.S. dollar.
Loan Agreements. The Portfolio may invest in direct debt instruments which are interests in amounts owed by a corporate, governmental, or other borrower to lenders or lending syndicates. The Portfolio’s investments in loans may be in the form of participations in loans or assignments
12 | | Semi-Annual Report | 6.30.03 |
of all or a portion of loans from third parties. A loan is often administered by a bank or other financial institution (the “lender”) that acts as agent for all holders. The agent administers the terms of the loan, as specified in the loan agreement. When investing in a loan participation, the Portfolio has the right to receive payments of principal, interest and any fees to which it is entitled only from the lender selling the loan agreement and only upon receipt by the lender of payments from the borrower. The portfolio generally has no right to enforce compliance with the terms of the loan agreement with the borrower. As a result, the Portfolio may be subject to the credit risk of both the borrower and the lender that is selling the loan agreement. When the Portfolio purchases assignments from lenders it acquires direct rights against the borrower on the loan.
Swap Agreements. The Portfolio may invest in swap agreements. A swap is an agreement to exchange the return generated by one instrument for the return generated by another instrument. The Portfolio may enter into interest rate, total return, forward swap spread lock and credit default swap agreements to manage its exposure to interest rates and credit risk. Interest rate swap agreements involve the exchange by the Portfolio with another party of their respective commitments to pay or receive interest, e.g., an exchange of floating rate payments for fixed rate payments with respect to a notional amount of principal. Total return swap agreements involve commitments to pay interest in exchange for a market-linked return, both based on notional amounts. To the extent the total return of the security or index underlying the transaction exceeds or falls short of the offsetting interest rate obligation, the Portfolio will receive a payment from or make a payment to the counterparty. Forward spread lock swap agreements involve commitments to pay or receive a settlement amount calculated as the difference between the swap spread and a fixed spread, multiplied by the notional amount times the duration of the swap. The swap spread is the difference between the benchmark swap rate (market rate) and the specific Treasury rate. In a credit default swap, one party makes a stream of payments to another party in exchange for the right to receive a specified return in the event of a default by a third party, typically corporate issues or sovereign issues of an emerging country, on its obligation. The Portfolio may use credit default swaps to provide a measure of protection against defaults of sovereign issuers (i.e., to reduce risk where the Portfolio owns or has exposure to the sovereign issuer) or to take an active long or short position with respect to the likelihood of a particular issuer’s default. Swaps are marked to market daily based upon quotations from market makers and vendors and the change in value, if any, is recorded as unrealized gain or loss in the Statement of Operations. Payments received or made at the beginning of the measurement period are reflected as such on the Statement of Assets and Liabilities. A liquidation payment received or made at the termination of the swap is recorded as realized gain or loss in the Statement of Operations. Net periodic payments are included as part of miscellaneous income on the Statement of Operations. Entering into these agreements involves, to varying degrees, elements of credit, market and documentation risk in excess of the amounts recognized on the Statement of Assets and Liabilities. Such risks involve the possibility that there will be no liquid market for these agreements, that the counterparty to the agreements may default on its obligation to perform or disagree as to the meaning of contractual terms in the agreements, and that there may be unfavorable changes in interest rates.
Delayed Delivery Transactions. The Portfolio may purchase or sell securities on a when-issued or delayed delivery basis. These transactions involve a commitment by the Portfolio to purchase or sell securities for a predetermined price or yield, with payment and delivery taking place beyond the customary settlement period. When delayed delivery purchases are outstanding, the Portfolio will set aside and maintain until the settlement date in a segregated account, liquid assets in an amount sufficient to meet the purchase price. When purchasing a security on a delayed delivery basis, the Portfolio assumes the rights and risks of ownership of the security, including the risk of price and yield fluctuations, and takes such fluctuations into account when determining its net asset value. The Portfolio may dispose of or renegotiate a delayed delivery transaction after it is entered into, and may sell when-issued securities before they are delivered, which may result in a capital gain or loss. When the Portfolio has sold a security on a delayed delivery basis, the Portfolio does not participate in future gains and losses with respect to the security.
Inflation-Indexed Bonds. Inflation-indexed bonds are fixed income securities whose principal value is periodically adjusted to the rate of inflation. The interest rate on these bonds is generally fixed at issuance at a rate lower than typical bonds. Over the life of an inflation-indexed bond, however, interest will be paid based on a principal value, which is adjusted for inflation. Any increase in the principal amount of an inflation-indexed bond will be included as interest income in the Statement of Operations, even though investors do not receive their principal until maturity.
Repurchase Agreements. The Portfolio may engage in repurchase transactions. Under the terms of a typical repurchase agreement, the Portfolio takes possession of an underlying debt obligation subject to an obligation of the seller to repurchase, and the Portfolio to resell, the obligation at an agreed-upon price and time. The market value of the collateral must be equal at all times to the total amount of the repurchase obligations, including interest. Generally, in the event of counterparty default, the Portfolio has the right to use the collateral to offset losses incurred.
6.30.03 | Semi-Annual Report | | 13 |
Restricted Securities. The Portfolio is permitted to invest in securities that are subject to legal or contractual restrictions on resale. These securities generally may be resold in transactions exempt from registration or to the public if the securities are registered. Disposal of these securities may involve time-consuming negotiations and expenses, and prompt sale at an acceptable price may be difficult.
3. Fees, Expenses, and Related Party Transactions
Investment Advisory Fee. Pacific Investment Management Company LLC (PIMCO) is a majority owned subsidiary partnership of Allianz Dresdner Asset Management of America L.P. (formerly PIMCO Advisors L.P.) and serves as investment adviser (the “Adviser”) to the Trust, pursuant to an investment advisory contract. The Adviser receives a monthly fee at an annual rate based on average daily net assets of the Portfolio. The Advisory Fee is charged at an annual rate of 0.25%.
Administration Fee. PIMCO serves as administrator (the “Administrator”) and provides administrative services to the Trust for which it receives a monthly administrative fee based on average daily net assets of the Portfolio. The Administration Fee is charged at the annual rate of 0.35%.
Servicing Fee. PIMCO Advisors Distributors LLC (“PAD”), is an indirect wholly-owned subsidiary of Allianz Dresdner Asset Management of America L.P. and serves as the distributor of the Trust’s shares. The Trust is permitted to reimburse PAD on a quarterly basis, out of the Administrative Class assets of the Portfolio in the amount of 0.15% on an annual basis of the average daily net assets of that class, for payments made to financial intermediaries that provide services in connection with the distribution of shares or administration of plans or programs that use Portfolio shares as their funding medium. The effective rate paid to PAD during the current fiscal year is 0.15%.
Expenses. The Portfolio is responsible for the following expenses: (i) salaries and other compensation of any of the Trust’s executive officers and employees who are not officers, directors, stockholders or employees of PIMCO or its subsidiaries or affiliates; (ii) taxes and governmental fees; (iii) brokerage fees and commissions and other portfolio transaction expenses; (iv) the cost of borrowing money, including interest expense; (v) fees and expenses of the Trustees who are not “interested persons” of PIMCO or the Trust, and any counsel retained exclusively for their benefit; (vi) extraordinary expenses, including costs of litigation and indemnification expenses; (vii) organization expenses and (viii) any expenses allocated or allocable to a specific class of shares, which include service fees payable with respect to the Administrative Class shares and may include certain other expenses as permitted by the Trust’s Multiple Class Plan adopted pursuant to Rule 18f-3 under the Act and subject to review and approval by the Trustees. The ratio of expenses to average net assets per share class, as disclosed in the Financial Highlights, may differ from the annual Portfolio operating expenses per share class as disclosed in the Prospectus for the reasons set forth above. PIMCO has agreed to waive a portion of its administrative fees to the extent that the payment of the Portfolio’s pro rata share of Trustees’ fees causes the actual expense ratio to rise above the rates disclosed in the current prospectus plus 0.49 basis points as set forth below (calculated as a percentage of the Portfolio’s average daily net assets attributable to each class):
| | | Institutional Class
| | | Administrative Class
| |
High Yield Portfolio | | 0.60 | % | | 0.75 | % |
PIMCO may be reimbursed for these waived amounts in future periods. The Trust pays no compensation directly to any Trustee or any other officer who is affiliated with the Administrator, all of whom receive renumeration for their services to the Trust from the Administrator or its affiliates.
Each unaffiliated Trustee receives an annual retainer of $4,000, plus $1,500 for each Board of Trustees meeting attended in person and $250 for each meeting attended telephonically, plus reimbursement of related expenses. In addition, each committee chair receives an additional annual retainer of $500. These expenses are allocated on a pro-rata basis to each Portfolio of the Trust according to its respective net assets.
Organization Expenses. Costs incurred in connection with the organization of the Portfolio and its initial registration are amortized on a straight-line basis over a five-year period from the Portfolio’s commencement of operations.
4. Purchases and Sales of Securities
Purchases and sales of securities (excluding short-term investments) for the period ended June 30, 2003 were as follows (amounts in thousands):
| | | U.S Government/Agency
| | All Other
|
| | | Purchases
| | Sales
| | Purchases
| | Sales
|
High Yield Portfolio | | $ | 27,768 | | $ | 24,013 | | $ | 491,935 | | $ | 219,200 |
5. Transactions in Written Call and Put Options
Transactions in written call and put options were as follows (amounts in thousands):
| | | High Yield Portfolio
| |
| | | | | Premium
| |
Balance at 12/31/2002 | | | | $ | 1,794 | |
Sales | | | | | 682 | |
Closing Buys | | | | | (244 | ) |
Expirations | | | | | (218 | ) |
Exercised | | | | | 0 | |
| | | | |
|
|
|
Balance at 06/30/2003 | | | | $ | 2,014 | |
| | | | |
|
|
|
14 | | Semi-Annual Report | 6.30.03 |
6. Federal Income Tax Matters
At June 30, 2003, the aggregate cost of investments was the same for federal income tax and financial statement purposes. The net unrealized appreciation (depreciation) of investments securities for federal income tax purposes is as follows (amounts in thousands):
| | | Aggregate Gross Unrealized Appreciation
| | Aggregate Gross Unrealized (Depreciation)
| | | Net Unrealized Appreciation
|
High Yield Portfolio | | $ | 49,452 | | $ | (9,784 | ) | | $ | 39,668 |
7. Shares of Beneficial Interest
The Trust may issue an unlimited number of shares of beneficial interest with a $.0001 par value. Changes in shares of beneficial interest were as follows (shares and amounts in thousands):
| | | High Yield Portfolio
| |
| | | Six Months Ended 06/30/2003
| | | Year Ended 12/31/2002
| |
| | | Shares
| | | Amount
| | | Shares
| | | Amount
| |
Receipts for shares sold | | | | | | | | | | | | | | |
Institutional Class | | 0 | | | $ | 0 | | | 1 | | | $ | 10 | |
Administrative Class | | 70,246 | | | | 530,792 | | | 58,343 | | | | 418,977 | |
Issued as reinvestment of distributions | | | | | | | | | | | | | | |
Institutional Class | | 0 | | | | 0 | | | 0 | | | | 0 | |
Administrative Class | | 3,017 | | | | 23,020 | | | 3,675 | | | | 26,655 | |
Cost of shares redeemed | | | | | | | | | | | | | | |
Institutional Class | | 0 | | | | 0 | | | 0 | | | | 0 | |
Administrative Class | | (38,268 | ) | | | (286,251 | ) | | (28,512 | ) | | | (207,553 | ) |
| | |
|
| |
|
|
| |
|
| |
|
|
|
Net increase resulting from Portfolio share transactions | | 34,995 | | | $ | 267,561 | | | 33,507 | | | $ | 238,089 | |
| | |
|
| |
|
|
| |
|
| |
|
|
|
The following schedule shows the number of shareholders each owning 5% or more of the Portfolio and the total percentage of the Portfolio held by such shareholders:
| | | Number
| | % of Portfolio
Held
|
High Yield Portfolio | | | | |
Institutional Class | | 1 | | 100 |
Administrative Class | | 5 | | 92 |
6.30.03 | Semi-Annual Report | | 15 |
Trustees and Officers
Brent R. Harris, Chairman and Trustee
R. Wesley Burns, President and Trustee
E. Philip Cannon, Trustee
Vern O. Curtis, Trustee
J. Michael Hagan, Trustee
William J. Popejoy, Trustee
Garlin G. Flynn, Secretary
John P. Hardaway, Treasurer
Investment Adviser and Administrator
Pacific Investment Management Company LLC
840 Newport Center Drive
Newport Beach, California 92660
Transfer Agent
National Financial Data Services
330 W. 9th Street, 4th Floor
Kansas City, Missouri 64105
Custodian
State Street Bank & Trust Company
801 Pennsylvania
Kansas City, Missouri 64105
Counsel
Dechert LLP
1775 I Street, N.W.
Washington, D.C. 20006
Independent Accountants
PricewaterhouseCoopers LLP
1055 Broadway
Kansas City, Missouri 64105
PIMCO VARIABLE INSURANCE TRUST
This report is submitted for the general information of the shareholders of the PIMCO Variable Insurance Trust. It is not authorized for distribution to prospective investors unless accompanied or preceded by an effective prospectus for the PIMCO Variable Insurance Trust, which contains information covering its investment policies as well as other pertinent information.
All Funds distributed by PIMCO ADVISORS DISTRIBUTORS LLC, member NASD
840 NEWPORT CENTER DRIVE
NEWPORT BEACH, CA 92660
800.927.4648
WWW.PIMCOADVISORS.COM
WWW.PIMCO.COM
| P I M C O |
| PIMCO VARIABLE INSURANCE TRUST |
| LOW DURATION PORTFOLIO |
| ADMINISTRATIVE CLASS |
|
| SEMI-ANNUAL REPORT |
| June 30, 2003 |
| | | Fund
Summary
| | Schedule of
Investments
|
Low Duration Portfolio (Administrative Class) | | 2 | | 7 |
Chairman’s Letter
Dear PIMCO Variable Insurance Trust Shareholder:
Financial assets gained during the first half of 2003 amid a revival of risk appetites as anxiety about the war in Iraq faded. Assets that generally benefit from economic growth, such as stocks, corporate bonds and emerging market debt, fared the best year-to-date as investors returned to these sectors in anticipation of a recovery in the second half of 2003. Reflationary forces that investors expected to fuel a rebound included federal tax cuts and a weak dollar, as well as low borrowing rates that eased the burden of high personal and corporate indebtedness. Low mortgage rates kept refinancings booming in the second quarter and put more money in consumers’ pockets.
U.S. Treasuries lagged their riskier counterparts but still enjoyed a modest rally. Yields fell to levels not seen in 45 years early in the second quarter before bouncing off their lows in June as hopes for recovery increased. The yield on the benchmark 10-year Treasury closed the six-month period 0.30% lower to 3.51%, after nearing 3% earlier in the period. Buyers were encouraged that inflation would remain tame amid low capacity utilization and weak employment growth. Asian central banks bought U.S. Treasuries to limit the rise in their currencies versus the dollar in an effort to protect their export industries. In June, the Federal Reserve cut the federal funds rate by 0.25% to 1%, its 13th easing since 2001, in an effort to boost the economy and ward off deflation. Although the cut was less than expected, the Fed suggested that rates would stay low until deflation risks abated.
On the following pages you will find specific details as to the Portfolio’s total return investment performance and a discussion of those factors that affected performance.
We appreciate the trust you have placed in us, and we will continue to focus our efforts to meet your investment needs.
Sincerely,
Brent R. Harris
Chairman
July 31, 2003
6.30.03 | Semi-Annual Report | | 1 |
Low Duration Portfolio
TOTAL RETURN INVESTMENT PERFORMANCE For the period ended June 30, 2003
| | | 1 Year | | | Since Inception* | |
Low Duration Portfolio Administrative Class | | 6.09 | % | | 6.18 | % |
Merrill Lynch 1-3 Year Treasury Index | | 4.65 | % | | — | |
| * | | Annualized (All Portfolio returns are net of fees and expenses) |
CUMULATIVE RETURNS THROUGH JUNE 30, 2003
$10,000 invested at inception
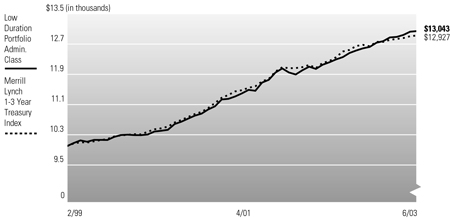
Past performance is no guarantee of future results. Investment return and principal value will fluctuate so that Portfolio shares, when redeemed, may be worth more or less than their original cost. The line graph above assumes the investment of $10,000 on 3/01/1999, the first full month following the Portfolio’s Administrative Class inception on 2/16/1999, compared to the Merrill Lynch 1-3 Year Treasury Index, an unmanaged market index. It is not possible to invest directly in the Index. The Portfolio may invest in foreign securities which involve potentially higher risks including foreign currency fluctuations and political or economic uncertainty. These risks may be enhanced when investing in emerging markets.
PORTFOLIO INSIGHTS
| • | | The Low Duration Portfolio seeks to achieve its investment objective by investing under normal circumstances at least 65% of its total assets in a diversified portfolio of Fixed Income Instruments of varying maturities. |
| • | | The Portfolio’s Administrative class returned 2.42% during the six-month period ended June 30, 2003, outperforming the 1.31% return of the Merrill Lynch 1-3 Year Treasury Index. |
| • | | Portfolio duration was near the benchmark throughout the period and had little effect on relative performance. An emphasis on both short and long maturities had a minimal impact on returns as the shape of the yield curve changed little over the period. |
| • | | Emphasis on shorter duration mortgages was positive. An overweight of lower coupon mortgages, which are less vulnerable to prepayment risk, helped returns as these issues outperformed. |
| • | | A corporate allocation was positive as corporates outperformed during the period. Positive security selection of telecom and energy pipeline issues additionally contributed to returns as they were among the strongest performers. |
| • | | Eurozone exposure added modestly to returns. While Europe lagged Treasuries overall, short Eurozone maturities outperformed due to expectations of more easing by the European Central Bank. |
| • | | As the emerging market sector’s economic fundamentals continued to improve, sustaining a recovery that began late last year, emerging market bonds added to returns, especially those from Brazil. |
2 | | Semi-Annual Report | 6.30.03 |
Financial Highlights
Low Duration Portfolio (Administrative Class)
| Selected Per Share Data for the Year or Period Ended: | | 06/30/2003 +
| | | 12/31/2002
| | | 12/31/2001
| | | 12/31/2000
| | | 02/16/1999-12/31/1999
| |
Net asset value beginning of period | | $ | 10.23 | | | $ | 9.95 | | | $ | 9.82 | | | $ | 9.74 | | | $ | 10.00 | |
Net investment income (a) | | | 0.10 | | | | 0.34 | | | | 0.52 | | | | 0.59 | | | | 0.50 | |
Net realized/unrealized gain (loss) on investments (a) | | | 0.15 | | | | 0.35 | | | | 0.21 | | | | 0.11 | | | | (0.25 | ) |
Total income from investment operations | | | 0.25 | | | | 0.69 | | | | 0.73 | | | | 0.70 | | | | 0.25 | |
Dividends from net investment income | | | (0.12 | ) | | | (0.35 | ) | | | (0.54 | ) | | | (0.62 | ) | | | (0.51 | ) |
Distributions from net realized capital gains | | | 0.00 | | | | (0.06 | ) | | | (0.06 | ) | | | 0.00 | | | | 0.00 | |
Total distributions | | | (0.12 | ) | | | (0.41 | ) | | | (0.60 | ) | | | (0.62 | ) | | | (0.51 | ) |
Net asset value end of period | | $ | 10.36 | | | $ | 10.23 | | | $ | 9.95 | | | $ | 9.82 | | | $ | 9.74 | |
Total return | | | 2.42 | % | | | 7.05 | % | | | 7.61 | % | | | 7.41 | % | | | 2.56 | % |
Net assets end of period (000s) | | $ | 34,075 | | | $ | 19,495 | | | $ | 5,175 | | | $ | 742 | | | $ | 5,149 | |
Ratio of expenses to average net assets | | | 0.66 | %*(c) | | | 0.66 | %(c)(e) | | | 0.69 | %(c)(d) | | | 0.65 | % | | | 0.65 | %(b)* |
Ratio of net investment income to average net assets | | | 1.97 | %* | | | 3.40 | % | | | 5.18 | % | | | 6.07 | % | | | 5.74 | %* |
Portfolio turnover rate | | | 195 | % | | | 339 | % | | | 661 | % | | | 165 | % | | | 11 | % |
| (a) | | Per share amounts based on average number of shares outstanding during the period. |
| (b) | | If the investment manager had not reimbursed expenses, the ratio of operating expenses to average net assets would have been 0.78% for the period ended December 31, 1999. |
| (c) | | Ratio of expenses to average net assets excluding interest expense is 0.65%. |
| (d) | | If the investment manager had not reimbursed expenses, the ratio of operating expenses to average net assets would have been 0.70% for the year ended December 31, 2001. |
| (e) | | If the investment manager had not reimbursed expenses, the ratio of operating expenses to average net assets would have been 0.67% for the year ended December 31, 2002. |
See accompanying notes | | | 6.30.03 | Semi-Annual Report | | 3 |
Statement of Assets and Liabilities
Low Duration Portfolio
June 30, 2003 (Unaudited)
Amounts in thousands, except per share amounts
Assets: | | | |
Investments, at value | | $ | 39,092 |
Foreign currency, at value | | | 63 |
Receivable for investments sold | | | 6,994 |
Receivable for Portfolio shares sold | | | 130 |
Interest receivable | | | 146 |
Variation margin receivable | | | 6 |
Swap premiums paid | | | 18 |
Unrealized appreciation on swap agreements | | | 3 |
| | |
|
|
| | | | 46,452 |
| | |
|
|
Liabilities: | | | |
Payable for investments purchased | | $ | 12,327 |
Written options outstanding | | | 17 |
Accrued investment advisory fee | | | 7 |
Accrued administration fee | | | 7 |
Accrued servicing fee | | | 4 |
Unrealized depreciation on swap agreements | | | 4 |
| | |
|
|
| | | | 12,366 |
| | |
|
|
Net Assets | | $ | 34,086 |
| | |
|
|
Net Assets Consist of: | | | |
Paid in capital | | $ | 33,478 |
Undistributed net investment income | | | 58 |
Accumulated undistributed net realized gain | | | 335 |
Net unrealized appreciation | | | 215 |
| | |
|
|
| | | $ | 34,086 |
| | |
|
|
Net Assets: | | | |
Institutional Class | | $ | 11 |
Administrative Class | | | 34,075 |
Shares Issued and Outstanding: | | | |
Institutional Class | | | 1 |
Administrative Class | | | 3,289 |
Net Asset Value and Redemption Price Per Share (Net Assets Per Share Outstanding) | | | |
Institutional Class | | $ | 10.36 |
Administrative Class | | | 10.36 |
Cost of Investments Owned | | $ | 38,859 |
Cost of Foreign Currency Held | | $ | 64 |
4 | | Semi-Annual Report | 6.30.03 | | | See accompanying notes |
Statement of Operations
Low Duration Portfolio
For the six months ended June 30, 2003 (Unaudited)
Amounts in thousands
Investment Income: | | | | |
Interest | | $ | 341 | |
| | |
|
|
|
Total Income | | | 341 | |
| | |
|
|
|
Expenses: | | | | |
Investment advisory fees | | | 32 | |
Administration fees | | | 32 | |
Distribution and/or servicing fees - Administrative Class | | | 19 | |
Interest expense | | | 1 | |
| | |
|
|
|
Total Expenses | | | 84 | |
| | |
|
|
|
Net Investment Income | | | 257 | |
| | |
|
|
|
Net Realized and Unrealized Gain (Loss): | | | | |
Net realized gain on investments | | | 227 | |
Net realized gain on futures contracts, written options, and swaps | | | 86 | |
Net realized gain on foreign currency transactions | | | 8 | |
Net change in unrealized appreciation on investments | | | 73 | |
Net change in unrealized (depreciation) on futures contracts, written options, and swaps | | | (32 | ) |
Net change in unrealized (depreciation) on translation of assets and liabilities denominated in foreign currencies | | | (6 | ) |
Net Gain | | | 356 | |
| | |
|
|
|
Net Increase in Assets Resulting from Operations | | $ | 613 | |
| | |
|
|
|
See accompanying notes | | | 6.30.03 | Semi-Annual Report | | 5 |
Statements of Changes in Net Assets
Low Duration Portfolio
Amounts in thousands
| Increase (Decrease) in Net Assets from: | | Six Months Ended
June 30, 2003
| | | Year Ended
December 31, 2002
| |
| | | (Unaudited) | | | | |
| | | | | | | | | |
Operations: | | | | | | | | |
Net investment income | | $ | 257 | | | $ | 348 | |
Net realized gain | | | 321 | | | | 242 | |
Net change in unrealized appreciation | | | 35 | | | | 117 | |
| | |
|
|
| |
|
|
|
Net increase resulting from operations | | | 613 | | | | 707 | |
| | |
|
|
| |
|
|
|
Distributions to Shareholders: | | | | | | | | |
From net investment income | | | | | | | | |
Institutional Class | | | 0 | | | | (1 | ) |
Administrative Class | | | (289 | ) | | | (347 | ) |
From net realized capital gains | | | | | | | | |
Institutional Class | | | 0 | | | | 0 | |
Administrative Class | | | 0 | | | | (85 | ) |
| | |
|
|
| |
|
|
|
Total Distributions | | | (289 | ) | | | (433 | ) |
| | |
|
|
| |
|
|
|
Portfolio Share Transactions: | | | | | | | | |
Receipts for shares sold | | | | | | | | |
Institutional Class | | | 0 | | | | 0 | |
Administrative Class | | | 17,201 | | | | 15,004 | |
Issued as reinvestment of distributions | | | | | | | | |
Institutional Class | | | 0 | | | | 1 | |
Administrative Class | | | 289 | | | | 432 | |
Cost of shares redeemed | | | | | | | | |
Institutional Class | | | 0 | | | | (460 | ) |
Administrative Class | | | (3,234 | ) | | | (1,388 | ) |
| | |
|
|
| |
|
|
|
Net increase resulting from Portfolio share transactions | | | 14,256 | | | | 13,589 | |
| | |
|
|
| |
|
|
|
Total Increase in Net Assets | | | 14,580 | | | | 13,863 | |
| | |
|
|
| |
|
|
|
Net Assets: | | | | | | | | |
Beginning of period | | | 19,506 | | | | 5,643 | |
End of period* | | $ | 34,086 | | | $ | 19,506 | |
*Including undistributed net investment income of: | | $ | 58 | | | $ | 90 | |
6 | | Semi-Annual Report | 6.30.03 | | | See accompanying notes |
Schedule of Investments
Low Duration Portfolio
June 30, 2003 (Unaudited)
| | | Principal
Amount
(000s)
| | Value
(000s)
|
CORPORATE BONDS & NOTES 16.7% | | | | | | |
Banking & Finance 3.4% | | | | | | |
CIT Group, Inc. | | | | | | |
7.500% due 11/14/2003 | | $ | 100 | | $ | 102 |
2.780% due 03/01/2004 (a) | | | 70 | | | 71 |
2.618% due 07/30/2004 (a) | | | 100 | | | 101 |
General Electric Capital Corp. | | | | | | |
4.250% due 01/15/2008 | | | 250 | | | 265 |
General Motors Acceptance Corp. | | | | | | |
1.630% due 08/04/2003 (a) | | | 200 | | | 200 |
1.679% due 07/21/2004 (a) | | | 100 | | | 99 |
Household Finance Corp. | | | | | | |
4.625% due 01/15/2008 | | | 200 | | | 214 |
Pemex Project Funding Master Trust | | | | | | |
2.778% due 01/07/2005 (a) | | | 100 | | | 101 |
| | | | | |
|
|
| | | | | | | 1,153 |
| | | | | |
|
|
Industrials 9.3% | | | | | | |
Altria Group, Inc. | | | | | | |
7.650% due 07/01/2008 | | | 200 | | | 224 |
AOL Time Warner, Inc. | | | | | | |
6.125% due 04/15/2006 | | | 250 | | | 274 |
Clear Channel Communications, Inc. | | | | | | |
6.000% due 11/01/2006 | | | 250 | | | 274 |
Comcast Cable Communications, Inc. | | | | | | |
8.375% due 05/01/2007 | | | 200 | | | 236 |
Conoco Funding Co. | | | | | | |
5.450% due 10/15/2006 | | | 100 | | | 110 |
Cox Communications, Inc. | | | | | | |
7.750% due 08/15/2006 | | | 250 | | | 289 |
DaimlerChrysler North America Holding Corp. | | | | | | |
1.810% due 08/02/2004 (a) | | | 200 | | | 200 |
Harrahs Operating Co., Inc. | | | | | | |
7.125% due 06/01/2007 | | | 200 | | | 226 |
International Paper Co. | | | | | | |
7.625% due 01/15/2007 | | | 250 | | | 290 |
Kroger Co. | | | | | | |
7.625% due 09/15/2006 | | | 250 | | | 285 |
Safeway, Inc. | | | | | | |
6.150% due 03/01/2006 | | | 250 | | | 271 |
Walt Disney Co. | | | | | | |
5.375% due 06/01/2007 | | | 250 | | | 273 |
Weyerhaeuser Co. | | | | | | |
6.125% due 03/15/2007 | | | 200 | | | 221 |
| | | | | |
|
|
| | | | | | | 3,173 |
| | | | | |
|
|
Utilities 4.0% | | | | | | |
Appalachian Power Co. | | | | | | |
4.800% due 06/15/2005 | | | 40 | | | 42 |
AT&T Wireless Services, Inc. | | | | | | |
7.350% due 03/01/2006 | | | 100 | | | 112 |
7.500% due 05/01/2007 | | | 150 | | | 173 |
British Telecom PLC | | | | | | |
2.413% due 12/15/2003 (a) | | | 100 | | | 100 |
Dominion Resources, Inc. | | | | | | |
7.600% due 07/15/2003 | | | 100 | | | 100 |
Entergy Mississippi, Inc. | | | | | | |
4.350% due 04/01/2008 | | | 100 | | | 103 |
France Telecom S.A. | | | | | | |
8.700% due 03/01/2006 (a) | | | 100 | | | 114 |
Pacific Gas & Electric Co. | | | | | | |
7.958% due 10/31/2049 (a) | | | 100 | | | 101 |
Progress Energy, Inc. | | | | | | |
6.750% due 03/01/2006 | | | 250 | | | 278 |
Sprint Capital Corp. | | | | | | |
5.700% due 11/15/2003 | | | 200 | | | 201 |
6.125% due 11/15/2008 | | | 35 | | | 38 |
| | | | | |
|
|
| | | | | | | 1,362 |
| | | | | |
|
|
Total Corporate Bonds & Notes
(Cost $5,523) | | | | | | 5,688 |
| | | | | |
|
|
U.S. GOVERNMENT AGENCIES 3.2% | | | | | | |
Federal Home Loan Bank | | | | | | |
5.500% due 04/17/2006 | | | 1,000 | | | 1,103 |
| | | | | |
|
|
Total U.S. Government Agencies
(Cost $1,069) | | | | | | 1,103 |
| | | | | |
|
|
U.S. TREASURY OBLIGATIONS 5.5% | | | | | | |
Treasury Inflation Protected Securities (e) | | | | | | |
3.625% due 01/15/2008 | | | 341 | | | 383 |
3.875% due 01/15/2009 | | | 1,166 | | | 1,335 |
4.250% due 01/15/2010 | | | 22 | | | 26 |
3.500% due 01/15/2011 | | | 63 | | | 72 |
3.875% due 04/15/2029 | | | 34 | | | 43 |
| | | | | |
|
|
Total U.S. Treasury Obligations
(Cost $1,836) | | | | | | 1,859 |
| | | | | |
|
|
MORTGAGE-BACKED SECURITIES 29.8% | | | | | | |
Collateralized Mortgage Obligations 9.4% | | | | | | |
Bank of America Mortgage Securities, Inc. | | | | | | |
6.181% due 07/25/2031 (a) | | | 11 | | | 11 |
5.776% due 10/20/2032 (a) | | | 49 | | | 51 |
Bear Stearns Adjustable Rate Mortgage Trust | | | | | | |
6.199% due 01/25/2032 (a) | | | 15 | | | 15 |
6.044% due 06/25/2032 (a) | | | 92 | | | 94 |
5.407% due 10/25/2032 (a) | | | 13 | | | 14 |
5.375% due 01/25/2033 (a) | | | 160 | | | 163 |
5.462% due 03/25/2033 (a) | | | 187 | | | 191 |
5.229% due 04/25/2033 (a) | | | 178 | | | 182 |
Countrywide Alternative Loan Trust | | | | | | |
4.750% due 01/25/2033 | | | 190 | | | 192 |
6.500% due 06/25/2033 | | | 286 | | | 295 |
CS First Boston Mortgage Securities Corp. | | | | | | |
2.478% due 03/25/2032 (a) | | | 77 | | | 75 |
6.181% due 06/25/2032 (a) | | | 25 | | | 26 |
5.760% due 10/25/2032 (a)(h) | | | 71 | | | 71 |
1.429% due 08/25/2033 (a) | | | 93 | | | 92 |
4.370% due 12/19/2039 (a) | | | 25 | | | 25 |
Fannie Mae | | | | | | |
5.000% due 09/25/2018 | | | 50 | | | 50 |
6.000% due 12/25/2028 | | | 88 | | | 89 |
6.000% due 02/25/2029 | | | 38 | | | 38 |
6.000% due 08/25/2029 | | | 125 | | | 127 |
6.500% due 01/01/2033 | | | 93 | | | 100 |
5.000% due 04/25/2033 | | | 337 | | | 344 |
First Horizon Asset Securities, Inc. | | | | | | |
6.750% due 02/25/2031 | | | 3 | | | 3 |
Freddie Mac | | | | | | |
5.625% due 07/15/2028 | | | 39 | | | 39 |
GSR Mortgage Loan Trust | | | | | | |
5.358% due 01/25/2032 (a) | | | 64 | | | 65 |
6.000% due 03/25/2032 | | | 75 | | | 77 |
6.000% due 07/25/2032 | | | 68 | | | 69 |
2.882% due 10/25/2032 (a) | | | 16 | | | 16 |
Master Asset Securitization Trust | | | | | | |
5.500% due 07/31/2033 | | | 200 | | | 203 |
Residential Funding Mortgage Securities I, Inc. | | | | | | |
5.654% due 09/25/2032 (a) | | | 20 | | | 20 |
Sequoia Mortgage Trust | | | | | | |
1.443% due 05/20/2032 (a) | | | 88 | | | 87 |
1.403% due 08/20/2032 (a) | | | 45 | | | 45 |
Structured Asset Mortgage Investments, Inc. | | | | | | |
1.422% due 09/19/2032 (a) | | | 113 | | | 112 |
Structured Asset Securities Corp. | | | | | | |
1.335% due 10/25/2027 (a) | | | 68 | | | 67 |
6.750% due 07/25/2029 | | | 60 | | | 61 |
6.150% due 07/25/2032 (a) | | | 12 | | | 12 |
Washington Mutual Loan Trust | | | | | | |
4.286% due 01/25/2041 (a) | | | 26 | | | 26 |
Washington Mutual Mortgage Securities Corp. | | | | | | |
6.190% due 07/25/2032 (a) | | | 46 | | | 47 |
Washington Mutual, Inc. | | | | | | |
5.500% due 09/25/2032 | | | 15 | | | 15 |
Wells Fargo Mortgage-Backed Securities Trust | | | | | | |
7.000% due 02/25/2016 | | | 9 | | | 9 |
| | | | | |
|
|
| | | | | | | 3,218 |
| | | | | |
|
|
Fannie Mae 9.4% | | | | | | |
3.147% due 09/01/2040 (a) | | | 64 | | | 65 |
5.500% due 10/01/2017 | | | 369 | | | 383 |
6.000% due 06/01/2016-08/13/2033 (b) | | | 2,149 | | | 2,236 |
6.500% due 08/01/2032 | | | 99 | | | 103 |
4.500% due 07/17/2018 | | | 400 | | | 408 |
| | | | | |
|
|
| | | | | | | 3,195 |
| | | | | |
|
|
Federal Housing Administration 0.6% | | | | | | |
7.430% due 10/01/2020 | | | 198 | | | 202 |
| | | | | |
|
|
Freddie Mac 10.4% | | | | | | |
5.000% due 08/18/2018 | | | 100 | | | 103 |
6.000% due 09/01/2016-08/13/2033 (b) | | | 3,250 | | | 3,370 |
6.500% due 08/01/2032 | | | 82 | | | 86 |
| | | | | |
|
|
| | | | | | | 3,559 |
| | | | | |
|
|
Total Mortgage-Backed Securities
(Cost $10,160) | | | | | | 10,174 |
| | | | | |
|
|
ASSET-BACKED SECURITIES 2.2% | | | | | | |
Ace Securities Corp. | | | | | | |
1.375% due 06/25/2032 (a) | | | 13 | | | 13 |
Amortizing Residential Collateral Trust | | | | | | |
1.325% due 07/25/2032 (a) | | | 72 | | | 72 |
Centex Home Equity | | | | | | |
5.770% due 11/25/2027 | | | 350 | | | 355 |
CIT Group Home Equity Loan Trust | | | | | | |
1.305% due 06/25/2033 (a) | | | 70 | | | 70 |
Credit-Based Asset Servicing and Securities | | | | | | |
1.355% due 06/25/2032 (a) | | | 17 | | | 17 |
Equity One ABS, Inc. | | | | | | |
1.315% due 11/25/2032 (a) | | | 61 | | | 61 |
Home Equity Mortgage Trust | | | | | | |
1.365% due 11/25/2032 (a) | | | 43 | | | 43 |
Household Mortgage Loan Trust | | | | | | |
1.403% due 05/20/2032 (a) | | | 13 | | | 13 |
Irwin Home Equity Loan Trust | | | | | | |
1.325% due 06/25/2009 (a) | | | 16 | | | 16 |
Morgan Stanley Dean Witter Capital I | | | | | | |
1.365% due 07/25/2032 (a) | | | 32 | | | 32 |
New Century Home Equity Loan Trust | | | | | | |
1.305% due 04/25/2030 (a) | | | 10 | | | 10 |
Vanderbilt Acquisition Loan Trust | | | | | | |
3.280% due 01/07/2013 | | | 57 | | | 57 |
| | | | | |
|
|
Total Asset-Backed Securities
(Cost $761) | | | | | | 759 |
| | | | | |
|
|
SOVEREIGN ISSUES 0.2% | | | | | | |
Republic of Brazil | | | | | | |
2.125% due 04/15/2006 (a) | | | 82 | | | 77 |
| | | | | |
|
|
Total Sovereign Issues
(Cost $77) | | | | | | 77 |
| | | | | |
|
|
SHORT-TERM INSTRUMENTS 57.0% | | | | | | |
Commercial Paper 53.3% | | | | | | |
ABN AMRO Mortgage Corp. | | | | | | |
1.200% due 07/07/2003 | | | 500 | | | 500 |
Barclays U.S. Funding Corp. | | | | | | |
1.200% due 08/27/2003 | | | 600 | | | 599 |
0.920% due 09/22/2003 | | | 200 | | | 199 |
CBA Finance, Inc. | | | | | | |
1.090% due 07/11/2003 | | | 100 | | | 100 |
Danske Corp. | | | | | | |
1.233% due 07/07/2003 | | | 500 | | | 500 |
E. I. du Pont de Nemours & Co. | | | | | | |
1.170% due 08/21/2003 | | | 600 | | | 599 |
Fannie Mae | | | | | | |
1.135% due 08/13/2003 | | | 500 | | | 499 |
1.165% due 08/13/2003 | | | 700 | | | 699 |
0.950% due 08/27/2003 | | | 900 | | | 899 |
0.900% due 09/03/2003 | | | 1,500 | | | 1,497 |
1.010% due 09/10/2003 | | | 500 | | | 499 |
1.010% due 09/17/2003 | | | 2,000 | | | 1,995 |
0.890% due 10/15/2003 | | | 1,300 | | | 1,296 |
See accompanying notes | | | 6.30.03 | Semi-Annual Report | | 7 |
| | | Principal
Amount
(000s)
| | Value
(000s)
| |
Federal Home Loan Bank | | | | | | | |
1.165% due 07/16/2003 | | $ | 1,000 | | $ | 999 | |
1.165% due 08/01/2003 | | | 800 | | | 799 | |
Freddie Mac | | | | | | | |
1.170% due 07/21/2003 | | | 1,000 | | | 999 | |
1.150% due 08/28/2003 | | | 1,300 | | | 1,298 | |
1.135% due 10/30/2003 | | | 1,100 | | | 1,096 | |
1.140% due 11/07/2003 | | | 100 | | | 100 | |
General Electric Capital Corp. | | | | | | | |
1.050% due 08/11/2003 | | | 600 | | | 599 | |
HBOS Treasury Services PLC | | | | | | | |
1.243% due 07/02/2003 | | | 500 | | | 500 | |
1.180% due 08/26/2003 | | | 200 | | | 200 | |
Royal Bank of Scotland PLC | | | | | | | |
1.220% due 07/16/2003 | | | 400 | | | 400 | |
Shell Finance | | | | | | | |
1.120% due 07/10/2003 | | | 500 | | | 500 | |
UBS Finance, Inc. | | | | | | | |
1.210% due 07/08/2003 | | | 600 | | | 600 | |
0.930% due 09/18/2003 | | | 200 | | | 200 | |
| | | | | |
|
|
|
| | | | | | | 18,171 | |
| | | | | |
|
|
|
Repurchase Agreement 2.7% | | | | | | | |
State Street Bank | | | | | | | |
0.800% due 07/01/2003 | | | 936 | | | 936 | |
| | | | | |
|
|
|
(Dated 06/30/2003. Collateralized by Federal Farm Credit Banks 2.000% due 11/19/2004 valued at $957. Repurchase proceeds are $936.) | | | | | | | |
| | | | | |
|
|
|
U.S. Treasury Bills 1.0% | | | | | | | |
1.686% due 08/07/2003-08/14/2003 (b)(d) | | | 325 | | | 325 | |
| | | | | |
|
|
|
Total Short-Term Instruments
(Cost $19,433) | | | | | | 19,432 | |
| | | | | |
|
|
|
Total Investments 114.6%
(Cost $38,859) | | | | | $ | 39,092 | |
Written Options (c) (0.0%)
(Premiums $16) | | | | | | (17 | ) |
Other Assets and Liabilities (Net) (14.6%) | | | | | | (4,989 | ) |
| | | | | |
|
|
|
Net Assets 100.0% | | | | | $ | 34,086 | |
| | | | | |
|
|
|
Notes to Schedule of Investments
(amounts in thousands, except number of contracts):
| (a) | | Variable rate security. The rate listed is as of June 30, 2003. |
| (b) | | Securities are grouped by coupon or range of coupons and represent a range of maturities. |
| (c) | | Premiums received on written options: |
Type
| | Notional
Amount
| | Premium
| | Value
|
Call - OTC 10 Year Interest Rate Swap | | | | | | | | | |
Strike @ 4.000%* Exp. 07/22/2003 | | $ | 400,000 | | $ | 4 | | $ | 6 |
Call - OTC 7 Year Interest Rate Swap | | | | | | | | | |
Strike @ 3.500%* Exp. 07/22/2003 | | | 300,000 | | | 3 | | | 5 |
Put - OTC 7 Year Interest Rate Swap | | | | | | | | | |
Strike @ 5.500%** Exp. 12/17/2003 | | | 300,000 | | | 4 | | | 0 |
| | | | | |
|
| |
|
|
| | | | | | $ | 11 | | $ | 11 |
| | | | | |
|
| |
|
|
| | | |
Type
| | # of
Contracts
| | Premium
| | Value
|
Call - CBOT U.S. Treasury Note September Futures | | | | | | | | | |
Strike @ 123.000 Exp. 08/23/2003 | | | 2 | | $ | 0 | | $ | 0 |
Put - CBOT U.S. Treasury Note September Futures | | | | | | | | | |
Strike @ 116.000 Exp. 08/23/2003 | | | 4 | | | 2 | | | 3 |
Call - CBOT U.S. Treasury Bond September Futures | | | | | | | | | |
Strike @ 126.000 Exp. 08/23/2003 | | | 2 | | | 0 | | | 0 |
Put - CBOT U.S. Treasury Bond September Futures | | | | | | | | | |
Strike @ 114.000 Exp. 8/23/2003 | | | 4 | | | 3 | | | 3 |
| | | | | |
|
| |
|
|
| | | | | | $ | 5 | | $ | 6 |
| | | | | |
|
| |
|
|
| * | | The Portfolio will receive a floating rate based on 3-month LIBOR. |
| ** | | The Portfolio will pay a floating rate based on 3-month LIBOR. |
| (d) | | Securities with an aggregate market value of $325 have been segregated with the custodian to cover margin requirements for the following open futures contracts at June 30, 2003: |
Type
| | # of
Contracts
| | Unrealized Appreciation/
(Depreciation)
| |
Euribor September Futures (09/2003) - Long | | 1 | | $ | 2 | |
Euro-Bobl 5 Year Note (09/2003) - Long | | 2 | | | (2 | ) |
Eurodollar March Futures (03/2005) - Long | | 1 | | | 2 | |
Eurodollar December Futures (12/2004) - Long | | 1 | | | 2 | |
U.S. Treasury 10 Year Note (09/2003) - Long | | 7 | | | (4 | ) |
U.S. Treasury 30 Year Bond (09/2003) - Long | | 3 | | | (13 | ) |
| | | | |
|
|
|
| | | | | $ | (13 | ) |
| | | | |
|
|
|
| (e) | | Principal amount of security is adjusted for inflation. |
| (f) | | Swap agreements outstanding at June 30, 2003: |
Type
| | Notional
Amount
| | Unrealized
Appreciation/
(Depreciation)
| |
Receive a fixed rate equal to 4.000% and pay floating rate based on 6-month BP-LIBOR. | | | | | | | |
| | |
Counterparty: Morgan Stanley Dean Witter & Co. | | | | | | | |
Exp. 03/17/2005 | | BP | 2,000 | | | (3 | ) |
Receive floating rate based on 6-month BP-LIBOR and pay a fixed rate equal to 5.000%. | | | | | | | |
| | |
Counterparty: Morgan Stanley Dean Witter & Co. | | | | | | | |
Exp. 03/15/2032 | | | 100 | | | 0 | |
Receive a fixed rate equal to 3.250% and pay floating rate based on 6-month EC-LIBOR. | | | | | | | |
| | |
Counterparty: J.P. Morgan Chase & Co. | | | | | | | |
Exp. 03/15/2007 | | | EC 300 | | | (1 | ) |
Receive a fixed rate equal to 6.000% and pay floating rate based on 6-month EC-LIBOR. | | | | | | | |
| | |
Counterparty: J.P. Morgan Chase & Co. | | | | | | | |
Exp. 03/15/2032 | | | 200 | | | 3 | |
Receive a fixed rate equal to 0.610% and the Portfolio will pay to the counterparty at par in the event of default of General Electric Capital Corp. 6.000% due 06/15/2012. | | | | | | | |
| | |
Counterparty: Merrill Lynch & Co., Inc. | | | | | | | |
Exp. 05/19/2004 | | $ | 30 | | $ | 0 | |
Receive a fixed rate equal to 1.650% and the Portfolio will pay to the counterparty at par in the event of default of Republic of Panama 8.875% due 09/30/2027. | | | | | | | |
| | |
Counterparty: | | | | | | | |
Exp. 05/30/2005 | | | 10 | | | 0 | |
Receive a fixed rate equal to 1.750% and the Portfolio will pay to the counterparty at par in the event of default of Republic of Peru 9.125% due 02/21/2012. | | | | | | | |
| | |
Counterparty: Morgan Stanley Dean Witter & Co. | | | | | | | |
Exp. 06/20/2004 | | | 20 | | | 0 | |
| | | | | |
|
|
|
| | | | | | $ | (1 | ) |
| | | | | |
|
|
|
| (g) | | Principal amount denoted in indicated currency: |
BP – British Pound
EC – Euro
| (h) | | Indicates a fair valued security which has not been valued utilizing an independent quote and which is valued pursuant to guidelines established by the Trustees. The aggregate value of fair valued securities is $71, which is 0.21% of net assets. |
8 | | Semi-Annual Report | 6.30.03 | | | See accompanying notes |
Notes to Financial Statements
June 30, 2003 (Unaudited)
1. Organization
The Low Duration Portfolio (the “Portfolio”) is a series of the PIMCO Variable Insurance Trust (the “Trust”). The Trust is registered under the Investment Company Act of 1940 (the “Act”), as amended, as an open-end investment company organized as a Delaware business trust on October 3, 1997. The Trust may offer up to two classes of shares: Institutional and Administrative. Each share class has identical voting rights (except that shareholders of a class have exclusive voting rights regarding any matter relating solely to that class of shares). Information presented in these financial statements pertains to the Administrative Class of the Trust. Certain detailed financial information for the Institutional Class is provided separately and is available upon request. The Trust is designed to be used as an investment vehicle by Separate Accounts of insurance companies that fund variable annuity contracts and variable life insurance policies and by qualified pension and retirement plans. The Portfolio commenced operations on February 16, 1999.
2. Significant Accounting Policies
The following is a summary of significant accounting policies consistently followed by the Trust in the preparation of its financial statements in conformity with accounting principles generally accepted in the United States of America. The preparation of financial statements in accordance with accounting principles generally accepted in the United States of America requires management to make estimates and assumptions that affect the reported amounts and disclosures in the financial statements. Actual results could differ from those estimates.
Security Valuation. Portfolio securities and other financial instruments for which market quotations are readily available are stated at market value. Market value is determined at the close of regular trading (normally, 4:00 p.m., Eastern Time) on the New York Stock Exchange on each day the New York Stock Exchange is open, or if no sales are reported, as is the case for most securities traded over-the-counter, the mean between representative bid and asked quotations obtained from a quotation reporting system or from established market makers. Fixed income securities, including those to be purchased under firm commitment agreements, are normally valued on the basis of quotes obtained from brokers and dealers or pricing services. Short-term investments, which mature in 60 days or less are valued at amortized cost, which approximates market value. Certain fixed income securities for which daily market quotations are not readily available may be valued, pursuant to guidelines established by the Board of Trustees, with reference to fixed income securities whose prices are more readily obtainable. Prices may be obtained from independent pricing services which use information provided by market makers or estimates of market values obtained from yield data relating to investments or securities with similar characteristics. The prices used by the Portfolio may differ from the value that would be realized if the securities were sold and the differences could be material to the financial statements.
Securities Transactions and Investment Income. Securities transactions are recorded as of the trade date. Securities purchased or sold on a when-issued or delayed delivery basis may be settled a month or more after the trade date. Realized gains and losses from securities sold are recorded on the identified cost basis. Dividend income is recorded on the ex-dividend date, except certain dividends from foreign securities where the ex-dividend date may have passed, are recorded as soon as the Portfolio is informed of the ex-dividend date. Interest income, adjusted for the accretion of discounts and amortization of premiums, is recorded on the accrual basis. Paydowns gains and losses on mortgage- and asset-backed securities are recorded as adjustments to interest income in the Statement of Operations.
Dividends and Distributions to Shareholders. Dividends from net investment income, if any, are declared on each day the Trust is open for business and are distributed to shareholders monthly. All dividends are reinvested in additional shares of the Portfolio. Net realized capital gains earned by the Portfolio, if any, will be distributed no less frequently than once each year.
Income dividends and capital gain distributions are determined in accordance with income tax regulations which may differ from accounting principles generally accepted in the United States of America. These differences are primarily due to differing treatments for such items as wash sales, foreign currency transactions, net operating losses and capital loss carryforwards.
Distributions classified as a tax basis return of capital, if any, are reflected in the accompanying Statements of Changes in Net Assets and have been reclassified to paid in capital. In addition, other amounts have been reclassified between undistributed net investment income, accumulated undistributed net realized gains or losses and/or paid in capital to more appropriately conform financial accounting to tax characterizations of dividend distributions.
Foreign Currency. The accounting records of the Portfolio are maintained in U.S. dollars. The market values of foreign securities, currency holding and other assets and liabilities are translated into U.S. dollars based on the current exchange rates each business day. Fluctuations in the value of these assets and liabilities resulting from changes in exchange rates are recorded as unrealized foreign currency gains or losses. Realized gains or losses and unrealized appreciation (depreciation) on investment securities and income and expenses are translated on the respective dates of such transactions. The effect of changes in foreign currency exchange rates on investments in securities are not
6.30.03 | Semi-Annual Report | | 9 |
segregated in the Statement of Operations from the effects of changes in market prices of those securities, but are included with the net realized and unrealized gain or loss on investment securities.
Multiclass Operations. Each class offered by the Trust has equal rights as to assets. Income, non-class specific expenses, and realized and unrealized capital gains and losses are allocated to each class of shares based on the relative net assets of each class.
Federal Income Taxes. The Portfolio intends to qualify as a regulated investment company and distribute all of its taxable income and net realized gains, if applicable, to shareholders. Accordingly, no provision for Federal income taxes has been made.
Financing Transactions. The Portfolio may enter into financing transactions consisting of the sale by the Portfolio of securities, together with a commitment to repurchase similar securities at a future date. The difference between the selling price and the future purchase price is an adjustment to interest income in the Statement of Operations. If the counterparty to whom the Portfolio sells the security becomes insolvent, the Portfolio’s right to repurchase the security may be restricted; the value of the security may change over the term of the financing transaction; and the return earned by the Portfolio with the proceeds of a financing transaction may not exceed transaction costs. The Portfolio will designate assets determined to be liquid by PIMCO or otherwise cover its obligations under financing transactions.
Futures Contracts. The Portfolio is authorized to enter into futures contracts. The Portfolio may use futures contracts to manage its exposure to the securities markets or to movements in interest rates and currency values. The primary risks associated with the use of futures contracts are imperfect correlation between the change in market value of the securities held by the Portfolio and the prices of futures contracts, the possibility of an illiquid market, and the inability of the counterparty to meet the terms of the contract. Futures contracts are valued based upon their quoted daily settlement prices. Upon entering into a futures contract, the Portfolio may be required to deposit with its custodian, in a segregated account in the name of the futures broker, an amount of cash or U.S. Government and Agency Obligations in accordance with the initial margin requirements of the broker or exchange. Futures contracts are marked to market daily and an appropriate payable or receivable for the change in value (“variation margin”) is recorded by the Portfolio. Gains or losses are recognized but not considered realized until the contracts expire or are closed. Futures contracts involve, to varying degrees, risk of loss in excess of the variation margin disclosed in the Statement of Assets and Liabilities.
Options Contracts. The Portfolio may write call and put options on futures, securities or currencies it owns or in which it may invest. Writing put options tends to increase the Portfolio’s exposure to the underlying instrument. Writing call options tends to decrease the Portfolio’s exposure to the underlying instrument. When the Portfolio writes a call or put option, an amount equal to the premium received is recorded as a liability and subsequently marked to market to reflect the current value of the option written. Payment received or made, if any, from writing options with premiums to be determined on a future date are reflected as such on the Statement of Assets and Liabilities. Premiums received from writing options which expire are treated as realized gains. Premiums received from writing options which are exercised or closed are added to the proceeds or offset against amounts paid on the underlying future, security or currency transaction to determine the realized gain or loss. The Portfolio as a writer of an option has no control over whether the underlying future, security or currency may be sold (call) or purchased (put) and as a result bears the market risk of an unfavorable change in the price of the future, security or currency underlying the written option. There is the risk the Portfolio may not be able to enter into a closing transaction because of an illiquid market.
The Portfolio may also purchase put and call options. Purchasing call options tends to increase the Portfolio’s exposure to the underlying instrument. Purchasing put options tends to decrease the Portfolio’s exposure to the underlying instrument. The Portfolio pays a premium which is included in the Portfolio’s Statement of Assets and Liabilities as an investment and subsequently marked to market to reflect the current value of the option. Premiums paid for purchasing options which expire are treated as realized losses. The risk associated with purchasing put and call options is limited to the premium paid. Premiums paid for purchasing options which are exercised or closed are added to the amounts paid or offset against the proceeds on the underlying future, security or currency transaction to determine the realized gain or loss.
Swap Agreements. The Portfolio may invest in swap agreements. A swap is an agreement to exchange the return generated by one instrument for the return generated by another instrument. The Portfolio may enter into interest rate, total return, forward swap spread lock and credit default swap agreements to manage its exposure to interest rates and credit risk. Interest rate swap agreements involve the exchange by the Portfolio with another party of their respective commitments to pay or receive interest, e.g., an exchange of floating rate payments for fixed rate payments with respect to a notional amount of principal. Total return swap agreements involve commitments to pay interest in exchange for a market-linked return, both based on notional amounts. To the extent the total return of the security or index underlying the transaction exceeds or falls short of the
10 | | Semi-Annual Report | 6.30.03 |
offsetting interest rate obligation, the Portfolio will receive a payment from or make a payment to the counterparty. Forward spread lock swap agreements involve commitments to pay or receive a settlement amount calculated as the difference between the swap spread and a fixed spread, multiplied by the notional amount times the duration of the swap. The swap spread is the difference between the benchmark swap rate (market rate) and the specific Treasury rate. In a credit default swap, one party makes a stream of payments to another party in exchange for the right to receive a specified return in the event of a default by a third party, typically corporate issues or sovereign issues of an emerging country, on its obligation. The Portfolio may use credit default swaps to provide a measure of protection against defaults of sovereign issuers (i.e., to reduce risk where the Portfolio owns or has exposure to the sovereign issuer) or to take an active long or short position with respect to the likelihood of a particular issuer’s default. Swaps are marked to market daily based upon quotations from market makers and vendors and the change in value, if any, is recorded as unrealized gain or loss in the Statement of Operations. Payments received or made at the beginning of the measurement period are reflected as such on the Statement of Assets and Liabilities. A liquidation payment received or made at the termination of the swap is recorded as realized gain or loss in the Statement of Operations. Net periodic payments are included as part of miscellaneous income on the Statement of Operations. Entering into these agreements involves, to varying degrees, elements of credit, market and documentation risk in excess of the amounts recognized on the Statement of Assets and Liabilities. Such risks involve the possibility that there will be no liquid market for these agreements, that the counterparty to the agreements may default on its obligation to perform or disagree as to the meaning of contractual terms in the agreements, and that there may be unfavorable changes in interest rates.
Delayed Delivery Transactions. The Portfolio may purchase or sell securities on a when-issued or delayed delivery basis. These transactions involve a commitment by the Portfolio to purchase or sell securities for a predetermined price or yield, with payment and delivery taking place beyond the customary settlement period. When delayed delivery purchases are outstanding, the Portfolio will set aside and maintain until the settlement date in a segregated account, liquid assets in an amount sufficient to meet the purchase price. When purchasing a security on a delayed delivery basis, the Portfolio assumes the rights and risks of ownership of the security, including the risk of price and yield fluctuations, and takes such fluctuations into account when determining its net asset value. The Portfolio may dispose of or renegotiate a delayed delivery transaction after it is entered into, and may sell when-issued securities before they are delivered, which may result in a capital gain or loss. When the Portfolio has sold a security on a delayed delivery basis, the Portfolio does not participate in future gains and losses with respect to the security.
Inflation-Indexed Bonds. Inflation-indexed bonds are fixed income securities whose principal value is periodically adjusted to the rate of inflation. The interest rate on these bonds is generally fixed at issuance at a rate lower than typical bonds. Over the life of an inflation-indexed bond, however, interest will be paid based on a principal value, which is adjusted for inflation. Any increase in the principal amount of an inflation-indexed bond will be included as interest income in the Statement of Operations, even though investors do not receive their principal until maturity.
Repurchase Agreements. The Portfolio may engage in repurchase transactions. Under the terms of a typical repurchase agreement, the Portfolio takes possession of an underlying debt obligation subject to an obligation of the seller to repurchase, and the Portfolio to resell, the obligation at an agreed-upon price and time. The market value of the collateral must be equal at all times to the total amount of the repurchase obligations, including interest. Generally, in the event of counterparty default, the Portfolio has the right to use the collateral to offset losses incurred.
3. Fees, Expenses, and Related Party Transactions
Investment Advisory Fee. Pacific Investment Management Company LLC (PIMCO) is a majority owned subsidiary partnership of Allianz Dresdner Asset Management of America L.P. (formerly PIMCO Advisors L.P.) and serves as investment adviser (the “Adviser”) to the Trust, pursuant to an investment advisory contract. The Adviser receives a monthly fee at an annual rate based on average daily net assets of the Portfolio. The Advisory Fee is charged at an annual rate of 0.25%.
Administration Fee. PIMCO serves as administrator (the “Administrator”) and provides administrative services to the Trust for which it receives a monthly administrative fee based on average daily net assets of the Portfolio. The Administration Fee is charged at the annual rate of 0.25%.
Servicing Fee. PIMCO Advisors Distributors LLC (“PAD”), is an indirect wholly-owned subsidiary of Allianz Dresdner Asset Management of America L.P. and serves as the distributor of the Trust’s shares. The Trust is permitted to reimburse PAD on a quarterly basis, out of the Administrative Class assets of the Portfolio in the amount of 0.15% on an annual basis of the average daily net assets of that class, for payments made to financial intermediaries that provide services in connection with the distribution of shares or administration of plans or programs that use Portfolio shares as their funding medium. The effective rate paid to PAD during the current fiscal year is 0.15%.
6.30.03 | Semi-Annual Report | | 11 |
Expenses. The Portfolio is responsible for the following expenses: (i) salaries and other compensation of any of the Trust’s executive officers and employees who are not officers, directors, stockholders or employees of PIMCO or its subsidiaries or affiliates; (ii) taxes and governmental fees; (iii) brokerage fees and commissions and other portfolio transaction expenses; (iv) the cost of borrowing money, including interest expense; (v) fees and expenses of the Trustees who are not “interested persons” of PIMCO or the Trust, and any counsel retained exclusively for their benefit; (vi) extraordinary expenses, including costs of litigation and indemnification expenses; (vii) organization expenses and (viii) any expenses allocated or allocable to a specific class of shares, which include service fees payable with respect to the Administrative Class shares and may include certain other expenses as permitted by the Trust’s Multiple Class Plan adopted pursuant to Rule 18f-3 under the Act and subject to review and approval by the Trustees. The ratio of expenses to average net assets per share class, as disclosed in the Financial Highlights, may differ from the annual Portfolio operating expenses per share class as disclosed in the Prospectus for the reasons set forth above. PIMCO has agreed to waive a portion of its administrative fees to the extent that the payment of the Portfolio’s pro rata share of Trustees’ fees causes the actual expense ratio to rise above the rates disclosed in the current prospectus plus 0.49 basis points as set forth below (calculated as a percentage of the Portfolio’s average daily net assets attributable to each class):
| | | Institutional
Class
| | | Administrative
Class
| |
Low Duration Portfolio | | 0.50 | % | | 0.65 | % |
PIMCO may be reimbursed for these waived amounts in future periods. The Trust pays no compensation directly to any Trustee or any other officer who is affiliated with the Administrator, all of whom receive renumeration for their services to the Trust from the Administrator or its affiliates.
Each unaffiliated Trustee receives an annual retainer of $4,000, plus $1,500 for each Board of Trustees meeting attended in person and $250 for each meeting attended telephonically, plus reimbursement of related expenses. In addition, each committee chair receives an additional annual retainer of $500. These expenses are allocated on a pro-rata basis to each Portfolio of the Trust according to its respective net assets.
4. Purchases and Sales of Securities
Purchases and sales of securities (excluding short-term investments) for the period ended June 30, 2003 were as follows (amounts in thousands):
| | | U.S Government/Agency
| | All Other
|
| | | Purchases
| | Sales
| | Purchases
| | Sales
|
Low Duration Portfolio | | $ | 35,885 | | $ | 33,546 | | $ | 6,793 | | $ | 2,101 |
5. Transactions in Written Call and Put Options
Transactions in written call and put options were as follows (amounts in thousands):
| | | Low Duration Portfolio
|
| | | | | Premium
|
Balance at 12/31/2002 | | | | $ | 4 |
Sales | | | | | 12 |
Closing Buys | | | | | 0 |
Expirations | | | | | 0 |
Exercised | | | | | 0 |
| | | | |
|
|
Balance at 06/30/2003 | | | | $ | 16 |
| | | | |
|
|
12 | | Semi-Annual Report | 6.30.03 |
6. Federal Income Tax Matters
At June 30, 2003, the aggregate cost of investments was the same for federal income tax and financial statement purposes. The net unrealized appreciation (depreciation) of investments securities for federal income tax purposes is as follows (amounts in thousands):
| | | Aggregate Gross
Unrealized
Appreciation
| | Aggregate Gross
Unrealized
(Depreciation)
| | | Net
Unrealized
Appreciation
|
Low Duration Portfolio | | $ | 272 | | $ | (39 | ) | | $ | 233 |
7. Shares of Beneficial Interest
The Trust may issue an unlimited number of shares of beneficial interest with a $.0001 par value. Changes in shares of beneficial interest were as follows (shares and amounts in thousands):
| | | Low Duration Portfolio
| |
| | | Six Months Ended
06/30/2003
| | | Year Ended
12/31/2002
| |
| | | Shares
| | | Amount
| | | Shares
| | | Amount
| |
Receipts for shares sold | | | | | | | | | | | | | | |
Institutional Class | | 0 | | | $ | 0 | | | 0 | | | $ | 0 | |
Administrative Class | | 1,669 | | | | 17,201 | | | 1,479 | | | | 15,004 | |
Issued as reinvestment of distributions | | | | | | | | | | | | | | |
Institutional Class | | 0 | | | | 0 | | | 0 | | | | 1 | |
Administrative Class | | 28 | | | | 289 | | | 43 | | | | 432 | |
Cost of shares redeemed | | | | | | | | | | | | | | |
Institutional Class | | 0 | | | | 0 | | | (46 | ) | | | (460 | ) |
Administrative Class | | (313 | ) | | | (3,234 | ) | | (137 | ) | | | (1,388 | ) |
| | |
|
| |
|
|
| |
|
| |
|
|
|
Net increase resulting from Portfolio share transactions | | 1,384 | | | $ | 14,256 | | | 1,339 | | | $ | 13,589 | |
| | |
|
| |
|
|
| |
|
| |
|
|
|
The following schedule shows the number of shareholders each owning 5% or more of the Portfolio and the total percentage of the Portfolio held by such shareholders:
| | | Number
| | % of Portfolio
Held
|
Low Duration Portfolio | | | | |
Institutional Class | | 1 | | 100 |
Administrative Class | | 6 | | 92 |
6.30.03 | Semi-Annual Report | | 13 |
Trustees and Officers
Brent R. Harris, Chairman and Trustee
R. Wesley Burns, President and Trustee
E. Philip Cannon, Trustee
Vern O. Curtis, Trustee
J. Michael Hagan, Trustee
William J. Popejoy, Trustee
Garlin G. Flynn, Secretary
John P. Hardaway, Treasurer
Investment Adviser and Administrator
Pacific Investment Management Company LLC
840 Newport Center Drive
Newport Beach, California 92660
Transfer Agent
National Financial Data Services
330 W. 9th Street, 4th Floor
Kansas City, Missouri 64105
Custodian
State Street Bank & Trust Company
801 Pennsylvania
Kansas City, Missouri 64105
Counsel
Dechert LLP
1775 I Street, N.W.
Washington, D.C. 20006
Independent Accountants
PricewaterhouseCoopers LLP
1055 Broadway
Kansas City, Missouri 64105
PIMCO VARIABLE INSURANCE TRUST
This report is submitted for the general information of the shareholders of the PIMCO Variable Insurance Trust. It is not authorized for distribution to prospective investors unless accompanied or preceded by an effective prospectus for the PIMCO Variable Insurance Trust, which contains information covering its investment policies as well as other pertinent information.
All Funds distributed by PIMCO ADVISORS DISTRIBUTORS LLC, member NASD
840 NEWPORT CENTER DRIVE
NEWPORT BEACH, CA 92660
800.927.4648
WWW.PIMCOADVISORS.COM
WWW.PIMCO.COM
| P I M C O |
| PIMCO VARIABLE INSURANCE TRUST |
| LOW DURATION PORTFOLIO |
| INSTITUTIONAL CLASS |
|
| SEMI-ANNUAL REPORT |
| June 30, 2003 |
Contents
| | | Fund Summary
| | Schedule of Investments
|
Low Duration Portfolio (Institutional Class) | | 2 | | 7 |
Chairman’s Letter
Dear PIMCO Variable Insurance Trust Shareholder:
Financial assets gained during the first half of 2003 amid a revival of risk appetites as anxiety about the war in Iraq faded. Assets that generally benefit from economic growth, such as stocks, corporate bonds and emerging market debt, fared the best year-to-date as investors returned to these sectors in anticipation of a recovery in the second half of 2003. Reflationary forces that investors expected to fuel a rebound included federal tax cuts and a weak dollar, as well as low borrowing rates that eased the burden of high personal and corporate indebtedness. Low mortgage rates kept refinancings booming in the second quarter and put more money in consumers’ pockets.
U.S. Treasuries lagged their riskier counterparts but still enjoyed a modest rally. Yields fell to levels not seen in 45 years early in the second quarter before bouncing off their lows in June as hopes for recovery increased. The yield on the benchmark 10-year Treasury closed the six-month period 0.30% lower to 3.51%, after nearing 3% earlier in the period. Buyers were encouraged that inflation would remain tame amid low capacity utilization and weak employment growth. Asian central banks bought U.S. Treasuries to limit the rise in their currencies versus the dollar in an effort to protect their export industries. In June, the Federal Reserve cut the federal funds rate by 0.25% to 1%, its 13th easing since 2001, in an effort to boost the economy and ward off deflation. Although the cut was less than expected, the Fed suggested that rates would stay low until deflation risks abated.
On the following pages you will find specific details as to the Portfolio’s total return investment performance and a discussion of those factors that affected performance.
We appreciate the trust you have placed in us, and we will continue to focus our efforts to meet your investment needs.
Sincerely,
Brent R. Harris
Chairman
July 31, 2003
6.30.03 | Semi-Annual Report | | 1 |
Low Duration Portfolio
TOTAL RETURN INVESTMENT PERFORMANCE For the period ended June 30, 2003
| | | 1 Year | | | Since Inception* | |
Low Duration Portfolio Institutional Class | | 6.26 | % | | 7.35 | % |
Merrill Lynch 1-3 Year Treasury Index | | 4.65 | % | | — | |
| * | | Annualized (All Portfolio returns are net of fees and expenses) |
CUMULATIVE RETURNS THROUGH JUNE 30, 2003
$10,000 invested at inception
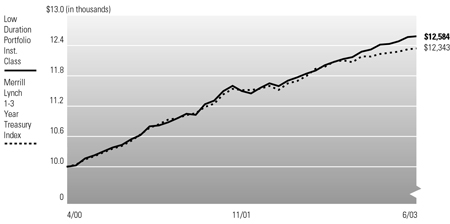
Past performance is no guarantee of future results. Investment return and principal value will fluctuate so that Portfolio shares, when redeemed, may be worth more or less than their original cost. The line graph above assumes the investment of $10,000 on 5/01/2000, the first full month following the Portfolio’s Institutional Class inception on 4/10/2000, compared to the Merrill Lynch 1-3 Year Treasury Index, an unmanaged market index. It is not possible to invest directly in the Index. The Portfolio may invest in foreign securities which involve potentially higher risks including foreign currency fluctuations and political or economic uncertainty. These risks may be enhanced when investing in emerging market securities.
PORTFOLIO INSIGHTS
| • | | The Low Duration Portfolio seeks to achieve its investment objective by investing under normal circumstances at least 65% of its total assets in a diversified portfolio of Fixed Income Instruments of varying maturities. |
| • | | The Portfolio’s Institutional class returned 2.49% during the six-month period ended June 30, 2003, outperforming the 1.31% return of the Merrill Lynch 1-3 Year Treasury Index. |
| • | | Portfolio duration was near the benchmark throughout the period, and had little effect on relative performance. An emphasis on both short and long maturities had a minimal impact on returns as the shape of the yield curve changed little over the period. |
| • | | Emphasis on shorter duration mortgages was positive. An overweight of lower coupon mortgages, which are less vulnerable to prepayment risk, helped returns as these issues outperformed. |
| • | | A corporate allocation was positive as corporates outperformed during the period. Positive security selection of telecom and energy pipeline issues additionally contributed to returns as they were among the strongest performers. |
| • | | Eurozone exposure added modestly to returns. While Europe lagged Treasuries overall, short Eurozone maturities outperformed due to expectations of more easing by the European Central Bank. |
| • | | As the emerging market sector’s economic fundamentals continued to improve, sustaining a recovery that began late last year, emerging market bonds added to returns, especially those from Brazil. |
2 | | Semi-Annual Report | 6.30.03 |
Financial Highlights
Low Duration Portfolio (Institutional Class)
| Selected Per Share Data for the Year or Period Ended: | | 06/30/2003 +
| | | 12/31/2002
| | | 12/31/2001
| | | 04/10/2000-12/31/2000
| |
Net asset value beginning of period | | $ | 10.23 | | | $ | 9.95 | | | $ | 9.82 | | | $ | 9.70 | |
Net investment income (a) | | | 0.11 | | | | 0.38 | | | | 0.60 | | | | 0.46 | |
Net realized/unrealized gain on investments (a) | | | 0.14 | | | | 0.33 | | | | 0.15 | | | | 0.12 | |
Total income from investment operations | | | 0.25 | | | | 0.71 | | | | 0.75 | | | | 0.58 | |
Dividends from net investment income | | | (0.12 | ) | | | (0.37 | ) | | | (0.56 | ) | | | (0.46 | ) |
Distributions from net realized capital gains | | | 0.00 | | | | (0.06 | ) | | | (0.06 | ) | | | 0.00 | |
Total distributions | | | (0.12 | ) | | | (0.43 | ) | | | (0.62 | ) | | | (0.46 | ) |
Net asset value end of period | | $ | 10.36 | | | $ | 10.23 | | | $ | 9.95 | | | $ | 9.82 | |
Total return | | | 2.49 | % | | | 7.22 | % | | | 7.77 | % | | | 6.13 | % |
Net assets end of period (000s) | | $ | 11 | | | $ | 11 | | | $ | 468 | | | $ | 5,430 | |
Ratio of expenses to average net assets | | | 0.51 | %*(b) | | | 0.51 | %(b) | | | 0.55 | %(b) | | | 0.50 | %* |
Ratio of net investment income to average net assets | | | 2.17 | %* | | | 3.79 | % | | | 5.99 | % | | | 6.49 | %* |
Portfolio turnover rate | | | 195 | % | | | 339 | % | | | 661 | % | | | 165 | % |
| (a) | | Per share amounts based on average number of shares outstanding during the period. |
| (b) | | Ratio of expenses to average net assets excluding interest expense is 0.50%. |
See accompanying notes | | | 6.30.03 | Semi-Annual Report | | 3 |
Statement of Assets and Liabilities
Low Duration Portfolio
June 30, 2003 (Unaudited)
Amounts in thousands, except per share amounts
Assets: | | | |
Investments, at value | | $ | 39,092 |
Foreign currency, at value | | | 63 |
Receivable for investments sold | | | 6,994 |
Receivable for Portfolio shares sold | | | 130 |
Interest receivable | | | 146 |
Variation margin receivable | | | 6 |
Swap premiums paid | | | 18 |
Unrealized appreciation on swap agreements | | | 3 |
| | |
|
|
| | | | 46,452 |
| | |
|
|
Liabilities: | | | |
Payable for investments purchased | | $ | 12,327 |
Written options outstanding | | | 17 |
Accrued investment advisory fee | | | 7 |
Accrued administration fee | | | 7 |
Accrued servicing fee | | | 4 |
Unrealized depreciation on swap agreements | | | 4 |
| | |
|
|
| | | | 12,366 |
| | |
|
|
Net Assets | | $ | 34,086 |
| | |
|
|
Net Assets Consist of: | | | |
Paid in capital | | $ | 33,478 |
Undistributed net investment income | | | 58 |
Accumulated undistributed net realized gain | | | 335 |
Net unrealized appreciation | | | 215 |
| | |
|
|
| | | $ | 34,086 |
| | |
|
|
Net Assets: | | | |
Institutional Class | | $ | 11 |
Administrative Class | | | 34,075 |
Shares Issued and Outstanding: | | | |
Institutional Class | | | 1 |
Administrative Class | | | 3,289 |
Net Asset Value and Redemption Price Per Share (Net Assets Per Share Outstanding) | | | |
Institutional Class | | $ | 10.36 |
Administrative Class | | | 10.36 |
Cost of Investments Owned | | $ | 38,859 |
Cost of Foreign Currency Held | | $ | 64 |
4 | | Semi-Annual Report | 6.30.03 | | | See accompanying notes |
Statement of Operations
Low Duration Portfolio
For the six months ended June 30, 2003 (Unaudited)
Amounts in thousands
Investment Income: | | | | |
Interest | | $ | 341 | |
| | |
|
|
|
Total Income | | | 341 | |
| | |
|
|
|
Expenses: | | | | |
Investment advisory fees | | | 32 | |
Administration fees | | | 32 | |
Distribution and/or servicing fees - Administrative Class | | | 19 | |
Interest expense | | | 1 | |
| | |
|
|
|
Total Expenses | | | 84 | |
| | |
|
|
|
Net Investment Income | | | 257 | |
| | |
|
|
|
Net Realized and Unrealized Gain (Loss): | | | | |
Net realized gain on investments | | | 227 | |
Net realized gain on futures contracts, written options, and swaps | | | 86 | |
Net realized gain on foreign currency transactions | | | 8 | |
Net change in unrealized appreciation on investments | | | 73 | |
Net change in unrealized (depreciation) on futures contracts, written options, and swaps | | | (32 | ) |
Net change in unrealized (depreciation) on translation of assets and liabilities denominated in foreign currencies | | | (6 | ) |
Net Gain | | | 356 | |
| | |
|
|
|
Net Increase in Assets Resulting from Operations | | $ | 613 | |
| | |
|
|
|
See accompanying notes | | | 6.30.03 | Semi-Annual Report | | 5 |
Statements of Changes in Net Assets
Low Duration Portfolio
Amounts in thousands
| Increase (Decrease) in Net Assets from: | | Six Months Ended June 30, 2003
| | | Year Ended December 31, 2002
| |
| | | (Unaudited) | | | | |
Operations: | | | | | | | | |
Net investment income | | $ | 257 | | | $ | 348 | |
Net realized gain | | | 321 | | | | 242 | |
Net change in unrealized appreciation | | | 35 | | | | 117 | |
| | |
|
|
| |
|
|
|
Net increase resulting from operations | | | 613 | | | | 707 | |
| | |
|
|
| |
|
|
|
Distributions to Shareholders: | | | | | | | | |
From net investment income | | | | | | | | |
Institutional Class | | | 0 | | | | (1 | ) |
Administrative Class | | | (289 | ) | | | (347 | ) |
From net realized capital gains | | | | | | | | |
Institutional Class | | | 0 | | | | 0 | |
Administrative Class | | | 0 | | | | (85 | ) |
| | |
|
|
| |
|
|
|
Total Distributions | | | (289 | ) | | | (433 | ) |
| | |
|
|
| |
|
|
|
Portfolio Share Transactions: | | | | | | | | |
Receipts for shares sold | | | | | | | | |
Institutional Class | | | 0 | | | | 0 | |
Administrative Class | | | 17,201 | | | | 15,004 | |
Issued as reinvestment of distributions | | | | | | | | |
Institutional Class | | | 0 | | | | 1 | |
Administrative Class | | | 289 | | | | 432 | |
Cost of shares redeemed | | | | | | | | |
Institutional Class | | | 0 | | | | (460 | ) |
Administrative Class | | | (3,234 | ) | | | (1,388 | ) |
| | |
|
|
| |
|
|
|
Net increase resulting from Portfolio share transactions | | | 14,256 | | | | 13,589 | |
| | |
|
|
| |
|
|
|
Total Increase in Net Assets | | | 14,580 | | | | 13,863 | |
| | |
|
|
| |
|
|
|
Net Assets: | | | | | | | | |
Beginning of period | | | 19,506 | | | | 5,643 | |
End of period* | | $ | 34,086 | | | $ | 19,506 | |
*Including undistributed net investment income of: | | $ | 58 | | | $ | 90 | |
6 | | Semi-Annual Report | 6.30.03 | | | See accompanying notes |
Schedule of Investments
Low Duration Portfolio
June 30, 2003 (Unaudited)
| | | Principal Amount (000s)
| | Value (000s)
|
CORPORATE BONDS & NOTES 16.7% | | | | | | |
Banking & Finance 3.4% | | | | | | |
CIT Group, Inc. | | | | | | |
7.500% due 11/14/2003 | | $ | 100 | | $ | 102 |
2.780% due 03/01/2004 (a) | | | 70 | | | 71 |
2.618% due 07/30/2004 (a) | | | 100 | | | 101 |
General Electric Capital Corp. | | | | | | |
4.250% due 01/15/2008 | | | 250 | | | 265 |
General Motors Acceptance Corp. | | | | | | |
1.630% due 08/04/2003 (a) | | | 200 | | | 200 |
1.679% due 07/21/2004 (a) | | | 100 | | | 99 |
Household Finance Corp. | | | | | | |
4.625% due 01/15/2008 | | | 200 | | | 214 |
Pemex Project Funding Master Trust | | | | | | |
2.778% due 01/07/2005 (a) | | | 100 | | | 101 |
| | | | | |
|
|
| | | | | | | 1,153 |
| | | | | |
|
|
Industrials 9.3% | | | | | | |
Altria Group, Inc. | | | | | | |
7.650% due 07/01/2008 | | | 200 | | | 224 |
AOL Time Warner, Inc. | | | | | | |
6.125% due 04/15/2006 | | | 250 | | | 274 |
Clear Channel Communications, Inc. | | | | | | |
6.000% due 11/01/2006 | | | 250 | | | 274 |
Comcast Cable Communications, Inc. | | | | | | |
8.375% due 05/01/2007 | | | 200 | | | 236 |
Conoco Funding Co. | | | | | | |
5.450% due 10/15/2006 | | | 100 | | | 110 |
Cox Communications, Inc. | | | | | | |
7.750% due 08/15/2006 | | | 250 | | | 289 |
DaimlerChrysler North America Holding Corp. | | | | | | |
1.810% due 08/02/2004 (a) | | | 200 | | | 200 |
Harrahs Operating Co., Inc. | | | | | | |
7.125% due 06/01/2007 | | | 200 | | | 226 |
International Paper Co. | | | | | | |
7.625% due 01/15/2007 | | | 250 | | | 290 |
Kroger Co. | | | | | | |
7.625% due 09/15/2006 | | | 250 | | | 285 |
Safeway, Inc. | | | | | | |
6.150% due 03/01/2006 | | | 250 | | | 271 |
Walt Disney Co. | | | | | | |
5.375% due 06/01/2007 | | | 250 | | | 273 |
Weyerhaeuser Co. | | | | | | |
6.125% due 03/15/2007 | | | 200 | | | 221 |
| | | | | |
|
|
| | | | | | | 3,173 |
| | | | | |
|
|
Utilities 4.0% | | | | | | |
Appalachian Power Co. | | | | | | |
4.800% due 06/15/2005 | | | 40 | | | 42 |
AT&T Wireless Services, Inc. | | | | | | |
7.350% due 03/01/2006 | | | 100 | | | 112 |
7.500% due 05/01/2007 | | | 150 | | | 173 |
British Telecom PLC | | | | | | |
2.413% due 12/15/2003 (a) | | | 100 | | | 100 |
Dominion Resources, Inc. | | | | | | |
7.600% due 07/15/2003 | | | 100 | | | 100 |
Entergy Mississippi, Inc. | | | | | | |
4.350% due 04/01/2008 | | | 100 | | | 103 |
France Telecom S.A. | | | | | | |
8.700% due 03/01/2006 (a) | | | 100 | | | 114 |
Pacific Gas & Electric Co. | | | | | | |
7.958% due 10/31/2049 (a) | | | 100 | | | 101 |
Progress Energy, Inc. | | | | | | |
6.750% due 03/01/2006 | | | 250 | | | 278 |
Sprint Capital Corp. | | | | | | |
5.700% due 11/15/2003 | | | 200 | | | 201 |
6.125% due 11/15/2008 | | | 35 | | | 38 |
| | | | | |
|
|
| | | | | | | 1,362 |
| | | | | |
|
|
Total Corporate Bonds & Notes
(Cost $5,523) | | | | | | 5,688 |
| | | | | |
|
|
U.S. GOVERNMENT AGENCIES 3.2% | | | | | | |
Federal Home Loan Bank | | | | | | |
5.500% due 04/17/2006 | | | 1,000 | | | 1,103 |
| | | | | |
|
|
Total U.S. Government Agencies
(Cost $1,069) | | | | | | 1,103 |
| | | | | |
|
|
U.S. TREASURY OBLIGATIONS 5.5% | | | | | | |
Treasury Inflation Protected Securities (e) | | | | | | |
3.625% due 01/15/2008 | | | 341 | | | 383 |
3.875% due 01/15/2009 | | | 1,166 | | | 1,335 |
4.250% due 01/15/2010 | | | 22 | | | 26 |
3.500% due 01/15/2011 | | | 63 | | | 72 |
3.875% due 04/15/2029 | | | 34 | | | 43 |
| | | | | |
|
|
Total U.S. Treasury Obligations
(Cost $1,836) | | | | | | 1,859 |
| | | | | |
|
|
MORTGAGE-BACKED SECURITIES 29.8% | | | | | | |
Collateralized Mortgage Obligations 9.4% | | | | | | |
Bank of America Mortgage Securities, Inc. | | | | | | |
6.181% due 07/25/2031 (a) | | | 11 | | | 11 |
5.776% due 10/20/2032 (a) | | | 49 | | | 51 |
Bear Stearns Adjustable Rate Mortgage Trust | | | | | | |
6.199% due 01/25/2032 (a) | | | 15 | | | 15 |
6.044% due 06/25/2032 (a) | | | 92 | | | 94 |
5.407% due 10/25/2032 (a) | | | 13 | | | 14 |
5.375% due 01/25/2033 (a) | | | 160 | | | 163 |
5.462% due 03/25/2033 (a) | | | 187 | | | 191 |
5.229% due 04/25/2033 (a) | | | 178 | | | 182 |
Countrywide Alternative Loan Trust | | | | | | |
4.750% due 01/25/2033 | | | 190 | | | 192 |
6.500% due 06/25/2033 | | | 286 | | | 295 |
CS First Boston Mortgage Securities Corp. | | | | | | |
2.478% due 03/25/2032 (a) | | | 77 | | | 75 |
6.181% due 06/25/2032 (a) | | | 25 | | | 26 |
5.760% due 10/25/2032 (a)(h) | | | 71 | | | 71 |
1.429% due 08/25/2033 (a) | | | 93 | | | 92 |
4.370% due 12/19/2039 (a) | | | 25 | | | 25 |
Fannie Mae | | | | | | |
5.000% due 09/25/2018 | | | 50 | | | 50 |
6.000% due 12/25/2028 | | | 88 | | | 89 |
6.000% due 02/25/2029 | | | 38 | | | 38 |
6.000% due 08/25/2029 | | | 125 | | | 127 |
6.500% due 01/01/2033 | | | 93 | | | 100 |
5.000% due 04/25/2033 | | | 337 | | | 344 |
First Horizon Asset Securities, Inc. | | | | | | |
6.750% due 02/25/2031 | | | 3 | | | 3 |
Freddie Mac | | | | | | |
5.625% due 07/15/2028 | | | 39 | | | 39 |
GSR Mortgage Loan Trust | | | | | | |
5.358% due 01/25/2032 (a) | | | 64 | | | 65 |
6.000% due 03/25/2032 | | | 75 | | | 77 |
6.000% due 07/25/2032 | | | 68 | | | 69 |
2.882% due 10/25/2032 (a) | | | 16 | | | 16 |
Master Asset Securitization Trust | | | | | | |
5.500% due 07/31/2033 | | | 200 | | | 203 |
Residential Funding Mortgage Securities I, Inc. | | | | | | |
5.654% due 09/25/2032 (a) | | | 20 | | | 20 |
Sequoia Mortgage Trust | | | | | | |
1.443% due 05/20/2032 (a) | | | 88 | | | 87 |
1.403% due 08/20/2032 (a) | | | 45 | | | 45 |
Structured Asset Mortgage Investments, Inc. | | | | | | |
1.422% due 09/19/2032 (a) | | | 113 | | | 112 |
Structured Asset Securities Corp. | | | | | | |
1.335% due 10/25/2027 (a) | | | 68 | | | 67 |
6.750% due 07/25/2029 | | | 60 | | | 61 |
6.150% due 07/25/2032 (a) | | | 12 | | | 12 |
Washington Mutual Loan Trust | | | | | | |
4.286% due 01/25/2041 (a) | | | 26 | | | 26 |
Washington Mutual Mortgage Securities Corp. | | | | | | |
6.190% due 07/25/2032 (a) | | | 46 | | | 47 |
Washington Mutual, Inc. | | | | | | |
5.500% due 09/25/2032 | | | 15 | | | 15 |
Wells Fargo Mortgage-Backed Securities Trust | | | | | | |
7.000% due 02/25/2016 | | | 9 | | | 9 |
| | | | | |
|
|
| | | | | | | 3,218 |
| | | | | |
|
|
Fannie Mae 9.4% | | | | | | |
3.147% due 09/01/2040 (a) | | | 64 | | | 65 |
5.500% due 10/01/2017 | | | 369 | | | 383 |
6.000% due 06/01/2016-08/13/2033 (b) | | | 2,149 | | | 2,236 |
6.500% due 08/01/2032 | | | 99 | | | 103 |
4.500% due 07/17/2018 | | | 400 | | | 408 |
| | | | | |
|
|
| | | | | | | 3,195 |
| | | | | |
|
|
Federal Housing Administration 0.6% | | | | | | |
7.430% due 10/01/2020 | | | 198 | | | 202 |
| | | | | |
|
|
Freddie Mac 10.4% | | | | | | |
5.000% due 08/18/2018 | | | 100 | | | 103 |
6.000% due 09/01/2016-08/13/2033 (b) | | | 3,250 | | | 3,370 |
6.500% due 08/01/2032 | | | 82 | | | 86 |
| | | | | |
|
|
| | | | | | | 3,559 |
| | | | | |
|
|
Total Mortgage-Backed Securities
(Cost $10,160) | | | | | | 10,174 |
| | | | | |
|
|
ASSET-BACKED SECURITIES 2.2% | | | | | | |
Ace Securities Corp. | | | | | | |
1.375% due 06/25/2032 (a) | | | 13 | | | 13 |
Amortizing Residential Collateral Trust | | | | | | |
1.325% due 07/25/2032 (a) | | | 72 | | | 72 |
Centex Home Equity | | | | | | |
5.770% due 11/25/2027 | | | 350 | | | 355 |
CIT Group Home Equity Loan Trust | | | | | | |
1.305% due 06/25/2033 (a) | | | 70 | | | 70 |
Credit-Based Asset Servicing and Securities | | | | | | |
1.355% due 06/25/2032 (a) | | | 17 | | | 17 |
Equity One ABS, Inc. | | | | | | |
1.315% due 11/25/2032 (a) | | | 61 | | | 61 |
Home Equity Mortgage Trust | | | | | | |
1.365% due 11/25/2032 (a) | | | 43 | | | 43 |
Household Mortgage Loan Trust | | | | | | |
1.403% due 05/20/2032 (a) | | | 13 | | | 13 |
Irwin Home Equity Loan Trust | | | | | | |
1.325% due 06/25/2009 (a) | | | 16 | | | 16 |
Morgan Stanley Dean Witter Capital I | | | | | | |
1.365% due 07/25/2032 (a) | | | 32 | | | 32 |
New Century Home Equity Loan Trust | | | | | | |
1.305% due 04/25/2030 (a) | | | 10 | | | 10 |
Vanderbilt Acquisition Loan Trust | | | | | | |
3.280% due 01/07/2013 | | | 57 | | | 57 |
| | | | | |
|
|
Total Asset-Backed Securities
(Cost $761) | | | | | | 759 |
| | | | | |
|
|
SOVEREIGN ISSUES 0.2% | | | | | | |
Republic of Brazil | | | | | | |
2.125% due 04/15/2006 (a) | | | 82 | | | 77 |
| | | | | |
|
|
Total Sovereign Issues
(Cost $77) | | | | | | 77 |
| | | | | |
|
|
SHORT-TERM INSTRUMENTS 57.0% | | | | | | |
Commercial Paper 53.3% | | | | | | |
ABN AMRO Mortgage Corp. | | | | | | |
1.200% due 07/07/2003 | | | 500 | | | 500 |
Barclays U.S. Funding Corp. | | | | | | |
1.200% due 08/27/2003 | | | 600 | | | 599 |
0.920% due 09/22/2003 | | | 200 | | | 199 |
CBA Finance, Inc. | | | | | | |
1.090% due 07/11/2003 | | | 100 | | | 100 |
Danske Corp. | | | | | | |
1.233% due 07/07/2003 | | | 500 | | | 500 |
E. I. du Pont de Nemours & Co. | | | | | | |
1.170% due 08/21/2003 | | | 600 | | | 599 |
Fannie Mae | | | | | | |
1.135% due 08/13/2003 | | | 500 | | | 499 |
1.165% due 08/13/2003 | | | 700 | | | 699 |
0.950% due 08/27/2003 | | | 900 | | | 899 |
0.900% due 09/03/2003 | | | 1,500 | | | 1,497 |
1.010% due 09/10/2003 | | | 500 | | | 499 |
1.010% due 09/17/2003 | | | 2,000 | | | 1,995 |
0.890% due 10/15/2003 | | | 1,300 | | | 1,296 |
See accompanying notes | | | 6.30.03 | Semi-Annual Report | | 7 |
| | | Principal Amount (000s)
| | Value (000s)
| |
Federal Home Loan Bank | | | | | | | |
1.165% due 07/16/2003 | | $ | 1,000 | | $ | 999 | |
1.165% due 08/01/2003 | | | 800 | | | 799 | |
Freddie Mac | | | | | | | |
1.170% due 07/21/2003 | | | 1,000 | | | 999 | |
1.150% due 08/28/2003 | | | 1,300 | | | 1,298 | |
1.135% due 10/30/2003 | | | 1,100 | | | 1,096 | |
1.140% due 11/07/2003 | | | 100 | | | 100 | |
General Electric Capital Corp. | | | | | | | |
1.050% due 08/11/2003 | | | 600 | | | 599 | |
HBOS Treasury Services PLC | | | | | | | |
1.243% due 07/02/2003 | | | 500 | | | 500 | |
1.180% due 08/26/2003 | | | 200 | | | 200 | |
Royal Bank of Scotland PLC | | | | | | | |
1.220% due 07/16/2003 | | | 400 | | | 400 | |
Shell Finance | | | | | | | |
1.120% due 07/10/2003 | | | 500 | | | 500 | |
UBS Finance, Inc. | | | | | | | |
1.210% due 07/08/2003 | | | 600 | | | 600 | |
0.930% due 09/18/2003 | | | 200 | | | 200 | |
| | | | | |
|
|
|
| | | | | | | 18,171 | |
| | | | | |
|
|
|
Repurchase Agreement 2.7% | | | | | | | |
State Street Bank | | | | | | | |
0.800% due 07/01/2003 | | | 936 | | | 936 | |
(Dated 06/30/2003. Collateralized by Federal Farm Credit Banks 2.000% due 11/19/2004 valued at $957. Repurchase proceeds are $936.) | | | | | | | |
| | | | | |
|
|
|
U.S. Treasury Bills 1.0% | | | | | | | |
1.686% due 08/07/2003-08/14/2003 (b)(d) | | | 325 | | | 325 | |
| | | | | |
|
|
|
Total Short-Term Instruments
(Cost $19,433) | | | | | | 19,432 | |
| | | | | |
|
|
|
Total Investments 114.6%
(Cost $38,859) | | | | | $ | 39,092 | |
Written Options (c) (0.0%)
(Premiums $16) | | | | | | (17 | ) |
Other Assets and Liabilities (Net) (14.6%) | | | | | | (4,989 | ) |
| | | | | |
|
|
|
Net Assets 100.0% | | | | | $ | 34,086 | |
| | | | | |
|
|
|
Notes to Schedule of Investments
(amounts in thousands, except number of contracts):
| (a) | | Variable rate security. The rate listed is as of June 30, 2003. |
| (b) | | Securities are grouped by coupon or range of coupons and represent a range of maturities. |
| (c) | | Premiums received on written options: |
Type
| | Notional Amount
| | Premium
| | Value
|
Call - OTC 10 Year Interest Rate Swap | | | | | | | | | |
Strike @ 4.000%* Exp. 07/22/2003 | | $ | 400,000 | | $ | 4 | | $ | 6 |
Call - OTC 7 Year Interest Rate Swap | | | | | | | | | |
Strike @ 3.500%* Exp. 07/22/2003 | | | 300,000 | | | 3 | | | 5 |
Put - OTC 7 Year Interest Rate Swap | | | | | | | | | |
Strike @ 5.500%** Exp. 12/17/2003 | | | 300,000 | | | 4 | | | 0 |
| | | | | |
|
| |
|
|
| | | | | | $ | 11 | | $ | 11 |
| | | | | |
|
| |
|
|
Type
| | # of Contracts
| | Premium
| | Value
|
Call - CBOT U.S. Treasury Note September Futures | | | | | | | | |
Strike @ 123.000 Exp. 08/23/2003 | | 2 | | $ | 0 | | $ | 0 |
Put - CBOT U.S. Treasury Note September Futures | | | | | | | | |
Strike @ 116.000 Exp. 08/23/2003 | | 4 | | | 2 | | | 3 |
Call - CBOT U.S. Treasury Bond September Futures | | | | | | | | |
Strike @ 126.000 Exp. 08/23/2003 | | 2 | | | 0 | | | 0 |
Put - CBOT U.S. Treasury Bond September Futures | | | | | | | | |
Strike @ 114.000 Exp. 8/23/2003 | | 4 | | | 3 | | | 3 |
| | | | |
|
| |
|
|
| | | | | $ | 5 | | $ | 6 |
| | | | |
|
| |
|
|
| * | | The Portfolio will receive a floating rate based on 3-month LIBOR. |
| ** | | The Portfolio will pay a floating rate based on 3-month LIBOR. |
| (d) | | Securities with an aggregate market value of $325 have been segregated with the custodian to cover margin requirements for the following open futures contracts at June 30, 2003: |
Type
| | # of
Contracts
| | Unrealized
Appreciation/
(Depreciation)
| |
Euribor September Futures (09/2003) - Long | | 1 | | $ | 2 | |
Euro-Bobl 5 Year Note (09/2003) - Long | | 2 | | | (2 | ) |
Eurodollar March Futures (03/2005) - Long | | 1 | | | 2 | |
Eurodollar December Futures (12/2004) - Long | | 1 | | | 2 | |
U.S. Treasury 10 Year Note (09/2003) - Long | | 7 | | | (4 | ) |
U.S. Treasury 30 Year Bond (09/2003) - Long | | 3 | | | (13 | ) |
| | | | |
|
|
|
| | | | | $ | (13 | ) |
| | | | |
|
|
|
| (e) | | Principal amount of security is adjusted for inflation. |
| (f) | | Swap agreements outstanding at June 30, 2003: |
Type
| | Notional Amount
| | Unrealized Appreciation/ (Depreciation)
| |
Receive a fixed rate equal to 4.000% and pay floating rate based on 6-month BP-LIBOR. | | | | | | | |
| | |
Counterparty: Morgan Stanley Dean Witter & Co. | | | | | | | |
Exp. 03/17/2005 | | BP | 2,000 | | | (3 | ) |
Receive floating rate based on 6-month BP-LIBOR and pay a fixed rate equal to 5.000%. | | | | | | | |
| | |
Counterparty: Morgan Stanley Dean Witter & Co. | | | | | | | |
Exp. 03/15/2032 | | | 100 | | | 0 | |
Receive a fixed rate equal to 3.250% and pay floating rate based on 6-month EC-LIBOR. | | | | | | | |
| | |
Counterparty: J.P. Morgan Chase & Co. | | | | | | | |
Exp. 03/15/2007 | | EC | 300 | | | (1 | ) |
Receive a fixed rate equal to 6.000% and pay floating rate based on 6-month EC-LIBOR. | | | | | | | |
| | |
Counterparty: J.P. Morgan Chase & Co. | | | | | | | |
Exp. 03/15/2032 | | | 200 | | | 3 | |
Receive a fixed rate equal to 0.610% and the Portfolio will pay to the counterparty at par in the event of default of General Electric Capital Corp. 6.000% due 06/15/2012. | | | | | | | |
| | |
Counterparty: Merrill Lynch & Co., Inc. | | | | | | | |
Exp. 05/19/2004 | | $ | 30 | | $ | 0 | |
Receive a fixed rate equal to 1.650% and the Portfolio will pay to the counterparty at par in the event of default of Republic of Panama 8.875% due 09/30/2027. | | | | | | | |
| | |
Counterparty: | | | | | | | |
Exp. 05/30/2005 | | | 10 | | | 0 | |
Receive a fixed rate equal to 1.750% and the Portfolio will pay to the counterparty at par in the event of default of Republic of Peru 9.125% due 02/21/2012. | | | | | | | |
| | |
Counterparty: Morgan Stanley Dean Witter & Co. | | | | | | | |
Exp. 06/20/2004 | | | 20 | | | 0 | |
| | | | | |
|
|
|
| | | | | | $ | (1 | ) |
| | | | | |
|
|
|
| (g) | | Principal amount denoted in indicated currency: |
BP – British Pound
EC – Euro
| (h) | | Indicates a fair valued security which has not been valued utilizing an independent quote and which is valued pursuant to guidelines established by the Trustees. The aggregate value of fair valued securities is $71, which is 0.21% of net assets. |
8 | | Semi-Annual Report | 6.30.03 | | | See accompanying notes |
Notes to Financial Statements
June 30, 2003 (Unaudited)
1. Organization
The Low Duration Portfolio (the “Portfolio”) is a series of the PIMCO Variable Insurance Trust (the “Trust”). The Trust is registered under the Investment Company Act of 1940 (the “Act”), as amended, as an open-end investment company organized as a Delaware business trust on October 3, 1997. The Trust may offer up to two classes of shares: Institutional and Administrative. Each share class has identical voting rights (except that shareholders of a class have exclusive voting rights regarding any matter relating solely to that class of shares). Information presented in these financial statements pertains to the Institutional Class of the Trust. Certain detailed financial information for the Administrative Class is provided separately and is available upon request. The Trust is designed to be used as an investment vehicle by Separate Accounts of insurance companies that fund variable annuity contracts and variable life insurance policies and by qualified pension and retirement plans. The Portfolio commenced operations on February 16, 1999.
2. Significant Accounting Policies
The following is a summary of significant accounting policies consistently followed by the Trust in the preparation of its financial statements in conformity with accounting principles generally accepted in the United States of America. The preparation of financial statements in accordance with accounting principles generally accepted in the United States of America requires management to make estimates and assumptions that affect the reported amounts and disclosures in the financial statements. Actual results could differ from those estimates.
Security Valuation. Portfolio securities and other financial instruments for which market quotations are readily available are stated at market value. Market value is determined at the close of regular trading (normally, 4:00 p.m., Eastern Time) on the New York Stock Exchange on each day the New York Stock Exchange is open, or if no sales are reported, as is the case for most securities traded over-the-counter, the mean between representative bid and asked quotations obtained from a quotation reporting system or from established market makers. Fixed income securities, including those to be purchased under firm commitment agreements, are normally valued on the basis of quotes obtained from brokers and dealers or pricing services. Short-term investments, which mature in 60 days or less are valued at amortized cost, which approximates market value. Certain fixed income securities for which daily market quotations are not readily available may be valued, pursuant to guidelines established by the Board of Trustees, with reference to fixed income securities whose prices are more readily obtainable. Prices may be obtained from independent pricing services which use information provided by market makers or estimates of market values obtained from yield data relating to investments or securities with similar characteristics. The prices used by the Portfolio may differ from the value that would be realized if the securities were sold and the differences could be material to the financial statements.
Securities Transactions and Investment Income. Securities transactions are recorded as of the trade date. Securities purchased or sold on a when-issued or delayed delivery basis may be settled a month or more after the trade date. Realized gains and losses from securities sold are recorded on the identified cost basis. Dividend income is recorded on the ex-dividend date, except certain dividends from foreign securities where the ex-dividend date may have passed, are recorded as soon as the Portfolio is informed of the ex-dividend date. Interest income, adjusted for the accretion of discounts and amortization of premiums, is recorded on the accrual basis. Paydowns gains and losses on mortgage- and asset-backed securities are recorded as adjustments to interest income in the Statement of Operations.
Dividends and Distributions to Shareholders. Dividends from net investment income, if any, are declared on each day the Trust is open for business and are distributed to shareholders monthly. All dividends are reinvested in additional shares of the Portfolio. Net realized capital gains earned by the Portfolio, if any, will be distributed no less frequently than once each year.
Income dividends and capital gain distributions are determined in accordance with income tax regulations which may differ from accounting principles generally accepted in the United States of America. These differences are primarily due to differing treatments for such items as wash sales, foreign currency transactions, net operating losses and capital loss carryforwards.
Distributions classified as a tax basis return of capital, if any, are reflected in the accompanying Statements of Changes in Net Assets and have been reclassified to paid in capital. In addition, other amounts have been reclassified between undistributed net investment income, accumulated undistributed net realized gains or losses and/or paid in capital to more appropriately conform financial accounting to tax characterizations of dividend distributions.
Foreign Currency. The accounting records of the Portfolio are maintained in U.S. dollars. The market values of foreign securities, currency holding and other assets and liabilities are translated into U.S. dollars based on the current exchange rates each business day. Fluctuations in the value of these assets and liabilities resulting from changes in exchange rates are recorded as unrealized foreign currency gains or losses. Realized gains or losses and unrealized appreciation (depreciation) on investment securities and income and expenses are translated on the respective dates of such transactions. The effect of changes in foreign currency exchange rates on investments in securities are not
6.30.03 | Semi-Annual Report | | 9 |
segregated in the Statement of Operations from the effects of changes in market prices of those securities, but are included with the net realized and unrealized gain or loss on investment securities.
Multiclass Operations. Each class offered by the Trust has equal rights as to assets. Income, non-class specific expenses, and realized and unrealized capital gains and losses are allocated to each class of shares based on the relative net assets of each class.
Federal Income Taxes. The Portfolio intends to qualify as a regulated investment company and distribute all of its taxable income and net realized gains, if applicable, to shareholders. Accordingly, no provision for Federal income taxes has been made.
Financing Transactions. The Portfolio may enter into financing transactions consisting of the sale by the Portfolio of securities, together with a commitment to repurchase similar securities at a future date. The difference between the selling price and the future purchase price is an adjustment to interest income in the Statement of Operations. If the counterparty to whom the Portfolio sells the security becomes insolvent, the Portfolio’s right to repurchase the security may be restricted; the value of the security may change over the term of the financing transaction; and the return earned by the Portfolio with the proceeds of a financing transaction may not exceed transaction costs. The Portfolio will designate assets determined to be liquid by PIMCO or otherwise cover its obligations under financing transactions.
Futures Contracts. The Portfolio is authorized to enter into futures contracts. The Portfolio may use futures contracts to manage its exposure to the securities markets or to movements in interest rates and currency values. The primary risks associated with the use of futures contracts are imperfect correlation between the change in market value of the securities held by the Portfolio and the prices of futures contracts, the possibility of an illiquid market, and the inability of the counterparty to meet the terms of the contract. Futures contracts are valued based upon their quoted daily settlement prices. Upon entering into a futures contract, the Portfolio may be required to deposit with its custodian, in a segregated account in the name of the futures broker, an amount of cash or U.S. Government and Agency Obligations in accordance with the initial margin requirements of the broker or exchange. Futures contracts are marked to market daily and an appropriate payable or receivable for the change in value (“variation margin”) is recorded by the Portfolio. Gains or losses are recognized but not considered realized until the contracts expire or are closed. Futures contracts involve, to varying degrees, risk of loss in excess of the variation margin disclosed in the Statement of Assets and Liabilities.
Options Contracts. The Portfolio may write call and put options on futures, securities or currencies it owns or in which it may invest. Writing put options tends to increase the Portfolio’s exposure to the underlying instrument. Writing call options tends to decrease the Portfolio’s exposure to the underlying instrument. When the Portfolio writes a call or put option, an amount equal to the premium received is recorded as a liability and subsequently marked to market to reflect the current value of the option written. Payment received or made, if any, from writing options with premiums to be determined on a future date are reflected as such on the Statement of Assets and Liabilities. Premiums received from writing options which expire are treated as realized gains. Premiums received from writing options which are exercised or closed are added to the proceeds or offset against amounts paid on the underlying future, security or currency transaction to determine the realized gain or loss. The Portfolio as a writer of an option has no control over whether the underlying future, security or currency may be sold (call) or purchased (put) and as a result bears the market risk of an unfavorable change in the price of the future, security or currency underlying the written option. There is the risk the Portfolio may not be able to enter into a closing transaction because of an illiquid market.
The Portfolio may also purchase put and call options. Purchasing call options tends to increase the Portfolio’s exposure to the underlying instrument. Purchasing put options tends to decrease the Portfolio’s exposure to the underlying instrument. The Portfolio pays a premium which is included in the Portfolio’s Statement of Assets and Liabilities as an investment and subsequently marked to market to reflect the current value of the option. Premiums paid for purchasing options which expire are treated as realized losses. The risk associated with purchasing put and call options is limited to the premium paid. Premiums paid for purchasing options which are exercised or closed are added to the amounts paid or offset against the proceeds on the underlying future, security or currency transaction to determine the realized gain or loss.
Swap Agreements. The Portfolio may invest in swap agreements. A swap is an agreement to exchange the return generated by one instrument for the return generated by another instrument. The Portfolio may enter into interest rate, total return, forward swap spread lock and credit default swap agreements to manage its exposure to interest rates and credit risk. Interest rate swap agreements involve the exchange by the Portfolio with another party of their respective commitments to pay or receive interest, e.g., an exchange of floating rate payments for fixed rate payments with respect to a notional amount of principal. Total return swap agreements involve commitments to pay interest in exchange for a market-linked return, both based on notional amounts. To the extent the total return of the security or index underlying the transaction exceeds or falls short of the
10 | | Semi-Annual Report | 6.30.03 |
offsetting interest rate obligation, the Portfolio will receive a payment from or make a payment to the counterparty. Forward spread lock swap agreements involve commitments to pay or receive a settlement amount calculated as the difference between the swap spread and a fixed spread, multiplied by the notional amount times the duration of the swap. The swap spread is the difference between the benchmark swap rate (market rate) and the specific Treasury rate. In a credit default swap, one party makes a stream of payments to another party in exchange for the right to receive a specified return in the event of a default by a third party, typically corporate issues or sovereign issues of an emerging country, on its obligation. The Portfolio may use credit default swaps to provide a measure of protection against defaults of sovereign issuers (i.e., to reduce risk where the Portfolio owns or has exposure to the sovereign issuer) or to take an active long or short position with respect to the likelihood of a particular issuer’s default. Swaps are marked to market daily based upon quotations from market makers and vendors and the change in value, if any, is recorded as unrealized gain or loss in the Statement of Operations. Payments received or made at the beginning of the measurement period are reflected as such on the Statement of Assets and Liabilities. A liquidation payment received or made at the termination of the swap is recorded as realized gain or loss in the Statement of Operations. Net periodic payments are included as part of miscellaneous income on the Statement of Operations. Entering into these agreements involves, to varying degrees, elements of credit, market and documentation risk in excess of the amounts recognized on the Statement of Assets and Liabilities. Such risks involve the possibility that there will be no liquid market for these agreements, that the counterparty to the agreements may default on its obligation to perform or disagree as to the meaning of contractual terms in the agreements, and that there may be unfavorable changes in interest rates.
Delayed Delivery Transactions. The Portfolio may purchase or sell securities on a when-issued or delayed delivery basis. These transactions involve a commitment by the Portfolio to purchase or sell securities for a predetermined price or yield, with payment and delivery taking place beyond the customary settlement period. When delayed delivery purchases are outstanding, the Portfolio will set aside and maintain until the settlement date in a segregated account, liquid assets in an amount sufficient to meet the purchase price. When purchasing a security on a delayed delivery basis, the Portfolio assumes the rights and risks of ownership of the security, including the risk of price and yield fluctuations, and takes such fluctuations into account when determining its net asset value. The Portfolio may dispose of or renegotiate a delayed delivery transaction after it is entered into, and may sell when-issued securities before they are delivered, which may result in a capital gain or loss. When the Portfolio has sold a security on a delayed delivery basis, the Portfolio does not participate in future gains and losses with respect to the security.
Inflation-Indexed Bonds. Inflation-indexed bonds are fixed income securities whose principal value is periodically adjusted to the rate of inflation. The interest rate on these bonds is generally fixed at issuance at a rate lower than typical bonds. Over the life of an inflation-indexed bond, however, interest will be paid based on a principal value, which is adjusted for inflation. Any increase in the principal amount of an inflation-indexed bond will be included as interest income in the Statement of Operations, even though investors do not receive their principal until maturity.
Repurchase Agreements. The Portfolio may engage in repurchase transactions. Under the terms of a typical repurchase agreement, the Portfolio takes possession of an underlying debt obligation subject to an obligation of the seller to repurchase, and the Portfolio to resell, the obligation at an agreed-upon price and time. The market value of the collateral must be equal at all times to the total amount of the repurchase obligations, including interest. Generally, in the event of counterparty default, the Portfolio has the right to use the collateral to offset losses incurred.
3. Fees, Expenses, and Related Party Transactions
Investment Advisory Fee. Pacific Investment Management Company LLC (PIMCO) is a majority owned subsidiary partnership of Allianz Dresdner Asset Management of America L.P. (formerly PIMCO Advisors L.P.) and serves as investment adviser (the “Adviser”) to the Trust, pursuant to an investment advisory contract. The Adviser receives a monthly fee at an annual rate based on average daily net assets of the Portfolio. The Advisory Fee is charged at an annual rate of 0.25%.
Administration Fee. PIMCO serves as administrator (the “Administrator”) and provides administrative services to the Trust for which it receives a monthly administrative fee based on average daily net assets of the Portfolio. The Administration Fee is charged at the annual rate of 0.25%.
Servicing Fee. PIMCO Advisors Distributors LLC (“PAD”), is an indirect wholly-owned subsidiary of Allianz Dresdner Asset Management of America L.P. and serves as the distributor of the Trust’s shares. The Trust is permitted to reimburse PAD on a quarterly basis, out of the Administrative Class assets of the Portfolio in the amount of 0.15% on an annual basis of the average daily net assets of that class, for payments made to financial intermediaries that provide services in connection with the distribution of shares or administration of plans or programs that use Portfolio shares as their funding medium. The effective rate paid to PAD during the current fiscal year is 0.15%.
6.30.03 | Semi-Annual Report | | 11 |
Expenses. The Portfolio is responsible for the following expenses: (i) salaries and other compensation of any of the Trust’s executive officers and employees who are not officers, directors, stockholders or employees of PIMCO or its subsidiaries or affiliates; (ii) taxes and governmental fees; (iii) brokerage fees and commissions and other portfolio transaction expenses; (iv) the cost of borrowing money, including interest expense; (v) fees and expenses of the Trustees who are not “interested persons” of PIMCO or the Trust, and any counsel retained exclusively for their benefit; (vi) extraordinary expenses, including costs of litigation and indemnification expenses; (vii) organization expenses and (viii) any expenses allocated or allocable to a specific class of shares, which include service fees payable with respect to the Administrative Class shares and may include certain other expenses as permitted by the Trust’s Multiple Class Plan adopted pursuant to Rule 18f-3 under the Act and subject to review and approval by the Trustees. The ratio of expenses to average net assets per share class, as disclosed in the Financial Highlights, may differ from the annual Portfolio operating expenses per share class as disclosed in the Prospectus for the reasons set forth above. PIMCO has agreed to waive a portion of its administrative fees to the extent that the payment of the Portfolio’s pro rata share of Trustees’ fees causes the actual expense ratio to rise above the rates disclosed in the current prospectus plus 0.49 basis points as set forth below (calculated as a percentage of the Portfolio’s average daily net assets attributable to each class):
| | | Institutional
Class
| | | Administrative
Class
| |
Low Duration Portfolio | | 0.50 | % | | 0.65 | % |
PIMCO may be reimbursed for these waived amounts in future periods. The Trust pays no compensation directly to any Trustee or any other officer who is affiliated with the Administrator, all of whom receive renumeration for their services to the Trust from the Administrator or its affiliates.
Each unaffiliated Trustee receives an annual retainer of $4,000, plus $1,500 for each Board of Trustees meeting attended in person and $250 for each meeting attended telephonically, plus reimbursement of related expenses. In addition, each committee chair receives an additional annual retainer of $500. These expenses are allocated on a pro-rata basis to each Portfolio of the Trust according to its respective net assets.
4. Purchases and Sales of Securities
Purchases and sales of securities (excluding short-term investments) for the period ended June 30, 2003 were as follows (amounts in thousands):
| | | U.S Government/Agency
| | All Other
|
| | | Purchases
| | Sales
| | Purchases
| | Sales
|
Low Duration Portfolio | | $ | 35,885 | | $ | 33,546 | | $ | 6,793 | | $ | 2,101 |
5. Transactions in Written Call and Put Options
Transactions in written call and put options were as follows (amounts in thousands):
| | | Low Duration Portfolio
|
| | | | | Premium
|
Balance at 12/31/2002 | | | | $ | 4 |
Sales | | | | | 12 |
Closing Buys | | | | | 0 |
Expirations | | | | | 0 |
Exercised | | | | | 0 |
| | | | |
|
|
Balance at 06/30/2003 | | | | $ | 16 |
| | | | |
|
|
12 | | Semi-Annual Report | 6.30.03 |
6. Federal Income Tax Matters
At June 30, 2003, the aggregate cost of investments was the same for federal income tax and financial statement purposes. The net unrealized appreciation (depreciation) of investments securities for federal income tax purposes is as follows (amounts in thousands):
| | | Aggregate Gross
Unrealized
Appreciation
| | Aggregate Gross
Unrealized
(Depreciation)
| | | Net Unrealized
Appreciation
|
Low Duration Portfolio | | $ | 272 | | $ | (39 | ) | | $ | 233 |
7. Shares of Beneficial Interest
The Trust may issue an unlimited number of shares of beneficial interest with a $.0001 par value. Changes in shares of beneficial interest were as follows (shares and amounts in thousands):
| | | Low Duration Portfolio
| |
| | | Six Months Ended 06/30/2003
| | | Year Ended 12/31/2002
| |
| | | Shares
| | | Amount
| | | Shares
| | | Amount
| |
Receipts for shares sold | | | | | | | | | | | | | | |
Institutional Class | | 0 | | | $ | 0 | | | 0 | | | $ | 0 | |
Administrative Class | | 1,669 | | | | 17,201 | | | 1,479 | | | | 15,004 | |
Issued as reinvestment of distributions | | | | | | | | | | | | | | |
Institutional Class | | 0 | | | | 0 | | | 0 | | | | 1 | |
Administrative Class | | 28 | | | | 289 | | | 43 | | | | 432 | |
Cost of shares redeemed | | | | | | | | | | | | | | |
Institutional Class | | 0 | | | | 0 | | | (46 | ) | | | (460 | ) |
Administrative Class | | (313 | ) | | | (3,234 | ) | | (137 | ) | | | (1,388 | ) |
| | |
|
| |
|
|
| |
|
| |
|
|
|
Net increase resulting from Portfolio share transactions | | 1,384 | | | $ | 14,256 | | | 1,339 | | | $ | 13,589 | |
| | |
|
| |
|
|
| |
|
| |
|
|
|
The following schedule shows the number of shareholders each owning 5% or more of the Portfolio and the total percentage of the Portfolio held by such shareholders:
| | | Number
| | % of Portfolio
Held
|
Low Duration Portfolio | | | | |
Institutional Class | | 1 | | 100 |
Administrative Class | | 6 | | 92 |
6.30.03 | Semi-Annual Report | | 13 |
Trustees and Officers
Brent R. Harris, Chairman and Trustee
R. Wesley Burns, President and Trustee
E. Philip Cannon, Trustee
Vern O. Curtis, Trustee
J. Michael Hagan, Trustee
William J. Popejoy, Trustee
Garlin G. Flynn, Secretary
John P. Hardaway, Treasurer
Investment Adviser and Administrator
Pacific Investment Management Company LLC
840 Newport Center Drive
Newport Beach, California 92660
Transfer Agent
National Financial Data Services
330 W. 9th Street, 4th Floor
Kansas City, Missouri 64105
Custodian
State Street Bank & Trust Company
801 Pennsylvania
Kansas City, Missouri 64105
Counsel
Dechert LLP
1775 I Street, N.W.
Washington, D.C. 20006
Independent Accountants
PricewaterhouseCoopers LLP
1055 Broadway
Kansas City, Missouri 64105
PIMCO VARIABLE INSURANCE TRUST
This report is submitted for the general information of the shareholders of the PIMCO Variable Insurance Trust. It is not authorized for distribution to prospective investors unless accompanied or preceded by an effective prospectus for the PIMCO Variable Insurance Trust, which contains information covering its investment policies as well as other pertinent information.
All Funds distributed by PIMCO ADVISORS DISTRIBUTORS LLC, member NASD
840 NEWPORT CENTER DRIVE
NEWPORT BEACH, CA 92660
800.927.4648
WWW.PIMCOADVISORS.COM
WWW.PIMCO.COM
| P I M C O |
| PIMCO VARIABLE INSURANCE TRUST |
| LONG-TERM U.S. GOVERNMENT PORTFOLIO |
| ADMINISTRATIVE CLASS |
|
| SEMI-ANNUAL REPORT |
| June 30, 2003 |
| | | Fund
Summary
| | Schedule of
Investments
|
Long-Term U.S. Government Portfolio (Administrative Class) | | 2 | | 7 |
Chairman’s Letter
Dear PIMCO Variable Insurance Trust Shareholder:
Financial assets gained during the first half of 2003 amid a revival of risk appetites as anxiety about the war in Iraq faded. Assets that generally benefit from economic growth, such as stocks, corporate bonds and emerging market debt, fared the best year-to-date as investors returned to these sectors in anticipation of a recovery in the second half of 2003. Reflationary forces that investors expected to fuel a rebound included federal tax cuts and a weak dollar, as well as low borrowing rates that eased the burden of high personal and corporate indebtedness. Low mortgage rates kept refinancings booming in the second quarter and put more money in consumers’ pockets.
U.S. Treasuries lagged their riskier counterparts but still enjoyed a modest rally. Yields fell to levels not seen in 45 years early in the second quarter before bouncing off their lows in June as hopes for recovery increased. The yield on the benchmark 10-year Treasury closed the six-month period 0.30% lower to 3.51%, after nearing 3% earlier in the period. Buyers were encouraged that inflation would remain tame amid low capacity utilization and weak employment growth. Asian central banks bought U.S. Treasuries to limit the rise in their currencies versus the dollar in an effort to protect their export industries. In June, the Federal Reserve cut the federal funds rate by 0.25% to 1%, its 13th easing since 2001, in an effort to boost the economy and ward off deflation. Although the cut was less than expected, the Fed suggested that rates would stay low until deflation risks abated.
On the following pages you will find specific details as to the Portfolio’s total return investment performance and a discussion of those factors that affected performance.
We appreciate the trust you have placed in us, and we will continue to focus our efforts to meet your investment needs.
Sincerely,
Brent R. Harris
Chairman
July 31, 2003
6.30.03 | Semi-Annual Report | | 1 |
Long-Term U.S. Government Portfolio
TOTAL RETURN INVESTMENT PERFORMANCE For the period ended June 30, 2003
| | | 1 Year | | | Since Inception* | |
Long-Term U.S. Gov’t Portfolio Administrative Class | | 18.59 | % | | 10.83 | % |
Lehman Brothers Long-Term Treasury Index | | 19.37 | % | | — | |
| * | | Annualized (All Portfolio returns are net of fees and expenses) |
CUMULATIVE RETURNS THROUGH JUNE 30, 2003
$10,000 invested at inception
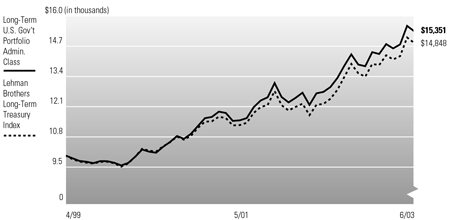
Past performance is no guarantee of future results. Investment return and principal value will fluctuate so that Portfolio shares, when redeemed, may be worth more or less than their original cost. The line graph above assumes the investment of $10,000 on 5/01/1999, the first full month following the Portfolio’s Administrative Class inception on 4/30/1999, compared to the Lehman Brothers Long-Term Treasury Index, an unmanaged market index. It is not possible to invest directly in the Index.
PORTFOLIO INSIGHTS
| • | | The Long-Term U.S. Government Portfolio seeks to achieve its investment objective by investing under normal circumstances at least 80% of its assets in a diversified portfolio of fixed income securities that are issued or guaranteed by the U.S. Government, its agencies or government-sponsored enterprises. |
| • | | The Portfolio’s Administrative Class underperformed the benchmark Lehman Brothers Long-Term Treasury Index for the six-month period ended June 30, 2003, returning 6.27% versus 6.53% for the Index. |
| • | | Below-Index duration was negative for performance for the first half of the year as interest rates declined. |
| • | | An overweight to intermediate-term maturities helped portfolio performance as intermediate rates rallied and these securities experienced greater price appreciation than longer maturity issues. |
| • | | A mortgage emphasis via agency pass-throughs and longer duration structured mortgages was a slight negative for the Portfolio’s performance. |
| • | | A modest allocation to longer duration corporates was positive. These issues continued to benefit from improved credit fundamentals and increased investor demand. |
| • | | An allocation to real return bonds was negative as real yields fell less than yields on nominal bonds with comparable maturities. |
| • | | A focus on high-quality agency bonds enhanced returns as these securities outperformed Treasuries. |
2 | | Semi-Annual Report | 6.30.03 |
Financial Highlights
Long-Term U.S. Government Portfolio (Administrative Class)
| Selected Per Share Data for the Year or Period Ended: | | 06/30/2003 +
| | | 12/31/2002
| | | 12/31/2001
| | | 12/31/2000
| | | 04/30/1999-12/31/1999
| |
Net asset value beginning of period | | $ | 11.09 | | | $ | 10.27 | | | $ | 10.56 | | | $ | 9.22 | | | $ | 10.00 | |
Net investment income (a) | | | 0.17 | | | | 0.44 | | | | 0.51 | | | | 0.56 | | | | 0.36 | |
Net realized/unrealized gain (loss) on investments (a) | | | 0.52 | | | | 1.31 | | | | 0.09 | | | | 1.34 | | | | (0.78 | ) |
Total income (loss) from investment operations | | | 0.69 | | | | 1.75 | | | | 0.60 | | | | 1.90 | | | | (0.42 | ) |
Dividends from net investment income | | | (0.18 | ) | | | (0.44 | ) | | | (0.52 | ) | | | (0.56 | ) | | | (0.36 | ) |
Distributions from net realized capital gains | | | 0.00 | | | | (0.49 | ) | | | (0.37 | ) | | | 0.00 | | | | 0.00 | |
Total distributions | | | (0.18 | ) | | | (0.93 | ) | | | (0.89 | ) | | | (0.56 | ) | | | (0.36 | ) |
Net asset value end of period | | $ | 11.60 | | | $ | 11.09 | | | $ | 10.27 | | | $ | 10.56 | | | $ | 9.22 | |
Total return | | | 6.27 | % | | | 17.59 | % | | | 5.86 | % | | | 21.24 | % | | | (4.28 | )% |
Net assets end of period (000s) | | $ | 109,961 | | | $ | 92,256 | | | $ | 33,013 | | | $ | 9,625 | | | $ | 7,173 | |
Ratio of expenses to average net assets | | | 0.65 | %* | | | 0.65 | %(d) | | | 0.65 | %(c) | | | 0.65 | % | | | 0.65 | %(b)* |
Ratio of net investment income to average net assets | | | 3.10 | %* | | | 4.05 | % | | | 4.75 | % | | | 5.70 | % | | | 5.55 | %* |
Portfolio turnover rate | | | 181 | % | | | 586 | % | | | 457 | % | | | 533 | % | | | 294 | % |
| (a) | | Per share amounts based on average number of shares outstanding during the period. |
| (b) | | If the investment manager had not reimbursed expenses, the ratio of operating expenses to average net assets would have been 0.71% for the period ended December 31, 1999. |
| (c) | | If the investment manager had not reimbursed expenses, the ratio of operating expenses to average net assets would have been 0.66% for the year ended December 31, 2001. |
| (d) | | If the investment manager had not reimbursed expenses, the ratio of operating expenses to average net assets would have been 0.66% for the year ended December 31, 2002. |
See accompanying notes | | | 6.30.03 | Semi-Annual Report | | 3 |
Statement of Assets and Liabilities
Long-Term U.S. Government Portfolio
June 30, 2003 (Unaudited)
Amounts in thousands, except per share amounts
Assets: | | | |
Investments, at value | | $ | 168,799 |
Cash | | | 1,790 |
Receivable for investments sold | | | 14,393 |
Interest receivable | | | 1,443 |
Variation margin receivable | | | 229 |
Unrealized appreciation on swap agreements | | | 13 |
| | |
|
|
| | | | 186,667 |
| | |
|
|
Liabilities: | | | |
Payable for investments purchased | | $ | 55,445 |
Payable for financing transactions | | | 8,453 |
Payable for short sale | | | 12,280 |
Written options outstanding | | | 223 |
Accrued investment advisory fee | | | 22 |
Accrued administration fee | | | 22 |
Accrued servicing fee | | | 12 |
Swap premiums received | | | 219 |
Other liabilities | | | 16 |
| | |
|
|
| | | | 76,692 |
| | |
|
|
Net Assets | | $ | 109,975 |
| | |
|
|
Net Assets Consist of: | | | |
Paid in capital | | $ | 102,082 |
Undistributed net investment income | | | 962 |
Accumulated undistributed net realized gain | | | 6,430 |
Net unrealized appreciation | | | 501 |
| | |
|
|
| | | $ | 109,975 |
| | |
|
|
Net Assets: | | | |
Institutional Class | | $ | 14 |
Administrative Class | | | 109,961 |
Shares Issued and Outstanding: | | | |
Institutional Class | | | 1 |
Administrative Class | | | 9,480 |
Net Asset Value and Redemption Price Per Share (Net Assets Per Share Outstanding) | | | |
Institutional Class | | $ | 11.60 |
Administrative Class | | | 11.60 |
Cost of Investments Owned | | $ | 167,802 |
4 | | Semi-Annual Report | 6.30.03 | | | See accompanying notes |
Statement of Operations
Long-Term U.S. Government Portfolio
For the six months ended June 30, 2003 (Unaudited)
Amounts in thousands
Investment Income: | | | | |
Interest | | $ | 1,925 | |
| | |
|
|
|
Total Income | | | 1,925 | |
| | |
|
|
|
Expenses: | | | | |
Investment advisory fees | | | 127 | |
Administration fees | | | 127 | |
Distribution and/or servicing fees - Administrative Class | | | 77 | |
Trustees’ fees | | | 1 | |
Total Expenses | | | 332 | |
| | |
|
|
|
Net Investment Income | | | 1,593 | |
| | |
|
|
|
Net Realized and Unrealized Gain (Loss): | | | | |
Net realized gain on investments | | | 2,304 | |
Net realized gain on futures contracts, written options, and swaps | | | 4,509 | |
Net change in unrealized (depreciation) on investments | | | (417 | ) |
Net change in unrealized (depreciation) on futures contracts, written options, and swaps | | | (1,583 | ) |
Net Gain | | | 4,813 | |
| | |
|
|
|
Net Increase in Assets Resulting from Operations | | $ | 6,406 | |
| | |
|
|
|
See accompanying notes | | | 6.30.03 | Semi-Annual Report | | 5 |
Statements of Changes in Net Assets
Long-Term U.S. Government Portfolio
Amounts in thousands
| Increase (Decrease) in Net Assets from: | | Six Months Ended
June 30, 2003 (Unaudited)
| | | Year Ended December 31, 2002
| |
Operations: | | | | | | | | |
Net investment income | | $ | 1,593 | | | $ | 2,378 | |
Net realized gain | | | 6,813 | | | | 4,809 | |
Net change in unrealized appreciation (depreciation) | | | (2,000 | ) | | | 2,658 | |
| | |
|
|
| |
|
|
|
Net increase resulting from operations | | | 6,406 | | | | 9,845 | |
| | |
|
|
| |
|
|
|
Distributions to Shareholders: | | | | | | | | |
From net investment income | | | | | | | | |
Institutional Class | | | 0 | | | | 0 | |
Administrative Class | | | (1,654 | ) | | | (2,378 | ) |
From net realized capital gains | | | | | | | | |
Institutional Class | | | 0 | | | | (1 | ) |
Administrative Class | | | 0 | | | | (3,799 | ) |
| | |
|
|
| |
|
|
|
Total Distributions | | | (1,654 | ) | | | (6,178 | ) |
| | |
|
|
| |
|
|
|
Portfolio Share Transactions: | | | | | | | | |
Receipts for shares sold | | | | | | | | |
Institutional Class | | | 0 | | | | 0 | |
Administrative Class | | | 27,569 | | | | 64,003 | |
Issued as reinvestment of distributions | | | | | | | | |
Institutional Class | | | 0 | | | | 1 | |
Administrative Class | | | 1,654 | | | | 6,177 | |
Cost of shares redeemed | | | | | | | | |
Institutional Class | | | 0 | | | | 0 | |
Administrative Class | | | (16,269 | ) | | | (14,603 | ) |
| | |
|
|
| |
|
|
|
Net increase resulting from Portfolio share transactions | | | 12,954 | | | | 55,578 | |
| | |
|
|
| |
|
|
|
Total Increase in Net Assets | | | 17,706 | | | | 59,245 | |
| | |
|
|
| |
|
|
|
Net Assets: | | | | | | | | |
Beginning of period | | | 92,269 | | | | 33,024 | |
End of period* | | $ | 109,975 | | | $ | 92,269 | |
*Including undistributed net investment income of: | | $ | 962 | | | $ | 1,023 | |
6 | | Semi-Annual Report | 6.30.03 | | | See accompanying notes |
Schedule of Investments
Long-Term U.S. Government Portfolio
June 30, 2003 (Unaudited)
| | | Principal Amount
(000s)
| | Value
(000s)
|
CORPORATE BONDS & NOTES 7.6% | | | | | | |
Banking & Finance 6.5% | | | | | | |
Donaldson, Lufkin & Jenrette, Inc. | | | | | | |
1.849% due 07/18/2003 (a) | | $ | 100 | | $ | 100 |
Ford Motor Credit Co. | | | | | | |
1.570% due 04/26/2004 (a) | | | 600 | | | 595 |
1.718% due 07/19/2004 (a) | | | 900 | | | 889 |
1.769% due 07/18/2005 (a) | | | 200 | | | 193 |
General Electric Capital Corp. | | | | | | |
1.408% due 09/15/2004 (a) | | | 100 | | | 100 |
1.383% due 03/15/2005 (a) | | | 800 | | | 801 |
General Motors Acceptance Corp. | | | | | | |
1.604% due 07/21/2003 (a) | | | 100 | | | 100 |
2.049% due 01/20/2004 (a) | | | 1,100 | | | 1,099 |
Merrill Lynch & Co., Inc. | | | | | | |
1.680% due 03/08/2004 (a) | | | 200 | | | 201 |
Morgan Stanley Dean Witter & Co. | | | | | | |
1.360% due 09/19/2003 (a) | | | 400 | | | 400 |
National Rural Utilities Cooperative Finance Corp. | | | | | | |
2.320% due 04/26/2004 (a) | | | 200 | | | 201 |
5.250% due 07/15/2004 | | | 400 | | | 417 |
Travelers Property Casualty Corp. | | | | | | |
6.375% due 03/15/2033 | | | 1,000 | | | 1,097 |
U.S. Trade Funding Corp. | | | | | | |
4.260% due 11/15/2014 | | | 975 | | | 1,018 |
| | | | | |
|
|
| | | | | | | 7,211 |
| | | | | |
|
|
Industrials 1.1% | | | | | | |
Continental Airlines, Inc. | | | | | | |
6.320% due 11/01/2008 | | | 1,000 | | | 971 |
DaimlerChrysler North America Holding Corp. | | | | | | |
1.610% due 08/16/2004 (a) | | | 200 | | | 199 |
| | | | | |
|
|
| | | | | | | 1,170 |
| | | | | |
|
|
Total Corporate Bonds & Notes
(Cost $8,185) | | | | | | 8,381 |
| | | | | |
|
|
MUNICIPAL BONDS & NOTES 2.0% | | | | | | |
Colorado 0.3% | | | | | | |
Dawson Ridge Metropolitan District No. 1 General Obligation Bonds, Series 1992
0.000% due 10/01/2022 | | | 800 | | | 318 |
| | | | | |
|
|
Florida 0.5% | | | | | | |
Florida State Board of Education General Obligation Bonds, (FGIC Insured), Series 2002
5.000% due 06/01/2031 | | | 500 | | | 525 |
| | | | | |
|
|
Illinois 0.8% | | | | | | |
Chicago, Illinois Water Revenue Bonds, (AMBAC Insured), Series 2001
5.000% due 11/01/2031 | | | 200 | | | 207 |
Illinois State General Obligation Bonds, Series 2003
5.100% due 06/01/2033 | | | 700 | | | 689 |
| | | | | |
|
|
| | | | | | | 896 |
| | | | | |
|
|
New York 0.2% | | | | | | |
New York State Triborough Bridge and Tunnels Authority Revenue Bonds, Series 2002
5.000% due 11/15/2032 | | | 200 | | | 208 |
| | | | | |
|
|
Texas 0.2% | | | | | | |
San Antonio, Texas Water Revenue Bonds, (FSA Insured), Series 2002
5.000% due 05/15/2032 | | | 250 | | | 259 |
| | | | | |
|
|
Total Municipal Bonds & Notes
(Cost $2,144) | | | | | | 2,206 |
| | | | | |
|
|
U.S. GOVERNMENT AGENCIES 17.1% | | | | | | |
Fannie Mae | | | | | | |
4.850% due 07/02/2004 | | | 500 | | | 500 |
4.500% due 10/17/2006 | | | 1,000 | | | 1,009 |
5.000% due 11/13/2006 | | | 500 | | | 507 |
5.000% due 01/20/2007 | | | 1,000 | | | 1,019 |
5.740% due 01/21/2009 | | | 1,000 | | | 1,025 |
5.550% due 02/08/2007 | | | 900 | | | 904 |
5.250% due 03/22/2007 | | | 1,000 | | | 1,027 |
Federal Home Loan Bank | | | | | | |
5.015% due 08/26/2005 | | | 500 | | | 503 |
4.000% due 02/13/2009 | | | 1,000 | | | 1,016 |
5.120% due 01/10/2013 | | | 5,000 | | | 5,225 |
Financing Corp. | | | | | | |
10.700% due 10/06/2017 | | | 650 | | | 1,083 |
Freddie Mac | | | | | | |
3.650% due 01/11/2005 | | | 1,000 | | | 1,001 |
4.625% due 03/22/2006 | | | 1,000 | | | 1,008 |
4.650% due 11/06/2006 | | | 1,000 | | | 1,011 |
4.000% due 02/13/2017 | | | 200 | | | 203 |
Overseas Private Investment Corp. | | | | | | |
3.800% due 08/15/2007 (i) | | | 1,000 | | | 1,017 |
5.590% due 11/30/2010 (i) | | | 700 | | | 784 |
| | | | | |
|
|
Total U.S. Government Agencies
(Cost $18,383) | | | | | | 18,842 |
| | | | | |
|
|
U.S. TREASURY OBLIGATIONS 48.5% | | | | | | |
Treasury Inflation Protected Securities (d) | | | | | | |
3.375% due 01/15/2007 (b) | | | 174 | | | 191 |
3.625% due 01/15/2008 | | | 1,136 | | | 1,275 |
3.875% due 04/15/2029 | | | 5,584 | | | 7,125 |
U.S. Treasury Bonds | | | | | | |
10.625% due 08/15/2015 (c) | | | 1,800 | | | 2,987 |
8.875% due 08/15/2017 (c) | | | 1,400 | | | 2,118 |
6.250% due 08/15/2023 (c) | | | 9,100 | | | 11,150 |
5.500% due 08/15/2028 | | | 16,500 | | | 18,566 |
U.S. Treasury Notes | | | | | | |
1.625% due 04/30/2005 (c) | | | 3,300 | | | 3,333 |
U.S. Treasury Strips | | | | | | |
0.000% due 11/15/2016 | | | 2,000 | | | 1,112 |
0.000% due 02/15/2027 | | | 8,500 | | | 2,623 |
0.000% due 11/15/2027 | | | 9,700 | | | 2,883 |
| | | | | |
|
|
Total U.S. Treasury Obligations
(Cost $53,613) | | | | | | 53,363 |
| | | | | |
|
|
MORTGAGE-BACKED SECURITIES 31.0% | | | | | | |
Collateralized Mortgage Obligations 26.2% | | | | | | |
ABN AMRO Mortgage Corp. | | | | | | |
6.500% due 01/25/2017 | | | 983 | | | 998 |
Bear Stearns Adjustable Rate Mortgage Trust | | | | | | |
6.158% due 01/25/2032 (a) | | | 192 | | | 194 |
5.218% due 03/25/2033 (a) | | | 3,114 | | | 3,181 |
5.430% due 03/25/2033 (a) | | | 1,292 | | | 1,317 |
Countrywide Alternative Loan Trust | | | | | | |
6.750% due 12/25/2031 | | | 43 | | | 43 |
Fannie Mae | | | | | | |
5.000% due 05/25/2015 | | | 91 | | | 91 |
1.962% due 04/25/2021 | | | 72 | | | 73 |
1.793% due 08/25/2021 (a) | | | 72 | | | 73 |
6.500% due 10/25/2021 | | | 31 | | | 31 |
1.662% due 08/25/2022 (a) | | | 45 | | | 45 |
7.000% due 10/25/2022 | | | 309 | | | 338 |
1.935% due 04/25/2032 | | | 159 | | | 160 |
Federal Agricultural Mortgage Corp. | | | | | | |
7.238% due 07/25/2011 (a) | | | 202 | | | 227 |
Freddie Mac | | | | | | |
6.000% due 02/15/2015 | | | 1,000 | | | 1,028 |
2.312% due 02/15/2021 | | | 88 | | | 88 |
5.500% due 06/15/2022 | | | 1,000 | | | 1,001 |
7.000% due 07/15/2023 | | | 49 | | | 54 |
6.500% due 12/15/2023 | | | 221 | | | 240 |
6.000% due 08/15/2025 | | | 1,000 | | | 1,011 |
2.012% due 02/15/2027 (a) | | | 85 | | | 85 |
6.000% due 03/15/2027 | | | 1,000 | | | 1,014 |
6.500% due 11/15/2027 | | | 1,120 | | | 1,135 |
5.625% due 07/15/2028 | | | 165 | | | 167 |
1.863% due 10/25/2030 | | | 1,054 | | | 1,052 |
6.000% due 12/15/2031 | | | 217 | | | 227 |
6.000% due 08/15/2032 | | | 1,041 | | | 1,094 |
Government National Mortgage Association | | | | | | |
6.000% due 06/16/2032 | | | 826 | | | 830 |
GS Mortgage Securities Corp. II | | | | | | |
6.860% due 07/13/2030 | | | 1,000 | | | 1,024 |
Master Asset Securitization Trust | | | | | | |
5.500% due 07/31/2033 | | | 900 | | | 911 |
Residential Funding Mortgage Securities I, Inc. | | | | | | |
7.500% due 04/25/2027 | | | 8 | | | 8 |
6.500% due 03/25/2032 | | | 772 | | | 781 |
Sequoia Mortgage Trust | | | | | | |
1.658% due 06/20/2032 (a) | | | 350 | | | 350 |
1.500% due 04/20/2033 (a) | | | 1,000 | | | 998 |
Structured Asset Mortgage Investments, Inc. | | | | | | |
7.100% due 02/25/2030 (a) | | | 172 | | | 177 |
6.217% due 03/25/2032 (a) | | | 346 | | | 354 |
1.647% due 09/19/2032 (a) | | | 2,352 | | | 2,343 |
1.740% due 06/18/2033 (a) | | | 1,035 | | | 1,033 |
Structured Asset Securities Corp. | | | | | | |
6.500% due 01/25/2032 | | | 86 | | | 86 |
1.535% due 07/25/2032 (a) | | | 562 | | | 565 |
1.325% due 01/25/2033 (a) | | | 319 | | | 319 |
United Mortgage Securities Corp. | | | | | | |
4.381% due 06/25/2032 (a) | | | 625 | | | 634 |
Washington Mutual Mortgage Securities Corp. | | | | | | |
6.000% due 03/25/2017 | | | 460 | | | 473 |
6.500% due 10/19/2029 | | | 150 | | | 151 |
5.390% due 02/25/2031 (a) | | | 840 | | | 859 |
5.150% due 02/25/2033 | | | 438 | | | 451 |
5.460% due 02/25/2033 (a) | | | 459 | | | 473 |
5.060% due 05/25/2033 (a) | | | 914 | | | 940 |
3.956% due 01/25/2041 (a) | | | 26 | | | 26 |
| | | | | |
|
|
| | | | | | | 28,753 |
| | | | | |
|
|
Fannie Mae 3.8% | | | | | | |
6.000% due 08/13/2033 | | | 4,000 | | | 4,155 |
| | | | | |
|
|
Federal Housing Administration 0.5% | | | | | | |
6.896% due 07/01/2020 | | | 573 | | | 584 |
| | | | | |
|
|
Freddie Mac 0.5% | | | | | | |
7.000% due 12/01/2031 | | | 517 | | | 543 |
| | | | | |
|
|
Total Mortgage-Backed Securities
(Cost $33,822) | | | | | | 34,035 |
| | | | | |
|
|
ASSET-BACKED SECURITIES 6.9% | | | | | | |
Ace Securities Corp. | | | | | | |
1.375% due 06/25/2032 (a) | | | 337 | | | 337 |
Countrywide Asset-Backed Certificates | | | | | | |
1.295% due 05/25/2032 (a) | | | 78 | | | 78 |
CS First Boston Mortgage Securities Corp. | | | | | | |
1.570% due 12/15/2030 (a) | | | 12 | | | 13 |
1.475% due 08/25/2032 (a) | | | 645 | | | 647 |
DaimlerChrysler Auto Trust | | | | | | |
2.900% due 12/06/2004 | | | 235 | | | 236 |
Financial Asset Securities Corp. AAA Trust | | | | | | |
1.150% due 09/25/2033 (a) | | | 958 | | | 957 |
Home Equity Mortgage Trust | | | | | | |
1.435% due 09/25/2033 (a) | | | 196 | | | 197 |
Household Automotive Trust | | | | | | |
2.750% due 05/17/2005 (a) | | | 343 | | | 345 |
Household Mortgage Loan Trust | | | | | | |
1.618% due 05/20/2032 (a) | | | 629 | | | 630 |
L.A. Arena Funding LLC | | | | | | |
7.656% due 12/15/2021 | | | 97 | | | 106 |
Novastar Home Equity Loan | | | | | | |
1.315% due 01/25/2031 (a) | | | 182 | | | 182 |
Renaissance Home Equity Loan Trust | | | | | | |
1.468% due 08/25/2033 (a) | | | 100 | | | 100 |
See accompanying notes | | | 6.30.03 | Semi-Annual Report | | 7 |
| | | Principal
Amount
(000s)
| | Value
(000s)
| |
Saxon Asset Securities Trust | | | | | | | |
1.400% due 03/25/2018 (a) | | $ | 993 | | $ | 992 | |
SLM Student Loan Trust | | | | | | | |
1.640% due 10/27/2025 (a) | | | 167 | | | 168 | |
Specialty Underwriting & Residential Finance | | | | | | | |
1.603% due 06/25/2034 | | | 1,000 | | | 998 | |
Terwin Mortgage Trust | | | | | | | |
1.000% due 06/25/2033 (a) | | | 1,200 | | | 1,200 | |
WFS Financial Owner Trust | | | | | | | |
2.820% due 05/20/2005 | | | 372 | | | 374 | |
| | | | | |
|
|
|
Total Asset-Backed Securities
(Cost $7,556) | | | | | | 7,560 | |
| | | | | |
|
|
|
SOVEREIGN ISSUES 3.4% | | | | | | | |
International Bank for Reconstruction & Development | | | | | | | |
7.625% due 01/19/2023 | | | 2,700 | | | 3,739 | |
| | | | | |
|
|
|
Total Sovereign Issues
(Cost $3,428) | | | | | | 3,739 | |
| | | | | |
|
|
|
PURCHASED PUT OPTIONS 0.0% | | | | | | | |
Eurodollar December Futures (CME) | | | | | | | |
Strike @ 98.500 Exp. 12/15/2003 | | | 60,000 | | | 2 | |
U.S. Treasury 10 Year Note September Futures (CBOT) | | | | | | | |
Strike @ 107.000 Exp. 08/23/2003 | | | 25,000 | | | 4 | |
U.S. Treasury 5 Year Note September Futures (CBOT) | | | | | | | |
Strike @ 109.500 Exp. 08/23/2003 | | | 20,000 | | | 6 | |
| | | | | |
|
|
|
Total Purchased Put Options
(Cost $10) | | | | | | 12 | |
| | | | | |
|
|
|
SHORT-TERM INSTRUMENTS 37.0% | | | | | | | |
Commercial Paper 35.2% | | | | | | | |
Fannie Mae | | | | | | | |
1.010% due 07/01/2003 | | | 9,000 | | | 9,000 | |
0.900% due 09/03/2003 | | | 1,800 | | | 1,797 | |
0.980% due 09/10/2003 | | | 5,000 | | | 4,990 | |
0.900% due 09/17/2003 | | | 900 | | | 898 | |
0.980% due 09/17/2003 | | | 5,000 | | | 4,989 | |
0.980% due 09/24/2003 | | | 5,000 | | | 4,988 | |
0.900% due 10/30/2003 | | | 1,400 | | | 1,396 | |
Federal Home Loan Bank | | | | | | | |
1.010% due 07/01/2003 | | | 9,000 | | | 9,000 | |
1.010% due 07/25/2003 | | | 1,600 | | | 1,599 | |
| | | | | |
|
|
|
| | | | | | | 38,657 | |
| | | | | |
|
|
|
U.S. Treasury Bills 1.8% | | | | | | | |
0.993% due 08/07/2003-08/14/2003 (b)(e) | | | 2,005 | | | 2,004 | |
| | | | | |
|
|
|
Total Short-Term Instruments
(Cost $40,661) | | | | | | 40,661 | |
| | | | | |
|
|
|
Total Investments 153.5%
(Cost $167,802) | | | | | $ | 168,799 | |
Written Options (f) (0.2%)
(Premiums $207) | | | | | | (223 | ) |
Other Assets and Liabilities (Net) (53.3%) | | | | | | (58,601 | ) |
| | | | | |
|
|
|
Net Assets 100.0% | | | | | $ | 109,975 | |
| | | | | |
|
|
|
Notes to Schedule of Investments
(amounts in thousands, except number of contracts):
| (a) | | Variable rate security. The rate listed is as of June 30, 2003. |
| (b) | | Securities with an aggregate market value of $2,195 have been segregated with the custodian to cover margin requirements for the following open futures contracts at June 30, 2003: |
Type
| | # of
Contracts
| | Unrealized
(Depreciation)
| |
Eurodollar March Futures (03/2005) - Long | | 15 | | $ | (6 | ) |
Eurodollar June Futures (06/2005) - Long | | 15 | | | (7 | ) |
Eurodollar September Futures (09/2004) - Long | | 15 | | | (6 | ) |
Eurodollar December Futures (12/2004) - Long | | 15 | | | (6 | ) |
U.S. Treasury 10 Year Note (09/2003) - Long | | 214 | | | (352 | ) |
U.S. Treasury 30 year Bond (09/2003) - Long | | 189 | | | (339 | ) |
U.S. Treasury 5 Year Bond (09/2003) - Long | | 21 | | | (15 | ) |
| | | | |
|
|
|
| | | | | $ | (731 | ) |
| | | | |
|
|
|
| (c) | | Security, or a portion thereof, subject to financing transaction. |
| (d) | | Principal amount of security is adjusted for inflation. |
| (e) | | Securities are grouped by coupon or range of coupons and represent a range of maturities. |
| (f) | | Premiums received on written options: |
Type
| | Notional
Amount
| | Premium
| | Value
|
Call - OTC 5 Year Interest Rate Swap | | | | | | | | | |
Strike @ 3.250%* Exp. 03/03/2004 | | $ | 1,500,000 | | $ | 23 | | $ | 29 |
Call - OTC 5 Year Interest Rate Swap | | | | | | | | | |
Strike @ 3.250%* Exp. 03/03/2004 | | | 5,800,000 | | | 92 | | | 113 |
| | | | | |
|
| |
|
|
| | | | | | $ | 115 | | $ | 142 |
| | | | | |
|
| |
|
|
| | | |
Type
| | # of
Contracts
| | Premium
| | Value
|
Call - CME Eurodollar September Futures | | | | | | | | | |
Strike @ 98.750 Exp 09/15/2003 | | | 12 | | $ | 4 | | $ | 6 |
Call - CBOT U.S. Treasury Note September Futures | | | | | | | | | |
Strike @ 120.000 Exp. 08/23/2003 | | | 48 | | | 18 | | | 17 |
Call - CBOT U.S. Treasury Bond September Futures | | | | | | | | | |
Strike @ 128.000 Exp. 08/23/2003 | | | 45 | | | 23 | | | 2 |
Call - CBOT U.S. Treasury Bond September Futures | | | | | | | | | |
Strike @ 126.000 Exp. 08/23/2003 | | | 59 | | | 22 | | | 7 |
Put - CBOT U.S. Treasury Bond September Futures | | | | | | | | | |
Strike @ 114.000 Exp. 08/23/2003 | | | 22 | | | 16 | | | 17 |
Put - CBOT U.S. Treasury Bond September Futures | | | | | | | | | |
Strike @ 116.000 Exp. 08/23/2003 | | | 23 | | | 9 | | | 32 |
| | | | | |
|
| |
|
|
| | | | | | $ | 92 | | $ | 81 |
| | | | | |
|
| |
|
|
| * | | The Portfolio will receive a floating rate based on 3-month LIBOR. |
| (g) | | Swap agreements outstanding at June 30, 2003: |
Type
| | Notional
Amount
| | Unrealized
Appreciation
|
Receive floating rate based on 3-month LIBOR and pay a fixed rate equal to 4.000%. | | | | | | |
| | |
Counterparty: Lehman Brothers, Inc. | | | | | | |
Exp. 12/17/2005 | | $ | 5,000 | | $ | 13 |
| | | | | |
|
|
| | | | | | $ | 13 |
| | | | | |
|
|
| (h) | | Short sales open at June 30, 2003 were as follows: |
Type
| | Coupon (%)
| | Maturity
| | Par
| | Value
| | Proceeds
|
Freddie Mac | | 4.500 | | 01/15/2013 | | $ | 8,500 | | $ | 8,947 | | $ | 9,184 |
U.S. Treasury Note | | 1.625 | | 04/30/2005 | | | 3,300 | | | 3,333 | | | 3,336 |
| | | | | | | | | |
|
| |
|
|
| | | | | | | | | | $ | 12,280 | | $ | 12,520 |
| | | | | | | | | |
|
| |
|
|
| (i) | | Indicates a fair valued security which has not been valued utilizing an independent quote and which is valued pursuant to guidelines established by the Trustees. The aggregate value of fair valued securities is $1,801, which is 1.6% of net assets. |
8 | | Semi-Annual Report | 6.30.03 | | | See accompanying notes |
Notes to Financial Statements
June 30, 2003 (Unaudited)
1. Organization
The Long-Term U.S. Government Portfolio (the “Portfolio”) is a series of the PIMCO Variable Insurance Trust (the “Trust”). The Trust is registered under the Investment Company Act of 1940 (the “Act”), as amended, as an open-end investment company organized as a Delaware business trust on October 3, 1997. The Trust may offer up to two classes of shares: Institutional and Administrative. Each share class has identical voting rights (except that shareholders of a class have exclusive voting rights regarding any matter relating solely to that class of shares). Information presented in these financial statements pertains to the Administrative Class of the Trust. Certain detailed financial information for the Institutional Class is provided separately and is available upon request. The Trust is designed to be used as an investment vehicle by Separate Accounts of insurance companies that fund variable annuity contracts and variable life insurance policies and by qualified pension and retirement plans. The Portfolio commenced operations on April 30, 1999.
2. Significant Accounting Policies
The following is a summary of significant accounting policies consistently followed by the Trust in the preparation of its financial statements in conformity with accounting principles generally accepted in the United States of America. The preparation of financial statements in accordance with accounting principles generally accepted in the United States of America requires management to make estimates and assumptions that affect the reported amounts and disclosures in the financial statements. Actual results could differ from those estimates.
Security Valuation. Portfolio securities and other financial instruments for which market quotations are readily available are stated at market value. Market value is determined at the close of regular trading (normally, 4:00 p.m., Eastern Time) on the New York Stock Exchange on each day the New York Stock Exchange is open, or if no sales are reported, as is the case for most securities traded over-the-counter, the mean between representative bid and asked quotations obtained from a quotation reporting system or from established market makers. Fixed income securities, including those to be purchased under firm commitment agreements, are normally valued on the basis of quotes obtained from brokers and dealers or pricing services. Short-term investments, which mature in 60 days or less are valued at amortized cost, which approximates market value. Certain fixed income securities for which daily market quotations are not readily available may be valued, pursuant to guidelines established by the Board of Trustees, with reference to fixed income securities whose prices are more readily obtainable. Prices may be obtained from independent pricing services which use information provided by market makers or estimates of market values obtained from yield data relating to investments or securities with similar characteristics. The prices used by the Portfolio may differ from the value that would be realized if the securities were sold and the differences could be material to the financial statements.
Securities Transactions and Investment Income. Securities transactions are recorded as of the trade date. Securities purchased or sold on a when-issued or delayed delivery basis may be settled a month or more after the trade date. Realized gains and losses from securities sold are recorded on the identified cost basis. Dividend income is recorded on the ex-dividend date, except certain dividends from foreign securities where the ex-dividend date may have passed, are recorded as soon as the Portfolio is informed of the ex-dividend date. Interest income, adjusted for the accretion of discounts and amortization of premiums, is recorded on the accrual basis. Paydowns gains and losses on mortgage- and asset-backed securities are recorded as adjustments to interest income in the Statement of Operations.
Dividends and Distributions to Shareholders. Dividends from net investment income, if any, are declared on each day the Trust is open for business and are distributed to shareholders monthly. All dividends are reinvested in additional shares of the Portfolio. Net realized capital gains earned by the Portfolio, if any, will be distributed no less frequently than once each year.
Income dividends and capital gain distributions are determined in accordance with income tax regulations which may differ from accounting principles generally accepted in the United States of America. These differences are primarily due to differing treatments for such items as wash sales, foreign currency transactions, net operating losses and capital loss carryforwards.
Distributions classified as a tax basis return of capital, if any, are reflected in the accompanying Statements of Changes in Net Assets and have been reclassified to paid in capital. In addition, other amounts have been reclassified between undistributed net investment income, accumulated undistributed net realized gains or losses and/or paid in capital to more appropriately conform financial accounting to tax characterizations of dividend distributions.
Multiclass Operations. Each class offered by the Trust has equal rights as to assets. Income, non-class specific expenses, and realized and unrealized capital gains and losses are allocated to each class of shares based on the relative net assets of each class.
Federal Income Taxes. The Portfolio intends to qualify as a regulated investment company and distribute all of its taxable income and net realized gains, if applicable, to shareholders. Accordingly, no provision for Federal income taxes has been made.
6.30.03 | Semi-Annual Report | | 9 |
Financing Transactions. The Portfolio may enter into financing transactions consisting of the sale by the Portfolio of securities, together with a commitment to repurchase similar securities at a future date. The difference between the selling price and the future purchase price is an adjustment to interest income in the Statement of Operations. If the counterparty to whom the Portfolio sells the security becomes insolvent, the Portfolio’s right to repurchase the security may be restricted; the value of the security may change over the term of the financing transaction; and the return earned by the Portfolio with the proceeds of a financing transaction may not exceed transaction costs. The Portfolio will designate assets determined to be liquid by PIMCO or otherwise cover its obligations under financing transactions.
Futures Contracts. The Portfolio is authorized to enter into futures contracts. The Portfolio may use futures contracts to manage its exposure to the securities markets or to movements in interest rates and currency values. The primary risks associated with the use of futures contracts are imperfect correlation between the change in market value of the securities held by the Portfolio and the prices of futures contracts, the possibility of an illiquid market, and the inability of the counterparty to meet the terms of the contract. Futures contracts are valued based upon their quoted daily settlement prices. Upon entering into a futures contract, the Portfolio may be required to deposit with its custodian, in a segregated account in the name of the futures broker, an amount of cash or U.S. Government and Agency Obligations in accordance with the initial margin requirements of the broker or exchange. Futures contracts are marked to market daily and an appropriate payable or receivable for the change in value (“variation margin”) is recorded by the Portfolio. Gains or losses are recognized but not considered realized until the contracts expire or are closed. Futures contracts involve, to varying degrees, risk of loss in excess of the variation margin disclosed in the Statement of Assets and Liabilities.
Options Contracts. The Portfolio may write call and put options on futures, securities or currencies it owns or in which it may invest. Writing put options tends to increase the Portfolio’s exposure to the underlying instrument. Writing call options tends to decrease the Portfolio’s exposure to the underlying instrument. When the Portfolio writes a call or put option, an amount equal to the premium received is recorded as a liability and subsequently marked to market to reflect the current value of the option written. Payment received or made, if any, from writing options with premiums to be determined on a future date are reflected as such on the Statement of Assets and Liabilities. Premiums received from writing options which expire are treated as realized gains. Premiums received from writing options which are exercised or closed are added to the proceeds or offset against amounts paid on the underlying future, security or currency transaction to determine the realized gain or loss. The Portfolio as a writer of an option has no control over whether the underlying future, security or currency may be sold (call) or purchased (put) and as a result bears the market risk of an unfavorable change in the price of the future, security or currency underlying the written option. There is the risk the Portfolio may not be able to enter into a closing transaction because of an illiquid market.
The Portfolio may also purchase put and call options. Purchasing call options tends to increase the Portfolio’s exposure to the underlying instrument. Purchasing put options tends to decrease the Portfolio’s exposure to the underlying instrument. The Portfolio pays a premium which is included in the Portfolio’s Statement of Assets and Liabilities as an investment and subsequently marked to market to reflect the current value of the option. Premiums paid for purchasing options which expire are treated as realized losses. The risk associated with purchasing put and call options is limited to the premium paid. Premiums paid for purchasing options which are exercised or closed are added to the amounts paid or offset against the proceeds on the underlying future, security or currency transaction to determine the realized gain or loss.
Short Sales. The Portfolio has entered into short sales transactions during the fiscal year. A short sale is a transaction in which a Portfolio sells securities it does not own in anticipation of a decline in the market price of the securities. The Portfolio is obligated to deliver securities at the market price at the time the short position is closed. Possible losses from short sales may be unlimited, whereas losses from purchases cannot exceed the total amount invested.
Swap Agreements. The Portfolio may invest in swap agreements. A swap is an agreement to exchange the return generated by one instrument for the return generated by another instrument. The Portfolio may enter into interest rate, total return, forward swap spread lock and credit default swap agreements to manage its exposure to interest rates and credit risk. Interest rate swap agreements involve the exchange by the Portfolio with another party of their respective commitments to pay or receive interest, e.g., an exchange of floating rate payments for fixed rate payments with respect to a notional amount of principal. Total return swap agreements involve commitments to pay interest in exchange for a market-linked return, both based on notional amounts. To the extent the total return of the security or index underlying the transaction exceeds or falls short of the offsetting interest rate obligation, the Portfolio will receive a payment from or make a payment to the counterparty. Forward spread lock swap agreements involve commitments to pay or receive a settlement amount calculated as the difference between the swap spread and a fixed spread, multiplied by the notional amount times the duration of the swap. The swap spread is the difference between the benchmark swap rate (market rate) and the specific Treasury
10 | | Semi-Annual Report | 6.30.03 |
rate. In a credit default swap, one party makes a stream of payments to another party in exchange for the right to receive a specified return in the event of a default by a third party, typically corporate issues or sovereign issues of an emerging country, on its obligation. The Portfolio may use credit default swaps to provide a measure of protection against defaults of sovereign issuers (i.e., to reduce risk where the Portfolio owns or has exposure to the sovereign issuer) or to take an active long or short position with respect to the likelihood of a particular issuer’s default. Swaps are marked to market daily based upon quotations from market makers and vendors and the change in value, if any, is recorded as unrealized gain or loss in the Statement of Operations. Payments received or made at the beginning of the measurement period are reflected as such on the Statement of Assets and Liabilities. A liquidation payment received or made at the termination of the swap is recorded as realized gain or loss in the Statement of Operations. Net periodic payments are included as part of miscellaneous income on the Statement of Operations. Entering into these agreements involves, to varying degrees, elements of credit, market and documentation risk in excess of the amounts recognized on the Statement of Assets and Liabilities. Such risks involve the possibility that there will be no liquid market for these agreements, that the counterparty to the agreements may default on its obligation to perform or disagree as to the meaning of contractual terms in the agreements, and that there may be unfavorable changes in interest rates.
Delayed Delivery Transactions. The Portfolio may purchase or sell securities on a when-issued or delayed delivery basis. These transactions involve a commitment by the Portfolio to purchase or sell securities for a predetermined price or yield, with payment and delivery taking place beyond the customary settlement period. When delayed delivery purchases are outstanding, the Portfolio will set aside and maintain until the settlement date in a segregated account, liquid assets in an amount sufficient to meet the purchase price. When purchasing a security on a delayed delivery basis, the Portfolio assumes the rights and risks of ownership of the security, including the risk of price and yield fluctuations, and takes such fluctuations into account when determining its net asset value. The Portfolio may dispose of or renegotiate a delayed delivery transaction after it is entered into, and may sell when-issued securities before they are delivered, which may result in a capital gain or loss. When the Portfolio has sold a security on a delayed delivery basis, the Portfolio does not participate in future gains and losses with respect to the security.
Inflation-Indexed Bonds. Inflation-indexed bonds are fixed income securities whose principal value is periodically adjusted to the rate of inflation. The interest rate on these bonds is generally fixed at issuance at a rate lower than typical bonds. Over the life of an inflation-indexed bond, however, interest will be paid based on a principal value, which is adjusted for inflation. Any increase in the principal amount of an inflation-indexed bond will be included as interest income in the Statement of Operations, even though investors do not receive their principal until maturity.
Repurchase Agreements. The Portfolio may engage in repurchase transactions. Under the terms of a typical repurchase agreement, the Portfolio takes possession of an underlying debt obligation subject to an obligation of the seller to repurchase, and the Portfolio to resell, the obligation at an agreed-upon price and time. The market value of the collateral must be equal at all times to the total amount of the repurchase obligations, including interest. Generally, in the event of counterparty default, the Portfolio has the right to use the collateral to offset losses incurred.
3. Fees, Expenses, and Related Party Transactions
Investment Advisory Fee. Pacific Investment Management Company LLC (PIMCO) is a majority owned subsidiary partnership of Allianz Dresdner Asset Management of America L.P. (formerly PIMCO Advisors L.P.) and serves as investment adviser (the “Adviser”) to the Trust, pursuant to an investment advisory contract. The Adviser receives a monthly fee at an annual rate based on average daily net assets of the Portfolio. The Advisory Fee is charged at an annual rate of 0.25%.
Administration Fee. PIMCO serves as administrator (the “Administrator”) and provides administrative services to the Trust for which it receives a monthly administrative fee based on average daily net assets of the Portfolio. The Administration Fee is charged at the annual rate of 0.25%.
Servicing Fee. PIMCO Advisors Distributors LLC (“PAD”), is an indirect wholly-owned subsidiary of Allianz Dresdner Asset Management of America L.P. and serves as the distributor of the Trust’s shares. The Trust is permitted to reimburse PAD on a quarterly basis, out of the Administrative Class assets of the Portfolio in the amount of 0.15% on an annual basis of the average daily net assets of that class, for payments made to financial intermediaries that provide services in connection with the distribution of shares or administration of plans or programs that use Portfolio shares as their funding medium. The effective rate paid to PAD during the current fiscal year is 0.15%.
Expenses. The Portfolio is responsible for the following expenses: (i) salaries and other compensation of any of the Trust’s executive officers and employees who are not officers, directors, stockholders or employees of PIMCO or its subsidiaries or affiliates; (ii) taxes and governmental fees; (iii) brokerage fees and commissions and other portfolio transaction expenses; (iv) the cost of borrowing money, including interest expense; (v) fees and expenses of the Trustees who are not “interested persons” of PIMCO or
6.30.03 | Semi-Annual Report | | 11 |
the Trust, and any counsel retained exclusively for their benefit; (vi) extraordinary expenses, including costs of litigation and indemnification expenses; (vii) organization expenses and (viii) any expenses allocated or allocable to a specific class of shares, which include service fees payable with respect to the Administrative Class shares and may include certain other expenses as permitted by the Trust’s Multiple Class Plan adopted pursuant to Rule 18f-3 under the Act and subject to review and approval by the Trustees. The ratio of expenses to average net assets per share class, as disclosed in the Financial Highlights, may differ from the annual Portfolio operating expenses per share class as disclosed in the Prospectus for the reasons set forth above. PIMCO has agreed to waive a portion of its administrative fees to the extent that the payment of the Portfolio’s pro rata share of Trustees’ fees causes the actual expense ratio to rise above the rates disclosed in the current prospectus plus 0.49 basis points as set forth below (calculated as a percentage of the Portfolio’s average daily net assets attributable to each class):
| | | Institutional
Class
| | | Administrative
Class
| |
Long-Term U.S. Government Portfolio | | 0.50 | % | | 0.65 | % |
PIMCO may be reimbursed for these waived amounts in future periods. The Trust pays no compensation directly to any Trustee or any other officer who is affiliated with the Administrator, all of whom receive renumeration for their services to the Trust from the Administrator or its affiliates.
Each unaffiliated Trustee receives an annual retainer of $4,000, plus $1,500 for each Board of Trustees meeting attended in person and $250 for each meeting attended telephonically, plus reimbursement of related expenses. In addition, each committee chair receives an additional annual retainer of $500. These expenses are allocated on a pro-rata basis to each Portfolio of the Trust according to its respective net assets.
4. Purchases and Sales of Securities
Purchases and sales of securities (excluding short-term investments) for the period ended June 30, 2003 were as follows (amounts in thousands):
| | | U.S Government/Agency
| | All Other
|
| | | Purchases
| | Sales
| | Purchases
| | Sales
|
Long-Term U.S. Government Portfolio | | $ | 210,957 | | $ | 152,109 | | $ | 25,870 | | $ | 22,186 |
5. Transactions in Written Call and Put Options
Transactions in written call and put options were as follows (amounts in thousands):
Long-Term U.S. Government Portfolio
| |
| | | Premium
| |
Balance at 12/31/2002 | | $ | 105 | |
Sales | | | 253 | |
Closing Buys | | | (49 | ) |
Expirations | | | (89 | ) |
Exercised | | | (13 | ) |
| | |
|
|
|
Balance at 06/30/2003 | | $ | 207 | |
| | |
|
|
|
6. Federal Income Tax Matters
At June 30, 2003, the aggregate cost of investments was the same for federal income tax and financial statement purposes. The net unrealized appreciation (depreciation) of investments securities for federal income tax purposes is as follows (amounts in thousands):
| | | Aggregate Gross
Unrealized
Appreciation
| | Aggregate Gross Unrealized
(Depreciation)
| | | Net
Unrealized
Appreciation
|
Long-Term U.S. Government Portfolio | | $ | 1,867 | | $ | (870 | ) | | $ | 997 |
12 | | Semi-Annual Report | 6.30.03 |
7. Shares of Beneficial Interest
The Trust may issue an unlimited number of shares of beneficial interest with a $.0001 par value. Changes in shares of beneficial interest were as follows (shares and amounts in thousands):
| | | Long-Term U.S. Government Portfolio
| |
| | | Six Months Ended
06/30/2003 | | | Year Ended
12/31/2002 | |
| | | Shares
| | | Amount
| | | Shares
| | | Amount
| |
Receipts for shares sold | | | | | | | | | | | �� | | | |
Institutional Class | | 0 | | | $ | 0 | | | 0 | | | $ | 0 | |
Administrative Class | | 2,463 | | | | 27,569 | | | 5,886 | | | | 64,003 | |
Issued as reinvestment of distributions | | | | | | | | | | | | | | |
Institutional Class | | 0 | | | | 0 | | | 0 | | | | 1 | |
Administrative Class | | 146 | | | | 1,654 | | | 568 | | | | 6,177 | |
Cost of shares redeemed | | | | | | | | | | | | | | |
Institutional Class | | 0 | | | | 0 | | | 0 | | | | 0 | |
Administrative Class | | (1,445 | ) | | | (16,269 | ) | | (1,353 | ) | | | (14,603 | ) |
| | |
|
| |
|
|
| |
|
| |
|
|
|
Net increase resulting from Portfolio share transactions | | 1,164 | | | $ | 12,954 | | | 5,101 | | | $ | 55,578 | |
| | |
|
| |
|
|
| |
|
| |
|
|
|
The following schedule shows the number of shareholders each owning 5% or more of the Portfolio and the total percentage of the Portfolio held by such shareholders:
| | | Number
| | % of Portfolio
Held
|
Long-Term U.S. Government Portfolio | | | | |
Institutional Class | | 1 | | 100 |
Administrative Class | | 2 | | 90 |
6.30.03 | Semi-Annual Report | | 13 |
Trustees and Officers
Brent R. Harris, Chairman and Trustee
R. Wesley Burns, President and Trustee
E. Philip Cannon, Trustee
Vern O. Curtis, Trustee
J. Michael Hagan, Trustee
William J. Popejoy, Trustee
Garlin G. Flynn, Secretary
John P. Hardaway, Treasurer
Investment Adviser and Administrator
Pacific Investment Management Company LLC
840 Newport Center Drive
Newport Beach, California 92660
Transfer Agent
National Financial Data Services
330 W. 9th Street, 4th Floor
Kansas City, Missouri 64105
Custodian
State Street Bank & Trust Company
801 Pennsylvania
Kansas City, Missouri 64105
Counsel
Dechert LLP
1775 I Street, N.W.
Washington, D.C. 20006
Independent Accountants
PricewaterhouseCoopers LLP
1055 Broadway
Kansas City, Missouri 64105
PIMCO VARIABLE INSURANCE TRUST
This report is submitted for the general information of the shareholders of the PIMCO Variable Insurance Trust. It is not authorized for distribution to prospective investors unless accompanied or preceded by an effective prospectus for the PIMCO Variable Insurance Trust, which contains information covering its investment policies as well as other pertinent information.
All Funds distributed by PIMCO ADVISORS DISTRIBUTORS LLC, member NASD
840 NEWPORT CENTER DRIVE
NEWPORT BEACH, CA 92660
800.927.4648
WWW.PIMCOADVISORS.COM
WWW.PIMCO.COM
| P I M C O |
| PIMCO VARIABLE INSURANCE TRUST |
| LONG-TERM U.S. GOVERNMENT PORTFOLIO |
| INSTITUTIONAL CLASS |
|
| SEMI-ANNUAL REPORT |
| June 30, 2003 |
| | | Fund
Summary
| | Schedule of
Investments
|
Long-Term U.S. Government Portfolio (Institutional Class) | | 2 | | 7 |
Chairman’s Letter
Dear PIMCO Variable Insurance Trust Shareholder:
Financial assets gained during the first half of 2003 amid a revival of risk appetites as anxiety about the war in Iraq faded. Assets that generally benefit from economic growth, such as stocks, corporate bonds and emerging market debt, fared the best year-to-date as investors returned to these sectors in anticipation of a recovery in the second half of 2003. Reflationary forces that investors expected to fuel a rebound included federal tax cuts and a weak dollar, as well as low borrowing rates that eased the burden of high personal and corporate indebtedness. Low mortgage rates kept refinancings booming in the second quarter and put more money in consumers’ pockets.
U.S. Treasuries lagged their riskier counterparts but still enjoyed a modest rally. Yields fell to levels not seen in 45 years early in the second quarter before bouncing off their lows in June as hopes for recovery increased. The yield on the benchmark 10-year Treasury closed the six-month period 0.30% lower to 3.51%, after nearing 3% earlier in the period. Buyers were encouraged that inflation would remain tame amid low capacity utilization and weak employment growth. Asian central banks bought U.S. Treasuries to limit the rise in their currencies versus the dollar in an effort to protect their export industries. In June, the Federal Reserve cut the federal funds rate by 0.25% to 1%, its 13th easing since 2001, in an effort to boost the economy and ward off deflation. Although the cut was less than expected, the Fed suggested that rates would stay low until deflation risks abated.
On the following pages you will find specific details as to the Portfolio’s total return investment performance and a discussion of those factors that affected performance.
We appreciate the trust you have placed in us, and we will continue to focus our efforts to meet your investment needs.
Sincerely,
Brent R. Harris
Chairman
July 31, 2003
6.30.03 | Semi-Annual Report | | 1 |
Long-Term U.S. Government Portfolio
TOTAL RETURN INVESTMENT PERFORMANCE For the period ended June 30, 2003
| | | 1 Year | | | Since Inception* | |
Long-Term U.S. Gov’t Portfolio Institutional Class | | 18.77 | % | | 12.90 | % |
Lehman Brothers Long-Term Treasury Index | | 19.37 | % | | — | |
| * | | Annualized (All Portfolio returns are net of fees and expenses) |
CUMULATIVE RETURNS THROUGH JUNE 30, 2003
$10,000 invested at inception
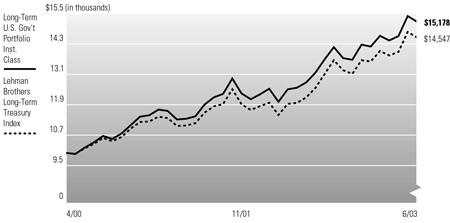
Past performance is no guarantee of future results. Investment return and principal value will fluctuate so that Portfolio shares, when redeemed, may be worth more or less than their original cost. The line graph above assumes the investment of $10,000 on 5/01/2000, the first full month following the Portfolio’s Institutional Class inception on 4/10/2000, compared to the Lehman Brothers Long-Term Treasury Index, an unmanaged market index. It is not possible to invest directly in the Index.
PORTFOLIO INSIGHTS
| • | | The Long-Term U.S. Government Portfolio seeks to achieve its investment objective by investing under normal circumstances at least 80% of its assets in a diversified portfolio of fixed income securities that are issued or guaranteed by the U.S. Government, its agencies or government-sponsored enterprises. |
| • | | The Portfolio’s Institutional Class underperformed the benchmark Lehman Brothers Long-Term Treasury Index for the six-month period ended June 30, 2003, returning 6.35% versus 6.53% for the Index. |
| • | | Below-Index duration was negative for performance for the first half of the year as interest rates declined. |
| • | | An overweight to intermediate-term maturities helped portfolio performance as intermediate rates rallied and these securities experienced greater price appreciation than longer maturity issues. |
| • | | A mortgage emphasis via agency pass-throughs and longer duration structured mortgages was a slight negative for the Portfolio’s performance. |
| • | | A modest allocation to longer duration corporates was positive. These issues continued to benefit from improved credit fundamentals and increased investor demand. |
| • | | An allocation to real return bonds was negative as real yields fell less than yields on nominal bonds with comparable maturities. |
| • | | A focus on high-quality agency bonds enhanced returns as these securities outperformed Treasuries. |
2 | | Semi-Annual Report | 6.30.03 |
Financial Highlights
Long-Term U.S. Government Portfolio (Institutional Class)
| Selected Per Share Data for the Year or Period Ended: | | 06/30/2003 +
| | | 12/31/2002
| | | 12/31/2001
| | | 04/10/2000-12/31/2000
| |
Net asset value beginning of period | | $ | 11.09 | | | $ | 10.27 | | | $ | 10.56 | | | $ | 9.90 | |
Net investment income (a) | | | 0.18 | | | | 0.46 | | | | 0.54 | | | | 0.43 | |
Net realized/unrealized gain on investments (a) | | | 0.52 | | | | 1.31 | | | | 0.08 | | | | 0.66 | |
Total income from investment operations | | | 0.70 | | | | 1.77 | | | | 0.62 | | | | 1.09 | |
Dividends from net investment income | | | (0.19 | ) | | | (0.46 | ) | | | (0.54 | ) | | | (0.43 | ) |
Distributions from net realized capital gains | | | 0.00 | | | | (0.49 | ) | | | (0.37 | ) | | | 0.00 | |
Total distributions | | | (0.19 | ) | | | (0.95 | ) | | | (0.91 | ) | | | (0.43 | ) |
Net asset value end of period | | $ | 11.60 | | | $ | 11.09 | | | $ | 10.27 | | | $ | 10.56 | |
Total return | | | 6.35 | % | | | 17.77 | % | | | 6.03 | % | | | 11.32 | % |
Net assets end of period (000s) | | $ | 14 | | | $ | 13 | | | $ | 11 | | | $ | 10 | |
Ratio of expenses to average net assets | | | 0.50 | %* | | | 0.50 | %(b) | | | 0.50 | % | | | 0.50 | %* |
Ratio of net investment income to average net assets | | | 3.25 | %* | | | 4.22 | % | | | 5.05 | % | | | 5.97 | %* |
Portfolio turnover rate | | | 181 | % | | | 586 | % | | | 457 | % | | | 553 | % |
| (a) | | Per share amounts based on average number of shares outstanding during the period. |
| (b) | | If the investment manager had not reimbursed expenses, the ratio of expenses to average net assets would have been 0.51%. |
See accompanying notes | | | 6.30.03 | Semi-Annual Report | | 3 |
Statement of Assets and Liabilities
Long-Term U.S. Government Portfolio
June 30, 2003 (Unaudited)
Amounts in thousands, except per share amounts
Assets: | | | |
Investments, at value | | $ | 168,799 |
Cash | | | 1,790 |
Receivable for investments sold | | | 14,393 |
Interest receivable | | | 1,443 |
Variation margin receivable | | | 229 |
Unrealized appreciation on swap agreements | | | 13 |
| | |
|
|
| | | | 186,667 |
| | |
|
|
Liabilities: | | | |
Payable for investments purchased | | $ | 55,445 |
Payable for financing transactions | | | 8,453 |
Payable for short sale | | | 12,280 |
Written options outstanding | | | 223 |
Accrued investment advisory fee | | | 22 |
Accrued administration fee | | | 22 |
Accrued servicing fee | | | 12 |
Swap premiums received | | | 219 |
Other liabilities | | | 16 |
| | |
|
|
| | | | 76,692 |
| | |
|
|
Net Assets | | $ | 109,975 |
| | |
|
|
Net Assets Consist of: | | | |
Paid in capital | | $ | 102,082 |
Undistributed net investment income | | | 962 |
Accumulated undistributed net realized gain | | | 6,430 |
Net unrealized appreciation | | | 501 |
| | |
|
|
| | | $ | 109,975 |
| | |
|
|
Net Assets: | | | |
Institutional Class | | $ | 14 |
Administrative Class | | | 109,961 |
Shares Issued and Outstanding: | | | |
Institutional Class | | | 1 |
Administrative Class | | | 9,480 |
Net Asset Value and Redemption Price Per Share (Net Assets Per Share Outstanding) | | | |
Institutional Class | | $ | 11.60 |
Administrative Class | | | 11.60 |
Cost of Investments Owned | | $ | 167,802 |
4 | | Semi-Annual Report | 6.30.03 | | | See accompanying notes |
Statement of Operations
Long-Term U.S. Government Portfolio
For the six months ended June 30, 2003 (Unaudited)
Amounts in thousands
Investment Income: | | | | |
Interest | | $ | 1,925 | |
| | |
|
|
|
Total Income | | | 1,925 | |
| | |
|
|
|
Expenses: | | | | |
Investment advisory fees | | | 127 | |
Administration fees | | | 127 | |
Distribution and/or servicing fees - Administrative Class | | | 77 | |
Trustees’ fees | | | 1 | |
| | |
|
|
|
Total Expenses | | | 332 | |
| | |
|
|
|
Net Investment Income | | | 1,593 | |
| | |
|
|
|
Net Realized and Unrealized Gain (Loss): | | | | |
Net realized gain on investments | | | 2,304 | |
Net realized gain on futures contracts, written options, and swaps | | | 4,509 | |
Net change in unrealized (depreciation) on investments | | | (417 | ) |
Net change in unrealized (depreciation) on futures contracts, written options, and swaps | | | (1,583 | ) |
Net Gain | | | 4,813 | |
| | |
|
|
|
Net Increase in Assets Resulting from Operations | | $ | 6,406 | |
| | |
|
|
|
See accompanying notes | | | 6.30.03 | Semi-Annual Report | | 5 |
Statements of Changes in Net Assets
Long-Term U.S. Government Portfolio
Amounts in thousands
| Increase (Decrease) in Net Assets from: | | Six Months Ended
June 30, 2003
| | | Year Ended December 31, 2002
| |
| | | (Unaudited) | | | | |
Operations: | | | | | | | | |
Net investment income | | $ | 1,593 | | | $ | 2,378 | |
Net realized gain | | | 6,813 | | | | 4,809 | |
Net change in unrealized appreciation (depreciation) | | | (2,000 | ) | | | 2,658 | |
| | |
|
|
| |
|
|
|
Net increase resulting from operations | | | 6,406 | | | | 9,845 | |
| | |
|
|
| |
|
|
|
Distributions to Shareholders: | | | | | | | | |
From net investment income | | | | | | | | |
Institutional Class | | | 0 | | | | 0 | |
Administrative Class | | | (1,654 | ) | | | (2,378 | ) |
From net realized capital gains | | | | | | | | |
Institutional Class | | | 0 | | | | (1 | ) |
Administrative Class | | | 0 | | | | (3,799 | ) |
| | |
|
|
| |
|
|
|
Total Distributions | | | (1,654 | ) | | | (6,178 | ) |
| | |
|
|
| |
|
|
|
Portfolio Share Transactions: | | | | | | | | |
Receipts for shares sold | | | | | | | | |
Institutional Class | | | 0 | | | | 0 | |
Administrative Class | | | 27,569 | | | | 64,003 | |
Issued as reinvestment of distributions | | | | | | | | |
Institutional Class | | | 0 | | | | 1 | |
Administrative Class | | | 1,654 | | | | 6,177 | |
Cost of shares redeemed | | | | | | | | |
Institutional Class | | | 0 | | | | 0 | |
Administrative Class | | | (16,269 | ) | | | (14,603 | ) |
| | |
|
|
| |
|
|
|
Net increase resulting from Portfolio share transactions | | | 12,954 | | | | 55,578 | |
| | |
|
|
| |
|
|
|
Total Increase in Net Assets | | | 17,706 | | | | 59,245 | |
| | |
|
|
| |
|
|
|
Net Assets: | | | | | | | | |
Beginning of period | | | 92,269 | | | | 33,024 | |
End of period* | | $ | 109,975 | | | $ | 92,269 | |
*Including undistributed net investment income of: | | $ | 962 | | | $ | 1,023 | |
6 | | Semi-Annual Report | 6.30.03 | | | See accompanying notes |
Schedule of Investments
Long-Term U.S. Government Portfolio
June 30, 2003 (Unaudited)
| | | Principal
Amount (000s)
| | Value
(000s)
|
CORPORATE BONDS & NOTES 7.6% | | | | | | |
Banking & Finance 6.5% | | | | | | |
Donaldson, Lufkin & Jenrette, Inc. | | | | | | |
1.849% due 07/18/2003 (a) | | $ | 100 | | $ | 100 |
Ford Motor Credit Co. | | | | | | |
1.570% due 04/26/2004 (a) | | | 600 | | | 595 |
1.718% due 07/19/2004 (a) | | | 900 | | | 889 |
1.769% due 07/18/2005 (a) | | | 200 | | | 193 |
General Electric Capital Corp. | | | | | | |
1.408% due 09/15/2004 (a) | | | 100 | | | 100 |
1.383% due 03/15/2005 (a) | | | 800 | | | 801 |
General Motors Acceptance Corp. | | | | | | |
1.604% due 07/21/2003 (a) | | | 100 | | | 100 |
2.049% due 01/20/2004 (a) | | | 1,100 | | | 1,099 |
Merrill Lynch & Co., Inc. | | | | | | |
1.680% due 03/08/2004 (a) | | | 200 | | | 201 |
Morgan Stanley Dean Witter & Co. | | | | | | |
1.360% due 09/19/2003 (a) | | | 400 | | | 400 |
National Rural Utilities Cooperative Finance Corp. | | | | | | |
2.320% due 04/26/2004 (a) | | | 200 | | | 201 |
5.250% due 07/15/2004 | | | 400 | | | 417 |
Travelers Property Casualty Corp. | | | | | | |
6.375% due 03/15/2033 | | | 1,000 | | | 1,097 |
U.S. Trade Funding Corp. | | | | | | |
4.260% due 11/15/2014 | | | 975 | | | 1,018 |
| | | | | |
|
|
| | | | | | | 7,211 |
| | | | | |
|
|
Industrials 1.1% | | | | | | |
Continental Airlines, Inc. | | | | | | |
6.320% due 11/01/2008 | | | 1,000 | | | 971 |
DaimlerChrysler North America Holding Corp. | | | | | | |
1.610% due 08/16/2004 (a) | | | 200 | | | 199 |
| | | | | |
|
|
| | | | | | | 1,170 |
| | | | | |
|
|
Total Corporate Bonds & Notes
(Cost $8,185) | | | | | | 8,381 |
| | | | | |
|
|
MUNICIPAL BONDS & NOTES 2.0% | | | | | | |
Colorado 0.3% | | | | | | |
Dawson Ridge Metropolitan District No. 1 General Obligation Bonds, Series 1992 | | | | | | |
0.000% due 10/01/2022 | | | 800 | | | 318 |
| | | | | |
|
|
Florida 0.5% | | | | | | |
Florida State Board of Education General Obligation Bonds, (FGIC Insured), Series 2002 | | | | | | |
5.000% due 06/01/2031 | | | 500 | | | 525 |
| | | | | |
|
|
Illinois 0.8% | | | | | | |
Chicago, Illinois Water Revenue Bonds, (AMBAC Insured), Series 2001 | | | | | | |
5.000% due 11/01/2031 | | | 200 | | | 207 |
Illinois State General Obligation Bonds, Series 2003 | | | | | | |
5.100% due 06/01/2033 | | | 700 | | | 689 |
| | | | | |
|
|
| | | | | | | 896 |
| | | | | |
|
|
New York 0.2% | | | | | | |
New York State Triborough Bridge and Tunnels Authority Revenue Bonds, Series 2002 | | | | | | |
5.000% due 11/15/2032 | | | 200 | | | 208 |
| | | | | |
|
|
Texas 0.2% | | | | | | |
San Antonio, Texas Water Revenue Bonds, (FSA Insured), Series 2002 | | | | | | |
5.000% due 05/15/2032 | | | 250 | | | 259 |
| | | | | |
|
|
Total Municipal Bonds & Notes
(Cost $2,144) | | | | | | 2,206 |
| | | | | |
|
|
U.S. GOVERNMENT AGENCIES 17.1% | | | | | | |
Fannie Mae | | | | | | |
4.850% due 07/02/2004 | | | 500 | | | 500 |
4.500% due 10/17/2006 | | | 1,000 | | | 1,009 |
5.000% due 11/13/2006 | | | 500 | | | 507 |
5.000% due 01/20/2007 | | | 1,000 | | | 1,019 |
5.740% due 01/21/2009 | | | 1,000 | | | 1,025 |
5.550% due 02/08/2007 | | | 900 | | | 904 |
5.250% due 03/22/2007 | | | 1,000 | | | 1,027 |
Federal Home Loan Bank | | | | | | |
5.015% due 08/26/2005 | | | 500 | | | 503 |
4.000% due 02/13/2009 | | | 1,000 | | | 1,016 |
5.120% due 01/10/2013 | | | 5,000 | | | 5,225 |
Financing Corp. | | | | | | |
10.700% due 10/06/2017 | | | 650 | | | 1,083 |
Freddie Mac | | | | | | |
3.650% due 01/11/2005 | | | 1,000 | | | 1,001 |
4.625% due 03/22/2006 | | | 1,000 | | | 1,008 |
4.650% due 11/06/2006 | | | 1,000 | | | 1,011 |
4.000% due 02/13/2017 | | | 200 | | | 203 |
Overseas Private Investment Corp. | | | | | | |
3.800% due 08/15/2007 (i) | | | 1,000 | | | 1,017 |
5.590% due 11/30/2010 (i) | | | 700 | | | 784 |
| | | | | |
|
|
Total U.S. Government Agencies
(Cost $18,383) | | | | | | 18,842 |
| | | | | |
|
|
U.S. TREASURY OBLIGATIONS 48.5% | | | | | | |
Treasury Inflation Protected Securities (d) | | | | | | |
3.375% due 01/15/2007 (b) | | | 174 | | | 191 |
3.625% due 01/15/2008 | | | 1,136 | | | 1,275 |
3.875% due 04/15/2029 | | | 5,584 | | | 7,125 |
U.S. Treasury Bonds | | | | | | |
10.625% due 08/15/2015 (c) | | | 1,800 | | | 2,987 |
8.875% due 08/15/2017 (c) | | | 1,400 | | | 2,118 |
6.250% due 08/15/2023 (c) | | | 9,100 | | | 11,150 |
5.500% due 08/15/2028 | | | 16,500 | | | 18,566 |
U.S. Treasury Notes | | | | | | |
1.625% due 04/30/2005 (c) | | | 3,300 | | | 3,333 |
U.S. Treasury Strips | | | | | | |
0.000% due 11/15/2016 | | | 2,000 | | | 1,112 |
0.000% due 02/15/2027 | | | 8,500 | | | 2,623 |
0.000% due 11/15/2027 | | | 9,700 | | | 2,883 |
| | | | | |
|
|
Total U.S. Treasury Obligations
(Cost $53,613) | | | | | | 53,363 |
| | | | | |
|
|
MORTGAGE-BACKED SECURITIES 31.0% | | | | | | |
Collateralized Mortgage Obligations 26.2% | | | | | | |
ABN AMRO Mortgage Corp. | | | | | | |
6.500% due 01/25/2017 | | | 983 | | | 998 |
Bear Stearns Adjustable Rate Mortgage Trust | | | | | | |
6.158% due 01/25/2032 (a) | | | 192 | | | 194 |
5.218% due 03/25/2033 (a) | | | 3,114 | | | 3,181 |
5.430% due 03/25/2033 (a) | | | 1,292 | | | 1,317 |
Countrywide Alternative Loan Trust | | | | | | |
6.750% due 12/25/2031 | | | 43 | | | 43 |
Fannie Mae | | | | | | |
5.000% due 05/25/2015 | | | 91 | | | 91 |
1.962% due 04/25/2021 | | | 72 | | | 73 |
1.793% due 08/25/2021 (a) | | | 72 | | | 73 |
6.500% due 10/25/2021 | | | 31 | | | 31 |
1.662% due 08/25/2022 (a) | | | 45 | | | 45 |
7.000% due 10/25/2022 | | | 309 | | | 338 |
1.935% due 04/25/2032 | | | 159 | | | 160 |
Federal Agricultural Mortgage Corp. | | | | | | |
7.238% due 07/25/2011 (a) | | | 202 | | | 227 |
Freddie Mac | | | | | | |
6.000% due 02/15/2015 | | | 1,000 | | | 1,028 |
2.312% due 02/15/2021 | | | 88 | | | 88 |
5.500% due 06/15/2022 | | | 1,000 | | | 1,001 |
7.000% due 07/15/2023 | | | 49 | | | 54 |
6.500% due 12/15/2023 | | | 221 | | | 240 |
6.000% due 08/15/2025 | | | 1,000 | | | 1,011 |
2.012% due 02/15/2027 (a) | | | 85 | | | 85 |
6.000% due 03/15/2027 | | | 1,000 | | | 1,014 |
6.500% due 11/15/2027 | | | 1,120 | | | 1,135 |
5.625% due 07/15/2028 | | | 165 | | | 167 |
1.863% due 10/25/2030 | | | 1,054 | | | 1,052 |
6.000% due 12/15/2031 | | | 217 | | | 227 |
6.000% due 08/15/2032 | | | 1,041 | | | 1,094 |
Government National Mortgage Association | | | | | | |
6.000% due 06/16/2032 | | | 826 | | | 830 |
GS Mortgage Securities Corp. II | | | | | | |
6.860% due 07/13/2030 | | | 1,000 | | | 1,024 |
Master Asset Securitization Trust | | | | | | |
5.500% due 07/31/2033 | | | 900 | | | 911 |
Residential Funding Mortgage Securities I, Inc. | | | | | | |
7.500% due 04/25/2027 | | | 8 | | | 8 |
6.500% due 03/25/2032 | | | 772 | | | 781 |
Sequoia Mortgage Trust | | | | | | |
1.658% due 06/20/2032 (a) | | | 350 | | | 350 |
1.500% due 04/20/2033 (a) | | | 1,000 | | | 998 |
Structured Asset Mortgage Investments, Inc. | | | | | | |
7.100% due 02/25/2030 (a) | | | 172 | | | 177 |
6.217% due 03/25/2032 (a) | | | 346 | | | 354 |
1.647% due 09/19/2032 (a) | | | 2,352 | | | 2,343 |
1.740% due 06/18/2033 (a) | | | 1,035 | | | 1,033 |
Structured Asset Securities Corp. | | | | | | |
6.500% due 01/25/2032 | | | 86 | | | 86 |
1.535% due 07/25/2032 (a) | | | 562 | | | 565 |
1.325% due 01/25/2033 (a) | | | 319 | | | 319 |
United Mortgage Securities Corp. | | | | | | |
4.381% due 06/25/2032 (a) | | | 625 | | | 634 |
Washington Mutual Mortgage Securities Corp. | | | | | | |
6.000% due 03/25/2017 | | | 460 | | | 473 |
6.500% due 10/19/2029 | | | 150 | | | 151 |
5.390% due 02/25/2031 (a) | | | 840 | | | 859 |
5.150% due 02/25/2033 | | | 438 | | | 451 |
5.460% due 02/25/2033 (a) | | | 459 | | | 473 |
5.060% due 05/25/2033 (a) | | | 914 | | | 940 |
3.956% due 01/25/2041 (a) | | | 26 | | | 26 |
| | | | | |
|
|
| | | | | | | 28,753 |
| | | | | |
|
|
Fannie Mae 3.8% | | | | | | |
6.000% due 08/13/2033 | | | 4,000 | | | 4,155 |
| | | | | |
|
|
Federal Housing Administration 0.5% | | | | | | |
6.896% due 07/01/2020 | | | 573 | | | 584 |
| | | | | |
|
|
Freddie Mac 0.5% | | | | | | |
7.000% due 12/01/2031 | | | 517 | | | 543 |
| | | | | |
|
|
Total Mortgage-Backed Securities
(Cost $33,822) | | | | | | 34,035 |
| | | | | |
|
|
ASSET-BACKED SECURITIES 6.9% | | | | | | |
Ace Securities Corp. | | | | | | |
1.375% due 06/25/2032 (a) | | | 337 | | | 337 |
Countrywide Asset-Backed Certificates | | | | | | |
1.295% due 05/25/2032 (a) | | | 78 | | | 78 |
CS First Boston Mortgage Securities Corp. | | | | | | |
1.570% due 12/15/2030 (a) | | | 12 | | | 13 |
1.475% due 08/25/2032 (a) | | | 645 | | | 647 |
DaimlerChrysler Auto Trust | | | | | | |
2.900% due 12/06/2004 | | | 235 | | | 236 |
Financial Asset Securities Corp. AAA Trust | | | | | | |
1.150% due 09/25/2033 (a) | | | 958 | | | 957 |
Home Equity Mortgage Trust | | | | | | |
1.435% due 09/25/2033 (a) | | | 196 | | | 197 |
Household Automotive Trust | | | | | | |
2.750% due 05/17/2005 (a) | | | 343 | | | 345 |
Household Mortgage Loan Trust | | | | | | |
1.618% due 05/20/2032 (a) | | | 629 | | | 630 |
L.A. Arena Funding LLC | | | | | | |
7.656% due 12/15/2021 | | | 97 | | | 106 |
Novastar Home Equity Loan | | | | | | |
1.315% due 01/25/2031 (a) | | | 182 | | | 182 |
Renaissance Home Equity Loan Trust | | | | | | |
1.468% due 08/25/2033 (a) | | | 100 | | | 100 |
See accompanying notes | | | 6.30.03 | Semi-Annual Report | | 7 |
Schedule of Investments (Cont.)
Long-Term U.S. Government Portfolio
June 30, 2003 (Unaudited)
| | | Principal
Amount
(000s)
| | Value
(000s)
| |
Saxon Asset Securities Trust | | | | | | | |
1.400% due 03/25/2018 (a) | | $ | 993 | | $ | 992 | |
SLM Student Loan Trust | | | | | | | |
1.640% due 10/27/2025 (a) | | | 167 | | | 168 | |
Specialty Underwriting & Residential Finance | | | | | | | |
1.603% due 06/25/2034 | | | 1,000 | | | 998 | |
Terwin Mortgage Trust | | | | | | | |
1.000% due 06/25/2033 (a) | | | 1,200 | | | 1,200 | |
WFS Financial Owner Trust | | | | | | | |
2.820% due 05/20/2005 | | | 372 | | | 374 | |
| | | | | |
|
|
|
Total Asset-Backed Securities
(Cost $7,556) | | | | | | 7,560 | |
| | | | | |
|
|
|
SOVEREIGN ISSUES 3.4% | | | | | | | |
International Bank for Reconstruction & Development | | | | | | | |
7.625% due 01/19/2023 | | | 2,700 | | | 3,739 | |
| | | | | |
|
|
|
Total Sovereign Issues
(Cost $3,428) | | | | | | 3,739 | |
| | | | | |
|
|
|
PURCHASED PUT OPTIONS 0.0% | | | | | | | |
Eurodollar December Futures (CME) | | | | | | | |
Strike @ 98.500 Exp. 12/15/2003 | | | 60,000 | | | 2 | |
U.S. Treasury 10 Year Note September Futures (CBOT) | | | | | | | |
Strike @ 107.000 Exp. 08/23/2003 | | | 25,000 | | | 4 | |
U.S. Treasury 5 Year Note September Futures (CBOT) | | | | | | | |
Strike @ 109.500 Exp. 08/23/2003 | | | 20,000 | | | 6 | |
| | | | | |
|
|
|
Total Purchased Put Options
(Cost $10) | | | | | | 12 | |
| | | | | |
|
|
|
SHORT-TERM INSTRUMENTS 37.0% | | | | | | | |
Commercial Paper 35.2% | | | | | | | |
Fannie Mae | | | | | | | |
1.010% due 07/01/2003 | | | 9,000 | | | 9,000 | |
0.900% due 09/03/2003 | | | 1,800 | | | 1,797 | |
0.980% due 09/10/2003 | | | 5,000 | | | 4,990 | |
0.900% due 09/17/2003 | | | 900 | | | 898 | |
0.980% due 09/17/2003 | | | 5,000 | | | 4,989 | |
0.980% due 09/24/2003 | | | 5,000 | | | 4,988 | |
0.900% due 10/30/2003 | | | 1,400 | | | 1,396 | |
Federal Home Loan Bank | | | | | | | |
1.010% due 07/01/2003 | | | 9,000 | | | 9,000 | |
1.010% due 07/25/2003 | | | 1,600 | | | 1,599 | |
| | | | | |
|
|
|
| | | | | | | 38,657 | |
| | | | | |
|
|
|
U.S. Treasury Bills 1.8% | | | | | | | |
0.993% due 08/07/2003-08/14/2003 (b)(e) | | | 2,005 | | | 2,004 | |
| | | | | |
|
|
|
Total Short-Term Instruments
(Cost $40,661) | | | | | | 40,661 | |
| | | | | |
|
|
|
Total Investments 153.5%
(Cost $167,802) | | | | | $ | 168,799 | |
Written Options (f) (0.2%)
(Premiums $207) | | | | | | (223 | ) |
Other Assets and Liabilities (Net) (53.3%) | | | | | | (58,601 | ) |
| | | | | |
|
|
|
Net Assets 100.0% | | | | | $ | 109,975 | |
| | | | | |
|
|
|
Notes to Schedule of Investments
(amounts in thousands, except number of contracts):
| (a) | | Variable rate security. The rate listed is as of June 30, 2003. |
| (b) | | Securities with an aggregate market value of $2,195 have been segregated with the custodian to cover margin requirements for the following open futures contracts at June 30, 2003: |
Type
| | # of
Contracts
| | Unrealized (Depreciation)
| |
Eurodollar March Futures (03/2005) - Long | | 15 | | $ | (6 | ) |
Eurodollar June Futures (06/2005) - Long | | 15 | | | (7 | ) |
Eurodollar September Futures (09/2004) - Long | | 15 | | | (6 | ) |
Eurodollar December Futures (12/2004) - Long | | 15 | | | (6 | ) |
U.S. Treasury 10 Year Note (09/2003) - Long | | 214 | | | (352 | ) |
U.S. Treasury 30 year Bond (09/2003) - Long | | 189 | | | (339 | ) |
U.S. Treasury 5 Year Bond (09/2003) - Long | | 21 | | | (15 | ) |
| | | | |
|
|
|
| | | | | $ | (731 | ) |
| | | | |
|
|
|
| (c) | | Security, or a portion thereof, subject to financing transaction. |
| (d) | | Principal amount of security is adjusted for inflation. |
| (e) | | Securities are grouped by coupon or range of coupons and represent a range of maturities. |
| (f) | | Premiums received on written options: |
Type
| | Notional
Amount
| | Premium
| | Value
|
Call - OTC 5 Year Interest Rate Swap | | | | | | | | | |
Strike @ 3.250%* Exp. 03/03/2004 | | $ | 1,500,000 | | $ | 23 | | $ | 29 |
Call - OTC 5 Year Interest Rate Swap | | | | | | | | | |
Strike @ 3.250%* Exp. 03/03/2004 | | | 5,800,000 | | | 92 | | | 113 |
| | | | | |
|
| |
|
|
| | | | | | $ | 115 | | $ | 142 |
| | | | | |
|
| |
|
|
| | | |
Type
| | # of
Contracts
| | Premium
| | Value
|
Call - CME Eurodollar September Futures | | | | | | | | | |
Strike @ 98.750 Exp 09/15/2003 | | | 12 | | $ | 4 | | $ | 6 |
Call - CBOT U.S. Treasury Note September Futures | | | | | | | | | |
Strike @ 120.000 Exp. 08/23/2003 | | | 48 | | | 18 | | | 17 |
Call - CBOT U.S. Treasury Bond September Futures | | | | | | | | | |
Strike @ 128.000 Exp. 08/23/2003 | | | 45 | | | 23 | | | 2 |
Call - CBOT U.S. Treasury Bond September Futures | | | | | | | | | |
Strike @ 126.000 Exp. 08/23/2003 | | | 59 | | | 22 | | | 7 |
Put - CBOT U.S. Treasury Bond September Futures | | | | | | | | | |
Strike @ 114.000 Exp. 08/23/2003 | | | 22 | | | 16 | | | 17 |
Put - CBOT U.S. Treasury Bond September Futures | | | | | | | | | |
Strike @ 116.000 Exp. 08/23/2003 | | | 23 | | | 9 | | | 32 |
| | | | | |
|
| |
|
|
| | | | | | $ | 92 | | $ | 81 |
| | | | | |
|
| |
|
|
| * | | The Portfolio will receive a floating rate based on 3-month LIBOR. |
| (g) | | Swap agreements outstanding at June 30, 2003: |
Type
| | Notional
Amount
| | Unrealized
Appreciation
|
Receive floating rate based on 3-month LIBOR and pay a fixed rate equal to 4.000%. Counterparty: Lehman Brothers, Inc. | | | | | | |
Exp. 12/17/2005 | | $ | 5,000 | | $ | 13 |
| | | | | |
|
|
| | | | | | $ | 13 |
| | | | | |
|
|
| (h) | | Short sales open at June 30, 2003 were as follows: |
Type
| | Coupon (%)
| | Maturity
| | Par
| | Value
| | Proceeds
|
Freddie Mac | | 4.500 | | 01/15/2013 | | $ | 8,500 | | $ | 8,947 | | $ | 9,184 |
U.S. Treasury Note | | 1.625 | | 04/30/2005 | | | 3,300 | | | 3,333 | | | 3,336 |
| | | | | | | | | |
|
| |
|
|
| | | | | | | | | | $ | 12,280 | | $ | 12,520 |
| | | | | | | | | |
|
| |
|
|
| (i) | | Indicates a fair valued security which has not been valued utilizing an independent quote and which is valued pursuant to guidelines established by the Trustees. The aggregate value of fair valued securities is $1,801, which is 1.6% of net assets. |
8 | | Semi-Annual Report | 6.30.03 | | | See accompanying notes |
Notes to Financial Statements
June 30, 2003 (Unaudited)
1. Organization
The Long-Term U.S. Government Portfolio (the “Portfolio”) is a series of the PIMCO Variable Insurance Trust (the “Trust”). The Trust is registered under the Investment Company Act of 1940 (the “Act”), as amended, as an open-end investment company organized as a Delaware business trust on October 3, 1997. The Trust may offer up to two classes of shares: Institutional and Administrative. Each share class has identical voting rights (except that shareholders of a class have exclusive voting rights regarding any matter relating solely to that class of shares). Information presented in these financial statements pertains to the Institutional Class of the Trust. Certain detailed financial information for the Administrative Class is provided separately and is available upon request. The Trust is designed to be used as an investment vehicle by Separate Accounts of insurance companies that fund variable annuity contracts and variable life insurance policies and by qualified pension and retirement plans. The Portfolio commenced operations on April 30, 1999.
2. Significant Accounting Policies
The following is a summary of significant accounting policies consistently followed by the Trust in the preparation of its financial statements in conformity with accounting principles generally accepted in the United States of America. The preparation of financial statements in accordance with accounting principles generally accepted in the United States of America requires management to make estimates and assumptions that affect the reported amounts and disclosures in the financial statements. Actual results could differ from those estimates.
Security Valuation. Portfolio securities and other financial instruments for which market quotations are readily available are stated at market value. Market value is determined at the close of regular trading (normally, 4:00 p.m., Eastern Time) on the New York Stock Exchange on each day the New York Stock Exchange is open, or if no sales are reported, as is the case for most securities traded over-the-counter, the mean between representative bid and asked quotations obtained from a quotation reporting system or from established market makers. Fixed income securities, including those to be purchased under firm commitment agreements, are normally valued on the basis of quotes obtained from brokers and dealers or pricing services. Short-term investments, which mature in 60 days or less are valued at amortized cost, which approximates market value. Certain fixed income securities for which daily market quotations are not readily available may be valued, pursuant to guidelines established by the Board of Trustees, with reference to fixed income securities whose prices are more readily obtainable. Prices may be obtained from independent pricing services which use information provided by market makers or estimates of market values obtained from yield data relating to investments or securities with similar characteristics. The prices used by the Portfolio may differ from the value that would be realized if the securities were sold and the differences could be material to the financial statements.
Securities Transactions and Investment Income. Securities transactions are recorded as of the trade date. Securities purchased or sold on a when-issued or delayed delivery basis may be settled a month or more after the trade date. Realized gains and losses from securities sold are recorded on the identified cost basis. Dividend income is recorded on the ex-dividend date, except certain dividends from foreign securities where the ex-dividend date may have passed, are recorded as soon as the Portfolio is informed of the ex-dividend date. Interest income, adjusted for the accretion of discounts and amortization of premiums, is recorded on the accrual basis. Paydowns gains and losses on mortgage- and asset-backed securities are recorded as adjustments to interest income in the Statement of Operations.
Dividends and Distributions to Shareholders. Dividends from net investment income, if any, are declared on each day the Trust is open for business and are distributed to shareholders monthly. All dividends are reinvested in additional shares of the Portfolio. Net realized capital gains earned by the Portfolio, if any, will be distributed no less frequently than once each year.
Income dividends and capital gain distributions are determined in accordance with income tax regulations which may differ from accounting principles generally accepted in the United States of America. These differences are primarily due to differing treatments for such items as wash sales, foreign currency transactions, net operating losses and capital loss carryforwards.
Distributions classified as a tax basis return of capital, if any, are reflected in the accompanying Statements of Changes in Net Assets and have been reclassified to paid in capital. In addition, other amounts have been reclassified between undistributed net investment income, accumulated undistributed net realized gains or losses and/or paid in capital to more appropriately conform financial accounting to tax characterizations of dividend distributions.
Multiclass Operations. Each class offered by the Trust has equal rights as to assets. Income, non-class specific expenses, and realized and unrealized capital gains and losses are allocated to each class of shares based on the relative net assets of each class.
Federal Income Taxes. The Portfolio intends to qualify as a regulated investment company and distribute all of its taxable income and net realized gains, if applicable, to shareholders. Accordingly, no provision for Federal income taxes has been made.
6.30.03 | Semi-Annual Report | | 9 |
Financing Transactions. The Portfolio may enter into financing transactions consisting of the sale by the Portfolio of securities, together with a commitment to repurchase similar securities at a future date. The difference between the selling price and the future purchase price is an adjustment to interest income in the Statement of Operations. If the counterparty to whom the Portfolio sells the security becomes insolvent, the Portfolio’s right to repurchase the security may be restricted; the value of the security may change over the term of the financing transaction; and the return earned by the Portfolio with the proceeds of a financing transaction may not exceed transaction costs. The Portfolio will designate assets determined to be liquid by PIMCO or otherwise cover its obligations under financing transactions.
Futures Contracts. The Portfolio is authorized to enter into futures contracts. The Portfolio may use futures contracts to manage its exposure to the securities markets or to movements in interest rates and currency values. The primary risks associated with the use of futures contracts are imperfect correlation between the change in market value of the securities held by the Portfolio and the prices of futures contracts, the possibility of an illiquid market, and the inability of the counterparty to meet the terms of the contract. Futures contracts are valued based upon their quoted daily settlement prices. Upon entering into a futures contract, the Portfolio may be required to deposit with its custodian, in a segregated account in the name of the futures broker, an amount of cash or U.S. Government and Agency Obligations in accordance with the initial margin requirements of the broker or exchange. Futures contracts are marked to market daily and an appropriate payable or receivable for the change in value (“variation margin”) is recorded by the Portfolio. Gains or losses are recognized but not considered realized until the contracts expire or are closed. Futures contracts involve, to varying degrees, risk of loss in excess of the variation margin disclosed in the Statement of Assets and Liabilities.
Options Contracts. The Portfolio may write call and put options on futures, securities or currencies it owns or in which it may invest. Writing put options tends to increase the Portfolio’s exposure to the underlying instrument. Writing call options tends to decrease the Portfolio’s exposure to the underlying instrument. When the Portfolio writes a call or put option, an amount equal to the premium received is recorded as a liability and subsequently marked to market to reflect the current value of the option written. Payment received or made, if any, from writing options with premiums to be determined on a future date are reflected as such on the Statement of Assets and Liabilities. Premiums received from writing options which expire are treated as realized gains. Premiums received from writing options which are exercised or closed are added to the proceeds or offset against amounts paid on the underlying future, security or currency transaction to determine the realized gain or loss. The Portfolio as a writer of an option has no control over whether the underlying future, security or currency may be sold (call) or purchased (put) and as a result bears the market risk of an unfavorable change in the price of the future, security or currency underlying the written option. There is the risk the Portfolio may not be able to enter into a closing transaction because of an illiquid market.
The Portfolio may also purchase put and call options. Purchasing call options tends to increase the Portfolio’s exposure to the underlying instrument. Purchasing put options tends to decrease the Portfolio’s exposure to the underlying instrument. The Portfolio pays a premium which is included in the Portfolio’s Statement of Assets and Liabilities as an investment and subsequently marked to market to reflect the current value of the option. Premiums paid for purchasing options which expire are treated as realized losses. The risk associated with purchasing put and call options is limited to the premium paid. Premiums paid for purchasing options which are exercised or closed are added to the amounts paid or offset against the proceeds on the underlying future, security or currency transaction to determine the realized gain or loss.
Short Sales. The Portfolio has entered into short sales transactions during the fiscal year. A short sale is a transaction in which a Portfolio sells securities it does not own in anticipation of a decline in the market price of the securities. The Portfolio is obligated to deliver securities at the market price at the time the short position is closed. Possible losses from short sales may be unlimited, whereas losses from purchases cannot exceed the total amount invested.
Swap Agreements. The Portfolio may invest in swap agreements. A swap is an agreement to exchange the return generated by one instrument for the return generated by another instrument. The Portfolio may enter into interest rate, total return, forward swap spread lock and credit default swap agreements to manage its exposure to interest rates and credit risk. Interest rate swap agreements involve the exchange by the Portfolio with another party of their respective commitments to pay or receive interest, e.g., an exchange of floating rate payments for fixed rate payments with respect to a notional amount of principal. Total return swap agreements involve commitments to pay interest in exchange for a market-linked return, both based on notional amounts. To the extent the total return of the security or index underlying the transaction exceeds or falls short of the offsetting interest rate obligation, the Portfolio will receive a payment from or make a payment to the counterparty. Forward spread lock swap agreements involve commitments to pay or receive a settlement amount calculated as the difference between the swap spread and a fixed spread, multiplied by the notional amount times the duration of the swap. The swap spread is the difference between the benchmark swap rate (market rate) and the specific Treasury
10 | | Semi-Annual Report | 6.30.03 |
rate. In a credit default swap, one party makes a stream of payments to another party in exchange for the right to receive a specified return in the event of a default by a third party, typically corporate issues or sovereign issues of an emerging country, on its obligation. The Portfolio may use credit default swaps to provide a measure of protection against defaults of sovereign issuers (i.e., to reduce risk where the Portfolio owns or has exposure to the sovereign issuer) or to take an active long or short position with respect to the likelihood of a particular issuer’s default. Swaps are marked to market daily based upon quotations from market makers and vendors and the change in value, if any, is recorded as unrealized gain or loss in the Statement of Operations. Payments received or made at the beginning of the measurement period are reflected as such on the Statement of Assets and Liabilities. A liquidation payment received or made at the termination of the swap is recorded as realized gain or loss in the Statement of Operations. Net periodic payments are included as part of miscellaneous income on the Statement of Operations. Entering into these agreements involves, to varying degrees, elements of credit, market and documentation risk in excess of the amounts recognized on the Statement of Assets and Liabilities. Such risks involve the possibility that there will be no liquid market for these agreements, that the counterparty to the agreements may default on its obligation to perform or disagree as to the meaning of contractual terms in the agreements, and that there may be unfavorable changes in interest rates.
Delayed Delivery Transactions. The Portfolio may purchase or sell securities on a when-issued or delayed delivery basis. These transactions involve a commitment by the Portfolio to purchase or sell securities for a predetermined price or yield, with payment and delivery taking place beyond the customary settlement period. When delayed delivery purchases are outstanding, the Portfolio will set aside and maintain until the settlement date in a segregated account, liquid assets in an amount sufficient to meet the purchase price. When purchasing a security on a delayed delivery basis, the Portfolio assumes the rights and risks of ownership of the security, including the risk of price and yield fluctuations, and takes such fluctuations into account when determining its net asset value. The Portfolio may dispose of or renegotiate a delayed delivery transaction after it is entered into, and may sell when-issued securities before they are delivered, which may result in a capital gain or loss. When the Portfolio has sold a security on a delayed delivery basis, the Portfolio does not participate in future gains and losses with respect to the security.
Inflation-Indexed Bonds. Inflation-indexed bonds are fixed income securities whose principal value is periodically adjusted to the rate of inflation. The interest rate on these bonds is generally fixed at issuance at a rate lower than typical bonds. Over the life of an inflation-indexed bond, however, interest will be paid based on a principal value, which is adjusted for inflation. Any increase in the principal amount of an inflation-indexed bond will be included as interest income in the Statement of Operations, even though investors do not receive their principal until maturity.
Repurchase Agreements. The Portfolio may engage in repurchase transactions. Under the terms of a typical repurchase agreement, the Portfolio takes possession of an underlying debt obligation subject to an obligation of the seller to repurchase, and the Portfolio to resell, the obligation at an agreed-upon price and time. The market value of the collateral must be equal at all times to the total amount of the repurchase obligations, including interest. Generally, in the event of counterparty default, the Portfolio has the right to use the collateral to offset losses incurred.
3. Fees, Expenses, and Related Party Transactions
Investment Advisory Fee. Pacific Investment Management Company LLC (PIMCO) is a majority owned subsidiary partnership of Allianz Dresdner Asset Management of America L.P. (formerly PIMCO Advisors L.P.) and serves as investment adviser (the “Adviser”) to the Trust, pursuant to an investment advisory contract. The Adviser receives a monthly fee at an annual rate based on average daily net assets of the Portfolio. The Advisory Fee is charged at an annual rate of 0.25%.
Administration Fee. PIMCO serves as administrator (the “Administrator”) and provides administrative services to the Trust for which it receives a monthly administrative fee based on average daily net assets of the Portfolio. The Administration Fee is charged at the annual rate of 0.25%.
Servicing Fee. PIMCO Advisors Distributors LLC (“PAD”), is an indirect wholly-owned subsidiary of Allianz Dresdner Asset Management of America L.P. and serves as the distributor of the Trust’s shares. The Trust is permitted to reimburse PAD on a quarterly basis, out of the Administrative Class assets of the Portfolio in the amount of 0.15% on an annual basis of the average daily net assets of that class, for payments made to financial intermediaries that provide services in connection with the distribution of shares or administration of plans or programs that use Portfolio shares as their funding medium. The effective rate paid to PAD during the current fiscal year is 0.15%.
Expenses. The Portfolio is responsible for the following expenses: (i) salaries and other compensation of any of the Trust’s executive officers and employees who are not officers, directors, stockholders or employees of PIMCO or its subsidiaries or affiliates; (ii) taxes and governmental fees; (iii) brokerage fees and commissions and other portfolio transaction expenses; (iv) the cost of borrowing money, including interest expense; (v) fees and expenses of the Trustees who are not “interested persons” of PIMCO or
6.30.03 | Semi-Annual Report | | 11 |
the Trust, and any counsel retained exclusively for their benefit; (vi) extraordinary expenses, including costs of litigation and indemnification expenses; (vii) organization expenses and (viii) any expenses allocated or allocable to a specific class of shares, which include service fees payable with respect to the Administrative Class shares and may include certain other expenses as permitted by the Trust’s Multiple Class Plan adopted pursuant to Rule 18f-3 under the Act and subject to review and approval by the Trustees. The ratio of expenses to average net assets per share class, as disclosed in the Financial Highlights, may differ from the annual Portfolio operating expenses per share class as disclosed in the Prospectus for the reasons set forth above. PIMCO has agreed to waive a portion of its administrative fees to the extent that the payment of the Portfolio’s pro rata share of Trustees’ fees causes the actual expense ratio to rise above the rates disclosed in the current prospectus plus 0.49 basis points as set forth below (calculated as a percentage of the Portfolio’s average daily net assets attributable to each class):
| | | Institutional
Class
| | | Administrative
Class
| |
Long-Term U.S. Government Portfolio | | 0.50 | % | | 0.65 | % |
PIMCO may be reimbursed for these waived amounts in future periods. The Trust pays no compensation directly to any Trustee or any other officer who is affiliated with the Administrator, all of whom receive renumeration for their services to the Trust from the Administrator or its affiliates.
Each unaffiliated Trustee receives an annual retainer of $4,000, plus $1,500 for each Board of Trustees meeting attended in person and $250 for each meeting attended telephonically, plus reimbursement of related expenses. In addition, each committee chair receives an additional annual retainer of $500. These expenses are allocated on a pro-rata basis to each Portfolio of the Trust according to its respective net assets.
4. Purchases and Sales of Securities
Purchases and sales of securities (excluding short-term investments) for the period ended June 30, 2003 were as follows (amounts in thousands):
| | | U.S Government/Agency
| | All Other
|
| | | Purchases
| | Sales
| | Purchases
| | Sales
|
Long-Term U.S. Government Portfolio | | $ | 210,957 | | $ | 152,109 | | $ | 25,870 | | $ | 22,186 |
5. Transactions in Written Call and Put Options
Transactions in written call and put options were as follows (amounts in thousands):
| | | Long-Term U.S.
Government Portfolio
| |
| | | | | Premium
| |
Balance at 12/31/2002 | | | | $ | 105 | |
Sales | | | | | 253 | |
Closing Buys | | | | | (49 | ) |
Expirations | | | | | (89 | ) |
Exercised | | | | | (13 | ) |
| | | | |
|
|
|
Balance at 06/30/2003 | | | | $ | 207 | |
| | | | |
|
|
|
6. Federal Income Tax Matters
At June 30, 2003, the aggregate cost of investments was the same for federal income tax and financial statement purposes. The net unrealized appreciation (depreciation) of investments securities for federal income tax purposes is as follows (amounts in thousands):
| | | Aggregate Gross
Unrealized
Appreciation
| | Aggregate Gross
Unrealized
(Depreciation)
| | | Net Unrealized
Appreciation
|
Long-Term U.S. Government Portfolio | | $ | 1,867 | | $ | (870 | ) | | $ | 997 |
12 | | Semi-Annual Report | 6.30.03 |
7. Shares of Beneficial Interest
The Trust may issue an unlimited number of shares of beneficial interest with a $.0001 par value. Changes in shares of beneficial interest were as follows (shares and amounts in thousands):
| | | Long-Term U.S. Government Portfolio
| |
| | | Six Months Ended
06/30/2003
| | | Year Ended
12/31/2002
| |
| | | Shares
| | | Amount
| | | Shares
| | | Amount
| |
Receipts for shares sold | | | | | | | | | | | | | | |
Institutional Class | | 0 | | | $ | 0 | | | 0 | | | $ | 0 | |
Administrative Class | | 2,463 | | | | 27,569 | | | 5,886 | | | | 64,003 | |
Issued as reinvestment of distributions | | | | | | | | | | | | | | |
Institutional Class | | 0 | | | | 0 | | | 0 | | | | 1 | |
Administrative Class | | 146 | | | | 1,654 | | | 568 | | | | 6,177 | |
Cost of shares redeemed | | | | | | | | | | | | | | |
Institutional Class | | 0 | | | | 0 | | | 0 | | | | 0 | |
Administrative Class | | (1,445 | ) | | | (16,269 | ) | | (1,353 | ) | | | (14,603 | ) |
| | |
|
| |
|
|
| |
|
| |
|
|
|
Net increase resulting from Portfolio share transactions | | 1,164 | | | $ | 12,954 | | | 5,101 | | | $ | 55,578 | |
| | |
|
| |
|
|
| |
|
| |
|
|
|
The following schedule shows the number of shareholders each owning 5% or more of the Portfolio and the total percentage of the Portfolio held by such shareholders:
| | | Number
| | % of Portfolio Held
|
Long-Term U.S. Government Portfolio | | | | |
Institutional Class | | 1 | | 100 |
Administrative Class | | 2 | | 90 |
6.30.03 | Semi-Annual Report | | 13 |
Trustees and Officers
Brent R. Harris, Chairman and Trustee
R. Wesley Burns, President and Trustee
E. Philip Cannon, Trustee
Vern O. Curtis, Trustee
J. Michael Hagan, Trustee
William J. Popejoy, Trustee
Garlin G. Flynn, Secretary
John P. Hardaway, Treasurer
Investment Adviser and Administrator
Pacific Investment Management Company LLC
840 Newport Center Drive
Newport Beach, California 92660
Transfer Agent
National Financial Data Services
330 W. 9th Street, 4th Floor
Kansas City, Missouri 64105
Custodian
State Street Bank & Trust Company
801 Pennsylvania
Kansas City, Missouri 64105
Counsel
Dechert LLP
1775 I Street, N.W.
Washington, D.C. 20006
Independent Accountants
PricewaterhouseCoopers LLP
1055 Broadway
Kansas City, Missouri 64105
PIMCO VARIABLE INSURANCE TRUST
This report is submitted for the general information of the shareholders of the PIMCO Variable Insurance Trust. It is not authorized for distribution to prospective investors unless accompanied or preceded by an effective prospectus for the PIMCO Variable Insurance Trust, which contains information covering its investment policies as well as other pertinent information.
All Funds distributed by PIMCO ADVISORS DISTRIBUTORS LLC, member NASD
840 NEWPORT CENTER DRIVE
NEWPORT BEACH, CA 92660
800.927.4648
WWW.PIMCOADVISORS.COM
WWW.PIMCO.COM
| P I M C O |
| PIMCO VARIABLE INSURANCE TRUST |
| MONEY MARKET PORTFOLIO |
| INSTITUTIONAL CLASS |
|
| SEMI-ANNUAL REPORT |
| June 30, 2003 |
| | | Fund
Summary
| | Schedule of
Investments
|
Money Market Portfolio (Institutional Class) | | 2 | | 7 |
Chairman’s Letter
Dear PIMCO Variable Insurance Trust Shareholder:
Financial assets gained during the first half of 2003 amid a revival of risk appetites as anxiety about the war in Iraq faded. Assets that generally benefit from economic growth, such as stocks, corporate bonds and emerging market debt, fared the best year-to-date as investors returned to these sectors in anticipation of a recovery in the second half of 2003. Reflationary forces that investors expected to fuel a rebound included federal tax cuts and a weak dollar, as well as low borrowing rates that eased the burden of high personal and corporate indebtedness. Low mortgage rates kept refinancings booming in the second quarter and put more money in consumers’ pockets.
U.S. Treasuries lagged their riskier counterparts but still enjoyed a modest rally. Yields fell to levels not seen in 45 years early in the second quarter before bouncing off their lows in June as hopes for recovery increased. The yield on the benchmark 10-year Treasury closed the six-month period 0.30% lower to 3.51%, after nearing 3% earlier in the period. Buyers were encouraged that inflation would remain tame amid low capacity utilization and weak employment growth. Asian central banks bought U.S. Treasuries to limit the rise in their currencies versus the dollar in an effort to protect their export industries. In June, the Federal Reserve cut the federal funds rate by 0.25% to 1%, its 13th easing since 2001, in an effort to boost the economy and ward off deflation. Although the cut was less than expected, the Fed suggested that rates would stay low until deflation risks abated.
On the following pages you will find specific details as to the Portfolio’s total return investment performance and a discussion of those factors that affected performance.
We appreciate the trust you have placed in us, and we will continue to focus our efforts to meet your investment needs.
Sincerely,
Brent R. Harris
Chairman
July 31, 2003
6.30.03 | Semi-Annual Report | | 1 |
Money Market Portfolio
TOTAL RETURN INVESTMENT PERFORMANCE For the period ended June 30, 2003
| | | 1 Year | | | Since Inception* | |
Money Market Portfolio Institutional Class | | 1.22 | % | | 3.30 | % |
Citigroup 3-Month Treasury Bill Index | | 1.41 | % | | — | |
| * | | Annualized (All Portfolio returns are net of fees and expenses) |
CUMULATIVE RETURNS THROUGH JUNE 30, 2003
$10,000 invested at inception
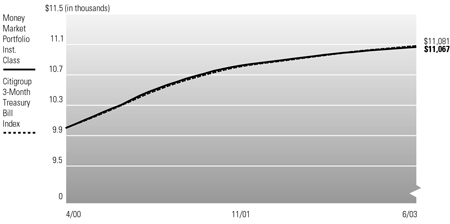
Past performance is no guarantee of future results. Investment return and principal value will fluctuate so that Portfolio shares, when redeemed, may be worth more or less than their original cost. The line graph above assumes the investment of $10,000 on 5/01/2000, the first full month following the Portfolio’s Institutional Class inception on 4/10/2000, compared to the Citigroup 3-Month Treasury Bill Index, an unmanaged market index. It is not possible to invest directly in the Index. Prior to 4/7/03 the Citigroup 3-Month Treasury Bill Index was known as the Salomon Smith Barney 3-Month Treasury Bill Index. An investment in the Money Market Portfolio is neither insured nor guaranteed by the Federal Deposit Insurance Corporation or any other U.S. Government Agency. Although the Portfolio seeks to preserve the value of your investment at $1.00 per share, it is possible to lose money by investing in the Portfolio. If there is a material difference between the quoted total return and the quoted current yield, the yield quotation more closely reflects the current earnings of the Money Market Portfolio than the total return quotation.
PORTFOLIO INSIGHTS
| • | | The Money Market Portfolio seeks to achieve its investment objective by investing at least 95% of its total assets in a diversified portfolio of money market securities that are in the highest rating category for short-term obligations. |
| • | | The total return performance of the Portfolio was 0.50% for the six-month period ended June 30, 2003, versus a return of 0.59% for its benchmark, the Citigroup 3-Month Treasury Bill Index. |
| • | | Already low interest rates plunged to levels not seen in 45 years as investors had anticipated that inflation would remain tame. |
| • | | The Portfolio’s average duration was maintained at about one-month, providing for ample liquidity and limiting the price effects from increasing yields. |
| • | | The 3-month Treasury sector outperformed short maturity securities from other sectors. |
| • | | U.S.-issued high quality (A1/P1) commercial paper was emphasized due to attractive yields, limited interest rate sensitivity, and low credit exposure. |
| • | | The Investment Adviser used high quality U.S. agency and shorter-term, fixed and floating rate U.S. corporates to boost portfolio income, while limiting credit risk. |
| • | | Seven-day and thirty-day SEC yields were 0.83% and 0.91%, respectively, at the end of the period. These yields were competitive with yields on similar duration portfolios. |
2 | | Semi-Annual Report | 6.30.03 |
Financial Highlights
Money Market Portfolio (Institutional Class)
| Selected Per Share Data for the Year or Period Ended: | | 06/30/2003 +
| | | 12/31/2002
| | | 12/31/2001
| | | 04/10/2000-12/31/2000
| |
Net asset value beginning of period | | $ | 1.00 | | | $ | 1.00 | | | $ | 1.00 | | | $ | 1.00 | |
Net investment income (a) | | | 0.01 | | | | 0.02 | | | | 0.04 | | | | 0.04 | |
Total income from investment operations | | | 0.01 | | | | 0.02 | | | | 0.04 | | | | 0.04 | |
Dividends from net investment income | | | (0.01 | ) | | | (0.02 | ) | | | (0.04 | ) | | | (0.04 | ) |
Total distributions | | | (0.01 | ) | | | (0.02 | ) | | | (0.04 | ) | | | (0.04 | ) |
Net asset value end of period | | $ | 1.00 | | | $ | 1.00 | | | $ | 1.00 | | | $ | 1.00 | |
Total return | | | 0.50 | % | | | 1.56 | % | | | 3.99 | % | | | 4.60 | % |
Net assets end of period (000s) | | $ | 12 | | | $ | 11 | | | $ | 11 | | | $ | 80 | |
Ratio of expenses to average net assets | | | 0.35 | %* | | | 0.35 | % | | | 0.35 | % | | | 0.35 | %* |
Ratio of net investment income to average net assets | | | 0.99 | %* | | | 1.58 | % | | | 4.59 | % | | | 6.02 | %* |
Portfolio turnover rate | | | N/A | | | | N/A | | | | N/A | | | | N/A | |
| (a) | | Per share amounts based on average number of shares outstanding during the period. |
See accompanying notes | | | 6.30.03 | Semi-Annual Report | | 3 |
Statement of Assets and Liabilities
Money Market Portfolio
June 30, 2003 (Unaudited)
Amounts in thousands, except per share amounts
Assets: | | | | |
Investments, at value | | $ | 26,779 | |
Cash | | | 1 | |
Receivable for investments sold | | | 1,029 | |
Receivable for Portfolio shares sold | | | 21 | |
Interest receivable | | | 74 | |
| | |
|
|
|
| | | | 27,904 | |
| | |
|
|
|
Liabilities: | | | | |
Dividends payable | | | 1 | |
Accrued investment advisory fee | | | 4 | |
Accrued administration fee | | | 5 | |
Accrued servicing fee | | | 3 | |
| | |
|
|
|
| | | | 13 | |
| | |
|
|
|
Net Assets | | $ | 27,891 | |
| | |
|
|
|
Net Assets Consist of: | | | | |
Paid in capital | | $ | 27,891 | |
Undistributed net investment income | | | 6 | |
Accumulated undistributed net realized (loss) | | | (6 | ) |
| | |
|
|
|
| | | $ | 27,891 | |
| | |
|
|
|
Net Assets: | | | | |
Institutional Class | | $ | 12 | |
Administrative Class | | | 27,879 | |
Shares Issued and Outstanding: | | | | |
Institutional Class | | | 12 | |
Administrative Class | | | 27,879 | |
Net Asset Value and Redemption Price Per Share (Net Assets Per Share Outstanding) | | | | |
Institutional Class | | $ | 1.00 | |
Administrative Class | | | 1.00 | |
Cost of Investments Owned | | $ | 26,779 | |
4 | | Semi-Annual Report | 6.30.03 | | | See accompanying notes |
Statement of Operations
Money Market Portfolio
For the six months ended June 30, 2003 (Unaudited)
Amounts in thousands
Investment Income: | | | |
Interest | | $ | 182 |
| | |
|
|
Total Income | | | 182 |
| | |
|
|
Expenses: | | | |
Investment advisory fees | | | 20 |
Administration fees | | | 27 |
Distribution and/or servicing fees - Administrative Class | | | 20 |
| | |
|
|
Total Expenses | | | 67 |
| | |
|
|
Net Investment Income | | | 115 |
| | |
|
|
Net Realized Gain: | | | |
Net realized gain on investments | | | 3 |
Net Gain | | | 3 |
| | |
|
|
Net Increase in Assets Resulting from Operations | | $ | 118 |
| | |
|
|
See accompanying notes | | | 6.30.03 | Semi-Annual Report | | 5 |
Statements of Changes in Net Assets
Money Market Portfolio
Amounts in thousands
| Increase (Decrease) in Net Assets from: | | Six Months Ended
June 30, 2003
| | | Year Ended
December 31, 2002
| |
| | | (Unaudited) | | | | |
Operations: | | | | | | | | |
Net investment income | | $ | 115 | | | $ | 291 | |
Net realized gain | | | 3 | | | | 0 | |
| | |
|
|
| |
|
|
|
Net increase resulting from operations | | | 118 | | | | 291 | |
| | |
|
|
| |
|
|
|
Distributions to Shareholders: | | | | | | | | |
From net investment income | | | | | | | | |
Institutional Class | | | 0 | | | | 0 | |
Administrative Class | | | (118 | ) | | | (291 | ) |
| | |
|
|
| |
|
|
|
Total Distributions | | | (118 | ) | | | (291 | ) |
| | |
|
|
| |
|
|
|
Portfolio Share Transactions: | | | | | | | | |
Receipts for shares sold | | | | | | | | |
Institutional Class | | | 1 | | | | 0 | |
Administrative Class | | | 8,976 | | | | 38,288 | |
Issued as reinvestment of distributions | | | | | | | | |
Institutional Class | | | 0 | | | | 0 | |
Administrative Class | | | 118 | | | | 291 | |
Cost of shares redeemed | | | | | | | | |
Institutional Class | | | 0 | | | | 0 | |
Administrative Class | | | (7,065 | ) | | | (25,589 | ) |
| | |
|
|
| |
|
|
|
Net increase resulting from Portfolio share transactions | | | 2,030 | | | | 12,990 | |
| | |
|
|
| |
|
|
|
Total Increase in Net Assets | | | 2,030 | | | | 12,990 | |
| | |
|
|
| |
|
|
|
Net Assets: | | | | | | | | |
Beginning of period | | | 25,861 | | | | 12,871 | |
End of period* | | $ | 27,891 | | | $ | 25,861 | |
*Including undistributed net investment income of: | | $ | 6 | | | $ | 9 | |
6 | | Semi-Annual Report | 6.30.03 | | | See accompanying notes |
Schedule of Investments
Money Market Portfolio
June 30, 2003 (Unaudited)
| | | Principal
Amount
(000s)
| | Value
(000s)
|
SHORT-TERM INSTRUMENTS 96.0% | | | | | | |
Commercial Paper 84.7% | | | | | | |
ABN AMRO Mortgage Corp. | | | | | | |
1.040% due 07/16/2003 | | $ | 400 | | $ | 400 |
Australia and New Zealand Banking Group Ltd. | | | | | | |
1.330% due 03/05/2004 | | | 300 | | | 300 |
Bell Atlantic New Jersey, Inc. | | | | | | |
5.875% due 02/01/2004 | | | 350 | | | 359 |
Bristol-Myers Squibb Co. | | | | | | |
0.920% due 10/28/2003 | | | 400 | | | 399 |
CBA Finance, Inc. | | | | | | |
1.230% due 07/23/2003 | | | 900 | | | 899 |
Danske Corp. | | | | | | |
1.280% due 07/10/2003 | | | 200 | | | 200 |
Dupont De Nemours & Co. | | | | | | |
8.125% due 03/15/2004 | | | 330 | | | 345 |
Fannie Mae | | | | | | |
1.050% due 07/31/2003 | | | 1,600 | | | 1,599 |
1.170% due 08/27/2003 | | | 200 | | | 200 |
1.175% due 08/27/2003 | | | 300 | | | 299 |
0.990% due 10/22/2003 | | | 3,700 | | | 3,688 |
5.625% due 05/14/2004 | | | 400 | | | 415 |
Federal Home Loan Bank | | | | | | |
1.010% due 07/01/2003 | | | 5,100 | | | 5,100 |
5.195% due 01/29/2004 | | | 165 | | | 169 |
4.750% due 06/28/2004 | | | 400 | | | 415 |
Freddie Mac | | | | | | |
3.750% due 04/15/2004 | | | 900 | | | 918 |
General Electric Capital Corp. | | | | | | |
1.220% due 07/09/2003 | | | 200 | | | 200 |
1.140% due 07/10/2003 | | | 600 | | | 600 |
6.267% due 07/23/2003 | | | 300 | | | 301 |
HBOS Treasury Services PLC | | | | | | |
1.250% due 07/16/2003 | | | 500 | | | 500 |
0.970% due 08/27/2003 | | | 100 | | | 100 |
1.401% due 01/16/2004 | | | 500 | | | 500 |
Lloyds Bank PLC | | | | | | |
1.250% due 07/10/2003 | | | 100 | | | 100 |
National Westminster Bank PLC | | | | | | |
9.375% due 11/15/2003 | | | 500 | | | 515 |
Nestle Capital Corp. | | | | | | |
1.195% due 08/01/2003 | | | 500 | | | 499 |
Oesterreichische Kontrollbank AG | | | | | | |
4.625% due 11/03/2003 | | | 100 | | | 101 |
Procter & Gamble Co. | | | | | | |
5.250% due 09/15/2003 | | | 300 | | | 302 |
Province of Alberta | | | | | | |
4.875% due 10/29/2003 | | | 250 | | | 253 |
Queensland Treasury Corp. | | | | | | |
1.170% due 07/11/2003 | | | 800 | | | 800 |
Rabobank Nederland NV | | | | | | |
1.230% due 07/07/2003 | | | 600 | | | 600 |
Royal Bank of Scotland PLC | | | | | | |
1.255% due 07/02/2003 | | | 100 | | | 100 |
1.225% due 07/09/2003 | | | 600 | | | 600 |
Svenska Handelsbank, Inc. | | | | | | |
1.250% due 07/01/2003 | | | 300 | | | 300 |
Toyota Motor Credit Corp. | | | | | | |
5.625% due 11/13/2003 | | | 175 | | | 178 |
Wells Fargo Financial, Inc. | | | | | | |
7.250% due 07/14/2003 | | | 460 | | | 461 |
5.375% due 09/30/2003 | | | 300 | | | 303 |
Westpac Trust Securities NZ Ltd. | | | | | | |
1.250% due 07/10/2003 | | | 200 | | | 200 |
1.200% due 08/27/2003 | | | 400 | | | 399 |
| | | | | |
|
|
| | | | | | | 23,617 |
| | | | | |
|
|
Repurchase Agreement 11.3% | | | | | | |
State Street Bank | | | | | | |
0.800% due 07/01/2003 | | | 3,162 | | | 3,162 |
(Dated 06/30/2003. Collateralized by Fannie Mae 3.125% due 10/01/2003 valued at $3,227. Repurchase proceeds are $3,162.) | | | | | | |
| | | | | |
|
|
Total Short-Term Instruments
(Cost $26,779) | | | | | | 26,779 |
| | | | | |
|
|
Total Investments 96.0%
(Cost $26,779) | | | | | $ | 26,779 |
Other Assets and Liabilities (Net) 4.0% | | | | | | 1,112 |
| | | | | |
|
|
Net Assets 100.0% | | | | | $ | 27,891 |
| | | | | |
|
|
See accompanying notes | | | 6.30.03 | Semi-Annual Report | | 7 |
Notes to Financial Statements
June 30, 2003 (Unaudited)
1. Organization
The Money Market Portfolio (the “Portfolio”) is a series of the PIMCO Variable Insurance Trust (the “Trust”). The Trust is registered under the Investment Company Act of 1940 (the “Act”), as amended, as an open-end investment company organized as a Delaware business trust on October 3, 1997. The Trust may offer up to two classes of shares: Institutional and Administrative. Each share class has identical voting rights (except that shareholders of a class have exclusive voting rights regarding any matter relating solely to that class of shares). Information presented in these financial statements pertains to the Institutional Class of the Trust. Certain detailed financial information for the Administrative Class is provided separately and is available upon request. The Trust is designed to be used as an investment vehicle by Separate Accounts of insurance companies that fund variable annuity contracts and variable life insurance policies and by qualified pension and retirement plans. The Portfolio commenced operations on September 30, 1999.
2. Significant Accounting Policies
The following is a summary of significant accounting policies consistently followed by the Trust in the preparation of its financial statements in conformity with accounting principles generally accepted in the United States of America. The preparation of financial statements in accordance with accounting principles generally accepted in the United States of America requires management to make estimates and assumptions that affect the reported amounts and disclosures in the financial statements. Actual results could differ from those estimates.
Security Valuation. Portfolio securities held by the Portfolio are valued at amortized cost, which approximates current market value. When valuations are not readily available, securities are valued at fair value as determined in accordance with procedures adopted by the Board of Trustees.
Securities Transactions and Investment Income. Securities transactions are recorded as of the trade date. Securities purchased or sold on a when-issued or delayed delivery basis may be settled a month or more after the trade date. Realized gains and losses from securities sold are recorded on the identified cost basis. Dividend income is recorded on the ex-dividend date. Interest income, adjusted for the accretion of discounts and amortization of premiums, is recorded on the accrual basis. Paydowns gains and losses on mortgage- and asset-backed securities are recorded as adjustments to interest income in the Statement of Operations.
Dividends and Distributions to Shareholders. Dividends from net investment income, if any, are declared on each day the Trust is open for business and are distributed to shareholders monthly. All dividends are reinvested in additional shares of the Portfolio. Net realized capital gains earned by the Portfolio, if any, will be distributed no less frequently than once each year.
Income dividends and capital gain distributions are determined in accordance with income tax regulations which may differ from accounting principles generally accepted in the United States of America. These differences are primarily due to differing treatments for such items as wash sales, foreign currency transactions, net operating losses and capital loss carryforwards.
Distributions classified as a tax basis return of capital, if any, are reflected in the accompanying Statements of Changes in Net Assets and have been reclassified to paid in capital. In addition, other amounts have been reclassified between undistributed net investment income, accumulated undistributed net realized gains or losses and/or paid in capital to more appropriately conform financial accounting to tax characterizations of dividend distributions.
Multiclass Operations. Each class offered by the Trust has equal rights as to assets. Income, non-class specific expenses, and realized and unrealized capital gains and losses are allocated to each class of shares based on the relative net assets of each class.
Federal Income Taxes. The Portfolio intends to qualify as a regulated investment company and distribute all of its taxable income and net realized gains, if applicable, to shareholders. Accordingly, no provision for Federal income taxes has been made.
Repurchase Agreements. The Portfolio may engage in repurchase transactions. Under the terms of a typical repurchase agreement, the Portfolio takes possession of an underlying debt obligation subject to an obligation of the seller to repurchase, and the Portfolio to resell, the obligation at an agreed-upon price and time. The market value of the collateral must be equal at all times to the total amount of the repurchase obligations, including interest. Generally, in the event of counterparty default, the Portfolio has the right to use the collateral to offset losses incurred.
3. Fees, Expenses, and Related Party Transactions
Investment Advisory Fee. Pacific Investment Management Company LLC (PIMCO) is a majority owned subsidiary partnership of Allianz Dresdner Asset Management of America L.P. (formerly PIMCO Advisors L.P.) and serves as investment adviser (the “Adviser”) to the Trust, pursuant to an investment advisory contract. The Adviser receives a monthly fee at an annual rate based on average daily net assets of the Portfolio. The Advisory Fee is charged at an annual rate of 0.15%.
Administration Fee. PIMCO serves as administrator (the “Administrator”) and provides administrative services to the Trust for which it receives a monthly administrative fee based on average daily net assets of the Portfolio. The Administration Fee is charged at the annual rate of 0.20%.
8 | | Semi-Annual Report | 6.30.03 |
Servicing Fee. PIMCO Advisors Distributors LLC (“PAD”), is an indirect wholly-owned subsidiary of Allianz Dresdner Asset Management of America L.P. and serves as the distributor of the Trust’s shares. The Trust is permitted to reimburse PAD on a quarterly basis, out of the Administrative Class assets of the Portfolio in the amount of 0.15% on an annual basis of the average daily net assets of that class, for payments made to financial intermediaries that provide services in connection with the distribution of shares or administration of plans or programs that use Portfolio shares as their funding medium. The effective rate paid to PAD during the current fiscal year is 0.15%.
Expenses. The Portfolio is responsible for the following expenses: (i) salaries and other compensation of any of the Trust’s executive officers and employees who are not officers, directors, stockholders or employees of PIMCO or its subsidiaries or affiliates; (ii) taxes and governmental fees; (iii) brokerage fees and commissions and other portfolio transaction expenses; (iv) the cost of borrowing money, including interest expense; (v) fees and expenses of the Trustees who are not “interested persons” of PIMCO or the Trust, and any counsel retained exclusively for their benefit; (vi) extraordinary expenses, including costs of litigation and indemnification expenses; (vii) organization expenses and (viii) any expenses allocated or allocable to a specific class of shares, which include service fees payable with respect to the Administrative Class shares and may include certain other expenses as permitted by the Trust’s Multiple Class Plan adopted pursuant to Rule 18f-3 under the Act and subject to review and approval by the Trustees. The ratio of expenses to average net assets per share class, as disclosed in the Financial Highlights, may differ from the annual Portfolio operating expenses per share class as disclosed in the Prospectus for the reasons set forth above. PIMCO has agreed to waive a portion of its administrative fees to the extent that the payment of the Portfolio’s pro rata share of Trustees’ fees causes the actual expense ratio to rise above the rates disclosed in the current prospectus plus 0.49 basis points as set forth below (calculated as a percentage of the Portfolio’s average daily net assets attributable to each class):
| | | Institutional
Class
| | | Administrative
Class
| |
Money Market Portfolio | | 0.35 | % | | 0.50 | % |
PIMCO may be reimbursed for these waived amounts in future periods. The Trust pays no compensation directly to any Trustee or any other officer who is affiliated with the Administrator, all of whom receive renumeration for their services to the Trust from the Administrator or its affiliates.
Each unaffiliated Trustee receives an annual retainer of $4,000, plus $1,500 for each Board of Trustees meeting attended in person and $250 for each meeting attended telephonically, plus reimbursement of related expenses. In addition, each committee chair receives an additional annual retainer of $500. These expenses are allocated on a pro-rata basis to each Portfolio of the Trust according to its respective net assets.
4. Shares of Beneficial Interest
The Trust may issue an unlimited number of shares of beneficial interest with a $.0001 par value. Changes in shares of beneficial interest were as follows (shares and amounts in thousands):
| | | Money Market Portfolio
| |
| | | Six Months Ended
06/30/2003
| | | Year Ended
12/31/2002
| |
| | | Shares
| | | Amount
| | | Shares
| | | Amount
| |
Receipts for shares sold | | | | | | | | | | | | | | |
Institutional Class | | 1 | | | $ | 1 | | | 0 | | | $ | 0 | |
Administrative Class | | 8,976 | | | | 8,976 | | | 38,288 | | | | 38,288 | |
Issued as reinvestment of distributions | | | | | | | | | | | | | | |
Institutional Class | | 0 | | | | 0 | | | 0 | | | | 0 | |
Administrative Class | �� | 118 | | | | 118 | | | 291 | | | | 291 | |
Cost of shares redeemed | | | | | | | | | | | | | | |
Institutional Class | | 0 | | | | 0 | | | 0 | | | | 0 | |
Administrative Class | | (7,065 | ) | | | (7,065 | ) | | (25,589 | ) | | | (25,589 | ) |
| | |
|
| |
|
|
| |
|
| |
|
|
|
Net increase resulting from Portfolio share transactions | | 2,030 | | | $ | 2,030 | | | 12,990 | | | $ | 12,990 | |
| | |
|
| |
|
|
| |
|
| |
|
|
|
The following schedule shows the number of shareholders each owning 5% or more of the Portfolio and the total percentage of the Portfolio held by such shareholders:
| | | Number
| | % of Portfolio
Held
|
Money Market Portfolio | | | | |
Institutional Class | | 1 | | 100 |
Administrative Class | | 1 | | 99 |
6.30.03 | Semi-Annual Report | | 9 |
Trustees and Officers
Brent R. Harris, Chairman and Trustee
R. Wesley Burns, President and Trustee
E. Philip Cannon, Trustee
Vern O. Curtis, Trustee
J. Michael Hagan, Trustee
William J. Popejoy, Trustee
Garlin G. Flynn, Secretary
John P. Hardaway, Treasurer
Investment Adviser and Administrator
Pacific Investment Management Company LLC
840 Newport Center Drive
Newport Beach, California 92660
Transfer Agent
National Financial Data Services
330 W. 9th Street, 4th Floor
Kansas City, Missouri 64105
Custodian
State Street Bank & Trust Company
801 Pennsylvania
Kansas City, Missouri 64105
Counsel
Dechert LLP
1775 I Street, N.W.
Washington, D.C. 20006
Independent Accountants
PricewaterhouseCoopers LLP
1055 Broadway
Kansas City, Missouri 64105
PIMCO VARIABLE INSURANCE TRUST
This report is submitted for the general information of the shareholders of the PIMCO Variable Insurance Trust. It is not authorized for distribution to prospective investors unless accompanied or preceded by an effective prospectus for the PIMCO Variable Insurance Trust, which contains information covering its investment policies as well as other pertinent information.
All Funds distributed by PIMCO ADVISORS DISTRIBUTORS LLC, member NASD
840 NEWPORT CENTER DRIVE
NEWPORT BEACH , CA 92660
800.927.4648
WWW.PIMCOADVISORS.COM
WWW.PIMCO.COM
| P I M C O |
| PIMCO VARIABLE INSURANCE TRUST |
| REAL RETURN PORTFOLIO |
| INSTITUTIONAL CLASS |
|
| SEMI-ANNUAL REPORT |
| June 30, 2003 |
| | | Fund Summary
| | Schedule of Investments
|
Real Return Portfolio (Institutional Class) | | 2 | | 8 |
Chairman’s Letter
Dear PIMCO Variable Insurance Trust Shareholder:
Financial assets gained during the first half of 2003 amid a revival of risk appetites as anxiety about the war in Iraq faded. Assets that generally benefit from economic growth, such as stocks, corporate bonds and emerging market debt, fared the best year-to-date as investors returned to these sectors in anticipation of a recovery in the second half of 2003. Reflationary forces that investors expected to fuel a rebound included federal tax cuts and a weak dollar, as well as low borrowing rates that eased the burden of high personal and corporate indebtedness. Low mortgage rates kept refinancings booming in the second quarter and put more money in consumers’ pockets.
U.S. Treasuries lagged their riskier counterparts but still enjoyed a modest rally. Yields fell to levels not seen in 45 years early in the second quarter before bouncing off their lows in June as hopes for recovery increased. The yield on the benchmark 10-year Treasury closed the six-month period 0.30% lower to 3.51%, after nearing 3% earlier in the period. Buyers were encouraged that inflation would remain tame amid low capacity utilization and weak employment growth. Asian central banks bought U.S. Treasuries to limit the rise in their currencies versus the dollar in an effort to protect their export industries. In June, the Federal Reserve cut the federal funds rate by 0.25% to 1%, its 13th easing since 2001, in an effort to boost the economy and ward off deflation. Although the cut was less than expected, the Fed suggested that rates would stay low until deflation risks abated.
On the following pages you will find specific details as to the Portfolio’s total return investment performance and a discussion of those factors that affected performance.
We appreciate the trust you have placed in us, and we will continue to focus our efforts to meet your investment needs.
Sincerely,
Brent R. Harris
Chairman
July 31, 2003
6.30.03 | Semi-Annual Report | | 1 |
Real Return Portfolio
TOTAL RETURN INVESTMENT PERFORMANCE For the period ended June 30, 2003
| | | 1 Year | | | Since Inception* | |
Real Return Portfolio Institutional Class | | 17.24 | % | | 13.52 | % |
Lehman Brothers Global Real: U.S. TIPS Index | | 15.39 | % | | — | |
| * | | Annualized (All Portfolio returns are net of fees and expenses) |
CUMULATIVE RETURNS THROUGH JUNE 30, 2003
$10,000 invested at inception
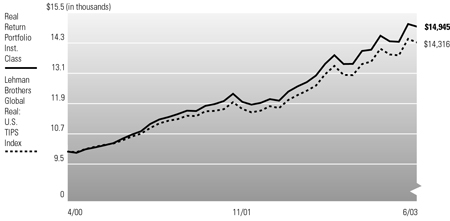
Past performance is no guarantee of future results. Investment return and principal value will fluctuate so that Portfolio shares, when redeemed, may be worth more or less than their original cost. The line graph above assumes the investment of $10,000 on 5/01/2000, the first full month following the Portfolio’s Institutional Class inception on 4/10/2000, compared to the Lehman Brothers Global Real: U.S. TIPS Index, an unmanaged market index, formerly the Lehman Brothers Inflation Linked Treasury Index. It is not possible to invest directly in the Index. The Portfolio may invest in foreign securities which involve potentially higher risks including foreign currency fluctuations and political or economic uncertainty. These risks may be enhanced when investing in emerging market securities. Treasury Inflation Protection Securities (TIPS) are guaranteed by the U.S. government (for timely payment of principal and interest), however, the shares of the Portfolio are not.
PORTFOLIO INSIGHTS
| • | | The Real Return Portfolio seeks to achieve its investment objective by investing under normal circumstances at least 65% of its total assets in inflation-indexed bonds of varying maturities issued by the U.S. and non-U.S. governments, their agencies or government-sponsored enterprises and corporations. |
| • | | For the six months ended June 30, 2003, the Institutional Class shares of the Portfolio returned 6.88%, outperforming the 6.34% return of the Lehman Brothers Global Real: U.S. TIPS Index. |
| • | | For the six month period, real yields decreased by 0.50%, compared to 0.37% for conventional U.S. Treasury issues of similar maturities. |
| • | | Breakeven inflation, defined as the difference between a real yield on a TIPS and a nominal yield on a Treasury of the same maturity, was 1.69% at June 30, 2003 for the 10-year maturity. This compares to a breakeven yield of 1.57% on December 31, 2002. The 12-month CPI-U change for the period ending June 30, 2003, was 2.11%. |
| • | | The effective duration of the Portfolio was 6.9 years on June 30, 2003, compared to a duration of 7.5 years for the benchmark. |
| • | | The Portfolio’s duration was lower than the benchmark for most of the period, which was negative for performance as real yields dropped. |
| • | | The Portfolio was overweight on the front end of the yield curve during the period, which benefited performance. |
| • | | The Portfolio’s yield was improved by using a combination of TIPS buy-forward agreements and low duration, high quality conventional yield debt instruments. The steepness of the real yield curve made this an attractive option for the Portfolio. |
2 | | Semi-Annual Report | 6.30.03 |
Financial Highlights
Real Return Portfolio (Institutional Class)
| Selected Per Share Data for the Year or Period Ended: | | 06/30/2003 +
| | | 12/31/2002
| | | 12/31/2001
| | | 04/10/2000-12/31/2000
| |
Net asset value beginning of period | | $ | 11.90 | | | $ | 10.56 | | | $ | 10.34 | | | $ | 10.11 | |
Net investment income (a) | | | 0.32 | | | | 0.49 | | | | 0.57 | | | | 0.62 | |
Net realized/unrealized gain on investments (a) | | | 0.49 | | | | 1.36 | | | | 0.43 | | | | 0.23 | |
Total income from investment operations | | | 0.81 | | | | 1.85 | | | | 1.00 | | | | 0.85 | |
Dividends from net investment income | | | (0.29 | ) | | | (0.49 | ) | | | (0.64 | ) | | | (0.62 | ) |
Distributions from net realized capital gains | | | (0.00 | ) | | | (0.02 | ) | | | (0.14 | ) | | | 0.00 | |
Total distributions | | | (0.29 | ) | | | (0.51 | ) | | | (0.78 | ) | | | (0.62 | ) |
Net asset value end of period | | $ | 12.42 | | | $ | 11.90 | | | $ | 10.56 | | | $ | 10.34 | |
Total return | | | 6.88 | % | | | 17.93 | % | | | 9.79 | % | | | 8.73 | % |
Net assets end of period (000s) | | $ | 26,525 | | | $ | 16 | | | $ | 14 | | | $ | 3,294 | |
Ratio of expenses to average net assets | | | 0.50 | %* | | | 0.51 | %(b) | | | 0.50 | % | | | 0.50 | %* |
Ratio of net investment income to average net assets | | | 5.21 | %* | | | 4.40 | % | | | 5.32 | % | | | 8.41 | %* |
Portfolio turnover rate | | | 169 | % | | | 87 | % | | | 58 | % | | | 18 | % |
| (a) | | Per share amounts based on average number of shares outstanding during the period. |
| (b) | | Ratio of expenses to average net assets excluding interest expense is 0.50%. |
See accompanying notes | | | 6.30.03 | Semi-Annual Report | | 3 |
Statement of Assets and Liabilities
Real Return Portfolio
June 30, 2003 (Unaudited)
Amounts in thousands, except per share amounts
| Assets: | | | | |
Investments, at value | | $ | 405,422 | |
Cash | | | 1,464 | |
Receivable for investments sold | | | 527 | |
Receivable for Portfolio shares sold | | | 36 | |
Interest receivable | | | 1,034 | |
| | |
|
|
|
| | | | 408,483 | |
| | |
|
|
|
Liabilities: | | | | |
Payable for investments purchased | | $ | 195,174 | |
Payable for short sale | | | 520 | |
Written options outstanding | | | 112 | |
Accrued investment advisory fee | | | 41 | |
Accrued administration fee | | | 41 | |
Accrued servicing fee | | | 19 | |
Variation margin payable | | | 38 | |
Other liabilities | | | 1,500 | |
| | |
|
|
|
| | | | 197,445 | |
| | |
|
|
|
Net Assets | | $ | 211,038 | |
| | |
|
|
|
Net Assets Consist of: | | | | |
Paid in capital | | $ | 201,248 | |
Undistributed net investment income | | | 110 | |
Accumulated undistributed net realized gain | | | 10,536 | |
Net unrealized (depreciation) | | | (856 | ) |
| | |
|
|
|
| | | $ | 211,038 | |
| | |
|
|
|
Net Assets: | | | | |
Institutional Class | | $ | 26,525 | |
Administrative Class | | | 184,513 | |
Shares Issued and Outstanding: | | | | |
Institutional Class | | | 2,135 | |
Administrative Class | | | 14,854 | |
Net Asset Value and Redemption Price Per Share (Net Assets Per Share Outstanding) | | | | |
Institutional Class | | $ | 12.42 | |
Administrative Class | | | 12.42 | |
Cost of Investments Owned | | $ | 406,407 | |
4 | | Semi-Annual Report | 6.30.03 | | | See accompanying notes |
Statement of Operations
Real Return Portfolio
For the six months ended June 30, 2003 (Unaudited)
Amounts in thousands
| Investment Income: | | | | |
Interest | | $ | 3,906 | |
Miscellaneous income | | | 1 | |
| | |
|
|
|
Total Income | | | 3,907 | |
| | |
|
|
|
Expenses: | | | | |
Investment advisory fees | | | 179 | |
Administration fees | | | 179 | |
Distribution and/or servicing fees - Administrative Class | | | 100 | |
Trustees’ fees | | | 1 | |
| | |
|
|
|
Total Expenses | | | 459 | |
| | |
|
|
|
Net Investment Income | | | 3,448 | |
| | |
|
|
|
Net Realized and Unrealized Gain (Loss): | | | | |
Net realized gain on investments | | | 10,697 | |
Net realized (loss) on futures contracts, written options, and swaps | | | (90 | ) |
Net change in unrealized (depreciation) on investments | | | (4,606 | ) |
Net change in unrealized appreciation on futures contracts, written options, and swaps | | | 119 | |
Net Gain | | | 6,120 | |
| | |
|
|
|
Net Increase in Assets Resulting from Operations | | $ | 9,568 | |
| | |
|
|
|
See accompanying notes | | | 6.30.03 | Semi-Annual Report | | 5 |
Statements of Changes in Net Assets
Real Return Portfolio
Amounts in thousands
| Increase (Decrease) in Net Assets from: | | Six Months Ended June 30, 2003
| | | Year Ended December 31, 2002
| |
| | | (Unaudited) | | | | |
Operations: | | | | | | | | |
Net investment income | | $ | 3,448 | | | $ | 1,329 | |
Net realized gain | | | 10,607 | | | | 231 | |
Net change in unrealized appreciation (depreciation) | | | (4,487 | ) | | | 3,524 | |
| | |
|
|
| |
|
|
|
Net increase resulting from operations | | | 9,568 | | | | 5,084 | |
| | |
|
|
| |
|
|
|
Distributions to Shareholders: | | | | | | | | |
From net investment income | | | | | | | | |
Institutional Class | | | (271 | ) | | | (1 | ) |
Administrative Class | | | (3,229 | ) | | | (1,328 | ) |
From net realized capital gains | | | | | | | | |
Institutional Class | | | 0 | | | | 0 | |
Administrative Class | | | 0 | | | | (140 | ) |
| | |
|
|
| |
|
|
|
Total Distributions | | | (3,500 | ) | | | (1,469 | ) |
| | |
|
|
| |
|
|
|
Portfolio Share Transactions: | | | | | | | | |
Receipts for shares sold | | | | | | | | |
Institutional Class | | | 25,391 | | | | 0 | |
Administrative Class | | | 107,172 | | | | 88,409 | |
Issued as reinvestment of distributions | | | | | | | | |
Institutional Class | | | 271 | | | | 1 | |
Administrative Class | | | 3,229 | | | | 1,468 | |
Cost of shares redeemed | | | | | | | | |
Institutional Class | | | (17 | ) | | | 0 | |
Administrative Class | | | (21,816 | ) | | | (10,173 | ) |
| | |
|
|
| |
|
|
|
Net increase resulting from Portfolio share transactions | | | 114,230 | | | | 79,705 | |
| | |
|
|
| |
|
|
|
Total Increase in Net Assets | | | 120,298 | | | | 83,320 | |
| | |
|
|
| |
|
|
|
Net Assets: | | | | | | | | |
Beginning of period | | | 90,740 | | | | 7,420 | |
End of period* | | $ | 211,038 | | | $ | 90,740 | |
*Including undistributed net investment income of: | | $ | 110 | | | $ | 162 | |
6 | | Semi-Annual Report | 6.30.03 | | | See accompanying notes |
Statement of Cash Flows
Real Return Portfolio
For six months ended June 30, 2003 (Unaudited)
Amounts in thousands
| Increase (Decrease) in Cash from: | | | |
Financing Activities: | | | | |
Sales of Portfolio shares | | $ | 132,834 | |
Redemptions of Portfolio shares | | | (21,879 | ) |
Proceeds from financing transactions | | | (76,275 | ) |
| | |
|
|
|
Net increase from financing activities | | | 34,680 | |
| | |
|
|
|
| |
Operating Activities: | | | | |
Purchases of long-term securities and foreign currency | | | (195,488 | ) |
Proceeds from sales of long-term securities and foreign currency | | | 270,940 | |
Purchases of short-term securities (net) | | | (115,066 | ) |
Net investment income | | | 3,448 | |
Change in other receivables/payables (net) | | | 2,949 | |
| | |
|
|
|
Net (decrease) from operating activities | | | (33,217 | ) |
| | |
|
|
|
Net Increase in Cash | | | 1,463 | |
| | |
|
|
|
Cash: | | | | |
Beginning of period | | | 1 | |
End of period | | $ | 1,464 | |
See accompanying notes | | | 6.30.03 | Semi-Annual Report | | 7 |
Schedule of Investments
Real Return Portfolio
June 30, 2003 (Unaudited)
| | | Principal Amount (000s)
| | Value (000s)
| |
CORPORATE BONDS & NOTES 5.3% | | | | | | | |
Banking & Finance 4.0% | | | | | | | |
CIT Group, Inc. | | | | | | | |
2.540% due 01/09/2004 (a) | | $ | 2,300 | | $ | 2,312 | |
Ford Motor Credit Co. | | | | | | | |
3.195% due 10/25/2004 (a) | | | 200 | | | 201 | |
1.769% due 07/18/2005 (a) | | | 200 | | | 193 | |
General Motors Acceptance Corp. | | | | | | | |
1.630% due 08/04/2003 (a) | | | 200 | | | 200 | |
2.049% due 01/20/2004 (a) | | | 1,600 | | | 1,599 | |
Phoenix Quake Ltd. | | | | | | | |
3.515% due 07/03/2008 | | | 2,000 | | | 1,998 | |
Residential Reinsurance Ltd. | | | | | | | |
6.230% due 06/08/2006 (a) | | | 1,000 | | | 1,001 | |
Studio Re Ltd. | | | | | | | |
6.378% due 07/07/2006 (a) | | | 750 | | | 752 | |
Travelers Property Casualty Corp. | | | | | | | |
3.750% due 03/15/2008 | | | 100 | | | 103 | |
| | | | | |
|
|
|
| | | | | | | 8,359 | |
| | | | | |
|
|
|
Industrials 0.4% | | | | | | | |
DaimlerChrysler North America Holding Corp. | | | | | | | |
7.750% due 06/15/2005 | | | 100 | | | 109 | |
Pemex Project Funding Master Trust | | | | | | | |
7.375% due 12/15/2014 | | | 500 | | | 549 | |
8.625% due 02/01/2022 | | | 200 | | | 229 | |
| | | | | |
|
|
|
| | | | | | | 887 | |
| | | | | |
|
|
|
Utilities 0.9% | | | | | | | |
British Telecom PLC | | | | | | | |
2.413% due 12/15/2003 (a) | | | 300 | | | 301 | |
Cleveland Electric Illuminating Co. | | | | | | | |
6.860% due 10/01/2008 | | | 100 | | | 115 | |
Entergy Gulf States, Inc. | | | | | | | |
2.040% due 06/18/2007 | | | 1,500 | | | 1,500 | |
| | | | | |
|
|
|
| | | | | | | 1,916 | |
| | | | | |
|
|
|
Total Corporate Bonds & Notes
(Cost $11,092) | | | | | | 11,162 | |
| | | | | |
|
|
|
U.S. TREASURY OBLIGATIONS 99.3% | | | | | | | |
Treasury Inflation Protected Securities (c) | | | | | | | |
3.375% due 01/15/2007 | | | 2,897 | | | 3,182 | |
3.625% due 01/15/2008 | | | 40,234 | | | 45,150 | |
3.875% due 01/15/2009 | | | 21,267 | | | 24,364 | |
4.250% due 01/15/2010 | | | 36,826 | | | 43,351 | |
3.500% due 01/15/2011 | | | 3,691 | | | 4,194 | |
3.375% due 01/15/2012 | | | 2,068 | | | 2,340 | |
3.000% due 07/15/2012 | | | 25,842 | | | 28,487 | |
3.625% due 04/15/2028 | | | 15,845 | | | 19,318 | |
3.875% due 04/15/2029 | | | 30,709 | | | 39,188 | |
| | | | | |
|
|
|
Total U.S. Treasury Obligations
(Cost $210,872) | | | | | | 209,574 | |
| | | | | |
|
|
|
MORTGAGE-BACKED SECURITIES 0.0% | | | | | | | |
Fannie Mae 0.0% | | | | | | | |
4.497% due 11/01/2024 (a) | | | 26 | | | 26 | |
| | | | | |
|
|
|
Total Mortgage-Backed Securities
(Cost $26) | | | | | | 26 | |
| | | | | |
|
|
|
ASSET-BACKED SECURITIES 0.9% | | | | | | | |
Bear Stearns Asset-Backed Securities, Inc. | | | | | | | |
1.470% due 07/25/2033 (g) | | | 2,000 | | | 1,999 | |
| | | | | |
|
|
|
Total Asset-Backed Securities
(Cost $2,000) | | | | | | 1,999 | |
| | | | | |
|
|
|
SOVEREIGN ISSUES 2.8% | | | | | | | |
Republic of Brazil | | | | | | | |
2.125% due 04/15/2006 (a) | | | 192 | | | 180 | |
2.187% due 04/15/2009 (a) | | | 141 | | | 119 | |
8.000% due 04/15/2014 | | | 616 | | | 541 | |
11.000% due 08/17/2040 | | | 200 | | | 181 | |
Republic of Colombia | | | | | | | |
10.000% due 01/23/2012 | | | 2,100 | | | 2,357 | |
Republic of Italy | | | | | | | |
1.175% due 10/22/2003 | | $ | 1,800 | | $ | 1,794 | |
United Mexican States | | | | | | | |
6.375% due 01/16/2013 | | | 700 | | | 744 | |
| | | | | |
|
|
|
Total Sovereign Issues
(Cost $5,664) | | | | | | 5,916 | |
| | | | | |
|
|
|
PURCHASED CALL OPTIONS 0.0% | | | | | | | |
U.S. Treasury Note September Futures (CBOT) | | | | | | | |
Strike @ 132.000 Exp. 08/23/2003 | | | 7,000 | | | 1 | |
| | | | | |
|
|
|
Total Purchased Call Options
(Cost $1) | | | | | | 1 | |
| | | | | |
|
|
|
PURCHASED PUT OPTIONS 0.0% | | | | | | | |
Treasury Inflated Protected Securities (OTC) | | | | | | | |
3.875% due 01/15/2009 | | | | | | | |
Strike @ 99.000 Exp. 08/06/2003 | | | 10,000 | | | 0 | |
| | | | | |
|
|
|
Total Purchased Put Options
(Cost $2) | | | | | | 0 | |
| | | | | |
|
|
|
SHORT-TERM INSTRUMENTS 83.8% | | | | | | | |
Commercial Paper 81.9% | | | | | | | |
ABN AMRO Mortgage Corp. | | | | | | | |
1.240% due 07/02/2003 | | | 5,000 | | | 5,000 | |
Anz, Inc. | | | | | | | |
1.225% due 07/30/2003 | | | 5,200 | | | 5,195 | |
Barclays U.S. Funding Corp. | | | | | | | |
0.920% due 09/22/2003 | | | 6,000 | | | 5,985 | |
CBA Finance, Inc. | | | | | | | |
1.220% due 07/08/2003 | | | 3,700 | | | 3,699 | |
1.220% due 08/01/2003 | | | 1,000 | | | 999 | |
Danske Corp. | | | | | | | |
1.230% due 07/07/2003 | | | 7,500 | | | 7,498 | |
1.240% due 07/28/2003 | | | 5,000 | | | 4,995 | |
Fannie Mae | | | | | | | |
0.950% due 07/01/2003 | | | 15,000 | | | 15,000 | |
1.130% due 09/03/2003 | | | 10,000 | | | 9,981 | |
0.980% due 09/10/2003 | | | 10,000 | | | 9,979 | |
0.900% due 09/17/2003 | | | 8,000 | | | 7,982 | |
0.990% due 09/17/2003 | | | 12,000 | | | 11,973 | |
0.980% due 09/24/2003 | | | 12,000 | | | 11,970 | |
Federal Home Loan Bank | | | | | | | |
0.950% due 07/01/2003 | | | 15,000 | | | 15,000 | |
1.205% due 07/16/2003 | | | 1,600 | | | 1,599 | |
0.970% due 07/25/2003 | | | 8,900 | | | 8,894 | |
1.165% due 08/01/2003 | | | 8,200 | | | 8,192 | |
1.150% due 10/29/2003 | | | 8,300 | | | 8,271 | |
Freddie Mac | | | | | | | |
1.170% due 07/10/2003 | | | 1,200 | | | 1,200 | |
1.195% due 07/17/2003 | | | 800 | | | 800 | |
General Electric Capital Corp. | | | | | | | |
1.250% due 07/23/2003 | | | 300 | | | 300 | |
1.200% due 08/21/2003 | | | 300 | | | 299 | |
HBOS Treasury Services PLC | | | | | | | |
0.960% due 08/01/2003 | | | 4,000 | | | 3,997 | |
1.210% due 08/28/2003 | | | 1,500 | | | 1,497 | |
Royal Bank of Scotland PLC | | | | | | | |
1.220% due 07/16/2003 | | | 3,000 | | | 2,998 | |
1.230% due 08/06/2003 | | | 500 | | | 499 | |
Svenska Handelsbank, Inc. | | | | | | | |
1.250% due 07/07/2003 | | | 5,000 | | | 4,999 | |
UBS Finance, Inc. | | | | | | | |
0.930% due 09/18/2003 | | $ | 6,000 | | $ | 5,986 | |
0.920% due 09/24/2003 | | | 200 | | | 200 | |
Westpac Trust Securities Ltd. | | | | | | | |
1.200% due 07/02/2003 | | | 6,000 | | | 6,000 | |
1.200% due 07/09/2003 | | | 1,900 | | | 1,900 | |
| | | | | |
|
|
|
| | | | | | | 172,887 | |
| | | | | |
|
|
|
Repurchase Agreement 1.0% | | | | | | | |
State Street Bank | | | | | | | |
0.800% due 07/01/2003 | | | 2,068 | | | 2,068 | |
(Dated 06/30/2003. Collateralized by Fannie Mae 1.910% due 04/29/2005 valued at $2,113. Repurchase proceeds are $2,068.) | | | | | | | |
| | | | | |
|
|
|
U.S. Treasury Bills 0.9% | | | | | | | |
1.021% due 08/07/2003-08/14/2003 (b)(d) | | | 1,790 | | | 1,789 | |
| | | | | |
|
|
|
Total Short-Term Instruments
(Cost $176,750) | | | | | | 176,744 | |
| | | | | |
|
|
|
Total Investments 192.1%
(Cost $406,407) | | | | | $ | 405,422 | |
Written Options (e) (0.1%)
(Premiums $92) | | | | | | (112 | ) |
Other Assets and Liabilities (Net) (92.0%) | | | | | | (194,272 | ) |
| | | | | |
|
|
|
Net Assets 100.0% | | | | | $ | 211,038 | |
| | | | | |
|
|
|
Notes to Schedule of Investments
(amounts in thousands, except number of contracts):
| (a) | | Variable rate security. The rate listed is as of June 30, 2003. |
| (b) | | Securities with an aggregate market value of $689 have been segregated with the custodian to cover margin requirements for the following open futures contracts at June 30, 2003: |
Type
| | # of Contracts
| | Unrealized Appreciation
|
U.S. Treasury 10 Year Note (09/2003 ) - Short | | 100 | | $ | 140 |
| | | | |
|
|
| (c) | | Principal amount of security is adjusted for inflation. |
| (d) | | Securities are grouped by coupon or range of coupons and represent a range of maturities. |
| (e) | | Premiums received on written options: |
Type
| | # of Contracts
| | Premium
| | Value
|
Call - CBOT U.S. Treasury Note September Futures | | | | | | | | |
Strike @ 116.000 Exp. 08/23/2003 | | 52 | | $ | 46 | | $ | 110 |
Call - CBOT U.S. Treasury Note September Futures | | | | | | | | |
Strike @ 110.000 Exp. 08/23/2003 | | 55 | | | 46 | | | 2 |
| | | | |
|
| |
|
|
| | | | | $ | 92 | | $ | 112 |
| | | | |
|
| |
|
|
| (f) | | Short sales open at June 30, 2003 were as follows: |
Type
| | Coupon (%)
| | Maturity
| | Par
| | Value
| | Proceeds
|
U.S. Treasury Note | | 4.000 | | 11/15/2012 | | $ | 500 | | $ | 520 | | $ | 527 |
| | | | | | | | | |
|
| |
|
|
| (g) | | Indicates a fair valued security which has not been valued utilizing an independent quote and which is valued pursuant to guidelines established by the Trustees. The aggregate value of fair valued securities is $1,999, which is 0.9% of net assets. |
8 | | Semi-Annual Report | 6.30.03 | | | See accompanying notes |
Notes to Financial Statements
June 30, 2003 (Unaudited)
1. Organization
The Real Return Portfolio (the “Portfolio”) is a series of the PIMCO Variable Insurance Trust (the “Trust”). The Trust is registered under the Investment Company Act of 1940 (the “Act”), as amended, as an open-end investment company organized as a Delaware business trust on October 3, 1997. The Trust may offer up to two classes of shares: Institutional and Administrative. Each share class has identical voting rights (except that shareholders of a class have exclusive voting rights regarding any matter relating solely to that class of shares). Information presented in these financial statements pertains to the Institutional Class of the Trust. Certain detailed financial information for the Administrative Class is provided separately and is available upon request. The Trust is designed to be used as an investment vehicle by Separate Accounts of insurance companies that fund variable annuity contracts and variable life insurance policies and by qualified pension and retirement plans. The Portfolio commenced operations on September 30, 1999.
2. Significant Accounting Policies
The following is a summary of significant accounting policies consistently followed by the Trust in the preparation of its financial statements in conformity with accounting principles generally accepted in the United States of America. The preparation of financial statements in accordance with accounting principles generally accepted in the United States of America requires management to make estimates and assumptions that affect the reported amounts and disclosures in the financial statements. Actual results could differ from those estimates.
Security Valuation. Portfolio securities and other financial instruments for which market quotations are readily available are stated at market value. Market value is determined at the close of regular trading (normally, 4:00 p.m., Eastern Time) on the New York Stock Exchange on each day the New York Stock Exchange is open, or if no sales are reported, as is the case for most securities traded over-the-counter, the mean between representative bid and asked quotations obtained from a quotation reporting system or from established market makers. Fixed income securities, including those to be purchased under firm commitment agreements, are normally valued on the basis of quotes obtained from brokers and dealers or pricing services. Short-term investments, which mature in 60 days or less are valued at amortized cost, which approximates market value. Certain fixed income securities for which daily market quotations are not readily available may be valued, pursuant to guidelines established by the Board of Trustees, with reference to fixed income securities whose prices are more readily obtainable. Prices may be obtained from independent pricing services which use information provided by market makers or estimates of market values obtained from yield data relating to investments or securities with similar characteristics. The prices used by the Portfolio may differ from the value that would be realized if the securities were sold and the differences could be material to the financial statements.
Securities Transactions and Investment Income. Securities transactions are recorded as of the trade date. Securities purchased or sold on a when-issued or delayed delivery basis may be settled a month or more after the trade date. Realized gains and losses from securities sold are recorded on the identified cost basis. Dividend income is recorded on the ex-dividend date, except certain dividends from foreign securities where the ex-dividend date may have passed, are recorded as soon as the Portfolio is informed of the ex-dividend date. Interest income, adjusted for the accretion of discounts and amortization of premiums, is recorded on the accrual basis. Paydowns gains and losses on mortgage- and asset-backed securities are recorded as adjustments to interest income in the Statement of Operations.
Dividends and Distributions to Shareholders. Dividends from net investment income, if any, are declared on each day the Trust is open for business and are distributed to shareholders monthly. All dividends are reinvested in additional shares of the Portfolio. Net realized capital gains earned by the Portfolio, if any, will be distributed no less frequently than once each year.
Income dividends and capital gain distributions are determined in accordance with income tax regulations which may differ from accounting principles generally accepted in the United States of America. These differences are primarily due to differing treatments for such items as wash sales, foreign currency transactions, net operating losses and capital loss carryforwards.
Distributions classified as a tax basis return of capital, if any, are reflected in the accompanying Statements of Changes in Net Assets and have been reclassified to paid in capital. In addition, other amounts have been reclassified between undistributed net investment income, accumulated undistributed net realized gains or losses and/or paid in capital to more appropriately conform financial accounting to tax characterizations of dividend distributions.
Foreign Currency. The accounting records of the Portfolio are maintained in U.S. dollars. The market values of foreign securities, currency holding and other assets and liabilities are translated into U.S. dollars based on the current exchange rates each business day. Fluctuations in the value of these assets and liabilities resulting from changes in exchange rates are recorded as unrealized foreign currency gains or losses. Realized gains or losses and unrealized appreciation (depreciation) on investment securities and income and expenses are translated on the respective dates of such transactions. The effect of changes in foreign currency exchange rates on investments in securities are not
6.30.03 | Semi-Annual Report | | 9 |
segregated in the Statement of Operations from the effects of changes in market prices of those securities, but are included with the net realized and unrealized gain or loss on investment securities.
Multiclass Operations. Each class offered by the Trust has equal rights as to assets. Income, non-class specific expenses, and realized and unrealized capital gains and losses are allocated to each class of shares based on the relative net assets of each class.
Federal Income Taxes. The Portfolio intends to qualify as a regulated investment company and distribute all of its taxable income and net realized gains, if applicable, to shareholders. Accordingly, no provision for Federal income taxes has been made.
Financing Transactions. The Portfolio may enter into financing transactions consisting of the sale by the Portfolio of securities, together with a commitment to repurchase similar securities at a future date. The difference between the selling price and the future purchase price is an adjustment to interest income in the Statement of Operations. If the counterparty to whom the Portfolio sells the security becomes insolvent, the Portfolio’s right to repurchase the security may be restricted; the value of the security may change over the term of the financing transaction; and the return earned by the Portfolio with the proceeds of a financing transaction may not exceed transaction costs. The Portfolio will designate assets determined to be liquid by PIMCO or otherwise cover its obligations under financing transactions.
Futures Contracts. The Portfolio is authorized to enter into futures contracts. The Portfolio may use futures contracts to manage its exposure to the securities markets or to movements in interest rates and currency values. The primary risks associated with the use of futures contracts are imperfect correlation between the change in market value of the securities held by the Portfolio and the prices of futures contracts, the possibility of an illiquid market, and the inability of the counterparty to meet the terms of the contract. Futures contracts are valued based upon their quoted daily settlement prices. Upon entering into a futures contract, the Portfolio may be required to deposit with its custodian, in a segregated account in the name of the futures broker, an amount of cash or U.S. Government and Agency Obligations in accordance with the initial margin requirements of the broker or exchange. Futures contracts are marked to market daily and an appropriate payable or receivable for the change in value (“variation margin”) is recorded by the Portfolio. Gains or losses are recognized but not considered realized until the contracts expire or are closed. Futures contracts involve, to varying degrees, risk of loss in excess of the variation margin disclosed in the Statement of Assets and Liabilities.
Options Contracts. The Portfolio may write call and put options on futures, securities or currencies it owns or in which it may invest. Writing put options tends to increase the Portfolio’s exposure to the underlying instrument. Writing call options tends to decrease the Portfolio’s exposure to the underlying instrument. When the Portfolio writes a call or put option, an amount equal to the premium received is recorded as a liability and subsequently marked to market to reflect the current value of the option written. Payment received or made, if any, from writing options with premiums to be determined on a future date are reflected as such on the Statement of Assets and Liabilities. Premiums received from writing options which expire are treated as realized gains. Premiums received from writing options which are exercised or closed are added to the proceeds or offset against amounts paid on the underlying future, security or currency transaction to determine the realized gain or loss. The Portfolio as a writer of an option has no control over whether the underlying future, security or currency may be sold (call) or purchased (put) and as a result bears the market risk of an unfavorable change in the price of the future, security or currency underlying the written option. There is the risk the Portfolio may not be able to enter into a closing transaction because of an illiquid market.
The Portfolio may also purchase put and call options. Purchasing call options tends to increase the Portfolio’s exposure to the underlying instrument. Purchasing put options tends to decrease the Portfolio’s exposure to the underlying instrument. The Portfolio pays a premium which is included in the Portfolio’s Statement of Assets and Liabilities as an investment and subsequently marked to market to reflect the current value of the option. Premiums paid for purchasing options which expire are treated as realized losses. The risk associated with purchasing put and call options is limited to the premium paid. Premiums paid for purchasing options which are exercised or closed are added to the amounts paid or offset against the proceeds on the underlying future, security or currency transaction to determine the realized gain or loss.
Delayed Delivery Transactions. The Portfolio may purchase or sell securities on a when-issued or delayed delivery basis. These transactions involve a commitment by the Portfolio to purchase or sell securities for a predetermined price or yield, with payment and delivery taking place beyond the customary settlement period. When delayed delivery purchases are outstanding, the Portfolio will set aside and maintain until the settlement date in a segregated account, liquid assets in an amount sufficient to meet the purchase price. When purchasing a security on a delayed delivery basis, the Portfolio assumes the rights and risks of ownership of the security, including the risk of price and yield fluctuations, and takes such fluctuations into account when determining its net asset value. The Portfolio may dispose of or renegotiate a delayed delivery transaction after it is entered into, and may sell
10 | | Semi-Annual Report | 6.30.03 |
when-issued securities before they are delivered, which may result in a capital gain or loss. When the Portfolio has sold a security on a delayed delivery basis, the Portfolio does not participate in future gains and losses with respect to the security.
Inflation-Indexed Bonds. Inflation-indexed bonds are fixed income securities whose principal value is periodically adjusted to the rate of inflation. The interest rate on these bonds is generally fixed at issuance at a rate lower than typical bonds. Over the life of an inflation-indexed bond, however, interest will be paid based on a principal value, which is adjusted for inflation. Any increase in the principal amount of an inflation-indexed bond will be included as interest income in the Statement of Operations, even though investors do not receive their principal until maturity.
Repurchase Agreements. The Portfolio may engage in repurchase transactions. Under the terms of a typical repurchase agreement, the Portfolio takes possession of an underlying debt obligation subject to an obligation of the seller to repurchase, and the Portfolio to resell, the obligation at an agreed-upon price and time. The market value of the collateral must be equal at all times to the total amount of the repurchase obligations, including interest. Generally, in the event of counterparty default, the Portfolio has the right to use the collateral to offset losses incurred.
Short Sales. The Portfolio has entered into short sales transactions during the fiscal year. A short sale is a transaction in which a Portfolio sells securities it does not own in anticipation of a decline in the market price of the securities. The Portfolio is obligated to deliver securities at the market price at the time the short position is closed. Possible losses from short sales may be unlimited, whereas losses from purchases cannot exceed the total amount invested.
3. Fees, Expenses, and Related Party Transactions
Investment Advisory Fee. Pacific Investment Management Company LLC (PIMCO) is a majority owned subsidiary partnership of Allianz Dresdner Asset Management of America L.P. (formerly PIMCO Advisors L.P.) and serves as investment adviser (the “Adviser”) to the Trust, pursuant to an investment advisory contract. The Adviser receives a monthly fee at an annual rate based on average daily net assets of the Portfolio. The Advisory Fee is charged at an annual rate of 0.25%.
Administration Fee. PIMCO serves as administrator (the “Administrator”) and provides administrative services to the Trust for which it receives a monthly administrative fee based on average daily net assets of the Portfolio. The Administration Fee is charged at the annual rate of 0.25%.
Servicing Fee. PIMCO Advisors Distributors LLC (“PAD”), is an indirect wholly-owned subsidiary of Allianz Dresdner Asset Management of America L.P. and serves as the distributor of the Trust’s shares. The Trust is permitted to reimburse PAD on a quarterly basis, out of the Administrative Class assets of the Portfolio in the amount of 0.15% on an annual basis of the average daily net assets of that class, for payments made to financial intermediaries that provide services in connection with the distribution of shares or administration of plans or programs that use Portfolio shares as their funding medium. The effective rate paid to PAD during the current fiscal year is 0.15%.
Expenses. The Portfolio is responsible for the following expenses: (i) salaries and other compensation of any of the Trust’s executive officers and employees who are not officers, directors, stockholders or employees of PIMCO or its subsidiaries or affiliates; (ii) taxes and governmental fees; (iii) brokerage fees and commissions and other portfolio transaction expenses; (iv) the cost of borrowing money, including interest expense; (v) fees and expenses of the Trustees who are not “interested persons” of PIMCO or the Trust, and any counsel retained exclusively for their benefit; (vi) extraordinary expenses, including costs of litigation and indemnification expenses; (vii) organization expenses and (viii) any expenses allocated or allocable to a specific class of shares, which include service fees payable with respect to the Administrative Class shares and may include certain other expenses as permitted by the Trust’s Multiple Class Plan adopted pursuant to Rule 18f-3 under the Act and subject to review and approval by the Trustees. The ratio of expenses to average net assets per share class, as disclosed in the Financial Highlights, may differ from the annual Portfolio operating expenses per share class as disclosed in the Prospectus for the reasons set forth above. PIMCO has agreed to waive a portion of its administrative fees to the extent that the payment of the Portfolio’s pro rata share of Trustees’ fees causes the actual expense ratio to rise above the rates disclosed in the current prospectus plus 0.49 basis points as set forth below (calculated as a percentage of the Portfolio’s average daily net assets attributable to each class):
| | | Institutional Class
| | | Administrative Class
| |
Real Return Portfolio | | 0.50 | % | | 0.65 | % |
PIMCO may be reimbursed for these waived amounts in future periods. The Trust pays no compensation directly to any Trustee or any other officer who is affiliated with the Administrator, all of whom receive renumeration for their services to the Trust from the Administrator or its affiliates.
Each unaffiliated Trustee receives an annual retainer of $4,000, plus $1,500 for each Board of Trustees meeting attended in person and $250 for each meeting attended telephonically, plus reimbursement of related expenses.
6.30.03 | Semi-Annual Report | | 11 |
In addition, each committee chair receives an additional annual retainer of $500. These expenses are allocated on a pro-rata basis to each Portfolio of the Trust according to its respective net assets.
4. Purchases and Sales of Securities
Purchases and sales of securities (excluding short-term investments) for the period ended June 30, 2003 were as follows (amounts in thousands):
| | | U.S Government/Agency
| | All Other
|
| | | Purchases
| | Sales
| | Purchases
| | Sales
|
Real Return Portfolio | | $ | 371,007 | | $ | 269,150 | | $ | 15,820 | | $ | 1,192 |
5. Transactions in Written Call and Put Options
Transactions in written call and put options were as follows (amounts in thousands):
| | | Real Return Portfolio
| |
| | | Premium
| |
Balance at 12/31/2002 | | $ | 0 | |
Sales | | | 153 | |
Closing Buys | | | 0 | |
Expirations | | | (61 | ) |
Exercised | | | 0 | |
| | |
|
|
|
Balance at 06/30/2003 | | $ | 92 | |
| | |
|
|
|
6. Federal Income Tax Matters
At June 30, 2003, the aggregate cost of investments was the same for federal income tax and financial statement purposes. The net unrealized appreciation (depreciation) of investments securities for federal income tax purposes is as follows (amounts in thousands):
| | | Aggregate Gross Unrealized Appreciation
| | Aggregate Gross Unrealized (Depreciation)
| | | Net Unrealized (Depreciation)
| |
Real Return Portfolio | | $ | 587 | | $ | (1,572 | ) | | $ | (985 | ) |
7. Shares of Beneficial Interest
The Trust may issue an unlimited number of shares of beneficial interest with a $.0001 par value. Changes in shares of beneficial interest were as follows (shares and amounts in thousands):
| | | Real Return Portfolio
| |
| | | Six Months Ended
06/30/2003 | | | Year Ended
12/31/2002 | |
| | | Shares
| | | Amount
| | | Shares
| | | Amount
| |
Receipts for shares sold | | | | | | | | | | | | | | |
Institutional Class | | 2,113 | | | $ | 25,391 | | | 0 | | | $ | 0 | |
Administrative Class | | 8,760 | | | | 107,172 | | | 7,686 | | | | 88,409 | |
Issued as reinvestment of distributions
| | | | | | | | | | | | | | |
Institutional Class | | 22 | | | | 271 | | | 0 | | | | 1 | |
Administrative Class | | 265 | | | | 3,229 | | | 128 | | | | 1,468 | |
Cost of shares redeemed
| | | | | | | | | | | | | | |
Institutional Class | | (1 | ) | | | (17 | ) | | 0 | | | | 0 | |
Administrative Class | | (1,796 | ) | | | (21,816 | ) | | (890 | ) | | | (10,173 | ) |
| | |
|
| |
|
|
| |
|
| |
|
|
|
Net increase resulting from Portfolio share transactions | | 9,363 | | | $ | 114,230 | | | 6,924 | | | $ | 79,705 | |
| | |
|
| |
|
|
| |
|
| |
|
|
|
The following schedule shows the number of shareholders each owning 5% or more of the Portfolio and the total percentage of the Portfolio held by such shareholders:
| | | Number
| | % of Portfolio Held
|
Real Return Portfolio | | | | |
Institutional Class | | 1 | | 100 |
Administrative Class | | 5 | | 62 |
12 | | Semi-Annual Report | 6.30.03 |
Trustees and Officers
Brent R. Harris, Chairman and Trustee
R. Wesley Burns, President and Trustee
E. Philip Cannon, Trustee
Vern O. Curtis, Trustee
J. Michael Hagan, Trustee
William J. Popejoy, Trustee
Garlin G. Flynn, Secretary
John P. Hardaway, Treasurer
Investment Adviser and Administrator
Pacific Investment Management Company LLC
840 Newport Center Drive
Newport Beach, California 92660
Transfer Agent
National Financial Data Services
330 W. 9th Street, 4th Floor
Kansas City, Missouri 64105
Custodian
State Street Bank & Trust Company
801 Pennsylvania
Kansas City, Missouri 64105
Counsel
Dechert LLP
1775 I Street, N.W.
Washington, D.C. 20006
Independent Accountants
PricewaterhouseCoopers LLP
1055 Broadway
Kansas City, Missouri 64105
PIMCO VARIABLE INSURANCE TRUST
This report is submitted for the general information of the shareholders of the PIMCO Variable Insurance Trust. It is not authorized for distribution to prospective investors unless accompanied or preceded by an effective prospectus for the PIMCO Variable Insurance Trust, which contains information covering its investment policies as well as other pertinent information.
All Funds distributed by PIMCO ADVISORS DISTRIBUTORS LLC, member NASD
840 NEWPORT CENTER DRIVE
NEWPORT BEACH, CA 92660
800.927.4648
WWW. PIMCOADVISORS.COM
WWW.PIMCO.COM
| P I M C O |
| PIMCO VARIABLE INSURANCE TRUST |
| SHORT-TERM PORTFOLIO |
| INSTITUTIONAL CLASS |
|
| SEMI-ANNUAL REPORT |
| June 30, 2003 |
| | | Fund Summary
| | Schedule of Investments
|
Short-Term Portfolio (Institutional Class) | | 2 | | 7 |
Chairman’s Letter
Dear PIMCO Variable Insurance Trust Shareholder:
Financial assets gained during the first half of 2003 amid a revival of risk appetites as anxiety about the war in Iraq faded. Assets that generally benefit from economic growth, such as stocks, corporate bonds and emerging market debt, fared the best year-to-date as investors returned to these sectors in anticipation of a recovery in the second half of 2003. Reflationary forces that investors expected to fuel a rebound included federal tax cuts and a weak dollar, as well as low borrowing rates that eased the burden of high personal and corporate indebtedness. Low mortgage rates kept refinancings booming in the second quarter and put more money in consumers’ pockets.
U.S. Treasuries lagged their riskier counterparts but still enjoyed a modest rally. Yields fell to levels not seen in 45 years early in the second quarter before bouncing off their lows in June as hopes for recovery increased. The yield on the benchmark 10-year Treasury closed the six-month period 0.30% lower to 3.51%, after nearing 3% earlier in the period. Buyers were encouraged that inflation would remain tame amid low capacity utilization and weak employment growth. Asian central banks bought U.S. Treasuries to limit the rise in their currencies versus the dollar in an effort to protect their export industries. In June, the Federal Reserve cut the federal funds rate by 0.25% to 1%, its 13th easing since 2001, in an effort to boost the economy and ward off deflation. Although the cut was less than expected, the Fed suggested that rates would stay low until deflation risks abated.
On the following pages you will find specific details as to the Portfolio’s total return investment performance and a discussion of those factors that affected performance.
We appreciate the trust you have placed in us, and we will continue to focus our efforts to meet your investment needs.
Sincerely,
Brent R. Harris
Chairman
July 31, 2003
6.30.03 | Semi-Annual Report | | 1 |
Short-Term Portfolio
TOTAL RETURN INVESTMENT PERFORMANCE For the period ended June 30, 2003
| | | 1 Year | | | Since Inception* | |
Short-Term Portfolio Institutional Class | | 3.55 | % | | 5.06 | % |
Citigroup 3-Month Treasury Bill Index | | 1.41 | % | | — | |
| * | | Annualized (All Portfolio returns are net of fees and expenses) |
CUMULATIVE RETURNS THROUGH JUNE 30, 2003
$10,000 invested at inception
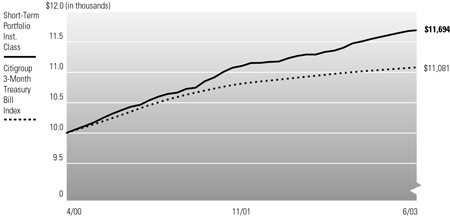
Past performance is no guarantee of future results. Investment return and principal value will fluctuate so that Portfolio shares, when redeemed, may be worth more or less than their original cost. The line graph above assumes the investment of $10,000 on 5/01/2000, the first full month following the Portfolio’s Institutional Class inception on 4/28/2000, compared to the Citigroup 3-Month Treasury Bill Index, an unmanaged market index. It is not possible to invest directly in the Index. Prior to 4/7/03 the Citigroup 3-Month Treasury Bill Index was known as the Salomon Smith Barney 3-Month Treasury Bill Index. Whereas money market funds attempt to maintain a stable share price, the Short-Term Portfolio’s share price will fluctuate in response to market conditions. The Portfolio may invest in foreign securities which involve potentially higher risks including foreign currency fluctuations and political or economic uncertainty. These risks may be enhanced when investing in emerging market securities.
PORTFOLIO INSIGHTS
| • | | The Short-Term Portfolio seeks to achieve its investment objective by investing under normal circumstances at least 65% of its total assets in a diversified portfolio of Fixed Income Instruments of varying maturities. |
| • | | The total return performance of the Portfolio was 1.62% for the six-month period ended June 30, 2003, outperforming the 0.59% return of the Citigroup 3-Month Treasury Bill Index. |
| • | | A duration longer than the effective benchmark was modestly positive for performance as rates fell. |
| • | | Mortgages enhanced the Portfolio’s yield and credit quality. |
| • | | Corporate holdings provided high relative yields and positive price performance as credit risk premiums fell. |
| • | | An allocation to real return bonds was neutral as real yields fell roughly in line with those on nominal bonds. |
| • | | Emerging market bonds helped returns. This asset class continued to gain amid strong demand from investors drawn to relatively high yields and improving credit quality. |
| • | | Asset-backed bonds helped returns, providing attractive relative yields. |
| • | | Short maturity Eurozone exposure was a slight positive as these maturities fell more than U.S. rates amid expectations of more easing by the European Central Bank. |
| • | | Option strategies added incremental income and contributed positively to overall performance. |
2 | | Semi-Annual Report | 6.30.03 |
Financial Highlights
Short-Term Portfolio (Institutional Class)
| Selected Per Share Data for the Year or Period Ended: | | 06/30/2003 +
| | | 12/31/2002
| | | 12/31/2001
| | | 04/10/2000-12/31/2000
| |
Net asset value beginning of period | | $ | 10.08 | | | $ | 10.08 | | | $ | 10.01 | | | $ | 10.00 | |
Net investment income (a) | | | 0.09 | | | | 0.30 | | | | 0.53 | | | | 0.45 | |
Net realized/unrealized gain (loss) on investments (a) | | | 0.07 | | | | (0.01 | ) | | | 0.12 | | | | 0.01 | |
Total income from investment operations | | | 0.16 | | | | 0.31 | | | | 0.65 | | | | 0.46 | |
Dividends from net investment income | | | (0.11 | ) | | | (0.30 | ) | | | (0.54 | ) | | | (0.45 | ) |
Distributions from net realized capital gains | | | 0.00 | | | | (0.01 | ) | | | (0.04 | ) | | | 0.00 | |
Total distributions | | | (0.11 | ) | | | (0.31 | ) | | | (0.58 | ) | | | (0.45 | ) |
Net asset value end of period | | $ | 10.13 | | | $ | 10.08 | | | $ | 10.08 | | | $ | 10.01 | |
Total return | | | 1.62 | % | | | 3.18 | % | | | 6.59 | % | | | 4.64 | % |
Net assets end of period (000s) | | $ | 10,119 | | | $ | 4,893 | | | $ | 4,093 | | | $ | 3,388 | |
Ratio of expenses to average net assets | | | 0.45 | %* | | | 0.45 | % | | | 0.47 | %(b)(c) | | | 0.45 | %* |
Ratio of net investment income to average net assets | | | 1.86 | %* | | | 2.99 | % | | | 5.30 | % | | | 6.56 | %* |
Portfolio turnover rate | | | 68 | % | | | 60 | % | | | 94 | % | | | 281 | % |
| (a) | | Per share amounts based on average number of shares outstanding during the period. |
| (b) | | Ratio of expenses to average net assets excluding interest expense is 0.45%. |
| (c) | | If the investment manager had not reimbursed expenses, the ratio of operating expenses to average net assets would have been 0.46% for the year ended December 31, 2001. |
See accompanying notes | | | 6.30.03 | Semi-Annual Report | | 3 |
Statement of Assets and Liabilities
Short-Term Portfolio
June 30, 2003 (Unaudited)
Amounts in thousands, except per share amounts
Assets: | | | | |
Investments, at value | | $ | 16,185 | |
Cash | | | 1 | |
Foreign currency, at value | | | 12 | |
Receivable for Portfolio shares sold | | | 1 | |
Interest receivable | | | 71 | |
Variation margin receivable | | | 2 | |
Unrealized appreciation on swap agreements | | | 13 | |
| | |
|
|
|
| | | | 16,285 | |
| | |
|
|
|
Liabilities: | | | | |
Payable for investments purchased | | $ | 110 | |
Written options outstanding | | | 11 | |
Payable for Portfolio shares redeemed | | | 11 | |
Accrued investment advisory fee | | | 3 | |
Accrued administration fee | | | 3 | |
Accrued servicing fee | | | 1 | |
| | |
|
|
|
| | | | 139 | |
| | |
|
|
|
Net Assets | | $ | 16,146 | |
| | |
|
|
|
Net Assets Consist of: | | | | |
Paid in capital | | $ | 16,047 | |
Undistributed (overdistributed) net investment income | | | (9 | ) |
Accumulated undistributed net realized gain | | | 39 | |
Net unrealized appreciation | | | 69 | |
| | |
|
|
|
| | | $ | 16,146 | |
| | |
|
|
|
Net Assets: | | | | |
Institutional Class | | $ | 10,119 | |
Administrative Class | | | 6,027 | |
Shares Issued and Outstanding: | | | | |
Institutional Class | | | 999 | |
Administrative Class | | | 595 | |
Net Asset Value and Redemption Price Per Share (Net Assets Per Share Outstanding) | | | | |
Institutional Class | | $ | 10.13 | |
Administrative Class | | | 10.13 | |
Cost of Investments Owned | | $ | 16,162 | |
Cost of Foreign Currency Held | | $ | 12 | |
4 | | Semi-Annual Report | 6.30.03 | | | See accompanying notes |
Statement of Operations
Short-Term Portfolio
For the six months ended June 30, 2003 (Unaudited)
Amounts in thousands
Investment Income: | | | | |
Interest | | $ | 136 | |
Miscellaneous income | | | 7 | |
| | |
|
|
|
Total Income | | | 143 | |
| | |
|
|
|
Expenses: | | | | |
Investment advisory fees | | | 15 | |
Administration fees | | | 12 | |
Distribution and/or servicing fees - Administrative Class | | | 4 | |
| | |
|
|
|
Total Expenses | | | 31 | |
| | |
|
|
|
Net Investment Income | | | 112 | |
| | |
|
|
|
Net Realized and Unrealized Gain (Loss): | | | | |
Net realized gain on investments | | | 6 | |
Net realized gain on futures contracts, written options, and swaps | | | 62 | |
Net realized (loss) on foreign currency transactions | | | (2 | ) |
Net change in unrealized appreciation on investments | | | 1 | |
Net change in unrealized appreciation on futures contracts, written options, and swaps | | | 5 | |
Net change in unrealized appreciation on translation of assets and liabilities denominated in foreign currencies | | | 1 | |
Net Gain | | | 73 | |
| | |
|
|
|
Net Increase in Assets Resulting from Operations | | $ | 185 | |
| | |
|
|
|
See accompanying notes | | | 6.30.03 | Semi-Annual Report | | 5 |
Statements of Changes in Net Assets
Short-Term Portfolio
Amounts in thousands
| Increase (Decrease) in Net Assets from: | | Six Months Ended June 30, 2003
| | | Year Ended December 31, 2002
| |
| | | (Unaudited) | | | | |
Operations: | | | | | | | | |
Net investment income | | $ | 112 | | | $ | 227 | |
Net realized gain (loss) | | | 66 | | | | (25 | ) |
Net change in unrealized appreciation | | | 7 | | | | 50 | |
| | |
|
|
| |
|
|
|
Net increase resulting from operations | | | 185 | | | | 252 | |
| | |
|
|
| |
|
|
|
Distributions to Shareholders: | | | | | | | | |
From net investment income | | | | | | | | |
Institutional Class | | | (69 | ) | | | (136 | ) |
Administrative Class | | | (58 | ) | | | (91 | ) |
From net realized capital gains | | | | | | | | |
Institutional Class | | | 0 | | | | (7 | ) |
Administrative Class | | | 0 | | | | (6 | ) |
| | |
|
|
| |
|
|
|
Total Distributions | | | (127 | ) | | | (240 | ) |
| | |
|
|
| |
|
|
|
Portfolio Share Transactions: | | | | | | | | |
Receipts for shares sold | | | | | | | | |
Institutional Class | | | 6,317 | | | | 945 | |
Administrative Class | | | 2,511 | | | | 3,406 | |
Issued as reinvestment of distributions | | | | | | | | |
Institutional Class | | | 69 | | | | 142 | |
Administrative Class | | | 58 | | | | 97 | |
Cost of shares redeemed | | | | | | | | |
Institutional Class | | | (1,188 | ) | | | (290 | ) |
Administrative Class | | | (912 | ) | | | (855 | ) |
| | |
|
|
| |
|
|
|
Net increase resulting from Portfolio share transactions | | | 6,855 | | | | 3,445 | |
| | |
|
|
| |
|
|
|
Total Increase in Net Assets | | | 6,913 | | | | 3,457 | |
| | |
|
|
| |
|
|
|
Net Assets: | | | | | | | | |
Beginning of period | | | 9,233 | | | | 5,776 | |
End of period* | | $ | 16,146 | | | $ | 9,233 | |
*Including undistributed (overdistributed) net investment income of: | | $ | (9 | ) | | $ | 6 | |
6 | | Semi-Annual Report | 6.30.03 | | | See accompanying notes |
Schedule of Investments
Short-Term Portfolio
June 30, 2003 (Unaudited)
| | | Principal Amount (000s)
| | Value (000s)
|
CORPORATE BONDS & NOTES 20.2% | | | | | | |
Banking & Finance 7.0% | | | | | | |
Bear Stearns Cos., Inc. | | | | | | |
1.676% due 09/21/2004 (a) | | $ | 100 | | $ | 100 |
CIT Group, Inc. | | | | | | |
5.500% due 02/15/2004 | | | 130 | | | 133 |
Deutsche Telekom International Finance BV | | | | | | |
8.250% due 06/15/2005 | | | 80 | | | 89 |
Ford Motor Credit Co. | | | | | | |
2.040% due 03/08/2004 (a) | | | 100 | | | 100 |
General Motors Acceptance Corp. | | | | | | |
1.390% due 08/18/2003 (a) | | | 104 | | | 104 |
1.990% due 05/17/2004 (a) | | | 100 | | | 99 |
4.500% due 07/15/2006 | | | 30 | | | 30 |
Household International Netherlands BV | | | | | | |
6.200% due 12/01/2003 | | | 105 | | | 107 |
Merrill Lynch & Co., Inc. | | | | | | |
1.578% due 05/21/2004 (a) | | | 105 | | | 105 |
Popular North America, Inc. | | | | | | |
6.625% due 01/15/2004 | | | 60 | | | 62 |
U.S. Bank National Association | | | | | | |
1.360% due 11/14/2003 (a) | | | 90 | | | 90 |
Unibank A/S | | | | | | |
1.680% due 05/28/2007 (a) | | | 50 | | | 50 |
Verizon Wireless Capital LLC | | | | | | |
1.658% due 12/17/2003 (a) | | | 60 | | | 60 |
| | | | | |
|
|
| | | | | | | 1,129 |
| | | | | |
|
|
Industrials 7.0% | | | | | | |
Clear Channel Communications, Inc. | | | | | | |
7.250% due 09/15/2003 | | | 50 | | | 51 |
DaimlerChrysler North America Holding Corp. | | | | | | |
1.810% due 08/01/2003 (a) | | | 200 | | | 200 |
HCA, Inc. | | | | | | |
6.730% due 07/15/2045 | | | 50 | | | 50 |
Kellogg Co. | | | | | | |
6.625% due 01/29/2004 | | | 60 | | | 62 |
Kraft Foods, Inc. | | | | | | |
2.080% due 02/27/2004 (a) | | | 100 | | | 99 |
Newell Co. | | | | | | |
5.700% due 09/22/2003 | | | 50 | | | 50 |
Norfolk Southern Corp. | | | | | | |
7.875% due 02/15/2004 | | | 100 | | | 104 |
Park Place Entertainment Corp. | | | | | | |
7.950% due 08/01/2003 | | | 90 | | | 90 |
Raytheon Co. | | | | | | |
5.700% due 11/01/2003 | | | 50 | | | 50 |
Safeway, Inc. | | | | | | |
6.050% due 11/15/2003 | | | 80 | | | 81 |
TCI Communications, Inc. | | | | | | |
8.650% due 09/15/2004 | | | 40 | | | 43 |
Time Warner, Inc. | | | | | | |
7.975% due 08/15/2004 | | | 100 | | | 106 |
Weyerhaeuser Co. | | | | | | |
2.243% due 09/15/2003 (a) | | | 150 | | | 150 |
| | | | | |
|
|
| | | | | | | 1,136 |
| | | | | |
|
|
Utilities 6.2% | | | | | | |
ALLETE, Inc. | | | | | | |
2.179% due 10/20/2003 (a) | | | 100 | | | 100 |
Appalachian Power Co. | | | | | | |
1.990% due 08/20/2003 (a) | | | 90 | | | 90 |
AT&T Corp. | | | | | | |
6.375% due 03/15/2004 | | | 110 | | | 113 |
Baltimore Gas & Electric Co. | | | | | | |
6.125% due 07/01/2003 | | | 60 | | | 60 |
British Telecom PLC | | | | | | |
2.413% due 12/15/2003 (a) | | | 100 | | | 100 |
Commonwealth Edison Co. | | | | | | |
1.915% due 09/30/2003 (a) | | | 100 | | | 100 |
DTE Energy Co. | | | | | | |
6.000% due 06/01/2004 | | | 25 | | | 26 |
Entergy Gulf States Inc | | | | | | |
3.600% due 06/01/2008 | | | 100 | | | 100 |
Florida Power Corp. | | | | | | |
6.000% due 07/01/2003 | | | 50 | | | 50 |
Niagara Mohawk Power Co. | | | | | | |
7.375% due 07/01/2003 | | $ | 76 | | $ | 76 |
Ohio Edison Co | | | | | | |
4.000% due 05/01/2008 | | | 30 | | | 31 |
Sprint Capital Corp. | | | | | | |
5.700% due 11/15/2003 | | | 150 | | | 151 |
| | | | | |
|
|
| | | | | | | 997 |
| | | | | |
|
|
Total Corporate Bonds & Notes
(Cost $3,243) | | | | | | 3,262 |
| | | | | |
|
|
U.S. GOVERNMENT AGENCIES 2.4% | | | | | | |
Federal Home Loan Bank | | | | | | |
6.270% due 08/26/2004 | | | 175 | | | 184 |
3.250% due 09/26/2005 | | | 200 | | | 201 |
| | | | | |
|
|
Total U.S. Government Agencies
(Cost $385) | | | | | | 385 |
| | | | | |
|
|
U.S. TREASURY OBLIGATIONS 3.6% | | | | | | |
Treasury Inflation Protected Securities (c) | | | | | | |
3.375% due 01/15/2007 | | | 35 | | | 38 |
3.625% due 01/15/2008 | | | 478 | | | 536 |
| | | | | |
|
|
Total U.S. Treasury Obligations
(Cost $580) | | | | | | 574 |
| | | | | |
|
|
MORTGAGE-BACKED SECURITIES 14.4% | | | | | | |
Collateralized Mortgage Obligations 6.8% | | | | | | |
Bank of America Mortgage Securities, Inc. | | | | | | |
6.357% due 07/25/2032 (a) | | | 64 | | | 66 |
5.768% due 10/20/2032 (a) | | | 49 | | | 51 |
Bear Stearns Adjustable Rate Mortgage Trust | | | | | | |
6.158% due 01/25/2032 (a) | | | 15 | | | 15 |
Countrywide Home Loans, Inc. | | | | | | |
4.855% due 09/19/2032 (a) | | | 41 | | | 42 |
CS First Boston Mortgage Securities Corp. | | | | | | |
1.931% due 03/25/2032 (a) | | | 230 | | | 226 |
5.726% due 05/25/2032 (a) | | | 39 | | | 40 |
1.375% due 07/25/2032 (a) | | | 68 | | | 68 |
First Republic Mortgage Loan Trust | | | | | | |
1.480% due 08/15/2032 (a) | | | 96 | | | 95 |
Freddie Mac | | | | | | |
5.500% due 08/15/2004 | | | 21 | | | 21 |
5.625% due 07/15/2028 | | | 55 | | | 56 |
5.750% due 06/15/2029 | | | 39 | | | 40 |
5.750% due 05/15/2031 | | | 50 | | | 50 |
Sequoia Mortgage Trust | | | | | | |
1.668% due 04/20/2033 (a)(g) | | | 60 | | | 60 |
Structured Asset Mortgage Investments, Inc. | | | | | | |
1.422% due 09/19/2032 (a) | | | 94 | | | 94 |
Wachovia Bank Commercial Mortgage Trust | | | | | | |
1.225% due 06/15/2013 (a) | | | 40 | | | 40 |
Washington Mutual Mortgage Securities Corp. | | | | | | |
5.780% due 02/25/2031 | | | 88 | | | 89 |
5.207% due 10/25/2032 (a) | | | 40 | | | 41 |
| | | | | |
|
|
| | | | | | | 1,094 |
| | | | | |
|
|
Fannie Mae 4.9% | | | | | | |
5.500% due 11/01/2016-09/01/2017 (b) | | | 650 | | | 676 |
6.000% due 06/01/2017 | | | 117 | | | 122 |
| | | | | |
|
|
| | | | | | | 798 |
| | | | | |
|
|
Freddie Mac 1.2% | | | | | | |
6.500% due 08/01/2032 | | | 51 | | | 54 |
9.500% due 12/01/2019 | | | 121 | | | 135 |
| | | | | |
|
|
| | | | | | | 189 |
| | | | | |
|
|
Government National Mortgage Association 1.5% | | | | | | |
4.000% due 02/20/2032 (a) | | | 195 | | | 202 |
6.000% due 03/15/2032 | | | 36 | | | 38 |
| | | | | |
|
|
| | | | | | | 240 |
| | | | | |
|
|
Total Mortgage-Backed Securities
(Cost $2,317) | | | | | | 2,321 |
| | | | | |
|
|
ASSET-BACKED SECURITIES 3.2% | | | | | | |
Bear Stearns Asset-Backed Securities, Inc. | | | | | | |
1.365% due 10/25/2032 (a) | | $ | 28 | | $ | 28 |
CDC Mortgage Capital Trust | | | | | | |
1.375% due 01/25/2032 (a) | | | 80 | | | 80 |
Contimortgage Home Equity Loan Trust | | | | | | |
1.360% due 04/15/2029 (a) | | | 100 | | | 100 |
CS First Boston Mortgage Securities Corp. | | | | | | |
1.475% due 08/25/2032 (a) | | | 27 | | | 27 |
Financial Asset Securities Corp. AAA Trust | | | | | | |
1.310% due 09/25/2033 (a) | | | 38 | | | 38 |
First Franklin Mortgage Loan Trust Asset-Backed Certificates | | | | | | |
1.385% due 09/25/2032 (a) | | | 75 | | | 76 |
Irwin Home Equity Loan Trust | | | | | | |
1.305% due 07/25/2032 (a) | | | 60 | | | 60 |
Morgan Stanley Dean Witter Capital I | | | | | | |
1.405% due 07/25/2030 (a) | | | 25 | | | 25 |
Renaissance Home Equity Loan Trust | | | | | | |
1.475% due 08/25/2033 (a) | | | 20 | | | 20 |
Saxon Asset Securities Trust | | | | | | |
1.435% due 12/25/2032 (a) | | | 26 | | | 26 |
Terwin Mortgage Trust | | | | | | |
1.000% due 06/25/2033 (a) | | | 30 | | | 30 |
| | | | | |
|
|
Total Asset-Backed Securities
(Cost $509) | | | | | | 510 |
| | | | | |
|
|
SOVEREIGN ISSUES 1.6% | | | | | | |
Province of Alberta | | | | | | |
4.875% due 10/29/2003 | | | 100 | | | 101 |
Republic of Brazil | | | | | | |
2.125% due 04/15/2006 (a) | | | 106 | | | 99 |
10.000% due 01/16/2007 | | | 30 | | | 31 |
2.187% due 04/15/2009 (a) | | | 35 | | | 30 |
| | | | | |
|
|
Total Sovereign Issues
(Cost $256) | | | | | | 261 |
| | | | | |
|
|
SHORT-TERM INSTRUMENTS 54.9% | | | | | | |
Commercial Paper 53.8% | | | | | | |
Barclays U.S. Funding Corp. | | | | | | |
0.930% due 08/25/2003 | | | 200 | | | 200 |
CBA Finance, Inc. | | | | | | |
1.220% due 08/01/2003 | | | 400 | | | 400 |
Danske Corp. | | | | | | |
1.190% due 08/21/2003 | | | 300 | | | 299 |
0.915% due 09/19/2003 | | | 100 | | | 100 |
Fannie Mae | | | | | | |
1.200% due 07/16/2003 | | | 500 | | | 500 |
1.135% due 08/13/2003 | | | 200 | | | 200 |
1.150% due 08/13/2003 | | | 1,000 | | | 999 |
1.165% due 08/13/2003 | | | 500 | | | 499 |
Federal Home Loan Bank | | | | | | |
1.175% due 07/02/2003 | | | 1,300 | | | 1,300 |
1.135% due 11/05/2003 | | | 200 | | | 199 |
Freddie Mac | | | | | | |
1.195% due 07/17/2003 | | | 600 | | | 600 |
1.110% due 08/21/2003 | | | 1,800 | | | 1,797 |
HBOS Treasury Services PLC | | | | | | |
1.195% due 08/20/2003 | | | 300 | | | 299 |
Royal Bank of Scotland PLC | | | | | | |
1.215% due 07/08/2003 | | | 500 | | | 500 |
Shell Finance PLC | | | | | | |
1.190% due 08/14/2003 | | | 400 | | | 399 |
UBS Finance, Inc. | | | | | | |
1.210% due 07/08/2003 | | | 400 | | | 400 |
| | | | | |
|
|
| | | | | | | 8,691 |
| | | | | |
|
|
Repurchase Agreement 0.6% | | | | | | |
State Street Bank | | | | | | |
0.800% due 07/01/2003 | | | 91 | | | 91 |
(Dated 06/30/2003. Collateralized by Federal Home Loan Bank 3.375% due 05/14/2004 valued at $97. Repurchase proceeds are $91.) | | | | | | |
| | | | | |
|
|
See accompanying notes | | | 6.30.03 | Semi-Annual Report | | 7 |
| | | Principal Amount (000s)
| | Value (000s)
| |
U.S. Treasury Bills 0.5% | | | | | | | |
1.079% due 08/07/2003-08/14/2003 (b)(d) | | $ | 90 | | $ | 90 | |
| | | | | |
|
|
|
Total Short-Term Instruments
(Cost $8,872) | | | | | | 8,872 | |
| | | | | |
|
|
|
Total Investments 100.3%
(Cost $16,162) | | | | | $ | 16,185 | |
Written Options (e) (0.1%)
(Premiums $26) | | | | | | (11 | ) |
Other Assets and Liabilities (Net) (0.2%) | | | | | | (28 | ) |
| | | | | |
|
|
|
Net Assets 100.0% | | | | | $ | 16,146 | |
| | | | | |
|
|
|
Notes to Schedule of Investments
(amounts in thousands, except number of contracts):
| (a) | | Variable rate security. The rate listed is as of June 30, 2003. |
| (b) | | Securities are grouped by coupon or range of coupons and represent a range of maturities. |
| (c) | | Principal amount of security is adjusted for inflation. |
| (d) | | Securities with an aggregate market value of $90 have been segregated with the custodian to cover margin requirements for the following open futures contracts at June 30, 2003: |
Type
| | # of Contracts
| | Unrealized Appreciation/ (Depreciation)
| |
Euribor Written Put Options Strike @ 97.250 (03/2004) - Short | | 14 | | $ | 10 | |
Euribor Written Put Options Strike @ 97.500 (03/2004) - Short | | 7 | | | 5 | |
Euribor Purchase Put Options Strike @ 95.125 (03/2004) - Long | | 21 | | | 0 | |
Euribor Written Put Options Strike @ 97.000 (12/2004) - Short | | 14 | | | 4 | |
Euribor Purchase Put Options Strike @ 93.750 (12/2004) - Long | | 14 | | | 0 | |
Euribor Written Put Options Strike @ 97.500 (12/2004) - Short | | 3 | | | (2 | ) |
Euribor Purchase Put Options Strike @ 95.000 (12/2004) - Long | | 4 | | | 0 | |
Euribor March Futures (03/2005) - Long | | 1 | | | 0 | |
Euribor June Futures (06/2005) - Long | | 1 | | | (1 | ) |
Euribor September Futures (09/2005) - Long | | 1 | | | (1 | ) |
Eurodollar March Futures (03/2006) - Long | | 1 | | | 0 | |
Eurodollar June Futures (06/2005) - Long | | 1 | | | 1 | |
Eurodollar September Futures (09/2005) - Long | | 1 | | | 1 | |
Eurodollar December Futures (12/2005) - Long | | 1 | | | 0 | |
| | | | |
|
|
|
| | | | | $ | 17 | |
| | | | |
|
|
|
| (e) | | Premiums received on written options: |
Type
| | Notional Amount
| | Premium
| | Value
|
Put - OTC 7 Year Interest Rate Swap | | | | | | | | | |
Strike @ 7.000%** Exp. 01/07/2005 | | $ | 140,000 | | $ | 3 | | $ | 1 |
Call - OTC 7 Year Interest Rate Swap | | | | | | | | | |
Strike @ 5.000%* Exp. 01/07/2005 | | | 140,000 | | | 3 | | | 10 |
| | | | | |
|
| |
|
|
| | | | | | $ | 6 | | $ | 11 |
| | | | | |
|
| |
|
|
Type
| | # of Contracts
| | Premium
| | Value
|
Put - CME Eurodollar March Futures | | | | | | | | |
Strike @ 97.250 Exp. 03/15/2004 | | 4 | | $ | 3 | | $ | 0 |
Put - CME Eurodollar June Futures | | | | | | | | |
Strike @ 97.000 Exp. 06/14/2004 | | 8 | | | 9 | | | 0 |
Put - CME Eurodollar June Futures | | | | | | | | |
Strike @ 97.250 Exp. 06/14/2004 | | 6 | | | 8 | | | 0 |
| | | | |
|
| |
|
|
| | | | | $ | 20 | | $ | 0 |
| | | | |
|
| |
|
|
| * | | The Portfolio will receive a floating rate based on 3-month LIBOR. |
| ** | | The Portfolio will pay a floating rate based on 3-month LIBOR. |
| (f) | | Swap agreements outstanding at June 30, 2003: |
Type
| | Notional Amount
| | Unrealized Appreciation
|
Receive a fixed rate equal to 0.360% and the Portfolio will pay to the counterparty at par in the event of default of General Electric Capital Corp. 5.875% due 02/15/2012. Counterparty: ABN AMRO Bank, N.V. | | | | | | |
Exp. 07/11/2003 | | $ | 50 | | $ | 0 |
Receive a fixed rate equal to 0.410% and the Portfolio will pay to the counterparty at par in the event of default of General Electric Capital Corp. 5.875% due 02/15/2012. Counterparty: Goldman Sachs & Co. | | | | | | |
Exp. 06/07/2004 | | | 100 | | | 0 |
Receive a fixed rate equal to 0.730% and the Portfolio will pay to the counterparty at par in the event of default of the United Mexican States 11.500% due 05/15/2026. Counterparty: Bear, Stearns & Co., Inc. | | | | | | |
Exp. 06/20/2005 | | | 80 | | | 0 |
Receive a fixed rate equal to 0.750% and the Portfolio will pay to the counterparty at par in the event of default of the United Mexican States 8.375% due 01/14/2011. Counterparty: Merrill Lynch & Co., Inc. | | | | | | |
Exp. 12/16/2003 | | | 90 | | | 0 |
Receive a fixed rate equal to 1.450% and the Portfolio will pay to the counterparty at par in the event of default of Republic of Bulgaria 2.813% due 07/28/2011. Counterparty: Goldman Sachs & Co. | | | | | | |
Exp. 04/15/2004 | | | 30 | | | 0 |
Receive a fixed rate equal to 16.500% and the Portfolio will pay to the counterparty at par in the event of default of Federative Republic of Brazil 2.563% due 04/15/2006. Counterparty: Merrill Lynch & Co., Inc. | | | | | | |
Exp. 01/16/2005 | | $ | 75 | | $ | 13 |
| | | | | |
|
|
| | | | | | $ | 13 |
| | | | | |
|
|
| (g) | | Indicates a fair valued security which has not been valued utilizing an independent quote and which is valued pursuant to guidelines established by the Trustees. The aggregate value of fair valued securities is $60, which is 0.37% of net assets. |
8 | | Semi-Annual Report | 6.30.03 | | | See accompanying notes |
Notes to Financial Statements
June 30, 2003 (Unaudited)
1. Organization
The Short-Term Portfolio (the “Portfolio”) is a series of the PIMCO Variable Insurance Trust (the “Trust”). The Trust is registered under the Investment Company Act of 1940 (the “Act”), as amended, as an open-end investment company organized as a Delaware business trust on October 3, 1997. The Trust may offer up to two classes of shares: Institutional and Administrative. Each share class has identical voting rights (except that shareholders of a class have exclusive voting rights regarding any matter relating solely to that class of shares). Information presented in these financial statements pertains to the Institutional Class of the Trust. Certain detailed financial information for the Administrative Class is provided separately and is available upon request. The Trust is designed to be used as an investment vehicle by Separate Accounts of insurance companies that fund variable annuity contracts and variable life insurance policies and by qualified pension and retirement plans. The Portfolio commenced operations on September 30, 1999.
2. Significant Accounting Policies
The following is a summary of significant accounting policies consistently followed by the Trust in the preparation of its financial statements in conformity with accounting principles generally accepted in the United States of America. The preparation of financial statements in accordance with accounting principles generally accepted in the United States of America requires management to make estimates and assumptions that affect the reported amounts and disclosures in the financial statements. Actual results could differ from those estimates.
Security Valuation. Portfolio securities and other financial instruments for which market quotations are readily available are stated at market value. Market value is determined at the close of regular trading (normally, 4:00 p.m., Eastern Time) on the New York Stock Exchange on each day the New York Stock Exchange is open, or if no sales are reported, as is the case for most securities traded over-the-counter, the mean between representative bid and asked quotations obtained from a quotation reporting system or from established market makers. Fixed income securities, including those to be purchased under firm commitment agreements, are normally valued on the basis of quotes obtained from brokers and dealers or pricing services. Short-term investments, which mature in 60 days or less are valued at amortized cost, which approximates market value. Certain fixed income securities for which daily market quotations are not readily available may be valued, pursuant to guidelines established by the Board of Trustees, with reference to fixed income securities whose prices are more readily obtainable. Prices may be obtained from independent pricing services which use information provided by market makers or estimates of market values obtained from yield data relating to investments or securities with similar characteristics. The prices used by the Portfolio may differ from the value that would be realized if the securities were sold and the differences could be material to the financial statements.
Securities Transactions and Investment Income. Securities transactions are recorded as of the trade date. Securities purchased or sold on a when-issued or delayed delivery basis may be settled a month or more after the trade date. Realized gains and losses from securities sold are recorded on the identified cost basis. Dividend income is recorded on the ex-dividend date, except certain dividends from foreign securities where the ex-dividend date may have passed, are recorded as soon as the Portfolio is informed of the ex-dividend date. Interest income, adjusted for the accretion of discounts and amortization of premiums, is recorded on the accrual basis. Paydowns gains and losses on mortgage- and asset-backed securities are recorded as adjustments to interest income in the Statement of Operations.
Dividends and Distributions to Shareholders. Dividends from net investment income, if any, are declared on each day the Trust is open for business and are distributed to shareholders monthly. All dividends are reinvested in additional shares of the Portfolio. Net realized capital gains earned by the Portfolio, if any, will be distributed no less frequently than once each year.
Income dividends and capital gain distributions are determined in accordance with income tax regulations which may differ from accounting principles generally accepted in the United States of America. These differences are primarily due to differing treatments for such items as wash sales, foreign currency transactions, net operating losses and capital loss carryforwards.
Distributions classified as a tax basis return of capital, if any, are reflected in the accompanying Statements of Changes in Net Assets and have been reclassified to paid in capital. In addition, other amounts have been reclassified between undistributed net investment income, accumulated undistributed net realized gains or losses and/or paid in capital to more appropriately conform financial accounting to tax characterizations of dividend distributions.
Foreign Currency. The accounting records of the Portfolio are maintained in U.S. dollars. The market values of foreign securities, currency holding and other assets and liabilities are translated into U.S. dollars based on the current exchange rates each business day. Fluctuations in the value of these assets and liabilities resulting from changes in exchange rates are recorded as unrealized foreign currency gains or losses. Realized gains or losses and unrealized appreciation (depreciation) on investment securities and income and expenses are translated on the respective dates of such transactions. The effect of changes in foreign currency exchange rates on investments in securities are not
6.30.03 | Semi-Annual Report | | 9 |
segregated in the Statement of Operations from the effects of changes in market prices of those securities, but are included with the net realized and unrealized gain or loss on investment securities.
Multiclass Operations. Each class offered by the Trust has equal rights as to assets. Income, non-class specific expenses, and realized and unrealized capital gains and losses are allocated to each class of shares based on the relative net assets of each class.
Federal Income Taxes. The Portfolio intends to qualify as a regulated investment company and distribute all of its taxable income and net realized gains, if applicable, to shareholders. Accordingly, no provision for Federal income taxes has been made.
Futures Contracts. The Portfolio is authorized to enter into futures contracts. The Portfolio may use futures contracts to manage its exposure to the securities markets or to movements in interest rates and currency values. The primary risks associated with the use of futures contracts are imperfect correlation between the change in market value of the securities held by the Portfolio and the prices of futures contracts, the possibility of an illiquid market, and the inability of the counterparty to meet the terms of the contract. Futures contracts are valued based upon their quoted daily settlement prices. Upon entering into a futures contract, the Portfolio may be required to deposit with its custodian, in a segregated account in the name of the futures broker, an amount of cash or U.S. Government and Agency Obligations in accordance with the initial margin requirements of the broker or exchange. Futures contracts are marked to market daily and an appropriate payable or receivable for the change in value (“variation margin”) is recorded by the Portfolio. Gains or losses are recognized but not considered realized until the contracts expire or are closed. Futures contracts involve, to varying degrees, risk of loss in excess of the variation margin disclosed in the Statement of Assets and Liabilities.
Options Contracts. The Portfolio may write call and put options on futures, securities or currencies it owns or in which it may invest. Writing put options tends to increase the Portfolio’s exposure to the underlying instrument. Writing call options tends to decrease the Portfolio’s exposure to the underlying instrument. When the Portfolio writes a call or put option, an amount equal to the premium received is recorded as a liability and subsequently marked to market to reflect the current value of the option written. Payment received or made, if any, from writing options with premiums to be determined on a future date are reflected as such on the Statement of Assets and Liabilities. Premiums received from writing options which expire are treated as realized gains. Premiums received from writing options which are exercised or closed are added to the proceeds or offset against amounts paid on the underlying future, security or currency transaction to determine the realized gain or loss. The Portfolio as a writer of an option has no control over whether the underlying future, security or currency may be sold (call) or purchased (put) and as a result bears the market risk of an unfavorable change in the price of the future, security or currency underlying the written option. There is the risk the Portfolio may not be able to enter into a closing transaction because of an illiquid market.
The Portfolio may also purchase put and call options. Purchasing call options tends to increase the Portfolio’s exposure to the underlying instrument. Purchasing put options tends to decrease the Portfolio’s exposure to the underlying instrument. The Portfolio pays a premium which is included in the Portfolio’s Statement of Assets and Liabilities as an investment and subsequently marked to market to reflect the current value of the option. Premiums paid for purchasing options which expire are treated as realized losses. The risk associated with purchasing put and call options is limited to the premium paid. Premiums paid for purchasing options which are exercised or closed are added to the amounts paid or offset against the proceeds on the underlying future, security or currency transaction to determine the realized gain or loss.
Swap Agreements. The Portfolio may invest in swap agreements. A swap is an agreement to exchange the return generated by one instrument for the return generated by another instrument. The Portfolio may enter into interest rate, total return, forward swap spread lock and credit default swap agreements to manage its exposure to interest rates and credit risk. Interest rate swap agreements involve the exchange by the Portfolio with another party of their respective commitments to pay or receive interest, e.g., an exchange of floating rate payments for fixed rate payments with respect to a notional amount of principal. Total return swap agreements involve commitments to pay interest in exchange for a market-linked return, both based on notional amounts. To the extent the total return of the security or index underlying the transaction exceeds or falls short of the offsetting interest rate obligation, the Portfolio will receive a payment from or make a payment to the counterparty. Forward spread lock swap agreements involve commitments to pay or receive a settlement amount calculated as the difference between the swap spread and a fixed spread, multiplied by the notional amount times the duration of the swap. The swap spread is the difference between the benchmark swap rate (market rate) and the specific Treasury rate. In a credit default swap, one party makes a stream of payments to another party in exchange for the right to receive a specified return in the event of a default by a third party, typically corporate issues or sovereign issues of an emerging country, on its obligation. The Portfolio may use credit default swaps to provide a measure of protection against defaults of
10 | | Semi-Annual Report | 6.30.03 |
sovereign issuers (i.e., to reduce risk where the Portfolio owns or has exposure to the sovereign issuer) or to take an active long or short position with respect to the likelihood of a particular issuer’s default. Swaps are marked to market daily based upon quotations from market makers and vendors and the change in value, if any, is recorded as unrealized gain or loss in the Statement of Operations. Payments received or made at the beginning of the measurement period are reflected as such on the Statement of Assets and Liabilities. A liquidation payment received or made at the termination of the swap is recorded as realized gain or loss in the Statement of Operations. Net periodic payments are included as part of miscellaneous income on the Statement of Operations. Entering into these agreements involves, to varying degrees, elements of credit, market and documentation risk in excess of the amounts recognized on the Statement of Assets and Liabilities. Such risks involve the possibility that there will be no liquid market for these agreements, that the counterparty to the agreements may default on its obligation to perform or disagree as to the meaning of contractual terms in the agreements, and that there may be unfavorable changes in interest rates.
Delayed Delivery Transactions. The Portfolio may purchase or sell securities on a when-issued or delayed delivery basis. These transactions involve a commitment by the Portfolio to purchase or sell securities for a predetermined price or yield, with payment and delivery taking place beyond the customary settlement period. When delayed delivery purchases are outstanding, the Portfolio will set aside and maintain until the settlement date in a segregated account, liquid assets in an amount sufficient to meet the purchase price. When purchasing a security on a delayed delivery basis, the Portfolio assumes the rights and risks of ownership of the security, including the risk of price and yield fluctuations, and takes such fluctuations into account when determining its net asset value. The Portfolio may dispose of or renegotiate a delayed delivery transaction after it is entered into, and may sell when-issued securities before they are delivered, which may result in a capital gain or loss. When the Portfolio has sold a security on a delayed delivery basis, the Portfolio does not participate in future gains and losses with respect to the security.
Inflation-Indexed Bonds. Inflation-indexed bonds are fixed income securities whose principal value is periodically adjusted to the rate of inflation. The interest rate on these bonds is generally fixed at issuance at a rate lower than typical bonds. Over the life of an inflation-indexed bond, however, interest will be paid based on a principal value, which is adjusted for inflation. Any increase in the principal amount of an inflation-indexed bond will be included as interest income in the Statement of Operations, even though investors do not receive their principal until maturity.
Repurchase Agreements. The Portfolio may engage in repurchase transactions. Under the terms of a typical repurchase agreement, the Portfolio takes possession of an underlying debt obligation subject to an obligation of the seller to repurchase, and the Portfolio to resell, the obligation at an agreed-upon price and time. The market value of the collateral must be equal at all times to the total amount of the repurchase obligations, including interest. Generally, in the event of counterparty default, the Portfolio has the right to use the collateral to offset losses incurred.
3. Fees, Expenses, and Related Party Transactions
Investment Advisory Fee. Pacific Investment Management Company LLC (PIMCO) is a majority owned subsidiary partnership of Allianz Dresdner Asset Management of America L.P. (formerly PIMCO Advisors L.P.) and serves as investment adviser (the “Adviser”) to the Trust, pursuant to an investment advisory contract. The Adviser receives a monthly fee at an annual rate based on average daily net assets of the Portfolio. The Advisory Fee is charged at an annual rate of 0.25%.
Administration Fee. PIMCO serves as administrator (the “Administrator”) and provides administrative services to the Trust for which it receives a monthly administrative fee based on average daily net assets of the Portfolio. The Administration Fee is charged at the annual rate of 0.20%.
Servicing Fee. PIMCO Advisors Distributors LLC (“PAD”), is an indirect wholly-owned subsidiary of Allianz Dresdner Asset Management of America L.P. and serves as the distributor of the Trust’s shares. The Trust is permitted to reimburse PAD on a quarterly basis, out of the Administrative Class assets of the Portfolio in the amount of 0.15% on an annual basis of the average daily net assets of that class, for payments made to financial intermediaries that provide services in connection with the distribution of shares or administration of plans or programs that use Portfolio shares as their funding medium. The effective rate paid to PAD during the current fiscal year is 0.15%.
Expenses. The Portfolio is responsible for the following expenses: (i) salaries and other compensation of any of the Trust’s executive officers and employees who are not officers, directors, stockholders or employees of PIMCO or its subsidiaries or affiliates; (ii) taxes and governmental fees; (iii) brokerage fees and commissions and other portfolio transaction expenses; (iv) the cost of borrowing money, including interest expense; (v) fees and expenses of the Trustees who are not “interested persons” of PIMCO or the Trust, and any counsel retained exclusively for their benefit; (vi) extraordinary expenses, including costs of litigation and indemnification expenses; (vii) organization expenses and (viii) any expenses allocated or allocable to a specific class of shares, which include service fees payable with respect to
6.30.03 | Semi-Annual Report | | 11 |
the Administrative Class shares and may include certain other expenses as permitted by the Trust’s Multiple Class Plan adopted pursuant to Rule 18f-3 under the Act and subject to review and approval by the Trustees. The ratio of expenses to average net assets per share class, as disclosed in the Financial Highlights, may differ from the annual Portfolio operating expenses per share class as disclosed in the Prospectus for the reasons set forth above. PIMCO has agreed to waive a portion of its administrative fees to the extent that the payment of the Portfolio’s pro rata share of Trustees’ fees causes the actual expense ratio to rise above the rates disclosed in the current prospectus plus 0.49 basis points as set forth below (calculated as a percentage of the Portfolio’s average daily net assets attributable to each class):
| | | Institutional Class
| | | Administrative Class
| |
Short-Term Portfolio | | 0.45 | % | | 0.60 | % |
PIMCO may be reimbursed for these waived amounts in future periods. The Trust pays no compensation directly to any Trustee or any other officer who is affiliated with the Administrator, all of whom receive renumeration for their services to the Trust from the Administrator or its affiliates.
Each unaffiliated Trustee receives an annual retainer of $4,000, plus $1,500 for each Board of Trustees meeting attended in person and $250 for each meeting attended telephonically, plus reimbursement of related expenses. In addition, each committee chair receives an additional annual retainer of $500. These expenses are allocated on a pro-rata basis to each Portfolio of the Trust according to its respective net assets.
4. Purchases and Sales of Securities
Purchases and sales of securities (excluding short-term investments) for the period ended June 30, 2003 were as follows (amounts in thousands):
| | | U.S Government/Agency
| | All Other
|
| | | Purchases
| | Sales
| | Purchases
| | Sales
|
Short-Term Portfolio | | $ | 2,716 | | $ | 1,641 | | $ | 2,903 | | $ | 2,898 |
5. Transactions in Written Call and Put Options
Transactions in written call and put options were as follows (amounts in thousands):
| | | Short-Term Portfolio
| |
| | | | | Premium
| |
Balance at 12/31/2002 | | | | $ | 37 | |
Sales | | | | | 30 | |
Closing Buys | | | | | (41 | ) |
Expirations | | | | | 0 | |
Exercised | | | | | 0 | |
| | | | |
|
|
|
Balance at 06/30/2003 | | | | $ | 26 | |
| | | | |
|
|
|
12 | | Semi-Annual Report | 6.30.03 |
6. Federal Income Tax Matters
At June 30, 2003, the aggregate cost of investments was the same for federal income tax and financial statement purposes. The net unrealized appreciation (depreciation) of investments securities for federal income tax purposes is as follows (amounts in thousands):
| | | Aggregate Gross Unrealized Appreciation
| | Aggregate Gross Unrealized (Depreciation)
| | | Net Unrealized Appreciation
|
Short-Term Portfolio | | $ | 41 | | $ | (18 | ) | | $ | 23 |
7. Shares of Beneficial Interest
The Trust may issue an unlimited number of shares of beneficial interest with a $.0001 par value. Changes in shares of beneficial interest were as follows (shares and amounts in thousands):
| | | Short-Term Portfolio
| |
| | | Six Months Ended
06/30/2003 | | | Year Ended
12/31/2002 | |
| | | Shares
| | | Amount
| | | Shares
| | | Amount
| |
Receipts for shares sold | | | | | | | | | | | | | | |
Institutional Class | | 624 | | | $ | 6,317 | | | 95 | | | $ | 945 | |
Administrative Class | | 248 | | | | 2,511 | | | 339 | | | | 3,406 | |
Issued as reinvestment of distributions
| | | | | | | | | | | | | | |
Institutional Class | | 7 | | | | 69 | | | 14 | | | | 142 | |
Administrative Class | | 6 | | | | 58 | | | 10 | | | | 97 | |
Cost of shares redeemed
| | | | | | | | | | | | | | |
Institutional Class | | (118 | ) | | | (1,188 | ) | | (29 | ) | | | (290 | ) |
Administrative Class | | (90 | ) | | | (912 | ) | | (85 | ) | | | (855 | ) |
| | |
|
| |
|
|
| |
|
| |
|
|
|
Net increase resulting from Portfolio share transactions | | 677 | | | $ | 6,855 | | | 344 | | | $ | 3,445 | |
| | |
|
| |
|
|
| |
|
| |
|
|
|
The following schedule shows the number of shareholders each owning 5% or more of the Portfolio and the total percentage of the Portfolio held by such shareholders:
| | | Number
| | % of Portfolio Held
|
Short-Term Portfolio | | | | |
Institutional Class | | 3 | | 99 |
Administrative Class | | 4 | | 92 |
6.30.03 | Semi-Annual Report | | 13 |
Trustees and Officers
Brent R. Harris, Chairman and Trustee
R. Wesley Burns, President and Trustee
E. Philip Cannon, Trustee
Vern O. Curtis, Trustee
J. Michael Hagan, Trustee
William J. Popejoy, Trustee
Garlin G. Flynn, Secretary
John P. Hardaway, Treasurer
Investment Adviser and Administrator
Pacific Investment Management Company LLC
840 Newport Center Drive
Newport Beach, California 92660
Transfer Agent
National Financial Data Services
330 W. 9th Street, 4th Floor
Kansas City, Missouri 64105
Custodian
State Street Bank & Trust Company
801 Pennsylvania
Kansas City, Missouri 64105
Counsel
Dechert LLP
1775 I Street, N.W.
Washington, D.C. 20006
Independent Accountants
PricewaterhouseCoopers LLP
1055 Broadway
Kansas City, Missouri 64105
PIMCO VARIABLE INSURANCE TRUST
This report is submitted for the general information of the shareholders of the PIMCO Variable Insurance Trust. It is not authorized for distribution to prospective investors unless accompanied or preceded by an effective prospectus for the PIMCO Variable Insurance Trust, which contains information covering its investment policies as well as other pertinent information.
All Funds distributed by PIMCO ADVISORS DISTRIBUTORS LLC, member NASD
840 NEWPORT CENTER DRIVE
NEWPORT BEACH, CA 92660
800.927.4648
WWW.PIMCOADVISORS.COM
WWW.PIMCO.COM
| P I M C O |
| PIMCO VARIABLE INSURANCE TRUST |
| STOCKSPLUS GROWTHAND INCOME PORTFOLIO |
| INSTITUTIONAL CLASS |
|
| SEMI-ANNUAL REPORT |
| June 30, 2003 |
| | | Fund Summary
| | Schedule of Investments
|
StocksPLUS Growth and Income Portfolio (Institutional Class) | | 2 | | 7 |
Chairman’s Letter
Dear PIMCO Variable Insurance Trust Shareholder:
Financial assets gained during the first half of 2003 amid a revival of risk appetites as anxiety about the war in Iraq faded. Assets that generally benefit from economic growth, such as stocks, corporate bonds and emerging market debt, fared the best year-to-date as investors returned to these sectors in anticipation of a recovery in the second half of 2003. Reflationary forces that investors expected to fuel a rebound included federal tax cuts and a weak dollar, as well as low borrowing rates that eased the burden of high personal and corporate indebtedness. Low mortgage rates kept refinancings booming in the second quarter and put more money in consumers’ pockets.
U.S. Treasuries lagged their riskier counterparts but still enjoyed a modest rally. Yields fell to levels not seen in 45 years early in the second quarter before bouncing off their lows in June as hopes for recovery increased. The yield on the benchmark 10-year Treasury closed the six-month period 0.30% lower to 3.51%, after nearing 3% earlier in the period. Buyers were encouraged that inflation would remain tame amid low capacity utilization and weak employment growth. Asian central banks bought U.S. Treasuries to limit the rise in their currencies versus the dollar in an effort to protect their export industries. In June, the Federal Reserve cut the federal funds rate by 0.25% to 1%, its 13th easing since 2001, in an effort to boost the economy and ward off deflation. Although the cut was less than expected, the Fed suggested that rates would stay low until deflation risks abated.
On the following pages you will find specific details as to the Portfolio’s total return investment performance and a discussion of those factors that affected performance.
We appreciate the trust you have placed in us, and we will continue to focus our efforts to meet your investment needs.
Sincerely,
Brent R. Harris
Chairman
July 31, 2003
6.30.03 | Semi-Annual Report | | 1 |
StocksPLUS Growth and Income Portfolio
TOTAL RETURN INVESTMENT PERFORMANCE For the period ended June 30, 2003
| | | 1 Year | | | Since Inception* | |
StocksPLUS Growth and Income Portfolio Institutional Class | | 1.46 | % | | -9.07 | % |
S&P 500 Index | | 0.25 | % | | — | |
| * | | Annualized (All Portfolio returns are net of fees and expenses) |
CUMULATIVE RETURNS THROUGH JUNE 30, 2003
$10,000 invested at inception
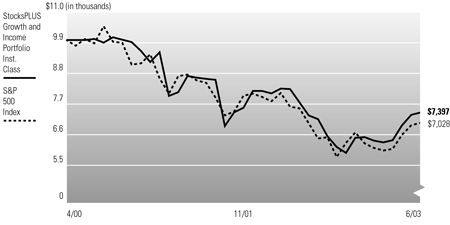
Past performance is no guarantee of future results. Investment return and principal value will fluctuate so that Portfolio shares, when redeemed, may be worth more or less than their original cost. The line graph above assumes the investment of $10,000 on 5/01/2000, the first full month following the Portfolio’s Institutional Class inception on 4/28/2000, compared to the S&P 500 Index, which is an unmanaged market index. It is not possible to invest directly in the Index. The Portfolio may invest in foreign securities which involve potentially higher risks including foreign currency fluctuations and political or economic uncertainty. These risks may be enhanced when investing in emerging market securities.
PORTFOLIO INSIGHTS
| • | | The StocksPLUS Growth & Income Portfolio seeks to exceed the total return of the S&P 500 by investing under normal circumstances substantially all of its assets in S&P 500 derivatives, backed by a portfolio of Fixed Income Instruments. |
| • | | The S&P 500 Index delivered a total return of 11.76% in the first half of 2003, as the stock market rallied in association with fading concern about the war in Iraq and increasing investor confidence. |
| • | | The Portfolio’s Institutional Class posted a total return of 13.60%, outperforming the S&P 500 Index by 1.56% in the first half of 2003. |
| • | | A duration longer than the effective benchmark was positive for performance as short-term interest rates fell modestly due to Fed easing and continued economic uncertainty. |
| • | | Mortgage-backed securities enhanced the Portfolio’s yield and credit quality, although the sector detracted from overall performance due to increased prepayment risk. |
| • | | Corporate holdings provided high relative yields and generally positive price performance as credit risk premiums fell. |
| • | | A small position in emerging market bonds boosted returns. This asset class continued to gain amid strong demand from investors drawn to relatively high yields and improving credit quality. |
| • | | Short maturity Eurozone exposure was a slight positive for performance; yields on these maturities fell more than U.S. rates amid expectations of more easing by the European Central Bank. |
2 | | Semi-Annual Report | 6.30.03 |
Financial Highlights
StocksPLUS Growth and Income Portfolio (Institutional Class)
| Selected Per Share Data for the Year or Period Ended: | | 06/30/2003 +
| | | 12/31/2002
| | | 12/31/2001
| | | 04/10/2000-12/31/2000
| |
Net asset value beginning of period | | $ | 7.27 | | | $ | 9.36 | | | $ | 11.05 | | | $ | 13.21 | |
Net investment income (a) | | | 0.10 | | | | 0.23 | | | | 0.45 | | | | 0.49 | |
Net realized/unrealized (loss) on investments (a) | | | 0.99 | | | | (2.10 | ) | | | (1.71 | ) | | | (1.48 | ) |
Total loss from investment operations | | | 1.09 | | | | (1.87 | ) | | | (1.26 | ) | | | (0.99 | ) |
Dividends from net investment income | | | (0.19 | ) | | | (0.22 | ) | | | (0.43 | ) | | | (0.63 | ) |
Distributions from net realized capital gains | | | 0.00 | | | | 0.00 | | | | 0.00 | | | | (0.54 | ) |
Total distributions | | | (0.19 | ) | | | (0.22 | ) | | | (0.43 | ) | | | (1.17 | ) |
Net asset value end of period | | $ | 8.17 | | | $ | 7.27 | | | $ | 9.36 | | | $ | 11.05 | |
Total return | | | 13.60 | % | | | (20.08 | )% | | | (11.28 | )% | | | (7.91 | )% |
Net assets end of period (000s) | | $ | 1,705 | | | $ | 786 | | | $ | 187 | | | $ | 63 | |
Ratio of expenses to average net assets | | | 0.50 | %* | | | 0.50 | %(d) | | | 0.52 | %(b)(c) | | | 0.50 | %* |
Ratio of net investment income to average net assets | | | 2.71 | %* | | | 2.84 | % | | | 4.60 | % | | | 5.79 | %* |
Portfolio turnover rate | | | 69 | % | | | 192 | % | | | 547 | % | | | 350 | % |
| (a) | | Per share amounts based on average number of shares outstanding during the period. |
| (b) | | Ratio of expenses to average net assets excluding interest expense is 0.50%. |
| (c) | | If the investment manager had not reimbursed expenses, the ratio of operating expenses to average net assets would have been 0.53% for the year ended December 31, 2001. |
| (d) | | If the investment manager had not reimbursed expenses, the ratio of operating expenses to average net assets would have been 0.51% for the year ended December 31, 2002. |
See accompanying notes | | | 6.30.03 | Semi-Annual Report | | 3 |
Statement of Assets and Liabilities
StocksPLUS Growth and Income Portfolio
June 30, 2003 (Unaudited)
Amounts in thousands, except per share amounts
Assets: | | | | |
Investments, at value | | $ | 263,199 | |
Cash | | | 2 | |
Foreign currency, at value | | | 978 | |
Receivable for investments sold | | | 9,030 | |
Unrealized appreciation on forward foreign currency contracts | | | 4 | |
Receivable for Portfolio shares sold | | | 140 | |
Interest receivable | | | 707 | |
Variation margin receivable | | | 750 | |
Swap premiums paid | | | 3 | |
Unrealized appreciation on swap agreements | | | 161 | |
Other assets | | | 1 | |
| | |
|
|
|
| | | | 274,975 | |
| | |
|
|
|
Liabilities: | | | | |
Payable for investments purchased | | $ | 28,040 | |
Written options outstanding | | | 67 | |
Payable for Portfolio shares redeemed | | | 1,333 | |
Accrued investment advisory fee | | | 80 | |
Accrued administration fee | | | 20 | |
Accrued servicing fee | | | 31 | |
Variation margin payable | | | 742 | |
Unrealized depreciation on swap agreements | | | 5 | |
Other liabilities | | | 5 | |
| | |
|
|
|
| | | | 30,323 | |
| | |
|
|
|
Net Assets | | $ | 244,652 | |
| | |
|
|
|
Net Assets Consist of: | | | | |
Paid in capital | | $ | 364,842 | |
Undistributed net investment income | | | 1,891 | |
Accumulated undistributed net realized (loss) | | | (124,018 | ) |
Net unrealized appreciation | | | 1,937 | |
| | |
|
|
|
| | | $ | 244,652 | |
| | |
|
|
|
Net Assets: | | | | |
Institutional Class | | $ | 1,705 | |
Administrative Class | | | 242,947 | |
Shares Issued and Outstanding: | | | | |
Institutional Class | | | 209 | |
Administrative Class | | | 29,825 | |
Net Asset Value and Redemption Price Per Share (Net Assets Per Share Outstanding) | | | | |
Institutional Class | | $ | 8.17 | |
Administrative Class | | | 8.15 | |
Cost of Investments Owned | | $ | 262,660 | |
Cost of Foreign Currency Held | | $ | 985 | |
4 | | Semi-Annual Report | 6.30.03 | | | See accompanying notes |
Statement of Operations
StocksPLUS Growth and Income Portfolio
For the six months ended June 30, 2003 (Unaudited)
Amounts in thousands
Investment Income: | | | | |
Interest | | $ | 2,980 | |
Miscellaneous income | | | 721 | |
| | |
|
|
|
Total Income | | | 3,701 | |
| | |
|
|
|
Expenses: | | | | |
Investment advisory fees | | | 458 | |
Administration fees | | | 115 | |
Distribution and/or servicing fees - Administrative Class | | | 171 | |
Trustees’ fees | | | 2 | |
Organization costs | | | 1 | |
| | |
|
|
|
Total Expenses | | | 747 | |
| | |
|
|
|
Net Investment Income | | | 2,954 | |
| | |
|
|
|
Net Realized and Unrealized Gain (Loss): | | | | |
Net realized gain on investments | | | 77 | |
Net realized gain on futures contracts, written options, and swaps | | | 24,438 | |
Net realized (loss) on foreign currency transactions | | | (72 | ) |
Net change in unrealized appreciation on investments | | | 974 | |
Net change in unrealized appreciation on futures contracts, written options, and swaps | | | 1,412 | |
Net change in unrealized appreciation on translation of assets and liabilities denominated in foreign currencies | | | 82 | |
Net Gain | | | 26,911 | |
| | |
|
|
|
Net Increase in Assets Resulting from Operations | | $ | 29,865 | |
| | |
|
|
|
See accompanying notes | | | 6.30.03 | Semi-Annual Report | | 5 |
Statements of Changes in Net Assets
StocksPLUS Growth and Income Portfolio
Amounts in thousands
| Increase (Decrease) in Net Assets from: | | Six Months Ended
June 30, 2003
| | | Year Ended December 31, 2002
| |
| | | (Unaudited) | | | | |
Operations: | | | | | | | | |
Net investment income | | $ | 2,954 | | | $ | 6,234 | |
Net realized gain (loss) | | | 24,443 | | | | (56,743 | ) |
Net change in unrealized appreciation (depreciation) | | | 2,468 | | | | (3,568 | ) |
| | |
|
|
| |
|
|
|
Net increase (decrease) resulting from operations | | | 29,865 | | | | (54,077 | ) |
| | |
|
|
| |
|
|
|
Distributions to Shareholders: | | | | | | | | |
From net investment income | | | | | | | | |
Institutional Class | | | (13 | ) | | | (21 | ) |
Administrative Class | | | (1,889 | ) | | | (6,408 | ) |
| | |
|
|
| |
|
|
|
Total Distributions | | | (1,902 | ) | | | (6,429 | ) |
| | |
|
|
| |
|
|
|
Portfolio Share Transactions: | | | | | | | | |
Receipts for shares sold | | | | | | | | |
Institutional Class | | | 749 | | | | 847 | |
Administrative Class | | | 42,498 | | | | 121,856 | |
Issued as reinvestment of distributions | | | | | | | | |
Institutional Class | | | 13 | | | | 21 | |
Administrative Class | | | 1,889 | | | | 6,408 | |
Cost of shares redeemed | | | | | | | | |
Institutional Class | | | (22 | ) | | | (76 | ) |
Administrative Class | | | (48,217 | ) | | | (108,884 | ) |
| | |
|
|
| |
|
|
|
Net increase (decrease) resulting from Portfolio share transactions | | | (3,090 | ) | | | 20,172 | |
| | |
|
|
| |
|
|
|
Total Increase (Decrease) in Net Assets | | | 24,873 | | | | (40,334 | ) |
| | |
|
|
| |
|
|
|
Net Assets: | | | | | | | | |
Beginning of period | | | 219,779 | | | | 260,113 | |
End of period* | | $ | 244,652 | | | $ | 219,779 | |
*Including undistributed net investment income of: | | $ | 1,891 | | | $ | 839 | |
6 | | Semi-Annual Report | 6.30.03 | | | See accompanying notes |
Schedule of Investments
StocksPLUS Growth and Income Portfolio
June 30, 2003 (Unaudited)
| | | Principal
Amount (000s)
| | Value (000s)
|
CORPORATE BONDS & NOTES 10.6% | | | | | | |
Banking & Finance 3.6% | | | | | | |
CIT Group, Inc. | | | | | | |
5.625% due 05/17/2004 | | $ | 700 | | $ | 723 |
General Motors Acceptance Corp. | | | | | | |
3.280% due 03/04/2005 (a) | | | 900 | | | 902 |
Goldman Sachs Group, Inc. | | | | | | |
7.009% due 02/10/2004 (a) | | | 0 | | | 0 |
Household Finance Corp. | | | | | | |
4.625% due 01/15/2008 | | | 1,000 | | | 1,068 |
National Rural Utilities Cooperative Finance Corp. | | | | | | |
2.320% due 04/26/2004 (a) | | | 2,100 | | | 2,114 |
Pemex Project Funding Master Trust | | | | | | |
2.778% due 01/07/2005 (a) | | | 3,900 | | | 3,948 |
| | | | | |
|
|
| | | | | | | 8,755 |
| | | | | |
|
|
Industrials 4.7% | | | | | | |
Coastal Corp. | | | | | | |
6.200% due 05/15/2004 | | | 3,000 | | | 2,985 |
Enron Corp. | | | | | | |
8.000% due 08/15/2005 (b) | | | 1,700 | | | 485 |
Kraft Foods, Inc. | | | | | | |
2.080% due 02/27/2004 (a) | | | 3,600 | | | 3,552 |
Park Place Entertainment Corp. | | | | | | |
7.950% due 08/01/2003 | | | 1,430 | | | 1,435 |
Walt Disney Co. | | | | | | |
3.900% due 09/15/2003 | | | 1,200 | | | 1,206 |
Waste Management, Inc. | | | | | | |
7.000% due 10/01/2004 | | | 300 | | | 318 |
Weyerhaeuser Co. | | | | | | |
2.243% due 09/15/2003 (a) | | | 1,700 | | | 1,700 |
| | | | | |
|
|
| | | | | | | 11,681 |
| | | | | |
|
|
Utilities 2.3% | | | | | | |
Entergy Gulf States, Inc. | | | | | | |
2.040% due 06/18/2007 (a) | | | 2,500 | | | 2,500 |
Niagara Mohawk Power Co. | | | | | | |
7.375% due 07/01/2003 | | | 529 | | | 529 |
Sprint Capital Corp. | | | | | | |
5.700% due 11/15/2003 | | | 2,100 | | | 2,108 |
7.900% due 03/15/2005 | | | 400 | | | 434 |
| | | | | |
|
|
| | | | | | | 5,571 |
| | | | | |
|
|
Total Corporate Bonds & Notes
(Cost $26,909) | | | | | | 26,007 |
| | | | | |
|
|
MUNICIPAL BONDS & NOTES 0.4% | | | | | | |
California 0.4% | | | | | | |
Golden State Tobacco Securitization Corporate Revenue Bonds, Series 2003 | | | | | | |
5.000% due 06/01/2021 | | | 1,100 | | | 1,074 |
| | | | | |
|
|
Total Municipal Bonds & Notes
(Cost $1,095) | | | | | | 1,074 |
| | | | | |
|
|
U.S. TREASURY OBLIGATIONS 6.2% | | | | | | |
Treasury Inflation Protected Securities (e) | | | | | | |
3.625% due 01/15/2008 (c) | | | 12,857 | | | 14,428 |
3.875% due 01/15/2009 | | | 112 | | | 128 |
3.500% due 01/15/2011 | | | 422 | | | 480 |
| | | | | |
|
|
Total U.S. Treasury Obligations
(Cost $13,799) | | | | | | 15,036 |
| | | | | |
|
|
MORTGAGE-BACKED SECURITIES 26.0% | | | | | | |
Collateralized Mortgage Obligations 12.4% | | | | | | |
Bear Stearns Adjustable Rate Mortgage Trust | | | | | | |
6.158% due 01/25/2032 (a) | | | 281 | | | 283 |
6.003% due 06/25/2032 (a) | | | 771 | | | 788 |
5.367% due 01/25/2033 (a) | | | 1,842 | | | 1,879 |
Countrywide Alternative Loan Trust | | | | | | |
5.875% due 07/25/2032 | | | 683 | | | 698 |
CS First Boston Mortgage Securities Corp. | | | | | | |
1.435% due 02/25/2032 (a) | | | 784 | | | 787 |
1.266% due 03/25/2032 (a) | | | 1,009 | | | 997 |
1.330% due 03/25/2032 (a) | | | 2,290 | | | 2,248 |
5.726% due 05/25/2032 (a) | | $ | 1,249 | | $ | 1,286 |
5.917% due 06/25/2032 (a) | | | 325 | | | 332 |
6.181% due 06/25/2032 (a) | | | 806 | | | 830 |
4.370% due 12/19/2039 (a) | | | 448 | | | 450 |
DLJ Mortgage Acceptance Corp. | | | | | | |
1.535% due 06/25/2026 (a) | | | 249 | | | 249 |
Fannie Mae | | | | | | |
8.000% due 05/01/2030 | | | 81 | | | 87 |
8.000% due 06/01/2030 | | | 77 | | | 83 |
Federal Home Loan Bank | | | | | | |
6.000% due 08/15/2026 | | | 955 | | | 965 |
Freddie Mac | | | | | | |
5.500% due 11/15/2015 | | | 586 | | | 599 |
5.750% due 12/15/2016 | | | 232 | | | 232 |
5.250% due 04/15/2026 | | | 716 | | | 722 |
6.000% due 01/15/2029 | | | 1,120 | | | 1,132 |
GE Capital Mortgage Services, Inc. | | | | | | |
6.500% due 12/25/2023 | | | 46 | | | 46 |
GSR Mortgage Loan Trust | | | | | | |
5.626% due 04/25/2032 (a) | | | 901 | | | 910 |
Housing Securities, Inc. | | | | | | |
2.036% due 07/25/2032 (a)(j) | | | 218 | | | 218 |
Master Asset Securitization Trust | | | | | | |
5.375% due 10/25/2032 | | | 460 | | | 470 |
Morgan Stanley Dean Witter Capital I | | | | | | |
5.500% due 04/25/2017 | | | 1,408 | | | 1,405 |
PNC Mortgage Securities Corp. | | | | | | |
7.375% due 05/25/2040 (a) | | | 61 | | | 60 |
Resecuritization Mortgage Trust | | | | | | |
1.277% due 04/26/2021 (a)(j) | | | 36 | | | 36 |
Residential Funding Mortgage Securities I, Inc. | | | | | | |
6.500% due 03/25/2032 | | | 1,853 | | | 1,874 |
Salomon Brothers Mortgage Securities VII, Inc. | | | | | | |
5.596% due 12/25/2030 (a) | | | 913 | | | 922 |
Structured Asset Mortgage Investments, Inc. | | | | | | |
7.000% due 07/28/2028 | | | 168 | | | 168 |
Structured Asset Securities Corp. | | | | | | |
1.335% due 10/25/2027 (a) | | | 889 | | | 874 |
6.500% due 10/25/2031 (a) | | | 2,088 | | | 2,169 |
Washington Mutual Loan Trust | | | | | | |
6.019% due 10/19/2039 (a) | | | 1,229 | | | 1,231 |
Washington Mutual Mortgage Securities Corp. | | | | | | |
6.000% due 03/25/2017 | | | 430 | | | 441 |
6.010% due 04/25/2031 (a) | | | 280 | | | 283 |
5.458% due 02/25/2033 (a) | | | 4,319 | | | 4,449 |
| | | | | |
|
|
| | | | | | | 30,203 |
| | | | | |
|
|
Fannie Mae 5.6% | | | | | | |
5.000% due 07/17/2018 | | | 2,000 | | | 2,066 |
5.371% due 04/01/2033 (a) | | | 1,067 | | | 1,095 |
6.000% due 04/01/2013-08/13/2033 (d) | | | 10,006 | | | 10,422 |
6.500% due 09/01/2005 | | | 54 | | | 55 |
8.000% due 09/01/2031 | | | 136 | | | 146 |
| | | | | |
|
|
| | | | | | | 13,784 |
| | | | | |
|
|
Freddie Mac 2.5% | | | | | | |
6.000% due 07/01/2016-08/13/2033 (d) | | | 5,150 | | | 5,339 |
6.500% due 08/01/2032 | | | 823 | | | 857 |
| | | | | |
|
|
| | | | | | | 6,196 |
| | | | | |
|
|
Government National Mortgage Association 5.5% | | | | | | |
4.375% due 02/20/2027 (a) | | | 559 | | | 577 |
4.500% due 05/20/2028 (a) | | | 1,106 | | | 1,129 |
5.000% due 11/20/2029 (a) | | | 720 | | | 748 |
5.375% due 04/20/2024-04/20/2027 (a)(d) | | | 2,516 | | | 2,608 |
5.750% due 08/20/2024 (a) | | | 63 | | | 64 |
6.000% due 08/20/2033 | | | 6,000 | | | 6,279 |
7.500% due 07/15/2030-12/15/2030 (d) | | | 72 | | | 76 |
8.000% due 04/15/2027-02/15/2031 (d) | | | 1,833 | | | 1,980 |
8.500% due 04/20/2030 | | | 29 | | | 31 |
| | | | | |
|
|
| | | | | | | 13,492 |
| | | | | |
|
|
Total Mortgage-Backed Securities
(Cost $63,446) | | | | | | 63,675 |
| | | | | |
|
|
ASSET-BACKED SECURITIES 3.5% | | | | | | |
Ameriquest Mortgage Securities, Inc. | | | | | | |
1.345% due 05/25/2032 (a) | | $ | 543 | | $ | 544 |
Countrywide Asset-Backed Certificates | | | | | | |
1.295% due 05/25/2032 (a) | | | 3,363 | | | 3,359 |
Green Tree Recreational, Equipment, & Consumer Trust | | | | | | |
6.550% due 07/15/2028 | | | 79 | | | 79 |
Home Equity Mortgage Trust | | | | | | |
1.365% due 11/25/2032 (a) | | | 1,626 | | | 1,628 |
North Carolina State Education Authority | | | | | | |
1.440% due 06/01/2009 (a) | | | 2,819 | | | 2,818 |
Option One Mortgage Loan Trust | | | | | | |
1.365% due 04/25/2030 (a) | | | 207 | | | 206 |
| | | | | |
|
|
Total Asset-Backed Securities
(Cost $8,638) | | | | | | 8,634 |
| | | | | |
|
|
SOVEREIGN ISSUES 0.5% | | | | | | |
Republic of Brazil | | | | | | |
2.125% due 04/15/2006 (a) | | | 1,056 | | | 993 |
2.187% due 04/15/2009 (a) | | | 141 | | | 118 |
| | | | | |
|
|
Total Sovereign Issues
(Cost $1,109) | | | | | | 1,111 |
| | | | | |
|
|
PURCHASED PUT OPTIONS 0.0% | | | | | | |
Eurodollar June Futures (OTC) | | | | | | |
Strike @ 94.000 Exp. 12/15/2003 | | | 106,000 | | | 0 |
PNC Mortgage Securities Corp. (OTC) | | | | | | |
2.243% due 01/00/1900 | | | | | | |
Strike @ 100.000 Exp. 04/01/2005 | | | 1,300 | | | 0 |
S&P 500 Index September Futures (OTC) | | | | | | |
Strike @ 550.000 Exp. 09/19/2003 | | | 56 | | | 6 |
| | | | | |
|
|
Total Purchased Put Options
(Cost $8) | | | | | | 6 |
| | | | | |
|
|
SHORT-TERM INSTRUMENTS 60.4% | | | | | | |
Commercial Paper 53.4% | | | | | | |
ABN AMRO North America | | | | | | |
1.200% due 07/07/2003 | | | 800 | | | 800 |
ABN AMRO North America Finance | | | | | | |
1.040% due 07/16/2003 | | | 6,000 | | | 5,997 |
Anz (Delaware), Inc. | | | | | | |
1.235% due 07/09/2003 | | | 4,800 | | | 4,799 |
1.225% due 07/30/2003 | | | 2,000 | | | 1,998 |
Barclays U.S. Funding Corp. | | | | | | |
1.200% due 08/27/2003 | | | 1,900 | | | 1,896 |
CBA Finance, Inc. | | | | | | |
1.220% due 07/08/2003 | | | 3,800 | | | 3,799 |
Fannie Mae | | | | | | |
1.170% due 07/02/2003 | | | 1,500 | | | 1,500 |
1.165% due 07/23/2003 | | | 900 | | | 899 |
1.195% due 08/11/2003 | | | 5,800 | | | 5,792 |
1.150% due 08/13/2003 | | | 2,000 | | | 1,997 |
1.180% due 08/25/2003 | | | 7,100 | | | 7,087 |
1.080% due 09/30/2003 | | | 3,500 | | | 3,491 |
Federal Home Loan Bank | | | | | | |
1.180% due 07/11/2003 | | | 2,000 | | | 1,999 |
1.200% due 07/16/2003 | | | 5,800 | | | 5,797 |
1.165% due 08/01/2003 | | | 12,000 | | | 11,988 |
Freddie Mac | | | | | | |
1.155% due 07/03/2003 | | | 13,000 | | | 12,999 |
1.195% due 07/17/2003 | | | 5,100 | | | 5,097 |
1.185% due 09/03/2003 | | | 2,300 | | | 2,296 |
General Electric Capital Corp. | | | | | | |
1.030% due 07/23/2003 | | | 2,000 | | | 1,999 |
1.050% due 08/11/2003 | | | 4,100 | | | 4,095 |
See accompanying notes | | | 6.30.03 | Semi-Annual Report | | 7 |
| | | Principal
Amount (000s)
| | Value (000s)
| |
HBOS Treasury Services PLC | | | | | | | |
1.250% due 07/16/2003 | | $ | 1,100 | | $ | 1,100 | |
1.240% due 07/24/2003 | | | 2,000 | | | 1,999 | |
1.120% due 08/28/2003 | | | 2,400 | | | 2,395 | |
1.000% due 09/15/2003 | | | 600 | | | 599 | |
Lloyds Bank PLC | | | | | | | |
0.980% due 09/09/2003 | | | 1,900 | | | 1,896 | |
Rabobank Nederland NV | | | | | | | |
1.310% due 07/01/2003 | | | 7,000 | | | 7,000 | |
Royal Bank of Scotland PLC | | | | | | | |
1.220% due 07/16/2003 | | | 6,200 | | | 6,197 | |
1.230% due 08/06/2003 | | | 4,800 | | | 4,794 | |
Shell Finance | | | | | | | |
1.120% due 07/10/2003 | | | 6,800 | | | 6,798 | |
Svenska Handelsbank, Inc. | | | | | | | |
1.220% due 07/01/2003 | | | 3,000 | | | 3,000 | |
TotalFinaElf Capital S.A. | | | | | | | |
1.300% due 07/01/2003 | | | 5,600 | | | 5,600 | |
Westpac Trust Securities Ltd. | | | | | | | |
1.200% due 08/27/2003 | | | 3,000 | | | 2,994 | |
| | | | | |
|
|
|
| | | | | | | 130,697 | |
| | | | | |
|
|
|
Repurchase Agreement 2.4% | | | | | | | |
State Street Bank | | | | | | | |
0.800% due 07/01/2003 | | | 5,766 | | | 5,766 | |
(Dated 06/30/2003. Collateralized by Federal Farm Credit Banks 3.125% due 10/01/2003 valued at $5,886. Repurchase proceeds are $5,766.) | | | | | | | |
| | | | | |
|
|
|
U.S. Treasury Bills 4.6% | | | | | | | |
1.091% due 08/07/2003-08/14/2003 (c)(d) | | | 11,205 | | | 11,193 | |
| | | | | |
|
|
|
Total Short-Term Instruments
(Cost $147,656) | | | | | | 147,656 | |
| | | | | |
|
|
|
Total Investments 107.6%
(Cost $262,660) | | | | | $ | 263,199 | |
Written Options (g) (0.0%)
(Premiums $108) | | | | | | (67 | ) |
Other Assets and Liabilities (Net) (7.6%) | | | | | | (18,480 | ) |
| | | | | |
|
|
|
Net Assets 100.0% | | | | | $ | 244,652 | |
| | | | | |
|
|
|
Notes to Schedule of Investments
(amounts in thousands, except number of contracts):
| (a) | | Variable rate security. The rate listed is as of June 30, 2003. |
| (b) | | Security is in default. |
| (c) | | Securities with an aggregate market value of $22,459 have been segregated with the custodian to cover margin requirements for the following open futures contracts at June 30, 2003: |
Type
| | # of Contracts
| | Unrealized Appreciation/
(Depreciation)
| |
Euribor Purchased Put Options Strike @ 96.375 (06/2004) - Long | | | 106 | | $ | 0 | |
Euribor Written Put Options Strike @ 97.500 (09/2003) - Short | | | 147 | | | 83 | |
Euribor Purchased Put Options Strike @ 96.250 (12/2003) - Long | | | 60 | | | (1 | ) |
Euribor Purchased Put Options Strike @ 93.000 (12/2004) - Long | | $ | 55 | | $ | (1 | ) |
United Kingdom Purchase Put Options Strike @ 93.750 (06/2004) - Long | | | 6 | | | 0 | |
Euribor March Futures (03/2004) - Long | | | 3 | | | 2 | |
Euribor September Futures (09/2003) - Long | | | 11 | | | 17 | |
Euribor September Futures (09/2005) - Long | | | 53 | | | (33 | ) |
Euribor December Futures (12/2004) - Long | | | 7 | | | 1 | |
United Kingdom 90 Day LIBOR Futures (03/2004) - Long | | | 3 | | | (1 | ) |
United Kingdom 90 Day LIBOR Futures (12/2003) - Long | | | 3 | | | (1 | ) |
S & P 500 Index (09/2003) - Long | | | 1,003 | | | 1,099 | |
Eurodollar March Futures (03/2004) - Long | | | 14 | | | 27 | |
Eurodollar March Futures (03/2005) - Long | | | 1 | | | 2 | |
Eurodollar September Futures (09/2004) - Long | | | 1 | | | 2 | |
Eurodollar December Futures (12/2004) - Long | | | 5 | | | 9 | |
| | | | | |
|
|
|
| | | | | | $ | 1,205 | |
| | | | | |
|
|
|
| (d) | | Securities are grouped by coupon or range of coupons and represent a range of maturities. |
| (e) | | Principal amount of security is adjusted for inflation. |
| (f) | | Swap agreements outstanding at June 30, 2003: |
Type
| | Notional Amount
| | Unrealized
Appreciation/
(Depreciation)
| |
Receive a fixed rate equal to 3.250% and pay floating rate based on 6-month EC-LIBOR. Counterparty: J.P. Morgan Chase & Co. | | | | | | | |
Exp. 03/15/2007 | | EC | 1,400 | | $ | (5 | ) |
Receive a fixed rate equal to 0.610% and the Portfolio will pay to the counterparty at par in the event of default of General Electric Capital Corp. 6.000% due 06/15/2012. Counterparty: Merrill Lynch & Co., Inc. | | | | | | | |
Exp. 05/19/2004 | | $ | 400 | | $ | 2 | |
Receive a fixed rate equal to 5.000% and the Portfolio will pay to the counterparty at par in the event of default of Sprint Capital Corp. 7.625% due 01/30/2011. Counterparty: Morgan Stanley Dean Witter & Co. | | | | | | | |
Exp. 05/28/2004 | | | 5,000 | | | 159 | |
Received total return on S&P 500 Index and pay floating rate based on 1-month LIBOR plus 0.700% Counterparty: J.P. Morgan Chase & Co. | | | | | | | |
Exp. 04/30/2004 | | | 4,734 | | | 0 | |
| | | | | |
|
|
|
| | | | | | $ | 156 | |
| | | | | |
|
|
|
| (g) | | Premiums received on written options: |
Type
| | Notional
Amount
| | Premium
| | Value
|
Call - OTC 7 Year Interest Rate Swap | | | | | | | | | |
Strike @ 3.500%* Exp. 12/17/2003 | | $ | 3,000 | | $ | 31 | | $ | 53 |
Put - OTC 7 Year Interest Rate Swap | | | | | | | | | |
Strike @ 5.500%** Exp. 12/17/2003 | | | 3,000 | | | 39 | | | 3 |
| | | | | |
|
| |
|
|
| | | | | | $ | 70 | | $ | 56 |
| | | | | |
|
| |
|
|
Type
| | # of
Contracts
| | Premium
| | Value
|
Put - CME Eurodollar December Futures | | | | | | | | |
Strike @ 98.750 Exp. 12/15/2003 | | 86 | | $ | 38 | | $ | 11 |
| | | | |
|
| |
|
|
| * | | The Portfolio will receive a floating rate based on 3-month LIBOR. |
| ** | | The Portfolio will pay a floating rate based on 3-month LIBOR. |
| (h) | | Principal amount denoted in indicated currency: |
| (i) | | Foreign forward currency contracts outstanding at June 30, 2003: |
Type
| | Currency
| | Principal Amount Covered by Contract
| | Settlement
Month
| | Unrealized
Appreciation
| | Unrealized
(Depreciation)
| | Net Unrealized Appreciation
|
Sell | | EC | | 751 | | 07/2003 | | $ | 4 | | $ | 0 | | $ | 4 |
| | | | | | | | |
|
| |
|
| |
|
|
| (j) | | Indicates a fair valued security which has not been valued utilizing an independent quote and which is valued pursuant to guidelines established by the Trustees. The aggregate value of fair valued securities is $254, which is 0.10% of net assets. |
8 | | Semi-Annual Report | 6.30.03 | | | See accompanying notes |
Notes to Financial Statements
June 30, 2003 (Unaudited)
1. Organization
The StocksPLUS Growth and Income Portfolio (the “Portfolio”) is a series of the PIMCO Variable Insurance Trust (the “Trust”). The Trust is registered under the Investment Company Act of 1940 (the “Act”), as amended, as an open-end investment company organized as a Delaware business trust on October 3, 1997. The Trust may offer up to two classes of shares: Institutional and Administrative. Each share class has identical voting rights (except that shareholders of a class have exclusive voting rights regarding any matter relating solely to that class of shares). Information presented in these financial statements pertains to the Institutional Class of the Trust. Certain detailed financial information for the Administrative Class is provided separately and is available upon request. The Trust is designed to be used as an investment vehicle by Separate Accounts of insurance companies that fund variable annuity contracts and variable life insurance policies and by qualified pension and retirement plans. The Portfolio commenced operations on December 31, 1997.
2. Significant Accounting Policies
The following is a summary of significant accounting policies consistently followed by the Trust in the preparation of its financial statements in conformity with accounting principles generally accepted in the United States of America. The preparation of financial statements in accordance with accounting principles generally accepted in the United States of America requires management to make estimates and assumptions that affect the reported amounts and disclosures in the financial statements. Actual results could differ from those estimates.
Security Valuation. Portfolio securities and other financial instruments for which market quotations are readily available are stated at market value. Market value is determined at the close of regular trading (normally, 4:00 p.m., Eastern Time) on the New York Stock Exchange on each day the New York Stock Exchange is open, or if no sales are reported, as is the case for most securities traded over-the-counter, the mean between representative bid and asked quotations obtained from a quotation reporting system or from established market makers. Fixed income securities, including those to be purchased under firm commitment agreements, are normally valued on the basis of quotes obtained from brokers and dealers or pricing services. Short-term investments, which mature in 60 days or less are valued at amortized cost, which approximates market value. Certain fixed income securities for which daily market quotations are not readily available may be valued, pursuant to guidelines established by the Board of Trustees, with reference to fixed income securities whose prices are more readily obtainable. Prices may be obtained from independent pricing services which use information provided by market makers or estimates of market values obtained from yield data relating to investments or securities with similar characteristics. The prices used by the Portfolio may differ from the value that would be realized if the securities were sold and the differences could be material to the financial statements.
Securities Transactions and Investment Income. Securities transactions are recorded as of the trade date. Securities purchased or sold on a when-issued or delayed delivery basis may be settled a month or more after the trade date. Realized gains and losses from securities sold are recorded on the identified cost basis. Dividend income is recorded on the ex-dividend date, except certain dividends from foreign securities where the ex-dividend date may have passed, are recorded as soon as the Portfolio is informed of the ex-dividend date. Interest income, adjusted for the accretion of discounts and amortization of premiums, is recorded on the accrual basis. Paydowns gains and losses on mortgage- and asset-backed securities are recorded as adjustments to interest income in the Statement of Operations.
Dividends and Distributions to Shareholders. Dividends from net investment income, if any, are declared and distributed to shareholders quarterly. All dividends are reinvested in additional shares of the Portfolio. Net realized capital gains earned by the Portfolio, if any, will be distributed no less frequently than once each year.
Income dividends and capital gain distributions are determined in accordance with income tax regulations which may differ from accounting principles generally accepted in the United States of America. These differences are primarily due to differing treatments for such items as wash sales, foreign currency transactions, net operating losses and capital loss carryforwards.
Distributions classified as a tax basis return of capital, if any, are reflected in the accompanying Statements of Changes in Net Assets and have been reclassified to paid in capital. In addition, other amounts have been reclassified between undistributed net investment income, accumulated undistributed net realized gains or losses and/or paid in capital to more appropriately conform financial accounting to tax characterizations of dividend distributions.
Foreign Currency. The accounting records of the Portfolio are maintained in U.S. dollars. The market values of foreign securities, currency holding and other assets and liabilities are translated into U.S. dollars based on the current exchange rates each business day. Fluctuations in the value of these assets and liabilities resulting from changes in exchange rates are recorded as unrealized foreign currency gains or losses. Realized gains or losses and unrealized appreciation (depreciation) on investment securities and income and expenses are translated on the respective dates of such transactions. The effect of changes in foreign currency exchange rates on investments in securities are not
6.30.03 | Semi-Annual Report | | 9 |
segregated in the Statement of Operations from the effects of changes in market prices of those securities, but are included with the net realized and unrealized gain or loss on investment securities.
Multiclass Operations. Each class offered by the Trust has equal rights as to assets. Income, non-class specific expenses, and realized and unrealized capital gains and losses are allocated to each class of shares based on the relative net assets of each class.
Federal Income Taxes. The Portfolio intends to qualify as a regulated investment company and distribute all of its taxable income and net realized gains, if applicable, to shareholders. Accordingly, no provision for Federal income taxes has been made.
Futures Contracts. The Portfolio is authorized to enter into futures contracts. The Portfolio may use futures contracts to manage its exposure to the securities markets or to movements in interest rates and currency values. The primary risks associated with the use of futures contracts are imperfect correlation between the change in market value of the securities held by the Portfolio and the prices of futures contracts, the possibility of an illiquid market, and the inability of the counterparty to meet the terms of the contract. Futures contracts are valued based upon their quoted daily settlement prices. Upon entering into a futures contract, the Portfolio may be required to deposit with its custodian, in a segregated account in the name of the futures broker, an amount of cash or U.S. Government and Agency Obligations in accordance with the initial margin requirements of the broker or exchange. Futures contracts are marked to market daily and an appropriate payable or receivable for the change in value (“variation margin”) is recorded by the Portfolio. Gains or losses are recognized but not considered realized until the contracts expire or are closed. Futures contracts involve, to varying degrees, risk of loss in excess of the variation margin disclosed in the Statement of Assets and Liabilities.
Options Contracts. The Portfolio may write call and put options on futures, securities or currencies it owns or in which it may invest. Writing put options tends to increase the Portfolio’s exposure to the underlying instrument. Writing call options tends to decrease the Portfolio’s exposure to the underlying instrument. When the Portfolio writes a call or put option, an amount equal to the premium received is recorded as a liability and subsequently marked to market to reflect the current value of the option written. Payment received or made, if any, from writing options with premiums to be determined on a future date are reflected as such on the Statement of Assets and Liabilities. Premiums received from writing options which expire are treated as realized gains. Premiums received from writing options which are exercised or closed are added to the proceeds or offset against amounts paid on the underlying future, security or currency transaction to determine the realized gain or loss. The Portfolio as a writer of an option has no control over whether the underlying future, security or currency may be sold (call) or purchased (put) and as a result bears the market risk of an unfavorable change in the price of the future, security or currency underlying the written option. There is the risk the Portfolio may not be able to enter into a closing transaction because of an illiquid market.
The Portfolio may also purchase put and call options. Purchasing call options tends to increase the Portfolio’s exposure to the underlying instrument. Purchasing put options tends to decrease the Portfolio’s exposure to the underlying instrument. The Portfolio pays a premium which is included in the Portfolio’s Statement of Assets and Liabilities as an investment and subsequently marked to market to reflect the current value of the option. Premiums paid for purchasing options which expire are treated as realized losses. The risk associated with purchasing put and call options is limited to the premium paid. Premiums paid for purchasing options which are exercised or closed are added to the amounts paid or offset against the proceeds on the underlying future, security or currency transaction to determine the realized gain or loss.
Forward Currency Transactions. The Portfolio may enter into forward currency contracts and forward cross-currency contracts in connection with settling planned purchases or sales of securities or to hedge the currency exposure associated with some or all of the Portfolio’s securities. A forward currency contract is an agreement between two parties to buy and sell a currency at a set price on a future date. The market value of a forward currency contract fluctuates with changes in forward currency exchange rates. Forward currency contracts are marked to market daily and the change in value is recorded by the Portfolio as an unrealized gain or loss. Realized gains or losses equal to the difference between the value of the contract at the time it was opened and the value at the time it was closed are recorded upon delivery or receipt of the currency or, if a forward currency contract is offset by entering into another forward currency contract with the same broker, upon settlement of the net gain or loss. These contracts may involve market risk in excess of the unrealized gain or loss reflected in the Portfolio’s Statement of Assets and Liabilities. In addition, the Portfolio could be exposed to risk if the counterparties are unable to meet the terms of the contracts or if the value of the currency changes unfavorably to the U.S. dollar.
Swap Agreements. The Portfolio may invest in swap agreements. A swap is an agreement to exchange the return generated by one instrument for the return generated by another instrument. The Portfolio may enter into interest rate,
10 | | Semi-Annual Report | 6.30.03 |
total return, forward swap spread lock and credit default swap agreements to manage its exposure to interest rates and credit risk. Interest rate swap agreements involve the exchange by the Portfolio with another party of their respective commitments to pay or receive interest, e.g., an exchange of floating rate payments for fixed rate payments with respect to a notional amount of principal. Total return swap agreements involve commitments to pay interest in exchange for a market-linked return, both based on notional amounts. To the extent the total return of the security or index underlying the transaction exceeds or falls short of the offsetting interest rate obligation, the Portfolio will receive a payment from or make a payment to the counterparty. Forward spread lock swap agreements involve commitments to pay or receive a settlement amount calculated as the difference between the swap spread and a fixed spread, multiplied by the notional amount times the duration of the swap. The swap spread is the difference between the benchmark swap rate (market rate) and the specific Treasury rate. In a credit default swap, one party makes a stream of payments to another party in exchange for the right to receive a specified return in the event of a default by a third party, typically corporate issues or sovereign issues of an emerging country, on its obligation. The Portfolio may use credit default swaps to provide a measure of protection against defaults of sovereign issuers (i.e., to reduce risk where the Portfolio owns or has exposure to the sovereign issuer) or to take an active long or short position with respect to the likelihood of a particular issuer’s default. Swaps are marked to market daily based upon quotations from market makers and vendors and the change in value, if any, is recorded as unrealized gain or loss in the Statement of Operations. Payments received or made at the beginning of the measurement period are reflected as such on the Statement of Assets and Liabilities. A liquidation payment received or made at the termination of the swap is recorded as realized gain or loss in the Statement of Operations. Net periodic payments are included as part of miscellaneous income on the Statement of Operations. Entering into these agreements involves, to varying degrees, elements of credit, market and documentation risk in excess of the amounts recognized on the Statement of Assets and Liabilities. Such risks involve the possibility that there will be no liquid market for these agreements, that the counterparty to the agreements may default on its obligation to perform or disagree as to the meaning of contractual terms in the agreements, and that there may be unfavorable changes in interest rates.
Delayed Delivery Transactions. The Portfolio may purchase or sell securities on a when-issued or delayed delivery basis. These transactions involve a commitment by the Portfolio to purchase or sell securities for a predetermined price or yield, with payment and delivery taking place beyond the customary settlement period. When delayed delivery purchases are outstanding, the Portfolio will set aside and maintain until the settlement date in a segregated account, liquid assets in an amount sufficient to meet the purchase price. When purchasing a security on a delayed delivery basis, the Portfolio assumes the rights and risks of ownership of the security, including the risk of price and yield fluctuations, and takes such fluctuations into account when determining its net asset value. The Portfolio may dispose of or renegotiate a delayed delivery transaction after it is entered into, and may sell when-issued securities before they are delivered, which may result in a capital gain or loss. When the Portfolio has sold a security on a delayed delivery basis, the Portfolio does not participate in future gains and losses with respect to the security.
Inflation-Indexed Bonds. Inflation-indexed bonds are fixed income securities whose principal value is periodically adjusted to the rate of inflation. The interest rate on these bonds is generally fixed at issuance at a rate lower than typical bonds. Over the life of an inflation-indexed bond, however, interest will be paid based on a principal value, which is adjusted for inflation. Any increase in the principal amount of an inflation-indexed bond will be included as interest income in the Statement of Operations, even though investors do not receive their principal until maturity.
Repurchase Agreements. The Portfolio may engage in repurchase transactions. Under the terms of a typical repurchase agreement, the Portfolio takes possession of an underlying debt obligation subject to an obligation of the seller to repurchase, and the Portfolio to resell, the obligation at an agreed-upon price and time. The market value of the collateral must be equal at all times to the total amount of the repurchase obligations, including interest. Generally, in the event of counterparty default, the Portfolio has the right to use the collateral to offset losses incurred.
3. Fees, Expenses, and Related Party Transactions
Investment Advisory Fee. Pacific Investment Management Company LLC (PIMCO) is a majority owned subsidiary partnership of Allianz Dresdner Asset Management of America L.P. (formerly PIMCO Advisors L.P.) and serves as investment adviser (the “Adviser”) to the Trust, pursuant to an investment advisory contract. The Adviser receives a monthly fee at an annual rate based on average daily net assets of the Portfolio. The Advisory Fee is charged at an annual rate of 0.40%.
Administration Fee. PIMCO serves as administrator (the “Administrator”) and provides administrative services to the Trust for which it receives a monthly administrative fee based on average daily net assets of the Portfolio. The Administration Fee is charged at the annual rate of 0.10%.
Servicing Fee. PIMCO Advisors Distributors LLC (“PAD”), is an indirect wholly-owned subsidiary of Allianz Dresdner Asset Management of America L.P. and serves as the distributor of the Trust’s shares. The Trust is permitted to reimburse PAD on
6.30.03 | Semi-Annual Report | | 11 |
a quarterly basis, out of the Administrative Class assets of the Portfolio in the amount of 0.15% on an annual basis of the average daily net assets of that class, for payments made to financial intermediaries that provide services in connection with the distribution of shares or administration of plans or programs that use Portfolio shares as their funding medium. The effective rate paid to PAD during the current fiscal year is 0.15%.
Expenses. The Portfolio is responsible for the following expenses: (i) salaries and other compensation of any of the Trust’s executive officers and employees who are not officers, directors, stockholders or employees of PIMCO or its subsidiaries or affiliates; (ii) taxes and governmental fees; (iii) brokerage fees and commissions and other portfolio transaction expenses; (iv) the cost of borrowing money, including interest expense; (v) fees and expenses of the Trustees who are not “interested persons” of PIMCO or the Trust, and any counsel retained exclusively for their benefit; (vi) extraordinary expenses, including costs of litigation and indemnification expenses; (vii) organization expenses and (viii) any expenses allocated or allocable to a specific class of shares, which include service fees payable with respect to the Administrative Class shares and may include certain other expenses as permitted by the Trust’s Multiple Class Plan adopted pursuant to Rule 18f-3 under the Act and subject to review and approval by the Trustees. The ratio of expenses to average net assets per share class, as disclosed in the Financial Highlights, may differ from the annual Portfolio operating expenses per share class as disclosed in the Prospectus for the reasons set forth above. PIMCO has agreed to waive a portion of its administrative fees to the extent that the payment of the Portfolio’s pro rata share of Trustees’ fees causes the actual expense ratio to rise above the rates disclosed in the current prospectus plus 0.49 basis points as set forth below (calculated as a percentage of the Portfolio’s average daily net assets attributable to each class):
| | | Institutional Class
| | | Administrative Class
| |
StocksPLUS Growth and Income Portfolio | | 0.50 | % | | 0.65 | % |
PIMCO may be reimbursed for these waived amounts in future periods. The Trust pays no compensation directly to any Trustee or any other officer who is affiliated with the Administrator, all of whom receive renumeration for their services to the Trust from the Administrator or its affiliates.
Each unaffiliated Trustee receives an annual retainer of $4,000, plus $1,500 for each Board of Trustees meeting attended in person and $250 for each meeting attended telephonically, plus reimbursement of related expenses. In addition, each committee chair receives an additional annual retainer of $500. These expenses are allocated on a pro-rata basis to each Portfolio of the Trust according to its respective net assets.
Organization Expenses. Costs incurred in connection with the organization of the Portfolio and its initial registration are amortized on a straight-line basis over a five-year period from the Portfolio’s commencement of operations.
4. Purchases and Sales of Securities
Purchases and sales of securities (excluding short-term investments) for the period ended June 30, 2003 were as follows (amounts in thousands):
| | | U.S Government/Agency
| | All Other
|
| | | Purchases
| | Sales
| | Purchases
| | Sales
|
StocksPLUS Growth and Income Portfolio | | $ | 63,507 | | $ | 57,262 | | $ | 19,329 | | $ | 38,800 |
5. Transactions in Written Call and Put Options
Transactions in written call and put options were as follows (amounts in thousands):
| | | StocksPLUS Growth
and Income Portfolio
| |
| | | | | Premium
| |
Balance at 12/31/2002 | | | | $ | 74 | |
Sales | | | | | 228 | |
Closing Buys | | | | | 0 | |
Expirations | | | | | (194 | ) |
Exercised | | | | | 0 | |
| | | | |
|
|
|
Balance at 06/30/2003 | | | | $ | 108 | |
| | | | |
|
|
|
12 | | Semi-Annual Report | 6.30.03 |
6. Federal Income Tax Matters
At June 30, 2003, the aggregate cost of investments was the same for federal income tax and financial statement purposes. The net unrealized appreciation (depreciation) of investments securities for federal income tax purposes is as follows (amounts in thousands):
| | | Aggregate Gross Unrealized Appreciation
| | Aggregate Gross Unrealized (Depreciation)
| | | Net Unrealized Appreciation
|
StocksPLUS Growth and Income Portfolio | | $ | 2,031 | | $ | (1,492 | ) | | $ | 539 |
7. Shares of Beneficial Interest
The Trust may issue an unlimited number of shares of beneficial interest with a $.0001 par value. Changes in shares of beneficial interest were as follows (shares and amounts in thousands):
| | | StocksPLUS Growth and Income Portfolio
| |
| | | Six Months Ended
06/30/2003 | | | Year Ended
12/31/2002 | |
| | | Shares
| | | Amount
| | | Shares
| | | Amount
| |
Receipts for shares sold | | | | | | | | | | | | | | |
Institutional Class | | 102 | | | $ | 749 | | | 95 | | | $ | 847 | |
Administrative Class | | 5,773 | | | | 42,498 | | | 15,080 | | | | 121,856 | |
Issued as reinvestment of distributions | | | | | | | | | | | | | | |
Institutional Class | | 2 | | | | 13 | | | 3 | | | | 21 | |
Administrative Class | | 248 | | | | 1,889 | | | 823 | | | | 6,408 | |
Cost of shares redeemed | | | | | | | | | | | | | | |
Institutional Class | | (3 | ) | | | (22 | ) | | (10 | ) | | | (76 | ) |
Administrative Class | | (6,400 | ) | | | (48,217 | ) | | (13,486 | ) | | | (108,884 | ) |
| | |
|
| |
|
|
| |
|
| |
|
|
|
Net increase (decrease) resulting from Portfolio share transactions | | (278 | ) | | $ | (3,090 | ) | | 2,505 | | | $ | 20,172 | |
| | |
|
| |
|
|
| |
|
| |
|
|
|
The following schedule shows the number of shareholders each owning 5% or more of the Portfolio and the total percentage of the Portfolio held by such shareholders:
| | | Number
| | % of Portfolio Held
|
StocksPLUS Growth and Income Portfolio | | | | |
Institutional Class | | 1 | | 100 |
Administrative Class | | 3 | | 91 |
6.30.03 | Semi-Annual Report | | 13 |
Trustees and Officers
Brent R. Harris, Chairman and Trustee
R. Wesley Burns, President and Trustee
E. Philip Cannon, Trustee
Vern O. Curtis, Trustee
J. Michael Hagan, Trustee
William J. Popejoy, Trustee
Garlin G. Flynn, Secretary
John P. Hardaway, Treasurer
Investment Adviser and Administrator
Pacific Investment Management Company LLC
840 Newport Center Drive
Newport Beach, California 92660
Transfer Agent
National Financial Data Services
330 W. 9th Street, 4th Floor
Kansas City, Missouri 64105
Custodian
State Street Bank & Trust Company
801 Pennsylvania
Kansas City, Missouri 64105
Counsel
Dechert LLP
1775 I Street, N.W.
Washington, D.C. 20006
Independent Accountants
PricewaterhouseCoopers LLP
1055 Broadway
Kansas City, Missouri 64105
PIMCO VARIABLE INSURANCE TRUST
This report is submitted for the general information of the shareholders of the PIMCO Variable Insurance Trust. It is not authorized for distribution to prospective investors unless accompanied or preceded by an effective prospectus for the PIMCO Variable Insurance Trust, which contains information covering its investment policies as well as other pertinent information.
All Funds distributed by PIMCO ADVISORS DISTRIBUTORS LLC, member NASD
840 NEWPORT CENTER DRIVE
NEWPORT BEACH, CA 92660
800.927.4648
WWW.PIMCOADVISORS.COM
WWW.PIMCO.COM
| P I M C O |
| PIMCO VARIABLE INSURANCE TRUST |
| TOTAL RETURN PORTFOLIO II |
| ADMINISTRATIVE CLASS |
|
| SEMI-ANNUAL REPORT |
| June 30, 2003 |
| | | Fund
Summary
| | Schedule of
Investments
|
Total Return Portfolio II (Administrative Class) | | 2 | | 7 |
Chairman’s Letter
Dear PIMCO Variable Insurance Trust Shareholder:
Financial assets gained during the first half of 2003 amid a revival of risk appetites as anxiety about the war in Iraq faded. Assets that generally benefit from economic growth, such as stocks, corporate bonds and emerging market debt, fared the best year-to-date as investors returned to these sectors in anticipation of a recovery in the second half of 2003. Reflationary forces that investors expected to fuel a rebound included federal tax cuts and a weak dollar, as well as low borrowing rates that eased the burden of high personal and corporate indebtedness. Low mortgage rates kept refinancings booming in the second quarter and put more money in consumers’ pockets.
U.S. Treasuries lagged their riskier counterparts but still enjoyed a modest rally. Yields fell to levels not seen in 45 years early in the second quarter before bouncing off their lows in June as hopes for recovery increased. The yield on the benchmark 10-year Treasury closed the six-month period 0.30% lower to 3.51%, after nearing 3% earlier in the period. Buyers were encouraged that inflation would remain tame amid low capacity utilization and weak employment growth. Asian central banks bought U.S. Treasuries to limit the rise in their currencies versus the dollar in an effort to protect their export industries. In June, the Federal Reserve cut the federal funds rate by 0.25% to 1%, its 13th easing since 2001, in an effort to boost the economy and ward off deflation. Although the cut was less than expected, the Fed suggested that rates would stay low until deflation risks abated.
On the following pages you will find specific details as to the Portfolio’s total return investment performance and a discussion of those factors that affected performance.
We appreciate the trust you have placed in us, and we will continue to focus our efforts to meet your investment needs.
Sincerely,
Brent R. Harris
Chairman
July 31, 2003
6.30.03 | Semi-Annual Report | | 1 |
Total Return Portfolio II
TOTAL RETURN INVESTMENT PERFORMANCE For the period ended June 30, 2003
| | | 1 Year | | | Since Inception* | |
Total Return Portfolio II Administrative Class | | 10.41 | % | | 8.59 | % |
Lehman Brothers Aggregate Bond Index | | 10.40 | % | | — | |
| * | | Annualized (All Portfolio returns are net of fees and expenses) |
CUMULATIVE RETURNS THROUGH JUNE 30, 2003
$10,000 invested at inception
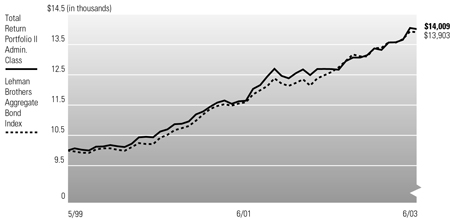
Past performance is no guarantee of future results. Investment return and principal value will fluctuate so that Portfolio shares, when redeemed, may be worth more or less than their original cost. The line graph above assumes the investment of $10,000 on 6/01/1999, the first full month following the Portfolio’s Administrative Class inception on 5/28/1999, compared to the Lehman Brothers Aggregate Bond Index, an unmanaged market index. It is not possible to invest directly in the Index.
PORTFOLIO INSIGHTS
| • | | The Total Return Portfolio II seeks to achieve its investment objective by investing under normal circumstances at least 65% of its total assets in a diversified portfolio of Fixed Income Instruments of varying maturities with quality and non-U.S. issuer restrictions. |
| • | | The Portfolio’s Administrative Class returned 4.77% for the six-month period ended June 30, 2003, outperforming its benchmark, the Lehman Brothers Aggregate Bond Index, which returned 3.93% for the period. |
| • | | Portfolio duration was near the benchmark throughout the period, and had little effect on relative performance. An emphasis on both short and long maturities had a minimal impact on returns as yield curve shape changed little over the period. |
| • | | Near benchmark exposure to mortgages had little impact on relative performance. An overweight of lower coupon mortgages, which are less vulnerable to prepayment risk, helped returns as these issues outperformed. |
| • | | A corporate underweight was negative as corporates outperformed, but positive security selection of telecom and energy pipeline issues mitigated this impact. |
2 | | Semi-Annual Report | 6.30.03 |
Financial Highlights
Total Return Portfolio II (Administrative Class)
| Selected Per Share Data for the Year or Period Ended: | | 06/30/2003 +
| | | 12/31/2002
| | | 12/31/2001
| | | 12/31/2000
| | | 05/28/1999-12/31/1999
| |
Net asset value beginning of period | | $ | 10.09 | | | $ | 10.12 | | | $ | 10.24 | | | $ | 9.82 | | | $ | 10.00 | |
Net investment income (a) | | | 0.09 | | | | 0.38 | | | | 0.48 | | | | 0.63 | | | | 0.32 | |
Net realized/unrealized gain (loss) on investments (a) | | | 0.39 | | | | 0.41 | | | | 0.49 | | | | 0.44 | | | | (0.18 | ) |
Total income from investment operations | | | 0.48 | | | | 0.79 | | | | 0.97 | | | | 1.07 | | | | 0.14 | |
Dividends from net investment income | | | (0.10 | ) | | | (0.40 | ) | | | (0.48 | ) | | | (0.65 | ) | | | (0.32 | ) |
Distributions from net realized capital gains | | | 0.00 | | | | (0.42 | ) | | | (0.61 | ) | | | 0.00 | | | | 0.00 | |
Total distributions | | | (0.10 | ) | | | (0.82 | ) | | | (1.09 | ) | | | (0.65 | ) | | | (0.32 | ) |
Net asset value end of period | | $ | 10.47 | | | $ | 10.09 | | | $ | 10.12 | | | $ | 10.24 | | | $ | 9.82 | |
Total return | | | 4.77 | % | | | 7.97 | % | | | 9.72 | % | | | 11.30 | % | | | 1.41 | % |
Net assets end of period (000s) | | $ | 17,577 | | | $ | 16,882 | | | $ | 2,403 | | | $ | 2,203 | | | $ | 5,128 | |
Ratio of expenses to average net assets | | | 0.65 | %* | | | 0.66 | %(d) | | | 0.65 | %(c) | | | 0.65 | % | | | 0.65 | %(b)* |
Ratio of net investment income to average net assets | | | 1.71 | %* | | | 3.73 | % | | | 4.56 | % | | | 6.34 | % | | | 5.38 | %* |
Portfolio turnover rate | | | 302 | % | | | 418 | % | | | 606 | % | | | 937 | % | | | 378 | % |
| (a) | | Per share amounts based on average number of shares outstanding during the period. |
| (b) | | If the investment manager had not reimbursed expenses, the ratio of operating expenses to average net assets would have been 0.78% for the period ended December 31, 1999. |
| (c) | | If the investment manager had not reimbursed expenses, the ratio of operating expenses to average net assets would have been 0.66% for the year ended December 31, 2001. |
| (d) | | Ratio of expenses to average net assets excluding interest expense is 0.65%. |
See accompanying notes | | | 6.30.03 | Semi-Annual Report | | 3 |
Statement of Assets and Liabilities
Total Return Portfolio II
June 30, 2003 (Unaudited)
Amounts in thousands, except per share amounts
Assets: | | | |
Investments, at value | | $ | 20,094 |
Cash | | | 4 |
Receivable for investments sold | | | 972 |
Interest receivable | | | 71 |
Variation margin receivable | | | 13 |
| | |
|
|
| | | | 21,154 |
| | |
|
|
Liabilities: | | | |
Payable for investments purchased | | $ | 3,501 |
Written options outstanding | | | 49 |
Accrued investment advisory fee | | | 4 |
Accrued administration fee | | | 4 |
Accrued servicing fee | | | 2 |
Variation margin payable | | | 1 |
| | |
|
|
| | | | 3,561 |
| | |
|
|
Net Assets | | $ | 17,593 |
| | |
|
|
Net Assets Consist of: | | | |
Paid in capital | | $ | 16,867 |
Undistributed net investment income | | | 29 |
Accumulated undistributed net realized gain | | | 539 |
Net unrealized appreciation | | | 158 |
| | |
|
|
| | | $ | 17,593 |
| | |
|
|
Net Assets: | | | |
Institutional Class | | $ | 16 |
Administrative Class | | | 17,577 |
Shares Issued and Outstanding: | | | |
Institutional Class | | | 2 |
Administrative Class | | | 1,678 |
Net Asset Value and Redemption Price Per Share (Net Assets Per Share Outstanding) | | | |
Institutional Class | | $ | 10.47 |
Administrative Class | | | 10.47 |
Cost of Investments Owned | | $ | 19,918 |
4 | | Semi-Annual Report | 6.30.03 | | | See accompanying notes |
Statement of Operations
Total Return Portfolio II
For the period ended June 30, 2003 (Unaudited)
Amounts in thousands
Investment Income: | | | |
Interest | | $ | 203 |
| | |
|
|
Total Income | | | 203 |
| | |
|
|
Expenses: | | | |
Investment advisory fees | | | 21 |
Administration fees | | | 21 |
Distribution and/or servicing fees - Administrative Class | | | 13 |
| | |
|
|
Total Expenses | | | 55 |
| | |
|
|
Net Investment Income | | | 148 |
| | |
|
|
Net Realized and Unrealized Gain (Loss): | | | |
Net realized gain on investments | | | 294 |
Net realized gain on futures contracts, written options, and swaps | | | 221 |
Net change in unrealized appreciation on investments | | | 146 |
Net change in unrealized appreciation on futures contracts, written options, and swaps | | | 5 |
Net Gain | | | 666 |
| | |
|
|
Net Increase in Assets Resulting from Operations | | $ | 814 |
| | |
|
|
See accompanying notes | | | 6.30.03 | Semi-Annual Report | | 5 |
Statements of Changes in Net Assets
Total Return Portfolio II
Amounts in thousands
| Increase (Decrease) in Net Assets from: | | Six Months Ended
June 30, 2003
| | | Year Ended
December 31, 2002
| |
| | | (Unaudited) | | | | |
Operations: | | | | | | | | |
Net investment income | | $ | 148 | | | $ | 160 | |
Net realized gain | | | 515 | | | | 219 | |
Net change in unrealized appreciation (depreciation) | | | 151 | | | | (55 | ) |
| | |
|
|
| |
|
|
|
Net increase resulting from operations | | | 814 | | | | 324 | |
| | |
|
|
| |
|
|
|
Distributions to Shareholders: | | | | | | | | |
From net investment income | | | | | | | | |
Institutional Class | | | (2 | ) | | | (50 | ) |
Administrative Class | | | (166 | ) | | | (110 | ) |
From net realized capital gains | | | | | | | | |
Institutional Class | | | 0 | | | | (48 | ) |
Administrative Class | | | 0 | | | | (102 | ) |
| | |
|
|
| |
|
|
|
Total Distributions | | | (168 | ) | | | (310 | ) |
| | |
|
|
| |
|
|
|
Portfolio Share Transactions: | | | | | | | | |
Receipts for shares sold | | | | | | | | |
Institutional Class | | | 0 | | | | 0 | |
Administrative Class | | | 0 | | | | 14,872 | |
Issued as reinvestment of distributions | | | | | | | | |
Institutional Class | | | 2 | | | | 98 | |
Administrative Class | | | 166 | | | | 212 | |
Cost of shares redeemed | | | | | | | | |
Institutional Class | | | (1,200 | ) | | | (2,745 | ) |
Administrative Class | | | (120 | ) | | | (600 | ) |
| | |
|
|
| |
|
|
|
Net increase (decrease) resulting from Portfolio share transactions | | | (1,152 | ) | | | 11,837 | |
| | |
|
|
| |
|
|
|
Total Increase (Decrease) in Net Assets | | | (506 | ) | | | 11,851 | |
| | |
|
|
| |
|
|
|
Net Assets: | | | | | | | | |
Beginning of period | | | 18,099 | | | | 6,248 | |
End of period* | | $ | 17,593 | | | $ | 18,099 | |
*Including undistributed net investment income of: | | $ | 29 | | | $ | 49 | |
6 | | Semi-Annual Report | 6.30.03 | | | See accompanying notes |
Schedule of Investments
Total Return Portfolio II
June 30, 2003 (Unaudited)
| | | Principal
Amount
(000s)
| | Value
(000s)
|
CORPORATE BONDS & NOTES 8.2% | | | | | | |
Banking & Finance 2.3% | | | | | | |
CIT Group, Inc. | | | | | | |
5.500% due 02/15/2004 | | $ | 30 | | $ | 31 |
2.618% due 07/30/2004 (a) | | | 40 | | | 40 |
2.798% due 01/31/2005 (a) | | | 100 | | | 101 |
EOP Operating L.P. | | | | | | |
5.875% due 01/15/2013 | | | 100 | | | 108 |
General Electric Capital Corp. | | | | | | |
6.125% due 02/22/2011 | | | 20 | | | 23 |
General Motors Acceptance Corp. | | | | | | |
1.679% due 07/21/2004 (a) | | | 100 | | | 99 |
| | | | | |
|
|
| | | | | | | 402 |
| | | | | |
|
|
Industrials 2.2% | | | | | | |
AOL Time Warner, Inc. | | | | | | |
7.625% due 04/15/2031 | | | 100 | | | 116 |
DaimlerChrysler North America Holding Corp. | | | | | | |
4.750% due 01/15/2008 | | | 170 | | | 175 |
Williams Cos., Inc. | | | | | | |
7.875% due 09/01/2021 | | | 100 | | | 98 |
| | | | | |
|
|
| | | | | | | 389 |
| | | | | |
|
|
Utilities 3.7% | | | | | | |
AEP Texas Central Co. | | | | | | |
2.540% due 02/15/2005 (a) | | | 10 | | | 10 |
Appalachian Power Co. | | | | | | |
4.800% due 06/15/2005 | | | 20 | | | 21 |
AT&T Wireless Services, Inc. | | | | | | |
8.125% due 05/01/2012 | | | 25 | | | 30 |
El Paso Corp. | | | | | | |
6.750% due 05/15/2009 | | | 50 | | | 46 |
Entergy Gulf States, Inc. | | | | | | |
2.040% due 06/18/2007 | | | 200 | | | 200 |
Sprint Capital Corp. | | | | | | |
7.625% due 01/30/2011 | | | 100 | | | 114 |
TXU Corp. | | | | | | |
7.000% due 03/15/2013 | | | 100 | | | 111 |
Verizon Pennsylvania, Inc. | | | | | | |
5.650% due 11/15/2011 | | | 100 | | | 111 |
| | | | | |
|
|
| | | | | | | 643 |
| | | | | |
|
|
Total Corporate Bonds & Notes
(Cost $1,362) | | | | | | 1,434 |
| | | | | |
|
|
MUNICIPAL BONDS & NOTES 3.0% | | | | | | |
California 0.6% | | | | | | |
La Quinta, California Redevelopment Agency Tax Allocation Bonds, (AMBAC Insured), Series 2001 | | | | | | |
5.100% due 09/01/2031 | | | 100 | | | 105 |
| | | | | |
|
|
New Jersey 0.9% Tobacco Settlement Financing Corp., Series 2003 | | | | | | |
4.375% due 06/01/2019 | | | 70 | | | 66 |
6.750% due 06/01/2039 | | | 100 | | | 91 |
| | | | | |
|
|
| | | | | | | 157 |
| | | | | |
|
|
New York 0.7% | | | | | | |
New York State Environmental Facilities Corporate Revenue Bonds, Series 2002 | | | | | | |
8.890% due 06/15/2023 (a) | | | 25 | | | 28 |
New York Transitional Finance Authority Revenue Bonds, Series 2003 | | | | | | |
5.000% due 02/01/2033 | | | 100 | | | 104 |
| | | | | |
|
|
| | | | | | | 132 |
| | | | | |
|
|
Texas 0.1% | | | | | | |
University of Texas Revenue Bonds, Series 2003 | | | | | | |
5.000% due 08/15/2033 | | | 20 | | | 21 |
| | | | | |
|
|
Washington 0.7% | | | | | | |
Energy Northwest Washington Electric Revenue Bonds, Series 2003 | | | | | | |
5.500% due 07/01/2014 | | | 100 | | | 116 |
| | | | | |
|
|
Total Municipal Bonds & Notes
(Cost $526) | | | | | | 531 |
| | | | | |
|
|
U.S. TREASURY OBLIGATIONS 16.6% | | | | | | |
Treasury Inflation Protected Securities (e) | | | | | | |
3.375% due 01/15/2007 (b) | | $ | 151 | | $ | 166 |
3.625% due 01/15/2008 | | | 273 | | | 306 |
3.875% due 01/15/2009 | | | 460 | | | 527 |
4.250% due 01/15/2010 | | | 11 | | | 13 |
3.500% due 01/15/2011 | | | 53 | | | 60 |
3.375% due 01/15/2012 | | | 104 | | | 117 |
3.000% due 07/15/2012 | | | 409 | | | 451 |
3.875% due 04/15/2029 | | | 112 | | | 143 |
U.S. Treasury Bonds | | | | | | |
7.250% due 05/15/2016 | | | 200 | | | 266 |
7.500% due 11/15/2016 | | | 30 | | | 41 |
8.750% due 05/15/2017 | | | 200 | | | 299 |
U.S. Treasury Strips | | | | | | |
0.000% due 05/15/2017 | | | 1,000 | | | 540 |
| | | | | |
|
|
Total U.S. Treasury Obligations
(Cost $2,858) | | | | | | 2,929 |
| | | | | |
|
|
MORTGAGE-BACKED SECURITIES 25.8% | | | | | | |
Collateralized Mortgage Obligations 6.8% | | | | | | |
Bank of America Mortgage Securities, Inc. | | | | | | |
6.500% due 12/25/2031 | | | 17 | | | 17 |
Bear Stearns Adjustable Rate Mortgage Trust | | | | | | |
6.461% due 10/25/2031 (a) | | | 14 | | | 15 |
6.159% due 08/25/2032 (a) | | | 10 | | | 10 |
5.229% due 03/25/2033 (a) | | | 93 | | | 95 |
Chase Mortgage Finance Corp. | | | | | | |
6.190% due 12/25/2029 (a) | | | 5 | | | 5 |
Countrywide Home Loans, Inc. | | | | | | |
5.608% due 03/19/2032 (a) | | | 8 | | | 8 |
6.500% due 08/25/2032 (a) | | | 1 | | | 1 |
CS First Boston Mortgage Securities Corp. | | | | | | |
6.230% due 04/25/2032 (a) | | | 4 | | | 4 |
5.917% due 06/25/2032 (a) | | | 46 | | | 47 |
6.181% due 06/25/2032 (a) | | | 55 | | | 57 |
2.360% due 08/25/2033 (a) | | | 28 | | | 28 |
Fannie Mae | | | | | | |
5.000% due 09/25/2018 | | | 42 | | | 42 |
6.000% due 08/25/2029 | | | 138 | | | 139 |
5.000% due 04/25/2033 | | | 258 | | | 263 |
Federal Home Loan Bank | | | | | | |
5.500% due 03/15/2015 | | | 12 | | | 12 |
Freddie Mac | | | | | | |
5.250% due 03/15/2028 | | | 66 | | | 67 |
5.850% due 10/15/2031 | | | 19 | | | 19 |
5.750% due 04/15/2032 | | | 6 | | | 6 |
Government National Mortgage Association | | | | | | |
1.818% due 09/20/2030 (a) | | | 22 | | | 22 |
GSR Mortgage Loan Trust | | | | | | |
5.575% due 10/25/2031 (a) | | | 19 | | | 19 |
6.000% due 03/25/2032 | | | 60 | | | 61 |
6.000% due 07/25/2032 | | | 46 | | | 46 |
Master Asset Securitization Trust | | | | | | |
5.500% due 07/31/2033 | | | 100 | | | 101 |
Merrill Lynch Mortgage Investors, Inc. | | | | | | |
1.618% due 01/20/2030 (a) | | | 9 | | | 9 |
Morgan Stanley Capital I | | | | | | |
7.460% due 02/15/2020 | | | 31 | | | 31 |
Residential Funding Mortgage Securities I, Inc. | | | | | | |
5.645% due 09/25/2032 (a) | | | 10 | | | 10 |
6.250% due 09/25/2032 | | | 7 | | | 8 |
Structured Asset Mortgage Investments, Inc. | | | | | | |
1.647% due 09/19/2032 (a) | | | 9 | | | 9 |
Structured Asset Securities Corp. | | | | | | |
5.800% due 09/25/2031 | | | 3 | | | 3 |
6.500% due 09/25/2031 (a) | | | 34 | | | 35 |
6.150% due 07/25/2032 (a) | | | 6 | | | 6 |
| | | | | |
|
|
| | | | | | | 1,195 |
| | | | | |
|
|
Fannie Mae 13.9% | | | | | | |
5.000% due 07/17/2018 | | | 1,500 | | | 1,550 |
5.500% due 10/01/2017-11/01/2017 (c) | | | 109 | | | 114 |
6.000% due 06/01/2016-08/13/2033 (a)(c) | | $ | 688 | | $ | 717 |
6.500% due 08/01/2032 | | | 59 | | | 62 |
| | | | | |
|
|
| | | | | | | 2,443 |
| | | | | |
|
|
Freddie Mac 3.7% | | | | | | |
4.362% due 01/01/2028 (a) | | | 10 | | | 10 |
4.584% due 07/01/2027 (a) | | | 10 | | | 10 |
5.000% due 08/18/2018 | | | 90 | | | 93 |
6.000% due 09/01/2016-08/13/2033 (c) | | | 450 | | | 468 |
6.500% due 08/01/2032 | | | 62 | | | 64 |
| | | | | |
|
|
| | | | | | | 645 |
| | | | | |
|
|
Government National Mortgage Association 1.4% | | | | | | |
4.375% due 02/20/2027 (a) | | | 44 | | | 46 |
4.500% due 05/20/2030 (a) | | | 32 | | | 33 |
6.500% due 01/15/2029-05/15/2032 (c) | | | 170 | | | 178 |
| | | | | |
|
|
| | | | | | | 257 |
| | | | | |
|
|
Total Mortgage-Backed Securities
(Cost $4,538) | | | | | | 4,540 |
| | | | | |
|
|
ASSET-BACKED SECURITIES 0.7% | | | | | | |
Amortizing Residential Collateral Trust | | | | | | |
1.590% due 06/25/2032 (a) | | | 37 | | | 37 |
CIT Group Home Equity Loan Trust | | | | | | |
1.590% due 06/25/2033 (a) | | | 22 | | | 22 |
Equity One ABS, Inc. | | | | | | |
1.600% due 11/25/2032 (a) | | | 33 | | | 33 |
Household Mortgage Loan Trust | | | | | | |
1.618% due 05/20/2032 (a) | | | 6 | | | 6 |
Irwin Home Equity Loan Trust | | | | | | |
1.610% due 06/25/2029 (a) | | | 7 | | | 7 |
Morgan Stanley Dean Witter Capital I | | | | | | |
1.650% due 07/25/2032 (a) | | | 16 | | | 16 |
| | | | | |
|
|
Total Asset-Backed Securities
(Cost $121) | | | | | | 121 |
| | | | | |
|
|
| | | Shares
| | |
PREFERRED SECURITY 0.7% | | | | | | |
UBS Preferred Funding Trust I | | | | | | |
8.622% due 10/29/2049 (a) | | | 100,000 | | | 128 |
| | | | | |
|
|
Total Preferred Security
(Cost $102) | | | | | | 128 |
| | | | | |
|
|
| | | Principal
Amount
(000s)
| | |
SHORT-TERM INSTRUMENTS 59.2% | | | | | | |
Commercial Paper 57.3% | | | | | | |
Fannie Mae | | | | | | |
1.165% due 07/23/2003 | | $ | 1,200 | | | 1,199 |
1.160% due 08/06/2003 | | | 1,600 | | | 1,598 |
1.135% due 08/13/2003 | | | 800 | | | 799 |
1.165% due 08/13/2003 | | | 1,200 | | | 1,198 |
1.010% due 09/10/2003 | | | 700 | | | 699 |
1.010% due 09/17/2003 | | | 700 | | | 698 |
1.010% due 09/24/2003 | | | 700 | | | 698 |
Federal Home Loan Bank | | | | | | |
1.135% due 11/05/2003 | | | 500 | | | 498 |
Freddie Mac | | | | | | |
1.150% due 07/15/2003 | | | 300 | | | 300 |
1.195% due 07/17/2003 | | | 300 | | | 300 |
1.160% due 07/30/2003 | | | 200 | | | 200 |
1.185% due 09/03/2003 | | | 600 | | | 599 |
1.130% due 11/06/2003 | | | 300 | | | 299 |
1.140% due 11/07/2003 | | | 1,000 | | | 996 |
| | | | | |
|
|
| | | | | | | 10,081 |
| | | | | |
|
|
See accompanying notes | | | 6.30.03 | Semi-Annual Report | | 7 |
| | | Principal
Amount
(000s)
| | Value
(000s)
| |
Repurchase Agreement 0.8% | | | | | | | |
State Street Bank | | | | | | | |
0.800% due 07/01/2003 | | $ | 130 | | $ | 130 | |
(Dated 06/30/2003. Collateralized by Freddie Mac 2.550% due 10/01/2004 valued at $136. Repurchase proceeds are $130.) | | | | | | | |
| | | | | |
|
|
|
U.S. Treasury Bills 1.1% | | | | | | | |
1.043% due 08/07/2003-08/14/2003 (b)(c) | | | 200 | | | 200 | |
| | | | | |
|
|
|
Total Short-Term Instruments
(Cost $10,411) | | | | | | 10,411 | |
| | | | | |
|
|
|
Total Investments 114.2%
(Cost $19,918) | | | | | $ | 20,094 | |
Written Options (d) (0.3%)
(Premiums $49) | | | | | | (49 | ) |
Other Assets and Liabilities (Net)(13.9%) | | | | | | (2,452 | ) |
| | | | | |
|
|
|
Net Assets 100.0% | | | | | $ | 17,593 | |
| | | | | |
|
|
|
Notes to Schedule of Investments
(amounts in thousands, except number of contracts):
| (a) | | Variable rate security. The rate listed is as of June 30, 2003. |
| (b) | | Securities with an aggregate market value of $327 have been segregated with the custodian to cover margin requirements for the following open futures contracts at June 30, 2003: |
Type
| | # of
Contracts
| | Unrealized
Appreciation/
(Depreciation)
| |
Eurodollar March Futures (03/2004) - Long | | 5 | | $ | 9 | |
Eurodollar December Futures (12/2004) - Long | | 1 | | | 2 | |
U.S. Treasury 10 Year Note (09/2003) - Long | | 17 | | | (10 | ) |
U.S. Treasury 30 Year Bond (09/2003) - Long | | 6 | | | (20 | ) |
| | | | |
|
|
|
| | | | | $ | (19 | ) |
| | | | |
|
|
|
| (c) | | Securities are grouped by coupon or range of coupons and represent a range of maturities. |
| (d) | | Premiums received on written options: |
Type
| | Notional Amount
| | Premium
| | Value
|
Put - OTC 7 Year Interest Rate Swap | | | | | | | | | |
Strike @ 6.000%** Exp. 10/19/2004 | | $ | 100,000 | | $ | 4 | | $ | 1 |
Call - OTC 7 Year Interest Rate Swap | | | | | | | | | |
Strike @ 6.000%* Exp. 10/19/2004 | | | 100,000 | | | 4 | | | 13 |
Call - OTC 7 Year Interest Rate Swap | | | | | | | | | |
Strike @ 5.200%* Exp. 11/02/2004 | | | 100,000 | | | 3 | | | 8 |
Put - OTC 7 Year Interest Rate Swap | | | | | | | | | |
Strike @ 6.700%** Exp. 11/02/2004 | | | 100,000 | | | 3 | | | 1 |
Put - OTC 7 Year Interest Rate Swap | | | | | | | | | |
Strike @ 5.500%** Exp. 12/17/2003 | | | 100,000 | | | 1 | | | 0 |
Call - OTC 7 Year Interest Rate Swap | | | | | | | | | |
Strike @ 3.500%* Exp. 12/17/2003 | | | 200,000 | | | 2 | | | 4 |
Call - OTC 10 Year Interest Rate Swap | | | | | | | | | |
Strike @ 4.000%* Exp. 03/03/2004 | | | 100,000 | | | 2 | | | 2 |
Call - OTC 10 Year Interest Rate Swap | | | | | | | | | |
Strike @ 4.000%* Exp. 03/03/2004 | | | 100,000 | | | 2 | | | 2 |
Call - OTC 10 Year Interest Rate Swap | | | | | | | | | |
Strike @ 4.000%* Exp. 03/03/2004 | | | 100,000 | | | 1 | | | 2 |
| | | | | |
|
| |
|
|
| | | | | | $ | 22 | | $ | 33 |
| | | | | |
|
| |
|
|
Type
| | # of Contracts
| | Premium
| | Value
|
Call - CME Eurodollar March Futures | | | | | | | | |
Strike @ 98.500 Exp. 03/15/2004 | | 2 | | $ | 1 | | $ | 2 |
Put - CME Eurodollar March Futures | | | | | | | | |
Strike @ 97.250 Exp. 03/15/2004 | | 1 | | | 1 | | | 0 |
Put - CME Eurodollar March Futures | | | | | | | | |
Strike @ 97.750 Exp. 03/15/2004 | | 1 | | | 1 | | | 0 |
Put - CME Eurodollar December Futures | | | | | | | | |
Strike @ 98.000 Exp. 12/15/2003 | | 2 | | | 1 | | | 0 |
Call - CBOT 5 Year September Futures | | | | | | | | |
Strike @ 119.000 Exp. 08/23/2003 | | 1 | | | 0 | | | 0 |
Call - CBOT U.S. Treasury Note September Futures | | | | | | | | |
Strike @ 117.000 Exp. 08/23/2003 | | 1 | | | 1 | | | 1 |
Call - CBOT U.S. Treasury Note September Futures | | | | | | | | |
Strike @ 120.000 Exp. 08/23/2003 | | 1 | | | 1 | | | 0 |
Call - CBOT U.S. Treasury Note September Futures | | | | | | | | |
Strike @ 122.000 Exp. 08/23/2003 | | 1 | | | 0 | | | 0 |
Call - CBOT U.S. Treasury Note September Futures | | | | | | | | |
Strike @ 123.000 Exp. 08/23/2003 | | 4 | | | 1 | | | 0 |
Put - CBOT U.S. Treasury Note September Futures | | | | | | | | |
Strike @ 110.000 Exp. 08/23/2003 | | 6 | | | 6 | | | 0 |
Put - CBOT U.S. Treasury Note September Futures | | | | | | | | |
Strike @ 114.000 Exp. 08/23/2003 | | 1 | | | 0 | | | 0 |
Put - CBOT U.S. Treasury Note September Futures | | | | | | | | |
Strike @ 116.000 Exp. 08/23/2003 | | 4 | | | 2 | | | 3 |
Call - CBOT U.S. Treasury Bond September Futures | | | | | | | | |
Strike @ 128.000 Exp. 08/23/2003 | | 3 | | | 1 | | | 0 |
Call - CBOT U.S. Treasury Bond September Futures | | | | | | | | |
Strike @ 126.000 Exp. 08/23/2003 | | 7 | | | 3 | | | 1 |
Put - CBOT U.S. Treasury Bond September Futures | | | | | | | | |
Strike @ 114.000 Exp. 08/23/2003 | | 11 | | | 8 | | | 9 |
| | | | |
|
| |
|
|
| | | | | $ | 27 | | $ | 16 |
| | | | |
|
| |
|
|
| * | | The Portfolio will receive a floating rate based on 3-month LIBOR. |
| ** | | The Portfolio will pay a floating rate based on 3-month LIBOR. |
| (e) | | Principal amount of security is adjusted for inflation. |
| (f) | | Swap agreements outstanding at June 30, 2003: |
Type
| | Notional
Amount
| | Unrealized
Appreciation
|
Receive a fixed rate equal to 0.610% and the Portfolio will pay to the counterparty at par in the event of default of General Electric Capital Corp. 6.000% due 06/15/2012. Counterparty: Merrill Lynch & Co., Inc. | | | | | | |
Exp. 05/19/2004 | | $ | 10 | | | 0 |
| | | | | |
|
|
| | | | | | $ | 0 |
| | | | | |
|
|
8 | | Semi-Annual Report | 6.30.03 | | | See accompanying notes |
Notes to Financial Statements
June 30, 2003 (Unaudited)
1. Organization
The Total Return Portfolio II (the “Portfolio”) is a series of the PIMCO Variable Insurance Trust (the “Trust”). The Trust is registered under the Investment Company Act of 1940 (the “Act”), as amended, as an open-end investment company organized as a Delaware business trust on October 3, 1997. The Trust may offer up to two classes of shares: Institutional and Administrative. Each share class has identical voting rights (except that shareholders of a class have exclusive voting rights regarding any matter relating solely to that class of shares). Information presented in these financial statements pertains to the Administrative Class of the Trust. Certain detailed financial information for the Institutional Class is provided separately and is available upon request. The Trust is designed to be used as an investment vehicle by Separate Accounts of insurance companies that fund variable annuity contracts and variable life insurance policies and by qualified pension and retirement plans. The Portfolio commenced operations on May 28, 1999.
2. Significant Accounting Policies
The following is a summary of significant accounting policies consistently followed by the Trust in the preparation of its financial statements in conformity with accounting principles generally accepted in the United States of America. The preparation of financial statements in accordance with accounting principles generally accepted in the United States of America requires management to make estimates and assumptions that affect the reported amounts and disclosures in the financial statements. Actual results could differ from those estimates.
Security Valuation. Portfolio securities and other financial instruments for which market quotations are readily available are stated at market value. Market value is determined at the close of regular trading (normally, 4:00 p.m., Eastern Time) on the New York Stock Exchange on each day the New York Stock Exchange is open, or if no sales are reported, as is the case for most securities traded over-the-counter, the mean between representative bid and asked quotations obtained from a quotation reporting system or from established market makers. Fixed income securities, including those to be purchased under firm commitment agreements, are normally valued on the basis of quotes obtained from brokers and dealers or pricing services. Short-term investments, which mature in 60 days or less are valued at amortized cost, which approximates market value. Certain fixed income securities for which daily market quotations are not readily available may be valued, pursuant to guidelines established by the Board of Trustees, with reference to fixed income securities whose prices are more readily obtainable. Prices may be obtained from independent pricing services which use information provided by market makers or estimates of market values obtained from yield data relating to investments or securities with similar characteristics. The prices used by the Portfolio may differ from the value that would be realized if the securities were sold and the differences could be material to the financial statements.
Securities Transactions and Investment Income. Securities transactions are recorded as of the trade date. Securities purchased or sold on a when-issued or delayed delivery basis may be settled a month or more after the trade date. Realized gains and losses from securities sold are recorded on the identified cost basis. Dividend income is recorded on the ex-dividend date, except certain dividends from foreign securities where the ex-dividend date may have passed, are recorded as soon as the Portfolio is informed of the ex-dividend date. Interest income, adjusted for the accretion of discounts and amortization of premiums, is recorded on the accrual basis. Paydowns gains and losses on mortgage- and asset-backed securities are recorded as adjustments to interest income in the Statement of Operations.
Dividends and Distributions to Shareholders. Dividends from net investment income, if any, are declared on each day the Trust is open for business and are distributed to shareholders monthly. All dividends are reinvested in additional shares of the Portfolio. Net realized capital gains earned by the Portfolio, if any, will be distributed no less frequently than once each year.
Income dividends and capital gain distributions are determined in accordance with income tax regulations which may differ from accounting principles generally accepted in the United States of America. These differences are primarily due to differing treatments for such items as wash sales, foreign currency transactions, net operating losses and capital loss carryforwards.
Distributions classified as a tax basis return of capital, if any, are reflected in the accompanying Statements of Changes in Net Assets and have been reclassified to paid in capital. In addition, other amounts have been reclassified between undistributed net investment income, accumulated undistributed net realized gains or losses and/or paid in capital to more appropriately conform financial accounting to tax characterizations of dividend distributions.
Multiclass Operations. Each class offered by the Trust has equal rights as to assets. Income, non-class specific expenses, and realized and unrealized capital gains and losses are allocated to each class of shares based on the relative net assets of each class.
Federal Income Taxes. The Portfolio intends to qualify as a regulated investment company and distribute all of its taxable income and net realized gains, if applicable, to shareholders. Accordingly, no provision for Federal income taxes has been made.
6.30.03 | Semi-Annual Report | | 9 |
Financing Transactions. The Portfolio may enter into financing transactions consisting of the sale by the Portfolio of securities, together with a commitment to repurchase similar securities at a future date. The difference between the selling price and the future purchase price is an adjustment to interest income in the Statement of Operations. If the counterparty to whom the Portfolio sells the security becomes insolvent, the Portfolio’s right to repurchase the security may be restricted; the value of the security may change over the term of the financing transaction; and the return earned by the Portfolio with the proceeds of a financing transaction may not exceed transaction costs. The Portfolio will designate assets determined to be liquid by PIMCO or otherwise cover its obligations under financing transactions.
Futures Contracts. The Portfolio is authorized to enter into futures contracts. The Portfolio may use futures contracts to manage its exposure to the securities markets or to movements in interest rates and currency values. The primary risks associated with the use of futures contracts are imperfect correlation between the change in market value of the securities held by the Portfolio and the prices of futures contracts, the possibility of an illiquid market, and the inability of the counterparty to meet the terms of the contract. Futures contracts are valued based upon their quoted daily settlement prices. Upon entering into a futures contract, the Portfolio may be required to deposit with its custodian, in a segregated account in the name of the futures broker, an amount of cash or U.S. Government and Agency Obligations in accordance with the initial margin requirements of the broker or exchange. Futures contracts are marked to market daily and an appropriate payable or receivable for the change in value (“variation margin”) is recorded by the Portfolio. Gains or losses are recognized but not considered realized until the contracts expire or are closed. Futures contracts involve, to varying degrees, risk of loss in excess of the variation margin disclosed in the Statement of Assets and Liabilities.
Options Contracts. The Portfolio may write call and put options on futures, securities or currencies it owns or in which it may invest. Writing put options tends to increase the Portfolio’s exposure to the underlying instrument. Writing call options tends to decrease the Portfolio’s exposure to the underlying instrument. When the Portfolio writes a call or put option, an amount equal to the premium received is recorded as a liability and subsequently marked to market to reflect the current value of the option written. Payment received or made, if any, from writing options with premiums to be determined on a future date are reflected as such on the Statement of Assets and Liabilities. Premiums received from writing options which expire are treated as realized gains. Premiums received from writing options which are exercised or closed are added to the proceeds or offset against amounts paid on the underlying future, security or currency transaction to determine the realized gain or loss. The Portfolio as a writer of an option has no control over whether the underlying future, security or currency may be sold (call) or purchased (put) and as a result bears the market risk of an unfavorable change in the price of the future, security or currency underlying the written option. There is the risk the Portfolio may not be able to enter into a closing transaction because of an illiquid market.
The Portfolio may also purchase put and call options. Purchasing call options tends to increase the Portfolio’s exposure to the underlying instrument. Purchasing put options tends to decrease the Portfolio’s exposure to the underlying instrument. The Portfolio pays a premium which is included in the Portfolio’s Statement of Assets and Liabilities as an investment and subsequently marked to market to reflect the current value of the option. Premiums paid for purchasing options which expire are treated as realized losses. The risk associated with purchasing put and call options is limited to the premium paid. Premiums paid for purchasing options which are exercised or closed are added to the amounts paid or offset against the proceeds on the underlying future, security or currency transaction to determine the realized gain or loss.
Swap Agreements. The Portfolio may invest in swap agreements. A swap is an agreement to exchange the return generated by one instrument for the return generated by another instrument. The Portfolio may enter into interest rate, total return, forward swap spread lock and credit default swap agreements to manage its exposure to interest rates and credit risk. Interest rate swap agreements involve the exchange by the Portfolio with another party of their respective commitments to pay or receive interest, e.g., an exchange of floating rate payments for fixed rate payments with respect to a notional amount of principal. Total return swap agreements involve commitments to pay interest in exchange for a market-linked return, both based on notional amounts. To the extent the total return of the security or index underlying the transaction exceeds or falls short of the offsetting interest rate obligation, the Portfolio will receive a payment from or make a payment to the counterparty. Forward spread lock swap agreements involve commitments to pay or receive a settlement amount calculated as the difference between the swap spread and a fixed spread, multiplied by the notional amount times the duration of the swap. The swap spread is the difference between the benchmark swap rate (market rate) and the specific Treasury rate. In a credit default swap, one party makes a stream of payments to another party in exchange for the right to receive a specified return in the event of a default by a third party, typically corporate issues or sovereign issues of an emerging country, on its obligation. The Portfolio may use credit default swaps to provide a measure of protection against defaults of sovereign issuers (i.e., to reduce risk where the Portfolio owns or has exposure to the sovereign issuer) or to take an active
10 | | Semi-Annual Report | 6.30.03 |
long or short position with respect to the likelihood of a particular issuer’s default. Swaps are marked to market daily based upon quotations from market makers and vendors and the change in value, if any, is recorded as unrealized gain or loss in the Statement of Operations. Payments received or made at the beginning of the measurement period are reflected as such on the Statement of Assets and Liabilities. A liquidation payment received or made at the termination of the swap is recorded as realized gain or loss in the Statement of Operations. Net periodic payments are included as part of miscellaneous income on the Statement of Operations. Entering into these agreements involves, to varying degrees, elements of credit, market and documentation risk in excess of the amounts recognized on the Statement of Assets and Liabilities. Such risks involve the possibility that there will be no liquid market for these agreements, that the counterparty to the agreements may default on its obligation to perform or disagree as to the meaning of contractual terms in the agreements, and that there may be unfavorable changes in interest rates.
Delayed Delivery Transactions. The Portfolio may purchase or sell securities on a when-issued or delayed delivery basis. These transactions involve a commitment by the Portfolio to purchase or sell securities for a predetermined price or yield, with payment and delivery taking place beyond the customary settlement period. When delayed delivery purchases are outstanding, the Portfolio will set aside and maintain until the settlement date in a segregated account, liquid assets in an amount sufficient to meet the purchase price. When purchasing a security on a delayed delivery basis, the Portfolio assumes the rights and risks of ownership of the security, including the risk of price and yield fluctuations, and takes such fluctuations into account when determining its net asset value. The Portfolio may dispose of or renegotiate a delayed delivery transaction after it is entered into, and may sell when-issued securities before they are delivered, which may result in a capital gain or loss. When the Portfolio has sold a security on a delayed delivery basis, the Portfolio does not participate in future gains and losses with respect to the security.
Inflation-Indexed Bonds. Inflation-indexed bonds are fixed income securities whose principal value is periodically adjusted to the rate of inflation. The interest rate on these bonds is generally fixed at issuance at a rate lower than typical bonds. Over the life of an inflation-indexed bond, however, interest will be paid based on a principal value, which is adjusted for inflation. Any increase in the principal amount of an inflation-indexed bond will be included as interest income in the Statement of Operations, even though investors do not receive their principal until maturity.
Repurchase Agreements. The Portfolio may engage in repurchase transactions. Under the terms of a typical repurchase agreement, the Portfolio takes possession of an underlying debt obligation subject to an obligation of the seller to repurchase, and the Portfolio to resell, the obligation at an agreed-upon price and time. The market value of the collateral must be equal at all times to the total amount of the repurchase obligations, including interest. Generally, in the event of counterparty default, the Portfolio has the right to use the collateral to offset losses incurred.
3. Fees, Expenses, and Related Party Transactions
Investment Advisory Fee. Pacific Investment Management Company LLC (PIMCO) is a majority owned subsidiary partnership of Allianz Dresdner Asset Management of America L.P. (formerly PIMCO Advisors L.P.) and serves as investment adviser (the “Adviser”) to the Trust, pursuant to an investment advisory contract. The Adviser receives a monthly fee at an annual rate based on average daily net assets of the Portfolio. The Advisory Fee is charged at an annual rate of 0.25%.
Administration Fee. PIMCO serves as administrator (the “Administrator”) and provides administrative services to the Trust for which it receives a monthly administrative fee based on average daily net assets of the Portfolio. The Administration Fee is charged at the annual rate of 0.25%.
Servicing Fee. PIMCO Advisors Distributors LLC (“PAD”), is an indirect wholly-owned subsidiary of Allianz Dresdner Asset Management of America L.P. and serves as the distributor of the Trust’s shares. The Trust is permitted to reimburse PAD on a quarterly basis, out of the Administrative Class assets of the Portfolio in the amount of 0.15% on an annual basis of the average daily net assets of that class, for payments made to financial intermediaries that provide services in connection with the distribution of shares or administration of plans or programs that use Portfolio shares as their funding medium. The effective rate paid to PAD during the current fiscal year is 0.15%.
Expenses. The Portfolio is responsible for the following expenses: (i) salaries and other compensation of any of the Trust’s executive officers and employees who are not officers, directors, stockholders or employees of PIMCO or its subsidiaries or affiliates; (ii) taxes and governmental fees; (iii) brokerage fees and commissions and other portfolio transaction expenses; (iv) the cost of borrowing money, including interest expense; (v) fees and expenses of the Trustees who are not “interested persons” of PIMCO or the Trust, and any counsel retained exclusively for their benefit; (vi) extraordinary expenses, including costs of litigation and indemnification expenses; (vii) organization expenses and (viii) any expenses allocated or allocable to a specific class of shares, which include service fees payable with respect to the
6.30.03 | Semi-Annual Report | | 11 |
Administrative Class shares and may include certain other expenses as permitted by the Trust’s Multiple Class Plan adopted pursuant to Rule 18f-3 under the Act and subject to review and approval by the Trustees. The ratio of expenses to average net assets per share class, as disclosed in the Financial Highlights, may differ from the annual Portfolio operating expenses per share class as disclosed in the Prospectus for the reasons set forth above. PIMCO has agreed to waive a portion of its administrative fees to the extent that the payment of the Portfolio’s pro rata share of Trustees’ fees causes the actual expense ratio to rise above the rates disclosed in the current prospectus plus 0.49 basis points as set forth below (calculated as a percentage of the Portfolio’s average daily net assets attributable to each class):
| | | Institutional
Class
| | | Administrative
Class
| |
Total Return Portfolio II | | 0.50 | % | | 0.65 | % |
PIMCO may be reimbursed for these waived amounts in future periods. The Trust pays no compensation directly to any Trustee or any other officer who is affiliated with the Administrator, all of whom receive renumeration for their services to the Trust from the Administrator or its affiliates.
Each unaffiliated Trustee receives an annual retainer of $4,000, plus $1,500 for each Board of Trustees meeting attended in person and $250 for each meeting attended telephonically, plus reimbursement of related expenses. In addition, each committee chair receives an additional annual retainer of $500. These expenses are allocated on a pro-rata basis to each Portfolio of the Trust according to its respective net assets.
4. Purchases and Sales of Securities
Purchases and sales of securities (excluding short-term investments) for the period ended June 30, 2003 were as follows (amounts in thousands):
| | | U.S Government/Agency
| | All Other
|
| | | Purchases
| | Sales
| | Purchases
| | Sales
|
Total Return Portfolio II | | $ | 19,779 | | $ | 15,462 | | $ | 17,448 | | $ | 16,115 |
5. Transactions in Written Call and Put Options
Transactions in written call and put options were as follows (amounts in thousands):
| | | Total Return Portfolio II
| |
| | | | | Premium
| |
Balance at 12/31/2002 | | | | $ | 16 | |
Sales | | | | | 44 | |
Closing Buys | | | | | (1 | ) |
Expirations | | | | | (10 | ) |
Exercised | | | | | 0 | |
| | | | |
|
|
|
Balance at 06/30/2003 | | | | $ | 49 | |
| | | | |
|
|
|
6. Federal Income Tax Matters
At June 30, 2003, the aggregate cost of investments was the same for federal income tax and financial statement purposes. The net unrealized appreciation (depreciation) of investments securities for federal income tax purposes is as follows (amounts in thousands):
| | | Aggregate Gross
Unrealized
Appreciation
| | Aggregate Gross Unrealized
(Depreciation)
| | | Net Unrealized
Appreciation
|
Total Return Portfolio II | | $ | 211 | | $ | (35 | ) | | $ | 176 |
12 | | Semi-Annual Report | 6.30.03 |
7. Shares of Beneficial Interest
The Trust may issue an unlimited number of shares of beneficial interest with a $.0001 par value. Changes in shares of beneficial interest were as follows (shares and amounts in thousands):
| | | Total Return Portfolio II
| |
| | | Six Months Ended
06/30/2003 | | | Year Ended 12/31/2002 | |
| | | Shares
| | | Amount
| | | Shares
| | | Amount
| |
Receipts for shares sold | | | | | | | | | | | | | | |
Institutional Class | | 0 | | | $ | 0 | | | 0 | | | $ | 0 | |
Administrative Class | | 0 | | | | 0 | | | 1,474 | | | | 14,872 | |
Issued as reinvestment of distributions | | | | | | | | | | | | | | |
Institutional Class | | 0 | | | | 2 | | | 10 | | | | 98 | |
Administrative Class | | 16 | | | | 166 | | | 21 | | | | 212 | |
Cost of shares redeemed | | | | | | | | | | | | | | |
Institutional Class | | (119 | ) | | | (1,200 | ) | | (269 | ) | | | (2,745 | ) |
Administrative Class | | (12 | ) | | | (120 | ) | | (58 | ) | | | (600 | ) |
| | |
|
| |
|
|
| |
|
| |
|
|
|
Net increase (decrease) resulting from Portfolio share transactions | | (115 | ) | | $ | (1,152 | ) | | 1,178 | | | $ | 11,837 | |
| | |
|
| |
|
|
| |
|
| |
|
|
|
The following schedule shows the number of shareholders each owning 5% or more of the Portfolio and the total percentage of the Portfolio held by such shareholders:
| | | Number
| | % of Portfolio
Held
|
Total Return Portfolio II | | | | |
Institutional Class | | 1 | | 100 |
Administrative Class | | 1 | | 99 |
6.30.03 | Semi-Annual Report | | 13 |
Trustees and Officers
Brent R. Harris, Chairman and Trustee
R. Wesley Burns, President and Trustee
E. Philip Cannon, Trustee
Vern O. Curtis, Trustee
J. Michael Hagan, Trustee
William J. Popejoy, Trustee
Garlin G. Flynn, Secretary
John P. Hardaway, Treasurer
Investment Adviser and Administrator
Pacific Investment Management Company LLC
840 Newport Center Drive
Newport Beach, California 92660
Transfer Agent
National Financial Data Services
330 W. 9th Street, 4th Floor
Kansas City, Missouri 64105
Custodian
State Street Bank & Trust Company
801 Pennsylvania
Kansas City, Missouri 64105
Counsel
Dechert LLP
1775 I Street, N.W.
Washington, D.C. 20006
Independent Accountants
PricewaterhouseCoopers LLP
1055 Broadway
Kansas City, Missouri 64105
PIMCO VARIABLE INSURANCE TRUST
This report is submitted for the general information of the shareholders of the PIMCO Variable Insurance Trust. It is not authorized for distribution to prospective investors unless accompanied or preceded by an effective prospectus for the PIMCO Variable Insurance Trust, which contains information covering its investment policies as well as other pertinent information.
All Funds distributed by PIMCO ADVISORS DISTRIBUTORS LLC, member NASD
840 NEWPORT CENTER DRIVE
NEWPORT BEACH, CA 92660
800.927.4648
WWW. PIMCOADVISORS. COM
WWW. PIMCO.COM
| P I M C O |
| PIMCO VARIABLE INSURANCE TRUST |
| TOTAL RETURN PORTFOLIO II |
| INSTITUTIONAL CLASS |
|
| SEMI-ANNUAL REPORT |
| June 30, 2003 |
| | | Fund Summary
| | Schedule of Investments
|
Total Return Portfolio II (Institutional Class) | | 2 | | 7 |
Chairman’s Letter
Dear PIMCO Variable Insurance Trust Shareholder:
Financial assets gained during the first half of 2003 amid a revival of risk appetites as anxiety about the war in Iraq faded. Assets that generally benefit from economic growth, such as stocks, corporate bonds and emerging market debt, fared the best year-to-date as investors returned to these sectors in anticipation of a recovery in the second half of 2003. Reflationary forces that investors expected to fuel a rebound included federal tax cuts and a weak dollar, as well as low borrowing rates that eased the burden of high personal and corporate indebtedness. Low mortgage rates kept refinancings booming in the second quarter and put more money in consumers’ pockets.
U.S. Treasuries lagged their riskier counterparts but still enjoyed a modest rally. Yields fell to levels not seen in 45 years early in the second quarter before bouncing off their lows in June as hopes for recovery increased. The yield on the benchmark 10-year Treasury closed the six-month period 0.30% lower to 3.51%, after nearing 3% earlier in the period. Buyers were encouraged that inflation would remain tame amid low capacity utilization and weak employment growth. Asian central banks bought U.S. Treasuries to limit the rise in their currencies versus the dollar in an effort to protect their export industries. In June, the Federal Reserve cut the federal funds rate by 0.25% to 1%, its 13th easing since 2001, in an effort to boost the economy and ward off deflation. Although the cut was less than expected, the Fed suggested that rates would stay low until deflation risks abated.
On the following pages you will find specific details as to the Portfolio’s total return investment performance and a discussion of those factors that affected performance.
We appreciate the trust you have placed in us, and we will continue to focus our efforts to meet your investment needs.
Sincerely,
Brent R. Harris
Chairman
July 31, 2003
6.30.03 | Semi-Annual Report | | 1 |
Total Return Portfolio II
TOTAL RETURN INVESTMENT PERFORMANCE For the period ended June 30, 2003
| | | 1 Year | | | Since Inception* | |
Total Return Portfolio II Institutional Class | | 10.64 | % | | 9.48 | % |
Lehman Brothers Aggregate Bond Index | | 10.40 | % | | — | |
| * | | Annualized (All Portfolio returns are net of fees and expenses) |
CUMULATIVE RETURNS THROUGH JUNE 30, 2003
$10,000 invested at inception
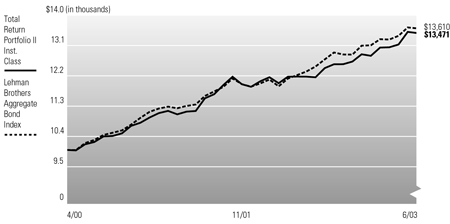
Past performance is no guarantee of future results. Investment return and principal value will fluctuate so that Portfolio shares, when redeemed, may be worth more or less than their original cost. The line graph above assumes the investment of $10,000 on 5/01/2000, the first full month following the Portfolio’s Institutional Class inception on 4/10/2000, compared to the Lehman Brothers Aggregate Bond Index, an unmanaged market index. It is not possible to invest directly in the index.
PORTFOLIO INSIGHTS
| • | | The Total Return Portfolio II seeks to achieve its investment objective by investing under normal circumstances at least 65% of its total assets in a diversified portfolio of Fixed Income Instruments of varying maturities with quality and non-U.S. issuer restrictions. |
| • | | The Portfolio’s Institutional Class returned 4.91% for the six-month period ended June 30, 2003, outperforming its benchmark, the Lehman Brothers Aggregate Bond Index, which returned 3.93% for the period. |
| • | | Portfolio duration was near the benchmark throughout the period, and had little effect on relative performance. An emphasis on both short and long maturities had a minimal impact on returns as yield curve shape changed little over the period. |
| • | | Near benchmark exposure to mortgages had little impact on relative performance. An overweight of lower coupon mortgages, which are less vulnerable to prepayment risk, helped returns as these issues outperformed. |
| • | | A corporate underweight was negative as corporates outperformed, but positive security selection of telecom and energy pipeline issues mitigated this impact. |
2 | | Semi-Annual Report | 6.30.03 |
Financial Highlights
Total Return Portfolio II (Institutional Class)
| Selected Per Share Data for the Year or Period Ended: | | 06/30/2003 +
| | | 12/31/2002
| | | 12/31/2001
| | | 04/10/2000-12/31/2000
| |
Net asset value beginning of period | | $ | 10.09 | | | $ | 10.12 | | | $ | 10.24 | | | $ | 10.02 | |
Net investment income (a) | | | 0.08 | | | | 0.41 | | | | 0.50 | | | | 0.50 | |
Net realized/unrealized gain on investments (a) | | | 0.41 | | | | 0.39 | | | | 0.49 | | | | 0.22 | |
Total income from investment operations | | | 0.49 | | | | 0.80 | | | | 0.99 | | | | 0.72 | |
Dividends from net investment income | | | (0.11 | ) | | | (0.41 | ) | | | (0.50 | ) | | | (0.50 | ) |
Distributions from net realized capital gains | | | 0.00 | | | | (0.42 | ) | | | (0.61 | ) | | | 0.00 | |
Total distributions | | | (0.11 | ) | | | (0.83 | ) | | | (1.11 | ) | | | (0.50 | ) |
Net asset value end of period | | $ | 10.47 | | | $ | 10.09 | | | $ | 10.12 | | | $ | 10.24 | |
Total return | | | 4.91 | % | | | 8.13 | % | | | 9.88 | % | | | 7.41 | % |
Net assets end of period (000s) | | $ | 16 | | | $ | 1,217 | | | $ | 3,845 | | | $ | 3,499 | |
Ratio of expenses to average net assets | | | 0.50 | %* | | | 0.51 | %(c) | | | 0.50 | %(b) | | | 0.50 | %* |
Ratio of net investment income to average net assets | | | 1.55 | %* | | | 3.99 | % | | | 4.71 | % | | | 6.90 | %* |
Portfolio turnover rate | | | 302 | % | | | 418 | % | | | 606 | % | | | 937 | % |
| (a) | | Per share amounts based on average number of shares outstanding during the period. |
| (b) | | If the investment manager had not reimbursed expenses, the ratio of operating expenses to average net assets would have been 0.51% for the year ended December 31, 2001. |
| (c) | | Ratio of expenses to average net assets excluding interest expense is 0.50%. |
See accompanying notes | | | 6.30.03 | Semi-Annual Report | | 3 |
Statement of Assets and Liabilities
Total Return Portfolio II
June 30, 2003 (Unaudited)
Amounts in thousands, except per share amounts
Assets: | | | |
Investments, at value | | $ | 20,094 |
Cash | | | 4 |
Receivable for investments sold | | | 972 |
Interest receivable | | | 71 |
Variation margin receivable | | | 13 |
| | |
|
|
| | | | 21,154 |
| | |
|
|
Liabilities: | | | |
Payable for investments purchased | | $ | 3,501 |
Written options outstanding | | | 49 |
Accrued investment advisory fee | | | 4 |
Accrued administration fee | | | 4 |
Accrued servicing fee | | | 2 |
Variation margin payable | | | 1 |
| | |
|
|
| | | | 3,561 |
| | |
|
|
Net Assets | | $ | 17,593 |
| | |
|
|
Net Assets Consist of: | | | |
Paid in capital | | $ | 16,867 |
Undistributed net investment income | | | 29 |
Accumulated undistributed net realized gain | | | 539 |
Net unrealized appreciation | | | 158 |
| | |
|
|
| | | $ | 17,593 |
| | |
|
|
Net Assets: | | | |
Institutional Class | | $ | 16 |
Administrative Class | | | 17,577 |
Shares Issued and Outstanding: | | | |
Institutional Class | | | 2 |
Administrative Class | | | 1,678 |
Net Asset Value and Redemption Price Per Share (Net Assets Per Share Outstanding) | | | |
Institutional Class | | $ | 10.47 |
Administrative Class | | | 10.47 |
Cost of Investments Owned | | $ | 19,918 |
4 | | Semi-Annual Report | 6.30.03 | | | See accompanying notes |
Statement of Operations
Total Return Portfolio II
For the period ended June 30, 2003 (Unaudited)
Amounts in thousands
Investment Income: | | | |
Interest | | $ | 203 |
| | |
|
|
Total Income | | | 203 |
| | |
|
|
Expenses: | | | |
Investment advisory fees | | | 21 |
Administration fees | | | 21 |
Distribution and/or servicing fees - Administrative Class | | | 13 |
| | |
|
|
Total Expenses | | | 55 |
| | |
|
|
Net Investment Income | | | 148 |
| | |
|
|
Net Realized and Unrealized Gain (Loss): | | | |
Net realized gain on investments | | | 294 |
Net realized gain on futures contracts, written options, and swaps | | | 221 |
Net change in unrealized appreciation on investments | | | 146 |
Net change in unrealized appreciation on futures contracts, written options, and swaps | | | 5 |
Net Gain | | | 666 |
| | |
|
|
Net Increase in Assets Resulting from Operations | | $ | 814 |
| | |
|
|
See accompanying notes | | | 6.30.03 | Semi-Annual Report | | 5 |
Statements of Changes in Net Assets
Total Return Portfolio II
Amounts in thousands
| Increase (Decrease) in Net Assets from: | | Six Months Ended June 30, 2003
| | | Year Ended December 31, 2002
| |
| | | (Unaudited) | | | | |
Operations: | | | | | | | | |
Net investment income | | $ | 148 | | | $ | 160 | |
Net realized gain | | | 515 | | | | 219 | |
Net change in unrealized appreciation (depreciation) | | | 151 | | | | (55 | ) |
| | |
|
|
| |
|
|
|
Net increase resulting from operations | | | 814 | | | | 324 | |
| | |
|
|
| |
|
|
|
Distributions to Shareholders: | | | | | | | | |
From net investment income | | | | | | | | |
Institutional Class | | | (2 | ) | | | (50 | ) |
Administrative Class | | | (166 | ) | | | (110 | ) |
From net realized capital gains | | | | | | | | |
Institutional Class | | | 0 | | | | (48 | ) |
Administrative Class | | | 0 | | | | (102 | ) |
| | |
|
|
| |
|
|
|
Total Distributions | | | (168 | ) | | | (310 | ) |
| | |
|
|
| |
|
|
|
Portfolio Share Transactions: | | | | | | | | |
Receipts for shares sold | | | | | | | | |
Institutional Class | | | 0 | | | | 0 | |
Administrative Class | | | 0 | | | | 14,872 | |
Issued as reinvestment of distributions | | | | | | | | |
Institutional Class | | | 2 | | | | 98 | |
Administrative Class | | | 166 | | | | 212 | |
Cost of shares redeemed | | | | | | | | |
Institutional Class | | | (1,200 | ) | | | (2,745 | ) |
Administrative Class | | | (120 | ) | | | (600 | ) |
| | |
|
|
| |
|
|
|
Net increase (decrease) resulting from Portfolio share transactions | | | (1,152 | ) | | | 11,837 | |
| | |
|
|
| |
|
|
|
Total Increase (Decrease) in Net Assets | | | (506 | ) | | | 11,851 | |
| | |
|
|
| |
|
|
|
Net Assets: | | | | | | | | |
Beginning of period | | | 18,099 | | | | 6,248 | |
End of period* | | $ | 17,593 | | | $ | 18,099 | |
*Including undistributed net investment income of: | | $ | 29 | | | $ | 49 | |
6 | | Semi-Annual Report | 6.30.03 | | | See accompanying notes |
Schedule of Investments
Total Return Portfolio II
June 30, 2003 (Unaudited)
| | | Principal Amount (000s)
| | Value (000s)
|
CORPORATE BONDS & NOTES 8.2% | | | | | | |
Banking & Finance 2.3% | | | | | | |
CIT Group, Inc. | | | | | | |
5.500% due 02/15/2004 | | $ | 30 | | $ | 31 |
2.618% due 07/30/2004 (a) | | | 40 | | | 40 |
2.798% due 01/31/2005 (a) | | | 100 | | | 101 |
EOP Operating L.P. | | | | | | |
5.875% due 01/15/2013 | | | 100 | | | 108 |
General Electric Capital Corp. | | | | | | |
6.125% due 02/22/2011 | | | 20 | | | 23 |
General Motors Acceptance Corp. | | | | | | |
1.679% due 07/21/2004 (a) | | | 100 | | | 99 |
| | | | | |
|
|
| | | | | | | 402 |
| | | | | |
|
|
Industrials 2.2% | | | | | | |
AOL Time Warner, Inc. | | | | | | |
7.625% due 04/15/2031 | | | 100 | | | 116 |
DaimlerChrysler North America Holding Corp. | | | | | | |
4.750% due 01/15/2008 | | | 170 | | | 175 |
Williams Cos., Inc. | | | | | | |
7.875% due 09/01/2021 | | | 100 | | | 98 |
| | | | | |
|
|
| | | | | | | 389 |
| | | | | |
|
|
Utilities 3.7% | | | | | | |
AEP Texas Central Co. | | | | | | |
2.540% due 02/15/2005 (a) | | | 10 | | | 10 |
Appalachian Power Co. | | | | | | |
4.800% due 06/15/2005 | | | 20 | | | 21 |
AT&T Wireless Services, Inc. | | | | | | |
8.125% due 05/01/2012 | | | 25 | | | 30 |
El Paso Corp. | | | | | | |
6.750% due 05/15/2009 | | | 50 | | | 46 |
Entergy Gulf States, Inc. | | | | | | |
2.040% due 06/18/2007 | | | 200 | | | 200 |
Sprint Capital Corp. | | | | | | |
7.625% due 01/30/2011 | | | 100 | | | 114 |
TXU Corp. | | | | | | |
7.000% due 03/15/2013 | | | 100 | | | 111 |
Verizon Pennsylvania, Inc. | | | | | | |
5.650% due 11/15/2011 | | | 100 | | | 111 |
| | | | | |
|
|
| | | | | | | 643 |
| | | | | |
|
|
Total Corporate Bonds & Notes (Cost $1,362) | | | | | | 1,434 |
| | | | | |
|
|
MUNICIPAL BONDS & NOTES 3.0% | | | | | | |
California 0.6% | | | | | | |
La Quinta, California Redevelopment Agency Tax Allocation Bonds, (AMBAC Insured), Series 2001 | | | | | | |
5.100% due 09/01/2031 | | | 100 | | | 105 |
| | | | | |
|
|
New Jersey 0.9% | | | | | | |
Tobacco Settlement Financing Corp., Series 2003 | | | | | | |
4.375% due 06/01/2019 | | | 70 | | | 66 |
6.750% due 06/01/2039 | | | 100 | | | 91 |
| | | | | |
|
|
| | | | | | | 157 |
| | | | | |
|
|
New York 0.7% | | | | | | |
New York State Environmental Facilities Corporate Revenue Bonds, Series 2002 | | | | | | |
8.890% due 06/15/2023 (a) | | | 25 | | | 28 |
New York Transitional Finance Authority Revenue Bonds, Series 2003 | | | | | | |
5.000% due 02/01/2033 | | | 100 | | | 104 |
| | | | | |
|
|
| | | | | | | 132 |
| | | | | |
|
|
Texas 0.1% | | | | | | |
University of Texas Revenue Bonds, Series 2003 | | | | | | |
5.000% due 08/15/2033 | | | 20 | | | 21 |
| | | | | |
|
|
Washington 0.7% | | | | | | |
Energy Northwest Washington Electric Revenue Bonds, Series 2003 | | | | | | |
5.500% due 07/01/2014 | | | 100 | | | 116 |
| | | | | |
|
|
Total Municipal Bonds & Notes (Cost $526) | | | | | | 531 |
| | | | | |
|
|
U.S. TREASURY OBLIGATIONS 16.6% | | | | | | |
Treasury Inflation Protected Securities (e) | | | | | | |
3.375% due 01/15/2007 (b) | | $ | 151 | | $ | 166 |
3.625% due 01/15/2008 | | | 273 | | | 306 |
3.875% due 01/15/2009 | | | 460 | | | 527 |
4.250% due 01/15/2010 | | | 11 | | | 13 |
3.500% due 01/15/2011 | | | 53 | | | 60 |
3.375% due 01/15/2012 | | | 104 | | | 117 |
3.000% due 07/15/2012 | | | 409 | | | 451 |
3.875% due 04/15/2029 | | | 112 | | | 143 |
U.S. Treasury Bonds | | | | | | |
7.250% due 05/15/2016 | | | 200 | | | 266 |
7.500% due 11/15/2016 | | | 30 | | | 41 |
8.750% due 05/15/2017 | | | 200 | | | 299 |
U.S. Treasury Strips | | | | | | |
0.000% due 05/15/2017 | | | 1,000 | | | 540 |
| | | | | |
|
|
Total U.S. Treasury Obligations (Cost $2,858) | | | | | | 2,929 |
| | | | | |
|
|
MORTGAGE-BACKED SECURITIES 25.8% | | | | | | |
Collateralized Mortgage Obligations 6.8% | | | | | | |
Bank of America Mortgage Securities, Inc. | | | | | | |
6.500% due 12/25/2031 | | | 17 | | | 17 |
Bear Stearns Adjustable Rate Mortgage Trust | | | | | | |
6.461% due 10/25/2031 (a) | | | 14 | | | 15 |
6.159% due 08/25/2032 (a) | | | 10 | | | 10 |
5.229% due 03/25/2033 (a) | | | 93 | | | 95 |
Chase Mortgage Finance Corp. | | | | | | |
6.190% due 12/25/2029 (a) | | | 5 | | | 5 |
Countrywide Home Loans, Inc. | | | | | | |
5.608% due 03/19/2032 (a) | | | 8 | | | 8 |
6.500% due 08/25/2032 (a) | | | 1 | | | 1 |
CS First Boston Mortgage Securities Corp. | | | | | | |
6.230% due 04/25/2032 (a) | | | 4 | | | 4 |
5.917% due 06/25/2032 (a) | | | 46 | | | 47 |
6.181% due 06/25/2032 (a) | | | 55 | | | 57 |
2.360% due 08/25/2033 (a) | | | 28 | | | 28 |
Fannie Mae | | | | | | |
5.000% due 09/25/2018 | | | 42 | | | 42 |
6.000% due 08/25/2029 | | | 138 | | | 139 |
5.000% due 04/25/2033 | | | 258 | | | 263 |
Federal Home Loan Bank | | | | | | |
5.500% due 03/15/2015 | | | 12 | | | 12 |
Freddie Mac | | | | | | |
5.250% due 03/15/2028 | | | 66 | | | 67 |
5.850% due 10/15/2031 | | | 19 | | | 19 |
5.750% due 04/15/2032 | | | 6 | | | 6 |
Government National Mortgage Association | | | | | | |
1.818% due 09/20/2030 (a) | | | 22 | | | 22 |
GSR Mortgage Loan Trust | | | | | | |
5.575% due 10/25/2031 (a) | | | 19 | | | 19 |
6.000% due 03/25/2032 | | | 60 | | | 61 |
6.000% due 07/25/2032 | | | 46 | | | 46 |
Master Asset Securitization Trust | | | | | | |
5.500% due 07/31/2033 | | | 100 | | | 101 |
Merrill Lynch Mortgage Investors, Inc. | | | | | | |
1.618% due 01/20/2030 (a) | | | 9 | | | 9 |
Morgan Stanley Capital I | | | | | | |
7.460% due 02/15/2020 | | | 31 | | | 31 |
Residential Funding Mortgage Securities I, Inc. | | | | | | |
5.645% due 09/25/2032 (a) | | | 10 | | | 10 |
6.250% due 09/25/2032 | | | 7 | | | 8 |
Structured Asset Mortgage Investments, Inc. | | | | | | |
1.647% due 09/19/2032 (a) | | | 9 | | | 9 |
Structured Asset Securities Corp. | | | | | | |
5.800% due 09/25/2031 | | | 3 | | | 3 |
6.500% due 09/25/2031 (a) | | | 34 | | | 35 |
6.150% due 07/25/2032 (a) | | | 6 | | | 6 |
| | | | | |
|
|
| | | | | | | 1,195 |
| | | | | |
|
|
Fannie Mae 13.9% | | | | | | |
5.000% due 07/17/2018 | | | 1,500 | | | 1,550 |
5.500% due 10/01/2017-11/01/2017 (c) | | | 109 | | | 114 |
6.000% due 06/01/2016-08/13/2033 (a)(c) | | $ | 688 | | $ | 717 |
6.500% due 08/01/2032 | | | 59 | | | 62 |
| | | | | |
|
|
| | | | | | | 2,443 |
| | | | | |
|
|
Freddie Mac 3.7% | | | | | | |
4.362% due 01/01/2028 (a) | | | 10 | | | 10 |
4.584% due 07/01/2027 (a) | | | 10 | | | 10 |
5.000% due 08/18/2018 | | | 90 | | | 93 |
6.000% due 09/01/2016-08/13/2033 (c) | | | 450 | | | 468 |
6.500% due 08/01/2032 | | | 62 | | | 64 |
| | | | | |
|
|
| | | | | | | 645 |
| | | | | |
|
|
Government National Mortgage Association 1.4% | | | | | | |
4.375% due 02/20/2027 (a) | | | 44 | | | 46 |
4.500% due 05/20/2030 (a) | | | 32 | | | 33 |
6.500% due 01/15/2029-05/15/2032 (c) | | | 170 | | | 178 |
| | | | | |
|
|
| | | | | | | 257 |
| | | | | |
|
|
Total Mortgage-Backed Securities (Cost $4,538) | | | | | | 4,540 |
| | | | | |
|
|
ASSET-BACKED SECURITIES 0.7% | | | | | | |
Amortizing Residential Collateral Trust | | | | | | |
1.590% due 06/25/2032 (a) | | | 37 | | | 37 |
CIT Group Home Equity Loan Trust | | | | | | |
1.590% due 06/25/2033 (a) | | | 22 | | | 22 |
Equity One ABS, Inc. | | | | | | |
1.600% due 11/25/2032 (a) | | | 33 | | | 33 |
Household Mortgage Loan Trust | | | | | | |
1.618% due 05/20/2032 (a) | | | 6 | | | 6 |
Irwin Home Equity Loan Trust | | | | | | |
1.610% due 06/25/2029 (a) | | | 7 | | | 7 |
Morgan Stanley Dean Witter Capital I | | | | | | |
1.650% due 07/25/2032 (a) | | | 16 | | | 16 |
| | | | | |
|
|
Total Asset-Backed Securities (Cost $121) | | | | | | 121 |
| | | | | |
|
|
| | | Shares
| | |
PREFERRED SECURITY 0.7% | | | | | | |
UBS Preferred Funding Trust I | | | | | | |
8.622% due 10/29/2049 (a) | | | 100,000 | | | 128 |
| | | | | |
|
|
Total Preferred Security (Cost $102) | | | | | | 128 |
| | | | | |
|
|
| | | Principal Amount (000s)
| | |
SHORT-TERM INSTRUMENTS 59.2% | | | | | | |
Commercial Paper 57.3% | | | | | | |
Fannie Mae | | | | | | |
1.165% due 07/23/2003 | | $ | 1,200 | | | 1,199 |
1.160% due 08/06/2003 | | | 1,600 | | | 1,598 |
1.135% due 08/13/2003 | | | 800 | | | 799 |
1.165% due 08/13/2003 | | | 1,200 | | | 1,198 |
1.010% due 09/10/2003 | | | 700 | | | 699 |
1.010% due 09/17/2003 | | | 700 | | | 698 |
1.010% due 09/24/2003 | | | 700 | | | 698 |
Federal Home Loan Bank | | | | | | |
1.135% due 11/05/2003 | | | 500 | | | 498 |
Freddie Mac | | | | | | |
1.150% due 07/15/2003 | | | 300 | | | 300 |
1.195% due 07/17/2003 | | | 300 | | | 300 |
1.160% due 07/30/2003 | | | 200 | | | 200 |
1.185% due 09/03/2003 | | | 600 | | | 599 |
1.130% due 11/06/2003 | | | 300 | | | 299 |
1.140% due 11/07/2003 | | | 1,000 | | | 996 |
| | | | | |
|
|
| | | | | | | 10,081 |
| | | | | |
|
|
See accompanying notes | | | 6.30.03 | Semi-Annual Report | | 7 |
| | | Principal Amount (000s)
| | Value (000s)
| |
Repurchase Agreement 0.8% | | | | | | | |
State Street Bank | | | | | | | |
0.800% due 07/01/2003 | | $ | 130 | | $ | 130 | |
(Dated 06/30/2003. Collateralized by Freddie Mac 2.550% due 10/01/2004 valued at $136. Repurchase proceeds are $130.) | | | | | | | |
| | | | | |
|
|
|
U.S. Treasury Bills 1.1% | | | | | | | |
1.043% due 08/07/2003-08/14/2003 (b)(c) | | | 200 | | | 200 | |
| | | | | |
|
|
|
Total Short-Term Instruments (Cost $10,411) | | | | | | 10,411 | |
| | | | | |
|
|
|
Total Investments 114.2% (Cost $19,918) | | | | | $ | 20,094 | |
Written Options (d) (0.3%) (Premiums $49) | | | | | | (49 | ) |
Other Assets and Liabilities (Net)(13.9%) | | | | | | (2,452 | ) |
| | | | | |
|
|
|
Net Assets 100.0% | | | | | $ | 17,593 | |
| | | | | |
|
|
|
Notes to Schedule of Investments
(amounts in thousands, except number of contracts):
| (a) | | Variable rate security. The rate listed is as of June 30, 2003. |
| (b) | | Securities with an aggregate market value of $327 have been segregated with the custodian to cover margin requirements for the following open futures contracts at June 30, 2003: |
Type
| | # of
Contracts
| | Unrealized Appreciation/ (Depreciation)
| |
Eurodollar March Futures (03/2004) - Long | | 5 | | $ | 9 | |
Eurodollar December Futures (12/2004) - Long | | 1 | | | 2 | |
U.S. Treasury 10 Year Note (09/2003) - Long | | 17 | | | (10 | ) |
U.S. Treasury 30 Year Bond (09/2003) - Long | | 6 | | | (20 | ) |
| | | | |
|
|
|
| | | | | $ | (19 | ) |
| | | | |
|
|
|
| (c) | | Securities are grouped by coupon or range of coupons and represent a range of maturities. |
| (d) | | Premiums received on written options: |
Type
| | Notional Amount
| | Premium
| | Value
|
Put - OTC 7 Year Interest Rate Swap | | | | | | | | | |
Strike @ 6.000%** Exp. 10/19/2004 | | $ | 100,000 | | $ | 4 | | $ | 1 |
Call - OTC 7 Year Interest Rate Swap | | | | | | | | | |
Strike @ 6.000%* Exp. 10/19/2004 | | | 100,000 | | | 4 | | | 13 |
Call - OTC 7 Year Interest Rate Swap | | | | | | | | | |
Strike @ 5.200%* Exp. 11/02/2004 | | | 100,000 | | | 3 | | | 8 |
Put - OTC 7 Year Interest Rate Swap | | | | | | | | | |
Strike @ 6.700%** Exp. 11/02/2004 | | | 100,000 | | | 3 | | | 1 |
Put - OTC 7 Year Interest Rate Swap | | | | | | | | | |
Strike @ 5.500%** Exp. 12/17/2003 | | | 100,000 | | | 1 | | | 0 |
Call - OTC 7 Year Interest Rate Swap | | | | | | | | | |
Strike @ 3.500%* Exp. 12/17/2003 | | | 200,000 | | | 2 | | | 4 |
Call - OTC 10 Year Interest Rate Swap | | | | | | | | | |
Strike @ 4.000%* Exp. 03/03/2004 | | | 100,000 | | | 2 | | | 2 |
Call - OTC 10 Year Interest Rate Swap | | | | | | | | | |
Strike @ 4.000%* Exp. 03/03/2004 | | | 100,000 | | | 2 | | | 2 |
Call - OTC 10 Year Interest Rate Swap | | | | | | | | | |
Strike @ 4.000%* Exp. 03/03/2004 | | | 100,000 | | | 1 | | | 2 |
| | | | | |
|
| |
|
|
| | | | | | $ | 22 | | $ | 33 |
| | | | | |
|
| |
|
|
Type
| | # of
Contracts
| | Premium
| | Value
|
Call - CME Eurodollar March Futures | | | | | | | | |
Strike @ 98.500 Exp. 03/15/2004 | | 2 | | $ | 1 | | $ | 2 |
Put - CME Eurodollar March Futures | | | | | | | | |
Strike @ 97.250 Exp. 03/15/2004 | | 1 | | | 1 | | | 0 |
Put - CME Eurodollar March Futures | | | | | | | | |
Strike @ 97.750 Exp. 03/15/2004 | | 1 | | | 1 | | | 0 |
Put - CME Eurodollar December Futures | | | | | | | | |
Strike @ 98.000 Exp. 12/15/2003 | | 2 | | | 1 | | | 0 |
Call - CBOT 5 Year September Futures | | | | | | | | |
Strike @ 119.000 Exp. 08/23/2003 | | 1 | | | 0 | | | 0 |
Call - CBOT U.S. Treasury Note September Futures | | | | | | | | |
Strike @ 117.000 Exp. 08/23/2003 | | 1 | | | 1 | | | 1 |
Call - CBOT U.S. Treasury Note September Futures | | | | | | | | |
Strike @ 120.000 Exp. 08/23/2003 | | 1 | | | 1 | | | 0 |
Call - CBOT U.S. Treasury Note September Futures | | | | | | | | |
Strike @ 122.000 Exp. 08/23/2003 | | 1 | | | 0 | | | 0 |
Call - CBOT U.S. Treasury Note September Futures | | | | | | | | |
Strike @ 123.000 Exp. 08/23/2003 | | 4 | | | 1 | | | 0 |
Put - CBOT U.S. Treasury Note September Futures | | | | | | | | |
Strike @ 110.000 Exp. 08/23/2003 | | 6 | | | 6 | | | 0 |
Put - CBOT U.S. Treasury Note September Futures | | | | | | | | |
Strike @ 114.000 Exp. 08/23/2003 | | 1 | | | 0 | | | 0 |
Put - CBOT U.S. Treasury Note September Futures | | | | | | | | |
Strike @ 116.000 Exp. 08/23/2003 | | 4 | | | 2 | | | 3 |
Call - CBOT U.S. Treasury Bond September Futures | | | | | | | | |
Strike @ 128.000 Exp. 08/23/2003 | | 3 | | | 1 | | | 0 |
Call - CBOT U.S. Treasury Bond September Futures | | | | | | | | |
Strike @ 126.000 Exp. 08/23/2003 | | 7 | | | 3 | | | 1 |
Put - CBOT U.S. Treasury Bond September Futures | | | | | | | | |
Strike @ 114.000 Exp. 08/23/2003 | | 11 | | | 8 | | | 9 |
| | | | |
|
| |
|
|
| | | | | $ | 27 | | $ | 16 |
| | | | |
|
| |
|
|
| * | | The Portfolio will receive a floating rate based on 3-month LIBOR. |
| ** | | The Portfolio will pay a floating rate based on 3-month LIBOR. |
| (e) | | Principal amount of security is adjusted for inflation. |
| (f) | | Swap agreements outstanding at June 30, 2003: |
Type
| | Notional Amount
| | Unrealized Appreciation
|
Receive a fixed rate equal to 0.610% and the Portfolio will pay to the counterparty at par in the event of default of General Electric Capital Corp. 6.000% due 06/15/2012. Counterparty: Merrill Lynch & Co., Inc. | | | | | | |
Exp. 05/19/2004 | | $ | 10 | | | 0 |
| | | | | |
|
|
| | | | | | $ | 0 |
| | | | | |
|
|
8 | | Semi-Annual Report | 6.30.03 | | | See accompanying notes |
Notes to Financial Statements
June 30, 2003 (Unaudited)
1. Organization
The Total Return Portfolio II (the “Portfolio”) is a series of the PIMCO Variable Insurance Trust (the “Trust”). The Trust is registered under the Investment Company Act of 1940 (the “Act”), as amended, as an open-end investment company organized as a Delaware business trust on October 3, 1997. The Trust may offer up to two classes of shares: Institutional and Administrative. Each share class has identical voting rights (except that shareholders of a class have exclusive voting rights regarding any matter relating solely to that class of shares). Information presented in these financial statements pertains to the Institutional Class of the Trust. Certain detailed financial information for the Administrative Class is provided separately and is available upon request. The Trust is designed to be used as an investment vehicle by Separate Accounts of insurance companies that fund variable annuity contracts and variable life insurance policies and by qualified pension and retirement plans. The Portfolio commenced operations on May 28, 1999.
2. Significant Accounting Policies
The following is a summary of significant accounting policies consistently followed by the Trust in the preparation of its financial statements in conformity with accounting principles generally accepted in the United States of America. The preparation of financial statements in accordance with accounting principles generally accepted in the United States of America requires management to make estimates and assumptions that affect the reported amounts and disclosures in the financial statements. Actual results could differ from those estimates.
Security Valuation. Portfolio securities and other financial instruments for which market quotations are readily available are stated at market value. Market value is determined at the close of regular trading (normally, 4:00 p.m., Eastern Time) on the New York Stock Exchange on each day the New York Stock Exchange is open, or if no sales are reported, as is the case for most securities traded over-the-counter, the mean between representative bid and asked quotations obtained from a quotation reporting system or from established market makers. Fixed income securities, including those to be purchased under firm commitment agreements, are normally valued on the basis of quotes obtained from brokers and dealers or pricing services. Short-term investments, which mature in 60 days or less are valued at amortized cost, which approximates market value. Certain fixed income securities for which daily market quotations are not readily available may be valued, pursuant to guidelines established by the Board of Trustees, with reference to fixed income securities whose prices are more readily obtainable. Prices may be obtained from independent pricing services which use information provided by market makers or estimates of market values obtained from yield data relating to investments or securities with similar characteristics. The prices used by the Portfolio may differ from the value that would be realized if the securities were sold and the differences could be material to the financial statements.
Securities Transactions and Investment Income. Securities transactions are recorded as of the trade date. Securities purchased or sold on a when-issued or delayed delivery basis may be settled a month or more after the trade date. Realized gains and losses from securities sold are recorded on the identified cost basis. Dividend income is recorded on the ex-dividend date, except certain dividends from foreign securities where the ex-dividend date may have passed, are recorded as soon as the Portfolio is informed of the ex-dividend date. Interest income, adjusted for the accretion of discounts and amortization of premiums, is recorded on the accrual basis. Paydowns gains and losses on mortgage- and asset-backed securities are recorded as adjustments to interest income in the Statement of Operations.
Dividends and Distributions to Shareholders. Dividends from net investment income, if any, are declared on each day the Trust is open for business and are distributed to shareholders monthly. All dividends are reinvested in additional shares of the Portfolio. Net realized capital gains earned by the Portfolio, if any, will be distributed no less frequently than once each year.
Income dividends and capital gain distributions are determined in accordance with income tax regulations which may differ from accounting principles generally accepted in the United States of America. These differences are primarily due to differing treatments for such items as wash sales, foreign currency transactions, net operating losses and capital loss carryforwards.
Distributions classified as a tax basis return of capital, if any, are reflected in the accompanying Statements of Changes in Net Assets and have been reclassified to paid in capital. In addition, other amounts have been reclassified between undistributed net investment income, accumulated undistributed net realized gains or losses and/or paid in capital to more appropriately conform financial accounting to tax characterizations of dividend distributions.
Multiclass Operations. Each class offered by the Trust has equal rights as to assets. Income, non-class specific expenses, and realized and unrealized capital gains and losses are allocated to each class of shares based on the relative net assets of each class.
Federal Income Taxes. The Portfolio intends to qualify as a regulated investment company and distribute all of its taxable income and net realized gains, if applicable, to shareholders. Accordingly, no provision for Federal income taxes has been made.
6.30.03 | Semi-Annual Report | | 9 |
Financing Transactions. The Portfolio may enter into financing transactions consisting of the sale by the Portfolio of securities, together with a commitment to repurchase similar securities at a future date. The difference between the selling price and the future purchase price is an adjustment to interest income in the Statement of Operations. If the counterparty to whom the Portfolio sells the security becomes insolvent, the Portfolio’s right to repurchase the security may be restricted; the value of the security may change over the term of the financing transaction; and the return earned by the Portfolio with the proceeds of a financing transaction may not exceed transaction costs. The Portfolio will designate assets determined to be liquid by PIMCO or otherwise cover its obligations under financing transactions.
Futures Contracts. The Portfolio is authorized to enter into futures contracts. The Portfolio may use futures contracts to manage its exposure to the securities markets or to movements in interest rates and currency values. The primary risks associated with the use of futures contracts are imperfect correlation between the change in market value of the securities held by the Portfolio and the prices of futures contracts, the possibility of an illiquid market, and the inability of the counterparty to meet the terms of the contract. Futures contracts are valued based upon their quoted daily settlement prices. Upon entering into a futures contract, the Portfolio may be required to deposit with its custodian, in a segregated account in the name of the futures broker, an amount of cash or U.S. Government and Agency Obligations in accordance with the initial margin requirements of the broker or exchange. Futures contracts are marked to market daily and an appropriate payable or receivable for the change in value (“variation margin”) is recorded by the Portfolio. Gains or losses are recognized but not considered realized until the contracts expire or are closed. Futures contracts involve, to varying degrees, risk of loss in excess of the variation margin disclosed in the Statement of Assets and Liabilities.
Options Contracts. The Portfolio may write call and put options on futures, securities or currencies it owns or in which it may invest. Writing put options tends to increase the Portfolio’s exposure to the underlying instrument. Writing call options tends to decrease the Portfolio’s exposure to the underlying instrument. When the Portfolio writes a call or put option, an amount equal to the premium received is recorded as a liability and subsequently marked to market to reflect the current value of the option written. Payment received or made, if any, from writing options with premiums to be determined on a future date are reflected as such on the Statement of Assets and Liabilities. Premiums received from writing options which expire are treated as realized gains. Premiums received from writing options which are exercised or closed are added to the proceeds or offset against amounts paid on the underlying future, security or currency transaction to determine the realized gain or loss. The Portfolio as a writer of an option has no control over whether the underlying future, security or currency may be sold (call) or purchased (put) and as a result bears the market risk of an unfavorable change in the price of the future, security or currency underlying the written option. There is the risk the Portfolio may not be able to enter into a closing transaction because of an illiquid market.
The Portfolio may also purchase put and call options. Purchasing call options tends to increase the Portfolio’s exposure to the underlying instrument. Purchasing put options tends to decrease the Portfolio’s exposure to the underlying instrument. The Portfolio pays a premium which is included in the Portfolio’s Statement of Assets and Liabilities as an investment and subsequently marked to market to reflect the current value of the option. Premiums paid for purchasing options which expire are treated as realized losses. The risk associated with purchasing put and call options is limited to the premium paid. Premiums paid for purchasing options which are exercised or closed are added to the amounts paid or offset against the proceeds on the underlying future, security or currency transaction to determine the realized gain or loss.
Swap Agreements. The Portfolio may invest in swap agreements. A swap is an agreement to exchange the return generated by one instrument for the return generated by another instrument. The Portfolio may enter into interest rate, total return, forward swap spread lock and credit default swap agreements to manage its exposure to interest rates and credit risk. Interest rate swap agreements involve the exchange by the Portfolio with another party of their respective commitments to pay or receive interest, e.g., an exchange of floating rate payments for fixed rate payments with respect to a notional amount of principal. Total return swap agreements involve commitments to pay interest in exchange for a market-linked return, both based on notional amounts. To the extent the total return of the security or index underlying the transaction exceeds or falls short of the offsetting interest rate obligation, the Portfolio will receive a payment from or make a payment to the counterparty. Forward spread lock swap agreements involve commitments to pay or receive a settlement amount calculated as the difference between the swap spread and a fixed spread, multiplied by the notional amount times the duration of the swap. The swap spread is the difference between the benchmark swap rate (market rate) and the specific Treasury rate. In a credit default swap, one party makes a stream of payments to another party in exchange for the right to receive a specified return in the event of a default by a third party, typically corporate issues or sovereign issues of an emerging country, on its obligation. The Portfolio may use credit default swaps to provide a measure of protection against defaults of sovereign issuers (i.e., to reduce risk where the Portfolio owns or has exposure to the sovereign issuer) or to take an active
10 | | Semi-Annual Report | 6.30.03 |
long or short position with respect to the likelihood of a particular issuer’s default. Swaps are marked to market daily based upon quotations from market makers and vendors and the change in value, if any, is recorded as unrealized gain or loss in the Statement of Operations. Payments received or made at the beginning of the measurement period are reflected as such on the Statement of Assets and Liabilities. A liquidation payment received or made at the termination of the swap is recorded as realized gain or loss in the Statement of Operations. Net periodic payments are included as part of miscellaneous income on the Statement of Operations. Entering into these agreements involves, to varying degrees, elements of credit, market and documentation risk in excess of the amounts recognized on the Statement of Assets and Liabilities. Such risks involve the possibility that there will be no liquid market for these agreements, that the counterparty to the agreements may default on its obligation to perform or disagree as to the meaning of contractual terms in the agreements, and that there may be unfavorable changes in interest rates.
Delayed Delivery Transactions. The Portfolio may purchase or sell securities on a when-issued or delayed delivery basis. These transactions involve a commitment by the Portfolio to purchase or sell securities for a predetermined price or yield, with payment and delivery taking place beyond the customary settlement period. When delayed delivery purchases are outstanding, the Portfolio will set aside and maintain until the settlement date in a segregated account, liquid assets in an amount sufficient to meet the purchase price. When purchasing a security on a delayed delivery basis, the Portfolio assumes the rights and risks of ownership of the security, including the risk of price and yield fluctuations, and takes such fluctuations into account when determining its net asset value. The Portfolio may dispose of or renegotiate a delayed delivery transaction after it is entered into, and may sell when-issued securities before they are delivered, which may result in a capital gain or loss. When the Portfolio has sold a security on a delayed delivery basis, the Portfolio does not participate in future gains and losses with respect to the security.
Inflation-Indexed Bonds. Inflation-indexed bonds are fixed income securities whose principal value is periodically adjusted to the rate of inflation. The interest rate on these bonds is generally fixed at issuance at a rate lower than typical bonds. Over the life of an inflation-indexed bond, however, interest will be paid based on a principal value, which is adjusted for inflation. Any increase in the principal amount of an inflation-indexed bond will be included as interest income in the Statement of Operations, even though investors do not receive their principal until maturity.
Repurchase Agreements. The Portfolio may engage in repurchase transactions. Under the terms of a typical repurchase agreement, the Portfolio takes possession of an underlying debt obligation subject to an obligation of the seller to repurchase, and the Portfolio to resell, the obligation at an agreed-upon price and time. The market value of the collateral must be equal at all times to the total amount of the repurchase obligations, including interest. Generally, in the event of counterparty default, the Portfolio has the right to use the collateral to offset losses incurred.
3. Fees, Expenses, and Related Party Transactions
Investment Advisory Fee. Pacific Investment Management Company LLC (PIMCO) is a majority owned subsidiary partnership of Allianz Dresdner Asset Management of America L.P. (formerly PIMCO Advisors L.P.) and serves as investment adviser (the “Adviser”) to the Trust, pursuant to an investment advisory contract. The Adviser receives a monthly fee at an annual rate based on average daily net assets of the Portfolio. The Advisory Fee is charged at an annual rate of 0.25%.
Administration Fee. PIMCO serves as administrator (the “Administrator”) and provides administrative services to the Trust for which it receives a monthly administrative fee based on average daily net assets of the Portfolio. The Administration Fee is charged at the annual rate of 0.25%.
Servicing Fee. PIMCO Advisors Distributors LLC (“PAD”), is an indirect wholly-owned subsidiary of Allianz Dresdner Asset Management of America L.P. and serves as the distributor of the Trust’s shares. The Trust is permitted to reimburse PAD on a quarterly basis, out of the Administrative Class assets of the Portfolio in the amount of 0.15% on an annual basis of the average daily net assets of that class, for payments made to financial intermediaries that provide services in connection with the distribution of shares or administration of plans or programs that use Portfolio shares as their funding medium. The effective rate paid to PAD during the current fiscal year is 0.15%.
Expenses. The Portfolio is responsible for the following expenses: (i) salaries and other compensation of any of the Trust’s executive officers and employees who are not officers, directors, stockholders or employees of PIMCO or its subsidiaries or affiliates; (ii) taxes and governmental fees; (iii) brokerage fees and commissions and other portfolio transaction expenses; (iv) the cost of borrowing money, including interest expense; (v) fees and expenses of the Trustees who are not “interested persons” of PIMCO or the Trust, and any counsel retained exclusively for their benefit; (vi) extraordinary expenses, including costs of litigation and indemnification expenses; (vii) organization expenses and (viii) any expenses allocated or allocable to a specific class of shares, which include service fees payable with respect to the
6.30.03 | Semi-Annual Report | | 11 |
Administrative Class shares and may include certain other expenses as permitted by the Trust’s Multiple Class Plan adopted pursuant to Rule 18f-3 under the Act and subject to review and approval by the Trustees. The ratio of expenses to average net assets per share class, as disclosed in the Financial Highlights, may differ from the annual Portfolio operating expenses per share class as disclosed in the Prospectus for the reasons set forth above. PIMCO has agreed to waive a portion of its administrative fees to the extent that the payment of the Portfolio’s pro rata share of Trustees’ fees causes the actual expense ratio to rise above the rates disclosed in the current prospectus plus 0.49 basis points as set forth below (calculated as a percentage of the Portfolio’s average daily net assets attributable to each class):
| | | Institutional Class
| | | Administrative Class
| |
Total Return Portfolio II | | 0.50 | % | | 0.65 | % |
PIMCO may be reimbursed for these waived amounts in future periods. The Trust pays no compensation directly to any Trustee or any other officer who is affiliated with the Administrator, all of whom receive renumeration for their services to the Trust from the Administrator or its affiliates.
Each unaffiliated Trustee receives an annual retainer of $4,000, plus $1,500 for each Board of Trustees meeting attended in person and $250 for each meeting attended telephonically, plus reimbursement of related expenses. In addition, each committee chair receives an additional annual retainer of $500. These expenses are allocated on a pro-rata basis to each Portfolio of the Trust according to its respective net assets.
4. Purchases and Sales of Securities
Purchases and sales of securities (excluding short-term investments) for the period ended June 30, 2003 were as follows (amounts in thousands):
| | | U.S Government/Agency
| | All Other
|
| | | Purchases
| | Sales
| | Purchases
| | Sales
|
Total Return Portfolio II | | $ | 19,779 | | $ | 15,462 | | $ | 17,448 | | $ | 16,115 |
5. Transactions in Written Call and Put Options
Transactions in written call and put options were as follows (amounts in thousands):
| | | Total Return Portfolio II
| |
| | | | | Premium
| |
Balance at 12/31/2002 | | | | $ | 16 | |
Sales | | | | | 44 | |
Closing Buys | | | | | (1 | ) |
Expirations | | | | | (10 | ) |
Exercised | | | | | 0 | |
| | | | |
|
|
|
Balance at 06/30/2003 | | | | $ | 49 | |
| | | | |
|
|
|
6. Federal Income Tax Matters
At June 30, 2003, the aggregate cost of investments was the same for federal income tax and financial statement purposes. The net unrealized appreciation (depreciation) of investments securities for federal income tax purposes is as follows (amounts in thousands):
| | | Aggregate Gross
Unrealized
Appreciation
| | Aggregate Gross Unrealized
(Depreciation)
| | | Net Unrealized
Appreciation
|
Total Return Portfolio II | | $ | 211 | | $ | (35 | ) | | $ | 176 |
12 | | Semi-Annual Report | 6.30.03 |
7. Shares of Beneficial Interest
The Trust may issue an unlimited number of shares of beneficial interest with a $.0001 par value. Changes in shares of beneficial interest were as follows (shares and amounts in thousands):
| | | Total Return Portfolio II
| |
| | | Six Months Ended 06/30/2003 | | | Year Ended 12/31/2002 | |
| | | Shares
| | | Amount
| | | Shares
| | | Amount
| |
Receipts for shares sold | | | | | | | | | | | | | | |
Institutional Class | | 0 | | | $ | 0 | | | 0 | | | $ | 0 | |
Administrative Class | | 0 | | | | 0 | | | 1,474 | | | | 14,872 | |
Issued as reinvestment of distributions | | | | | | | | | | | | | | |
Institutional Class | | 0 | | | | 2 | | | 10 | | | | 98 | |
Administrative Class | | 16 | | | | 166 | | | 21 | | | | 212 | |
Cost of shares redeemed | | | | | | | | | | | | | | |
Institutional Class | | (119 | ) | | | (1,200 | ) | | (269 | ) | | | (2,745 | ) |
Administrative Class | | (12 | ) | | | (120 | ) | | (58 | ) | | | (600 | ) |
| | |
|
| |
|
|
| |
|
| |
|
|
|
Net increase (decrease) resulting from Portfolio share transactions | | (115 | ) | | $ | (1,152 | ) | | 1,178 | | | $ | 11,837 | |
| | |
|
| |
|
|
| |
|
| |
|
|
|
The following schedule shows the number of shareholders each owning 5% or more of the Portfolio and the total percentage of the Portfolio held by such shareholders:
| | | Number
| | % of Portfolio
Held
|
Total Return Portfolio II | | | | |
Institutional Class | | 1 | | 100 |
Administrative Class | | 1 | | 99 |
6.30.03 | Semi-Annual Report | | 13 |
Trustees and Officers
Brent R. Harris, Chairman and Trustee
R. Wesley Burns, President and Trustee
E. Philip Cannon, Trustee
Vern O. Curtis, Trustee
J. Michael Hagan, Trustee
William J. Popejoy, Trustee
Garlin G. Flynn, Secretary
John P. Hardaway, Treasurer
Investment Adviser and Administrator
Pacific Investment Management Company LLC
840 Newport Center Drive
Newport Beach, California 92660
Transfer Agent
National Financial Data Services
330 W. 9th Street, 4th Floor
Kansas City, Missouri 64105
Custodian
State Street Bank & Trust Company
801 Pennsylvania
Kansas City, Missouri 64105
Counsel
Dechert LLP
1775 I Street, N.W.
Washington, D.C. 20006
Independent Accountants
PricewaterhouseCoopers LLP
1055 Broadway
Kansas City, Missouri 64105
PIMCO VARIABLE INSURANCE TRUST
This report is submitted for the general information of the shareholders of the PIMCO Variable Insurance Trust. It is not authorized for distribution to prospective investors unless accompanied or preceded by an effective prospectus for the PIMCO Variable Insurance Trust, which contains information covering its investment policies as well as other pertinent information.
All Funds distributed by PIMCO ADVISORS DISTRIBUTORS LLC, member NASD
840 NEWPORT CENTER DRIVE
NEWPORT BEACH, CA 92660
800.927.4648
WWW.PIMCOADVISORS.COM
WWW.PIMCO.COM
P I M C O
| PIMCO VARIABLE INSURANCE TRUST |
| TOTAL RETURN PORTFOLIO |
| INSTITUTIONAL CLASS |
|
| SEMI-ANNUAL REPORT |
| June 30, 2003 |
| | | Fund
Summary
| | Schedule of
Investments
|
Total Return Portfolio (Institutional Class) | | 2 | | 7 |
Chairman’s Letter
Dear PIMCO Variable Insurance Trust Shareholder:
Financial assets gained during the first half of 2003 amid a revival of risk appetites as anxiety about the war in Iraq faded. Assets that generally benefit from economic growth, such as stocks, corporate bonds and emerging market debt, fared the best year-to-date as investors returned to these sectors in anticipation of a recovery in the second half of 2003. Reflationary forces that investors expected to fuel a rebound included federal tax cuts and a weak dollar, as well as low borrowing rates that eased the burden of high personal and corporate indebtedness. Low mortgage rates kept refinancings booming in the second quarter and put more money in consumers’ pockets.
U.S. Treasuries lagged their riskier counterparts but still enjoyed a modest rally. Yields fell to levels not seen in 45 years early in the second quarter before bouncing off their lows in June as hopes for recovery increased. The yield on the benchmark 10-year Treasury closed the six-month period 0.30% lower to 3.51%, after nearing 3% earlier in the period. Buyers were encouraged that inflation would remain tame amid low capacity utilization and weak employment growth. Asian central banks bought U.S. Treasuries to limit the rise in their currencies versus the dollar in an effort to protect their export industries. In June, the Federal Reserve cut the federal funds rate by 0.25% to 1%, its 13th easing since 2001, in an effort to boost the economy and ward off deflation. Although the cut was less than expected, the Fed suggested that rates would stay low until deflation risks abated.
On the following pages you will find specific details as to the Portfolio’s total return investment performance and a discussion of those factors that affected performance.
We appreciate the trust you have placed in us, and we will continue to focus our efforts to meet your investment needs.
Sincerely,
Brent R. Harris
Chairman
July 31, 2003
6.30.03 | Semi-Annual Report | | 1 |
Total Return Portfolio
TOTAL RETURN INVESTMENT PERFORMANCE For the period ended June 30, 2003
| | | 1 Year | | | Since Inception* | |
Total Return Portfolio Institutional Class | | 10.47 | % | | 9.42 | % |
Lehman Brothers Aggregate Bond Index | | 10.40 | % | | — | |
| * | | Annualized (All Portfolio returns are net of fees and expenses) |
CUMULATIVE RETURNS THROUGH JUNE 30, 2003
$10,000 invested at inception

Past performance is no guarantee of future results. Investment return and principal value will fluctuate so that Portfolio shares, when redeemed, may be worth more or less than their original cost. The line graph above assumes the investment of $10,000 on 5/01/2000, the first full month following the Portfolio’s Institutional Class inception on 4/10/2000, compared to the Lehman Brothers Aggregate Bond Index, an unmanaged market index. It is not possible to invest directly in the Index. The Portfolio may invest in foreign securities which involve potentially higher risks including foreign currency fluctuations and political or economic uncertainty. These risks may be enhanced when investing in emerging market securities.
PORTFOLIO INSIGHTS
| • | | The Total Return Portfolio seeks to achieve its investment objective by investing under normal circumstances at least 65% of its total assets in a diversified portfolio of Fixed Income Instruments of varying maturities. |
| • | | The Portfolio’s Institutional Class returned 4.57% for the six-month period ended June 30, 2003, outperforming its benchmark, the Lehman Brothers Aggregate Bond Index, which returned 3.93% for the period. |
| • | | Portfolio duration was near the benchmark throughout the period and had little effect on relative performance. An emphasis on both short and long maturities had a minimal impact on returns as yield curve shape changed little over the period. |
| • | | Near benchmark exposure to mortgages had little impact on relative performance. An overweight of lower coupon mortgages, which are less vulnerable to prepayment risk, helped returns as these issues outperformed. |
| • | | A corporate underweight was negative as corporates outperformed, but positive security selection of telecom and energy pipeline issues mitigated this impact. |
| • | | Eurozone exposure added modestly to returns. While Europe lagged Treasuries overall, short Eurozone maturities outperformed due to expectations of more easing by the European Central Bank. |
| • | | As the emerging market sector’s economic fundamentals continued to improve, sustaining a recovery that began late last year, emerging market bonds added to returns, especially those from Brazil. |
2 | | Semi-Annual Report | 6.30.03 |
Financial Highlights
Total Return Portfolio (Institutional Class)
| Selected Per Share Data for the Year or Period Ended: | | 06/30/2003 +
| | | 12/31/2002
| | | 12/31/2001
| | | 04/10/2000-12/31/2000
| |
Net asset value beginning of period | | $ | 10.23 | | | $ | 9.89 | | | $ | 9.77 | | | $ | 9.50 | |
Net investment income (a) | | | 0.16 | | | | 0.43 | | | | 0.50 | | | | 0.45 | |
Net realized/unrealized gain on investments (a) | | | 0.30 | | | | 0.47 | | | | 0.31 | | | | 0.27 | |
Total income from investment operations | | | 0.46 | | | | 0.90 | | | | 0.81 | | | | 0.72 | |
Dividends from net investment income | | | (0.17 | ) | | | (0.43 | ) | | | (0.50 | ) | | | (0.45 | ) |
Distributions from net realized capital gains | | | 0.00 | | | | (0.13 | ) | | | (0.19 | ) | | | 0.00 | |
Total distributions | | | (0.17 | ) | | | (0.56 | ) | | | (0.69 | ) | | | (0.45 | ) |
Net asset value end of period | | $ | 10.52 | | | $ | 10.23 | | | $ | 9.89 | | | $ | 9.77 | |
Total return | | | 4.57 | % | | | 9.23 | % | | | 8.53 | % | | | 7.82 | % |
Net assets end of period (000s) | | $ | 74,208 | | | $ | 46,548 | | | $ | 35,231 | | | $ | 625 | |
Ratio of expenses to average net assets | | | 0.50 | %* | | | 0.50 | % | | | 0.50 | % | | | 0.50 | %* |
Ratio of net investment income to average net assets | | | 3.08 | %* | | | 4.24 | % | | | 5.00 | % | | | 6.48 | %* |
Portfolio turnover rate | | | 110 | % | | | 222 | % | | | 217 | % | | | 415 | % |
| (a) | | Per share amounts based on average number of shares outstanding during the period. |
See accompanying notes | | | 6.30.03 | Semi-Annual Report | | 3 |
Statement of Assets and Liabilities
Total Return Portfolio
June 30, 2003 (Unaudited)
Amounts in thousands, except per share amounts
Assets: | | | |
Investments, at value | | $ | 2,005,748 |
Foreign currency, at value | | | 4,609 |
Receivable for investments sold | | | 231,505 |
Unrealized appreciation on forward foreign currency contracts | | | 82 |
Interest receivable | | | 8,906 |
Variation margin receivable | | | 743 |
Swap premiums paid | | | 167 |
Unrealized appreciation on swap agreements | | | 244 |
Other assets | | | 1 |
| | |
|
|
| | | | 2,252,005 |
| | |
|
|
Liabilities: | | | |
Payable for investments purchased | | $ | 498,864 |
Unrealized depreciation on forward foreign currency contracts | | | 51 |
Due to Custodian | | | 42 |
Written options outstanding | | | 4,397 |
Dividends payable | | | 614 |
Accrued investment advisory fee | | | 340 |
Accrued administration fee | | | 340 |
Accrued servicing fee | | | 182 |
Swap premiums received | | | 56 |
Unrealized depreciation on swap agreements | | | 53 |
| | |
|
|
| | | | 504,939 |
| | |
|
|
Net Assets | | $ | 1,747,066 |
| | |
|
|
Net Assets Consist of: | | | |
Paid in capital | | $ | 1,681,047 |
Undistributed net investment income | | | 3,283 |
Accumulated undistributed net realized gain | | | 31,174 |
Net unrealized appreciation | | | 31,562 |
| | |
|
|
| | | $ | 1,747,066 |
| | |
|
|
Net Assets: | | | |
Institutional Class | | $ | 74,208 |
Administrative Class | | | 1,672,858 |
Shares Issued and Outstanding: | | | |
Institutional Class | | | 7,050 |
Administrative Class | | | 158,932 |
Net Asset Value and Redemption Price Per Share (Net Assets Per Share Outstanding) | | | |
Institutional Class | | $ | 10.52 |
Administrative Class | | | 10.52 |
Cost of Investments Owned | | $ | 1,972,249 |
Cost of Foreign Currency Held | | $ | 4,597 |
4 | | Semi-Annual Report | 6.30.03 | | | See accompanying notes |
Statement of Operations
Total Return Portfolio
For the six months ended June 30, 2003 (Unaudited)
Amounts in thousands
Investment Income: | | | | |
Interest | | $ | 26,140 | |
Miscellaneous income | | | 15 | |
| | |
|
|
|
Total Income | | | 26,155 | |
| | |
|
|
|
Expenses: | | | | |
Investment advisory fees | | | 1,820 | |
Administration fees | | | 1,820 | |
Servicing fees | | | 1,045 | |
Trustees’ fees | | | 9 | |
Organization costs | | | 1 | |
| | |
|
|
|
Total Expenses | | | 4,695 | |
| | |
|
|
|
Net Investment Income | | | 21,460 | |
| | |
|
|
|
Net Realized and Unrealized Gain (Loss): | | | | |
Net realized gain on investments | | | 11,362 | |
Net realized gain on futures contracts, written options, and swaps | | | 18,255 | |
Net realized gain on foreign currency transactions | | | 1,401 | |
Net change in unrealized appreciation on investments | | | 18,437 | |
Net change in unrealized (depreciation) on futures contracts, written options, and swaps | | | (5,135 | ) |
Net change in unrealized (depreciation) on translation of assets and liabilities denominated in foreign currencies | | | (445 | ) |
Net Gain | | | 43,875 | |
| | |
|
|
|
Net Increase in Assets Resulting from Operations | | $ | 65,335 | |
| | |
|
|
|
See accompanying notes | | | 6.30.03 | Semi-Annual Report | | 5 |
Statements of Changes in Net Assets
Total Return Portfolio
Amounts in thousands
| Increase (Decrease) in Net Assets from: | | Six Months Ended
June 30, 2003
| | | Year Ended December 31, 2002
| |
| | | (Unaudited) | | | | |
Operations: | | | | | | | | |
Net investment income | | $ | 21,460 | | | $ | 29,591 | |
Net realized gain | | | 31,018 | | | | 21,933 | |
Net change in unrealized appreciation | | | 12,857 | | | | 17,135 | |
| | |
|
|
| |
|
|
|
Net increase resulting from operations | | | 65,335 | | | | 68,659 | |
| | |
|
|
| |
|
|
|
Distributions to Shareholders: | | | | | | | | |
From net investment income | | | | | | | | |
Institutional Class | | | (1,066 | ) | | | (1,571 | ) |
Administrative Class | | | (22,551 | ) | | | (28,021 | ) |
From net realized capital gains | | | | | | | | |
Institutional Class | | | 0 | | | | (558 | ) |
Administrative Class | | | 0 | | | | (13,143 | ) |
| | |
|
|
| |
|
|
|
Total Distributions | | | (23,617 | ) | | | (43,293 | ) |
| | |
|
|
| |
|
|
|
Portfolio Share Transactions: | | | | | | | | |
Receipts for shares sold | | | | | | | | |
Institutional Class | | | 56,936 | | | | 18,993 | |
Administrative Class | | | 538,861 | | | | 946,200 | |
Issued as reinvestment of distributions | | | | | | | | |
Institutional Class | | | 1,066 | | | | 2,129 | |
Administrative Class | | | 18,310 | | | | 37,015 | |
Cost of shares redeemed | | | | | | | | |
Institutional Class | | | (32,059 | ) | | | (11,077 | ) |
Administrative Class | | | (85,613 | ) | | | (178,833 | ) |
| | |
|
|
| |
|
|
|
Net increase resulting from Portfolio share transactions | | | 497,501 | | | | 814,427 | |
| | |
|
|
| |
|
|
|
Total Increase in Net Assets | | | 539,219 | | | | 839,793 | |
| | |
|
|
| |
|
|
|
Net Assets: | | | | | | | | |
Beginning of period | | | 1,207,847 | | | | 368,054 | |
End of period* | | $ | 1,747,066 | | | $ | 1,207,847 | |
*Includingundistributed net investment income of: | | $ | 3,283 | | | $ | 5,440 | |
6 | | Semi-Annual Report | 6.30.03 | | | See accompanying notes |
Schedule of Investments
Total Return Portfolio
June 30, 2003 (Unaudited)
| | | Principal
Amount
(000s)
| | Value
(000s)
|
CORPORATE BONDS & NOTES 11.3% | | | | | | |
Banking & Finance 3.7% | | | | | | |
Atlas Reinsurance PLC | | | | | | |
4.877% due 01/07/2005 (a) | | $ | 1,000 | | $ | 1,009 |
Banco Nacional de Comercio Exterior | | | | | | |
7.250% due 02/02/2004 | | | 700 | | | 725 |
Bear Stearns Cos., Inc. | | | | | | |
1.630% due 12/01/2003 (a) | | | 2,000 | | | 2,003 |
CIT Group, Inc. | | | | | | |
2.618% due 07/30/2004 (a) | | | 2,220 | | | 2,243 |
Credit Suisse First Boston USA, Inc. | | | | | | |
4.625% due 01/15/2008 | | | 1,300 | | | 1,390 |
Deutsche Telekom International Finance BV | | | | | | |
8.500% due 06/15/2010 | | | 6,300 | | | 7,751 |
8.750% due 06/15/2030 | | | 7,300 | | | 9,334 |
EOP Operating L.P. | | | | | | |
5.875% due 01/15/2013 | | | 6,100 | | | 6,589 |
Gemstone Investors Ltd. | | | | | | |
7.710% due 10/31/2004 | | | 700 | | | 700 |
General Motors Acceptance Corp. | | | | | | |
1.604% due 07/21/2003 (a) | | | 500 | | | 500 |
1.630% due 08/04/2003 (a) | | | 1,900 | | | 1,900 |
1.390% due 08/18/2003 (a) | | | 1,600 | | | 1,599 |
2.250% due 03/22/2004 (a) | | | 1,500 | | | 1,497 |
2.100% due 05/04/2004 (a) | | | 2,500 | | | 2,490 |
1.981% due 05/10/2004 (a) | | | 500 | | | 497 |
1.990% due 05/17/2004 (a) | | | 700 | | | 696 |
1.759% due 07/20/2004 (a) | | | 500 | | | 495 |
1.679% due 07/21/2004 (a) | | | 200 | | | 198 |
1.698% due 07/30/2004 (a) | | | 600 | | | 594 |
8.000% due 11/01/2031 | | | 5,300 | | | 5,215 |
Pemex Finance Ltd. | | | | | | |
5.720% due 11/15/2003 | | | 25 | | | 25 |
Phoenix Quake Ltd. | | | | | | |
3.515% due 07/03/2008 | | | 1,600 | | | 1,598 |
4.565% due 07/03/2008 | | | 400 | | | 400 |
PNC Funding Corp. | | | | | | |
6.125% due 09/01/2003 | | | 100 | | | 101 |
Popular North America, Inc. | | | | | | |
6.625% due 01/15/2004 | | | 500 | | | 514 |
Premium Asset Trust | | | | | | |
1.605% due 11/27/2004 (a) | | | 100 | | | 100 |
1.692% due 09/08/2007 (a) | | | 100 | | | 100 |
Qwest Capital Funding, Inc. | | | | | | |
7.250% due 02/15/2011 | | | 657 | | | 542 |
Residential Reinsurance Ltd. | | | | | | |
6.415% due 06/01/2004 (a) | | | 100 | | | 100 |
6.230% due 06/08/2006 (a) | | | 8,100 | | | 8,110 |
Studio Re Ltd. | | | | | | |
6.378% due 07/07/2006 (a) | | | 1,300 | | | 1,303 |
Verizon Global Funding Corp. | | | | | | |
6.125% due 06/15/2007 | | | 3,700 | | | 4,170 |
| | | | | |
|
|
| | | | | | | 64,488 |
| | | | | |
|
|
Industrials 2.6% | | | | | | |
Amerada Hess Corp. | | | | | | |
6.650% due 08/15/2011 | | | 2,000 | | | 2,311 |
AOL Time Warner, Inc. | | | | | | |
7.625% due 04/15/2031 | | | 8,600 | | | 9,963 |
7.700% due 05/01/2032 | | | 3,300 | | | 3,867 |
Continental Airlines, Inc. | | | | | | |
7.256% due 03/15/2020 | | | 414 | | | 410 |
DaimlerChrysler North America Holding Corp. | | | | | | |
1.508% due 08/21/2003 (a) | | | 2,300 | | | 2,300 |
General Motors Corp. | | | | | | |
7.125% due 07/15/2013 | | | 1,600 | | | 1,610 |
Hutchison Whampoa International Ltd. | | | | | | |
6.500% due 02/13/2013 | | | 500 | | | 526 |
ITT Corp. | | | | | | |
6.750% due 11/15/2005 | | | 250 | | | 262 |
Kerr-McGee Corp. | | | | | | |
2.040% due 06/28/2004 (a) | | | 150 | | | 149 |
Northwest Airlines, Inc. | | | | | | |
6.841% due 10/01/2012 | | | 3,300 | | | 3,273 |
Pemex Project Funding Master Trust | | | | | | |
8.000% due 11/15/2011 | | $ | 100 | | $ | 115 |
8.625% due 02/01/2022 | | | 1,800 | | | 2,061 |
Singapore Telecommunications Ltd. | | | | | | |
7.375% due 12/01/2031 | | | 1,700 | | | 2,084 |
Tyco International Group S.A. | | | | | | |
6.750% due 02/15/2011 | | | 157 | | | 167 |
United Airlines, Inc. | | | | | | |
1.558% due 03/02/2004 (a) | | | 1,365 | | | 1,031 |
8.030% due 07/01/2011 | | | 465 | | | 117 |
6.071% due 03/01/2013 | | | 6,920 | | | 5,806 |
Waste Management, Inc. | | | | | | |
6.375% due 11/15/2012 | | | 2,600 | | | 2,962 |
Weyerhaeuser Co. | | | | | | |
7.950% due 03/15/2025 | | | 900 | | | 1,056 |
Williams Cos., Inc. | | | | | | |
7.875% due 09/01/2021 | | | 5,500 | | | 5,390 |
| | | | | |
|
|
| | | | | | | 45,460 |
| | | | | |
|
|
Utilities 5.0% | | | | | | |
AEP Texas Central Co. | | | | | | |
2.590% due 02/15/2005 (a) | | | 900 | | | 901 |
ALLETE, Inc. | | | | | | |
2.179% due 10/20/2003 (a) | | | 100 | | | 100 |
AT&T Wireless Services, Inc. | | | | | | |
7.875% due 03/01/2011 | | | 100 | | | 118 |
British Telecom PLC | | | | | | |
2.553% due 12/15/2003 (a) | | | 1,900 | | | 1,906 |
8.125% due 12/15/2010 | | | 100 | | | 127 |
DTE Energy Co. | | | | | | |
7.110% due 11/15/2038 (a) | | | 500 | | | 506 |
El Paso Corp. | | | | | | |
6.750% due 05/15/2009 | | | 6,000 | | | 5,520 |
7.875% due 06/15/2012 | | | 8,600 | | | 8,009 |
7.800% due 08/01/2031 | | | 1,500 | | | 1,271 |
7.750% due 01/15/2032 | | | 300 | | | 254 |
Entergy Gulf States, Inc. | | | | | | |
8.250% due 04/01/2004 | | | 5,500 | | | 5,763 |
2.638% due 09/01/2004 (a) | | | 3,400 | | | 3,398 |
6.000% due 12/01/2012 | | | 6,500 | | | 6,806 |
France Telecom S.A. | | | | | | |
1.906% due 07/16/2003 (a) | | | 200 | | | 200 |
9.250% due 03/01/2011 | | | 7,600 | | | 9,582 |
10.000% due 03/01/2031 | | | 900 | | | 1,250 |
Oncor Electric Delivery Co. | | | | | | |
6.375% due 01/15/2015 | | | 5,500 | | | 6,252 |
Pacific Gas & Electric Co. | | | | | | |
7.958% due 10/31/2049 (a) | | | 400 | | | 406 |
PSEG Power LLC | | | | | | |
7.750% due 04/15/2011 | | | 5,700 | | | 6,814 |
Sprint Capital Corp. | | | | | | |
6.000% due 01/15/2007 | | | 100 | | | 108 |
6.125% due 11/15/2008 | | | 900 | | | 978 |
7.625% due 01/30/2011 | | | 5,200 | | | 5,946 |
8.375% due 03/15/2012 | | | 3,200 | | | 3,839 |
8.750% due 03/15/2032 | | | 14,000 | | | 16,818 |
Telekomunikacja Polska S.A. | | | | | | |
7.125% due 12/10/2003 | | | 100 | | | 101 |
Verizon Florida, Inc. | | | | | | |
6.125% due 01/15/2013 | | | 700 | | | 794 |
Vodafone Group PLC | | | | | | |
6.250% due 11/30/2032 | | | 300 | | | 326 |
| | | | | |
|
|
| | | | | | | 88,093 |
| | | | | |
|
|
Total Corporate Bonds & Notes
(Cost $182,842) | | | | | | 198,041 |
| | | | | |
|
|
MUNICIPAL BONDS & NOTES 3.9% | | | | | | |
California 0.6% | | | | | | |
California State Revenue Bonds, Series 2003 | | | | | | |
2.000% due 06/16/2004 | | | 3,600 | | | 3,630 |
Los Angeles, California Unified School District General Obligation Bonds, (MBIA Insured), Series 2003 | | | | | | |
5.000% due 01/01/2028 | | | 7,300 | | | 7,651 |
| | | | | |
|
|
| | | | | | | 11,281 |
| | | | | |
|
|
Illinois 1.1% | | | | | | |
Illinois State General Obligation Bonds, Series 2003 | | | | | | |
5.100% due 06/01/2033 | | $ | 20,000 | | $ | 19,667 |
| | | | | |
|
|
Massachusetts 0.1% | | | | | | |
Massachusetts State Water Reserve Authority Revenue Bonds, (FSA Insured), Series 2002 | | | | | | |
5.000% due 08/01/2032 | | | 1,000 | | | 1,045 |
| | | | | |
|
|
New Jersey 0.6% | | | | | | |
Tobacco Settlement Financing Corp., Series 2003 | | | | | | |
4.375% due 06/01/2019 | | | 4,870 | | | 4,605 |
6.000% due 06/01/2037 | | | 1,530 | | | 1,254 |
6.750% due 06/01/2039 | | | 5,450 | | | 4,943 |
| | | | | |
|
|
| | | | | | | 10,802 |
| | | | | |
|
|
New York 0.8% | | | | | | |
New York City, New York Municipal Water Finance Authority Revenue Bonds, (FGIC Insured), Series 2003-E | | | | | | |
5.000% due 06/15/2034 | | | 1,400 | | | 1,459 |
New York City, New York Municipal Water Finance Authority Revenue Bonds, (FSA-CR Insured), Series 2002 | | | | | | |
5.125% due 06/15/2034 | | | 10,460 | | | 11,040 |
New York State Environmental Facilities Corporate Revenue Bonds, Series 2002 | | | | | | |
8.760% due 06/15/2023 (a) | | | 850 | | | 975 |
| | | | | |
|
|
| | | | | | | 13,474 |
| | | | | |
|
|
North Carolina 0.2% | | | | | | |
Durham County, North Carolina General Obligation | | | | | | |
Revenue Bonds, Series 2002 | | | | | | |
8.750% due 04/01/2021 (a) | | | 2,733 | | | 3,113 |
| | | | | |
|
|
Texas 0.1% | | | | | | |
University of Texas Revenue Bonds, Series 2003 | | | | | | |
5.000% due 08/15/2033 | | | 1,200 | | | 1,246 |
| | | | | |
|
|
Washington 0.1% | | | | | | |
Energy Northwest Washington Electric Revenue Bonds, Series 2003 | | | | | | |
5.500% due 07/01/2013 | | | 1,700 | | | 1,968 |
5.500% due 07/01/2014 | | | 1,300 | | | 1,510 |
| | | | | |
|
|
| | | | | | | 3,478 |
| | | | | |
|
|
Wisconsin 0.2% | | | | | | |
Badger Asset Securitization Corporate Revenue Bonds, Series 2002 | | | | | | |
6.000% due 06/01/2017 | | | 3,700 | | | 3,526 |
| | | | | |
|
|
Total Municipal Bonds & Notes
(Cost $67,458) | | | | | | 67,632 |
| | | | | |
|
|
U.S. GOVERNMENT AGENCIES 1.3% | | | | | | |
Small Business Administration | | | | | | |
8.017% due 02/10/2010 | | | 633 | | | 725 |
7.449% due 08/01/2010 | | | 77 | | | 86 |
6.344% due 08/01/2011 | | | 2,270 | | | 2,460 |
6.030% due 02/10/2012 | | | 14,626 | | | 15,766 |
7.500% due 04/01/2017 | | | 3,023 | | | 3,441 |
6.290% due 01/01/2021 | | | 356 | | | 398 |
| | | | | |
|
|
Total U.S. Government Agencies
(Cost $21,069) | | | | | | 22,876 |
| | | | | |
|
|
U.S. TREASURY OBLIGATIONS 11.5% | | | | | | |
Treasury Inflation Protected Securities (f) | | | | | | |
3.375% due 01/15/2007 (b) | | | 4,061 | | | 4,461 |
3.625% due 01/15/2008 | | | 16,499 | | | 18,515 |
3.875% due 01/15/2009 | | | 16,141 | | | 18,491 |
4.250% due 01/15/2010 | | | 2,185 | | | 2,572 |
3.500% due 01/15/2011 | | | 6,548 | | | 7,440 |
See accompanying notes | | | 6.30.03 | Semi-Annual Report | | 7 |
| | | Principal
Amount
(000s)
| | Value
(000s)
|
3.375% due 01/15/2012 | | $ | 2,071 | | $ | 2,343 |
3.000% due 07/15/2012 | | | 818 | | | 902 |
3.875% due 04/15/2029 | | | 31,757 | | | 40,525 |
U.S. Treasury Bonds | | | | | | |
7.250% due 05/15/2016 | | | 33,700 | | | 44,829 |
7.500% due 11/15/2016 | | | 22,400 | | | 30,414 |
8.750% due 05/15/2017 | | | 10,000 | | | 14,971 |
8.875% due 08/15/2017 | | | 6,900 | | | 10,441 |
U.S. Treasury Strips | | | | | | |
0.000% due 11/15/2016 | | | 1,900 | | | 1,056 |
0.000% due 05/15/2017 | | | 6,300 | | | 3,403 |
| | | | | |
|
|
Total U.S. Treasury Obligations
(Cost 194,366) | | | | | | 200,363 |
| | | | | |
|
|
MORTGAGE-BACKED SECURITIES 38.3% | | | | | | |
Collateralized Mortgage Obligations 8.3% | | | | | | |
Aurora Loan Services | | | | | | |
2.020% due 05/25/2030 (a) | | | 205 | | | 205 |
Bank of America Mortgage Securities, Inc. | | | | | | |
6.250% due 03/25/2032 | | | 1,124 | | | 1,128 |
5.772% due 10/20/2032 (a) | | | 2,600 | | | 2,686 |
Bear Stearns Adjustable Rate Mortgage Trust | | | | | | |
6.750% due 03/25/2028 | | | 934 | | | 939 |
4.405% due 11/25/2030 (a) | | | 37 | | | 38 |
6.477% due 10/25/2031 (a) | | | 260 | | | 261 |
6.592% due 11/25/2031 (a) | | | 408 | | | 413 |
6.191% due 01/25/2032 (a) | | | 503 | | | 506 |
6.050% due 02/25/2032 (a) | | | 126 | | | 127 |
6.090% due 02/25/2032 (a) | | | 237 | | | 239 |
6.159% due 08/25/2032 (a) | | | 393 | | | 402 |
5.395% due 10/25/2032 (a) | | | 675 | | | 688 |
5.376% due 01/25/2033 (a) | | | 5,045 | | | 5,147 |
5.673% due 01/25/2033 (a) | | | 1,832 | | | 1,865 |
5.234% due 03/25/2033 (a) | | | 8,184 | | | 8,362 |
Cendant Mortgage Corp. | | | | | | |
1.970% due 08/25/2030 (a) | | | 270 | | | 270 |
Chase Mortgage Finance Corp. | | | | | | |
6.200% due 12/25/2029 (a) | | | 590 | | | 600 |
Countrywide Home Loans, Inc. | | | | | | |
6.500% due 08/25/2032 (a) | | | 231 | | | 231 |
Credit-Based Asset Servicing & Securitization LLC | | | | | | |
1.730% due 09/25/2029 (a) | | | 204 | | | 204 |
CS First Boston Mortgage Securities Corp. | | | | | | |
6.750% due 12/27/2028 | | | 100 | | | 104 |
1.670% due 08/25/2031 (a) | | | 319 | | | 320 |
6.249% due 04/25/2032 (a) | | | 494 | | | 505 |
6.182% due 06/25/2032 (a) | | | 6,750 | | | 6,952 |
5.767% due 10/25/2032 (a)(i) | | | 2,969 | | | 2,978 |
Fannie Mae | | | | | | |
7.000% due 04/25/2023 | | | 12,128 | | | 12,767 |
6.000% due 02/25/2029 | | | 1,363 | | | 1,372 |
5.000% due 04/25/2033 | | | 20,505 | | | 20,953 |
Federal Home Loan Bank | | | | | | |
5.500% due 03/15/2015 | | | 886 | | | 902 |
First Horizon Asset Securities, Inc. | | | | | | |
6.750% due 11/25/2031 | | | 111 | | | 113 |
6.500% due 11/25/2032 | | | 1,969 | | | 1,981 |
First Nationwide Trust | | | | | | |
6.750% due 08/21/2031 | | | 633 | | | 650 |
Freddie Mac | | | | | | |
5.000% due 09/15/2016 | | | 1,680 | | | 1,735 |
7.500% due 11/15/2016 | | | 50 | | | 50 |
6.250% due 08/25/2022 | | | 5,186 | | | 5,317 |
7.000% due 06/15/2023 | | | 9,286 | | | 9,679 |
8.500% due 08/01/2024 | | | 71 | | | 77 |
6.500% due 04/15/2029 | | | 648 | | | 700 |
7.500% due 07/15/2030 | | | 300 | | | 314 |
1.810% due 09/15/2030 (a) | | | 207 | | | 208 |
1.760% due 11/15/2030 (a) | | | 345 | | | 344 |
GMAC Commercial Mortgage Securities, Inc. | | | | | | |
2.459% due 09/11/2006 (a) | | | 1,000 | | | 976 |
Government National Mortgage Association | | | | | | |
7.500% due 11/20/2029 | | $ | 520 | | $ | 567 |
1.718% due 06/20/2030 (a) | | | 26 | | | 26 |
1.818% due 09/20/2030 (a) | | | 222 | | | 223 |
GSR Mortgage Loan Trust | | | | | | |
5.626% due 04/25/2032 (a) | | | 5,474 | | | 5,530 |
2.882% due 10/25/2032 (a) | | | 373 | | | 374 |
G-Wing Ltd. | | | | | | |
3.950% due 05/06/2004 (a) | | | 1,730 | | | 1,697 |
Indymac Adjustable Rate Mortgage Trust | | | | | | |
6.506% due 01/25/2032 (a) | | | 157 | | | 162 |
PNC Mortgage Securities Corp. | | | | | | |
7.500% due 02/25/2031 | | | 34 | | | 34 |
Resecuritization Mortgage Trust | | | | | | |
6.500% due 04/19/2029 | | | 166 | | | 168 |
Residential Asset Securitization Trust | | | | | | |
7.130% due 07/25/2031 | | | 3,400 | | | 3,529 |
Residential Funding Mortgage Securities I, Inc. | | | | | | |
6.500% due 12/25/2023 | | | 4,632 | | | 4,716 |
6.500% due 03/25/2032 | | | 12,120 | | | 12,257 |
5.649% due 09/25/2032 (a) | | | 1,164 | | | 1,178 |
6.250% due 09/25/2032 | | | 820 | | | 827 |
Structured Asset Mortgage Investments, Inc. | | | | | | |
1.647% due 09/19/2032 (a) | | | 1,317 | | | 1,312 |
Structured Asset Securities Corp. | | | | | | |
7.000% due 02/25/2016 | | | 76 | | | 77 |
1.770% due 06/25/2017 (a) | | | 4,491 | | | 4,497 |
1.770% due 05/25/2031 (a) | | | 117 | | | 117 |
5.800% due 09/25/2031 | | | 187 | | | 189 |
6.500% due 10/25/2031 (a) | | | 253 | | | 263 |
6.170% due 02/25/2032 (a) | | | 348 | | | 356 |
6.150% due 07/25/2032 (a) | | | 765 | | | 784 |
1.610% due 01/25/2033 (a) | | | 1,086 | | | 1,085 |
5.600% due 01/25/2033 | | | 383 | | | 383 |
Superannuation Members Home Loans Global Fund | | | | | | |
1.513% due 06/15/2026 (a) | | | 392 | | | 393 |
Torrens Trust | | | | | | |
1.570% due 07/15/2031 (a) | | | 1,283 | | | 1,284 |
Washington Mutual Mortgage Securities Corp. | | | | | | |
5.224% due 10/25/2032 (a) | | | 3,954 | | | 4,018 |
6.396% due 10/19/2039 | | | 2,547 | | | 2,557 |
4.054% due 01/25/2041 (a) | | | 51 | | | 52 |
Wells Fargo Mortgage-Backed Securities Trust | | | | | | |
6.542% due 10/25/2031 (a) | | | 280 | | | 281 |
5.176% due 09/25/2032 (a) | | | 765 | | | 772 |
5.250% due 01/25/2033 | | | 2,094 | | | 2,114 |
| | | | | |
|
|
| | | | | | | 145,130 |
| | | | | |
|
|
Fannie Mae 23.0% | | | | | | |
3.258% due 09/01/2040 (a) | | | 353 | | | 360 |
4.265% due 11/01/2025 (a) | | | 7 | | | 7 |
4.359% due 10/01/2032 (a) | | | 3,952 | | | 4,047 |
4.417% due 11/01/2035 (a) | | | 784 | | | 803 |
5.000% due 07/17/2018 | | | 25,000 | | | 25,828 |
5.500% due 04/01/2014-01/01/2018 (c) | | | 146,439 | | | 152,159 |
6.000% due 04/01/2013-08/13/2033 (c) | | | 206,582 | | | 214,969 |
6.500% due 06/01/2029-07/01/2032 (c) | | | 1,752 | | | 1,829 |
6.569% due 09/01/2039 (a) | | | 815 | | | 844 |
| | | | | |
|
|
| | | | | | | 400,846 |
| | | | | |
|
|
Federal Housing Administration 0.0% | | | | | | |
7.430% due 01/25/2023 | | | 530 | | | 543 |
| | | | | |
|
|
Freddie Mac 6.1% | | | | | | |
4.366% due 01/01/2028 (a) | | | 10 | | | 11 |
4.584% due 07/01/2027 (a) | | | 11 | | | 11 |
5.000% due 08/18/2018 | | | 7,000 | | | 7,212 |
5.500% due 08/13/2033 | | | 51,000 | | | 52,482 |
6.000% due 07/01/2016-08/13/2033 (c) | | | 40,169 | | | 41,654 |
6.500% due 08/01/2032 | | | 5,195 | | | 5,408 |
7.850% due 07/01/2030 (a) | | | 15 | | | 15 |
| | | | | |
|
|
| | | | | | | 106,793 |
| | | | | |
|
|
Government National Mortgage Association 0.9% | | | | | | |
4.500% due 05/20/2030-02/20/2032 (a)(c) | | | 4,752 | | | 4,848 |
5.000% due 10/20/2029-07/20/2030 (a)(c) | | | 1,659 | | | 1,724 |
5.375% due 04/20/2026-02/20/2027 (a)(c) | | | 454 | | | 471 |
5.500% due 07/22/2033 | | | 3,000 | | | 3,124 |
6.500% due 02/15/2029-10/15/2032 (c) | | | 5,464 | | | 5,740 |
7.000% due 11/15/2026 (c) | | | 424 | | | 449 |
7.500% due 07/15/2029 | | | 23 | | | 25 |
| | | | | |
|
|
| | | | | | | 16,381 |
| | | | | |
|
|
Total Mortgage-Backed Securities
(Cost $665,350) | | | | | | 669,693 |
| | | | | |
|
|
ASSET-BACKED SECURITIES 1.3% | | | | | | |
Ace Securities Corp. | | | | | | |
1.660% due 06/25/2032 (a) | | | 942 | | | 943 |
Ameriquest Mortgage Securities, Inc. | | | | | | |
1.630% due 06/15/2030 (a) | | | 9 | | | 9 |
1.610% due 07/15/2030 (a) | | | 30 | | | 30 |
Amortizing Residential Collateral Trust | | | | | | |
1.590% due 06/25/2032 (a) | | | 4,692 | | | 4,687 |
Bayview Financial Acquisition Trust | | | | | | |
1.710% due 07/25/2030 (a) | | | 37 | | | 37 |
1.720% due 04/25/2031 (a) | | | 145 | | | 145 |
1.600% due 07/25/2031 (a) | | | 93 | | | 93 |
CDC Mortgage Capital Trust | | | | | | |
1.610% due 01/25/2033 (a) | | | 5,492 | | | 5,494 |
Conseco Finance Corp. | | | | | | |
3.220% due 09/01/2023 | | | 887 | | | 888 |
1.680% due 10/15/2031 (a) | | | 247 | | | 247 |
CS First Boston Mortgage Securities Corp. | | | | | | |
1.570% due 12/15/2030 (a) | | | 136 | | | 137 |
EMC Mortgage Loan Trust | | | | | | |
1.690% due 05/25/2040 (a) | | | 2,950 | | | 2,955 |
GRMT II Mortgage Loan Trust | | | | | | |
1.568% due 06/20/2032 (a) | | | 100 | | | 100 |
Household Mortgage Loan Trust | | | | | | |
1.618% due 05/20/2032 (a) | | | 943 | | | 945 |
Irwin Home Equity Loan Trust | | | | | | |
1.695% due 06/25/2021 (a) | | | 13 | | | 13 |
1.610% due 06/25/2029 (a) | | | 880 | | | 880 |
Morgan Stanley Dean Witter Capital I | | | | | | |
1.650% due 07/25/2032 (a) | | | 2,089 | | | 2,090 |
Salomon Brothers Mortgage Securities VII, Inc. | | | | | | |
1.720% due 09/25/2029 (a) | | | 51 | | | 51 |
Vanderbilt Acquisition Loan Trust | | | | | | |
3.280% due 01/07/2013 | | | 2,838 | | | 2,868 |
| | | | | |
|
|
Total Asset-Backed Securities
(Cost $22,575) | | | | | | 22,612 |
| | | | | |
|
|
SOVEREIGN ISSUES 3.5% | | | | | | |
Province of Quebec | | | | | | |
7.500% due 09/15/2029 | | | 75 | | | 100 |
Republic of Brazil | | | | | | |
2.125% due 04/15/2006 (a) | | | 2,304 | | | 2,166 |
11.500% due 03/12/2008 | | | 2,300 | | | 2,415 |
2.187% due 04/15/2009 (a) | | | 685 | | | 575 |
11.000% due 01/11/2012 | | | 2,840 | | | 2,833 |
8.000% due 04/15/2014 | | | 7,376 | | | 6,482 |
11.000% due 08/17/2040 | | | 2,400 | | | 2,172 |
Republic of Panama | | | | | | |
9.625% due 02/08/2011 | | | 800 | | | 930 |
9.375% due 01/16/2023 | | | 330 | | | 369 |
8.875% due 09/30/2027 | | | 5,200 | | | 5,681 |
Republic of Peru | | | | | | |
9.125% due 02/21/2012 | | | 1,400 | | | 1,496 |
9.875% due 02/06/2015 | | | 5,100 | | | 5,610 |
Republic of South Africa | | | | | | |
9.125% due 05/19/2009 | | | 500 | | | 621 |
8 | | Semi-Annual Report | 6.30.03 | | | See accompanying notes |
| | | Principal
Amount
(000s)
| | Value (000s)
| |
United Mexican States | | | | | | | |
9.875% due 02/01/2010 | | $ | 100 | | $ | 128 | |
8.375% due 01/14/2011 | | | 300 | | | 360 | |
6.375% due 01/16/2013 | | | 930 | | | 988 | |
11.375% due 09/15/2016 | | | 5,100 | | | 7,408 | |
8.300% due 08/15/2031 | | | 17,700 | | | 20,426 | |
| | | | | |
|
|
|
Total Sovereign Issues (Cost $54,903) | | | | | | 60,760 | |
| | | | | |
|
|
|
PURCHASED PUT OPTIONS 0.0% | | | | | | | |
7 Year Interest Rate Swap (OTC) | | | | | | | |
Strike @ 0.760% Exp. 05/31/2005 | | | 400,000 | | | 71 | |
| | | | | |
|
|
|
Total Purchased Put Options (Cost $23) | | | | | | 71 | |
| | | | | |
|
|
|
SHORT-TERM INSTRUMENTS 43.7% | | | | | | | |
Commercial Paper 42.2% | | | | | | | |
ABN AMRO North America Finance | | | | | | | |
1.200% due 07/07/2003 | | | 2,500 | | | 2,499 | |
1.040% due 07/16/2003 | | | 14,000 | | | 13,994 | |
0.915% due 08/25/2003 | | | 5,600 | | | 5,592 | |
Anz, Inc. | | | | | | | |
1.235% due 07/09/2003 | | | 9,900 | | | 9,897 | |
Bank of America Corp. | | | | | | | |
1.150% due 07/14/2003 | | | 2,100 | | | 2,100 | |
Barclays U.S. Funding Corp. | | | | | | | |
0.930% due 08/25/2003 | | | 10,200 | | | 10,186 | |
Danske Corp. | | | | | | | |
1.220% due 07/02/2003 | | | 5,700 | | | 5,700 | |
1.210% due 07/10/2003 | | | 3,400 | | | 3,399 | |
1.220% due 07/10/2003 | | | 9,900 | | | 9,897 | |
1.240% due 07/28/2003 | | | 2,700 | | | 2,697 | |
1.210% due 08/20/2003 | | | 15,000 | | | 14,975 | |
0.915% due 09/19/2003 | | | 1,900 | | | 1,896 | |
Fannie Mae | | | | | | | |
1.230% due 07/01/2003 | | | 15,300 | | | 15,300 | |
1.195% due 08/11/2003 | | | 33,800 | | | 33,754 | |
1.165% due 08/13/2003 | | | 10,400 | | | 10,386 | |
1.170% due 08/27/2003 | | | 20,000 | | | 19,963 | |
1.080% due 09/30/2003 | | | 44,700 | | | 44,581 | |
1.140% due 10/15/2003 | | | 75,000 | | | 74,768 | |
1.110% due 12/11/2003 | | | 9,500 | | | 9,455 | |
Federal Home Loan Bank | | | | | | | |
1.145% due 08/08/2003 | | | 50,000 | | | 49,940 | |
1.170% due 08/29/2003 | | | 20,000 | | | 19,962 | |
1.140% due 11/17/2003 | | | 30,000 | | | 29,879 | |
Freddie Mac | | | | | | | |
1.160% due 07/10/2003 | | | 23,200 | | | 23,193 | |
1.080% due 08/05/2003 | | | 26,800 | | | 26,772 | |
1.170% due 08/28/2003 | | | 12,000 | | | 11,977 | |
1.135% due 10/30/2003 | | | 10,500 | | | 10,463 | |
General Electric Capital Corp. | | | | | | | |
1.200% due 07/11/2003 | | | 23,400 | | | 23,392 | |
1.250% due 07/23/2003 | | | 2,900 | | | 2,898 | |
1.200% due 08/21/2003 | | | 7,000 | | | 6,988 | |
HBOS Treasury Services PLC | | | | | | | |
1.200% due 08/14/2003 | | | 20,000 | | | 19,971 | |
1.195% due 08/27/2003 | | | 6,200 | | | 6,188 | |
1.100% due 09/12/2003 | | | 15,000 | | | 14,968 | |
Rabobank Nederland NV | | | | | | | |
1.310% due 07/01/2003 | | | 50,000 | | | 50,000 | |
Royal Bank of Scotland PLC | | | | | | | |
1.245% due 07/03/2003 | | | 8,600 | | | 8,599 | |
Shell Finance | | | | | | | |
0.970% due 08/19/2003 | | | 19,900 | | | 19,874 | |
Svenska Handelsbank, Inc. | | | | | | | |
1.220% due 07/01/2003 | | | 8,800 | | | 8,800 | |
1.250% due 07/07/2003 | | | 21,200 | | | 21,196 | |
TotalFinaElf Capital S.A. | | | | | | | |
1.300% due 07/01/2003 | | | 21,000 | | | 21,000 | |
UBS Finance, Inc. | | | | | | | |
1.210% due 07/08/2003 | | | 20,000 | | | 19,995 | |
0.920% due 09/24/2003 | | | 11,700 | | | 11,671 | |
Westpac Capital Corp. | | | | | | | |
1.190% due 08/07/2003 | | | 30,000 | | | 29,963 | |
1.180% due 08/20/2003 | | | 7,900 | | | 7,887 | |
| | | | | |
|
|
|
| | | | | | | 736,615 | |
| | | | | |
|
|
|
Repurchase Agreement 0.7% | | | | | | | |
State Street Bank | | | | | | | |
0.800% due 07/01/2003 | | | 13,282 | | | 13,282 | |
(Dated 06/30/2003. Collateralized by Federal Farm Credit Banks 2.000% due 11/19/2004 valued at $13,548. Repurchase proceeds are $13,282.) | | | | | | | |
| | | | | |
|
|
|
U.S. Treasury Bills 0.8% | | | | | | | |
1.043% due 08/07/2003-08/14/2003 (b)(c) | | | 13,820 | | | 13,803 | |
| | | | | |
|
|
|
Total Short-Term Instruments (Cost $763,663) | | | | | | 763,700 | |
| | | | | |
|
|
|
Total Investments 114.8% (Cost $1,972,249) | | | | | $ | 2,005,748 | |
Written Options (d) (0.3%) (Premiums $4,073) | | | | | | (4,397 | ) |
Other Assets and Liabilities (Net) (14.5%) | | | | | | (254,285 | ) |
| | | | | |
|
|
|
Net Assets 100.0% | | | | | $ | 1,747,066 | |
| | | | | |
|
|
|
Notes to Schedule of Investments
(amounts in thousands, except number of contracts):
| (a) | | Variable rate security. The rate listed is as of June 30, 2003. |
| (b) | | Securities with an aggregate market value of $9,322 have been segregated with the custodian to cover margin requirements for the following open futures contracts at June 30, 2003: |
Type
| | # of
Contracts
| | Unrealized
Appreciation/
(Depreciation)
| |
| | | | | | | |
Euribor Written Put Options Strike @ 97.500 (03/2004) - Short | | 74 | | $ | 52 | |
Euribor Written Put Options Strike @ 97.500 (09/2003) - Short | | 107 | | | 53 | |
Euribor Written Put Options Strike @ 96.500 (12/2003) - Short | | 89 | | | 77 | |
Euribor Written Put Options Strike @ 97.375 (12/2003) - Short | | 71 | | | 56 | |
Euribor Written Put Options Strike @ 97.500 (12/2003) - Short | | 143 | | | 104 | |
Euribor Written Put Options Strike @ 95.500 (12/2003) - Long | | 411 | | | (6 | ) |
Euribor March Futures (03/2004) - Long | | 25 | | | 19 | |
Euribor September Futures (09/2003) - Long | | 73 | | | 100 | |
Euribor September Futures (09/2005) - Long | | 100 | | | (60 | ) |
Euribor December Futures (12/2004) - Long | | 12 | | | 2 | |
Euro-Bobl 5 Year Note (09/2003) - Long | | 412 | | | (75 | ) |
United Kingdom 90 Day LIBOR Futures (12/2003) - Long | | 25 | | | (9 | ) |
Eurodollar June Futures (06/2004) - Long | | 17 | | | 28 | |
U.S. Treasury 30 Year Bond (09/2003) - Long | | 504 | | | (2,048 | ) |
Eurodollar March Futures (03/2004) - Long | | 188 | | | 325 | |
Eurodollar September Futures (09/2004) - Long | | 35 | | | 68 | |
Eurodollar December Futures (12/2004) - Long | | 73 | | | 135 | |
U.S. Treasury 10 Year Note (09/2003) - Long | | 565 | | | (670 | ) |
| | | | |
|
|
|
| | | | | $ | (1,849 | ) |
| | | | |
|
|
|
| (c) | | Securities are grouped by coupon or range of coupons and represent a range of maturities. |
| (d) | | Premiums received on written options: |
Type
| | Notional
Amount
| | Premium
| | Value
|
Call - OTC 7 Year Interest Rate Swap | | | | | | | | | |
Strike @ 5.970%* Exp. 10/04/2004 | | $ | 6,400,000 | | $ | 257 | | $ | 787 |
Put - OTC 7 Year Interest Rate Swap | | | | | | | | | |
Strike @ 6.000%** Exp. 10/19/2004 | | | 1,700,000 | | | 69 | | | 14 |
Call - OTC 7 Year Interest Rate Swap | | | | | | | | | |
Strike @ 6.000%* Exp. 10/19/2004 | | | 1,700,000 | | | 69 | | | 210 |
Put - OTC 7 Year Interest Rate Swap | | | | | | | | | |
Strike @ 5.970%** Exp. 10/04/2004 | | | 6,400,000 | | | 257 | | | 49 |
Call - OTC 7 Year Interest Rate Swap | | | | | | | | | |
Strike @ 5.500%* Exp. 01/07/2005 | | | 3,900,000 | | | 95 | | | 361 |
Put - OTC 7 Year Interest Rate Swap | | | | | | | | | |
Strike @ 7.000%** Exp. 01/07/2005 | | | 3,900,000 | | | 132 | | | 20 |
Call - OTC 7 Year Interest Rate Swap | | | | | | | | | |
Strike @ 3.500%* Exp. 12/17/2003 | | | 6,700,000 | | | 62 | | | 119 |
Call - OTC 5 Year Interest Rate Swap | | | | | | | | | |
Strike @ 3.500%* Exp. 12/15/2003 | | | 5,500,000 | | | 58 | | | 155 |
Call - OTC 10 Year Interest Rate Swap | | | | | | | | | |
Strike @ 4.000%* Exp. 07/22/2003 | | | 9,800,000 | | | 88 | | | 138 |
Call - OTC 5 Year Interest Rate Swap | | | | | | | | | |
Strike @ 3.500%* Exp. 12/16/2003 | | | 9,700,000 | | | 104 | | | 273 |
Call - OTC 10 Year Interest Rate Swap | | | | | | | | | |
Strike @ 4.000%* Exp. 08/01/2003 | | | 5,200,000 | | | 49 | | | 79 |
Put - OTC 7 Year Interest Rate Swap | | | | | | | | | |
Strike @ 5.500%** Exp. 12/17/2003 | | | 4,000,000 | | | 57 | | | 3 |
See accompanying notes | | | 6.30.03 | Semi-Annual Report | | 9 |
Call - OTC 7 Year Interest Rate Swap | | | | | | | | |
Strike @ 5.500%* Exp. 12/17/2003 | | 1,400,000 | | $ | 24 | | $ | 1 |
Call - OTC 7 Year Interest Rate Swap | | | | | | | | |
Strike @ 3.500%* Exp. 12/17/2003 | | 1,400,000 | | | 10 | | | 25 |
Call - OTC 10 Year Interest Rate Swap | | | | | | | | |
Strike @ 4.000%* Exp. 08/01/2003 | | 3,900,000 | | | 32 | | | 60 |
Call - OTC 10 Year Interest Rate Swap | | | | | | | | |
Strike @ 4.000%* Exp. 03/03/2004 | | 8,200,000 | | | 136 | | | 201 |
Call - OTC 10 Year Interest Rate Swap | | | | | | | | |
Strike @ 4.000%* Exp. 03/03/2004 | | 5,100,000 | | | 112 | | | 125 |
Call - OTC 5 Year Interest Rate Swap | | | | | | | | |
Strike @ 3.250%* Exp. 03/03/2004 | | 25,600,000 | | | 393 | | | 500 |
Call - OTC 10 Year Interest Rate Swap | | | | | | | | |
Strike @ 4.000%* Exp. 03/03/2004 | | 8,300,000 | | | 119 | | | 204 |
| | | | |
|
| |
|
|
| | | | | $ | 2,123 | | $ | 3,324 |
| | | | |
|
| |
|
|
Type
| | # of
Contracts
| | Premium
| | Value
|
Call - CME Eurodollar March Futures | | | | | | | | |
Strike @ 98.50 Exp. 03/15/2004 | | 18 | | $ | 9 | | $ | 15 |
Put - CME Eurodollar March Futures | | | | | | | | |
Strike @ 97.250 Exp. 03/15/2004 | | 9 | | | 7 | | | 0 |
Put - CME Eurodollar March Futures | | | | | | | | |
Strike @ 97.750 Exp. 03/15/2004 | | 81 | | | 48 | | | 2 |
Put - CME Eurodollar December Futures | | | | | | | | |
Strike @ 98.000 Exp. 12/15/2003 | | 200 | | | 108 | | | 1 |
Call - CBOT 5 Year September Futures | | | | | | | | |
Strike @ 119.000 Exp. 08/23/2003 | | 84 | | | 15 | | | 3 |
Call - TSE Japanese Yen 10 Year September Futures | | | | | | | | |
Strike @ 145.000 Exp. 08/29/2003 | | 4 | | | 8 | | | 1 |
Call - CBOT U.S. Treasury Note September Futures | | | | | | | | |
Strike @ 117.000 Exp. 08/23/2003 | | 23 | | | 13 | | | 34 |
Call - CBOT U.S. Treasury Note September Futures | | | | | | | | |
Strike @ 120.000 Exp. 08/23/2003 | | 80 | | | 46 | | | 29 |
Call - CBOT U.S. Treasury Note September Futures | | | | | | | | |
Strike @ 122.000 Exp. 08/23/2003 | | 86 | | | 25 | | | 9 |
Call - CBOT U.S. Treasury Note September Futures | | | | | | | | |
Strike @ 123.000 Exp. 08/23/2003 | | 321 | | | 106 | | | 20 |
Put - CBOT U.S. Treasury Note September Futures | | | | | | | | |
Strike @ 110.000 Exp. 08/23/2003 | | 543 | | | 546 | | | 17 |
Put - CBOT U.S. Treasury Note September Futures | | | | | | | | |
Strike @ 114.000 Exp. 08/23/2003 | | 80 | | | 39 | | | 23 |
Put - CBOT U.S. Treasury Note September Futures | | | | | | | | |
Strike @ 116.000 Exp. 08/23/2003 | | 303 | | | 129 | | | 208 |
Call - CBOT U.S. Treasury Bond September Futures | | | | | | | | |
Strike @ 128.000 Exp. 08/23/2003 | | 194 | | | 66 | | | 9 |
Call - CBOT U.S. Treasury Bond September Futures | | | | | | | | |
Strike @ 126.000 Exp. 08/23/2003 | | 566 | | | 226 | | | 62 |
Put - CBOT U.S. Treasury Bond September Futures | | | | | | | | |
Strike @ 114.000 Exp. 08/23/2003 | | 818 | | | 559 | | | 640 |
| | | | |
|
| |
|
|
| | | | | $ | 1,950 | | $ | 1,073 |
| | | | |
|
| |
|
|
| * | | The Portfolio will receive a floating rate based on 3-month LIBOR. |
| ** | | The Portfolio will pay a floating rate based on 3-month LIBOR. |
| (e) | | Swap agreements outstanding at June 30, 2003: |
Type
| | Notional
Amount
| | Unrealized
Appreciation/
(Depreciation)
| |
Receive a fixed rate equal to 4.000% and pay floating rate based on 6-month BP-LIBOR. Counterparty: Morgan Stanley Dean Witter & Co. | | | | | | | |
Exp. 03/17/2005 | | BP | 22,500 | | $ | 65 | |
Receive floating rate based on 6-month BP-LIBOR and pay a fixed rate equal to 5.000%. Counterparty: UBS Warburg LLC | | | | | | | |
Exp. 03/15/2017 | | | 700 | | | (6 | ) |
Receive floating rate based on 6-month BP-LIBOR and pay a fixed rate equal to 5.000%. Counterparty: J.P. Morgan Chase & Co. | | | | | | | |
Exp. 03/15/2017 | | | 300 | | | (2 | ) |
Receive floating rate based on 6-month BP-LIBOR and pay a fixed rate equal to 5.000%. Counterparty: Goldman Sachs & Co. | | | | | | | |
Exp. 03/15/2017 | | | 1,700 | | | (7 | ) |
Receive floating rate based on 6-month BP-LIBOR and pay a fixed rate equal to 5.000%. Counterparty: J.P. Morgan Chase & Co. | | | | | | | |
Exp. 03/15/2032 | | | 900 | | | 29 | |
Receive floating rate based on 6-month BP-LIBOR and pay a fixed rate equal to 5.000%. Counterparty: UBS Warburg LLC | | | | | | | |
Exp. 03/15/2032 | | BP | 1,100 | | | 26 | |
Receive a fixed rate equal to 3.250% and pay floating rate based on 6-month EC-LIBOR. Counterparty: J.P. Morgan Chase & Co. | | | | | | | |
Exp. 03/15/2007 | | EC | 8,700 | | | (38 | ) |
Receive a fixed rate equal to 6.000% and pay floating rate based on 6-month EC-LIBOR. Counterparty: J.P. Morgan Chase & Co. | | | | | | | |
Exp. 03/15/2017 | | | 500 | | | 10 | |
Receive a fixed rate equal to 6.000% and pay floating rate based on 6-month EC-LIBOR. Counterparty: J.P. Morgan Chase & Co. | | | | | | | |
Exp. 03/15/2032 | | | 1,500 | | | 18 | |
Receive a fixed rate equal to 6.000% and pay floating rate based on 6-month EC-LIBOR. Counterparty: Goldman Sachs & Co. | | | | | | | |
Exp. 03/15/2017 | | | 4,000 | | | 77 | |
Receive a fixed rate equal to 6.000% and pay floating rate based on 6-month EC-LIBOR. Counterparty: UBS Warburg LLC | | | | | | | |
Exp. 03/15/2032 | | | 1,800 | | | 12 | |
Receive a fixed rate equal to 0.610% and the Portfolio will pay to the counterparty at par in the event of default of General Electric Capital Corp. 6.000% due 06/15/2012. Counterparty: Merrill Lynch & Co., Inc. | | | | | | | |
Exp. 05/19/2004 | | $ | 1,900 | | | 6 | |
Receive a fixed rate equal to 1.750% and the Portfolio will pay to the counterparty at par in the event of default of Republic of Peru 9.125% due 02/21/2012. Counterparty: Morgan Stanley Dean Witter & Co. | | | | | | | |
Exp. 06/20/2004 | | | 900 | | | 0 | |
Receive a fixed rate equal to 1.800% and the Portfolio will pay to the counterparty at par in the event of default of Republic of Panama 9.375% due 04/01/2029. Counterparty: Morgan Stanley Dean Witter & Co. | | | | | | | |
Exp. 06/20/2005 | | | 300 | | | 1 | |
| | | | | |
|
|
|
| | | | | | $ | 191 | |
| | | | | |
|
|
|
| (f) | | Principal amount of security is adjusted for inflation. |
| (g) | | Principal amount denoted in indicated currency: |
BP – British Pound
EC – Euro
MP – Mexican Peso
| (h) | | Foreign forward currency contracts outstanding at June 30, 2003: |
Type
| | Currency
| | Principal
Amount
Covered by
Contract
| | Settlement
Month
| | Unrealized
Appreciation
| | Unrealized
(Depreciation)
| | | Net Unrealized
Appreciation/
(Depreciation)
| |
Sell | | EC | | 3,003 | | 07/2003 | | $ | 14 | | $ | 0 | | | $ | 14 | |
Buy | | MP | | 8,082 | | 09/2003 | | | 68 | | | 0 | | | | 68 | |
Sell | | MP | | 8,082 | | 09/2003 | | | 0 | | | (51 | ) | | | (51 | ) |
| | | | | | | | |
|
| |
|
|
| |
|
|
|
| | | | | | | | | $ | 82 | | $ | (51 | ) | | $ | 31 | |
| | | | | | | | |
|
| |
|
|
| |
|
|
|
| (i) | | Indicates a fair valued security which has not been valued utilizing an independent quote and which is valued pursuant to guidelines established by the Trustees. The aggregate value of fair valued securities is $2,978, which is 0.17% of net assets. |
10 | | Semi-Annual Report | 6.30.03 | | | See accompanying notes |
Notes to Financial Statements
June 30, 2003 (Unaudited)
1. Organization
The Total Return Portfolio (the “Portfolio”) is a series of the PIMCO Variable Insurance Trust (the “Trust”). The Trust is registered under the Investment Company Act of 1940 (the “Act”), as amended, as an open-end investment company organized as a Delaware business trust on October 3, 1997. The Trust may offer up to two classes of shares: Institutional and Administrative. Each share class has identical voting rights (except that shareholders of a class have exclusive voting rights regarding any matter relating solely to that class of shares). Information presented in these financial statements pertains to the Institutional Class of the Trust. Certain detailed financial information for the Administrative Class is provided separately and is available upon request. The Trust is designed to be used as an investment vehicle by Separate Accounts of insurance companies that fund variable annuity contracts and variable life insurance policies and by qualified pension and retirement plans. The Portfolio commenced operations on December 31, 1997.
2. Significant Accounting Policies
The following is a summary of significant accounting policies consistently followed by the Trust in the preparation of its financial statements in conformity with accounting principles generally accepted in the United States of America. The preparation of financial statements in accordance with accounting principles generally accepted in the United States of America requires management to make estimates and assumptions that affect the reported amounts and disclosures in the financial statements. Actual results could differ from those estimates.
Security Valuation. Portfolio securities and other financial instruments for which market quotations are readily available are stated at market value. Market value is determined at the close of regular trading (normally, 4:00 p.m., Eastern Time) on the New York Stock Exchange on each day the New York Stock Exchange is open, or if no sales are reported, as is the case for most securities traded over-the-counter, the mean between representative bid and asked quotations obtained from a quotation reporting system or from established market makers. Fixed income securities, including those to be purchased under firm commitment agreements, are normally valued on the basis of quotes obtained from brokers and dealers or pricing services. Short-term investments, which mature in 60 days or less are valued at amortized cost, which approximates market value. Certain fixed income securities for which daily market quotations are not readily available may be valued, pursuant to guidelines established by the Board of Trustees, with reference to fixed income securities whose prices are more readily obtainable. Prices may be obtained from independent pricing services which use information provided by market makers or estimates of market values obtained from yield data relating to investments or securities with similar characteristics. The prices used by the Portfolio may differ from the value that would be realized if the securities were sold and the differences could be material to the financial statements.
Securities Transactions and Investment Income. Securities transactions are recorded as of the trade date. Securities purchased or sold on a when-issued or delayed delivery basis may be settled a month or more after the trade date. Realized gains and losses from securities sold are recorded on the identified cost basis. Dividend income is recorded on the ex-dividend date, except certain dividends from foreign securities where the ex-dividend date may have passed, are recorded as soon as the Portfolio is informed of the ex-dividend date. Interest income, adjusted for the accretion of discounts and amortization of premiums, is recorded on the accrual basis. Paydowns gains and losses on mortgage- and asset-backed securities are recorded as adjustments to interest income in the Statement of Operations.
Dividends and Distributions to Shareholders. Dividends from net investment income, if any, are declared on each day the Trust is open for business and are distributed to shareholders monthly. All dividends are reinvested in additional shares of the Portfolio. Net realized capital gains earned by the Portfolio, if any, will be distributed no less frequently than once each year.
Income dividends and capital gain distributions are determined in accordance with income tax regulations which may differ from accounting principles generally accepted in the United States of America. These differences are primarily due to differing treatments for such items as wash sales, foreign currency transactions, net operating losses and capital loss carryforwards.
Distributions classified as a tax basis return of capital, if any, are reflected in the accompanying Statements of Changes in Net Assets and have been reclassified to paid in capital. In addition, other amounts have been reclassified between undistributed net investment income, accumulated undistributed net realized gains or losses and/or paid in capital to more appropriately conform financial accounting to tax characterizations of dividend distributions.
Foreign Currency. The accounting records of the Portfolio are maintained in U.S. dollars. The market values of foreign securities, currency holding and other assets and liabilities are translated into U.S. dollars based on the current exchange rates each business day. Fluctuations in the value of these assets and liabilities resulting from changes in exchange rates are recorded as unrealized foreign currency gains or losses. Realized gains or losses and unrealized appreciation (depreciation) on investment securities and income and expenses are translated on the respective dates of such transactions. The effect of changes in foreign currency exchange rates on investments in securities are not
6.30.03 | Semi-Annual Report | | 11 |
segregated in the Statement of Operations from the effects of changes in market prices of those securities, but are included with the net realized and unrealized gain or loss on investment securities.
Multiclass Operations. Each class offered by the Trust has equal rights as to assets. Income, non-class specific expenses, and realized and unrealized capital gains and losses are allocated to each class of shares based on the relative net assets of each class.
Federal Income Taxes. The Portfolio intends to qualify as a regulated investment company and distribute all of its taxable income and net realized gains, if applicable, to shareholders. Accordingly, no provision for Federal income taxes has been made.
Financing Transactions. The Portfolio may enter into financing transactions consisting of the sale by the Portfolio of securities, together with a commitment to repurchase similar securities at a future date. The difference between the selling price and the future purchase price is an adjustment to interest income in the Statement of Operations. If the counterparty to whom the Portfolio sells the security becomes insolvent, the Portfolio’s right to repurchase the security may be restricted; the value of the security may change over the term of the financing transaction; and the return earned by the Portfolio with the proceeds of a financing transaction may not exceed transaction costs. The Portfolio will designate assets determined to be liquid by PIMCO or otherwise cover its obligations under financing transactions.
Futures Contracts. The Portfolio is authorized to enter into futures contracts. The Portfolio may use futures contracts to manage its exposure to the securities markets or to movements in interest rates and currency values. The primary risks associated with the use of futures contracts are imperfect correlation between the change in market value of the securities held by the Portfolio and the prices of futures contracts, the possibility of an illiquid market, and the inability of the counterparty to meet the terms of the contract. Futures contracts are valued based upon their quoted daily settlement prices. Upon entering into a futures contract, the Portfolio may be required to deposit with its custodian, in a segregated account in the name of the futures broker, an amount of cash or U.S. Government and Agency Obligations in accordance with the initial margin requirements of the broker or exchange. Futures contracts are marked to market daily and an appropriate payable or receivable for the change in value (“variation margin”) is recorded by the Portfolio. Gains or losses are recognized but not considered realized until the contracts expire or are closed. Futures contracts involve, to varying degrees, risk of loss in excess of the variation margin disclosed in the Statement of Assets and Liabilities.
Options Contracts. The Portfolio may write call and put options on futures, securities or currencies it owns or in which it may invest. Writing put options tends to increase the Portfolio’s exposure to the underlying instrument. Writing call options tends to decrease the Portfolio’s exposure to the underlying instrument. When the Portfolio writes a call or put option, an amount equal to the premium received is recorded as a liability and subsequently marked to market to reflect the current value of the option written. Payment received or made, if any, from writing options with premiums to be determined on a future date are reflected as such on the Statement of Assets and Liabilities. Premiums received from writing options which expire are treated as realized gains. Premiums received from writing options which are exercised or closed are added to the proceeds or offset against amounts paid on the underlying future, security or currency transaction to determine the realized gain or loss. The Portfolio as a writer of an option has no control over whether the underlying future, security or currency may be sold (call) or purchased (put) and as a result bears the market risk of an unfavorable change in the price of the future, security or currency underlying the written option. There is the risk the Portfolio may not be able to enter into a closing transaction because of an illiquid market.
The Portfolio may also purchase put and call options. Purchasing call options tends to increase the Portfolio’s exposure to the underlying instrument. Purchasing put options tends to decrease the Portfolio’s exposure to the underlying instrument. The Portfolio pays a premium which is included in the Portfolio’s Statement of Assets and Liabilities as an investment and subsequently marked to market to reflect the current value of the option. Premiums paid for purchasing options which expire are treated as realized losses. The risk associated with purchasing put and call options is limited to the premium paid. Premiums paid for purchasing options which are exercised or closed are added to the amounts paid or offset against the proceeds on the underlying future, security or currency transaction to determine the realized gain or loss.
Forward Currency Transactions. The Portfolio may enter into forward currency contracts and forward cross currency contracts in connection with settling planned purchases or sales of securities or to hedge the currency exposure associated with some or all of the Portfolio’s securities. A forward currency contract is an agreement between two parties to buy and sell a currency at a set price on a future date. The market value of a forward currency contract fluctuates with changes in forward currency exchange rates. Forward currency contracts are marked to market daily and the change in value is recorded by the Portfolio as an unrealized gain or loss. Realized gains or losses equal to the difference between the value of the contract at the time it was opened and the value at the time it was closed are recorded upon delivery or receipt of the currency or, if a
12 | | Semi-Annual Report | 6.30.03 |
forward currency contract is offset by entering into another forward currency contract with the same broker, upon settlement of the net gain or loss. These contracts may involve market risk in excess of the unrealized gain or loss reflected in the Portfolio’s Statement of Assets and Liabilities. In addition, the Portfolio could be exposed to risk if the counterparties are unable to meet the terms of the contracts or if the value of the currency changes unfavorably to the U.S. dollar.
Swap Agreements. The Portfolio may invest in swap agreements. A swap is an agreement to exchange the return generated by one instrument for the return generated by another instrument. The Portfolio may enter into interest rate, total return, forward swap spread lock and credit default swap agreements to manage its exposure to interest rates and credit risk. Interest rate swap agreements involve the exchange by the Portfolio with another party of their respective commitments to pay or receive interest, e.g., an exchange of floating rate payments for fixed rate payments with respect to a notional amount of principal. Total return swap agreements involve commitments to pay interest in exchange for a market-linked return, both based on notional amounts. To the extent the total return of the security or index underlying the transaction exceeds or falls short of the offsetting interest rate obligation, the Portfolio will receive a payment from or make a payment to the counterparty. Forward spread lock swap agreements involve commitments to pay or receive a settlement amount calculated as the difference between the swap spread and a fixed spread, multiplied by the notional amount times the duration of the swap. The swap spread is the difference between the benchmark swap rate (market rate) and the specific Treasury rate. In a credit default swap, one party makes a stream of payments to another party in exchange for the right to receive a specified return in the event of a default by a third party, typically corporate issues or sovereign issues of an emerging country, on its obligation. The Portfolio may use credit default swaps to provide a measure of protection against defaults of sovereign issuers (i.e., to reduce risk where the Portfolio owns or has exposure to the sovereign issuer) or to take an active long or short position with respect to the likelihood of a particular issuer’s default. Swaps are marked to market daily based upon quotations from market makers and vendors and the change in value, if any, is recorded as unrealized gain or loss in the Statement of Operations. Payments received or made at the beginning of the measurement period are reflected as such on the Statement of Assets and Liabilities. A liquidation payment received or made at the termination of the swap is recorded as realized gain or loss in the Statement of Operations. Net periodic payments are included as part of miscellaneous income on the Statement of Operations. Entering into these agreements involves, to varying degrees, elements of credit, market and documentation risk in excess of the amounts recognized on the Statement of Assets and Liabilities. Such risks involve the possibility that there will be no liquid market for these agreements, that the counterparty to the agreements may default on its obligation to perform or disagree as to the meaning of contractual terms in the agreements, and that there may be unfavorable changes in interest rates.
Delayed Delivery Transactions. The Portfolio may purchase or sell securities on a when-issued or delayed delivery basis. These transactions involve a commitment by the Portfolio to purchase or sell securities for a predetermined price or yield, with payment and delivery taking place beyond the customary settlement period. When delayed delivery purchases are outstanding, the Portfolio will set aside and maintain until the settlement date in a segregated account, liquid assets in an amount sufficient to meet the purchase price. When purchasing a security on a delayed delivery basis, the Portfolio assumes the rights and risks of ownership of the security, including the risk of price and yield fluctuations, and takes such fluctuations into account when determining its net asset value. The Portfolio may dispose of or renegotiate a delayed delivery transaction after it is entered into, and may sell when-issued securities before they are delivered, which may result in a capital gain or loss. When the Portfolio has sold a security on a delayed delivery basis, the Portfolio does not participate in future gains and losses with respect to the security.
Inflation-Indexed Bonds. Inflation-indexed bonds are fixed income securities whose principal value is periodically adjusted to the rate of inflation. The interest rate on these bonds is generally fixed at issuance at a rate lower than typical bonds. Over the life of an inflation-indexed bond, however, interest will be paid based on a principal value, which is adjusted for inflation. Any increase in the principal amount of an inflation-indexed bond will be included as interest income in the Statement of Operations, even though investors do not receive their principal until maturity.
Repurchase Agreements. The Portfolio may engage in repurchase transactions. Under the terms of a typical repurchase agreement, the Portfolio takes possession of an underlying debt obligation subject to an obligation of the seller to repurchase, and the Portfolio to resell, the obligation at an agreed-upon price and time. The market value of the collateral must be equal at all times to the total amount of the repurchase obligations, including interest. Generally, in the event of counterparty default, the Portfolio has the right to use the collateral to offset losses incurred.
6.30.03 | Semi-Annual Report | | 13 |
3. Fees, Expenses, and Related Party Transactions
Investment Advisory Fee. Pacific Investment Management Company LLC (PIMCO) is a majority owned subsidiary partnership of Allianz Dresdner Asset Management of America L.P. (formerly PIMCO Advisors L.P.) and serves as investment adviser (the “Adviser”) to the Trust, pursuant to an investment advisory contract. The Adviser receives a monthly fee at an annual rate based on average daily net assets of the Portfolio. The Advisory Fee is charged at an annual rate of 0.25%.
Administration Fee. PIMCO serves as administrator (the “Administrator”) and provides administrative services to the Trust for which it receives a monthly administrative fee based on average daily net assets of the Portfolio. The Administration Fee is charged at the annual rate of 0.25%.
Servicing Fee. PIMCO Advisors Distributors LLC (“PAD”), is an indirect wholly-owned subsidiary of Allianz Dresdner Asset Management of America L.P. and serves as the distributor of the Trust’s shares. The Trust is permitted to reimburse PAD on a quarterly basis, out of the Administrative Class assets of the Portfolio in the amount of 0.15% on an annual basis of the average daily net assets of that class, for payments made to financial intermediaries that provide services in connection with the distribution of shares or administration of plans or programs that use Portfolio shares as their funding medium. The effective rate paid to PAD during the current fiscal year is 0.15%.
Expenses. The Portfolio is responsible for the following expenses: (i) salaries and other compensation of any of the Trust’s executive officers and employees who are not officers, directors, stockholders or employees of PIMCO or its subsidiaries or affiliates; (ii) taxes and governmental fees; (iii) brokerage fees and commissions and other portfolio transaction expenses; (iv) the cost of borrowing money, including interest expense; (v) fees and expenses of the Trustees who are not “interested persons” of PIMCO or the Trust, and any counsel retained exclusively for their benefit; (vi) extraordinary expenses, including costs of litigation and indemnification expenses; (vii) organization expenses and (viii) any expenses allocated or allocable to a specific class of shares, which include service fees payable with respect to the Administrative Class shares and may include certain other expenses as permitted by the Trust’s Multiple Class Plan adopted pursuant to Rule 18f-3 under the Act and subject to review and approval by the Trustees. The ratio of expenses to average net assets per share class, as disclosed in the Financial Highlights, may differ from the annual Portfolio operating expenses per share class as disclosed in the Prospectus for the reasons set forth above. PIMCO has agreed to waive a portion of its administrative fees to the extent that the payment of the Portfolio’s pro rata share of Trustees’ fees causes the actual expense ratio to rise above the rates disclosed in the current prospectus plus 0.49 basis points as set forth below (calculated as a percentage of the Portfolio’s average daily net assets attributable to each class):
| | | Institutional
Class
| | | Administrative
Class
| |
Total Return Portfolio | | 0.50 | % | | 0.65 | % |
PIMCO may be reimbursed for these waived amounts in future periods. The Trust pays no compensation directly to any Trustee or any other officer who is affiliated with the Administrator, all of whom receive renumeration for their services to the Trust from the Administrator or its affiliates.
Each unaffiliated Trustee receives an annual retainer of $4,000, plus $1,500 for each Board of Trustees meeting attended in person and $250 for each meeting attended telephonically, plus reimbursement of related expenses. In addition, each committee chair receives an additional annual retainer of $500. These expenses are allocated on a pro-rata basis to each Portfolio of the Trust according to its respective net assets.
Organization Expenses. Costs incurred in connection with the organization of the Portfolio and its initial registration are amortized on a straight-line basis over a five-year period from the Portfolio’s commencement of operations.
4. Purchases and Sales of Securities
Purchases and sales of securities (excluding short-term investments) for the period ended June 30, 2003 were as follows (amounts in thousands):
| | | U.S Government/Agency
| | All Other
|
| | | Purchases
| | Sales
| | Purchases
| | Sales
|
Total Return Portfolio | | $ | 1,291,505 | | $ | 1,090,547 | | $ | 209,250 | | $ | 97,856 |
5. Transactions in Written Call and Put Options
Transactions in written call and put options were as follows (amounts in thousands):
| | | Total Return Portfolio
| |
| | | | | Premium
| |
Balance at 12/31/2002 | | | | $ | 2,008 | |
Sales | | | | | 3,442 | |
Closing Buys | | | | | (417 | ) |
Expirations | | | | | (960 | ) |
Exercised | | | | | 0 | |
| | | | |
|
|
|
Balance at 06/30/2003 | | | | $ | 4,073 | |
| | | | |
|
|
|
14 | | Semi-Annual Report | 6.30.03 |
6. Federal Income Tax Matters
At June 30, 2003, the aggregate cost of investments was the same for federal income tax and financial statement purposes. The net unrealized appreciation (depreciation) of investments securities for federal income tax purposes is as follows (amounts in thousands):
| | | Aggregate Gross
Unrealized
Appreciation
| | Aggregate Gross Unrealized
(Depreciation)
| | | Net Unrealized
Appreciation
|
Total Return Portfolio | | $ | 38,587 | | $ | (5,088 | ) | | $ | 33,499 |
7. Shares of Beneficial Interest
The Trust may issue an unlimited number of shares of beneficial interest with a $.0001 par value. Changes in shares of beneficial interest were as follows (shares and amounts in thousands):
| | | Total Return Portfolio
| |
| | | Six Months Ended
06/30/2003 | | | Year Ended 12/31/2002 | |
| | | Shares
| | | Amount
| | | Shares
| | | Amount
| |
Receipts for shares sold | | | | | | | | | | | | | | |
Institutional Class | | 5,488 | | | $ | 56,936 | | | 1,882 | | | $ | 18,993 | |
Administrative Class | | 51,939 | | | | 538,861 | | | 93,895 | | | | 946,200 | |
Issued as reinvestment of distributions | | | | | | | | | | | | | | |
Institutional Class | | 102 | | | | 1,066 | | | 211 | | | | 2,129 | |
Administrative Class | | 1,760 | | | | 18,310 | | | 3,662 | | | | 37,015 | |
Cost of shares redeemed | | | | | | | | | | | | | | |
Institutional Class | | (3,089 | ) | | | (32,059 | ) | | (1,106 | ) | | | (11,077 | ) |
Administrative Class | | (8,269 | ) | | | (85,613 | ) | | (17,705 | ) | | | (178,833 | ) |
| | |
|
| |
|
|
| |
|
| |
|
|
|
Net increase resulting from Portfolio share transactions | | 47,931 | | | $ | 497,501 | | | 80,839 | | | $ | 814,427 | |
| | |
|
| |
|
|
| |
|
| |
|
|
|
The following schedule shows the number of shareholders each owning 5% or more of the Portfolio and the total percentage of the Portfolio held by such shareholders:
| | | Number
| | % of Portfolio
Held
|
Total Return Portfolio | | | | |
Institutional Class | | 1 | | 28 |
Administrative Class | | 5 | | 70 |
6.30.03 | Semi-Annual Report | | 15 |
Trustees and Officers
Brent R. Harris, Chairman and Trustee
R. Wesley Burns, President and Trustee
E. Philip Cannon, Trustee
Vern O. Curtis, Trustee
J. Michael Hagan, Trustee
William J. Popejoy, Trustee
Garlin G. Flynn, Secretary
John P. Hardaway, Treasurer
Investment Adviser and Administrator
Pacific Investment Management Company LLC
840 Newport Center Drive
Newport Beach, California 92660
Transfer Agent
National Financial Data Services
330 W. 9th Street, 4th Floor
Kansas City, Missouri 64105
Custodian
State Street Bank & Trust Company
801 Pennsylvania
Kansas City, Missouri 64105
Counsel
Dechert LLP
1775 I Street, N.W.
Washington, D.C. 20006
Independent Accountants
PricewaterhouseCoopers LLP
1055 Broadway
Kansas City, Missouri 64105
PIMCO VARIABLE INSURANCE TRUST
This report is submitted for the general information of the shareholders of the PIMCO Variable Insurance Trust. It is not authorized for distribution to prospective investors unless accompanied or preceded by an effective prospectus for the PIMCO Variable Insurance Trust, which contains information covering its investment policies as well as other pertinent information.
All Funds distributed by PIMCO ADVISORS DISTRIBUTORS LLC, member NASD
840 NEWPORT CENTER DRIVE
NEWPORT BEACH, CA 92660
800.927.4648
WWW.PIMCOADVISORS.COM
WWW.PIMCO.COM
| |
Item 2. | | Code of Ethics—not applicable |
| |
Item 3. | | Audit Committee Financial Expert—not applicable |
| |
Item 4. | | Principal Accountant Fees and Services—not applicable |
| |
Item 5. | | Audit Committee of Listed Registrants—not applicable |
| |
Item 6. | | (Reserved) |
| |
Item 7. | | Disclosure of Proxy Voting Policies and Procedures for Closed-End Management Investment Companies—not applicable |
| |
Item 8. | | (Reserved) |
| |
Item 9. | | Controls and Procedures |
| | |
| | | (a) | | The Chairman of the Board, President and Treasurer have concluded that Pacific Select Fund’s disclosure controls and procedures (as defined in Rule 30a-3(c) under the Investment Company Act) provide reasonable assurances that material information relating to Pacific Select Fund is made known to them by the appropriate persons, based on their evaluation of these controls and procedures as of a date within 90 days of the filing of this report. |
| | |
| | | (b) | | There were no changes in Pacific Select Fund’s internal control over financial reporting that occurred during the Fund’s most recent fiscal half-year (the Fund’s second fiscal half-year in the case of an annual report) that have materially affected, or are reasonably likely to materially affect, the Fund’s internal control over financial reporting. |
| |
Item 10. | | Exhibits |
| | |
| | | (a) | | Not applicable |
| | |
| | | (b) | | Exhibit 99.CERT—Certifications pursuant to Section 302 of the Sarbanes-Oxley Act of 2002. |
| | |
| | | | | Exhibit 99.906CERT—Certifications pursuant to Section 906 of the Sarbanes-Oxley Act of 2002. |
Signatures
Pursuant to the requirements of the Securities Exchange Act of 1934 and the Investment Company Act of 1940, the registrant has duly caused this report to be signed on its behalf by the undersigned, thereunto duly authorized.
| PIMCO Variable Insurance Trust |
| |
By: | | /s/ R. WESLEY BURNS
|
| | | R. Wesley Burns |
| | | President |
| |
Date: | | August 29, 2003 |
Pursuant to the requirements of the Securities Exchange Act of 1934 and the Investment Company Act of 1940, this report has been signed below by the following persons on behalf of the registrant and in the capacities and on the dates indicated.
| |
By: | | /s/ R. WESLEY BURNS
|
| | | R. Wesley Burns |
| | | President |
| |
Date: | | August 29, 2003 |
| |
By: | | /s/ JOHN P. HARDAWAY
|
| | | John P. Hardaway |
| | | Treasurer |
| |
Date: | | August 29, 2003 |