UNITED STATES
SECURITIES AND EXCHANGE COMMISSION
Washington, D.C. 20549
FORM N-CSRS
CERTIFIED SHAREHOLDER REPORT OF REGISTERED MANAGEMENT
INVESTMENT COMPANIES
Investment Company Act file number: 811-08399
PIMCO Variable Insurance Trust
(Exact name of registrant as specified in charter)
840 Newport Center Drive, Newport Beach, CA 92660
(Address of principal executive offices)
John P. Hardaway
Treasurer
PIMCO Funds
840 Newport Center Drive
Newport Beach, CA 92660
(Name and address of agent for service)
Copies to:
Brendan C. Fox
Dechert LLP
1775 I Street, N.W.
Washington, D.C. 20006
Registrant’s telephone number, including area code: (866) 746-2606
Date of fiscal year end: December 31
Date of reporting period: January 1, 2006 - June 30, 2006
Form N-CSR is to be used by management investment companies to file reports with the Commission not later than 10 days after the transmission to stockholders of any report that is required to be transmitted to stockholders under Rule 30e-1 under the Investment Company Act of 1940 (17 CFR 270.30e-1). The Commission may use the information provided on Form N-CSR in its regulatory, disclosure review, inspection, and policymaking roles.
A registrant is required to disclose the information specified by Form N-CSR, and the Commission will make this information public. A registrant is not required to respond to the collection of information contained in Form N-CSR unless the Form displays a currently valid Office of Management and Budget (“OMB”) control number. Please direct comments concerning the accuracy of the information collection burden estimate and any suggestions for reducing the burden to Secretary, Securities and Exchange Commission, 450 Fifth Street, NW, Washington, DC 20549-0609. The OMB has reviewed this collection of information under the clearance requirements of 44 U.S.C. § 3507.
Item 1. Reports to Shareholders.
The following is a copy of the report transmitted to shareholders pursuant to Rule 30e-1 under the Act (17 CFR 270.30e-1).
| | • | | PIMCO Variable Insurance Trust All Asset Portfolio Administrative Class |
| | • | | PIMCO Variable Insurance Trust All Asset Portfolio Advisor Class |
| | • | | PIMCO Variable Insurance Trust All Asset Portfolio Class M |
| | • | | PIMCO Variable Insurance Trust CommodityRealReturn Strategy Portfolio Administrative Class |
| | • | | PIMCO Variable Insurance Trust CommodifyRealReturn Strategy Portfolio Advisor Class |
| | • | | PIMCO Variable Insurance Trust Emerging Markets Bond Portfolio Administrative Class |
| | • | | PIMCO Variable Insurance Trust Emerging Markets Bond Portfolio Advisor Class |
| | • | | PIMCO Variable Insurance Trust Foreign Bond Portfolio (U.S. Dollar-Hedged) Administrative Class |
| | • | | PIMCO Variable Insurance Trust Global Bond Portfolio (Unhedged) Administrative Class |
| | • | | PIMCO Variable Insurance Trust High Yield Portfolio Administrative Class |
| | • | | PIMCO Variable Insurance Trust High Yield Portfolio Institutional Class |
| | • | | PIMCO Variable Insurance Trust Long-Term U.S. Government Portfolio Administrative Class |
| | • | | PIMCO Variable Insurance Trust Long-Term U.S. Government Portfolio Institutional Class |
| | • | | PIMCO Variable Insurance Trust Low Duration Portfolio Administrative Class |
| | • | | PIMCO Variable Insurance Trust Low Duration Portfolio Institutional Class |
| | • | | PIMCO Variable Insurance Trust Money Market Portfolio Administrative Class |
| | • | | PIMCO Variable Insurance Trust Money Market Portfolio Institutional Class |
| | • | | PIMCO Variable Insurance Trust Real Return Portfolio Administrative Class |
| | • | | PIMCO Variable Insurance Trust Real Return Portfolio Institutional Class |
| | • | | PIMCO Variable Insurance Trust Real Return Portfolio Advisor Class |
| | • | | PIMCO Variable Insurance Trust RealEstateRealReturn Strategy Portfolio Administrative Class |
| | • | | PIMCO Variable Insurance Trust Short-Term Portfolio Administrative Class |
| | • | | PIMCO Variable Insurance Trust Short-Term Portfolio Institutional Class |
| | • | | PIMCO Variable Insurance Trust StocksPLUS® Growth and Income Portfolio Administrative Class |
| | • | | PIMCO Variable Insurance Trust StocksPLUS® Growth and Income Portfolio Institutional Class |
| | • | | PIMCO Variable Insurance Trust StocksPLUS® Total Return Portfolio Administrative Class |
| | • | | PIMCO Variable Insurance Trust Total Return Portfolio Administrative Class |
| | • | | PIMCO Variable Insurance Trust Total Return Portfolio Institutional Class |
| | • | | PIMCO Variable Insurance Trust Total Return Portfolio Advisor Class |
| | • | | PIMCO Variable Insurance Trust Total Return Portfolio II Administrative Class |
| | • | | PIMCO Variable Insurance Trust Total Return Portfolio II Institutional Class |
| | • | | PIMCO Variable Insurance Trust Combined Portfolios |
| | • | | All Asset Portfolio Institutional Class |
| | • | | Foreign Bond Portfolio (U.S. Dollar-Hedged) Institutional Class |
| | • | | Global Bond Portfolio (Unhedged) Institutional Class |
| | • | | High Yield Portfolio Advisor Class |
| | • | | Low Duration Portfolio Advisor Class |

Share Class Administrative
Semiannual Report June 30, 2006
PIMCO Variable Insurance Trust
All Asset Portfolio
Table of Contents
This material is authorized for use only when preceded or accompanied by the current PIMCO Variable Insurance Trust (the “Trust”) prospectus. Investors should consider the investment objectives, risks, charges and expenses of this Trust carefully before investing. Ask your financial professional to explain all charges that may apply. This and other information is contained in the Trust’s prospectus. The variable product prospectus may be obtained by contacting your Investment Consultant. Please read the Trust and variable product prospectus carefully before you invest or send money.
Chairman’s Letter
Dear PIMCO Variable Insurance Trust Shareholder:
It is our pleasure to present to you the semiannual report for the PIMCO Variable Insurance Trust covering the six-month period ended June 30, 2006.
Highlights of the global bond markets during the six-month period included:
| | n | | Most fixed-income sectors lost ground during the first half of 2006, as concern about accelerating inflation and central bank tightening pushed interest rates higher worldwide. The benchmark Lehman Brothers Aggregate Bond Index (which includes Treasury, Investment-Grade Corporate, and Residential Mortgage-Backed Securities) returned -0.72% for the first six months of the year. On June 30, the benchmark ten-year Treasury yielded 5.14%, 0.75% higher than at the start of the year. The U.S. yield curve remained flat as shorter-maturity yields rose by a comparable amount. |
| | n | | The Federal Reserve tightened four times during the reporting period, bringing the Federal Funds Rate to 5.25%. The increase near the end of the period was the Federal Reserve’s 17th consecutive rate hike since the start of its tightening cycle in 2004. The Federal Reserve was not alone, as central banks in Europe, India, and China tightened credit in unison for the first time since 2000. The Bank of Japan, whose zero-interest-rate policy has flooded global markets with liquidity, looked set to reverse this policy in the coming months. |
In these pages please find a more complete Portfolio review as it relates to financial-market activities, as well as details about total-return investment performance for the six-month reporting period. Thank you for the trust you have placed in us. We will continue to work diligently to meet your investment needs.
Sincerely,

Brent R. Harris
Chairman, PIMCO Variable Insurance Trust
July 31, 2006
| | | | | | |
| | | Semiannual Report | | June 30, 2006 | | 1 |
Important Information About the Portfolio
PIMCO Variable Insurance Trust (the “Trust”) is an open-end management investment company currently consisting of nineteen separate investment portfolios, including the All Asset Portfolio (the “Portfolio”). The Portfolio is only available as a funding vehicle under variable life insurance policies or variable annuity contracts issued by insurance companies (“Variable Contracts”). Individuals may not purchase shares of the Portfolio directly. Shares of the Portfolio also may be sold to qualified pension and retirement plans outside of the separate account context.
The Portfolio is a “fund of funds,” which is a term used to describe mutual funds that pursue their investment objective by investing in other mutual funds instead of investing directly in stocks or bonds of other issuers. Under normal circumstances, the Portfolio invests substantially all of its assets in Institutional Class shares of PIMCO Funds, an affiliated open-end investment company, except the All Asset and All Asset All Authority Funds (“Underlying Funds”).
Among the principal risks of investing in the Portfolio are allocation risk, Underlying Fund risk and issuer non-diversification risk. The Portfolio also is indirectly subject to the risks of the Underlying Funds, which may include, but are not limited to, the following: interest rate risk, credit risk, high yield risk, market risk, issuer risk, variable dividends risk, liquidity risk, derivatives risk, commodity risk, equity risk, mortgage risk, non-U.S. investment risk, real estate risk, emerging markets risk, currency risk, issuer non-diversification risk, leveraging risk, small company risk, management risk, California state specific risk, New York state specific risk, tax risk and index risk. A complete description of these risks is contained in the Portfolio’s prospectus. An Underlying Fund may use derivative instruments for hedging purposes or as part of an investment strategy. Use of these instruments may involve certain costs and risks such as liquidity risk, interest rate risk, market risk, credit risk, management risk and the risk that the Underlying Fund could not close out a position when it would be most advantageous to do so. An Underlying Fund investing in derivatives could lose more than the principal amount invested in these instruments. Investing in non-U.S. securities may entail risk due to non-U.S. economic and political developments; this risk may be increased when investing in emerging markets.
The cost of investing in the Portfolio will generally be higher than the cost of investing in a mutual fund that invests directly in individual stocks and bonds. By investing in the Portfolio, an investor will indirectly bear fees and expenses charged by the Underlying Funds in addition to the Portfolio’s direct fees and expenses.
On the performance summary page in this Semiannual Report, the Total Return Investment Performance table measures performance assuming that all dividend and capital gain distributions were reinvested.
An investment in the Portfolio is not a deposit of a bank and is not guaranteed or insured by the Federal Deposit Insurance Corporation or any other government agency. It is possible to lose money on investments in the Portfolio.
PIMCO has adopted written proxy voting policies and procedures (“Proxy Policy”) as required by Rule 206(4)-6 under the Investment Advisers Act of 1940. The Proxy Policy has been adopted by the Trust as the policies and procedures that PIMCO will use when voting proxies on behalf of the Portfolio. Copies of the written Proxy Policy and the factors that PIMCO may consider in determining how to vote proxies for the Portfolio, and information about how the Portfolio voted proxies relating to portfolio securities held during the most recent twelve-month period ended June 30, are available without charge, upon request, by calling the Trust at 1-866-746-2606 and on the Securities and Exchange Commission’s (“SEC”) website at http://www.sec.gov.
The Portfolio files its complete schedule of portfolio holdings with the SEC for the first and third quarters of each fiscal year on Form N-Q. A copy of the Trust’s Form N-Q is available on the SEC’s website at http://www.sec.gov and may be reviewed and copied at the SEC’s Public Reference Room in Washington D.C. Information on the operation of the Public Reference Room may be obtained by calling 1-800-SEC-0330.
PIMCO Variable Insurance Trust is distributed by Allianz Global Investors Distributors LLC, 2187 Atlantic Street, Stamford, CT 06902.
| | | | |
| 2 | | PIMCO Variable Insurance Trust | | |
The following disclosure provides important information regarding the Portfolio’s Expense Example (“Example” or “Expense Example”), which appears in this Semiannual Report. Please refer to this information when reviewing the Expense Example for the Portfolio.
Example
As a shareholder of the Portfolio, you incur two types of costs: (1) transaction costs and (2) ongoing costs, including advisory and administrative fees; distribution and/or service (12b-1) fees (Administrative Class, Advisor Class and Class M only); and other Portfolio expenses. The Example is intended to help you understand your ongoing costs (in dollars) of investing in the Portfolio and to compare these costs with the ongoing costs of investing in other mutual funds. The Expense Example does not reflect any fees or other expenses imposed by the Variable Contracts. If it did, the expenses reflected in the Expense Examples would be higher. The Example is based on an investment of $1,000 invested at the beginning of the period and held for the entire period indicated, which is from January 1, 2006 to June 30, 2006.
Actual Expenses
The information in the table under the heading “Actual Performance” provides information about actual account values and actual expenses. You may use the information in these columns, together with the amount you invested, to estimate the expenses that you paid over the period. Simply divide your account value by $1,000 (for example, an $8,600 account value divided by $1,000 = 8.60), then multiply the result by the number in the appropriate column for your share class, in the row titled “Expenses Paid During Period” to estimate the expenses you paid on your account during this period.
Hypothetical Example for Comparison Purposes
The information in the table under the heading “Hypothetical Performance (5% return before expenses)” provides information about hypothetical account values and hypothetical expenses based on the Portfolio’s actual expense ratio and an assumed rate of return of 5% per year before expenses, which is not the Portfolio’s actual return. The hypothetical account values and expenses may not be used to estimate the actual ending account balance or expenses you paid for the period. You may use this information to compare the ongoing costs of investing in the Portfolio and other portfolios. To do so, compare this 5% hypothetical example with the 5% hypothetical examples that appear in the shareholder reports of the other portfolios.
Please note that the expenses shown in the table are meant to highlight your ongoing costs only and do not reflect any transactional costs. Therefore, the information under the heading “Hypothetical Performance (5% return before expenses)” is useful in comparing ongoing costs only, and will not help you determine the relative total costs of owning different portfolios. In addition, if these transactional costs were included, your costs would have been higher.
The expense ratio may vary period to period because of various factors, such as an increase in expenses not covered by the advisory and administrative fees (such as expenses of the trustees and their counsel or litigation expense).
Portfolio Benchmarks
Lehman Brothers U.S. TIPS: 1-10 Year is an unmanaged index market comprised of U.S. Treasury Inflation Linked securities having a maturity of at least 1 year and less than 10 years. It is not possible to invest directly in such an unmanaged index.
The CPI + 500 Basis Points benchmark is created by adding 5% to the annual percentage change in the Consumer Price Index (“CPI”). This index reflects non-seasonally adjusted returns. The CPI is an unmanaged index representing the rate of inflation of the U.S. consumer prices as determined by the US Department of Labor Statistics. There can be no guarantee that the CPI or other indexes will reflect the exact level of inflation at any given time.
| | | | | | |
| | | Semiannual Report | | June 30, 2006 | | 3 |
| | | | |
| | |
| PIMCO All Asset Portfolio | | | | |
| | | | |
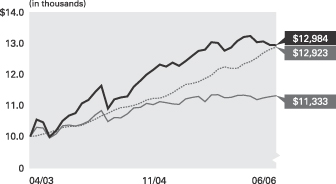
Cumulative Returns Through June 30, 2006
All Asset
Portfolio Lehman Brothers Consumer Price
Administrative U.S. TIPS: 1-10 Index + 500
Class Year Index Basis points
-------------- --------------- --------------
04/30/2003 $10,000 $10,000 $10,000
05/31/2003 10,550 10,296 10,025
06/30/2003 10,464 10,275 10,078
07/31/2003 9,991 9,949 10,131
08/31/2003 10,182 10,081 10,212
09/30/2003 10,511 10,351 10,288
10/31/2003 10,682 10,368 10,319
11/30/2003 10,763 10,337 10,334
12/31/2003 11,079 10,397 10,366
01/31/2004 11,192 10,496 10,460
02/29/2004 11,449 10,701 10,560
03/31/2004 11,661 10,845 10,672
04/30/2004 10,909 10,488 10,751
05/31/2004 11,208 10,618 10,859
06/30/2004 11,276 10,610 10,938
07/31/2004 11,307 10,742 10,966
08/31/2004 11,626 10,936 11,018
09/30/2004 11,818 10,946 11,087
10/31/2004 12,025 11,079 11,192
11/30/2004 12,181 11,040 11,244
12/31/2004 12,352 11,135 11,250
01/31/2005 12,288 11,106 11,320
02/28/2005 12,415 11,066 11,433
03/31/2005 12,312 11,046 11,570
04/30/2005 12,462 11,229 11,696
05/31/2005 12,633 11,278 11,733
06/30/2005 12,794 11,306 11,788
07/31/2005 12,837 11,141 11,891
08/31/2005 13,085 11,356 12,002
09/30/2005 13,055 11,367 12,198
10/31/2005 12,805 11,266 12,274
11/30/2005 12,903 11,277 12,226
12/31/2005 13,121 11,344 12,228
01/31/2006 13,254 11,352 12,372
02/28/2006 13,288 11,320 12,448
03/31/2006 13,080 11,205 12,569
04/30/2006 13,102 11,262 12,728
05/31/2006 12,990 11,299 12,845
06/30/2006 12,984 11,333 12,923
$10,000 invested at the beginning of the first full month following the inception date of the Portfolio’s Administrative Class.
PIMCO Funds Allocation‡
| | |
Real Return Asset | | 28.4% |
Real Return | | 18.1% |
Developing Local Markets | | 8.5% |
Floating Income | | 8.3% |
Long-Term U.S. Government | | 7.4% |
International StocksPLUS® TR Strategy | | 6.0% |
Emerging Markets Bond | | 5.6% |
Other | | 17.7% |
| | ‡ | % of Total Investments as of June 30, 2006 |
| | | | | | | | | | |
| Average Annual Total Return for the period ended June 30, 2006 |
| | | | | | | 6 Months* | | 1 Year | | Since
Inception
(04/30/03) |
| | |
| | PIMCO All Asset Portfolio Administrative Class | | -1.05% | | 1.48% | | 8.59% |
| | |
| | Lehman Brothers U.S. TIPS 1-10 Year Index | | -0.09% | | 0.24% | | 4.03% |
| | | ------ | | Consumer Price Index + 500 Basis points | | 5.69% | | 9.64% | | 8.43% |
All Portfolio returns are net of fees and expenses.
* Cumulative return.
Past performance is no guarantee of future results. The performance quoted represents past performance. Investment return and principal value will fluctuate so the Portfolio shares, when redeemed, may be worth more or less than their original cost. The Portfolio’s performance does not reflect the deduction of additional charges and expenses imposed in connection with investing in Variable Contracts, which will reduce returns. Current performance may be lower or higher than the performance data quoted. Performance data current to the most recent month-end is available by calling (800) 927-4648.
| | | | | | | | | | |
| Expense Example | | | | Actual Performance | | | | Hypothetical Performance |
| | | | | | | | | (5% return before expenses) |
Beginning Account Value (01/01/06) | | | | $ | 1,000.00 | | | | $ | 1,000.00 |
Ending Account Value (06/30/06) | | | | $ | 989.50 | | | | $ | 1,021.82 |
Expenses Paid During Period† | | | | $ | 2.96 | | | | $ | 3.01 |
† Expenses are equal to the Portfolio’s Administrative Class annualized expense ratio of 0.60%, multiplied by the average account value over the period, multiplied by 181/365 (to reflect the one-half year period). The expense ratio excludes the expenses of the Underlying Funds, which based upon the allocation of the Portfolio’s assets among the Underlying Funds are indirectly borne by the shareholders of the Portfolio. The Underlying Fund Expenses for the Portfolio are estimated at 0.63%. Overall fees and expenses of investing in the Portfolio will be higher because the example does not reflect Variable Contract fees and expenses.
Please refer to page 3 herein for a description of the Portfolio’s benchmark and an explanation of the information presented in the above Expense Example.
Portfolio Insights
| » | | The PIMCO All Asset Portfolio seeks to achieve its investment objective by investing under normal circumstances substantially all of its assets in Institutional Class Shares of the Underlying Funds (i.e., any of the PIMCO Funds, except the All Asset and All Asset All Authority Funds). |
| » | | Significant exposure to the Treasury Inflation-Protected Securities (“TIPS”) asset class detracted significantly from tactical asset allocation alpha due to the asset class, particularly longer dated TIPS, posting negative returns. |
| » | | Less than optimal exposure to commodities detracted from performance, as the Dow Jones AIG Commodity Index returned 3.58% over the period. |
| » | | Less than optimal exposure to Real Estate Investment Trusts (“REITs”) detracted from performance, as the Dow Jones Wilshire REIT Index gained 14.40% for the period. |
| » | | Significant exposure to lower duration instruments was positive for performance, as lower duration assets tend to outperform assets with longer duration in a rising interest rate environment. Exposure to the Floating Rate Income Fund provided positive returns. |
| » | | Significant exposure to the Developing Local Markets Fund and emerging market currencies added to performance with the fund returning 4.34%. |
| » | | Exposure to the High Yield Fund was positive due to coupon selection providing solid returns for the period. |
| | | | |
| 4 | | PIMCO Variable Insurance Trust | | |
| | |
| |
| Financial Highlights All Asset Portfolio | | |
| | | | | | | | | | | | | | | | |
| Selected Per Share Data for the Year or Period Ended: | | 06/30/2006+ | | | 12/31/2005 | | | 12/31/2004 | | | 04/30/2003-12/31/2003 | |
| | | | |
Administrative Class | | | | | | | | | | | | | | | | |
| Net asset value beginning of period | | $ | 11.81 | | | $ | 11.62 | | | $ | 10.77 | | | $ | 10.00 | |
| Net investment income (a) | | | 0.23 | | | | 0.83 | | | | 1.50 | | | | 0.53 | |
| Net realized/unrealized gain (loss) on investments (a) | | | (0.35 | ) | | | (0.11 | ) | | | (0.27 | ) | | | 0.54 | |
| Total income (loss) from investment operations | | | (0.12 | ) | | | 0.72 | | | | 1.23 | | | | 1.07 | |
| Dividends from net investment income | | | (0.24 | ) | | | (0.49 | ) | | | (0.37 | ) | | | (0.30 | ) |
| Distributions from net realized capital gains | | | 0.00 | | | | (0.04 | ) | | | (0.01 | ) | | | 0.00 | |
| Total distributions | | | (0.24 | ) | | | (0.53 | ) | | | (0.38 | ) | | | (0.30 | ) |
| Net asset value end of period | | $ | 11.45 | | | $ | 11.81 | | | $ | 11.62 | | | $ | 10.77 | |
| Total return | | | (1.05 | )% | | | 6.23 | % | | | 11.49 | % | | | 10.79 | % |
| Net assets end of period (000s) | | $ | 233,824 | | | $ | 251,482 | | | $ | 102,183 | | | $ | 1,017 | |
| Ratio of expenses to average net assets | | | 0.60 | %* | | | 0.59 | %(c)(d) | | | 0.57 | %(c)(d) | | | 0.60 | %*(b)(c) |
| Ratio of net investment income to average net assets | | | 3.89 | %* | | | 6.98 | % | | | 13.02 | % | | | 7.56 | %* |
| Portfolio turnover rate | | | 33 | % | | | 75 | % | | | 93 | % | | | 136 | % |
+ Unaudited
* Annualized
(a) Per share amounts based on average number of shares outstanding during the period.
(b) If the investment manager had not reimbursed expenses, the ratio of expenses to average net assets would have been 10.92%.
(c) Ratio of expenses to average net assets excluding underlying Funds’ expenses in which the Portfolio invests.
(d) If the investment manager had not reimbursed expenses, the ratio of expenses to average net assets would have been 0.60%.
| | | | | | |
| See Accompanying Notes | | Semiannual Report | | June 30, 2006 | | 5 |
| | |
| |
| Statement of Assets and Liabilities All Asset Portfolio | | |
| | | | |
| (Amounts in thousands, except per share amounts) | | June 30, 2006
(Unaudited) | |
| |
Assets: | | | | |
Investments in Affiliates, at value | | $ | 364,075 | |
Cash | | | 1 | |
Receivable for Portfolio shares sold | | | 2,020 | |
Interest and dividends receivable from Affiliates | | | 1,899 | |
| | | | 367,995 | |
| |
Liabilities: | | | | |
Payable for investments in Affiliates purchased | | $ | 3,433 | |
Payable for Portfolio shares redeemed | | | 228 | |
Accrued investment advisory fee | | | 62 | |
Accrued administration fee | | | 77 | |
Accrued servicing fee | | | 62 | |
Recoupment payable to Manager | | | 5 | |
| | | | 3,867 | |
| |
Net Assets | | $ | 364,128 | |
| |
Net Assets Consist of: | | | | |
Paid in capital | | $ | 368,395 | |
Undistributed net investment income | | | 6,814 | |
Accumulated undistributed net realized (loss) | | | (1,686 | ) |
Net unrealized (depreciation) | | | (9,395 | ) |
| | | $ | 364,128 | |
| |
Net Assets: | | | | |
Institutional Class | | $ | 10 | |
Administrative Class | | | 233,824 | |
Advisor Class | | | 65,231 | |
Class M | | | 65,063 | |
| |
Shares Issued and Outstanding: | | | | |
Institutional Class | | | 1 | |
Administrative Class | | | 20,415 | |
Advisor Class | | | 5,693 | |
Class M | | | 5,684 | |
| |
Net Asset Value and Redemption Price Per Share (Net Assets Per Share Outstanding) | | | | |
Institutional Class | | $ | 11.45 | |
Administrative Class | | | 11.45 | |
Advisor Class | | | 11.45 | |
Class M | | | 11.44 | |
| |
Cost of Investments in Affiliates Owned | | $ | 373,469 | |
| | | | |
| 6 | | PIMCO Variable Insurance Trust | | See Accompanying Notes |
| | |
| |
| Statement of Operations All Asset Portfolio | | |
| | | | |
| (Amounts in Thousands) | | Six Months Ended
June 30, 2006
(Unaudited) | |
| |
Investment Income: | | | | |
Interest | | $ | 14 | |
Dividends from Affiliate investments | | | 7,717 | |
Total Income | | | 7,731 | |
| |
Expenses: | | | | |
Investment advisory fees | | | 337 | |
Administration fees | | | 422 | |
Servicing fees – Administrative Class | | | 190 | |
Distribution and/or servicing fees – Advisor Class | | | 21 | |
Distribution and/or servicing fees – Class M | | | 152 | |
Interest expense | | | 1 | |
Miscellaneous expense | | | 10 | |
Total Expenses | | | 1,133 | |
| |
Net Investment Income | | | 6,598 | |
| |
Net Realized and Unrealized (Loss): | | | | |
Net realized (loss) on Affiliate investments | | | (3,155 | ) |
Net change in unrealized (depreciation) on Affiliate investments | | | (7,231 | ) |
Net (Loss) | | | (10,386 | ) |
| |
Net (Decrease) in Net Assets Resulting from Operations | | $ | (3,788 | ) |
| | | | | | |
| See Accompanying Notes | | Semiannual Report | | June 30, 2006 | | 7 |
| | |
| |
| Statements of Changes in Net Assets All Asset Portfolio | | |
| | | | | | | | |
| (Amounts In Thousands) | | Six Months Ended
June 30, 2006
(Unaudited) | | | Year Ended
December 31, 2005 | |
| | |
Increase (Decrease) in Net Assets from: | | | | | | | | |
| | |
Operations: | | | | | | | | |
Net investment income | | $ | 6,598 | | | $ | 16,918 | |
Net realized gain (loss) on Affiliate investments | | | (3,155 | ) | | | 1,306 | |
Net capital (loss) distributions received from Underlying Funds | | | 0 | | | | 712 | |
Net change in unrealized (depreciation) on Affiliate investments | | | (7,231 | ) | | | (3,656 | ) |
Net increase (decrease) resulting from operations | | | (3,788 | ) | | | 15,280 | |
| | |
Distributions to Shareholders: | | | | | | | | |
| From net investment income | | | | | | | | |
Institutional Class | | | 0 | | | | 0 | |
Administrative Class | | | (5,038 | ) | | | (9,080 | ) |
Advisor Class | | | (632 | ) | | | (160 | ) |
Class M | | | (1,232 | ) | | | (2,166 | ) |
| From net realized capital gains | | | | | | | | |
Institutional Class | | | 0 | | | | 0 | |
Administrative Class | | | 0 | | | | (735 | ) |
Advisor Class | | | 0 | | | | (22 | ) |
Class M | | | 0 | | | | (198 | ) |
| | |
Total Distributions | | | (6,902 | ) | | | (12,361 | ) |
| | |
Portfolio Share Transactions: | | | | | | | | |
| Receipts for shares sold | | | | | | | | |
Institutional Class | | | 10 | | | | 0 | |
Administrative Class | | | 33,411 | | | | 166,191 | |
Advisor Class | | | 58,213 | | | | 7,545 | |
Class M | | | 11,550 | | | | 54,317 | |
| Issued as reinvestment of distributions | | | | | | | | |
Institutional Class | | | 0 | | | | 0 | |
Administrative Class | | | 5,038 | | | | 9,815 | |
Advisor Class | | | 632 | | | | 182 | |
Class M | | | 1,232 | | | | 2,364 | |
| Cost of shares redeemed | | | | | | | | |
Institutional Class | | | 0 | | | | 0 | |
Administrative Class | | | (48,154 | ) | | | (29,204 | ) |
Advisor Class | | | (431 | ) | | | (208 | ) |
Class M | | | (12,991 | ) | | | (8,152 | ) |
Net increase resulting from Portfolio share transactions | | | 48,510 | | | | 202,850 | |
| | |
Total Increase in Net Assets | | | 37,820 | | | | 205,769 | |
| | |
Net Assets: | | | | | | | | |
Beginning of period | | | 326,308 | | | | 120,539 | |
End of period* | | $ | 364,128 | | | $ | 326,308 | |
| | |
*Including undistributed net investment income of: | | $ | 6,814 | | | $ | 7,118 | |
| | | | |
| 8 | | PIMCO Variable Insurance Trust | | See Accompanying Notes |
| | |
| |
| Schedule of Investments All Asset Portfolio (a) | | June 30, 2006 (Unaudited) |
| | | | | | | | |
| | | | | | | | | |
| | | | | | | | | VALUE |
| | | | | SHARES | | | | (000S) |
| |
| PIMCO FUNDS (b) 99.5% |
CommodityRealReturn Strategy Fund® | | | | 639,133 | | $ | | 9,395 |
Convertible Fund | | | | 99,294 | | | | 1,240 |
Developing Local Markets Fund | | | | 2,967,035 | | | | 30,946 |
Diversified Income Fund | | | | 95,839 | | | | 1,031 |
Emerging Markets Bond Fund | | | | 1,908,223 | | | | 20,552 |
Floating Income Fund | | | | 2,936,807 | | | | 30,396 |
Foreign Bond Fund (Unhedged) | | | | 81,715 | | | | 833 |
Fundamental IndexPLUS® Fund | | | | 162,512 | | | | 1,666 |
Fundamental IndexPLUS® TR Fund | | | | 780,708 | | | | 7,823 |
GNMA Fund | | | | 249,029 | | | | 2,670 |
High Yield Fund | | | | 1,318,660 | | | | 12,554 |
International StocksPLUS® TR Strategy Fund | | | | 1,888,909 | | | | 22,025 |
Long-Term U.S. Government Fund | | | | 2,636,612 | | | | 26,893 |
Low Duration Fund | | | | 304,426 | | | | 2,993 |
Real Return Asset Fund | | | | 9,461,298 | | | | 103,412 |
Real Return Fund | | | | 6,131,194 | | | | 65,726 |
RealEstateRealReturn Strategy Fund | | | | 202,957 | | | | 1,756 |
Short-Term Fund | | | | 994 | | | | 10 |
StocksPLUS® Fund | | | | 7,084 | | | | 72 |
StocksPLUS® Total Return Fund | | | | 148,481 | | | | 1,679 |
Total Return Fund | | | | 1,477,051 | | | | 15,036 |
Total Return Mortgage Fund | | | | 346,837 | | | | 3,586 |
| | | | | | | | |
|
Total PIMCO Funds (Cost $371,688) | | | | 362,294 |
| | | | | | | | |
|
| | | | | | | | |
| SHORT-TERM INSTRUMENTS 0.5% |
| |
| REPURCHASE AGREEMENT 0.5% |
| State Street Bank | | | | | | | | |
4.900% due 07/03/2006 | | $ | | 1,781 | | $ | | 1,781 |
| | | | | | | | |
|
(Dated 06/30/2006. Collateralized by Federal Home Loan Bank 4.875% due 02/15/2007 valued at $1,819. Repurchase proceeds are $1,782.) |
| |
Total Short-Term Instruments
(Cost $1,781) | | 1,781 |
| | | | | | | | |
|
| |
Total Investments 100.0%
(Cost $373,469) | | $ | | 364,075 |
| |
| Other Assets and Liabilities (Net) 0.0% | | 53 |
| | | | | | | | |
|
| Net Assets 100.0% | | $ | | 364,128 |
| | | | | | | | |
|
| | | | | | | | |
Notes to Schedule of Investments: |
(a) The All Asset Portfolio is investing in shares of affiliated Funds. |
| | | | | | | | | |
(b) Institutional Class of each PIMCO Funds. |
| | | | | | |
| See Accompanying Notes | | Semiannual Report | | June 30, 2006 | | 9 |
Notes to Financial Statements
1. ORGANIZATION
The All Asset Portfolio (the “Portfolio”) is a series of the PIMCO Variable Insurance Trust (the “Trust”). The Trust is registered under the Investment Company Act of 1940 (the “Act”), as amended, as an open-end investment management company organized as a Delaware business trust on October 3, 1997. The Portfolio offers four classes of shares: Institutional, Administrative, Advisor, and Class M. Information presented in these financial statements pertains to the Administrative Class of the Portfolio. Certain detailed financial information for the Institutional Class, Advisor Class and Class M are provided separately and are available upon request. The Trust is designed to be used as an investment vehicle by Separate Accounts of insurance companies that fund variable annuity contracts and variable life insurance policies and by qualified pension and retirement plans.
2. SIGNIFICANT ACCOUNTING POLICIES
The following is a summary of significant accounting policies consistently followed by the Portfolio in the preparation of its financial statements in conformity with accounting principles generally accepted in the United States of America (“GAAP”). The preparation of financial statements in accordance with GAAP requires management to make estimates and assumptions that affect the reported amounts and disclosures in the financial statements. Actual results could differ from those estimates.
Security Valuation Investments in Funds within the PIMCO Funds are valued at their net asset value as reported by the Underlying Funds.
Securities Transactions and Investment Income. Securities transactions are recorded as of the trade date. Securities purchased or sold on a when-issued or delayed-delivery basis may be settled a month or more after the trade date. Realized gains and losses from securities sold are recorded on the identified cost basis. Dividend income is recorded on the ex-dividend date, except certain dividends from foreign securities where the ex-dividend date may have passed, which are recorded as soon as the Portfolio is informed of the ex-dividend date. Interest income, adjusted for the accretion of discounts and amortization of premiums, is recorded on the accrual basis. Paydown gains and losses on mortgage-related or asset-backed securities are recorded as components of interest income in the Statement of Operations.
Dividends and Distributions to Shareholders. Dividends from net investment income, if any, are declared and distributed to shareholders quarterly. Net realized capital gains earned by the Portfolio, if any, will be distributed no less frequently than once each year. Most shareholders choose to reinvest their dividends and capital gain distribution in additional shares of the Portfolio.
Income dividends and capital gain distributions are determined in accordance with income tax regulations which may differ from GAAP. Differences between tax regulations and GAAP may change the fiscal year when income and capital items are recognized for tax and GAAP purposes. Examples of events that give rise to timing differences include wash sales, straddles, net operating losses and capital loss carryforwards. Further, the character of investment income and capital gains may be different for certain transactions under the two methods of accounting. Examples of characterization differences include the treatment of mortgage paydowns, swaps, foreign currency transactions and contingent debt instruments. As a result, income dividends and capital gain distributions declared during a fiscal period may differ significantly from the net investment income and realized capital gain reported in the Portfolio’s annual financial statements presented under GAAP.
Distributions classified as a tax basis return of capital, if any, are reflected in the accompanying Statements of Changes in Net Assets and have been reclassified to paid in capital. In addition, other amounts have been reclassified between undistributed net investment income, accumulated undistributed net realized gains or losses and/or paid in capital to more appropriately conform financial accounting to tax characterizations of dividend distributions.
Multiclass Operations. Each class offered by the Portfolio has equal rights as to assets and voting privileges (except that shareholders of a class have exclusive voting rights regarding any matter relating solely to that class of shares). Income and non-class specific expenses of the Portfolio are allocated daily to each class of shares based on the relative value of settled shares. Realized and unrealized capital gains and losses of the Portfolio are allocated daily to each class of shares based on the relative net assets of each class. Class specific expenses, where applicable, currently include administrative, distribution and servicing fees.
Federal Income Taxes. The All Asset Portfolio (“the Portfolio”) intends to qualify as a regulated investment company and distribute all of its taxable income and net realized gains, if applicable, to shareholders. Accordingly, no provision for Federal income taxes has been made.
To the extent the All Asset Portfolio invest in the CommodityRealReturn Strategy Portfolio® (the “CRRS Portfolio”), an Underlying Fund, this Portfolio may be subject to the risks associated with commodity-linked derivative instruments.
One of the requirements for favorable tax treatment as a regulated investment company under the Code is that the CRRS Portfolio derive at least 90 percent of its gross income from certain qualifying sources of income. On December 16, 2005, the IRS issued Revenue Ruling 2006-01 which held that income from commodity index-linked swaps was not qualifying income. At the time Revenue Ruling 2006-01 was issued, the CRRS Portfolio invested primarily in commodity index-linked swaps to gain exposure to the commodity markets. Revenue Ruling 2006-01 provided an effective date of June 30, 2006, after which time the CRRS Portfolio’s ability to utilize commodity index-linked swaps as part of its investment strategy will be limited to a maximum of 10 percent of its gross income.
On June 2, 2006, the IRS issued Revenue Ruling 2006-31 which extends the effective date for Revenue Ruling 2006-01 from June 30, 2006 until September 30, 2006. Revenue Ruling 2006-31 also clarifies the holding of Revenue Ruling 2006-01 by providing that income from alternative instruments (such as certain commodity index-linked notes) that create commodity exposure may be considered qualifying income under the Code. In addition, the IRS has also issued private letter rulings to at least two other funds in which the IRS specifically concluded that income from certain commodity index-linked notes is qualifying income. The CRRS Portfolio has also obtained an opinion of counsel with respect to the treatment of income from commodity index-linked notes as qualifying income under the Code. Such an opinion is not binding upon the IRS.
Based on Revenue Ruling 2006-31, IRS guidance and advice of counsel, the CRRS Portfolio will seek to gain exposure to the commodity markets primarily through investments in commodity indexlinked notes. The use of commodity index-linked notes involves specific risks. The CRRS Portfolio will continue to seek ways to make use of other commodity-linked derivative instruments, including swap agreements, commodity options, futures and options on futures, and alternative structures within the Portfolio to gain exposure to commodity markets. Please refer to the prospectus for the Separate Account and Variable Contract for information regarding federal income tax treatment of distributions to the Separate Account.
Guarantees and Indemnifications. Under the Trust’s organizational documents, each Trustee, officer, employee or other agent of the Trust (including the Trust’s investment manager) is indemnified against certain liabilities that may arise out of performance of their duties to the Portfolio. Additionally, in the normal course of business, the Portfolio enters into contracts that contain a variety of
| | | | |
| 10 | | PIMCO Variable Insurance Trust | | |
| | |
| |
| | | June 30, 2006 (Unaudited) |
indemnification clauses. The Portfolio’s maximum exposure under these arrangements is unknown as this would involve future claims that may be made against the Portfolio that have not yet occurred. However, the Portfolio has not had prior claims or losses pursuant to these contracts, and believes the risk of loss to be remote.
Underlying Funds. The Portfolio may invest in any or all of the Underlying Funds, but will not normally invest in every Underlying Fund at any particular time. The Underlying Funds are the Institutional Class shares of the PIMCO Funds, an affiliated open-end investment company, except All Asset and All Asset All Authority Funds. Though it is anticipated that the All Asset Portfolio will not currently invest in the European StocksPLUS® Total Return Strategy, Far East (ex-Japan) StocksPLUS® Total Return Strategy, Japanese StocksPLUS® TR Strategy, StocksPLUS® Municipal-Backed and StocksPLUS® TR Short Strategy Funds, the Portfolio may invest in these Funds in the future, without shareholder approval, at the discretion of the Portfolio’s asset allocation sub-adviser.
New Accounting Policies. In July 2006, the Financial Accounting Standards Board issued Interpretation No. 48, “Accounting for Uncertainty in Income Taxes—an Interpretation of FASB Statement No. 109” (the “Interpretation”). The Interpretation is effective for fiscal years beginning after December 15, 2006. Management is currently evaluating the application of the Interpretation to the Portfolio and will provide additional information in relation to the Interpretation in the Portfolio’s annual financial statements for the year ending December 31, 2006.
3. FEES, EXPENSES, AND RELATED PARTY TRANSACTIONS
Investment Advisory Fee. PIMCO is a majority-owned subsidiary of Allianz Global Investors of America L.P. (“AGI”), and serves as investment adviser (the “Adviser”) to the Trust, pursuant to an investment advisory contract. The Adviser receives a monthly fee at an annual rate based on average daily net assets of the Portfolio. The Advisory Fee is charged at an annual rate of 0.20%.
Administration Fee. PIMCO serves as administrator (the “Administrator”), and provides administrative services to the Trust for which it receives a monthly administrative fee based on average daily net assets of the Portfolio. As the Administrator, PIMCO bears the costs of various third-party services, including audit, custodial, portfolio accounting, legal, transfer agency and printing costs. The Administration Fee is charged at the annual rate of 0.25%.
Distribution and Servicing Fees. Allianz Global Investors Distributors LLC (“AGID”) is an indirect wholly-owned subsidiary of AGI and serves as the distributor of the Trust’s shares. The Trust is permitted to reimburse AGID on a quarterly basis, out of the Administrative Class assets of the Portfolio in the amount of 0.15% on an annual basis of the average daily net assets of that class, for payments made to financial intermediaries that provide services in connection with the distribution of shares or administration of plans or programs that use Portfolio shares as their funding medium. The effective rate paid to AGID was 0.15% during the current fiscal year.
Expenses. The Trust is responsible for the following expenses: (i) salaries and other compensation of any of the Trust’s executive officers and employees who are not officers, directors, stockholders or employees of PIMCO or its subsidiaries or affiliates; (ii) taxes and governmental fees; (iii) brokerage fees and commissions and other portfolio transaction expenses; (iv) the costs of borrowing money, including interest expenses and bank overdraft charges; (v) fees and expenses of the Trustees who are not “interested persons” of PIMCO or the Trust, and any counsel retained exclusively for their benefit; (vi) extraordinary expenses, including costs of litigation and indemnification expenses; (vii) organization expenses and (viii) any expenses allocated or allocable to a specific class of shares, which include service fees payable with respect to the Administrative Class shares and may include certain other expenses as permitted by the Trust’s Multiple Class Plan adopted pursuant to Rule 18f-3 under the Act and subject to review and approval by the Trustees. The ratio of expenses to average net assets per share class, as disclosed in the Financial Highlights, may differ from the annual portfolio operating expenses per share class as disclosed in the Prospectus for the reasons set forth above.
PIMCO has agreed to waive a portion of its administrative fees to the extent that the payment of the Portfolio’s pro rata share of organization expenses and Trustee fees cause the actual expense ratio to rise above the rates disclosed in the then-current prospectus plus 0.49 basis points as set forth below (calculated as a percentage of the Portfolio’s average daily net assets attributable to each class):
| | | |
| Administrative Class | | 0.60 | % |
PIMCO may be reimbursed for these waived amounts in future periods, not to exceed thirty-six months. Expenses that have been waived and may still be reimbursed by the Administrator, to the extent the Portfolio’s annualized total portfolio operating expenses plus the amount so reimbursed does not exceed the operating expense limitation, are as follows (amounts in thousands):
| | | | | | | | | | | | | | | | | | | | |
| | | | | | Year of Waiver |
| | | | | | 12/31/2003 | | | | | 12/31/2004 | | | | | 12/31/2005 | | | | | 06/30/2006 |
Amount Available for Reimbursement | | | | $ | 12 | | | | $ | 0 | | | | $ | 0 | | | | $ | 0 |
For the current period ended June 30, 2006, each unaffiliated Trustee received an annual retainer of $15,000, plus $2,000 for each Board of Trustees quarterly meeting attended, $500 for each Board of Trustees committee meeting attended and $500 for each special board meeting attended, plus reimbursement of related expenses. In addition, each Committee Chair received an additional annual retainer of $500 and each Audit Committee Chair received an additional annual retainer of $1,500. These expenses are allocated on a pro-rata basis to each Portfolio of the Trust according to its respective net assets. The Trust pays no compensation directly to any Trustee or any other officer who is affiliated with the Administrator, all of whom receive remuneration for their services to the Trust from the Administrator or its affiliates.
4. PURCHASES AND SALES OF SECURITIES
The length of time the Portfolio has held a particular security is not generally a consideration in investment decisions. A change in the securities held by the Portfolio is known as “portfolio turnover”. The Portfolio may engage in frequent and active trading of portfolio securities to achieve its investment objective, particularly during periods of volatile market movements. High portfolio turnover (e.g., over 100%) involves correspondingly greater expenses to the Portfolio, including brokerage commissions or dealer mark-ups and other transaction costs on the sale of securities and reinvestments in other securities. Such sales may also result in realization of taxable capital gains, including short-term capital gains (which are generally taxed at ordinary income tax rates). The trading costs and tax effects associated with portfolio turnover may adversely affect the Portfolio’s performance.
Purchases and sales of securities (excluding short-term investments) for the period ended June 30, 2006 were as follows (amounts in thousands):
| | | | | | | | | | | | | | | | |
| | U.S Government/Agency | | | | | All Other |
| | Purchases | | | | | Sales | | | | | Purchases | | | | | Sales |
| $ | 0 | | | | $ | 0 | | | | $ | 159,640 | | | | $ | 113,374 |
| | | | | | |
| | | Semiannual Report | | June 30, 2006 | | 11 |
Notes to Financial Statements (Cont.)
5. SHARES OF BENEFICIAL INTEREST
The Portfolio may issue an unlimited number of shares of beneficial interest with a $0.001 par value. Changes in shares of beneficial interest were as follows (shares and amounts in thousands):
| | | | | | | | | | | | | | | | | | |
| | | | | Six Months Ended
06/30/2006 | | | | | Year Ended
12/31/2005 | |
| | | | | Shares | | | Amount | | | | | Shares | | | Amount | |
| | | | | | |
Receipts for shares sold | | | | | | | | | | | | | | | | | | |
Institutional Class | | | | 1 | | | $ | 10 | | | | | 0 | | | $ | 0 | |
Administrative Class | | | | 2,843 | | | | 33,411 | | | | | 14,121 | | | | 166,191 | |
Advisor Class | | | | 5,043 | | | | 58,213 | | | | | 632 | | | | 7,545 | |
Class M | | | | 982 | | | | 11,550 | | | | | 4,617 | | | | 54,317 | |
Issued as reinvestment of distributions | | | | | | | | | | | | | | | | | | |
Institutional Class | | | | 0 | | | | 0 | | | | | 0 | | | | 0 | |
Administrative Class | | | | 437 | | | | 5,038 | | | | | 828 | | | | 9,815 | |
Advisor Class | | | | 56 | | | | 632 | | | | | 15 | | | | 182 | |
Class M | | | | 107 | | | | 1,232 | | | | | 200 | | | | 2,364 | |
Cost of shares redeemed | | | | | | | | | | | | | | | | | | |
Institutional Class | | | | 0 | | | | 0 | | | | | 0 | | | | 0 | |
Administrative Class | | | | (4,149 | ) | | | (48,154 | ) | | | | (2,453 | ) | | | (29,204 | ) |
Advisor Class | | | | (37 | ) | | | (431 | ) | | | | (17 | ) | | | (208 | ) |
Class M | | | | (1,114 | ) | | | (12,991 | ) | | | | (689 | ) | | | (8,152 | ) |
Net increase resulting from Portfolio share transactions | | | | 4,169 | | | $ | 48,510 | | | | | 17,254 | | | $ | 202,850 | |
The following schedule shows the number of shareholders each owning 5% or more of the Portfolio and the total percentage of the Portfolio held by such shareholders:
| | | | | | | |
| | | | | Number of
Shareholders | | % of Portfolio
Held | |
Institutional Class | | | | 1 | | 100 | |
Administrative Class | | | | 2 | | 89 | * |
Advisor Class | | | | 2 | | 93 | |
Class M | | | | 3 | | 97 | |
* Allianz Life Insurance Co. of North America, an indirect wholly owned subsidiary of AGI and a related party to the Portfolio, owned 25% or more of the outstanding shares of beneficial interest of the Portfolio and therefore may be presumed to “control” the Portfolio, as that term is defined in the 1940 Act.
6. AFFILIATED TRANSACTIONS
The Underlying Funds are considered to be affiliated with the Portfolio. The table below shows the transactions in and earnings from investments in these affiliated Funds for the period ended June 30, 2006 (amounts in thousands):
| | | | | | | | | | | | | | | | | | | | | | | |
| Underlying Funds | | Market Value
12/31/2005 | | Purchases
at Cost | | Proceeds
from Sales | | Unrealized
Appreciation
(Depreciation) | | | Market Value
6/30/2006 | | Dividend
Income | | Net Capital and
Realized
Gain (Loss) | |
CommodityRealReturn Strategy Fund® | | $ | 11,984 | | $ | 3,509 | | $ | 6,126 | | $ | 130 | | | $ | 9,395 | | $ | 46 | | $ | (270 | ) |
Convertible Fund | | | 1,193 | | | 16 | | | 0 | | | 66 | | | | 1,240 | | | 16 | | | 0 | |
Developing Local Markets Fund | | | 23,695 | | | 11,797 | | | 5,002 | | | 582 | | | | 30,946 | | | 529 | | | 96 | |
Diversified Income Fund | | | 0 | | | 1,051 | | | 0 | | | (19 | ) | | | 1,031 | | | 11 | | | 0 | |
Emerging Markets Bond Fund | | | 26,326 | | | 9,172 | | | 13,874 | | | 321 | | | | 20,552 | | | 756 | | | (215 | ) |
Floating Income Fund | | | 23,662 | | | 14,886 | | | 8,178 | | | 272 | | | | 30,396 | | | 678 | | | 65 | |
Foreign Bond Fund (Unhedged) | | | 7,223 | | | 1,078 | | | 7,621 | | | 25 | | | | 833 | | | 80 | | | (356 | ) |
Fundamental IndexPLUS® Fund | | | 1,258 | | | 1,753 | | | 1,411 | | | 28 | | | | 1,666 | | | 18 | | | 24 | |
Fundamental IndexPLUS® TR Fund | | | 10,704 | | | 972 | | | 3,795 | | | (28 | ) | | | 7,823 | | | 164 | | | (158 | ) |
GNMA Fund | | | 3,197 | | | 539 | | | 988 | | | (63 | ) | | | 2,670 | | | 70 | | | (9 | ) |
High Yield Fund | | | 20,384 | | | 705 | | | 8,205 | | | (76 | ) | | | 12,554 | | | 705 | | | (85 | ) |
International StocksPLUS® TR Strategy Fund | | | 10,584 | | | 12,012 | | | 75 | | | (675 | ) | | | 22,025 | | | 379 | | | (9 | ) |
Long-Term U.S. Government Fund | | | 39,326 | | | 3,546 | | | 13,541 | | | (2,088 | ) | | | 26,893 | | | 717 | | | (831 | ) |
Low Duration Fund | | | 4,844 | | | 12,249 | | | 13,954 | | | (2 | ) | | | 2,993 | | | 158 | | | (146 | ) |
Real Return Asset Fund | | | 49,421 | | | 59,336 | | | 997 | | | (4,724 | ) | | | 103,412 | | | 1,423 | | | (38 | ) |
Real Return Fund | | | 43,544 | | | 24,385 | | | 591 | | | (2,425 | ) | | | 65,726 | | | 995 | | | (45 | ) |
RealEstateRealReturn Strategy Fund | | | 10,989 | | | 230 | | | 9,873 | | | 36 | | | | 1,756 | | | 230 | | | (537 | ) |
Short-Term Fund | | | 0 | | | 76 | | | 66 | | | 0 | | | | 10 | | | 0 | | | 0 | |
StocksPLUS® Fund | | | 70 | | | 1 | | | 0 | | | 3 | | | | 72 | | | 1 | | | 0 | |
StocksPLUS® Total Return Fund | | | 1,687 | | | 21 | | | 0 | | | (59 | ) | | | 1,679 | | | 21 | | | 0 | |
Total Return Fund | | | 26,281 | | | 2,128 | | | 12,615 | | | (576 | ) | | | 15,036 | | | 542 | | | (463 | ) |
Total Return Mortgage Fund | | | 10,041 | | | 178 | | | 6,462 | | | (123 | ) | | | 3,586 | | | 178 | | | (178 | ) |
Totals | | $ | 326,413 | | $ | 159,640 | | $ | 113,374 | | $ | (9,395 | ) | | $ | 362,294 | | $ | 7,717 | | $ | (3,155 | ) |
| | | | |
| 12 | | PIMCO Variable Insurance Trust | | |
| | |
| |
| | | June 30, 2006 (Unaudited) |
7. FEDERAL INCOME TAX MATTERS
As of June 30, 2006, the aggregate cost of investments was the same for federal income tax and financial statement purposes. The net unrealized appreciation (depreciation) of investment securities for federal income tax purposes is as follows (amounts in thousands):
| | | | |
Aggregate
Gross
Unrealized
Appreciation | | Aggregate
Gross
Unrealized
(Depreciation) | | Net
Unrealized
(Depreciation) |
$ 1,463 | | $ (10,857) | | $ (9,394) |
8. REGULATORY AND LITIGATION MATTERS
On June 1, 2004, the Attorney General of the State of New Jersey announced that it had dismissed PIMCO from a complaint filed by the New Jersey Attorney General on February 17, 2004, and that it had entered into a settlement agreement (the “New Jersey Settlement”) with Allianz Global Investors of America L.P. (“AGI”) (formerly known as Allianz Dresdner Asset Management of America L.P.), PEA Capital LLC (an entity affiliated with PIMCO through common ownership) (“PEA”) and Allianz Global Investors Distributors LLC (“AGID”), in connection with the same matter. In the New Jersey Settlement, AGI, PEA and AGID neither admitted nor denied the allegations or conclusions of law, but did agree to pay New Jersey a civil fine of $15 million and $3 million for investigative costs and further potential enforcement initiatives against unrelated parties. They also undertook to implement certain governance changes. The complaint relating to the New Jersey Settlement alleged, among other things, that AGI, PEA and AGID had failed to disclose that they improperly allowed certain hedge funds to engage in “market timing” in certain funds. The complaint sought injunctive relief, civil monetary penalties, restitution and disgorgement of profits.
Since February 2004, PIMCO, AGI, PEA, AGID, and certain of their affiliates, including the PIMCO Funds, the Allianz Funds (formerly known as PIMCO Funds: Multi-Manager Series), and the Trustees and employees of the PIMCO Funds, have been named as defendants in fifteen lawsuits filed in various jurisdictions. Eleven of those lawsuits concern “market timing,” and they have been transferred to and consolidated for pre-trial proceedings in a multi-district litigation proceeding in the U.S. District Court for the District of Maryland; the other four lawsuits concern “revenue sharing” and have been consolidated into a single action in the U.S. District Court for the District of Connecticut. The lawsuits have been commenced as putative class actions on behalf of investors who purchased, held or redeemed shares of the various series of the PIMCO Funds and the Allianz Funds during specified periods, or as derivative actions on behalf of the PIMCO Funds and Allianz Funds.
The market timing actions in the District of Maryland generally allege that certain hedge funds were allowed to engage in “market timing” in certain of the Allianz Funds and the PIMCO Funds and this alleged activity was not disclosed. Pursuant to tolling agreements entered into with the derivative and class action plaintiffs, PIMCO, the Trustees, and certain employees of PIMCO who were previously named as defendants have all been dropped as defendants in the market timing actions; the plaintiffs continue to assert claims on behalf of the shareholders of the PIMCO Funds or on behalf of the PIMCO Funds themselves against other defendants. By order dated November 3, 2005, the U.S. District Court for the District of Maryland granted the PIMCO Funds’ motion to dismiss claims asserted against it in a consolidated amended complaint where the PIMCO Funds were named, in the complaint, as a nominal defendant. The revenue sharing action in the District of Connecticut generally alleges that fund assets were inappropriately used to pay brokers to promote the Allianz Funds and PIMCO Funds, including directing fund brokerage transactions to such brokers, and that such alleged arrangements were not fully disclosed to shareholders. On August 11, 2005 the U.S. District Court for the District of Connecticut conducted a hearing on defendants’ motion to dismiss the consolidated amended complaint in the revenue sharing action but has not yet ruled on the motion to dismiss. The market timing and revenue sharing lawsuits seek, among other things, unspecified compensatory damages plus interest and, in some cases, punitive damages, the rescission of investment advisory contracts, the return of fees paid under those contracts and restitution.
Under Section 9(a) of the Investment Company Act of 1940, as amended (“1940 Act”), if the New Jersey Settlement or any of the lawsuits described above were to result in a court injunction against AGI, PEA, AGID and/or their affiliates, PIMCO could, in the absence of exemptive relief granted by the SEC, be barred from serving as an investment adviser, and AGID could be barred from serving as principal underwriter, to any registered investment company, including the Portfolios of the Trust. In connection with an inquiry from the SEC concerning the status of the New Jersey Settlement under Section 9(a), PEA, AGID, AGI and certain of their affiliates (including PIMCO) (together, the “Applicants”) have sought exemptive relief from the SEC under Section 9(c) of the 1940 Act. The SEC has granted the Applicants a temporary exemption from the provisions of Section 9(a) with respect to the New Jersey Settlement until the earlier of (i) September 13, 2006 and (ii) the date on which the SEC takes final action on their application for a permanent order. There is no assurance that the SEC will issue a permanent order.
Two nearly identical class action civil complaints have been filed in August 2005, in the Northern District of Illinois Eastern Division alleging that the plaintiffs each purchased and sold a 10-year Treasury note futures contract and suffered damages from an alleged shortage when PIMCO held both physical and futures positions in 10-year Treasury notes for its client accounts. The two actions have been consolidated into one action, and the two separate complaints have been replaced by a consolidated complaint. PIMCO is a named defendant, and the PIMCO Funds have been added as a defendant, to the consolidated action. PIMCO strongly believes the complaint (and any consolidated complaint filed hereafter) is without merit and intends to vigorously defend itself.
Certain Portfolios of the Trust were recently served in an adversary proceeding brought by the Official Committee of Asbestos Claimants of G-I Holdings, Inc. in G-I Holdings, Inc.’s bankruptcy in the District of New Jersey. PIMCO was previously named in this lawsuit and remains a defendant. The plaintiff seeks to recover for the bankruptcy estate assets that were transferred by the predecessor entity of G-I Holdings, Inc. to a wholly-owned subsidiary in 1994. The subsidiary has since issued notes, of which certain Portfolios of the Trust are alleged to be holders. The complaint alleges that in 2000, more than two hundred noteholders —including certain Portfolios of the Trust—were granted a second priority lien on the assets of the subsidiary in exchange for their consent to a refinancing transaction and the granting of a first priority lien to the lending banks. The plaintiff is seeking invalidation of the lien in favor of the noteholders and/or the value of the lien.
It is possible that these matters and/or other developments resulting from these matters could result in increased fund redemptions or other adverse consequences to the Portfolios. However, PIMCO and AGID believe that these matters are not likely to have a material adverse effect on the Portfolios or on PIMCO’s or AGID’s ability to perform their respective investment advisory or distribution services relating to the Portfolios.
| | | | | | |
| | | Semiannual Report | | June 30, 2006 | | 13 |
Investment Adviser and Administrator
Pacific Investment Management Company LLC
840 Newport Center Drive
Newport Beach, California 92660
Distributor
Allianz Global Investors Distributors LLC
2187 Atlantic Street
Stamford, Connecticut 06902
Custodian
State Street Bank & Trust Company
801 Pennsylvania
Kansas City, Missouri 64105
Transfer Agent
Boston Financial Data Services–Midwest
330 W. 9th Street
Kansas City, Missouri 64105
Legal Counsel
Dechert LLP
1775 I Street, N.W.
Washington, D.C. 20006
Independent Registered Public Accounting Firm
PricewaterhouseCoopers LLP
1055 Broadway
Kansas City, Missouri 64105
P I M C O

Share Class Advisor
Semiannual Report June 30, 2006
PIMCO Variable Insurance Trust
All Asset Portfolio
Table of Contents
This material is authorized for use only when preceded or accompanied by the current PIMCO Variable Insurance Trust (the “Trust”) prospectus. Investors should consider the investment objectives, risks, charges and expenses of this Trust carefully before investing. Ask your financial professional to explain all charges that may apply. This and other information is contained in the Trust’s prospectus. The variable product prospectus may be obtained by contacting your Investment Consultant. Please read the Trust and variable product prospectus carefully before you invest or send money.
Chairman’s Letter
Dear PIMCO Variable Insurance Trust Shareholder:
It is our pleasure to present to you the semiannual report for the PIMCO Variable Insurance Trust covering the six-month period ended June 30, 2006.
Highlights of the global bond markets during the six-month period included:
| | n | | Most fixed-income sectors lost ground during the first half of 2006, as concern about accelerating inflation and central bank tightening pushed interest rates higher worldwide. The benchmark Lehman Brothers Aggregate Bond Index (which includes Treasury, Investment-Grade Corporate, and Residential Mortgage-Backed Securities) returned -0.72% for the first six months of the year. On June 30, the benchmark ten-year Treasury yielded 5.14%, 0.75% higher than at the start of the year. The U.S. yield curve remained flat as shorter-maturity yields rose by a comparable amount. |
| | n | | The Federal Reserve tightened four times during the reporting period, bringing the Federal Funds Rate to 5.25%. The increase near the end of the period was the Federal Reserve’s 17th consecutive rate hike since the start of its tightening cycle in 2004. The Federal Reserve was not alone, as central banks in Europe, India, and China tightened credit in unison for the first time since 2000. The Bank of Japan, whose zero-interest-rate policy has flooded global markets with liquidity, looked set to reverse this policy in the coming months. |
In these pages please find a more complete Portfolio review as it relates to financial-market activities, as well as details about total-return investment performance for the six-month reporting period. Thank you for the trust you have placed in us. We will continue to work diligently to meet your investment needs.
Sincerely,

Brent R. Harris
Chairman, PIMCO Variable Insurance Trust
July 31, 2006
| | | | | | |
| | | Semiannual Report | | June 30, 2006 | | 1 |
Important Information About the Portfolio
PIMCO Variable Insurance Trust (the “Trust”) is an open-end management investment company currently consisting of nineteen separate investment portfolios, including the All Asset Portfolio (the “Portfolio”). The Portfolio is only available as a funding vehicle under variable life insurance policies or variable annuity contracts issued by insurance companies (“Variable Contracts”). Individuals may not purchase shares of the Portfolio directly. Shares of the Portfolio also may be sold to qualified pension and retirement plans outside of the separate account context.
The Portfolio is a “fund of funds,” which is a term used to describe mutual funds that pursue their investment objective by investing in other mutual funds instead of investing directly in stocks or bonds of other issuers. Under normal circumstances, the Portfolio invests substantially all of its assets in Institutional Class shares of PIMCO Funds, an affiliated open-end investment company, except the All Asset and All Asset All Authority Funds (“Underlying Funds”).
Among the principal risks of investing in the Portfolio are allocation risk, Underlying Fund risk and issuer non-diversification risk. The Portfolio also is indirectly subject to the risks of the Underlying Funds, which may include, but are not limited to, the following: interest rate risk, credit risk, high yield risk, market risk, issuer risk, variable dividends risk, liquidity risk, derivatives risk, commodity risk, equity risk, mortgage risk, non-U.S. investment risk, real estate risk, emerging markets risk, currency risk, issuer non-diversification risk, leveraging risk, small company risk, management risk, California state specific risk, New York state specific risk, tax risk and index risk. A complete description of these risks is contained in the Portfolio’s prospectus. An Underlying Fund may use derivative instruments for hedging purposes or as part of an investment strategy. Use of these instruments may involve certain costs and risks such as liquidity risk, interest rate risk, market risk, credit risk, management risk and the risk that the Underlying Fund could not close out a position when it would be most advantageous to do so. An Underlying Fund investing in derivatives could lose more than the principal amount invested in these instruments. Investing in non-U.S. securities may entail risk due to non-U.S. economic and political developments; this risk may be increased when investing in emerging markets.
The cost of investing in the Portfolio will generally be higher than the cost of investing in a mutual fund that invests directly in individual stocks and bonds. By investing in the Portfolio, an investor will indirectly bear fees and expenses charged by the Underlying Funds in addition to the Portfolio’s direct fees and expenses.
On the performance summary page in this Semiannual Report, the Total Return Investment Performance table measures performance assuming that all dividend and capital gain distributions were reinvested.
An investment in the Portfolio is not a deposit of a bank and is not guaranteed or insured by the Federal Deposit Insurance Corporation or any other government agency. It is possible to lose money on investments in the Portfolio.
PIMCO has adopted written proxy voting policies and procedures (“Proxy Policy”) as required by Rule 206(4)-6 under the Investment Advisers Act of 1940. The Proxy Policy has been adopted by the Trust as the policies and procedures that PIMCO will use when voting proxies on behalf of the Portfolio. Copies of the written Proxy Policy and the factors that PIMCO may consider in determining how to vote proxies for the Portfolio, and information about how the Portfolio voted proxies relating to portfolio securities held during the most recent twelve-month period ended June 30, are available without charge, upon request, by calling the Trust at 1-866-746-2606 and on the Securities and Exchange Commission’s (“SEC”) website at http://www.sec.gov.
The Portfolio files its complete schedule of portfolio holdings with the SEC for the first and third quarters of each fiscal year on Form N-Q. A copy of the Trust’s Form N-Q is available on the SEC’s website at http://www.sec.gov and may be reviewed and copied at the SEC’s Public Reference Room in Washington D.C. Information on the operation of the Public Reference Room may be obtained by calling 1-800-SEC-0330.
PIMCO Variable Insurance Trust is distributed by Allianz Global Investors Distributors LLC, 2187 Atlantic Street, Stamford, CT 06902.
| | | | |
| 2 | | PIMCO Variable Insurance Trust | | |
The following disclosure provides important information regarding the Portfolio’s Expense Example (“Example” or “Expense Example”), which appears in this Semiannual Report. Please refer to this information when reviewing the Expense Example for the Portfolio.
Example
As a shareholder of the Portfolio, you incur two types of costs: (1) transaction costs and (2) ongoing costs, including advisory and administrative fees; distribution and/or service (12b-1) fees (Administrative Class, Advisor Class and Class M only); and other Portfolio expenses. The Example is intended to help you understand your ongoing costs (in dollars) of investing in the Portfolio and to compare these costs with the ongoing costs of investing in other mutual funds. The Expense Example does not reflect any fees or other expenses imposed by the Variable Contracts. If it did, the expenses reflected in the Expense Examples would be higher. The Example is based on an investment of $1,000 invested at the beginning of the period and held for the entire period indicated, which is from January 1, 2006 to June 30, 2006.
Actual Expenses
The information in the table under the heading “Actual Performance” provides information about actual account values and actual expenses. You may use the information in these columns, together with the amount you invested, to estimate the expenses that you paid over the period. Simply divide your account value by $1,000 (for example, an $8,600 account value divided by $1,000 = 8.60), then multiply the result by the number in the appropriate column for your share class, in the row titled “Expenses Paid During Period” to estimate the expenses you paid on your account during this period.
Hypothetical Example for Comparison Purposes
The information in the table under the heading “Hypothetical Performance (5% return before expenses)” provides information about hypothetical account values and hypothetical expenses based on the Portfolio’s actual expense ratio and an assumed rate of return of 5% per year before expenses, which is not the Portfolio’s actual return. The hypothetical account values and expenses may not be used to estimate the actual ending account balance or expenses you paid for the period. You may use this information to compare the ongoing costs of investing in the Portfolio and other portfolios. To do so, compare this 5% hypothetical example with the 5% hypothetical examples that appear in the shareholder reports of the other portfolios.
Please note that the expenses shown in the table are meant to highlight your ongoing costs only and do not reflect any transactional costs. Therefore, the information under the heading “Hypothetical Performance (5% return before expenses)” is useful in comparing ongoing costs only, and will not help you determine the relative total costs of owning different portfolios. In addition, if these transactional costs were included, your costs would have been higher.
The expense ratio may vary period to period because of various factors, such as an increase in expenses not covered by the advisory and administrative fees (such as expenses of the trustees and their counsel or litigation expense).
Portfolio Benchmarks
Lehman Brothers U.S. TIPS: 1-10 Year is an unmanaged index market comprised of U.S. Treasury Inflation Linked securities having a maturity of at least 1 year and less than 10 years. It is not possible to invest directly in such an unmanaged index.
The CPI + 500 Basis Points benchmark is created by adding 5% to the annual percentage change in the Consumer Price Index (“CPI”). This index reflects non-seasonally adjusted returns. The CPI is an unmanaged index representing the rate of inflation of the U.S. consumer prices as determined by the US Department of Labor Statistics. There can be no guarantee that the CPI or other indexes will reflect the exact level of inflation at any given time.
| | | | | | |
| | | Semiannual Report | | June 30, 2006 | | 3 |
|
|
| PIMCO All Asset Portfolio |
|
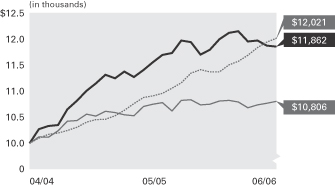
Cumulative Returns Through June 30, 2006
Consumer Price
All Asset Portfolio Index + 500 Lehman Brothers U.S.
Advisor Class Basis points TIPS 1-10 Year Index
------------------- -------------- --------------------
04/30/2004 $10,000 $10,000 $10,000
05/31/2004 10,274 10,100 10,124
06/30/2004 10,332 10,174 10,116
07/31/2004 10,351 10,201 10,242
08/31/2004 10,653 10,249 10,427
09/30/2004 10,821 10,313 10,437
10/31/2004 11,010 10,410 10,564
11/30/2004 11,152 10,459 10,527
12/31/2004 11,318 10,464 10,617
01/31/2005 11,250 10,530 10,590
02/28/2005 11,377 10,634 10,552
03/31/2005 11,275 10,762 10,532
04/30/2005 11,412 10,679 10,707
05/31/2005 11,558 10,913 10,753
06/30/2005 11,697 10,964 10,780
07/31/2005 11,738 11,061 10,623
08/31/2005 11,975 11,163 10,828
09/30/2005 11,945 11,346 10,838
10/31/2005 11,707 11,416 10,742
11/30/2005 11,796 11,372 10,752
12/31/2005 12,001 11,374 10,816
01/31/2006 12,123 11,508 10,825
02/28/2006 12,153 11,579 10,793
03/31/2006 11,958 11,691 10,684
04/30/2006 11,978 11,839 10,738
05/31/2006 11,876 11,948 10,774
06/30/2006 11,862 12,021 10,806
$10,000 invested at the beginning of the first full month following the inception date of the Portfolio’s Advisor Class.
PIMCO Funds Allocation‡
| | |
Real Return Asset | | 28.4% |
Real Return | | 18.1% |
Developing Local Markets | | 8.5% |
Floating Income | | 8.3% |
Long-Term U.S. Government | | 7.4% |
International StocksPLUS® TR Strategy | | 6.0% |
Emerging Markets Bond | | 5.6% |
Other | | 17.7% |
| | ‡ | % of Total Investments as of June 30, 2006 |
| | | | | | | | | | |
| Average Annual Total Return for the period ended June 30, 2006 |
| | | | | | | 6 Months* | | 1 Year | | Since
Inception
(04/30/04) |
| | |
| | PIMCO All Asset Portfolio Advisor Class | | -1.16% | | 1.39% | | 8.20% |
| | |
| | Lehman Brothers U.S. TIPS 1-10 Year Index | | -0.09% | | 0.24% | | 3.65% |
| | | - - - - | | Consumer Price Index + 500 Basis points | | 5.69% | | 9.64% | | 8.87% |
* Cumulative return. All Portfolio returns are net of fees and expenses.
Past performance is no guarantee of future results. The performance quoted represents past performance. Investment return and principal value will fluctuate so that Fund shares, when redeemed, may be worth more or less than their original cost. The Portfolio’s performance does not reflect the deduction of additional charges and expenses imposed in connection with investing in Variable Contracts, which will reduce returns. Current performance may be lower or higher than the performance data quoted. Performance data current to the most recent month-end is available by calling (800) 927-4648.
| | | | | | | | | | |
| Expense Example | | | | Actual Performance | | | | Hypothetical Performance |
| | | | | | | | | (5% return before expenses) |
Beginning Account Value (01/01/06) | | | | $ | 1,000.00 | | | | $ | 1,000.00 |
Ending Account Value (06/30/06) | | | | $ | 988.40 | | | | $ | 1,021.32 |
Expenses Paid During Period† | | | | $ | 3.45 | | | | $ | 3.51 |
† Expenses are equal to the Portfolio’s Advisor Class annualized expense ratio of 0.70%, multiplied by the average account value over the period, multiplied by 181/365 (to reflect the one-half year period). The expense ratio excludes the expenses of the underlying Funds, which based upon the allocation of the Portfolio’s assets among the Underlying Funds are indirectly borne by the shareholders of the Portfolio. The Underlying Fund Expenses for the Portfolio are estimated at 0.63%. Overall fees and expenses of investing in the Portfolio will be higher because the example does not reflect Variable Contract fees and expenses.
Please refer to page 3 herein for a description of the Portfolio’s benchmark and an explanation of the information presented in the above Expense Example.
Portfolio Insights
| » | | The PIMCO All Asset Portfolio seeks to achieve its investment objective by investing under normal circumstances substantially all of its assets in Institutional Class Shares of the Underlying Funds (i.e., any of the PIMCO Funds, except the All Asset and All Asset All Authority Funds). |
| » | | Significant exposure to the Treasury Inflation-Protected Securities (“TIPS”) asset class detracted significantly from tactical asset allocation alpha due to the asset class, particularly longer dated TIPS, posting negative returns. |
| » | | Less than optimal exposure to commodities detracted from performance, as the Dow Jones AIG Commodity Index returned 3.58% over the period. |
| » | | Less than optimal exposure to Real Estate Investment Trusts (“REITs”) detracted from performance, as the Dow Jones Wilshire REIT Index gained 14.40% for the period. |
| » | | Significant exposure to lower duration instruments was positive for performance, as lower duration assets tend to outperform assets with longer duration in a rising interest rate environment. Exposure to the Floating Rate Income Fund provided positive returns. |
| » | | Significant exposure to the Developing Local Markets Fund and emerging market currencies added to performance with the fund returning 4.34%. |
| » | | Exposure to the High Yield Fund was positive due to coupon selection providing solid returns for the period. |
| | | | |
| 4 | | PIMCO Variable Insurance Trust | | |
| | |
| |
| Financial Highlights All Asset Portfolio Advisor Class | | |
| | | | | | | | | | | | |
| Selected Per Share Data for the Year or Period Ended: | | 06/30/2006+ | | | 12/31/2005 | | | 04/30/2004-
12/31/2004 | |
| | | |
Advisor Class | | | | | | | | | | | | |
| Net asset value beginning of period | | $ | 11.82 | | | $ | 11.64 | | | $ | 10.59 | |
| Net investment income (a) | | | 0.32 | | | | 1.63 | | | | 0.52 | |
| Net realized/unrealized gain (loss) on investments (a) | | | (0.46 | ) | | | (0.93 | ) | | | 0.87 | |
| Total income (loss) from investment operations | | | (0.14 | ) | | | 0.70 | | | | 1.39 | |
| Dividends from net investment income | | | (0.23 | ) | | | (0.48 | ) | | | (0.33 | ) |
| Distributions from net realized capital gains | | | 0.00 | | | | (0.04 | ) | | | (0.01 | ) |
| Total distributions | | | (0.23 | ) | | | (0.52 | ) | | | (0.34 | ) |
| Net asset value end of period | | $ | 11.45 | | | $ | 11.82 | | | $ | 11.64 | |
| Total return | | | (1.16 | )% | | | 6.03 | % | | | 13.18 | % |
| Net assets end of period (000s) | | $ | 65,231 | | | $ | 7,461 | | | $ | 11 | |
| Ratio of expenses to average net assets | | | 0.70 | %* | | | 0.70 | % | | | 0.67 | %*(b)(c) |
| Ratio of net investment income to average net assets | | | 5.53 | %* | | | 13.67 | % | | | 6.96 | %* |
| Portfolio turnover rate | | | 33 | % | | | 75 | % | | | 93 | % |
+ Unaudited
* Annualized
(a) Per share amounts based on average number of shares outstanding during the period.
(b) Ratio of expenses to average net assets excluding underlying Funds’ expenses in which the Portfolio invests.
(c) If the investment manager had not reimbursed expenses, the ratio of expenses to average net assets would have been 0.70%
| | | | | | |
| See Accompanying Notes | | Semiannual Report | | June 30, 2006 | | 5 |
| | |
| |
| Statement of Assets and Liabilities All Asset Portfolio | | |
| | | | |
| (Amounts in thousands, except per share amounts) | | June 30, 2006
(Unaudited) | |
| |
Assets: | | | | |
Investments in Affiliates, at value | | $ | 364,075 | |
Cash | | | 1 | |
Receivable for Portfolio shares sold | | | 2,020 | |
Interest and dividends receivable from Affiliates | | | 1,899 | |
| | | | 367,995 | |
| |
Liabilities: | | | | |
Payable for investments in Affiliates purchased | | $ | 3,433 | |
Payable for Portfolio shares redeemed | | | 228 | |
Accrued investment advisory fee | | | 62 | |
Accrued administration fee | | | 77 | |
Accrued servicing fee | | | 62 | |
Recoupment payable to Manager | | | 5 | |
| | | | 3,867 | |
| |
Net Assets | | $ | 364,128 | |
| |
Net Assets Consist of: | | | | |
Paid in capital | | $ | 368,395 | |
Undistributed net investment income | | | 6,814 | |
Accumulated undistributed net realized (loss) | | | (1,686 | ) |
Net unrealized (depreciation) | | | (9,395 | ) |
| | | $ | 364,128 | |
| |
Net Assets: | | | | |
Institutional Class | | $ | 10 | |
Administrative Class | | | 233,824 | |
Advisor Class | | | 65,231 | |
Class M | | | 65,063 | |
| |
Shares Issued and Outstanding: | | | | |
Institutional Class | | | 1 | |
Administrative Class | | | 20,415 | |
Advisor Class | | | 5,693 | |
Class M | | | 5,684 | |
| |
Net Asset Value and Redemption Price Per Share (Net Assets Per Share Outstanding) | | | | |
Institutional Class | | $ | 11.45 | |
Administrative Class | | | 11.45 | |
Advisor Class | | | 11.45 | |
Class M | | | 11.44 | |
| |
Cost of Investments in Affiliates Owned | | $ | 373,469 | |
| | | | |
| 6 | | PIMCO Variable Insurance Trust | | See Accompanying Notes |
| | |
| |
| Statement of Operations All Asset Portfolio | | |
| | | | |
| (Amounts in Thousands) | | Six Months Ended
June 30, 2006
(Unaudited) | |
| |
Investment Income: | | | | |
Interest | | $ | 14 | |
Dividends from Affiliate investments | | | 7,717 | |
Total Income | | | 7,731 | |
| |
Expenses: | | | | |
Investment advisory fees | | | 337 | |
Administration fees | | | 422 | |
Servicing fees – Administrative Class | | | 190 | |
Distribution and/or servicing fees – Advisor Class | | | 21 | |
Distribution and/or servicing fees – Class M | | | 152 | |
Interest expense | | | 1 | |
Miscellaneous expense | | | 10 | |
Total Expenses | | | 1,133 | |
| |
Net Investment Income | | | 6,598 | |
| |
Net Realized and Unrealized (Loss): | | | | |
Net realized (loss) on Affiliate investments | | | (3,155 | ) |
Net change in unrealized (depreciation) on Affiliate investments | | | (7,231 | ) |
Net (Loss) | | | (10,386 | ) |
| |
Net (Decrease) in Net Assets Resulting from Operations | | $ | (3,788 | ) |
| | | | | | |
| See Accompanying Notes | | Semiannual Report | | June 30, 2006 | | 7 |
| | |
| |
| Statements of Changes in Net Assets All Asset Portfolio | | |
| | | | | | | | |
| (Amounts In Thousands) | | Six Months Ended
June 30, 2006
(Unaudited) | | | Year Ended
December 31, 2005 | |
| | |
Increase (Decrease) in Net Assets from: | | | | | | | | |
| | |
Operations: | | | | | | | | |
Net investment income | | $ | 6,598 | | | $ | 16,918 | |
Net realized gain (loss) on Affiliate investments | | | (3,155 | ) | | | 1,306 | |
Net capital (loss) distributions received from Underlying Funds | | | 0 | | | | 712 | |
Net change in unrealized (depreciation) on Affiliate investments | | | (7,231 | ) | | | (3,656 | ) |
Net increase (decrease) resulting from operations | | | (3,788 | ) | | | 15,280 | |
| | |
Distributions to Shareholders: | | | | | | | | |
| From net investment income | | | | | | | | |
Institutional Class | | | 0 | | | | 0 | |
Administrative Class | | | (5,038 | ) | | | (9,080 | ) |
Advisor Class | | | (632 | ) | | | (160 | ) |
Class M | | | (1,232 | ) | | | (2,166 | ) |
| From net realized capital gains | | | | | | | | |
Institutional Class | | | 0 | | | | 0 | |
Administrative Class | | | 0 | | | | (735 | ) |
Advisor Class | | | 0 | | | | (22 | ) |
Class M | | | 0 | | | | (198 | ) |
| | |
Total Distributions | | | (6,902 | ) | | | (12,361 | ) |
| | |
Portfolio Share Transactions: | | | | | | | | |
| Receipts for shares sold | | | | | | | | |
Institutional Class | | | 10 | | | | 0 | |
Administrative Class | | | 33,411 | | | | 166,191 | |
Advisor Class | | | 58,213 | | | | 7,545 | |
Class M | | | 11,550 | | | | 54,317 | |
| Issued as reinvestment of distributions | | | | | | | | |
Institutional Class | | | 0 | | | | 0 | |
Administrative Class | | | 5,038 | | | | 9,815 | |
Advisor Class | | | 632 | | | | 182 | |
Class M | | | 1,232 | | | | 2,364 | |
| Cost of shares redeemed | | | | | | | | |
Institutional Class | | | 0 | | | | 0 | |
Administrative Class | | | (48,154 | ) | | | (29,204 | ) |
Advisor Class | | | (431 | ) | | | (208 | ) |
Class M | | | (12,991 | ) | | | (8,152 | ) |
Net increase resulting from Portfolio share transactions | | | 48,510 | | | | 202,850 | |
| | |
Total Increase in Net Assets | | | 37,820 | | | | 205,769 | |
| | |
Net Assets: | | | | | | | | |
Beginning of period | | | 326,308 | | | | 120,539 | |
End of period* | | $ | 364,128 | | | $ | 326,308 | |
| | |
*Including undistributed net investment income of: | | $ | 6,814 | | | $ | 7,118 | |
| | | | |
| 8 | | PIMCO Variable Insurance Trust | | See Accompanying Notes |
| | |
| |
| Schedule of Investments All Asset Portfolio (a) | | June 30, 2006 (Unaudited) |
| | | | | | | | |
| | | | | | | | | VALUE |
| | | | | SHARES | | | | (000S) |
| PIMCO FUNDS (b) 99.5% |
CommodityRealReturn Strategy Fund® | | | | 639,133 | | $ | | 9,395 |
Convertible Fund | | | | 99,294 | | | | 1,240 |
Developing Local Markets Fund | | | | 2,967,035 | | | | 30,946 |
Diversified Income Fund | | | | 95,839 | | | | 1,031 |
Emerging Markets Bond Fund | | | | 1,908,223 | | | | 20,552 |
Floating Income Fund | | | | 2,936,807 | | | | 30,396 |
Foreign Bond Fund (Unhedged) | | | | 81,715 | | | | 833 |
Fundamental IndexPLUS® Fund | | | | 162,512 | | | | 1,666 |
Fundamental IndexPLUS® TR Fund | | | | 780,708 | | | | 7,823 |
GNMA Fund | | | | 249,029 | | | | 2,670 |
High Yield Fund | | | | 1,318,660 | | | | 12,554 |
International StocksPLUS® TR Strategy Fund | | | | 1,888,909 | | | | 22,025 |
Long-Term U.S. Government Fund | | | | 2,636,612 | | | | 26,893 |
Low Duration Fund | | | | 304,426 | | | | 2,993 |
Real Return Asset Fund | | | | 9,461,298 | | | | 103,412 |
Real Return Fund | | | | 6,131,194 | | | | 65,726 |
RealEstateRealReturn Strategy Fund | | | | 202,957 | | | | 1,756 |
Short-Term Fund | | | | 994 | | | | 10 |
StocksPLUS® Fund | | | | 7,084 | | | | 72 |
StocksPLUS® Total Return Fund | | | | 148,481 | | | | 1,679 |
Total Return Fund | | | | 1,477,051 | | | | 15,036 |
Total Return Mortgage Fund | | | | 346,837 | | | | 3,586 |
| | | | | | | | |
|
Total PIMCO Funds (Cost $371,688) | | | | 362,294 |
| | | | | | | | |
|
| | | | | | | | |
| SHORT-TERM INSTRUMENTS 0.5% |
| |
| REPURCHASE AGREEMENT 0.5% |
| State Street Bank | | | | | | | | |
4.900% due 07/03/2006 | | $ | | 1,781 | | $ | | 1,781 |
| | | | | | | | |
|
(Dated 06/30/2006. Collateralized by Federal Home Loan Bank 4.875% due 02/15/2007 valued at $1,819. Repurchase proceeds are $1,782.) |
| |
Total Short-Term Instruments
(Cost $1,781) | | 1,781 |
| | | | | | | | |
|
| |
Total Investments 100.0%
(Cost $373,469) | | $ | | 364,075 |
| |
| Other Assets and Liabilities (Net) 0.0% | | 53 |
| | | | | | | | |
|
| Net Assets 100.0% | | $ | | 364,128 |
| | | | | | | | |
|
| | | | | | | | |
Notes to Schedule of Investments: |
(a) The All Asset Portfolio is investing in shares of affiliated Funds. |
| | | | | | | | | |
(b) Institutional Class of each PIMCO Funds. |
| | | | | | |
| See Accompanying Notes | | Semiannual Report | | June 30, 2006 | | 9 |
Notes to Financial Statements
1. ORGANIZATION
The All Asset Portfolio (the “Portfolio”) is a series of the PIMCO Variable Insurance Trust (the “Trust”). The Trust is registered under the Investment Company Act of 1940 (the “Act”), as amended, as an open-end investment management company organized as a Delaware business trust on October 3, 1997. The Portfolio offers four classes of shares: Institutional, Administrative, Advisor, and Class M. Information presented in these financial statements pertains to the Advisor Class of the Portfolio. Certain detailed financial information for the Institutional Class, Administrative Class and Class M are provided separately and are available upon request. The Trust is designed to be used as an investment vehicle by Separate Accounts of insurance companies that fund variable annuity contracts and variable life insurance policies and by qualified pension and retirement plans.
2. SIGNIFICANT ACCOUNTING POLICIES
The following is a summary of significant accounting policies consistently followed by the Portfolio in the preparation of its financial statements in conformity with accounting principles generally accepted in the United States of America (“GAAP”). The preparation of financial statements in accordance with GAAP requires management to make estimates and assumptions that affect the reported amounts and disclosures in the financial statements. Actual results could differ from those estimates.
Security Valuation Investments in Funds within the PIMCO Funds are valued at their net asset value as reported by the Underlying Funds.
Securities Transactions and Investment Income. Securities transactions are recorded as of the trade date. Securities purchased or sold on a when-issued or delayed-delivery basis may be settled a month or more after the trade date. Realized gains and losses from securities sold are recorded on the identified cost basis. Dividend income is recorded on the ex-dividend date, except certain dividends from foreign securities where the ex-dividend date may have passed, which are recorded as soon as the Portfolio is informed of the ex-dividend date. Interest income, adjusted for the accretion of discounts and amortization of premiums, is recorded on the accrual basis. Paydown gains and losses on mortgage-related or asset-backed securities are recorded as components of interest income in the Statement of Operations.
Dividends and Distributions to Shareholders. Dividends from net investment income, if any, are declared and distributed to shareholders quarterly. Net realized capital gains earned by the Portfolio, if any, will be distributed no less frequently than once each year. Most shareholders choose to reinvest their dividends and capital gain distribution in additional shares of the Portfolio.
Income dividends and capital gain distributions are determined in accordance with income tax regulations which may differ from GAAP. Differences between tax regulations and GAAP may change the fiscal year when income and capital items are recognized for tax and GAAP purposes. Examples of events that give rise to timing differences include wash sales, straddles, net operating losses and capital loss carryforwards. Further, the character of investment income and capital gains may be different for certain transactions under the two methods of accounting. Examples of characterization differences include the treatment of mortgage paydowns, swaps, foreign currency transactions and contingent debt instruments. As a result, income dividends and capital gain distributions declared during a fiscal period may differ significantly from the net investment income and realized capital gain reported in the Portfolio’s annual financial statements presented under GAAP.
Distributions classified as a tax basis return of capital, if any, are reflected in the accompanying Statements of Changes in Net Assets and have been reclassified to paid in capital. In addition, other amounts have been reclassified between undistributed net investment income, accumulated undistributed net realized gains or losses and/or paid in capital to more appropriately conform financial accounting to tax characterizations of dividend distributions.
Multiclass Operations. Each class offered by the Portfolio has equal rights as to assets and voting privileges (except that shareholders of a class have exclusive voting rights regarding any matter relating solely to that class of shares). Income and non-class specific expenses of the Portfolio are allocated daily to each class of shares based on the relative value of settled shares. Realized and unrealized capital gains and losses of the Portfolio are allocated daily to each class of shares based on the relative net assets of each class. Class specific expenses, where applicable, currently include administrative, distribution and servicing fees.
Federal Income Taxes. The All Asset Portfolio (“the Portfolio”) intends to qualify as a regulated investment company and distribute all of its taxable income and net realized gains, if applicable, to shareholders. Accordingly, no provision for Federal income taxes has been made.
To the extent the All Asset Portfolio invest in the CommodityRealReturn Strategy Portfolio® (the “CRRS Portfolio”), an Underlying Fund, this Portfolio may be subject to the risks associated with commodity-linked derivative instruments.
One of the requirements for favorable tax treatment as a regulated investment company under the Code is that the CRRS Portfolio derive at least 90 percent of its gross income from certain qualifying sources of income. On December 16, 2005, the IRS issued Revenue Ruling 2006-01 which held that income from commodity index-linked swaps was not qualifying income. At the time Revenue Ruling 2006-01 was issued, the CRRS Portfolio invested primarily in commodity index-linked swaps to gain exposure to the commodity markets. Revenue Ruling 2006-01 provided an effective date of June 30, 2006, after which time the CRRS Portfolio’s ability to utilize commodity index-linked swaps as part of its investment strategy will be limited to a maximum of 10 percent of its gross income.
On June 2, 2006, the IRS issued Revenue Ruling 2006-31 which extends the effective date for Revenue Ruling 2006-01 from June 30, 2006 until September 30, 2006. Revenue Ruling 2006-31 also clarifies the holding of Revenue Ruling 2006-01 by providing that income from alternative instruments (such as certain commodity index-linked notes) that create commodity exposure may be considered qualifying income under the Code. In addition, the IRS has also issued private letter rulings to at least two other funds in which the IRS specifically concluded that income from certain commodity index-linked notes is qualifying income. The CRRS Portfolio has also obtained an opinion of counsel with respect to the treatment of income from commodity index-linked notes as qualifying income under the Code. Such an opinion is not binding upon the IRS.
Based on Revenue Ruling 2006-31, IRS guidance and advice of counsel, the CRRS Portfolio will seek to gain exposure to the commodity markets primarily through investments in commodity indexlinked notes. The use of commodity index-linked notes involves specific risks. The CRRS Portfolio will continue to seek ways to make use of other commodity-linked derivative instruments, including swap agreements, commodity options, futures and options on futures, and alternative structures within the Portfolio to gain exposure to commodity markets. Please refer to the prospectus for the Separate Account and Variable Contract for information regarding federal income tax treatment of distributions to the Separate Account.
Guarantees and Indemnifications. Under the Trust’s organizational documents, each Trustee, officer, employee or other agent of the Trust (including the Trust’s investment manager) is indemnified against certain liabilities that may arise out of performance of their duties to the Portfolio. Additionally, in the normal course of business, the Portfolio enters into contracts that contain a variety of
| | | | |
| 10 | | PIMCO Variable Insurance Trust | | |
| | |
| |
| | | June 30, 2006 (Unaudited) |
indemnification clauses. The Portfolio’s maximum exposure under these arrangements is unknown as this would involve future claims that may be made against the Portfolio that have not yet occurred. However, the Portfolio has not had prior claims or losses pursuant to these contracts, and believes the risk of loss to be remote.
Underlying Funds. The Portfolio may invest in any or all of the Underlying Funds, but will not normally invest in every Underlying Fund at any particular time. The Underlying Funds are the Institutional Class shares of the PIMCO Funds, an affiliated open-end investment company, except All Asset and All Asset All Authority Funds. Though it is anticipated that the All Asset Portfolio will not currently invest in the European StocksPLUS® Total Return Strategy, Far East (ex-Japan) StocksPLUS® Total Return Strategy, Japanese StocksPLUS® TR Strategy, StocksPLUS® Municipal-Backed and StocksPLUS® TR Short Strategy Funds, the Portfolio may invest in these Funds in the future, without shareholder approval, at the discretion of the Portfolio’s asset allocation sub-adviser.
New Accounting Policies. In July 2006, the Financial Accounting Standards Board issued Interpretation No. 48, “Accounting for Uncertainty in Income Taxes—an Interpretation of FASB Statement No. 109” (the “Interpretation”). The Interpretation is effective for fiscal years beginning after December 15, 2006. Management is currently evaluating the application of the Interpretation to the Portfolio and will provide additional information in relation to the Interpretation in the Portfolio’s annual financial statements for the year ending December 31, 2006.
3. FEES, EXPENSES, AND RELATED PARTY TRANSACTIONS
Investment Advisory Fee. PIMCO is a majority-owned subsidiary of Allianz Global Investors of America L.P. (“AGI”), and serves as investment adviser (the “Adviser”) to the Trust, pursuant to an investment advisory contract. The Adviser receives a monthly fee at an annual rate based on average daily net assets of the Portfolio. The Advisory Fee is charged at an annual rate of 0.20%.
Administration Fee. PIMCO serves as administrator (the “Administrator”), and provides administrative services to the Trust for which it receives a monthly administrative fee based on average daily net assets of the Portfolio. As the Administrator, PIMCO bears the costs of various third-party services, including audit, custodial, portfolio accounting, legal, transfer agency and printing costs. The Administration Fee is charged at the annual rate of 0.25%.
Distribution and Servicing Fees. Allianz Global Investors Distributors LLC (“AGID”) is an indirect wholly-owned subsidiary of AGI and serves as the distributor of the Trust’s shares. The Trust is permitted to reimburse AGID on a quarterly basis, out of the Administrative Class assets of the Portfolio in the amount of 0.15% on an annual basis of the average daily net assets of that class, for payments made to financial intermediaries that provide services in connection with the distribution of shares or administration of plans or programs that use Portfolio shares as their funding medium. The effective rate paid to AGID was 0.15% during the current fiscal year.
Expenses. The Trust is responsible for the following expenses: (i) salaries and other compensation of any of the Trust’s executive officers and employees who are not officers, directors, stockholders or employees of PIMCO or its subsidiaries or affiliates; (ii) taxes and governmental fees; (iii) brokerage fees and commissions and other portfolio transaction expenses; (iv) the costs of borrowing money, including interest expenses and bank overdraft charges; (v) fees and expenses of the Trustees who are not “interested persons” of PIMCO or the Trust, and any counsel retained exclusively for their benefit; (vi) extraordinary expenses, including costs of litigation and indemnification expenses; (vii) organization expenses and (viii) any expenses allocated or allocable to a specific class of shares, which include service fees payable with respect to the Administrative Class shares and may include certain other expenses as permitted by the Trust’s Multiple Class Plan adopted pursuant to Rule 18f-3 under the Act and subject to review and approval by the Trustees. The ratio of expenses to average net assets per share class, as disclosed in the Financial Highlights, may differ from the annual portfolio operating expenses per share class as disclosed in the Prospectus for the reasons set forth above.
PIMCO has agreed to waive a portion of its administrative fees to the extent that the payment of the Portfolio’s pro rata share of organization expenses and Trustee fees cause the actual expense ratio to rise above the rates disclosed in the then-current prospectus plus 0.49 basis points as set forth below (calculated as a percentage of the Portfolio’s average daily net assets attributable to each class):
| | | |
| Administrative Class | | 0.60 | % |
PIMCO may be reimbursed for these waived amounts in future periods, not to exceed thirty-six months. Expenses that have been waived and may still be reimbursed by the Administrator, to the extent the Portfolio’s annualized total portfolio operating expenses plus the amount so reimbursed does not exceed the operating expense limitation, are as follows (amounts in thousands):
| | | | | | | | | | | | | | | | | | | | |
| | | | | | Year of Waiver |
| | | | | | 12/31/2003 | | | | | 12/31/2004 | | | | | 12/31/2005 | | | | | 06/30/2006 |
Amount Available for Reimbursement | | | | $ | 12 | | | | $ | 0 | | | | $ | 0 | | | | $ | 0 |
For the current period ended June 30, 2006, each unaffiliated Trustee received an annual retainer of $15,000, plus $2,000 for each Board of Trustees quarterly meeting attended, $500 for each Board of Trustees committee meeting attended and $500 for each special board meeting attended, plus reimbursement of related expenses. In addition, each Committee Chair received an additional annual retainer of $500 and each Audit Committee Chair received an additional annual retainer of $1,500. These expenses are allocated on a pro-rata basis to each Portfolio of the Trust according to its respective net assets. The Trust pays no compensation directly to any Trustee or any other officer who is affiliated with the Administrator, all of whom receive remuneration for their services to the Trust from the Administrator or its affiliates.
4. PURCHASES AND SALES OF SECURITIES
The length of time the Portfolio has held a particular security is not generally a consideration in investment decisions. A change in the securities held by the Portfolio is known as “portfolio turnover”. The Portfolio may engage in frequent and active trading of portfolio securities to achieve its investment objective, particularly during periods of volatile market movements. High portfolio turnover (e.g., over 100%) involves correspondingly greater expenses to the Portfolio, including brokerage commissions or dealer mark-ups and other transaction costs on the sale of securities and reinvestments in other securities. Such sales may also result in realization of taxable capital gains, including short-term capital gains (which are generally taxed at ordinary income tax rates). The trading costs and tax effects associated with portfolio turnover may adversely affect the Portfolio’s performance.
Purchases and sales of securities (excluding short-term investments) for the period ended June 30, 2006 were as follows (amounts in thousands):
| | | | | | | | | | | | | | | | | | |
| | | | U.S Government/Agency | | | | | All Other |
| | | | Purchases | | | | | Sales | | | | | Purchases | | | | | Sales |
| | | $ | 0 | | | | $ | 0 | | | | $ | 159,640 | | | | $ | 113,374 |
| | | | | | |
| | | Semiannual Report | | June 30, 2006 | | 11 |
Notes to Financial Statements (Cont.)
5. SHARES OF BENEFICIAL INTEREST
The Portfolio may issue an unlimited number of shares of beneficial interest with a $0.001 par value. Changes in shares of beneficial interest were as follows (shares and amounts in thousands):
| | | | | | | | | | | | | | | | | | |
| | | | | Six Months Ended
06/30/2006 | | | | | Year Ended
12/31/2005 | |
| | | | | Shares | | | Amount | | | | | Shares | | | Amount | |
| | | | | | |
Receipts for shares sold | | | | | | | | | | | | | | | | | | |
Institutional Class | | | | 1 | | | $ | 10 | | | | | 0 | | | $ | 0 | |
Administrative Class | | | | 2,843 | | | | 33,411 | | | | | 14,121 | | | | 166,191 | |
Advisor Class | | | | 5,043 | | | | 58,213 | | | | | 632 | | | | 7,545 | |
Class M | | | | 982 | | | | 11,550 | | | | | 4,617 | | | | 54,317 | |
Issued as reinvestment of distributions | | | | | | | | | | | | | | | | | | |
Institutional Class | | | | 0 | | | | 0 | | | | | 0 | | | | 0 | |
Administrative Class | | | | 437 | | | | 5,038 | | | | | 828 | | | | 9,815 | |
Advisor Class | | | | 56 | | | | 632 | | | | | 15 | | | | 182 | |
Class M | | | | 107 | | | | 1,232 | | | | | 200 | | | | 2,364 | |
Cost of shares redeemed | | | | | | | | | | | | | | | | | | |
Institutional Class | | | | 0 | | | | 0 | | | | | 0 | | | | 0 | |
Administrative Class | | | | (4,149 | ) | | | (48,154 | ) | | | | (2,453 | ) | | | (29,204 | ) |
Advisor Class | | | | (37 | ) | | | (431 | ) | | | | (17 | ) | | | (208 | ) |
Class M | | | | (1,114 | ) | | | (12,991 | ) | | | | (689 | ) | | | (8,152 | ) |
Net increase resulting from Portfolio share transactions | | | | 4,169 | | | $ | 48,510 | | | | | 17,254 | | | $ | 202,850 | |
The following schedule shows the number of shareholders each owning 5% or more of the Portfolio and the total percentage of the Portfolio held by such shareholders:
| | | | | | | |
| | | | | Number of
Shareholders | | % of Portfolio
Held | |
Institutional Class | | | | 1 | | 100 | |
Administrative Class | | | | 2 | | 89 | * |
Advisor Class | | | | 2 | | 93 | |
Class M | | | | 3 | | 97 | |
* Allianz Life Insurance Co. of North America, an indirect wholly owned subsidiary of AGI and a related party to the Portfolio, owned 25% or more of the outstanding shares of beneficial interest of the Portfolio and therefore may be presumed to “control” the Portfolio, as that term is defined in the 1940 Act.
6. AFFILIATED TRANSACTIONS
The Underlying Funds are considered to be affiliated with the Portfolio. The table below shows the transactions in and earnings from investments in these affiliated Funds for the period ended June 30, 2006 (amounts in thousands):
| | | | | | | | | | | | | | | | | | | | | | | |
| Underlying Funds | | Market Value
12/31/2005 | | Purchases
at Cost | | Proceeds
from Sales | | Unrealized
Appreciation
(Depreciation) | | | Market Value
6/30/2006 | | Dividend
Income | | Net Capital and
Realized
Gain (Loss) | |
CommodityRealReturn Strategy Fund® | | $ | 11,984 | | $ | 3,509 | | $ | 6,126 | | $ | 130 | | | $ | 9,395 | | $ | 46 | | $ | (270 | ) |
Convertible Fund | | | 1,193 | | | 16 | | | 0 | | | 66 | | | | 1,240 | | | 16 | | | 0 | |
Developing Local Markets Fund | | | 23,695 | | | 11,797 | | | 5,002 | | | 582 | | | | 30,946 | | | 529 | | | 96 | |
Diversified Income Fund | | | 0 | | | 1,051 | | | 0 | | | (19 | ) | | | 1,031 | | | 11 | | | 0 | |
Emerging Markets Bond Fund | | | 26,326 | | | 9,172 | | | 13,874 | | | 321 | | | | 20,552 | | | 756 | | | (215 | ) |
Floating Income Fund | | | 23,662 | | | 14,886 | | | 8,178 | | | 272 | | | | 30,396 | | | 678 | | | 65 | |
Foreign Bond Fund (Unhedged) | | | 7,223 | | | 1,078 | | | 7,621 | | | 25 | | | | 833 | | | 80 | | | (356 | ) |
Fundamental IndexPLUS® Fund | | | 1,258 | | | 1,753 | | | 1,411 | | | 28 | | | | 1,666 | | | 18 | | | 24 | |
Fundamental IndexPLUS® TR Fund | | | 10,704 | | | 972 | | | 3,795 | | | (28 | ) | | | 7,823 | | | 164 | | | (158 | ) |
GNMA Fund | | | 3,197 | | | 539 | | | 988 | | | (63 | ) | | | 2,670 | | | 70 | | | (9 | ) |
High Yield Fund | | | 20,384 | | | 705 | | | 8,205 | | | (76 | ) | | | 12,554 | | | 705 | | | (85 | ) |
International StocksPLUS® TR Strategy Fund | | | 10,584 | | | 12,012 | | | 75 | | | (675 | ) | | | 22,025 | | | 379 | | | (9 | ) |
Long-Term U.S. Government Fund | | | 39,326 | | | 3,546 | | | 13,541 | | | (2,088 | ) | | | 26,893 | | | 717 | | | (831 | ) |
Low Duration Fund | | | 4,844 | | | 12,249 | | | 13,954 | | | (2 | ) | | | 2,993 | | | 158 | | | (146 | ) |
Real Return Asset Fund | | | 49,421 | | | 59,336 | | | 997 | | | (4,724 | ) | | | 103,412 | | | 1,423 | | | (38 | ) |
Real Return Fund | | | 43,544 | | | 24,385 | | | 591 | | | (2,425 | ) | | | 65,726 | | | 995 | | | (45 | ) |
RealEstateRealReturn Strategy Fund | | | 10,989 | | | 230 | | | 9,873 | | | 36 | | | | 1,756 | | | 230 | | | (537 | ) |
Short-Term Fund | | | 0 | | | 76 | | | 66 | | | 0 | | | | 10 | | | 0 | | | 0 | |
StocksPLUS® Fund | | | 70 | | | 1 | | | 0 | | | 3 | | | | 72 | | | 1 | | | 0 | |
StocksPLUS® Total Return Fund | | | 1,687 | | | 21 | | | 0 | | | (59 | ) | | | 1,679 | | | 21 | | | 0 | |
Total Return Fund | | | 26,281 | | | 2,128 | | | 12,615 | | | (576 | ) | | | 15,036 | | | 542 | | | (463 | ) |
Total Return Mortgage Fund | | | 10,041 | | | 178 | | | 6,462 | | | (123 | ) | | | 3,586 | | | 178 | | | (178 | ) |
Totals | | $ | 326,413 | | $ | 159,640 | | $ | 113,374 | | $ | (9,395 | ) | | $ | 362,294 | | $ | 7,717 | | $ | (3,155 | ) |
| | | | |
| 12 | | PIMCO Variable Insurance Trust | | |
| | |
| |
| | | June 30, 2006 (Unaudited) |
7. FEDERAL INCOME TAX MATTERS
As of June 30, 2006, the aggregate cost of investments was the same for federal income tax and financial statement purposes. The net unrealized appreciation (depreciation) of investment securities for federal income tax purposes is as follows (amounts in thousands):
| | | | |
Aggregate
Gross
Unrealized
Appreciation | | Aggregate
Gross
Unrealized
(Depreciation) | | Net
Unrealized
(Depreciation) |
$ 1,463 | | $ (10,857) | | $ (9,394) |
8. REGULATORY AND LITIGATION MATTERS
On June 1, 2004, the Attorney General of the State of New Jersey announced that it had dismissed PIMCO from a complaint filed by the New Jersey Attorney General on February 17, 2004, and that it had entered into a settlement agreement (the “New Jersey Settlement”) with Allianz Global Investors of America L.P. (“AGI”) (formerly known as Allianz Dresdner Asset Management of America L.P.), PEA Capital LLC (an entity affiliated with PIMCO through common ownership) (“PEA”) and Allianz Global Investors Distributors LLC (“AGID”), in connection with the same matter. In the New Jersey Settlement, AGI, PEA and AGID neither admitted nor denied the allegations or conclusions of law, but did agree to pay New Jersey a civil fine of $15 million and $3 million for investigative costs and further potential enforcement initiatives against unrelated parties. They also undertook to implement certain governance changes. The complaint relating to the New Jersey Settlement alleged, among other things, that AGI, PEA and AGID had failed to disclose that they improperly allowed certain hedge funds to engage in “market timing” in certain funds. The complaint sought injunctive relief, civil monetary penalties, restitution and disgorgement of profits.
Since February 2004, PIMCO, AGI, PEA, AGID, and certain of their affiliates, including the PIMCO Funds, the Allianz Funds (formerly known as PIMCO Funds: Multi-Manager Series), and the Trustees and employees of the PIMCO Funds, have been named as defendants in fifteen lawsuits filed in various jurisdictions. Eleven of those lawsuits concern “market timing,” and they have been transferred to and consolidated for pre-trial proceedings in a multi-district litigation proceeding in the U.S. District Court for the District of Maryland; the other four lawsuits concern “revenue sharing” and have been consolidated into a single action in the U.S. District Court for the District of Connecticut. The lawsuits have been commenced as putative class actions on behalf of investors who purchased, held or redeemed shares of the various series of the PIMCO Funds and the Allianz Funds during specified periods, or as derivative actions on behalf of the PIMCO Funds and Allianz Funds.
The market timing actions in the District of Maryland generally allege that certain hedge funds were allowed to engage in “market timing” in certain of the Allianz Funds and the PIMCO Funds and this alleged activity was not disclosed. Pursuant to tolling agreements entered into with the derivative and class action plaintiffs, PIMCO, the Trustees, and certain employees of PIMCO who were previously named as defendants have all been dropped as defendants in the market timing actions; the plaintiffs continue to assert claims on behalf of the shareholders of the PIMCO Funds or on behalf of the PIMCO Funds themselves against other defendants. By order dated November 3, 2005, the U.S. District Court for the District of Maryland granted the PIMCO Funds’ motion to dismiss claims asserted against it in a consolidated amended complaint where the PIMCO Funds were named, in the complaint, as a nominal defendant. The revenue sharing action in the District of Connecticut generally alleges that fund assets were inappropriately used to pay brokers to promote the Allianz Funds and PIMCO Funds, including directing fund brokerage transactions to such brokers, and that such alleged arrangements were not fully disclosed to shareholders. On August 11, 2005 the U.S. District Court for the District of Connecticut conducted a hearing on defendants’ motion to dismiss the consolidated amended complaint in the revenue sharing action but has not yet ruled on the motion to dismiss. The market timing and revenue sharing lawsuits seek, among other things, unspecified compensatory damages plus interest and, in some cases, punitive damages, the rescission of investment advisory contracts, the return of fees paid under those contracts and restitution.
Under Section 9(a) of the Investment Company Act of 1940, as amended (“1940 Act”), if the New Jersey Settlement or any of the lawsuits described above were to result in a court injunction against AGI, PEA, AGID and/or their affiliates, PIMCO could, in the absence of exemptive relief granted by the SEC, be barred from serving as an investment adviser, and AGID could be barred from serving as principal underwriter, to any registered investment company, including the Portfolios of the Trust. In connection with an inquiry from the SEC concerning the status of the New Jersey Settlement under Section 9(a), PEA, AGID, AGI and certain of their affiliates (including PIMCO) (together, the “Applicants”) have sought exemptive relief from the SEC under Section 9(c) of the 1940 Act. The SEC has granted the Applicants a temporary exemption from the provisions of Section 9(a) with respect to the New Jersey Settlement until the earlier of (i) September 13, 2006 and (ii) the date on which the SEC takes final action on their application for a permanent order. There is no assurance that the SEC will issue a permanent order.
Two nearly identical class action civil complaints have been filed in August 2005, in the Northern District of Illinois Eastern Division alleging that the plaintiffs each purchased and sold a 10-year Treasury note futures contract and suffered damages from an alleged shortage when PIMCO held both physical and futures positions in 10-year Treasury notes for its client accounts. The two actions have been consolidated into one action, and the two separate complaints have been replaced by a consolidated complaint. PIMCO is a named defendant, and the PIMCO Funds have been added as a defendant, to the consolidated action. PIMCO strongly believes the complaint (and any consolidated complaint filed hereafter) is without merit and intends to vigorously defend itself.
Certain Portfolios of the Trust were recently served in an adversary proceeding brought by the Official Committee of Asbestos Claimants of G-I Holdings, Inc. in G-I Holdings, Inc.’s bankruptcy in the District of New Jersey. PIMCO was previously named in this lawsuit and remains a defendant. The plaintiff seeks to recover for the bankruptcy estate assets that were transferred by the predecessor entity of G-I Holdings, Inc. to a wholly-owned subsidiary in 1994. The subsidiary has since issued notes, of which certain Portfolios of the Trust are alleged to be holders. The complaint alleges that in 2000, more than two hundred noteholders —including certain Portfolios of the Trust—were granted a second priority lien on the assets of the subsidiary in exchange for their consent to a refinancing transaction and the granting of a first priority lien to the lending banks. The plaintiff is seeking invalidation of the lien in favor of the noteholders and/or the value of the lien.
It is possible that these matters and/or other developments resulting from these matters could result in increased fund redemptions or other adverse consequences to the Portfolios. However, PIMCO and AGID believe that these matters are not likely to have a material adverse effect on the Portfolios or on PIMCO’s or AGID’s ability to perform their respective investment advisory or distribution services relating to the Portfolios.
| | | | | | |
| | | Semiannual Report | | June 30, 2006 | | 13 |
Investment Adviser and Administrator
Pacific Investment Management Company LLC
840 Newport Center Drive
Newport Beach, California 92660
Distributor
Allianz Global Investors Distributors LLC
2187 Atlantic Street
Stamford, Connecticut 06902
Custodian
State Street Bank & Trust Company
801 Pennsylvania
Kansas City, Missouri 64105
Transfer Agent
Boston Financial Data Services–Midwest
330 W. 9th Street
Kansas City, Missouri 64105
Legal Counsel
Dechert LLP
1775 I Street, N.W.
Washington, D.C. 20006
Independent Registered Public Accounting Firm
PricewaterhouseCoopers LLP
1055 Broadway
Kansas City, Missouri 64105
P I M C O

Share Class M
Semiannual Report June 30, 2006
PIMCO Variable Insurance Trust
All Asset Portfolio
Table of Contents
This material is authorized for use only when preceded or accompanied by the current PIMCO Variable Insurance Trust (the “Trust”) prospectus. Investors should consider the investment objectives, risks, charges and expenses of this Trust carefully before investing. Ask your financial professional to explain all charges that may apply. This and other information is contained in the Trust’s prospectus. The variable product prospectus may be obtained by contacting your Investment Consultant. Please read the Trust and variable product prospectus carefully before you invest or send money.
Chairman’s Letter
Dear PIMCO Variable Insurance Trust Shareholder:
It is our pleasure to present to you the semiannual report for the PIMCO Variable Insurance Trust covering the six-month period ended June 30, 2006.
Highlights of the global bond markets during the six-month period included:
| | n | | Most fixed-income sectors lost ground during the first half of 2006, as concern about accelerating inflation and central bank tightening pushed interest rates higher worldwide. The benchmark Lehman Brothers Aggregate Bond Index (which includes Treasury, Investment-Grade Corporate, and Residential Mortgage-Backed Securities) returned -0.72% for the first six months of the year. On June 30, the benchmark ten-year Treasury yielded 5.14%, 0.75% higher than at the start of the year. The U.S. yield curve remained flat as shorter-maturity yields rose by a comparable amount. |
| | n | | The Federal Reserve tightened four times during the reporting period, bringing the Federal Funds Rate to 5.25%. The increase near the end of the period was the Federal Reserve’s 17th consecutive rate hike since the start of its tightening cycle in 2004. The Federal Reserve was not alone, as central banks in Europe, India, and China tightened credit in unison for the first time since 2000. The Bank of Japan, whose zero-interest-rate policy has flooded global markets with liquidity, looked set to reverse this policy in the coming months. |
In these pages please find a more complete Portfolio review as it relates to financial-market activities, as well as details about total-return investment performance for the six-month reporting period. Thank you for the trust you have placed in us. We will continue to work diligently to meet your investment needs.
Sincerely,
Brent R. Harris
Chairman, PIMCO Variable Insurance Trust
July 31, 2006
| | | | | | |
| | | Semiannual Report | | June 30, 2006 | | 1 |
Important Information About the Portfolio
PIMCO Variable Insurance Trust (the “Trust”) is an open-end management investment company currently consisting of nineteen separate investment portfolios, including the All Asset Portfolio (the “Portfolio”). The Portfolio is only available as a funding vehicle under variable life insurance policies or variable annuity contracts issued by insurance companies (“Variable Contracts”). Individuals may not purchase shares of the Portfolio directly. Shares of the Portfolio also may be sold to qualified pension and retirement plans outside of the separate account context.
The Portfolio is a “fund of funds,” which is a term used to describe mutual funds that pursue their investment objective by investing in other mutual funds instead of investing directly in stocks or bonds of other issuers. Under normal circumstances, the Portfolio invests substantially all of its assets in Institutional Class shares of PIMCO Funds, an affiliated open-end investment company, except the All Asset and All Asset All Authority Funds (“Underlying Funds”).
Among the principal risks of investing in the Portfolio are allocation risk, Underlying Fund risk and issuer non-diversification risk. The Portfolio also is indirectly subject to the risks of the Underlying Funds, which may include, but are not limited to, the following: interest rate risk, credit risk, high yield risk, market risk, issuer risk, variable dividends risk, liquidity risk, derivatives risk, commodity risk, equity risk, mortgage risk, non-U.S. investment risk, real estate risk, emerging markets risk, currency risk, issuer non-diversification risk, leveraging risk, small company risk, management risk, California state specific risk, New York state specific risk, tax risk and index risk. A complete description of these risks is contained in the Portfolio’s prospectus. An Underlying Fund may use derivative instruments for hedging purposes or as part of an investment strategy. Use of these instruments may involve certain costs and risks such as liquidity risk, interest rate risk, market risk, credit risk, management risk and the risk that the Underlying Fund could not close out a position when it would be most advantageous to do so. An Underlying Fund investing in derivatives could lose more than the principal amount invested in these instruments. Investing in non-U.S. securities may entail risk due to non-U.S. economic and political developments; this risk may be increased when investing in emerging markets.
The cost of investing in the Portfolio will generally be higher than the cost of investing in a mutual fund that invests directly in individual stocks and bonds. By investing in the Portfolio, an investor will indirectly bear fees and expenses charged by the Underlying Funds in addition to the Portfolio’s direct fees and expenses.
On the performance summary page in this Semiannual Report, the Total Return Investment Performance table measures performance assuming that all dividend and capital gain distributions were reinvested.
An investment in the Portfolio is not a deposit of a bank and is not guaranteed or insured by the Federal Deposit Insurance Corporation or any other government agency. It is possible to lose money on investments in the Portfolio.
PIMCO has adopted written proxy voting policies and procedures (“Proxy Policy”) as required by Rule 206(4)-6 under the Investment Advisers Act of 1940. The Proxy Policy has been adopted by the Trust as the policies and procedures that PIMCO will use when voting proxies on behalf of the Portfolio. Copies of the written Proxy Policy and the factors that PIMCO may consider in determining how to vote proxies for the Portfolio, and information about how the Portfolio voted proxies relating to portfolio securities held during the most recent twelve-month period ended June 30, are available without charge, upon request, by calling the Trust at 1-866-746-2606 and on the Securities and Exchange Commission’s (“SEC”) website at http://www.sec.gov.
The Portfolio files its complete schedule of portfolio holdings with the SEC for the first and third quarters of each fiscal year on Form N-Q. A copy of the Trust’s Form N-Q is available on the SEC’s website at http://www.sec.gov and may be reviewed and copied at the SEC’s Public Reference Room in Washington D.C. Information on the operation of the Public Reference Room may be obtained by calling 1-800-SEC-0330.
PIMCO Variable Insurance Trust is distributed by Allianz Global Investors Distributors LLC, 2187 Atlantic Street, Stamford, CT 06902.
| | | | |
| 2 | | PIMCO Variable Insurance Trust | | |
The following disclosure provides important information regarding the Portfolio’s Expense Example (“Example” or “Expense Example”), which appears in this Semiannual Report. Please refer to this information when reviewing the Expense Example for the Portfolio.
Example
As a shareholder of the Portfolio, you incur two types of costs: (1) transaction costs and (2) ongoing costs, including advisory and administrative fees; distribution and/or service (12b-1) fees (Administrative Class, Advisor Class and Class M only); and other Portfolio expenses. The Example is intended to help you understand your ongoing costs (in dollars) of investing in the Portfolio and to compare these costs with the ongoing costs of investing in other mutual funds. The Expense Example does not reflect any fees or other expenses imposed by the Variable Contracts. If it did, the expenses reflected in the Expense Examples would be higher. The Example is based on an investment of $1,000 invested at the beginning of the period and held for the entire period indicated, which is from January 1, 2006 to June 30, 2006.
Actual Expenses
The information in the table under the heading “Actual Performance” provides information about actual account values and actual expenses. You may use the information in these columns, together with the amount you invested, to estimate the expenses that you paid over the period. Simply divide your account value by $1,000 (for example, an $8,600 account value divided by $1,000 = 8.60), then multiply the result by the number in the appropriate column for your share class, in the row titled “Expenses Paid During Period” to estimate the expenses you paid on your account during this period.
Hypothetical Example for Comparison Purposes
The information in the table under the heading “Hypothetical Performance (5% return before expenses)” provides information about hypothetical account values and hypothetical expenses based on the Portfolio’s actual expense ratio and an assumed rate of return of 5% per year before expenses, which is not the Portfolio’s actual return. The hypothetical account values and expenses may not be used to estimate the actual ending account balance or expenses you paid for the period. You may use this information to compare the ongoing costs of investing in the Portfolio and other portfolios. To do so, compare this 5% hypothetical example with the 5% hypothetical examples that appear in the shareholder reports of the other portfolios.
Please note that the expenses shown in the table are meant to highlight your ongoing costs only and do not reflect any transactional costs. Therefore, the information under the heading “Hypothetical Performance (5% return before expenses)” is useful in comparing ongoing costs only, and will not help you determine the relative total costs of owning different portfolios. In addition, if these transactional costs were included, your costs would have been higher.
The expense ratio may vary period to period because of various factors, such as an increase in expenses not covered by the advisory and administrative fees (such as expenses of the trustees and their counsel or litigation expense).
Portfolio Benchmarks
Lehman Brothers U.S. TIPS: 1-10 Year is an unmanaged index market comprised of U.S. Treasury Inflation Linked securities having a maturity of at least 1 year and less than 10 years. It is not possible to invest directly in such an unmanaged index.
The CPI + 500 Basis Points benchmark is created by adding 5% to the annual percentage change in the Consumer Price Index (“CPI”). This index reflects non-seasonally adjusted returns. The CPI is an unmanaged index representing the rate of inflation of the U.S. consumer prices as determined by the US Department of Labor Statistics. There can be no guarantee that the CPI or other indexes will reflect the exact level of inflation at any given time.
| | | | | | |
| | | Semiannual Report | | June 30, 2006 | | 3 |
|
|
| PIMCO All Asset Portfolio |
|
Cumulative Returns Through June 30, 2006
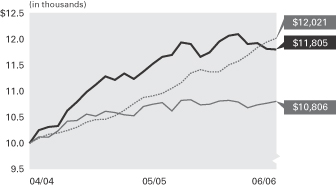
Consumer Price
All Asset Index + 500 Lehman Brothers U.S.
Portfolio M Class Basis points TIPS 1-10 Year Index
----------------- -------------- --------------------
04/30/2004 $10,000 $10,000 $10,000
05/31/2004 10,255 10,100 10,124
06/30/2004 10,316 10,174 10,116
07/31/2004 10,335 10,201 10,242
08/31/2004 10,628 10,249 10,427
09/30/2004 10,798 10,313 10,437
10/31/2004 10,988 10,410 10,564
11/30/2004 11,130 10,459 10,527
12/31/2004 11,285 10,464 10,617
01/31/2005 11,217 10,530 10,590
02/28/2005 11,344 10,634 10,552
03/31/2005 11,241 10,762 10,532
04/30/2005 11,377 10,879 10,707
05/31/2005 11,524 10,913 10,753
06/30/2005 11,661 10,964 10,780
07/31/2005 11,701 11,061 10,623
08/31/2005 11,937 11,163 10,828
09/30/2005 11,910 11,346 10,838
10/31/2005 11,662 11,416 10,742
11/30/2005 11,751 11,372 10,752
12/31/2005 11,956 11,374 10,816
01/31/2006 12,067 11,508 10,825
02/28/2006 12,098 11,579 10,793
03/31/2006 11,907 11,691 10,684
04/30/2006 11,927 11,839 10,738
05/31/2006 11,815 11,948 10,774
06/30/2006 11,805 12,021 10,806
$10,000 invested at the beginning of the first full month following the inception date of the Portfolio’s Class M.
Regional Breakdown‡
| | |
Real Return Asset | | 28.4% |
Real Return | | 18.1% |
Developing Local Markets | | 8.5% |
Floating Income | | 8.3% |
Long-Term U.S. Government | | 7.4% |
International StocksPLUS® TR Strategy Fund | | 6.0% |
Emerging Markets Bond | | 5.6% |
Other | | 17.7% |
| | ‡ | % of Total Investments as of June 30, 2006 |
| | | | | | | | | | |
| Average Annual Total Return for the period ended June 30, 2006 |
| | | | | | | 6 Months* | | 1 Year | | Portfolio
Inception
(04/30/04) |
| | |
| | All Asset Portfolio M Class | | -1.26% | | 1.23% | | 7.96% |
| | | - - - - | | Consumer Price Index + 500 Basis points | | 5.69% | | 9.64% | | 8.87% |
| | |
| | Lehman Brothers U.S. TIPS 1-10 Year Index | | -0.09% | | 0.24% | | 3.65% |
* Cumulative return. All Portfolio returns are net of fees and expenses.
Past performance is no guarantee of future results. The performance quoted represents past performance. Investment return and principal value will fluctuate so that Fund shares, when redeemed, may be worth more or less than their original cost. The Portfolio’s performance does not reflect the deduction of additional charges and expenses imposed in connection with investing in Variable Contracts, which will reduce returns. Current performance may be lower or higher than the performance data quoted. Performance data current to the most recent month-end is available by calling (800) 927-4648.
| | | | | | | | | | |
| Expense Example | | | | Actual Performance | | | | Hypothetical Performance |
| | | | | | | | | (5% return before expenses) |
Beginning Account Value (01/01/06) | | | | $ | 1,000.00 | | | | $ | 1,000.00 |
Ending Account Value (06/30/06) | | | | $ | 987.40 | | | | $ | 1,020.33 |
Expenses Paid During Period† | | | | $ | 4.43 | | | | $ | 4.51 |
† Expenses are equal to the Portfolio’s Class M annualized expense ratio of 0.90%, multiplied by the average account value over the period, multiplied by 181/365 (to reflect the one-half year period). The expense ratio excludes the expenses of the Underlying Funds, which based upon the allocation of the Portfolio’s assets among the Underlying Funds are indirectly borne by the shareholders of the Portfolio. The Underlying Fund Expenses for the Portfolio are estimated at 0.63%. Overall fees and expenses of investing in the Portfolio will be higher because the example does not reflect Variable Contract fees and expenses.
Please refer to page 3 herein for a description of the Portfolio’s benchmark and an explanation of the information presented in the above Expense Example.
Portfolio Insights
| » | | The PIMCO All Asset Portfolio seeks to achieve its investment objective by investing under normal circumstances substantially all of its assets in Institutional Class Shares of the Underlying Funds (i.e., any of the PIMCO Funds, except the All Asset and All Asset All Authority Funds). |
| » | | Significant exposure to the Treasury Inflation-Protected Securities (“TIPS”) asset class detracted significantly from tactical asset allocation alpha due to the asset class, particularly longer dated TIPS, posting negative returns. |
| » | | Less than optimal exposure to commodities detracted from performance, as the Dow Jones AIG Commodity Index returned 3.58% over the period. |
| » | | Less than optimal exposure to Real Estate Investment Trusts (“REITs”) detracted from performance, as the Dow Jones Wilshire REIT Index gained 14.40% for the period. |
| » | | Significant exposure to lower duration instruments was positive for performance, as lower duration assets tend to outperform assets with longer duration in a rising interest rate environment. Exposure to the Floating Rate Income Fund provided positive returns. |
| » | | Significant exposure to the Developing Local Markets Fund and emerging market currencies added to performance with the fund returning 4.34%. |
| » | | Exposure to the High Yield Fund was positive due to coupon selection providing solid returns for the period. |
| | | | |
| 4 | | PIMCO Variable Insurance Trust | | |
| | |
| |
| Financial Highlights All Asset Portfolio Class M | | June 30, 2006 (Unaudited) |
| | | | | | | | | | | | |
| Selected Per Share Data for the Year or Period Ended: | | 06/30/2006+ | | | 12/31/2005 | | | 04/30/2004-
12/31/2004 | |
| | | |
Class M | | | | | | | | | | | | |
| Net asset value beginning of period | | $ | 11.80 | | | $ | 11.60 | | | $ | 10.59 | |
| Net investment income (a) | | | 0.21 | | | | 0.85 | | | | 0.96 | |
| Net realized/unrealized gain (loss) on investments (a) | | | (0.36 | ) | | | (0.16 | ) | | | 0.39 | |
| Total income (loss) from investment operations | | | (0.15 | ) | | | 0.69 | | | | 1.35 | |
| Dividends from net investment income | | | (0.21 | ) | | | (0.45 | ) | | | (0.33 | ) |
| Distributions from net realized capital gains | | | 0.00 | | | | (0.04 | ) | | | (0.01 | ) |
| Total distributions | | | (0.21 | ) | | | (0.49 | ) | | | (0.34 | ) |
| Net asset value end of period | | $ | 11.44 | | | $ | 11.80 | | | $ | 11.60 | |
| Total return | | | (1.26 | )% | | | 5.94 | % | | | 12.85 | % |
| Net assets end of period (000s) | | $ | 65,063 | | | $ | 67,365 | | | $ | 18,345 | |
| Ratio of expenses to average net assets | | | 0.90 | %* | | | 0.89 | %(b)(c) | | | 0.87 | %*(b)(c) |
| Ratio of net investment income to average net assets | | | 3.60 | %* | | | 7.16 | % | | | 12.66 | %* |
| Portfolio turnover rate | | | 33 | % | | | 75 | % | | | 93 | % |
+ Unaudited
* Annualized
(a) Per share amounts based on average number of shares outstanding during the period.
(b) Ratio of expenses to average net assets excluding underlying Funds’ expense in which the Portfolio invests.
(c) If the investment manager had not reimbursed expenses, the ratio of expenses to average net assets would have been 0.90%.
| | | | | | |
| See Accompanying Notes | | Semiannual Report | | June 30, 2006 | | 5 |
| | |
| |
| Statement of Assets and Liabilities All Asset Portfolio | | |
| | | | |
| (Amounts in thousands, except per share amounts) | | June 30, 2006
(Unaudited) | |
| |
Assets: | | | | |
Investments in Affiliates, at value | | $ | 364,075 | |
Cash | | | 1 | |
Receivable for Portfolio shares sold | | | 2,020 | |
Interest and dividends receivable from Affiliates | | | 1,899 | |
| | | | 367,995 | |
| |
Liabilities: | | | | |
Payable for investments in Affiliates purchased | | $ | 3,433 | |
Payable for Portfolio shares redeemed | | | 228 | |
Accrued investment advisory fee | | | 62 | |
Accrued administration fee | | | 77 | |
Accrued servicing fee | | | 62 | |
Recoupment payable to Manager | | | 5 | |
| | | | 3,867 | |
| |
Net Assets | | $ | 364,128 | |
| |
Net Assets Consist of: | | | | |
Paid in capital | | $ | 368,395 | |
Undistributed net investment income | | | 6,814 | |
Accumulated undistributed net realized (loss) | | | (1,686 | ) |
Net unrealized (depreciation) | | | (9,395 | ) |
| | | $ | 364,128 | |
| |
Net Assets: | | | | |
Institutional Class | | $ | 10 | |
Administrative Class | | | 233,824 | |
Advisor Class | | | 65,231 | |
Class M | | | 65,063 | |
| |
Shares Issued and Outstanding: | | | | |
Institutional Class | | | 1 | |
Administrative Class | | | 20,415 | |
Advisor Class | | | 5,693 | |
Class M | | | 5,684 | |
| |
Net Asset Value and Redemption Price Per Share (Net Assets Per Share Outstanding) | | | | |
Institutional Class | | $ | 11.45 | |
Administrative Class | | | 11.45 | |
Advisor Class | | | 11.45 | |
Class M | | | 11.44 | |
| |
Cost of Investments in Affiliates Owned | | $ | 373,469 | |
| | | | |
| 6 | | PIMCO Variable Insurance Trust | | See Accompanying Notes |
| | |
| |
| Statement of Operations All Asset Portfolio | | |
| | | | |
| (Amounts in Thousands) | | Six Months Ended
June 30, 2006
(Unaudited) | |
| |
Investment Income: | | | | |
Interest | | $ | 14 | |
Dividends from Affiliate investments | | | 7,717 | |
Total Income | | | 7,731 | |
| |
Expenses: | | | | |
Investment advisory fees | | | 337 | |
Administration fees | | | 422 | |
Servicing fees – Administrative Class | | | 190 | |
Distribution and/or servicing fees – Advisor Class | | | 21 | |
Distribution and/or servicing fees – Class M | | | 152 | |
Interest expense | | | 1 | |
Miscellaneous expense | | | 10 | |
Total Expenses | | | 1,133 | |
| |
Net Investment Income | | | 6,598 | |
| |
Net Realized and Unrealized (Loss): | | | | |
Net realized (loss) on Affiliate investments | | | (3,155 | ) |
Net change in unrealized (depreciation) on Affiliate investments | | | (7,231 | ) |
Net (Loss) | | | (10,386 | ) |
| |
Net (Decrease) in Net Assets Resulting from Operations | | $ | (3,788 | ) |
| | | | | | |
| See Accompanying Notes | | Semiannual Report | | June 30, 2006 | | 7 |
| | |
| |
| Statements of Changes in Net Assets All Asset Portfolio | | |
| | | | | | | | |
| (Amounts In Thousands) | | Six Months Ended
June 30, 2006
(Unaudited) | | | Year Ended
December 31, 2005 | |
| | |
Increase (Decrease) in Net Assets from: | | | | | | | | |
| | |
Operations: | | | | | | | | |
Net investment income | | $ | 6,598 | | | $ | 16,918 | |
Net realized gain (loss) on Affiliate investments | | | (3,155 | ) | | | 1,306 | |
Net capital (loss) distributions received from Underlying Funds | | | 0 | | | | 712 | |
Net change in unrealized (depreciation) on Affiliate investments | | | (7,231 | ) | | | (3,656 | ) |
Net increase (decrease) resulting from operations | | | (3,788 | ) | | | 15,280 | |
| | |
Distributions to Shareholders: | | | | | | | | |
| From net investment income | | | | | | | | |
Institutional Class | | | 0 | | | | 0 | |
Administrative Class | | | (5,038 | ) | | | (9,080 | ) |
Advisor Class | | | (632 | ) | | | (160 | ) |
Class M | | | (1,232 | ) | | | (2,166 | ) |
| From net realized capital gains | | | | | | | | |
Institutional Class | | | 0 | | | | 0 | |
Administrative Class | | | 0 | | | | (735 | ) |
Advisor Class | | | 0 | | | | (22 | ) |
Class M | | | 0 | | | | (198 | ) |
| | |
Total Distributions | | | (6,902 | ) | | | (12,361 | ) |
| | |
Portfolio Share Transactions: | | | | | | | | |
| Receipts for shares sold | | | | | | | | |
Institutional Class | | | 10 | | | | 0 | |
Administrative Class | | | 33,411 | | | | 166,191 | |
Advisor Class | | | 58,213 | | | | 7,545 | |
Class M | | | 11,550 | | | | 54,317 | |
| Issued as reinvestment of distributions | | | | | | | | |
Institutional Class | | | 0 | | | | 0 | |
Administrative Class | | | 5,038 | | | | 9,815 | |
Advisor Class | | | 632 | | | | 182 | |
Class M | | | 1,232 | | | | 2,364 | |
| Cost of shares redeemed | | | | | | | | |
Institutional Class | | | 0 | | | | 0 | |
Administrative Class | | | (48,154 | ) | | | (29,204 | ) |
Advisor Class | | | (431 | ) | | | (208 | ) |
Class M | | | (12,991 | ) | | | (8,152 | ) |
Net increase resulting from Portfolio share transactions | | | 48,510 | | | | 202,850 | |
| | |
Total Increase in Net Assets | | | 37,820 | | | | 205,769 | |
| | |
Net Assets: | | | | | | | | |
Beginning of period | | | 326,308 | | | | 120,539 | |
End of period* | | $ | 364,128 | | | $ | 326,308 | |
| | |
*Including undistributed net investment income of: | | $ | 6,814 | | | $ | 7,118 | |
| | | | |
| 8 | | PIMCO Variable Insurance Trust | | See Accompanying Notes |
| | |
| |
| Schedule of Investments All Asset Portfolio (a) | | June 30, 2006 (Unaudited) |
| | | | | | | | |
| | | | | | | | | VALUE |
| | | | | SHARES | | | | (000S) |
| PIMCO FUNDS (b) 99.5% |
CommodityRealReturn Strategy Fund® | | | | 639,133 | | $ | | 9,395 |
Convertible Fund | | | | 99,294 | | | | 1,240 |
Developing Local Markets Fund | | | | 2,967,035 | | | | 30,946 |
Diversified Income Fund | | | | 95,839 | | | | 1,031 |
Emerging Markets Bond Fund | | | | 1,908,223 | | | | 20,552 |
Floating Income Fund | | | | 2,936,807 | | | | 30,396 |
Foreign Bond Fund (Unhedged) | | | | 81,715 | | | | 833 |
Fundamental IndexPLUS® Fund | | | | 162,512 | | | | 1,666 |
Fundamental IndexPLUS® TR Fund | | | | 780,708 | | | | 7,823 |
GNMA Fund | | | | 249,029 | | | | 2,670 |
High Yield Fund | | | | 1,318,660 | | | | 12,554 |
International StocksPLUS® TR Strategy Fund | | | | 1,888,909 | | | | 22,025 |
Long-Term U.S. Government Fund | | | | 2,636,612 | | | | 26,893 |
Low Duration Fund | | | | 304,426 | | | | 2,993 |
Real Return Asset Fund | | | | 9,461,298 | | | | 103,412 |
Real Return Fund | | | | 6,131,194 | | | | 65,726 |
RealEstateRealReturn Strategy Fund | | | | 202,957 | | | | 1,756 |
Short-Term Fund | | | | 994 | | | | 10 |
StocksPLUS® Fund | | | | 7,084 | | | | 72 |
StocksPLUS® Total Return Fund | | | | 148,481 | | | | 1,679 |
Total Return Fund | | | | 1,477,051 | | | | 15,036 |
Total Return Mortgage Fund | | | | 346,837 | | | | 3,586 |
| | | | | | | | |
|
Total PIMCO Funds (Cost $371,688) | | | | 362,294 |
| | | | | | | | |
|
| | | | | | | | |
| SHORT-TERM INSTRUMENTS 0.5% |
| |
| REPURCHASE AGREEMENT 0.5% |
| State Street Bank | | | | | | | | |
4.900% due 07/03/2006 | | $ | | 1,781 | | $ | | 1,781 |
| | | | | | | | |
|
(Dated 06/30/2006. Collateralized by Federal Home Loan Bank 4.875% due 02/15/2007 valued at $1,819. Repurchase proceeds are $1,782.) |
| |
Total Short-Term Instruments
(Cost $1,781) | | 1,781 |
| | | | | | | | |
|
| |
Total Investments 100.0%
(Cost $373,469) | | $ | | 364,075 |
| |
| Other Assets and Liabilities (Net) 0.0% | | 53 |
| | | | | | | | |
|
| Net Assets 100.0% | | $ | | 364,128 |
| | | | | | | | |
|
| | | | | | | | |
Notes to Schedule of Investments: |
(a) The All Asset Portfolio is investing in shares of affiliated Funds. |
| | | | | | | | | |
(b) Institutional Class of each PIMCO Funds. |
| | | | | | |
| See Accompanying Notes | | Semiannual Report | | June 30, 2006 | | 9 |
Notes to Financial Statements
1. ORGANIZATION
The All Asset Portfolio (the “Portfolio”) is a series of the PIMCO Variable Insurance Trust (the “Trust”). The Trust is registered under the Investment Company Act of 1940 (the “Act”), as amended, as an open-end investment management company organized as a Delaware business trust on October 3, 1997. The Portfolio offers four classes of shares: Institutional, Administrative, Advisor, and Class M. Information presented in these financial statements pertains to the Class M of the Portfolio. Certain detailed financial information for the Institutional Class, Advisor Class and Administrative Class are provided separately and are available upon request. The Trust is designed to be used as an investment vehicle by Separate Accounts of insurance companies that fund variable annuity contracts and variable life insurance policies and by qualified pension and retirement plans.
2. SIGNIFICANT ACCOUNTING POLICIES
The following is a summary of significant accounting policies consistently followed by the Portfolio in the preparation of its financial statements in conformity with accounting principles generally accepted in the United States of America (“GAAP”). The preparation of financial statements in accordance with GAAP requires management to make estimates and assumptions that affect the reported amounts and disclosures in the financial statements. Actual results could differ from those estimates.
Security Valuation Investments in Funds within the PIMCO Funds are valued at their net asset value as reported by the Underlying Funds.
Securities Transactions and Investment Income. Securities transactions are recorded as of the trade date. Securities purchased or sold on a when-issued or delayed-delivery basis may be settled a month or more after the trade date. Realized gains and losses from securities sold are recorded on the identified cost basis. Dividend income is recorded on the ex-dividend date, except certain dividends from foreign securities where the ex-dividend date may have passed, which are recorded as soon as the Portfolio is informed of the ex-dividend date. Interest income, adjusted for the accretion of discounts and amortization of premiums, is recorded on the accrual basis. Paydown gains and losses on mortgage-related or asset-backed securities are recorded as components of interest income in the Statement of Operations.
Dividends and Distributions to Shareholders. Dividends from net investment income, if any, are declared and distributed to shareholders quarterly. Net realized capital gains earned by the Portfolio, if any, will be distributed no less frequently than once each year. Most shareholders choose to reinvest their dividends and capital gain distribution in additional shares of the Portfolio.
Income dividends and capital gain distributions are determined in accordance with income tax regulations which may differ from GAAP. Differences between tax regulations and GAAP may change the fiscal year when income and capital items are recognized for tax and GAAP purposes. Examples of events that give rise to timing differences include wash sales, straddles, net operating losses and capital loss carryforwards. Further, the character of investment income and capital gains may be different for certain transactions under the two methods of accounting. Examples of characterization differences include the treatment of mortgage paydowns, swaps, foreign currency transactions and contingent debt instruments. As a result, income dividends and capital gain distributions declared during a fiscal period may differ significantly from the net investment income and realized capital gain reported in the Portfolio’s annual financial statements presented under GAAP.
Distributions classified as a tax basis return of capital, if any, are reflected in the accompanying Statements of Changes in Net Assets and have been reclassified to paid in capital. In addition, other amounts have been reclassified between undistributed net investment income, accumulated undistributed net realized gains or losses and/or paid in capital to more appropriately conform financial accounting to tax characterizations of dividend distributions.
Multiclass Operations. Each class offered by the Portfolio has equal rights as to assets and voting privileges (except that shareholders of a class have exclusive voting rights regarding any matter relating solely to that class of shares). Income and non-class specific expenses of the Portfolio are allocated daily to each class of shares based on the relative value of settled shares. Realized and unrealized capital gains and losses of the Portfolio are allocated daily to each class of shares based on the relative net assets of each class. Class specific expenses, where applicable, currently include administrative, distribution and servicing fees.
Federal Income Taxes. The All Asset Portfolio (“the Portfolio”) intends to qualify as a regulated investment company and distribute all of its taxable income and net realized gains, if applicable, to shareholders. Accordingly, no provision for Federal income taxes has been made.
To the extent the All Asset Portfolio invest in the CommodityRealReturn Strategy Portfolio® (the “CRRS Portfolio”), an Underlying Fund, this Portfolio may be subject to the risks associated with commodity-linked derivative instruments.
One of the requirements for favorable tax treatment as a regulated investment company under the Code is that the CRRS Portfolio derive at least 90 percent of its gross income from certain qualifying sources of income. On December 16, 2005, the IRS issued Revenue Ruling 2006-01 which held that income from commodity index-linked swaps was not qualifying income. At the time Revenue Ruling 2006-01 was issued, the CRRS Portfolio invested primarily in commodity index-linked swaps to gain exposure to the commodity markets. Revenue Ruling 2006-01 provided an effective date of June 30, 2006, after which time the CRRS Portfolio’s ability to utilize commodity index-linked swaps as part of its investment strategy will be limited to a maximum of 10 percent of its gross income.
On June 2, 2006, the IRS issued Revenue Ruling 2006-31 which extends the effective date for Revenue Ruling 2006-01 from June 30, 2006 until September 30, 2006. Revenue Ruling 2006-31 also clarifies the holding of Revenue Ruling 2006-01 by providing that income from alternative instruments (such as certain commodity index-linked notes) that create commodity exposure may be considered qualifying income under the Code. In addition, the IRS has also issued private letter rulings to at least two other funds in which the IRS specifically concluded that income from certain commodity index-linked notes is qualifying income. The CRRS Portfolio has also obtained an opinion of counsel with respect to the treatment of income from commodity index-linked notes as qualifying income under the Code. Such an opinion is not binding upon the IRS.
Based on Revenue Ruling 2006-31, IRS guidance and advice of counsel, the CRRS Portfolio will seek to gain exposure to the commodity markets primarily through investments in commodity indexlinked notes. The use of commodity index-linked notes involves specific risks. The CRRS Portfolio will continue to seek ways to make use of other commodity-linked derivative instruments, including swap agreements, commodity options, futures and options on futures, and alternative structures within the Portfolio to gain exposure to commodity markets. Please refer to the prospectus for the Separate Account and Variable Contract for information regarding federal income tax treatment of distributions to the Separate Account.
Guarantees and Indemnifications. Under the Trust’s organizational documents, each Trustee, officer, employee or other agent of the Trust (including the Trust’s investment manager) is indemnified against certain liabilities that may arise out of performance of their duties to the Portfolio. Additionally, in the normal course of business, the Portfolio enters into contracts that contain a variety of
| | | | |
| 10 | | PIMCO Variable Insurance Trust | | |
| | |
| |
| | | June 30, 2006 (Unaudited) |
indemnification clauses. The Portfolio’s maximum exposure under these arrangements is unknown as this would involve future claims that may be made against the Portfolio that have not yet occurred. However, the Portfolio has not had prior claims or losses pursuant to these contracts, and believes the risk of loss to be remote.
Underlying Funds. The Portfolio may invest in any or all of the Underlying Funds, but will not normally invest in every Underlying Fund at any particular time. The Underlying Funds are the Institutional Class shares of the PIMCO Funds, an affiliated open-end investment company, except All Asset and All Asset All Authority Funds. Though it is anticipated that the All Asset Portfolio will not currently invest in the European StocksPLUS® Total Return Strategy, Far East (ex-Japan) StocksPLUS® Total Return Strategy, Japanese StocksPLUS® TR Strategy, StocksPLUS® Municipal-Backed and StocksPLUS® TR Short Strategy Funds, the Portfolio may invest in these Funds in the future, without shareholder approval, at the discretion of the Portfolio’s asset allocation sub-adviser.
New Accounting Policies. In July 2006, the Financial Accounting Standards Board issued Interpretation No. 48, “Accounting for Uncertainty in Income Taxes—an Interpretation of FASB Statement No. 109” (the “Interpretation”). The Interpretation is effective for fiscal years beginning after December 15, 2006. Management is currently evaluating the application of the Interpretation to the Portfolio and will provide additional information in relation to the Interpretation in the Portfolio’s annual financial statements for the year ending December 31, 2006.
3. FEES, EXPENSES, AND RELATED PARTY TRANSACTIONS
Investment Advisory Fee. PIMCO is a majority-owned subsidiary of Allianz Global Investors of America L.P. (“AGI”), and serves as investment adviser (the “Adviser”) to the Trust, pursuant to an investment advisory contract. The Adviser receives a monthly fee at an annual rate based on average daily net assets of the Portfolio. The Advisory Fee is charged at an annual rate of 0.20%.
Administration Fee. PIMCO serves as administrator (the “Administrator”), and provides administrative services to the Trust for which it receives a monthly administrative fee based on average daily net assets of the Portfolio. As the Administrator, PIMCO bears the costs of various third-party services, including audit, custodial, portfolio accounting, legal, transfer agency and printing costs. The Administration Fee is charged at the annual rate of 0.25%.
Distribution and Servicing Fees. Allianz Global Investors Distributors LLC (“AGID”) is an indirect wholly-owned subsidiary of AGI and serves as the distributor of the Trust’s shares. The Trust is permitted to reimburse AGID on a quarterly basis, out of the Administrative Class assets of the Portfolio in the amount of 0.15% on an annual basis of the average daily net assets of that class, for payments made to financial intermediaries that provide services in connection with the distribution of shares or administration of plans or programs that use Portfolio shares as their funding medium. The effective rate paid to AGID was 0.15% during the current fiscal year.
Expenses. The Trust is responsible for the following expenses: (i) salaries and other compensation of any of the Trust’s executive officers and employees who are not officers, directors, stockholders or employees of PIMCO or its subsidiaries or affiliates; (ii) taxes and governmental fees; (iii) brokerage fees and commissions and other portfolio transaction expenses; (iv) the costs of borrowing money, including interest expenses and bank overdraft charges; (v) fees and expenses of the Trustees who are not “interested persons” of PIMCO or the Trust, and any counsel retained exclusively for their benefit; (vi) extraordinary expenses, including costs of litigation and indemnification expenses; (vii) organization expenses and (viii) any expenses allocated or allocable to a specific class of shares, which include service fees payable with respect to the Administrative Class shares and may include certain other expenses as permitted by the Trust’s Multiple Class Plan adopted pursuant to Rule 18f-3 under the Act and subject to review and approval by the Trustees. The ratio of expenses to average net assets per share class, as disclosed in the Financial Highlights, may differ from the annual portfolio operating expenses per share class as disclosed in the Prospectus for the reasons set forth above.
PIMCO has agreed to waive a portion of its administrative fees to the extent that the payment of the Portfolio’s pro rata share of organization expenses and Trustee fees cause the actual expense ratio to rise above the rates disclosed in the then-current prospectus plus 0.49 basis points as set forth below (calculated as a percentage of the Portfolio’s average daily net assets attributable to each class):
| | | |
| Administrative Class | | 0.60 | % |
PIMCO may be reimbursed for these waived amounts in future periods, not to exceed thirty-six months. Expenses that have been waived and may still be reimbursed by the Administrator, to the extent the Portfolio’s annualized total portfolio operating expenses plus the amount so reimbursed does not exceed the operating expense limitation, are as follows (amounts in thousands):
| | | | | | | | | | | | | | | | | | | | |
| | | | | | Year of Waiver |
| | | | | | 12/31/2003 | | | | | 12/31/2004 | | | | | 12/31/2005 | | | | | 06/30/2006 |
Amount Available for Reimbursement | | | | $ | 12 | | | | $ | 0 | | | | $ | 0 | | | | $ | 0 |
For the current period ended June 30, 2006, each unaffiliated Trustee received an annual retainer of $15,000, plus $2,000 for each Board of Trustees quarterly meeting attended, $500 for each Board of Trustees committee meeting attended and $500 for each special board meeting attended, plus reimbursement of related expenses. In addition, each Committee Chair received an additional annual retainer of $500 and each Audit Committee Chair received an additional annual retainer of $1,500. These expenses are allocated on a pro-rata basis to each Portfolio of the Trust according to its respective net assets. The Trust pays no compensation directly to any Trustee or any other officer who is affiliated with the Administrator, all of whom receive remuneration for their services to the Trust from the Administrator or its affiliates.
4. PURCHASES AND SALES OF SECURITIES
The length of time the Portfolio has held a particular security is not generally a consideration in investment decisions. A change in the securities held by the Portfolio is known as “portfolio turnover”. The Portfolio may engage in frequent and active trading of portfolio securities to achieve its investment objective, particularly during periods of volatile market movements. High portfolio turnover (e.g., over 100%) involves correspondingly greater expenses to the Portfolio, including brokerage commissions or dealer mark-ups and other transaction costs on the sale of securities and reinvestments in other securities. Such sales may also result in realization of taxable capital gains, including short-term capital gains (which are generally taxed at ordinary income tax rates). The trading costs and tax effects associated with portfolio turnover may adversely affect the Portfolio’s performance.
Purchases and sales of securities (excluding short-term investments) for the period ended June 30, 2006 were as follows (amounts in thousands):
| | | | | | | | | | | | | | | | |
| | U.S Government/Agency | | | | | All Other |
| | Purchases | | | | | Sales | | | | | Purchases | | | | | Sales |
| $ | 0 | | | | $ | 0 | | | | $ | 159,640 | | | | $ | 113,374 |
| | | | | | |
| | | Semiannual Report | | June 30, 2006 | | 11 |
Notes to Financial Statements (Cont.)
5. SHARES OF BENEFICIAL INTEREST
The Portfolio may issue an unlimited number of shares of beneficial interest with a $0.001 par value. Changes in shares of beneficial interest were as follows (shares and amounts in thousands):
| | | | | | | | | | | | | | | | | | |
| | | | | Six Months Ended
06/30/2006 | | | | | Year Ended
12/31/2005 | |
| | | | | Shares | | | Amount | | | | | Shares | | | Amount | |
| | | | | | |
Receipts for shares sold | | | | | | | | | | | | | | | | | | |
Institutional Class | | | | 1 | | | $ | 10 | | | | | 0 | | | $ | 0 | |
Administrative Class | | | | 2,843 | | | | 33,411 | | | | | 14,121 | | | | 166,191 | |
Advisor Class | | | | 5,043 | | | | 58,213 | | | | | 632 | | | | 7,545 | |
Class M | | | | 982 | | | | 11,550 | | | | | 4,617 | | | | 54,317 | |
Issued as reinvestment of distributions | | | | | | | | | | | | | | | | | | |
Institutional Class | | | | 0 | | | | 0 | | | | | 0 | | | | 0 | |
Administrative Class | | | | 437 | | | | 5,038 | | | | | 828 | | | | 9,815 | |
Advisor Class | | | | 56 | | | | 632 | | | | | 15 | | | | 182 | |
Class M | | | | 107 | | | | 1,232 | | | | | 200 | | | | 2,364 | |
Cost of shares redeemed | | | | | | | | | | | | | | | | | | |
Institutional Class | | | | 0 | | | | 0 | | | | | 0 | | | | 0 | |
Administrative Class | | | | (4,149 | ) | | | (48,154 | ) | | | | (2,453 | ) | | | (29,204 | ) |
Advisor Class | | | | (37 | ) | | | (431 | ) | | | | (17 | ) | | | (208 | ) |
Class M | | | | (1,114 | ) | | | (12,991 | ) | | | | (689 | ) | | | (8,152 | ) |
Net increase resulting from Portfolio share transactions | | | | 4,169 | | | $ | 48,510 | | | | | 17,254 | | | $ | 202,850 | |
The following schedule shows the number of shareholders each owning 5% or more of the Portfolio and the total percentage of the Portfolio held by such shareholders:
| | | | | | | |
| | | | | Number of
Shareholders | | % of Portfolio
Held | |
Institutional Class | | | | 1 | | 100 | |
Administrative Class | | | | 2 | | 89 | * |
Advisor Class | | | | 2 | | 93 | |
Class M | | | | 3 | | 97 | |
* Allianz Life Insurance Co. of North America, an indirect wholly owned subsidiary of AGI and a related party to the Portfolio, owned 25% or more of the outstanding shares of beneficial interest of the Portfolio and therefore may be presumed to “control” the Portfolio, as that term is defined in the 1940 Act.
6. AFFILIATED TRANSACTIONS
The Underlying Funds are considered to be affiliated with the Portfolio. The table below shows the transactions in and earnings from investments in these affiliated Funds for the period ended June 30, 2006 (amounts in thousands):
| | | | | | | | | | | | | | | | | | | | | | | |
| Underlying Funds | | Market Value
12/31/2005 | | Purchases
at Cost | | Proceeds
from Sales | | Unrealized
Appreciation
(Depreciation) | | | Market Value
6/30/2006 | | Dividend
Income | | Net Capital and
Realized
Gain (Loss) | |
CommodityRealReturn Strategy Fund® | | $ | 11,984 | | $ | 3,509 | | $ | 6,126 | | $ | 130 | | | $ | 9,395 | | $ | 46 | | $ | (270 | ) |
Convertible Fund | | | 1,193 | | | 16 | | | 0 | | | 66 | | | | 1,240 | | | 16 | | | 0 | |
Developing Local Markets Fund | | | 23,695 | | | 11,797 | | | 5,002 | | | 582 | | | | 30,946 | | | 529 | | | 96 | |
Diversified Income Fund | | | 0 | | | 1,051 | | | 0 | | | (19 | ) | | | 1,031 | | | 11 | | | 0 | |
Emerging Markets Bond Fund | | | 26,326 | | | 9,172 | | | 13,874 | | | 321 | | | | 20,552 | | | 756 | | | (215 | ) |
Floating Income Fund | | | 23,662 | | | 14,886 | | | 8,178 | | | 272 | | | | 30,396 | | | 678 | | | 65 | |
Foreign Bond Fund (Unhedged) | | | 7,223 | | | 1,078 | | | 7,621 | | | 25 | | | | 833 | | | 80 | | | (356 | ) |
Fundamental IndexPLUS® Fund | | | 1,258 | | | 1,753 | | | 1,411 | | | 28 | | | | 1,666 | | | 18 | | | 24 | |
Fundamental IndexPLUS® TR Fund | | | 10,704 | | | 972 | | | 3,795 | | | (28 | ) | | | 7,823 | | | 164 | | | (158 | ) |
GNMA Fund | | | 3,197 | | | 539 | | | 988 | | | (63 | ) | | | 2,670 | | | 70 | | | (9 | ) |
High Yield Fund | | | 20,384 | | | 705 | | | 8,205 | | | (76 | ) | | | 12,554 | | | 705 | | | (85 | ) |
International StocksPLUS® TR Strategy Fund | | | 10,584 | | | 12,012 | | | 75 | | | (675 | ) | | | 22,025 | | | 379 | | | (9 | ) |
Long-Term U.S. Government Fund | | | 39,326 | | | 3,546 | | | 13,541 | | | (2,088 | ) | | | 26,893 | | | 717 | | | (831 | ) |
Low Duration Fund | | | 4,844 | | | 12,249 | | | 13,954 | | | (2 | ) | | | 2,993 | | | 158 | | | (146 | ) |
Real Return Asset Fund | | | 49,421 | | | 59,336 | | | 997 | | | (4,724 | ) | | | 103,412 | | | 1,423 | | | (38 | ) |
Real Return Fund | | | 43,544 | | | 24,385 | | | 591 | | | (2,425 | ) | | | 65,726 | | | 995 | | | (45 | ) |
RealEstateRealReturn Strategy Fund | | | 10,989 | | | 230 | | | 9,873 | | | 36 | | | | 1,756 | | | 230 | | | (537 | ) |
Short-Term Fund | | | 0 | | | 76 | | | 66 | | | 0 | | | | 10 | | | 0 | | | 0 | |
StocksPLUS® Fund | | | 70 | | | 1 | | | 0 | | | 3 | | | | 72 | | | 1 | | | 0 | |
StocksPLUS® Total Return Fund | | | 1,687 | | | 21 | | | 0 | | | (59 | ) | | | 1,679 | | | 21 | | | 0 | |
Total Return Fund | | | 26,281 | | | 2,128 | | | 12,615 | | | (576 | ) | | | 15,036 | | | 542 | | | (463 | ) |
Total Return Mortgage Fund | | | 10,041 | | | 178 | | | 6,462 | | | (123 | ) | | | 3,586 | | | 178 | | | (178 | ) |
Totals | | $ | 326,413 | | $ | 159,640 | | $ | 113,374 | | $ | (9,395 | ) | | $ | 362,294 | | $ | 7,717 | | $ | (3,155 | ) |
| | | | |
| 12 | | PIMCO Variable Insurance Trust | | |
| | |
| |
| | | June 30, 2006 (Unaudited) |
7. FEDERAL INCOME TAX MATTERS
As of June 30, 2006, the aggregate cost of investments was the same for federal income tax and financial statement purposes. The net unrealized appreciation (depreciation) of investment securities for federal income tax purposes is as follows (amounts in thousands):
| | | | |
Aggregate
Gross
Unrealized
Appreciation | | Aggregate
Gross
Unrealized
(Depreciation) | | Net
Unrealized
(Depreciation) |
$ 1,463 | | $ (10,857) | | $ (9,394) |
8. REGULATORY AND LITIGATION MATTERS
On June 1, 2004, the Attorney General of the State of New Jersey announced that it had dismissed PIMCO from a complaint filed by the New Jersey Attorney General on February 17, 2004, and that it had entered into a settlement agreement (the “New Jersey Settlement”) with Allianz Global Investors of America L.P. (“AGI”) (formerly known as Allianz Dresdner Asset Management of America L.P.), PEA Capital LLC (an entity affiliated with PIMCO through common ownership) (“PEA���) and Allianz Global Investors Distributors LLC (“AGID”), in connection with the same matter. In the New Jersey Settlement, AGI, PEA and AGID neither admitted nor denied the allegations or conclusions of law, but did agree to pay New Jersey a civil fine of $15 million and $3 million for investigative costs and further potential enforcement initiatives against unrelated parties. They also undertook to implement certain governance changes. The complaint relating to the New Jersey Settlement alleged, among other things, that AGI, PEA and AGID had failed to disclose that they improperly allowed certain hedge funds to engage in “market timing” in certain funds. The complaint sought injunctive relief, civil monetary penalties, restitution and disgorgement of profits.
Since February 2004, PIMCO, AGI, PEA, AGID, and certain of their affiliates, including the PIMCO Funds, the Allianz Funds (formerly known as PIMCO Funds: Multi-Manager Series), and the Trustees and employees of the PIMCO Funds, have been named as defendants in fifteen lawsuits filed in various jurisdictions. Eleven of those lawsuits concern “market timing,” and they have been transferred to and consolidated for pre-trial proceedings in a multi-district litigation proceeding in the U.S. District Court for the District of Maryland; the other four lawsuits concern “revenue sharing” and have been consolidated into a single action in the U.S. District Court for the District of Connecticut. The lawsuits have been commenced as putative class actions on behalf of investors who purchased, held or redeemed shares of the various series of the PIMCO Funds and the Allianz Funds during specified periods, or as derivative actions on behalf of the PIMCO Funds and Allianz Funds.
The market timing actions in the District of Maryland generally allege that certain hedge funds were allowed to engage in “market timing” in certain of the Allianz Funds and the PIMCO Funds and this alleged activity was not disclosed. Pursuant to tolling agreements entered into with the derivative and class action plaintiffs, PIMCO, the Trustees, and certain employees of PIMCO who were previously named as defendants have all been dropped as defendants in the market timing actions; the plaintiffs continue to assert claims on behalf of the shareholders of the PIMCO Funds or on behalf of the PIMCO Funds themselves against other defendants. By order dated November 3, 2005, the U.S. District Court for the District of Maryland granted the PIMCO Funds’ motion to dismiss claims asserted against it in a consolidated amended complaint where the PIMCO Funds were named, in the complaint, as a nominal defendant. The revenue sharing action in the District of Connecticut generally alleges that fund assets were inappropriately used to pay brokers to promote the Allianz Funds and PIMCO Funds, including directing fund brokerage transactions to such brokers, and that such alleged arrangements were not fully disclosed to shareholders. On August 11, 2005 the U.S. District Court for the District of Connecticut conducted a hearing on defendants’ motion to dismiss the consolidated amended complaint in the revenue sharing action but has not yet ruled on the motion to dismiss. The market timing and revenue sharing lawsuits seek, among other things, unspecified compensatory damages plus interest and, in some cases, punitive damages, the rescission of investment advisory contracts, the return of fees paid under those contracts and restitution.
Under Section 9(a) of the Investment Company Act of 1940, as amended (“1940 Act”), if the New Jersey Settlement or any of the lawsuits described above were to result in a court injunction against AGI, PEA, AGID and/or their affiliates, PIMCO could, in the absence of exemptive relief granted by the SEC, be barred from serving as an investment adviser, and AGID could be barred from serving as principal underwriter, to any registered investment company, including the Portfolios of the Trust. In connection with an inquiry from the SEC concerning the status of the New Jersey Settlement under Section 9(a), PEA, AGID, AGI and certain of their affiliates (including PIMCO) (together, the “Applicants”) have sought exemptive relief from the SEC under Section 9(c) of the 1940 Act. The SEC has granted the Applicants a temporary exemption from the provisions of Section 9(a) with respect to the New Jersey Settlement until the earlier of (i) September 13, 2006 and (ii) the date on which the SEC takes final action on their application for a permanent order. There is no assurance that the SEC will issue a permanent order.
Two nearly identical class action civil complaints have been filed in August 2005, in the Northern District of Illinois Eastern Division alleging that the plaintiffs each purchased and sold a 10-year Treasury note futures contract and suffered damages from an alleged shortage when PIMCO held both physical and futures positions in 10-year Treasury notes for its client accounts. The two actions have been consolidated into one action, and the two separate complaints have been replaced by a consolidated complaint. PIMCO is a named defendant, and the PIMCO Funds have been added as a defendant, to the consolidated action. PIMCO strongly believes the complaint (and any consolidated complaint filed hereafter) is without merit and intends to vigorously defend itself.
Certain Portfolios of the Trust were recently served in an adversary proceeding brought by the Official Committee of Asbestos Claimants of G-I Holdings, Inc. in G-I Holdings, Inc.’s bankruptcy in the District of New Jersey. PIMCO was previously named in this lawsuit and remains a defendant. The plaintiff seeks to recover for the bankruptcy estate assets that were transferred by the predecessor entity of G-I Holdings, Inc. to a wholly-owned subsidiary in 1994. The subsidiary has since issued notes, of which certain Portfolios of the Trust are alleged to be holders. The complaint alleges that in 2000, more than two hundred noteholders —including certain Portfolios of the Trust—were granted a second priority lien on the assets of the subsidiary in exchange for their consent to a refinancing transaction and the granting of a first priority lien to the lending banks. The plaintiff is seeking invalidation of the lien in favor of the noteholders and/or the value of the lien.
It is possible that these matters and/or other developments resulting from these matters could result in increased fund redemptions or other adverse consequences to the Portfolios. However, PIMCO and AGID believe that these matters are not likely to have a material adverse effect on the Portfolios or on PIMCO’s or AGID’s ability to perform their respective investment advisory or distribution services relating to the Portfolios.
| | | | | | |
| | | Semiannual Report | | June 30, 2006 | | 13 |
Investment Adviser and Administrator
Pacific Investment Management Company LLC
840 Newport Center Drive
Newport Beach, California 92660
Distributor
Allianz Global Investors Distributors LLC
2187 Atlantic Street
Stamford, Connecticut 06902
Custodian
State Street Bank & Trust Company
801 Pennsylvania
Kansas City, Missouri 64105
Transfer Agent
Boston Financial Data Services–Midwest
330 W. 9th Street
Kansas City, Missouri 64105
Legal Counsel
Dechert LLP
1775 I Street, N.W.
Washington, D.C. 20006
Independent Registered Public Accounting Firm
PricewaterhouseCoopers LLP
1055 Broadway
Kansas City, Missouri 64105
P I M C O

Share Class Administrative
Semiannual Report June 30, 2006
PIMCO Variable Insurance Trust
CommodityRealReturn™ Strategy Portfolio
Table of Contents
This material is authorized for use only when preceded or accompanied by the current PIMCO Variable Insurance Trust (the “Trust”) prospectus. Investors should consider the investment objectives, risks, charges and expenses of this Trust carefully before investing. Ask your financial professional to explain all charges that may apply. This and other information is contained in the Trust’s prospectus. The variable product prospectus may be obtained by contacting your Investment Consultant. Please read the Trust and variable product prospectus carefully before you invest or send money.
Chairman’s Letter
Dear PIMCO Variable Insurance Trust Shareholder:
It is our pleasure to present to you the semiannual report for the PIMCO Variable Insurance Trust covering the six-month period ended June 30, 2006.
Highlights of the global bond markets during the six-month period included:
| | n | | Most fixed-income sectors lost ground during the first half of 2006, as concern about accelerating inflation and central bank tightening pushed interest rates higher worldwide. The benchmark Lehman Brothers Aggregate Bond Index (which includes Treasury, Investment-Grade Corporate, and Residential Mortgage-Backed Securities) returned -0.72% for the first six months of the year. On June 30, the benchmark ten-year Treasury yielded 5.14%, 0.75% higher than at the start of the year. The U.S. yield curve remained flat as shorter-maturity yields rose by a comparable amount. |
| | n | | The Federal Reserve tightened four times during the reporting period, bringing the Federal Funds Rate to 5.25%. The increase near the end of the period was the Federal Reserve’s 17th consecutive rate hike since the start of its tightening cycle in 2004. The Federal Reserve was not alone, as central banks in Europe, India, and China tightened credit in unison for the first time since 2000. The Bank of Japan, whose zero-interest-rate policy has flooded global markets with liquidity, looked set to reverse this policy in the coming months. |
In these pages please find a more complete Portfolio review as it relates to financial-market activities, as well as details about total-return investment performance for the six-month reporting period. Thank you for the trust you have placed in us. We will continue to work diligently to meet your investment needs.
Sincerely,
Brent R. Harris
Chairman, PIMCO Variable Insurance Trust
July 31, 2006
| | | | | | |
| | | Semiannual Report | | June 30, 2006 | | 1 |
Important Information About the Portfolio
PIMCO Variable Insurance Trust (the “Trust”) is an open-end management investment company currently consisting of nineteen separate investment portfolios, including the CommodityRealReturn Strategy Portfolio (the “Portfolio”). The Portfolio is only available as a funding vehicle under variable life insurance policies or variable annuity contracts issued by insurance companies (“Variable Contracts”). Individuals may not purchase shares of the Portfolio directly. Shares of the Portfolio also may be sold to qualified pension and retirement plans outside of the separate account context.
We believe that bond funds have an important role to play in a well diversified investment portfolio. It is important to note, however, that in an environment where interest rates may trend upward, rising rates would negatively impact the performance of most bond funds, and fixed-income securities held by a fund are likely to decrease in value. The price volatility of fixed-income securities can also increase during periods of rising interest rates resulting in increased losses to a fund. Bond funds and individual bonds with a longer duration (a measure of the expected life of a security) tend to be more sensitive to changes in interest rates, usually making them more volatile than securities or funds with shorter durations. The longer-term performance of most bond funds has benefited from capital gains in part resulting from an extended period of declining interest rates. In the event interest rates increase, these capital gains should not be expected to recur.
The Portfolio may be subject to various risks in addition to those described above. Some of these risks may include, but are not limited to, the following: credit risk, high yield risk, market risk, issuer risk, liquidity risk, derivatives risk, commodity risk, mortgage risk, non-U.S. investment risk, currency risk, issuer non-diversification risk, leveraging risk, management risk, and tax risk. A complete description of these risks is contained in the Portfolio’s prospectus. The Portfolio may use derivative instruments for hedging purposes or as part of an investment strategy. Use of these instruments may involve certain costs and risks such as liquidity risk, interest rate risk, market risk, credit risk, management risk and the risk that the Portfolio could not close out a position when it would be most advantageous to do so. A Portfolio investing in derivatives could lose more than the principal amount invested in these instruments. Investing in non-U.S. securities may entail risk due to non-U.S. economic and political developments; this risk may be increased when investing in emerging markets.
The value of commodity-linked derivative instruments may be affected by changes in overall market movements, changes in interest rates, and other factors such as weather, disease, embargoes, and international economic and political developments, as well as the trading activity of speculators and arbitrageurs in the underlying commodities.
The Portfolio will seek to gain exposure to the commodity markets primarily through investments in leveraged or unleveraged commodity index-linked notes, which are derivative debt instruments with principal and/or coupon payments linked to the value of commodities, commodity futures contracts or the performance of commodity indices. These notes are sometimes referred to as “structured notes” because the terms of these notes may be structured by the issuer and the purchaser of the note. The value of these notes will rise or fall in response to changes in the underlying commodity or related index of investment. These notes expose the Portfolio economically to movements in commodity prices. The Portfolio may also gain exposure to commodity markets by investing in one or more underlying investment vehicles or companies that have substantially similar investment objectives as the Portfolio. Assets not invested in commodity index-linked derivative instruments may be invested in inflation-indexed securities and other fixed income instruments, including derivative fixed income instruments.
One of the requirements for favorable tax treatment as a regulated investment company under the Internal Revenue Code is that the Portfolio derive at least 90 percent of its gross income from certain qualifying sources of income. On December 16, 2005, the Internal Revenue Service issued Revenue Ruling 2006-01, which held that income from commodity index-linked swaps would not be qualifying income after June 30, 2006. At the time Revenue Ruling 2006-01 was issued, the Portfolio invested primarily in commodity index-linked swaps to gain exposure to the commodity markets. The effective date of Revenue Ruling 2006-01 was extended to September 30, 2006 by Revenue Ruling 2006-31, after which time the Portfolio’s ability to utilize commodity index-linked swaps as part of its investment strategy will be limited to a maximum of 10 percent of its gross income.
In addition to extending the effective date, Revenue Ruling 2006-31 also clarifies the holding of Revenue Ruling 2006-01 by providing that income from alternative instruments (such as certain commodity index-linked notes) that create commodity exposure may be considered qualifying income under the Internal Revenue Code. In addition, the Internal Revenue Service has also issued private letter rulings to at least two other funds in which the Internal Revenue Service specifically concluded that income from certain commodity index-linked notes is qualifying income. The Portfolio has also obtained an opinion of counsel with respect to the treatment of income from commodity index-linked notes as qualifying income under the Internal Revenue Code. Such an opinion is not binding upon the Internal Revenue Service.
Based on Revenue Ruling 2006-31, Internal Revenue Service guidance and advice of counsel, the Portfolio will seek to gain exposure to the commodity markets primarily through investments in commodity index-linked notes. These notes are subject to risks, such as credit, market and interest rate risks, that in general affect the values of debt securities. In addition, these notes are often leveraged, increasing the volatility of each note’s market value relative to changes in the underlying commodity, commodity futures contract or commodity index. Therefore, at the maturity of the note, the Portfolio may receive more or less principal than it originally invested. The Portfolio may receive interest payments on the note that are more or less than the stated coupon interest payments.
As a result of the Portfolio’s investments in commodity index-linked notes and other commodity-linked derivative instruments, it is possible that a lesser amount of the Portfolio’s assets would be available for investment in inflation-indexed instruments and other fixed income instruments, which could adversely affect the Portfolio’s total return.
The Portfolio is intended for long-term investors and an investment in the Portfolio should be no more than a small part of a typical diversified portfolio. The Portfolio’s share price is expected to be more volatile than that of other funds. The Portfolio may invest in commodity-linked derivative instruments which may subject the Portfolio to greater volatility than investments in traditional securities. The value of commodity-linked derivative instruments may be affected by changes in overall market movements, changes in interest rates, and other factors such as weather, disease, embargoes, and international economic and political developments, as well as the trading activity of speculators and arbitrageurs in the underlying commodities.
| | | | |
| 2 | | PIMCO Variable Insurance Trust | | |
On the performance summary page in this Semiannual Report, the Total Return Investment Performance table measures performance assuming that all dividend and capital gain distributions were reinvested.
An investment in the Portfolio is not a deposit of a bank and is not guaranteed or insured by the Federal Deposit Insurance Corporation or any other government agency. It is possible to lose money on investments in the Portfolio.
PIMCO has adopted written proxy voting policies and procedures (“Proxy Policy”) as required by Rule 206(4)-6 under the Investment Advisers Act of 1940. The Proxy Policy has been adopted by the Trust as the policies and procedures that PIMCO will use when voting proxies on behalf of the Portfolio. Copies of the written Proxy Policy and the factors that PIMCO may consider in determining how to vote proxies for the Portfolio, and information about how the Portfolio voted proxies relating to portfolio securities held during the most recent twelve-month period ended June 30, are available without charge, upon request, by calling the Trust at 1-866-746-2606 and on the Securities and Exchange Commission’s (“SEC”) website at http://www.sec.gov.
The Portfolio files its complete schedule of portfolio holdings with the SEC for the first and third quarters of each fiscal year on Form N-Q. A copy of the Trust’s Form N-Q is available on the SEC’s website at http://www.sec.gov and may be reviewed and copied at the SEC’s Public Reference Room in Washington D.C. Information on the operation of the Public Reference Room may be obtained by calling 1-800-SEC-0330.
PIMCO Variable Insurance Trust is distributed by Allianz Global Investors Distributors LLC, 2187 Atlantic Street, Stamford, CT 06902.
The following disclosure provides important information regarding the Portfolio’s Expense Example (“Example” or “Expense Example”), which appears in this Semiannual Report. Please refer to this information when reviewing the Expense Example for the Portfolio.
Example
As a shareholder of the Portfolio, you incur two types of costs: (1) transaction costs and (2) ongoing costs, including advisory and administrative fees; distribution and/or service (12b-1) fees (Administrative Class only); and other Portfolio expenses. The Example is intended to help you understand your ongoing costs (in dollars) of investing in the Portfolio and to compare these costs with the ongoing costs of investing in other mutual funds. The Expense Example does not reflect any fees or other expenses imposed by the Variable Contracts. If it did, the expenses reflected in the Expense Examples would be higher. The Example is based on an investment of $1,000 invested at the beginning of the period and held for the entire period indicated, which is from January 1, 2006 to June 30, 2006.
Actual Expenses
The information in the table under the heading “Actual Performance” provides information about actual account values and actual expenses. You may use the information in these columns, together with the amount you invested, to estimate the expenses that you paid over the period. Simply divide your account value by $1,000 (for example, an $8,600 account value divided by $1,000 = 8.60), then multiply the result by the number in the appropriate column for your share class, in the row titled “Expenses Paid During Period” to estimate the expenses you paid on your account during this period.
Hypothetical Example for Comparison Purposes
The information in the table under the heading “Hypothetical Performance (5% return before expenses)” provides information about hypothetical account values and hypothetical expenses based on the Portfolio’s actual expense ratio and an assumed rate of return of 5% per year before expenses, which is not the Portfolio’s actual return. The hypothetical account values and expenses may not be used to estimate the actual ending account balance or expenses you paid for the period. You may use this information to compare the ongoing costs of investing in the Portfolio and other portfolios. To do so, compare this 5% hypothetical example with the 5% hypothetical examples that appear in the shareholder reports of the other portfolios.
Please note that the expenses shown in the table are meant to highlight your ongoing costs only and do not reflect any transactional costs. Therefore, the information under the heading “Hypothetical Performance (5% return before expenses)” is useful in comparing ongoing costs only, and will not help you determine the relative total costs of owning different portfolios. In addition, if these transactional costs were included, your costs would have been higher.
The expense ratio may vary period to period because of various factors, such as an increase in expenses not covered by the advisory and administrative fees (such as expenses of the trustees and their counsel or litigation expense).
Portfolio Benchmark
Dow Jones – AIG Commodity Total Return is an unmanaged index composed of futures contracts on 19 physical commodities. The index is designed to be a highly liquid and diversified benchmark for commodities as an asset class. It is not possible to invest directly in the index.
| | | | | | |
| | | Semiannual Report | | June 30, 2006 | | 3 |
| | | | |
| | |
| PIMCO CommodityRealReturn Strategy Portfolio | | | | |
| | | | |
Cumulative Returns Through June 30, 2006
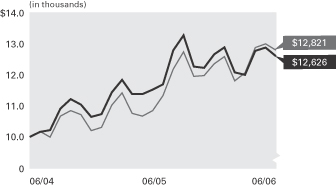
CommodityRealReturn Dow Jones - AIG
Strategy Portfolio Commodity Total
Administrative Class Return Index
-------------------- ---------------
06/30/2004 $10,000 $10,000
07/31/2004 10,160 10,177
08/31/2004 10,220 9,991
09/30/2004 10,920 10,675
10/31/2004 11,230 10,856
11/30/2004 11,050 10,726
12/31/2004 10,651 10,199
01/31/2005 10,743 10,306
02/28/2005 11,443 11,034
03/31/2005 11,855 11,427
04/30/2005 11,386 10,760
05/31/2005 11,386 10,677
06/30/2005 11,535 10,856
07/31/2005 11,709 11,343
08/31/2005 12,813 12,199
09/30/2005 13,299 12,767
10/31/2005 12,285 11,965
11/30/2005 12,244 11,996
12/31/2005 12,684 12,378
01/31/2006 12,912 12,607
02/28/2006 12,094 11,818
03/31/2006 12,016 12,081
04/30/2006 12,795 12,900
05/31/2006 12,899 13,023
06/30/2006 12,626 12,821
$10,000 invested at the beginning of the first full month following the inception date of the Portfolio’s Administrative Class.
Sector Breakdown‡
| | |
U.S. Treasury Obligations# | | 47.8% |
Short-Term Instrument# | | 29.9% |
Structured Notes# | | 16.3% |
Other | | 6.0% |
| | ‡ | % of Total Investments as of June 30, 2006 |
| | # | Primarily serving as collateral for commodity-linked derivative positions |
| | | | | | | | | | |
| Average Annual Total Return for the period ended June 30, 2006 |
| | | | | | | 6 Months* | | 1 Year | | Since
Inception
(06/30/04) |
| | |
| | PIMCO CommodityRealReturn Strategy Portfolio Administrative Class | | -0.45% | | 9.46% | | 12.37% |
| | |
| | Dow Jones–AIG Commodity Total Return Index | | 3.58% | | 18.09% | | 13.24% |
All Portfolio returns are net of fees and expenses.
* Cumulative return.
Past performance is no guarantee of future results. The performance quoted represents past performance. Investment return and principal value will fluctuate so the Portfolio shares, when redeemed, may be worth more or less than their original cost. The Portfolio’s performance does not reflect the deduction of additional charges and expenses imposed in connection with investing in Variable Contracts, which will reduce returns. Current performance may be lower or higher than the performance data quoted. Performance data current to the most recent month-end is available by calling (800) 927-4648.
| | | | | | | | | | |
| Expense Example | | | | Actual Performance | | | | Hypothetical Performance |
| | | | | | | | | (5% return before expenses) |
Beginning Account Value (1/01/06) | | | | $ | 1,000.00 | | | | $ | 1,000.00 |
Ending Account Value (06/30/06) | | | | $ | 995.50 | | | | $ | 1,020.38 |
Expenses Paid During Period† | | | | $ | 4.40 | | | | $ | 4.46 |
† Expenses are equal to the Portfolio’s Administrative Class annualized expense ratio of 0.89%, multiplied by the average account value over the period, multiplied by 181/365 (to reflect the one-half year period). Overall fees and expenses of investing in the Portfolio will be higher because the example does not reflect Variable Contract fees and expenses.
Please refer to page 3 herein for a description of the Portfolio’s benchmark and an explanation of the information presented in the above Expense Example.
Portfolio Insights
| » | | The PIMCO CommodityRealReturn Strategy Portfolio seeks to achieve its investment objective by investing under normal circumstances in commodity-linked derivative instruments backed by a portfolio of inflation-indexed securities and other Fixed-Income Instruments. |
| » | | Commodities rallied for the six-month period of December 31, 2005 to June 30, 2006, driven in part by surging gasoline prices resulting from concerns over supply disruptions to the U.S. gasoline market amid strong demand. Also benefiting commodities was continued strong global economic growth, which boosted demand and prices alike for industrial metals. |
| » | | The Portfolio invested the collateral backing its commodity derivatives positions primarily in Treasury Inflation-Protected Securities (“TIPS”), implementing a “double real®” strategy. For the six-month period ending June 30, 2006, this was negative for performance, as TIPS performance was negative. |
| » | | The Portfolio’s below benchmark TIPS duration added to performance as real yields rose on strong U.S. economic growth. The effective duration of the Portfolio was 6.86 years on June 30, 2006 compared to a duration of 6.11 years for the benchmark. |
| » | | The Portfolio’s emphasis on U.S. nominal bonds was negative for performance, as nominal yields rose faster than real yields on higher inflation expectations and the outlook for further Federal Reserve tightening. |
| » | | Positions in short maturity U.S. nominal bonds for the period detracted significantly from performance due to a substantial flattening of the nominal yield curve. |
| » | | Currency exposure added to performance resulting from a depreciation of the U.S. dollar relative to the Euro and Japanese Yen. |
| » | | Mortgage holdings during the period were positive due to favorable coupon selection, particularly 15-year FNMA 5.0% and 30-year FNMA 5.5% coupons, which outperformed the broader Index. |
| | | | |
| 4 | | PIMCO Variable Insurance Trust | | |
| | |
| |
| Financial Highlights CommodityRealReturn Strategy Portfolio | | |
| | | | | | | | | | | | |
| Selected Per Share Data for the Year or Period Ended: | | 06/30/2006+ | | | 12/31/2005 | | | 06/30/2004-12/31/2004 | |
| | | |
Administrative Class | | | | | | | | | | | | |
| Net asset value beginning of period | | $ | 12.25 | | | $ | 10.49 | | | $ | 10.00 | |
| Net investment income (a) | | | 0.19 | | | | 0.35 | | | | 0.07 | |
| Net realized/unrealized gain (loss) on investments (a) | | | (0.26 | ) | | | 1.64 | | | | 0.58 | |
| Total income (loss) from investment operations | | | (0.07 | ) | | | 1.99 | | | | 0.65 | |
| Dividends from net investment income | | | (0.17 | ) | | | (0.22 | ) | | | 0.00 | |
| Distributions from net realized capital gains | | | 0.00 | | | | (0.01 | ) | | | (0.16 | ) |
| Total distributions | | | (0.17 | ) | | | (0.23 | ) | | | (0.16 | ) |
| Net asset value end of period | | $ | 12.01 | | | $ | 12.25 | | | $ | 10.49 | |
| Total return | | | (0.45 | )% | | | 19.08 | % | | | 6.51 | % |
| Net assets end of period (000s) | | $ | 147,599 | | | $ | 106,943 | | | $ | 3,358 | |
| Ratio of expenses to average net assets | | | 0.89 | %* | | | 0.89 | % | | | 0.90 | %*(b)(c) |
| Ratio of net investment income to average net assets | | | 3.18 | %* | | | 2.92 | % | | | 1.36 | %* |
| Portfolio turnover rate | | | 629 | % | | | 1,415 | % | | | 700 | % |
+ Unaudited
* Annualized
(a) Per share amounts based on average number of shares outstanding during the period.
(b) Ratio of expenses to average net assets excluding interest expense is 0.89%.
(c) If the investment manager had not reimbursed expenses, the ratio of expenses to average net assets would have been 1.58%.
| | | | | | |
| See Accompanying Notes | | Semiannual Report | | June 30, 2006 | | 5 |
| | |
| |
| Statement of Assets and Liabilities CommodityRealReturn Strategy Portfolio | | |
| | | | |
| (Amounts in thousands, except per share amounts) | | June 30, 2006
(Unaudited) | |
| |
Assets: | | | | |
Investments, at value | | $ | 312,385 | |
Cash | | | 60 | |
Foreign currency, at value | | | 14 | |
Receivable for investments sold | | | 425 | |
Receivable for investments sold on delayed-delivery basis | | | 511 | |
Receivable for Portfolio shares sold | | | 1,357 | |
Interest and dividends receivable | | | 449 | |
Variation margin receivable | | | 64 | |
Swap premiums paid | | | 532 | |
Unrealized appreciation on forward foreign currency contracts | | | 18 | |
Unrealized appreciation on swap agreements | | | 94 | |
Other assets | | | 68 | |
| | | | 315,977 | |
| |
Liabilities: | | | | |
Payable for investments purchased | | $ | 15,801 | |
Payable for investments purchased on delayed-delivery basis | | | 149,121 | |
Payable for Portfolio shares redeemed | | | 655 | |
Written options outstanding | | | 89 | |
Accrued investment advisory fee | | | 62 | |
Accrued administration fee | | | 32 | |
Variation margin payable | | | 62 | |
Recoupment payable to Manager | | | 3 | |
Swap premiums received | | | 37 | |
Unrealized depreciation on forward foreign currency contracts | | | 481 | |
Unrealized depreciation on swap agreements | | | 20 | |
Other liabilities | | | 396 | |
| | | | 166,759 | |
| |
Net Assets | | $ | 149,218 | |
| |
Net Assets Consist of: | | | | |
Paid in capital | | $ | 147,883 | |
Undistributed net investment income | | | 3,943 | |
Accumulated undistributed net realized (loss) | | | (6,005 | ) |
Net unrealized appreciation | | | 3,397 | |
| | | $ | 149,218 | |
| |
Net Assets: | | | | |
Administrative Class | | $ | 147,599 | |
Advisor Class | | | 1,619 | |
| |
Shares Issued and Outstanding: | | | | |
Administrative Class | | | 12,279 | |
Advisor Class | | | 135 | |
| |
Net Asset Value and Redemption Price Per Share (Net Assets Per Share Outstanding) | | | | |
Administrative Class | | | 12.02 | |
Advisor Class | | | 12.01 | |
| |
Cost of Investments Owned | | $ | 307,923 | |
Cost of Foreign Currency Held | | $ | 14 | |
Premiums Received on Written Options | | $ | 148 | |
| | | | |
| 6 | | PIMCO Variable Insurance Trust | | See Accompanying Notes |
| | |
| |
| Statement of Operations CommodityRealReturn Strategy Portfolio | | |
| | | | |
| (Amounts In Thousands) | | Six Months Ended
June 30, 2006
(Unaudited) | |
| |
Investment Income: | | | | |
Interest | | $ | 2,782 | |
Total Income | | | 2,782 | |
| |
Expenses: | | | | |
Investment advisory fees | | | 334 | |
Administration fees | | | 171 | |
Servicing fees – Administrative Class | | | 102 | |
Trustees’ fees | | | 1 | |
Interest expense | | | 2 | |
Miscellaneous expense | | | 3 | |
Total Expenses | | | 613 | |
| |
Net Investment Income | | | 2,169 | |
| |
Net Realized and Unrealized Gain (Loss): | | | | |
Net realized (loss) on investments | | | (7,788 | ) |
Net realized gain on futures contracts, options and swaps | | | 2,707 | |
Net realized (loss) on foreign currency transactions | | | (158 | ) |
Net change in unrealized appreciation on investments | | | 3,018 | |
Net change in unrealized appreciation on futures contracts, options and swaps | | | 769 | |
Net change in unrealized appreciation on translation of assets and liabilities denominated in foreign currencies | | | 414 | |
Net (Loss) | | | (1,038 | ) |
| |
Net Increase in Net Assets Resulting from Operations | | $ | 1,131 | |
| | | | | | |
| See Accompanying Notes | | Semiannual Report | | June 30, 2006 | | 7 |
| | |
| |
| Statements of Changes in Net Assets CommodityRealReturn Strategy Portfolio | | |
| | | | | | | | |
| (Amounts in Thousands) | | Six Months Ended
June 30, 2006
(Unaudited) | | | Year Ended
December 31, 2005 | |
| | |
Increase (Decrease) in Net Assets from: | | | | | | | | |
| | |
Operations: | | | | | | | | |
Net investment income | | $ | 2,169 | | | $ | 994 | |
Net realized gain (loss) | | | (5,239 | ) | | | 3,135 | |
Net change in unrealized appreciation (depreciation) | | | 4,201 | | | | (756 | ) |
Net increase resulting from operations | | | 1,131 | | | | 3,373 | |
| | |
Distributions to Shareholders: | | | | | | | | |
| From net investment income | | | | | | | | |
Administrative Class | | | (1,990 | ) | | | (1,210 | ) |
Advisor Class | | | (15 | ) | | | 0 | |
| From net realized capital gains | | | | | | | | |
Administrative Class | | | 0 | | | | (100 | ) |
Advisor Class | | | 0 | | | | 0 | |
| | |
Total Distributions | | | (2,005 | ) | | | (1,310 | ) |
| | |
Portfolio Share Transactions: | | | | | | | | |
| Receipts for shares sold | | | | | | | | |
Administrative Class | | | 86,046 | | | | 107,935 | |
Advisor Class | | | 1,992 | | | | 0 | |
| Issued as reinvestment of distributions | | | | | | | | |
Administrative Class | | | 1,990 | | | | 1,298 | |
Advisor Class | | | 15 | | | | 0 | |
| Cost of shares redeemed | | | | | | | | |
Administrative Class | | | (46,555 | ) | | | (7,711 | ) |
Advisor Class | | | (339 | ) | | | 0 | |
Net increase resulting from Portfolio share transactions | | | 43,149 | | | | 101,522 | |
| | |
Total Increase in Net Assets | | | 42,275 | | | | 103,585 | |
| | |
Net Assets: | | | | | | | | |
Beginning of period | | | 106,943 | | | | 3,358 | |
End of period* | | $ | 149,218 | | | $ | 106,943 | |
| | |
*Including undistributed net investment income of: | | $ | 3,943 | | | $ | 3,779 | |
| | | | |
| 8 | | PIMCO Variable Insurance Trust | | See Accompanying Notes |
| | |
| |
| Schedule of Investments CommodityRealReturn Strategy Portfolio | | June 30, 2006 (Unaudited) |
| | | | |
| | | PRINCIPAL | | |
| | | AMOUNT | | VALUE |
| | | (000S) | | (000S) |
| | | | | |
| | | | | | | | |
| STRUCTURED NOTES 34.2% |
| Bank of America N.A.: DJAIG Commodity Linked Index Total Return Index |
4.983% due 06/08/2007 | | $ | | 3,000 | | $ | | 2,885 |
|
| Bear Stearn Co., Inc.: DJAIG Commodity Linked Index Total Return Index |
5.209% due 06/11/2007 | | | | 3,000 | | | | 2,777 |
|
| Calyon Financial Products (Guernsey) Ltd.: DJAIG Commodity Linked Index Total Return Index |
1.000% due 07/16/2007 | | | | 3,000 | | | | 3,107 |
|
| Commonwealth Bank of Australia: DJAIG Commodity Linked Index Total Return Index |
1.000% due 06/28/2007 | | | | 2,800 | | | | 3,170 |
|
| Credit Suisse First Boston New York: DJAIG Commodity Linked Index Total Return Index |
1.000% due 11/20/2006 | | | | 4,000 | | | | 4,499 |
|
| Eksportfinans ASA: DJAIG Commodity Linked Index Total Return Index |
0.000% due 05/18/2007 | | | | 3,500 | | | | 3,702 |
|
| CDC IXIS: DJAIG Commodity Linked Index Total Return Index |
4.829% due 04/09/2007 | | | | 2,000 | | | | 2,312 |
|
| JP Morgan: DJAIG Commodity Linked Index Total Return Index |
4.679% due 04/30/2007 | | | | 1,000 | | | | 1,116 |
|
| Landesbank Baden-Wurttenberg: DJAIG Commodity Linked Index Total Return Index |
1.000% due 04/10/2007 | | | | 3,000 | | | | 2,777 |
|
| Merrill Lynch & Co., Inc.: DJAIG Commodity Linked Index Total Return Index |
4.737% due 03/19/2007 | | | | 2,000 | | | | 2,313 |
|
| Morgan Stanley: DJAIG Commodity Linked Index Total Return Index |
1.000% due 04/30/2007 | | | | 2,000 | | | | 2,300 |
4.969% due 06/15/2007 | | | | 1,000 | | | | 872 |
1.000% due 07/06/2007 | | | | 10,000 | | | | 10,457 |
|
| RaboBank: DJAIG Commodity Linked Index Total Return Index |
4.979% due 06/21/2007 | | | | 2,000 | | | | 2,266 |
|
| Svensk Exportkredit AB: DJAIG Commodity Linked Index Total Return Index |
1.000% due 03/30/2007 | | | | 1,000 | | | | 930 |
1.000% due 04/18/2007 | | | | 2,000 | | | | 2,327 |
|
| UBS AG: DJAIG Commodity Linked Index Total Return Index |
4.967% due 02/20/2007 | | | | 3,000 | | | | 3,193 |
| | | | | | | | |
|
Total Structured Notes (Cost $48,300) | | 51,003 |
| | | | | | | | |
|
| |
| CORPORATE BONDS & NOTES 1.1% |
| |
| BANKING & FINANCE 0.7% |
| Atlantic & Western Re Ltd. |
11.240% due 01/09/2009 | | | | 300 | | | | 283 |
|
| Ford Motor Credit Co. |
6.320% due 09/28/2007 | | | | 200 | | | | 196 |
|
| General Electric Capital Corp. |
5.340% due 12/12/2008 | | | | 100 | | | | 100 |
|
| Rabobank Nederland |
5.088% due 01/15/2009 | | | | 100 | | | | 100 |
|
| Wachovia Bank N.A. |
5.308% due 12/02/2010 | | | | 400 | | | | 400 |
| | | | | | | | |
|
| | | | | | | | | 1,079 |
| | | | | | | | |
|
| |
| INDUSTRIALS 0.4% |
| Caesars Entertainment, Inc. |
8.875% due 09/15/2008 | | | | 300 | | | | 316 |
| | | | | | | | |
| Starwood Hotels & Resorts Worldwide, Inc. |
7.375% due 05/01/2007 | | $ | | 300 | | $ | | 303 |
| | | | | | | | |
|
| | | | | | | | | 619 |
| | | | | | | | |
|
Total Corporate Bonds & Notes
(Cost $1,719) | | 1,698 |
| | | | | | | | |
|
| |
| U.S. GOVERNMENT AGENCIES 6.2% |
| Fannie Mae | | | | | | | | |
4.192% due 11/01/2034 | | | | 331 | | | | 325 |
4.500% due 10/25/2022 | | | | 15 | | | | 15 |
4.681% due 02/25/2036 | | | | 300 | | | | 291 |
5.211% due 03/01/2044 - 10/01/2044 (c) | | | | 1,139 | | | | 1,145 |
5.500% due 09/01/2035 - 07/13/2036 (c) | | | | 6,725 | | | | 6,461 |
5.672% due 05/25/2042 | | | | 32 | | | | 32 |
5.950% due 02/25/2044 | | | | 200 | | | | 198 |
|
| Freddie Mac |
4.000% due 03/15/2023 - 10/15/2023 (c) | | | | 185 | | | | 181 |
4.555% due 01/01/2034 | | | | 62 | | | | 60 |
5.211% due 02/25/2045 | | | | 509 | | | | 505 |
5.582% due 08/25/2031 | | | | 8 | | | | 8 |
| | | | | | | | |
|
Total U.S. Government Agencies
(Cost $9,292) | | 9,221 |
| | | | | | | | |
|
| |
| U.S. TREASURY OBLIGATIONS 100.0% |
| Treasury Inflation Protected Securities (b) |
3.375% due 01/15/2007 | | | | 128 | | | | 128 |
3.625% due 01/15/2008 | | | | 6,762 | | | | 6,880 |
3.875% due 01/15/2009 | | | | 4,318 | | | | 4,473 |
4.250% due 01/15/2010 | | | | 12,746 | | | | 13,545 |
0.875% due 04/15/2010 | | | | 13,669 | | | | 12,899 |
2.375% due 04/15/2011 | | | | 10,602 | | | | 10,563 |
3.000% due 07/15/2012 | | | | 13,954 | | | | 14,374 |
1.875% due 07/15/2013 | | | | 4,517 | | | | 4,341 |
2.000% due 01/15/2014 | | | | 3,066 | | | | 2,961 |
2.000% due 07/15/2014 | | | | 2,040 | | | | 1,965 |
1.625% due 01/15/2015 | | | | 530 | | | | 494 |
1.875% due 07/15/2015 | | | | 11,859 | | | | 11,256 |
2.000% due 01/15/2016 | | | | 22,326 | | | | 21,327 |
2.375% due 01/15/2025 | | | | 10,402 | | | | 10,127 |
2.000% due 01/15/2026 | | | | 12,743 | | | | 11,671 |
3.625% due 04/15/2028 | | | | 11,134 | | | | 13,215 |
3.875% due 04/15/2029 | | | | 6,400 | | | | 7,921 |
|
| U.S. Treasury Bonds | | | | | | | | |
4.500% due 02/15/2036 | | | | 500 | | | | 448 |
|
| U.S. Treasury Notes | | | | | | | | |
4.500% due 02/28/2011 | | | | 100 | | | | 98 |
4.500% due 11/15/2015 | | | | 600 | | | | 572 |
| | | | | | | | |
|
Total U.S. Treasury Obligations
(Cost $148,219) | | | | 149,258 |
| | | | | | | | |
|
| |
| MORTGAGE-BACKED SECURITIES 1.2% |
| Citigroup Mortgage Loan Trust, Inc. | | | | |
4.700% due 12/25/2035 | | | | 476 | | | | 467 |
|
| Countrywide Home Loan Mortgage Pass-Through Trust |
3.795% due 11/19/2033 | | | | 42 | | | | 40 |
|
| First Horizon Alternative Mortgage Securities |
4.745% due 06/25/2034 | | | | 64 | | | | 62 |
|
| GGP Mall Properties Trust |
5.007% due 11/15/2011 | | | | 95 | | | | 95 |
|
| Greenpoint Mortgage Funding Trust |
5.592% due 11/25/2045 | | | | 67 | | | | 67 |
|
| Harborview Mortgage Loan Trust |
5.492% due 03/19/2037 | | | | 198 | | | | 198 |
| | | | | | | | |
| Lehman XS Trust |
5.402% due 06/25/2036 | | $ | | 200 | | $ | | 200 |
5.402% due 04/25/2046 | | | | 379 | | | | 379 |
|
| Mastr Adjustable Rate Mortgages Trust |
3.786% due 11/21/2034 | | | | 100 | | | | 94 |
|
| Structured Adjustable Rate Mortgage Loan Trust |
4.580% due 02/25/2034 | | | | 98 | | | | 96 |
5.682% due 01/25/2035 | | | | 96 | | | | 98 |
| | | | | | | | |
|
Total Mortgage-Backed Securities
(Cost $1,802) | | 1,796 |
| | | | | | | | |
|
| |
| ASSET-BACKED SECURITIES 4.0% |
| AAA Trust | | | | | | | | |
5.422% due 11/26/2035 | | | | 13 | | | | 13 |
|
| ACE Securities Corp. |
5.432% due 10/25/2035 | | | | 192 | | | | 192 |
|
| Argent Securities, Inc. |
5.442% due 10/25/2035 | | | | 48 | | | | 48 |
5.462% due 02/25/2036 | | | | 287 | | | | 287 |
5.402% due 03/25/2036 | | | | 161 | | | | 162 |
5.392% due 05/25/2036 | | | | 174 | | | | 174 |
|
| Asset-Backed Funding Certificates |
5.432% due 08/25/2035 | | | | 85 | | | | 85 |
|
| Bear Stearns Asset-Backed Securities, Inc. |
5.522% due 09/25/2034 | | | | 32 | | | | 32 |
|
| Chase Credit Card Master Trust |
5.579% due 11/17/2008 | | | | 100 | | | | 100 |
|
| Citigroup Mortgage Loan Trust, Inc. |
5.432% due 09/25/2035 | | | | 63 | | | | 63 |
5.402% due 12/27/2036 | | | | 214 | | | | 214 |
|
| Countrywide Asset-Backed Certificates |
5.422% due 08/25/2035 | | | | 51 | | | | 51 |
5.512% due 08/25/2035 | | | | 100 | | | | 100 |
5.452% due 02/25/2036 | | | | 91 | | | | 91 |
5.392% due 03/25/2036 | | | | 277 | | | | 277 |
5.392% due 04/25/2036 | | | | 92 | | | | 92 |
|
| FBR Securitization Trust |
5.442% due 09/25/2035 | | | | 54 | | | | 54 |
5.502% due 09/25/2035 | | | | 100 | | | | 100 |
5.432% due 10/25/2035 | | | | 479 | | | | 479 |
5.442% due 10/25/2035 | | | | 55 | | | | 55 |
|
| First Franklin Mortgage Loan Asset-Backed Certificates |
5.412% due 01/25/2036 | | | | 256 | | | | 257 |
|
| First NLC Trust |
5.432% due 12/25/2035 | | | | 103 | | | | 103 |
|
| Ford Credit Auto Owner Trust |
4.240% due 03/15/2008 | | | | 63 | | | | 63 |
|
| Fremont Home Loan Trust |
5.412% due 01/25/2036 | | | | 313 | | | | 314 |
|
| GSAMP Trust |
5.432% due 01/25/2036 | | | | 185 | | | | 185 |
|
| Home Equity Asset Trust |
5.432% due 02/25/2036 | | | | 71 | | | | 71 |
5.402% due 05/25/2036 | | | | 87 | | | | 87 |
|
| HSI Asset Securitization Corp. Trust |
5.402% due 12/25/2035 | | | | 83 | | | | 83 |
|
| Indymac Residential Asset-Backed Trust |
5.412% due 03/25/2036 | | | | 251 | | | | 251 |
5.422% due 03/25/2036 | | | | 76 | | | | 76 |
|
| JP Morgan Mortgage Acquisition Corp. |
5.392% due 01/25/2026 | | | | 132 | | | | 132 |
|
| Long Beach Mortgage Loan Trust |
5.522% due 11/25/2034 | | | | 62 | | | | 62 |
5.402% due 02/25/2036 | | | | 79 | | | | 79 |
| | | | | | |
| See Accompanying Notes | | Semiannual Report | | June 30, 2006 | | 9 |
| | |
| |
| Schedule of Investments CommodityRealReturn Strategy Portfolio (Cont.) | | |
| | | | | | | | | |
| | | | | PRINCIPAL | | | | | |
| | | | | AMOUNT | | | | | VALUE |
| | | | | (000S) | | | | | (000S) |
| |
| Merrill Lynch Mortgage Investors, Inc. |
5.402% due 01/25/2037 | | $ | | 83 | | | $ | | 83 |
|
| Nelnet Student Loan Trust |
5.190% due 07/25/2016 | | | | 100 | | | | | 100 |
|
| New Century Home Equity Loan Trust |
5.432% due 09/25/2035 | | | | 42 | | | | | 42 |
|
| Nomura Asset Acceptance Corp. |
5.462% due 01/25/2036 | | | | 81 | | | | | 81 |
|
| Residential Asset Mortgage Products, Inc. |
5.402% due 12/25/2007 | | | | 80 | | | | | 80 |
|
| Residential Asset Securities Corp. |
5.422% due 09/25/2025 | | | | 18 | | | | | 18 |
5.422% due 05/25/2027 | | | | 126 | | | | | 126 |
|
| Residential Funding Mortgage Securities II, Inc. |
5.462% due 05/25/2015 | | | | 142 | | | | | 142 |
|
| SACO I, Inc. |
5.432% due 10/25/2033 | | | | 99 | | | | | 100 |
|
| Securitized Asset-Backed Receivables LLC Trust |
5.392% due 10/25/2035 | | | | 68 | | | | | 68 |
|
| Soundview Home Equity Loan Trust |
5.432% due 05/25/2035 | | | | 64 | | | | | 64 |
5.392% due 03/25/2036 | | | | 79 | | | | | 79 |
|
| Structured Asset Investment Loan Trust |
5.412% due 07/25/2035 | | | | 39 | | | | | 39 |
|
| Structured Asset Securities Corp. |
5.452% due 12/25/2035 | | | | 265 | | | | | 266 |
|
| Susquehanna Auto Lease Trust |
4.991% due 04/16/2007 | | | | 60 | | | | | 60 |
|
| USAA Auto Owner Trust |
5.030% due 11/17/2007 | | | | 100 | | | | | 100 |
|
| Wachovia Mortgage Loan Trust LLC |
5.432% due 10/25/2035 | | | | 41 | | | | | 41 |
| | | | | | | | | |
|
Total Asset-Backed Securities
(Cost $5,917) | | 5,921 |
| | | | | | | | | |
|
| |
| | | | | NOTIONAL
AMOUNT
(000S) | | | | | |
| PURCHASED CALL OPTIONS 0.0% |
| 2-Year Interest Rate Swap (OTC) Pay 3-Month USD-LIBOR Floating Rate Index |
Strike @ 5.250% Exp. 06/07/2007 | | | | 7,000 | | | | | 19 |
| | | | | | | | | |
|
Total Purchased Call Options
(Cost $30) | | 19 |
| | | | | | | | | |
|
| |
| | | | | #OF
CONTRACTS | | | | | |
| PURCHASED PUT OPTIONS 0.0% |
| 90-Day Eurodollar December Futures (CME) |
Strike @ $92.000 Exp. 12/18/2006 | | | | 50 | | | | | 0 |
Strike @ $92.500 Exp. 12/18/2006 | | | | 53 | | | | | 0 |
Strike @ $92.750 Exp. 12/18/2006 | | | | 16 | | | | | 0 |
|
| 90-Day Eurodollar March Futures (CME) |
Strike @ $92.000 Exp. 03/19/2007 | | | | 83 | | | | | 1 |
|
| 90-Day Eurodollar September Futures (CME) |
Strike @ $92.000 Exp. 09/17/2007 | | | | 1 | | | | | 0 |
| | | | | | | | | |
| Treasury Inflation Protected Securities (OTC) 0.875% due 04/05/2010 |
Strike @ $83.000 Exp. 07/05/2006 | | $ | | 11,000 | | | $ | | 0 |
|
| Treasury Inflation Protected Securities (OTC) 1.875% due 07/13/2015 |
Strike @ $70.000 Exp. 07/13/2006 | | | | 20,000 | | | | | 0 |
|
| Treasury Inflation Protected Securities (OTC) 2.000% due 01/15/2016 |
Strike @ $68.000 Exp. 09/15/2006 | | | | 20,000 | | | | | 0 |
|
| Treasury Inflation Protected Securities (OTC) 2.000% due 01/17/2026 |
Strike @ $54.000 Exp. 07/17/2006 | | | | 11,000 | | | | | 0 |
|
| Treasury Inflation Protected Securities (OTC) 2.375% due 01/13/2025 |
Strike @ $58.000 Exp. 07/13/2006 | | | | 5,000 | | | | | 0 |
|
| Treasury Inflation Protected Securities (OTC) 3.000% due 07/08/2012 |
Strike @ $83.000 Exp. 08/08/2006 | | | | 14,200 | | | | | 0 |
|
| Treasury Inflation Protected Securities (OTC) 3.500% due 01/17/2011 |
Strike @ $89.000 Exp. 07/17/2006 | | | | 6,000 | | | | | 0 |
|
| Treasury Inflation Protected Securities (OTC) 3.625% due 01/08/2008 |
Strike @ $96.000 Exp. 08/08/2006 | | | | 6,800 | | | | | 0 |
|
| Treasury Inflation Protected Securities (OTC) 3.625% due 04/05/2028 |
Strike @ $76.000 Exp. 07/05/2006 | | | | 11,000 | | | | | 0 |
|
| Treasury Inflation Protected Securities (OTC) 3.875% due 04/08/2029 |
Strike @ $70.000 Exp. 08/08/2006 | | | | 6,300 | | | | | 0 |
|
| Treasury Inflation Protected Securities (OTC) 4.250% due 01/05/2010 |
Strike @ $95.000 Exp. 07/05/2006 | | | | 12,000 | | | | | 0 |
|
| U.S. dollar versus Japanese Yen (OTC) |
Strike @ JPY114.000 Exp. 07/03/2006 | | | | 1,800 | | | | | 3 |
| | | | | | | | | |
|
Total Purchased Put Options
(Cost $50) | | 4 |
| | | | | | | | | |
|
| |
| | | | | PRINCIPAL
AMOUNT
(000S) | | | | | |
| SHORT-TERM INSTRUMENTS (g) 62.7% |
| |
| COMMERCIAL PAPER 45.9% |
| Abbey National N.A. LLC |
5.100% due 07/05/2006 | | $ | | 3,800 | | | | | 3,799 |
|
| Bank of Ireland |
5.090% due 08/17/2006 | | | | 4,000 | | | | | 3,975 |
|
| Barclays U.S. Funding Corp. | | | | | | | | | |
5.140% due 09/05/2006 | | | | 1,600 | | | | | 1,584 |
|
| BNP Paribas Finance |
4.930% due 07/13/2006 | | | | 1,800 | | | | | 1,797 |
|
| Danske Corp. |
4.955% due 07/20/2006 | | | | 1,500 | | | | | 1,496 |
4.980% due 07/26/2006 | | | | 2,900 | | | | | 2,891 |
|
| Dexia Delaware LLC |
5.275% due 07/05/2006 | | | | 1,400 | | | | | 1,400 |
5.065% due 08/18/2006 | | | | 2,900 | | | | | 2,881 |
| | | | | | | | |
| DNB NORBank ASA |
4.960% due 07/17/2006 | | $ | | 700 | | $ | | 699 |
5.080% due 08/02/2006 | | | | 2,000 | | | | 1,991 |
|
| Fannie Mae |
4.809% due 07/05/2006 | | | | 1,900 | | | | 1,899 |
4.958% due 09/13/2006 | | | | 3,800 | | | | 3,758 |
|
| Federal Home Loan Bank |
5.030% due 07/03/2006 | | | | 4,000 | | | | 4,000 |
|
| Freddie Mac |
4.625% due 08/01/2006 | | | | 2,000 | | | | 1,992 |
|
| General Electric Capital Corp. |
5.060% due 08/16/2006 | | | | 2,600 | | | | 2,584 |
|
| HBOS Treasury Services PLC |
4.940% due 07/13/2006 | | | | 1,000 | | | | 999 |
5.100% due 08/25/2006 | | | | 500 | | | | 496 |
|
| ING U.S. Funding LLC |
5.235% due 08/03/2006 | | | | 3,800 | | | | 3,783 |
|
| Nordea N.A., Inc. |
4.880% due 07/06/2006 | | | | 1,600 | | | | 1,599 |
5.090% due 08/24/2006 | | | | 2,900 | | | | 2,879 |
|
| Skandinaviska Enskilda Banken AB |
5.280% due 07/20/2006 | | | | 1,400 | | | | 1,396 |
5.000% due 07/26/2006 | | | | 2,900 | | | | 2,891 |
|
| Societe Generale N.A. |
5.270% due 07/03/2006 | | | | 200 | | | | 200 |
4.890% due 07/06/2006 | | | | 500 | | | | 500 |
5.245% due 08/08/2006 | | | | 2,000 | | | | 1,989 |
5.100% due 08/24/2006 | | | | 1,700 | | | | 1,687 |
|
| Spintab AB |
5.120% due 08/01/2006 | | | | 2,500 | | | | 2,490 |
|
| Svenska Handelsbanken, Inc. |
4.890% due 07/06/2006 | | | | 3,900 | | | | 3,898 |
|
| Total Captial S.A. |
5.270% due 07/03/2006 | | | | 4,000 | | | | 4,000 |
|
| UBS Finance Delaware LLC |
4.930% due 07/10/2006 | | | | 2,100 | | | | 2,098 |
|
| Westpac Trust Securities NZ Ltd. |
4.960% due 07/20/2006 | | | | 900 | | | | 898 |
| | | | | | | | |
|
| | | | | | | | | 68,549 |
| | | | | | | | |
|
| |
| FRANCE TREASURY BILLS 7.5% |
2.527% due 07/13/2006 -07/20/2006 (c) | | EUR | | 8,740 | | | | 11,170 |
| | | | | | | | |
|
| |
| GERMANY TREASURY BILLS 8.0% |
2.684% due 08/16/2006 | | | | 9,010 | | | | 11,854 |
| | | | | | | | |
|
| |
| REPURCHASE AGREEMENT 0.9% |
| State Street Bank |
4.900% due 07/03/2006 | | $ | | 1,381 | | | | 1,381 |
| | | | | | | | |
|
(Dated 06/30/2006. Collateralized by Federal Home Loan Bank 3.375% due 02/23/2007 valued at $1,412. Repurchase proceeds are $1,382.) |
| |
| U.S. TREASURY BILLS 0.4% |
4.799% due 08/31/2006 -09/14/2006 (c)(d) | | | | 515 | | | | 511 |
| | | | | | | | |
|
Total Short-Term Instruments
(Cost $92,594) | | 93,465 |
| | | | | | | | |
|
| |
Total Investments (a) 209.4%
(Cost $307,923) | | $ | | 312,385 |
| |
Written Options (f) (0.1%)
(Premiums $148) | | (89) |
| |
| Other Assets and Liabilities (Net) (109.3%) | | (163,078) |
| | | | | | | | |
|
| Net Assets 100.0% | | | | | | $ | | 149,218 |
| | | | | | | | |
|
| | | | |
| 10 | | PIMCO Variable Insurance Trust | | See Accompanying Notes |
| | |
| |
| | | June 30, 2006 (Unaudited) |
|
| Notes to Schedule of Investments (amounts in thousands, except number of contracts): |
| |
(a) As of June 30, 2006, portfolio securities with an aggregate market value of $51,360 were valued in good faith and pursuant to guidelines established by the Board of Trustees. |
| |
(b) Principal amount of security is adjusted for inflation. |
| |
(c) Securities are grouped by coupon or range of coupons and represent a range of maturities. |
| |
(d) Securities with an aggregate market value of $511 have been segregated with the custodian to cover margin requirements for the following open futures contracts on June 30, 2006: |
| |
| | | | | | | | | | |
| Description | | Type | | Expiration
Month | | # of
Contracts | | Unrealized
(Depreciation) | |
90-Day Eurodollar December Futures | | Long | | 12/2006 | | 13 | | $ | (26 | ) |
90-Day Eurodollar December Futures | | Long | | 12/2007 | | 18 | | | (25 | ) |
90-Day Eurodollar June Futures | | Long | | 06/2007 | | 31 | | | (58 | ) |
90-Day Eurodollar March Futures | | Long | | 03/2007 | | 30 | | | (60 | ) |
90-Day Eurodollar September Futures | | Long | | 09/2007 | | 31 | | | (54 | ) |
Euro-Bund 10-Year Note September Futures | | Long | | 09/2006 | | 5 | | | (3 | ) |
U.S. Treasury 5-Year Note September Futures | | Long | | 09/2006 | | 53 | | | (35 | ) |
U.S. Treasury 10-Year Note September Futures | | Long | | 09/2006 | | 87 | | | (56 | ) |
U.S. Treasury 30-Year Bond September Futures | | Long | | 09/2006 | | 84 | | | (22 | ) |
| | | | | | | | |
|
|
|
| | | | | | | | | $ | (339 | ) |
| | | | | | | | |
|
|
|
| | | | | | | | | | | | | | | |
(e) Swap agreements outstanding on June 30, 2006: |
| Credit Default Swaps | | | | | | | | | | | | | | | |
| Counterparty | | Reference Entity | | Buy/Sell
Protection+ | | (Pay)/Receive
Fixed Rate | | | Expiration
Date | | Notional
Amount | | Unrealized
Appreciation |
Citibank N.A. | | Morgan Stanley Dean Witter & Co. | | Buy | | (0.068% | ) | | 06/20/2007 | | $ | 1,000 | | $ | 0 |
| | | | | | | | | | | | | | |
|
|
|
| + If the Portfolio is a seller of protection and a credit event occurs, as defined under the terms of that particular swap agreement, the Portfolio will pay to the buyer of the protection an amount up to the Notional value of the swap and in certain instances, take delivery of the security. As a buyer of protection, the Portfolio will generally receive from the seller of protection an amount up to the notional amount of the swap if a credit event occurs. |
| | | | | | | | | | | | | | | | |
| | | | | | | |
| Interest Rate Swaps | | | | | | | | | | | | | | | | |
| Counterparty | | Floating Rate
Index | | Pay/Receive
Floating Rate | | Fixed Rate | | Expiration
Date | | | | Notional
Amount | | Unrealized
Appreciation/
(Depreciation) | |
Barclays Bank PLC | | 5-year French CPI Ex Tobacco
Daily Reference Index | | Pay | | 2.103% | | 10/15/2010 | | EUR | | 500 | | $ | (2 | ) |
BNP Paribas Bank | | 5-year French CPI Ex Tobacco
Daily Reference Index | | Pay | | 2.040% | | 02/21/2011 | | | | 1,700 | | | (17 | ) |
Goldman Sachs & Co. | | 6-month EUR-LIBOR | | Receive | | 4.500% | | 06/17/2015 | | | | 200 | | | 17 | |
HSBC Bank USA | | 6-month GBP-LIBOR | | Receive | | 4.250% | | 06/12/2036 | | GBP | | 300 | | | 23 | |
J.P. Morgan Chase & Co. | | 6-month GBP-LIBOR | | Pay | | 5.000% | | 06/15/2008 | | | | 100 | | | 0 | |
Barclays Bank PLC | | 3-month USD-LIBOR | | Pay | | 5.000% | | 12/20/2008 | | $ | | 900 | | | (1 | ) |
Barclays Bank PLC | | 3-month USD-LIBOR | | Receive | | 5.000% | | 12/20/2016 | | | | 1,050 | | | 13 | |
Deutsche Bank AG | | 3-month USD-LIBOR | | Receive | | 5.000% | | 06/21/2021 | | | | 1,800 | | | 16 | |
Deutsche Bank AG | | 3-month USD-LIBOR | | Receive | | 5.000% | | 12/20/2026 | | | | 1,800 | | | 2 | |
Goldman Sachs & Co. | | 3-month USD-LIBOR | | Pay | | 5.000% | | 12/20/2008 | | | | 500 | | | 0 | |
Goldman Sachs & Co. | | 3-month USD-LIBOR | | Receive | | 5.000% | | 12/20/2013 | | | | 300 | | | 4 | |
Goldman Sachs & Co. | | 3-month USD-LIBOR | | Receive | | 5.000% | | 12/20/2016 | | | | 300 | | | 4 | |
Morgan Stanley Dean Witter & Co. | | 3-month USD-LIBOR | | Receive | | 5.000% | | 12/20/2036 | | | | 1,600 | | | 15 | |
| | | | | | | | | | | | | | |
|
|
|
| | | | | | | | | | | | | | | $ | 74 | |
| | | | | | | | | | | | | | |
|
|
|
| | | | | | | | | | | | | | | | | | | | |
(f) Written options outstanding on June 30, 2006: | | | | | | | | | | | | | | |
| Options on Exchange-Traded Futures Contracts | | | | | | | | | | | | | | |
| Description | | | | | | | | Exercise
Price | | Expiration
Date | | # of Contracts | | Premium | | Value |
Call - CBOT U.S. Treasury 10-Year Note September Futures | | $ | 108.000 | | 08/25/2006 | | $ | 116 | | $ | 17 | | $ | 4 |
Put - CBOT U.S. Treasury 10-Year Note September Futures | | | 103.000 | | 08/25/2006 | | | 151 | | | 23 | | | 21 |
Call - CBOT U.S. Treasury 10-Year Note September Futures | | | 107.000 | | 08/25/2006 | | | 35 | | | 3 | | | 3 |
| | | | | | | | | | | | | | | | |
|
| |
|
|
| | | | | | | | | | | | | | | | | $ | 43 | | $ | 28 |
| | | | | | | | | | | | | | | | |
|
| |
|
|
| | | | | | |
| See Accompanying Notes | | Semiannual Report | | June 30, 2006 | | 11 |
Schedule of Investments CommodityRealReturn Strategy Portfolio (Cont.)
| | | | | | | | | | | | | | | | | | | |
| Interest Rate Swaptions |
| Description | | Counterparty | | Floating Rate
Index | | Pay/Receive
Floating Rate | | Exercise
Rate | | Expiration
Date | | Notional
Amount | | Premium | | Value |
Call - OTC 10-Year Interest Rate Swap | | Barclays Bank PLC | | 3-month USD-LIBOR | | Receive | | 5.300% | | 01/02/2007 | | $ | 3,000 | | $ | 16 | | $ | 12 |
Put - OTC 10-Year Interest Rate Swap | | Barclays Bank PLC | | 3-month USD-LIBOR | | Pay | | 5.900% | | 01/02/2007 | | | 2,000 | | | 23 | | | 22 |
Put - OTC 1-Year Interest Rate Swap | | Barclays Bank PLC | | 3-month USD-LIBOR | | Pay | | 6.100% | | 01/02/2007 | | | 1,000 | | | 7 | | | 6 |
Call - OTC 5-Year Interest Rate Swap | | Royal Bank of Scotland PLC | | 3-month USD-LIBOR | | Receive | | 5.340% | | 06/07/2007 | | | 2,000 | | | 20 | | | 14 |
Call - OTC 5-Year Interest Rate Swap | | Wachovia Bank N.A. | | 3-month USD-LIBOR | | Receive | | 5.325% | | 06/07/2007 | | | 1,000 | | | 9 | | | 7 |
| | | | | | | | | | | | |
|
| |
|
|
| | | | | | | | | | | | | | | | $ | 75 | | $ | 61 |
| | | | | | | | | | | | | | | |
|
| |
|
|
| | | | | | | | | | | | | | | |
| | | | | | |
| Foreign Currency Options | | | | | | | | | | | | | | | |
| Description | | Counterparty | | Exercise
Price | | Expiration
Date | | Notional
Amount | | Premium | | Value |
Put - OTC U.S. dollar versus Japanese Yen | | Bank of America | | JPY 104.000 | | 07/03/2006 | | $ | 1,400 | | $ | 3 | | $ | 0 |
Put - OTC U.S. dollar versus Japanese Yen | | Bank of America | | 106.500 | | 07/03/2006 | | | 1,100 | | | 7 | | | 0 |
Put - OTC U.S. dollar versus Japanese Yen | | Credit Suisse First Boston | | 106.500 | | 07/03/2006 | | | 700 | | | 4 | | | 0 |
Put - OTC U.S. dollar versus Japanese Yen | | Goldman Sachs & Co. | | 104.000 | | 07/03/2006 | | | 7,300 | | | 16 | | | 0 |
| | | | | | | | | | | |
|
| |
|
|
| | | | | | | | | | | | $ | 30 | | $ | 0 |
| | | | | | | | | | | |
|
| |
|
|
| | | | | | | | | | | | | | | | | |
(g) Forward foreign currency contracts outstanding on June 30, 2006: | | | | | |
| Type | | | | Principal
Amount
Covered by
Contract | | Settlement
Month | | Unrealized
Appreciation | | Unrealized
(Depreciation) | | | Net
Unrealized
Appreciation/
(Depreciation) | |
Buy | | EUR | | 653 | | 07/2006 | | $ | 18 | | $ | 0 | | | $ | 18 | |
Sell | | | | 17,095 | | 08/2006 | | | 0 | | | (373 | ) | | | (373 | ) |
Buy | | JPY | | 9,840 | | 07/2006 | | | 0 | | | 0 | | | | 0 | |
Buy | | | | 434,578 | | 08/2006 | | | 0 | | | (108 | ) | | | (108 | ) |
| | | | | | | | |
|
| |
|
|
| |
|
|
|
| | | | | | | | | $ | 18 | | $ | (481 | ) | | $ | (463 | ) |
| | | | | | | | |
|
| |
|
|
| |
|
|
|
| | | | |
| 12 | | PIMCO Variable Insurance Trust | | See Accompanying Notes |
| | |
| |
| Notes to Financial Statements | | June 30, 2006 (Unaudited) |
1. ORGANIZATION
The CommodityRealReturn Strategy Portfolio (the “Portfolio”) is a series of the PIMCO Variable Insurance Trust (the “Trust”). The Trust is registered under the Investment Company Act of 1940 (the “Act”), as amended, as an open-end investment management company organized as a Delaware business trust on October 3, 1997. The Portfolio may offer up to two classes of shares: Administrative and Advisor. Information presented in these financial statements pertains to the Administrative Class of the Portfolio. Certain detailed financial information for the Advisor Class is provided separately and is available upon request. The Trust is designed to be used as an investment vehicle by Separate Accounts of insurance companies that fund variable annuity contracts and variable life insurance policies and by qualified pension and retirement plans.
2. SIGNIFICANT ACCOUNTING POLICIES
The following is a summary of significant accounting policies consistently followed by the Trust in the preparation of its financial statements in conformity with accounting principles generally accepted in the United States of America (“GAAP”). The preparation of financial statements in accordance with GAAP requires management to make estimates and assumptions that affect the reported amounts and disclosures in the financial statements. Actual results could differ from those estimates.
Security Valuation. Portfolio securities are valued as of the close of regular trading (normally 4:00 p.m., Eastern Time) on each day that the New York Stock Exchange (“NYSE”) is open. Portfolio securities and other assets for which market quotes are readily available are stated at market value. Market value is generally determined on the basis of last reported sales prices, or if no sales are reported, based on quotes obtained from a quotation reporting system, established market makers, or pricing services. Fixed-income securities and non-exchange traded derivatives are normally valued on the basis of quotes obtained from brokers and dealers or pricing services. Prices obtained from independent pricing services use information provided by market makers or estimates of market values obtained from yield data relating to investments or securities with similar characteristics. Certain fixed-income securities purchased on a delayed-delivery basis are marked to market daily until settlement at the forward settlement date. Short-term investments having a maturity of 60 days or less are generally valued at amortized cost. Exchange traded options, futures and options on futures are valued at the settlement price determined by the relevant exchange.
Investments initially valued in currencies other than the U.S. dollar are converted to the U.S. dollar using exchange rates obtained from pricing services. As a result, the NAV of the Portfolio’s shares may be affected by changes in the value of currencies in relation to the U.S. dollar. The value of securities traded in markets outside the United States or denominated in currencies other than the U.S. dollar may be affected significantly on a day that the NYSE is closed and an investor is not able to purchase, redeem or exchange shares.
Securities and other assets for which market quotes are not readily available are valued at fair value as determined in good faith by the Board of Trustees or persons acting at their direction. The Board of Trustees has adopted methods for valuing securities and other assets in circumstances where market quotes are not readily available, and has delegated to Pacific Investment Management Company LLC (“PIMCO”) the responsibility for applying the valuation methods. In the event that market quotes are not readily available, and the security or asset cannot be valued pursuant to one of the valuation methods, the value of the security or asset will be determined in good faith by the Valuation Committee of the Board of Trustees, generally based upon recommendations provided by PIMCO. Market quotes are considered not readily available in circumstances where there is an absence of current or reliable market-based data (e.g., trade information, bid/asked information, broker quotes), including where events occur after the close of the relevant market, but prior to the close of regular trading, that materially affect the values of the Portfolio’s securities or assets. In addition, market quotes are considered not readily available when, due to extraordinary circumstances, the exchanges or markets on which the securities trade do not open for trading for the entire day and no other market prices are available. The Board has delegated to PIMCO the responsibility for monitoring significant events that may materially affect the values of the Portfolio’s securities or assets and for determining whether the value of the applicable securities or assets should be re-evaluated in light of such significant events.
When the Portfolio uses fair value pricing to determine its NAV, securities will not be priced on the basis of quotations from the primary market in which they are traded, but rather may be priced by another method that the Board of Trustees or persons acting at their direction believe accurately reflects fair value. The Trust’s policy is intended to result in a calculation of the Portfolio’s NAV that fairly reflects security values as of the time of pricing. However, fair values determined by the Board of Trustees or persons acting at their direction may not accurately reflect the price that the Portfolio could obtain for a security if it were to dispose of that security as of the time of pricing. Because foreign securities can trade on non-business days, the NAV of the Portfolio may change on days when shareholders will not be able to purchase or redeem fund shares. The prices used by the Portfolio may differ from the value that would be realized if the securities were sold and the differences could be material to the financial statements.
Securities Transactions and Investment Income. Securities transactions are recorded as of the trade date. Securities purchased or sold on a when-issued or delayed-delivery basis may be settled a month or more after the trade date. Realized gains and losses from securities sold are recorded on the identified cost basis. Dividend income is recorded on the ex-dividend date, except certain dividends from foreign securities where the ex-dividend date may have passed, which are recorded as soon as the Portfolio is informed of the ex-dividend date. Interest income, adjusted for the accretion of discounts and amortization of premiums, is recorded on the accrual basis. Paydown gains and losses on mortgage-related or asset-backed securities are recorded as components of interest income in the Statement of Operations.
Dividends and Distributions to Shareholders. Dividends from net investment income, if any, are declared and distributed to shareholders quarterly. Net realized capital gains earned by the Portfolio, if any, will be distributed no less frequently than once each year. Most shareholders choose to reinvest their dividends and capital gain distribution in additional shares of the Portfolio.
Income dividends and capital gain distributions are determined in accordance with income tax regulations which may differ from GAAP. Differences between tax regulations and GAAP may change the fiscal year when income and capital items are recognized for tax and GAAP purposes. Examples of events that give rise to timing differences include wash sales, straddles, net operating losses and capital loss carryforwards. Further, the character of investment income and capital gains may be different for certain transactions under the two methods of accounting. Examples of characterization differences include the treatment of mortgage paydowns, swaps, foreign currency transactions and contingent debt instruments. As a result, income dividends and capital gain distributions declared during a fiscal period may differ significantly from the net investment income and realized capital gain reported in the Portfolio’s annual financial statements presented under GAAP.
Distributions classified as a tax basis return of capital, if any, are reflected in the accompanying Statements of Changes in Net Assets and have been reclassified to paid in capital. In addition, other amounts have been reclassified between
| | | | | | |
| | | Semiannual Report | | June 30, 2006 | | 13 |
Notes to Financial Statements (Cont.)
undistributed net investment income, accumulated undistributed net realized gains or losses and/or paid in capital to more appropriately conform financial accounting to tax characterizations of dividend distributions.
Multiclass Operations. Each class offered by the Portfolio has equal rights as to assets and voting privileges (except that shareholders of a class have exclusive voting rights regarding any matter relating solely to that class of shares). Income and non-class specific expenses of the Portfolio are allocated daily to each class of shares based on the relative value of settled shares. Realized and unrealized capital gains and losses of the Portfolio are allocated daily to each class of shares based on the relative net assets of each class. Class specific expenses, where applicable, currently include administrative, distribution and servicing fees.
Delayed-Delivery Transactions. The Portfolio may purchase or sell securities on a when-issued or delayed-delivery basis. These transactions involve a commitment by the Portfolio to purchase or sell securities for a predetermined price or yield, with payment and delivery taking place beyond the customary settlement period. When delayed-delivery purchases are outstanding, the Portfolio will designate liquid assets in an amount sufficient to meet the purchase price. When purchasing a security on a delayed-delivery basis, the Portfolio assumes the rights and risks of ownership of the security, including the risk of price and yield fluctuations, and takes such fluctuations into account when determining its net asset value. The Portfolio may dispose of or renegotiate a delayed-delivery transaction after it is entered into, and may sell when-issued securities before they are delivered, which may result in a capital gain or loss. When the Portfolio has sold a security on a delayed-delivery basis, the Portfolio does not participate in future gains and losses with respect to the security.
Federal Income Taxes. The Portfolio intends to qualify as a regulated investment company under sub-chapter M of the Internal Revenue Code and distribute all of its taxable income and net realized gains, if applicable, to shareholders. Accordingly, no provision for Federal income taxes has been made.
The Portfolio may gain exposure to the commodities markets by entering into swap agreements on a commodities index, and may invest in other commodity-linked derivative instruments, including commodity swap agreements, options, futures contracts, options on futures contracts and commodity-linked structured notes.
One of the requirements for favorable tax treatment as a regulated investment company under the Code is that the Portfolio derive at least 90 percent of its gross income from certain qualifying sources of income. On December 16, 2005, the IRS issued Revenue Ruling 2006-01 which held that income from commodity index-linked swaps was not qualifying income. At the time Revenue Ruling 2006-01 was issued, the Portfolio invested primarily in commodity index-linked swaps to gain exposure to the commodity markets. Revenue Ruling 2006-01 provided an effective date of June 30, 2006, after which time the Portfolio’s ability to utilize commodity index-linked swaps as part of its investment strategy will be limited to a maximum of 10 percent of its gross income.
On June 2, 2006, the IRS issued Revenue Ruling 2006-31 which extends the effective date for Revenue Ruling 2006-01 from June 30, 2006 until September 30, 2006. Revenue Ruling 2006-31 also clarifies the holding of Revenue Ruling 2006-01 by providing that income from alternative instruments (such as certain commodity index-linked notes) that create commodity exposure may be considered qualifying income under the Code. In addition, the IRS has also issued private letter rulings to at least two other funds in which the IRS specifically concluded that income from certain commodity index-linked notes is qualifying income. The Portfolio has also obtained an opinion of counsel with respect to the treatment of income from commodity index-linked notes as qualifying income under the Code. Such an opinion is not binding upon the IRS.
Based on Revenue Ruling 2006-31, IRS guidance and advice of counsel, the Portfolio will seek to gain exposure to the commodity markets primarily through investments in commodity index-linked notes. The use of commodity index-linked notes involves specific risks. The Portfolio will continue to seek ways to make use of other commodity-linked derivative instruments, including swap agreements, commodity options, futures and options on futures, and alternative structures within the Portfolio to gain exposure to commodity markets. Please refer to the prospectus for the Separate Account and Variable Contract for information regarding federal income tax treatment of distributions to the Separate Account.
Foreign Currency. The accounting records of the Portfolio are maintained in U.S. dollar. The market values of foreign securities, currency holdings and other assets and liabilities are translated into U.S. dollar based on the current exchange rates each business day. Fluctuations in the value of currency holdings and other assets and liabilities resulting from changes in exchange rates are recorded as unrealized foreign currency gains or losses. Realized gains or losses and unrealized appreciation or depreciation on investment securities and income and expenses are translated on the respective dates of such transactions. The effects of changes in foreign currency exchange rates on investments in securities are not segregated in the Statement of Operations from the effects of changes in market prices of those securities, but are included with the net realized and unrealized gain or loss on investment securities.
| | | | | | |
|
| Non-U.S. currency symbols utilized throughout the report are defined as follows: |
| EUR | | Euro | | | | |
| GBP | | British Pound | | | | |
| JPY | | Japanese Yen | | | | |
Forward Currency Transactions. The Portfolio may enter into forward currency contracts in connection with settling planned purchases or sales of securities, to hedge the currency exposure associated with some or all of the Portfolio’s securities or as a part of an investment strategy. A forward currency contract is an agreement between two parties to buy and sell a currency at a set price on a future date. The market value of a forward currency contract fluctuates with changes in forward currency exchange rates. Forward currency contracts are marked to market daily and the change in value is recorded by the Portfolio as an unrealized gain or loss. Realized gains or losses equal to the difference between the value of the contract at the time it was opened and the value at the time it was closed are recorded upon delivery or receipt of the currency or, if a forward currency contract is offset by entering into another forward currency contract with the same broker, upon settlement of the net gain or loss. These contracts may involve market risk in excess of the unrealized gain or loss reflected in the Portfolio’s Statement of Assets and Liabilities. In addition, the Portfolio could be exposed to risk if the counterparties are unable to meet the terms of the contracts or if the value of the currency changes unfavorably to the U.S. dollar.
Futures Contracts. The Portfolio is authorized to enter into futures contracts. The Portfolio may use futures contracts to manage its exposure to the securities markets or to movements in interest rates and currency values. The primary risks associated with the use of futures contracts are the imperfect correlation between the change in market value of the securities held by the Portfolio and the prices of futures contracts, the possibility of an illiquid market, and the inability of the counterparty to meet the terms of the contract. Futures contracts are valued based upon their quoted daily settlement prices. Upon entering into a futures contract, the Portfolio is required to deposit with its custodian, in a segregated account in the name of the futures broker, an amount of cash or U.S. Government and Agency Obligations in accordance with the initial margin requirements of the broker or exchange. Futures contracts are marked to market daily and an appropriate payable or receivable for the change in value (“variation margin”) is recorded by the Portfolio. Gains or losses are recognized but not considered realized until the
| | | | |
| 14 | | PIMCO Variable Insurance Trust | | |
| | |
| |
| | | June 30, 2006 (Unaudited) |
contracts expire or are closed. Futures contracts involve, to varying degrees, risk of loss in excess of the variation margin disclosed in the Statement of Assets and Liabilities.
Guarantees and Indemnifications. Under the Trust’s organizational documents, each Trustee, officer, employee or other agent of the Trust (including the Trust’s investment manager) is indemnified against certain liabilities that may arise out of performance of their duties to the Portfolio. Additionally, in the normal course of business, the Portfolio enters into contracts that contain a variety of indemnification clauses. The Portfolio’s maximum exposure under these arrangements is unknown as this would involve future claims that may be made against the Portfolio that have not yet occurred. However, the Portfolio has not had prior claims or losses pursuant to these contracts, and believes the risk of loss to be remote.
Inflation-Indexed Bonds. The Portfolio may invest in inflation-indexed bonds. Inflation-indexed bonds are fixed-income securities whose principal value is periodically adjusted to the rate of inflation. The interest rate on these bonds is generally fixed at issuance at a rate lower than typical bonds. Over the life of an inflation-indexed bond, however, interest will be paid based on a principal value, which is adjusted for inflation. Any increase in the principal amount of an inflation-indexed bond will be included as interest income in the Statement of Operations, even though investors do not receive their principal until maturity.
Options Contracts. The Portfolio may write call and put options on futures, swaps, securities or currencies it owns or in which it may invest. Writing put options tends to increase the Portfolio’s exposure to the underlying instrument. Writing call options tends to decrease the Portfolio’s exposure to the underlying instrument. When the Portfolio writes a call or put option, an amount equal to the premium received is recorded as a liability and subsequently marked to market to reflect the current value of the option written. These liabilities are reflected as written options outstanding in the Statement of Assets and Liabilities. Certain options may be written with premiums to determined on a future date. The premiums for these options are based upon implied volatility parameters at specified terms. Premiums received from writing options which expire are treated as realized gains. Premiums received from writing options which are exercised or closed are added to the proceeds or offset against amounts paid on the underlying future, swap, security or currency transaction to determine the realized gain or loss. The Portfolio as a writer of an option has no control over whether the underlying future, swap, security or currency may be sold (call) or purchased (put) and as a result bears the market risk of an unfavorable change in the price of the future, swap, security or currency underlying the written option. There is the risk the Portfolio may not be able to enter into a closing transaction because of an illiquid market.
The Portfolio may also purchase put and call options. Purchasing call options tends to increase the Portfolio’s exposure to the underlying instrument. Purchasing put options tends to decrease the Portfolio’s exposure to the underlying instrument. The Portfolio pays a premium which is included in the Portfolio’s Statement of Assets and Liabilities as an investment and subsequently marked to market to reflect the current value of the option. Premiums paid for purchasing options which expire are treated as realized losses. Certain options may be purchased with premiums to be determined on a future date. The premiums for these options are based upon implied volatility parameters at specified terms. The risk associated with purchasing put and call options is limited to the premium paid. Premiums paid for purchasing options which are exercised or closed are added to the amounts paid or offset against the proceeds on the underlying future, swap, security or currency transaction to determine the realized gain or loss.
Repurchase Agreements. The Portfolio may engage in repurchase transactions. Under the terms of a typical repurchase agreement, the Portfolio takes possession of an underlying debt obligation subject to an obligation of the seller to repurchase, and the Portfolio to resell, the obligation at an agreed-upon price and time. The market value of the collateral must be equal to or exceed at all times the total amount of the repurchase obligations, including interest. Securities purchased under repurchase agreements are reflected as an asset in the Statement of Assets and Liabilities. Generally, in the event of counterparty default, the Portfolio has the right to use the collateral to offset losses incurred. If the counterparty should default, the Portfolio will seek to sell the securities which it holds as collateral. This could involve procedural costs or delays in addition to a loss on the securities if their value should fall below their repurchase price.
Mortgage-Related and Other Asset-Backed Securities. The Portfolio may invest in mortgage-related or other asset-backed securities. These securities include mortgage pass-through securities, collateralized mortgage obligations (“CMOs”), commercial mortgage-backed securities, mortgage dollar rolls, CMO residuals, stripped mortgage-backed securities (“SMBSs”) and other securities that directly or indirectly represent a participation in, or are secured by and payable from, mortgage loans on real property. The value of some mortgage- or asset-backed securities may be particularly sensitive to changes in prevailing interest rates. Early repayment of principal on some mortgage-related securities may expose the Portfolio to a lower rate of return upon reinvestment of principal. The value of these securities may fluctuate in response to the market’s perception of the creditworthiness of the issuers. Additionally, although mortgages and mortgage-related securities are generally supported by some form of government or private guarantee and/or insurance, there is no assurance that private guarantors or insurers will meet their obligations.
Swap Agreements. The Portfolio may engage in swap transactions, including, but not limited to, swap agreements on interest rate, total return and credit default to manage its exposure to interest rates and credit risk. In connection with these agreements, securities may be identified as collateral in accordance with the terms of the respective swap agreements.
Interest rate swap agreements involve the exchange by the Portfolio with another party of their respective commitments to pay or receive interest, e.g., an exchange of floating rate payments for fixed rate payments with respect to the notional amount of principal.
Credit default swap agreements involve one party making a stream of payments to another party in exchange for the right to receive a specified return in the event of a default by a third party, typically corporate issues or sovereign issues of an emerging country, on its obligation. The Portfolio may use credit default swaps to provide a measure of protection against defaults of the issuers (i.e., to reduce risk where the Portfolio owns or has exposure to the sovereign issuer) or to take an active long or short position with respect to the likelihood of a particular issuer’s default. As a seller of protection, the Portfolio generally receives an upfront payment or a fixed rate of income throughout the term of the swap provided that there is no credit event. If the Portfolio is a seller of protection and a credit event occurs, as defined under the terms of that particular swap agreement, the Portfolio will pay to the buyer of the protection an amount up to the notional value of the swap and in certain instances take delivery of the security. As the seller, the Portfolio would effectively add leverage to its portfolio because, in addition to its total net assets, the Portfolio would be subject to investment exposure on the notional amount of the swap. As a buyer of protection, the Portfolio generally receives an amount up to the notional value of the swap if a credit event occurs. The treatment of a credit default swaps and other swap agreements that provide for contingent, non-periodic, bullet-type payments as “notional principal contracts” for federal income tax purposes is uncertain. Were the Internal Revenue Service in take the position that a credit default swap or other bullet-type swap is not a “notional principal contract” for federal income tax purposes, payments received by the Portfolio from such investments might be subject to income taxes.
| | | | | | |
| | | Semiannual Report | | June 30, 2006 | | 15 |
Notes to Financial Statements (Cont.)
Swaps are marked to market daily based upon quotations from market makers and the change in value, if any, is recorded as unrealized gain or loss in the Statement of Operations. Payments received or made at the beginning of the measurement period are reflected as such in the Statement of Assets and Liabilities. These upfront payments are recorded as realized gain or loss in the Statement of Operations upon termination or maturity of the swap. A liquidation payment received or made at the termination of the swap is recorded as realized gain or loss in the Statement of Operations. Net periodic payments received or paid by the Portfolio are included as part of realized gain or loss in the Statement of Operations. Entering into these agreements involves, to varying degrees, elements of credit, market and documentation risk in excess of the amounts recognized in the Statement of Assets and Liabilities. Such risks involve the possibility that there will be no liquid market for these agreements, that the counterparty to the agreements may default on its obligation to perform or disagree as to the meaning of contractual terms in the agreements and that there may be unfavorable changes in interest rates.
Commodities Linked/Structured Notes. The Portfolio invests in structured notes whose value is based on the price movements of a commodity index. The structured notes are often leveraged, increasing the volatility of each note’s value relative to the change in the underlying linked financial element. The value of these notes will rise and fall in response to changes in the underlying commodity index. Structured securities may entail a greater degree of market risk than other types of debt securities because the investor bears the risk of the underlying commodity index. Structured notes may also be more volatile, less liquid, and more difficult to accurately price than less complex securities or more traditional debt securities. Fluctuations in value of the structured notes are recorded as unrealized gains and losses in the accompanying financial statements. Net payments are recorded as net realized gains/losses. These notes are subject to prepayment, credit and interest risks. The Portfolio has the option to request prepayment from the issuer. At maturity, or when a note is sold, the Portfolio records a realized gain or loss. At June 30, 2006, the value of these securities comprised 34.2% of the Portfolio’s net assets and resulted in unrealized appreciation of $2,703.
U.S. Government Agencies or Government-Sponsored Enterprises. Securities issued by U.S. Government agencies or government-sponsored enterprises may not be guaranteed by the U.S. Treasury. The Government National Mortgage Association (“GNMA”), a wholly owned U.S. Government corporation, is authorized to guarantee, with the full faith and credit of the U.S. Government, the timely payment of principal and interest on securities issued by institutions approved by GNMA and backed by pools of mortgages insured by the Federal Housing Administration or guaranteed by the Department of Veterans Affairs. Government-related guarantors (i.e., not backed by the full faith and credit of the U.S. Government) include the Federal National Mortgage Association (“FNMA” or “Fannie Mae”) and the Federal Home Loan Mortgage Corporation (“FHLMC” or “Freddie Mac”). Pass-through securities issued by FNMA are guaranteed as to timely payment of principal and interest by FNMA but are not backed by the full faith and credit of the U.S. Government. FHLMC guarantees the timely payment of interest and ultimate collection of principal, but its participation certificates are not backed by the full faith and credit of the U.S. Government.
New Accounting Policies. In July 2006, the Financial Accounting Standards Board issued Interpretation No. 48, “Accounting for Uncertainty in Income Taxes—an Interpretation of FASB Statement No. 109” (the “Interpretation”). The Interpretation is effective for fiscal years beginning after December 15, 2006. Management is currently evaluating the application of the Interpretation to the Portfolio and will provide additional information in relation to the Interpretation in the Portfolio’s annual financial statements for the year ending December 31, 2006.
3. FEES, EXPENSES, AND RELATED PARTY TRANSACTIONS
Investment Advisory Fee. PIMCO is a majority-owned subsidiary of Allianz Global Investors of America L.P. (“AGI”) and serves as investment adviser (the “Adviser”) to the Trust, pursuant to an investment advisory contract. The Adviser receives a monthly fee at an annual rate based on average daily net assets of the Portfolio. The Advisory Fee is charged at an annual rate of 0.49%.
Administration Fee. PIMCO serves as administrator (the “Administrator”), and provides administrative services to the Trust for which it receives a monthly administrative fee based on average daily net assets of the Portfolio. As the Administrator, PIMCO bears the costs of various third-party services, including audit, custodial, portfolio accounting, legal, transfer agency and printing costs. The Administration Fee is charged at the annual rate of 0.25%.
Distribution and Servicing Fees. Allianz Global Investors Distributors LLC (“AGID”) is an indirect wholly-owned subsidiary of AGI and serves as the distributor of the Trust’s shares. The Trust is permitted to reimburse AGID on a quarterly basis, out of the Administrative Class assets of the Portfolio in the amount of 0.15% on an annual basis of the average daily net assets of that class, for payments made to financial intermediaries that provide services in connection with the distribution of shares or administration of plans or programs that use Portfolio shares as their funding medium. The effective rate paid to AGID was 0.15% during the current fiscal year.
Expenses. The Trust is responsible for the following expenses: (i) salaries and other compensation of any of the Trust’s executive officers and employees who are not officers, directors, stockholders or employees of PIMCO or its subsidiaries or affiliates; (ii) taxes and governmental fees; (iii) brokerage fees and commissions and other portfolio transaction expenses; (iv) the costs of borrowing money, including interest expenses and bank overdraft charges; (v) fees and expenses of the Trustees who are not “interested persons” of PIMCO or the Trust, and any counsel retained exclusively for their benefit; (vi) extraordinary expenses, including costs of litigation and indemnification expenses; (vii) organization expenses and (viii) any expenses allocated or allocable to a specific class of shares, which include service fees payable with respect to the Administrative Class shares and may include certain other expenses as permitted by the Trust’s Multiple Class Plan adopted pursuant to Rule 18f-3 under the Act and subject to review and approval by the Trustees. The ratio of expenses to average net assets per share class, as disclosed in the Financial Highlights, may differ from the annual portfolio operating expenses per share class as disclosed in the Prospectus for the reasons set forth above.
PIMCO has agreed to waive a portion of its administrative fees to the extent that the payment of the Portfolio’s pro rata share of organization expenses and Trustee fees cause the actual expense ratio to rise above the rates disclosed in the then-current prospectus plus 0.49 basis points as set forth below (calculated as a percentage of the Portfolio’s average daily net assets attributable to each class):
| | | |
| Administrative Class | | 0.89 | % |
PIMCO may be reimbursed for these waived amounts in future periods, not to exceed thirty-six months. Expenses that have been waived and may still be reimbursed by the Administrator, to the extent the Portfolio’s annualized total portfolio operating expenses plus the amount so reimbursed does not exceed the operating expense limitation, are as follows (amounts in thousands):
| | | | | | | | | | | | | | | |
| | | | | | 12/31/2004 | | | | | 12/31/2005 | | | | | 06/30/2006 |
Amount Available for Reimbursement | | | | $ | 9 | | | | $ | 0 | | | | $ | 0 |
| | | | |
| 16 | | PIMCO Variable Insurance Trust | | |
| | |
| |
| | | June 30, 2006 (Unaudited) |
For the current period ended June 30, 2006, each unaffiliated Trustee received an annual retainer of $15,000, plus $2,000 for each Board of Trustees quarterly meeting attended, $500 for each Board of Trustees committee meeting attended and $500 for each special board meeting attended, plus reimbursement of related expenses. In addition, each Committee Chair received an additional annual retainer of $500 and each Audit Committee Chair received an additional annual retainer of $1,500. These expenses are allocated on a pro-rata basis to each Portfolio of the Trust according to its respective net assets. The Trust pays no compensation directly to any Trustee or any other officer who is affiliated with the Administrator, all of whom receive remuneration for their services to the Trust from the Administrator or its affiliates.
4. PURCHASES AND SALES OF SECURITIES
The length of time the Portfolio has held a particular security is not generally a consideration in investment decisions. A change in the securities held by the Portfolio is known as “portfolio turnover”. The Portfolio may engage in frequent and active trading of portfolio securities to achieve its investment objective, particularly during periods of volatile market movements. High portfolio turnover (e.g., over 100%) involves correspondingly greater expenses to the Portfolio, including brokerage commissions or dealer mark-ups and other transaction costs on the sale of securities and reinvestments in other securities. Such sales may also result in realization of taxable capital gains, including short-term capital gains (which are generally taxed at ordinary income tax rates). The trading costs and tax effects associated with portfolio turnover may adversely affect the Portfolio’s performance.
Purchases and sales of securities (excluding short-term investments) for the period ended June 30, 2006 were as follows (amounts in thousands):
| | | | | | | | | | | | | | | | |
| | U.S Government/Agency | | | | | All Other |
| | Purchases | | | | | Sales | | | | | Purchases | | | | | Sales |
| $ | 1,090,207 | | | | $ | 1,027,659 | | | | $ | 63,523 | | | | $ | 8,613 |
5. TRANSACTIONS IN WRITTEN CALL AND PUT OPTIONS
Transactions in written call and put options were as follows (amounts in thousands, except number of contracts):
| | | | | | | | | | | | | | | | |
| | | | | # of
Contracts |
| | | |
| Notional
Amount
in $ | | | | | Premium | |
Balance at 12/31/2005 | | | | 18 | | | | | $ | 0 | | | | $ | 6 | |
Sales | | | | 310 | | | | | | 19,500 | | | | | 156 | |
Closing Buys | | | | (26 | ) | | | | | 0 | | | | | (14 | ) |
Expirations | | | | 0 | | | | | | 0 | | | | | 0 | |
Exercised | | | | 0 | | | | | | 0 | | | | | 0 | |
Balance at 06/30/2006 | | | | 302 | | | | | $ | 19,500 | | | | $ | 148 | |
6. SHARES OF BENEFICIAL INTEREST
The Portfolio may issue an unlimited number of shares of beneficial interest with a $0.001 par value. Changes in shares of beneficial interest were as follows (shares and amounts in thousands):
| | | | | | | | | | | | | | | | | | |
| | | | | Six Months Ended
06/30/2006 | | | | | Year Ended
12/31/2005 | |
| | | | | Shares | | | Amount | | | | | Shares | | | Amount | |
| | | | | | |
Receipts for shares sold | | | | | | | | | | | | | | | | | | |
Administrative Class | | | | 7,192 | | | $ | 86,046 | | | | | 8,973 | | | $ | 107,935 | |
Advisor Class | | | | 161 | | | | 1,992 | | | | | 0 | | | | 0 | |
Issued as reinvestment of distributions | | | | | | | | | | | | | | | | | | |
Administrative Class | | | | 173 | | | | 1,990 | | | | | 106 | | | | 1,298 | |
Advisor Class | | | | 1 | | | | 15 | | | | | 0 | | | | 0 | |
Cost of shares redeemed | | | | | | | | | | | | | | | | | | |
Administrative Class | | | | (3,813 | ) | | | (46,555 | ) | | | | (672 | ) | | | (7,711 | ) |
Advisor Class | | | | (27 | ) | | | (339 | ) | | | | 0 | | | | 0 | |
Net increase resulting from Portfolio share transactions | | | | 3,687 | | | $ | 43,149 | | | | | 8,407 | | | $ | 101,522 | |
* Inception date of the Portfolio
The following schedule shows the number of shareholders each owning 5% or more of the Portfolio and the total percentage of the Portfolio held by such shareholders:
| | | | | | | |
| | | | | Number of
Shareholders | | % of Portfolio Held | |
Administrative Class | | | | 4 | | 87 | * |
Advisor Class | | | | 4 | | 94 | |
* Allianz Life Insurance Co. of North America, an indirect wholly owned subsidiary of AGI and a related party to the Portfolio, owned 25% or more of the outstanding shares of beneficial interest of the Portfolio, and therefore may be presumed to “control” the Portfolio, as that term is defined in the 1940 Act.
7. FEDERAL INCOME TAX MATTERS
As of June 30, 2006, the aggregate cost of investments was the same for federal income tax and financial statement purposes. The net unrealized appreciation (depreciation) of investment securities for federal income tax purposes is as follows (amounts in thousands):
| | | | |
Aggregate
Gross
Unrealized
Appreciation | | Aggregate
Gross
Unrealized
(Depreciation) | | Net
Unrealized
Appreciation |
$ 5,397 | | $ (935) | | $ 4,462 |
8. REGULATORY AND LITIGATION MATTERS
On June 1, 2004, the Attorney General of the State of New Jersey announced that it had dismissed PIMCO from a complaint filed by the New Jersey Attorney General on February 17, 2004, and that it had entered into a settlement agreement (the “New Jersey Settlement”) with Allianz Global Investors of America L.P. (“AGI”) (formerly known as Allianz Dresdner Asset Management of America L.P.), PEA Capital LLC (an entity affiliated with PIMCO through common ownership) (“PEA”) and Allianz Global Investors Distributors LLC (“AGID”), in connection with the same matter. In the New Jersey Settlement, AGI, PEA and AGID neither admitted nor denied the allegations or conclusions of law, but did agree to pay New Jersey a civil fine of $15 million and $3 million for investigative costs and further potential enforcement initiatives against unrelated parties. They also undertook to implement certain governance changes. The complaint relating to the New Jersey Settlement alleged, among other things, that AGI, PEA and AGID had failed to disclose that they improperly allowed certain hedge funds to engage in “market timing” in certain funds. The complaint sought injunctive relief, civil monetary penalties, restitution and disgorgement of profits.
| | | | | | |
| | | Semiannual Report | | June 30, 2006 | | 17 |
| | |
| |
| Notes to Financial Statements (Cont.) | | June 30, 2006 (Unaudited) |
Since February 2004, PIMCO, AGI, PEA, AGID, and certain of their affiliates, including the PIMCO Funds, the Allianz Funds (formerly known as PIMCO Funds: Multi-Manager Series), and the Trustees and employees of the PIMCO Funds, have been named as defendants in fifteen lawsuits filed in various jurisdictions. Eleven of those lawsuits concern “market timing,” and they have been transferred to and consolidated for pre-trial proceedings in a multi-district litigation proceeding in the U.S. District Court for the District of Maryland; the other four lawsuits concern “revenue sharing” and have been consolidated into a single action in the U.S. District Court for the District of Connecticut. The lawsuits have been commenced as putative class actions on behalf of investors who purchased, held or redeemed shares of the various series of the PIMCO Funds and the Allianz Funds during specified periods, or as derivative actions on behalf of the PIMCO Funds and Allianz Funds.
The market timing actions in the District of Maryland generally allege that certain hedge funds were allowed to engage in “market timing” in certain of the PIMCO Funds and the Allianz Funds and this alleged activity was not disclosed. Pursuant to tolling agreements entered into with the derivative and class action plaintiffs, PIMCO, the Trustees, and certain employees of PIMCO who were previously named as defendants have all been dropped as defendants in the market timing actions; the plaintiffs continue to assert claims on behalf of the shareholders of the PIMCO Funds or on behalf of the PIMCO Funds themselves against other defendants. By order dated November 3, 2005, the U.S. District Court for the District of Maryland granted the PIMCO Funds’ motion to dismiss claims asserted against it in a consolidated amended complaint where the PIMCO Funds were named, in the complaint, as a nominal defendant. The revenue sharing action in the District of Connecticut generally alleges that fund assets were inappropriately used to pay brokers to promote the PIMCO Funds and Allianz Funds including directing fund brokerage transactions to such brokers, and that such alleged arrangements were not fully disclosed to shareholders. On August 11, 2005 the U.S. District Court for the District of Connecticut conducted a hearing on defendants’ motion to dismiss the consolidated amended complaint in the revenue sharing action but has not yet ruled on the motion to dismiss. The market timing and revenue sharing lawsuits seek, among other things, unspecified compensatory damages plus interest and, in some cases, punitive damages, the rescission of investment advisory contracts, the return of fees paid under those contracts and restitution.
Under Section 9(a) of the Investment Company Act of 1940, as amended (“1940 Act”), if the New Jersey Settlement or any of the lawsuits described above were to result in a court injunction against AGI, PEA, AGID and/or their affiliates, PIMCO could, in the absence of exemptive relief granted by the SEC, be barred from serving as an investment adviser, and AGID could be barred from serving as principal underwriter, to any registered investment company, including the Portfolios of the Trust. In connection with an inquiry from the SEC concerning the status of the New Jersey Settlement under Section 9(a), PEA, AGID, AGI and certain of their affiliates (including PIMCO) (together, the “Applicants”) have sought exemptive relief from the SEC under Section 9(c) of the 1940 Act. The SEC has granted the Applicants a temporary exemption from the provisions of Section 9(a) with respect to the New Jersey Settlement until the earlier of (i) September 13, 2006 and (ii) the date on which the SEC takes final action on their application for a permanent order. There is no assurance that the SEC will issue a permanent order.
Two nearly identical class action civil complaints have been filed in August 2005, in the Northern District of Illinois Eastern Division alleging that the plaintiffs each purchased and sold a 10-year Treasury note futures contract and suffered damages from an alleged shortage when PIMCO held both physical and futures positions in 10-year Treasury notes for its client accounts. The two actions have been consolidated into one action, and the two separate complaints have been replaced by a consolidated complaint. PIMCO is a named defendant, and the PIMCO Funds have been added as a defendant, to the consolidated action. PIMCO strongly believes the complaint (and any consolidated complaint filed hereafter) is without merit and intends to vigorously defend itself.
Certain Portfolios of the Trust were recently served in an adversary proceeding brought by the Official Committee of Asbestos Claimants of G-I Holdings, Inc. in G-I Holdings, Inc.’s bankruptcy in the District of New Jersey. PIMCO was previously named in this lawsuit and remains a defendant. The plaintiff seeks to recover for the bankruptcy estate assets that were transferred by the predecessor entity of G-I Holdings, Inc. to a wholly-owned subsidiary in 1994. The subsidiary has since issued notes, of which certain Portfolios of the Trust are alleged to be holders. The complaint alleges that in 2000, more than two hundred noteholders—including certain Portfolios of the Trust—were granted a second priority lien on the assets of the subsidiary in exchange for their consent to a refinancing transaction and the granting of a first priority lien to the lending banks. The plaintiff is seeking invalidation of the lien in favor of the noteholders and/or the value of the lien.
It is possible that these matters and/or other developments resulting from these matters could result in increased fund redemptions or other adverse consequences to the Portfolios. However, PIMCO and AGID believe that these matters are not likely to have a material adverse effect on the Portfolios or on PIMCO’s or AGID’s ability to perform their respective investment advisory or distribution services relating to the Portfolios.
| | | | |
| 18 | | PIMCO Variable Insurance Trust | | |
Investment Adviser and Administrator
Pacific Investment Management Company LLC
840 Newport Center Drive
Newport Beach, California 92660
Distributor
Allianz Global Investors Distributors LLC
2187 Atlantic Street
Stamford, Connecticut 06902
Custodian
State Street Bank & Trust Company
801 Pennsylvania
Kansas City, Missouri 64105
Transfer Agent
Boston Financial Data Services–Midwest
330 W. 9th Street
Kansas City, Missouri 64105
Legal Counsel
Dechert LLP
1775 I Street, N.W.
Washington, D.C. 20006
Independent Registered Public Accounting Firm
PricewaterhouseCoopers LLP
1055 Broadway
Kansas City, Missouri 64105
P I M C O

Share Class Advisor
Semiannual Report June 30, 2006
PIMCO Variable Insurance Trust
CommodityRealReturn™ Strategy Portfolio
Table of Contents
This material is authorized for use only when preceded or accompanied by the current PIMCO Variable Insurance Trust (the “Trust”) prospectus. Investors should consider the investment objectives, risks, charges and expenses of this Trust carefully before investing. Ask your financial professional to explain all charges that may apply. This and other information is contained in the Trust’s prospectus. The variable product prospectus may be obtained by contacting your Investment Consultant. Please read the Trust and variable product prospectus carefully before you invest or send money.
Chairman’s Letter
Dear PIMCO Variable Insurance Trust Shareholder:
It is our pleasure to present to you the semiannual report for the PIMCO Variable Insurance Trust covering the six-month period ended June 30, 2006.
Highlights of the global bond markets during the six-month period included:
| | n | | Most fixed-income sectors lost ground during the first half of 2006, as concern about accelerating inflation and central bank tightening pushed interest rates higher worldwide. The benchmark Lehman Brothers Aggregate Bond Index (which includes Treasury, Investment-Grade Corporate, and Residential Mortgage-Backed Securities) returned -0.72% for the first six months of the year. On June 30, the benchmark ten-year Treasury yielded 5.14%, 0.75% higher than at the start of the year. The U.S. yield curve remained flat as shorter-maturity yields rose by a comparable amount. |
| | n | | The Federal Reserve tightened four times during the reporting period, bringing the Federal Funds Rate to 5.25%. The increase near the end of the period was the Federal Reserve’s 17th consecutive rate hike since the start of its tightening cycle in 2004. The Federal Reserve was not alone, as central banks in Europe, India, and China tightened credit in unison for the first time since 2000. The Bank of Japan, whose zero-interest-rate policy has flooded global markets with liquidity, looked set to reverse this policy in the coming months. |
In these pages please find a more complete Portfolio review as it relates to financial-market activities, as well as details about total-return investment performance for the six-month reporting period. Thank you for the trust you have placed in us. We will continue to work diligently to meet your investment needs.
Sincerely,
Brent R. Harris
Chairman, PIMCO Variable Insurance Trust
July 31, 2006
| | | | | | |
| | | Semiannual Report | | June 30, 2006 | | 1 |
Important Information About the Portfolio
PIMCO Variable Insurance Trust (the “Trust”) is an open-end management investment company currently consisting of nineteen separate investment portfolios, including the CommodityRealReturn Strategy Portfolio (the “Portfolio”). The Portfolio is only available as a funding vehicle under variable life insurance policies or variable annuity contracts issued by insurance companies (“Variable Contracts”). Individuals may not purchase shares of the Portfolio directly. Shares of the Portfolio also may be sold to qualified pension and retirement plans outside of the separate account context.
We believe that bond funds have an important role to play in a well diversified investment portfolio. It is important to note, however, that in an environment where interest rates may trend upward, rising rates would negatively impact the performance of most bond funds, and fixed-income securities held by a fund are likely to decrease in value. The price volatility of fixed-income securities can also increase during periods of rising interest rates resulting in increased losses to a fund. Bond funds and individual bonds with a longer duration (a measure of the expected life of a security) tend to be more sensitive to changes in interest rates, usually making them more volatile than securities or funds with shorter durations. The longer-term performance of most bond funds has benefited from capital gains in part resulting from an extended period of declining interest rates. In the event interest rates increase, these capital gains should not be expected to recur.
The Portfolio may be subject to various risks in addition to those described above. Some of these risks may include, but are not limited to, the following: credit risk, high yield risk, market risk, issuer risk, liquidity risk, derivatives risk, commodity risk, mortgage risk, non-U.S. investment risk, currency risk, issuer non-diversification risk, leveraging risk, management risk, and tax risk. A complete description of these risks is contained in the Portfolio’s prospectus. The Portfolio may use derivative instruments for hedging purposes or as part of an investment strategy. Use of these instruments may involve certain costs and risks such as liquidity risk, interest rate risk, market risk, credit risk, management risk and the risk that the Portfolio could not close out a position when it would be most advantageous to do so. A Portfolio investing in derivatives could lose more than the principal amount invested in these instruments. Investing in non-U.S. securities may entail risk due to non-U.S. economic and political developments; this risk may be increased when investing in emerging markets.
The value of commodity-linked derivative instruments may be affected by changes in overall market movements, changes in interest rates, and other factors such as weather, disease, embargoes, and international economic and political developments, as well as the trading activity of speculators and arbitrageurs in the underlying commodities.
The Portfolio will seek to gain exposure to the commodity markets primarily through investments in leveraged or unleveraged commodity index-linked notes, which are derivative debt instruments with principal and/or coupon payments linked to the value of commodities, commodity futures contracts or the performance of commodity indices. These notes are sometimes referred to as “structured notes” because the terms of these notes may be structured by the issuer and the purchaser of the note. The value of these notes will rise or fall in response to changes in the underlying commodity or related index of investment. These notes expose the Portfolio economically to movements in commodity prices. The Portfolio may also gain exposure to commodity markets by investing in one or more underlying investment vehicles or companies that have substantially similar investment objectives as the Portfolio. Assets not invested in commodity index-linked derivative instruments may be invested in inflation-indexed securities and other fixed income instruments, including derivative fixed income instruments.
One of the requirements for favorable tax treatment as a regulated investment company under the Internal Revenue Code is that the Portfolio derive at least 90 percent of its gross income from certain qualifying sources of income. On December 16, 2005, the Internal Revenue Service issued Revenue Ruling 2006-01, which held that income from commodity index-linked swaps would not be qualifying income after June 30, 2006. At the time Revenue Ruling 2006-01 was issued, the Portfolio invested primarily in commodity index-linked swaps to gain exposure to the commodity markets. The effective date of Revenue Ruling 2006-01 was extended to September 30, 2006 by Revenue Ruling 2006-31, after which time the Portfolio’s ability to utilize commodity index-linked swaps as part of its investment strategy will be limited to a maximum of 10 percent of its gross income.
In addition to extending the effective date, Revenue Ruling 2006-31 also clarifies the holding of Revenue Ruling 2006-01 by providing that income from alternative instruments (such as certain commodity index-linked notes) that create commodity exposure may be considered qualifying income under the Internal Revenue Code. In addition, the Internal Revenue Service has also issued private letter rulings to at least two other funds in which the Internal Revenue Service specifically concluded that income from certain commodity index-linked notes is qualifying income. The Portfolio has also obtained an opinion of counsel with respect to the treatment of income from commodity index-linked notes as qualifying income under the Internal Revenue Code. Such an opinion is not binding upon the Internal Revenue Service.
Based on Revenue Ruling 2006-31, Internal Revenue Service guidance and advice of counsel, the Portfolio will seek to gain exposure to the commodity markets primarily through investments in commodity index-linked notes. These notes are subject to risks, such as credit, market and interest rate risks, that in general affect the values of debt securities. In addition, these notes are often leveraged, increasing the volatility of each note’s market value relative to changes in the underlying commodity, commodity futures contract or commodity index. Therefore, at the maturity of the note, the Portfolio may receive more or less principal than it originally invested. The Portfolio may receive interest payments on the note that are more or less than the stated coupon interest payments.
As a result of the Portfolio’s investments in commodity index-linked notes and other commodity-linked derivative instruments, it is possible that a lesser amount of the Portfolio’s assets would be available for investment in inflation-indexed instruments and other fixed income instruments, which could adversely affect the Portfolio’s total return.
The Portfolio is intended for long-term investors and an investment in the Portfolio should be no more than a small part of a typical diversified portfolio. The Portfolio’s share price is expected to be more volatile than that of other funds. The Portfolio may invest in commodity-linked derivative instruments which may subject the Portfolio to greater volatility than investments in traditional securities. The value of commodity-linked derivative instruments may be affected by changes in overall market movements, changes in interest rates, and other factors such as weather, disease, embargoes, and international economic and political developments, as well as the trading activity of speculators and arbitrageurs in the underlying commodities.
| | | | |
| 2 | | PIMCO Variable Insurance Trust | | |
On the performance summary page in this Semiannual Report, the Total Return Investment Performance table measures performance assuming that all dividend and capital gain distributions were reinvested.
An investment in the Portfolio is not a deposit of a bank and is not guaranteed or insured by the Federal Deposit Insurance Corporation or any other government agency. It is possible to lose money on investments in the Portfolio.
PIMCO has adopted written proxy voting policies and procedures (“Proxy Policy”) as required by Rule 206(4)-6 under the Investment Advisers Act of 1940. The Proxy Policy has been adopted by the Trust as the policies and procedures that PIMCO will use when voting proxies on behalf of the Portfolio. Copies of the written Proxy Policy and the factors that PIMCO may consider in determining how to vote proxies for the Portfolio, and information about how the Portfolio voted proxies relating to portfolio securities held during the most recent twelve-month period ended June 30, are available without charge, upon request, by calling the Trust at 1-866-746-2606 and on the Securities and Exchange Commission’s (“SEC”) website at http://www.sec.gov.
The Portfolio files its complete schedule of portfolio holdings with the SEC for the first and third quarters of each fiscal year on Form N-Q. A copy of the Trust’s Form N-Q is available on the SEC’s website at http://www.sec.gov and may be reviewed and copied at the SEC’s Public Reference Room in Washington D.C. Information on the operation of the Public Reference Room may be obtained by calling 1-800-SEC-0330.
PIMCO Variable Insurance Trust is distributed by Allianz Global Investors Distributors LLC, 2187 Atlantic Street, Stamford, CT 06902.
The following disclosure provides important information regarding the Portfolio’s Expense Example (“Example” or “Expense Example”), which appears in this Semiannual Report. Please refer to this information when reviewing the Expense Example for the Portfolio.
Example
As a shareholder of the Portfolio, you incur two types of costs: (1) transaction costs and (2) ongoing costs, including advisory and administrative fees; distribution and/or service (12b-1) fees (Administrative Class only); and other Portfolio expenses. The Example is intended to help you understand your ongoing costs (in dollars) of investing in the Portfolio and to compare these costs with the ongoing costs of investing in other mutual funds. The Expense Example does not reflect any fees or other expenses imposed by the Variable Contracts. If it did, the expenses reflected in the Expense Examples would be higher. The Example is based on an investment of $1,000 invested at the beginning of the period and held for the entire period indicated, which is from January 1, 2006 to June 30, 2006.
Actual Expenses
The information in the table under the heading “Actual Performance” provides information about actual account values and actual expenses. You may use the information in these columns, together with the amount you invested, to estimate the expenses that you paid over the period. Simply divide your account value by $1,000 (for example, an $8,600 account value divided by $1,000 = 8.60), then multiply the result by the number in the appropriate column for your share class, in the row titled “Expenses Paid During Period” to estimate the expenses you paid on your account during this period.
Hypothetical Example for Comparison Purposes
The information in the table under the heading “Hypothetical Performance (5% return before expenses)” provides information about hypothetical account values and hypothetical expenses based on the Portfolio’s actual expense ratio and an assumed rate of return of 5% per year before expenses, which is not the Portfolio’s actual return. The hypothetical account values and expenses may not be used to estimate the actual ending account balance or expenses you paid for the period. You may use this information to compare the ongoing costs of investing in the Portfolio and other portfolios. To do so, compare this 5% hypothetical example with the 5% hypothetical examples that appear in the shareholder reports of the other portfolios.
Please note that the expenses shown in the table are meant to highlight your ongoing costs only and do not reflect any transactional costs. Therefore, the information under the heading “Hypothetical Performance (5% return before expenses)” is useful in comparing ongoing costs only, and will not help you determine the relative total costs of owning different portfolios. In addition, if these transactional costs were included, your costs would have been higher.
The expense ratio may vary period to period because of various factors, such as an increase in expenses not covered by the advisory and administrative fees (such as expenses of the trustees and their counsel or litigation expense).
Portfolio Benchmark
Dow Jones – AIG Commodity Total Return is an unmanaged index composed of futures contracts on 19 physical commodities. The index is designed to be a highly liquid and diversified benchmark for commodities as an asset class. It is not possible to invest directly in the index.
| | | | | | |
| | | Semiannual Report | | June 30, 2006 | | 3 |
|
|
| PIMCO CommodityRealReturn Strategy Portfolio |
|
Cumulative Returns Through June 30, 2006
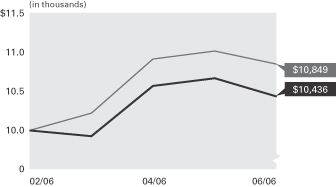
Commodity RealReturn Dow Jones - AIG
Strategy Portfolio Commodity
Advisor Class Total Return Index
-------------------- ------------------
02/28/2006 $10,000 $10,000
03/31/2006 9,929 10,222
04/30/2006 10,573 10,915
05/31/2006 10,668 11,020
06/30/2006 10,436 10,849
$10,000 invested at the beginning of the first full month following the inception date of the Portfolio’s Advisor Class.
Sector Breakdown‡
| | |
U.S. Treasury Obligations | | 47.8% |
Short-Term Instruments | | 29.9% |
Structured Notes | | 16.3% |
Other | | 6.0% |
| | ‡ | % of Total Investments as of June 30, 2006 |
| | | | | | | | | | | | |
| Cumulative Total Return for the period ended June 30, 2006 |
| | | | | | | | | | | | | Since
Inception
(02/28/06) |
| | |
| | PIMCO CommodityRealReturn Strategy Portfolio Advisor Class | | | | | | | | 4.36% |
| | |
| | Dow Jones - AIG Commodity Total Return Index | | | | | | | | 8.49% |
Past performance is no guarantee of future results. The performance quoted represents past performance. Investment return and principal value will fluctuate so that Fund shares, when redeemed, may be worth more or less than their original cost. The Portfolio’s performance does not reflect the deduction of additional charges and expenses imposed in connection with investing in Variable Contracts, which will reduce returns. Current performance may be lower or higher than the performance data quoted. Performance data current to the most recent month-end is available by calling (800) 927-4648.
| | | | | | | | | | |
| Expense Example | | | | Actual Performance | | | | Hypothetical Performance |
| | | | | | | | | (5% return before expenses) |
Beginning Account Value (02/28/06) | | | | $ | 1,000.00 | | | | $ | 1,000.00 |
Ending Account Value (06/30/06) | | | | $ | 1,043.60 | | | | $ | 1,013.51 |
Expenses Paid During Period† | | | | $ | 3.41 | | | | $ | 3.36 |
† Expenses are equal to the Portfolio’s Advisor Class annualized expense ratio of 0.99%, multiplied by the average account value over the period, multiplied by 123/365 (to reflect the period since the Portfolio’s Advisor Class share commenced operations on 02/28/06). Overall fees and expenses of investing in the Portfolio will be higher because the example does not reflect Variable Contract fees and expenses.
Please refer to page 3 herein for a description of the Portfolio’s benchmark and an explanation of the information presented in the above Expense Example.
Portfolio Insights
| » | | The PIMCO CommodityRealReturn Strategy Portfolio seeks to achieve its investment objective by investing under normal circumstances in commodity-linked derivative instruments backed by a portfolio of inflation-indexed securities and other Fixed-Income Instruments. |
| » | | Commodities rallied for the six-month period of December 31, 2005 to June 30, 2006, driven in part by surging gasoline prices resulting from concerns over supply disruptions to the U.S. gasoline market amid strong demand. Also benefiting commodities was continued strong global economic growth, which boosted demand and prices alike for industrial metals. |
| » | | The Portfolio invested the collateral backing its commodity derivatives positions primarily in Treasury Inflation-Protected Securities (“TIPS”), implementing a “double real®” strategy. For the six-month period ending June 30, 2006, this was negative for performance, as TIPS performance was negative. |
| » | | The Portfolio’s below benchmark TIPS duration added to performance as real yields rose on strong U.S. economic growth. The effective duration of the Portfolio was 6.86 years on June 30, 2006 compared to a duration of 6.11 years for the benchmark. |
| » | | The Portfolio’s emphasis on U.S. nominal bonds was negative for performance, as nominal yields rose faster than real yields on higher inflation expectations and the outlook for further Federal Reserve tightening. |
| » | | Positions in short maturity U.S. nominal bonds for the period detracted significantly from performance due to a substantial flattening of the nominal yield curve. |
| » | | Currency exposure added to performance resulting from a depreciation of the U.S. dollar relative to the Euro and Japanese Yen. |
| » | | Mortgage holdings during the period were positive due to favorable coupon selection, particularly 15-year FNMA 5.0% and 30-year FNMA 5.5% coupons, which outperformed the broader Index. |
| | | | |
| 4 | | PIMCO Variable Insurance Trust | | |
| | |
| |
| Financial Highlights CommodityRealReturn Strategy Portfolio | | |
| | | | |
| Selected Per Share Data for the Period Ended: | | 02/28/2006-
06/30/2006+ | |
| |
Advisor Class | | | | |
| Net asset value beginning of period | | $ | 11.68 | |
| Net investment income (a) | | | 0.10 | |
| Net realized/unrealized gain (loss) on investments (a) | | | 0.40 | |
| Total income (loss) from investment operations | | | 0.50 | |
| Dividends from net investment income | | | (0.17 | ) |
| Total distributions | | | (0.17 | ) |
| Net asset value end of period | | $ | 12.01 | |
| Total return | | | 4.36 | % |
| Net assets end of period (000s) | | $ | 1,619 | |
| Ratio of expenses to average net assets | | | 0.99 | %* |
| Ratio of net investment income to average net assets | | | 2.44 | %* |
| Portfolio turnover rate | | | 629 | % |
+ Unaudited
* Annualized
(a) Per share amounts based on average number of shares outstanding during the period.
| | | | | | |
| See Accompanying Notes | | Semiannual Report | | June 30, 2006 | | 5 |
| | |
| |
| Statement of Assets and Liabilities CommodityRealReturn Strategy Portfolio | | |
| | | | |
| (Amounts in thousands, except per share amounts) | | June 30, 2006
(Unaudited) | |
| |
Assets: | | | | |
Investments, at value | | $ | 312,385 | |
Cash | | | 60 | |
Foreign currency, at value | | | 14 | |
Receivable for investments sold | | | 425 | |
Receivable for investments sold on delayed-delivery basis | | | 511 | |
Receivable for Portfolio shares sold | | | 1,357 | |
Interest and dividends receivable | | | 449 | |
Variation margin receivable | | | 64 | |
Swap premiums paid | | | 532 | |
Unrealized appreciation on forward foreign currency contracts | | | 18 | |
Unrealized appreciation on swap agreements | | | 94 | |
Other assets | | | 68 | |
| | | | 315,977 | |
| |
Liabilities: | | | | |
Payable for investments purchased | | $ | 15,801 | |
Payable for investments purchased on delayed-delivery basis | | | 149,121 | |
Payable for Portfolio shares redeemed | | | 655 | |
Written options outstanding | | | 89 | |
Accrued investment advisory fee | | | 62 | |
Accrued administration fee | | | 32 | |
Variation margin payable | | | 62 | |
Recoupment payable to Manager | | | 3 | |
Swap premiums received | | | 37 | |
Unrealized depreciation on forward foreign currency contracts | | | 481 | |
Unrealized depreciation on swap agreements | | | 20 | |
Other liabilities | | | 396 | |
| | | | 166,759 | |
| |
Net Assets | | $ | 149,218 | |
| |
Net Assets Consist of: | | | | |
Paid in capital | | $ | 147,883 | |
Undistributed net investment income | | | 3,943 | |
Accumulated undistributed net realized (loss) | | | (6,005 | ) |
Net unrealized appreciation | | | 3,397 | |
| | | $ | 149,218 | |
| |
Net Assets: | | | | |
Administrative Class | | $ | 147,599 | |
Advisor Class | | | 1,619 | |
| |
Shares Issued and Outstanding: | | | | |
Administrative Class | | | 12,279 | |
Advisor Class | | | 135 | |
| |
Net Asset Value and Redemption Price Per Share (Net Assets Per Share Outstanding) | | | | |
Administrative Class | | | 12.02 | |
Advisor Class | | | 12.01 | |
| |
Cost of Investments Owned | | $ | 307,923 | |
Cost of Foreign Currency Held | | $ | 14 | |
Premiums Received on Written Options | | $ | 148 | |
| | | | |
| 6 | | PIMCO Variable Insurance Trust | | See Accompanying Notes |
| | |
| |
| Statement of Operations CommodityRealReturn Strategy Portfolio | | |
| | | | |
| (Amounts In Thousands) | | Six Months Ended
June 30, 2006
(Unaudited) | |
| |
Investment Income: | | | | |
Interest | | $ | 2,782 | |
Total Income | | | 2,782 | |
| |
Expenses: | | | | |
Investment advisory fees | | | 334 | |
Administration fees | | | 171 | |
Servicing fees – Administrative Class | | | 102 | |
Trustees’ fees | | | 1 | |
Interest expense | | | 2 | |
Miscellaneous expense | | | 3 | |
Total Expenses | | | 613 | |
| |
Net Investment Income | | | 2,169 | |
| |
Net Realized and Unrealized Gain (Loss): | | | | |
Net realized (loss) on investments | | | (7,788 | ) |
Net realized gain on futures contracts, options and swaps | | | 2,707 | |
Net realized (loss) on foreign currency transactions | | | (158 | ) |
Net change in unrealized appreciation on investments | | | 3,018 | |
Net change in unrealized appreciation on futures contracts, options and swaps | | | 769 | |
Net change in unrealized appreciation on translation of assets and liabilities denominated in foreign currencies | | | 414 | |
Net (Loss) | | | (1,038 | ) |
| |
Net Increase in Net Assets Resulting from Operations | | $ | 1,131 | |
| | | | | | |
| See Accompanying Notes | | Semiannual Report | | June 30, 2006 | | 7 |
| | |
| |
| Statements of Changes in Net Assets CommodityRealReturn Strategy Portfolio | | |
| | | | | | | | |
| (Amounts in Thousands) | | Six Months Ended
June 30, 2006
(Unaudited) | | | Year Ended
December 31, 2005 | |
| | |
Increase (Decrease) in Net Assets from: | | | | | | | | |
| | |
Operations: | | | | | | | | |
Net investment income | | $ | 2,169 | | | $ | 994 | |
Net realized gain (loss) | | | (5,239 | ) | | | 3,135 | |
Net change in unrealized appreciation (depreciation) | | | 4,201 | | | | (756 | ) |
Net increase resulting from operations | | | 1,131 | | | | 3,373 | |
| | |
Distributions to Shareholders: | | | | | | | | |
| From net investment income | | | | | | | | |
Administrative Class | | | (1,990 | ) | | | (1,210 | ) |
Advisor Class | | | (15 | ) | | | 0 | |
| From net realized capital gains | | | | | | | | |
Administrative Class | | | 0 | | | | (100 | ) |
Advisor Class | | | 0 | | | | 0 | |
| | |
Total Distributions | | | (2,005 | ) | | | (1,310 | ) |
| | |
Portfolio Share Transactions: | | | | | | | | |
| Receipts for shares sold | | | | | | | | |
Administrative Class | | | 86,046 | | | | 107,935 | |
Advisor Class | | | 1,992 | | | | 0 | |
| Issued as reinvestment of distributions | | | | | | | | |
Administrative Class | | | 1,990 | | | | 1,298 | |
Advisor Class | | | 15 | | | | 0 | |
| Cost of shares redeemed | | | | | | | | |
Administrative Class | | | (46,555 | ) | | | (7,711 | ) |
Advisor Class | | | (339 | ) | | | 0 | |
Net increase resulting from Portfolio share transactions | | | 43,149 | | | | 101,522 | |
| | |
Total Increase in Net Assets | | | 42,275 | | | | 103,585 | |
| | |
Net Assets: | | | | | | | | |
Beginning of period | | | 106,943 | | | | 3,358 | |
End of period* | | $ | 149,218 | | | $ | 106,943 | |
| | |
*Including undistributed net investment income of: | | $ | 3,943 | | | $ | 3,779 | |
| | | | |
| 8 | | PIMCO Variable Insurance Trust | | See Accompanying Notes |
| | |
| |
| Schedule of Investments CommodityRealReturn Strategy Portfolio | | June 30, 2006 (Unaudited) |
| | | | | | | | |
| | | | | PRINCIPAL | | | | |
| | | | | AMOUNT | | | | VALUE |
| | | | | (000S) | | | | (000S) |
| STRUCTURED NOTES 34.2% |
| Bank of America N.A.: DJAIG Commodity Linked Index Total Return Index |
4.983% due 06/08/2007 | | $ | | 3,000 | | $ | | 2,885 |
|
| Bear Stearn Co., Inc.: DJAIG Commodity Linked Index Total Return Index |
5.209% due 06/11/2007 | | | | 3,000 | | | | 2,777 |
|
| Calyon Financial Products (Guernsey) Ltd.: DJAIG Commodity Linked Index Total Return Index |
1.000% due 07/16/2007 | | | | 3,000 | | | | 3,107 |
|
| Commonwealth Bank of Australia: DJAIG Commodity Linked Index Total Return Index |
1.000% due 06/28/2007 | | | | 2,800 | | | | 3,170 |
|
| Credit Suisse First Boston New York: DJAIG Commodity Linked Index Total Return Index |
1.000% due 11/20/2006 | | | | 4,000 | | | | 4,499 |
|
| Eksportfinans ASA: DJAIG Commodity Linked Index Total Return Index |
0.000% due 05/18/2007 | | | | 3,500 | | | | 3,702 |
|
| CDC IXIS: DJAIG Commodity Linked Index Total Return Index |
4.829% due 04/09/2007 | | | | 2,000 | | | | 2,312 |
|
| JP Morgan: DJAIG Commodity Linked Index Total Return Index |
4.679% due 04/30/2007 | | | | 1,000 | | | | 1,116 |
|
| Landesbank Baden-Wurttenberg: DJAIG Commodity Linked Index Total Return Index |
1.000% due 04/10/2007 | | | | 3,000 | | | | 2,777 |
|
| Merrill Lynch & Co., Inc.: DJAIG Commodity Linked Index Total Return Index |
4.737% due 03/19/2007 | | | | 2,000 | | | | 2,313 |
|
| Morgan Stanley: DJAIG Commodity Linked Index Total Return Index |
1.000% due 04/30/2007 | | | | 2,000 | | | | 2,300 |
4.969% due 06/15/2007 | | | | 1,000 | | | | 872 |
1.000% due 07/06/2007 | | | | 10,000 | | | | 10,457 |
|
| RaboBank: DJAIG Commodity Linked Index Total Return Index |
4.979% due 06/21/2007 | | | | 2,000 | | | | 2,266 |
|
| Svensk Exportkredit AB: DJAIG Commodity Linked Index Total Return Index |
1.000% due 03/30/2007 | | | | 1,000 | | | | 930 |
1.000% due 04/18/2007 | | | | 2,000 | | | | 2,327 |
|
| UBS AG: DJAIG Commodity Linked Index Total Return Index |
4.967% due 02/20/2007 | | | | 3,000 | | | | 3,193 |
| | | | | | | | |
|
Total Structured Notes (Cost $48,300) | | 51,003 |
| | | | | | | | |
|
| |
| CORPORATE BONDS & NOTES 1.1% |
| |
| BANKING & FINANCE 0.7% |
| Atlantic & Western Re Ltd. |
11.240% due 01/09/2009 | | | | 300 | | | | 283 |
|
| Ford Motor Credit Co. |
6.320% due 09/28/2007 | | | | 200 | | | | 196 |
|
| General Electric Capital Corp. |
5.340% due 12/12/2008 | | | | 100 | | | | 100 |
|
| Rabobank Nederland |
5.088% due 01/15/2009 | | | | 100 | | | | 100 |
|
| Wachovia Bank N.A. |
5.308% due 12/02/2010 | | | | 400 | | | | 400 |
| | | | | | | | |
|
| | | | | | | | | 1,079 |
| | | | | | | | |
|
| |
| INDUSTRIALS 0.4% |
| Caesars Entertainment, Inc. |
8.875% due 09/15/2008 | | | | 300 | | | | 316 |
| | | | | | | | |
| Starwood Hotels & Resorts Worldwide, Inc. |
7.375% due 05/01/2007 | | $ | | 300 | | $ | | 303 |
| | | | | | | | |
|
| | | | | | | | | 619 |
| | | | | | | | |
|
Total Corporate Bonds & Notes
(Cost $1,719) | | 1,698 |
| | | | | | | | |
|
| |
| U.S. GOVERNMENT AGENCIES 6.2% |
| Fannie Mae | | | | | | | | |
4.192% due 11/01/2034 | | | | 331 | | | | 325 |
4.500% due 10/25/2022 | | | | 15 | | | | 15 |
4.681% due 02/25/2036 | | | | 300 | | | | 291 |
5.211% due 03/01/2044 - 10/01/2044 (c) | | | | 1,139 | | | | 1,145 |
5.500% due 09/01/2035 - 07/13/2036 (c) | | | | 6,725 | | | | 6,461 |
5.672% due 05/25/2042 | | | | 32 | | | | 32 |
5.950% due 02/25/2044 | | | | 200 | | | | 198 |
|
| Freddie Mac |
4.000% due 03/15/2023 - 10/15/2023 (c) | | | | 185 | | | | 181 |
4.555% due 01/01/2034 | | | | 62 | | | | 60 |
5.211% due 02/25/2045 | | | | 509 | | | | 505 |
5.582% due 08/25/2031 | | | | 8 | | | | 8 |
| | | | | | | | |
|
Total U.S. Government Agencies
(Cost $9,292) | | 9,221 |
| | | | | | | | |
|
| |
| U.S. TREASURY OBLIGATIONS 100.0% |
| Treasury Inflation Protected Securities (b) |
3.375% due 01/15/2007 | | | | 128 | | | | 128 |
3.625% due 01/15/2008 | | | | 6,762 | | | | 6,880 |
3.875% due 01/15/2009 | | | | 4,318 | | | | 4,473 |
4.250% due 01/15/2010 | | | | 12,746 | | | | 13,545 |
0.875% due 04/15/2010 | | | | 13,669 | | | | 12,899 |
2.375% due 04/15/2011 | | | | 10,602 | | | | 10,563 |
3.000% due 07/15/2012 | | | | 13,954 | | | | 14,374 |
1.875% due 07/15/2013 | | | | 4,517 | | | | 4,341 |
2.000% due 01/15/2014 | | | | 3,066 | | | | 2,961 |
2.000% due 07/15/2014 | | | | 2,040 | | | | 1,965 |
1.625% due 01/15/2015 | | | | 530 | | | | 494 |
1.875% due 07/15/2015 | | | | 11,859 | | | | 11,256 |
2.000% due 01/15/2016 | | | | 22,326 | | | | 21,327 |
2.375% due 01/15/2025 | | | | 10,402 | | | | 10,127 |
2.000% due 01/15/2026 | | | | 12,743 | | | | 11,671 |
3.625% due 04/15/2028 | | | | 11,134 | | | | 13,215 |
3.875% due 04/15/2029 | | | | 6,400 | | | | 7,921 |
|
| U.S. Treasury Bonds | | | | | | | | |
4.500% due 02/15/2036 | | | | 500 | | | | 448 |
|
| U.S. Treasury Notes | | | | | | | | |
4.500% due 02/28/2011 | | | | 100 | | | | 98 |
4.500% due 11/15/2015 | | | | 600 | | | | 572 |
| | | | | | | | |
|
Total U.S. Treasury Obligations
(Cost $148,219) | | | | 149,258 |
| | | | | | | | |
|
| |
| MORTGAGE-BACKED SECURITIES 1.2% |
| Citigroup Mortgage Loan Trust, Inc. | | | | |
4.700% due 12/25/2035 | | | | 476 | | | | 467 |
|
| Countrywide Home Loan Mortgage Pass-Through Trust |
3.795% due 11/19/2033 | | | | 42 | | | | 40 |
|
| First Horizon Alternative Mortgage Securities |
4.745% due 06/25/2034 | | | | 64 | | | | 62 |
|
| GGP Mall Properties Trust |
5.007% due 11/15/2011 | | | | 95 | | | | 95 |
|
| Greenpoint Mortgage Funding Trust |
5.592% due 11/25/2045 | | | | 67 | | | | 67 |
|
| Harborview Mortgage Loan Trust |
5.492% due 03/19/2037 | | | | 198 | | | | 198 |
| | | | | | | | |
| Lehman XS Trust |
5.402% due 06/25/2036 | | $ | | 200 | | $ | | 200 |
5.402% due 04/25/2046 | | | | 379 | | | | 379 |
|
| Mastr Adjustable Rate Mortgages Trust |
3.786% due 11/21/2034 | | | | 100 | | | | 94 |
|
| Structured Adjustable Rate Mortgage Loan Trust |
4.580% due 02/25/2034 | | | | 98 | | | | 96 |
5.682% due 01/25/2035 | | | | 96 | | | | 98 |
| | | | | | | | |
|
Total Mortgage-Backed Securities
(Cost $1,802) | | 1,796 |
| | | | | | | | |
|
| |
| ASSET-BACKED SECURITIES 4.0% |
| AAA Trust | | | | | | | | |
5.422% due 11/26/2035 | | | | 13 | | | | 13 |
|
| ACE Securities Corp. |
5.432% due 10/25/2035 | | | | 192 | | | | 192 |
|
| Argent Securities, Inc. |
5.442% due 10/25/2035 | | | | 48 | | | | 48 |
5.462% due 02/25/2036 | | | | 287 | | | | 287 |
5.402% due 03/25/2036 | | | | 161 | | | | 162 |
5.392% due 05/25/2036 | | | | 174 | | | | 174 |
|
| Asset-Backed Funding Certificates |
5.432% due 08/25/2035 | | | | 85 | | | | 85 |
|
| Bear Stearns Asset-Backed Securities, Inc. |
5.522% due 09/25/2034 | | | | 32 | | | | 32 |
|
| Chase Credit Card Master Trust |
5.579% due 11/17/2008 | | | | 100 | | | | 100 |
|
| Citigroup Mortgage Loan Trust, Inc. |
5.432% due 09/25/2035 | | | | 63 | | | | 63 |
5.402% due 12/27/2036 | | | | 214 | | | | 214 |
|
| Countrywide Asset-Backed Certificates |
5.422% due 08/25/2035 | | | | 51 | | | | 51 |
5.512% due 08/25/2035 | | | | 100 | | | | 100 |
5.452% due 02/25/2036 | | | | 91 | | | | 91 |
5.392% due 03/25/2036 | | | | 277 | | | | 277 |
5.392% due 04/25/2036 | | | | 92 | | | | 92 |
|
| FBR Securitization Trust |
5.442% due 09/25/2035 | | | | 54 | | | | 54 |
5.502% due 09/25/2035 | | | | 100 | | | | 100 |
5.432% due 10/25/2035 | | | | 479 | | | | 479 |
5.442% due 10/25/2035 | | | | 55 | | | | 55 |
|
| First Franklin Mortgage Loan Asset-Backed Certificates |
5.412% due 01/25/2036 | | | | 256 | | | | 257 |
|
| First NLC Trust |
5.432% due 12/25/2035 | | | | 103 | | | | 103 |
|
| Ford Credit Auto Owner Trust |
4.240% due 03/15/2008 | | | | 63 | | | | 63 |
|
| Fremont Home Loan Trust |
5.412% due 01/25/2036 | | | | 313 | | | | 314 |
|
| GSAMP Trust |
5.432% due 01/25/2036 | | | | 185 | | | | 185 |
|
| Home Equity Asset Trust |
5.432% due 02/25/2036 | | | | 71 | | | | 71 |
5.402% due 05/25/2036 | | | | 87 | | | | 87 |
|
| HSI Asset Securitization Corp. Trust |
5.402% due 12/25/2035 | | | | 83 | | | | 83 |
|
| Indymac Residential Asset-Backed Trust |
5.412% due 03/25/2036 | | | | 251 | | | | 251 |
5.422% due 03/25/2036 | | | | 76 | | | | 76 |
|
| JP Morgan Mortgage Acquisition Corp. |
5.392% due 01/25/2026 | | | | 132 | | | | 132 |
|
| Long Beach Mortgage Loan Trust |
5.522% due 11/25/2034 | | | | 62 | | | | 62 |
5.402% due 02/25/2036 | | | | 79 | | | | 79 |
| | | | | | |
| See Accompanying Notes | | Semiannual Report | | June 30, 2006 | | 9 |
| | |
| |
| Schedule of Investments CommodityRealReturn Strategy Portfolio (Cont.) | | |
| | | | | | | | |
| | | | | PRINCIPAL | | | | |
| | | | | AMOUNT | | | | VALUE |
| | | | | (000S) | | | | (000S) |
| Merrill Lynch Mortgage Investors, Inc. |
5.402% due 01/25/2037 | | $ | | 83 | | $ | | 83 |
|
| Nelnet Student Loan Trust |
5.190% due 07/25/2016 | | | | 100 | | | | 100 |
|
| New Century Home Equity Loan Trust |
5.432% due 09/25/2035 | | | | 42 | | | | 42 |
|
| Nomura Asset Acceptance Corp. |
5.462% due 01/25/2036 | | | | 81 | | | | 81 |
|
| Residential Asset Mortgage Products, Inc. |
5.402% due 12/25/2007 | | | | 80 | | | | 80 |
|
| Residential Asset Securities Corp. |
5.422% due 09/25/2025 | | | | 18 | | | | 18 |
5.422% due 05/25/2027 | | | | 126 | | | | 126 |
|
| Residential Funding Mortgage Securities II, Inc. |
5.462% due 05/25/2015 | | | | 142 | | | | 142 |
|
| SACO I, Inc. |
5.432% due 10/25/2033 | | | | 99 | | | | 100 |
|
| Securitized Asset-Backed Receivables LLC Trust |
5.392% due 10/25/2035 | | | | 68 | | | | 68 |
|
| Soundview Home Equity Loan Trust |
5.432% due 05/25/2035 | | | | 64 | | | | 64 |
5.392% due 03/25/2036 | | | | 79 | | | | 79 |
|
| Structured Asset Investment Loan Trust |
5.412% due 07/25/2035 | | | | 39 | | | | 39 |
|
| Structured Asset Securities Corp. |
5.452% due 12/25/2035 | | | | 265 | | | | 266 |
|
| Susquehanna Auto Lease Trust |
4.991% due 04/16/2007 | | | | 60 | | | | 60 |
|
| USAA Auto Owner Trust |
5.030% due 11/17/2007 | | | | 100 | | | | 100 |
|
| Wachovia Mortgage Loan Trust LLC |
5.432% due 10/25/2035 | | | | 41 | | | | 41 |
| | | | | | | | |
|
Total Asset-Backed Securities
(Cost $5,917) | | 5,921 |
| | | | | | | | |
|
| |
| | | | | NOTIONAL
AMOUNT
(000S) | | | | |
| PURCHASED CALL OPTIONS 0.0% |
| 2-Year Interest Rate Swap (OTC) Pay 3-Month USD-LIBOR Floating Rate Index |
Strike @ 5.250% Exp. 06/07/2007 | | | | 7,000 | | | | 19 |
| | | | | | | | |
|
Total Purchased Call Options
(Cost $30) | | 19 |
| | | | | | | | |
|
| |
| | | | | #OF
CONTRACTS | | | | |
| PURCHASED PUT OPTIONS 0.0% |
| 90-Day Eurodollar December Futures (CME) |
Strike @ $92.000 Exp. 12/18/2006 | | | | 50 | | | | 0 |
Strike @ $92.500 Exp. 12/18/2006 | | | | 53 | | | | 0 |
Strike @ $92.750 Exp. 12/18/2006 | | | | 16 | | | | 0 |
|
| 90-Day Eurodollar March Futures (CME) |
Strike @ $92.000 Exp. 03/19/2007 | | | | 83 | | | | 1 |
|
| 90-Day Eurodollar September Futures (CME) |
Strike @ $92.000 Exp. 09/17/2007 | | | | 1 | | | | 0 |
| | | | | | | | |
| | | | | NOTIONAL | | | | |
| | | | | AMOUNT | | | | VALUE |
| | | | | (000S) | | | | (000S) |
| Treasury Inflation Protected Securities (OTC) 0.875% due 04/05/2010 |
Strike @ $83.000 Exp. 07/05/2006 | | $ | | 11,000 | | $ | | 0 |
|
| Treasury Inflation Protected Securities (OTC) 1.875% due 07/13/2015 |
Strike @ $70.000 Exp. 07/13/2006 | | | | 20,000 | | | | 0 |
|
| Treasury Inflation Protected Securities (OTC) 2.000% due 01/15/2016 |
Strike @ $68.000 Exp. 09/15/2006 | | | | 20,000 | | | | 0 |
|
| Treasury Inflation Protected Securities (OTC) 2.000% due 01/17/2026 |
Strike @ $54.000 Exp. 07/17/2006 | | | | 11,000 | | | | 0 |
|
| Treasury Inflation Protected Securities (OTC) 2.375% due 01/13/2025 |
Strike @ $58.000 Exp. 07/13/2006 | | | | 5,000 | | | | 0 |
|
| Treasury Inflation Protected Securities (OTC) 3.000% due 07/08/2012 |
Strike @ $83.000 Exp. 08/08/2006 | | | | 14,200 | | | | 0 |
|
| Treasury Inflation Protected Securities (OTC) 3.500% due 01/17/2011 |
Strike @ $89.000 Exp. 07/17/2006 | | | | 6,000 | | | | 0 |
|
| Treasury Inflation Protected Securities (OTC) 3.625% due 01/08/2008 |
Strike @ $96.000 Exp. 08/08/2006 | | | | 6,800 | | | | 0 |
|
| Treasury Inflation Protected Securities (OTC) 3.625% due 04/05/2028 |
Strike @ $76.000 Exp. 07/05/2006 | | | | 11,000 | | | | 0 |
|
| Treasury Inflation Protected Securities (OTC) 3.875% due 04/08/2029 |
Strike @ $70.000 Exp. 08/08/2006 | | | | 6,300 | | | | 0 |
|
| Treasury Inflation Protected Securities (OTC) 4.250% due 01/05/2010 |
Strike @ $95.000 Exp. 07/05/2006 | | | | 12,000 | | | | 0 |
|
| U.S. dollar versus Japanese Yen (OTC) |
Strike @ JPY114.000 Exp. 07/03/2006 | | | | 1,800 | | | | 3 |
| | | | | | | | |
|
Total Purchased Put Options
(Cost $50) | | 4 |
| | | | | | | | |
|
| |
| | | | | PRINCIPAL
AMOUNT
(000S) | | | | |
| SHORT-TERM INSTRUMENTS (g) 62.7% |
| |
| COMMERCIAL PAPER 45.9% |
| Abbey National N.A. LLC |
5.100% due 07/05/2006 | | $ | | 3,800 | | | | 3,799 |
|
| Bank of Ireland |
5.090% due 08/17/2006 | | | | 4,000 | | | | 3,975 |
|
| Barclays U.S. Funding Corp. |
5.140% due 09/05/2006 | | | | 1,600 | | | | 1,584 |
|
| BNP Paribas Finance |
4.930% due 07/13/2006 | | | | 1,800 | | | | 1,797 |
|
| Danske Corp. |
4.955% due 07/20/2006 | | | | 1,500 | | | | 1,496 |
4.980% due 07/26/2006 | | | | 2,900 | | | | 2,891 |
|
| Dexia Delaware LLC |
5.275% due 07/05/2006 | | | | 1,400 | | | | 1,400 |
5.065% due 08/18/2006 | | | | 2,900 | | | | 2,881 |
| | | | | | | | |
| DNB NORBank ASA |
4.960% due 07/17/2006 | | $ | | 700 | | $ | | 699 |
5.080% due 08/02/2006 | | | | 2,000 | | | | 1,991 |
|
| Fannie Mae |
4.809% due 07/05/2006 | | | | 1,900 | | | | 1,899 |
4.958% due 09/13/2006 | | | | 3,800 | | | | 3,758 |
|
| Federal Home Loan Bank |
5.030% due 07/03/2006 | | | | 4,000 | | | | 4,000 |
|
| Freddie Mac |
4.625% due 08/01/2006 | | | | 2,000 | | | | 1,992 |
|
| General Electric Capital Corp. |
5.060% due 08/16/2006 | | | | 2,600 | | | | 2,584 |
|
| HBOS Treasury Services PLC |
4.940% due 07/13/2006 | | | | 1,000 | | | | 999 |
5.100% due 08/25/2006 | | | | 500 | | | | 496 |
|
| ING U.S. Funding LLC |
5.235% due 08/03/2006 | | | | 3,800 | | | | 3,783 |
|
| Nordea N.A., Inc. |
4.880% due 07/06/2006 | | | | 1,600 | | | | 1,599 |
5.090% due 08/24/2006 | | | | 2,900 | | | | 2,879 |
|
| Skandinaviska Enskilda Banken AB |
5.280% due 07/20/2006 | | | | 1,400 | | | | 1,396 |
5.000% due 07/26/2006 | | | | 2,900 | | | | 2,891 |
|
| Societe Generale N.A. |
5.270% due 07/03/2006 | | | | 200 | | | | 200 |
4.890% due 07/06/2006 | | | | 500 | | | | 500 |
5.245% due 08/08/2006 | | | | 2,000 | | | | 1,989 |
5.100% due 08/24/2006 | | | | 1,700 | | | | 1,687 |
|
| Spintab AB |
5.120% due 08/01/2006 | | | | 2,500 | | | | 2,490 |
|
| Svenska Handelsbanken, Inc. |
4.890% due 07/06/2006 | | | | 3,900 | | | | 3,898 |
|
| Total Captial S.A. |
5.270% due 07/03/2006 | | | | 4,000 | | | | 4,000 |
|
| UBS Finance Delaware LLC |
4.930% due 07/10/2006 | | | | 2,100 | | | | 2,098 |
|
| Westpac Trust Securities NZ Ltd. |
4.960% due 07/20/2006 | | | | 900 | | | | 898 |
| | | | | | | | |
|
| | | | | | | | | 68,549 |
| | | | | | | | |
|
| |
| FRANCE TREASURY BILLS 7.5% |
2.527% due 07/13/2006 -07/20/2006 (c) | | EUR | | 8,740 | | | | 11,170 |
| | | | | | | | |
|
| |
| GERMANY TREASURY BILLS 8.0% |
2.684% due 08/16/2006 | | | | 9,010 | | | | 11,854 |
| | | | | | | | |
|
| |
| REPURCHASE AGREEMENT 0.9% |
| State Street Bank |
4.900% due 07/03/2006 | | $ | | 1,381 | | | | 1,381 |
| | | | | | | | |
|
(Dated 06/30/2006. Collateralized by Federal Home Loan Bank 3.375% due 02/23/2007 valued at $1,412. Repurchase proceeds are $1,382.) |
| |
| U.S. TREASURY BILLS 0.4% |
4.799% due 08/31/2006 -09/14/2006 (c)(d) | | | | 515 | | | | 511 |
| | | | | | | | |
|
Total Short-Term Instruments
(Cost $92,594) | | 93,465 |
| | | | | | | | |
|
| |
Total Investments (a) 209.4%
(Cost $307,923) | | $ | | 312,385 |
| |
Written Options (f) (0.1%)
(Premiums $148) | | (89) |
| |
| Other Assets and Liabilities (Net) (109.3%) | | (163,078) |
| | | | | | | | |
|
| Net Assets 100.0% | | | | | | $ | | 149,218 |
| | | | | | | | |
|
| | | | |
| 10 | | PIMCO Variable Insurance Trust | | See Accompanying Notes |
| | |
| |
| | | June 30, 2006 (Unaudited) |
|
| Notes to Schedule of Investments (amounts in thousands, except number of contracts): |
| |
(a) As of June 30, 2006, portfolio securities with an aggregate market value of $51,360 were valued in good faith and pursuant to guidelines established by the Board of Trustees. |
| |
(b) Principal amount of security is adjusted for inflation. |
| |
(c) Securities are grouped by coupon or range of coupons and represent a range of maturities. |
| |
(d) Securities with an aggregate market value of $511 have been segregated with the custodian to cover margin requirements for the following open futures contracts on June 30, 2006: |
| |
| | | | | | | | | | |
| Description | | Type | | Expiration
Month | | # of
Contracts | | Unrealized
(Depreciation) | |
90-Day Eurodollar December Futures | | Long | | 12/2006 | | 13 | | $ | (26 | ) |
90-Day Eurodollar December Futures | | Long | | 12/2007 | | 18 | | | (25 | ) |
90-Day Eurodollar June Futures | | Long | | 06/2007 | | 31 | | | (58 | ) |
90-Day Eurodollar March Futures | | Long | | 03/2007 | | 30 | | | (60 | ) |
90-Day Eurodollar September Futures | | Long | | 09/2007 | | 31 | | | (54 | ) |
Euro-Bund 10-Year Note September Futures | | Long | | 09/2006 | | 5 | | | (3 | ) |
U.S. Treasury 5-Year Note September Futures | | Long | | 09/2006 | | 53 | | | (35 | ) |
U.S. Treasury 10-Year Note September Futures | | Long | | 09/2006 | | 87 | | | (56 | ) |
U.S. Treasury 30-Year Bond September Futures | | Long | | 09/2006 | | 84 | | | (22 | ) |
| | | | | | | | |
|
|
|
| | | | | | | | | $ | (339 | ) |
| | | | | | | | |
|
|
|
| | | | | | | | | | | | | | | |
(e) Swap agreements outstanding on June 30, 2006: |
| Credit Default Swaps | | | | | | | | | | | | | | | |
| Counterparty | | Reference Entity | | Buy/Sell
Protection+ | | (Pay)/Receive
Fixed Rate | | | Expiration
Date | | Notional
Amount | | Unrealized
Appreciation |
Citibank N.A. | | Morgan Stanley Dean Witter & Co. | | Buy | | (0.068% | ) | | 06/20/2007 | | $ | 1,000 | | $ | 0 |
| | | | | | | | | | | | | | |
|
|
|
| + If the Portfolio is a seller of protection and a credit event occurs, as defined under the terms of that particular swap agreement, the Portfolio will pay to the buyer of the protection an amount up to the Notional value of the swap and in certain instances, take delivery of the security. As a buyer of protection, the Portfolio will generally receive from the seller of protection an amount up to the notional amount of the swap if a credit event occurs. |
| | | | | | | | | | | | | | | | |
| | | | | | | |
| Interest Rate Swaps | | | | | | | | | | | | | | | | |
| Counterparty | | Floating Rate
Index | | Pay/Receive
Floating Rate | | Fixed Rate | | Expiration
Date | | | | Notional
Amount | | Unrealized
Appreciation/
(Depreciation) | |
Barclays Bank PLC | | 5-year French CPI Ex Tobacco
Daily Reference Index | | Pay | | 2.103% | | 10/15/2010 | | EUR | | 500 | | $ | (2 | ) |
BNP Paribas Bank | | 5-year French CPI Ex Tobacco
Daily Reference Index | | Pay | | 2.040% | | 02/21/2011 | | | | 1,700 | | | (17 | ) |
Goldman Sachs & Co. | | 6-month EUR-LIBOR | | Receive | | 4.500% | | 06/17/2015 | | | | 200 | | | 17 | |
HSBC Bank USA | | 6-month GBP-LIBOR | | Receive | | 4.250% | | 06/12/2036 | | GBP | | 300 | | | 23 | |
J.P. Morgan Chase & Co. | | 6-month GBP-LIBOR | | Pay | | 5.000% | | 06/15/2008 | | | | 100 | | | 0 | |
Barclays Bank PLC | | 3-month USD-LIBOR | | Pay | | 5.000% | | 12/20/2008 | | $ | | 900 | | | (1 | ) |
Barclays Bank PLC | | 3-month USD-LIBOR | | Receive | | 5.000% | | 12/20/2016 | | | | 1,050 | | | 13 | |
Deutsche Bank AG | | 3-month USD-LIBOR | | Receive | | 5.000% | | 06/21/2021 | | | | 1,800 | | | 16 | |
Deutsche Bank AG | | 3-month USD-LIBOR | | Receive | | 5.000% | | 12/20/2026 | | | | 1,800 | | | 2 | |
Goldman Sachs & Co. | | 3-month USD-LIBOR | | Pay | | 5.000% | | 12/20/2008 | | | | 500 | | | 0 | |
Goldman Sachs & Co. | | 3-month USD-LIBOR | | Receive | | 5.000% | | 12/20/2013 | | | | 300 | | | 4 | |
Goldman Sachs & Co. | | 3-month USD-LIBOR | | Receive | | 5.000% | | 12/20/2016 | | | | 300 | | | 4 | |
Morgan Stanley Dean Witter & Co. | | 3-month USD-LIBOR | | Receive | | 5.000% | | 12/20/2036 | | | | 1,600 | | | 15 | |
| | | | | | | | | | | | | | |
|
|
|
| | | | | | | | | | | | | | | $ | 74 | |
| | | | | | | | | | | | | | |
|
|
|
| | | | | | | | | | | | | | | | | | | | |
(f) Written options outstanding on June 30, 2006: | | | | | | | | | | | | | | |
| Options on Exchange-Traded Futures Contracts | | | | | | | | | | | | | | |
| Description | | | | | | | | Exercise
Price | | Expiration
Date | | # of Contracts | | Premium | | Value |
Call - CBOT U.S. Treasury 10-Year Note September Futures | | $ | 108.000 | | 08/25/2006 | | $ | 116 | | $ | 17 | | $ | 4 |
Put - CBOT U.S. Treasury 10-Year Note September Futures | | | 103.000 | | 08/25/2006 | | | 151 | | | 23 | | | 21 |
Call - CBOT U.S. Treasury 10-Year Note September Futures | | | 107.000 | | 08/25/2006 | | | 35 | | | 3 | | | 3 |
| | | | | | | | | | | | | | | | |
|
| |
|
|
| | | | | | | | | | | | | | | | | $ | 43 | | $ | 28 |
| | | | | | | | | | | | | | | | |
|
| |
|
|
| | | | | | |
| See Accompanying Notes | | Semiannual Report | | June 30, 2006 | | 11 |
Schedule of Investments CommodityRealReturn Strategy Portfolio (Cont.)
| | | | | | | | | | | | | | | | | | | |
| Interest Rate Swaptions |
| Description | | Counterparty | | Floating Rate
Index | | Pay/Receive
Floating Rate | | Exercise
Rate | | Expiration
Date | | Notional
Amount | | Premium | | Value |
Call - OTC 10-Year Interest Rate Swap | | Barclays Bank PLC | | 3-month USD-LIBOR | | Receive | | 5.300% | | 01/02/2007 | | $ | 3,000 | | $ | 16 | | $ | 12 |
Put - OTC 10-Year Interest Rate Swap | | Barclays Bank PLC | | 3-month USD-LIBOR | | Pay | | 5.900% | | 01/02/2007 | | | 2,000 | | | 23 | | | 22 |
Put - OTC 1-Year Interest Rate Swap | | Barclays Bank PLC | | 3-month USD-LIBOR | | Pay | | 6.100% | | 01/02/2007 | | | 1,000 | | | 7 | | | 6 |
Call - OTC 5-Year Interest Rate Swap | | Royal Bank of Scotland PLC | | 3-month USD-LIBOR | | Receive | | 5.340% | | 06/07/2007 | | | 2,000 | | | 20 | | | 14 |
Call - OTC 5-Year Interest Rate Swap | | Wachovia Bank N.A. | | 3-month USD-LIBOR | | Receive | | 5.325% | | 06/07/2007 | | | 1,000 | | | 9 | | | 7 |
| | | | | | | | | | | | |
|
| |
|
|
| | | | | | | | | | | | | | | | $ | 75 | | $ | 61 |
| | | | | | | | | | | | | | | |
|
| |
|
|
| | | | | | | | | | | | | | | |
| | | | | | |
| Foreign Currency Options | | | | | | | | | | | | | | | |
| Description | | Counterparty | | Exercise
Price | | Expiration
Date | | Notional
Amount | | Premium | | Value |
Put - OTC U.S. dollar versus Japanese Yen | | Bank of America | | JPY 104.000 | | 07/03/2006 | | $ | 1,400 | | $ | 3 | | $ | 0 |
Put - OTC U.S. dollar versus Japanese Yen | | Bank of America | | 106.500 | | 07/03/2006 | | | 1,100 | | | 7 | | | 0 |
Put - OTC U.S. dollar versus Japanese Yen | | Credit Suisse First Boston | | 106.500 | | 07/03/2006 | | | 700 | | | 4 | | | 0 |
Put - OTC U.S. dollar versus Japanese Yen | | Goldman Sachs & Co. | | 104.000 | | 07/03/2006 | | | 7,300 | | | 16 | | | 0 |
| | | | | | | | | | | |
|
| |
|
|
| | | | | | | | | | | | $ | 30 | | $ | 0 |
| | | | | | | | | | | |
|
| |
|
|
| | | | | | | | | | | | | | | | | |
(g) Forward foreign currency contracts outstanding on June 30, 2006: | | | | | |
| Type | | | | Principal
Amount
Covered by
Contract | | Settlement
Month | | Unrealized
Appreciation | | Unrealized
(Depreciation) | | | Net
Unrealized
Appreciation/
(Depreciation) | |
Buy | | EUR | | 653 | | 07/2006 | | $ | 18 | | $ | 0 | | | $ | 18 | |
Sell | | | | 17,095 | | 08/2006 | | | 0 | | | (373 | ) | | | (373 | ) |
Buy | | JPY | | 9,840 | | 07/2006 | | | 0 | | | 0 | | | | 0 | |
Buy | | | | 434,578 | | 08/2006 | | | 0 | | | (108 | ) | | | (108 | ) |
| | | | | | | | |
|
| |
|
|
| |
|
|
|
| | | | | | | | | $ | 18 | | $ | (481 | ) | | $ | (463 | ) |
| | | | | | | | |
|
| |
|
|
| |
|
|
|
| | | | |
| 12 | | PIMCO Variable Insurance Trust | | See Accompanying Notes |
| | |
| |
| Notes to Financial Statements | | June 30, 2006 (Unaudited) |
1. ORGANIZATION
The CommodityRealReturn Strategy Portfolio (the “Portfolio”) is a series of the PIMCO Variable Insurance Trust (the “Trust”). The Trust is registered under the Investment Company Act of 1940 (the “Act”), as amended, as an open-end investment management company organized as a Delaware business trust on October 3, 1997. The Portfolio may offer up to two classes of shares: Administrative and Advisor. Information presented in these financial statements pertains to the Advisor Class of the Portfolio. Certain detailed financial information for the Administration Class is provided separately and is available upon request. The Trust is designed to be used as an investment vehicle by Separate Accounts of insurance companies that fund variable annuity contracts and variable life insurance policies and by qualified pension and retirement plans.
2. SIGNIFICANT ACCOUNTING POLICIES
The following is a summary of significant accounting policies consistently followed by the Trust in the preparation of its financial statements in conformity with accounting principles generally accepted in the United States of America (“GAAP”). The preparation of financial statements in accordance with GAAP requires management to make estimates and assumptions that affect the reported amounts and disclosures in the financial statements. Actual results could differ from those estimates.
Security Valuation. Portfolio securities are valued as of the close of regular trading (normally 4:00 p.m., Eastern Time) on each day that the New York Stock Exchange (“NYSE”) is open. Portfolio securities and other assets for which market quotes are readily available are stated at market value. Market value is generally determined on the basis of last reported sales prices, or if no sales are reported, based on quotes obtained from a quotation reporting system, established market makers, or pricing services. Fixed-income securities and non-exchange traded derivatives are normally valued on the basis of quotes obtained from brokers and dealers or pricing services. Prices obtained from independent pricing services use information provided by market makers or estimates of market values obtained from yield data relating to investments or securities with similar characteristics. Certain fixed-income securities purchased on a delayed-delivery basis are marked to market daily until settlement at the forward settlement date. Short-term investments having a maturity of 60 days or less are generally valued at amortized cost. Exchange traded options, futures and options on futures are valued at the settlement price determined by the relevant exchange.
Investments initially valued in currencies other than the U.S. dollar are converted to the U.S. dollar using exchange rates obtained from pricing services. As a result, the NAV of the Portfolio’s shares may be affected by changes in the value of currencies in relation to the U.S. dollar. The value of securities traded in markets outside the United States or denominated in currencies other than the U.S. dollar may be affected significantly on a day that the NYSE is closed and an investor is not able to purchase, redeem or exchange shares.
Securities and other assets for which market quotes are not readily available are valued at fair value as determined in good faith by the Board of Trustees or persons acting at their direction. The Board of Trustees has adopted methods for valuing securities and other assets in circumstances where market quotes are not readily available, and has delegated to Pacific Investment Management Company LLC (“PIMCO”) the responsibility for applying the valuation methods. In the event that market quotes are not readily available, and the security or asset cannot be valued pursuant to one of the valuation methods, the value of the security or asset will be determined in good faith by the Valuation Committee of the Board of Trustees, generally based upon recommendations provided by PIMCO. Market quotes are considered not readily available in circumstances where there is an absence of current or reliable market-based data (e.g., trade information, bid/asked information, broker quotes), including where events occur after the close of the relevant market, but prior to the close of regular trading, that materially affect the values of the Portfolio’s securities or assets. In addition, market quotes are considered not readily available when, due to extraordinary circumstances, the exchanges or markets on which the securities trade do not open for trading for the entire day and no other market prices are available. The Board has delegated to PIMCO the responsibility for monitoring significant events that may materially affect the values of the Portfolio’s securities or assets and for determining whether the value of the applicable securities or assets should be re-evaluated in light of such significant events.
When the Portfolio uses fair value pricing to determine its NAV, securities will not be priced on the basis of quotations from the primary market in which they are traded, but rather may be priced by another method that the Board of Trustees or persons acting at their direction believe accurately reflects fair value. The Trust’s policy is intended to result in a calculation of the Portfolio’s NAV that fairly reflects security values as of the time of pricing. However, fair values determined by the Board of Trustees or persons acting at their direction may not accurately reflect the price that the Portfolio could obtain for a security if it were to dispose of that security as of the time of pricing. Because foreign securities can trade on non-business days, the NAV of the Portfolio may change on days when shareholders will not be able to purchase or redeem fund shares. The prices used by the Portfolio may differ from the value that would be realized if the securities were sold and the differences could be material to the financial statements.
Securities Transactions and Investment Income. Securities transactions are recorded as of the trade date. Securities purchased or sold on a when-issued or delayed-delivery basis may be settled a month or more after the trade date. Realized gains and losses from securities sold are recorded on the identified cost basis. Dividend income is recorded on the ex-dividend date, except certain dividends from foreign securities where the ex-dividend date may have passed, which are recorded as soon as the Portfolio is informed of the ex-dividend date. Interest income, adjusted for the accretion of discounts and amortization of premiums, is recorded on the accrual basis. Paydown gains and losses on mortgage-related or asset-backed securities are recorded as components of interest income in the Statement of Operations.
Dividends and Distributions to Shareholders. Dividends from net investment income, if any, are declared and distributed to shareholders quarterly. Net realized capital gains earned by the Portfolio, if any, will be distributed no less frequently than once each year. Most shareholders choose to reinvest their dividends and capital gain distribution in additional shares of the Portfolio.
Income dividends and capital gain distributions are determined in accordance with income tax regulations which may differ from GAAP. Differences between tax regulations and GAAP may change the fiscal year when income and capital items are recognized for tax and GAAP purposes. Examples of events that give rise to timing differences include wash sales, straddles, net operating losses and capital loss carryforwards. Further, the character of investment income and capital gains may be different for certain transactions under the two methods of accounting. Examples of characterization differences include the treatment of mortgage paydowns, swaps, foreign currency transactions and contingent debt instruments. As a result, income dividends and capital gain distributions declared during a fiscal period may differ significantly from the net investment income and realized capital gain reported in the Portfolio’s annual financial statements presented under GAAP.
Distributions classified as a tax basis return of capital, if any, are reflected in the accompanying Statements of Changes in Net Assets and have been reclassified to paid in capital. In addition, other amounts have been reclassified between
| | | | | | |
| | | Semiannual Report | | June 30, 2006 | | 13 |
Notes to Financial Statements (Cont.)
undistributed net investment income, accumulated undistributed net realized gains or losses and/or paid in capital to more appropriately conform financial accounting to tax characterizations of dividend distributions.
Multiclass Operations. Each class offered by the Portfolio has equal rights as to assets and voting privileges (except that shareholders of a class have exclusive voting rights regarding any matter relating solely to that class of shares). Income and non-class specific expenses of the Portfolio are allocated daily to each class of shares based on the relative value of settled shares. Realized and unrealized capital gains and losses of the Portfolio are allocated daily to each class of shares based on the relative net assets of each class. Class specific expenses, where applicable, currently include administrative, distribution and servicing fees.
Delayed-Delivery Transactions. The Portfolio may purchase or sell securities on a when-issued or delayed-delivery basis. These transactions involve a commitment by the Portfolio to purchase or sell securities for a predetermined price or yield, with payment and delivery taking place beyond the customary settlement period. When delayed-delivery purchases are outstanding, the Portfolio will designate liquid assets in an amount sufficient to meet the purchase price. When purchasing a security on a delayed-delivery basis, the Portfolio assumes the rights and risks of ownership of the security, including the risk of price and yield fluctuations, and takes such fluctuations into account when determining its net asset value. The Portfolio may dispose of or renegotiate a delayed-delivery transaction after it is entered into, and may sell when-issued securities before they are delivered, which may result in a capital gain or loss. When the Portfolio has sold a security on a delayed-delivery basis, the Portfolio does not participate in future gains and losses with respect to the security.
Federal Income Taxes. The Portfolio intends to qualify as a regulated investment company under sub-chapter M of the Internal Revenue Code and distribute all of its taxable income and net realized gains, if applicable, to shareholders. Accordingly, no provision for Federal income taxes has been made.
The Portfolio may gain exposure to the commodities markets by entering into swap agreements on a commodities index, and may invest in other commodity-linked derivative instruments, including commodity swap agreements, options, futures contracts, options on futures contracts and commodity-linked structured notes.
One of the requirements for favorable tax treatment as a regulated investment company under the Code is that the Portfolio derive at least 90 percent of its gross income from certain qualifying sources of income. On December 16, 2005, the IRS issued Revenue Ruling 2006-01 which held that income from commodity index-linked swaps was not qualifying income. At the time Revenue Ruling 2006-01 was issued, the Portfolio invested primarily in commodity index-linked swaps to gain exposure to the commodity markets. Revenue Ruling 2006-01 provided an effective date of June 30, 2006, after which time the Portfolio’s ability to utilize commodity index-linked swaps as part of its investment strategy will be limited to a maximum of 10 percent of its gross income.
On June 2, 2006, the IRS issued Revenue Ruling 2006-31 which extends the effective date for Revenue Ruling 2006-01 from June 30, 2006 until September 30, 2006. Revenue Ruling 2006-31 also clarifies the holding of Revenue Ruling 2006-01 by providing that income from alternative instruments (such as certain commodity index-linked notes) that create commodity exposure may be considered qualifying income under the Code. In addition, the IRS has also issued private letter rulings to at least two other funds in which the IRS specifically concluded that income from certain commodity index-linked notes is qualifying income. The Portfolio has also obtained an opinion of counsel with respect to the treatment of income from commodity index-linked notes as qualifying income under the Code. Such an opinion is not binding upon the IRS.
Based on Revenue Ruling 2006-31, IRS guidance and advice of counsel, the Portfolio will seek to gain exposure to the commodity markets primarily through investments in commodity index-linked notes. The use of commodity index-linked notes involves specific risks. The Portfolio will continue to seek ways to make use of other commodity-linked derivative instruments, including swap agreements, commodity options, futures and options on futures, and alternative structures within the Portfolio to gain exposure to commodity markets. Please refer to the prospectus for the Separate Account and Variable Contract for information regarding federal income tax treatment of distributions to the Separate Account.
Foreign Currency. The accounting records of the Portfolio are maintained in U.S. dollar. The market values of foreign securities, currency holdings and other assets and liabilities are translated into U.S. dollar based on the current exchange rates each business day. Fluctuations in the value of currency holdings and other assets and liabilities resulting from changes in exchange rates are recorded as unrealized foreign currency gains or losses. Realized gains or losses and unrealized appreciation or depreciation on investment securities and income and expenses are translated on the respective dates of such transactions. The effects of changes in foreign currency exchange rates on investments in securities are not segregated in the Statement of Operations from the effects of changes in market prices of those securities, but are included with the net realized and unrealized gain or loss on investment securities.
| | | | | | |
|
| Non-U.S. currency symbols utilized throughout the report are defined as follows: |
| EUR | | Euro | | | | |
| GBP | | British Pound | | | | |
| JPY | | Japanese Yen | | | | |
Forward Currency Transactions. The Portfolio may enter into forward currency contracts in connection with settling planned purchases or sales of securities, to hedge the currency exposure associated with some or all of the Portfolio’s securities or as a part of an investment strategy. A forward currency contract is an agreement between two parties to buy and sell a currency at a set price on a future date. The market value of a forward currency contract fluctuates with changes in forward currency exchange rates. Forward currency contracts are marked to market daily and the change in value is recorded by the Portfolio as an unrealized gain or loss. Realized gains or losses equal to the difference between the value of the contract at the time it was opened and the value at the time it was closed are recorded upon delivery or receipt of the currency or, if a forward currency contract is offset by entering into another forward currency contract with the same broker, upon settlement of the net gain or loss. These contracts may involve market risk in excess of the unrealized gain or loss reflected in the Portfolio’s Statement of Assets and Liabilities. In addition, the Portfolio could be exposed to risk if the counterparties are unable to meet the terms of the contracts or if the value of the currency changes unfavorably to the U.S. dollar.
Futures Contracts. The Portfolio is authorized to enter into futures contracts. The Portfolio may use futures contracts to manage its exposure to the securities markets or to movements in interest rates and currency values. The primary risks associated with the use of futures contracts are the imperfect correlation between the change in market value of the securities held by the Portfolio and the prices of futures contracts, the possibility of an illiquid market, and the inability of the counterparty to meet the terms of the contract. Futures contracts are valued based upon their quoted daily settlement prices. Upon entering into a futures contract, the Portfolio is required to deposit with its custodian, in a segregated account in the name of the futures broker, an amount of cash or U.S. Government and Agency Obligations in accordance with the initial margin requirements of the broker or exchange. Futures contracts are marked to market daily and an appropriate payable or receivable for the change in value (“variation margin”) is recorded by the Portfolio. Gains or losses are recognized but not considered realized until the
| | | | |
| 14 | | PIMCO Variable Insurance Trust | | |
| | |
| |
| | | June 30, 2006 (Unaudited) |
contracts expire or are closed. Futures contracts involve, to varying degrees, risk of loss in excess of the variation margin disclosed in the Statement of Assets and Liabilities.
Guarantees and Indemnifications. Under the Trust’s organizational documents, each Trustee, officer, employee or other agent of the Trust (including the Trust’s investment manager) is indemnified against certain liabilities that may arise out of performance of their duties to the Portfolio. Additionally, in the normal course of business, the Portfolio enters into contracts that contain a variety of indemnification clauses. The Portfolio’s maximum exposure under these arrangements is unknown as this would involve future claims that may be made against the Portfolio that have not yet occurred. However, the Portfolio has not had prior claims or losses pursuant to these contracts, and believes the risk of loss to be remote.
Inflation-Indexed Bonds. The Portfolio may invest in inflation-indexed bonds. Inflation-indexed bonds are fixed-income securities whose principal value is periodically adjusted to the rate of inflation. The interest rate on these bonds is generally fixed at issuance at a rate lower than typical bonds. Over the life of an inflation-indexed bond, however, interest will be paid based on a principal value, which is adjusted for inflation. Any increase in the principal amount of an inflation-indexed bond will be included as interest income in the Statement of Operations, even though investors do not receive their principal until maturity.
Options Contracts. The Portfolio may write call and put options on futures, swaps, securities or currencies it owns or in which it may invest. Writing put options tends to increase the Portfolio’s exposure to the underlying instrument. Writing call options tends to decrease the Portfolio’s exposure to the underlying instrument. When the Portfolio writes a call or put option, an amount equal to the premium received is recorded as a liability and subsequently marked to market to reflect the current value of the option written. These liabilities are reflected as written options outstanding in the Statement of Assets and Liabilities. Certain options may be written with premiums to determined on a future date. The premiums for these options are based upon implied volatility parameters at specified terms. Premiums received from writing options which expire are treated as realized gains. Premiums received from writing options which are exercised or closed are added to the proceeds or offset against amounts paid on the underlying future, swap, security or currency transaction to determine the realized gain or loss. The Portfolio as a writer of an option has no control over whether the underlying future, swap, security or currency may be sold (call) or purchased (put) and as a result bears the market risk of an unfavorable change in the price of the future, swap, security or currency underlying the written option. There is the risk the Portfolio may not be able to enter into a closing transaction because of an illiquid market.
The Portfolio may also purchase put and call options. Purchasing call options tends to increase the Portfolio’s exposure to the underlying instrument. Purchasing put options tends to decrease the Portfolio’s exposure to the underlying instrument. The Portfolio pays a premium which is included in the Portfolio’s Statement of Assets and Liabilities as an investment and subsequently marked to market to reflect the current value of the option. Premiums paid for purchasing options which expire are treated as realized losses. Certain options may be purchased with premiums to be determined on a future date. The premiums for these options are based upon implied volatility parameters at specified terms. The risk associated with purchasing put and call options is limited to the premium paid. Premiums paid for purchasing options which are exercised or closed are added to the amounts paid or offset against the proceeds on the underlying future, swap, security or currency transaction to determine the realized gain or loss.
Repurchase Agreements. The Portfolio may engage in repurchase transactions. Under the terms of a typical repurchase agreement, the Portfolio takes possession of an underlying debt obligation subject to an obligation of the seller to repurchase, and the Portfolio to resell, the obligation at an agreed-upon price and time. The market value of the collateral must be equal to or exceed at all times the total amount of the repurchase obligations, including interest. Securities purchased under repurchase agreements are reflected as an asset in the Statement of Assets and Liabilities. Generally, in the event of counterparty default, the Portfolio has the right to use the collateral to offset losses incurred. If the counterparty should default, the Portfolio will seek to sell the securities which it holds as collateral. This could involve procedural costs or delays in addition to a loss on the securities if their value should fall below their repurchase price.
Mortgage-Related and Other Asset-Backed Securities. The Portfolio may invest in mortgage-related or other asset-backed securities. These securities include mortgage pass-through securities, collateralized mortgage obligations (“CMOs”), commercial mortgage-backed securities, mortgage dollar rolls, CMO residuals, stripped mortgage-backed securities (“SMBSs”) and other securities that directly or indirectly represent a participation in, or are secured by and payable from, mortgage loans on real property. The value of some mortgage- or asset-backed securities may be particularly sensitive to changes in prevailing interest rates. Early repayment of principal on some mortgage-related securities may expose the Portfolio to a lower rate of return upon reinvestment of principal. The value of these securities may fluctuate in response to the market’s perception of the creditworthiness of the issuers. Additionally, although mortgages and mortgage-related securities are generally supported by some form of government or private guarantee and/or insurance, there is no assurance that private guarantors or insurers will meet their obligations.
Swap Agreements. The Portfolio may engage in swap transactions, including, but not limited to, swap agreements on interest rate, total return and credit default to manage its exposure to interest rates and credit risk. In connection with these agreements, securities may be identified as collateral in accordance with the terms of the respective swap agreements.
Interest rate swap agreements involve the exchange by the Portfolio with another party of their respective commitments to pay or receive interest, e.g., an exchange of floating rate payments for fixed rate payments with respect to the notional amount of principal.
Credit default swap agreements involve one party making a stream of payments to another party in exchange for the right to receive a specified return in the event of a default by a third party, typically corporate issues or sovereign issues of an emerging country, on its obligation. The Portfolio may use credit default swaps to provide a measure of protection against defaults of the issuers (i.e., to reduce risk where the Portfolio owns or has exposure to the sovereign issuer) or to take an active long or short position with respect to the likelihood of a particular issuer’s default. As a seller of protection, the Portfolio generally receives an upfront payment or a fixed rate of income throughout the term of the swap provided that there is no credit event. If the Portfolio is a seller of protection and a credit event occurs, as defined under the terms of that particular swap agreement, the Portfolio will pay to the buyer of the protection an amount up to the notional value of the swap and in certain instances take delivery of the security. As the seller, the Portfolio would effectively add leverage to its portfolio because, in addition to its total net assets, the Portfolio would be subject to investment exposure on the notional amount of the swap. As a buyer of protection, the Portfolio generally receives an amount up to the notional value of the swap if a credit event occurs. The treatment of a credit default swaps and other swap agreements that provide for contingent, non-periodic, bullet-type payments as “notional principal contracts” for federal income tax purposes is uncertain. Were the Internal Revenue Service in take the position that a credit default swap or other bullet-type swap is not a “notional principal contract” for federal income tax purposes, payments received by the Portfolio from such investments might be subject to income taxes.
| | | | | | |
| | | Semiannual Report | | June 30, 2006 | | 15 |
Notes to Financial Statements (Cont.)
Swaps are marked to market daily based upon quotations from market makers and the change in value, if any, is recorded as unrealized gain or loss in the Statement of Operations. Payments received or made at the beginning of the measurement period are reflected as such in the Statement of Assets and Liabilities. These upfront payments are recorded as realized gain or loss in the Statement of Operations upon termination or maturity of the swap. A liquidation payment received or made at the termination of the swap is recorded as realized gain or loss in the Statement of Operations. Net periodic payments received or paid by the Portfolio are included as part of realized gain or loss in the Statement of Operations. Entering into these agreements involves, to varying degrees, elements of credit, market and documentation risk in excess of the amounts recognized in the Statement of Assets and Liabilities. Such risks involve the possibility that there will be no liquid market for these agreements, that the counterparty to the agreements may default on its obligation to perform or disagree as to the meaning of contractual terms in the agreements and that there may be unfavorable changes in interest rates.
Commodities Linked/Structured Notes. The Portfolio invests in structured notes whose value is based on the price movements of a commodity index. The structured notes are often leveraged, increasing the volatility of each note’s value relative to the change in the underlying linked financial element. The value of these notes will rise and fall in response to changes in the underlying commodity index. Structured securities may entail a greater degree of market risk than other types of debt securities because the investor bears the risk of the underlying commodity index. Structured notes may also be more volatile, less liquid, and more difficult to accurately price than less complex securities or more traditional debt securities. Fluctuations in value of the structured notes are recorded as unrealized gains and losses in the accompanying financial statements. Net payments are recorded as net realized gains/losses. These notes are subject to prepayment, credit and interest risks. The Portfolio has the option to request prepayment from the issuer. At maturity, or when a note is sold, the Portfolio records a realized gain or loss. At June 30, 2006, the value of these securities comprised 34.2% of the Portfolio’s net assets and resulted in unrealized appreciation of $2,703.
U.S. Government Agencies or Government-Sponsored Enterprises. Securities issued by U.S. Government agencies or government-sponsored enterprises may not be guaranteed by the U.S. Treasury. The Government National Mortgage Association (“GNMA”), a wholly owned U.S. Government corporation, is authorized to guarantee, with the full faith and credit of the U.S. Government, the timely payment of principal and interest on securities issued by institutions approved by GNMA and backed by pools of mortgages insured by the Federal Housing Administration or guaranteed by the Department of Veterans Affairs. Government-related guarantors (i.e., not backed by the full faith and credit of the U.S. Government) include the Federal National Mortgage Association (“FNMA” or “Fannie Mae”) and the Federal Home Loan Mortgage Corporation (“FHLMC” or “Freddie Mac”). Pass-through securities issued by FNMA are guaranteed as to timely payment of principal and interest by FNMA but are not backed by the full faith and credit of the U.S. Government. FHLMC guarantees the timely payment of interest and ultimate collection of principal, but its participation certificates are not backed by the full faith and credit of the U.S. Government.
New Accounting Policies. In July 2006, the Financial Accounting Standards Board issued Interpretation No. 48, “Accounting for Uncertainty in Income Taxes—an Interpretation of FASB Statement No. 109” (the “Interpretation”). The Interpretation is effective for fiscal years beginning after December 15, 2006. Management is currently evaluating the application of the Interpretation to the Portfolio and will provide additional information in relation to the Interpretation in the Portfolio’s annual financial statements for the year ending December 31, 2006.
3. FEES, EXPENSES, AND RELATED PARTY TRANSACTIONS
Investment Advisory Fee. PIMCO is a majority-owned subsidiary of Allianz Global Investors of America L.P. (“AGI”) and serves as investment adviser (the “Adviser”) to the Trust, pursuant to an investment advisory contract. The Adviser receives a monthly fee at an annual rate based on average daily net assets of the Portfolio. The Advisory Fee is charged at an annual rate of 0.49%.
Administration Fee. PIMCO serves as administrator (the “Administrator”), and provides administrative services to the Trust for which it receives a monthly administrative fee based on average daily net assets of the Portfolio. As the Administrator, PIMCO bears the costs of various third-party services, including audit, custodial, portfolio accounting, legal, transfer agency and printing costs. The Administration Fee is charged at the annual rate of 0.25%.
Distribution and Servicing Fees. Allianz Global Investors Distributors LLC (“AGID”) is an indirect wholly-owned subsidiary of AGI and serves as the distributor of the Trust’s shares. The Trust is permitted to reimburse AGID on a quarterly basis, out of the Administrative Class assets of the Portfolio in the amount of 0.15% on an annual basis of the average daily net assets of that class, for payments made to financial intermediaries that provide services in connection with the distribution of shares or administration of plans or programs that use Portfolio shares as their funding medium. The effective rate paid to AGID was 0.15% during the current fiscal year.
Expenses. The Trust is responsible for the following expenses: (i) salaries and other compensation of any of the Trust’s executive officers and employees who are not officers, directors, stockholders or employees of PIMCO or its subsidiaries or affiliates; (ii) taxes and governmental fees; (iii) brokerage fees and commissions and other portfolio transaction expenses; (iv) the costs of borrowing money, including interest expenses and bank overdraft charges; (v) fees and expenses of the Trustees who are not “interested persons” of PIMCO or the Trust, and any counsel retained exclusively for their benefit; (vi) extraordinary expenses, including costs of litigation and indemnification expenses; (vii) organization expenses and (viii) any expenses allocated or allocable to a specific class of shares, which include service fees payable with respect to the Administrative Class shares and may include certain other expenses as permitted by the Trust’s Multiple Class Plan adopted pursuant to Rule 18f-3 under the Act and subject to review and approval by the Trustees. The ratio of expenses to average net assets per share class, as disclosed in the Financial Highlights, may differ from the annual portfolio operating expenses per share class as disclosed in the Prospectus for the reasons set forth above.
PIMCO has agreed to waive a portion of its administrative fees to the extent that the payment of the Portfolio’s pro rata share of organization expenses and Trustee fees cause the actual expense ratio to rise above the rates disclosed in the then-current prospectus plus 0.49 basis points as set forth below (calculated as a percentage of the Portfolio’s average daily net assets attributable to each class):
| | | |
| Administrative Class | | 0.89 | % |
PIMCO may be reimbursed for these waived amounts in future periods, not to exceed thirty-six months. Expenses that have been waived and may still be reimbursed by the Administrator, to the extent the Portfolio’s annualized total portfolio operating expenses plus the amount so reimbursed does not exceed the operating expense limitation, are as follows (amounts in thousands):
| | | | | | | | | | | | | | | |
| | | | | | 12/31/2004 | | | | | 12/31/2005 | | | | | 06/30/2006 |
Amount Available for Reimbursement | | | | $ | 9 | | | | $ | 0 | | | | $ | 0 |
| | | | |
| 16 | | PIMCO Variable Insurance Trust | | |
| | |
| |
| | | June 30, 2006 (Unaudited) |
For the current period ended June 30, 2006, each unaffiliated Trustee received an annual retainer of $15,000, plus $2,000 for each Board of Trustees quarterly meeting attended, $500 for each Board of Trustees committee meeting attended and $500 for each special board meeting attended, plus reimbursement of related expenses. In addition, each Committee Chair received an additional annual retainer of $500 and each Audit Committee Chair received an additional annual retainer of $1,500. These expenses are allocated on a pro-rata basis to each Portfolio of the Trust according to its respective net assets. The Trust pays no compensation directly to any Trustee or any other officer who is affiliated with the Administrator, all of whom receive remuneration for their services to the Trust from the Administrator or its affiliates.
4. PURCHASES AND SALES OF SECURITIES
The length of time the Portfolio has held a particular security is not generally a consideration in investment decisions. A change in the securities held by the Portfolio is known as “portfolio turnover”. The Portfolio may engage in frequent and active trading of portfolio securities to achieve its investment objective, particularly during periods of volatile market movements. High portfolio turnover (e.g., over 100%) involves correspondingly greater expenses to the Portfolio, including brokerage commissions or dealer mark-ups and other transaction costs on the sale of securities and reinvestments in other securities. Such sales may also result in realization of taxable capital gains, including short-term capital gains (which are generally taxed at ordinary income tax rates). The trading costs and tax effects associated with portfolio turnover may adversely affect the Portfolio’s performance.
Purchases and sales of securities (excluding short-term investments) for the period ended June 30, 2006 were as follows (amounts in thousands):
| | | | | | | | | | | | | | | | |
| | U.S Government/Agency | | | | | All Other |
| | Purchases | | | | | Sales | | | | | Purchases | | | | | Sales |
| $ | 1,090,207 | | | | $ | 1,027,659 | | | | $ | 63,523 | | | | $ | 8,613 |
5. TRANSACTIONS IN WRITTEN CALL AND PUT OPTIONS
Transactions in written call and put options were as follows (amounts in thousands, except number of contracts):
| | | | | | | | | | | | | | | | |
| | | | | # of
Contracts |
| | | |
| Notional
Amount
in $ | | | | | Premium | |
Balance at 12/31/2005 | | | | 18 | | | | | $ | 0 | | | | $ | 6 | |
Sales | | | | 310 | | | | | | 19,500 | | | | | 156 | |
Closing Buys | | | | (26 | ) | | | | | 0 | | | | | (14 | ) |
Expirations | | | | 0 | | | | | | 0 | | | | | 0 | |
Exercised | | | | 0 | | | | | | 0 | | | | | 0 | |
Balance at 06/30/2006 | | | | 302 | | | | | $ | 19,500 | | | | $ | 148 | |
6. SHARES OF BENEFICIAL INTEREST
The Portfolio may issue an unlimited number of shares of beneficial interest with a $0.001 par value. Changes in shares of beneficial interest were as follows (shares and amounts in thousands):
| | | | | | | | | | | | | | | | | | |
| | | | | Six Months Ended
06/30/2006 | | | | | Year Ended
12/31/2005 | |
| | | | | Shares | | | Amount | | | | | Shares | | | Amount | |
| | | | | | |
Receipts for shares sold | | | | | | | | | | | | | | | | | | |
Administrative Class | | | | 7,192 | | | $ | 86,046 | | | | | 8,973 | | | $ | 107,935 | |
Advisor Class | | | | 161 | | | | 1,992 | | | | | 0 | | | | 0 | |
Issued as reinvestment of distributions | | | | | | | | | | | | | | | | | | |
Administrative Class | | | | 173 | | | | 1,990 | | | | | 106 | | | | 1,298 | |
Advisor Class | | | | 1 | | | | 15 | | | | | 0 | | | | 0 | |
Cost of shares redeemed | | | | | | | | | | | | | | | | | | |
Administrative Class | | | | (3,813 | ) | | | (46,555 | ) | | | | (672 | ) | | | (7,711 | ) |
Advisor Class | | | | (27 | ) | | | (339 | ) | | | | 0 | | | | 0 | |
Net increase resulting from Portfolio share transactions | | | | 3,687 | | | $ | 43,149 | | | | | 8,407 | | | $ | 101,522 | |
* Inception date of the Portfolio
The following schedule shows the number of shareholders each owning 5% or more of the Portfolio and the total percentage of the Portfolio held by such shareholders:
| | | | | | | |
| | | | | Number of
Shareholders | | % of Portfolio Held | |
Administrative Class | | | | 4 | | 87 | * |
Advisor Class | | | | 4 | | 94 | |
* Allianz Life Insurance Co. of North America, an indirect wholly owned subsidiary of AGI and a related party to the Portfolio, owned 25% or more of the outstanding shares of beneficial interest of the Portfolio, and therefore may be presumed to “control” the Portfolio, as that term is defined in the 1940 Act.
7. FEDERAL INCOME TAX MATTERS
As of June 30, 2006, the aggregate cost of investments was the same for federal income tax and financial statement purposes. The net unrealized appreciation (depreciation) of investment securities for federal income tax purposes is as follows (amounts in thousands):
| | | | |
Aggregate
Gross
Unrealized
Appreciation | | Aggregate
Gross
Unrealized
(Depreciation) | | Net
Unrealized
Appreciation |
$ 5,397 | | $ (935) | | $ 4,462 |
8. REGULATORY AND LITIGATION MATTERS
On June 1, 2004, the Attorney General of the State of New Jersey announced that it had dismissed PIMCO from a complaint filed by the New Jersey Attorney General on February 17, 2004, and that it had entered into a settlement agreement (the “New Jersey Settlement”) with Allianz Global Investors of America L.P. (“AGI”) (formerly known as Allianz Dresdner Asset Management of America L.P.), PEA Capital LLC (an entity affiliated with PIMCO through common ownership) (“PEA”) and Allianz Global Investors Distributors LLC (“AGID”), in connection with the same matter. In the New Jersey Settlement, AGI, PEA and AGID neither admitted nor denied the allegations or conclusions of law, but did agree to pay New Jersey a civil fine of $15 million and $3 million for investigative costs and further potential enforcement initiatives against unrelated parties. They also undertook to implement certain governance changes. The complaint relating to the New Jersey Settlement alleged, among other things, that AGI, PEA and AGID had failed to disclose that they improperly allowed certain hedge funds to engage in “market timing” in certain funds. The complaint sought injunctive relief, civil monetary penalties, restitution and disgorgement of profits.
| | | | | | |
| | | Semiannual Report | | June 30, 2006 | | 17 |
| | |
| |
| Notes to Financial Statements (Cont.) | | June 30, 2006 (Unaudited) |
Since February 2004, PIMCO, AGI, PEA, AGID, and certain of their affiliates, including the PIMCO Funds, the Allianz Funds (formerly known as PIMCO Funds: Multi-Manager Series), and the Trustees and employees of the PIMCO Funds, have been named as defendants in fifteen lawsuits filed in various jurisdictions. Eleven of those lawsuits concern “market timing,” and they have been transferred to and consolidated for pre-trial proceedings in a multi-district litigation proceeding in the U.S. District Court for the District of Maryland; the other four lawsuits concern “revenue sharing” and have been consolidated into a single action in the U.S. District Court for the District of Connecticut. The lawsuits have been commenced as putative class actions on behalf of investors who purchased, held or redeemed shares of the various series of the PIMCO Funds and the Allianz Funds during specified periods, or as derivative actions on behalf of the PIMCO Funds and Allianz Funds.
The market timing actions in the District of Maryland generally allege that certain hedge funds were allowed to engage in “market timing” in certain of the PIMCO Funds and the Allianz Funds and this alleged activity was not disclosed. Pursuant to tolling agreements entered into with the derivative and class action plaintiffs, PIMCO, the Trustees, and certain employees of PIMCO who were previously named as defendants have all been dropped as defendants in the market timing actions; the plaintiffs continue to assert claims on behalf of the shareholders of the PIMCO Funds or on behalf of the PIMCO Funds themselves against other defendants. By order dated November 3, 2005, the U.S. District Court for the District of Maryland granted the PIMCO Funds’ motion to dismiss claims asserted against it in a consolidated amended complaint where the PIMCO Funds were named, in the complaint, as a nominal defendant. The revenue sharing action in the District of Connecticut generally alleges that fund assets were inappropriately used to pay brokers to promote the PIMCO Funds and Allianz Funds including directing fund brokerage transactions to such brokers, and that such alleged arrangements were not fully disclosed to shareholders. On August 11, 2005 the U.S. District Court for the District of Connecticut conducted a hearing on defendants’ motion to dismiss the consolidated amended complaint in the revenue sharing action but has not yet ruled on the motion to dismiss. The market timing and revenue sharing lawsuits seek, among other things, unspecified compensatory damages plus interest and, in some cases, punitive damages, the rescission of investment advisory contracts, the return of fees paid under those contracts and restitution.
Under Section 9(a) of the Investment Company Act of 1940, as amended (“1940 Act”), if the New Jersey Settlement or any of the lawsuits described above were to result in a court injunction against AGI, PEA, AGID and/or their affiliates, PIMCO could, in the absence of exemptive relief granted by the SEC, be barred from serving as an investment adviser, and AGID could be barred from serving as principal underwriter, to any registered investment company, including the Portfolios of the Trust. In connection with an inquiry from the SEC concerning the status of the New Jersey Settlement under Section 9(a), PEA, AGID, AGI and certain of their affiliates (including PIMCO) (together, the “Applicants”) have sought exemptive relief from the SEC under Section 9(c) of the 1940 Act. The SEC has granted the Applicants a temporary exemption from the provisions of Section 9(a) with respect to the New Jersey Settlement until the earlier of (i) September 13, 2006 and (ii) the date on which the SEC takes final action on their application for a permanent order. There is no assurance that the SEC will issue a permanent order.
Two nearly identical class action civil complaints have been filed in August 2005, in the Northern District of Illinois Eastern Division alleging that the plaintiffs each purchased and sold a 10-year Treasury note futures contract and suffered damages from an alleged shortage when PIMCO held both physical and futures positions in 10-year Treasury notes for its client accounts. The two actions have been consolidated into one action, and the two separate complaints have been replaced by a consolidated complaint. PIMCO is a named defendant, and the PIMCO Funds have been added as a defendant, to the consolidated action. PIMCO strongly believes the complaint (and any consolidated complaint filed hereafter) is without merit and intends to vigorously defend itself.
Certain Portfolios of the Trust were recently served in an adversary proceeding brought by the Official Committee of Asbestos Claimants of G-I Holdings, Inc. in G-I Holdings, Inc.’s bankruptcy in the District of New Jersey. PIMCO was previously named in this lawsuit and remains a defendant. The plaintiff seeks to recover for the bankruptcy estate assets that were transferred by the predecessor entity of G-I Holdings, Inc. to a wholly-owned subsidiary in 1994. The subsidiary has since issued notes, of which certain Portfolios of the Trust are alleged to be holders. The complaint alleges that in 2000, more than two hundred noteholders—including certain Portfolios of the Trust—were granted a second priority lien on the assets of the subsidiary in exchange for their consent to a refinancing transaction and the granting of a first priority lien to the lending banks. The plaintiff is seeking invalidation of the lien in favor of the noteholders and/or the value of the lien.
It is possible that these matters and/or other developments resulting from these matters could result in increased fund redemptions or other adverse consequences to the Portfolios. However, PIMCO and AGID believe that these matters are not likely to have a material adverse effect on the Portfolios or on PIMCO’s or AGID’s ability to perform their respective investment advisory or distribution services relating to the Portfolios.
| | | | |
| 18 | | PIMCO Variable Insurance Trust | | |
Investment Adviser and Administrator
Pacific Investment Management Company LLC
840 Newport Center Drive
Newport Beach, California 92660
Distributor
Allianz Global Investors Distributors LLC
2187 Atlantic Street
Stamford, Connecticut 06902
Custodian
State Street Bank & Trust Company
801 Pennsylvania
Kansas City, Missouri 64105
Transfer Agent
Boston Financial Data Services–Midwest
330 W. 9th Street
Kansas City, Missouri 64105
Legal Counsel
Dechert LLP
1775 I Street, N.W.
Washington, D.C. 20006
Independent Registered Public Accounting Firm
PricewaterhouseCoopers LLP
1055 Broadway
Kansas City, Missouri 64105
P I M C O

Share Class Administrative
Semiannual Report June 30, 2006
PIMCO Variable Insurance Trust
Emerging Markets Bond Portfolio
Table of Contents
This material is authorized for use only when preceded or accompanied by the current PIMCO Variable Insurance Trust (the “Trust”) prospectus. Investors should consider the investment objectives, risks, charges and expenses of this Trust carefully before investing. Ask your financial professional to explain all charges that may apply. This and other information is contained in the Trust’s prospectus. The variable product prospectus may be obtained by contacting your Investment Consultant. Please read the Trust and variable product prospectus carefully before you invest or send money.
Chairman’s Letter
Dear PIMCO Variable Insurance Trust Shareholder:
It is our pleasure to present to you the semiannual report for the PIMCO Variable Insurance Trust covering the six-month period ended June 30, 2006.
Highlights of the global bond markets during the six-month period included:
| | n | | Most fixed-income sectors lost ground during the first half of 2006, as concern about accelerating inflation and central bank tightening pushed interest rates higher worldwide. The benchmark Lehman Brothers Aggregate Bond Index (which includes Treasury, Investment-Grade Corporate, and Residential Mortgage-Backed Securities) returned -0.72% for the first six months of the year. On June 30, the benchmark ten-year Treasury yielded 5.14%, 0.75% higher than at the start of the year. The U.S. yield curve remained flat as shorter-maturity yields rose by a comparable amount. |
| | n | | The Federal Reserve tightened four times during the reporting period, bringing the Federal Funds Rate to 5.25%. The increase near the end of the period was the Federal Reserve’s 17th consecutive rate hike since the start of its tightening cycle in 2004. The Federal Reserve was not alone, as central banks in Europe, India, and China tightened credit in unison for the first time since 2000. The Bank of Japan, whose zero-interest-rate policy has flooded global markets with liquidity, looked set to reverse this policy in the coming months. |
In these pages please find a more complete Portfolio review as it relates to financial-market activities, as well as details about total-return investment performance for the six-month reporting period. Thank you for the trust you have placed in us. We will continue to work diligently to meet your investment needs.
Sincerely,
Brent R. Harris
Chairman, PIMCO Variable Insurance Trust
July 31, 2006
| | | | | | |
| | | Semiannual Report | | June 30, 2006 | | 1 |
Important Information About the Portfolios
PIMCO Variable Insurance Trust (the “Trust”) is an open-end investment company currently consisting of nineteen separate investment portfolios, including the Emerging Markets Bond Portfolio (the “Portfolio”). The Portfolio is only available as a funding vehicle under variable life insurance policies or variable annuity contracts issued by insurance companies (“Variable Contracts”). Individuals may not purchase shares of the Portfolio directly. Shares of the Portfolio also may be sold to qualified pension and retirement plans outside of the separate account context.
We believe that bond funds have an important role to play in a well diversified investment portfolio. It is important to note, however, that in an environment where interest rates may trend upward, rising rates would negatively impact the performance of most bond funds, and fixed-income securities held by a fund are likely to decrease in value. The price volatility of fixed-income securities can also increase during periods of rising interest rates resulting in increased losses to a fund. Bond funds and individual bonds with a longer duration (a measure of the expected life of a security) tend to be more sensitive to changes in interest rates, usually making them more volatile than securities or funds with shorter durations. The longer-term performance of most bond funds has benefited from capital gains in part resulting from an extended period of declining interest rates. In the event interest rates increase, these capital gains should not be expected to recur.
The Portfolio may be subject to various risks in addition to those described above. Some of these risks may include, but are not limited to, the following: credit risk, high yield risk, market risk, issuer risk, liquidity risk, derivatives risk, mortgage risk, non-U.S. investment risk, emerging markets risk, currency risk, issuer non-diversification risk, leveraging risk and management risk. A complete description of these risks is contained in the Portfolio’s prospectus. The Portfolio may use derivative instruments for hedging purposes or as part of an investment strategy. Use of these instruments may involve certain costs and risks such as liquidity risk, interest rate risk, market risk, credit risk, management risk and the risk that the Portfolio could not close out a position when it would be most advantageous to do so. A Portfolio investing in derivatives could lose more than the principal amount invested in these instruments. Investing in non-U.S. securities may entail risk due to non-U.S. economic and political developments; this risk may be increased when investing in emerging markets.
On the performance summary page in this Semiannual Report, the Total Return Investment Performance table measures performance assuming that all dividend and capital gain distributions were reinvested.
An investment in the Portfolio is not a deposit of a bank and is not guaranteed or insured by the Federal Deposit Insurance Corporation or any other government agency. It is possible to lose money on investments in the Portfolio.
PIMCO has adopted written proxy voting policies and procedures (“Proxy Policy”) as required by Rule 206(4)-6 under the Investment Advisers Act of 1940. The Proxy Policy has been adopted by the Trust as the policies and procedures that PIMCO will use when voting proxies on behalf of the Portfolio. Copies of the written Proxy Policy and the factors that PIMCO may consider in determining how to vote proxies for the Portfolio, and information about how the Portfolio voted proxies relating to portfolio securities held during the most recent twelve-month period ended June 30, are available without charge, upon request, by calling the Trust at 1-866-746-2606 and on the Securities and Exchange Commission’s (“SEC”) website at http://www.sec.gov.
The Portfolio files its complete schedule of portfolio holdings with the SEC for the first and third quarters of each fiscal year on Form N-Q. A copy of the Trust’s Form N-Q is available on the SEC’s website at http://www.sec.gov and may be reviewed and copied at the SEC’s Public Reference Room in Washington D.C. Information on the operation of the Public Reference Room may be obtained by calling 1-800-SEC-0330.
PIMCO Variable Insurance Trust is distributed by Allianz Global Investors Distributors LLC, 2187 Atlantic Street, Stamford, CT 06902.
| | | | |
| 2 | | PIMCO Variable Insurance Trust | | |
The following disclosure provides important information regarding the Portfolio’s Expense Example (“Example” or “Expense Example”), which appears in this Semiannual Report. Please refer to this information when reviewing the Expense Example for the Portfolio.
Example
As a shareholder of the Portfolio, you incur two types of costs: (1) transaction costs and (2) ongoing costs, including advisory and administrative fees; distribution and/or service (12b-1) fees (Administrative Class only); and other Portfolio expenses. The Example is intended to help you understand your ongoing costs (in dollars) of investing in the Portfolio and to compare these costs with the ongoing costs of investing in other mutual funds. The Expense Example does not reflect any fees or other expenses imposed by the Variable Contracts. If it did, the expenses reflected in the Expense Examples would be higher. The Example is based on an investment of $1,000 invested at the beginning of the period and held for the entire period indicated, which is from January 1, 2006 to June 30, 2006.
Actual Expenses
The information in the table under the heading “Actual Performance” provides information about actual account values and actual expenses. You may use the information in these columns, together with the amount you invested, to estimate the expenses that you paid over the period. Simply divide your account value by $1,000 (for example, an $8,600 account value divided by $1,000 = 8.60), then multiply the result by the number in the appropriate column for your share class, in the row titled “Expenses Paid During Period” to estimate the expenses you paid on your account during this period.
Hypothetical Example for Comparison Purposes
The information in the table under the heading “Hypothetical Performance (5% return before expenses)” provides information about hypothetical account values and hypothetical expenses based on the Portfolio’s actual expense ratio and an assumed rate of return of 5% per year before expenses, which is not the Portfolio’s actual return. The hypothetical account values and expenses may not be used to estimate the actual ending account balance or expenses you paid for the period. You may use this information to compare the ongoing costs of investing in the Portfolio and other portfolios. To do so, compare this 5% hypothetical example with the 5% hypothetical examples that appear in the shareholder reports of the other portfolios.
Please note that the expenses shown in the table are meant to highlight your ongoing costs only and do not reflect any transactional costs. Therefore, the information under the heading “Hypothetical Performance (5% return before expenses)” is useful in comparing ongoing costs only, and will not help you determine the relative total costs of owning different portfolios. In addition, if these transactional costs were included, your costs would have been higher.
The expense ratio may vary period to period because of various factors, such as an increase in expenses not covered by the advisory and administrative fees (such as expenses of the trustees and their counsel or litigation expense).
Portfolio Benchmark
JPMorgan EMBI Global tracks total returns for United States Dollar denominated debt instruments issued by emerging market sovereign and quasi-sovereign entities. Brady bonds, loans, Eurobonds and local market instruments. This index only tracks the particular region or country. It is not possible to invest directly in this index.
| | | | | | |
| | | Semiannual Report | | June 30, 2006 | | 3 |
| | | | |
| | |
| PIMCO Emerging Markets Bond Portfolio | | | | |
| | | | |
Cumulative Returns Through June 30, 2006
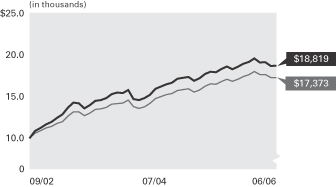
Emerging Markets
Bond Portfolio JPMorgan Emerging
Administrative Class Markets Global Index
-------------------- --------------------
09/30/2002 $10,000 $10,000
10/31/2002 10,879 10,616
11/30/2002 11,248 10,917
12/31/2002 11,665 11,253
01/31/2003 11,972 11,438
02/28/2003 12,475 11,804
03/31/2003 12,902 11,995
04/30/2003 13,728 12,678
05/31/2003 14,328 13,203
06/30/2003 14,225 13,203
07/31/2003 13,624 12,735
08/31/2003 14,020 13,045
09/30/2003 14,540 13,503
10/31/2003 14,623 13,569
11/30/2003 14,886 13,735
12/31/2003 15,356 14,139
01/31/2004 15,541 14,211
02/29/2004 15,485 14,261
03/31/2004 15,853 14,617
04/30/2004 14,754 13,823
05/31/2004 14,621 13,618
06/30/2004 14,888 13,818
07/31/2004 15,257 14,228
08/31/2004 15,988 14,815
09/30/2004 16,272 15,062
10/31/2004 16,560 15,304
11/30/2004 16,719 15,411
12/31/2004 17,215 15,797
01/31/2005 17,349 15,896
02/28/2005 17,450 16,003
03/31/2005 16,967 15,595
04/30/2005 17,289 15,841
05/31/2005 17,797 16,315
06/30/2005 18,069 16,605
07/31/2005 18,028 16,564
08/31/2005 18,405 16,885
09/30/2005 18,721 17,170
10/31/2005 18,380 16,917
11/30/2005 18,680 17,175
12/31/2005 19,066 17,493
01/31/2006 19,258 17,702
02/28/2006 19,690 18,095
03/31/2006 19,220 17,752
04/30/2006 19,226 17,737
05/31/2006 18,786 17,374
06/30/2006 18,819 17,373
$10,000 invested at the beginning of the first full month following the inception date of the Portfolio’s Administrative Class.
Country Allocation‡
| | |
Short-Term Instruments | | 21.0% |
Brazil | | 20.2% |
Russia | | 14.8% |
Mexico | | 12.8% |
Venezuela | | 6.2% |
Other | | 25.0% |
| | ‡ | % of Total Investments as of June 30, 2006 |
| | | | | | | | | | |
| Average Annual Total Return for the period ended June 30, 2006 |
| | | | | | | 6 Months* | | 1 Year | | Since
Inception
(09/30/02) |
| | |
| | PIMCO Emerging Markets Bond Portfolio Administrative Class | | -1.30% | | 4.15% | | 18.37% |
| | |
| | JPMorgan Emerging Markets Bond Global Index | | -0.69% | | 4.62% | | 15.88% |
All Portfolio returns are net of fees and expenses.
* Cumulative return.
Past performance is no guarantee of future results. The performance quoted represents past performance. Investment return and principal value will fluctuate so the Portfolio shares, when redeemed, may be worth more or less than their original cost. The Portfolio’s performance does not reflect the deduction of additional charges and expenses imposed in connection with investing in Variable Contracts, which will reduce returns. Current performance may be lower or higher than the performance data quoted. Performance data current to the most recent month-end is available by calling (800) 927-4648.
| | | | | | | | | | |
| Expense Example | | | | Actual Performance | | | | Hypothetical Performance |
| | | | | | | | | (5% return before expenses) |
Beginning Account Value (01/01/06) | | | | $ | 1,000.00 | | | | $ | 1,000.00 |
Ending Account Value (06/30/06) | | | | $ | 987.00 | | | | $ | 1,019.84 |
Expenses Paid During Period† | | | | $ | 4.93 | | | | $ | 5.01 |
† Expenses are equal to the Portfolio’s Administrative Class annualized expense ratio of 1.00%, multiplied by the average account value over the period, multiplied by 181/365 (to reflect the one-half year period). Overall fees and expenses of investing in the Portfolio will be higher because the example does not reflect Variable Contract fees and expenses.
Please refer to page 3 herein for a description of the Portfolio’s benchmark and an explanation of the information presented in the above Expense Example.
Portfolio Insights
| » | | The PIMCO Emerging Markets Bond Portfolio seeks to achieve its investment objective by investing at least 80% of its assets in Fixed- Income Securities of issuers that economically are tied to countries with emerging securities markets. |
| » | | An overweight position in Brazil was positive; Brazil outperformed the index on the back of external debt buybacks and ratings upgrades from S&P and Fitch. |
| » | | An overweight to Ecuador was positive; debt buybacks, a high spread cushion and supportive crude oil prices helped to balance political noise. The Ecuador sub-index rallied strongly in Q1 and returned 8.04% for the past six months. |
| » | | A significant underweight to Turkey was positive, especially in Q2, when Turkish spreads widened by 1.12%. Spread widening was due to worries about the country’s large current account deficit, a major sell-off in the lira, and an increasing inflation rate. |
| » | | Despite the recent shift in risk tolerance, which favored strong credits over weak credits in Q2, an underweight to Argentina was negative for the first half of the year. The country posted a return of 17.9% for the Q1, as short covering and a search for yield outweighed investor concerns over mounting inflation. Year-to-date, the sub-index has returned 10.8%. |
| » | | Underweighting the Philippines was negative; the country outperformed due to high levels of overseas remittances and news that the budget shortfall narrowed. |
| » | | Above benchmark duration in Q1 was negative as U.S. Treasury rates rose. |
| » | | An emphasis on shorter maturities was negative, as the yield curve continued to flatten in the past six months. |
| » | | A strategic allocation to emerging market currencies was positive, as attractive carry via high local interest rates was high enough to offset weakness in some EM currencies. |
| | | | |
| 4 | | PIMCO Variable Insurance Trust | | |
| | |
| |
| Financial Highlights Emerging Markets Bond Portfolio | | |
| | | | | | | | | | | | | | | | | | | | |
| Selected Per Share Data for the Year or Period Ended: | | 06/30/2006+ | | | 12/31/2005 | | | 12/31/2004 | | | 12/31/2003 | | | 09/30/2002-12/31/2002 | |
| | | | | |
Administrative Class | | | | | | | | | | | | | | | | | | | | |
| Net asset value beginning of period | | $ | 13.66 | | | $ | 13.21 | | | $ | 12.97 | | | $ | 11.48 | | | $ | 10.00 | |
| Net investment income (a) | | | 0.35 | | | | 0.67 | | | | 0.48 | | | | 0.62 | | | | 0.18 | |
| Net realized/unrealized gain (loss) on investments (a) | | | (0.52 | ) | | | 0.71 | | | | 1.03 | | | | 2.90 | | | | 1.48 | |
| Total income (loss) from investment operations | | | (0.17 | ) | | | 1.38 | | | | 1.51 | | | | 3.52 | | | | 1.66 | |
| Dividends from net investment income | | | (0.36 | ) | | | (0.68 | ) | | | (0.51 | ) | | | (0.65 | ) | | | (0.18 | ) |
| Distributions from net realized capital gains | | | 0.00 | | | | (0.25 | ) | | | (0.76 | ) | | | (1.38 | ) | | | 0.00 | |
| Total distributions | | | (0.36 | ) | | | (0.93 | ) | | | (1.27 | ) | | | (2.03 | ) | | | (0.18 | ) |
| Net asset value end of period | | $ | 13.13 | | | $ | 13.66 | | | $ | 13.21 | | | $ | 12.97 | | | $ | 11.48 | |
| Total return | | | (1.30 | )% | | | 10.75 | % | | | 12.11 | % | | | 31.64 | % | | | 16.65 | % |
| Net assets end of period (000s) | | $ | 163,807 | | | $ | 133,142 | | | $ | 64,598 | | | $ | 50,954 | | | $ | 32,767 | |
| Ratio of expenses to average net assets | | | 1.00 | %* | | | 1.00 | % | | | 1.01 | %(b) | | | 1.04 | %(b) | | | 1.02 | %*(b)(c) |
| Ratio of net investment income to average net assets | | | 5.24 | %* | | | 5.01 | % | | | 3.70 | % | | | 4.78 | % | | | 6.58 | %* |
| Portfolio turnover rate | | | 154 | % | | | 242 | % | | | 484 | % | | | 451 | % | | | 91 | % |
+ Unaudited
* Annualized
(a) Per share amounts based on average number of shares outstanding during the period.
(b) Ratio of expenses to average net assets excluding interest expense is 1.00%.
(c) If the investment manager had not reimbursed expenses, the ratio of expenses to average net assets would have been 1.11%.
| | | | | | |
| See Accompanying Notes | | Semiannual Report | | June 30, 2006 | | 5 |
| | |
| |
| Statement of Assets and Liabilities Emerging Markets Bond Portfolio | | |
| | | | |
| (Amounts in thousands, except per share amounts) | | June 30, 2006
(Unaudited) | |
| |
Assets: | | | | |
Investments, at value | | $ | 172,671 | |
Cash | | | 103 | |
Foreign currency, at value | | | 74 | |
Receivable for investments sold | | | 12,533 | |
Receivable for Portfolio shares sold | | | 123 | |
Interest and dividends receivable | | | 3,022 | |
Variation margin receivable | | | 68 | |
Unrealized appreciation on forward foreign currency contracts | | | 64 | |
Unrealized appreciation on swap agreements | | | 404 | |
| | | | 189,062 | |
| |
Liabilities: | | | | |
Payable for investments purchased | | $ | 101 | |
Payable for investments purchased on delayed-delivery basis | | | 24,365 | |
Payable for Portfolio shares redeemed | | | 58 | |
Written options outstanding | | | 15 | |
Accrued investment advisory fee | | | 64 | |
Accrued administration fee | | | 57 | |
Accrued servicing fee | | | 19 | |
Swap premiums received | | | 120 | |
Unrealized depreciation on forward foreign currency contracts | | | 165 | |
Unrealized depreciation on swap agreements | | | 194 | |
| | | | 25,158 | |
| |
Net Assets | | $ | 163,904 | |
| |
Net Assets Consist of: | | | | |
Paid in capital | | $ | 159,124 | |
Undistributed net investment income | | | 2,227 | |
Accumulated undistributed net realized gain | | | 2,918 | |
Net unrealized (depreciation) | | | (365 | ) |
| | | $ | 163,904 | |
| |
Net Assets: | | | | |
Administrative Class | | $ | 163,807 | |
Advisor Class | | | 97 | |
| |
Shares Issued and Outstanding: | | | | |
Administrative Class | | | 12,478 | |
Advisor Class | | | 7 | |
| |
Net Asset Value and Redemption Price Per Share (Net Assets Per Share Outstanding) | | | | |
Administrative Class | | $ | 13.13 | |
Advisor Class | | | 13.13 | |
| |
Cost of Investments Owned | | $ | 172,701 | |
Cost of Foreign Currency Held | | $ | 73 | |
Premiums Received on Written Options | | $ | 25 | |
| | | | |
| 6 | | PIMCO Variable Insurance Trust | | See Accompanying Notes |
| | |
| |
| Statement of Operations Emerging Markets Bond Portfolio | | |
| | | | |
| (Amounts in Thousands) | | Six Months Ended
June 30, 2006
(Unaudited) | |
| |
Investment Income: | | | | |
Interest | | $ | 4,773 | |
Total Income | | | 4,773 | |
| |
Expenses: | | | | |
Investment advisory fees | | | 344 | |
Administration fees | | | 306 | |
Servicing fees – Administrative Class | | | 115 | |
Trustees’ fees | | | 1 | |
Interest expense | | | 1 | |
Total Expenses | | | 767 | |
| |
Net Investment Income | | | 4,006 | |
| |
Net Realized and Unrealized Gain (Loss): | | | | |
Net realized gain on investments | | | 1,386 | |
Net realized (loss) on futures contracts, options and swaps | | | (164 | ) |
Net realized gain on foreign currency transactions | | | 26 | |
Net change in unrealized (depreciation) on investments | | | (6,930 | ) |
Net change in unrealized (depreciation) on futures contracts, options and swaps | | | (767 | ) |
Net change in unrealized (depreciation) on translation of assets and liabilities denominated in foreign currencies | | | (117 | ) |
Net (Loss) | | | (6,566 | ) |
| |
Net (Decrease) in Net Assets Resulting from Operations | | $ | (2,560 | ) |
| | | | | | |
| See Accompanying Notes | | Semiannual Report | | June 30, 2006 | | 7 |
| | |
| |
| Statements of Changes in Net Assets Emerging Markets Bond Portfolio | | |
| | | | | | | | |
| (Amounts in Thousands) | | Six Months Ended
June 30, 2006
(Unaudited) | | | Year Ended
December 31, 2005 | |
| | |
Increase (Decrease) in Net Assets from: | | | | | | | | |
| | |
Operations: | | | | | | | | |
Net investment income | | $ | 4,006 | | | $ | 4,299 | |
Net realized gain | | | 1,248 | | | | 2,037 | |
Net change in unrealized appreciation (depreciation) | | | (7,814 | ) | | | 3,223 | |
Net increase (decrease) resulting from operations | | | (2,560 | ) | | | 9,559 | |
| | |
Distributions to Shareholders: | | | | | | | | |
| From net investment income | | | | | | | | |
Administrative Class | | | (4,103 | ) | | | (4,422 | ) |
Advisor Class | | | 0 | | | | 0 | |
| From net realized capital gains | | | | | | | | |
Administrative Class | | | 0 | | | | (2,330 | ) |
Advisor Class | | | 0 | | | | 0 | |
| | |
Total Distributions | | | (4,103 | ) | | | (6,752 | ) |
| | |
Portfolio Share Transactions: | | | | | | | | |
| Receipts for shares sold | | | | | | | | |
Administrative Class | | | 52,231 | | | | 67,244 | |
Advisor Class | | | 108 | | | | 0 | |
| Issued as reinvestment of distributions | | | | | | | | |
Administrative Class | | | 4,103 | | | | 6,752 | |
Advisor Class | | | 0 | | | | 0 | |
| Cost of shares redeemed | | | | | | | | |
Administrative Class | | | (19,006 | ) | | | (8,259 | ) |
Advisor Class | | | (11 | ) | | | 0 | |
Net increase resulting from Portfolio share transactions | | | 37,425 | | | | 65,737 | |
| | |
Total Increase in Net Assets | | | 30,762 | | | | 68,544 | |
| | |
Net Assets: | | | | | | | | |
Beginning of period | | | 133,142 | | | | 64,598 | |
End of period* | | $ | 163,904 | | | $ | 133,142 | |
| | |
*Including undistributed net investment income of: | | $ | 2,227 | | | $ | 2,324 | |
| | | | |
| 8 | | PIMCO Variable Insurance Trust | | See Accompanying Notes |
| | |
| |
| Schedule of Investments Emerging Markets Bond Portfolio | | June 30, 2006 (Unaudited) |
| | | | |
| | | PRINCIPAL | | |
| | | AMOUNT | | VALUE |
| | | (000S) | | (000S) |
| | | | | |
| | | | | | | | |
| ARGENTINA 0.5% |
| Argentina Bonos |
0.000% due 08/03/2012 | | $ | | 1,000 | | $ | | 832 |
| | | | | | | | |
|
Total Argentina (Cost $829) | | 832 |
| | | | | | | | |
|
| |
| BRAZIL 21.2% |
| Brazilian Government International Bond |
10.000% due 08/07/2011 | | $ | | 1,250 | | | | 1,429 |
11.000% due 01/11/2012 | | | | 1,160 | | | | 1,386 |
10.250% due 06/17/2013 | | | | 50 | | | | 59 |
10.500% due 07/14/2014 | | | | 2,085 | | | | 2,516 |
7.875% due 03/07/2015 | | | | 3,625 | | | | 3,804 |
8.000% due 01/15/2018 | | | | 2,258 | | | | 2,388 |
8.875% due 10/14/2019 | | | | 2,250 | | | | 2,512 |
8.875% due 04/15/2024 | | | | 350 | | | | 389 |
8.750% due 02/04/2025 | | | | 1,700 | | | | 1,870 |
10.125% due 05/15/2027 | | | | 1,740 | | | | 2,166 |
12.250% due 03/06/2030 | | | | 220 | | | | 323 |
8.250% due 01/20/2034 | | | | 5,690 | | | | 5,989 |
11.000% due 08/17/2040 | | | | 7,646 | | | | 9,491 |
|
| CSN Islands VII Corp. |
10.750% due 09/12/2008 | | | | 200 | | | | 215 |
|
| Petrobras International Finance Co. |
7.750% due 09/15/2014 | | | | 250 | | | | 261 |
| | | | | | | | |
|
Total Brazil (Cost $33,593) | | 34,799 |
| | | | | | | | |
|
| |
| CAYMAN ISLANDS 0.1% |
| Banco Mercantil del Norte S.A. |
5.875% due 02/17/2014 | | $ | | 145 | | | | 144 |
| | | | | | | | |
|
Total Cayman Islands (Cost $145) | | 144 |
| | | | | | | | |
|
| |
| CHILE 0.8% |
| Chile Government International Bond |
5.625% due 07/23/2007 | | $ | | 915 | | | | 916 |
|
| Corp. Nacional del Cobre de Chile – CODELCO |
5.625% due 09/21/2035 | | | | 200 | | | | 180 |
|
| Empresa Nacional de Electricidad S.A. |
8.350% due 08/01/2013 | | | | 200 | | | | 216 |
| | | | | | | | |
|
Total Chile (Cost $1,353) | | 1,312 |
| | | | | | | | |
|
| |
| CHINA 1.3% |
| China Development Bank |
5.000% due 10/15/2015 | | $ | | 500 | | | | 467 |
|
| Export-Import Bank of China |
4.875% due 07/21/2015 | | | | 550 | | | | 507 |
|
| Panva Gas Holdings Ltd. |
8.250% due 09/23/2011 | | | | 670 | | | | 675 |
|
| Sino-Forest Corp. |
9.125% due 08/17/2011 | | | | 500 | | | | 517 |
| | | | | | | | |
|
Total China (Cost $2,279) | | 2,166 |
| | | | | | | | |
|
| |
| COLOMBIA 2.2% |
| Colombia Government International Bond |
9.750% due 04/23/2009 | | $ | | 220 | | | | 238 |
10.000% due 01/23/2012 | | | | 100 | | | | 113 |
10.750% due 01/15/2013 | | | | 400 | | | | 473 |
8.250% due 12/22/2014 | | | | 2,325 | | | | 2,453 |
10.375% due 01/28/2033 | | | | 310 | | | | 384 |
| | | | | | | | |
|
Total Colombia (Cost $3,721) | | 3,661 |
| | | | | | | | |
|
| |
| ECUADOR 3.8% |
| Ecuador Government International Bond |
9.000% due 08/15/2030 | | $ | | 6,469 | | | | 6,248 |
| | | | | | | | |
|
Total Ecuador (Cost $5,013) | | 6,248 |
| | | | | | | | |
|
| | | | | | | | |
| EGYPT 0.3% |
| Petroleum Export Ltd. |
5.265% due 06/15/2011 | | $ | | 574 | | $ | | 560 |
| | | | | | | | |
|
Total Egypt (Cost $571) | | 560 |
| | | | | | | | |
|
| |
| EL SALVADOR 0.5% |
| AES El Salvador Trust |
6.750% due 02/01/2016 | | $ | | 700 | | | | 648 |
|
| El Salvador Government International Bond |
8.500% due 07/25/2011 | | | | 150 | | | | 162 |
| | | | | | | | |
|
Total El Salvador (Cost $844) | | 810 |
| | | | | | | | |
|
| |
| GUATEMALA 0.4% |
| Guatemala Government Bond |
9.250% due 08/01/2013 | | $ | | 570 | | | | 637 |
| | | | | | | | |
|
Total Guatemala (Cost $570) | | 637 |
| | | | | | | | |
|
| |
| INDONESIA 0.7% |
| Indonesia Government International Bond |
6.875% due 03/09/2017 | | $ | | 1,200 | | | | 1,171 |
| | | | | | | | |
|
Total Indonesia (Cost $1,187) | | 1,171 |
| | | | | | | | |
|
| |
| KAZAKHSTAN 1.7% |
| ATF BANK |
9.000% due 05/11/2016 | | $ | | 150 | | | | 148 |
|
| Intergas Finance BV |
6.875% due 11/04/2011 | | | | 100 | | | | 99 |
|
| Kazakhstan Temir Zholy Finance BV |
6.500% due 05/11/2011 | | | | 300 | | | | 292 |
|
| Kazkommerts International BV |
8.500% due 04/16/2013 | | | | 250 | | | | 257 |
|
| Tengizchevroil Finance Co. SARL |
6.124% due 11/15/2014 | | | | 2,000 | | | | 1,942 |
| | | | | | | | |
|
Total Kazakhstan (Cost $2,834) | | 2,738 |
| | | | | | | | |
|
| |
| MALAYSIA 0.7% |
| Malaysia Government International Bond |
8.750% due 06/01/2009 | | $ | | 120 | | | | 129 |
7.500% due 07/15/2011 | | | | 325 | | | | 347 |
|
| Petronas Capital Ltd. |
7.000% due 05/22/2012 | | | | 325 | | | | 341 |
|
| Tenaga Nasional Bhd |
7.500% due 11/01/2025 | | | | 250 | | | | 273 |
|
| TNB Capital Ltd. |
5.250% due 05/05/2015 | | | | 100 | | | | 94 |
| | | | | | | | |
|
Total Malaysia (Cost $1,250) | | 1,184 |
| | | | | | | | |
|
| |
| MEXICO 13.4% |
| America Movil S.A. de C.V. |
5.500% due 03/01/2014 | | $ | | 200 | | | | 185 |
5.750% due 01/15/2015 | | | | 100 | | | | 93 |
|
| Mexico Government International Bond |
7.500% due 01/14/2012 | | | | 282 | | | | 300 |
5.875% due 01/15/2014 | | | | 250 | | | | 243 |
6.625% due 03/03/2015 | | | | 315 | | | | 320 |
11.375% due 09/15/2016 | | | | 25 | | | | 34 |
5.625% due 01/15/2017 | | | | 650 | | | | 606 |
8.125% due 12/30/2019 | | | | 1,324 | | | | 1,499 |
8.300% due 08/15/2031 | | | | 2,415 | | | | 2,795 |
7.500% due 04/08/2033 | | | | 1,000 | | | | 1,065 |
6.750% due 09/27/2034 | | | | 2,300 | | | | 2,242 |
| | | | | | | | |
| Pemex Project Funding Master Trust |
8.000% due 11/15/2011 | | $ | | 250 | | $ | | 265 |
7.375% due 12/15/2014 | | | | 3,015 | | | | 3,119 |
5.750% due 12/15/2015 | | | | 7,100 | | | | 6,548 |
9.250% due 03/30/2018 | | | | 977 | | | | 1,136 |
8.625% due 02/01/2022 | | | | 1,200 | | | | 1,345 |
6.625% due 06/15/2035 | | | | 250 | | | | 227 |
| | | | | | | | |
|
Total Mexico (Cost $22,894) | | 22,022 |
| | | | | | | | |
|
| |
| MOROCCO 0.1% |
| Kingdom of Morocco |
4.719% due 01/05/2009 | | $ | | 150 | | | | 149 |
| | | | | | | | |
|
Total Morocco (Cost $143) | | 149 |
| | | | | | | | |
|
| |
| NETHERLANDS 0.1% |
| HSBK Europe BV |
7.750% due 05/13/2013 | | $ | | 100 | | | | 100 |
| | | | | | | | |
|
Total Netherlands (Cost $100) | | 100 |
| | | | | | | | |
|
| |
| PAKISTAN 0.9% |
| Pakistan Government International Bond |
7.125% due 03/31/2016 | | $ | | 1,550 | | | | 1,418 |
| | | | | | | | |
|
Total Pakistan (Cost $1,534) | | 1,418 |
| | | | | | | | |
|
| |
| PANAMA 2.5% |
| Panama Government International Bond |
9.625% due 02/08/2011 | | $ | | 210 | | | | 234 |
9.375% due 07/23/2012 | | | | 1,210 | | | | 1,355 |
7.250% due 03/15/2015 | | | | 150 | | | | 152 |
7.125% due 01/29/2026 | | | | 2,165 | | | | 2,100 |
8.875% due 09/30/2027 | | | | 80 | | | | 91 |
9.375% due 04/01/2029 | | | | 200 | | | | 237 |
| | | | | | | | |
|
Total Panama (Cost $4,249) | | | | 4,169 |
| | | | | | | | |
|
| |
| PERU 3.0% |
| Peru Government International Bond |
9.125% due 01/15/2008 | | $ | | 650 | | | | 679 |
9.125% due 02/21/2012 | | | | 1,470 | | | | 1,632 |
5.000% due 03/07/2017 | | | | 2,066 | | | | 1,984 |
7.350% due 07/21/2025 | | | | 500 | | | | 482 |
|
| Southern Copper Corp. | | | | | | | | |
7.500% due 07/27/2035 | | | | 100 | | | | 96 |
| | | | | | | | |
|
Total Peru (Cost $4,874) | | | | | | | | 4,873 |
| | | | | | | | |
|
| |
| QATAR 0.1% |
| Ras Laffan Liquefied Natural Gas Co. Ltd. II |
5.298% due 09/30/2020 | | $ | | 250 | | | | 233 |
| | | | | | | | |
|
Total Qatar (Cost $250) | | | | | | | | 233 |
| | | | | | | | |
|
| |
| RUSSIA (d) 15.6% |
| Gaz Capital for Gazprom | | | | | | | | |
5.875% due 06/01/2015 | | EUR | | 200 | | | | 260 |
|
| Gazinvest Luxembourg S.A. for Gazprombank |
7.250% due 10/30/2008 | | $ | | 1,000 | | | | 1,014 |
|
| Gazprom International S.A. |
7.201% due 02/01/2020 | | | | 850 | | | | 863 |
|
| Mobile Telesystems Finance S.A. |
8.000% due 01/28/2012 | | | | 150 | | | | 147 |
|
| Morgan Stanley Bank AG for OAO Gazprom |
9.625% due 03/01/2013 | | | | 6,410 | | | | 7,358 |
|
| RSHB Capital S.A. for OJSC Russian Agricultural Bank |
7.175% due 05/16/2013 | | | | 300 | | | | 298 |
| | | | | | |
| See Accompanying Notes | | Semiannual Report | | June 30, 2006 | | 9 |
| | |
| |
| Schedule of Investments Emerging Markets Bond Portfolio (Cont.) | | |
| | | | | | | | |
| | | | | PRINCIPAL | | | | |
| | | | | AMOUNT | | | | VALUE |
| | | | | (000S) | | | | (000S) |
| |
| Russia Government International Bond |
8.250% due 03/31/2010 | | $ | | 1,111 | | $ | | 1,157 |
5.000% due 03/31/2030 | | | | 10,835 | | | | 11,557 |
|
| Sistema Finance S.A. |
10.250% due 04/14/2008 | | | | 500 | | | | 519 |
|
| UBS Luxembourg S.A. for OJSC Vimpel Communications |
8.375% due 10/22/2011 | | | | 350 | | | | 350 |
|
| UBS Luxembourg S.A. for Sberbank |
6.230% due 02/11/2015 | | | | 1,000 | | | | 982 |
|
| VTB Capital S.A. for Vneshtorgbank |
6.174% due 09/21/2007 | | | | 1,000 | | | | 1,001 |
| | | | | | | | |
|
Total Russia (Cost $26,267) | | | | 25,506 |
| | | | | | | | |
|
| |
| SOUTH AFRICA (d) 1.9% |
| South Africa Government International Bond |
7.375% due 04/25/2012 | | $ | | 310 | | | | 323 |
5.250% due 05/16/2013 | | EUR | | 400 | | | | 519 |
6.500% due 06/02/2014 | | $ | | 750 | | | | 750 |
8.500% due 06/23/2017 | | | | 1,300 | | | | 1,472 |
| | | | | | | | |
|
Total South Africa (Cost $3,158) | | | | 3,064 |
| | | | | | | | |
|
| |
| SOUTH KOREA 0.1% |
| Industrial Bank of Korea | | | | | | | | |
4.000% due 05/19/2014 | | $ | | 110 | | | | 104 |
|
| Korea Development Bank |
5.750% due 09/10/2013 | | | | 15 | | | | 15 |
|
| KT Corp. |
4.875% due 07/15/2015 | | | | 100 | | | | 91 |
| | | | | | | | |
|
Total South Korea (Cost $223) | | | | 210 |
| | | | | | | | |
|
| |
| TUNISIA (d) 1.1% |
| Banque Centrale de Tunisie |
4.750% due 04/07/2011 | | EUR | | 500 | | | | 642 |
7.375% due 04/25/2012 | | | | 1,050 | | | | 1,097 |
| | | | | | | | |
|
Total Tunisia (Cost $1,748) | | | | 1,739 |
| | | | | | | | |
|
| |
| UKRAINE (d) 3.3% |
| Dresdner Bank AG for Kyivstar GSM |
7.750% due 04/27/2012 | | $ | | 1,000 | | | | 967 |
|
| Ukraine Government International Bond |
11.000% due 03/15/2007 | | | | 133 | | | | 136 |
8.235% due 08/05/2009 | | | | 1,150 | | | | 1,208 |
6.875% due 03/04/2011 | | | | 800 | | | | 786 |
7.650% due 06/11/2013 | | | | 1,700 | | | | 1,714 |
4.950% due 10/13/2015 | | EUR | | 500 | | | | 559 |
| | | | | | | | |
|
Total Ukraine (Cost $5,519) | | | | 5,370 |
| | | | | | | | |
|
| | | | | | | | |
| UNITED STATES 0.3% |
| Hyundai Motor Manufacturing Alabama LLC |
5.300% due 12/19/2008 | | $ | | 500 | | $ | | 490 |
| | | | | | | | |
|
Total United States (Cost $499) | | | | 490 |
| | | | | | | | |
|
| |
| VENEZUELA 6.5% |
| Venezuela Government International Bond |
5.375% due 08/07/2010 | | $ | | 2,150 | | | | 2,037 |
6.090% due 04/20/2011 | | | | 1,450 | | | | 1,443 |
10.750% due 09/19/2013 | | | | 1,750 | | | | 2,092 |
8.500% due 10/08/2014 | | | | 500 | | | | 530 |
5.750% due 02/26/2016 | | | | 770 | | | | 670 |
6.000% due 12/09/2020 | | | | 1,500 | | | | 1,282 |
9.250% due 09/15/2027 | | | | 1,780 | | | | 2,105 |
9.375% due 01/13/2034 | | | | 450 | | | | 529 |
| | | | | | | | |
|
Total Venezuela (Cost $10,671) | | | | 10,688 |
| | | | | | | | |
|
| |
| VIETNAM 0.1% |
| Socialist Republic of Vietnam |
6.875% due 01/15/2016 | | $ | | 100 | | | | 100 |
| | | | | | | | |
|
Total Vietnam (Cost $98) | | | | | | | | 100 |
| | | | | | | | |
|
| |
| | | | | #OF
CONTRACTS | | | | |
| PURCHASED PUT OPTIONS 0.0% |
| 90-Day Eurodollar June Futures (CME) |
Strike @ $91.250
Exp. 06/18/2007 | | | | 70 | | | | 0 |
| | | | | | | | |
|
Total Purchased Put Options (Cost $1) | | 0 |
| | | | | | | | |
|
| |
| | | | | PRINCIPAL
AMOUNT
(000S) | | | | |
| SHORT-TERM INSTRUMENTS 22.1% |
| | | | | | | | | |
| COMMERCIAL PAPER 20.1% |
| Abbey National N.A. LLC | | | | | | | | |
5.230% due 08/08/2006 | | $ | | 3,000 | | | | 2,984 |
|
| Bank of Ireland |
5.100% due 08/23/2006 | | | | 1,700 | | | | 1,688 |
|
| Barclays U.S. Funding Corp. |
5.140% due 09/05/2006 | | | | 4,500 | | | | 4,455 |
|
| BNP Paribas Finance |
5.050% due 08/16/2006 | | | | 1,600 | | | | 1,590 |
|
| Danske Corp. |
5.280% due 07/17/2006 | | | | 3,800 | | | | 3,792 |
| | | | | | | | |
| Dexia Delaware LLC |
4.980% due 07/25/2006 | | $ | | 1,000 | | $ | | 997 |
|
| DnB NORBank ASA |
5.080% due 08/02/2006 | | | | 300 | | | | 299 |
|
| Fannie Mae |
4.958% due 09/13/2006 | | | | 1,500 | | | | 1,483 |
|
| ING U.S. Funding LLC |
5.250% due 08/08/2006 | | | | 900 | | | | 895 |
|
| Nordea N.A., Inc. |
4.880% due 07/06/2006 | | | | 1,600 | | | | 1,599 |
|
| Skandinaviska Enskilda Banken |
5.000% due 07/26/2006 | | | | 2,300 | | | | 2,293 |
|
| Societe Generale N.A. |
5.055% due 08/15/2006 | | | | 1,200 | | | | 1,193 |
5.050% due 08/16/2006 | | | | 2,700 | | | | 2,683 |
4.985% due 08/22/2006 | | | | 1,000 | | | | 993 |
|
| Spintab AB |
5.120% due 08/01/2006 | | | | 600 | | | | 598 |
|
| Svenska Handelsbanken, Inc. |
4.890% due 07/06/2006 | | | | 1,200 | | | | 1,200 |
|
| Westpac Capital Corp. |
4.970% due 07/21/2006 | | | | 4,300 | | | | 4,289 |
| | | | | | | | |
|
| | | | | | | | | 33,031 |
| | | | | | | | |
|
| |
| REPURCHASE AGREEMENT 1.7% |
| State Street Bank | | | | | | | | |
4.900% due 07/03/2006 | | | | 2,822 | | | | 2,822 |
| | | | | | | | |
|
(Dated 06/30/2006. Collateralized by Fannie Mae 5.000% due 01/15/2007 valued at $2,880. Repurchase proceeds are $2,822.) |
| |
| U.S. TREASURY BILL 0.3% (b) |
4.678% due 09/14/2006 | | | | 430 | | | | 425 |
| | | | | | | | |
|
Total Short-Term Instruments
(Cost $36,284) | | | | 36,278 |
| | | | | | | | |
|
| |
| Total Investments (a) 105.3% (Cost $172,701) | | | | | | $ | | 172,671 |
| |
| Written Options (e) (0.0%) (Premiums $25) | | | | | | | | (15) |
| |
| Other Assets and Liabilities (Net) (5.3%) | | (8,752) |
| | | | | | | | |
|
| Net Assets 100.0% | | $ | | 163,904 |
| | | | | | | | |
|
| | | | |
| 10 | | PIMCO Variable Insurance Trust | | See Accompanying Notes |
| | |
| |
| | | June 30, 2006 (Unaudited) |
| | | | | | | | | | |
Notes to Schedule of Investments (amounts in thousands, except number of contracts): | |
(a) As of June 30, 2006, portfolio securities with an aggregate market value of $148 were valued in good faith and pursuant to guidelines established by the Board of Trustees. | |
| | | | | | | | | | | |
(b) Securities with an aggregate market value of $425 have been segregated with the custodian to cover margin requirements for the following open futures contracts on June 30, 2006: | |
| | | | | | | | | | | |
| | | | |
| Description | | Type | | Expiration
Month | | # of
Contracts | | Unrealized
(Depreciation) | |
90-Day Eurodollar December Futures | | Long | | 12/2007 | | 32 | | $ | (27 | ) |
90-Day Eurodollar June Futures | | Long | | 06/2007 | | 132 | | | (118 | ) |
90-Day Eurodollar March Futures | | Long | | 03/2007 | | 120 | | | (114 | ) |
90-Day Eurodollar March Futures | | Long | | 03/2008 | | 32 | | | (27 | ) |
90-Day Eurodollar September Futures | | Long | | 09/2006 | | 130 | | | (101 | ) |
90-Day Eurodollar September Futures | | Long | | 09/2007 | | 32 | | | (29 | ) |
U.S. Treasury 5-Year Note September Futures | | Long | | 09/2006 | | 84 | | | (40 | ) |
| | | | | | | | |
|
|
|
| | | | | | | | | $ | (456 | ) |
| | | | | | | | |
|
|
|
| | | | | | | | | | | | | | | |
(c) Swap agreements outstanding on June 30, 2006: | |
| Interest Rate Swaps | | | | | | | | | | | | | | | |
| Counterparty | | Floating Rate Index | | Pay/Receive
Floating Rate | | Fixed Rate | | Expiration
Date | | Notional
Amount | | Unrealized
Appreciation/
(Depreciation) | |
Morgan Stanley Dean Witter & Co. | | 28-day Mexico Interbank TIIE Banxico | | Pay | | 9.920% | | 08/12/2015 | | MXN | 2,000 | | $ | 3 | |
Bank of America | | 3-month USD-LIBOR | | Pay | | 5.000% | | 12/20/2016 | | $ | 600 | | | (7 | ) |
Lehman Brothers, Inc. | | 3-month USD-LIBOR | | Pay | | 5.000% | | 12/20/2016 | | | 600 | | | (7 | ) |
| | | | | | | | | | | | | |
|
|
|
| | | | | | | | | | | | | | $ | (11 | ) |
| | | | | | | | | | | | | |
|
|
|
| | | | | | | | | | | | | | | | |
|
| Credit Default Swaps | |
| Counterparty | | Reference Entity | | Buy/Sell
Protection+ | | (Pay)/Receive
Fixed Rate | | | Expiration
Date | | Notional
Amount | | Unrealized
Appreciation/
(Depreciation) | |
Barclays Bank PLC | | Ukraine Government International Bond 7.650% due 06/11/2013 | | Sell | | 1.700% | | | 03/20/2011 | | $ | 500 | | $ | (13 | ) |
Barclays Bank PLC | | Salomon Brothers (Gazprom)
9.125% due 04/25/2007 | | Sell | | 0.940% | | | 05/20/2011 | | | 2,500 | | | (40 | ) |
Barclays Bank PLC | | Dow Jones CDX N.A. EM5 Index | | Sell | | 1.350% | | | 06/20/2011 | | | 3,000 | | | (29 | ) |
Goldman Sachs & Co. | | Russia Government International Bond, 5.000% until 03/31/2007 and 7.500% thereafter, due 03/31/2030 | | Sell | | 0.700% | | | 03/20/2007 | | | 75 | | | 0 | |
HSBC Bank USA | | Russia Government International Bond, 5.000% until 03/31/2007 and 7.500% thereafter, due 03/31/2030 | | Sell | | 0.390% | | | 09/20/2006 | | | 5,000 | | | 4 | |
J.P. Morgan Chase & Co. | | Gaz Capital S.A. 8.625% due 04/28/2034 | | Sell | | 1.000% | | | 04/20/2011 | | | 1,000 | | | (12 | ) |
J.P. Morgan Chase & Co. | | Mexico Government International Bond 11.500% due 05/15/2026 | | Sell | | 2.840% | | | 01/04/2013 | | | 1,600 | | | 186 | |
J.P. Morgan Chase & Co. | | Multiple reference entities of Gazprom | | Sell | | 1.500% | | | 04/20/2016 | | | 1,000 | | | (17 | ) |
J.P. Morgan Chase & Co. | | Petroleos Mexicanos 9.500% due 09/15/2027 | | Sell | | 1.130% | | | 04/20/2016 | | | 1,400 | | | (27 | ) |
Lehman Brothers, Inc. | | Brazilian Government International Bond 12.250% due 03/06/2030 | | Sell | | 1.770% | | | 06/20/2011 | | | 500 | | | 2 | |
Lehman Brothers, Inc. | | Russia Government International Bond, 5.000% until 03/31/2007 and 7.500% thereafter, due 03/31/2030 | | Sell | | 2.550% | | | 03/20/2014 | | | 350 | | | 38 | |
Lehman Brothers, Inc. | | Multiple reference entities of Gazprom | | Sell | | 1.330% | | | 03/20/2016 | | | 1,000 | | | (28 | ) |
Merrill Lynch & Co., Inc. | | Russia Government International Bond, 5.000% until 03/31/2007 and 7.500% thereafter, due 03/31/2030 | | Sell | | 3.160% | | | 10/02/2013 | | | 450 | | | 64 | |
Merrill Lynch & Co., Inc. | | Russia Government International Bond, 5.000% until 03/31/2007 and 7.500% thereafter, due 03/31/2030 | | Sell | | 2.310% | | | 01/21/2014 | | | 525 | | | 51 | |
Morgan Stanley Dean Witter & Co. | | Colombia Government International Bond 10.375% due 01/28/2033 | | Sell | | 0.760% | | | 03/20/2010 | | | 250 | | | (4 | ) |
Morgan Stanley Dean Witter & Co. | | Dow Jones CDX N.A. EM3 Index | | Sell | | 2.100% | | | 06/20/2010 | | | 800 | | | 44 | |
Morgan Stanley Dean Witter & Co. | | Turkey Government International Bond 11.875% due 01/15/2030 | | Buy | | (2.200% | ) | | 10/20/2010 | | | 400 | | | 8 | |
Morgan Stanley Dean Witter & Co. | | Gaz Capital S.A. 8.625% due 04/28/2034 | | Sell | | 1.050% | | | 04/20/2011 | | | 1,000 | | | (10 | ) |
Morgan Stanley Dean Witter & Co. | | Dow Jones CDX N.A. EM5 Index | | Sell | | 1.350% | | | 06/20/2011 | | | 1,000 | | | 2 | |
UBS Warburg LLC | | Brazilian Government International Bond 12.250% due 03/06/2030 | | Sell | | 1.870% | | | 06/20/2011 | | | 200 | | | 2 | |
| | | | | | | | | | | | | | |
|
|
|
| | | | | | | | | | | | | | | $ | 221 | |
| | | | | | | | | | | | | | |
|
|
|
|
| + If the Portfolio is a seller of protection and a credit event occurs, as defined under the terms of that particular swap agreement, the Portfolio will pay to the buyer of the protection an amount up to the notional value of the swap and in certain instances, take delivery of the security. As a buyer of protection, the Portfolio will generally receive from the seller of protection an amount up to the notional amount of the swap if a credit event occurs. | |
| | | | | | |
| See Accompanying Notes | | Semiannual Report | | June 30, 2006 | | 11 |
Schedule of Investments Emerging Markets Bond Portfolio (Cont.)
| | | | | | | | | | | | | | | | | |
(d) Forward foreign currency contracts outstanding on June 30, 2006: | |
| Type | | | | Principal Amount
Covered by
Contract | | Settlement
Month | | Unrealized
Appreciation | | Unrealized
(Depreciation) | | | Net Unrealized
Appreciation/
(Depreciation) | |
Buy | | BRL | | 601 | | 08/2006 | | $ | 16 | | $ | 0 | | | $ | 16 | |
Buy | | CLP | | 9,500 | | 07/2006 | | | 0 | | | 0 | | | | 0 | |
Sell | | | | 9,500 | | 07/2006 | | | 0 | | | 0 | | | | 0 | |
Buy | | | | 49,502 | | 08/2006 | | | 0 | | | (1 | ) | | | (1 | ) |
Buy | | | | 9,500 | | 09/2006 | | | 0 | | | 0 | | | | 0 | |
Buy | | CNY | | 896 | | 09/2006 | | | 0 | | | (1 | ) | | | (1 | ) |
Buy | | | | 5,553 | | 03/2007 | | | 0 | | | (5 | ) | | | (5 | ) |
Sell | | EUR | | 1,662 | | 07/2006 | | | 0 | | | (38 | ) | | | (38 | ) |
Buy | | IDR | | 3,359,122 | | 08/2006 | | | 8 | | | (5 | ) | | | 3 | |
Buy | | INR | | 7,925 | | 09/2006 | | | 0 | | | (4 | ) | | | (4 | ) |
Buy | | | | 1,143 | | 11/2006 | | | 0 | | | 0 | | | | 0 | |
Buy | | JPY | | 208,025 | | 08/2006 | | | 0 | | | (11 | ) | | | (11 | ) |
Buy | | KRW | | 98,900 | | 07/2006 | | | 3 | | | 0 | | | | 3 | |
Sell | | | | 98,900 | | 07/2006 | | | 0 | | | (1 | ) | | | (1 | ) |
Buy | | | | 75,826 | | 08/2006 | | | 1 | | | 0 | | | | 1 | |
Buy | | | | 314,285 | | 09/2006 | | | 7 | | | 0 | | | | 7 | |
Buy | | MXN | | 1,806 | | 08/2006 | | | 0 | | | (8 | ) | | | (8 | ) |
Buy | | | | 303 | | 09/2006 | | | 0 | | | (2 | ) | | | (2 | ) |
Buy | | PEN | | 158 | | 08/2006 | | | 1 | | | 0 | | | | 1 | |
Sell | | | | 158 | | 08/2006 | | | 0 | | | (1 | ) | | | (1 | ) |
Buy | | PLN | | 170 | | 08/2006 | | | 0 | | | 0 | | | | 0 | |
Buy | | | | 34 | | 09/2006 | | | 0 | | | 0 | | | | 0 | |
Buy | | | | 769 | | 11/2006 | | | 0 | | | (7 | ) | | | (7 | ) |
Buy | | RUB | | 1,289 | | 07/2006 | | | 2 | | | 0 | | | | 2 | |
Sell | | | | 1,288 | | 07/2006 | | | 0 | | | 0 | | | | 0 | |
Buy | | | | 8,121 | | 08/2006 | | | 14 | | | 0 | | | | 14 | |
Buy | | | | 1,288 | | 09/2006 | | | 0 | | | 0 | | | | 0 | |
Buy | | SGD | | 76 | | 07/2006 | | | 1 | | | 0 | | | | 1 | |
Sell | | | | 76 | | 07/2006 | | | 0 | | | 0 | | | | 0 | |
Buy | | | | 269 | | 08/2006 | | | 1 | | | 0 | | | | 1 | |
Buy | | | | 76 | | 09/2006 | | | 0 | | | 0 | | | | 0 | |
Buy | | | | 440 | | 11/2006 | | | 0 | | | (4 | ) | | | (4 | ) |
Buy | | SKK | | 2,314 | | 08/2006 | | | 3 | | | 0 | | | | 3 | |
Buy | | | | 7,374 | | 09/2006 | | | 7 | | | 0 | | | | 7 | |
Buy | | TWD | | 12,500 | | 08/2006 | | | 0 | | | (14 | ) | | | (14 | ) |
Buy | | ZAR | | 2,577 | | 08/2006 | | | 0 | | | (63 | ) | | | (63 | ) |
| | | | | | | | |
|
| |
|
|
| |
|
|
|
| | | | | | | | | $ | 64 | | $ | (165 | ) | | $ | (101 | ) |
| | | | | | | | |
|
| |
|
|
| |
|
|
|
| | | | | | | | | | | | | | |
(e) Written options outstanding on June 30, 2006: |
| Options on Exchange-Traded Futures Contracts |
| Description | | | | Exercise
Price | | Expiration
Date | | # of
Contracts | | Premium | | Value |
Call - CBOT U.S. Treasury 10-Year Note September Futures | | $108.000 | | 08/25/2006 | | 62 | | $ | 11 | | $ | 2 |
Call - CBOT U.S. 10-Year Treasury Note September Futures | | 107.000 | | 08/25/2006 | | 20 | | | 2 | | | 2 |
Put - CBOT U.S. Treasury 10-Year Note September Futures | | 103.000 | | 08/25/2006 | | 82 | | | 12 | | | 11 |
| | | | | | | | | | |
|
| |
|
|
| | | | | | | | | | | $ | 25 | | $ | 15 |
| | | | | | | | | | |
|
| |
|
|
| | | | |
| 12 | | PIMCO Variable Insurance Trust | | See Accompanying Notes |
| | |
| |
| Notes to Financial Statements | | June 30, 2006 (Unaudited) |
1. ORGANIZATION
The Emerging Markets Bond Portfolio (the “Portfolio”) is a series of the PIMCO Variable Insurance Trust (the “Trust”). The Trust is registered under the Investment Company Act of 1940 (the “Act”), as amended, as an open-end investment management company organized as a Delaware business trust on October 3, 1997. The Portfolio offers two classes of shares: Administrative and Advisor. Information presented in these financial statements pertains to the Administrative Class of the Portfolio. Certain detailed financial information for the Advisor Class is provided separately and is available upon request. The Trust is designed to be used as an investment vehicle by Separate Accounts of insurance companies that fund variable annuity contracts and variable life insurance policies and by qualified pension and retirement plans.
2. SIGNIFICANT ACCOUNTING POLICIES
The following is a summary of significant accounting policies consistently followed by the Portfolio in the preparation of its financial statements in conformity with accounting principles generally accepted in the United States of America (“GAAP”). The preparation of financial statements in accordance with GAAP requires management to make estimates and assumptions that affect the reported amounts and disclosures in the financial statements. Actual results could differ from those estimates.
Security Valuation. Portfolio securities are valued as of the close of regular trading (normally 4:00 p.m., Eastern Time) on each day that the New York Stock Exchange (“NYSE”) is open. Portfolio securities and other assets for which market quotes are readily available are stated at market value. Market value is generally determined on the basis of last reported sales prices, or if no sales are reported, based on quotes obtained from a quotation reporting system, established market makers, or pricing services. Fixed-income securities and non-exchange traded derivatives are normally valued on the basis of quotes obtained from brokers and dealers or pricing services. Prices obtained from independent pricing services use information provided by market makers or estimates of market values obtained from yield data relating to investments or securities with similar characteristics. Certain fixed-income securities purchased on a delayed-delivery basis are marked to market daily until settlement at the forward settlement date. Short-term investments having a maturity of 60 days or less are generally valued at amortized cost. Exchange traded options, futures and options on futures are valued at the settlement price determined by the relevant exchange.
Investments initially valued in currencies other than the U.S. dollar are converted to the U.S. dollar using exchange rates obtained from pricing services. As a result, the NAV of the Portfolio’s shares may be affected by changes in the value of currencies in relation to the U.S. dollar. The value of securities traded in markets outside the United States or denominated in currencies other than the U.S. dollar may be affected significantly on a day that the NYSE is closed and an investor is not able to purchase, redeem or exchange shares.
Securities and other assets for which market quotes are not readily available are valued at fair value as determined in good faith by the Board of Trustees or persons acting at their direction. The Board of Trustees has adopted methods for valuing securities and other assets in circumstances where market quotes are not readily available, and has delegated to Pacific Investment Management Company LLC (“PIMCO”) the responsibility for applying the valuation methods. In the event that market quotes are not readily available, and the security or asset cannot be valued pursuant to one of the valuation methods, the value of the security or asset will be determined in good faith by the Valuation Committee of the Board of Trustees, generally based upon recommendations provided by PIMCO.
Market quotes are considered not readily available in circumstances where there is an absence of current or reliable market-based data (e.g., trade information, bid/asked information, broker quotes), including where events occur after the close of the relevant market, but prior to the close of regular trading, that materially affect the values of the Portfolio’s securities or assets. In addition, market quotes are considered not readily available when, due to extraordinary circumstances, the exchanges or markets on which the securities trade do not open for trading for the entire day and no other market prices are available. The Board has delegated to PIMCO the responsibility for monitoring significant events that may materially affect the values of the Portfolio’s securities or assets and for determining whether the value of the applicable securities or assets should be re-evaluated in light of such significant events. When the Portfolio uses fair value pricing to determine its NAV, securities will not be priced on the basis of quotations from the primary market in which they are traded, but rather may be priced by another method that the Board of Trustees or persons acting at their direction believe accurately reflects fair value. The Trust’s policy is intended to result in a calculation of the Portfolio’s NAV that fairly reflects security values as of the time of pricing. However, fair values determined by the Board of Trustees or persons acting at their direction may not accurately reflect the price that the Portfolio could obtain for a security if it were to dispose of that security as of the time of pricing. Because foreign securities can trade on non-business days, the NAV of the Portfolio may change on days when shareholders will not be able to purchase or redeem shares. The prices used by the Portfolio may differ from the value that would be realized if the securities were sold and the differences could be material to the financial statements.
Securities Transactions and Investment Income. Securities transactions are recorded as of the trade date. Securities purchased or sold on a when-issued or delayed-delivery basis may be settled a month or more after the trade date. Realized gains and losses from securities sold are recorded on the identified cost basis. Dividend income is recorded on the ex-dividend date, except certain dividends from foreign securities where the ex-dividend date may have passed, which are recorded as soon as the Portfolio is informed of the ex-dividend date. Interest income, adjusted for the accretion of discounts and amortization of premiums, is recorded on the accrual basis. Paydown gains and losses on mortgage-related or asset-backed securities are recorded as components of interest income in the Statement of Operations.
Dividends and Distributions to Shareholders. Dividends from net investment income, if any, are declared on each day the Portfolio is open for business and are distributed to shareholders monthly. Net realized capital gains earned by the Portfolio, if any, will be distributed no less frequently than once each year. Most shareholders choose to reinvest their dividends and capital gain distribution in additional shares of the Portfolio.
Income dividends and capital gain distributions are determined in accordance with income tax regulations which may differ from GAAP. Differences between tax regulations and GAAP may change the fiscal year when income and capital items are recognized for tax and GAAP purposes. Examples of events that give rise to timing differences include wash sales, straddles, net operating losses and capital loss carryforwards. Further, the character of investment income and capital gains may be different for certain transactions under the two methods of accounting. Examples of characterization differences include the treatment of mortgage paydowns, swaps, foreign currency transactions and contingent debt instruments. As a result, income dividends and capital gain distributions declared during a fiscal period may differ significantly from the net investment income and realized capital gain reported in the Portfolio’s annual financial statements presented under GAAP.
Distributions classified as a tax basis return of capital, if any, are reflected in the accompanying Statements of Changes in Net Assets and have been reclassified to paid in capital. In addition, other amounts have been reclassified between undistributed net investment income, accumulated undistributed net realized gains or losses and/or paid in capital to more appropriately conform financial accounting to tax characterizations of dividend distributions.
| | | | | | |
| | | Semiannual Report | | June 30, 2006 | | 13 |
Notes to Financial Statements (Cont.)
Loan Participations and Assignments. The Portfolio may invest in direct debt instruments which are interests in amounts owned by corporate, governmental, or other borrowers to lenders or lending syndicates. The Portfolio’s investments in loans may be in the form of participations in loans or assignments of all or a portion of loans from third parties. A loan is often administered by a bank or other financial institution (the “lender”) that acts as agent for all holders. The agent administers the terms of the loan, as specified in the loan agreement. When investing in a loan participation, the Portfolio has the right to receive payments of principal, interest and any fees to which it is entitled only from the lender selling the loan agreement and only upon receipt by the lender of payments from the borrower. The Portfolio generally has no right to enforce compliance with the terms of the loan agreement with the borrower. As a result, the Portfolio may be subject to the credit risk of both the borrower and the lender that is selling the loan agreement. When the Portfolio purchases assignments from lenders it acquires direct rights against the borrower on the loan. At the end of the period, the Portfolio had no unfunded loan commitments.
Delayed-Delivery Transactions. The Portfolio may purchase or sell securities on a when-issued or delayed-delivery basis. These transactions involve a commitment by the Portfolio to purchase or sell securities for a predetermined price or yield, with payment and delivery taking place beyond the customary settlement period. When delayed-delivery purchases are outstanding, the Portfolio will designate liquid assets in an amount sufficient to meet the purchase price. When purchasing a security on a delayed-delivery basis, the Portfolio assumes the rights and risks of ownership of the security, including the risk of price and yield fluctuations, and takes such fluctuations into account when determining its net asset value. The Portfolio may dispose of or renegotiate a delayed-delivery transaction after it is entered into, and may sell when-issued securities before they are delivered, which may result in a capital gain or loss. When the Portfolio has sold a security on a delayed-delivery basis, the Portfolio does not participate in future gains and losses with respect to the security.
Federal Income Taxes. The Portfolio intends to qualify as a regulated investment company under sub-chapter M of the Internal Revenue Code and distribute all of its taxable income and net realized gains, if applicable, to shareholders. Accordingly, no provision for Federal income taxes has been made.
Foreign Currency. The accounting records of the Portfolio are maintained in U.S. dollar. The market values of foreign securities, currency holdings and other assets and liabilities are translated into U.S. dollar based on the current exchange rates each business day. Fluctuations in the value of currency holdings and other assets and liabilities resulting from changes in exchange rates are recorded as unrealized foreign currency gains or losses. Realized gains or losses and unrealized appreciation or depreciation on investment securities and income and expenses are translated on the respective dates of such transactions. The effects of changes in foreign currency exchange rates on investments in securities are not segregated in the Statement of Operations from the effects of changes in market prices of those securities, but are included with the net realized and unrealized gain or loss on investment securities.
| | | | | | |
|
Non-U.S. currency symbols utilized throughout the report are defined
as follows: |
| BRL | | Brazilian Real | | MXN | | Mexican Peso |
| CLP | | Chilean Peso | | PEN | | Peruvian New Sol |
| CNY | | Chinese Yuan Renminbi | | PLN | | Polish Zloty |
| EUR | | Euro | | RUB | | Russian Ruble |
| IDR | | Indonesian Rupiah | | SGD | | Singapore Dollar |
| INR | | Indian Rupee | | SKK | | Slovakian Koruna |
| JPY | | Japanese Yen | | TWD | | Taiwan Dollar |
| KRW | | South Korean Won | | ZAR | | South African Rand |
Forward Currency Transactions. The Portfolio may enter into forward currency contracts in connection with settling planned purchases or sales of securities, to hedge the currency exposure associated with some or all of the Portfolio’s securities or as a part of an investment strategy. A forward currency contract is an agreement between two parties to buy and sell a currency at a set price on a future date. The market value of a forward currency contract fluctuates with changes in forward currency exchange rates. Forward currency contracts are marked to market daily and the change in value is recorded by the Portfolio as an unrealized gain or loss. Realized gains or losses equal to the difference between the value of the contract at the time it was opened and the value at the time it was closed are recorded upon delivery or receipt of the currency or, if a forward currency contract is offset by entering into another forward currency contract with the same broker, upon settlement of the net gain or loss. These contracts may involve market risk in excess of the unrealized gain or loss reflected in the Portfolio’s Statement of Assets and Liabilities. In addition, the Portfolio could be exposed to risk if the counterparties are unable to meet the terms of the contracts or if the value of the currency changes unfavorably to the U.S. dollar
Futures Contracts. The Portfolio is authorized to enter into futures contracts. The Portfolio may use futures contracts to manage its exposure to the securities markets or to movements in interest rates and currency values. The primary risks associated with the use of futures contracts are the imperfect correlation between the change in market value of the securities held by the Portfolio and the prices of futures contracts, the possibility of an illiquid market, and the inability of the counterparty to meet the terms of the contract. Futures contracts are valued based upon their quoted daily settlement prices. Upon entering into a futures contract, the Portfolio is required to deposit with its custodian, in a segregated account in the name of the futures broker, an amount of cash or U.S. Government and Agency Obligations in accordance with the initial margin requirements of the broker or exchange. Futures contracts are marked to market daily and an appropriate payable or receivable for the change in value (“variation margin”) is recorded by the Portfolio. Gains or losses are recognized but not considered realized until the contracts expire or are closed. Futures contracts involve, to varying degrees, risk of loss in excess of the variation margin disclosed in the Statement of Assets and Liabilities.
Options Contracts. The Portfolio may write call and put options on futures, swaps, securities or currencies it owns or in which it may invest. Writing put options tends to increase the Portfolio’s exposure to the underlying instrument. Writing call options tends to decrease the Portfolio’s exposure to the underlying instrument. When the Portfolio writes a call or put option, an amount equal to the premium received is recorded as a liability and subsequently marked to market to reflect the current value of the option written. These liabilities are reflected as written options outstanding in the Statement of Assets and Liabilities. Certain options may be written with premiums to determined on a future date. The premiums for these options are based upon implied volatility parameters at specified terms. Premiums received from writing options which expire are treated as realized gains. Premiums received from writing options which are exercised or closed are added to the proceeds or offset against amounts paid on the underlying future, swap, security or currency transaction to determine the realized gain or loss. The Portfolio as a writer of an option has no control over whether the underlying future, swap, security or currency may be sold (call) or purchased (put) and as a result bears the market risk of an unfavorable change in the price of the future, swap, security or currency underlying the written option. There is the risk the Portfolio may not be able to enter into a closing transaction because of an illiquid market.
The Portfolio may also purchase put and call options. Purchasing call options tends to increase the Portfolio’s exposure to the underlying instrument. Purchasing put options tends to decrease the Portfolio’s exposure to the underlying instrument. The Portfolio pays a premium which is included in the Portfolio’s Statement of
| | | | |
| 14 | | PIMCO Variable Insurance Trust | | |
| | |
| |
| | | June 30, 2006 (Unaudited) |
Assets and Liabilities as an investment and subsequently marked to market to reflect the current value of the option. Premiums paid for purchasing options which expire are treated as realized losses. Certain options may be purchased with premiums to be determined on a future date. The premiums for these options are based upon implied volatility parameters at specified terms. The risk associated with purchasing put and call options is limited to the premium paid. Premiums paid for purchasing options which are exercised or closed are added to the amounts paid or offset against the proceeds on the underlying future, swap, security or currency transaction to determine the realized gain or loss.
Repurchase Agreements. The Portfolio may engage in repurchase transactions. Under the terms of a typical repurchase agreement, the Portfolio takes possession of an underlying debt obligation subject to an obligation of the seller to repurchase, and the Portfolio to resell, the obligation at an agreed-upon price and time. The market value of the collateral must be equal to or exceed at all times the total amount of the repurchase obligations, including interest. Securities purchased under repurchase agreements are reflected as an asset in the Statement of Assets and Liabilities. Generally, in the event of counterparty default, the Portfolio has the right to use the collateral to offset losses incurred. If the counterparty should default, the Portfolio will seek to sell the securities which it holds as collateral. This could involve procedural costs or delays in addition to a loss on the securities if their value should fall below their repurchase price.
Swap Agreements. The Portfolio may engage in swap transactions, including, but not limited to, swap agreements on interest rate, total return, forward spread-lock and credit default to manage its exposure to interest rates and credit risk. In connection with these agreements, securities may be identified as collateral in accordance with the terms of the respective swap agreements.
Interest rate swap agreements involve the exchange by the Portfolio with another party of their respective commitments to pay or receive interest, e.g., an exchange of floating rate payments for fixed rate payments with respect to the notional amount of principal.
Credit default swap agreements involve one party making a stream of payments to another party in exchange for the right to receive a specified return in the event of a default by a third party, typically corporate issues or sovereign issues of an emerging country, on its obligation. The Portfolio may use credit default swaps to provide a measure of protection against defaults of the issuers (i.e., to reduce risk where the Portfolio owns or has exposure to the sovereign issuer) or to take an active long or short position with respect to the likelihood of a particular issuer’s default. As a seller of protection, the Portfolio generally receives an upfront payment or a fixed rate of income throughout the term of the swap provided that there is no credit event. If the Portfolio is a seller of protection and a credit event occurs, as defined under the terms of that particular swap agreement, the Portfolio will pay to the buyer of the protection an amount up to the notional value of the swap and in certain instances take delivery of the security. As the seller, the Portfolio would effectively add leverage to its portfolio because, in addition to its total net assets, the Portfolio would be subject to investment exposure on the notional amount of the swap. As a buyer of protection, the Portfolio generally receives an amount up to the notional value of the swap if a credit event occurs. The treatment of a credit default swaps and other swap agreements that provide for contingent, non-periodic, bullet-type payments as “notional principal contracts” for federal income tax purposes is uncertain. Were the Internal Revenue Service in take the position that a credit default swap or other bullet-type swap is not a “notional principal contract” for federal income tax purposes, payments received by the Portfolio from such investments might be subject to income taxes.
Swaps are marked to market daily based upon quotations from market makers and the change in value, if any, is recorded as unrealized gain or loss in the Statement of Operations. Payments received or made at the beginning of the measurement period are reflected as such in the Statement of Assets and Liabilities. These upfront payments are recorded as realized gain or loss in the Statement of Operations upon termination or maturity of the swap. A liquidation payment received or made at the termination of the swap is recorded as realized gain or loss in the Statement of Operations. Net periodic payments received by the Portfolio are included as part of realized gain or loss in the Statement of Operations. Entering into these agreements involves, to varying degrees, elements of credit, market and documentation risk in excess of the amounts recognized in the Statement of Assets and Liabilities. Such risks involve the possibility that there will be no liquid market for these agreements, that the counterparty to the agreements may default on its obligation to perform or disagree as to the meaning of contractual terms in the agreements and that there may be unfavorable changes in interest rates.
Guarantees and Indemnifications. Under the Trust’s organizational documents, each Trustee, officer, employee or other agent of the Trust (including the Trust’s investment manager) is indemnified against certain liabilities that may arise out of performance of their duties to the Portfolio. Additionally, in the normal course of business, the Portfolio enters into contracts that contain a variety of indemnification clauses. The Portfolio’s maximum exposure under these arrangements is unknown as this would involve future claims that may be made against the Portfolio that have not yet occurred. However, the Portfolio has not had prior claims or losses pursuant to these contracts, and believes the risk of loss to be remote.
New Accounting Policies. In July 2006, the Financial Accounting Standards Board issued Interpretation No. 48, “Accounting for Uncertainty in Income Taxes—an Interpretation of FASB Statement No. 109” (the “Interpretation”). The Interpretation is effective for fiscal years beginning after December 15, 2006. Management is currently evaluating the application of the Interpretation to the Portfolio and will provide additional information in relation to the Interpretation in the Portfolio’s annual financial statements for the year ending December 31, 2006.
3. FEES, EXPENSES, AND RELATED PARTY TRANSACTIONS
Investment Advisory Fee. PIMCO is a majority-owned subsidiary of Allianz Global Investors of America L.P. (“AGI”), and serves as investment adviser (the “Adviser”) to the Trust, pursuant to an investment advisory contract. The Adviser receives a monthly fee at an annual rate based on average daily net assets of the Portfolio. The Advisory Fee is charged at an annual rate of 0.45%.
Administration Fee. PIMCO serves as administrator (the “Administrator”), and provides administrative services to the Trust for which it receives a monthly administrative fee based on average daily net assets of the Portfolio. As the Administrator, PIMCO bears the costs of various third-party services, including audit, custodial, portfolio accounting, legal, transfer agency and printing costs. The Administration Fee is charged at the annual rate of 0.40%.
Distribution and Servicing Fees. Allianz Global Investors Distributors LLC (“AGID”) is an indirect wholly-owned subsidiary of AGI and serves as the distributor of the Trust’s shares. The Trust is permitted to reimburse AGID on a quarterly basis, out of the Administrative Class assets of the Portfolio in the amount of 0.15% on an annual basis of the average daily net assets of that class, for payments made to financial intermediaries that provide services in connection with the distribution of shares or administration of plans or programs that use Portfolio shares as their funding medium. The effective rate paid to AGID was 0.15% during the current fiscal year.
Expenses. The Trust is responsible for the following expenses: (i) salaries and other compensation of any of the Trust’s executive officers and employees who are not officers, directors, stockholders or employees of PIMCO or its subsidiaries or affiliates; (ii) taxes and governmental fees; (iii) brokerage fees and commissions and other portfolio transaction expenses; (iv) the costs of borrowing money,
| | | | | | |
| | | Semiannual Report | | June 30, 2006 | | 15 |
Notes to Financial Statements (Cont.)
including interest expenses and bank overdraft charges; (v) fees and expenses of the Trustees who are not “interested persons” of PIMCO or the Trust, and any counsel retained exclusively for their benefit; (vi) extraordinary expenses, including costs of litigation and indemnification expenses; (vii) organization expenses and (viii) any expenses allocated or allocable to a specific class of shares, which include service fees payable with respect to the Administrative Class shares and may include certain other expenses as permitted by the Trust’s Multiple Class Plan adopted pursuant to Rule 18f-3 under the Act and subject to review and approval by the Trustees. The ratio of expenses to average net assets per share class, as disclosed in the Financial Highlights, may differ from the annual portfolio operating expenses per share class as disclosed in the Prospectus for the reasons set forth above.
For the current period ended June 30, 2006, each unaffiliated Trustee received an annual retainer of $15,000, plus $2,000 for each Board of Trustees quarterly meeting attended, $500 for each Board of Trustees committee meeting attended and $500 for each special board meeting attended, plus reimbursement of related expenses. In addition, each Committee Chair received an additional annual retainer of $500 and each Audit Committee Chair received an additional annual retainer of $1,500. These expenses are allocated on a pro-rata basis to each Portfolio of the Trust according to its respective net assets. The Trust pays no compensation directly to any Trustee or any other officer who is affiliated with the Administrator, all of whom receive remuneration for their services to the Trust from the Administrator or its affiliates.
4. PURCHASES AND SALES OF SECURITIES
The length of time the Portfolio has held a particular security is not generally a consideration in investment decisions. A change in the securities held by the Portfolio is known as “portfolio turnover”. The Portfolio may engage in frequent and active trading of portfolio securities to achieve its investment objective, particularly during periods of volatile market movements. High portfolio turnover (e.g., over 100%) involves correspondingly greater expenses to the Portfolio, including brokerage commissions or dealer mark-ups and other transaction costs on the sale of securities and reinvestments in other securities. Such sales may also result in realization of taxable capital gains, including short-term capital gains (which are generally taxed at ordinary income tax rates). The trading costs and tax effects associated with portfolio turnover may adversely affect the Portfolio’s performance.
Purchases and sales of securities (excluding short-term investments) for the period ended June 30, 2006 were as follows (amounts in thousands):
| | | | | | | | | | | | | | | | |
| | U.S Government/Agency | | | | | All Other |
| | Purchases | | | | | Sales | | | | | Purchases | | | | | Sales |
| $ | 3,924 | | | | $ | 2,638 | | | | $ | 224,692 | | | | $ | 205,534 |
5. TRANSACTIONS IN WRITTEN CALL AND PUT OPTIONS
Transactions in written call and put options were as follows (amounts in thousands, except number of contracts):
| | | | | | | | | |
| | | | | # of
Contracts | | | | | Premium |
Balance at 12/31/2005 | | | | 0 | | | | $ | 0 |
Sales | | | | 164 | | | | | 25 |
Closing Buys | | | | 0 | | | | | 0 |
Expirations | | | | 0 | | | | | 0 |
Exercised | | | | 0 | | | | | 0 |
Balance at 06/30/2006 | | | | 164 | | | | $ | 25 |
6. SHARES OF BENEFICIAL INTEREST
The Portfolio may issue an unlimited number of shares of beneficial interest with a $0.001 par value. Changes in shares of beneficial interest were as follows (shares and amounts in thousands):
| | | | | | | | | | | | | | | | | | |
| | | | | Six Months Ended
06/30/2006 | | | | | Year Ended
12/31/2005 | |
| | | | | Shares | | | Amount | | | | | Shares | | | Amount | |
| | | | | | |
Receipts for shares sold | | | | | | | | | | | | | | | | | | |
Administrative Class | | | | 3,851 | | | $ | 52,231 | | | | | 4,972 | | | $ | 67,244 | |
Advisor Class | | | | 8 | | | | 108 | | | | | 0 | | | | 0 | |
Issued as reinvestment of distributions | | | | | | | | | | | | | | | | | | |
Administrative Class | | | | 304 | | | | 4,103 | | | | | 500 | | | | 6,752 | |
Advisor Class | | | | 0 | | | | 0 | | | | | 0 | | | | 0 | |
Cost of shares redeemed | | | | | | | | | | | | | | | | | | |
Administrative Class | | | | (1,423 | ) | | | (19,006 | ) | | | | (618 | ) | | | (8,259 | ) |
Advisor Class | | | | (1 | ) | | | (11 | ) | | | | 0 | | | | 0 | |
Net increase resulting from
Portfolio share transactions | | | | 2,739 | | | $ | 37,425 | | | | | 4,854 | | | $ | 65,737 | |
The following schedule shows the number of shareholders each owning 5% or more of the Portfolio and the total percentage of the Portfolio held by such shareholders:
| | | | | | | |
| | | | | Number of
Shareholders | | % of Portfolio
Held | |
Administrative Class | | | | 5 | | 93 | * |
Advisor Class | | | | 2 | | 100 | |
* One of the shareholders, Allianz Life Insurance Co. of North America, is an indirect wholly owned subsidiary of AGI and a related party to the Portfolio.
7. FEDERAL INCOME TAX MATTERS
As of June 30, 2006, the aggregate cost of investments was the same for federal income tax and financial statement purposes. The net unrealized appreciation (depreciation) of investment securities for federal income tax purposes is as follows (amounts in thousands):
| | | | |
Aggregate
Gross
Unrealized
Appreciation | | Aggregate
Gross
Unrealized
(Depreciation) | | Net
Unrealized
(Depreciation) |
$ 3,249 | | $ (3,279) | | $ (30) |
8. REGULATORY AND LITIGATION MATTERS
On June 1, 2004, the Attorney General of the State of New Jersey announced that it had dismissed PIMCO from a complaint filed by the New Jersey Attorney General on February 17, 2004, and that it had entered into a settlement agreement (the “New Jersey Settlement”) with Allianz Global Investors of America L.P. (“AGI”) (formerly known as Allianz Dresdner Asset Management of America L.P.), PEA Capital LLC (an entity affiliated with PIMCO through common ownership) (“PEA”) and Allianz Global Investors Distributors LLC (“AGID”), in connection with the same matter. In the New Jersey Settlement, AGI, PEA and AGID neither admitted nor denied the allegations or conclusions of law, but did agree to pay New Jersey a civil fine of $15 million and $3 million for investigative costs and further potential enforcement initiatives against unrelated parties. They also undertook to implement certain governance changes. The complaint relating to the New Jersey Settlement alleged, among other things, that AGI, PEA and AGID had failed to disclose that they improperly allowed certain hedge funds to engage in
| | | | |
| 16 | | PIMCO Variable Insurance Trust | | |
| | |
| |
| | | June 30, 2006 (Unaudited) |
“market timing” in certain funds. The complaint sought injunctive relief, civil monetary penalties, restitution and disgorgement of profits.
Since February 2004, PIMCO, AGI, PEA, AGID, and certain of their affiliates, including the PIMCO Funds, the Allianz Funds (formerly known as PIMCO Funds: Multi-Manager Series), and the Trustees and employees of the PIMCO Funds, have been named as defendants in fifteen lawsuits filed in various jurisdictions. Eleven of those lawsuits concern “market timing,” and they have been transferred to and consolidated for pre-trial proceedings in a multi-district litigation proceeding in the U.S. District Court for the District of Maryland; the other four lawsuits concern “revenue sharing” and have been consolidated into a single action in the U.S. District Court for the District of Connecticut. The lawsuits have been commenced as putative class actions on behalf of investors who purchased, held or redeemed shares of the various series of the PIMCO Funds and the Allianz Funds during specified periods, or as derivative actions on behalf of the PIMCO Funds and Allianz Funds.
The market timing actions in the District of Maryland generally allege that certain hedge funds were allowed to engage in “market timing” in certain of the PIMCO Funds and the Allianz Funds and this alleged activity was not disclosed. Pursuant to tolling agreements entered into with the derivative and class action plaintiffs, PIMCO, the Trustees, and certain employees of PIMCO who were previously named as defendants have all been dropped as defendants in the market timing actions; the plaintiffs continue to assert claims on behalf of the shareholders of the PIMCO Funds or on behalf of the PIMCO Funds themselves against other defendants. By order dated November 3, 2005, the U.S. District Court for the District of Maryland granted the PIMCO Funds’ motion to dismiss claims asserted against it in a consolidated amended complaint where the PIMCO Funds were named, in the complaint, as a nominal defendant. The revenue sharing action in the District of Connecticut generally alleges that fund assets were inappropriately used to pay brokers to promote the PIMCO Funds and Allianz Funds, including directing fund brokerage transactions to such brokers, and that such alleged arrangements were not fully disclosed to shareholders. On August 11, 2005 the U.S. District Court for the District of Connecticut conducted a hearing on defendants’ motion to dismiss the consolidated amended complaint in the revenue sharing action but has not yet ruled on the motion to dismiss. The market timing and revenue sharing lawsuits seek, among other things, unspecified compensatory damages plus interest and, in some cases, punitive damages, the rescission of investment advisory contracts, the return of fees paid under those contracts and restitution.
Under Section 9(a) of the Investment Company Act of 1940, as amended (“1940 Act”), if the New Jersey Settlement or any of the lawsuits described above were to result in a court injunction against AGI, PEA, AGID and/or their affiliates, PIMCO could, in the absence of exemptive relief granted by the SEC, be barred from serving as an investment adviser, and AGID could be barred from serving as principal underwriter, to any registered investment company, including the Portfolios of the Trust. In connection with an inquiry from the SEC concerning the status of the New Jersey Settlement under Section 9(a), PEA, AGID, AGI and certain of their affiliates (including PIMCO) (together, the “Applicants”) have sought exemptive relief from the SEC under Section 9(c) of the 1940 Act. The SEC has granted the Applicants a temporary exemption from the provisions of Section 9(a) with respect to the New Jersey Settlement until the earlier of (i) September 13, 2006 and (ii) the date on which the SEC takes final action on their application for a permanent order. There is no assurance that the SEC will issue a permanent order.
Two nearly identical class action civil complaints have been filed in August 2005, in the Northern District of Illinois Eastern Division alleging that the plaintiffs each purchased and sold a 10-year Treasury note futures contract and suffered damages from an alleged shortage when PIMCO held both physical and futures positions in 10-year Treasury notes for its client accounts. The two actions have been consolidated into one action, and the two separate complaints have been replaced by a consolidated complaint. PIMCO is a named defendant, and the PIMCO Funds have been added as a defendant, to the consolidated action. PIMCO strongly believes the complaint (and any consolidated complaint filed hereafter) is without merit and intends to vigorously defend itself.
Certain Portfolios of the Trust were recently served in an adversary proceeding brought by the Official Committee of Asbestos Claimants of G-I Holdings, Inc. in G-I Holdings, Inc.’s bankruptcy in the District of New Jersey. PIMCO was previously named in this lawsuit and remains a defendant. The plaintiff seeks to recover for the bankruptcy estate assets that were transferred by the predecessor entity of G-I Holdings, Inc. to a wholly-owned subsidiary in 1994. The subsidiary has since issued notes, of which certain Portfolios of the Trust are alleged to be holders. The complaint alleges that in 2000, more than two hundred noteholders —including certain Portfolios of the Trust—were granted a second priority lien on the assets of the subsidiary in exchange for their consent to a refinancing transaction and the granting of a first priority lien to the lending banks. The plaintiff is seeking invalidation of the lien in favor of the noteholders and/or the value of the lien.
It is possible that these matters and/or other developments resulting from these matters could result in increased fund redemptions or other adverse consequences to the Portfolios. However, PIMCO and AGID believe that these matters are not likely to have a material adverse effect on the Portfolios or on PIMCO’s or AGID’s ability to perform their respective investment advisory or distribution services relating to the Portfolios.
| | | | | | |
| | | Semiannual Report | | June 30, 2006 | | 17 |
Investment Adviser and Administrator
Pacific Investment Management Company LLC
840 Newport Center Drive
Newport Beach, California 92660
Distributor
Allianz Global Investors Distributors LLC
2187 Atlantic Street
Stamford, Connecticut 06902
Custodian
State Street Bank & Trust Company
801 Pennsylvania
Kansas City, Missouri 64105
Transfer Agent
Boston Financial Data Services–Midwest
330 W. 9th Street
Kansas City, Missouri 64105
Legal Counsel
Dechert LLP
1775 I Street, N.W.
Washington, D.C. 20006
Independent Registered Public Accounting Firm
PricewaterhouseCoopers LLP
1055 Broadway
Kansas City, Missouri 64105
P I M C O

Share Class Advisor
Semiannual Report June 30, 2006
PIMCO Variable Insurance Trust
Emerging Markets Bond Portfolio
Table of Contents
This material is authorized for use only when preceded or accompanied by the current PIMCO Variable Insurance Trust (the “Trust”) prospectus. Investors should consider the investment objectives, risks, charges and expenses of this Trust carefully before investing. Ask your financial professional to explain all charges that may apply. This and other information is contained in the Trust’s prospectus. The variable product prospectus may be obtained by contacting your Investment Consultant. Please read the Trust and variable product prospectus carefully before you invest or send money.
Chairman’s Letter
Dear PIMCO Variable Insurance Trust Shareholder:
It is our pleasure to present to you the semiannual report for the PIMCO Variable Insurance Trust covering the six-month period ended June 30, 2006.
Highlights of the global bond markets during the six-month period included:
| | n | | Most fixed-income sectors lost ground during the first half of 2006, as concern about accelerating inflation and central bank tightening pushed interest rates higher worldwide. The benchmark Lehman Brothers Aggregate Bond Index (which includes Treasury, Investment-Grade Corporate, and Residential Mortgage-Backed Securities) returned -0.72% for the first six months of the year. On June 30, the benchmark ten-year Treasury yielded 5.14%, 0.75% higher than at the start of the year. The U.S. yield curve remained flat as shorter-maturity yields rose by a comparable amount. |
| | n | | The Federal Reserve tightened four times during the reporting period, bringing the Federal Funds Rate to 5.25%. The increase near the end of the period was the Federal Reserve’s 17th consecutive rate hike since the start of its tightening cycle in 2004. The Federal Reserve was not alone, as central banks in Europe, India, and China tightened credit in unison for the first time since 2000. The Bank of Japan, whose zero-interest-rate policy has flooded global markets with liquidity, looked set to reverse this policy in the coming months. |
In these pages please find a more complete Portfolio review as it relates to financial-market activities, as well as details about total-return investment performance for the six-month reporting period. Thank you for the trust you have placed in us. We will continue to work diligently to meet your investment needs.
Sincerely,
Brent R. Harris
Chairman, PIMCO Variable Insurance Trust
July 31, 2006
| | | | | | |
| | | Semiannual Report | | June 30, 2006 | | 1 |
Important Information About the Portfolios
PIMCO Variable Insurance Trust (the “Trust”) is an open-end investment company currently consisting of nineteen separate investment portfolios, including the Emerging Markets Bond Portfolio (the “Portfolio”). The Portfolio is only available as a funding vehicle under variable life insurance policies or variable annuity contracts issued by insurance companies (“Variable Contracts”). Individuals may not purchase shares of the Portfolio directly. Shares of the Portfolio also may be sold to qualified pension and retirement plans outside of the separate account context.
We believe that bond funds have an important role to play in a well diversified investment portfolio. It is important to note, however, that in an environment where interest rates may trend upward, rising rates would negatively impact the performance of most bond funds, and fixed-income securities held by a fund are likely to decrease in value. The price volatility of fixed-income securities can also increase during periods of rising interest rates resulting in increased losses to a fund. Bond funds and individual bonds with a longer duration (a measure of the expected life of a security) tend to be more sensitive to changes in interest rates, usually making them more volatile than securities or funds with shorter durations. The longer-term performance of most bond funds has benefited from capital gains in part resulting from an extended period of declining interest rates. In the event interest rates increase, these capital gains should not be expected to recur.
The Portfolio may be subject to various risks in addition to those described above. Some of these risks may include, but are not limited to, the following: credit risk, high yield risk, market risk, issuer risk, liquidity risk, derivatives risk, mortgage risk, non-U.S. investment risk, emerging markets risk, currency risk, issuer non-diversification risk, leveraging risk and management risk. A complete description of these risks is contained in the Portfolio’s prospectus. The Portfolio may use derivative instruments for hedging purposes or as part of an investment strategy. Use of these instruments may involve certain costs and risks such as liquidity risk, interest rate risk, market risk, credit risk, management risk and the risk that the Portfolio could not close out a position when it would be most advantageous to do so. A Portfolio investing in derivatives could lose more than the principal amount invested in these instruments. Investing in non-U.S. securities may entail risk due to non-U.S. economic and political developments; this risk may be increased when investing in emerging markets.
On the performance summary page in this Semiannual Report, the Total Return Investment Performance table measures performance assuming that all dividend and capital gain distributions were reinvested.
An investment in the Portfolio is not a deposit of a bank and is not guaranteed or insured by the Federal Deposit Insurance Corporation or any other government agency. It is possible to lose money on investments in the Portfolio.
PIMCO has adopted written proxy voting policies and procedures (“Proxy Policy”) as required by Rule 206(4)-6 under the Investment Advisers Act of 1940. The Proxy Policy has been adopted by the Trust as the policies and procedures that PIMCO will use when voting proxies on behalf of the Portfolio. Copies of the written Proxy Policy and the factors that PIMCO may consider in determining how to vote proxies for the Portfolio, and information about how the Portfolio voted proxies relating to portfolio securities held during the most recent twelve-month period ended June 30, are available without charge, upon request, by calling the Trust at 1-866-746-2606 and on the Securities and Exchange Commission’s (“SEC”) website at http://www.sec.gov.
The Portfolio files its complete schedule of portfolio holdings with the SEC for the first and third quarters of each fiscal year on Form N-Q. A copy of the Trust’s Form N-Q is available on the SEC’s website at http://www.sec.gov and may be reviewed and copied at the SEC’s Public Reference Room in Washington D.C. Information on the operation of the Public Reference Room may be obtained by calling 1-800-SEC-0330.
PIMCO Variable Insurance Trust is distributed by Allianz Global Investors Distributors LLC, 2187 Atlantic Street, Stamford, CT 06902.
| | | | |
| 2 | | PIMCO Variable Insurance Trust | | |
The following disclosure provides important information regarding the Portfolio’s Expense Example (“Example” or “Expense Example”), which appears in this Semiannual Report. Please refer to this information when reviewing the Expense Example for the Portfolio.
Example
As a shareholder of the Portfolio, you incur two types of costs: (1) transaction costs and (2) ongoing costs, including advisory and administrative fees; distribution and/or service (12b-1) fees (Administrative Class only); and other Portfolio expenses. The Example is intended to help you understand your ongoing costs (in dollars) of investing in the Portfolio and to compare these costs with the ongoing costs of investing in other mutual funds. The Expense Example does not reflect any fees or other expenses imposed by the Variable Contracts. If it did, the expenses reflected in the Expense Examples would be higher. The Example is based on an investment of $1,000 invested at the beginning of the period and held for the entire period indicated, which is from January 1, 2006 to June 30, 2006.
Actual Expenses
The information in the table under the heading “Actual Performance” provides information about actual account values and actual expenses. You may use the information in these columns, together with the amount you invested, to estimate the expenses that you paid over the period. Simply divide your account value by $1,000 (for example, an $8,600 account value divided by $1,000 = 8.60), then multiply the result by the number in the appropriate column for your share class, in the row titled “Expenses Paid During Period” to estimate the expenses you paid on your account during this period.
Hypothetical Example for Comparison Purposes
The information in the table under the heading “Hypothetical Performance (5% return before expenses)” provides information about hypothetical account values and hypothetical expenses based on the Portfolio’s actual expense ratio and an assumed rate of return of 5% per year before expenses, which is not the Portfolio’s actual return. The hypothetical account values and expenses may not be used to estimate the actual ending account balance or expenses you paid for the period. You may use this information to compare the ongoing costs of investing in the Portfolio and other portfolios. To do so, compare this 5% hypothetical example with the 5% hypothetical examples that appear in the shareholder reports of the other portfolios.
Please note that the expenses shown in the table are meant to highlight your ongoing costs only and do not reflect any transactional costs. Therefore, the information under the heading “Hypothetical Performance (5% return before expenses)” is useful in comparing ongoing costs only, and will not help you determine the relative total costs of owning different portfolios. In addition, if these transactional costs were included, your costs would have been higher.
The expense ratio may vary period to period because of various factors, such as an increase in expenses not covered by the advisory and administrative fees (such as expenses of the trustees and their counsel or litigation expense).
Portfolio Benchmark
JPMorgan EMBI Global tracks total returns for United States Dollar denominated debt instruments issued by emerging market sovereign and quasi-sovereign entities. Brady bonds, loans, Eurobonds and local market instruments. This index only tracks the particular region or country. It is not possible to invest directly in this index.
| | | | | | |
| | | Semiannual Report | | June 30, 2006 | | 3 |
|
|
| PIMCO Emerging Markets Bond Portfolio |
|
Cumulative Returns Through June 30, 2006
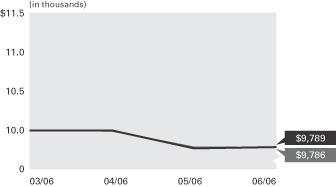
Emerging Markets Bond JPMorgan Emerging
Portfolio Advisor Class Markets Global Index
----------------------- --------------------
03/31/2006 $10,000 $10,000
04/30/2006 10,003 9,991
05/31/2006 9,773 9,787
06/30/2006 9,789 9,786
$10,000 invested at the beginning of the first full month following the inception date of the Portfolio’s Advisor Class.
Country Allocation‡
| | |
Short-Term Instruments | | 21.0% |
Brazil | | 20.2% |
Russia | | 14.8% |
Mexico | | 12.8% |
Venezuela | | 6.2% |
Other | | 25% |
| | ‡ | % of Total Investments as of June 30, 2006 |
| | | | | | |
| Cumulative Total Return for the period ended June 30, 2006 |
| | | | | | | Since
Inception
(03/31/06) |
| | |
| | PIMCO Emerging Markets Bond Portfolio Advisor Class | | -2.11% |
| | |
| | JPMorgan Emerging Markets Bond Global Index | | -2.14% |
Past performance is no guarantee of future results. The performance quoted represents past performance. Investment return and principal value will fluctuate so that Fund shares, when redeemed, may be worth more or less than their original cost. The Portfolio’s performance does not reflect the deduction of additional charges and expenses imposed in connection with investing in Variable Contracts, which will reduce returns. Current performance may be lower or higher than the performance data quoted. Performance data current to the most recent month-end is available by calling (800) 927-4648.
| | | | | | | | | | |
| Expense Example | | | | Actual Performance | | | | Hypothetical Performance |
| | | | | | | | | (5% return before expenses) |
Beginning Account Value (03/31/06) | | | | $ | 1,000.00 | | | | $ | 1,000.00 |
Ending Account Value (06/30/06) | | | | $ | 978.90 | | | | $ | 1,009.70 |
Expenses Paid During Period† | | | | $ | 2.87 | | | | $ | 2.91 |
† Expenses are equal to the Portfolio’s Advisor Class annualized expense ratio of 1.15%, multiplied by the average account value over the period, multiplied by 92/365 (to reflect the period since the Portfolio’s Advisor Class shares commenced operations on 03/31/06). Overall fees and expenses of investing in the Portfolio will be higher because the example does not reflect Variable Contract fees and expenses.
Please refer to page 3 herein for a description of the Portfolio’s benchmark and an explanation of the information presented in the above Expense Example.
Portfolio Insights
| » | | The PIMCO Emerging Markets Bond Portfolio seeks to achieve its investment objective by investing at least 80% of its assets in Fixed- Income Securities of issuers that economically are tied to countries with emerging securities markets. |
| » | | An overweight position in Brazil was positive; Brazil outperformed the index on the back of external debt buybacks and ratings upgrades from S&P and Fitch. |
| » | | An overweight to Ecuador was positive; debt buybacks, a high spread cushion and supportive crude oil prices helped to balance political noise. The Ecuador sub-index rallied strongly in Q1 and returned 8.04% for the past six months. |
| » | | A significant underweight to Turkey was positive, especially in Q2, when Turkish spreads widened by 1.12%. Spread widening was due to worries about the country’s large current account deficit, a major sell-off in the lira, and an increasing inflation rate. |
| » | | Despite the recent shift in risk tolerance, which favored strong credits over weak credits in Q2, an underweight to Argentina was negative for the first half of the year. The country posted a return of 17.9% for the Q1, as short covering and a search for yield outweighed investor concerns over mounting inflation. Year-to-date, the sub-index has returned 10.8%. |
| » | | Underweighting the Philippines was negative; the country outperformed due to high levels of overseas remittances and news that the budget shortfall narrowed. |
| » | | Above benchmark duration in Q1 was negative as U.S. Treasury rates rose. |
| » | | An emphasis on shorter maturities was negative, as the yield curve continued to flatten in the past six months. |
| » | | A strategic allocation to emerging market currencies was positive, as attractive carry via high local interest rates was high enough to offset weakness in some EM currencies. |
| | | | |
| 4 | | PIMCO Variable Insurance Trust | | |
| | |
| |
| Financial Highlights Emerging Markets Bond Portfolio | | |
| | | | |
| Selected Per Share Data for the Period Ended: | | 03/31/2006-
06/30/2006+ | |
| |
Advisor Class | | | | |
| Net asset value beginning of period | | $ | 13.59 | |
| Net investment income (a) | | | 0.17 | |
| Net realized/unrealized (loss) on investments (a) | | | (0.46 | ) |
| Total (loss) from investment operations | | | (0.29 | ) |
| Dividends from net investment income | | | (0.17 | ) |
| Total distributions | | | (0.17 | ) |
| Net asset value end of period | | $ | 13.13 | |
| Total return | | | (2.11 | )% |
| Net assets end of period (000s) | | $ | 97 | |
| Ratio of expenses to average net assets | | | 1.15 | %* |
| Ratio of net investment income to average net assets | | | 5.44 | %* |
| Portfolio turnover rate | | | 154 | % |
+ Unaudited
* Annualized
(a) Per share amounts based on average number of shares outstanding during the period.
| | | | | | |
| See Accompanying Notes | | Semiannual Report | | June 30, 2006 | | 5 |
| | |
| |
| Statement of Assets and Liabilities Emerging Markets Bond Portfolio | | |
| | | | |
| (Amounts in thousands, except per share amounts) | | June 30, 2006
(Unaudited) | |
| |
Assets: | | | | |
Investments, at value | | $ | 172,671 | |
Cash | | | 103 | |
Foreign currency, at value | | | 74 | |
Receivable for investments sold | | | 12,533 | |
Receivable for Portfolio shares sold | | | 123 | |
Interest and dividends receivable | | | 3,022 | |
Variation margin receivable | | | 68 | |
Unrealized appreciation on forward foreign currency contracts | | | 64 | |
Unrealized appreciation on swap agreements | | | 404 | |
| | | | 189,062 | |
| |
Liabilities: | | | | |
Payable for investments purchased | | $ | 101 | |
Payable for investments purchased on delayed-delivery basis | | | 24,365 | |
Payable for Portfolio shares redeemed | | | 58 | |
Written options outstanding | | | 15 | |
Accrued investment advisory fee | | | 64 | |
Accrued administration fee | | | 57 | |
Accrued servicing fee | | | 19 | |
Swap premiums received | | | 120 | |
Unrealized depreciation on forward foreign currency contracts | | | 165 | |
Unrealized depreciation on swap agreements | | | 194 | |
| | | | 25,158 | |
| |
Net Assets | | $ | 163,904 | |
| |
Net Assets Consist of: | | | | |
Paid in capital | | $ | 159,124 | |
Undistributed net investment income | | | 2,227 | |
Accumulated undistributed net realized gain | | | 2,918 | |
Net unrealized (depreciation) | | | (365 | ) |
| | | $ | 163,904 | |
| |
Net Assets: | | | | |
Administrative Class | | $ | 163,807 | |
Advisor Class | | | 97 | |
| |
Shares Issued and Outstanding: | | | | |
Administrative Class | | | 12,478 | |
Advisor Class | | | 7 | |
| |
Net Asset Value and Redemption Price Per Share (Net Assets Per Share Outstanding) | | | | |
Administrative Class | | $ | 13.13 | |
Advisor Class | | | 13.13 | |
| |
Cost of Investments Owned | | $ | 172,701 | |
Cost of Foreign Currency Held | | $ | 73 | |
Premiums Received on Written Options | | $ | 25 | |
| | | | |
| 6 | | PIMCO Variable Insurance Trust | | See Accompanying Notes |
| | |
| |
| Statement of Operations Emerging Markets Bond Portfolio | | |
| | | | |
| (Amounts in Thousands) | | Six Months Ended
June 30, 2006
(Unaudited) | |
| |
Investment Income: | | | | |
Interest | | $ | 4,773 | |
Total Income | | | 4,773 | |
| |
Expenses: | | | | |
Investment advisory fees | | | 344 | |
Administration fees | | | 306 | |
Servicing fees – Administrative Class | | | 115 | |
Trustees’ fees | | | 1 | |
Interest expense | | | 1 | |
Total Expenses | | | 767 | |
| |
Net Investment Income | | | 4,006 | |
| |
Net Realized and Unrealized Gain (Loss): | | | | |
Net realized gain on investments | | | 1,386 | |
Net realized (loss) on futures contracts, options and swaps | | | (164 | ) |
Net realized gain on foreign currency transactions | | | 26 | |
Net change in unrealized (depreciation) on investments | | | (6,930 | ) |
Net change in unrealized (depreciation) on futures contracts, options and swaps | | | (767 | ) |
Net change in unrealized (depreciation) on translation of assets and liabilities denominated in foreign currencies | | | (117 | ) |
Net (Loss) | | | (6,566 | ) |
| |
Net (Decrease) in Net Assets Resulting from Operations | | $ | (2,560 | ) |
| | | | | | |
| See Accompanying Notes | | Semiannual Report | | June 30, 2006 | | 7 |
| | |
| |
| Statements of Changes in Net Assets Emerging Markets Bond Portfolio | | |
| | | | | | | | |
| (Amounts in Thousands) | | Six Months Ended
June 30, 2006
(Unaudited) | | | Year Ended
December 31, 2005 | |
| | |
Increase (Decrease) in Net Assets from: | | | | | | | | |
| | |
Operations: | | | | | | | | |
Net investment income | | $ | 4,006 | | | $ | 4,299 | |
Net realized gain | | | 1,248 | | | | 2,037 | |
Net change in unrealized appreciation (depreciation) | | | (7,814 | ) | | | 3,223 | |
Net increase (decrease) resulting from operations | | | (2,560 | ) | | | 9,559 | |
| | |
Distributions to Shareholders: | | | | | | | | |
| From net investment income | | | | | | | | |
Administrative Class | | | (4,103 | ) | | | (4,422 | ) |
Advisor Class | | | 0 | | | | 0 | |
| From net realized capital gains | | | | | | | | |
Administrative Class | | | 0 | | | | (2,330 | ) |
Advisor Class | | | 0 | | | | 0 | |
| | |
Total Distributions | | | (4,103 | ) | | | (6,752 | ) |
| | |
Portfolio Share Transactions: | | | | | | | | |
| Receipts for shares sold | | | | | | | | |
Administrative Class | | | 52,231 | | | | 67,244 | |
Advisor Class | | | 108 | | | | 0 | |
| Issued as reinvestment of distributions | | | | | | | | |
Administrative Class | | | 4,103 | | | | 6,752 | |
Advisor Class | | | 0 | | | | 0 | |
| Cost of shares redeemed | | | | | | | | |
Administrative Class | | | (19,006 | ) | | | (8,259 | ) |
Advisor Class | | | (11 | ) | | | 0 | |
Net increase resulting from Portfolio share transactions | | | 37,425 | | | | 65,737 | |
| | |
Total Increase in Net Assets | | | 30,762 | | | | 68,544 | |
| | |
Net Assets: | | | | | | | | |
Beginning of period | | | 133,142 | | | | 64,598 | |
End of period* | | $ | 163,904 | | | $ | 133,142 | |
| | |
*Including undistributed net investment income of: | | $ | 2,227 | | | $ | 2,324 | |
| | | | |
| 8 | | PIMCO Variable Insurance Trust | | See Accompanying Notes |
| | |
| |
| Schedule of Investments Emerging Markets Bond Portfolio | | June 30, 2006 (Unaudited) |
| | | | | | | | |
| | | | | PRINCIPAL | | | | |
| | | | | AMOUNT | | | | VALUE |
| | | | | (000S) | | | | (000S) |
| ARGENTINA 0.5% |
| Argentina Bonos |
0.000% due 08/03/2012 | | $ | | 1,000 | | $ | | 832 |
| | | | | | | | |
|
Total Argentina (Cost $829) | | 832 |
| | | | | | | | |
|
| |
| BRAZIL 21.2% |
| Brazilian Government International Bond |
10.000% due 08/07/2011 | | $ | | 1,250 | | | | 1,429 |
11.000% due 01/11/2012 | | | | 1,160 | | | | 1,386 |
10.250% due 06/17/2013 | | | | 50 | | | | 59 |
10.500% due 07/14/2014 | | | | 2,085 | | | | 2,516 |
7.875% due 03/07/2015 | | | | 3,625 | | | | 3,804 |
8.000% due 01/15/2018 | | | | 2,258 | | | | 2,388 |
8.875% due 10/14/2019 | | | | 2,250 | | | | 2,512 |
8.875% due 04/15/2024 | | | | 350 | | | | 389 |
8.750% due 02/04/2025 | | | | 1,700 | | | | 1,870 |
10.125% due 05/15/2027 | | | | 1,740 | | | | 2,166 |
12.250% due 03/06/2030 | | | | 220 | | | | 323 |
8.250% due 01/20/2034 | | | | 5,690 | | | | 5,989 |
11.000% due 08/17/2040 | | | | 7,646 | | | | 9,491 |
|
| CSN Islands VII Corp. |
10.750% due 09/12/2008 | | | | 200 | | | | 215 |
|
| Petrobras International Finance Co. |
7.750% due 09/15/2014 | | | | 250 | | | | 261 |
| | | | | | | | |
|
Total Brazil (Cost $33,593) | | 34,799 |
| | | | | | | | |
|
| |
| CAYMAN ISLANDS 0.1% |
| Banco Mercantil del Norte S.A. |
5.875% due 02/17/2014 | | $ | | 145 | | | | 144 |
| | | | | | | | |
|
Total Cayman Islands (Cost $145) | | 144 |
| | | | | | | | |
|
| |
| CHILE 0.8% |
| Chile Government International Bond |
5.625% due 07/23/2007 | | $ | | 915 | | | | 916 |
|
| Corp. Nacional del Cobre de Chile – CODELCO |
5.625% due 09/21/2035 | | | | 200 | | | | 180 |
|
| Empresa Nacional de Electricidad S.A. |
8.350% due 08/01/2013 | | | | 200 | | | | 216 |
| | | | | | | | |
|
Total Chile (Cost $1,353) | | 1,312 |
| | | | | | | | |
|
| |
| CHINA 1.3% |
| China Development Bank |
5.000% due 10/15/2015 | | $ | | 500 | | | | 467 |
|
| Export-Import Bank of China |
4.875% due 07/21/2015 | | | | 550 | | | | 507 |
|
| Panva Gas Holdings Ltd. |
8.250% due 09/23/2011 | | | | 670 | | | | 675 |
|
| Sino-Forest Corp. |
9.125% due 08/17/2011 | | | | 500 | | | | 517 |
| | | | | | | | |
|
Total China (Cost $2,279) | | 2,166 |
| | | | | | | | |
|
| |
| COLOMBIA 2.2% |
| Colombia Government International Bond |
9.750% due 04/23/2009 | | $ | | 220 | | | | 238 |
10.000% due 01/23/2012 | | | | 100 | | | | 113 |
10.750% due 01/15/2013 | | | | 400 | | | | 473 |
8.250% due 12/22/2014 | | | | 2,325 | | | | 2,453 |
10.375% due 01/28/2033 | | | | 310 | | | | 384 |
| | | | | | | | |
|
Total Colombia (Cost $3,721) | | 3,661 |
| | | | | | | | |
|
| |
| ECUADOR 3.8% |
| Ecuador Government International Bond |
9.000% due 08/15/2030 | | $ | | 6,469 | | | | 6,248 |
| | | | | | | | |
|
Total Ecuador (Cost $5,013) | | 6,248 |
| | | | | | | | |
|
| | | | | | | | |
| EGYPT 0.3% |
| Petroleum Export Ltd. |
5.265% due 06/15/2011 | | $ | | 574 | | $ | | 560 |
| | | | | | | | |
|
Total Egypt (Cost $571) | | 560 |
| | | | | | | | |
|
| |
| EL SALVADOR 0.5% |
| AES El Salvador Trust |
6.750% due 02/01/2016 | | $ | | 700 | | | | 648 |
|
| El Salvador Government International Bond |
8.500% due 07/25/2011 | | | | 150 | | | | 162 |
| | | | | | | | |
|
Total El Salvador (Cost $844) | | 810 |
| | | | | | | | |
|
| |
| GUATEMALA 0.4% |
| Guatemala Government Bond |
9.250% due 08/01/2013 | | $ | | 570 | | | | 637 |
| | | | | | | | |
|
Total Guatemala (Cost $570) | | 637 |
| | | | | | | | |
|
| |
| INDONESIA 0.7% |
| Indonesia Government International Bond |
6.875% due 03/09/2017 | | $ | | 1,200 | | | | 1,171 |
| | | | | | | | |
|
Total Indonesia (Cost $1,187) | | 1,171 |
| | | | | | | | |
|
| |
| KAZAKHSTAN 1.7% |
| ATF BANK |
9.000% due 05/11/2016 | | $ | | 150 | | | | 148 |
|
| Intergas Finance BV |
6.875% due 11/04/2011 | | | | 100 | | | | 99 |
|
| Kazakhstan Temir Zholy Finance BV |
6.500% due 05/11/2011 | | | | 300 | | | | 292 |
|
| Kazkommerts International BV |
8.500% due 04/16/2013 | | | | 250 | | | | 257 |
|
| Tengizchevroil Finance Co. SARL |
6.124% due 11/15/2014 | | | | 2,000 | | | | 1,942 |
| | | | | | | | |
|
Total Kazakhstan (Cost $2,834) | | 2,738 |
| | | | | | | | |
|
| |
| MALAYSIA 0.7% |
| Malaysia Government International Bond |
8.750% due 06/01/2009 | | $ | | 120 | | | | 129 |
7.500% due 07/15/2011 | | | | 325 | | | | 347 |
|
| Petronas Capital Ltd. |
7.000% due 05/22/2012 | | | | 325 | | | | 341 |
|
| Tenaga Nasional Bhd |
7.500% due 11/01/2025 | | | | 250 | | | | 273 |
|
| TNB Capital Ltd. |
5.250% due 05/05/2015 | | | | 100 | | | | 94 |
| | | | | | | | |
|
Total Malaysia (Cost $1,250) | | 1,184 |
| | | | | | | | |
|
| |
| MEXICO 13.4% |
| America Movil S.A. de C.V. |
5.500% due 03/01/2014 | | $ | | 200 | | | | 185 |
5.750% due 01/15/2015 | | | | 100 | | | | 93 |
|
| Mexico Government International Bond |
7.500% due 01/14/2012 | | | | 282 | | | | 300 |
5.875% due 01/15/2014 | | | | 250 | | | | 243 |
6.625% due 03/03/2015 | | | | 315 | | | | 320 |
11.375% due 09/15/2016 | | | | 25 | | | | 34 |
5.625% due 01/15/2017 | | | | 650 | | | | 606 |
8.125% due 12/30/2019 | | | | 1,324 | | | | 1,499 |
8.300% due 08/15/2031 | | | | 2,415 | | | | 2,795 |
7.500% due 04/08/2033 | | | | 1,000 | | | | 1,065 |
6.750% due 09/27/2034 | | | | 2,300 | | | | 2,242 |
| | | | | | | | |
| Pemex Project Funding Master Trust |
8.000% due 11/15/2011 | | $ | | 250 | | $ | | 265 |
7.375% due 12/15/2014 | | | | 3,015 | | | | 3,119 |
5.750% due 12/15/2015 | | | | 7,100 | | | | 6,548 |
9.250% due 03/30/2018 | | | | 977 | | | | 1,136 |
8.625% due 02/01/2022 | | | | 1,200 | | | | 1,345 |
6.625% due 06/15/2035 | | | | 250 | | | | 227 |
| | | | | | | | |
|
Total Mexico (Cost $22,894) | | 22,022 |
| | | | | | | | |
|
| |
| MOROCCO 0.1% |
| Kingdom of Morocco |
4.719% due 01/05/2009 | | $ | | 150 | | | | 149 |
| | | | | | | | |
|
Total Morocco (Cost $143) | | 149 |
| | | | | | | | |
|
| |
| NETHERLANDS 0.1% |
| HSBK Europe BV |
7.750% due 05/13/2013 | | $ | | 100 | | | | 100 |
| | | | | | | | |
|
Total Netherlands (Cost $100) | | 100 |
| | | | | | | | |
|
| |
| PAKISTAN 0.9% |
| Pakistan Government International Bond |
7.125% due 03/31/2016 | | $ | | 1,550 | | | | 1,418 |
| | | | | | | | |
|
Total Pakistan (Cost $1,534) | | 1,418 |
| | | | | | | | |
|
| |
| PANAMA 2.5% |
| Panama Government International Bond |
9.625% due 02/08/2011 | | $ | | 210 | | | | 234 |
9.375% due 07/23/2012 | | | | 1,210 | | | | 1,355 |
7.250% due 03/15/2015 | | | | 150 | | | | 152 |
7.125% due 01/29/2026 | | | | 2,165 | | | | 2,100 |
8.875% due 09/30/2027 | | | | 80 | | | | 91 |
9.375% due 04/01/2029 | | | | 200 | | | | 237 |
| | | | | | | | |
|
Total Panama (Cost $4,249) | | | | 4,169 |
| | | | | | | | |
|
| |
| PERU 3.0% |
| Peru Government International Bond |
9.125% due 01/15/2008 | | $ | | 650 | | | | 679 |
9.125% due 02/21/2012 | | | | 1,470 | | | | 1,632 |
5.000% due 03/07/2017 | | | | 2,066 | | | | 1,984 |
7.350% due 07/21/2025 | | | | 500 | | | | 482 |
|
| Southern Copper Corp. | | | | | | | | |
7.500% due 07/27/2035 | | | | 100 | | | | 96 |
| | | | | | | | |
|
Total Peru (Cost $4,874) | | | | | | | | 4,873 |
| | | | | | | | �� |
|
| |
| QATAR 0.1% |
| Ras Laffan Liquefied Natural Gas Co. Ltd. II |
5.298% due 09/30/2020 | | $ | | 250 | | | | 233 |
| | | | | | | | |
|
Total Qatar (Cost $250) | | | | | | | | 233 |
| | | | | | | | |
|
| |
| RUSSIA (d) 15.6% |
| Gaz Capital for Gazprom | | | | | | | | |
5.875% due 06/01/2015 | | EUR | | 200 | | | | 260 |
|
| Gazinvest Luxembourg S.A. for Gazprombank |
7.250% due 10/30/2008 | | $ | | 1,000 | | | | 1,014 |
|
| Gazprom International S.A. |
7.201% due 02/01/2020 | | | | 850 | | | | 863 |
|
| Mobile Telesystems Finance S.A. |
8.000% due 01/28/2012 | | | | 150 | | | | 147 |
|
| Morgan Stanley Bank AG for OAO Gazprom |
9.625% due 03/01/2013 | | | | 6,410 | | | | 7,358 |
|
| RSHB Capital S.A. for OJSC Russian Agricultural Bank |
7.175% due 05/16/2013 | | | | 300 | | | | 298 |
| | | | | | |
| See Accompanying Notes | | Semiannual Report | | June 30, 2006 | | 9 |
| | |
| |
| Schedule of Investments Emerging Markets Bond Portfolio (Cont.) | | |
| | | | | | | | |
| | | | | PRINCIPAL | | | | |
| | | | | AMOUNT | | | | VALUE |
| | | | | (000S) | | | | (000S) |
| Russia Government International Bond |
8.250% due 03/31/2010 | | $ | | 1,111 | | $ | | 1,157 |
5.000% due 03/31/2030 | | | | 10,835 | | | | 11,557 |
|
| Sistema Finance S.A. |
10.250% due 04/14/2008 | | | | 500 | | | | 519 |
|
| UBS Luxembourg S.A. for OJSC Vimpel Communications |
8.375% due 10/22/2011 | | | | 350 | | | | 350 |
|
| UBS Luxembourg S.A. for Sberbank |
6.230% due 02/11/2015 | | | | 1,000 | | | | 982 |
|
| VTB Capital S.A. for Vneshtorgbank |
6.174% due 09/21/2007 | | | | 1,000 | | | | 1,001 |
| | | | | | | | |
|
Total Russia (Cost $26,267) | | | | 25,506 |
| | | | | | | | |
|
| |
| SOUTH AFRICA (d) 1.9% |
| South Africa Government International Bond |
7.375% due 04/25/2012 | | $ | | 310 | | | | 323 |
5.250% due 05/16/2013 | | EUR | | 400 | | | | 519 |
6.500% due 06/02/2014 | | $ | | 750 | | | | 750 |
8.500% due 06/23/2017 | | | | 1,300 | | | | 1,472 |
| | | | | | | | |
|
Total South Africa (Cost $3,158) | | | | 3,064 |
| | | | | | | | |
|
| |
| SOUTH KOREA 0.1% |
| Industrial Bank of Korea | | | | | | | | |
4.000% due 05/19/2014 | | $ | | 110 | | | | 104 |
|
| Korea Development Bank |
5.750% due 09/10/2013 | | | | 15 | | | | 15 |
|
| KT Corp. |
4.875% due 07/15/2015 | | | | 100 | | | | 91 |
| | | | | | | | |
|
Total South Korea (Cost $223) | | | | 210 |
| | | | | | | | |
|
| |
| TUNISIA (d) 1.1% |
| Banque Centrale de Tunisie |
4.750% due 04/07/2011 | | EUR | | 500 | | | | 642 |
7.375% due 04/25/2012 | | | | 1,050 | | | | 1,097 |
| | | | | | | | |
|
Total Tunisia (Cost $1,748) | | | | 1,739 |
| | | | | | | | |
|
| |
| UKRAINE (d) 3.3% |
| Dresdner Bank AG for Kyivstar GSM |
7.750% due 04/27/2012 | | $ | | 1,000 | | | | 967 |
|
| Ukraine Government International Bond |
11.000% due 03/15/2007 | | | | 133 | | | | 136 |
8.235% due 08/05/2009 | | | | 1,150 | | | | 1,208 |
6.875% due 03/04/2011 | | | | 800 | | | | 786 |
7.650% due 06/11/2013 | | | | 1,700 | | | | 1,714 |
4.950% due 10/13/2015 | | EUR | | 500 | | | | 559 |
| | | | | | | | |
|
Total Ukraine (Cost $5,519) | | | | 5,370 |
| | | | | | | | |
|
| | | | | | | | |
| |
| UNITED STATES 0.3% |
| Hyundai Motor Manufacturing Alabama LLC |
5.300% due 12/19/2008 | | $ | | 500 | | $ | | 490 |
| | | | | | | | |
|
Total United States (Cost $499) | | | | 490 |
| | | | | | | | |
|
| |
| VENEZUELA 6.5% |
| Venezuela Government International Bond |
5.375% due 08/07/2010 | | $ | | 2,150 | | | | 2,037 |
6.090% due 04/20/2011 | | | | 1,450 | | | | 1,443 |
10.750% due 09/19/2013 | | | | 1,750 | | | | 2,092 |
8.500% due 10/08/2014 | | | | 500 | | | | 530 |
5.750% due 02/26/2016 | | | | 770 | | | | 670 |
6.000% due 12/09/2020 | | | | 1,500 | | | | 1,282 |
9.250% due 09/15/2027 | | | | 1,780 | | | | 2,105 |
9.375% due 01/13/2034 | | | | 450 | | | | 529 |
| | | | | | | | |
|
Total Venezuela (Cost $10,671) | | | | 10,688 |
| | | | | | | | |
|
| |
| VIETNAM 0.1% |
| Socialist Republic of Vietnam |
6.875% due 01/15/2016 | | $ | | 100 | | | | 100 |
| | | | | | | | |
|
Total Vietnam (Cost $98) | | | | | | | | 100 |
| | | | | | | | |
|
| |
| | | | | #OF
CONTRACTS | | | | |
| PURCHASED PUT OPTIONS 0.0% |
| 90-Day Eurodollar June Futures (CME) |
Strike @ $91.250
Exp. 06/18/2007 | | | | 70 | | | | 0 |
| | | | | | | | |
|
Total Purchased Put Options (Cost $1) | | 0 |
| | | | | | | | |
|
| | | | |
| | | | | PRINCIPAL
AMOUNT
(000S) | | | | |
| SHORT-TERM INSTRUMENTS 22.1% |
| | | | | | | | | |
| COMMERCIAL PAPER 20.1% |
| Abbey National N.A. LLC | | | | | | | | |
5.230% due 08/08/2006 | | $ | | 3,000 | | | | 2,984 |
|
| Bank of Ireland |
5.100% due 08/23/2006 | | | | 1,700 | | | | 1,688 |
|
| Barclays U.S. Funding Corp. |
5.140% due 09/05/2006 | | | | 4,500 | | | | 4,455 |
|
| BNP Paribas Finance |
5.050% due 08/16/2006 | | | | 1,600 | | | | 1,590 |
|
| Danske Corp. |
5.280% due 07/17/2006 | | | | 3,800 | | | | 3,792 |
| | | | | | | | |
| Dexia Delaware LLC |
4.980% due 07/25/2006 | | $ | | 1,000 | | $ | | 997 |
|
| DnB NORBank ASA |
5.080% due 08/02/2006 | | | | 300 | | | | 299 |
|
| Fannie Mae |
4.958% due 09/13/2006 | | | | 1,500 | | | | 1,483 |
|
| ING U.S. Funding LLC |
5.250% due 08/08/2006 | | | | 900 | | | | 895 |
|
| Nordea N.A., Inc. |
4.880% due 07/06/2006 | | | | 1,600 | | | | 1,599 |
|
| Skandinaviska Enskilda Banken |
5.000% due 07/26/2006 | | | | 2,300 | | | | 2,293 |
|
| Societe Generale N.A. |
5.055% due 08/15/2006 | | | | 1,200 | | | | 1,193 |
5.050% due 08/16/2006 | | | | 2,700 | | | | 2,683 |
4.985% due 08/22/2006 | | | | 1,000 | | | | 993 |
|
| Spintab AB |
5.120% due 08/01/2006 | | | | 600 | | | | 598 |
|
| Svenska Handelsbanken, Inc. |
4.890% due 07/06/2006 | | | | 1,200 | | | | 1,200 |
|
| Westpac Capital Corp. |
4.970% due 07/21/2006 | | | | 4,300 | | | | 4,289 |
| | | | | | | | |
|
| | | | | | | | | 33,031 |
| | | | | | | | |
|
| |
| REPURCHASE AGREEMENT 1.7% |
| State Street Bank | | | | | | | | |
4.900% due 07/03/2006 | | | | 2,822 | | | | 2,822 |
| | | | | | | | |
|
(Dated 06/30/2006. Collateralized by Fannie Mae 5.000% due 01/15/2007 valued at $2,880. Repurchase proceeds are $2,822.) |
| |
| U.S. TREASURY BILL 0.3% (b) |
4.678% due 09/14/2006 | | | | 430 | | | | 425 |
| | | | | | | | |
|
Total Short-Term Instruments
(Cost $36,284) | | | | 36,278 |
| | | | | | | | |
|
| |
| Total Investments (a) 105.3% (Cost $172,701) | | | | | | $ | | 172,671 |
| |
| Written Options (e) (0.0%) (Premiums $25) | | | | | | | | (15) |
| |
| Other Assets and Liabilities (Net) (5.3%) | | (8,752) |
| | | | | | | | |
|
| Net Assets 100.0% | | $ | | 163,904 |
| | | | | | | | |
|
| | | | |
| 10 | | PIMCO Variable Insurance Trust | | See Accompanying Notes |
| | |
| |
| | | June 30, 2006 (Unaudited) |
| | | | | | | | | | |
Notes to Schedule of Investments (amounts in thousands, except number of contracts): | |
(a) As of June 30, 2006, portfolio securities with an aggregate market value of $148 were valued in good faith and pursuant to guidelines established by the Board of Trustees. | |
| | | | | | | | | | | |
(b) Securities with an aggregate market value of $425 have been segregated with the custodian to cover margin requirements for the following open futures contracts on June 30, 2006: | |
| | | | | | | | | | | |
| | | | |
| Description | | Type | | Expiration
Month | | # of
Contracts | | Unrealized
(Depreciation) | |
90-Day Eurodollar December Futures | | Long | | 12/2007 | | 32 | | $ | (27 | ) |
90-Day Eurodollar June Futures | | Long | | 06/2007 | | 132 | | | (118 | ) |
90-Day Eurodollar March Futures | | Long | | 03/2007 | | 120 | | | (114 | ) |
90-Day Eurodollar March Futures | | Long | | 03/2008 | | 32 | | | (27 | ) |
90-Day Eurodollar September Futures | | Long | | 09/2006 | | 130 | | | (101 | ) |
90-Day Eurodollar September Futures | | Long | | 09/2007 | | 32 | | | (29 | ) |
U.S. Treasury 5-Year Note September Futures | | Long | | 09/2006 | | 84 | | | (40 | ) |
| | | | | | | | |
|
|
|
| | | | | | | | | $ | (456 | ) |
| | | | | | | | |
|
|
|
| | | | | | | | | | | | | | | |
(c) Swap agreements outstanding on June 30, 2006: | |
| Interest Rate Swaps | | | | | | | | | | | | | | | |
| Counterparty | | Floating Rate Index | | Pay/Receive
Floating Rate | | Fixed Rate | | Expiration
Date | | Notional
Amount | | Unrealized
Appreciation/
(Depreciation) | |
Morgan Stanley Dean Witter & Co. | | 28-day Mexico Interbank TIIE Banxico | | Pay | | 9.920% | | 08/12/2015 | | MXN | 2,000 | | $ | 3 | |
Bank of America | | 3-month USD-LIBOR | | Pay | | 5.000% | | 12/20/2016 | | $ | 600 | | | (7 | ) |
Lehman Brothers, Inc. | | 3-month USD-LIBOR | | Pay | | 5.000% | | 12/20/2016 | | | 600 | | | (7 | ) |
| | | | | | | | | | | | | |
|
|
|
| | | | | | | | | | | | | | $ | (11 | ) |
| | | | | | | | | | | | | |
|
|
|
| | | | | | | | | | | | | | | | |
|
| Credit Default Swaps | |
| Counterparty | | Reference Entity | | Buy/Sell
Protection+ | | (Pay)/Receive
Fixed Rate | | | Expiration
Date | | Notional
Amount | | Unrealized
Appreciation/
(Depreciation) | |
Barclays Bank PLC | | Ukraine Government International Bond 7.650% due 06/11/2013 | | Sell | | 1.700% | | | 03/20/2011 | | $ | 500 | | $ | (13 | ) |
Barclays Bank PLC | | Salomon Brothers (Gazprom)
9.125% due 04/25/2007 | | Sell | | 0.940% | | | 05/20/2011 | | | 2,500 | | | (40 | ) |
Barclays Bank PLC | | Dow Jones CDX N.A. EM5 Index | | Sell | | 1.350% | | | 06/20/2011 | | | 3,000 | | | (29 | ) |
Goldman Sachs & Co. | | Russia Government International Bond, 5.000% until 03/31/2007 and 7.500% thereafter, due 03/31/2030 | | Sell | | 0.700% | | | 03/20/2007 | | | 75 | | | 0 | |
HSBC Bank USA | | Russia Government International Bond, 5.000% until 03/31/2007 and 7.500% thereafter, due 03/31/2030 | | Sell | | 0.390% | | | 09/20/2006 | | | 5,000 | | | 4 | |
J.P. Morgan Chase & Co. | | Gaz Capital S.A. 8.625% due 04/28/2034 | | Sell | | 1.000% | | | 04/20/2011 | | | 1,000 | | | (12 | ) |
J.P. Morgan Chase & Co. | | Mexico Government International Bond 11.500% due 05/15/2026 | | Sell | | 2.840% | | | 01/04/2013 | | | 1,600 | | | 186 | |
J.P. Morgan Chase & Co. | | Multiple reference entities of Gazprom | | Sell | | 1.500% | | | 04/20/2016 | | | 1,000 | | | (17 | ) |
J.P. Morgan Chase & Co. | | Petroleos Mexicanos 9.500% due 09/15/2027 | | Sell | | 1.130% | | | 04/20/2016 | | | 1,400 | | | (27 | ) |
Lehman Brothers, Inc. | | Brazilian Government International Bond 12.250% due 03/06/2030 | | Sell | | 1.770% | | | 06/20/2011 | | | 500 | | | 2 | |
Lehman Brothers, Inc. | | Russia Government International Bond, 5.000% until 03/31/2007 and 7.500% thereafter, due 03/31/2030 | | Sell | | 2.550% | | | 03/20/2014 | | | 350 | | | 38 | |
Lehman Brothers, Inc. | | Multiple reference entities of Gazprom | | Sell | | 1.330% | | | 03/20/2016 | | | 1,000 | | | (28 | ) |
Merrill Lynch & Co., Inc. | | Russia Government International Bond, 5.000% until 03/31/2007 and 7.500% thereafter, due 03/31/2030 | | Sell | | 3.160% | | | 10/02/2013 | | | 450 | | | 64 | |
Merrill Lynch & Co., Inc. | | Russia Government International Bond, 5.000% until 03/31/2007 and 7.500% thereafter, due 03/31/2030 | | Sell | | 2.310% | | | 01/21/2014 | | | 525 | | | 51 | |
Morgan Stanley Dean Witter & Co. | | Colombia Government International Bond 10.375% due 01/28/2033 | | Sell | | 0.760% | | | 03/20/2010 | | | 250 | | | (4 | ) |
Morgan Stanley Dean Witter & Co. | | Dow Jones CDX N.A. EM3 Index | | Sell | | 2.100% | | | 06/20/2010 | | | 800 | | | 44 | |
Morgan Stanley Dean Witter & Co. | | Turkey Government International Bond 11.875% due 01/15/2030 | | Buy | | (2.200% | ) | | 10/20/2010 | | | 400 | | | 8 | |
Morgan Stanley Dean Witter & Co. | | Gaz Capital S.A. 8.625% due 04/28/2034 | | Sell | | 1.050% | | | 04/20/2011 | | | 1,000 | | | (10 | ) |
Morgan Stanley Dean Witter & Co. | | Dow Jones CDX N.A. EM5 Index | | Sell | | 1.350% | | | 06/20/2011 | | | 1,000 | | | 2 | |
UBS Warburg LLC | | Brazilian Government International Bond 12.250% due 03/06/2030 | | Sell | | 1.870% | | | 06/20/2011 | | | 200 | | | 2 | |
| | | | | | | | | | | | | | |
|
|
|
| | | | | | | | | | | | | | | $ | 221 | |
| | | | | | | | | | | | | | |
|
|
|
|
| + If the Portfolio is a seller of protection and a credit event occurs, as defined under the terms of that particular swap agreement, the Portfolio will pay to the buyer of the protection an amount up to the notional value of the swap and in certain instances, take delivery of the security. As a buyer of protection, the Portfolio will generally receive from the seller of protection an amount up to the notional amount of the swap if a credit event occurs. | |
| | | | | | |
| See Accompanying Notes | | Semiannual Report | | June 30, 2006 | | 11 |
Schedule of Investments Emerging Markets Bond Portfolio (Cont.)
| | | | | | | | | | | | | | | | | |
(d) Forward foreign currency contracts outstanding on June 30, 2006: | |
| Type | | | | Principal Amount
Covered by
Contract | | Settlement
Month | | Unrealized
Appreciation | | Unrealized
(Depreciation) | | | Net Unrealized
Appreciation/
(Depreciation) | |
Buy | | BRL | | 601 | | 08/2006 | | $ | 16 | | $ | 0 | | | $ | 16 | |
Buy | | CLP | | 9,500 | | 07/2006 | | | 0 | | | 0 | | | | 0 | |
Sell | | | | 9,500 | | 07/2006 | | | 0 | | | 0 | | | | 0 | |
Buy | | | | 49,502 | | 08/2006 | | | 0 | | | (1 | ) | | | (1 | ) |
Buy | | | | 9,500 | | 09/2006 | | | 0 | | | 0 | | | | 0 | |
Buy | | CNY | | 896 | | 09/2006 | | | 0 | | | (1 | ) | | | (1 | ) |
Buy | | | | 5,553 | | 03/2007 | | | 0 | | | (5 | ) | | | (5 | ) |
Sell | | EUR | | 1,662 | | 07/2006 | | | 0 | | | (38 | ) | | | (38 | ) |
Buy | | IDR | | 3,359,122 | | 08/2006 | | | 8 | | | (5 | ) | | | 3 | |
Buy | | INR | | 7,925 | | 09/2006 | | | 0 | | | (4 | ) | | | (4 | ) |
Buy | | | | 1,143 | | 11/2006 | | | 0 | | | 0 | | | | 0 | |
Buy | | JPY | | 208,025 | | 08/2006 | | | 0 | | | (11 | ) | | | (11 | ) |
Buy | | KRW | | 98,900 | | 07/2006 | | | 3 | | | 0 | | | | 3 | |
Sell | | | | 98,900 | | 07/2006 | | | 0 | | | (1 | ) | | | (1 | ) |
Buy | | | | 75,826 | | 08/2006 | | | 1 | | | 0 | | | | 1 | |
Buy | | | | 314,285 | | 09/2006 | | | 7 | | | 0 | | | | 7 | |
Buy | | MXN | | 1,806 | | 08/2006 | | | 0 | | | (8 | ) | | | (8 | ) |
Buy | | | | 303 | | 09/2006 | | | 0 | | | (2 | ) | | | (2 | ) |
Buy | | PEN | | 158 | | 08/2006 | | | 1 | | | 0 | | | | 1 | |
Sell | | | | 158 | | 08/2006 | | | 0 | | | (1 | ) | | | (1 | ) |
Buy | | PLN | | 170 | | 08/2006 | | | 0 | | | 0 | | | | 0 | |
Buy | | | | 34 | | 09/2006 | | | 0 | | | 0 | | | | 0 | |
Buy | | | | 769 | | 11/2006 | | | 0 | | | (7 | ) | | | (7 | ) |
Buy | | RUB | | 1,289 | | 07/2006 | | | 2 | | | 0 | | | | 2 | |
Sell | | | | 1,288 | | 07/2006 | | | 0 | | | 0 | | | | 0 | |
Buy | | | | 8,121 | | 08/2006 | | | 14 | | | 0 | | | | 14 | |
Buy | | | | 1,288 | | 09/2006 | | | 0 | | | 0 | | | | 0 | |
Buy | | SGD | | 76 | | 07/2006 | | | 1 | | | 0 | | | | 1 | |
Sell | | | | 76 | | 07/2006 | | | 0 | | | 0 | | | | 0 | |
Buy | | | | 269 | | 08/2006 | | | 1 | | | 0 | | | | 1 | |
Buy | | | | 76 | | 09/2006 | | | 0 | | | 0 | | | | 0 | |
Buy | | | | 440 | | 11/2006 | | | 0 | | | (4 | ) | | | (4 | ) |
Buy | | SKK | | 2,314 | | 08/2006 | | | 3 | | | 0 | | | | 3 | |
Buy | | | | 7,374 | | 09/2006 | | | 7 | | | 0 | | | | 7 | |
Buy | | TWD | | 12,500 | | 08/2006 | | | 0 | | | (14 | ) | | | (14 | ) |
Buy | | ZAR | | 2,577 | | 08/2006 | | | 0 | | | (63 | ) | | | (63 | ) |
| | | | | | | | |
|
| |
|
|
| |
|
|
|
| | | | | | | | | $ | 64 | | $ | (165 | ) | | $ | (101 | ) |
| | | | | | | | |
|
| |
|
|
| |
|
|
|
| | | | | | | | | | | | | | |
(e) Written options outstanding on June 30, 2006: |
| Options on Exchange-Traded Futures Contracts |
| Description | | | | Exercise
Price | | Expiration
Date | | # of
Contracts | | Premium | | Value |
Call - CBOT U.S. Treasury 10-Year Note September Futures | | $108.000 | | 08/25/2006 | | 62 | | $ | 11 | | $ | 2 |
Call - CBOT U.S. 10-Year Treasury Note September Futures | | 107.000 | | 08/25/2006 | | 20 | | | 2 | | | 2 |
Put - CBOT U.S. Treasury 10-Year Note September Futures | | 103.000 | | 08/25/2006 | | 82 | | | 12 | | | 11 |
| | | | | | | | | | |
|
| |
|
|
| | | | | | | | | | | $ | 25 | | $ | 15 |
| | | | | | | | | | |
|
| |
|
|
| | | | |
| 12 | | PIMCO Variable Insurance Trust | | See Accompanying Notes |
| | |
| |
| Notes to Financial Statements | | June 30, 2006 (Unaudited) |
1. ORGANIZATION
The Emerging Markets Bond Portfolio (the “Portfolio”) is a series of the PIMCO Variable Insurance Trust (the “Trust”). The Trust is registered under the Investment Company Act of 1940 (the “Act”), as amended, as an open-end investment management company organized as a Delaware business trust on October 3, 1997. The Portfolio offers two classes of shares: Administrative and Advisor. Information presented in these financial statements pertains to the Advisor Class of the Portfolio. Certain detailed financial information for the Administrative Class is provided separately and is available upon request. The Trust is designed to be used as an investment vehicle by Separate Accounts of insurance companies that fund variable annuity contracts and variable life insurance policies and by qualified pension and retirement plans.
2. SIGNIFICANT ACCOUNTING POLICIES
The following is a summary of significant accounting policies consistently followed by the Portfolio in the preparation of its financial statements in conformity with accounting principles generally accepted in the United States of America (“GAAP”). The preparation of financial statements in accordance with GAAP requires management to make estimates and assumptions that affect the reported amounts and disclosures in the financial statements. Actual results could differ from those estimates.
Security Valuation. Portfolio securities are valued as of the close of regular trading (normally 4:00 p.m., Eastern Time) on each day that the New York Stock Exchange (“NYSE”) is open. Portfolio securities and other assets for which market quotes are readily available are stated at market value. Market value is generally determined on the basis of last reported sales prices, or if no sales are reported, based on quotes obtained from a quotation reporting system, established market makers, or pricing services. Fixed-income securities and non-exchange traded derivatives are normally valued on the basis of quotes obtained from brokers and dealers or pricing services. Prices obtained from independent pricing services use information provided by market makers or estimates of market values obtained from yield data relating to investments or securities with similar characteristics. Certain fixed-income securities purchased on a delayed-delivery basis are marked to market daily until settlement at the forward settlement date. Short-term investments having a maturity of 60 days or less are generally valued at amortized cost. Exchange traded options, futures and options on futures are valued at the settlement price determined by the relevant exchange.
Investments initially valued in currencies other than the U.S. dollar are converted to the U.S. dollar using exchange rates obtained from pricing services. As a result, the NAV of the Portfolio’s shares may be affected by changes in the value of currencies in relation to the U.S. dollar. The value of securities traded in markets outside the United States or denominated in currencies other than the U.S. dollar may be affected significantly on a day that the NYSE is closed and an investor is not able to purchase, redeem or exchange shares.
Securities and other assets for which market quotes are not readily available are valued at fair value as determined in good faith by the Board of Trustees or persons acting at their direction. The Board of Trustees has adopted methods for valuing securities and other assets in circumstances where market quotes are not readily available, and has delegated to Pacific Investment Management Company LLC (“PIMCO”) the responsibility for applying the valuation methods. In the event that market quotes are not readily available, and the security or asset cannot be valued pursuant to one of the valuation methods, the value of the security or asset will be determined in good faith by the Valuation Committee of the Board of Trustees, generally based upon recommendations provided by PIMCO.
Market quotes are considered not readily available in circumstances where there is an absence of current or reliable market-based data (e.g., trade information, bid/asked information, broker quotes), including where events occur after the close of the relevant market, but prior to the close of regular trading, that materially affect the values of the Portfolio’s securities or assets. In addition, market quotes are considered not readily available when, due to extraordinary circumstances, the exchanges or markets on which the securities trade do not open for trading for the entire day and no other market prices are available. The Board has delegated to PIMCO the responsibility for monitoring significant events that may materially affect the values of the Portfolio’s securities or assets and for determining whether the value of the applicable securities or assets should be re-evaluated in light of such significant events. When the Portfolio uses fair value pricing to determine its NAV, securities will not be priced on the basis of quotations from the primary market in which they are traded, but rather may be priced by another method that the Board of Trustees or persons acting at their direction believe accurately reflects fair value. The Trust’s policy is intended to result in a calculation of the Portfolio’s NAV that fairly reflects security values as of the time of pricing. However, fair values determined by the Board of Trustees or persons acting at their direction may not accurately reflect the price that the Portfolio could obtain for a security if it were to dispose of that security as of the time of pricing. Because foreign securities can trade on non-business days, the NAV of the Portfolio may change on days when shareholders will not be able to purchase or redeem shares. The prices used by the Portfolio may differ from the value that would be realized if the securities were sold and the differences could be material to the financial statements.
Securities Transactions and Investment Income. Securities transactions are recorded as of the trade date. Securities purchased or sold on a when-issued or delayed-delivery basis may be settled a month or more after the trade date. Realized gains and losses from securities sold are recorded on the identified cost basis. Dividend income is recorded on the ex-dividend date, except certain dividends from foreign securities where the ex-dividend date may have passed, which are recorded as soon as the Portfolio is informed of the ex-dividend date. Interest income, adjusted for the accretion of discounts and amortization of premiums, is recorded on the accrual basis. Paydown gains and losses on mortgage-related or asset-backed securities are recorded as components of interest income in the Statement of Operations.
Dividends and Distributions to Shareholders. Dividends from net investment income, if any, are declared on each day the Portfolio is open for business and are distributed to shareholders monthly. Net realized capital gains earned by the Portfolio, if any, will be distributed no less frequently than once each year. Most shareholders choose to reinvest their dividends and capital gain distribution in additional shares of the Portfolio.
Income dividends and capital gain distributions are determined in accordance with income tax regulations which may differ from GAAP. Differences between tax regulations and GAAP may change the fiscal year when income and capital items are recognized for tax and GAAP purposes. Examples of events that give rise to timing differences include wash sales, straddles, net operating losses and capital loss carryforwards. Further, the character of investment income and capital gains may be different for certain transactions under the two methods of accounting. Examples of characterization differences include the treatment of mortgage paydowns, swaps, foreign currency transactions and contingent debt instruments. As a result, income dividends and capital gain distributions declared during a fiscal period may differ significantly from the net investment income and realized capital gain reported in the Portfolio’s annual financial statements presented under GAAP.
Distributions classified as a tax basis return of capital, if any, are reflected in the accompanying Statements of Changes in Net Assets and have been reclassified to paid in capital. In addition, other amounts have been reclassified between undistributed net investment income, accumulated undistributed net realized gains or losses and/or paid in capital to more appropriately conform financial accounting to tax characterizations of dividend distributions.
| | | | | | |
| | | Semiannual Report | | June 30, 2006 | | 13 |
Notes to Financial Statements (Cont.)
Loan Participations and Assignments. The Portfolio may invest in direct debt instruments which are interests in amounts owned by corporate, governmental, or other borrowers to lenders or lending syndicates. The Portfolio’s investments in loans may be in the form of participations in loans or assignments of all or a portion of loans from third parties. A loan is often administered by a bank or other financial institution (the “lender”) that acts as agent for all holders. The agent administers the terms of the loan, as specified in the loan agreement. When investing in a loan participation, the Portfolio has the right to receive payments of principal, interest and any fees to which it is entitled only from the lender selling the loan agreement and only upon receipt by the lender of payments from the borrower. The Portfolio generally has no right to enforce compliance with the terms of the loan agreement with the borrower. As a result, the Portfolio may be subject to the credit risk of both the borrower and the lender that is selling the loan agreement. When the Portfolio purchases assignments from lenders it acquires direct rights against the borrower on the loan. At the end of the period, the Portfolio had no unfunded loan commitments.
Delayed-Delivery Transactions. The Portfolio may purchase or sell securities on a when-issued or delayed-delivery basis. These transactions involve a commitment by the Portfolio to purchase or sell securities for a predetermined price or yield, with payment and delivery taking place beyond the customary settlement period. When delayed-delivery purchases are outstanding, the Portfolio will designate liquid assets in an amount sufficient to meet the purchase price. When purchasing a security on a delayed-delivery basis, the Portfolio assumes the rights and risks of ownership of the security, including the risk of price and yield fluctuations, and takes such fluctuations into account when determining its net asset value. The Portfolio may dispose of or renegotiate a delayed-delivery transaction after it is entered into, and may sell when-issued securities before they are delivered, which may result in a capital gain or loss. When the Portfolio has sold a security on a delayed-delivery basis, the Portfolio does not participate in future gains and losses with respect to the security.
Federal Income Taxes. The Portfolio intends to qualify as a regulated investment company under sub-chapter M of the Internal Revenue Code and distribute all of its taxable income and net realized gains, if applicable, to shareholders. Accordingly, no provision for Federal income taxes has been made.
Foreign Currency. The accounting records of the Portfolio are maintained in U.S. dollar. The market values of foreign securities, currency holdings and other assets and liabilities are translated into U.S. dollar based on the current exchange rates each business day. Fluctuations in the value of currency holdings and other assets and liabilities resulting from changes in exchange rates are recorded as unrealized foreign currency gains or losses. Realized gains or losses and unrealized appreciation or depreciation on investment securities and income and expenses are translated on the respective dates of such transactions. The effects of changes in foreign currency exchange rates on investments in securities are not segregated in the Statement of Operations from the effects of changes in market prices of those securities, but are included with the net realized and unrealized gain or loss on investment securities.
| | | | | | |
|
Non-U.S. currency symbols utilized throughout the report are defined
as follows: |
| BRL | | Brazilian Real | | MXN | | Mexican Peso |
| CLP | | Chilean Peso | | PEN | | Peruvian New Sol |
| CNY | | Chinese Yuan Renminbi | | PLN | | Polish Zloty |
| EUR | | Euro | | RUB | | Russian Ruble |
| IDR | | Indonesian Rupiah | | SGD | | Singapore Dollar |
| INR | | Indian Rupee | | SKK | | Slovakian Koruna |
| JPY | | Japanese Yen | | TWD | | Taiwan Dollar |
| KRW | | South Korean Won | | ZAR | | South African Rand |
Forward Currency Transactions. The Portfolio may enter into forward currency contracts in connection with settling planned purchases or sales of securities, to hedge the currency exposure associated with some or all of the Portfolio’s securities or as a part of an investment strategy. A forward currency contract is an agreement between two parties to buy and sell a currency at a set price on a future date. The market value of a forward currency contract fluctuates with changes in forward currency exchange rates. Forward currency contracts are marked to market daily and the change in value is recorded by the Portfolio as an unrealized gain or loss. Realized gains or losses equal to the difference between the value of the contract at the time it was opened and the value at the time it was closed are recorded upon delivery or receipt of the currency or, if a forward currency contract is offset by entering into another forward currency contract with the same broker, upon settlement of the net gain or loss. These contracts may involve market risk in excess of the unrealized gain or loss reflected in the Portfolio’s Statement of Assets and Liabilities. In addition, the Portfolio could be exposed to risk if the counterparties are unable to meet the terms of the contracts or if the value of the currency changes unfavorably to the U.S. dollar
Futures Contracts. The Portfolio is authorized to enter into futures contracts. The Portfolio may use futures contracts to manage its exposure to the securities markets or to movements in interest rates and currency values. The primary risks associated with the use of futures contracts are the imperfect correlation between the change in market value of the securities held by the Portfolio and the prices of futures contracts, the possibility of an illiquid market, and the inability of the counterparty to meet the terms of the contract. Futures contracts are valued based upon their quoted daily settlement prices. Upon entering into a futures contract, the Portfolio is required to deposit with its custodian, in a segregated account in the name of the futures broker, an amount of cash or U.S. Government and Agency Obligations in accordance with the initial margin requirements of the broker or exchange. Futures contracts are marked to market daily and an appropriate payable or receivable for the change in value (“variation margin”) is recorded by the Portfolio. Gains or losses are recognized but not considered realized until the contracts expire or are closed. Futures contracts involve, to varying degrees, risk of loss in excess of the variation margin disclosed in the Statement of Assets and Liabilities.
Options Contracts. The Portfolio may write call and put options on futures, swaps, securities or currencies it owns or in which it may invest. Writing put options tends to increase the Portfolio’s exposure to the underlying instrument. Writing call options tends to decrease the Portfolio’s exposure to the underlying instrument. When the Portfolio writes a call or put option, an amount equal to the premium received is recorded as a liability and subsequently marked to market to reflect the current value of the option written. These liabilities are reflected as written options outstanding in the Statement of Assets and Liabilities. Certain options may be written with premiums to determined on a future date. The premiums for these options are based upon implied volatility parameters at specified terms. Premiums received from writing options which expire are treated as realized gains. Premiums received from writing options which are exercised or closed are added to the proceeds or offset against amounts paid on the underlying future, swap, security or currency transaction to determine the realized gain or loss. The Portfolio as a writer of an option has no control over whether the underlying future, swap, security or currency may be sold (call) or purchased (put) and as a result bears the market risk of an unfavorable change in the price of the future, swap, security or currency underlying the written option. There is the risk the Portfolio may not be able to enter into a closing transaction because of an illiquid market.
The Portfolio may also purchase put and call options. Purchasing call options tends to increase the Portfolio’s exposure to the underlying instrument. Purchasing put options tends to decrease the Portfolio’s exposure to the underlying instrument. The Portfolio pays a premium which is included in the Portfolio’s Statement of
| | | | |
| 14 | | PIMCO Variable Insurance Trust | | |
| | |
| |
| | | June 30, 2006 (Unaudited) |
Assets and Liabilities as an investment and subsequently marked to market to reflect the current value of the option. Premiums paid for purchasing options which expire are treated as realized losses. Certain options may be purchased with premiums to be determined on a future date. The premiums for these options are based upon implied volatility parameters at specified terms. The risk associated with purchasing put and call options is limited to the premium paid. Premiums paid for purchasing options which are exercised or closed are added to the amounts paid or offset against the proceeds on the underlying future, swap, security or currency transaction to determine the realized gain or loss.
Repurchase Agreements. The Portfolio may engage in repurchase transactions. Under the terms of a typical repurchase agreement, the Portfolio takes possession of an underlying debt obligation subject to an obligation of the seller to repurchase, and the Portfolio to resell, the obligation at an agreed-upon price and time. The market value of the collateral must be equal to or exceed at all times the total amount of the repurchase obligations, including interest. Securities purchased under repurchase agreements are reflected as an asset in the Statement of Assets and Liabilities. Generally, in the event of counterparty default, the Portfolio has the right to use the collateral to offset losses incurred. If the counterparty should default, the Portfolio will seek to sell the securities which it holds as collateral. This could involve procedural costs or delays in addition to a loss on the securities if their value should fall below their repurchase price.
Swap Agreements. The Portfolio may engage in swap transactions, including, but not limited to, swap agreements on interest rate, total return, forward spread-lock and credit default to manage its exposure to interest rates and credit risk. In connection with these agreements, securities may be identified as collateral in accordance with the terms of the respective swap agreements.
Interest rate swap agreements involve the exchange by the Portfolio with another party of their respective commitments to pay or receive interest, e.g., an exchange of floating rate payments for fixed rate payments with respect to the notional amount of principal.
Credit default swap agreements involve one party making a stream of payments to another party in exchange for the right to receive a specified return in the event of a default by a third party, typically corporate issues or sovereign issues of an emerging country, on its obligation. The Portfolio may use credit default swaps to provide a measure of protection against defaults of the issuers (i.e., to reduce risk where the Portfolio owns or has exposure to the sovereign issuer) or to take an active long or short position with respect to the likelihood of a particular issuer’s default. As a seller of protection, the Portfolio generally receives an upfront payment or a fixed rate of income throughout the term of the swap provided that there is no credit event. If the Portfolio is a seller of protection and a credit event occurs, as defined under the terms of that particular swap agreement, the Portfolio will pay to the buyer of the protection an amount up to the notional value of the swap and in certain instances take delivery of the security. As the seller, the Portfolio would effectively add leverage to its portfolio because, in addition to its total net assets, the Portfolio would be subject to investment exposure on the notional amount of the swap. As a buyer of protection, the Portfolio generally receives an amount up to the notional value of the swap if a credit event occurs. The treatment of a credit default swaps and other swap agreements that provide for contingent, non-periodic, bullet-type payments as “notional principal contracts” for federal income tax purposes is uncertain. Were the Internal Revenue Service in take the position that a credit default swap or other bullet-type swap is not a “notional principal contract” for federal income tax purposes, payments received by the Portfolio from such investments might be subject to income taxes.
Swaps are marked to market daily based upon quotations from market makers and the change in value, if any, is recorded as unrealized gain or loss in the Statement of Operations. Payments received or made at the beginning of the measurement period are reflected as such in the Statement of Assets and Liabilities. These upfront payments are recorded as realized gain or loss in the Statement of Operations upon termination or maturity of the swap. A liquidation payment received or made at the termination of the swap is recorded as realized gain or loss in the Statement of Operations. Net periodic payments received by the Portfolio are included as part of realized gain or loss in the Statement of Operations. Entering into these agreements involves, to varying degrees, elements of credit, market and documentation risk in excess of the amounts recognized in the Statement of Assets and Liabilities. Such risks involve the possibility that there will be no liquid market for these agreements, that the counterparty to the agreements may default on its obligation to perform or disagree as to the meaning of contractual terms in the agreements and that there may be unfavorable changes in interest rates.
Guarantees and Indemnifications. Under the Trust’s organizational documents, each Trustee, officer, employee or other agent of the Trust (including the Trust’s investment manager) is indemnified against certain liabilities that may arise out of performance of their duties to the Portfolio. Additionally, in the normal course of business, the Portfolio enters into contracts that contain a variety of indemnification clauses. The Portfolio’s maximum exposure under these arrangements is unknown as this would involve future claims that may be made against the Portfolio that have not yet occurred. However, the Portfolio has not had prior claims or losses pursuant to these contracts, and believes the risk of loss to be remote.
New Accounting Policies. In July 2006, the Financial Accounting Standards Board issued Interpretation No. 48, “Accounting for Uncertainty in Income Taxes—an Interpretation of FASB Statement No. 109” (the “Interpretation”). The Interpretation is effective for fiscal years beginning after December 15, 2006. Management is currently evaluating the application of the Interpretation to the Portfolio and will provide additional information in relation to the Interpretation in the Portfolio’s annual financial statements for the year ending December 31, 2006.
3. FEES, EXPENSES, AND RELATED PARTY TRANSACTIONS
Investment Advisory Fee. PIMCO is a majority-owned subsidiary of Allianz Global Investors of America L.P. (“AGI”), and serves as investment adviser (the “Adviser”) to the Trust, pursuant to an investment advisory contract. The Adviser receives a monthly fee at an annual rate based on average daily net assets of the Portfolio. The Advisory Fee is charged at an annual rate of 0.45%.
Administration Fee. PIMCO serves as administrator (the “Administrator”), and provides administrative services to the Trust for which it receives a monthly administrative fee based on average daily net assets of the Portfolio. As the Administrator, PIMCO bears the costs of various third-party services, including audit, custodial, portfolio accounting, legal, transfer agency and printing costs. The Administration Fee is charged at the annual rate of 0.40%.
Distribution and Servicing Fees. Allianz Global Investors Distributors LLC (“AGID”) is an indirect wholly-owned subsidiary of AGI and serves as the distributor of the Trust’s shares. The Trust is permitted to reimburse AGID on a quarterly basis, out of the Administrative Class assets of the Portfolio in the amount of 0.15% on an annual basis of the average daily net assets of that class, for payments made to financial intermediaries that provide services in connection with the distribution of shares or administration of plans or programs that use Portfolio shares as their funding medium. The effective rate paid to AGID was 0.15% during the current fiscal year.
Expenses. The Trust is responsible for the following expenses: (i) salaries and other compensation of any of the Trust’s executive officers and employees who are not officers, directors, stockholders or employees of PIMCO or its subsidiaries or affiliates; (ii) taxes and governmental fees; (iii) brokerage fees and commissions and other portfolio transaction expenses; (iv) the costs of borrowing money,
| | | | | | |
| | | Semiannual Report | | June 30, 2006 | | 15 |
Notes to Financial Statements (Cont.)
including interest expenses and bank overdraft charges; (v) fees and expenses of the Trustees who are not “interested persons” of PIMCO or the Trust, and any counsel retained exclusively for their benefit; (vi) extraordinary expenses, including costs of litigation and indemnification expenses; (vii) organization expenses and (viii) any expenses allocated or allocable to a specific class of shares, which include service fees payable with respect to the Administrative Class shares and may include certain other expenses as permitted by the Trust’s Multiple Class Plan adopted pursuant to Rule 18f-3 under the Act and subject to review and approval by the Trustees. The ratio of expenses to average net assets per share class, as disclosed in the Financial Highlights, may differ from the annual portfolio operating expenses per share class as disclosed in the Prospectus for the reasons set forth above.
For the current period ended June 30, 2006, each unaffiliated Trustee received an annual retainer of $15,000, plus $2,000 for each Board of Trustees quarterly meeting attended, $500 for each Board of Trustees committee meeting attended and $500 for each special board meeting attended, plus reimbursement of related expenses. In addition, each Committee Chair received an additional annual retainer of $500 and each Audit Committee Chair received an additional annual retainer of $1,500. These expenses are allocated on a pro-rata basis to each Portfolio of the Trust according to its respective net assets. The Trust pays no compensation directly to any Trustee or any other officer who is affiliated with the Administrator, all of whom receive remuneration for their services to the Trust from the Administrator or its affiliates.
4. PURCHASES AND SALES OF SECURITIES
The length of time the Portfolio has held a particular security is not generally a consideration in investment decisions. A change in the securities held by the Portfolio is known as “portfolio turnover”. The Portfolio may engage in frequent and active trading of portfolio securities to achieve its investment objective, particularly during periods of volatile market movements. High portfolio turnover (e.g., over 100%) involves correspondingly greater expenses to the Portfolio, including brokerage commissions or dealer mark-ups and other transaction costs on the sale of securities and reinvestments in other securities. Such sales may also result in realization of taxable capital gains, including short-term capital gains (which are generally taxed at ordinary income tax rates). The trading costs and tax effects associated with portfolio turnover may adversely affect the Portfolio’s performance.
Purchases and sales of securities (excluding short-term investments) for the period ended June 30, 2006 were as follows (amounts in thousands):
| | | | | | | | | | | | | | | | |
| | U.S Government/Agency | | | | | All Other |
| | Purchases | | | | | Sales | | | | | Purchases | | | | | Sales |
| $ | 3,924 | | | | $ | 2,638 | | | | $ | 224,692 | | �� | | $ | 205,534 |
5. TRANSACTIONS IN WRITTEN CALL AND PUT OPTIONS
Transactions in written call and put options were as follows (amounts in thousands, except number of contracts):
| | | | | | | | | |
| | | | | # of
Contracts | | | | | Premium |
Balance at 12/31/2005 | | | | 0 | | | | $ | 0 |
Sales | | | | 164 | | | | | 25 |
Closing Buys | | | | 0 | | | | | 0 |
Expirations | | | | 0 | | | | | 0 |
Exercised | | | | 0 | | | | | 0 |
Balance at 06/30/2006 | | | | 164 | | | | $ | 25 |
6. SHARES OF BENEFICIAL INTEREST
The Portfolio may issue an unlimited number of shares of beneficial interest with a $0.001 par value. Changes in shares of beneficial interest were as follows (shares and amounts in thousands):
| | | | | | | | | | | | | | | | | | |
| | | | | Six Months Ended
06/30/2006 | | | | | Year Ended
12/31/2005 | |
| | | | | Shares | | | Amount | | | | | Shares | | | Amount | |
| | | | | | |
Receipts for shares sold | | | | | | | | | | | | | | | | | | |
Administrative Class | | | | 3,851 | | | $ | 52,231 | | | | | 4,972 | | | $ | 67,244 | |
Advisor Class | | | | 8 | | | | 108 | | | | | 0 | | | | 0 | |
Issued as reinvestment of distributions | | | | | | | | | | | | | | | | | | |
Administrative Class | | | | 304 | | | | 4,103 | | | | | 500 | | | | 6,752 | |
Advisor Class | | | | 0 | | | | 0 | | | | | 0 | | | | 0 | |
Cost of shares redeemed | | | | | | | | | | | | | | | | | | |
Administrative Class | | | | (1,423 | ) | | | (19,006 | ) | | | | (618 | ) | | | (8,259 | ) |
Advisor Class | | | | (1 | ) | | | (11 | ) | | | | 0 | | | | 0 | |
Net increase resulting from
Portfolio share transactions | | | | 2,739 | | | $ | 37,425 | | | | | 4,854 | | | $ | 65,737 | |
The following schedule shows the number of shareholders each owning 5% or more of the Portfolio and the total percentage of the Portfolio held by such shareholders:
| | | | | | | |
| | | | | Number of
Shareholders | | % of Portfolio
Held | |
Administrative Class | | | | 5 | | 93 | * |
Advisor Class | | | | 2 | | 100 | |
* One of the shareholders, Allianz Life Insurance Co. of North America, is an indirect wholly owned subsidiary of AGI and a related party to the Portfolio.
7. FEDERAL INCOME TAX MATTERS
As of June 30, 2006, the aggregate cost of investments was the same for federal income tax and financial statement purposes. The net unrealized appreciation (depreciation) of investment securities for federal income tax purposes is as follows (amounts in thousands):
| | | | |
Aggregate
Gross
Unrealized
Appreciation | | Aggregate
Gross
Unrealized
(Depreciation) | | Net
Unrealized
(Depreciation) |
$ 3,249 | | $ (3,279) | | $ (30) |
8. REGULATORY AND LITIGATION MATTERS
On June 1, 2004, the Attorney General of the State of New Jersey announced that it had dismissed PIMCO from a complaint filed by the New Jersey Attorney General on February 17, 2004, and that it had entered into a settlement agreement (the “New Jersey Settlement”) with Allianz Global Investors of America L.P. (“AGI”) (formerly known as Allianz Dresdner Asset Management of America L.P.), PEA Capital LLC (an entity affiliated with PIMCO through common ownership) (“PEA”) and Allianz Global Investors Distributors LLC (“AGID”), in connection with the same matter. In the New Jersey Settlement, AGI, PEA and AGID neither admitted nor denied the allegations or conclusions of law, but did agree to pay New Jersey a civil fine of $15 million and $3 million for investigative costs and further potential enforcement initiatives against unrelated parties. They also undertook to implement certain governance changes. The complaint relating to the New Jersey Settlement alleged, among other things, that AGI, PEA and AGID had failed to disclose that they improperly allowed certain hedge funds to engage in
| | | | |
| 16 | | PIMCO Variable Insurance Trust | | |
| | |
| |
| | | June 30, 2006 (Unaudited) |
“market timing” in certain funds. The complaint sought injunctive relief, civil monetary penalties, restitution and disgorgement of profits.
Since February 2004, PIMCO, AGI, PEA, AGID, and certain of their affiliates, including the PIMCO Funds, the Allianz Funds (formerly known as PIMCO Funds: Multi-Manager Series), and the Trustees and employees of the PIMCO Funds, have been named as defendants in fifteen lawsuits filed in various jurisdictions. Eleven of those lawsuits concern “market timing,” and they have been transferred to and consolidated for pre-trial proceedings in a multi-district litigation proceeding in the U.S. District Court for the District of Maryland; the other four lawsuits concern “revenue sharing” and have been consolidated into a single action in the U.S. District Court for the District of Connecticut. The lawsuits have been commenced as putative class actions on behalf of investors who purchased, held or redeemed shares of the various series of the PIMCO Funds and the Allianz Funds during specified periods, or as derivative actions on behalf of the PIMCO Funds and Allianz Funds.
The market timing actions in the District of Maryland generally allege that certain hedge funds were allowed to engage in “market timing” in certain of the PIMCO Funds and the Allianz Funds and this alleged activity was not disclosed. Pursuant to tolling agreements entered into with the derivative and class action plaintiffs, PIMCO, the Trustees, and certain employees of PIMCO who were previously named as defendants have all been dropped as defendants in the market timing actions; the plaintiffs continue to assert claims on behalf of the shareholders of the PIMCO Funds or on behalf of the PIMCO Funds themselves against other defendants. By order dated November 3, 2005, the U.S. District Court for the District of Maryland granted the PIMCO Funds’ motion to dismiss claims asserted against it in a consolidated amended complaint where the PIMCO Funds were named, in the complaint, as a nominal defendant. The revenue sharing action in the District of Connecticut generally alleges that fund assets were inappropriately used to pay brokers to promote the PIMCO Funds and Allianz Funds, including directing fund brokerage transactions to such brokers, and that such alleged arrangements were not fully disclosed to shareholders. On August 11, 2005 the U.S. District Court for the District of Connecticut conducted a hearing on defendants’ motion to dismiss the consolidated amended complaint in the revenue sharing action but has not yet ruled on the motion to dismiss. The market timing and revenue sharing lawsuits seek, among other things, unspecified compensatory damages plus interest and, in some cases, punitive damages, the rescission of investment advisory contracts, the return of fees paid under those contracts and restitution.
Under Section 9(a) of the Investment Company Act of 1940, as amended (“1940 Act”), if the New Jersey Settlement or any of the lawsuits described above were to result in a court injunction against AGI, PEA, AGID and/or their affiliates, PIMCO could, in the absence of exemptive relief granted by the SEC, be barred from serving as an investment adviser, and AGID could be barred from serving as principal underwriter, to any registered investment company, including the Portfolios of the Trust. In connection with an inquiry from the SEC concerning the status of the New Jersey Settlement under Section 9(a), PEA, AGID, AGI and certain of their affiliates (including PIMCO) (together, the “Applicants”) have sought exemptive relief from the SEC under Section 9(c) of the 1940 Act. The SEC has granted the Applicants a temporary exemption from the provisions of Section 9(a) with respect to the New Jersey Settlement until the earlier of (i) September 13, 2006 and (ii) the date on which the SEC takes final action on their application for a permanent order. There is no assurance that the SEC will issue a permanent order.
Two nearly identical class action civil complaints have been filed in August 2005, in the Northern District of Illinois Eastern Division alleging that the plaintiffs each purchased and sold a 10-year Treasury note futures contract and suffered damages from an alleged shortage when PIMCO held both physical and futures positions in 10-year Treasury notes for its client accounts. The two actions have been consolidated into one action, and the two separate complaints have been replaced by a consolidated complaint. PIMCO is a named defendant, and the PIMCO Funds have been added as a defendant, to the consolidated action. PIMCO strongly believes the complaint (and any consolidated complaint filed hereafter) is without merit and intends to vigorously defend itself.
Certain Portfolios of the Trust were recently served in an adversary proceeding brought by the Official Committee of Asbestos Claimants of G-I Holdings, Inc. in G-I Holdings, Inc.’s bankruptcy in the District of New Jersey. PIMCO was previously named in this lawsuit and remains a defendant. The plaintiff seeks to recover for the bankruptcy estate assets that were transferred by the predecessor entity of G-I Holdings, Inc. to a wholly-owned subsidiary in 1994. The subsidiary has since issued notes, of which certain Portfolios of the Trust are alleged to be holders. The complaint alleges that in 2000, more than two hundred noteholders —including certain Portfolios of the Trust—were granted a second priority lien on the assets of the subsidiary in exchange for their consent to a refinancing transaction and the granting of a first priority lien to the lending banks. The plaintiff is seeking invalidation of the lien in favor of the noteholders and/or the value of the lien.
It is possible that these matters and/or other developments resulting from these matters could result in increased fund redemptions or other adverse consequences to the Portfolios. However, PIMCO and AGID believe that these matters are not likely to have a material adverse effect on the Portfolios or on PIMCO’s or AGID’s ability to perform their respective investment advisory or distribution services relating to the Portfolios.
| | | | | | |
| | | Semiannual Report | | June 30, 2006 | | 17 |
Investment Adviser and Administrator
Pacific Investment Management Company LLC
840 Newport Center Drive
Newport Beach, California 92660
Distributor
Allianz Global Investors Distributors LLC
2187 Atlantic Street
Stamford, Connecticut 06902
Custodian
State Street Bank & Trust Company
801 Pennsylvania
Kansas City, Missouri 64105
Transfer Agent
Boston Financial Data Services–Midwest
330 W. 9th Street
Kansas City, Missouri 64105
Legal Counsel
Dechert LLP
1775 I Street, N.W.
Washington, D.C. 20006
Independent Registered Public Accounting Firm
PricewaterhouseCoopers LLP
1055 Broadway
Kansas City, Missouri 64105
P I M C O

Share Class Administrative
Semiannual Report June 30, 2006
PIMCO Variable Insurance Trust
Foreign Bond Portfolio (U.S. Dollar-Hedged)
Table of Contents
This material is authorized for use only when preceded or accompanied by the current PIMCO Variable Insurance Trust (the “Trust”) prospectus. Investors should consider the investment objectives, risks, charges and expenses of this Trust carefully before investing. Ask your financial professional to explain all charges that may apply. This and other information is contained in the Trust’s prospectus. The variable product prospectus may be obtained by contacting your Investment Consultant. Please read the Trust and variable product prospectus carefully before you invest or send money.
Chairman’s Letter
Dear PIMCO Variable Insurance Trust Shareholder:
It is our pleasure to present to you the semiannual report for the PIMCO Variable Insurance Trust covering the six-month period ended June 30, 2006.
Highlights of the global bond markets during the six-month period included:
| | n | | Most fixed-income sectors lost ground during the first half of 2006, as concern about accelerating inflation and central bank tightening pushed interest rates higher worldwide. The benchmark Lehman Brothers Aggregate Bond Index (which includes Treasury, Investment-Grade Corporate, and Residential Mortgage-Backed Securities) returned -0.72% for the first six months of the year. On June 30, the benchmark ten-year Treasury yielded 5.14%, 0.75% higher than at the start of the year. The U.S. yield curve remained flat as shorter-maturity yields rose by a comparable amount. |
| | n | | The Federal Reserve tightened four times during the reporting period, bringing the Federal Funds Rate to 5.25%. The increase near the end of the period was the Federal Reserve’s 17th consecutive rate hike since the start of its tightening cycle in 2004. The Federal Reserve was not alone, as central banks in Europe, India, and China tightened credit in unison for the first time since 2000. The Bank of Japan, whose zero-interest-rate policy has flooded global markets with liquidity, looked set to reverse this policy in the coming months. |
In these pages please find a more complete Portfolio review as it relates to financial-market activities, as well as details about total-return investment performance for the six-month reporting period. Thank you for the trust you have placed in us. We will continue to work diligently to meet your investment needs.
Sincerely,
Brent R. Harris
Chairman, PIMCO Variable Insurance Trust
July 31, 2006
| | | | | | |
| | | Semiannual Report | | June 30, 2006 | | 1 |
Important Information About the Portfolio
PIMCO Variable Insurance Trust (the “Trust”) is an open-end management investment company currently consisting of nineteen separate investment portfolios, including the Foreign Bond Portfolio (U.S. Dollar-Hedged) (the “Portfolio”). The Portfolio is only available as a funding vehicle under variable life insurance policies or variable annuity contracts issued by insurance companies (“Variable Contracts”). Individuals may not purchase shares of the Portfolio directly. Shares of the Portfolio also may be sold to qualified pension and retirement plans outside of the separate account context.
We believe that bond funds have an important role to play in a well diversified investment portfolio. It is important to note, however, that in an environment where interest rates may trend upward, rising rates would negatively impact the performance of most bond funds, and fixed-income securities held by a fund are likely to decrease in value. The price volatility of fixed-income securities can also increase during periods of rising interest rates resulting in increased losses to a fund. Bond funds and individual bonds with a longer duration (a measure of the expected life of a security) tend to be more sensitive to changes in interest rates, usually making them more volatile than securities or funds with shorter durations. The longer-term performance of most bond funds has benefited from capital gains in part resulting from an extended period of declining interest rates. In the event interest rates increase, these capital gains should not be expected to recur.
The Portfolio may be subject to various risks in addition to those described above. Some of these risks may include, but are not limited to, the following: credit risk, high yield risk, market risk, issuer risk, liquidity risk, derivatives risk, mortgage risk, non-U.S. investment risk, currency risk, issuer non-diversification risk, leveraging risk and management risk. A complete description of these risks is contained in the Portfolio’s prospectus. The Portfolio may use derivative instruments for hedging purposes or as part of an investment strategy. Use of these instruments may involve certain costs and risks such as liquidity risk, interest rate risk, market risk, credit risk, management risk and the risk that the Portfolio could not close out a position when it would be most advantageous to do so. A Portfolio investing in derivatives could lose more than the principal amount invested in these instruments. Investing in non-U.S. securities may entail risk due to non-U.S. economic and political developments; this risk may be increased when investing in emerging markets.
On the performance summary page in this Semiannual Report, the Total Return Investment Performance table measures performance assuming that all dividend and capital gain distributions were reinvested.
An investment in the Portfolio is not a deposit of a bank and is not guaranteed or insured by the Federal Deposit Insurance Corporation or any other government agency. It is possible to lose money on investments in the Portfolio.
PIMCO has adopted written proxy voting policies and procedures (“Proxy Policy”) as required by Rule 206(4)-6 under the Investment Advisers Act of 1940. The Proxy Policy has been adopted by the Trust as the policies and procedures that PIMCO will use when voting proxies on behalf of the Portfolio. Copies of the written Proxy Policy and the factors that PIMCO may consider in determining how to vote proxies for the Portfolio, and information about how the Portfolio voted proxies relating to portfolio securities held during the most recent twelve-month period ended June 30, are available without charge, upon request, by calling the Trust at 1-866-746-2606 and on the Securities and Exchange Commission’s (“SEC”) website at http://www.sec.gov.
The Portfolio files its complete schedule of portfolio holdings with the SEC for the first and third quarters of each fiscal year on Form N-Q. A copy of the Trust’s Form N-Q is available on the SEC’s website at http://www.sec.gov and may be reviewed and copied at the SEC’s Public Reference Room in Washington D.C. Information on the operation of the Public Reference Room may be obtained by calling 1-800-SEC-0330.
PIMCO Variable Insurance Trust is distributed by Allianz Global Investors Distributors LLC, 2187 Atlantic Street, Stamford, CT 06902.
| | | | |
| 2 | | PIMCO Variable Insurance Trust | | |
The following disclosure provides important information regarding the Portfolio’s Expense Example (“Example” or “Expense Example”), which appears in this Semiannual Report. Please refer to this information when reviewing the Expense Example for the Portfolio.
Example
As a shareholder of the Portfolio, you incur two types of costs: (1) transaction costs and (2) ongoing costs, including advisory and administrative fees; distribution and/or service (12b-1) fees (Administrative Class only); and other Portfolio expenses. The Example is intended to help you understand your ongoing costs (in dollars) of investing in the Portfolio and to compare these costs with the ongoing costs of investing in other mutual funds. The Expense Example does not reflect any fees or other expenses imposed by the Variable Contracts. If it did, the expenses reflected in the Expense Examples would be higher. The Example is based on an investment of $1,000 invested at the beginning of the period and held for the entire period indicated, which is from January 1, 2006 to June 30, 2006.
Actual Expenses
The information in the table under the heading “Actual Performance” provides information about actual account values and actual expenses. You may use the information in these columns, together with the amount you invested, to estimate the expenses that you paid over the period. Simply divide your account value by $1,000 (for example, an $8,600 account value divided by $1,000 = 8.60), then multiply the result by the number in the appropriate column for your share class, in the row titled “Expenses Paid During Period” to estimate the expenses you paid on your account during this period.
Hypothetical Example for Comparison Purposes
The information in the table under the heading “Hypothetical Performance (5% return before expenses)” provides information about hypothetical account values and hypothetical expenses based on the Portfolio’s actual expense ratio and an assumed rate of return of 5% per year before expenses, which is not the Portfolio’s actual return. The hypothetical account values and expenses may not be used to estimate the actual ending account balance or expenses you paid for the period. You may use this information to compare the ongoing costs of investing in the Portfolio and other portfolios. To do so, compare this 5% hypothetical example with the 5% hypothetical examples that appear in the shareholder reports of the other portfolios.
Please note that the expenses shown in the table are meant to highlight your ongoing costs only and do not reflect any transactional costs. Therefore, the information under the heading “Hypothetical Performance (5% return before expenses)” is useful in comparing ongoing costs only, and will not help you determine the relative total costs of owning different portfolios. In addition, if these transactional costs were included, your costs would have been higher.
The expense ratio may vary period to period because of various factors, such as an increase in expenses not covered by the advisory and administrative fees (such as expenses of the trustees and their counsel or litigation expense).
Portfolio Benchmark
JPMorgan Government Bond Indices Global Ex-U.S. Index Hedged in USD is an unmanaged index market representative of the total return performance in U.S. dollars of major non-U.S. bond markets. It is not possible to invest directly in such an unmanaged index.
| | | | | | |
| | | Semiannual Report | | June 30, 2006 | | 3 |
| | | | |
| | |
| PIMCO Foreign Bond Portfolio (U.S. Dollar-Hedged) | | | | |
| | | | |
Cumulative Returns Through June 30, 2006
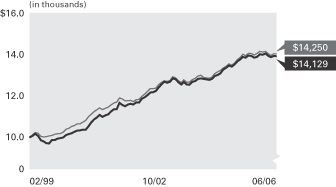
Foreign Bond Portfolio JPMorgan GBI Global
(U.S. Dollar-Hedged) ex-US Index
Administrative Class Hedged in USD
---------------------- -------------------
02/28/1999 $10,000 $10,000
03/31/1999 10,069 10,119
04/30/1999 10,186 10,248
05/31/1999 10,075 10,205
06/30/1999 9,857 10,047
07/31/1999 9,787 10,021
08/31/1999 9,706 10,039
09/30/1999 9,693 10,077
10/31/1999 9,870 10,102
11/30/1999 9,868 10,160
12/31/1999 9,942 10,191
01/31/2000 9,964 10,192
02/29/2000 9,997 10,267
03/31/2000 10,119 10,417
04/30/2000 10,170 10,473
05/31/2000 10,210 10,557
06/30/2000 10,286 10,608
07/31/2000 10,351 10,684
08/31/2000 10,356 10,686
09/30/2000 10,392 10,778
10/31/2000 10,400 10,865
11/30/2000 10,570 11,058
12/31/2000 10,773 11,180
01/31/2001 10,919 11,313
02/28/2001 11,019 11,410
03/31/2001 11,146 11,496
04/30/2001 11,051 11,418
05/31/2001 11,115 11,478
06/30/2001 11,174 11,541
07/31/2001 11,322 11,646
08/31/2001 11,425 11,744
09/30/2001 11,433 11,792
10/31/2001 11,756 12,008
11/30/2001 11,649 11,956
12/31/2001 11,591 11,857
01/31/2002 11,671 11,870
02/28/2002 11,705 11,881
03/31/2002 11,672 11,820
04/30/2002 11,783 11,916
05/31/2002 11,776 11,931
06/30/2002 11,962 12,085
07/31/2002 12,045 12,202
08/31/2002 12,158 12,349
09/30/2002 12,285 12,490
10/31/2002 12,301 12,484
11/30/2002 12,376 12,507
12/31/2002 12,540 12,687
01/31/2003 12,699 12,787
02/28/2003 12,847 12,875
03/31/2003 12,774 12,859
04/30/2003 12,829 12,888
05/31/2003 13,003 13,092
06/30/2003 12,964 13,024
07/31/2003 12,800 12,880
08/31/2003 12,699 12,787
09/30/2003 12,816 12,927
10/31/2003 12,693 12,807
11/30/2003 12,684 12,818
12/31/2003 12,823 12,938
01/31/2004 12,864 12,996
02/29/2004 12,977 13,120
03/31/2004 13,003 13,156
04/30/2004 12,973 13,053
05/31/2004 12,955 13,031
06/30/2004 12,932 13,014
07/31/2004 12,978 13,067
08/31/2004 13,128 13,251
09/30/2004 13,174 13,327
10/31/2004 13,262 13,412
11/30/2004 13,454 13,528
12/31/2004 13,536 13,612
01/31/2005 13,649 13,745
02/28/2005 13,599 13,679
03/31/2005 13,715 13,783
04/30/2005 13,875 13,957
05/31/2005 13,969 14,073
06/30/2005 14,091 14,225
07/31/2005 14,053 14,162
08/31/2005 14,164 14,277
09/30/2005 14,145 14,261
10/31/2005 14,056 14,188
11/30/2005 14,090 14,267
12/31/2005 14,233 14,374
01/31/2006 14,200 14,347
02/28/2006 14,262 14,380
03/31/2006 14,149 14,254
04/30/2006 14,079 14,173
05/31/2006 14,144 14,256
06/30/2006 14,129 14,250
$10,000 invested at the beginning of the first full month following the inception date of the Portfolio’s Administrative Class.
Country Allocation‡
| | |
Short-Term Instruments | | 28.7% |
United States | | 27.4% |
Germany | | 15.0% |
Japan | | 9.9% |
Spain | | 7.4% |
United Kingdom | | 6.4% |
Other | | 5.2% |
| | ‡ | % of Total Investments as of June 30, 2006 |
| | | | | | | | | | | | |
| Average Annual Total Return for the period ended June 30, 2006 |
| | | | | | | 6 Months* | | 1 Year | | 5 Years | | Since
Inception
(02/16/99)** |
| | |
| | PIMCO Foreign Bond Portfolio (U.S. Dollar-Hedged) Administrative Class | | -0.73% | | 0.26% | | 4.80% | | 4.77% |
| | |
| | JPMorgan GBI Global ex-U.S. Index Hedged in USD | | -0.86% | | 0.17% | | 4.31% | | 4.95% |
All Portfolio returns are net of fees and expenses.
* Cumulative return.
** The Portfolio began operations on 02/16/99. Index comparisons began on 02/28/99.
Past performance is no guarantee of future results. The performance quoted represents past performance. Investment return and principal value will fluctuate so the Portfolio shares, when redeemed, may be worth more or less than their original cost. The Portfolio’s performance does not reflect the deduction of additional charges and expenses imposed in connection with investing in Variable Contracts, which will reduce returns. Current performance may be lower or higher than the performance data quoted. Performance data current to the most recent month-end is available by calling (800) 927-4648.
| | | | | | | | | | |
| Expense Example | | | | Actual Performance | | | | Hypothetical Performance |
| | | | | | | | | (5% return before expenses) |
Beginning Account Value (01/01/06) | | | | $ | 1,000.00 | | | | $ | 1,000.00 |
Ending Account Value (06/30/06) | | | | $ | 992.70 | | | | $ | 1,020.33 |
Expenses Paid During Period† | | | | $ | 4.45 | | | | $ | 4.51 |
† Expenses are equal to the Portfolio’s Administrative Class annualized expense ratio of 0.90%, multiplied by the average account value over the period, multiplied by 181/365 (to reflect the one-half year period). Overall fees and expenses of investing in the Portfolio will be higher because the example does not reflect Variable Contract fees and expenses.
Please refer to page 3 herein for a description of the Portfolio’s benchmark and an explanation of the information presented in the above Expense Example.
Portfolio Insights
| » | | The PIMCO Foreign Bond Portfolio (U.S. Dollar-Hedged) seeks to achieve its investment objective by investing under normal circumstances at least 80% of its assets in Fixed-Income Instruments of issuers located outside the United States, representing at least three foreign countries, which may be represented by futures contracts (including related options) with respect to such securities, and options on such securities. |
| » | | An underweight to Euroland duration and a curve flattening bias added to returns as these yields rose on stronger than expected economic data and hawkish European Central Bank comments. |
| » | | An overweight to U.S. duration and an emphasis on shorter maturities detracted from returns, as rates rose and the yield curve continued to flatten amid concern that the Federal Reserve would extend its tightening cycle. |
| » | | An emphasis on mortgage-backed securities was positive for performance as mortgages outperformed like-duration Treasuries amidst declining volatility and heightened investor demand. |
| » | | A focus on the short-to-intermediate portion of the U.K. curve was negative for returns as U.K. long-dated gilts outperformed on firmer demand for longer dated assets. |
| » | | A long position in the Euro and the Yen versus the U.S. dollar was positive for returns as the Euro and the Yen appreciated on improving growth and expectations of monetary tightening. |
| | | | |
| 4 | | PIMCO Variable Insurance Trust | | |
|
|
| Financial Highlights Foreign Bond Portfolio (U.S. Dollar-Hedged) |
| | | | | | | | | | | | | | | | | | |
| Selected Per Share Data for the Year or Period Ended: | | 06/30/2006+ | | | 12/31/2005 | | | 12/31/2004 | | | 12/31/2003 | | | 12/31/2002 | | | 12/31/2001 | |
| | | | | | |
Administrative Class | | | | | | | | | | | | | | | | | | |
| Net asset value beginning of period | | $ 10.34 | | | $ 10.15 | | | $ 10.03 | | | $ 10.07 | | | $ 9.69 | | | $ 9.40 | |
| Net investment income (a) | | 0.17 | | | 0.28 | | | 0.23 | | | 0.26 | | | 0.36 | | | 0.42 | |
| Net realized/unrealized gain (loss) on investments (a) | | (0.25 | ) | | 0.24 | | | 0.33 | | | (0.03 | ) | | 0.42 | | | 0.28 | |
| Total income from investment operations | | (0.08 | ) | | 0.52 | | | 0.56 | | | 0.23 | | | 0.78 | | | 0.70 | |
| Dividends from net investment income | | (0.15 | ) | | (0.25 | ) | | (0.21 | ) | | (0.27 | ) | | (0.36 | ) | | (0.41 | ) |
| Distributions from net realized capital gains | | 0.00 | | | (0.08 | ) | | (0.23 | ) | | 0.00 | | | (0.04 | ) | | 0.00 | |
| Total distributions | | (0.15 | ) | | (0.33 | ) | | (0.44 | ) | | (0.27 | ) | | (0.40 | ) | | (0.41 | ) |
| Net asset value end of period | | $ 10.11 | | | $ 10.34 | | | $ 10.15 | | | $ 10.03 | | | $ 10.07 | | | $ 9.69 | |
| Total return | | (0.73 | )% | | 5.15 | % | | 5.56 | % | | 2.26 | % | | 8.19 | % | | 7.59 | % |
| Net assets end of period (000s) | | $ 54,250 | | | $ 49,640 | | | $ 38,141 | | | $ 32,355 | | | $ 16,776 | | | $ 4,856 | |
| Ratio of expenses to average net assets | | 0.90 | %* | | 0.90 | % | | 0.90 | % | | 0.93 | %(b) | | 0.93 | %(b)(d) | | 0.90 | %(c) |
| Ratio of net investment income to average net assets | | 3.44 | %* | | 2.70 | % | | 2.26 | % | | 2.53 | % | | 3.67 | % | | 4.43 | % |
| Portfolio turnover rate | | 193 | % | | 453 | % | | 515 | % | | 600 | % | | 321 | % | | 285 | % |
+ Unaudited
* Annualized
(a) Per share amounts based on average number of shares outstanding during the period.
(b) Ratio of expense to average net assets excluding interest expense is 0.90%.
(c) If the investment manager had not reimbursed expenses, the ratio of expenses to average net assets would have been 0.91%.
(d) If the investment manager had not reimbursed expenses, the ratio of expenses to average net assets would have been 0.94%.
| | | | | | |
| See Accompanying Notes | | Semiannual Report | | June 30, 2006 | | 5 |
|
|
| Statement of Assets and Liabilities Foreign Bond Portfolio (U.S. Dollar-Hedged) |
| | | | |
| (Amounts in thousands, except per share amounts) | | June 30, 2006
(Unaudited) | |
| |
Assets: | | | | |
Investments, at value | | $ | 58,481 | |
Cash | | | 5 | |
Foreign currency, at value | | | 656 | |
Receivable for investments sold | | | 4,472 | |
Receivable for investments sold on delayed-delivery basis | | | 2,557 | |
Receivable for Portfolio shares sold | | | 425 | |
Interest and dividends receivable | | | 554 | |
Variation margin receivable | | | 27 | |
Swap premiums paid | | | 871 | |
Unrealized appreciation on forward foreign currency contracts | | | 32 | |
Unrealized appreciation on swap agreements | | | 709 | |
| | | | 68,789 | |
| |
Liabilities: | | | | |
Payable for investments purchased | | $ | 4,391 | |
Payable for investments purchased on delayed-delivery basis | | | 8,316 | |
Payable for short sales | | | 384 | |
Payable for Portfolio shares redeemed | | | 171 | |
Written options outstanding | | | 90 | |
Accrued investment advisory fee | | | 12 | |
Accrued administration fee | | | 23 | |
Accrued servicing fee | | | 6 | |
Swap premiums received | | | 644 | |
Unrealized depreciation on forward foreign currency contracts | | | 224 | |
Unrealized depreciation on swap agreements | | | 264 | |
Other | | | | |
| | | | 14,525 | |
| |
Net Assets | | $ | 54,264 | |
| |
Net Assets Consist of: | | | | |
Paid in capital | | $ | 54,016 | |
Undistributed net investment income | | | 600 | |
Accumulated undistributed net realized (loss) | | | (964 | ) |
Net unrealized appreciation | | | 612 | |
| | | $ | 54,264 | |
| |
Net Assets: | | | | |
Institutional Class | | $ | 14 | |
Administrative Class | | | 54,250 | |
| |
Shares Issued and Outstanding: | | | | |
Institutional Class | | | 1 | |
Administrative Class | | | 5,364 | |
| |
Net Asset Value and Redemption Price Per Share
(Net Assets Per Share Outstanding) | | | | |
Institutional Class | | $ | 10.11 | |
Administrative Class | | | 10.11 | |
| |
Cost of Investments Owned | | $ | 58,111 | |
Cost of Foreign Currency Held | | $ | 650 | |
Proceeds Received on Short Sales | | $ | 387 | |
Premiums Received on Written Options | | $ | 235 | |
| | | | |
| 6 | | PIMCO Variable Insurance Trust | | See Accompanying Notes |
|
|
| Statement of Operations Foreign Bond Portfolio (U.S. Dollar-Hedged) |
| | | | |
| (Amounts in Thousands) | | Six Months Ended
June 30, 2006
(Unaudited) | |
| |
Investment Income: | | | | |
Interest | | $ | 1,083 | |
Dividends | | | 21 | |
Miscellaneous income | | | 1 | |
Total Income | | | 1,105 | |
| |
Expenses: | | | | |
Investment advisory fees | | | 64 | |
Administration fees | | | 127 | |
Servicing fees – Administrative Class | | | 38 | |
Total Expenses | | | 229 | |
| |
Net Investment Income | | | 876 | |
| |
Net Realized and Unrealized Gain (Loss): | | | | |
Net realized (loss) on investments | | | (234 | ) |
Net realized (loss) on futures contracts, options and swaps | | | (201 | ) |
Net realized (loss) on foreign currency transactions | | | (858 | ) |
Net change in unrealized (depreciation) on investments | | | (310 | ) |
Net change in unrealized appreciation on futures contracts, options and swaps | | | 522 | |
Net change in unrealized (depreciation) on translation of assets and liabilities denominated in foreign currencies | | | (150 | ) |
Net (Loss) | | | (1,231 | ) |
| |
Net (Decrease) in Net Assets Resulting from Operations | | $ | (355 | ) |
| | | | | | |
| See Accompanying Notes | | Semiannual Report | | June 30, 2006 | | 7 |
|
|
| Statements of Changes in Net Assets Foreign Bond Portfolio (U.S. Dollar-Hedged) |
| | | | | | | | |
| (Amounts in Thousands) | | Six Months Ended
June 30, 2006
(Unaudited) | | | Year Ended
December 31, 2005 | |
| | |
Increase (Decrease) in Net Assets from: | | | | | | | | |
| | |
Operations: | | | | | | | | |
Net investment income | | $ | 876 | | | $ | 1,202 | |
Net realized gain (loss) | | | (1,293 | ) | | | 2,973 | |
Net change in unrealized appreciation (depreciation) | | | 62 | | | | (1,986 | ) |
Net increase (decrease) resulting from operations | | | (355 | ) | | | 2,189 | |
| | |
Distributions to Shareholders: | | | | | | | | |
| From net investment income | | | | | | | | |
Institutional Class | | | 0 | | | | 0 | |
Administrative Class | | | (777 | ) | | | (1,087 | ) |
| From net realized capital gains | | | | | | | | |
Institutional Class | | | 0 | | | | 0 | |
Administrative Class | | | 0 | | | | (365 | ) |
| | |
Total Distributions | | | (777 | ) | | | (1,452 | ) |
| | |
Portfolio Share Transactions: | | | | | | | | |
| Receipts for shares sold | | | | | | | | |
Institutional Class | | | 0 | | | | 0 | |
Administrative Class | | | 9,424 | | | | 17,519 | |
| Issued as reinvestment of distributions | | | | | | | | |
Institutional Class | | | 0 | | | | 0 | |
Administrative Class | | | 777 | | | | 1,452 | |
| Cost of shares redeemed | | | | | | | | |
Institutional Class | | | 0 | | | | 0 | |
Administrative Class | | | (4,459 | ) | | | (8,208 | ) |
Net increase resulting from Portfolio share transactions | | | 5,742 | | | | 10,763 | |
| | |
Total Increase in Net Assets | | | 4,610 | | | | 11,500 | |
| | |
Net Assets: | | | | | | | | |
Beginning of period | | | 49,654 | | | | 38,154 | |
End of period* | | $ | 54,264 | | | $ | 49,654 | |
| | |
*Including undistributed net investment income of: | | $ | 600 | | | $ | 501 | |
| | | | |
| 8 | | PIMCO Variable Insurance Trust | | See Accompanying Notes |
| | |
| |
| Schedule of Investments Foreign Bond Portfolio (U.S. Dollar-Hedged) | | June 30, 2006 (Unaudited) |
| | | | |
| | | PRINCIPAL | | |
| | | AMOUNT | | VALUE |
| | | (000S) | | (000S) |
| | | | | |
| | | | | | | | |
| AUSTRALIA 0.0% | | | | | | | | |
| Medallion Trust | | | | | | | | |
5.275% due 07/12/2031 | | $ | | 14 | | $ | | 14 |
| | | | | | | | |
|
Total Australia (Cost $14) | | 14 |
| | | | | | | | |
|
| | | | | | | | | |
| AUSTRIA (j) 1.0% | | | | | | | | |
| Austria Government Bond | | | | | | |
5.250% due 01/04/2011 | | EUR | | 300 | | | | 406 |
3.800% due 10/20/2013 | | | | 100 | | | | 127 |
| | | | | | | | |
|
Total Austria (Cost $441) | | 533 |
| | | | | | | | |
|
| | | | | | | | | |
| CAYMAN ISLANDS 0.8% |
| MUFG Capital Finance 1 Ltd. | | | | | | |
6.346% due 07/29/2049 | | $ | | 200 | | | | 193 |
|
| Vita Capital Ltd. | | | | | | | | |
6.340% due 01/01/2007 | | | | 250 | | | | 251 |
| | | | | | | | |
|
Total Cayman Islands (Cost $450) | | 444 |
| | | | | | | | |
|
| |
| DENMARK 0.0% (j) | | | | |
| Nykredit Realkredit A/S | | | | | | | | |
6.000% due 10/01/2029 | | DKK | | 67 | | | | 12 |
| | | | | | | | |
|
Total Denmark (Cost $7) | | | | | | | | 12 |
| | | | | | | | |
|
| |
| FRANCE 1.8% (j) | | | | | | | | |
| France Government Bond | | |
4.000% due 10/25/2009 | | EUR | | 30 | | | | 39 |
5.500% due 04/25/2010 | | | | 110 | | | | 149 |
5.750% due 10/25/2032 | | | | 500 | | | | 779 |
| | | | | | | | |
|
Total France (Cost $961) | | | | | | | | 967 |
| | | | | | | | |
|
| |
| GERMANY (j) 16.2% | | | | | | |
| Amadeus Global Travel Distribution S.A. | | |
5.549% due 04/08/2013 | | EUR | | 50 | | | | 65 |
6.049% due 04/08/2014 | | | | 50 | | | | 65 |
|
| Haus Ltd. | | | | | | | | |
3.169% due 12/14/2037 | | | | 48 | | | | 57 |
|
| Landesbank Baden-Wurttemberg | | |
5.500% due 04/02/2007 | | | | 30 | | | | 39 |
|
| Republic of Germany | | | | | | | | |
4.500% due 07/04/2009 | | | | 10 | | | | 13 |
5.250% due 07/04/2010 | | | | 1,400 | | | | 1,886 |
5.250% due 01/04/2011 | | | | 300 | | | | 406 |
6.250% due 01/04/2024 | | | | 600 | | | | 955 |
6.500% due 07/04/2027 | | | | 590 | | | | 981 |
5.625% due 01/04/2028 | | | | 2,650 | | | | 3,999 |
4.750% due 07/04/2028 | | | | 30 | | | | 41 |
5.500% due 01/04/2031 | | | | 100 | | | | 150 |
4.750% due 07/04/2034 | | | | 100 | | | | 137 |
| | | | | | | | |
|
Total Germany (Cost $7,989) | | | | 8,794 |
| | | | | | | | |
|
| |
| ITALY (j) 1.7% | | | | | | | | |
| Italy Buoni Poliennali Del Tesoro |
4.500% due 05/01/2009 | | EUR | | 360 | | | | 470 |
4.250% due 11/01/2009 | | | | 60 | | | | 78 |
5.500% due 11/01/2010 | | | | 110 | | | | 150 |
|
| Seashell Securities PLC | | | | | | | | |
3.079% due 10/25/2028 | | | | 100 | | | | 126 |
|
| Telecom Italia SpA | | | | | | | | |
5.625% due 02/01/2007 | | | | 70 | | | | 91 |
| | | | | | | | |
|
Total Italy (Cost $864) | | | | | | | | 915 |
| | | | | | | | |
|
| | | | | | | | |
| JAPAN (j) 10.7% | | | | | | | | |
| Bank of Tokyo-Mitsubishi UFJ Ltd. | | |
3.500% due 12/16/2015 | | EUR | | 100 | | | | 123 |
|
| Japan Finance Corp. for Municipal Enterprises |
5.875% due 03/14/2011 | | $ | | 80 | | | | 81 |
|
| Japan Government Bond | | | | | | | | |
0.700% due 09/20/2008 | | JPY | | 10,000 | | | | 87 |
1.500% due 03/20/2014 | | | | 90,000 | | | | 772 |
1.600% due 06/20/2014 | | | | 240,000 | | | | 2,068 |
1.600% due 09/20/2014 | | | | 60,000 | | | | 516 |
2.300% due 05/20/2030 | | | | 10,000 | | | | 85 |
2.400% due 03/20/2034 | | | | 20,000 | | | | 172 |
2.300% due 06/20/2035 | | | | 70,000 | | | | 585 |
2.500% due 09/20/2035 | | | | 140,000 | | | | 1,221 |
|
| Sumitomo Mitsui Banking Corp. | | | | |
5.625% due 07/29/2049 | | $ | | 100 | | | | 93 |
| | | | | | | | |
|
Total Japan (Cost $6,197) | | | | | | | | 5,803 |
| | | | | | | | |
|
| |
| SPAIN (j) 8.0% | | | | | | | | |
| Santander U.S. Debt S.A. Unipersonal | | |
5.220% due 02/06/2009 | | $ | | 200 | | | | 200 |
|
| Spain Government Bond | | | | | | | | |
5.150% due 07/30/2009 | | EUR | | 1,210 | | | | 1,611 |
4.000% due 01/31/2010 | | | | 100 | | | | 129 |
4.400% due 01/31/2015 | | | | 1,800 | | | | 2,361 |
| | | | | | | | |
|
Total Spain (Cost $4,081) | | | | | | | | 4,301 |
| | | | | | | | |
|
| |
| UNITED KINGDOM (j) 6.9% | | |
| Lloyds TSB Bank PLC | | | | | | | | |
5.625% due 07/15/2049 | | EUR | | 40 | | | | 53 |
5.438% due 11/29/2049 | | $ | | 100 | | | | 89 |
|
| United Kingdom Gilt | | | | | | | | |
5.000% due 03/07/2008 | | GBP | | 100 | | | | 186 |
4.750% due 06/07/2010 | | | | 600 | | | | 1,108 |
5.000% due 03/07/2012 | | | | 500 | | | | 936 |
4.750% due 09/07/2015 | | | | 700 | | | | 1,297 |
|
| Vodafone Group PLC | | | | | | | | |
5.560% due 06/29/2007 | | $ | | 100 | | | | 100 |
| | | | | | | | |
|
Total United Kingdom (Cost $3,736) | | | | 3,769 |
| | | | | | | | |
|
| |
| UNITED STATES (j) 29.5% | | |
| |
| ASSET-BACKED SECURITIES 3.1% | | |
| AAA Trust | | | | | | | | |
5.422% due 04/25/2035 | | $ | | 26 | | | | 26 |
|
| Amortizing Residential Collateral Trust | | |
5.672% due 10/25/2031 | | | | 4 | | | | 4 |
5.612% due 07/25/2032 | | | | 1 | | | | 1 |
|
| Amresco Residential Securities Mortgage Loan Trust |
6.262% due 06/25/2029 | | | | 2 | | | | 2 |
|
| Argent Securities, Inc. | | | | | | | | |
5.442% due 02/25/2036 | | | | 192 | | | | 192 |
|
| Capital One Auto Finance Trust | | | | |
5.117% due 05/15/2007 | | | | 82 | | | | 82 |
|
| Centex Home Equity | | | | | | | | |
5.372% due 06/25/2036 | | | | 194 | | | | 194 |
|
| CS First Boston Mortgage Securities Corp. | | |
5.632% due 01/25/2032 | | | | 3 | | | | 3 |
|
| First Alliance Mortgage Loan Trust | | |
5.497% due 12/20/2027 | | | | 3 | | | | 3 |
|
| First Franklin Mortgage Loan Asset-Backed Certificates |
5.731% due 02/25/2034 | | | | 9 | | | | 9 |
| | | | | | | | |
| GSR Mortgage Loan Trust | | | | | | | | |
5.422% due 12/25/2030 | | $ | | 148 | | $ | | 148 |
|
| IXIS Real Estate Capital Trust |
5.382% due 08/25/2036 | | | | 97 | | | | 97 |
|
| Morgan Stanley Home Equity Loans |
5.392% due 02/25/2036 | | | | 267 | | | | 267 |
|
| Novastar Home Equity Loan | | | | |
5.597% due 04/25/2028 | | | | 5 | | | | 5 |
|
| Quest Trust | | | | |
5.882% due 06/25/2034 | | | | 31 | | | | 31 |
|
| Residential Asset Mortgage Products, Inc. |
5.662% due 09/25/2033 | | | | 1 | | | | 1 |
5.402% due 10/25/2036 | | | | 180 | | | | 181 |
|
| Residential Asset Securities Corp. | | |
5.592% due 04/25/2032 | | | | 10 | | | | 10 |
5.572% due 07/25/2032 | | | | 14 | | | | 14 |
|
| SACO I, Inc. | | | | | | | | |
5.382% due 05/25/2036 | | | | 88 | | | | 88 |
|
| Securitized Asset-Backed Receivables LLC Trust |
5.382% due 03/25/2036 | | | | 180 | | | | 180 |
|
| SLM Student Loan Trust | | | | | | | | |
5.120% due 07/25/2013 | | | | 57 | | | | 57 |
5.110% due 01/26/2015 | | | | 79 | | | | 79 |
|
| Soundview Home Equity Loan Trust | | |
5.492% due 04/25/2035 | | | | 25 | | | | 25 |
|
| Structured Asset Securities Corp. | | |
5.371% due 01/25/2033 | | | | 4 | | | | 4 |
| | | | | | | | |
|
| | | | | | | | | 1,703 |
| | | | | | | | |
|
| |
| CORPORATE BONDS & NOTES 4.6% |
| Bear Stearns Cos., Inc. | | | | | | | | |
5.356% due 01/31/2011 | | | | 200 | | | | 200 |
|
| Charter One Bank N.A. | | | | | | | | |
5.157% due 04/24/2009 | | | | 250 | | | | 250 |
|
| CIT Group, Inc. | | | | | | | | |
5.259% due 02/21/2008 | | | | 100 | | | | 100 |
|
| Citigroup, Inc. | | | | | | | | |
5.520% due 12/26/2008 | | | | 100 | | | | 100 |
|
| CMS Energy Corp. | | | | | | | | |
8.900% due 07/15/2008 | | | | 100 | | | | 104 |
7.500% due 01/15/2009 | | | | 100 | | | | 102 |
|
| ConocoPhillips Australia Funding Co. | | |
5.128% due 04/09/2009 | | | | 200 | | | | 200 |
|
| HSBC Finance Corp. | | | | | | | | |
5.500% due 01/19/2016 | | | | 200 | | | | 191 |
|
| JP Morgan & Co., Inc. | | | | | | | | |
8.019% due 02/15/2012 | | | | 10 | | | | 10 |
|
| KFW International Finance, Inc. |
1.750% due 03/23/2010 | | JPY | | 11,000 | | | | 98 |
|
| Mizuho Preferred Capital Co. LLC | | |
8.790% due 12/29/2049 | | $ | | 100 | | | | 105 |
|
| Morgan Stanley | | | | | | | | |
5.276% due 02/09/2009 | | | | 200 | | | | 200 |
|
| Oracle Corp. & Ozark Holding, Inc. | | |
5.280% due 01/13/2009 | | | | 100 | | | | 100 |
|
| SB Treasury Co. LLC | | | | | | | | |
9.400% due 12/29/2049 | | | | 100 | | | | 106 |
|
| Toyota Motor Credit Corp. | | | | | | | | |
5.140% due 10/12/2007 | | | | 100 | | | | 100 |
|
| Unicredito Italiano | | | | | | | | |
5.231% due 12/03/2007 | | | | 100 | | | | 100 |
5.307% due 12/13/2007 | | | | 100 | | | | 100 |
| | | | | | |
| See Accompanying Notes | | Semiannual Report | | June 30, 2006 | | 9 |
| | |
| |
| Schedule of Investments Foreign Bond Portfolio (U.S. Dollar-Hedged) (Cont.) | | |
| | | | |
| | | PRINCIPAL | | |
| | | AMOUNT | | VALUE |
| | | (000S) | | (000S) |
| | | | | |
| | | | | | | | |
| US Bancorp | | | | | | | | |
5.371% due 04/28/2009 | | $ | | 100 | | $ | | 100 |
|
| Wachovia Bank N.A. | | | | | | | | |
5.489% due 03/23/2009 | | | | 250 | | | | 250 |
| | | | | | | | |
|
| | | | | | | | | 2,516 |
| | | | | | | | |
|
| |
| MORTGAGE-BACKED SECURITIES 7.3% |
| Banc of America Commercial Mortgage, Inc. |
4.772% due 07/11/2043 | | | | 250 | | | | 244 |
|
| Banc of America Mortgage Securities | | |
5.000% due 05/25/2034 | | | | 204 | | | | 199 |
|
| Commercial Mortgage Asset Trust | | |
6.975% due 01/17/2032 | | | | 100 | | | | 106 |
|
| Countrywide Alternative Loan Trust | | |
5.291% due 02/25/2036 | | | | 288 | | | | 288 |
5.602% due 02/25/2036 | | | | 194 | | | | 195 |
|
| Countrywide Home Loan Mortgage Pass-Through Trust |
5.652% due 02/25/2035 | | | | 54 | | | | 55 |
5.642% due 03/25/2035 | | | | 397 | | | | 398 |
5.552% due 05/25/2035 | | | | 201 | | | | 200 |
|
| CS First Boston Mortgage Securities Corp. |
6.500% due 04/25/2033 | | | | 11 | | | | 11 |
5.872% due 08/25/2033 | | | | 13 | | | | 13 |
|
| CSAB Mortgage-Backed Trust | | | | |
5.423% due 06/25/2036 | | | | 94 | | | | 94 |
|
| First Horizon Asset Securities, Inc. | | |
6.250% due 08/25/2017 | | | | 90 | | | | 89 |
|
| GMAC Commercial Mortgage Securities, Inc. |
6.420% due 05/15/2035 | | | | 93 | | | | 94 |
|
| GMAC Mortgage Corp. Loan Trust |
5.500% due 09/25/2034 | | | | 131 | | | | 129 |
|
| Indymac Index Mortgage Loan Trust |
5.402% due 06/25/2046 | | | | 194 | | | | 194 |
|
| Mellon Residential Funding Corp. |
5.639% due 12/15/2030 | | | | 62 | | | | 62 |
|
| MLCC Mortgage Investors, Inc. | | |
5.579% due 03/15/2025 | | | | 23 | | | | 23 |
|
| Residential Accredit Loans, Inc. | | |
5.532% due 03/25/2046 | | | | 299 | | | | 299 |
|
| Sequoia Mortgage Trust | | | | | | | | |
5.567% due 08/20/2032 | | | | 30 | | | | 30 |
|
| Structured Asset Mortgage Investments, Inc. |
5.542% due 09/19/2032 | | | | 41 | | | | 41 |
5.582% due 09/19/2032 | | | | 26 | | | | 26 |
5.602% due 03/19/2034 | | | | 52 | | | | 52 |
5.542% due 09/25/2035 | | | | 300 | | | | 300 |
|
| Washington Mutual, Inc. | | | | | | | | |
5.592% due 12/25/2027 | | | | 95 | | | | 95 |
5.121% due 10/25/2032 | | | | 5 | | | | 5 |
5.009% due 02/27/2034 | | | | 32 | | | | 32 |
5.632% due 12/25/2044 | | | | 59 | | | | 59 |
5.552% due 04/25/2045 | | | | 65 | | | | 65 |
5.123% due 06/25/2046 | | | | 198 | | | | 198 |
|
| Wells Fargo Mortgage-Backed Securities Trust |
4.950% due 03/25/2036 | | | | 288 | | | | 285 |
5.240% due 05/25/2036 | | | | 92 | | | | 91 |
| | | | | | | | |
|
| | | | | | | | | 3,972 |
| | | | | | | | |
|
| |
| MUNICIPAL BONDS & NOTES 0.4% |
| Illinois State Educational Facilities Authority Revenue Bonds, Series 2003 |
5.000% due 07/01/2033 | | | | 100 | | | | 102 |
| | | | | | | | |
| Lower Colorado River, Texas Authority Revenue Notes, (FSA Insured), Series 2003 |
5.000% due 05/15/2023 | | $ | | 100 | | $ | | 102 |
| | | | | | | | |
|
| | | | | | | | | 204 |
| | | | | | | | |
|
| |
| | | | | SHARES | | | | |
| PREFERRED STOCK 1.3% | | | | | | | | |
| DG Funding Trust | | | | | | | | |
7.210% due 12/31/2049 | | | | 65 | | | | 686 |
| | | | | | | | |
|
| |
| | | | | PRINCIPAL
AMOUNT
(000S) | | | | |
| U.S. GOVERNMENT AGENCIES 8.2% |
| Fannie Mae | | | | | | | | |
4.192% due 11/01/2034 | | $ | | 414 | | | | 406 |
4.681% due 02/25/2036 | | | | 100 | | | | 97 |
4.964% due 12/01/2034 | | | | 59 | | | | 58 |
5.000% due 09/01/2018 - 07/13/2036 (c) | | | | 629 | | | | 591 |
5.211% due 10/01/2044 | | | | 193 | | | | 194 |
5.442% due 03/25/2034 | | | | 64 | | | | 64 |
5.472% due 08/25/2034 | | | | 60 | | | | 60 |
5.500% due 11/01/2016 - 02/01/2035 (c) | | | | 1,996 | | | | 1,929 |
5.672% due 09/25/2042 | | | | 100 | | | | 101 |
6.000% due 07/25/2044 | | | | 64 | | | | 64 |
|
| Freddie Mac |
5.211% due 10/25/2044 | | | | 193 | | | | 195 |
6.103% due 02/01/2029 | | | | 34 | | | | 35 |
6.530% due 11/26/2012 | | | | 300 | | | | 302 |
|
| Government National Mortgage Association |
4.375% due 04/20/2028 - 06/20/2030 (c) | | | | 32 | | | | 32 |
|
| Tennessee Valley Authority | | | | | | | | |
4.875% due 12/15/2016 | | | | 300 | | | | 300 |
| | | | | | | | |
|
| | | | | | | | | 4,428 |
| | | | | | | | |
|
| |
| U.S. TREASURY OBLIGATIONS 4.6% |
| Treasury Inflation Protected Securities (b) |
2.000% due 07/15/2014 | | | | 321 | | | | 309 |
3.625% due 04/15/2028 | | | | 125 | | | | 148 |
|
| U.S. Treasury Bond | | | | | | | | |
8.875% due 02/15/2019 | | | | 100 | | | | 133 |
8.125% due 08/15/2019 | | | | 300 | | | | 380 |
7.875% due 02/15/2021 | | | | 200 | | | | 252 |
8.125% due 05/15/2021 | | | | 400 | | | | 515 |
6.250% due 08/15/2023 | | | | 200 | | | | 221 |
|
| U.S. Treasury Note | | | | | | | | |
4.625% due 02/29/2008 | | | | 400 | | | | 396 |
4.250% due 08/15/2013 | | | | 100 | | | | 95 |
|
| U.S. Treasury Strip | | | | | | | | |
0.000% due 11/15/2021 (a) | | | | 100 | | | | 44 |
| | | | | | | | |
|
| | | | | | | | | 2,493 |
| | | | | | | | |
|
Total United States (Cost $16,317) | | | | 16,002 |
| | | | | | | | |
|
| |
| | | | | NOTIONAL
AMOUNT
(000S) | | | | |
| PURCHASED CALL OPTIONS 0.2% |
| 1-Year Interest Rate Swap (OTC) Pay 3-Month USD-LIBOR Floating Rate Index |
Strike @ 5.190% Exp. 05/09/2007 | | $ | | 61,400 | | | | 62 |
|
| 2-Year Interest Rate Swap (OTC) Pay 3-Month USD-LIBOR Floating Rate Index |
Strike @ 4.500% Exp. 10/18/2006 | | | | 2,300 | | | | 0 |
| | | | | | | | |
Strike @ 4.750% Exp. 08/07/2006 | | $ | | 4,700 | | $ | | 0 |
Strike @ 5.080% Exp. 04/19/2007 | | | | 4,600 | | | | 7 |
Strike @ 5.150% Exp. 05/08/2007 | | | | 4,700 | | | | 9 |
Strike @ 5.130% Exp. 10/25/2006 | | | | 2,300 | | | | 1 |
Strike @ 5.200% Exp. 05/09/2007 | | | | 3,300 | | | | 7 |
|
| 30-Year Interest Rate Swap (OTC) Receive 3-Month USD-LIBOR Floating Rate Index |
Strike @ 5.750% Exp. 04/27/2009 | | | | 200 | | | | 12 |
|
| U.S. dollar versus Japanese Yen (OTC) | | |
Strike @ JPY117.000 Exp. 12/11/2006 | | | | 370 | | | | 3 |
|
| |
| | | | | #OF
CONTRACTS | | | | |
| U.S. Treasury 30-Year Bond September Futures (CBOT) |
Strike @ $108.000 Exp. 08/25/2006 | | | | 9 | | | | 5 |
| | | | | | | | |
|
Total Purchased Call Options (Cost $224) | | 106 |
| | | | | | | | |
|
| |
| | | | | NOTIONAL
AMOUNT
(000S) | | | | |
| PURCHASED PUT OPTIONS 0.0% |
| 30-Year Interest Rate Swap (OTC) Receive 3-Month USD-LIBOR Floating Rate Index |
Strike @ 6.250% Exp. 04/27/2009 | | $ | | 200 | | | | 8 |
|
| |
| | | | | #OF
CONTRACTS | | | | |
| U.S. Treasury 30-Year Bond September Futures (CBOT) |
Strike @ $103.000 Exp. 08/25/2006 | | 9 | | | | 2 |
| | | | | | | | |
|
Total Purchased Put Options (Cost $20) | | 10 |
| | | | | | | | |
|
| |
| | | | | NOTIONAL
AMOUNT
(000S) | | | | |
| PURCHASED STRADDLE OPTIONS 0.0% |
| Call & Put - OTC U.S. dollar versus Japanese Yen Forward Delta Neutral Straddle |
Strike @ $0.000 (f) Exp. 08/23/2007 | | $ | | 5,000 | | | | 3 |
| | | | | | | | |
|
Total Purchased Straddle Options (Cost $0) | | 3 |
| | | | | | | | |
|
| |
| | | | | PRINCIPAL
AMOUNT
(000S) | | | | |
| SHORT-TERM INSTRUMENTS 31.0% |
| |
| CERTIFICATES OF DEPOSIT 0.6% | | |
| Countrywide Bank N.A. | | | | | | | | |
5.209% due 09/15/2006 | | $ | | 300 | | | | 300 |
| | | | | | | | |
|
| | | | | | | | | |
| COMMERCIAL PAPER 29.0% |
| Abbey National N.A. LLC | | | | | | | | |
5.100% due 07/05/2006 | | | | 1,400 | | | | 1,400 |
|
| Danske Corp. | | | | | | | | |
5.280% due 07/17/2006 | | | | 800 | | | | 798 |
4.955% due 07/20/2006 | | | | 800 | | | | 798 |
|
| Dexia Delaware LLC | | | | | | | | |
5.275% due 07/05/2006 | | | | 1,400 | | | | 1,400 |
|
| DnB NORBank ASA | | | | | | | | |
4.990% due 08/18/2006 | | | | 1,400 | | | | 1,391 |
| | | | |
| 10 | | PIMCO Variable Insurance Trust | | See Accompanying Notes |
| | |
| |
| | | June 30, 2006 (Unaudited) |
| | | | |
| | | PRINCIPAL | | |
| | | AMOUNT | | VALUE |
| | | (000S) | | (000S) |
| | | | | |
| | | | | | | | |
| Fannie Mae | | | | | | | | |
4.958% due 09/13/2006 | | $ | | 400 | | $ | | 395 |
|
| HBOS Treasury Services PLC | | | | | | | | |
4.940% due 07/13/2006 | | | | 900 | | | | 899 |
5.100% due 08/25/2006 | | | | 600 | | | | 595 |
|
| Nordea N.A., Inc. | | | | | | | | |
5.090% due 08/24/2006 | | | | 300 | | | | 298 |
5.180% due 09/08/2006 | | | | 900 | | | | 890 |
|
| Societe Generale N.A. | | | | | | | | |
5.260% due 07/05/2006 | | | | 600 | | | | 600 |
4.985% due 08/22/2006 | | | | 1,000 | | | | 993 |
|
| Spintab AB | | | | | | | | |
5.120% due 08/01/2006 | | | | 800 | | | | 797 |
|
| Svenska Handelsbanken, Inc. | | | | |
4.890% due 07/06/2006 | | | | 1,400 | | | | 1,399 |
|
| Time Warner Telecom, Inc. | | | | | | | | |
5.240% due 09/19/2006 | | | | 100 | | | | 99 |
|
| Total Captial S.A. | | | | | | | | |
5.270% due 07/03/2006 | | | | 400 | | | | 400 |
|
| UBS Finance Delaware LLC | | | | | | | | |
4.930% due 07/10/2006 | | | | 600 | | | | 599 |
5.225% due 08/08/2006 | | | | 1,000 | | | | 995 |
| | | | | | | | |
| Westpac Trust Securities NZ Ltd. | | |
4.960% due 07/20/2006 | | $ | | 1,000 | | $ | | 998 |
| | | | | | | | |
|
| | | | | | | | | 15,744 |
| | | | | | | | |
|
| |
| REPURCHASE AGREEMENT 0.8% |
| State Street Bank | | | | | | | | |
4.900% due 07/03/2006 | | | | 413 | | | | 413 |
| | | | | | | | |
|
(Dated 06/30/2006. Collateralized by Freddie Mac 2.750% due 02/09/2007 valued at $423. Repurchase proceeds are $413.) |
| |
| U.S. TREASURY BILLS 0.6% | | | | | | | | |
4.794% due 08/31/2006 -09/14/2006 (c)(e) | | | | 355 | | | | 351 |
| | | | | | | | |
|
Total Short-Term Instruments
(Cost $16,810) | | | | 16,808 |
| | | | | | | | |
|
| |
Total Investments (d) 107.8%
(Cost $58,111) | | | | | | $ | | 58,481 |
| |
Written Options (h) (0.2%)
(Premiums $235) | | | | | | | | (90) |
| |
| Other Assets and Liabilities (Net) (7.6%) | | (4,127) |
| | | | | | | | |
|
| Net Assets 100.0% | | | | | | $ | | 54,264 |
| | | | | | | | |
|
|
| Notes to Schedule of Investments (amounts in thousands, except number of contracts): |
| |
(a) Principal only security. |
| |
(b) Principal amount of security is adjusted for inflation. |
| |
(c) Securities are grouped by coupon or range of coupons and represent a range of maturities. |
| |
(d) As of June 30, 2006, portfolio securities with an aggregate market value of $681 were valued in good faith and pursuant to guidelines established by the Board of Trustees. |
| |
(e) Securities with an aggregate market value of $351 have been segregated with the custodian to cover margin requirements for the following open futures contracts on June 30, 2006: |
| |
| | | | | | | | | | |
| Description | | Type | | Expiration
Month | | # of
Contracts | | Unrealized
(Depreciation) | |
90-Day Eurodollar June Futures | | Long | | 06/2007 | | 40 | | $ | (26 | ) |
Euro-Bobl 5-Year Note September Futures | | Long | | 09/2006 | | 2 | | | (1 | ) |
Euro-Bund 10-Year Note September Futures | | Long | | 09/2006 | | 53 | | | (40 | ) |
Japan Government 10-Year Note September Futures | | Long | | 09/2006 | | 13 | | | (9 | ) |
U.S. Treasury 5-Year Note September Futures | | Long | | 09/2006 | | 17 | | | (11 | ) |
U.S. Treasury 10-Year Note September Futures | | Long | | 09/2006 | | 19 | | | (13 | ) |
U.S. Treasury 30-Year Bond September Futures | | Long | | 09/2006 | | 3 | | | (2 | ) |
| | | | | | | | |
|
|
|
| | | | | | | | | $ | (102 | ) |
| | | | | | | | |
|
|
|
(f) Exercise price and premium determined on a future date, based upon implied volatility parameters. | |
| | |
(g) Swap agreements outstanding on June 30, 2006: | |
| | | | | | | | | | | | | | | |
|
| Interest Rate Swaps | |
| Counterparty | | Floating Rate
Index | | Pay/Receive
Floating Rate | | Fixed Rate | | Expiration
Date | | Notional
Amount | | Unrealized
Appreciation/
(Depreciation) | |
Citibank N.A. | | 6-month Australian Bank Bill | | Pay | | 6.000% | | 06/15/2010 | | AUD | 700 | | $ | (8 | ) |
Citibank N.A. | | 6-month Australian Bank Bill | | Receive | | 6.000% | | 06/15/2015 | | | 400 | | | 7 | |
Deutsche Bank AG | | 6-month Australian Bank Bill | | Pay | | 6.000% | | 12/15/2011 | | | 500 | | | (2 | ) |
Deutsche Bank AG | | 6-month Australian Bank Bill | | Receive | | 6.000% | | 12/15/2016 | | | 300 | | | 2 | |
HSBC Bank USA | | 6-month Australian Bank Bill | | Pay | | 6.000% | | 12/15/2011 | | | 300 | | | (1 | ) |
HSBC Bank USA | | 6-month Australian Bank Bill | | Receive | | 6.000% | | 12/15/2016 | | | 200 | | | 1 | |
UBS Warburg LLC | | 6-month Australian Bank Bill | | Pay | | 6.000% | | 06/15/2010 | | | 2,700 | | | (41 | ) |
UBS Warburg LLC | | 6-month Australian Bank Bill | | Receive | | 6.000% | | 06/15/2015 | | | 1,500 | | | 34 | |
Bank of America | | 3-month Canadian Bank Bill | | Receive | | 5.500% | | 12/16/2014 | | CAD | 500 | | | 6 | |
Royal Bank of Canada | | 3-month Canadian Bank Bill | | Receive | | 5.000% | | 06/15/2015 | | | 200 | | | 2 | |
| | | | | | |
| See Accompanying Notes | | Semiannual Report | | June 30, 2006 | | 11 |
Schedule of Investments Foreign Bond Portfolio (U.S. Dollar-Hedged) (Cont.)
| | | | | | | | | | | | | | | |
| Counterparty | | Floating Rate
Index | | Pay/Receive
Floating Rate | | Fixed Rate | | Expiration
Date | | Notional
Amount | | Unrealized
Appreciation/
(Depreciation) | |
BNP Paribas Bank | | 6-month EUR-LIBOR | | Pay | | 6.000% | | 06/18/2034 | | EUR | 100 | | $ | 1 | |
Citibank N.A. | | 6-month EUR-LIBOR | | Receive | | 5.000% | | 06/17/2012 | | | 200 | | | 11 | |
Citibank N.A. | | 6-month EUR-LIBOR | | Receive | | 4.000% | | 12/15/2014 | | | 1,280 | | | 85 | |
Citibank N.A. | | 6-month EUR-LIBOR | | Receive | | 4.500% | | 06/17/2015 | | | 100 | | | 6 | |
Citibank N.A. | | 6-month EUR-LIBOR | | Pay | | 6.000% | | 06/18/2034 | | | 100 | | | (10 | ) |
Deutsche Bank AG | | 6-month EUR-LIBOR | | Receive | | 4.000% | | 12/15/2011 | | | 200 | | | 0 | |
Goldman Sachs & Co. | | 6-month EUR-LIBOR | | Pay | | 4.000% | | 06/17/2010 | | | 200 | | | (2 | ) |
Goldman Sachs & Co. | | 6-month EUR-LIBOR | | Receive | | 4.000% | | 12/15/2014 | | | 600 | | | (1 | ) |
HSBC Bank USA | | 6-month EUR-LIBOR | | Receive | | 4.000% | | 12/15/2014 | | | 200 | | | 6 | |
J.P. Morgan Chase & Co. | | 6-month EUR-LIBOR | | Pay | | 4.000% | | 06/17/2010 | | | 200 | | | (8 | ) |
J.P. Morgan Chase & Co. | | 6-month EUR-LIBOR | | Receive | | 5.000% | | 06/17/2012 | | | 100 | | | 5 | |
Lehman Brothers, Inc. | | 6-month EUR-LIBOR | | Receive | | 4.000% | | 12/15/2014 | | | 400 | | | 27 | |
Merrill Lynch & Co., Inc. | | 6-month EUR-LIBOR | | Receive | | 4.000% | | 12/15/2014 | | | 2,600 | | | 171 | |
Morgan Stanley Dean Witter & Co. | | 6-month EUR-LIBOR | | Pay | | 4.000% | | 06/17/2010 | | | 100 | | | (4 | ) |
Morgan Stanley Dean Witter & Co. | | 6-month EUR-LIBOR | | Receive | | 4.000% | | 12/15/2011 | | | 2,000 | | | 15 | |
Morgan Stanley Dean Witter & Co. | | 6-month EUR-LIBOR | | Receive | | 4.000% | | 12/15/2014 | | | 300 | | | 18 | |
Morgan Stanley Dean Witter & Co. | | 6-month EUR-LIBOR | | Receive | | 4.500% | | 06/17/2015 | | | 400 | | | 44 | |
Morgan Stanley Dean Witter & Co. | | 6-month EUR-LIBOR | | Pay | | 6.000% | | 06/18/2034 | | | 1,100 | | | (4 | ) |
UBS Warburg LLC | | 6-month EUR-LIBOR | | Pay | | 4.000% | | 06/17/2010 | | | 200 | | | (9 | ) |
Barclays Bank PLC | | 6-month GBP-LIBOR | | Pay | | 5.000% | | 09/15/2010 | | GBP | 2,800 | | | (67 | ) |
Barclays Bank PLC | | 6-month GBP-LIBOR | | Receive | | 5.000% | | 09/15/2015 | | | 500 | | | 4 | |
Barclays Bank PLC | | 6-month GBP-LIBOR | | Pay | | 5.000% | | 06/18/2034 | | | 200 | | | (4 | ) |
Deutsche Bank AG | | 6-month GBP-LIBOR | | Pay | | 5.000% | | 06/15/2009 | | | 1,800 | | | 2 | |
Deutsche Bank AG | | 6-month GBP-LIBOR | | Receive | | 5.000% | | 09/15/2015 | | | 300 | | | 10 | |
Deutsche Bank AG | | 6-month GBP-LIBOR | | Receive | | 4.250% | | 06/12/2036 | | | 100 | | | 8 | |
Goldman Sachs & Co. | | 6-month GBP-LIBOR | | Receive | | 4.250% | | 06/12/2036 | | | 600 | | | 11 | |
HSBC Bank USA | | 6-month GBP-LIBOR | | Pay | | 5.000% | | 09/15/2010 | | | 1,400 | | | (34 | ) |
Merrill Lynch & Co., Inc. | | 6-month GBP-LIBOR | | Pay | | 5.000% | | 09/15/2010 | | | 1,000 | | | (24 | ) |
Morgan Stanley Dean Witter & Co. | | 6-month GBP-LIBOR | | Pay | | 5.000% | | 09/15/2015 | | | 300 | | | (1 | ) |
Goldman Sachs & Co. | | 3-month HKD-HIBOR | | Receive | | 4.235% | | 12/17/2008 | | HKD | 7,100 | | | 16 | |
Barclays Bank PLC | | 6-month JPY-LIBOR | | Receive | | 2.000% | | 12/15/2015 | | JPY | 30,000 | | | 3 | |
Deutsche Bank AG | | 6-month JPY-LIBOR | | Pay | | 1.000% | | 03/18/2008 | | | 100,000 | | | 0 | |
Deutsche Bank AG | | 6-month JPY-LIBOR | | Receive | | 2.000% | | 12/15/2015 | | | 50,000 | | | 4 | |
Goldman Sachs & Co. | | 6-month JPY-LIBOR | | Pay | | 1.000% | | 03/18/2008 | | | 400,000 | | | (2 | ) |
Goldman Sachs & Co. | | 6-month JPY-LIBOR | | Receive | | 2.020% | | 05/18/2010 | | | 17,000 | | | (4 | ) |
Goldman Sachs & Co. | | 6-month JPY-LIBOR | | Receive | | 1.300% | | 09/21/2011 | | | 40,000 | | | 5 | |
Goldman Sachs & Co. | | 6-month JPY-LIBOR | | Receive | | 2.000% | | 12/15/2015 | | | 350,000 | | | 19 | |
Merrill Lynch & Co., Inc. | | 6-month JPY-LIBOR | | Receive | | 2.000% | | 12/15/2015 | | | 50,000 | | | 4 | |
Morgan Stanley Dean Witter & Co. | | 6-month JPY-LIBOR | | Receive | | 2.000% | | 12/20/2013 | | | 130,000 | | | 14 | |
Morgan Stanley Dean Witter & Co. | | 6-month JPY-LIBOR | | Receive | | 2.000% | | 12/15/2015 | | | 420,000 | | | 29 | |
UBS Warburg LLC | | 6-month JPY-LIBOR | | Receive | | 0.800% | | 03/20/2012 | | | 50,000 | | | 4 | |
UBS Warburg LLC | | 6-month JPY-LIBOR | | Receive | | 2.000% | | 12/20/2013 | | | 190,000 | | | 28 | |
Bank of America | | 3-month USD-LIBOR | | Receive | | 5.000% | | 12/20/2016 | | $ | 200 | | | 2 | |
Bank of America | | 3-month USD-LIBOR | | Pay | | 5.000% | | 12/20/2036 | | | 500 | | | (5 | ) |
Goldman Sachs & Co. | | 3-month USD-LIBOR | | Receive | | 5.000% | | 12/20/2016 | | | 1,200 | | | 15 | |
J.P. Morgan Chase & Co. | | 3-month USD-LIBOR | | Pay | | 5.000% | | 12/20/2011 | | | 400 | | | (1 | ) |
J.P. Morgan Chase & Co. | | 3-month USD-LIBOR | | Receive | | 5.000% | | 12/20/2016 | | | 100 | | | 1 | |
Lehman Brothers, Inc. | | 3-month USD-LIBOR | | Pay | | 5.000% | | 12/20/2011 | | | 500 | | | (4 | ) |
Lehman Brothers, Inc. | | 3-month USD-LIBOR | | Receive | | 5.000% | | 12/20/2013 | | | 4,700 | | | 55 | |
Lehman Brothers, Inc. | | 3-month USD-LIBOR | | Receive | | 5.000% | | 12/20/2016 | | | 800 | | | 10 | |
Lehman Brothers, Inc. | | 3-month USD-LIBOR | | Pay | | 5.000% | | 12/20/2036 | | | 500 | | | (5 | ) |
Morgan Stanley Dean Witter & Co. | | 3-month USD-LIBOR | | Receive | | 5.000% | | 12/20/2016 | | | 1,900 | | | 23 | |
Royal Bank of Scotland PLC | | 3-month USD-LIBOR | | Pay | | 5.000% | | 12/20/2011 | | | 2,600 | | | (23 | ) |
| | | | | | | | | | | | | |
|
|
|
| | | | | | | | | | | | | | $ | 444 | |
| | | | | | | | | | | | | |
|
|
|
| | | | | | | | | | | | | | |
|
| Credit Default Swaps |
| Counterparty | | Reference Entity | | Buy/Sell
Protection+ | | (Pay)/Receive
Fixed Rate | | Expiration
Date | | Notional
Amount | | Unrealized
Appreciation |
Merrill Lynch & Co., Inc. | | Russia Government International Bond, 5.000% until 03/31/2007 and 7.500% thereafter, due 03/31/2030 | | Sell | | 0.410% | | 06/20/2007 | | $ | 100 | | $ | 0 |
UBS Warburg LLC | | Russia Government International Bond, 5.000% until 03/31/2007 and 7.500% thereafter, due 03/31/2030 | | Receive | | 5.000% | | 12/20/2026 | | | 900 | | | 1 |
| | | | | | | | | | | | | |
|
|
| | | | | | | | | | | | | | $ | 1 |
| | | | | | | | | | | | | |
|
|
|
| + If the Portfolio is a seller of protection and a credit event occurs, as defined under the terms of that particular swap agreement, the Portfolio will pay to the buyer of the protection an amount up to the notional value of the swap and in certain instances, take delivery of the security. As a buyer of protection, the Portfolio will generally receive from the seller of protection an amount up to the notional amount of the swap if a credit event occurs. |
| | | | |
| 12 | | PIMCO Variable Insurance Trust | | See Accompanying Notes |
| | |
| |
| | | June 30, 2006 (Unaudited) |
| | | | | | | | | | | | |
(h) Written options outstanding on June 30, 2006: |
Options on Exchange-Traded Futures Contracts
| | | | | | | | | | | | |
| Description | | Exercise
Price | | Expiration
Date | | # of
Contracts | | Premium | | Value |
Call - CBOT U.S. Treasury 10-Year Note September Futures | | $ 106.000 | | 08/25/2006 | | 15 | | $ | 9 | | $ | 4 |
Put - CBOT U.S. Treasury 10-Year Note September Futures | | 103.000 | | 08/25/2006 | | 15 | | | 5 | | | 2 |
| | | | | | | | |
|
| |
|
|
| | | | | | | | | $ | 14 | | $ | 6 |
| | | | | | | | |
|
| |
|
|
| | | | | | | | | | | | | | | | | | | | |
| | |
| Interest Rate Swaptions | | | | | | | |
| Description | | Counterparty | | Floating Rate
Index | | Pay/Receive
Floating Rate | | Exercise
Rate | | Expiration
Date | | Notional
Amount | | Premium | | Value | |
Call - OTC 5-Year Interest Rate Swap | | Goldman Sachs & Co. | | 3-month USD-LIBOR | | Receive | | 4.780% | | 08/07/2006 | | $ | 2,000 | | $ | 16 | | $ | 0 | |
Call - OTC 5-Year Interest Rate Swap | | Goldman Sachs & Co. | | 3-month USD-LIBOR | | Receive | | 5.210% | | 10/25/2006 | | | 1,000 | | | 4 | | | 1 | |
Call - OTC 5-Year Interest Rate Swap | | J.P. Morgan Chase & Co. | | 3-month USD-LIBOR | | Receive | | 4.560% | | 10/18/2006 | | | 1,000 | | | 10 | | | 0 | |
Call - OTC 5-Year Interest Rate Swap | | Royal Bank of Scotland PLC | | 3-month USD-LIBOR | | Receive | | 5.220% | | 04/19/2007 | | | 2,000 | | | 16 | | | 9 | |
Call - OTC 5-Year Interest Rate Swap | | Royal Bank of Scotland PLC | | 3-month USD-LIBOR | | Receive | | 5.280% | | 05/08/2007 | | | 2,000 | | | 18 | | | 11 | |
Call - OTC 5-Year Interest Rate Swap | | Royal Bank of Scotland PLC | | 3-month USD-LIBOR | | Receive | | 5.315% | | 05/09/2007 | | | 13,700 | | | 127 | | | 82 | |
Call - OTC 5-Year Interest Rate Swap | | Royal Bank of Scotland PLC | | 3-month USD-LIBOR | | Receive | | 5.315% | | 05/09/2007 | | | 1,400 | | | 13 | | | 8 | |
| | | | | | | | | | | | |
|
| |
|
|
|
| | | | | | | | | | | | | | | | $ | 204 | | $ | 111 | |
| | | | | | | | | | | | | | | |
|
| |
|
|
|
| | |
| Straddle Options | | | | | | | |
| Description | | Counterparty | | Exercise Price* | | Expiration
Date | | Notional
Amount | | Premium* | | Value | |
Call & Put - OTC U.S. dollar versus Japanese Yen Forward Delta Neutral Straddle | | Goldman Sachs & Co. | | $ 0.000 | | 08/23/2007 | | $ | 4,600 | | $ | 17 | | $ | (27 | ) |
| | | | | | | | | | | | | | | |
|
| |
|
|
|
|
* Exercise price and final premium determined on a future date, based upon implied volatility parameters. | |
| | | | | | | | | | | | | |
(i) Short sales outstanding on June 30, 2006: |
| Description | | Coupon | | Maturity
Date | | Principal
Amount | | Proceeds | | Value |
Fannie Mae | | 5.500% | | 07/13/2036 | | $ | 400 | | $ | 387 | | $ | 384 |
| | | | | | | | | |
|
| |
|
|
| | | | | | |
| See Accompanying Notes | | Semiannual Report | | June 30, 2006 | | 13 |
Schedule of Investments Foreign Bond Portfolio (U.S. Dollar-Hedged) (Cont.)
| | | | | | | | | | | | | | | | | |
(j) Forward foreign currency contracts outstanding on June 30, 2006: | |
| Type | | | | Principal
Amount
Covered by
Contract | | Settlement
Month | | Unrealized
Appreciation | | Unrealized
(Depreciation) | | | Net Unrealized
Appreciation/
(Depreciation) | |
Buy | | BRL | | 30 | | 07/2006 | | $ | 1 | | $ | 0 | | | $ | 1 | |
Sell | | | | 30 | | 07/2006 | | | 0 | | | 0 | | | | 0 | |
Buy | | | | 31 | | 08/2006 | | | 1 | | | 0 | | | | 1 | |
Buy | | | | 30 | | 09/2006 | | | 0 | | | 0 | | | | 0 | |
Buy | | CLP | | 4,000 | | 07/2006 | | | 0 | | | 0 | | | | 0 | |
Sell | | | | 4,000 | | 07/2006 | | | 0 | | | 0 | | | | 0 | |
Buy | | | | 6,033 | | 08/2006 | | | 0 | | | 0 | | | | 0 | |
Buy | | | | 4,000 | | 09/2006 | | | 0 | | | 0 | | | | 0 | |
Buy | | CNY | | 3,712 | | 05/2007 | | | 0 | | | (5 | ) | | | (5 | ) |
Sell | | DKK | | 178 | | 09/2006 | | | 0 | | | 0 | | | | 0 | |
Buy | | EUR | | 21 | | 07/2006 | | | 0 | | | 0 | | | | 0 | |
Sell | | | | 8,583 | | 07/2006 | | | 0 | | | (198 | ) | | | (198 | ) |
Buy | | GBP | | 60 | | 07/2006 | | | 1 | | | 0 | | | | 1 | |
Sell | | | | 1,817 | | 07/2006 | | | 0 | | | (13 | ) | | | (13 | ) |
Buy | | HKD | | 475 | | 07/2006 | | | 0 | | | 0 | | | | 0 | |
Sell | | | | 475 | | 07/2006 | | | 0 | | | 0 | | | | 0 | |
Buy | | | | 475 | | 09/2006 | | | 0 | | | 0 | | | | 0 | |
Buy | | JPY | | 12,529 | | 07/2006 | | | 0 | | | 0 | | | | 0 | |
Sell | | | | 507,968 | | 07/2006 | | | 25 | | | 0 | | | | 25 | |
Buy | | | | 3,912 | | 08/2006 | | | 0 | | | 0 | | | | 0 | |
Buy | | KRW | | 13,000 | | 07/2006 | | | 0 | | | 0 | | | | 0 | |
Sell | | | | 13,000 | | 07/2006 | | | 0 | | | 0 | | | | 0 | |
Buy | | | | 98,732 | | 08/2006 | | | 2 | | | 0 | | | | 2 | |
Buy | | | | 41,181 | | 09/2006 | | | 1 | | | 0 | | | | 1 | |
Buy | | MXN | | 277 | | 08/2006 | | | 0 | | | (2 | ) | | | (2 | ) |
Buy | | | | 68 | | 09/2006 | | | 0 | | | 0 | | | | 0 | |
Buy | | NZD | | 29 | | 08/2006 | | | 0 | | | 0 | | | | 0 | |
Buy | | PEN | | 51 | | 08/2006 | | | 0 | | | 0 | | | | 0 | |
Sell | | | | 51 | | 08/2006 | | | 0 | | | 0 | | | | 0 | |
Buy | | PLN | | 34 | | 08/2006 | | | 0 | | | (1 | ) | | | (1 | ) |
Buy | | | | 15 | | 09/2006 | | | 0 | | | 0 | | | | 0 | |
Buy | | | | 32 | | 11/2006 | | | 0 | | | 0 | | | | 0 | |
Buy | | RUB | | 201 | | 07/2006 | | | 0 | | | 0 | | | | 0 | |
Sell | | | | 200 | | 07/2006 | | | 0 | | | 0 | | | | 0 | |
Buy | | | | 457 | | 08/2006 | | | 1 | | | 0 | | | | 1 | |
Buy | | | | 200 | | 09/2006 | | | 0 | | | 0 | | | | 0 | |
Buy | | SGD | | 11 | | 07/2006 | | | 0 | | | 0 | | | | 0 | |
Sell | | | | 11 | | 07/2006 | | | 0 | | | 0 | | | | 0 | |
Buy | | | | 165 | | 08/2006 | | | 0 | | | (1 | ) | | | (1 | ) |
Buy | | | | 11 | | 09/2006 | | | 0 | | | 0 | | | | 0 | |
Buy | | SKK | | 478 | | 08/2006 | | | 0 | | | 0 | | | | 0 | |
Buy | | | | 362 | | 09/2006 | | | 0 | | | 0 | | | | 0 | |
Buy | | TWD | | 3,537 | | 08/2006 | | | 0 | | | (3 | ) | | | (3 | ) |
Buy | | ZAR | | 70 | | 08/2006 | | | 0 | | | (1 | ) | | | (1 | ) |
| | | | | | | | |
|
| |
|
|
|
| | | | | | | | | $ | 32 | | $ | (224 | ) | | $ | (192 | ) |
| | | | | | | | |
|
| |
|
|
| |
|
|
|
| | | | |
| 14 | | PIMCO Variable Insurance Trust | | See Accompanying Notes |
| | |
| |
| Notes to Financial Statements | | June 30, 2006 (Unaudited) |
1. ORGANIZATION
The Foreign Bond Portfolio U.S. Dollar-Hedged (the “Portfolio”) is a series of the PIMCO Variable Insurance Trust (the “Trust”). The Trust is registered under the Investment Company Act of 1940 (the “Act”), as amended, as an open-end investment management company organized as a Delaware business trust on October 3, 1997. The Portfolio offers two classes of shares: Institutional and Administrative. Information presented in these financial statements pertains to the Administrative Class of the Portfolio. Certain detailed financial information for the Institutional Class is provided separately and is available upon request. The Trust is designed to be used as an investment vehicle by Separate Accounts of insurance companies that fund variable annuity contracts and variable life insurance policies and by qualified pension and retirement plans.
2. SIGNIFICANT ACCOUNTING POLICIES
The following is a summary of significant accounting policies consistently followed by the Portfolio in the preparation of its financial statements in conformity with accounting principles generally accepted in the United States of America (“GAAP”). The preparation of financial statements in accordance with GAAP requires management to make estimates and assumptions that affect the reported amounts and disclosures in the financial statements. Actual results could differ from those estimates.
Security Valuation. Portfolio securities are valued as of the close of regular trading (normally 4:00 p.m., Eastern Time) on each day that the New York Stock Exchange (“NYSE”) is open. Portfolio securities and other assets for which market quotes are readily available are stated at market value. Market value is generally determined on the basis of last reported sales prices, or if no sales are reported, based on quotes obtained from a quotation reporting system, established market makers, or pricing services. Fixed-income securities and non-exchange traded derivatives are normally valued on the basis of quotes obtained from brokers and dealers or pricing services. Prices obtained from independent pricing services use information provided by market makers or estimates of market values obtained from yield data relating to investments or securities with similar characteristics. Certain fixed-income securities purchased on a delayed-delivery basis are marked to market daily until settlement at the forward settlement date. Short-term investments having a maturity of 60 days or less are generally valued at amortized cost. Exchange traded options, futures and options on futures are valued at the settlement price determined by the relevant exchange.
Investments initially valued in currencies other than the U.S. dollar are converted to the U.S. dollar using exchange rates obtained from pricing services. As a result, the NAV of the Portfolio’s shares may be affected by changes in the value of currencies in relation to the U.S. dollar. The value of securities traded in markets outside the United States or denominated in currencies other than the U.S. dollar may be affected significantly on a day that the NYSE is closed and an investor is not able to purchase, redeem or exchange shares.
Securities and other assets for which market quotes are not readily available are valued at fair value as determined in good faith by the Board of Trustees or persons acting at their direction. The Board of Trustees has adopted methods for valuing securities and other assets in circumstances where market quotes are not readily available, and has delegated to Pacific Investment Management Company LLC (“PIMCO”) the responsibility for applying the valuation methods. In the event that market quotes are not readily available, and the security or asset cannot be valued pursuant to one of the valuation methods, the value of the security or asset will be determined in good faith by the Valuation Committee of the Board of Trustees, generally based upon recommendations provided by PIMCO.
Market quotes are considered not readily available in circumstances where there is an absence of current or reliable market-based data (e.g., trade information, bid/asked information, broker quotes), including where events occur after the close of the relevant market, but prior to the close of regular trading, that materially affect the values of the Portfolio’s securities or assets. In addition, market quotes are considered not readily available when, due to extraordinary circumstances, the exchanges or markets on which the securities trade do not open for trading for the entire day and no other market prices are available. The Board has delegated to PIMCO the responsibility for monitoring significant events that may materially affect the values of the Portfolio’s securities or assets and for determining whether the value of the applicable securities or assets should be re-evaluated in light of such significant events. When the Portfolio uses fair value pricing to determine its NAV, securities will not be priced on the basis of quotations from the primary market in which they are traded, but rather may be priced by another method that the Board of Trustees or persons acting at their direction believe accurately reflects fair value. The Trust’s policy is intended to result in a calculation of the Portfolio’s NAV that fairly reflects security values as of the time of pricing. However, fair values determined by the Board of Trustees or persons acting at their direction may not accurately reflect the price that the Portfolio could obtain for a security if it were to dispose of that security as of the time of pricing. Because foreign securities can trade on non-business days, the NAV of the Portfolio may change on days when shareholders will not be able to purchase or redeem shares. The prices used by the Portfolio may differ from the value that would be realized if the securities were sold and the differences could be material to the financial statements.
Securities Transactions and Investment Income. Securities transactions are recorded as of the trade date. Securities purchased or sold on a when-issued or delayed-delivery basis may be settled a month or more after the trade date. Realized gains and losses from securities sold are recorded on the identified cost basis. Dividend income is recorded on the ex-dividend date, except certain dividends from foreign securities where the ex-dividend date may have passed, which are recorded as soon as the Portfolio is informed of the ex-dividend date. Interest income, adjusted for the accretion of discounts and amortization of premiums, is recorded on the accrual basis. Paydown gains and losses on mortgage-related or asset-backed securities are recorded as components of interest income in the Statement of Operations.
Dividends and Distributions to Shareholders. Dividends from net investment income, if any, are declared on each day the Portfolio is open for business and are distributed to shareholders monthly. Net realized capital gains earned by the Portfolio, if any, will be distributed no less frequently than once each year. Most shareholders choose to reinvest their dividends and capital gain distribution in additional shares of the Portfolio.
Income dividends and capital gain distributions are determined in accordance with income tax regulations which may differ from GAAP. Differences between tax regulations and GAAP may change the fiscal year when income and capital items are recognized for tax and GAAP purposes. Examples of events that give rise to timing differences include wash sales, straddles, net operating losses and capital loss carryforwards. Further, the character of investment income and capital gains may be different for certain transactions under the two methods of accounting. Examples of characterization differences include the treatment of mortgage paydowns, swaps, foreign currency transactions and contingent debt instruments. As a result, income dividends and capital gain distributions declared during a fiscal period may differ significantly from the net investment income and realized capital gain reported in the Portfolio’s annual financial statements presented under GAAP.
| | | | | | |
| | | Semiannual Report | | June 30, 2006 | | 15 |
Notes to Financial Statements (Cont.)
Distributions classified as a tax basis return of capital, if any, are reflected in the accompanying Statements of Changes in Net Assets and have been reclassified to paid in capital. In addition, other amounts have been reclassified between undistributed net investment income, accumulated undistributed net realized gains or losses and/or paid in capital to more appropriately conform financial accounting to tax characterizations of dividend distributions.
Multiclass Operations. Each class offered by the Portfolio has equal rights as to assets and voting privileges (except that shareholders of a class have exclusive voting rights regarding any matter relating solely to that class of shares). Income and non-class specific expenses of the Portfolio are allocated daily to each class of shares based on the relative value of settled shares. Realized and unrealized capital gains and losses of the Portfolio are allocated daily to each class of shares based on the relative net assets of each class. Class specific expenses, where applicable, currently include administrative, distribution and servicing fees.
Loan Participations and Assignments. The Portfolio may invest in direct debt instruments which are interests in amounts owned by corporate, governmental, or other borrowers to lenders or lending syndicates. The Portfolio’s investments in loans may be in the form of participations in loans or assignments of all or a portion of loans from third parties. A loan is often administered by a bank or other financial institution (the “lender”) that acts as agent for all holders. The agent administers the terms of the loan, as specified in the loan agreement. When investing in a loan participation, the Portfolio has the right to receive payments of principal, interest and any fees to which it is entitled only from the lender selling the loan agreement and only upon receipt by the lender of payments from the borrower. The Portfolio generally has no right to enforce compliance with the terms of the loan agreement with the borrower. As a result, the Portfolio may be subject to the credit risk of both the borrower and the lender that is selling the loan agreement. When the Portfolio purchases assignments from lenders it acquires direct rights against the borrower on the loan. At the end of the period, the Portfolio had no unfunded loan commitments.
Delayed-Delivery Transactions. The Portfolio may purchase or sell securities on a when-issued or delayed-delivery basis. These transactions involve a commitment by the Portfolio to purchase or sell securities for a predetermined price or yield, with payment and delivery taking place beyond the customary settlement period. When delayed-delivery purchases are outstanding, the Portfolio will designate liquid assets in an amount sufficient to meet the purchase price. When purchasing a security on a delayed-delivery basis, the Portfolio assumes the rights and risks of ownership of the security, including the risk of price and yield fluctuations, and takes such fluctuations into account when determining its net asset value. The Portfolio may dispose of or renegotiate a delayed-delivery transaction after it is entered into, and may sell when-issued securities before they are delivered, which may result in a capital gain or loss. When the Portfolio has sold a security on a delayed-delivery basis, the Portfolio does not participate in future gains and losses with respect to the security.
Federal Income Taxes. The Portfolio intends to qualify as a regulated investment company under sub-chapter M of the Internal Revenue Code and distribute all of its taxable income and net realized gains, if applicable, to shareholders. Accordingly, no provision for Federal income taxes has been made.
Foreign Currency. The accounting records of the Portfolio are maintained in U.S. dollar. The market values of foreign securities, currency holdings and other assets and liabilities are translated into U.S. dollar based on the current exchange rates each business day. Fluctuations in the value of currency holdings and other assets and liabilities resulting from changes in exchange rates are recorded as unrealized foreign currency gains or losses. Realized gains or losses and unrealized appreciation or depreciation on investment securities and income and expenses are translated on the respective dates of such transactions. The effects of changes in foreign currency exchange rates on investments in securities are not segregated in the Statement of Operations from the effects of changes in market prices of those securities, but are included with the net realized and unrealized gain or loss on investment securities.
| | | | | | |
|
| Non-U.S. currency symbols utilized throughout the report are defined as follows: |
| AUD | | Australian Dollar | | KRW | | South Korean Won |
| BRL | | Brazilian Real | | MXN | | Mexican Peso |
| CAD | | Canadian Dollar | | NZD | | New Zealand Dollar |
| CLP | | Chilean Peso | | PEN | | Peruvian New Sol |
| CNY | | Chinese Yuan Renminbi | | PLN | | Polish Zloty |
| DKK | | Danish Krone | | RUB | | Russian Ruble |
| EUR | | Euro | | SGD | | Singapore Dollar |
| GBP | | British Pound | | SKK | | Slovakian Koruna |
| HKD | | Hong Kong Dollar | | TWD | | Taiwan Dollar |
| JPY | | Japanese Yen | | ZAR | | South African Rand |
Forward Currency Transactions. The Portfolio may enter into forward currency contracts in connection with settling planned purchases or sales of securities, to hedge the currency exposure associated with some or all of the Portfolio’s securities or as a part of an investment strategy. A forward currency contract is an agreement between two parties to buy and sell a currency at a set price on a future date. The market value of a forward currency contract fluctuates with changes in forward currency exchange rates. Forward currency contracts are marked to market daily and the change in value is recorded by the Portfolio as an unrealized gain or loss. Realized gains or losses equal to the difference between the value of the contract at the time it was opened and the value at the time it was closed are recorded upon delivery or receipt of the currency or, if a forward currency contract is offset by entering into another forward currency contract with the same broker, upon settlement of the net gain or loss. These contracts may involve market risk in excess of the unrealized gain or loss reflected in the Portfolio’s Statement of Assets and Liabilities. In addition, the Portfolio could be exposed to risk if the counterparties are unable to meet the terms of the contracts or if the value of the currency changes unfavorably to the U.S. dollar.
Futures Contracts. The Portfolio is authorized to enter into futures contracts. The Portfolio may use futures contracts to manage its exposure to the securities markets or to movements in interest rates and currency values. The primary risks associated with the use of futures contracts are the imperfect correlation between the change in market value of the securities held by the Portfolio and the prices of futures contracts, the possibility of an illiquid market, and the inability of the counterparty to meet the terms of the contract. Futures contracts are valued based upon their quoted daily settlement prices. Upon entering into a futures contract, the Portfolio is required to deposit with its custodian, in a segregated account in the name of the futures broker, an amount of cash or U.S. Government and Agency Obligations in accordance with the initial margin requirements of the broker or exchange. Futures contracts are marked to market daily and an appropriate payable or receivable for the change in value (“variation margin”) is recorded by the Portfolio. Gains or losses are recognized but not considered realized until the contracts expire or are closed. Futures contracts involve, to varying degrees, risk of loss in excess of the variation margin disclosed in the Statement of Assets and Liabilities.
Inflation-Indexed Bonds. The Portfolio may invest in inflation-indexed bonds. Inflation-indexed bonds are fixed-income securities whose principal value is periodically adjusted to the rate of inflation. The interest rate on these bonds is generally fixed at issuance at a rate lower than typical bonds. Over the life of an
| | | | |
| 16 | | PIMCO Variable Insurance Trust | | |
| | |
| |
| | | June 30, 2006 (Unaudited) |
inflation-indexed bond, however, interest will be paid based on a principal value, which is adjusted for inflation. Any increase in the principal amount of an inflation-indexed bond will be included as interest income in the Statement of Operations, even though investors do not receive their principal until maturity.
Options Contracts. The Portfolio may write call and put options on futures, swaps, securities or currencies it owns or in which it may invest. Writing put options tends to increase the Portfolio’s exposure to the underlying instrument. Writing call options tends to decrease the Portfolio’s exposure to the underlying instrument. When the Portfolio writes a call or put option, an amount equal to the premium received is recorded as a liability and subsequently marked to market to reflect the current value of the option written. These liabilities are reflected as written options outstanding in the Statement of Assets and Liabilities. Certain options may be written with premiums to determined on a future date. The premiums for these options are based upon implied volatility parameters at specified terms. Premiums received from writing options which expire are treated as realized gains. Premiums received from writing options which are exercised or closed are added to the proceeds or offset against amounts paid on the underlying future, swap, security or currency transaction to determine the realized gain or loss. The Portfolio as a writer of an option has no control over whether the underlying future, swap, security or currency may be sold (call) or purchased (put) and as a result bears the market risk of an unfavorable change in the price of the future, swap, security or currency underlying the written option. There is the risk the Portfolio may not be able to enter into a closing transaction because of an illiquid market.
The Portfolio may also purchase put and call options. Purchasing call options tends to increase the Portfolio’s exposure to the underlying instrument. Purchasing put options tends to decrease the Portfolio’s exposure to the underlying instrument. The Portfolio pays a premium which is included in the Portfolio’s Statement of Assets and Liabilities as an investment and subsequently marked to market to reflect the current value of the option. Premiums paid for purchasing options which expire are treated as realized losses. Certain options may be purchased with premiums to be determined on a future date. The premiums for these options are based upon implied volatility parameters at specified terms. The risk associated with purchasing put and call options is limited to the premium paid. Premiums paid for purchasing options which are exercised or closed are added to the amounts paid or offset against the proceeds on the underlying future, swap, security or currency transaction to determine the realized gain or loss.
Repurchase Agreements. The Portfolio may engage in repurchase transactions. Under the terms of a typical repurchase agreement, the Portfolio takes possession of an underlying debt obligation subject to an obligation of the seller to repurchase, and the Portfolio to resell, the obligation at an agreed-upon price and time. The market value of the collateral must be equal to or exceed at all times the total amount of the repurchase obligations, including interest. Securities purchased under repurchase agreements are reflected as an asset in the Statement of Assets and Liabilities. Generally, in the event of counterparty default, the Portfolio has the right to use the collateral to offset losses incurred. If the counterparty should default, the Portfolio will seek to sell the securities which it holds as collateral. This could involve procedural costs or delays in addition to a loss on the securities if their value should fall below their repurchase price.
Mortgage-Related and Other Asset-Backed Securities. The Portfolio may invest in mortgage-related or other asset-backed securities. These securities include mortgage pass-through securities, collateralized mortgage obligations (“CMOs”), commercial mortgage-backed securities, mortgage dollar rolls, CMO residuals, stripped mortgage-backed securities (“SMBSs”) and other securities that directly or indirectly represent a participation in, or are secured by and payable from, mortgage loans on real property. The value of some mortgage- or asset-backed securities may be particularly sensitive to changes in prevailing interest rates. Early repayment of principal on some mortgage-related securities may expose a Portfolio to a lower rate of return upon reinvestment of principal. The value of these securities may fluctuate in response to the market’s perception of the creditworthiness of the issuers. Additionally, although mortgages and mortgage-related securities are generally supported by some form of government or private guarantee and/or insurance, there is no assurance that private guarantors or insurers will meet their obligations.
One type of SMBS has one class receiving all of the interest from the mortgage assets (the interest-only, or “IO” class), while the other class will receive all of the principal (the principal-only, or “PO” class). Payments received for IOs are included in interest income in the Statement of Operations. Because principal will not be received at the maturity of an IO, adjustments are made to the book value of the security on a daily basis until maturity. These adjustments are included in interest income in the Statement of Operations. Payments received for POs are treated as reductions to the cost and par value of the securities.
Swap Agreements. The Portfolio may engage in swap transactions, including, but not limited to, swap agreements on interest rate and credit default to manage its exposure to interest rates and credit risk. In connection with these agreements, securities may be identified as collateral in accordance with the terms of the respective swap agreements.
Interest rate swap agreements involve the exchange by the Portfolio with another party of their respective commitments to pay or receive interest, e.g., an exchange of floating rate payments for fixed rate payments with respect to the notional amount of principal.
Credit default swap agreements involve one party making a stream of payments to another party in exchange for the right to receive a specified return in the event of a default by a third party, typically corporate issues or sovereign issues of an emerging country, on its obligation. The Portfolio may use credit default swaps to provide a measure of protection against defaults of the issuers (i.e., to reduce risk where the Portfolio owns or has exposure to the sovereign issuer) or to take an active long or short position with respect to the likelihood of a particular issuer’s default. As a seller of protection, the Portfolio generally receives an upfront payment or a fixed rate of income throughout the term of the swap provided that there is no credit event. If the Portfolio is a seller of protection and a credit event occurs, as defined under the terms of that particular swap agreement, the Portfolio will pay to the buyer of the protection an amount up to the notional value of the swap and in certain instances take delivery of the security. As the seller, the Portfolio would effectively add leverage to its portfolio because, in addition to its total net assets, the Portfolio would be subject to investment exposure on the notional amount of the swap. As a buyer of protection, the Portfolio generally receives an amount up to the notional value of the swap if a credit event occurs. The treatment of a credit default swaps and other swap agreements that provide for contingent, non-periodic, bullet-type payments as “notional principal contracts” for federal income tax purposes is uncertain. Were the Internal Revenue Service in take the position that a credit default swap or other bullet-type swap is not a “notional principal contract” for federal income tax purposes, payments received by the Portfolio from such investments might be subject to income taxes.
Swaps are marked to market daily based upon quotations from market makers and the change in value, if any, is recorded as unrealized gain or loss in the Statement of Operations. Payments received or made at the beginning of the measurement period are reflected as such in the Statement of Assets and Liabilities. These upfront payments are recorded as realized gain or loss in the Statement of Operations upon termination or maturity of the swap. A liquidation payment received or made at the termination of the swap is recorded as realized gain or loss in the Statement of Operations. Net periodic payments received or paid by the Portfolio are included as part of realized gain or loss in the Statement of Operations. Entering into these agreements involves, to varying degrees, elements
| | | | | | |
| | | Semiannual Report | | June 30, 2006 | | 17 |
Notes to Financial Statements (Cont.)
of credit, market and documentation risk in excess of the amounts recognized in the Statement of Assets and Liabilities. Such risks involve the possibility that there will be no liquid market for these agreements, that the counterparty to the agreements may default on its obligation to perform or disagree as to the meaning of contractual terms in the agreements and that there may be unfavorable changes in interest rates.
U.S. Government Agencies or Government-Sponsored Enterprises. Securities issued by U.S. Government agencies or government-sponsored enterprises may not be guaranteed by the U.S. Treasury. The Government National Mortgage Association (“GNMA”), a wholly owned U.S. Government corporation, is authorized to guarantee, with the full faith and credit of the U.S. Government, the timely payment of principal and interest on securities issued by institutions approved by GNMA and backed by pools of mortgages insured by the Federal Housing Administration or guaranteed by the Department of Veterans Affairs. Government-related guarantors (i.e., not backed by the full faith and credit of the U.S. Government) include the Federal National Mortgage Association (“FNMA” or “Fannie Mae”) and the Federal Home Loan Mortgage Corporation (“FHLMC” or “Freddie Mac”). Pass-through securities issued by FNMA are guaranteed as to timely payment of principal and interest by FNMA but are not backed by the full faith and credit of the U.S. Government. FHLMC guarantees the timely payment of interest and ultimate collection of principal, but its participation certificates are not backed by the full faith and credit of the U.S. Government.
Guarantees and Indemnifications. Under the Trust’s organizational documents, each Trustee, officer, employee or other agent of the Trust (including the Trust’s investment manager) is indemnified against certain liabilities that may arise out of performance of their duties to the Portfolio. Additionally, in the normal course of business, the Portfolio enters into contracts that contain a variety of indemnification clauses. The Portfolio’s maximum exposure under these arrangements is unknown as this would involve future claims that may be made against the Portfolio that have not yet occurred. However, the Portfolio has not had prior claims or losses pursuant to these contracts, and believes the risk of loss to be remote.
New Accounting Policies. In July 2006, the Financial Accounting Standards Board issued Interpretation No. 48, “Accounting for Uncertainty in Income Taxes—an Interpretation of FASB Statement No. 109” (the “Interpretation”). The Interpretation is effective for fiscal years beginning after December 15, 2006. Management is currently evaluating the application of the Interpretation to the Portfolio and will provide additional information in relation to the Interpretation in the Portfolio’s annual financial statements for the year ending December 31, 2006.
3. FEES, EXPENSES, AND RELATED PARTY TRANSACTIONS
Investment Advisory Fee. PIMCO is a majority-owned subsidiary of Allianz Global Investors of America L.P. (“AGI”), and serves as investment adviser (the “Adviser”) to the Trust, pursuant to an investment advisory contract. The Adviser receives a monthly fee at an annual rate based on average daily net assets of the Portfolio. The Advisory Fee is charged at an annual rate of 0.25%.
Administration Fee. PIMCO serves as administrator (the “Administrator”), and provides administrative services to the Trust for which it receives a monthly administrative fee based on average daily net assets of the Portfolio. As the Administrator, PIMCO bears the costs of various third-party services, including audit, custodial, portfolio accounting, legal, transfer agency and printing costs. The Administration Fee is charged at the annual rate of 0.50%.
Distribution and Servicing Fees. Allianz Global Investors Distributors LLC (“AGID”) is an indirect wholly-owned subsidiary of AGI and serves as the distributor of the Trust’s shares. The Trust is permitted to reimburse AGID on a quarterly basis, out of the Administrative Class assets of the Portfolio in the amount of 0.15% on an annual basis of the average daily net assets of that class, for payments made to financial intermediaries that provide services in connection with the distribution of shares or administration of plans or programs that use Portfolio shares as their funding medium. The effective rate paid to AGID was 0.15% during the current fiscal year.
Expenses. The Trust is responsible for the following expenses: (i) salaries and other compensation of any of the Trust’s executive officers and employees who are not officers, directors, stockholders or employees of PIMCO or its subsidiaries or affiliates; (ii) taxes and governmental fees; (iii) brokerage fees and commissions and other portfolio transaction expenses; (iv) the costs of borrowing money, including interest expenses and bank overdraft charges; (v) fees and expenses of the Trustees who are not “interested persons” of PIMCO or the Trust, and any counsel retained exclusively for their benefit; (vi) extraordinary expenses, including costs of litigation and indemnification expenses; (vii) organization expenses and (viii) any expenses allocated or allocable to a specific class of shares, which include service fees payable with respect to the Administrative Class shares and may include certain other expenses as permitted by the Trust’s Multiple Class Plan adopted pursuant to Rule 18f-3 under the Act and subject to review and approval by the Trustees. The ratio of expenses to average net assets per share class, as disclosed in the Financial Highlights, may differ from the annual portfolio operating expenses per share class as disclosed in the Prospectus for the reasons set forth above.
For the current period ended June 30, 2006, each unaffiliated Trustee received an annual retainer of $15,000, plus $2,000 for each Board of Trustees quarterly meeting attended, $500 for each Board of Trustees committee meeting attended and $500 for each special board meeting attended, plus reimbursement of related expenses. In addition, each Committee Chair received an additional annual retainer of $500 and each Audit Committee Chair received an additional annual retainer of $1,500. These expenses are allocated on a pro-rata basis to each Portfolio of the Trust according to its respective net assets. The Trust pays no compensation directly to any Trustee or any other officer who is affiliated with the Administrator, all of whom receive remuneration for their services to the Trust from the Administrator or its affiliates.
4. PURCHASES AND SALES OF SECURITIES
The length of time the Portfolio has held a particular security is not generally a consideration in investment decisions. A change in the securities held by the Portfolio is known as “portfolio turnover”. The Portfolio may engage in frequent and active trading of portfolio securities to achieve its investment objective, particularly during periods of volatile market movements. High portfolio turnover (e.g., over 100%) involves correspondingly greater expenses to the Portfolio, including brokerage commissions or dealer mark-ups and other transaction costs on the sale of securities and reinvestments in other securities. Such sales may also result in realization of taxable capital gains, including short-term capital gains (which are generally taxed at ordinary income tax rates). The trading costs and tax effects associated with portfolio turnover may adversely affect the Portfolio’s performance.
Purchases and sales of securities (excluding short-term investments) for the period ended June 30, 2006 were as follows (amounts in thousands):
| | | | | | | | | | | | | | | | |
| | U.S Government/Agency | | | | | All Other |
| | Purchases | | | | | Sales | | | | | Purchases | | | | | Sales |
| $ | 44,576 | | | | $ | 56,423 | | | | $ | 42,889 | | | | $ | 35,879 |
| | | | |
| 18 | | PIMCO Variable Insurance Trust | | |
| | |
| |
| | | June 30, 2006 (Unaudited) |
5. TRANSACTIONS IN WRITTEN CALL AND PUT OPTIONS
Transactions in written call and put options were as follows (amounts in thousands, except number of contracts):
| | | | | | | | | | | | | | | | | |
| | | | | # of
Contracts |
| | | |
| Notional
Amount
in $ |
| | | | | Premium | |
Balance at 12/31/2005 | | | | 64 | | | | | $ | 7,000 | | | | | $ | 68 | |
Sales | | | | 102 | | | | | | 26,600 | | | | | | 251 | |
Closing Buys | | | | 0 | | | | | | (5,800 | ) | | | | | (49 | ) |
Expirations | | | | (123 | ) | | | | | (100 | ) | | | | | (32 | ) |
Exercised | | | | (13 | ) | | | | | 0 | | | | | | (3 | ) |
Balance at 06/30/2006 | | | | 30 | | | | | $ | 27,700 | | | | | $ | 235 | |
6. SHARES OF BENEFICIAL INTEREST
The Portfolio may issue an unlimited number of shares of beneficial interest with a $0.001 par value. Changes in shares of beneficial interest were as follows (shares and amounts in thousands):
| | | | | | | | | | | | | | | | | | |
| | | | | Six Months Ended
06/30/2006 | | | | | Year Ended
12/31/2005 | |
| | | | | Shares | | | Amount | | | | | Shares | | | Amount | |
| | | | | | |
Receipts for shares sold | | | | | | | | | | | | | | | | | | |
Institutional Class | | | | 0 | | | $ | 0 | | | | | 0 | | | $ | 0 | |
Administrative Class | | | | 925 | | | | 9,424 | | | | | 1,697 | | | | 17,519 | |
Issued as reinvestment of distributions | | | | | | | | | | | | | | | | | | |
Institutional Class | | | | 0 | | | | 0 | | | | | 0 | | | | 0 | |
Administrative Class | | | | 76 | | | | 777 | | | | | 140 | | | | 1,452 | |
Cost of shares redeemed | | | | | | | | | | | | | | | | | | |
Institutional Class | | | | 0 | | | | 0 | | | | | 0 | | | | 0 | |
Administrative Class | | | | (437 | ) | | | (4,459 | ) | | | | (793 | ) | | | (8,208 | ) |
Net increase resulting from Portfolio share transactions | | | | 564 | | | $ | 5,742 | | | | | 1,044 | | | $ | 10,763 | |
The following schedule shows the number of shareholders each owning 5% or more of the Portfolio and the total percentage of the Portfolio held by such shareholders:
| | | | | | |
| | | | | Number of
Shareholders | | % of Portfolio
Held |
Institutional Class | | | | 1 | | 100 |
Administrative Class | | | | 4 | | 91 |
7. FEDERAL INCOME TAX MATTERS
As of June 30, 2006, the aggregate cost of investments was the same for federal income tax and financial statement purposes. The net unrealized appreciation (depreciation) of investment securities for federal income tax purposes is as follows (amounts in thousands):
| | | | |
Aggregate
Gross
Unrealized
Appreciation | | Aggregate
Gross
Unrealized
(Depreciation) | | Net
Unrealized
Appreciation |
$ 1,351 | | $ (981) | | $ 370 |
8. REGULATORY AND LITIGATION MATTERS
On June 1, 2004, the Attorney General of the State of New Jersey announced that it had dismissed PIMCO from a complaint filed by the New Jersey Attorney General on February 17, 2004, and that it had entered into a settlement agreement (the “New Jersey Settlement”) with Allianz Global Investors of America L.P. (“AGI”) (formerly known as Allianz Dresdner Asset Management of America L.P.), PEA Capital LLC (an entity affiliated with PIMCO through common ownership) (“PEA”) and Allianz Global Investors Distributors LLC (“AGID”), in connection with the same matter. In the New Jersey Settlement, AGI, PEA and AGID neither admitted nor denied the allegations or conclusions of law, but did agree to pay New Jersey a civil fine of $15 million and $3 million for investigative costs and further potential enforcement initiatives against unrelated parties. They also undertook to implement certain governance changes. The complaint relating to the New Jersey Settlement alleged, among other things, that AGI, PEA and AGID had failed to disclose that they improperly allowed certain hedge funds to engage in “market timing” in certain funds. The complaint sought injunctive relief, civil monetary penalties, restitution and disgorgement of profits.
Since February 2004, PIMCO, AGI, PEA, AGID, and certain of their affiliates, including the PIMCO Funds, the Allianz Funds (formerly known as PIMCO Funds: Multi-Manager Series), and the Trustees and employees of the PIMCO Funds, have been named as defendants in fifteen lawsuits filed in various jurisdictions. Eleven of those lawsuits concern “market timing,” and they have been transferred to and consolidated for pre-trial proceedings in a multi-district litigation proceeding in the U.S. District Court for the District of Maryland; the other four lawsuits concern “revenue sharing” and have been consolidated into a single action in the U.S. District Court for the District of Connecticut. The lawsuits have been commenced as putative class actions on behalf of investors who purchased, held or redeemed shares of the various series of the PIMCO Funds and the Allianz Funds during specified periods, or as derivative actions on behalf of the PIMCO Funds and Allianz Funds.
The market timing actions in the District of Maryland generally allege that certain hedge funds were allowed to engage in “market timing” in certain of the PIMCO Funds and the Allianz Funds and this alleged activity was not disclosed. Pursuant to tolling agreements entered into with the derivative and class action plaintiffs, PIMCO, the Trustees, and certain employees of PIMCO who were previously named as defendants have all been dropped as defendants in the market timing actions; the plaintiffs continue to assert claims on behalf of the shareholders of the PIMCO Funds or on behalf of the PIMCO Funds themselves against other defendants. By order dated November 3, 2005, the U.S. District Court for the District of Maryland granted the PIMCO Funds’ motion to dismiss claims asserted against it in a consolidated amended complaint where the PIMCO Funds were named, in the complaint, as a nominal defendant. The revenue sharing action in the District of Connecticut generally alleges that fund assets were inappropriately used to pay brokers to promote the PIMCO Funds Allianz Funds, including directing fund brokerage transactions to such brokers, and that such alleged arrangements were not fully disclosed to shareholders. On August 11, 2005 the U.S. District Court for the District of Connecticut conducted a hearing on defendants’ motion to dismiss the consolidated amended complaint in the revenue sharing action but has not yet ruled on the motion to dismiss. The market timing and revenue sharing lawsuits seek, among other things, unspecified compensatory damages plus interest and, in some cases, punitive damages, the rescission of investment advisory contracts, the return of fees paid under those contracts and restitution.
Under Section 9(a) of the Investment Company Act of 1940, as amended (“1940 Act”), if the New Jersey Settlement or any of the lawsuits described above were to result in a court injunction against AGI, PEA, AGID and/or their affiliates, PIMCO could, in the absence of exemptive relief granted by the SEC, be barred from serving as an investment adviser, and AGID could be barred from serving as principal underwriter, to any registered investment company, including the
| | | | | | |
| | | Semiannual Report | | June 30, 2006 | | 19 |
Notes to Financial Statements (Cont.)
Portfolios of the Trust. In connection with an inquiry from the SEC concerning the status of the New Jersey Settlement under Section 9(a), PEA, AGID, AGI and certain of their affiliates (including PIMCO) (together, the “Applicants”) have sought exemptive relief from the SEC under Section 9(c) of the 1940 Act. The SEC has granted the Applicants a temporary exemption from the provisions of Section 9(a) with respect to the New Jersey Settlement until the earlier of (i) September 13, 2006 and (ii) the date on which the SEC takes final action on their application for a permanent order. There is no assurance that the SEC will issue a permanent order.
Two nearly identical class action civil complaints have been filed in August 2005, in the Northern District of Illinois Eastern Division alleging that the plaintiffs each purchased and sold a 10-year Treasury note futures contract and suffered damages from an alleged shortage when PIMCO held both physical and futures positions in 10-year Treasury notes for its client accounts. The two actions have been consolidated into one action, and the two separate complaints have been replaced by a consolidated complaint. PIMCO is a named defendant, and the PIMCO Funds have been added as a defendant, to the consolidated action. PIMCO strongly believes the complaint (and any consolidated complaint filed hereafter) is without merit and intends to vigorously defend itself.
Certain Portfolios of the Trust were recently served in an adversary proceeding brought by the Official Committee of Asbestos Claimants of G-I Holdings, Inc. in G-I Holdings, Inc.’s bankruptcy in the District of New Jersey. PIMCO was previously named in this lawsuit and remains a defendant. The plaintiff seeks to recover for the bankruptcy estate assets that were transferred by the predecessor entity of G-I Holdings, Inc. to a wholly-owned subsidiary in 1994. The subsidiary has since issued notes, of which certain Portfolios of the Trust are alleged to be holders. The complaint alleges that in 2000, more than two hundred noteholders—including certain Portfolios of the Trust—were granted a second priority lien on the assets of the subsidiary in exchange for their consent to a refinancing transaction and the granting of a first priority lien to the lending banks. The plaintiff is seeking invalidation of the lien in favor of the noteholders and/or the value of the lien.
It is possible that these matters and/or other developments resulting from these matters could result in increased fund redemptions or other adverse consequences to the Portfolios. However, PIMCO and AGID believe that these matters are not likely to have a material adverse effect on the Portfolios or on PIMCO’s or AGID’s ability to perform their respective investment advisory or distribution services relating to the Portfolios.
| | | | |
| 20 | | PIMCO Variable Insurance Trust | | |
Investment Adviser and Administrator
Pacific Investment Management Company LLC
840 Newport Center Drive
Newport Beach, California 92660
Distributor
Allianz Global Investors Distributors LLC
2187 Atlantic Street
Stamford, Connecticut 06902
Custodian
State Street Bank & Trust Company
801 Pennsylvania
Kansas City, Missouri 64105
Transfer Agent
Boston Financial Data Services–Midwest
330 W. 9th Street
Kansas City, Missouri 64105
Legal Counsel
Dechert LLP
1775 I Street, N.W.
Washington, D.C. 20006
Independent Registered Public Accounting Firm
PricewaterhouseCoopers LLP
1055 Broadway
Kansas City, Missouri 64105
P I M C O

Share Class Administrative
Semiannual Report June 30, 2006
PIMCO Variable Insurance Trust
Global Bond Portfolio (Unhedged)
Table of Contents
This material is authorized for use only when preceded or accompanied by the current PIMCO Variable Insurance Trust (the “Trust”) prospectus. Investors should consider the investment objectives, risks, charges and expenses of this Trust carefully before investing. Ask your financial professional to explain all charges that may apply. This and other information is contained in the Trust’s prospectus. The variable product prospectus may be obtained by contacting your Investment Consultant. Please read the Trust and variable product prospectus carefully before you invest or send money.
Chairman’s Letter
Dear PIMCO Variable Insurance Trust Shareholder:
It is our pleasure to present to you the semiannual report for the PIMCO Variable Insurance Trust covering the six-month period ended June 30, 2006.
Highlights of the global bond markets during the six-month period included:
| | n | | Most fixed-income sectors lost ground during the first half of 2006, as concern about accelerating inflation and central bank tightening pushed interest rates higher worldwide. The benchmark Lehman Brothers Aggregate Bond Index (which includes Treasury, Investment-Grade Corporate, and Residential Mortgage-Backed Securities) returned -0.72% for the first six months of the year. On June 30, the benchmark ten-year Treasury yielded 5.14%, 0.75% higher than at the start of the year. The U.S. yield curve remained flat as shorter-maturity yields rose by a comparable amount. |
| | n | | The Federal Reserve tightened four times during the reporting period, bringing the Federal Funds Rate to 5.25%. The increase near the end of the period was the Federal Reserve’s 17th consecutive rate hike since the start of its tightening cycle in 2004. The Federal Reserve was not alone, as central banks in Europe, India, and China tightened credit in unison for the first time since 2000. The Bank of Japan, whose zero-interest-rate policy has flooded global markets with liquidity, looked set to reverse this policy in the coming months. |
In these pages please find a more complete Portfolio review as it relates to financial-market activities, as well as details about total-return investment performance for the six-month reporting period. Thank you for the trust you have placed in us. We will continue to work diligently to meet your investment needs.
Sincerely,
Brent R. Harris
Chairman, PIMCO Variable Insurance Trust
July 31, 2006
| | | | | | |
| | | Semiannual Report | | June 30, 2006 | | 1 |
Important Information About the Portfolio
PIMCO Variable Insurance Trust (the “Trust”) is an open-end management investment company currently consisting of nineteen separate investment portfolios, including the Global Bond Portfolio (Unhedged) (the “Portfolio”). The Portfolio is only available as a funding vehicle under variable life insurance policies or variable annuity contracts issued by insurance companies (“Variable Contracts”). Individuals may not purchase shares of the Portfolio directly. Shares of the Portfolio also may be sold to qualified pension and retirement plans outside of the separate account context.
We believe that bond funds have an important role to play in a well diversified investment portfolio. It is important to note, however, that in an environment where interest rates may trend upward, rising rates would negatively impact the performance of most bond funds, and fixed-income securities held by a fund are likely to decrease in value. The price volatility of fixed-income securities can also increase during periods of rising interest rates resulting in increased losses to a fund. Bond funds and individual bonds with a longer duration (a measure of the expected life of a security) tend to be more sensitive to changes in interest rates, usually making them more volatile than securities or funds with shorter durations. The longer-term performance of most bond funds has benefited from capital gains in part resulting from an extended period of declining interest rates. In the event interest rates increase, these capital gains should not be expected to recur.
The Portfolio may be subject to various risks in addition to those described above. Some of these risks may include, but are not limited to, the following: credit risk, high yield risk, market risk, issuer risk, liquidity risk, derivatives risk, mortgage risk, non-U.S. investment risk, currency risk, issuer non-diversification risk, leveraging risk and management risk. A complete description of these risks is contained in the Portfolio’s prospectus. The Portfolio may use derivative instruments for hedging purposes or as part of an investment strategy. Use of these instruments may involve certain costs and risks such as liquidity risk, interest rate risk, market risk, credit risk, management risk and the risk that the Portfolio could not close out a position when it would be most advantageous to do so. A Portfolio investing in derivatives could lose more than the principal amount invested in these instruments. Investing in non-U.S. securities may entail risk due to non-U.S. economic and political developments; this risk may be increased when investing in emerging markets.
On the performance summary page in this Semiannual Report, the Total Return Investment Performance table measures performance assuming that all dividend and capital gain distributions were reinvested.
An investment in the Portfolio is not a deposit of a bank and is not guaranteed or insured by the Federal Deposit Insurance Corporation or any other government agency. It is possible to lose money on investments in the Portfolio.
PIMCO has adopted written proxy voting policies and procedures (“Proxy Policy”) as required by Rule 206(4)-6 under the Investment Advisers Act of 1940. The Proxy Policy has been adopted by the Trust as the policies and procedures that PIMCO will use when voting proxies on behalf of the Portfolio. Copies of the written Proxy Policy and the factors that PIMCO may consider in determining how to vote proxies for the Portfolio, and information about how the Portfolio voted proxies relating to portfolio securities held during the most recent twelve-month period ended June 30, are available without charge, upon request, by calling the Trust at 1-866-746-2606 and on the Securities and Exchange Commission’s (“SEC”) website at http://www.sec.gov.
The Portfolio files its complete schedule of portfolio holdings with the SEC for the first and third quarters of each fiscal year on Form N-Q. A copy of the Trust’s Form N-Q is available on the SEC’s website at http://www.sec.gov and may be reviewed and copied at the SEC’s Public Reference Room in Washington D.C. Information on the operation of the Public Reference Room may be obtained by calling 1-800-SEC-0330.
PIMCO Variable Insurance Trust is distributed by Allianz Global Investors Distributors LLC, 2187 Atlantic Street, Stamford, CT 06902.
| | | | |
| 2 | | PIMCO Variable Insurance Trust | | |
The following disclosure provides important information regarding the Portfolio’s Expense Example (“Example” or “Expense Example”), which appears in this Semiannual Report. Please refer to this information when reviewing the Expense Example for the Portfolio.
Example
As a shareholder of the Portfolio, you incur two types of costs: (1) transaction costs and (2) ongoing costs, including advisory and administrative fees; distribution and/or service (12b-1) fees (Administrative Class only); and other Portfolio expenses. The Example is intended to help you understand your ongoing costs (in dollars) of investing in the Portfolio and to compare these costs with the ongoing costs of investing in other mutual funds. The Expense Example does not reflect any fees or other expenses imposed by the Variable Contracts. If it did, the expenses reflected in the Expense Examples would be higher. The Example is based on an investment of $1,000 invested at the beginning of the period and held for the entire period indicated, which is from January 1, 2006 to June 30, 2006.
Actual Expenses
The information in the table under the heading “Actual Performance” provides information about actual account values and actual expenses. You may use the information in these columns, together with the amount you invested, to estimate the expenses that you paid over the period. Simply divide your account value by $1,000 (for example, an $8,600 account value divided by $1,000 = 8.60), then multiply the result by the number in the appropriate column for your share class, in the row titled “Expenses Paid During Period” to estimate the expenses you paid on your account during this period.
Hypothetical Example for Comparison Purposes
The information in the table under the heading “Hypothetical Performance (5% return before expenses)” provides information about hypothetical account values and hypothetical expenses based on the Portfolio’s actual expense ratio and an assumed rate of return of 5% per year before expenses, which is not the Portfolio’s actual return. The hypothetical account values and expenses may not be used to estimate the actual ending account balance or expenses you paid for the period. You may use this information to compare the ongoing costs of investing in the Portfolio and other portfolios. To do so, compare this 5% hypothetical example with the 5% hypothetical examples that appear in the shareholder reports of the other portfolios.
Please note that the expenses shown in the table are meant to highlight your ongoing costs only and do not reflect any transactional costs. Therefore, the information under the heading “Hypothetical Performance (5% return before expenses)” is useful in comparing ongoing costs only, and will not help you determine the relative total costs of owning different portfolios. In addition, if these transactional costs were included, your costs would have been higher.
The expense ratio may vary period to period because of various factors, such as an increase in expenses not covered by the advisory and administrative fees (such as expenses of the trustees and their counsel or litigation expense).
Portfolio Benchmark
JPMorgan Global Bond Indices Global FX NY Index Unhedged in USD is an unmanaged index market representative of the total return performance in U.S. dollars on an unhedged basis of major world bond markets. It is not possible to invest directly in such an unmanaged index.
| | | | | | |
| | | Semiannual Report | | June 30, 2006 | | 3 |
| | | | |
| | |
| PIMCO Global Bond Portfolio (Unhedged) | | | | |
| | | | |
Cumulative Returns Through June 30, 2006
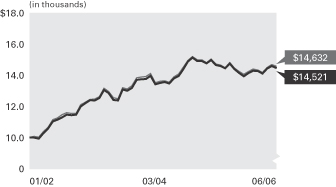
Global Bond Portfolio JPMorgan GBI
(Unhedged) Administrative Global FX NY Index
Class Unhedged in USD
-------------------------- ---------------
01/31/2002 $10,000 $10,000
02/28/2002 9,978 10,053
03/31/2002 9,907 10,009
04/30/2002 10,267 10,364
05/31/2002 10,566 10,646
06/30/2002 11,031 11,143
07/31/2002 11,146 11,266
08/31/2002 11,291 11,472
09/30/2002 11,474 11,607
10/31/2002 11,450 11,558
11/30/2002 11,470 11,562
12/31/2002 12,016 12,131
01/31/2003 12,222 12,289
02/28/2003 12,422 12,466
03/31/2003 12,400 12,497
04/30/2003 12,566 12,647
05/31/2003 13,094 13,196
06/30/2003 12,895 12,988
07/31/2003 12,441 12,582
08/31/2003 12,401 12,519
09/30/2003 13,121 13,227
10/31/2003 13,033 13,157
11/30/2003 13,222 13,366
12/31/2003 13,749 13,891
01/31/2004 13,785 13,936
02/29/2004 13,810 13,968
03/31/2004 14,013 14,165
04/30/2004 13,461 13,557
05/31/2004 13,543 13,653
06/30/2004 13,603 13,683
07/31/2004 13,517 13,598
08/31/2004 13,847 13,952
09/30/2004 14,005 14,129
10/31/2004 14,445 14,568
11/30/2004 14,950 15,007
12/31/2004 15,207 15,262
01/31/2005 14,974 15,064
02/28/2005 14,981 15,049
03/31/2005 14,834 14,865
04/30/2005 15,046 15,107
05/31/2005 14,721 14,782
06/30/2005 14,650 14,716
07/31/2005 14,497 14,541
08/31/2005 14,808 14,869
09/30/2005 14,449 14,517
10/31/2005 14,194 14,285
11/30/2005 13,984 14,115
12/31/2005 14,201 14,294
01/31/2006 14,344 14,448
02/28/2006 14,318 14,388
03/31/2006 14,165 14,228
04/30/2006 14,486 14,545
05/31/2006 14,647 14,749
06/30/2006 14,521 14,632
$10,000 invested at the beginning of the first full month following the inception date of the Portfolio’s Administrative Class.
Country Allocation‡
| | |
United States | | 36.3% |
Short-Term Instruments | | 21.7% |
United Kingdom | | 12.4% |
Japan | | 10.3% |
Germany | | 9.7% |
Spain | | 5.5% |
Other | | 4.1% |
| | ‡ | % of Total Investments as of June 30, 2006 |
| | | | | | | | | | |
| Average Annual Total Return for the period ended June 30, 2006 |
| | | | | | | 6 Months* | | 1 Year | | Since
Inception
(01/10/02)** |
| | |
| | PIMCO Global Bond Portfolio (Unhedged) Administrative Class | | 2.26% | | -0.88% | | 8.74% |
| | |
| | JPMorgan GBI Global FX NY Index Unhedged in USD | | 2.37% | | -0.57% | | 8.45% |
All Portfolio returns are net of fees and expenses.
* Cumulative return.
** The Portfolio began operations on 01/10/02. Index comparisons began on 12/31/01.
Past performance is no guarantee of future results. The performance quoted represents past performance. Investment return and principal value will fluctuate so the Portfolio shares, when redeemed, may be worth more or less than their original cost. The Portfolio’s performance does not reflect the deduction of additional charges and expenses imposed in connection with investing in Variable Contracts, which will reduce returns. Current performance may be lower or higher than the performance data quoted. Performance data current to the most recent month-end is available by calling (800) 927-4648.
| | | | | | | | | | |
| Expense Example | | | | Actual Performance | | | | Hypothetical Performance |
| | | | | | | | | (5% return before expenses) |
Beginning Account Value (01/01/06) | | | | $ | 1,000.00 | | | | $ | 1,000.00 |
Ending Account Value (06/30/06) | | | | $ | 1,022.60 | | | | $ | 1,020.33 |
Expenses Paid During Period† | | | | $ | 4.51 | | | | $ | 4.51 |
† Expenses are equal to the Portfolio’s Administrative Class annualized expense ratio of 0.90%, multiplied by the average account value over the period, multiplied by 181/365 (to reflect the one-half year period). Overall fees and expenses of investing in the Portfolio will be higher because the example does not reflect Variable Contract fees and expenses.
Please refer to page 3 herein for a description of the Portfolio’s benchmark and an explanation of the information presented in the above Expense Example.
Portfolio Insights
| » | | The PIMCO Global Bond Portfolio (Unhedged) seeks to achieve its investment objective by investing under normal circumstances at least 80% of its assets in Fixed-Income Instruments of issuers located in at least three countries (one of which may be the United States), which may be represented by futures contracts (including related options) with respect to such securities, and options on such securities. |
| » | | An underweight to Euroland duration and a curve flattening bias added to returns as these yields rose on stronger than expected economic data and hawkish European Central Bank comments. |
| » | | An overweight to U.S. duration and an emphasis on shorter maturities detracted from returns, as rates rose and the yield curve continued to flatten amid concern that the Federal Reserve would extend its tightening cycle. |
| » | | An emphasis on mortgage-backed securities was positive for performance as mortgages outperformed like-duration Treasuries amidst declining volatility and heightened investor demand. |
| » | | A focus on the short-to-intermediate portion of the U.K. curve was negative for returns as U.K. long-dated gilts outperformed on firmer demand for longer dated assets. |
| » | | A long position in the Euro and the Yen versus the U.S. dollar was positive for returns as the Euro and the Yen appreciated on improving growth and expectations of monetary tightening. |
| | | | |
| 4 | | PIMCO Variable Insurance Trust | | |
| | |
| |
| Financial Highlights Global Bond Portfolio (Unhedged) | | |
| | | | | | | | | | | | | | | | | | | | |
| Selected Per Share Data for the Year or Period Ended: | | 06/30/2006+ | | | 12/31/2005 | | | 12/31/2004 | | | 12/31/2003 | | | 1/10/2002-
12/31/2002 | |
| | | | | |
Administrative Class | | | | | | | | | | | | | | | | | | | | |
| Net asset value beginning of period | | $ | 11.91 | | | $ | 13.27 | | | $ | 13.03 | | | $ | 11.69 | | | $ | 10.00 | |
| Net investment income (a) | | | 0.20 | | | | 0.35 | | | | 0.26 | | | | 0.25 | | | | 0.28 | |
| Net realized/unrealized gain (loss) on investments (a) | | | 0.07 | | | | (1.22 | ) | | | 1.08 | | | | 1.42 | | | | 1.73 | |
| Total income (loss) from investment operations | | | 0.27 | | | | (0.87 | ) | | | 1.34 | | | | 1.67 | | | | 2.01 | |
| Dividends from net investment income | | | (0.19 | ) | | | (0.32 | ) | | | (0.24 | ) | | | (0.25 | ) | | | (0.27 | ) |
| Distributions from net realized capital gains | | | 0.00 | | | | (0.17 | ) | | | (0.86 | ) | | | (0.08 | ) | | | (0.05 | ) |
| Total distributions | | | (0.19 | ) | | | (0.49 | ) | | | (1.10 | ) | | | (0.33 | ) | | | (0.32 | ) |
| Net asset value end of period | | $ | 11.99 | | | $ | 11.91 | | | $ | 13.27 | | | $ | 13.03 | | | $ | 11.69 | |
| Total return | | | 2.26 | % | | | (6.61 | )% | | | 10.60 | % | | | 14.43 | % | | | 20.35 | % |
| Net assets end of period (000s) | | $ | 137,787 | | | $ | 94,214 | | | $ | 41,695 | | | $ | 29,415 | | | $ | 20,456 | |
| Ratio of expenses to average net assets | | | 0.90 | %* | | | 0.90 | % | | | 0.90 | % | | | 0.92 | %(c) | | | 0.90 | %*(b) |
| Ratio of net investment income to average net assets | | | 3.46 | %* | | | 2.82 | % | | | 2.03 | % | | | 2.03 | % | | | 2.65 | %* |
| Portfolio turnover rate | | | 152 | % | | | 320 | % | | | 319 | % | | | 592 | % | | | 581 | % |
+ Unaudited
* Annualized
(a) Per share amounts based on average number of shares outstanding during the period.
(b) If the investment manager had not reimbursed expenses, the ratio of expenses to average net assets would have been 1.01%.
(c) Ratio of expenses to average net assets excluding interest expense is 0.90%.
| | | | | | |
| See Accompanying Notes | | Semiannual Report | | June 30, 2006 | | 5 |
| | |
| |
| Statement of Assets and Liabilities Global Bond Portfolio (Unhedged) | | |
| | | | |
| (Amounts in thousands, except per share amounts) | | June 30, 2006
(Unaudited) | |
| |
Assets: | | | | |
Investments, at value | | $ | 146,967 | |
Cash | | | 934 | |
Foreign currency, at value | | | 1,620 | |
Receivable for investments sold | | | 5,205 | |
Receivable for investments sold on delayed-delivery basis | | | 403 | |
Receivable for Portfolio shares sold | | | 500 | |
Interest and dividends receivable | | | 1,334 | |
Variation margin receivable | | | 91 | |
Swap premiums paid | | | 1,781 | |
Unrealized appreciation on forward foreign currency contracts | | | 599 | |
Unrealized appreciation on swap agreements | | | 1,258 | |
| | | | 160,692 | |
| |
Liabilities: | | | | |
Payable for investments purchased | | $ | 18,639 | |
Payable for investments purchased on delayed-delivery basis | | | 995 | |
Payable for short sales | | | 401 | |
Payable for Portfolio shares redeemed | | | 34 | |
Written options outstanding | | | 358 | |
Accrued investment advisory fee | | | 30 | |
Accrued administration fee | | | 60 | |
Accrued servicing fee | | | 19 | |
Swap premiums received | | | 1,465 | |
Unrealized depreciation on forward foreign currency contracts | | | 370 | |
Unrealized depreciation on swap agreements | | | 524 | |
| | | | 22,895 | |
| |
Net Assets | | $ | 137,797 | |
| |
Net Assets Consist of: | | | | |
Paid in capital | | $ | 138,099 | |
(Overdistributed) net investment income | | | (1,174 | ) |
Accumulated undistributed net realized gain | | | 514 | |
Net unrealized appreciation | | | 358 | |
| | | $ | 137,797 | |
| |
Net Assets: | | | | |
Institutional Class | | $ | 10 | |
Administrative Class | | | 137,787 | |
| |
Shares Issued and Outstanding: | | | | |
Institutional Class | | | 1 | |
Administrative Class | | | 11,492 | |
| |
Net Asset Value and Redemption Price Per Share (Net Assets Per Share Outstanding) | | | | |
Institutional Class | | $ | 11.99 | |
Administrative Class | | | 11.99 | |
| |
Cost of Investments Owned | | $ | 147,653 | |
Cost of Foreign Currency Held | | $ | 1,609 | |
Proceeds Received on Short Sales | | $ | 401 | |
Premiums Received on Written Options | | $ | 648 | |
| | | | |
| 6 | | PIMCO Variable Insurance Trust | | See Accompanying Notes |
| | |
| |
| Statement of Operations Global Bond Portfolio (Unhedged) | | |
| | | | |
| (Amounts in thousands) | | Six Months Ended
June 30, 2006
(Unaudited) | |
| |
Investment Income: | | | | |
Interest, net of foreign taxes | | $ | 2,551 | |
Dividends | | | 19 | |
Miscellaneous income | | | 1 | |
Total Income | | | 2,571 | |
| |
Expenses: | | | | |
Investment advisory fees | | | 147 | |
Administration fees | | | 295 | |
Servicing fees – Administrative Class | | | 89 | |
Trustees’ fees | | | 1 | |
Total Expenses | | | 532 | |
| |
Net Investment Income | | | 2,039 | |
| |
Net Realized and Unrealized Gain (Loss): | | | | |
Net realized (loss) on investments | | | (598 | ) |
Net realized (loss) on futures contracts, options and swaps | | | (446 | ) |
Net realized gain on foreign currency transactions | | | 1,865 | |
Net change in unrealized (depreciation) on investments | | | (827 | ) |
Net change in unrealized appreciation on futures contracts, options and swaps | | | 691 | |
Net change in unrealized (depreciation) on translation of assets and liabilities denominated in foreign currencies | | | (162 | ) |
Net Gain | | | 523 | |
| |
Net Increase in Net Assets Resulting from Operations | | $ | 2,562 | |
| | | | | | |
| See Accompanying Notes | | Semiannual Report | | June 30, 2006 | | 7 |
| | |
| |
| Statements of Changes in Net Assets Global Bond Portfolio (Unhedged) | | |
| | | | | | | | |
| (Amounts in thousands) | | Six Months Ended
June 30, 2006 (Unaudited) | | | Year Ended
December 31, 2005 | |
| | |
Increase (Decrease) in Net Assets from: | | | | | | | | |
| | |
Operations: | | | | | | | | |
Net investment income | | $ | 2,039 | | | $ | 1,678 | |
Net realized gain (loss) | | | 821 | | | | (3,310 | ) |
Net change in unrealized (depreciation) | | | (298 | ) | | | (2,270 | ) |
Net increase (decrease) resulting from operations | | | 2,562 | | | | (3,902 | ) |
| | |
Distributions to Shareholders: | | | | | | | | |
| From net investment income | | | | | | | | |
Institutional Class | | | 0 | | | | 0 | |
Administrative Class | | | (1,881 | ) | | | (1,572 | ) |
| From net realized capital gains | | | | | | | | |
Institutional Class | | | 0 | | | | 0 | |
Administrative Class | | | 0 | | | | (1,301 | ) |
| | |
Total Distributions | | | (1,881 | ) | | | (2,873 | ) |
| | |
Portfolio Share Transactions: | | | | | | | | |
| Receipts for shares sold | | | | | | | | |
Institutional Class | | | 10 | | | | 0 | |
Administrative Class | | | 55,471 | | | | 63,454 | |
| Issued as reinvestment of distributions | | | | | | | | |
Institutional Class | | | 0 | | | | 0 | |
Administrative Class | | | 1,881 | | | | 2,873 | |
| Cost of shares redeemed | | | | | | | | |
Institutional Class | | | 0 | | | | 0 | |
Administrative Class | | | (14,460 | ) | | | (7,033 | ) |
Net increase resulting from Portfolio share transactions | | | 42,902 | | | | 59,294 | |
| | |
Total Increase in Net Assets | | | 43,583 | | | | 52,519 | |
| | |
Net Assets: | | | | | | | | |
Beginning of period | | | 94,214 | | | | 41,695 | |
End of period* | | $ | 137,797 | | | $ | 94,214 | |
| | |
*Including (overdistributed) net investment income of: | | $ | (1,174 | ) | | $ | (1,332 | ) |
| | | | |
| 8 | | PIMCO Variable Insurance Trust | | See Accompanying Notes |
| | |
| |
| Schedule of Investments Global Bond Portfolio (Unhedged) | | June 30, 2006 (Unaudited) |
| | | | |
| | | PRINCIPAL | | |
| | | AMOUNT | | VALUE |
| | | (000S) | | (000S) |
| | | | | |
| | | | | | | | |
| BELGIUM (i) 0.6% |
| Belgium Government Bond | | | | | | |
4.250% due 09/28/2014 | | EUR | | 600 | | $ | | 780 |
| | | | | | | | |
|
Total Belgium (Cost $763) | | | | | | 780 |
| | | | | | | | |
|
| |
| BRAZIL 0.2% |
| Vale Overseas Ltd. | | | | | | | | |
6.250% due 01/11/2016 | | $ | | 300 | | | | 287 |
| | | | | | | | |
|
Total Brazil (Cost $300) | | | | | | | | 287 |
| | | | | | | | |
|
| |
| CAYMAN ISLANDS (i) 0.6% |
| ASIF II | | | | | | | | |
4.540% due 06/15/2007 | | CAD | | 200 | | | | 179 |
|
| MUFG Capital Finance 1 Ltd. | | | | | | |
6.346% due 07/29/2049 | | $ | | 400 | | | | 387 |
|
| Vita Capital Ltd. | | | | | | | | |
6.340% due 01/01/2007 | | | | 250 | | | | 251 |
| | | | | | | | |
|
Total Cayman Islands (Cost $811) | | | | 817 |
| | | | | | | | |
|
| |
| FRANCE (i) 1.1% |
| France Government Bond | | | | | | |
6.500% due 04/25/2011 | | EUR | | 300 | | | | 428 |
3.150% due 07/25/2032 (c) | | | | 108 | | | | 171 |
5.750% due 10/25/2032 | | | | 600 | | | | 935 |
| | | | | | | | |
|
Total France (Cost $1,580) | | | | | | 1,534 |
| | | | | | | | |
|
| |
| GERMANY (i) 10.4% |
| Amadeus Global Travel Distribution S.A. | | |
5.549% due 04/08/2013 | | EUR | | 50 | | | | 65 |
6.049% due 04/08/2014 | | | | 50 | | | | 65 |
|
| Republic of Germany | | | | | | | | |
5.250% due 01/04/2011 | | | | 1,100 | | | | 1,488 |
4.250% due 01/04/2014 | | | | 1,400 | | | | 1,820 |
6.250% due 01/04/2024 | | | | 600 | | | | 955 |
6.500% due 07/04/2027 | | | | 1,100 | | | | 1,828 |
5.625% due 01/04/2028 | | | | 3,550 | | | | 5,357 |
4.750% due 07/04/2028 | | | | 1,000 | | | | 1,355 |
6.250% due 01/04/2030 | | | | 400 | | | | 654 |
5.500% due 01/04/2031 | | | | 400 | | | | 600 |
4.750% due 07/04/2034 | | | | 100 | | | | 137 |
| | | | | | | | |
|
Total Germany (Cost $14,046) | | | | 14,324 |
| | | | | | | | |
|
| |
| ITALY (i) 0.4% |
| Seashell Securities PLC | | | | | | | | |
3.079% due 10/25/2028 | | EUR | | 50 | | | | 63 |
|
| Siena Mortgages SpA | | | | | | | | |
3.191% due 12/16/2038 | | | | 274 | | | | 352 |
|
| Telecom Italia SpA | | | | | | | | |
5.625% due 02/01/2007 | | | | 60 | | | | 78 |
| | | | | | | | |
|
Total Italy (Cost $461) | | | | | | | | 493 |
| | | | | | | | |
|
| |
| JAPAN (i) 10.9% |
| Bank of Tokyo-Mitsubishi UFJ Ltd. | | | | |
3.500% due 12/16/2015 | | EUR | | 100 | | | | 123 |
|
| Japan Government Bond | | | | | | | | |
0.700% due 09/20/2008 | | JPY | | 20,000 | | | | 174 |
1.000% due 09/20/2010 | | | | 100,000 | | | | 864 |
1.500% due 03/20/2011 | | | | 620,000 | | | | 5,453 |
1.600% due 09/20/2013 | | | | 10,000 | | | | 87 |
1.500% due 03/20/2014 | | | | 50,000 | | | | 429 |
1.600% due 06/20/2014 | | | | 120,000 | | | | 1,034 |
1.600% due 09/20/2014 | | | | 240,000 | | | | 2,064 |
2.300% due 05/20/2030 | | | | 7,000 | | | | 60 |
2.400% due 03/20/2034 | | | | 130,000 | | | | 1,116 |
2.300% due 06/20/2035 | | | | 130,000 | | | | 1,087 |
2.500% due 09/20/2035 | | | | 280,000 | | | | 2,442 |
|
| | | | | | | | |
| Resona Bank Ltd. | | | | | | | | |
5.850% due 09/29/2049 | | $ | | 100 | | $ | | 93 |
|
| Sumitomo Mitsui Banking Corp. | | | | |
5.625% due 07/29/2049 | | | | 100 | | | | 93 |
| | | | | | | | |
|
Total Japan (Cost $15,509) | | | | | | 15,119 |
| | | | | | | | |
|
| |
| MEXICO 0.1% |
| Pemex Project Funding Master Trust | | | | |
5.750% due 12/15/2015 | | $ | | 100 | | | | 92 |
| | | | | | | | |
|
Total Mexico (Cost $97) | | | | | | | | 92 |
| | | | | | | | |
|
| |
| NETHERLANDS (i) 1.1% |
| Dutch Mortgage-Backed Securities BV |
3.094% due 10/02/2079 | | EUR | | 1,000 | | | | 1,285 |
|
| Netherlands Government Bond | | | | |
4.250% due 07/15/2013 | | | | 200 | | | | 260 |
| | | | | | | | |
|
Total Netherlands (Cost $1,479) | | | | 1,545 |
| | | | | | | | |
|
| |
| SPAIN (i) 5.9% |
| Banesto Banco de Emisiones | | | | |
3.118% due 10/04/2006 | | EUR | | 100 | | | | 128 |
|
| Spain Government Bond | | | | | | | | |
5.150% due 07/30/2009 | | | | 900 | | | | 1,198 |
4.750% due 07/30/2014 | | | | 5,000 | | | | 6,734 |
| | | | | | | | |
|
Total Spain (Cost $7,887) | | | | | | 8,060 |
| | | | | | | | |
|
| |
| UNITED KINGDOM (i) 13.2% |
| HBOS PLC | | | | | | | | |
5.920% due 09/29/2049 | | $ | | 200 | | | | 185 |
|
| Holmes Financing PLC | | | | | | | | |
3.004% due 10/15/2009 | | EUR | | 100 | | | | 128 |
3.024% due 07/25/2010 | | | | 100 | | | | 128 |
|
| Paragon Mortgages PLC | | | | | | | | |
3.309% due 03/15/2030 | | | | 200 | | | | 256 |
|
| United Kingdom Gilt | | | | | | | | |
5.000% due 03/07/2008 | | GBP | | 100 | | | | 186 |
4.750% due 06/07/2010 | | | | 7,520 | | | | 13,881 |
5.000% due 03/07/2012 | | | | 200 | | | | 374 |
4.750% due 09/07/2015 | | | | 1,500 | | | | 2,779 |
|
| Vodafone Group PLC | | | | | | | | |
5.560% due 06/29/2007 | | $ | | 300 | | | | 300 |
| | | | | | | | |
|
Total United Kingdom (Cost $17,911) | | 18,217 |
| | | | | | | | |
|
| |
| UNITED STATES 38.7% |
| |
| ASSET-BACKED SECURITIES 7.8% |
| AAA Trust | | | | | | | | |
5.422% due 11/26/2035 | | $ | | 26 | | | | 26 |
|
| Accredited Mortgage Loan Trust | | | | |
5.216% due 09/25/2036 | | | | 700 | | | | 700 |
|
| ACE Securities Corp. | | | | | | | | |
5.432% due 10/25/2035 | | | | 128 | | | | 128 |
|
| Aegis Asset-Backed Securities Trust | | |
5.680% due 10/25/2034 | | | | 53 | | | | 53 |
|
| Amortizing Residential Collateral Trust | | |
5.672% due 10/25/2031 | | | | 4 | | | | 4 |
5.612% due 07/25/2032 | | | | 1 | | | | 1 |
|
| Argent Securities, Inc. | | | | | | | | |
5.442% due 10/25/2035 | | | | 95 | | | | 95 |
5.442% due 02/25/2036 | | | | 575 | | | | 575 |
|
| Asset-Backed Funding Certificates | | | | |
5.432% due 08/25/2035 | | | | 25 | | | | 26 |
|
| Asset-Backed Securities Corp. Home Equity |
5.432% due 11/25/2035 | | | | 59 | | | | 59 |
|
| | | | | | | | |
| Bear Stearns Asset-Backed Securities, Inc. |
5.532% due 07/25/2031 | | $ | | 2 | | $ | | 2 |
5.492% due 12/25/2042 | | | | 15 | | | | 15 |
|
| Capital One Auto Finance Trust | | | | |
5.117% due 05/15/2007 | | | | 247 | | | | 247 |
|
| Carrington Mortgage Loan Trust | | | | |
5.402% due 06/25/2035 | | | | 18 | | | | 18 |
5.442% due 09/25/2035 | | | | 241 | | | | 241 |
|
| Centex Home Equity | | | | | | | | |
5.412% due 06/25/2035 | | | | 28 | | | | 28 |
5.372% due 06/25/2036 | | | | 582 | | | | 582 |
|
| Countrywide Asset-Backed Certificates | | |
5.402% due 10/25/2035 | | | | 12 | | | | 12 |
5.160% due 07/25/2036 | | | | 700 | | | | 701 |
|
| CS First Boston Mortgage Securities Corp. | | |
5.632% due 01/25/2032 | | | | 2 | | | | 2 |
|
| First Franklin Mortgage Loan Asset-Backed Certificates |
5.731% due 02/25/2034 | | | | 4 | | | | 4 |
5.352% due 05/25/2036 | | | | 587 | | | | 587 |
|
| GSAMP Trust | | | | | | | | |
5.612% due 03/25/2034 | | | | 71 | | | | 72 |
|
| Indymac Residential Asset-Backed Trust | | |
5.000% due 08/25/2036 | | | | 700 | | | | 699 |
|
| IXIS Real Estate Capital Trust | | | | |
5.382% due 08/25/2036 | | | | 291 | | | | 291 |
|
| Long Beach Mortgage Loan Trust | | | | |
5.382% due 04/25/2036 | | | | 461 | | | | 461 |
|
| Merrill Lynch Mortgage Investors, Inc. | | |
5.422% due 06/25/2036 | | | | 6 | | | | 7 |
|
| Morgan Stanley ABS Capital I | | | | |
5.381% due 06/25/2036 | | | | 600 | | | | 600 |
|
| Morgan Stanley Capital I | | | | | | | | |
5.392% due 02/25/2036 | | | | 513 | | | | 513 |
|
| Morgan Stanley Home Equity Loans | | | | |
5.392% due 02/25/2036 | | | | 533 | | | | 534 |
|
| Option One Mortgage Loan Trust | | | | |
5.392% due 01/25/2036 | | | | 487 | | | | 488 |
|
| Quest Trust | | | | | | | | |
5.402% due 12/25/2035 | | | | 128 | | | | 128 |
|
| Residential Asset Mortgage Products, Inc. | | |
5.652% due 12/25/2033 | | | | 3 | | | | 3 |
5.402% due 02/25/2036 | | | | 523 | | | | 523 |
5.402% due 10/25/2036 | | | | 433 | | | | 433 |
|
| Residential Asset Securities Corp. | | | | |
5.422% due 05/25/2027 | | | | 63 | | | | 63 |
5.382% due 04/25/2036 | | | | 192 | | | | 192 |
|
| SACO I, Inc. | | | | | | | | |
5.432% due 07/25/2035 | | | | 73 | | | | 73 |
5.382% due 05/25/2036 | | | | 262 | | | | 262 |
|
| Saxon Asset Securities Trust |
5.592% due 01/25/2032 | | | | 3 | | | | 3 |
|
| Securitized Asset-Backed Receivables LLC Trust |
5.382% due 03/25/2036 | | | | 541 | | | | 541 |
|
| Soundview Home Equity Loan Trust |
5.492% due 04/25/2035 | | | | 76 | | | | 76 |
5.432% due 11/25/2035 | | | | 127 | | | | 127 |
|
| Structured Asset Securities Corp. |
5.722% due 05/25/2034 | | | | 32 | | | | 32 |
4.900% due 04/25/2035 | | | | 71 | | | | 68 |
5.432% due 11/25/2035 | | | | 354 | | | | 354 |
|
| Truman Capital Mortgage Loan Trust |
5.662% due 01/25/2034 | | | | 41 | | | | 41 |
| | | | | | | | |
|
| | | | | | | | | 10,690 |
| | | | | | | | |
|
| | | | | | |
| See Accompanying Notes | | Semiannual Report | | June 30, 2006 | | 9 |
| | |
| |
| Schedule of Investments Global Bond Portfolio (Unhedged) (Cont.) | | |
| | | | | | | | |
| | | | | PRINCIPAL | | | | |
| | | | | AMOUNT | | | | VALUE |
| | | | | (000S) | | | | (000S) |
| | | | | | | | | |
| CORPORATE BONDS & NOTES 6.5% |
| AT&T, Inc. | | | | | | | | |
5.262% due 05/15/2008 | | $ | | 600 | | $ | | 600 |
|
| Atlantic & Western Re Ltd. |
11.508% due 01/09/2007 | | | | 250 | | | | 246 |
|
| Boston Scientific Corp. |
6.000% due 06/15/2011 | | | | 200 | | | | 198 |
6.400% due 06/15/2016 | | | | 200 | | | | 195 |
|
| Charter One Bank N.A. |
5.157% due 04/24/2009 | | | | 1,000 | | | | 1,001 |
|
| CIT Group, Inc. |
5.259% due 02/21/2008 | | | | 300 | | | | 300 |
5.404% due 05/23/2008 | | | | 100 | | | | 100 |
5.380% due 06/08/2009 | | | | 500 | | | | 500 |
|
| Citigroup, Inc. |
5.520% due 12/26/2008 | | | | 200 | | | | 200 |
|
| CMS Energy Corp. |
8.900% due 07/15/2008 | | | | 200 | | | | 209 |
7.500% due 01/15/2009 | | | | 100 | | | | 102 |
|
| ConocoPhillips Australia Funding Co. |
5.128% due 04/09/2009 | | | | 500 | | | | 501 |
|
| Dominion Resources, Inc. |
5.790% due 09/28/2007 | | | | 100 | | | | 100 |
|
| General Electric Capital Corp. |
5.429% due 06/15/2009 | | | | 600 | | | | 601 |
|
| Harrah’s Operating Co., Inc. |
5.760% due 02/08/2008 | | | | 100 | | | | 100 |
|
| HJ Heinz Co. | | | | | | | | |
6.428% due 12/01/2020 | | | | 300 | | | | 305 |
|
| HSBC Finance Corp. |
5.459% due 09/15/2008 | | | | 100 | | | | 100 |
5.504% due 06/19/2009 | | | | 400 | | | | 400 |
5.500% due 01/19/2016 | | | | 200 | | | | 191 |
|
| Mizuho Preferred Capital Co. LLC |
8.790% due 12/29/2049 | | | | 100 | | | | 105 |
|
| Morgan Stanley |
5.276% due 02/09/2009 | | | | 500 | | | | 501 |
|
| Oracle Corp. & Ozark Holding, Inc. |
5.280% due 01/13/2009 | | | | 200 | | | | 200 |
|
| SB Treasury Co. LLC |
9.400% due 12/29/2049 | | | | 100 | | | | 106 |
|
| Tokai Preferred Capital Co. LLC |
9.980% due 12/29/2049 | | | | 200 | | | | 215 |
|
| Toyota Motor Credit Corp. |
5.140% due 10/12/2007 | | | | 400 | | | | 400 |
|
| Unicredito Italiano | | | | | | | | |
5.231% due 12/03/2007 | | | | 300 | | | | 301 |
5.307% due 12/13/2007 | | | | 400 | | | | 400 |
|
| US Bancorp | | | | | | | | |
5.371% due 04/28/2009 | | | | 300 | | | | 300 |
|
| Wachovia Bank N.A. | | | | | | | | |
5.489% due 03/23/2009 | | | | 500 | | | | 500 |
| | | | | | | | |
|
| | | | | | | | | 8,977 |
| | | | | | | | |
|
| |
| MORTGAGE-BACKED SECURITIES 8.3% |
| Banc of America Mortgage Securities |
5.000% due 05/25/2034 | | | | 272 | | | | 265 |
|
| Bear Stearns Commercial Mortgage Securities |
5.404% due 03/15/2019 | | | | 700 | | | | 699 |
|
| Countrywide Alternative Loan Trust |
5.291% due 02/25/2036 | | | | 479 | | | | 480 |
5.602% due 02/25/2036 | | | | 486 | | | | 487 |
6.209% due 08/25/2036 | | | | 700 | | | | 704 |
| | | | | | | | |
| Countrywide Home Loan Mortgage Pass-Through Trust |
5.602% due 08/25/2034 | | $ | | 35 | | $ | | 35 |
5.702% due 09/25/2034 | | | | 81 | | | | 82 |
5.652% due 02/25/2035 | | | | 54 | | | | 55 |
5.642% due 03/25/2035 | | | | 562 | | | | 563 |
5.612% due 04/25/2035 | | | | 54 | | | | 54 |
5.552% due 05/25/2035 | | | | 468 | | | | 468 |
|
| CS First Boston Mortgage Securities Corp. |
6.500% due 04/25/2033 | | | | 11 | | | | 11 |
|
| CSAB Mortgage-Backed Trust |
5.422% due 06/25/2036 | | | | 281 | | | | 281 |
|
| First Horizon Asset Securities, Inc. |
6.250% due 08/25/2017 | | | | 269 | | | | 268 |
|
| GE Capital Commercial Mortgage Corp. |
4.229% due 12/10/2037 | | | | 610 | | | | 589 |
|
| GMAC Commercial Mortgage Securities, Inc. |
6.420% due 05/15/2035 | | | | 93 | | | | 94 |
|
| GMAC Mortgage Corp. Loan Trust |
5.500% due 09/25/2034 | | | | 131 | | | | 129 |
|
| Greenpoint Mortgage Funding Trust |
5.592% due 11/25/2045 | | | | 67 | | | | 67 |
|
| GSR Mortgage Loan Trust |
3.405% due 06/01/2034 | | | | 107 | | | | 106 |
4.541% due 09/25/2035 | | | | 264 | | | | 258 |
|
| Harborview Mortgage Loan Trust |
5.622% due 02/25/2034 | | | | 34 | | | | 34 |
|
| Indymac Index Mortgage Loan Trust |
5.402% due 06/25/2046 | | | | 582 | | | | 583 |
|
| Lehman XS Trust | | | | | | | | |
5.402% due 06/25/2036 | | | | 700 | | | | 701 |
5.402% due 04/25/2046 | | | | 474 | | | | 474 |
|
| Mellon Residential Funding Corp. |
5.639% due 12/15/2030 | | | | 62 | | | | 62 |
|
| Nomura Asset Acceptance Corp. |
5.050% due 10/25/2035 | | | | 85 | | | | 83 |
|
| Residential Accredit Loans, Inc. |
5.532% due 03/25/2046 | | | | 598 | | | | 599 |
|
| Sequoia Mortgage Trust |
5.567% due 08/20/2032 | | | | 24 | | | | 24 |
|
| Structured Asset Mortgage Investments, Inc. |
5.602% due 03/19/2034 | | | | 52 | | | | 52 |
5.542% due 07/19/2034 | | | | 41 | | | | 41 |
5.542% due 09/25/2035 | | | | 599 | | | | 600 |
|
| Washington Mutual, Inc. |
5.592% due 12/25/2027 | | | | 142 | | | | 142 |
5.121% due 10/25/2032 | | | | 5 | | | | 5 |
5.009% due 02/27/2034 | | | | 21 | | | | 21 |
5.410% due 08/25/2042 | | | | 64 | | | | 64 |
5.632% due 12/25/2044 | | | | 59 | | | | 59 |
5.642% due 01/25/2045 | | | | 60 | | | | 60 |
5.612% due 10/25/2045 | | | | 170 | | | | 171 |
5.592% due 12/26/2045 | | | | 362 | | | | 363 |
5.259% due 07/25/2046 | | | | 700 | | | | 699 |
|
| Wells Fargo Mortgage-Backed Securities Trust |
4.750% due 10/25/2018 | | | | 258 | | | | 248 |
4.950% due 03/25/2036 | | | | 481 | | | | 474 |
5.240% due 05/25/2036 | | | | 184 | | | | 183 |
| | | | | | | | |
|
| | | | | | | | | 11,437 |
| | | | | | | | |
|
| |
| MUNICIPAL BONDS & NOTES 0.0% |
| New York City, New York Municipal Water Finance Authority Revenue Notes, Series 2004 |
5.000% due 02/01/2028 | | | | 25 | | | | 26 |
| | | | | | | | |
|
| |
| | | | | | | | | |
| PREFERRED STOCK 0.4% |
| DG Funding Trust | | | | | | | | | |
7.210% due 12/31/2049 | | | | 58 | | | $ | | 612 |
| | | | | | | | | |
|
| |
| | | | | PRINCIPAL
AMOUNT
(000S) | | | | | |
| U.S. GOVERNMENT AGENCIES 8.7% |
| Fannie Mae | | | | | | | | | |
4.192% due 11/01/2034 | | $ | | 414 | | | | | 406 |
4.401% due 10/01/2034 | | | | 54 | | | | | 53 |
4.964% due 12/01/2034 | | | | 59 | | | | | 58 |
5.000% due 11/01/2018 - 07/13/2036 (d) | | | | 896 | | | | | 850 |
5.442% due 03/25/2034 | | | | 64 | | | | | 64 |
5.472% due 08/25/2034 | | | | 60 | | | | | 60 |
5.500% due 10/01/2016 - 07/13/2036 (d) | | | | 5,534 | | | | | 5,337 |
5.572% due 08/25/2030 | | | | 61 | | | | | 61 |
6.000% due 07/25/2044 | | | | 129 | | | | | 128 |
|
| Freddie Mac | | | | | | | | | |
5.211% due 10/25/2044 | | | | 322 | | | | | 324 |
5.500% due 06/01/2035 - 07/13/2036 (d) | | | | 4,862 | | | | | 4,675 |
6.103% due 02/01/2029 | | | | 33 | | | | | 34 |
|
| Government National Mortgage Association |
5.125% due 11/20/2024 | | | | 8 | | | | | 9 |
| | | | | | | | | |
|
| | | | | | | | | | 12,059 |
| | | | | | | | | |
|
| |
| U.S. TREASURY OBLIGATIONS 7.0% |
| Treasury Inflation Protected Securities (c) |
3.000% due 07/15/2012 | | | | 112 | | | | | 115 |
2.000% due 01/15/2014 | | | | 109 | | | | | 105 |
2.000% due 07/15/2014 | | | | 214 | | | | | 206 |
|
| U.S. Treasury Bonds | | | | | | | | | |
8.750% due 05/15/2017 | | | | 100 | | | | | 129 |
8.875% due 02/15/2019 | | | | 200 | | | | | 266 |
8.125% due 08/15/2019 | | | | 100 | | | | | 127 |
8.125% due 05/15/2021 | | | | 1,100 | | | | | 1,415 |
8.000% due 11/15/2021 | | | | 600 | | | | | 768 |
7.125% due 02/15/2023 | | | | 600 | | | | | 718 |
6.250% due 08/15/2023 | | | | 3,800 | | | | | 4,192 |
|
| U.S. Treasury Notes | | | | | | | | | |
4.625% due 02/29/2008 | | | | 800 | | | | | 793 |
3.875% due 09/15/2010 | | | | 30 | | | | | 29 |
4.250% due 08/15/2013 | | | | 100 | | | | | 95 |
|
| U.S. Treasury Strips | | | | | | | | | |
0.000% due 05/15/2017 (b) | | | | 430 | | | | | 245 |
0.000% due 08/15/2020 (b) | | | | 300 | | | | | 142 |
0.000% due 11/15/2021 (b) | | | | 600 | | | | | 265 |
| | | | | | | | | |
|
| | | | | | | | | | 9,610 |
| | | | | | | | | |
|
Total United States (Cost $54,215) | | | | | 53,411 |
| | | | | | | | | |
|
| |
| | | | | NOTIONAL
AMOUNT
(000S) | | | | | |
| PURCHASED CALL OPTIONS 0.3% |
| 1-Year Interest Rate Swap (OTC) Pay 3-Month USD-LIBOR Floating Rate Index |
Strike @ 5.190%
Exp. 05/09/2007 | | $ | | 171,200 | | | | | 174 |
|
| 2-Year Interest Rate Swap (OTC) Pay 3-Month USD-LIBOR Floating Rate Index |
Strike @ 4.500%
Exp. 10/18/2006 | | | | 4,700 | | | | | 0 |
Strike @ 4.750%
Exp. 08/07/2006 | | | | 4,700 | | | | | 0 |
Strike @ 5.080%
Exp. 04/19/2007 | | | | 4,600 | | | | | 7 |
Strike @ 5.150%
Exp. 05/08/2007 | | | | 23,300 | | | | | 45 |
| | | | |
| 10 | | PIMCO Variable Insurance Trust | | See Accompanying Notes |
| | |
| |
| | | June 30, 2006 (Unaudited) |
| | | | | | | | |
| | | | | NOTIONAL | | | | |
| | | | | AMOUNT | | | | VALUE |
| | | | | (000S) | | | | (000S) |
| |
Strike @ 5.130% Exp. 10/25/2006 | | $ | | 4,700 | | $ | | 1 |
Strike @ 5.200% Exp. 05/09/2007 | | | | 10,600 | | | | 23 |
Strike @ 5.500% Exp. 06/29/2007 | | | | 10,800 | | | | 52 |
|
| 30-Year Interest Rate Swap (OTC) Pay 3-Month USD-LIBOR Floating Rate Index |
Strike @ 5.750% Exp. 04/27/2009 | | | | 100 | | | | 6 |
|
| U.S. dollar versus Japanese Yen (OTC) |
Strike @ JY117.000 Exp. 12/11/2006 | | | | 740 | | | | 5 |
Strike @ JY120.000 Exp. 12/11/2006 | | | | 50 | | | | 0 |
|
| |
| | | | | #OF
CONTRACTS | | | | |
| U.S. Treasury 30-Year Bond September Futures (CBOT) |
Strike @ $108.000 Exp. 08/25/2006 | | | | 23 | | | | 14 |
| | | | | | | | |
|
Total Purchased Call Options (Cost $622) | | 327 |
| | | | | | | | |
|
| |
| | | | | NOTIONAL
AMOUNT
(000S) | | | | |
| PURCHASED PUT OPTIONS 0.0% |
| 30-Year Interest Rate Swap (OTC) Receive 3-Month USD-LIBOR Floating Rate Index |
Strike @ 6.250% Exp. 04/27/2009 | | $ | | 100 | | | | 4 |
| |
| | | | | # OF
CONTRACTS | | | | |
| 90-Day Eurodollar December Futures (CME) |
Strike @ $91.750 Exp. 12/18/2006 | | | | 161 | | | | 1 |
|
| U.S. Treasury 10-Year Note September Futures (CBOT) |
Strike @ $98.000 Exp. 08/25/2006 | | | | 100 | | | | 2 |
|
| U.S. Treasury 30-Year Bond September Futures (CBOT) |
Strike @ $103.000 Exp. 08/25/2006 | | | | 23 | | | | 4 |
| | | | | | | | |
|
Total Purchased Put Options (Cost $25) | | 11 |
| | | | | | | | |
|
| |
| | | | | | | | |
| | | | | NOTIONAL | | | | |
| | | | | AMOUNT | | | | VALUE |
| | | | | (000S) | | | | (000S) |
| |
| PURCHASED STRADDLE OPTIONS (j) 0.0% |
| Call & Put–OTC U.S. dollar versus Japanese Yen Forward Delta Neutral Straddle |
Strike @ $0.000 Exp. 08/23/2007 | | $ | | 6,000 | | $ | | 3 |
| | | | | | | | |
|
Total Purchased Straddle Options (Cost $0) | | 3 |
| | | | | | | | |
|
| | | | | | | | | |
| | | | | PRINCIPAL
AMOUNT
(000S) | | | | |
| SHORT-TERM INSTRUMENTS 23.2% |
| |
| CERTIFICATES OF DEPOSIT 2.0% |
| Countrywide Bank N.A. | | | | | | | | |
5.209% due 09/15/2006 | | $ | | 700 | | | | 700 |
|
| Danske Corp. | | | | | | | | |
4.980% due 07/26/2006 | | | | 2,000 | | | | 1,994 |
| | | | | | | | |
|
| | | | | | | | | 2,694 |
| | | | | | | | |
|
| |
| COMMERCIAL PAPER 20.1% |
| Bank of Ireland | | | | | | | | |
5.090% due 08/17/2006 | | | | 2,800 | | | | 2,782 |
|
| BNP Paribas Finance | | | | | | | | |
5.000% due 08/28/2006 | | | | 3,300 | | | | 3,274 |
|
| CBA (de) Finance | | | | | | | | |
5.080% due 08/21/2006 | | | | 3,700 | | | | 3,674 |
|
| Dexia Delaware LLC | | | | | | | | |
4.980% due 07/25/2006 | | | | 1,800 | | | | 1,795 |
5.065% due 08/18/2006 | | | | 1,300 | | | | 1,292 |
|
| DnB NORBank ASA | | | | | | | | |
4.990% due 08/18/2006 | | | | 2,400 | | | | 2,385 |
|
| HBOS Treasury Services PLC | | | | | | | | |
5.055% due 08/17/2006 | | | | 3,100 | | | | 3,080 |
|
| Nordea N.A., Inc. | | | | | | | | |
5.120% due 09/05/2006 | | | | 3,500 | | | | 3,468 |
5.180% due 09/08/2006 | | | | 700 | | | | 693 |
|
| Societe Generale N.A. | | | | | | | | |
5.055% due 08/15/2006 | | | | 400 | | | | 398 |
4.985% due 08/22/2006 | | | | 1,500 | | | | 1,490 |
|
| Sumitomo Corp. of America | | | | | | | | |
4.980% due 09/12/2006 | | | | 200 | | | | 198 |
| | | | | | | | | |
| Svenska Handelsbanken, Inc. | | | | | |
5.190% due 09/11/2006 | | $ | | 2,900 | | $ | | 2,871 | |
|
|
| Time Warner Telecom, Inc. | | | | | | | | | |
5.240% due 09/19/2006 | | | | 300 | | | | 297 | |
| | | | | | | | |
|
|
| | | | | | | | | 27,697 | |
| | | | | | | | |
|
|
| | |
| REPURCHASE AGREEMENT 0.5% | |
| State Street Bank | | | | | | | | | |
4.900% due 07/03/2006 | | | | 660 | | | | 660 | |
| | | | | | | | |
|
|
(Dated 06/30/2006. Collateralized by Freddie Mac 2.750% due 02/09/2007 valued at $676. Repurchase proceeds are $660.) | |
| | |
| U.S. TREASURY BILLS 0.6% | |
4.748% due 08/31/2006 - 09/14/2006 (d)(e) | | | | 905 | | | | 896 | |
| | | | | | | | |
|
|
Total Short-Term Instruments
(Cost $31,947) | | | | 31,947 | |
| | | | | | | | |
|
|
| | | | | | | | |
Total Investments (a)
(Cost $147,653) 106.7% | | $ | | 146,967 | |
| | | | | | | | |
Written Options (g) (0.3%)
(Premiums $648) | | | | (358) | |
| | | | | | | | |
| Other Assets and Liabilities (Net) (6.4%) | | | | (8,812 | ) |
| | | | | | | | |
|
|
| Net Assets 100.0% | | $ | | 137,797 | |
| | | | | | | | |
|
|
|
Notes to Schedule of Investments (amounts in thousands, except number of contracts): |
(a) As of June 30, 2006, portfolio securities with an aggregate market value of $6,670 were valued in good faith and pursuant to guidelines established by the Board of Trustees. |
| |
(b) Principal only security. |
| |
(c) Principal amount of security is adjusted for inflation. |
| |
(d) Securities are grouped by coupon or range of coupons and represent a range of maturities. |
| |
(e) Securities with an aggregate market value of $649 have been segregated with the custodian to cover margin requirements for the following open futures contracts on June 30, 2006: |
| | | | | | | | | | |
| Description | | Type | | Expiration
Month | | # of
Contracts | | Unrealized
Appreciation/
(Depreciation) | |
90-Day Eurodollar June Futures | | Long | | 06/2007 | | 79 | | $ | (51 | ) |
Euro-Bobl 5-Year Note September Futures | | Long | | 09/2006 | | 8 | | | (5 | ) |
Euro-Bund 10-Year Note September Futures | | Long | | 09/2006 | | 68 | | | (56 | ) |
Euro-Bund 10-Year Note September Futures Put Option Strike @ EUR107.500 | | Long | | 09/2006 | | 50 | | | 0 | |
Japan Government 10-Year Note September Futures | | Long | | 09/2006 | | 19 | | | (12 | ) |
U.S. Treasury 5-Year Note September Futures | | Long | | 09/2006 | | 23 | | | (14 | ) |
U.S. Treasury 10-Year Note September Futures | | Long | | 09/2006 | | 87 | | | (42 | ) |
U.S. Treasury 30-Year Bond September Futures | | Long | | 09/2006 | | 11 | | | 1 | |
| | | | | | | | |
|
|
|
| | | | | | | | | $ | (179 | ) |
| | | | | | | | |
|
|
|
| | | | | | |
| See Accompanying Notes | | Semiannual Report | | June 30, 2006 | | 11 |
Schedule of Investments Global Bond Portfolio (Unhedged) (Cont.)
| | | | | | | | | | | | | | | | | |
(f) Swap agreements outstanding on June 30, 2006: | | | | |
| Interest Rate Swaps | | | | | | | | | | | | | | | | | |
| Counterparty | | Floating Rate
Index | | Pay/Receive
Floating Rate | | Fixed Rate | | Expiration
Date | | | | Notional
Amount | | Unrealized
Appreciation/
(Depreciation) | |
Citibank N.A. | | 6-month Australian Bank Bill | | Pay | | 6.000% | | 06/15/2010 | | | AUD | | 700 | | $ | (8 | ) |
Citibank N.A. | | 6-month Australian Bank Bill | | Receive | | 6.000% | | 06/15/2015 | | | | | 400 | | | 7 | |
Deutsche Bank AG | | 6-month Australian Bank Bill | | Pay | | 6.000% | | 12/15/2011 | | | | | 3,900 | | | (14 | ) |
Deutsche Bank AG | | 6-month Australian Bank Bill | | Receive | | 6.000% | | 12/15/2016 | | | | | 2,300 | | | 13 | |
HSBC Bank USA | | 6-month Australian Bank Bill | | Pay | | 6.000% | | 12/15/2011 | | | | | 3,100 | | | (5 | ) |
HSBC Bank USA | | 6-month Australian Bank Bill | | Receive | | 6.000% | | 12/15/2016 | | | | | 1,800 | | | 6 | |
UBS Warburg LLC | | 6-month Australian Bank Bill | | Pay | | 6.000% | | 06/15/2010 | | | | | 2,800 | | | (42 | ) |
UBS Warburg LLC | | 6-month Australian Bank Bill | | Receive | | 6.000% | | 06/15/2015 | | | | | 1,600 | | | 37 | |
Bank of America | | 3-month Canadian Bank Bill | | Receive | | 5.500% | | 12/16/2014 | | | CAD | | 500 | | | 6 | |
Merrill Lynch & Co., Inc. | | 3-month Canadian Bank Bill | | Receive | | 5.500% | | 12/16/2014 | | | | | 700 | | | 14 | |
Royal Bank of Canada | | 3-month Canadian Bank Bill | | Receive | | 5.000% | | 06/15/2015 | | | | | 1,500 | | | 16 | |
Barclays Bank PLC | | 6-month EUR-LIBOR | | Receive | | 4.000% | | 06/17/2010 | | | EUR | | 10 | | | 0 | |
Barclays Bank PLC | | 6-month EUR-LIBOR | | Receive | | 4.000% | | 12/15/2014 | | | | | 300 | | | 29 | |
BNP Paribas Bank | | 6-month EUR-LIBOR | | Pay | | 6.000% | | 06/18/2034 | | | | | 300 | | | 3 | |
Citibank N.A. | | 6-month EUR-LIBOR | | Receive | | 4.000% | | 12/15/2014 | | | | | 460 | | | 30 | |
Citibank N.A. | | 6-month EUR-LIBOR | | Pay | | 6.000% | | 06/18/2034 | | | | | 200 | | | (20 | ) |
Deutsche Bank AG | | 6-month EUR-LIBOR | | Receive | | 4.000% | | 12/15/2011 | | | | | 700 | | | 1 | |
Deutsche Bank AG | | 6-month EUR-LIBOR | | Pay | | 6.000% | | 06/18/2034 | | | | | 100 | | | (2 | ) |
J.P. Morgan Chase & Co. | | 6-month EUR-LIBOR | | Receive | | 5.000% | | 06/17/2012 | | | | | 900 | | | 48 | |
J.P. Morgan Chase & Co. | | 6-month EUR-LIBOR | | Receive | | 4.000% | | 12/15/2014 | | | | | 2,800 | | | 215 | |
Lehman Brothers, Inc. | | 6-month EUR-LIBOR | | Receive | | 4.000% | | 12/15/2014 | | | | | 1,600 | | | 111 | |
Merrill Lynch & Co., Inc. | | 6-month EUR-LIBOR | | Pay | | 6.000% | | 06/18/2034 | | | | | 300 | | | (2 | ) |
Morgan Stanley Dean Witter & Co. | | 6-month EUR-LIBOR | | Receive | | 4.000% | | 12/15/2011 | | | | | 5,300 | | | 40 | |
Morgan Stanley Dean Witter & Co. | | 6-month EUR-LIBOR | | Receive | | 4.000% | | 12/15/2014 | | | | | 2,300 | | | 148 | |
Morgan Stanley Dean Witter & Co. | | 6-month EUR-LIBOR | | Receive | | 4.500% | | 06/17/2015 | | | | | 500 | | | 54 | |
Morgan Stanley Dean Witter & Co. | | 6-month EUR-LIBOR | | Pay | | 6.000% | | 06/18/2034 | | | | | 3,100 | | | (8 | ) |
UBS Warburg LLC | | 6-month EUR-LIBOR | | Pay | | 4.000% | | 06/17/2010 | | | | | 200 | | | (9 | ) |
UBS Warburg LLC | | 6-month EUR-LIBOR | | Pay | | 6.000% | | 06/18/2034 | | | | | 200 | | | (4 | ) |
Barclays Bank PLC | | 6-month GBP-LIBOR | | Pay | | 5.000% | | 09/15/2010 | | | GBP | | 3,400 | | | (82 | ) |
Barclays Bank PLC | | 6-month GBP-LIBOR | | Receive | | 5.000% | | 09/15/2015 | | | | | 1,400 | | | 10 | |
Deutsche Bank AG | | 6-month GBP-LIBOR | | Pay | | 5.000% | | 06/15/2009 | | | | | 2,800 | | | 4 | |
Deutsche Bank AG | | 6-month GBP-LIBOR | | Receive | | 5.000% | | 09/15/2015 | | | | | 200 | | | 7 | |
Deutsche Bank AG | | 6-month GBP-LIBOR | | Receive | | 4.000% | | 12/15/2035 | | | | | 500 | | | 0 | |
Deutsche Bank AG | | 6-month GBP-LIBOR | | Receive | | 4.250% | | 06/12/2036 | | | | | 200 | | | 16 | |
Goldman Sachs & Co. | | 6-month GBP-LIBOR | | Receive | | 4.250% | | 06/12/2036 | | | | | 1,300 | | | 31 | |
HSBC Bank USA | | 6-month GBP-LIBOR | | Pay | | 5.000% | | 09/15/2010 | | | | | 400 | | | (10 | ) |
Merrill Lynch & Co., Inc. | | 6-month GBP-LIBOR | | Pay | | 5.000% | | 09/15/2010 | | | | | 4,300 | | | (105 | ) |
Morgan Stanley Dean Witter & Co. | | 6-month GBP-LIBOR | | Pay | | 5.000% | | 09/15/2015 | | | | | 700 | | | (1 | ) |
Goldman Sachs & Co. | | 3-month HKD-HIBOR | | Receive | | 4.235% | | 12/17/2008 | | | HKD | | 5,800 | | | 13 | |
Barclays Bank PLC | | 6-month JPY-LIBOR | | Receive | | 2.000% | | 12/15/2015 | | | JPY | | 60,000 | | | 5 | |
Deutsche Bank AG | | 6-month JPY-LIBOR | | Pay | | 1.000% | | 03/18/2008 | | | | | 100,000 | | | 0 | |
Goldman Sachs & Co. | | 6-month JPY-LIBOR | | Receive | | 2.000% | | 12/15/2015 | | | | | 910,000 | | | 50 | |
Merrill Lynch & Co., Inc. | | 6-month JPY-LIBOR | | Receive | | 2.000% | | 12/15/2015 | | | | | 120,000 | | | 9 | |
Morgan Stanley Dean Witter & Co. | | 6-month JPY-LIBOR | | Receive | | 2.000% | | 12/15/2015 | | | | | 510,000 | | | 35 | |
UBS Warburg LLC | | 6-month JPY-LIBOR | | Receive | | 0.800% | | 03/20/2012 | | | | | 50,000 | | | 4 | |
UBS Warburg LLC | | 6-month JPY-LIBOR | | Receive | | 2.000% | | 06/15/2012 | | | | | 45,000 | | | 11 | |
UBS Warburg LLC | | 6-month JPY-LIBOR | | Receive | | 2.000% | | 12/20/2013 | | | | | 420,000 | | | 60 | |
Bank of America | | 3-month USD-LIBOR | | Pay | | 5.000% | | 12/20/2036 | | $ | | | 1,000 | | | (9 | ) |
Barclays Bank PLC | | 3-month USD-LIBOR | | Receive | | 5.000% | | 12/20/2016 | | | | | 4,500 | | | 55 | |
Goldman Sachs & Co. | | 3-month USD-LIBOR | | Pay | | 5.500% | | 12/16/2014 | | | | | 700 | | | (16 | ) |
Goldman Sachs & Co. | | 3-month USD-LIBOR | | Receive | | 5.000% | | 12/20/2016 | | | | | 2,600 | | | 32 | |
J.P. Morgan Chase & Co. | | 3-month USD-LIBOR | | Pay | | 5.000% | | 12/20/2011 | | | | | 800 | | | (2 | ) |
J.P. Morgan Chase & Co. | | 3-month USD-LIBOR | | Receive | | 5.000% | | 12/20/2016 | | | | | 1,400 | | | 17 | |
Lehman Brothers, Inc. | | 3-month USD-LIBOR | | Pay | | 5.000% | | 12/20/2011 | | | | | 1,700 | | | (15 | ) |
Lehman Brothers, Inc. | | 3-month USD-LIBOR | | Receive | | 5.000% | | 12/20/2013 | | | | | 4,300 | | | 50 | |
Lehman Brothers, Inc. | | 3-month USD-LIBOR | | Receive | | 5.000% | | 12/20/2016 | | | | | 1,100 | | | 14 | |
Lehman Brothers, Inc. | | 3-month USD-LIBOR | | Pay | | 5.000% | | 12/20/2036 | | | | | 1,000 | | | (9 | ) |
Morgan Stanley Dean Witter & Co. | | 3-month USD-LIBOR | | Receive | | 5.000% | | 12/20/2016 | | | | | 4,600 | | | 57 | |
Royal Bank of Scotland PLC | | 3-month USD-LIBOR | | Pay | | 5.000% | | 12/20/2011 | | | | | 18,000 | | | (161 | ) |
| | | | | | | | | | | | | | | |
|
|
|
| | | | | | | | | | | | | | | | $ | 734 | |
| | | | | | | | | | | | | | | |
|
|
|
| | | | |
| 12 | | PIMCO Variable Insurance Trust | | See Accompanying Notes |
| | |
| |
| | | June 30, 2006 (Unaudited) |
| | | | | | | | | | | | | | |
| Credit Default Swaps | | | | | | | | | | | | | | |
| Counterparty | | Reference Entity | | Buy/Sell
Protection+ | | (Pay)/Receive
Fixed Rate | | Expiration
Date | | Notional
Amount | | Unrealized
Appreciation |
Merrill Lynch & Co., Inc. | | Russia Government International Bond, 5.000% until 03/31/2007 and 7.500% thereafter, due 03/31/2030 | | Sell | | 0.410% | | 06/20/2007 | | $ | 400 | | $ | 0 |
| | | | | | | | | | | | | |
|
|
|
| + If the Portfolio is a seller of protection and a credit event occurs, as defined under the terms of that particular swap agreement, the Portfolio will pay to the buyer of the protection an amount up to the notional value of the swap and in certain instances, take delivery of the security. As a buyer of protection, the Portfolio will generally the seller of protection an amount up to the notional amount of the swap if a credit event occurs. |
| | | | | | | | | | | | | | | | | |
(g) Written options outstanding on June 30, 2006: |
| Options on Exchange-Traded Futures Contracts | | | | | | | | | | | | | |
| Description | | | | | | Exercise
Price | | Expiration
Date | | # of
Contracts | | Premium | | Value |
Call - CBOT U.S. Treasury 10-Year Note September Futures | | $ | 106.000 | | 08/25/2006 | | 39 | | $ | 22 | | $ | 9 |
Put - CBOT U.S. Treasury 10-Year Note September Futures | | | 103.000 | | 08/25/2006 | | 39 | | | 13 | | | 5 |
| | | | | | | | | | | | | |
|
| |
|
|
| | | | | | | | | | | | | | $ | 35 | | $ | 14 |
| | | | | | | | | | | | | |
|
| |
|
|
| | | | | | | | | | | | | | | | | | | |
| | | | | | | | |
| Interest Rate Swaptions | | | | | | | | | | | | | | | | | | | |
| Description | | Counterparty | | Floating Rate
Index | | Pay/Receive
Floating Rate | | Exercise
Rate | | Expiration
Date | | Notional
Amount | | Premium | | Value |
Call - OTC 5-Year Interest Rate Swap | | Goldman Sachs & Co. | | 3-month USD-LIBOR | | Receive | | 4.780% | | 08/07/2006 | | $ | 2,000 | | $ | 16 | | $ | 0 |
Call - OTC 5-Year Interest Rate Swap | | Goldman Sachs & Co. | | 3-month USD-LIBOR | | Receive | | 5.210% | | 10/25/2006 | | | 2,000 | | | 9 | | | 2 |
Call - OTC 5-Year Interest Rate Swap | | J.P. Morgan Chase & Co. | | 3-month USD-LIBOR | | Receive | | 4.560% | | 10/18/2006 | | | 2,000 | | | 20 | | | 0 |
Call - OTC 5-Year Interest Rate Swap | | Royal Bank of Scotland PLC | | 3-month USD-LIBOR | | Receive | | 5.220% | | 04/19/2007 | | | 2,000 | | | 16 | | | 9 |
Call - OTC 5-Year Interest Rate Swap | | Royal Bank of Scotland PLC | | 3-month USD-LIBOR | | Receive | | 5.280% | | 05/08/2007 | | | 10,200 | | | 91 | | | 55 |
Call - OTC 5-Year Interest Rate Swap | | Royal Bank of Scotland PLC | | 3-month USD-LIBOR | | Receive | | 5.315% | | 05/09/2007 | | | 38,300 | | | 355 | | | 226 |
Call - OTC 5-Year Interest Rate Swap | | Royal Bank of Scotland PLC | | 3-month USD-LIBOR | | Receive | | 5.315% | | 05/09/2007 | | | 4,600 | | | 43 | | | 27 |
Call - OTC 5-Year Interest Rate Swap | | Royal Bank of Scotland PLC | | 3-month USD-LIBOR | | Receive | | 5.600% | | 06/29/2007 | | | 4,700 | | | 52 | | | 56 |
| | | | | | | | | | | | |
|
| |
|
|
| | | | | | | | | | | | | | | | $ | 602 | | $ | 375 |
| | | | | | | | | | | | | | | |
|
| |
|
|
| | | | | | | | | | | | | | | | |
| | | | | | |
| Straddle Options | | | | | | | | | | | | | | | | |
| Description | | Counterparty | | Exercise
Price* | | Expiration
Date | | Notional
Amount | | Premium* | | Value | |
Call & Put - OTC U.S. dollar versus Japanese Yen Forward Delta Neutral Straddle | | Goldman Sachs & Co. | | $0.000 | | 08/23/2007 | | $ | 5,000 | | $ | 11 | | $ | (31 | ) |
| | | | | | | | | | | |
|
| |
|
|
|
|
| * Exercise price and final premium determined on a future date, based upon implied volatility parameters. | |
| | | | | | | | | | | | | |
(h) Short sales outstanding on June 30, 2006: | | | | | | | | | | | |
| Description | | Coupon | | Maturity
Date | | Principal
Amount | | Proceeds | | Valueà |
U.S. Treasury Note | | 4.875% | | 05/31/2011 | | $ | 200 | | $ | 199 | | $ | 199 |
U.S. Treasury Note | | 5.125% | | 05/15/2016 | | | 200 | | | 202 | | | 202 |
| | | | | | | | | |
|
| |
|
|
| | | | | | | | | | $ | 401 | | $ | 401 |
| | | | | | | | | |
|
| |
|
|
|
à Market value includes $3 of interest payable on short sales. |
| | | | | | |
| See Accompanying Notes | | Semiannual Report | | June 30, 2006 | | 13 |
Schedule of Investments Global Bond Portfolio (Unhedged) (Cont.)
| | | | | | | | | | | | | | | | | |
(i) Forward foreign currency contracts outstanding on June 30, 2006: | | | | | |
| Type | | | | Principal
Amount
Covered by
Contract | | Settlement
Month | | Unrealized
Appreciation | | Unrealized
(Depreciation) | | | Net Unrealized
Appreciation/
(Depreciation) | |
Buy | | AUD | | 422 | | 08/2006 | | $ | 5 | | $ | 0 | | | $ | 5 | |
Buy | | CAD | | 3,184 | | 07/2006 | | | 0 | | | (33 | ) | | | (33 | ) |
Buy | | CLP | | 10,300 | | 07/2006 | | | 0 | | | 0 | | | | 0 | |
Sell | | | | 10,300 | | 07/2006 | | | 0 | | | 0 | | | | 0 | |
Buy | | | | 6,033 | | 08/2006 | | | 0 | | | 0 | | | | 0 | |
Buy | | | | 10,300 | | 09/2006 | | | 0 | | | 0 | | | | 0 | |
Buy | | CNY | | 9,364 | | 05/2007 | | | 0 | | | (12 | ) | | | (12 | ) |
Buy | | DKK | | 6,472 | | 09/2006 | | | 0 | | | (3 | ) | | | (3 | ) |
Buy | | EUR | | 30,275 | | 07/2006 | | | 572 | | | 0 | | | | 572 | |
Sell | | | | 6,625 | | 07/2006 | | | 0 | | | (37 | ) | | | (37 | ) |
Buy | | GBP | | 135 | | 07/2006 | | | 2 | | | 0 | | | | 2 | |
Sell | | | | 5,157 | | 07/2006 | | | 0 | | | (37 | ) | | | (37 | ) |
Buy | | | | 100 | | 07/2006 | | | 3 | | | 0 | | | | 3 | |
Sell | | | | 100 | | 07/2006 | | | 0 | | | (2 | ) | | | (2 | ) |
Buy | | | | 61 | | 08/2006 | | | 2 | | | 0 | | | | 2 | |
Buy | | | | 100 | | 09/2006 | | | 2 | | | 0 | | | | 2 | |
Buy | | INR | | 648 | | 08/2006 | | | 0 | | | 0 | | | | 0 | |
Buy | | JPY | | 15,213 | | 07/2006 | | | 0 | | | 0 | | | | 0 | |
Buy | | | | 3,302,687 | | 08/2006 | | | 0 | | | (230 | ) | | | (230 | ) |
Buy | | KRW | | 13,000 | | 07/2006 | | | 0 | | | 0 | | | | 0 | |
Sell | | | | 13,000 | | 07/2006 | | | 0 | | | 0 | | | | 0 | |
Buy | | | | 235,698 | | 08/2006 | | | 4 | | | 0 | | | | 4 | |
Buy | | | | 39,973 | | 09/2006 | | | 1 | | | 0 | | | | 1 | |
Buy | | MXN | | 457 | | 08/2006 | | | 0 | | | (3 | ) | | | (3 | ) |
Buy | | | | 68 | | 09/2006 | | | 0 | | | 0 | | | | 0 | |
Buy | | PEN | | 124 | | 08/2006 | | | 0 | | | 0 | | | | 0 | |
Sell | | | | 124 | | 08/2006 | | | 0 | | | 0 | | | | 0 | |
Buy | | PLN | | 34 | | 08/2006 | | | 0 | | | (1 | ) | | | (1 | ) |
Buy | | | | 15 | | 09/2006 | | | 0 | | | 0 | | | | 0 | |
Buy | | | | 75 | | 11/2006 | | | 0 | | | 0 | | | | 0 | |
Buy | | RUB | | 172 | | 07/2006 | | | 0 | | | 0 | | | | 0 | |
Sell | | | | 172 | | 07/2006 | | | 0 | | | 0 | | | | 0 | |
Buy | | | | 946 | | 08/2006 | | | 2 | | | 0 | | | | 2 | |
Buy | | | | 172 | | 09/2006 | | | 0 | | | 0 | | | | 0 | |
Buy | | SEK | | 8,983 | | 09/2006 | | | 4 | | | 0 | | | | 4 | |
Buy | | SGD | | 11 | | 07/2006 | | | 0 | | | 0 | | | | 0 | |
Sell | | | | 11 | | 07/2006 | | | 0 | | | 0 | | | | 0 | |
Buy | | | | 428 | | 08/2006 | | | 1 | | | (3 | ) | | | (2 | ) |
Buy | | | | 11 | | 09/2006 | | | 0 | | | 0 | | | | 0 | |
Buy | | SKK | | 478 | | 08/2006 | | | 0 | | | 0 | | | | 0 | |
Buy | | | | 788 | | 09/2006 | | | 1 | | | 0 | | | | 1 | |
Buy | | TWD | | 9,257 | | 08/2006 | | | 0 | | | (7 | ) | | | (7 | ) |
Buy | | ZAR | | 97 | | 08/2006 | | | 0 | | | (2 | ) | | | (2 | ) |
| | | | | | | | |
|
|
|
| | | | | | | | | $ | 599 | | $ | (370 | ) | | $ | 229 | |
| | | | | | | | |
|
|
|
|
| (j) Exercise price and premium determined on a future date, based upon implied volatility parameters. | |
| | | | |
| 14 | | PIMCO Variable Insurance Trust | | See Accompanying Notes |
| | |
| |
| Notes to Financial Statements | | June 30, 2006 (Unaudited) |
1. ORGANIZATION
The Global Bond Portfolio (Unhedged) (the “Portfolio”) is a series of the PIMCO Variable Insurance Trust (the “Trust”). The Trust is registered under the Investment Company Act of 1940 (the “Act”), as amended, as an open-end investment management company organized as a Delaware business trust on October 3, 1997. The Portfolio offers two classes of shares: Institutional and Administrative. Information presented in these financial statements pertains to the Administrative Class of the Portfolio. Certain detailed financial information for the Institutional Class is provided separately and is available upon request. The Trust is designed to be used as an investment vehicle by Separate Accounts of insurance companies that fund variable annuity contracts and variable life insurance policies and by qualified pension and retirement plans.
2. SIGNIFICANT ACCOUNTING POLICIES
The following is a summary of significant accounting policies consistently followed by the Portfolio in the preparation of its financial statements in conformity with accounting principles generally accepted in the United States of America (“GAAP”). The preparation of financial statements in accordance with GAAP requires management to make estimates and assumptions that affect the reported amounts and disclosures in the financial statements. Actual results could differ from those estimates.
Security Valuation. Portfolio securities are valued as of the close of regular trading (normally 4:00 p.m., Eastern Time) on each day that the New York Stock Exchange (“NYSE”) is open. Portfolio securities and other assets for which market quotes are readily available are stated at market value. Market value is generally determined on the basis of last reported sales prices, or if no sales are reported, based on quotes obtained from a quotation reporting system, established market makers, or pricing services. Fixed-income securities and non-exchange traded derivatives are normally valued on the basis of quotes obtained from brokers and dealers or pricing services. Prices obtained from independent pricing services use information provided by market makers or estimates of market values obtained from yield data relating to investments or securities with similar characteristics. Certain fixed-income securities purchased on a delayed-delivery basis are marked to market daily until settlement at the forward settlement date. Short-term investments having a maturity of 60 days or less are generally valued at amortized cost. Exchange traded options, futures and options on futures are valued at the settlement price determined by the relevant exchange.
Investments initially valued in currencies other than the U.S. dollar are converted to the U.S. dollar using exchange rates obtained from pricing services. As a result, the NAV of the Portfolio’s shares may be affected by changes in the value of currencies in relation to the U.S. dollar. The value of securities traded in markets outside the United States or denominated in currencies other than the U.S. dollar may be affected significantly on a day that the NYSE is closed and an investor is not able to purchase, redeem or exchange shares.
Securities and other assets for which market quotes are not readily available are valued at fair value as determined in good faith by the Board of Trustees or persons acting at their direction. The Board of Trustees has adopted methods for valuing securities and other assets in circumstances where market quotes are not readily available, and has delegated to Pacific Investment Management Company LLC (“PIMCO”) the responsibility for applying the valuation methods. In the event that market quotes are not readily available, and the security or asset cannot be valued pursuant to one of the valuation methods, the value of the security or asset will be determined in good faith by the Valuation Committee of the Board of Trustees, generally based upon recommendations provided by PIMCO.
Market quotes are considered not readily available in circumstances where there is an absence of current or reliable market-based data (e.g., trade information, bid/ asked information, broker quotes), including where events occur after the close of the relevant market, but prior to the close of regular trading, that materially affect the values of the Portfolio’s securities or assets. In addition, market quotes are considered not readily available when, due to extraordinary circumstances, the exchanges or markets on which the securities trade do not open for trading for the entire day and no other market prices are available. The Board has delegated to PIMCO the responsibility for monitoring significant events that may materially affect the values of the Portfolio’s securities or assets and for determining whether the value of the applicable securities or assets should be re-evaluated in light of such significant events when the Portfolio uses fair value pricing to determine its NAV, securities will not be priced on the basis of quotations from the primary market in which they are traded, but rather may be priced by another method that the Board of Trustees or persons acting at their direction believe accurately reflects fair value. The Trust’s policy is intended to result in a calculation of the Portfolio’s NAV that fairly reflects security values as of the time of pricing. However, fair values determined by the Board of Trustees or persons acting at their direction may not accurately reflect the price that the Portfolio could obtain for a security if it were to dispose of that security as of the time of pricing. Because foreign securities can trade on non-business days, the NAV of the Portfolio may change on days when shareholders will not be able to purchase or redeem shares. The prices used by the Portfolio may differ from the value that would be realized if the securities were sold and the differences could be material to the financial statements.
Securities Transactions and Investment Income. Securities transactions are recorded as of the trade date. Securities purchased or sold on a when-issued or delayed-delivery basis may be settled a month or more after the trade date. Realized gains and losses from securities sold are recorded on the identified cost basis. Dividend income is recorded on the ex-dividend date, except certain dividends from foreign securities where the ex-dividend date may have passed, which are recorded as soon as the Portfolio is informed of the ex-dividend date. Interest income, adjusted for the accretion of discounts and amortization of premiums, is recorded on the accrual basis. Paydown gains and losses on mortgage-related or asset-backed securities are recorded as components of interest income in the Statement of Operations.
Dividends and Distributions to Shareholders. Dividends from net investment income, if any, are declared on each day the Portfolio is open for business and are distributed to shareholders monthly. Net realized capital gains earned by the Portfolio, if any, will be distributed no less frequently than once each year. Most shareholders choose to reinvest their dividends and capital gain distribution in additional shares of the Portfolio.
Income dividends and capital gain distributions are determined in accordance with income tax regulations which may differ from GAAP. Differences between tax regulations and GAAP may change the fiscal year when income and capital items are recognized for tax and GAAP purposes. Examples of events that give rise to timing differences include wash sales, straddles, net operating losses and capital loss carryforwards. Further, the character of investment income and capital gains may be different for certain transactions under the two methods of accounting. Examples of characterization differences include the treatment of mortgage paydowns, swaps, foreign currency transactions and contingent debt instruments. As a result, income dividends and capital gain distributions declared during a fiscal period may differ significantly from the net investment income and realized capital gain reported in the Portfolio’s annual financial statements presented under GAAP.
Distributions classified as a tax basis return of capital, if any, are reflected in the accompanying Statements of Changes in Net Assets and have been reclassified to paid in capital. In addition, other amounts have been reclassified between undistributed net investment income, accumulated undistributed net realized gains or losses and/or paid in capital to more appropriately conform financial accounting to tax characterizations of dividend distributions.
| | | | | | |
| | | Semiannual Report | | June 30, 2006 | | 15 |
Notes to Financial Statements (Cont.)
Loan Participation and Assignments. The Portfolio may invest in direct debt instruments which are interests in amounts owned by corporate, governmental, or other borrowers to lenders or lending syndicates. The Portfolio’s investments in loans may be in the form of participations in loans or assignments of all or a portion of loans from third parties. A loan is often administered by a bank or other financial institution (the “lender”) that acts as agent for all holders. The agent administers the terms of the loan, as specified in the loan agreement. When investing in a loan participation, the Portfolio has the right to receive payments of principal, interest and any fees to which it is entitled only from the lender selling the loan agreement and only upon receipt by the lender of payments from the borrower. The Portfolio generally has no right to enforce compliance with the terms of the loan agreement with the borrower. As a result, the Portfolio may be subject to the credit risk of both the borrower and the lender that is selling the loan agreement. When the Portfolio purchases assignments from lenders it acquires direct rights against the borrower on the loan. At the end of the period, the Portfolio had no unfunded loan commitments.
Delayed-Delivery Transactions. The Portfolio may purchase or sell securities on a when-issued or delayed-delivery basis. These transactions involve a commitment by the Portfolio to purchase or sell securities for a predetermined price or yield, with payment and delivery taking place beyond the customary settlement period. When delayed-delivery purchases are outstanding, the Portfolio will designate liquid assets in an amount sufficient to meet the purchase price. When purchasing a security on a delayed-delivery basis, the Portfolio assumes the rights and risks of ownership of the security, including the risk of price and yield fluctuations, and takes such fluctuations into account when determining its net asset value. The Portfolio may dispose of or renegotiate a delayed-delivery transaction after it is entered into, and may sell when-issued securities before they are delivered, which may result in a capital gain or loss. When the Portfolio has sold a security on a delayed-delivery basis, the Portfolio does not participate in future gains and losses with respect to the security.
Federal Income Taxes. The Portfolio intends to qualify as a regulated investment company under sub-chapter M of the Internal Revenue Code and distribute all of its taxable income and net realized gains, if applicable, to shareholders. Accordingly, no provision for Federal income taxes has been made.
Foreign Currency. The accounting records of the Portfolio are maintained in U.S. dollar. The market values of foreign securities, currency holdings and other assets and liabilities are translated into U.S. dollar based on the current exchange rates each business day. Fluctuations in the value of currency holdings and other assets and liabilities resulting from changes in exchange rates are recorded as unrealized foreign currency gains or losses. Realized gains or losses and unrealized appreciation or depreciation on investment securities and income and expenses are translated on the respective dates of such transactions. The effects of changes in foreign currency exchange rates on investments in securities are not segregated in the Statement of Operations from the effects of changes in market prices of those securities, but are included with the net realized and unrealized gain or loss on investment securities.
| | | | | | |
|
| Non-U.S. currency symbols utilized throughout the report are defined as follows: |
| AUD | | Australian Dollar | | KRW | | South Korean Won |
| CAD | | Canadian Dollar | | MXN | | Mexican Peso |
| CLP | | Chilean Peso | | PEN | | Peruvian New Sol |
| CNY | | Chinese Yuan Renminbi | | PLN | | Polish Zloty |
| DKK | | Danish Krone | | RUB | | Russian Ruble |
| EUR | | Euro | | SEK | | Swedish Krona |
| GBP | | British Pound | | SGD | | Singapore Dollar |
| HKD | | Hong Kong Dollar | | SKK | | Slovakian Koruna |
| INR | | Indian Rupee | | TWD | | Taiwan Dollar |
| JPY | | Japanese Yen | | ZAR | | South African Rand |
Forward Currency Transactions. The Portfolio may enter into forward currency contracts in connection with settling planned purchases or sales of securities, to hedge the currency exposure associated with some or all of the Portfolio’s securities or as a part of an investment strategy. A forward currency contract is an agreement between two parties to buy and sell a currency at a set price on a future date. The market value of a forward currency contract fluctuates with changes in forward currency exchange rates. Forward currency contracts are marked to market daily and the change in value is recorded by the Portfolio as an unrealized gain or loss. Realized gains or losses equal to the difference between the value of the contract at the time it was opened and the value at the time it was closed are recorded upon delivery or receipt of the currency or, if a forward currency contract is offset by entering into another forward currency contract with the same broker, upon settlement of the net gain or loss. These contracts may involve market risk in excess of the unrealized gain or loss reflected in the Portfolio’s Statement of Assets and Liabilities. In addition, the Portfolio could be exposed to risk if the counterparties are unable to meet the terms of the contracts or if the value of the currency changes unfavorably to the U.S. dollar.
Futures Contracts. The Portfolio is authorized to enter into futures contracts. The Portfolio may use futures contracts to manage its exposure to the securities markets or to movements in interest rates and currency values. The primary risks associated with the use of futures contracts are the imperfect correlation between the change in market value of the securities held by the Portfolio and the prices of futures contracts, the possibility of an illiquid market, and the inability of the counterparty to meet the terms of the contract. Futures contracts are valued based upon their quoted daily settlement prices. Upon entering into a futures contract, the Portfolio is required to deposit with its custodian, in a segregated account in the name of the futures broker, an amount of cash or U.S. Government and Agency Obligations in accordance with the initial margin requirements of the broker or exchange. Futures contracts are marked to market daily and an appropriate payable or receivable for the change in value (“variation margin”) is recorded by the Portfolio. Gains or losses are recognized but not considered realized until the contracts expire or are closed. Futures contracts involve, to varying degrees, risk of loss in excess of the variation margin disclosed in the Statement of Assets and Liabilities.
Inflation-Indexed Bonds. The Portfolio may invest in inflation-indexed bonds. Inflation-indexed bonds are fixed-income securities whose principal value is periodically adjusted to the rate of inflation. The interest rate on these bonds is generally fixed at issuance at a rate lower than typical bonds. Over the life of an inflation-indexed bond, however, interest will be paid based on a principal value, which is adjusted for inflation. Any increase in the principal amount of an inflation-indexed bond will be included as interest income in the Statement of Operations, even though investors do not receive their principal until maturity.
Options Contracts. The Portfolio may write call and put options on futures, swaps, securities or currencies it owns or in which it may invest. Writing put options tends to increase the Portfolio’s exposure to the underlying instrument. Writing call options tends to decrease the Portfolio’s exposure to the underlying instrument. When the Portfolio writes a call or put option, an amount equal to the premium received is recorded as a liability and subsequently marked to market to reflect the current value of the option written. These liabilities are reflected as written options outstanding in the Statement of Assets and Liabilities. Certain options may be written with premiums to determined on a future date. The premiums for these options are based upon implied volatility parameters at specified terms. Premiums received from writing options which expire are treated as realized gains. Premiums received from writing options which are exercised or closed are added to the proceeds or offset against amounts paid on the underlying future, swap, security or currency transaction to determine the realized gain or loss. The Portfolio as a writer of an option has no control over whether the underlying future, swap, security or currency may be sold (call) or purchased (put) and as a result bears the market risk of an unfavorable change in the price of the future, swap, security or currency underlying the written option. There is the risk the Portfolio may not be able to enter into a closing transaction because of an illiquid market.
| | | | |
| 16 | | PIMCO Variable Insurance Trust | | |
| | |
| |
| | | June 30, 2006 (Unaudited) |
The Portfolio may also purchase put and call options. Purchasing call options tends to increase the Portfolio’s exposure to the underlying instrument. Purchasing put options tends to decrease the Portfolio’s exposure to the underlying instrument. The Portfolio pays a premium which is included in the Portfolio’s Statement of Assets and Liabilities as an investment and subsequently marked to market to reflect the current value of the option. Certain options may be purchased with premiums to be determined on a future date. The premiums for these options are based upon implied volatility parameters at specified terms. Premiums paid for purchasing options which expire are treated as realized losses. The risk associated with purchasing put and call options is limited to the premium paid. Premiums paid for purchasing options which are exercised or closed are added to the amounts paid or offset against the proceeds on the underlying future, swap, security or currency transaction to determine the realized gain or loss.
Repurchase Agreements. The Portfolio may engage in repurchase transactions. Under the terms of a typical repurchase agreement, the Portfolio takes possession of an underlying debt obligation subject to an obligation of the seller to repurchase, and the Portfolio to resell, the obligation at an agreed-upon price and time. The market value of the collateral must be equal to or exceed at all times the total amount of the repurchase obligations, including interest. Securities purchased under repurchase agreements are reflected as an asset in the Statement of Assets and Liabilities. Generally, in the event of counterparty default, the Portfolio has the right to use the collateral to offset losses incurred. If the counterparty should default, the Portfolio will seek to sell the securities which it holds as collateral. This could involve procedural costs or delays in addition to a loss on the securities if their value should fall below their repurchase price.
Mortgage-Related and Other Asset-Backed Securities. The Portfolio may invest in mortgage-related or other asset-backed securities. These securities include mortgage pass-through securities, collateralized mortgage obligations (“CMOs”), commercial mortgage-backed securities, mortgage dollar rolls, CMO residuals, stripped mortgage-backed securities (“SMBSs”) and other securities that directly or indirectly represent a participation in, or are secured by and payable from, mortgage loans on real property. The value of some mortgage- or asset-backed securities may be particularly sensitive to changes in prevailing interest rates. Early repayment of principal on some mortgage-related securities may expose a Portfolio to a lower rate of return upon reinvestment of principal. The value of these securities may fluctuate in response to the market’s perception of the creditworthiness of the issuers. Additionally, although mortgages and mortgage-related securities are generally supported by some form of government or private guarantee and/or insurance, there is no assurance that private guarantors or insurers will meet their obligations.
One type of SMBS has one class receiving all of the interest from the mortgage assets (the interest-only, or “IO” class), while the other class will receive all of the principal (the principal-only, or “PO” class). Payments received for IOs are included in interest income in the Statement of Operations. Because principal will not be received at the maturity of an IO, adjustments are made to the book value of the security on a daily basis until maturity. These adjustments are included in interest income in the Statement of Operations. Payments received for POs are treated as reductions to the cost and par value of the securities.
Swap Agreements. The Portfolio may engage in swap transactions, including, but not limited to, swap agreements on interest rate and credit default to manage its exposure to interest rates and credit risk. In connection with these agreements, securities may be identified as collateral in accordance with the terms of the respective swap agreements.
Interest rate swap agreements involve the exchange by the Portfolio with another party of their respective commitments to pay or receive interest, e.g., an exchange of floating rate payments for fixed rate payments with respect to the notional amount of principal.
Credit default swap agreements involve one party making a stream of payments to another party in exchange for the right to receive a specified return in the event of a default by a third party, typically corporate issues or sovereign issues of an emerging country, on its obligation. The Portfolio may use credit default swaps to provide a measure of protection against defaults of the issuers (i.e., to reduce risk where the Portfolio owns or has exposure to the sovereign issuer) or to take an active long or short position with respect to the likelihood of a particular issuer’s default. As a seller of protection, the Portfolio generally receives an upfront payment or a fixed rate of income throughout the term of the swap provided that there is no credit event. If the Portfolio is a seller of protection and a credit event occurs, as defined under the terms of that particular swap agreement, the Portfolio will pay to the buyer of the protection an amount up to the notional value of the swap and in certain instances take delivery of the security. As the seller, the Portfolio would effectively add leverage to its portfolio because, in addition to its total net assets, the Portfolio would be subject to investment exposure on the notional amount of the swap. As a buyer of protection, the Portfolio generally receives an amount up to the notional value of the swap if a credit event occurs. The treatment of a credit default swaps and other swap agreements that provide for contingent, non-periodic, bullet-type payments as “notional principal contracts” for federal income tax purposes is uncertain. Were the Internal Revenue Service in take the position that a credit default swap or other bullet-type swap is not a “notional principal contract” for federal income tax purposes, payments received by the Portfolio from such investments might be subject to income taxes.
Swaps are marked to market daily based upon quotations from market makers and the change in value, if any, is recorded as unrealized gain or loss in the Statement of Operations. Payments received or made at the beginning of the measurement period are reflected as such in the Statement of Assets and Liabilities. These upfront payments are recorded as realized gain or loss in the Statement of Operations upon termination or maturity of the swap. A liquidation payment received or made at the termination of the swap is recorded as realized gain or loss in the Statement of Operations. Net periodic payments received or paid by the Portfolio are included as part of realized gain or loss in the Statement of Operations. Entering into these agreements involves, to varying degrees, elements of credit, market and documentation risk in excess of the amounts recognized in the Statement of Assets and Liabilities. Such risks involve the possibility that there will be no liquid market for these agreements, that the counterparty to the agreements may default on its obligation to perform or disagree as to the meaning of contractual terms in the agreements and that there may be unfavorable changes in interest rates.
U.S. Government Agencies or Government-Sponsored Enterprises. Securities issued by U.S. Government agencies or government-sponsored enterprises may not be guaranteed by the U.S. Treasury. The Government National Mortgage Association (“GNMA”), a wholly owned U.S. Government corporation, is authorized to guarantee, with the full faith and credit of the U.S. Government, the timely payment of principal and interest on securities issued by institutions approved by GNMA and backed by pools of mortgages insured by the Federal Housing Administration or guaranteed by the Department of Veterans Affairs. Government-related guarantors (i.e., not backed by the full faith and credit of the U.S. Government) include the Federal National Mortgage Association (“FNMA” or “Fannie Mae”) and the Federal Home Loan Mortgage Corporation (“FHLMC” or “Freddie Mac”). Pass-through securities issued by FNMA are guaranteed as to timely payment of principal and interest by FNMA but are not backed by the full faith and credit of the U.S. Government. FHLMC guarantees the timely payment of interest and ultimate collection of principal, but its participation certificates are not backed by the full faith and credit of the U.S. Government.
Guarantees and Indemnifications. Under the Trust’s organizational documents, each Trustee, officer, employee or other agent of the Trust (including the Trust’s investment manager) is indemnified against certain liabilities that may
| | | | | | |
| | | Semiannual Report | | June 30, 2006 | | 17 |
Notes to Financial Statements (Cont.)
arise out of performance of their duties to the Portfolio. Additionally, in the normal course of business, the Portfolio enters into contracts that contain a variety of indemnification clauses. The Portfolio’s maximum exposure under these arrangements is unknown as this would involve future claims that may be made against the Portfolio that have not yet occurred. However, the Portfolio has not had prior claims or losses pursuant to these contracts, and believes the risk of loss to be remote.
New Accounting Policies. In July 2006, the Financial Accounting Standards Board issued Interpretation No. 48, “Accounting for Uncertainty in Income Taxes—an Interpretation of FASB Statement No. 109” (the “Interpretation”). The Interpretation is effective for fiscal years beginning after December 15, 2006. Management is currently evaluating the application of the Interpretation to the Portfolio and will provide additional information in relation to the Interpretation in the Portfolio’s annual financial statements for the year ending December 31, 2006.
3. FEES, EXPENSES, AND RELATED PARTY TRANSACTIONS
Investment Advisory Fee. PIMCO is a majority-owned subsidiary of Allianz Global Investors of America L.P. (“AGI”), and serves as investment adviser (the “Adviser”) to the Trust, pursuant to an investment advisory contract. The Adviser receives a monthly fee at an annual rate based on average daily net assets of the Portfolio. The Advisory Fee is charged at an annual rate of 0.25%.
Administration Fee. PIMCO serves as administrator (the “Administrator”), and provides administrative services to the Trust for which it receives a monthly administrative fee based on average daily net assets of the Portfolio. As the Administrator, PIMCO bears the costs of various third-party services, including audit, custodial, portfolio accounting, legal, transfer agency and printing costs. The Administration Fee is charged at the annual rate of 0.50%.
Distribution and Servicing Fees. Allianz Global Investors Distributors LLC (“AGID”) is an indirect wholly-owned subsidiary of AGI and serves as the distributor of the Trust’s shares. The Trust is permitted to reimburse AGID on a quarterly basis, out of the Administrative Class assets of the Portfolio in the amount of 0.15% on an annual basis of the average daily net assets of that class, for payments made to financial intermediaries that provide services in connection with the distribution of shares or administration of plans or programs that use Portfolio shares as their funding medium. The effective rate paid to AGID was 0.15% during the current fiscal year.
Expenses. The Trust is responsible for the following expenses: (i) salaries and other compensation of any of the Trust’s executive officers and employees who are not officers, directors, stockholders or employees of PIMCO or its subsidiaries or affiliates; (ii) taxes and governmental fees; (iii) brokerage fees and commissions and other portfolio transaction expenses; (iv) the costs of borrowing money, including interest expenses and bank overdraft charges; (v) fees and expenses of the Trustees who are not “interested persons” of PIMCO or the Trust, and any counsel retained exclusively for their benefit; (vi) extraordinary expenses, including costs of litigation and indemnification expenses; (vii) organization expenses and (viii) any expenses allocated or allocable to a specific class of shares, which include service fees payable with respect to the Administrative Class shares and may include certain other expenses as permitted by the Trust’s Multiple Class Plan adopted pursuant to Rule 18f-3 under the Act and subject to review and approval by the Trustees. The ratio of expenses to average net assets per share class, as disclosed in the Financial Highlights, may differ from the annual portfolio operating expenses per share class as disclosed in the Prospectus for the reasons set forth above.
For the current period ended June 30, 2006, each unaffiliated Trustee received an annual retainer of $15,000, plus $2,000 for each Board of Trustees quarterly meeting attended, $500 for each Board of Trustees committee meeting attended and $500 for each special board meeting attended, plus reimbursement of related expenses. In addition, each Committee Chair received an additional annual retainer of $500 and each Audit Committee Chair received an additional annual retainer of $1,500. These expenses are allocated on a pro-rata basis to each Portfolio of the Trust according to its respective net assets. The Trust pays no compensation directly to any Trustee or any other officer who is affiliated with the Administrator, all of whom receive remuneration for their services to the Trust from the Administrator or its affiliates.
4. PURCHASES AND SALES OF SECURITIES
The length of time the Portfolio has held a particular security is not generally a consideration in investment decisions. A change in the securities held by the Portfolio is known as “portfolio turnover”. The Portfolio may engage in frequent and active trading of portfolio securities to achieve its investment objective, particularly during periods of volatile market movements. High portfolio turnover (e.g., over 100%) involves correspondingly greater expenses to the Portfolio, including brokerage commissions or dealer mark-ups and other transaction costs on the sale of securities and reinvestments in other securities. Such sales may also result in realization of taxable capital gains, including short-term capital gains (which are generally taxed at ordinary income tax rates). The trading costs and tax effects associated with portfolio turnover may adversely affect the Portfolio’s performance.
Purchases and sales of securities (excluding short-term investments) for the period ended June 30, 2006 were as follows (amounts in thousands):
| | | | | | | | | | | | | | | | |
| | U.S Government/Agency | | | | | All Other |
| | Purchases | | | | | Sales | | | | | Purchases | | | | | Sales |
| $ | 102,156 | | | | $ | 114,497 | | | | $ | 74,761 | | | | $ | 31,310 |
5. TRANSACTIONS IN WRITTEN CALL AND PUT OPTIONS
Transactions in written call and put options were as follows (amounts in thousands, except number of contracts):
| | | | | | | | | | | | | | | | | |
| | | | | # of
Contracts |
| | | |
| Notional
Amount
in $ |
| | | | | Premium | |
Balance at 12/31/2005 | | | | 124 | | | | | $ | 11,000 | | | | | $ | 112 | |
Sales | | | | 174 | | | | | | 71,200 | | | | | | 684 | |
Closing Buys | | | | 0 | | | | | | (9,900 | ) | | | | | (84 | ) |
Expirations | | | | (220 | ) | | | | | (1,500 | ) | | | | | (64 | ) |
Exercised | | | | 0 | | | | | | 0 | | | | | | 0 | |
Balance at 06/30/2006 | | | | 78 | | | | | $ | $70,800 | | | | | $ | 648 | |
6. SHARES OF BENEFICIAL INTEREST
The Portfolio may issue an unlimited number of shares of beneficial interest with a $0.001 par value. Changes in shares of beneficial interest were as follows (shares and amounts in thousands):
| | | | | | | | | | | | | | | | | | |
| | | | | Six Months Ended
06/30/2006 | | | | | Year Ended
12/31/2005 | |
| | | | | Shares | | | Amount | | | | | Shares | | | Amount | |
| | | | | | |
Receipts for shares sold | | | | | | | | | | | | | | | | | | |
Institutional Class | | | | 1 | | | $ | 10 | | | | | 0 | | | $ | 0 | |
Administrative Class | | | | 4,637 | | | | 55,471 | | | | | 5,093 | | | | 63,454 | |
Issued as reinvestment of distributions | | | | | | | | | | | | | | | | | | |
Institutional Class | | | | 0 | | | | 0 | | | | | 0 | | | | 0 | |
Administrative Class | | | | 157 | | | | 1,881 | | | | | 235 | | | | 2,873 | |
Cost of shares redeemed | | | | | | | | | | | | | | | | | | |
Institutional Class | | | | 0 | | | | 0 | | | | | 0 | | | | 0 | |
Administrative Class | | | | (1,210 | ) | | | (14,460 | ) | | | | (561 | ) | | | (7,033 | ) |
Net increase resulting from
Portfolio share transactions | | | | 3,585 | | | $ | 42,902 | | | | | 4,767 | | | $ | 59,294 | |
| | | | |
| 18 | | PIMCO Variable Insurance Trust | | |
| | |
| |
| | | June 30, 2006 (Unaudited) |
The following schedule shows the number of shareholders each owning 5% or more of the Portfolio and the total percentage of the Portfolio held by such shareholders:
| | | | | | | |
| | | | | Number of
Shareholders | | % of Portfolio Held | |
Institutional Class | | | | 1 | | 100 | |
Administrative Class | | | | 6 | | 95 | * |
* One of the shareholders, Allianz Life Insurance Co. of North America, is an indirect wholly owned subsidiary of AGI and a related party to the Portfolio.
7. FEDERAL INCOME TAX MATTERS
As of June 30, 2006, the aggregate cost of investments was the same for federal income tax and financial statement purposes. The net unrealized appreciation (depreciation) of investment securities for federal income tax purposes is as follows (amounts in thousands):
| | | | |
Aggregate
Gross
Unrealized
Appreciation | | Aggregate
Gross
Unrealized
(Depreciation) | | Net
Unrealized
(Depreciation) |
$ 1,160 | | $ (1,846) | | $ (686) |
8. REGULATORY AND LITIGATION MATTERS
On June 1, 2004, the Attorney General of the State of New Jersey announced that it had dismissed PIMCO from a complaint filed by the New Jersey Attorney General on February 17, 2004, and that it had entered into a settlement agreement (the “New Jersey Settlement”) with Allianz Global Investors of America L.P. (“AGI”) (formerly known as Allianz Dresdner Asset Management of America L.P.), PEA Capital LLC (an entity affiliated with PIMCO through common ownership) (“PEA”) and Allianz Global Investors Distributors LLC (“AGID”), in connection with the same matter. In the New Jersey Settlement, AGI, PEA and AGID neither admitted nor denied the allegations or conclusions of law, but did agree to pay New Jersey a civil fine of $15 million and $3 million for investigative costs and further potential enforcement initiatives against unrelated parties. They also undertook to implement certain governance changes. The complaint relating to the New Jersey Settlement alleged, among other things, that AGI, PEA and AGID had failed to disclose that they improperly allowed certain hedge funds to engage in “market timing” in certain funds. The complaint sought injunctive relief, civil monetary penalties, restitution and disgorgement of profits.
Since February 2004, PIMCO, AGI, PEA, AGID, and certain of their affiliates, including the PIMCO Funds, the Allianz Funds (formerly known as PIMCO Funds: Multi-Manager Series), and the Trustees and employees of the PIMCO Funds, have been named as defendants in fifteen lawsuits filed in various jurisdictions. Eleven of those lawsuits concern “market timing,” and they have been transferred to and consolidated for pre-trial proceedings in a multi-district litigation proceeding in the U.S. District Court for the District of Maryland; the other four lawsuits concern “revenue sharing” and have been consolidated into a single action in the U.S. District Court for the District of Connecticut. The lawsuits have been commenced as putative class actions on behalf of investors who purchased, held or redeemed shares of the various series of the PIMCO Funds and the Allianz Funds during specified periods, or as derivative actions on behalf of the PIMCO Funds and Allianz Funds.
The market timing actions in the District of Maryland generally allege that certain hedge funds were allowed to engage in “market timing” in certain of and the PIMCO Funds the Allianz Funds and this alleged activity was not disclosed. Pursuant to tolling agreements entered into with the derivative and class action plaintiffs, PIMCO, the Trustees, and certain employees of PIMCO who were previously named as defendants have all been dropped as defendants in the market timing actions; the plaintiffs continue to assert claims on behalf of the shareholders of the PIMCO Funds or on behalf of the PIMCO Funds themselves against other defendants. By order dated November 3, 2005, the U.S. District Court for the District of Maryland granted the PIMCO Funds’ motion to dismiss claims asserted against it in a consolidated amended complaint where the PIMCO Funds were named, in the complaint, as a nominal defendant. The revenue sharing action in the District of Connecticut generally alleges that fund assets were inappropriately used to pay brokers to promote the PIMCO Funds and Allianz Funds including directing fund brokerage transactions to such brokers, and that such alleged arrangements were not fully disclosed to shareholders. On August 11, 2005 the U.S. District Court for the District of Connecticut conducted a hearing on defendants’ motion to dismiss the consolidated amended complaint in the revenue sharing action but has not yet ruled on the motion to dismiss. The market timing and revenue sharing lawsuits seek, among other things, unspecified compensatory damages plus interest and, in some cases, punitive damages, the rescission of investment advisory contracts, the return of fees paid under those contracts and restitution.
Under Section 9(a) of the Investment Company Act of 1940, as amended (“1940 Act”), if the New Jersey Settlement or any of the lawsuits described above were to result in a court injunction against AGI, PEA, AGID and/or their affiliates, PIMCO could, in the absence of exemptive relief granted by the SEC, be barred from serving as an investment adviser, and AGID could be barred from serving as principal underwriter, to any registered investment company, including the Portfolios of the Trust. In connection with an inquiry from the SEC concerning the status of the New Jersey Settlement under Section 9(a), PEA, AGID, AGI and certain of their affiliates (including PIMCO) (together, the “Applicants”) have sought exemptive relief from the SEC under Section 9(c) of the 1940 Act. The SEC has granted the Applicants a temporary exemption from the provisions of Section 9(a) with respect to the New Jersey Settlement until the earlier of (i) September 13, 2006 and (ii) the date on which the SEC takes final action on their application for a permanent order. There is no assurance that the SEC will issue a permanent order.
Two nearly identical class action civil complaints have been filed in August 2005, in the Northern District of Illinois Eastern Division alleging that the plaintiffs each purchased and sold a 10-year Treasury note futures contract and suffered damages from an alleged shortage when PIMCO held both physical and futures positions in 10-year Treasury notes for its client accounts. The two actions have been consolidated into one action, and the two separate complaints have been replaced by a consolidated complaint. PIMCO is a named defendant, and the PIMCO Funds have been added as a defendant, to the consolidated action. PIMCO strongly believes the complaint (and any consolidated complaint filed hereafter) is without merit and intends to vigorously defend itself.
Certain Portfolios of the Trust were recently served in an adversary proceeding brought by the Official Committee of Asbestos Claimants of G-I Holdings, Inc. in G-I Holdings, Inc.’s bankruptcy in the District of New Jersey. PIMCO was previously named in this lawsuit and remains a defendant. The plaintiff seeks to recover for the bankruptcy estate assets that were transferred by the predecessor entity of G-I Holdings, Inc. to a wholly-owned subsidiary in 1994. The subsidiary has since issued notes, of which certain Portfolios of the Trust are alleged to be holders. The complaint alleges that in 2000, more than two hundred noteholders—including certain Portfolios of the Trust—were granted a second priority lien on the assets of the subsidiary in exchange for their consent to a refinancing transaction and the granting of a first priority lien to the lending banks. The plaintiff is seeking invalidation of the lien in favor of the noteholders and/or the value of the lien.
It is possible that these matters and/or other developments resulting from these matters could result in increased fund redemptions or other adverse consequences to the Portfolios. However, PIMCO and AGID believe that these matters are not likely to have a material adverse effect on the Portfolios or on PIMCO’s or AGID’s ability to perform their respective investment advisory or distribution services relating to the Portfolios.
| | | | | | |
| | | Semiannual Report | | June 30, 2006 | | 19 |
Investment Adviser and Administrator
Pacific Investment Management Company LLC
840 Newport Center Drive
Newport Beach, California 92660
Distributor
Allianz Global Investors Distributors LLC
2187 Atlantic Street
Stamford, Connecticut 06902
Custodian
State Street Bank & Trust Company
801 Pennsylvania
Kansas City, Missouri 64105
Transfer Agent
Boston Financial Data Services–Midwest
330 W. 9th Street
Kansas City, Missouri 64105
Legal Counsel
Dechert LLP
1775 I Street, N.W.
Washington, D.C. 20006
Independent Registered Public Accounting Firm
PricewaterhouseCoopers LLP
1055 Broadway
Kansas City, Missouri 64105
P I M C O

Share Class Administrative
Semiannual Report June 30, 2006
PIMCO Variable Insurance Trust
High Yield Portfolio
Table of Contents
This material is authorized for use only when preceded or accompanied by the current PIMCO Variable Insurance Trust (the “Trust”) prospectus. Investors should consider the investment objectives, risks, charges and expenses of this Trust carefully before investing. Ask your financial professional to explain all charges that may apply. This and other information is contained in the Trust’s prospectus. The variable product prospectus may be obtained by contacting your Investment Consultant. Please read the Trust and variable product prospectus carefully before you invest or send money.
Chairman’s Letter
Dear PIMCO Variable Insurance Trust Shareholder:
It is our pleasure to present to you the semiannual report for the PIMCO Variable Insurance Trust covering the six-month period ended June 30, 2006.
Highlights of the global bond markets during the six-month period included:
| | n | | Most fixed-income sectors lost ground during the first half of 2006, as concern about accelerating inflation and central bank tightening pushed interest rates higher worldwide. The benchmark Lehman Brothers Aggregate Bond Index (which includes Treasury, Investment-Grade Corporate, and Residential Mortgage-Backed Securities) returned -0.72% for the first six months of the year. On June 30, the benchmark ten-year Treasury yielded 5.14%, 0.75% higher than at the start of the year. The U.S. yield curve remained flat as shorter-maturity yields rose by a comparable amount. |
| | n | | The Federal Reserve tightened four times during the reporting period, bringing the Federal Funds Rate to 5.25%. The increase near the end of the period was the Federal Reserve’s 17th consecutive rate hike since the start of its tightening cycle in 2004. The Federal Reserve was not alone, as central banks in Europe, India, and China tightened credit in unison for the first time since 2000. The Bank of Japan, whose zero-interest-rate policy has flooded global markets with liquidity, looked set to reverse this policy in the coming months. |
In these pages please find a more complete Portfolio review as it relates to financial-market activities, as well as details about total-return investment performance for the six-month reporting period. Thank you for the trust you have placed in us. We will continue to work diligently to meet your investment needs.
Sincerely,
Brent R. Harris
Chairman, PIMCO Variable Insurance Trust
July 31, 2006
| | | | | | |
| | | Semiannual Report | | June 30, 2006 | | 1 |
Important Information About the Portfolio
PIMCO Variable Insurance Trust (the “Trust”) is an open-end management investment company currently consisting of nineteen separate investment portfolios, including the High Yield Portfolio (the “Portfolio”). The Portfolio is only available as a funding vehicle under variable life insurance policies or variable annuity contracts issued by insurance companies (“Variable Contracts”). Individuals may not purchase shares of the Portfolio directly. Shares of the Portfolio also may be sold to qualified pension and retirement plans outside of the separate account context.
We believe that bond funds have an important role to play in a well diversified investment portfolio. It is important to note, however, that in an environment where interest rates may trend upward, rising rates would negatively impact the performance of most bond funds, and fixed-income securities held by a fund are likely to decrease in value. The price volatility of fixed-income securities can also increase during periods of rising interest rates resulting in increased losses to a fund. Bond funds and individual bonds with a longer duration (a measure of the expected life of a security) tend to be more sensitive to changes in interest rates, usually making them more volatile than securities or funds with shorter durations. The longer-term performance of most bond funds has benefited from capital gains in part resulting from an extended period of declining interest rates. In the event interest rates increase, these capital gains should not be expected to recur.
The Portfolio may be subject to various risks in addition to those described above. Some of these risks may include, but are not limited to, the following: credit risk, high yield risk, market risk, issuer risk, liquidity risk, derivatives risk, mortgage risk, non-U.S. investment risk, currency risk, leveraging risk and management risk. A complete description of these risks is contained in the Portfolio’s prospectus. The Portfolio may use derivative instruments for hedging purposes or as part of an investment strategy. Use of these instruments may involve certain costs and risks such as liquidity risk, interest rate risk, market risk, credit risk, management risk and the risk that the Portfolio could not close out a position when it would be most advantageous to do so. A Portfolio investing in derivatives could lose more than the principal amount invested in these instruments. Investing in non-U.S. securities may entail risk due to non-U.S. economic and political developments; this risk may be increased when investing in emerging markets.
On the performance summary page in this Semiannual Report, the Total Return Investment Performance table measures performance assuming that all dividend and capital gain distributions were reinvested.
An investment in the Portfolio is not a deposit of a bank and is not guaranteed or insured by the Federal Deposit Insurance Corporation or any other government agency. It is possible to lose money on investments in the Portfolio.
PIMCO has adopted written proxy voting policies and procedures (“Proxy Policy”) as required by Rule 206(4)-6 under the Investment Advisers Act of 1940. The Proxy Policy has been adopted by the Trust as the policies and procedures that PIMCO will use when voting proxies on behalf of the Portfolio. Copies of the written Proxy Policy and the factors that PIMCO may consider in determining how to vote proxies for the Portfolio, and information about how the Portfolio voted proxies relating to portfolio securities held during the most recent twelve-month period ended June 30, are available without charge, upon request, by calling the Trust at 1-866-746-2606 and on the Securities and Exchange Commission’s (“SEC”) website at http://www.sec.gov.
The Portfolio files its complete schedule of portfolio holdings with the SEC for the first and third quarters of each fiscal year on Form N-Q. A copy of the Trust’s Form N-Q is available on the SEC’s website at http://www.sec.gov and may be reviewed and copied at the SEC’s Public Reference Room in Washington D.C. Information on the operation of the Public Reference Room may be obtained by calling 1-800-SEC-0330.
PIMCO Variable Insurance Trust is distributed by Allianz Global Investors Distributors LLC, 2187 Atlantic Street, Stamford, CT 06902.
| | | | |
| 2 | | PIMCO Variable Insurance Trust | | |
The following disclosure provides important information regarding the Portfolio’s Expense Example (“Example” or “Expense Example”), which appears in this Semiannual Report. Please refer to this information when reviewing the Expense Example for the Portfolio.
Example
As a shareholder of the Portfolio, you incur two types of costs: (1) transaction costs and (2) ongoing costs, including advisory and administrative fees; distribution and/or service (12b-1) fees (Administrative Class only); and other Portfolio expenses. The Example is intended to help you understand your ongoing costs (in dollars) of investing in the Portfolio and to compare these costs with the ongoing costs of investing in other mutual funds. The Expense Example does not reflect any fees or other expenses imposed by the Variable Contracts. If it did, the expenses reflected in the Expense Examples would be higher. The Example is based on an investment of $1,000 invested at the beginning of the period and held for the entire period indicated, which is from January 1, 2006 to June 30, 2006.
Actual Expenses
The information in the table under the heading “Actual Performance” provides information about actual account values and actual expenses. You may use the information in these columns, together with the amount you invested, to estimate the expenses that you paid over the period. Simply divide your account value by $1,000 (for example, an $8,600 account value divided by $1,000 = 8.60), then multiply the result by the number in the appropriate column for your share class, in the row titled “Expenses Paid During Period” to estimate the expenses you paid on your account during this period.
Hypothetical Example for Comparison Purposes
The information in the table under the heading “Hypothetical Performance (5% return before expenses)” provides information about hypothetical account values and hypothetical expenses based on the Portfolio’s actual expense ratio and an assumed rate of return of 5% per year before expenses, which is not the Portfolio’s actual return. The hypothetical account values and expenses may not be used to estimate the actual ending account balance or expenses you paid for the period. You may use this information to compare the ongoing costs of investing in the Portfolio and other portfolios. To do so, compare this 5% hypothetical example with the 5% hypothetical examples that appear in the shareholder reports of the other portfolios.
Please note that the expenses shown in the table are meant to highlight your ongoing costs only and do not reflect any transactional costs. Therefore, the information under the heading “Hypothetical Performance (5% return before expenses)” is useful in comparing ongoing costs only, and will not help you determine the relative total costs of owning different portfolios. In addition, if these transactional costs were included, your costs would have been higher.
The expense ratio may vary period to period because of various factors, such as an increase in expenses not covered by the advisory and administrative fees (such as expenses of the trustees and their counsel or litigation expense).
Portfolio Benchmark
Merrill Lynch US High Yield, BB-B Rated Constrained Index tracks the performance of BB-B Rated US Dollar-denominated corporate bonds publicly issued in the US domestic market. Qualifying bonds are capitalization-weighted provided the total allocation to an individual issuer (defined by Bloomberg tickers) does not exceed 2%. Issuers that exceed the limit are reduced to 2% and the face value of each of their bonds is adjusted on a pro-rata basis.
| | | | | | |
| | | Semiannual Report | | June 30, 2006 | | 3 |
| | | | |
| | |
| PIMCO High Yield Portfolio | | | | |
| | | | |
Cumulative Returns Through June 30, 2006
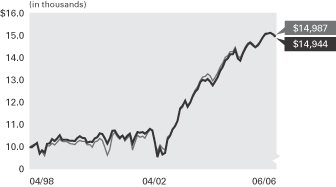
High Yield Merrill Lynch US
Portfolio High Yield, BB-B
Administrative Rated, Constrained
Class Index
-------------- -------------------
04/30/1998 $10,000 $10,000
05/31/1998 10,004 10,075
06/30/1998 10,101 10,131
07/31/1998 10,195 10,193
08/31/1998 9,722 9,739
09/30/1998 9,858 9,803
10/31/1998 9,760 9,612
11/30/1998 10,152 10,063
12/31/1998 10,180 10,060
01/31/1999 10,357 10,171
02/28/1999 10,279 10,103
03/31/1999 10,383 10,216
04/30/1999 10,539 10,365
05/31/1999 10,335 10,262
06/30/1999 10,331 10,240
07/31/1999 10,338 10,253
08/31/1999 10,288 10,163
09/30/1999 10,292 10,150
10/31/1999 10,277 10,111
11/30/1999 10,403 10,231
12/31/1999 10,486 10,309
01/31/2000 10,419 10,260
02/29/2000 10,401 10,264
03/31/2000 10,205 10,104
04/30/2000 10,253 10,114
05/31/2000 10,226 10,006
06/30/2000 10,393 10,225
07/31/2000 10,443 10,276
08/31/2000 10,619 10,393
09/30/2000 10,589 10,300
10/31/2000 10,397 9,998
11/30/2000 10,162 9,645
12/31/2000 10,396 9,906
01/31/2001 10,726 10,525
02/28/2001 10,742 10,655
03/31/2001 10,540 10,462
04/30/2001 10,417 10,354
05/31/2001 10,516 10,514
06/30/2001 10,354 10,269
07/31/2001 10,514 10,420
08/31/2001 10,607 10,511
09/30/2001 10,155 9,878
10/31/2001 10,450 10,196
11/30/2001 10,678 10,529
12/31/2001 10,640 10,444
01/31/2002 10,682 10,496
02/28/2002 10,603 10,405
03/31/2002 10,701 10,633
04/30/2002 10,814 10,777
05/31/2002 10,751 10,760
06/30/2002 10,185 10,179
07/31/2002 9,566 9,818
08/31/2002 9,966 10,097
09/30/2002 9,673 9,963
10/31/2002 9,744 9,871
11/30/2002 10,351 10,445
12/31/2002 10,513 10,559
01/31/2003 10,788 10,791
02/28/2003 10,945 10,917
03/31/2003 11,176 11,162
04/30/2003 11,740 11,697
05/31/2003 11,846 11,776
06/30/2003 12,076 12,076
07/31/2003 11,811 11,885
08/31/2003 11,994 12,017
09/30/2003 12,263 12,320
10/31/2003 12,478 12,544
11/30/2003 12,589 12,703
12/31/2003 12,916 12,975
01/31/2004 13,016 13,143
02/29/2004 12,970 13,171
03/31/2004 13,046 13,288
04/30/2004 12,928 13,176
05/31/2004 12,767 12,964
06/30/2004 12,932 13,129
07/31/2004 13,137 13,336
08/31/2004 13,409 13,583
09/30/2004 13,596 13,767
10/31/2004 13,868 14,009
11/30/2004 13,971 14,095
12/31/2004 14,148 14,263
01/31/2005 14,150 14,274
02/28/2005 14,355 14,468
03/31/2005 13,974 14,081
04/30/2005 13,862 14,003
05/31/2005 14,198 14,258
06/30/2005 14,417 14,483
07/31/2005 14,601 14,654
08/31/2005 14,665 14,718
09/30/2005 14,556 14,606
10/31/2005 14,476 14,490
11/30/2005 14,561 14,608
12/31/2005 14,730 14,747
01/31/2006 14,921 14,907
02/28/2006 15,070 15,031
03/31/2006 15,087 15,070
04/30/2006 15,117 15,118
05/31/2006 15,036 15,076
06/30/2006 14,944 14,987
$10,000 invested at the beginning of the first full month following the inception date of the Portfolio’s Administrative Class.
Sector Breakdown‡
| | |
Corporate Bonds & Notes | | 82.3% |
Short-Term Instruments | | 7.4% |
Bank Loan Obligations | | 4.6% |
Foreign Currency-Denominated Issues | | 3.7% |
Other | | 2.0% |
| | ‡ | % of Total Investments as of June 30, 2006 |
| | | | | | | | | | | | |
| Average Annual Total Return for the period ended June 30, 2006 | | |
| | | | | | | 6 Months* | | 1 Year | | 5 Years | | Since
Inception
(04/30/98) |
| | |
| | PIMCO High Yield Portfolio Administrative Class | | 1.45% | | 3.65% | | 7.61% | | 5.04% |
| | |
| | Merrill Lynch US High Yield, BB-B Rated,
Constrained Index | | 1.62% | | 3.48% | | 7.86% | | 5.08% |
All Portfolio returns are net of fees and expenses.
* Cumulative return.
Past performance is no guarantee of future results. The performance quoted represents past performance. Investment return and principal value will fluctuate so the Portfolio shares, when redeemed, may be worth more or less than their original cost. The Portfolio’s performance does not reflect the deduction of additional charges and expenses imposed in connection with investing in Variable Contracts, which will reduce returns. Current performance may be lower or higher than the performance data quoted. Performance data current to the most recent month-end is available by calling (800) 927-4648.
| | | | | | | | | | |
| Expense Example | | | | Actual Performance | | | | Hypothetical Performance |
| | | | | | | | | (5% return before expenses) |
Beginning Account Value (01/01/06) | | | | $ | 1,000.00 | | | | $ | 1,000.00 |
Ending Account Value (06/30/06) | | | | $ | 1,014.50 | | | | $ | 1,021.08 |
Expenses Paid During Period† | | | | $ | 3.75 | | | | $ | 3.76 |
† Expenses are equal to the Portfolio’s Administrative Class annualized expense ratio of 0.75%, multiplied by the average account value over the period, multiplied by 181/365 (to reflect the one-half year period). Overall fees and expenses of investing in the Portfolio will be higher because the example does not reflect Variable Contract fees and expenses.
Please refer to page 3 herein for a description of the Portfolio’s benchmark and an explanation of the information presented in the above Expense Example.
Portfolio Insights
| » | | The PIMCO High Yield Portfolio seeks to achieve its investment objective by investing under normal circumstances at least 80% of its assets in a diversified portfolio of high-yield securities rated below investment grade but rated at least Caa (subject to a maximum of 5% of total assets in securities rated Caa) by Moody’s or S&P, or, if unrated, determined by PIMCO to be of comparable quality. |
| » | | An underweight to BB-rated bonds versus the index contributed to relative performance, as these issues underperformed B-rated bonds by about 1.50%. |
| » | | An overweight to the automotive sector helped performance as these bonds significantly outperformed the high-yield market. |
| » | | As cable/pay TV bonds outperformed the high- yield market, an overweight to the sector benefited the Portfolio. |
| » | | Security selection in the utility sector was positive as electric generation companies led the overall sector. |
| » | | As telecom bonds underperformed the market, an overweight to the sector negatively impacted the Portfolio’s performance. |
| » | | As the energy sector was among the worst performing broad market sectors in the first half of the year, an overweight to this industry category detracted from returns. |
| » | | Modest exposure to emerging market sovereign bonds, which underperformed high yield by about 3.75%, hurt performance. |
| | | | |
| 4 | | PIMCO Variable Insurance Trust | | |
| | |
| |
| Financial Highlights High Yield Portfolio | | |
| | | | | | | | | | | | | | | | | | | | | | | | |
| Selected Per Share Data for the Year or Period Ended: | | 06/30/2006+ | | | 12/31/2005 | | | 12/31/2004 | | | 12/31/2003 | | | 12/31/2002 | | | 12/31/2001 | |
| | | | | | |
Administrative Class | | | | | | | | | | | | | | | | | | | | | | | | |
| Net asset value beginning of period | | $ | 8.19 | | | $ | 8.40 | | | $ | 8.19 | | | $ | 7.17 | | | $ | 7.88 | | | $ | 8.33 | |
| Net investment income (a) | | | 0.29 | | | | 0.54 | | | | 0.53 | | | | 0.55 | | | | 0.59 | | | | 0.64 | |
| Net realized/unrealized gain (loss) on investments (a) | | | (0.17 | ) | | | (0.21 | ) | | | 0.22 | | | | 1.04 | | | | (0.70 | ) | | | (0.45 | ) |
| Total income (loss) from investment operations | | | 0.12 | | | | 0.33 | | | | 0.75 | | | | 1.59 | | | | (0.11 | ) | | | 0.19 | |
| Dividends from net investment income | | | (0.29 | ) | | | (0.54 | ) | | | (0.54 | ) | | | (0.57 | ) | | | (0.60 | ) | | | (0.64 | ) |
| Total distributions | | | (0.29 | ) | | | (0.54 | ) | | | (0.54 | ) | | | (0.57 | ) | | | (0.60 | ) | | | (0.64 | ) |
| Net asset value end of period | | $ | 8.02 | | | $ | 8.19 | | | $ | 8.40 | | | $ | 8.19 | | | $ | 7.17 | | | $ | 7.88 | |
| Total return | | | 1.45 | % | | | 4.11 | % | | | 9.54 | % | | | 22.85 | % | | | (1.19 | )% | | | 2.35 | % |
| Net assets end of period (000s) | | $ | 449,653 | | | $ | 460,926 | | | $ | 414,062 | | | $ | 955,599 | | | $ | 481,473 | | | $ | 264,718 | |
| Ratio of expenses to average net assets | | | 0.75 | %* | | | 0.75 | % | | | 0.75 | % | | | 0.75 | % | | | 0.75 | %(b) | | | 0.75 | %(b) |
| Ratio of net investment income to average net assets | | | 7.03 | %* | | | 6.50 | % | | | 6.48 | % | | | 7.14 | % | | | 8.14 | % | | | 7.88 | % |
| Portfolio turnover rate | | | 45 | % | | | 109 | % | | | 97 | % | | | 97 | % | | | 102 | % | | | 129 | % |
+ Unaudited
* Annualized
(a) Per share amounts based on average number of shares outstanding during the period.
(b) If the investment manager had not reimbursed expenses, the ratio of expenses to average net assets would have been 0.76%.
| | | | | | |
| See Accompanying Notes | | Semiannual Report | | June 30, 2006 | | 5 |
| | |
| |
| Statement of Assets and Liabilities High Yield Portfolio | | |
| | | | |
| (Amounts in thousands, except per share amounts) | | June 30, 2006
(Unaudited) | |
| |
Assets: | | | | |
Investments, at value | | $ | 454,275 | |
Cash | | | 1,169 | |
Foreign currency, at value | | | 1,682 | |
Receivable for investments sold | | | 1,449 | |
Receivable for investments sold on delayed-delivery basis | | | 75 | |
Receivable for Portfolio shares sold | | | 5,977 | |
Interest and dividends receivable | | | 8,878 | |
Variation margin receivable | | | 53 | |
Unrealized appreciation on forward foreign currency contracts | | | 1 | |
Unrealized appreciation on swap agreements | | | 171 | |
| | | | 473,730 | |
| |
Liabilities: | | | | |
Payable for investments purchased | | $ | 4,316 | |
Payable for investments purchased on delayed-delivery basis | | | 17,885 | |
Payable for Portfolio shares redeemed | | | 118 | |
Written options outstanding | | | 73 | |
Accrued investment advisory fee | | | 100 | |
Accrued administration fee | | | 140 | |
Accrued servicing fee | | | 50 | |
Swap premiums received | | | 11 | |
Unrealized depreciation on forward foreign currency contracts | | | 288 | |
Unrealized depreciation on swap agreements | | | 44 | |
| | | | 23,025 | |
| |
Net Assets | | $ | 450,705 | |
| |
Net Assets Consist of: | | | | |
Paid in capital | | $ | 463,809 | |
(Overdistributed) net investment income | | | (507 | ) |
Accumulated undistributed net realized (loss) | | | (5,172 | ) |
Net unrealized (depreciation) | | | (7,425 | ) |
| | | $ | 450,705 | |
| |
Net Assets: | | | | |
Institutional Class | | $ | 1,042 | |
Administrative Class | | | 449,653 | |
Advisor Class | | | 10 | |
| |
Shares Issued and Outstanding: | | | | |
Institutional Class | | | 130 | |
Administrative Class | | | 56,036 | |
Advisor Class | | | 1 | |
| |
Net Asset Value and Redemption Price Per Share (Net Assets Per Share Outstanding) | | | | |
Institutional Class | | $ | 8.02 | |
Administrative Class | | | 8.02 | |
Advisor Class | | | 8.02 | |
| |
Cost of Investments Owned | | $ | 459,918 | |
Cost of Foreign Currency Held | | $ | 1,658 | |
Premiums Received on Written Options | | $ | 283 | |
| | | | |
| 6 | | PIMCO Variable Insurance Trust | | See Accompanying Notes |
| | |
| |
| Statement of Operations High Yield Portfolio | | |
| | | | |
| (Amounts in Thousands) | | Six Months Ended
June 30, 2006
(Unaudited) | |
| |
Investment Income: | | | | |
Interest, net of foreign taxes | | $ | 17,337 | |
Dividends | | | 92 | |
Miscellaneous income | | | 595 | |
Total Income | | | 18,024 | |
| |
Expenses: | | | | |
Investment advisory fees | | | 579 | |
Administration fees | | | 811 | |
Servicing fees – Administrative Class | | | 347 | |
Trustees’ fees | | | 3 | |
Interest expense | | | 3 | |
Total Expenses | | | 1,743 | |
| |
Net Investment Income | | | 16,281 | |
| |
Net Realized and Unrealized Gain (Loss): | | | | |
Net realized gain on investments | | | 1,981 | |
Net realized gain on futures contracts, options and swaps | | | 350 | |
Net realized (loss) on foreign currency transactions | | | (199 | ) |
Net change in unrealized (depreciation) on investments | | | (10,574 | ) |
Net change in unrealized (depreciation) on futures contracts, options and swaps | | | (769 | ) |
Net change in unrealized (depreciation) on translation of assets and liabilities denominated in foreign currencies | | | (282 | ) |
Net (Loss) | | | (9,493 | ) |
| |
Net Increase in Net Assets Resulting from Operations | | $ | 6,788 | |
| | | | | | |
| See Accompanying Notes | | Semiannual Report | | June 30, 2006 | | 7 |
| | |
| |
| Statements of Changes in Net Assets High Yield Portfolio | | |
| | | | | | | | |
| (Amounts in Thousands) | | Six Months Ended June 30, 2006 (Unaudited) | | | Year Ended December 31, 2005 | |
| | |
Increase (Decrease) in Net Assets from: | | | | | | | | |
| | |
Operations: | | | | | | | | |
Net investment income | | $ | 16,281 | | | $ | 27,561 | |
Net realized gain | | | 2,132 | | | | 4,638 | |
Net change in unrealized (depreciation) | | | (11,625 | ) | | | (14,899 | ) |
Net increase resulting from operations | | | 6,788 | | | | 17,300 | |
| | |
Distributions to Shareholders: | | | | | | | | |
| From net investment income | | | | | | | | |
Institutional Class | | | (29 | ) | | | (37 | ) |
Administrative Class | | | (16,515 | ) | | | (27,841 | ) |
Advisor Class | | | 0 | | | | 0 | |
| | |
Total Distributions | | | (16,544 | ) | | | (27,878 | ) |
| | |
Portfolio Share Transactions: | | | | | | | | |
| Receipts for shares sold | | | | | | | | |
Institutional Class | | | 360 | | | | 336 | |
Administrative Class | | | 62,810 | | | | 167,640 | |
Advisor Class | | | 10 | | | | 0 | |
| Issued as reinvestment of distributions | | | | | | | | |
Institutional Class | | | 29 | | | | 37 | |
Administrative Class | | | 16,529 | | | | 27,827 | |
Advisor Class | | | 0 | | | | 0 | |
| Cost of shares redeemed | | | | | | | | |
Institutional Class | | | (12 | ) | | | (25 | ) |
Administrative Class | | | (80,878 | ) | | | (138,029 | ) |
Advisor Class | | | 0 | | | | 0 | |
Net increase (decrease) resulting from Portfolio share transactions | | | (1,152 | ) | | | 57,786 | |
| | |
Total Increase (Decrease) in Net Assets | | | (10,908 | ) | | | 47,208 | |
| | |
Net Assets: | | | | | | | | |
Beginning of period | | | 461,613 | | | | 414,405 | |
End of period* | | $ | 450,705 | | | $ | 461,613 | |
| | |
*Including (overdistributed) net investment income of: | | $ | (507 | ) | | $ | (244 | ) |
| | | | |
| 8 | | PIMCO Variable Insurance Trust | | See Accompanying Notes |
| | |
| |
| Schedule of Investments High Yield Portfolio | | June 30, 2006 (Unaudited) |
| | | | |
| | | PRINCIPAL | | |
| | | AMOUNT | | VALUE |
| | | (000S) | | (000S) |
| | | | | |
| | | | | | | | |
| BANK LOAN OBLIGATIONS 4.7% |
| Amadeus Global Travel Distribution S.A. | | |
7.856% due 04/08/2013 | | $ | | 700 | | $ | | 708 |
8.356% due 04/08/2014 | | | | 700 | | | | 711 |
|
| Cablevision Systems Corp. | | | | | | | | |
6.740% due 02/24/2013 | | | | 571 | | | | 569 |
6.861% due 02/24/2013 | | | | 5 | | | | 5 |
|
| Centennial Cellular Operating Co. LLC | | |
7.230% due 01/20/2011 | | | | 22 | | | | 22 |
7.318% due 01/20/2011 | | | | 91 | | | | 91 |
7.749% due 01/20/2011 | | | | 300 | | | | 301 |
|
| Centennial Communications | | | | | | | | |
4.000% due 02/09/2011 | | | | 38 | | | | 38 |
7.749% due 02/09/2011 | | | | 375 | | | | 377 |
|
| Charter Communications Operating LLC | | |
5.000% due 04/25/2013 | | | | 1,500 | | | | 1,505 |
|
| CSC Holdings, Inc. | | | | | | | | |
6.580% due 02/24/2013 | | | | 571 | | | | 569 |
6.988% due 02/24/2013 | | | | 852 | | | | 849 |
|
| El Paso Corp. | | | | | | | | |
7.750% due 11/22/2009 | | | | 970 | | | | 977 |
|
| Georgia-Pacific Corp. | | | | | | | | |
7.880% due 12/23/2013 | | | | 222 | | | | 224 |
7.920% due 12/23/2013 | | | | 444 | | | | 449 |
7.957% due 12/23/2013 | | | | 444 | | | | 449 |
8.029% due 12/23/2013 | | | | 444 | | | | 449 |
8.086% due 12/23/2013 | | | | 444 | | | | 449 |
|
| Headwaters, Inc. | | | | | | | | |
6.766% due 04/30/2011 | | | | 1,348 | | | | 1,353 |
|
| HealthSouth Corp. | | | | | | | | |
8.150% due 02/02/2013 | | | | 1,900 | | | | 1,902 |
|
| Ineos Group Holdings PLC | | | | | | | | |
2.275% due 10/07/2012 | | | | 1,200 | | | | 1,205 |
|
| Intelsat Ltd. | | | | | | | | |
5.000% due 04/24/2016 | | | | 1,000 | | | | 1,002 |
|
| Invensys PLC | | | | | | | | |
7.791% due 09/05/2009 | | | | 126 | | | | 127 |
9.431% due 12/30/2009 | | | | 900 | | | | 911 |
|
| JSG Packaging | | | | | | | | |
7.397% due 11/29/2013 | | | | 650 | | | | 649 |
7.897% due 11/29/2014 | | | | 650 | | | | 649 |
|
| Nortel Networks Inc. | | | | | | | | |
8.375% due 02/15/2007 | | | | 1,250 | | | | 1,249 |
|
| Reliant Resources, Inc. | | | | | | | | |
7.175% due 12/22/2010 | | | | 181 | | | | 181 |
|
| Roundy’s Supermarket, Inc. | | | | | | | | |
7.870% due 11/01/2011 | | | | 495 | | | | 499 |
8.170% due 11/01/2011 | | | | 500 | | | | 504 |
4.000% due 11/03/2011 | | | | 3 | | | | 3 |
|
| Service Corp. International | | | | | | | | |
5.000% due 04/02/2016 | | | | 2,000 | | | | 2,008 |
| | | | | | | | |
|
Total Bank Loan Obligations
(Cost $20,962) | | 20,984 |
| | | | | | | | |
|
| |
| CORPORATE BONDS & NOTES 82.9% |
| |
| BANKING & FINANCE 11.6% |
| AES Ironwood LLC | | | | | | | | |
8.857% due 11/30/2025 | | | | 2,493 | | | | 2,705 |
|
| AES Red Oak LLC | | | | | | | | |
8.540% due 11/30/2019 | | | | 1,229 | | | | 1,303 |
| | | | | | | | |
| BCP Crystal U.S. Holdings Corp. | | | | |
9.625% due 06/15/2014 | | $ | | 3,317 | | $ | | 3,616 |
|
| Bluewater Finance Ltd. | �� | | | | | | | |
10.250% due 02/15/2012 | | | | 2,200 | | | | 2,238 |
|
| Bombardier Capital, Inc. | | | | |
7.090% due 03/30/2007 (i) | | | | 1,000 | | | | 1,005 |
|
| Corsair Netherlands BV | | | | |
11.121% due 03/07/2016 | | | | 1,400 | | | | 1,408 |
|
| Deutsche Bank AG | | | | |
1.800% due 05/29/2009 | | | | 400 | | | | 409 |
|
| Eircom Funding | | | | |
8.250% due 08/15/2013 | | | | 800 | | | | 852 |
|
| Ferrellgas Escrow LLC | | | | |
6.750% due 05/01/2014 | | | | 2,100 | | | | 2,000 |
|
| Ford Motor Credit Co. | | | | |
7.875% due 06/15/2010 | | | | 500 | | | | 462 |
8.625% due 11/01/2010 | | | | 260 | | | | 244 |
7.375% due 02/01/2011 | | | | 10,190 | | | | 9,133 |
|
| Forest City Enterprises, Inc. | | | | |
7.625% due 06/01/2015 | | | | 425 | | | | 430 |
|
| General Motors Acceptance Corp. | | | | |
7.250% due 03/02/2011 | | | | 2,000 | | | | 1,941 |
6.000% due 04/01/2011 | | | | 1,194 | | | | 1,087 |
7.000% due 02/01/2012 | | | | 500 | | | | 475 |
6.875% due 08/28/2012 | | | | 1,500 | | | | 1,415 |
8.000% due 11/01/2031 | | | | 1,975 | | | | 1,903 |
|
| IXIS Financial Products, Inc. | | | | |
0.800% due 06/15/2009 | | | | 350 | | | | 344 |
1.650% due 06/15/2009 | | | | 325 | | | | 325 |
1.875% due 06/15/2009 | | | | 350 | | | | 335 |
|
| K&F Acquisition, Inc. | | | | |
7.750% due 11/15/2014 | | | | 1,000 | | | | 990 |
|
| KRATON Polymers LLC | | | | |
8.125% due 01/15/2014 | | | | 1,700 | | | | 1,696 |
|
| Merrill Lynch & Co, Inc. | | | | |
2.300% due 06/22/2009 | | | | 325 | | | | 323 |
|
| Mirage Resorts, Inc. | | | | |
7.250% due 08/01/2017 | | | | 2,600 | | | | 2,502 |
|
| Rotech Healthcare, Inc. | | | | |
9.500% due 04/01/2012 | | | | 3,575 | | | | 2,994 |
|
| Tenneco, Inc. | | | | |
10.250% due 07/15/2013 | | | | 2,600 | | | | 2,863 |
8.625% due 11/15/2014 | | | | 975 | | | | 977 |
|
| TRAINS | | | | |
7.341% due 05/01/2016 | | | | 1,125 | | | | 1,104 |
|
| Universal City Development Partners | | | | |
11.750% due 04/01/2010 | | | | 800 | | | | 875 |
|
| Universal City Florida Holding Co. I | | | | |
8.375% due 05/01/2010 | | | | 1,425 | | | | 1,439 |
9.899% due 05/01/2010 | | | | 175 | | | | 182 |
|
| Ventas Realty LP | | | | |
9.000% due 05/01/2012 | | | | 500 | | | | 550 |
7.125% due 06/01/2015 | | | | 1,000 | | | | 1,005 |
|
| Wind Acquisition Finance S.A. | | | | |
10.750% due 12/01/2015 | | | | 1,000 | | | | 1,067 |
| | | | | | | | |
|
| | | | | | | | | 52,197 |
| | | | | | | | |
|
| |
| INDUSTRIALS 56.4% |
| Abitibi-Consolidated Co. of Canada | | | | |
8.375% due 04/01/2015 | | | | 1,475 | | | | 1,353 |
| | | | | | | | |
| Abitibi-Consolidated, Inc. | | | | | | | | |
8.550% due 08/01/2010 | | $ | | 1,850 | | $ | | 1,762 |
7.750% due 06/15/2011 | | | | 365 | | | | 337 |
7.400% due 04/01/2018 | | | | 400 | | | | 334 |
8.850% due 08/01/2030 | | | | 1,953 | | | | 1,660 |
|
| Alliance One International, Inc. | | | | |
11.000% due 05/15/2012 | | | | 650 | | | | 621 |
|
| Allied Waste North America, Inc. | | | | |
7.875% due 04/15/2013 | | | | 1,625 | | | | 1,633 |
7.250% due 03/15/2015 | | | | 4,600 | | | | 4,416 |
7.125% due 05/15/2016 | | | | 425 | | | | 403 |
|
| AmeriGas Partners LP | | | | | | | | |
7.250% due 05/20/2015 | | | | 1,850 | | | | 1,757 |
7.125% due 05/20/2016 | | | | 2,650 | | | | 2,498 |
|
| Arco Chemical Co. | | | | | | | | |
10.250% due 11/01/2010 | | | | 50 | | | | 55 |
|
| Armor Holdings, Inc. | | | | | | | | |
8.250% due 08/15/2013 | | | | 800 | | | | 832 |
|
| ArvinMeritor, Inc. | | | | | | | | |
8.750% due 03/01/2012 | | | | 3,225 | | | | 3,160 |
|
| Aviall, Inc. | | | | | | | | |
7.625% due 07/01/2011 | | | | 650 | | | | 681 |
|
| Bowater Canada Finance | | | | | | | | |
7.950% due 11/15/2011 | | | | 2,350 | | | | 2,244 |
|
| Bowater, Inc. | | | | | | | | |
6.500% due 06/15/2013 | | | | 300 | | | | 262 |
|
| Boyd Gaming Corp. | | | | | | | | |
7.125% due 02/01/2016 | | | | 4,000 | | | | 3,885 |
|
| Buhrmann US, Inc. | | | | | | | | |
8.250% due 07/01/2014 | | | | 1,000 | | | | 1,000 |
7.875% due 03/01/2015 | | | | 1,300 | | | | 1,290 |
|
| CanWest Media, Inc. | | | | | | | | |
8.000% due 09/15/2012 | | | | 1,520 | | | | 1,512 |
|
| Cascades, Inc. | | | | | | | | |
7.250% due 02/15/2013 | | | | 750 | | | | 697 |
|
| CCO Holdings LLC | | | | | | | | |
8.750% due 11/15/2013 | | | | 4,400 | | | | 4,312 |
|
| Celestica, Inc. | | | | | | | | |
7.625% due 07/01/2013 | | | | 950 | | | | 926 |
|
| Chart Industries, Inc. | | | | | | | | |
9.125% due 10/15/2015 | | | | 425 | | | | 436 |
|
| Charter Communications Operating LLC | | |
8.375% due 04/30/2014 | | | | 1,750 | | | | 1,761 |
|
| Chesapeake Energy Corp. | | | | | | | | |
7.625% due 07/15/2013 | | | | 800 | | | | 809 |
7.000% due 08/15/2014 | | | | 1,000 | | | | 972 |
6.375% due 06/15/2015 | | | | 1,695 | | | | 1,581 |
6.875% due 01/15/2016 | | | | 1,200 | | | | 1,140 |
|
| Choctaw Resort Development Enterprise | | |
7.250% due 11/15/2019 | | | | 1,400 | | | | 1,379 |
|
| Colorado Interstate Gas Co. | | | | | | | | |
6.850% due 06/15/2037 | | | | 200 | | | | 202 |
|
| Continental Airlines, Inc. | | | | | | | | |
6.920% due 04/02/2013 (i) | | | | 802 | | | | 808 |
7.373% due 12/15/2015 | | | | 273 | | | | 260 |
|
| Cooper-Standard Automotive, Inc. | | |
7.000% due 12/15/2012 | | | | 1,200 | | | | 1,080 |
|
| Corrections Corp. of America | | | | | | | | |
6.750% due 01/31/2014 | | | | 200 | | | | 193 |
| | | | | | |
| See Accompanying Notes | | Semiannual Report | | June 30, 2006 | | 9 |
| | |
| |
| Schedule of Investments High Yield Portfolio (Cont.) | | |
| | | | |
| | | PRINCIPAL | | |
| | | AMOUNT | | VALUE |
| | | (000S) | | (000S) |
| | | | | |
| | | | | | | | |
| Crown Americas LLC & Crown Americas Capital Corp. |
7.625% due 11/15/2013 | | $ | | 425 | | $ | | 420 |
7.750% due 11/15/2015 | | | | 1,400 | | | | 1,386 |
|
| CSC Holdings, Inc. | | | | | | | | |
8.125% due 08/15/2009 | | | | 1,500 | | | | 1,534 |
7.625% due 04/01/2011 | | | | 4,625 | | | | 4,648 |
|
| DaVita, Inc. | | | | | | | | |
7.250% due 03/15/2015 | | | | 2,850 | | | | 2,750 |
|
| Delhaize America, Inc. | | | | | | | | |
9.000% due 04/15/2031 | | | | 2,975 | | | | 3,277 |
|
| Delta Air Lines, Inc. | | | | | | | | |
7.379% due 05/18/2010 | | | | 211 | | | | 212 |
7.570% due 11/18/2010 | | | | 975 | | | | 979 |
|
| Dex Media West LLC | | | | | | | | |
9.875% due 08/15/2013 | | | | 2,200 | | | | 2,395 |
|
| DirecTV Holdings LLC | | | | | | | | |
8.375% due 03/15/2013 | | | | 1,184 | | | | 1,246 |
6.375% due 06/15/2015 | | | | 925 | | | | 858 |
|
| Dresser, Inc. | | | | | | | | |
9.375% due 04/15/2011 | | | | 3,350 | | | | 3,409 |
|
| Dresser-Rand Group, Inc. | | | | | | | | |
7.375% due 11/01/2014 | | | | 396 | | | | 380 |
|
| DRS Technologies, Inc. | | | | | | | | |
7.625% due 02/01/2018 | | | | 1,000 | | | | 1,000 |
|
| EchoStar DBS Corp. | | | | | | | | |
6.375% due 10/01/2011 | | | | 1,000 | | | | 960 |
6.625% due 10/01/2014 | | | | 2,975 | | | | 2,804 |
7.125% due 02/01/2016 | | | | 2,500 | | | | 2,419 |
|
| El Paso Corp. | | | | | | | | |
10.750% due 10/01/2010 | | | | 1,500 | | | | 1,642 |
9.625% due 05/15/2012 | | | | 200 | | | | 219 |
7.875% due 06/15/2012 | | | | 4,155 | | | | 4,248 |
8.050% due 10/15/2030 | | | | 1,300 | | | | 1,310 |
7.800% due 08/01/2031 | | | | 700 | | | | 683 |
7.750% due 01/15/2032 | | | | 1,200 | | | | 1,174 |
|
| El Paso Production Holding Co. | | |
7.750% due 06/01/2013 | | | | 2,250 | | | | 2,278 |
|
| Encore Acquisition Co. | | | | | | | | |
6.250% due 04/15/2014 | | | | 300 | | | | 277 |
7.250% due 12/01/2017 | | | | 1,075 | | | | 1,037 |
|
| Equistar Chemicals LP | | | | | | | | |
10.125% due 09/01/2008 | | | | 45 | | | | 48 |
8.750% due 02/15/2009 | | | | 2,035 | | | | 2,111 |
|
| Extendicare Health Services, Inc. | | |
9.500% due 07/01/2010 | | | | 800 | | | | 839 |
|
| Ferrellgas Partners LP | | | | | | | | |
8.870% due 08/01/2009 (i) | | | | 1,200 | | | | 1,242 |
8.750% due 06/15/2012 | | | | 1,525 | | | | 1,555 |
|
| Fisher Communications, Inc. | | | | | | | | |
8.625% due 09/15/2014 | | | | 1,000 | | | | 1,040 |
|
| Ford Motor Co. | | | | | | | | |
7.450% due 07/16/2031 | | | | 2,000 | | | | 1,455 |
|
| Fresenius Medical Care Capital Trust |
7.875% due 06/15/2011 | | | | 2,250 | | | | 2,284 |
|
| Gaylord Entertainment Co. | | | | | | | | |
8.000% due 11/15/2013 | | | | 1,000 | | | | 1,004 |
|
| General Motors Corp. | | | | | | | | |
8.250% due 07/15/2023 | | | | 2,200 | | | | 1,743 |
| | | | | | | | |
| Georgia-Pacific Corp. | | | | | | | | |
8.000% due 01/15/2024 | | $ | | 775 | | $ | | 736 |
7.375% due 12/01/2025 | | | | 5,710 | | | | 5,196 |
|
| Greif, Inc. | | | | | | | | |
8.875% due 08/01/2012 | | | | 400 | | | | 423 |
|
| Grupo Transportacion Ferroviaria Mexicana S.A. de C.V. |
9.375% due 05/01/2012 | | | | 700 | | | | 749 |
|
| Hanover Compressor Co. | | | | | | | | |
9.000% due 06/01/2014 | | | | 500 | | | | 525 |
|
| HCA, Inc. | | | | | | | | |
6.950% due 05/01/2012 | | | | 1,550 | | | | 1,521 |
6.750% due 07/15/2013 | | | | 2,675 | | | | 2,568 |
7.190% due 11/15/2015 | | | | 200 | | | | 194 |
7.500% due 12/15/2023 | | | | 400 | | | | 373 |
|
| Herbst Gaming, Inc. | | | | | | | | |
7.000% due 11/15/2014 | | | | 1,000 | | | | 955 |
|
| Hertz Corp. | | | | | | | | |
8.875% due 01/01/2014 | | | | 1,925 | | | | 1,983 |
|
| Horizon Lines LLC | | | | | | | | |
9.000% due 11/01/2012 | | | | 2,016 | | | | 2,056 |
|
| Host Marriott LP | | | | | | | | |
7.000% due 08/15/2012 | | | | 100 | | | | 100 |
7.125% due 11/01/2013 | | | | 2,780 | | | | 2,783 |
|
| Ineos Group Holdings Plc | | | | | | | | |
8.500% due 02/15/2016 | | | | 1,325 | | | | 1,247 |
|
| Ingles Markets, Inc. | | | | | | | | |
8.875% due 12/01/2011 | | | | 1,450 | | | | 1,524 |
|
| Intelsat Bermuda Ltd. | | | | | | | | |
8.250% due 01/15/2013 | | | | 75 | | | | 75 |
9.250% due 06/15/2016 | | | | 1,275 | | | | 1,323 |
|
| Intelsat Subsidiary Holding Co. Ltd. | | |
9.614% due 01/15/2012 | | | | 1,000 | | | | 1,015 |
8.250% due 01/15/2013 | | | | 325 | | | | 324 |
8.625% due 01/15/2015 | | | | 2,700 | | | | 2,720 |
|
| Invensys PLC | | | | | | | | |
9.875% due 03/15/2011 | | | | 1,150 | | | | 1,253 |
|
| Jefferson Smurfit Corp. U.S. | | | | | | | | |
8.250% due 10/01/2012 | | | | 750 | | | | 707 |
7.500% due 06/01/2013 | | | | 775 | | | | 697 |
|
| JET Equipment Trust | | | | | | | | |
10.000% due 06/15/2012 (b) | | | | 653 | | | | 634 |
7.630% due 08/15/2012 (b) | | | | 352 | | | | 274 |
|
| JSG Funding PLC | | | | | | | | |
9.625% due 10/01/2012 | | | | 3,815 | | | | 3,949 |
|
| L-3 Communications Corp. | | | | | | | | |
7.625% due 06/15/2012 | | | | 500 | | | | 510 |
6.375% due 10/15/2015 | | | | 900 | | | | 864 |
|
| Legrand France | | | | | | | | |
8.500% due 02/15/2025 | | | | 475 | | | | 545 |
|
| Mandalay Resort Group | | | | | | | | |
9.375% due 02/15/2010 | | | | 2,300 | | | | 2,432 |
|
| Mediacom Broadband LLC | | | | | | | | |
11.000% due 07/15/2013 | | | | 2,940 | | | | 3,113 |
|
| MGM Mirage | | | | | | | | |
8.500% due 09/15/2010 | | | | 400 | | | | 417 |
8.375% due 02/01/2011 | | | | 825 | | | | 850 |
6.750% due 04/01/2013 | | | | 775 | | | | 743 |
6.625% due 07/15/2015 | | | | 2,100 | | | | 1,969 |
| | | | | | | | |
| Nalco Co. | | | | | | | | |
7.750% due 11/15/2011 | | $ | | 1,800 | | $ | | 1,805 |
8.875% due 11/15/2013 | | | | 700 | | | | 709 |
|
| New Skies Satellites NV | | | | | | | | |
9.125% due 11/01/2012 | | | | 825 | | | | 877 |
|
| Newfield Exploration Co. | | | | | | | | |
6.625% due 04/15/2016 | | | | 800 | | | | 758 |
|
| Newpark Resources | | | | | | | | |
8.625% due 12/15/2007 | | | | 1,390 | | | | 1,393 |
|
| Norampac, Inc. | | | | | | | | |
6.750% due 06/01/2013 | | | | 1,050 | | | | 950 |
|
| Nordic Telephone Co. Holdings ApS | | |
8.875% due 05/01/2016 | | | | 1,000 | | | | 1,033 |
|
| Nortel Networks Ltd. | | | | | | | | |
10.125% due 07/15/2013 | | | | 800 | | | | 818 |
10.750% due 07/15/2016 | | | | 475 | | | | 486 |
|
| Northwest Pipeline Corp. | | | | | | | | |
7.125% due 12/01/2025 | | | | 500 | | | | 483 |
|
| Novelis, Inc. |
7.250% due 02/15/2015 | | | | 1,200 | | | | 1,158 |
|
| Owens Brockway Glass Container, Inc. |
6.750% due 12/01/2014 | | | | 3,175 | | | | 2,961 |
|
| Peabody Energy Corp. | | | | | | | | |
6.875% due 03/15/2013 | | | | 2,041 | | | | 2,015 |
|
| Plains Exploration & Production Co. |
7.125% due 06/15/2014 | | | | 1,625 | | | | 1,609 |
|
| Pogo Producing Co. | | | | | | | | |
7.875% due 05/01/2013 | | | | 800 | | | | 806 |
|
| PQ Corp. | | | | | | | | |
7.500% due 02/15/2013 | | | | 2,225 | | | | 2,103 |
|
| Premier Entertainment Biloxi LLC |
10.750% due 02/01/2012 | | | | 750 | | | | 778 |
|
| Primedia, Inc. | | | | | | | | |
8.875% due 05/15/2011 | | | | 275 | | | | 265 |
8.000% due 05/15/2013 | | | | 400 | | | | 360 |
|
| Quiksilver, Inc. | | | | | | | | |
6.875% due 04/15/2015 | | | | 2,600 | | | | 2,431 |
|
| Qwest Communications International, Inc. |
7.250% due 02/15/2011 | | | | 5,125 | | | | 4,997 |
7.500% due 02/15/2014 | | | | 8,275 | | | | 8,110 |
|
| Reynolds American, Inc. | | | | | | | | |
7.250% due 06/01/2012 | | | | 925 | | | | 911 |
7.250% due 06/01/2013 | | | | 1,450 | | | | 1,425 |
7.625% due 06/01/2016 | | | | 925 | | | | 909 |
|
| RH Donnelley Corp. | | | | | | | | |
6.875% due 01/15/2013 | | | | 250 | | | | 231 |
8.875% due 01/15/2016 | | | | 1,350 | | | | 1,369 |
|
| Rhodia S.A. | | | | | | | | |
7.625% due 06/01/2010 | | | | 750 | | | | 746 |
|
| Rockwood Specialties Group, Inc. |
7.500% due 11/15/2014 | | | | 600 | | | | 591 |
|
| Rogers Cable, Inc. | | | | | | | | |
6.750% due 03/15/2015 | | | | 1,560 | | | | 1,494 |
8.750% due 05/01/2032 | | | | 800 | | | | 866 |
|
| Roseton | | | | | | | | |
7.270% due 11/08/2010 | | | | 2,275 | | | | 2,276 |
7.670% due 11/08/2016 | | | | 2,325 | | | | 2,321 |
|
| Russell Corp. | | | | | | | | |
9.250% due 05/01/2010 | | | | 550 | | | | 578 |
| | | | |
| 10 | | PIMCO Variable Insurance Trust | | See Accompanying Notes |
| | |
| |
| | | June 30, 2006 (Unaudited) |
| | | | |
| | | PRINCIPAL | | |
| | | AMOUNT | | VALUE |
| | | (000S) | | (000S) |
| | | | | |
| | | | | | | | |
| Sanmina-SCI Corp. | | | | | | | | |
8.125% due 03/01/2016 | | $ | | 1,175 | | $ | | 1,152 |
|
| SemGroup LP | | | | | | | | |
8.750% due 11/15/2015 | | | | 1,000 | | | | 1,000 |
|
| Seneca Gaming Corp. | | | | | | | | |
7.250% due 05/01/2012 | | | | 1,900 | | | | 1,850 |
|
| Sensata Technologies BV | | | | | | | | |
8.000% due 05/01/2014 | | | | 2,500 | | | | 2,425 |
|
| Smurfit Capital Funding PLC |
7.500% due 11/20/2025 | | | | 500 | | | | 458 |
|
| Smurfit-Stone Container Enterprises, Inc. |
9.750% due 02/01/2011 | | | | 430 | | | | 444 |
8.375% due 07/01/2012 | | | | 2,545 | | | | 2,418 |
|
| Solectron Global Finance Ltd. | | | | |
8.000% due 03/15/2016 | | | | 1,300 | | | | 1,287 |
|
| Sonat, Inc. | | | | | | | | |
7.000% due 02/01/2018 | | | | 500 | | | | 468 |
|
| Station Casinos, Inc. | | | | | | | | |
6.500% due 02/01/2014 | | | | 1,200 | | | | 1,122 |
6.875% due 03/01/2016 | | | | 2,500 | | | | 2,344 |
|
| Suburban Propane Partners LP |
6.875% due 12/15/2013 | | | | 2,750 | | | | 2,585 |
|
| Sungard Data Systems, Inc. | | | | | | | | |
9.125% due 08/15/2013 | | | | 3,050 | | | | 3,180 |
|
| Superior Essex Communications LLC |
9.000% due 04/15/2012 | | | | 500 | | | | 510 |
|
| Tenet Healthcare Corp. | | | | | | | | |
7.375% due 02/01/2013 | | | | 3,125 | | | | 2,867 |
|
| Triad Hospitals, Inc. | | | | | | | | |
7.000% due 11/15/2013 | | | | 2,275 | | | | 2,224 |
|
| Trinity Industries, Inc. | | | | | | | | |
6.500% due 03/15/2014 | | | | 780 | | | | 764 |
|
| TRW Automotive, Inc. | | | | | | | | |
9.375% due 02/15/2013 | | | | 2,025 | | | | 2,162 |
|
| United Airlines, Inc. | | | | | | | | |
6.201% due 09/01/2008 | | | | 177 | | | | 177 |
6.602% due 09/01/2013 | | | | 396 | | | | 398 |
|
| Unity Media GmbH | | | | | | | | |
10.375% due 02/15/2015 | | | | 750 | | | | 720 |
|
| US Airways Inc. | | | | | | | | |
9.330% due 01/01/2024 (b) | | | | 84 | | | | 1 |
9.625% due 09/01/2024 (b) | | | | 1,016 | | | | 4 |
|
| Valero Energy Corp. | | | | | | | | |
7.800% due 06/14/2010 | | | | 850 | | | | 855 |
|
| VWR International, Inc. | | | | | | | | |
6.875% due 04/15/2012 | | | | 460 | | | | 442 |
8.000% due 04/15/2014 | | | | 3,190 | | | | 3,114 |
|
| Williams Cos., Inc. | | | | | | | | |
7.625% due 07/15/2019 | | | | 3,950 | | | | 4,029 |
7.875% due 09/01/2021 | | | | 3,075 | | | | 3,137 |
7.750% due 06/15/2031 | | | | 650 | | | | 644 |
|
| Windstream Corp. | | | | | | | | |
8.625% due 08/01/2016 | | | | 1,050 | | | | 1,079 |
|
| Wynn Las Vegas LLC | | | | | | | | |
6.625% due 12/01/2014 | | | | 6,900 | | | | 6,538 |
|
| Xerox Corp. | | | | | | | | |
7.200% due 04/01/2016 | | | | 1,025 | | | | 1,033 |
| | | | | | | | |
|
| | | | | | | | | 254,517 |
| | | | | | | | |
|
| |
| | | | | | | | |
| UTILITIES 14.9% | | | | | | | | |
| AES Corp. | | | | | | | | |
8.750% due 05/15/2013 | | $ | | 2,825 | | $ | | 3,037 |
|
| American Cellular Corp. | | | | | | | | |
10.000% due 08/01/2011 | | | | 1,350 | | | | 1,428 |
|
| Cincinnati Bell, Inc. | | | | | | | | |
7.250% due 07/15/2013 | | | | 3,425 | | | | 3,391 |
8.375% due 01/15/2014 | | | | 1,970 | | | | 1,950 |
|
| Citizens Communications Co. | | | | | | | | |
7.000% due 11/01/2025 | | | | 75 | | | | 62 |
9.000% due 08/15/2031 | | | | 2,025 | | | | 2,060 |
7.450% due 07/01/2035 | | | | 250 | | | | 213 |
|
| CMS Energy Corp. | | | | | | | | |
7.500% due 01/15/2009 | | | | 375 | | | | 382 |
7.750% due 08/01/2010 | | | | 600 | | | | 612 |
8.500% due 04/15/2011 | | | | 1,000 | | | | 1,048 |
6.300% due 02/01/2012 | | | | 300 | | | | 285 |
|
| Edison Mission Energy | | | | | | | | |
7.500% due 06/15/2013 | | | | 750 | | | | 739 |
7.750% due 06/15/2016 | | | | 750 | | | | 741 |
|
| Hawaiian Telcom Communications, Inc. |
9.750% due 05/01/2013 | | | | 1,500 | | | | 1,534 |
10.789% due 05/01/2013 | | | | 500 | | | | 508 |
|
| Homer City Funding LLC | | | | | | | | |
8.734% due 10/01/2026 | | | | 983 | | | | 1,096 |
|
| IPALCO Enterprises, Inc. | | | | | | | | |
8.375% due 11/14/2008 | | | | 1,050 | | | | 1,084 |
8.625% due 11/14/2011 | | | | 490 | | | | 522 |
|
| Midwest Generation LLC | | | | | | | | |
8.560% due 01/02/2016 | | | | 4,784 | | | | 5,026 |
8.750% due 05/01/2034 | | | | 1,550 | | | | 1,651 |
|
| Mobile Telesystems Finance S.A. |
8.375% due 10/14/2010 | | | | 500 | | | | 502 |
8.000% due 01/28/2012 | | | | 450 | | | | 440 |
|
| MSW Energy Holdings II LLC | | | | | | | | |
7.375% due 09/01/2010 | | | | 650 | | | | 653 |
|
| MSW Energy Holdings LLC | | | | | | | | |
8.500% due 09/01/2010 | | | | 500 | | | | 518 |
|
| Northwestern Bell Telephone | | | | |
7.750% due 05/01/2030 | | | | 1,208 | | | | 1,154 |
|
| NRG Energy, Inc. | | | | | | | | |
7.250% due 02/01/2014 | | | | 2,775 | | | | 2,713 |
7.375% due 02/01/2016 | | | | 4,000 | | | | 3,910 |
|
| PSEG Energy Holdings LLC | | | | | | | | |
8.500% due 06/15/2011 | | | | 4,250 | | | | 4,484 |
|
| Qwest Capital Funding, Inc. | | | | | | | | |
7.900% due 08/15/2010 | | | | 1,650 | | | | 1,650 |
7.250% due 02/15/2011 | | | | 300 | | | | 293 |
|
| Qwest Corp. | | | | | | | | |
8.875% due 03/15/2012 | | | | 2,625 | | | | 2,783 |
7.500% due 06/15/2023 | | | | 1,000 | | | | 943 |
7.200% due 11/10/2026 | | | | 700 | | | | 642 |
|
| Reliant Energy, Inc. | | | | | | | | |
9.250% due 07/15/2010 | | | | 1,975 | | | | 1,985 |
6.750% due 12/15/2014 | | | | 3,075 | | | | 2,844 |
|
| Rogers Wireless, Inc. | | | | | | | | |
7.250% due 12/15/2012 | | | | 150 | | | | 152 |
8.000% due 12/15/2012 | | | | 520 | | | | 534 |
7.500% due 03/15/2015 | | | | 2,195 | | | | 2,228 |
|
| Rural Cellular Corp. | | | | | | | | |
9.875% due 02/01/2010 | | | | 1,275 | | | | 1,318 |
| | | | | | | | |
| Sierra Pacific Resources | | | | | | | | |
7.803% due 06/15/2012 | | $ | | 975 | | $ | | 993 |
8.625% due 03/15/2014 | | | | 500 | | | | 532 |
|
| South Point Energy Center LLC | | | | |
8.400% due 05/30/2012 | | | | 2,288 | | | | 2,231 |
|
| TECO Energy, Inc. | | | | | | | | |
6.750% due 05/01/2015 | | | | 1,000 | | | | 978 |
|
| Tenaska Alabama Partners LP | | | | |
7.000% due 06/30/2021 | | | | 2,266 | | | | 2,220 |
|
| Time Warner Telecom Holdings, Inc. |
9.250% due 02/15/2014 | | | | 2,875 | | | | 2,961 |
| | | | | | | | |
|
| | | | | | | | | 67,030 |
| | | | | | | | |
|
Total Corporate Bonds & Notes
(Cost $380,445) | | 373,744 |
| | | | | | | | |
|
| |
| CONVERTIBLE BONDS & NOTES 0.5% |
| | | | | | | | | |
| BANKING & FINANCE 0.2% |
| Lehman Brothers Holdings, Inc. |
1.383% due 06/15/2009 | | | | 350 | | | | 359 |
2.070% due 06/15/2009 | | | | 350 | | | | 347 |
3.119% due 06/15/2009 | | | | 350 | | | | 345 |
| | | | | | | | |
|
| | | | | | | | | 1,051 |
| | | | | | | | |
|
| |
| UTILITIES 0.3% | | | | | | | | |
| CMS Energy Corp. |
2.875% due 12/01/2024 | | | | 1,075 | | | | 1,152 |
| | | | | | | | |
|
Total Convertible Bonds & Notes
(Cost $2,271) | | 2,203 |
| | | | | | | | |
|
| |
| SOVEREIGN ISSUES 0.3% |
| Brazilian Government International Bond |
8.875% due 10/14/2019 | | | | 50 | | | | 56 |
8.750% due 02/04/2025 | | | | 50 | | | | 55 |
8.250% due 01/20/2034 | | | | 1,100 | | | | 1,157 |
| | | | | | | | |
|
Total Sovereign Issues (Cost $1,159) | | 1,268 |
| | | | | | | | |
|
| |
| FOREIGN CURRENCY-DENOMINATED ISSUES (j) 3.7% |
| Cognis Holding GmbH |
11.644% due 01/15/2015 (c) | | EUR | | 112 | | | | 138 |
|
| Development Bank of Japan |
2.875% due 12/20/2006 | | JPY | | 150,000 | | | | 1,327 |
|
| France Government International Bond |
4.500% due 07/12/2006 | | EUR | | 1,500 | | | | 1,919 |
|
| JSG Funding PLC |
10.125% due 10/01/2012 | | | | 650 | | | | 910 |
|
| JSG Holding PLC |
11.500% due 10/01/2015 (c) | | | | 1,252 | | | | 1,652 |
|
| Lighthouse International Co. S.A. |
8.000% due 04/30/2014 | | | | 2,220 | | | | 3,006 |
|
| Nordic Telephone |
5.207% due 11/30/2014 | | | | 550 | | | | 711 |
5.707% due 11/30/2015 | | | | 550 | | | | 714 |
|
| Nordic Telephone Co. Holdings ApS |
8.250% due 05/01/2016 | | | | 1,000 | | | | 1,314 |
|
| Rhodia S.A. |
8.000% due 06/01/2010 | | | | 1,000 | | | | 1,334 |
|
| SigmaKalon |
4.742% due 06/30/2012 | | | | 1,000 | | | | 1,279 |
| | | | | | |
| See Accompanying Notes | | Semiannual Report | | June 30, 2006 | | 11 |
| | |
| |
| Schedule of Investments High Yield Portfolio (Cont.) | | |
| | | | |
| | | PRINCIPAL | | |
| | | AMOUNT | | VALUE |
| | | (000S) | | (000S) |
| | | | | | | | | |
| UPC Broadband Holding BV |
5.000% due 03/31/2013 | | EC | | 500 | | | $ | | 639 |
5.000% due 12/31/2013 | | | | 500 | | | | | 639 |
|
| UPC Holding BV |
7.750% due 01/15/2014 | | | | 200 | | | | | 241 |
8.625% due 01/15/2014 | | | | 800 | | | | | 1,008 |
| | | | | | | | | |
|
Total Foreign Currency-Denominated Issues (Cost $15,796) | | 16,831 |
| | | | | | | | | |
|
| | | | |
| | | | | SHARES | | | | | |
| CONVERTIBLE PREFERRED STOCK 0.1% |
| Chesapeake Energy Corp. | | | | | | | |
4.500% due 12/31/2049 | | | | 5,000 | | | | | 468 |
| | | | | | | | | |
|
Total Convertible Preferred Stock
(Cost $499) | | 468 |
| | | | | | | | | |
|
| |
| PREFERRED SECURITIES 1.2% |
| Fresenius Medical Care Capital Trust II |
7.875% due 02/01/2008 | | | | 2,050 | | | | | 2,086 |
|
| Xerox Capital Trust I |
8.000% due 02/01/2027 | | | | 3,100,000 | | | | | 3,127 |
| | | | | | | | | |
|
Total Preferred Stock (Cost $5,370) | | 5,213 |
| | | | | | | | | |
|
| | | | |
| | | | | PRINCIPAL
AMOUNT
(000S) | | | | | |
| SHORT-TERM INSTRUMENTS (j) 7.4% |
| |
| COMMERCIAL PAPER 3.6% |
| Societe Generale N.A. |
5.250% due 07/05/2006 | | $ | | 300 | | | | | 300 |
5.245% due 08/08/2006 | | | | 2,700 | | | | | 2,686 |
|
| UBS Finance Delaware LLC |
5.225% due 08/08/2006 | | | | 6,000 | | | | | 5,969 |
5.250% due 08/08/2006 | | | | 7,400 | | | | | 7,361 |
| | | | | | | | | |
|
| | | | | | | | | | 16,316 |
| | | | | | | | | |
|
| |
| | | | | | | | |
| REPURCHASE AGREEMENT 0.8% |
| State Street Bank |
4.900% due 07/03/2006 | | $ | | 3,644 | | $ | | 3,644 |
| | | | | | | | |
|
(Dated 06/30/2006. Collateralized by Federal Home Loan Bank 4.875% due 07/02/2005 valued at $3,720. Repurchase proceeds are $3,645.) |
| |
| BELGIUM TREASURY BILLS 2.7% |
2.808% due 09/14/2006 | | EUR | | 9,500 | | | | 12,083 |
| | | | | | | | |
|
| |
| SPAIN TREASURY BILLS 0.0% |
3.004% due 12/22/2006 | | | | 200 | | | | 252 |
| | | | | | | | |
|
| |
| U.S. TREASURY BILLS 0.3% |
4.725% due 08/31/2006 - 09/14/2006 (d)(e)(f) | | $ | | 1,280 | | | | 1,269 |
| | | | | | | | |
|
| |
Total Short-Term Instruments
(Cost $33,416) | | 33,564 |
| | | | | | | | |
|
| |
Total Investments (a) 100.8%
(Cost $459,918) | | $ | | 454,275 |
| |
Written Options (h) (0.0%)
(Premiums $283) | | (73) |
| |
| Other Assets and Liabilities (Net) (0.8%) | | (3,497) |
| | | | | | | | |
|
| Net Assets 100.0% | | | | | | $ | | 450,705 |
| | | | | | | | |
|
| | |
| Notes to Schedule of Investments (amounts in thousands, except number of contracts): |
| |
(a) As of June 30, 2006, portfolio securities with an aggregate market value of $8,370 were valued in good faith and pursuant to guidelines established by the Board of Trustees. |
| |
(b) Security is in default. |
| |
(c) Payment in-kind bond security. |
| |
(d) Securities are grouped by coupon or range of coupons and represent a range of maturities. |
| |
(e) Securities with an aggregate market value of $248 have been pledged as collateral for swap and swaption contracts on June 30, 2006. |
| |
(f) Securities with an aggregate market value of $1,021 have been segregated with the custodian to cover margin requirements for the following open futures contracts on June 30, 2006: |
| | | | | | | | | | |
| Description | | Type | | Expiration
Month | | # of
Contracts | | Unrealized
(Depreciation) | |
90-Day Eurodollar December Futures | | Long | | 12/2006 | | 844 | | $ | (1,651 | ) |
| | | | | | | | |
|
|
|
| | | | |
| 12 | | PIMCO Variable Insurance Trust | | See Accompanying Notes |
| | |
| |
| | | June 30, 2006 (Unaudited) |
| | | | | | | | | | | | | | | |
(g) Swap agreements outstanding on June 30, 2006: | |
| Credit Default Swaps | |
| Counterparty | | Reference Entity | | Buy/Sell
Protection+ | | (Pay)/Receive
Fixed Rate | | Expiration
Date | | Notional
Amount | | Unrealized
Appreciation/
(Depreciation) | |
Bank of America | | Ford Motor Credit Co. 7.000% due 10/01/2013 | | Sell | | 4.750% | | 12/20/2006 | | $ | 1,500 | | $ | 24 | |
Bank of America | | Dow Jones CDX N.A. HY6 Index | | Sell | | 3.450% | | 06/20/2011 | | | 900 | | | 18 | |
Citibank N.A. | | CMS Energy Corp. 8.500% due 04/05/2011 | | Sell | | 1.900% | | 06/20/2011 | | | 500 | | | 6 | |
Citibank N.A. | | CMS Energy Corp. 6.875% due 12/15/2015 | | Sell | | 1.720% | | 06/20/2011 | | | 1,000 | | | 5 | |
Credit Suisse First Boston | | CMS Energy Corp. 7.500% due 01/15/2009 | | Sell | | 1.800% | | 12/20/2010 | | | 625 | | | 6 | |
Credit Suisse First Boston | | Abitibi-Consolidated, Inc.
8.550% due 08/01/2010 | | Sell | | 5.350% | | 09/20/2011 | | | 1,000 | | | 27 | |
Deutsche Bank AG | | Russia Government International Bond, 5.000% until 03/31/2007 and 7.500% thereafter,
due 03/31/2030 | | Sell | | 0.440% | | 06/20/2007 | | | 2,500 | | | 1 | |
Goldman Sachs & Co. | | ArvinMeritor, Inc. 8.750% due 03/01/2012 | | Sell | | 2.400% | | 03/20/2007 | | | 700 | | | 9 | |
Goldman Sachs & Co. | | Host Marriott LP 7.125% due 11/01/2013 | | Sell | | 1.770% | | 12/20/2010 | | | 500 | | | 12 | |
J.P. Morgan Chase & Co. | | Lear Corp. 8.110% due 05/15/2009 | | Sell | | 7.750% | | 03/20/2007 | | | 1,400 | | | 59 | |
J.P. Morgan Chase & Co. | | Abitibi-Consolidated, Inc.
8.375% due 04/01/2015 | | Sell | | 1.500% | | 06/20/2007 | | | 500 | | | 0 | |
Lehman Brothers, Inc. | | Primedia, Inc. 8.875% due 05/15/2011 | | Sell | | 2.500% | | 03/20/2007 | | | 1,000 | | | (1 | ) |
Merrill Lynch & Co., Inc. | | AES Corp. 8.750% due 06/15/2008 | | Sell | | 0.950% | | 06/20/2007 | | | 1,300 | | | 3 | |
Merrill Lynch & Co., Inc. | | AES Corp. 8.750% due 06/15/2008 | | Sell | | 0.950% | | 06/20/2007 | | | 700 | | | 1 | |
Morgan Stanley Dean Witter & Co. | | Qwest Capital Funding, Inc.
7.250% due 02/15/2011 | | Sell | | 1.800% | | 06/20/2010 | | | 2,000 | | | (14 | ) |
Morgan Stanley Dean Witter & Co. | | Multiple reference entities of Gazprom | | Sell | | 1.050% | | 04/20/2011 | | | 3,000 | | | (29 | ) |
| | | | | | | | | | | | | |
|
|
|
| | | | | | | | | | | | | | $ | 127 | |
| | | | | | | | | | | | | |
|
|
|
|
| + If the Portfolio is a seller of protection and a credit event occurs, as defined under the terms of that particular swap agreement, the Portfolio will pay to the buyer of the protection an amount up to the notional value of the swap and in certain instances, take delivery of the security. As a buyer of protection, the Portfolio will generally receive from the seller of protection an amount up to the notional amount of the swap if a credit event occurs. | |
| | | | | | | | | | | | | | | |
(h) Written options outstanding on June 30, 2006: | | | | | | | | | | | | | |
| Options on Exchange-Traded Futures Contracts | | | | | | | | | | | | | |
| Description | | | | Exercise
Price | | Expiration
Date | | # of
Contracts | | Premium | | Value |
Call - CBOT U.S. Treasury 10-Year Note September Futures | | $ | 108.000 | | 08/25/2006 | | 319 | | $ | 113 | | $ | 10 |
Call - CBOT U.S. Treasury 10-Year Note September Futures | | | 107.000 | | 08/25/2006 | | 129 | | | 54 | | | 12 |
Put - CBOT U.S. Treasury 10-Year Note September Futures | | | 103.000 | | 08/25/2006 | | 319 | | | 94 | | | 45 |
Put - CBOT U.S. Treasury 10-Year Note September Futures | | | 102.000 | | 08/25/2006 | | 129 | | | 22 | | | 6 |
| | | | | | | | | | | |
|
|
| | | | | | | | | | | | $ | 283 | | $ | 73 |
| | | | | | | | | | | |
|
|
| | | | | | | | | | | | | | | | |
(i) Restricted securities as of June 30, 2006: | |
| Issuer Description | | Coupon | | Maturity
Date | | Acquisition
Date | | Cost | | Market
Value | | | Market Value
as Percentage
of Net Assets | |
Bombardier Capital, Inc. | | 7.090% | | 03/30/2007 | | 08/11/2003 | | $ 1,002 | | $ | 1,005 | | | | 0.22% | |
Continental Airlines, Inc. | | 6.920% | | 04/02/2013 | | 07/01/2003 | | 733 | | | 808 | | | | 0.18% | |
Ferrellgas Partners LP | | 8.870% | | 08/01/2009 | | 06/30/2003 | | 1,286 | | | 1,242 | | | | 0.28% | |
| | | | | | | | |
|
|
| | | | | | | | | $ 3,021 | | $ | 3,055 | | | | 0.68% | |
| | | | | | | | |
|
|
(j) Forward foreign currency contracts outstanding on June 30, 2006: | |
| Type | | | | Principal Amount Covered by Contract | | Settlement Month | | Unrealized Appreciation | | Unrealized (Depreciation) | | | Net Unrealized (Depreciation) | |
Sell | | EUR | | 11,581 | | 07/2006 | | $ 0 | | $ | (262 | ) | | $ | (262 | ) |
Buy | | JPY | | 545,951 | | 08/2006 | | 1 | | | (26 | ) | | | (25 | ) |
| | | | | | | | |
|
|
| | | | | | | | | $ 1 | | $ | (288 | ) | | $ | (287 | ) |
| | | | | | | | |
|
|
| | | | | | |
| See Accompanying Notes | | Semiannual Report | | June 30, 2006 | | 13 |
Notes to Financial Statements
1. ORGANIZATION
The High Yield Portfolio (the “Portfolio”) is a series of the PIMCO Variable Insurance Trust (the “Trust”). The Trust is registered under the Investment Company Act of 1940 (the “Act”), as amended, as an open-end investment management company organized as a Delaware business trust on October 3, 1997. The Portfolio offers three classes of shares: Institutional, Administrative and Advisor. Information presented in these financial statements pertains to the Administrative Class of the Portfolio. Certain detailed financial information for the Institutional Class and Advisor Classes is provided separately and is available upon request. The Trust is designed to be used as an investment vehicle by Separate Accounts of insurance companies that fund variable annuity contracts and variable life insurance policies and by qualified pension and retirement plans.
2. SIGNIFICANT ACCOUNTING POLICIES
The following is a summary of significant accounting policies consistently followed by the Portfolio in the preparation of its financial statements in conformity with accounting principles generally accepted in the United States of America (“GAAP”). The preparation of financial statements in accordance with GAAP requires management to make estimates and assumptions that affect the reported amounts and disclosures in the financial statements. Actual results could differ from those estimates.
Security Valuation. Portfolio securities are valued as of the close of regular trading (normally 4:00 p.m., Eastern Time) on each day that the New York Stock Exchange (“NYSE”) is open. Portfolio securities and other assets for which market quotes are readily available are stated at market value. Market value is generally determined on the basis of last reported sales prices, or if no sales are reported, based on quotes obtained from a quotation reporting system, established market makers, or pricing services. Fixed-income securities and non-exchange traded derivatives are normally valued on the basis of quotes obtained from brokers and dealers or pricing services. Prices obtained from independent pricing services use information provided by market makers or estimates of market values obtained from yield data relating to investments or securities with similar characteristics. Certain fixed-income securities purchased on a delayed-delivery basis are marked to market daily until settlement at the forward settlement date. Short-term investments having a maturity of 60 days or less are generally valued at amortized cost. Exchange traded options, futures and options on futures are valued at the settlement price determined by the relevant exchange.
Investments initially valued in currencies other than the U.S. dollar are converted to the U.S. dollar using exchange rates obtained from pricing services. As a result, the NAV of the Portfolio’s shares may be affected by changes in the value of currencies in relation to the U.S. dollar. The value of securities traded in markets outside the United States or denominated in currencies other than the U.S. dollar may be affected significantly on a day that the NYSE is closed and an investor is not able to purchase, redeem or exchange shares.
Securities and other assets for which market quotes are not readily available are valued at fair value as determined in good faith by the Board of Trustees or persons acting at their direction. The Board of Trustees has adopted methods for valuing securities and other assets in circumstances where market quotes are not readily available, and has delegated to Pacific Investment Management Company LLC (“PIMCO”) the responsibility for applying the valuation methods. In the event that market quotes are not readily available, and the security or asset cannot be valued pursuant to one of the valuation methods, the value of the security or asset will be determined in good faith by the Valuation Committee of the Board of Trustees, generally based upon recommendations provided by PIMCO.
Market quotes are considered not readily available in circumstances where there is an absence of current or reliable market-based data (e.g., trade information, bid/asked information, broker quotes), including where events occur after the close of the relevant market, but prior to the close of regular trading, that materially affect the values of the Portfolio’s securities or assets. In addition, market quotes are considered not readily available when, due to extraordinary circumstances, the exchanges or markets on which the securities trade do not open for trading for the entire day and no other market prices are available. The Board has delegated to PIMCO the responsibility for monitoring significant events that may materially affect the values of the Portfolio’s securities or assets and for determining whether the value of the applicable securities or assets should be re-evaluated in light of such significant events when the Portfolio uses fair value pricing to determine its NAV, securities will not be priced on the basis of quotations from the primary market in which they are traded, but rather may be priced by another method that the Board of Trustees or persons acting at their direction believe accurately reflects fair value. The Trust’s policy is intended to result in a calculation of the Portfolio’s NAV that fairly reflects security values as of the time of pricing. However, fair values determined by the Board of Trustees or persons acting at their direction may not accurately reflect the price that the Portfolio could obtain for a security if it were to dispose of that security as of the time of pricing. Because foreign securities can trade on non-business days, the NAV of the Portfolio may change on days when shareholders will not be able to purchase or redeem shares. The prices used by the Portfolio may differ from the value that would be realized if the securities were sold and the differences could be material to the financial statements.
Securities Transactions and Investment Income. Securities transactions are recorded as of the trade date. Securities purchased or sold on a when-issued or delayed-delivery basis may be settled a month or more after the trade date. Realized gains and losses from securities sold are recorded on the identified cost basis. Dividend income is recorded on the ex-dividend date, except certain dividends from foreign securities where the ex-dividend date may have passed, which are recorded as soon as the Portfolio is informed of the ex-dividend date. Interest income, adjusted for the accretion of discounts and amortization of premiums, is recorded on the accrual basis. Paydown gains and losses on mortgage-related or asset-backed securities are recorded as components of interest income in the Statement of Operations.
Dividends and Distributions to Shareholders. Dividends from net investment income, if any, are declared on each day the Portfolio is open for business and are distributed to shareholders monthly. Net realized capital gains earned by the Portfolio, if any, will be distributed no less frequently than once each year. Most shareholders choose to reinvest their dividends and capital gain distribution in additional shares of the Portfolio.
Income dividends and capital gain distributions are determined in accordance with income tax regulations which may differ from GAAP. Differences between tax regulations and GAAP may change the fiscal year when income and capital items are recognized for tax and GAAP purposes. Examples of events that give rise to timing differences include wash sales, straddles, net operating losses and capital loss carryforwards. Further, the character of investment income and capital gains may be different for certain transactions under the two methods of accounting. Examples of characterization differences include the treatment of mortgage paydowns, swaps, foreign currency transactions and contingent debt instruments. As a result, income dividends and capital gain distributions declared during a fiscal period may differ significantly from the net investment income and realized capital gain reported in the Portfolio’s annual financial statements presented under GAAP.
| | | | |
| 14 | | PIMCO Variable Insurance Trust | | |
| | |
| |
| | | June 30, 2006 (Unaudited) |
Distributions classified as a tax basis return of capital, if any, are reflected in the accompanying Statements of Changes in Net Assets and have been reclassified to paid in capital. In addition, other amounts have been reclassified between undistributed net investment income, accumulated undistributed net realized gains or losses and/or paid in capital to more appropriately conform financial accounting to tax characterizations of dividend distributions.
Multiclass Operations. Each class offered by the Portfolio has equal rights as to assets and voting privileges (except that shareholders of a class have exclusive voting rights regarding any matter relating solely to that class of shares). Income and non-class specific expenses of the Portfolio are allocated daily to each class of shares based on the relative value of settled shares. Realized and unrealized capital gains and losses of the Portfolio are allocated daily to each class of shares based on the relative net assets of each class. Class specific expenses, where applicable, currently include administrative, distribution and servicing fees.
Bridge Debt Commitments. At the period ended June 30, 2006, the Portfolio had $2,008,182 in commitments outstanding to fund high-yield bridge debt. The Portfolio is entitled to a fee upon the expiration of the commitment period. The bridge debt terms approximate market rates at the time the commitment is entered into.
Loan Participants and Assignments. The Portfolio may invest in direct debt instruments which are interests in amounts owned by corporate, governmental, or other borrowers to lenders or lending syndicates. The Portfolio’s investments in loans may be in the form of participations in loans or assignments of all or a portion of loans from third parties. A loan is often administered by a bank or other financial institution (the “lender”) that acts as agent for all holders. The agent administers the terms of the loan, as specified in the loan agreement. When investing in a loan participation, the Portfolio has the right to receive payments of principal, interest and any fees to which it is entitled only from the lender selling the loan agreement and only upon receipt by the lender of payments from the borrower. The Portfolio generally has no right to enforce compliance with the terms of the loan agreement with the borrower. As a result, the Portfolio may be subject to the credit risk of both the borrower and the lender that is selling the loan agreement. When the Portfolio purchases assignments from lenders it acquires direct rights against the borrower on the loan. At the end of the period, the Portfolio had unfunded loan commitments of $2,008,182.
Delayed-Delivery Transactions. The Portfolio may purchase or sell securities on a when-issued or delayed-delivery basis. These transactions involve a commitment by the Portfolio to purchase or sell securities for a predetermined price or yield, with payment and delivery taking place beyond the customary settlement period. When delayed-delivery purchases are outstanding, the Portfolio will designate liquid assets in an amount sufficient to meet the purchase price. When purchasing a security on a delayed-delivery basis, the Portfolio assumes the rights and risks of ownership of the security, including the risk of price and yield fluctuations, and takes such fluctuations into account when determining its net asset value. The Portfolio may dispose of or renegotiate a delayed-delivery transaction after it is entered into, and may sell when-issued securities before they are delivered, which may result in a capital gain or loss. When the Portfolio has sold a security on a delayed-delivery basis, the Portfolio does not participate in future gains and losses with respect to the security.
Federal Income Taxes. The Portfolio intends to qualify as a regulated investment company under sub-chapter M of the Internal Revenue Code and distribute all of its taxable income and net realized gains, if applicable, to shareholders. Accordingly, no provision for Federal income taxes has been made.
Foreign Currency. The accounting records of the Portfolio are maintained in U.S. dollar. The market values of foreign securities, currency holdings and other assets and liabilities are translated into U.S. dollar based on the current exchange rates each business day. Fluctuations in the value of currency holdings and other assets and liabilities resulting from changes in exchange rates are recorded as unrealized foreign currency gains or losses. Realized gains or losses and unrealized appreciation or depreciation on investment securities and income and expenses are translated on the respective dates of such transactions. The effects of changes in foreign currency exchange rates on investments in securities are not segregated in the Statement of Operations from the effects of changes in market prices of those securities, but are included with the net realized and unrealized gain or loss on investment securities.
| | | | | | |
|
| Non-U.S. currency symbols utilized throughout the report are defined as follows: |
| EUR | | Euro | | | | |
| JPY | | Japanese Yen | | | | |
Forward Currency Transactions. The Portfolio may enter into forward currency contracts in connection with settling planned purchases or sales of securities, to hedge the currency exposure associated with some or all of the Portfolio’s securities or as a part of an investment strategy. A forward currency contract is an agreement between two parties to buy and sell a currency at a set price on a future date. The market value of a forward currency contract fluctuates with changes in forward currency exchange rates. Forward currency contracts are marked to market daily and the change in value is recorded by the Portfolio as an unrealized gain or loss. Realized gains or losses equal to the difference between the value of the contract at the time it was opened and the value at the time it was closed are recorded upon delivery or receipt of the currency or, if a forward currency contract is offset by entering into another forward currency contract with the same broker, upon settlement of the net gain or loss. These contracts may involve market risk in excess of the unrealized gain or loss reflected in the Portfolio’s Statement of Assets and Liabilities. In addition, the Portfolio could be exposed to risk if the counterparties are unable to meet the terms of the contracts or if the value of the currency changes unfavorably to the U.S. dollar.
Futures Contracts. The Portfolio is authorized to enter into futures contracts. The Portfolio may use futures contracts to manage its exposure to the securities markets or to movements in interest rates and currency values. The primary risks associated with the use of futures contracts are the imperfect correlation between the change in market value of the securities held by the Portfolio and the prices of futures contracts, the possibility of an illiquid market, and the inability of the counterparty to meet the terms of the contract. Futures contracts are valued based upon their quoted daily settlement prices. Upon entering into a futures contract, the Portfolio is required to deposit with its custodian, in a segregated account in the name of the futures broker, an amount of cash or U.S. Government and Agency Obligations in accordance with the initial margin requirements of the broker or exchange. Futures contracts are marked to market daily and an appropriate payable or receivable for the change in value (“variation margin”) is recorded by the Portfolio. Gains or losses are recognized but not considered realized until the contracts expire or are closed. Futures contracts involve, to varying degrees, risk of loss in excess of the variation margin disclosed in the Statement of Assets and Liabilities.
Payment In-Kind Securities. The portfolio may invest in payment in-kind securities. Payment in-kind securities (PIKs) give the issuer the option at each interest payment date of making interest payments in either cash or additional debt securities. Those additional debt securities usually have the same term, including maturity dates and interest rates, and associated risks as the original bonds. The daily market quotations of the original bonds include the accrued
| | | | | | |
| | | Semiannual Report | | June 30, 2006 | | 15 |
Notes to Financial Statements (Cont.)
interest (referred to as a dirty price) and require a pro-rata adjustment from interest receivable to the unrealized appreciation or depreciation on investment in the Statements of Assets and Liabilities.
Options Contracts. The Portfolio may write call and put options on futures, swaps, securities or currencies it owns or in which it may invest. Writing put options tends to increase the Portfolio’s exposure to the underlying instrument. Writing call options tends to decrease the Portfolio’s exposure to the underlying instrument. When the Portfolio writes a call or put option, an amount equal to the premium received is recorded as a liability and subsequently marked to market to reflect the current value of the option written. These liabilities are reflected as written options outstanding in the Statement of Assets and Liabilities. Certain options may be written with premiums to determined on a future date. The premiums for these options are based upon implied volatility parameters at specified terms. Premiums received from writing options which expire are treated as realized gains. Premiums received from writing options which are exercised or closed are added to the proceeds or offset against amounts paid on the underlying future, swap, security or currency transaction to determine the realized gain or loss. The Portfolio as a writer of an option has no control over whether the underlying future, swap, security or currency may be sold (call) or purchased (put) and as a result bears the market risk of an unfavorable change in the price of the future, swap, security or currency underlying the written option. There is the risk the Portfolio may not be able to enter into a closing transaction because of an illiquid market.
The Portfolio may also purchase put and call options. Purchasing call options tends to increase the Portfolio’s exposure to the underlying instrument. Purchasing put options tends to decrease the Portfolio’s exposure to the underlying instrument. The Portfolio pays a premium which is included in the Portfolio’s Statement of Assets and Liabilities as an investment and subsequently marked to market to reflect the current value of the option. Premiums paid for purchasing options which expire are treated as realized losses. The risk associated with purchasing put and call options is limited to the premium paid. Certain options may be purchased with premiums to be determined on a future date. The premiums for these options are based upon implied volatility parameters at specified terms. Premiums paid for purchasing options which are exercised or closed are added to the amounts paid or offset against the proceeds on the underlying future, swap, security or currency transaction to determine the realized gain or loss.
Repurchase Agreements. The Portfolio may engage in repurchase transactions. Under the terms of a typical repurchase agreement, the Portfolio takes possession of an underlying debt obligation subject to an obligation of the seller to repurchase, and the Portfolio to resell, the obligation at an agreed-upon price and time. The market value of the collateral must be equal to or exceed at all times the total amount of the repurchase obligations, including interest. Securities purchased under repurchase agreements are reflected as an asset in the Statement of Assets and Liabilities. Generally, in the event of counterparty default, the Portfolio has the right to use the collateral to offset losses incurred. If the counterparty should default, the Portfolio will seek to sell the securities which it holds as collateral. This could involve procedural costs or delays in addition to a loss on the securities if their value should fall below their repurchase price.
Restricted Securities. The Portfolio is permitted to invest in securities that are subject to legal or contractual restrictions on resale. These securities generally may be resold in transactions exempt from registration or to the public if the securities are registered. Disposal of these securities may involve time-consuming negotiations and expenses, and prompt sale at an acceptable price may be difficult.
Swap Agreements. The Portfolio may engage in swap transactions, including, but not limited to, swap agreements on credit default to manage its exposure to interest rates and credit risk. In connection with these agreements, securities may be identified as collateral in accordance with the terms of the respective swap agreements.
Credit default swap agreements involve one party making a stream of payments to another party in exchange for the right to receive a specified return in the event of a default by a third party, typically corporate issues or sovereign issues of an emerging country, on its obligation. The Portfolio may use credit default swaps to provide a measure of protection against defaults of the issuers (i.e., to reduce risk where the Portfolio owns or has exposure to the sovereign issuer) or to take an active long or short position with respect to the likelihood of a particular issuer’s default. As a seller of protection, the Portfolio generally receives an upfront payment or a fixed rate of income throughout the term of the swap provided that there is no credit event. If the Portfolio is a seller of protection and a credit event occurs, as defined under the terms of that particular swap agreement, the Portfolio will pay to the buyer of the protection an amount up to the notional value of the swap and in certain instances take delivery of the security. As the seller, the Portfolio would effectively add leverage to its portfolio because, in addition to its total net assets, the Portfolio would be subject to investment exposure on the notional amount of the swap. As a buyer of protection, the Portfolio generally receives an amount up to the notional value of the swap if a credit event occurs. The treatment of a credit default swaps and other swap agreements that provide for contingent, non-periodic, bullet-type payments as “notional principal contracts” for federal income tax purposes is uncertain. Were the Internal Revenue Service in take the position that a credit default swap or other bullet-type swap is not a “notional principal contract” for federal income tax purposes, payments received by the Portfolio from such investments might be subject to income taxes.
Swaps are marked to market daily based upon quotations from market makers and the change in value, if any, is recorded as unrealized gain or loss in the Statement of Operations. Payments received or made at the beginning of the measurement period are reflected as such in the Statement of Assets and Liabilities. These upfront payments are recorded as realized gain or loss in the Statement of Operations upon termination or maturity of the swap. A liquidation payment received or made at the termination of the swap is recorded as realized gain or loss in the Statement of Operations. Net periodic payments received or paid by the Portfolio are included as part of realized gain or loss in the Statement of Operations. Entering into these agreements involves, to varying degrees, elements of credit, market and documentation risk in excess of the amounts recognized in the Statement of Assets and Liabilities. Such risks involve the possibility that there will be no liquid market for these agreements, that the counterparty to the agreements may default on its obligation to perform or disagree as to the meaning of contractual terms in the agreements and that there may be unfavorable changes in interest rates.
Guarantees and Indemnifications. Under the Trust’s organizational documents, each Trustee, officer, employee or other agent of the Trust (including the Trust’s investment manager) is indemnified against certain liabilities that may arise out of performance of their duties to the Portfolio. Additionally, in the normal course of business, the Portfolio enters into contracts that contain a variety of indemnification clauses. The Portfolio’s maximum exposure under these arrangements is unknown as this would involve future claims that may be made against the Portfolio that have not yet occurred. However, the Portfolio has not had prior claims or losses pursuant to these contracts, and believes the risk of loss to be remote.
New Accounting Policies. In July 2006, the Financial Accounting Standards Board issued Interpretation No. 48, “Accounting for Uncertainty in Income Taxes—an Interpretation of FASB Statement No. 109” (the “Interpretation”). The Interpretation is effective for fiscal years beginning after December 15, 2006. Management is currently evaluating the application of the Interpretation to the Portfolio and will provide additional information in relation to the Interpretation in the Portfolio’s annual financial statements for the year ending December 31, 2006.
3. FEES, EXPENSES, AND RELATED PARTY TRANSACTIONS
Investment Advisory Fee. PIMCO is a majority-owned subsidiary of Allianz Global Investors of America L.P. (“AGI”), and serves as investment adviser (the
| | | | |
| 16 | | PIMCO Variable Insurance Trust | | |
| | |
| |
| | | June 30, 2006 (Unaudited) |
“Adviser”) to the Trust, pursuant to an investment advisory contract. The Adviser receives a monthly fee at an annual rate based on average daily net assets of the Portfolio. The Advisory Fee is charged at an annual rate of 0.25%.
Administration Fee. PIMCO serves as administrator (the “Administrator”), and provides administrative services to the Trust for which it receives a monthly administrative fee based on average daily net assets of the Portfolio. As the Administrator, PIMCO bears the costs of various third-party services, including audit, custodial, portfolio accounting, legal, transfer agency and printing costs. The Administration Fee is charged at the annual rate of 0.35%.
Distribution and Servicing Fees. Allianz Global Investors Distributors LLC (“AGID”) is an indirect wholly-owned subsidiary of AGI and serves as the distributor of the Trust’s shares. The Trust is permitted to reimburse AGID on a quarterly basis, out of the Administrative Class assets of the Portfolio in the amount of 0.15% on an annual basis of the average daily net assets of that class, for payments made to financial intermediaries that provide services in connection with the distribution of shares or administration of plans or programs that use Portfolio shares as their funding medium. The effective rate paid to AGID was 0.15% during the current fiscal year.
Expenses. The Trust is responsible for the following expenses: (i) salaries and other compensation of any of the Trust’s executive officers and employees who are not officers, directors, stockholders or employees of PIMCO or its subsidiaries or affiliates; (ii) taxes and governmental fees; (iii) brokerage fees and commissions and other portfolio transaction expenses; (iv) the costs of borrowing money, including interest expenses and bank overdraft charges; (v) fees and expenses of the Trustees who are not “interested persons” of PIMCO or the Trust, and any counsel retained exclusively for their benefit; (vi) extraordinary expenses, including costs of litigation and indemnification expenses; (vii) organization expenses and (viii) any expenses allocated or allocable to a specific class of shares, which include service fees payable with respect to the Administrative Class shares and may include certain other expenses as permitted by the Trust’s Multiple Class Plan adopted pursuant to Rule 18f-3 under the Act and subject to review and approval by the Trustees. The ratio of expenses to average net assets per share class, as disclosed in the Financial Highlights, may differ from the annual portfolio operating expenses per share class as disclosed in the Prospectus for the reasons set forth above.
For the current period ended June 30, 2006, each unaffiliated Trustee received an annual retainer of $15,000, plus $2,000 for each Board of Trustees quarterly meeting attended, $500 for each Board of Trustees committee meeting attended and $500 for each special board meeting attended, plus reimbursement of related expenses. In addition, each Committee Chair received an additional annual retainer of $500 and each Audit Committee Chair received an additional annual retainer of $1,500. These expenses are allocated on a pro-rata basis to each Portfolio of the Trust according to its respective net assets. The Trust pays no compensation directly to any Trustee or any other officer who is affiliated with the Administrator, all of whom receive remuneration for their services to the Trust from the Administrator or its affiliates.
4. PURCHASES AND SALES OF SECURITIES
The length of time the Portfolio has held a particular security is not generally a consideration in investment decisions. A change in the securities held by the Portfolio is known as “portfolio turnover”. The Portfolio may engage in frequent and active trading of portfolio securities to achieve its investment objective, particularly during periods of volatile market movements. High portfolio turnover (e.g., over 100%) involves correspondingly greater expenses to the Portfolio, including brokerage commissions or dealer mark-ups and other transaction costs on the sale of securities and reinvestments in other securities. Such sales may also result in realization of taxable capital gains, including short-term capital gains (which are generally taxed at ordinary income tax rates). The trading costs and tax effects associated with portfolio turnover may adversely affect the Portfolio’s performance.
Purchases and sales of securities (excluding short-term investments) for the period ended June 30, 2006 were as follows (amounts in thousands):
| | | | | | | | | | | | | | | | |
| | U.S Government/Agency | | | | | All Other |
| | Purchases | | | | | Sales | | | | | Purchases | | | | | Sales |
| $ | 0 | | | | $ | 0 | | | | $ | 227,130 | | | | $ | 218,953 |
5. TRANSACTIONS IN WRITTEN CALL AND PUT OPTIONS
Transactions in written call and put options were as follows (amounts in thousands, except number of contracts):
| | | | | | | | | | | | | | | | | |
| | | | | # of
Contracts |
| | | |
| Notional
Amount
in $ |
| | | | | Premium | |
Balance at 12/31/2005 | | | | 707 | | | | | $ | 17,000 | | | | | $ | 285 | |
Sales | | | | 2,167 | | | | | | 1,500 | | | | | | 638 | |
Closing Buys | | | | (1,978 | ) | | | | | (18,500 | ) | | | | | (640 | ) |
Expirations | | | | 0 | | | | | | 0 | | | | | | 0 | |
Exercised | | | | 0 | | | | | | 0 | | | | | | 0 | |
Balance at 06/30/2006 | | | | 896 | | | | | $ | 0 | | | | | $ | 283 | |
6. SHARES OF BENEFICIAL INTEREST
The Portfolio may issue an unlimited number of shares of beneficial interest with a $0.001 par value. Changes in shares of beneficial interest were as follows (shares and amounts in thousands):
| | | | | | | | | | | | | | | | | | |
| | | | | Six Months Ended
06/30/2006 | | | | | Year Ended
12/31/2005 | |
| | | | | Shares | | | Amount | | | | | Shares | | | Amount | |
| | | | | | |
Receipts for shares sold | | | | | | | | | | | | | | | | | | |
Institutional Class | | | | 43 | | | $ | 360 | | | | | 42 | | | $ | 336 | |
Administrative Class | | | | 7,675 | | | | 62,810 | | | | | 20,365 | | | | 167,640 | |
Advisor Class | | | | 1 | | | | 10 | | | | | 0 | | | | 0 | |
Issued as reinvestment of distributions | | | | | | | | | | | | | | | | | | |
Institutional Class | | | | 4 | | | | 29 | | | | | 4 | | | | 37 | |
Administrative Class | | | | 2,019 | | | | 16,529 | | | | | 3,377 | | | | 27,827 | |
Advisor Class | | | | 0 | | | | 0 | | | | | 0 | | | | 0 | |
Cost of shares redeemed | | | | | | | | | | | | | | | | | | |
Institutional Class | | | | (1 | ) | | | (12 | ) | | | | (3 | ) | | | (25 | ) |
Administrative Class | | | | (9,932 | ) | | | (80,878 | ) | | | | (16,769 | ) | | | (138,029 | ) |
Advisor Class | | | | 0 | | | | 0 | | | | | 0 | | | | 0 | |
Net increase (decrease) resulting from Portfolio share transactions | | | | (191 | ) | | $ | (1,152 | ) | | | | 7,016 | | | $ | 57,786 | |
The following schedule shows the number of shareholders each owning 5% or more of the Portfolio and the total percentage of the Portfolio held by such shareholders:
| | | | | | | |
| | | | | Number of
Shareholders | | % of Portfolio
Held | |
Institutional Class | | | | 1 | | 94 | |
Administrative Class | | | | 3 | | 79 | * |
Advisor Class | | | | 1 | | 100 | |
* Allianz Life Insurance Co. of North America, an indirect wholly subsidiary of AGI and a related party to the Portfolio, owned 25% or more of the outstanding shares of beneficial interest of the Portfolio, and therefore may be presumed to “control” the Portfolio, as that term is defined in the 1940 Act.
| | | | | | |
| | | Semiannual Report | | June 30, 2006 | | 17 |
Notes to Financial Statements (Cont.)
7. FEDERAL INCOME TAX MATTERS
As of June 30, 2006, the aggregate cost of investments was the same for federal income tax and financial statement purposes. The net unrealized appreciation (depreciation) of investment securities for federal income tax purposes is as follows (amounts in thousands):
| | | | |
Aggregate
Gross
Unrealized
Appreciation | | Aggregate
Gross
Unrealized
(Depreciation) | | Net
Unrealized
(Depreciation) |
$ 5,358 | | $ (11,001) | | $ (5,643) |
8. REGULATORY AND LITIGATION MATTERS
On June 1, 2004, the Attorney General of the State of New Jersey announced that it had dismissed PIMCO from a complaint filed by the New Jersey Attorney General on February 17, 2004, and that it had entered into a settlement agreement (the “New Jersey Settlement”) with Allianz Global Investors of America L.P. (“AGI”) (formerly known as Allianz Dresdner Asset Management of America L.P.), PEA Capital LLC (an entity affiliated with PIMCO through common ownership) (“PEA”) and Allianz Global Investors Distributors LLC (“AGID”), in connection with the same matter. In the New Jersey Settlement, AGI, PEA and AGID neither admitted nor denied the allegations or conclusions of law, but did agree to pay New Jersey a civil fine of $15 million and $3 million for investigative costs and further potential enforcement initiatives against unrelated parties. They also undertook to implement certain governance changes. The complaint relating to the New Jersey Settlement alleged, among other things, that AGI, PEA and AGID had failed to disclose that they improperly allowed certain hedge funds to engage in “market timing” in certain funds. The complaint sought injunctive relief, civil monetary penalties, restitution and disgorgement of profits.
Since February 2004, PIMCO, AGI, PEA, AGID, and certain of their affiliates, including the PIMCO Funds, the Allianz Funds (formerly known as PIMCO Funds: Multi-Manager Series), and the Trustees and employees of the PIMCO Funds, have been named as defendants in fifteen lawsuits filed in various jurisdictions. Eleven of those lawsuits concern “market timing,” and they have been transferred to and consolidated for pre-trial proceedings in a multi-district litigation proceeding in the U.S. District Court for the District of Maryland; the other four lawsuits concern “revenue sharing” and have been consolidated into a single action in the U.S. District Court for the District of Connecticut. The lawsuits have been commenced as putative class actions on behalf of investors who purchased, held or redeemed shares of the various series of the PIMCO Funds and the Allianz Funds during specified periods, or as derivative actions on behalf of the PIMCO Funds and Allianz Funds.
The market timing actions in the District of Maryland generally allege that certain hedge funds were allowed to engage in “market timing” in certain of the PIMCO Funds and the Allianz Funds and this alleged activity was not disclosed. Pursuant to tolling agreements entered into with the derivative and class action plaintiffs, PIMCO, the Trustees, and certain employees of PIMCO who were previously named as defendants have all been dropped as defendants in the market timing actions; the plaintiffs continue to assert claims on behalf of the shareholders of the PIMCO Funds or on behalf of the PIMCO Funds themselves against other defendants. By order dated November 3, 2005, the U.S. District Court for the District of Maryland granted the PIMCO Funds’ motion to dismiss claims asserted against it in a consolidated amended complaint where the PIMCO Funds were named, in the complaint, as a nominal defendant. The revenue sharing action in the District of Connecticut generally alleges that fund assets were inappropriately used to pay brokers to promote PIMCO Funds and the Allianz Funds, including directing fund brokerage transactions to such brokers, and that such alleged arrangements were not fully disclosed to shareholders. On August 11, 2005 the U.S. District Court for the District of Connecticut conducted a hearing on defendants’ motion to dismiss the consolidated amended complaint in the revenue sharing action but has not yet ruled on the motion to dismiss. The market timing and revenue sharing lawsuits seek, among other things, unspecified compensatory damages plus interest and, in some cases, punitive damages, the rescission of investment advisory contracts, the return of fees paid under those contracts and restitution.
Under Section 9(a) of the Investment Company Act of 1940, as amended (“1940 Act”), if the New Jersey Settlement or any of the lawsuits described above were to result in a court injunction against AGI, PEA, AGID and/or their affiliates, PIMCO could, in the absence of exemptive relief granted by the SEC, be barred from serving as an investment adviser, and AGID could be barred from serving as principal underwriter, to any registered investment company, including the Portfolios of the Trust. In connection with an inquiry from the SEC concerning the status of the New Jersey Settlement under Section 9(a), PEA, AGID, AGI and certain of their affiliates (including PIMCO) (together, the “Applicants”) have sought exemptive relief from the SEC under Section 9(c) of the 1940 Act. The SEC has granted the Applicants a temporary exemption from the provisions of Section 9(a) with respect to the New Jersey Settlement until the earlier of (i) September 13, 2006 and (ii) the date on which the SEC takes final action on their application for a permanent order. There is no assurance that the SEC will issue a permanent order.
Two nearly identical class action civil complaints have been filed in August 2005, in the Northern District of Illinois Eastern Division alleging that the plaintiffs each purchased and sold a 10-year Treasury note futures contract and suffered damages from an alleged shortage when PIMCO held both physical and futures positions in 10-year Treasury notes for its client accounts. The two actions have been consolidated into one action, and the two separate complaints have been replaced by a consolidated complaint. PIMCO is a named defendant, and the PIMCO Funds have been added as a defendant, to the consolidated action. PIMCO strongly believes the complaint (and any consolidated complaint filed hereafter) is without merit and intends to vigorously defend itself.
Certain Portfolios of the Trust were recently served in an adversary proceeding brought by the Official Committee of Asbestos Claimants of G-I Holdings, Inc. in G-I Holdings, Inc.’s bankruptcy in the District of New Jersey. PIMCO was previously named in this lawsuit and remains a defendant. The plaintiff seeks to recover for the bankruptcy estate assets that were transferred by the predecessor entity of G-I Holdings, Inc. to a wholly-owned subsidiary in 1994. The subsidiary has since issued notes, of which certain Portfolios of the Trust are alleged to be holders. The complaint alleges that in 2000, more than two hundred noteholders—including certain Portfolios of the Trust—were granted a second priority lien on the assets of the subsidiary in exchange for their consent to a refinancing transaction and the granting of a first priority lien to the lending banks. The plaintiff is seeking invalidation of the lien in favor of the noteholders and/or the value of the lien.
It is possible that these matters and/or other developments resulting from these matters could result in increased fund redemptions or other adverse consequences to the Portfolios. However, PIMCO and AGID believe that these matters are not likely to have a material adverse effect on the Portfolios or on PIMCO’s or AGID’s ability to perform their respective investment advisory or distribution services relating to the Portfolios.
| | | | |
| 18 | | PIMCO Variable Insurance Trust | | |
Investment Adviser and Administrator
Pacific Investment Management Company LLC
840 Newport Center Drive
Newport Beach, California 92660
Distributor
Allianz Global Investors Distributors LLC
2187 Atlantic Street
Stamford, Connecticut 06902
Custodian
State Street Bank & Trust Company
801 Pennsylvania
Kansas City, Missouri 64105
Transfer Agent
Boston Financial Data Services–Midwest
330 W. 9th Street
Kansas City, Missouri 64105
Legal Counsel
Dechert LLP
1775 I Street, N.W.
Washington, D.C. 20006
Independent Registered Public Accounting Firm
PricewaterhouseCoopers LLP
1055 Broadway
Kansas City, Missouri 64105
P I M C O
Share Class Institutional
Semiannual Report June 30, 2006
PIMCO Variable Insurance Trust
High Yield Portfolio
Table of Contents
This material is authorized for use only when preceded or accompanied by the current PIMCO Variable Insurance Trust (the “Trust”) prospectus. Investors should consider the investment objectives, risks, charges and expenses of this Trust carefully before investing. Ask your financial professional to explain all charges that may apply. This and other information is contained in the Trust’s prospectus. The variable product prospectus may be obtained by contacting your Investment Consultant. Please read the Trust and variable product prospectus carefully before you invest or send money.
Chairman’s Letter
Dear PIMCO Variable Insurance Trust Shareholder:
It is our pleasure to present to you the semiannual report for the PIMCO Variable Insurance Trust covering the six-month period ended June 30, 2006.
Highlights of the global bond markets during the six-month period included:
| | n | | Most fixed-income sectors lost ground during the first half of 2006, as concern about accelerating inflation and central bank tightening pushed interest rates higher worldwide. The benchmark Lehman Brothers Aggregate Bond Index (which includes Treasury, Investment-Grade Corporate, and Residential Mortgage-Backed Securities) returned -0.72% for the first six months of the year. On June 30, the benchmark ten-year Treasury yielded 5.14%, 0.75% higher than at the start of the year. The U.S. yield curve remained flat as shorter-maturity yields rose by a comparable amount. |
| | n | | The Federal Reserve tightened four times during the reporting period, bringing the Federal Funds Rate to 5.25%. The increase near the end of the period was the Federal Reserve’s 17th consecutive rate hike since the start of its tightening cycle in 2004. The Federal Reserve was not alone, as central banks in Europe, India, and China tightened credit in unison for the first time since 2000. The Bank of Japan, whose zero-interest-rate policy has flooded global markets with liquidity, looked set to reverse this policy in the coming months. |
In these pages please find a more complete Portfolio review as it relates to financial-market activities, as well as details about total-return investment performance for the six-month reporting period. Thank you for the trust you have placed in us. We will continue to work diligently to meet your investment needs.
Sincerely,

Brent R. Harris
Chairman, PIMCO Variable Insurance Trust
July 31, 2006
| | | | | | |
| | | Semiannual Report | | June 30, 2006 | | 1 |
Important Information About the Portfolio
PIMCO Variable Insurance Trust (the “Trust”) is an open-end management investment company currently consisting of nineteen separate investment portfolios, including the High Yield Portfolio (the “Portfolio”). The Portfolio is only available as a funding vehicle under variable life insurance policies or variable annuity contracts issued by insurance companies (“Variable Contracts”). Individuals may not purchase shares of the Portfolio directly. Shares of the Portfolio also may be sold to qualified pension and retirement plans outside of the separate account context.
We believe that bond funds have an important role to play in a well diversified investment portfolio. It is important to note, however, that in an environment where interest rates may trend upward, rising rates would negatively impact the performance of most bond funds, and fixed-income securities held by a fund are likely to decrease in value. The price volatility of fixed-income securities can also increase during periods of rising interest rates resulting in increased losses to a fund. Bond funds and individual bonds with a longer duration (a measure of the expected life of a security) tend to be more sensitive to changes in interest rates, usually making them more volatile than securities or funds with shorter durations. The longer-term performance of most bond funds has benefited from capital gains in part resulting from an extended period of declining interest rates. In the event interest rates increase, these capital gains should not be expected to recur.
The Portfolio may be subject to various risks in addition to those described above. Some of these risks may include, but are not limited to, the following: credit risk, high yield risk, market risk, issuer risk, liquidity risk, derivatives risk, mortgage risk, non-U.S. investment risk, currency risk, leveraging risk and management risk. A complete description of these risks is contained in the Portfolio’s prospectus. The Portfolio may use derivative instruments for hedging purposes or as part of an investment strategy. Use of these instruments may involve certain costs and risks such as liquidity risk, interest rate risk, market risk, credit risk, management risk and the risk that the Portfolio could not close out a position when it would be most advantageous to do so. A Portfolio investing in derivatives could lose more than the principal amount invested in these instruments. Investing in non-U.S. securities may entail risk due to non-U.S. economic and political developments; this risk may be increased when investing in emerging markets.
On the performance summary page in this Semiannual Report, the Total Return Investment Performance table measures performance assuming that all dividend and capital gain distributions were reinvested.
An investment in the Portfolio is not a deposit of a bank and is not guaranteed or insured by the Federal Deposit Insurance Corporation or any other government agency. It is possible to lose money on investments in the Portfolio.
PIMCO has adopted written proxy voting policies and procedures (“Proxy Policy”) as required by Rule 206(4)-6 under the Investment Advisers Act of 1940. The Proxy Policy has been adopted by the Trust as the policies and procedures that PIMCO will use when voting proxies on behalf of the Portfolio. Copies of the written Proxy Policy and the factors that PIMCO may consider in determining how to vote proxies for the Portfolio, and information about how the Portfolio voted proxies relating to portfolio securities held during the most recent twelve-month period ended June 30, are available without charge, upon request, by calling the Trust at 1-866-746-2606 and on the Securities and Exchange Commission’s (“SEC”) website at http://www.sec.gov.
The Portfolio files its complete schedule of portfolio holdings with the SEC for the first and third quarters of each fiscal year on Form N-Q. A copy of the Trust’s Form N-Q is available on the SEC’s website at http://www.sec.gov and may be reviewed and copied at the SEC’s Public Reference Room in Washington D.C. Information on the operation of the Public Reference Room may be obtained by calling 1-800-SEC-0330.
PIMCO Variable Insurance Trust is distributed by Allianz Global Investors Distributors LLC, 2187 Atlantic Street, Stamford, CT 06902.
| | | | |
| 2 | | PIMCO Variable Insurance Trust | | |
The following disclosure provides important information regarding the Portfolio’s Expense Example (“Example” or “Expense Example”), which appears in this Semiannual Report. Please refer to this information when reviewing the Expense Example for the Portfolio.
Example
As a shareholder of the Portfolio, you incur two types of costs: (1) transaction costs and (2) ongoing costs, including advisory and administrative fees; distribution and/or service (12b-1) fees (Administrative Class only); and other Portfolio expenses. The Example is intended to help you understand your ongoing costs (in dollars) of investing in the Portfolio and to compare these costs with the ongoing costs of investing in other mutual funds. The Expense Example does not reflect any fees or other expenses imposed by the Variable Contracts. If it did, the expenses reflected in the Expense Examples would be higher. The Example is based on an investment of $1,000 invested at the beginning of the period and held for the entire period indicated, which is from January 1, 2006 to June 30, 2006.
Actual Expenses
The information in the table under the heading “Actual Performance” provides information about actual account values and actual expenses. You may use the information in these columns, together with the amount you invested, to estimate the expenses that you paid over the period. Simply divide your account value by $1,000 (for example, an $8,600 account value divided by $1,000 = 8.60), then multiply the result by the number in the appropriate column for your share class, in the row titled “Expenses Paid During Period” to estimate the expenses you paid on your account during this period.
Hypothetical Example for Comparison Purposes
The information in the table under the heading “Hypothetical Performance (5% return before expenses)” provides information about hypothetical account values and hypothetical expenses based on the Portfolio’s actual expense ratio and an assumed rate of return of 5% per year before expenses, which is not the Portfolio’s actual return. The hypothetical account values and expenses may not be used to estimate the actual ending account balance or expenses you paid for the period. You may use this information to compare the ongoing costs of investing in the Portfolio and other portfolios. To do so, compare this 5% hypothetical example with the 5% hypothetical examples that appear in the shareholder reports of the other portfolios.
Please note that the expenses shown in the table are meant to highlight your ongoing costs only and do not reflect any transactional costs. Therefore, the information under the heading “Hypothetical Performance (5% return before expenses)” is useful in comparing ongoing costs only, and will not help you determine the relative total costs of owning different portfolios. In addition, if these transactional costs were included, your costs would have been higher.
The expense ratio may vary period to period because of various factors, such as an increase in expenses not covered by the advisory and administrative fees (such as expenses of the trustees and their counsel or litigation expense).
Portfolio Benchmark
Merrill Lynch US High Yield, BB-B Rated Constrained Index tracks the performance of BB-B Rated US Dollar-denominated corporate bonds publicly issued in the US domestic market. Qualifying bonds are capitalization-weighted provided the total allocation to an individual issuer (defined by Bloomberg tickers) does not exceed 2%. Issuers that exceed the limit are reduced to 2% and the face value of each of their bonds is adjusted on a pro-rata basis.
| | | | | | |
| | | Semiannual Report | | June 30, 2006 | | 3 |
|
|
| PIMCO High Yield Portfolio |
|
Cumulative Returns Through June 30, 2006
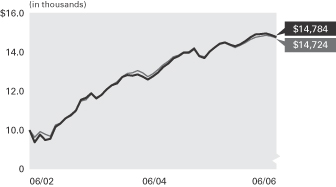
High Yield Portfolio Merrill Lynch US High Yield,
Institutional Class BB-B Rated, Constrained Index
------------------- -----------------------------
06/30/2002 $10,000 $10,000
07/31/2002 9,392 9,645
08/31/2002 9,785 9,920
09/30/2002 9,499 9,788
10/31/2002 9,570 9,698
11/30/2002 10,168 10,262
12/31/2002 10,343 10,373
01/31/2003 10,618 10,601
02/28/2003 10,774 10,725
03/31/2003 11,002 10,966
04/30/2003 11,559 11,492
05/31/2003 11,666 11,569
06/30/2003 11,894 11,864
07/31/2003 11,634 11,676
08/31/2003 11,816 11,806
09/30/2003 12,083 12,103
10/31/2003 12,296 12,323
11/30/2003 12,407 12,480
12/31/2003 12,731 12,747
01/31/2004 12,831 12,912
02/29/2004 12,788 12,940
03/31/2004 12,865 13,054
04/30/2004 12,750 12,944
05/31/2004 12,593 12,736
06/30/2004 12,757 12,898
07/31/2004 12,961 13,101
08/31/2004 13,231 13,345
09/30/2004 13,417 13,525
10/31/2004 13,686 13,763
11/30/2004 13,790 13,847
12/31/2004 13,967 14,013
01/31/2005 13,970 14,023
02/28/2005 14,174 14,214
03/31/2005 13,800 13,833
04/30/2005 13,691 13,757
05/31/2005 14,025 14,007
06/30/2005 14,243 14,228
07/31/2005 14,426 14,396
08/31/2005 14,492 14,459
09/30/2005 14,385 14,349
10/31/2005 14,307 14,236
11/30/2005 14,393 14,351
12/31/2005 14,562 14,488
01/31/2006 14,753 14,645
02/28/2006 14,901 14,767
03/31/2006 14,921 14,805
04/30/2006 14,951 14,852
05/31/2006 14,874 14,811
06/30/2006 14,784 14,724
$10,000 invested at the end of the nearest month to the inception date of the Portfolio’s Institutional Class.
Sector Breakdown‡
| | |
Corporate Bonds & Notes | | 82.3% |
Short-Term Instruments | | 7.4% |
Bank Loan Obligations | | 4.6% |
Foreign Currency-Denominated Issues | | 3.7% |
Other | | 2.0% |
| | ‡ | % of Total Investments as of June 30, 2006 |
| | | | | | | | | | |
| Average Annual Total Return for the period ended June 30, 2006 | | |
| | | | | | | 6 Months* | | 1 Year | | Since
Inception
(07/01/02)** |
| | |
| | PIMCO High Yield Portfolio Institutional Class | | 1.53% | | 3.80% | | 10.28% |
| | |
| | Merrill Lynch US High Yield, BB-B Rated, Constrained Index | | 1.62% | | 3.48% | | 10.15% |
All Portfolio returns are net of fees and expenses.
* Cumulative return.
** The Institutional Class shares commenced operations on 07/01/02. Index comparisons began on 06/30/02.
Past performance is no guarantee of future results. The performance quoted represents past performance. Investment return and principal value will fluctuate so the Portfolio shares, when redeemed, may be worth more or less than their original cost. The Portfolio’s performance does not reflect the deduction of additional charges and expenses imposed in connection with investing in Variable Contracts, which will reduce returns. Current performance may be lower or higher than the performance data quoted. Performance data current to the most recent month-end is available by calling (800) 927-4648.
| | | | | | | | |
| Expense Example | | Actual Performance | | | | Hypothetical Performance |
| | | | | | | (5% return before expenses) |
Beginning Account Value (01/01/06) | | $ | 1,000.00 | | | | $ | 1,000.00 |
Ending Account Value (06/30/06) | | $ | 1,015.30 | | | | $ | 1,021.82 |
Expenses Paid During Period† | | $ | 3.00 | | | | $ | 3.01 |
† Expenses are equal to the Portfolio’s Institutional Class annualized expense ratio of 0.60%, multiplied by the average account value over the period, multiplied by 181/365 (to reflect the one-half year period). Overall fees and expenses of investing in the Portfolio will be higher because the example does not reflect Variable Contract fees and expenses.
Please refer to page 3 herein for a description of the Portfolio’s benchmark and an explanation of the information presented in the above Expense Example.
Portfolio Insights
| » | | The PIMCO High Yield Portfolio seeks to achieve its investment objective by investing under normal circumstances at least 80% of its assets in a diversified portfolio of high-yield securities rated below investment grade but rated at least Caa (subject to a maximum of 5% of total assets in securities rated Caa) by Moody’s or S&P, or, if unrated, determined by PIMCO to be of comparable quality. |
| » | | An underweight to BB-rated bonds versus the index contributed to relative performance, as these issues underperformed B-rated bonds by about 1.50%. |
| » | | An overweight to the automotive sector helped performance as these bonds significantly outperformed the high-yield market. |
| » | | As cable/pay TV bonds outperformed the high- yield market, an overweight to the sector benefited the Portfolio. |
| » | | Security selection in the utility sector was positive as electric generation companies led the overall sector. |
| » | | As telecom bonds underperformed the market, an overweight to the sector negatively impacted the Portfolio’s performance. |
| » | | As the energy sector was among the worst performing broad market sectors in the first half of the year, an overweight to this industry category detracted from returns. |
| » | | Modest exposure to emerging market sovereign bonds, which underperformed high yield by about 3.75%, hurt performance. |
| | | | | | |
| 4 | | PIMCO Variable Insurance Trust | | | | |
|
|
| Financial Highlights High Yield Portfolio |
| | | | | | | | | | | | | | | | | | | | |
| Selected Per Share Data for the Year or Period Ended: | | 06/30/2006+ | | | 12/31/2005 | | | 12/31/2004 | | | 12/31/2003 | | | 07/01/2002 -12/31/2002 | |
| | | | | |
Institutional Class | | | | | | | | | | | | | | | | | | | | |
| Net asset value beginning of period | | $ | 8.19 | | | $ | 8.40 | | | $ | 8.19 | | | $ | 7.17 | | | $ | 7.25 | |
| Net investment income (a) | | | 0.29 | | | | 0.55 | | | | 0.53 | | | | 0.57 | | | | 0.29 | |
| Net realized/unrealized gain (loss) on investments (a) | | | (0.16 | ) | | | (0.21 | ) | | | 0.23 | | | | 1.03 | | | | (0.06 | ) |
| Total income from investment operations | | | 0.13 | | | | 0.34 | | | | 0.76 | | | | 1.60 | | | | 0.23 | |
| Dividends from net investment income | | | (0.30 | ) | | | (0.55 | ) | | | (0.55 | ) | | | (0.58 | ) | | | (0.31 | ) |
| Total distributions | | | (0.30 | ) | | | (0.55 | ) | | | (0.55 | ) | | | (0.58 | ) | | | (0.31 | ) |
| Net asset value end of period | | $ | 8.02 | | | $ | 8.19 | | | $ | 8.40 | | | $ | 8.19 | | | $ | 7.17 | |
| Total return | | | 1.53 | % | | | 4.26 | % | | | 9.71 | % | | | 23.08 | % | | | 3.43 | % |
| Net assets end of period (000s) | | $ | 1,042 | | | $ | 687 | | | $ | 343 | | | $ | 13 | | | $ | 10 | |
| Ratio of expenses to average net assets | | | 0.60 | %* | | | 0.60 | % | | | 0.60 | % | | | 0.60 | % | | | 0.60 | %*(b) |
| Ratio of net investment income to average net assets | | | 7.18 | %* | | | 6.68 | % | | | 6.51 | % | | | 7.36 | % | | | 8.59 | %* |
| Portfolio turnover rate | | | 45 | % | | | 109 | % | | | 97 | % | | | 97 | % | | | 102 | % |
+ Unaudited
* Annualized
(a) Per share amounts based on average number of shares outstanding during the period.
(b) If the investment manager had not reimbursed expenses, the ratio of expenses to average net assets would have been 0.61%.
| | | | | | |
| See Accompanying Notes | | Semiannual Report | | June 30, 2006 | | 5 |
| | |
| |
| Statement of Assets and Liabilities High Yield Portfolio | | |
| | | | |
| (Amounts in thousands, except per share amounts) | | June 30, 2006
(Unaudited) | |
| |
Assets: | | | | |
Investments, at value | | $ | 454,275 | |
Cash | | | 1,169 | |
Foreign currency, at value | | | 1,682 | |
Receivable for investments sold | | | 1,449 | |
Receivable for investments sold on delayed-delivery basis | | | 75 | |
Receivable for Portfolio shares sold | | | 5,977 | |
Interest and dividends receivable | | | 8,878 | |
Variation margin receivable | | | 53 | |
Unrealized appreciation on forward foreign currency contracts | | | 1 | |
Unrealized appreciation on swap agreements | | | 171 | |
| | | | 473,730 | |
| |
Liabilities: | | | | |
Payable for investments purchased | | $ | 4,316 | |
Payable for investments purchased on delayed-delivery basis | | | 17,885 | |
Payable for Portfolio shares redeemed | | | 118 | |
Written options outstanding | | | 73 | |
Accrued investment advisory fee | | | 100 | |
Accrued administration fee | | | 140 | |
Accrued servicing fee | | | 50 | |
Swap premiums received | | | 11 | |
Unrealized depreciation on forward foreign currency contracts | | | 288 | |
Unrealized depreciation on swap agreements | | | 44 | |
| | | | 23,025 | |
| |
Net Assets | | $ | 450,705 | |
| |
Net Assets Consist of: | | | | |
Paid in capital | | $ | 463,809 | |
(Overdistributed) net investment income | | | (507 | ) |
Accumulated undistributed net realized (loss) | | | (5,172 | ) |
Net unrealized (depreciation) | | | (7,425 | ) |
| | | $ | 450,705 | |
| |
Net Assets: | | | | |
Institutional Class | | $ | 1,042 | |
Administrative Class | | | 449,653 | |
Advisor Class | | | 10 | |
| |
Shares Issued and Outstanding: | | | | |
Institutional Class | | | 130 | |
Administrative Class | | | 56,036 | |
Advisor Class | | | 1 | |
| |
Net Asset Value and Redemption Price Per Share (Net Assets Per Share Outstanding) | | | | |
Institutional Class | | $ | 8.02 | |
Administrative Class | | | 8.02 | |
Advisor Class | | | 8.02 | |
| |
Cost of Investments Owned | | $ | 459,918 | |
Cost of Foreign Currency Held | | $ | 1,658 | |
Premiums Received on Written Options | | $ | 283 | |
| | | | |
| 6 | | PIMCO Variable Insurance Trust | | See Accompanying Notes |
| | |
| |
| Statement of Operations High Yield Portfolio | | |
| | | | |
| (Amounts in Thousands) | | Six Months Ended
June 30, 2006
(Unaudited) | |
| |
Investment Income: | | | | |
Interest, net of foreign taxes | | $ | 17,337 | |
Dividends | | | 92 | |
Miscellaneous income | | | 595 | |
Total Income | | | 18,024 | |
| |
Expenses: | | | | |
Investment advisory fees | | | 579 | |
Administration fees | | | 811 | |
Servicing fees – Administrative Class | | | 347 | |
Trustees’ fees | | | 3 | |
Interest expense | | | 3 | |
Total Expenses | | | 1,743 | |
| |
Net Investment Income | | | 16,281 | |
| |
Net Realized and Unrealized Gain (Loss): | | | | |
Net realized gain on investments | | | 1,981 | |
Net realized gain on futures contracts, options and swaps | | | 350 | |
Net realized (loss) on foreign currency transactions | | | (199 | ) |
Net change in unrealized (depreciation) on investments | | | (10,574 | ) |
Net change in unrealized (depreciation) on futures contracts, options and swaps | | | (769 | ) |
Net change in unrealized (depreciation) on translation of assets and liabilities denominated in foreign currencies | | | (282 | ) |
Net (Loss) | | | (9,493 | ) |
| |
Net Increase in Net Assets Resulting from Operations | | $ | 6,788 | |
| | | | | | |
| See Accompanying Notes | | Semiannual Report | | June 30, 2006 | | 7 |
| | |
| |
| Statements of Changes in Net Assets High Yield Portfolio | | |
| | | | | | | | |
| (Amounts in Thousands) | | Six Months Ended June 30, 2006 (Unaudited) | | | Year Ended December 31, 2005 | |
| | |
Increase (Decrease) in Net Assets from: | | | | | | | | |
| | |
Operations: | | | | | | | | |
Net investment income | | $ | 16,281 | | | $ | 27,561 | |
Net realized gain | | | 2,132 | | | | 4,638 | |
Net change in unrealized (depreciation) | | | (11,625 | ) | | | (14,899 | ) |
Net increase resulting from operations | | | 6,788 | | | | 17,300 | |
| | |
Distributions to Shareholders: | | | | | | | | |
| From net investment income | | | | | | | | |
Institutional Class | | | (29 | ) | | | (37 | ) |
Administrative Class | | | (16,515 | ) | | | (27,841 | ) |
Advisor Class | | | 0 | | | | 0 | |
| | |
Total Distributions | | | (16,544 | ) | | | (27,878 | ) |
| | |
Portfolio Share Transactions: | | | | | | | | |
| Receipts for shares sold | | | | | | | | |
Institutional Class | | | 360 | | | | 336 | |
Administrative Class | | | 62,810 | | | | 167,640 | |
Advisor Class | | | 10 | | | | 0 | |
| Issued as reinvestment of distributions | | | | | | | | |
Institutional Class | | | 29 | | | | 37 | |
Administrative Class | | | 16,529 | | | | 27,827 | |
Advisor Class | | | 0 | | | | 0 | |
| Cost of shares redeemed | | | | | | | | |
Institutional Class | | | (12 | ) | | | (25 | ) |
Administrative Class | | | (80,878 | ) | | | (138,029 | ) |
Advisor Class | | | 0 | | | | 0 | |
Net increase (decrease) resulting from Portfolio share transactions | | | (1,152 | ) | | | 57,786 | |
| | |
Total Increase (Decrease) in Net Assets | | | (10,908 | ) | | | 47,208 | |
| | |
Net Assets: | | | | | | | | |
Beginning of period | | | 461,613 | | | | 414,405 | |
End of period* | | $ | 450,705 | | | $ | 461,613 | |
| | |
*Including (overdistributed) net investment income of: | | $ | (507 | ) | | $ | (244 | ) |
| | | | |
| 8 | | PIMCO Variable Insurance Trust | | See Accompanying Notes |
| | |
| |
| Schedule of Investments High Yield Portfolio | | June 30, 2006 (Unaudited) |
| | | | | | | | |
| | | | | PRINCIPAL | | | | |
| | | | | AMOUNT | | | | VALUE |
| | | | | (000S) | | | | (000S) |
| | | | | | | | | |
| BANK LOAN OBLIGATIONS 4.7% |
| Amadeus Global Travel Distribution S.A. | | |
7.856% due 04/08/2013 | | $ | | 700 | | $ | | 708 |
8.356% due 04/08/2014 | | | | 700 | | | | 711 |
|
| Cablevision Systems Corp. | | | | | | | | |
6.740% due 02/24/2013 | | | | 571 | | | | 569 |
6.861% due 02/24/2013 | | | | 5 | | | | 5 |
|
| Centennial Cellular Operating Co. LLC | | |
7.230% due 01/20/2011 | | | | 22 | | | | 22 |
7.318% due 01/20/2011 | | | | 91 | | | | 91 |
7.749% due 01/20/2011 | | | | 300 | | | | 301 |
|
| Centennial Communications | | | | | | | | |
4.000% due 02/09/2011 | | | | 38 | | | | 38 |
7.749% due 02/09/2011 | | | | 375 | | | | 377 |
|
| Charter Communications Operating LLC | | |
5.000% due 04/25/2013 | | | | 1,500 | | | | 1,505 |
|
| CSC Holdings, Inc. | | | | | | | | |
6.580% due 02/24/2013 | | | | 571 | | | | 569 |
6.988% due 02/24/2013 | | | | 852 | | | | 849 |
|
| El Paso Corp. | | | | | | | | |
7.750% due 11/22/2009 | | | | 970 | | | | 977 |
|
| Georgia-Pacific Corp. | | | | | | | | |
7.880% due 12/23/2013 | | | | 222 | | | | 224 |
7.920% due 12/23/2013 | | | | 444 | | | | 449 |
7.957% due 12/23/2013 | | | | 444 | | | | 449 |
8.029% due 12/23/2013 | | | | 444 | | | | 449 |
8.086% due 12/23/2013 | | | | 444 | | | | 449 |
|
| Headwaters, Inc. | | | | | | | | |
6.766% due 04/30/2011 | | | | 1,348 | | | | 1,353 |
|
| HealthSouth Corp. | | | | | | | | |
8.150% due 02/02/2013 | | | | 1,900 | | | | 1,902 |
|
| Ineos Group Holdings PLC | | | | | | | | |
2.275% due 10/07/2012 | | | | 1,200 | | | | 1,205 |
|
| Intelsat Ltd. | | | | | | | | |
5.000% due 04/24/2016 | | | | 1,000 | | | | 1,002 |
|
| Invensys PLC | | | | | | | | |
7.791% due 09/05/2009 | | | | 126 | | | | 127 |
9.431% due 12/30/2009 | | | | 900 | | | | 911 |
|
| JSG Packaging | | | | | | | | |
7.397% due 11/29/2013 | | | | 650 | | | | 649 |
7.897% due 11/29/2014 | | | | 650 | | | | 649 |
|
| Nortel Networks Inc. | | | | | | | | |
8.375% due 02/15/2007 | | | | 1,250 | | | | 1,249 |
|
| Reliant Resources, Inc. | | | | | | | | |
7.175% due 12/22/2010 | | | | 181 | | | | 181 |
|
| Roundy’s Supermarket, Inc. | | | | | | | | |
7.870% due 11/01/2011 | | | | 495 | | | | 499 |
8.170% due 11/01/2011 | | | | 500 | | | | 504 |
4.000% due 11/03/2011 | | | | 3 | | | | 3 |
|
| Service Corp. International | | | | | | | | |
5.000% due 04/02/2016 | | | | 2,000 | | | | 2,008 |
| | | | | | | | |
|
Total Bank Loan Obligations
(Cost $20,962) | | 20,984 |
| | | | | | | | |
|
| |
| CORPORATE BONDS & NOTES 82.9% |
| |
| BANKING & FINANCE 11.6% |
| AES Ironwood LLC | | | | | | | | |
8.857% due 11/30/2025 | | | | 2,493 | | | | 2,705 |
|
| AES Red Oak LLC | | | | | | | | |
8.540% due 11/30/2019 | | | | 1,229 | | | | 1,303 |
| | | | | | | | |
| BCP Crystal U.S. Holdings Corp. | | | | |
9.625% due 06/15/2014 | | $ | | 3,317 | | $ | | 3,616 |
|
| Bluewater Finance Ltd. | | | | | | | | |
10.250% due 02/15/2012 | | | | 2,200 | | | | 2,238 |
|
| Bombardier Capital, Inc. | | | | |
7.090% due 03/30/2007 (i) | | | | 1,000 | | | | 1,005 |
|
| Corsair Netherlands BV | | | | |
11.121% due 03/07/2016 | | | | 1,400 | | | | 1,408 |
|
| Deutsche Bank AG | | | | |
1.800% due 05/29/2009 | | | | 400 | | | | 409 |
|
| Eircom Funding | | | | |
8.250% due 08/15/2013 | | | | 800 | | | | 852 |
|
| Ferrellgas Escrow LLC | | | | |
6.750% due 05/01/2014 | | | | 2,100 | | | | 2,000 |
|
| Ford Motor Credit Co. | | | | |
7.875% due 06/15/2010 | | | | 500 | | | | 462 |
8.625% due 11/01/2010 | | | | 260 | | | | 244 |
7.375% due 02/01/2011 | | | | 10,190 | | | | 9,133 |
|
| Forest City Enterprises, Inc. | | | | |
7.625% due 06/01/2015 | | | | 425 | | | | 430 |
|
| General Motors Acceptance Corp. | | | | |
7.250% due 03/02/2011 | | | | 2,000 | | | | 1,941 |
6.000% due 04/01/2011 | | | | 1,194 | | | | 1,087 |
7.000% due 02/01/2012 | | | | 500 | | | | 475 |
6.875% due 08/28/2012 | | | | 1,500 | | | | 1,415 |
8.000% due 11/01/2031 | | | | 1,975 | | | | 1,903 |
|
| IXIS Financial Products, Inc. | | | | |
0.800% due 06/15/2009 | | | | 350 | | | | 344 |
1.650% due 06/15/2009 | | | | 325 | | | | 325 |
1.875% due 06/15/2009 | | | | 350 | | | | 335 |
|
| K&F Acquisition, Inc. | | | | |
7.750% due 11/15/2014 | | | | 1,000 | | | | 990 |
|
| KRATON Polymers LLC | | | | |
8.125% due 01/15/2014 | | | | 1,700 | | | | 1,696 |
|
| Merrill Lynch & Co, Inc. | | | | |
2.300% due 06/22/2009 | | | | 325 | | | | 323 |
|
| Mirage Resorts, Inc. | | | | |
7.250% due 08/01/2017 | | | | 2,600 | | | | 2,502 |
|
| Rotech Healthcare, Inc. | | | | |
9.500% due 04/01/2012 | | | | 3,575 | | | | 2,994 |
|
| Tenneco, Inc. | | | | |
10.250% due 07/15/2013 | | | | 2,600 | | | | 2,863 |
8.625% due 11/15/2014 | | | | 975 | | | | 977 |
|
| TRAINS | | | | |
7.341% due 05/01/2016 | | | | 1,125 | | | | 1,104 |
|
| Universal City Development Partners | | | | |
11.750% due 04/01/2010 | | | | 800 | | | | 875 |
|
| Universal City Florida Holding Co. I | | | | |
8.375% due 05/01/2010 | | | | 1,425 | | | | 1,439 |
9.899% due 05/01/2010 | | | | 175 | | | | 182 |
|
| Ventas Realty LP | | | | |
9.000% due 05/01/2012 | | | | 500 | | | | 550 |
7.125% due 06/01/2015 | | | | 1,000 | | | | 1,005 |
|
| Wind Acquisition Finance S.A. | | | | |
10.750% due 12/01/2015 | | | | 1,000 | | | | 1,067 |
| | | | | | | | |
|
| | | | | | | | | 52,197 |
| | | | | | | | |
|
| |
| INDUSTRIALS 56.4% |
| Abitibi-Consolidated Co. of Canada | | | | |
8.375% due 04/01/2015 | | | | 1,475 | | | | 1,353 |
| | | | | | | | |
| Abitibi-Consolidated, Inc. | | | | | | | | |
8.550% due 08/01/2010 | | $ | | 1,850 | | $ | | 1,762 |
7.750% due 06/15/2011 | | | | 365 | | | | 337 |
7.400% due 04/01/2018 | | | | 400 | | | | 334 |
8.850% due 08/01/2030 | | | | 1,953 | | | | 1,660 |
|
| Alliance One International, Inc. | | | | |
11.000% due 05/15/2012 | | | | 650 | | | | 621 |
|
| Allied Waste North America, Inc. | | | | |
7.875% due 04/15/2013 | | | | 1,625 | | | | 1,633 |
7.250% due 03/15/2015 | | | | 4,600 | | | | 4,416 |
7.125% due 05/15/2016 | | | | 425 | | | | 403 |
|
| AmeriGas Partners LP | | | | | | | | |
7.250% due 05/20/2015 | | | | 1,850 | | | | 1,757 |
7.125% due 05/20/2016 | | | | 2,650 | | | | 2,498 |
|
| Arco Chemical Co. | | | | | | | | |
10.250% due 11/01/2010 | | | | 50 | | | | 55 |
|
| Armor Holdings, Inc. | | | | | | | | |
8.250% due 08/15/2013 | | | | 800 | | | | 832 |
|
| ArvinMeritor, Inc. | | | | | | | | |
8.750% due 03/01/2012 | | | | 3,225 | | | | 3,160 |
|
| Aviall, Inc. | | | | | | | | |
7.625% due 07/01/2011 | | | | 650 | | | | 681 |
|
| Bowater Canada Finance | | | | | | | | |
7.950% due 11/15/2011 | | | | 2,350 | | | | 2,244 |
|
| Bowater, Inc. | | | | | | | | |
6.500% due 06/15/2013 | | | | 300 | | | | 262 |
|
| Boyd Gaming Corp. | | | | | | | | |
7.125% due 02/01/2016 | | | | 4,000 | | | | 3,885 |
|
| Buhrmann US, Inc. | | | | | | | | |
8.250% due 07/01/2014 | | | | 1,000 | | | | 1,000 |
7.875% due 03/01/2015 | | | | 1,300 | | | | 1,290 |
|
| CanWest Media, Inc. | | | | | | | | |
8.000% due 09/15/2012 | | | | 1,520 | | | | 1,512 |
|
| Cascades, Inc. | | | | | | | | |
7.250% due 02/15/2013 | | | | 750 | | | | 697 |
|
| CCO Holdings LLC | | | | | | | | |
8.750% due 11/15/2013 | | | | 4,400 | | | | 4,312 |
|
| Celestica, Inc. | | | | | | | | |
7.625% due 07/01/2013 | | | | 950 | | | | 926 |
|
| Chart Industries, Inc. | | | | | | | | |
9.125% due 10/15/2015 | | | | 425 | | | | 436 |
|
| Charter Communications Operating LLC | | |
8.375% due 04/30/2014 | | | | 1,750 | | | | 1,761 |
|
| Chesapeake Energy Corp. | | | | | | | | |
7.625% due 07/15/2013 | | | | 800 | | | | 809 |
7.000% due 08/15/2014 | | | | 1,000 | | | | 972 |
6.375% due 06/15/2015 | | | | 1,695 | | | | 1,581 |
6.875% due 01/15/2016 | | | | 1,200 | | | | 1,140 |
|
| Choctaw Resort Development Enterprise | | |
7.250% due 11/15/2019 | | | | 1,400 | | | | 1,379 |
|
| Colorado Interstate Gas Co. | | | | | | | | |
6.850% due 06/15/2037 | | | | 200 | | | | 202 |
|
| Continental Airlines, Inc. | | | | | | | | |
6.920% due 04/02/2013 (i) | | | | 802 | | | | 808 |
7.373% due 12/15/2015 | | | | 273 | | | | 260 |
|
| Cooper-Standard Automotive, Inc. | | |
7.000% due 12/15/2012 | | | | 1,200 | | | | 1,080 |
|
| Corrections Corp. of America | | | | | | | | |
6.750% due 01/31/2014 | | | | 200 | | | | 193 |
| | | | | | |
| See Accompanying Notes | | Semiannual Report | | June 30, 2006 | | 9 |
| | |
| |
| Schedule of Investments High Yield Portfolio (Cont.) | | |
| | | | | | | | |
| | | | | PRINCIPAL | | | | |
| | | | | AMOUNT | | | | VALUE |
| | | | | (000S) | | | | (000S) |
| | | | | | | | | |
| Crown Americas LLC & Crown Americas Capital Corp. |
7.625% due 11/15/2013 | | $ | | 425 | | $ | | 420 |
7.750% due 11/15/2015 | | | | 1,400 | | | | 1,386 |
|
| CSC Holdings, Inc. | | | | | | | | |
8.125% due 08/15/2009 | | | | 1,500 | | | | 1,534 |
7.625% due 04/01/2011 | | | | 4,625 | | | | 4,648 |
|
| DaVita, Inc. | | | | | | | | |
7.250% due 03/15/2015 | | | | 2,850 | | | | 2,750 |
|
| Delhaize America, Inc. | | | | | | | | |
9.000% due 04/15/2031 | | | | 2,975 | | | | 3,277 |
|
| Delta Air Lines, Inc. | | | | | | | | |
7.379% due 05/18/2010 | | | | 211 | | | | 212 |
7.570% due 11/18/2010 | | | | 975 | | | | 979 |
|
| Dex Media West LLC | | | | | | | | |
9.875% due 08/15/2013 | | | | 2,200 | | | | 2,395 |
|
| DirecTV Holdings LLC | | | | | | | | |
8.375% due 03/15/2013 | | | | 1,184 | | | | 1,246 |
6.375% due 06/15/2015 | | | | 925 | | | | 858 |
|
| Dresser, Inc. | | | | | | | | |
9.375% due 04/15/2011 | | | | 3,350 | | | | 3,409 |
|
| Dresser-Rand Group, Inc. | | | | | | | | |
7.375% due 11/01/2014 | | | | 396 | | | | 380 |
|
| DRS Technologies, Inc. | | | | | | | | |
7.625% due 02/01/2018 | | | | 1,000 | | | | 1,000 |
|
| EchoStar DBS Corp. | | | | | | | | |
6.375% due 10/01/2011 | | | | 1,000 | | | | 960 |
6.625% due 10/01/2014 | | | | 2,975 | | | | 2,804 |
7.125% due 02/01/2016 | | | | 2,500 | | | | 2,419 |
|
| El Paso Corp. | | | | | | | | |
10.750% due 10/01/2010 | | | | 1,500 | | | | 1,642 |
9.625% due 05/15/2012 | | | | 200 | | | | 219 |
7.875% due 06/15/2012 | | | | 4,155 | | | | 4,248 |
8.050% due 10/15/2030 | | | | 1,300 | | | | 1,310 |
7.800% due 08/01/2031 | | | | 700 | | | | 683 |
7.750% due 01/15/2032 | | | | 1,200 | | | | 1,174 |
|
| El Paso Production Holding Co. | | |
7.750% due 06/01/2013 | | | | 2,250 | | | | 2,278 |
|
| Encore Acquisition Co. | | | | | | | | |
6.250% due 04/15/2014 | | | | 300 | | | | 277 |
7.250% due 12/01/2017 | | | | 1,075 | | | | 1,037 |
|
| Equistar Chemicals LP | | | | | | | | |
10.125% due 09/01/2008 | | | | 45 | | | | 48 |
8.750% due 02/15/2009 | | | | 2,035 | | | | 2,111 |
|
| Extendicare Health Services, Inc. | | |
9.500% due 07/01/2010 | | | | 800 | | | | 839 |
|
| Ferrellgas Partners LP | | | | | | | | |
8.870% due 08/01/2009 (i) | | | | 1,200 | | | | 1,242 |
8.750% due 06/15/2012 | | | | 1,525 | | | | 1,555 |
|
| Fisher Communications, Inc. | | | | | | | | |
8.625% due 09/15/2014 | | | | 1,000 | | | | 1,040 |
|
| Ford Motor Co. | | | | | | | | |
7.450% due 07/16/2031 | | | | 2,000 | | | | 1,455 |
|
| Fresenius Medical Care Capital Trust |
7.875% due 06/15/2011 | | | | 2,250 | | | | 2,284 |
|
| Gaylord Entertainment Co. | | | | | | | | |
8.000% due 11/15/2013 | | | | 1,000 | | | | 1,004 |
|
| General Motors Corp. | | | | | | | | |
8.250% due 07/15/2023 | | | | 2,200 | | | | 1,743 |
| | | | | | | | |
| Georgia-Pacific Corp. | | | | | | | | |
8.000% due 01/15/2024 | | $ | | 775 | | $ | | 736 |
7.375% due 12/01/2025 | | | | 5,710 | | | | 5,196 |
|
| Greif, Inc. | | | | | | | | |
8.875% due 08/01/2012 | | | | 400 | | | | 423 |
|
| Grupo Transportacion Ferroviaria Mexicana S.A. de C.V. |
9.375% due 05/01/2012 | | | | 700 | | | | 749 |
|
| Hanover Compressor Co. | | | | | | | | |
9.000% due 06/01/2014 | | | | 500 | | | | 525 |
|
| HCA, Inc. | | | | | | | | |
6.950% due 05/01/2012 | | | | 1,550 | | | | 1,521 |
6.750% due 07/15/2013 | | | | 2,675 | | | | 2,568 |
7.190% due 11/15/2015 | | | | 200 | | | | 194 |
7.500% due 12/15/2023 | | | | 400 | | | | 373 |
|
| Herbst Gaming, Inc. | | | | | | | | |
7.000% due 11/15/2014 | | | | 1,000 | | | | 955 |
|
| Hertz Corp. | | | | | | | | |
8.875% due 01/01/2014 | | | | 1,925 | | | | 1,983 |
|
| Horizon Lines LLC | | | | | | | | |
9.000% due 11/01/2012 | | | | 2,016 | | | | 2,056 |
|
| Host Marriott LP | | | | | | | | |
7.000% due 08/15/2012 | | | | 100 | | | | 100 |
7.125% due 11/01/2013 | | | | 2,780 | | | | 2,783 |
|
| Ineos Group Holdings Plc | | | | | | | | |
8.500% due 02/15/2016 | | | | 1,325 | | | | 1,247 |
|
| Ingles Markets, Inc. | | | | | | | | |
8.875% due 12/01/2011 | | | | 1,450 | | | | 1,524 |
|
| Intelsat Bermuda Ltd. | | | | | | | | |
8.250% due 01/15/2013 | | | | 75 | | | | 75 |
9.250% due 06/15/2016 | | | | 1,275 | | | | 1,323 |
|
| Intelsat Subsidiary Holding Co. Ltd. | | |
9.614% due 01/15/2012 | | | | 1,000 | | | | 1,015 |
8.250% due 01/15/2013 | | | | 325 | | | | 324 |
8.625% due 01/15/2015 | | | | 2,700 | | | | 2,720 |
|
| Invensys PLC | | | | | | | | |
9.875% due 03/15/2011 | | | | 1,150 | | | | 1,253 |
|
| Jefferson Smurfit Corp. U.S. | | | | | | | | |
8.250% due 10/01/2012 | | | | 750 | | | | 707 |
7.500% due 06/01/2013 | | | | 775 | | | | 697 |
|
| JET Equipment Trust | | | | | | | | |
10.000% due 06/15/2012 (b) | | | | 653 | | | | 634 |
7.630% due 08/15/2012 (b) | | | | 352 | | | | 274 |
|
| JSG Funding PLC | | | | | | | | |
9.625% due 10/01/2012 | | | | 3,815 | | | | 3,949 |
|
| L-3 Communications Corp. | | | | | | | | |
7.625% due 06/15/2012 | | | | 500 | | | | 510 |
6.375% due 10/15/2015 | | | | 900 | | | | 864 |
|
| Legrand France | | | | | | | | |
8.500% due 02/15/2025 | | | | 475 | | | | 545 |
|
| Mandalay Resort Group | | | | | | | | |
9.375% due 02/15/2010 | | | | 2,300 | | | | 2,432 |
|
| Mediacom Broadband LLC | | | | | | | | |
11.000% due 07/15/2013 | | | | 2,940 | | | | 3,113 |
|
| MGM Mirage | | | | | | | | |
8.500% due 09/15/2010 | | | | 400 | | | | 417 |
8.375% due 02/01/2011 | | | | 825 | | | | 850 |
6.750% due 04/01/2013 | | | | 775 | | | | 743 |
6.625% due 07/15/2015 | | | | 2,100 | | | | 1,969 |
| | | | | | | | |
| Nalco Co. | | | | | | | | |
7.750% due 11/15/2011 | | $ | | 1,800 | | $ | | 1,805 |
8.875% due 11/15/2013 | | | | 700 | | | | 709 |
|
| New Skies Satellites NV | | | | | | | | |
9.125% due 11/01/2012 | | | | 825 | | | | 877 |
|
| Newfield Exploration Co. | | | | | | | | |
6.625% due 04/15/2016 | | | | 800 | | | | 758 |
|
| Newpark Resources | | | | | | | | |
8.625% due 12/15/2007 | | | | 1,390 | | | | 1,393 |
|
| Norampac, Inc. | | | | | | | | |
6.750% due 06/01/2013 | | | | 1,050 | | | | 950 |
|
| Nordic Telephone Co. Holdings ApS | | |
8.875% due 05/01/2016 | | | | 1,000 | | | | 1,033 |
|
| Nortel Networks Ltd. | | | | | | | | |
10.125% due 07/15/2013 | | | | 800 | | | | 818 |
10.750% due 07/15/2016 | | | | 475 | | | | 486 |
|
| Northwest Pipeline Corp. | | | | | | | | |
7.125% due 12/01/2025 | | | | 500 | | | | 483 |
|
| Novelis, Inc. |
7.250% due 02/15/2015 | | | | 1,200 | | | | 1,158 |
|
| Owens Brockway Glass Container, Inc. |
6.750% due 12/01/2014 | | | | 3,175 | | | | 2,961 |
|
| Peabody Energy Corp. | | | | | | | | |
6.875% due 03/15/2013 | | | | 2,041 | | | | 2,015 |
|
| Plains Exploration & Production Co. |
7.125% due 06/15/2014 | | | | 1,625 | | | | 1,609 |
|
| Pogo Producing Co. | | | | | | | | |
7.875% due 05/01/2013 | | | | 800 | | | | 806 |
|
| PQ Corp. | | | | | | | | |
7.500% due 02/15/2013 | | | | 2,225 | | | | 2,103 |
|
| Premier Entertainment Biloxi LLC |
10.750% due 02/01/2012 | | | | 750 | | | | 778 |
|
| Primedia, Inc. | | | | | | | | |
8.875% due 05/15/2011 | | | | 275 | | | | 265 |
8.000% due 05/15/2013 | | | | 400 | | | | 360 |
|
| Quiksilver, Inc. | | | | | | | | |
6.875% due 04/15/2015 | | | | 2,600 | | | | 2,431 |
|
| Qwest Communications International, Inc. |
7.250% due 02/15/2011 | | | | 5,125 | | | | 4,997 |
7.500% due 02/15/2014 | | | | 8,275 | | | | 8,110 |
|
| Reynolds American, Inc. | | | | | | | | |
7.250% due 06/01/2012 | | | | 925 | | | | 911 |
7.250% due 06/01/2013 | | | | 1,450 | | | | 1,425 |
7.625% due 06/01/2016 | | | | 925 | | | | 909 |
|
| RH Donnelley Corp. | | | | | | | | |
6.875% due 01/15/2013 | | | | 250 | | | | 231 |
8.875% due 01/15/2016 | | | | 1,350 | | | | 1,369 |
|
| Rhodia S.A. | | | | | | | | |
7.625% due 06/01/2010 | | | | 750 | | | | 746 |
|
| Rockwood Specialties Group, Inc. |
7.500% due 11/15/2014 | | | | 600 | | | | 591 |
|
| Rogers Cable, Inc. | | | | | | | | |
6.750% due 03/15/2015 | | | | 1,560 | | | | 1,494 |
8.750% due 05/01/2032 | | | | 800 | | | | 866 |
|
| Roseton | | | | | | | | |
7.270% due 11/08/2010 | | | | 2,275 | | | | 2,276 |
7.670% due 11/08/2016 | | | | 2,325 | | | | 2,321 |
|
| Russell Corp. | | | | | | | | |
9.250% due 05/01/2010 | | | | 550 | | | | 578 |
| | | | |
| 10 | | PIMCO Variable Insurance Trust | | See Accompanying Notes |
| | |
| |
| | | June 30, 2006 (Unaudited) |
| | | | | | | | |
| | | | | PRINCIPAL | | | | |
| | | | | AMOUNT | | | | VALUE |
| | | | | (000S) | | | | (000S) |
| | | | | | | | | |
| Sanmina-SCI Corp. | | | | | | | | |
8.125% due 03/01/2016 | | $ | | 1,175 | | $ | | 1,152 |
|
| SemGroup LP | | | | | | | | |
8.750% due 11/15/2015 | | | | 1,000 | | | | 1,000 |
|
| Seneca Gaming Corp. | | | | | | | | |
7.250% due 05/01/2012 | | | | 1,900 | | | | 1,850 |
|
| Sensata Technologies BV | | | | | | | | |
8.000% due 05/01/2014 | | | | 2,500 | | | | 2,425 |
|
| Smurfit Capital Funding PLC |
7.500% due 11/20/2025 | | | | 500 | | | | 458 |
|
| Smurfit-Stone Container Enterprises, Inc. |
9.750% due 02/01/2011 | | | | 430 | | | | 444 |
8.375% due 07/01/2012 | | | | 2,545 | | | | 2,418 |
|
| Solectron Global Finance Ltd. | | | | |
8.000% due 03/15/2016 | | | | 1,300 | | | | 1,287 |
|
| Sonat, Inc. | | | | | | | | |
7.000% due 02/01/2018 | | | | 500 | | | | 468 |
|
| Station Casinos, Inc. | | | | | | | | |
6.500% due 02/01/2014 | | | | 1,200 | | | | 1,122 |
6.875% due 03/01/2016 | | | | 2,500 | | | | 2,344 |
|
| Suburban Propane Partners LP |
6.875% due 12/15/2013 | | | | 2,750 | | | | 2,585 |
|
| Sungard Data Systems, Inc. | | | | | | | | |
9.125% due 08/15/2013 | | | | 3,050 | | | | 3,180 |
|
| Superior Essex Communications LLC |
9.000% due 04/15/2012 | | | | 500 | | | | 510 |
|
| Tenet Healthcare Corp. | | | | | | | | |
7.375% due 02/01/2013 | | | | 3,125 | | | | 2,867 |
|
| Triad Hospitals, Inc. | | | | | | | | |
7.000% due 11/15/2013 | | | | 2,275 | | | | 2,224 |
|
| Trinity Industries, Inc. | | | | | | | | |
6.500% due 03/15/2014 | | | | 780 | | | | 764 |
|
| TRW Automotive, Inc. | | | | | | | | |
9.375% due 02/15/2013 | | | | 2,025 | | | | 2,162 |
|
| United Airlines, Inc. | | | | | | | | |
6.201% due 09/01/2008 | | | | 177 | | | | 177 |
6.602% due 09/01/2013 | | | | 396 | | | | 398 |
|
| Unity Media GmbH | | | | | | | | |
10.375% due 02/15/2015 | | | | 750 | | | | 720 |
|
| US Airways Inc. | | | | | | | | |
9.330% due 01/01/2024 (b) | | | | 84 | | | | 1 |
9.625% due 09/01/2024 (b) | | | | 1,016 | | | | 4 |
|
| Valero Energy Corp. | | | | | | | | |
7.800% due 06/14/2010 | | | | 850 | | | | 855 |
|
| VWR International, Inc. | | | | | | | | |
6.875% due 04/15/2012 | | | | 460 | | | | 442 |
8.000% due 04/15/2014 | | | | 3,190 | | | | 3,114 |
|
| Williams Cos., Inc. | | | | | | | | |
7.625% due 07/15/2019 | | | | 3,950 | | | | 4,029 |
7.875% due 09/01/2021 | | | | 3,075 | | | | 3,137 |
7.750% due 06/15/2031 | | | | 650 | | | | 644 |
|
| Windstream Corp. | | | | | | | | |
8.625% due 08/01/2016 | | | | 1,050 | | | | 1,079 |
|
| Wynn Las Vegas LLC | | | | | | | | |
6.625% due 12/01/2014 | | | | 6,900 | | | | 6,538 |
|
| Xerox Corp. | | | | | | | | |
7.200% due 04/01/2016 | | | | 1,025 | | | | 1,033 |
| | | | | | | | |
|
| | | | | | | | | 254,517 |
| | | | | | | | |
|
| |
| | | | | | | | |
| UTILITIES 14.9% | | | | | | | | |
| AES Corp. | | | | | | | | |
8.750% due 05/15/2013 | | $ | | 2,825 | | $ | | 3,037 |
|
| American Cellular Corp. | | | | | | | | |
10.000% due 08/01/2011 | | | | 1,350 | | | | 1,428 |
|
| Cincinnati Bell, Inc. | | | | | | | | |
7.250% due 07/15/2013 | | | | 3,425 | | | | 3,391 |
8.375% due 01/15/2014 | | | | 1,970 | | | | 1,950 |
|
| Citizens Communications Co. | | | | | | | | |
7.000% due 11/01/2025 | | | | 75 | | | | 62 |
9.000% due 08/15/2031 | | | | 2,025 | | | | 2,060 |
7.450% due 07/01/2035 | | | | 250 | | | | 213 |
|
| CMS Energy Corp. | | | | | | | | |
7.500% due 01/15/2009 | | | | 375 | | | | 382 |
7.750% due 08/01/2010 | | | | 600 | | | | 612 |
8.500% due 04/15/2011 | | | | 1,000 | | | | 1,048 |
6.300% due 02/01/2012 | | | | 300 | | | | 285 |
|
| Edison Mission Energy | | | | | | | | |
7.500% due 06/15/2013 | | | | 750 | | | | 739 |
7.750% due 06/15/2016 | | | | 750 | | | | 741 |
|
| Hawaiian Telcom Communications, Inc. |
9.750% due 05/01/2013 | | | | 1,500 | | | | 1,534 |
10.789% due 05/01/2013 | | | | 500 | | | | 508 |
|
| Homer City Funding LLC | | | | | | | | |
8.734% due 10/01/2026 | | | | 983 | | | | 1,096 |
|
| IPALCO Enterprises, Inc. | | | | | | | | |
8.375% due 11/14/2008 | | | | 1,050 | | | | 1,084 |
8.625% due 11/14/2011 | | | | 490 | | | | 522 |
|
| Midwest Generation LLC | | | | | | | | |
8.560% due 01/02/2016 | | | | 4,784 | | | | 5,026 |
8.750% due 05/01/2034 | | | | 1,550 | | | | 1,651 |
|
| Mobile Telesystems Finance S.A. |
8.375% due 10/14/2010 | | | | 500 | | | | 502 |
8.000% due 01/28/2012 | | | | 450 | | | | 440 |
|
| MSW Energy Holdings II LLC | | | | | | | | |
7.375% due 09/01/2010 | | | | 650 | | | | 653 |
|
| MSW Energy Holdings LLC | | | | | | | | |
8.500% due 09/01/2010 | | | | 500 | | | | 518 |
|
| Northwestern Bell Telephone | | | | |
7.750% due 05/01/2030 | | | | 1,208 | | | | 1,154 |
|
| NRG Energy, Inc. | | | | | | | | |
7.250% due 02/01/2014 | | | | 2,775 | | | | 2,713 |
7.375% due 02/01/2016 | | | | 4,000 | | | | 3,910 |
|
| PSEG Energy Holdings LLC | | | | | | | | |
8.500% due 06/15/2011 | | | | 4,250 | | | | 4,484 |
|
| Qwest Capital Funding, Inc. | | | | | | | | |
7.900% due 08/15/2010 | | | | 1,650 | | | | 1,650 |
7.250% due 02/15/2011 | | | | 300 | | | | 293 |
|
| Qwest Corp. | | | | | | | | |
8.875% due 03/15/2012 | | | | 2,625 | | | | 2,783 |
7.500% due 06/15/2023 | | | | 1,000 | | | | 943 |
7.200% due 11/10/2026 | | | | 700 | | | | 642 |
|
| Reliant Energy, Inc. | | | | | | | | |
9.250% due 07/15/2010 | | | | 1,975 | | | | 1,985 |
6.750% due 12/15/2014 | | | | 3,075 | | | | 2,844 |
|
| Rogers Wireless, Inc. | | | | | | | | |
7.250% due 12/15/2012 | | | | 150 | | | | 152 |
8.000% due 12/15/2012 | | | | 520 | | | | 534 |
7.500% due 03/15/2015 | | | | 2,195 | | | | 2,228 |
|
| Rural Cellular Corp. | | | | | | | | |
9.875% due 02/01/2010 | | | | 1,275 | | | | 1,318 |
| | | | | | | | |
| Sierra Pacific Resources | | | | | | | | |
7.803% due 06/15/2012 | | $ | | 975 | | $ | | 993 |
8.625% due 03/15/2014 | | | | 500 | | | | 532 |
|
| South Point Energy Center LLC | | | | |
8.400% due 05/30/2012 | | | | 2,288 | | | | 2,231 |
|
| TECO Energy, Inc. | | | | | | | | |
6.750% due 05/01/2015 | | | | 1,000 | | | | 978 |
|
| Tenaska Alabama Partners LP | | | | |
7.000% due 06/30/2021 | | | | 2,266 | | | | 2,220 |
|
| Time Warner Telecom Holdings, Inc. |
9.250% due 02/15/2014 | | | | 2,875 | | | | 2,961 |
| | | | | | | | |
|
| | | | | | | | | 67,030 |
| | | | | | | | |
|
Total Corporate Bonds & Notes
(Cost $380,445) | | 373,744 |
| | | | | | | | |
|
| |
| CONVERTIBLE BONDS & NOTES 0.5% |
| | | | | | | | | |
| BANKING & FINANCE 0.2% |
| Lehman Brothers Holdings, Inc. |
1.383% due 06/15/2009 | | | | 350 | | | | 359 |
2.070% due 06/15/2009 | | | | 350 | | | | 347 |
3.119% due 06/15/2009 | | | | 350 | | | | 345 |
| | | | | | | | |
|
| | | | | | | | | 1,051 |
| | | | | | | �� | |
|
| |
| UTILITIES 0.3% | | | | | | | | |
| CMS Energy Corp. |
2.875% due 12/01/2024 | | | | 1,075 | | | | 1,152 |
| | | | | | | | |
|
Total Convertible Bonds & Notes
(Cost $2,271) | | 2,203 |
| | | | | | | | |
|
| |
| SOVEREIGN ISSUES 0.3% |
| Brazilian Government International Bond |
8.875% due 10/14/2019 | | | | 50 | | | | 56 |
8.750% due 02/04/2025 | | | | 50 | | | | 55 |
8.250% due 01/20/2034 | | | | 1,100 | | | | 1,157 |
| | | | | | | | |
|
Total Sovereign Issues (Cost $1,159) | | 1,268 |
| | | | | | | | |
|
| |
| FOREIGN CURRENCY-DENOMINATED ISSUES (j) 3.7% |
| Cognis Holding GmbH |
11.644% due 01/15/2015 (c) | | EUR | | 112 | | | | 138 |
|
| Development Bank of Japan |
2.875% due 12/20/2006 | | JPY | | 150,000 | | | | 1,327 |
|
| France Government International Bond |
4.500% due 07/12/2006 | | EUR | | 1,500 | | | | 1,919 |
|
| JSG Funding PLC |
10.125% due 10/01/2012 | | | | 650 | | | | 910 |
|
| JSG Holding PLC |
11.500% due 10/01/2015 (c) | | | | 1,252 | | | | 1,652 |
|
| Lighthouse International Co. S.A. |
8.000% due 04/30/2014 | | | | 2,220 | | | | 3,006 |
|
| Nordic Telephone |
5.207% due 11/30/2014 | | | | 550 | | | | 711 |
5.707% due 11/30/2015 | | | | 550 | | | | 714 |
|
| Nordic Telephone Co. Holdings ApS |
8.250% due 05/01/2016 | | | | 1,000 | | | | 1,314 |
|
| Rhodia S.A. |
8.000% due 06/01/2010 | | | | 1,000 | | | | 1,334 |
|
| SigmaKalon |
4.742% due 06/30/2012 | | | | 1,000 | | | | 1,279 |
| | | | | | |
| See Accompanying Notes | | Semiannual Report | | June 30, 2006 | | 11 |
| | |
| |
| Schedule of Investments High Yield Portfolio (Cont.) | | |
| | | | | | | | |
| | | | | PRINCIPAL | | | | |
| | | | | AMOUNT | | | | VALUE |
| | | | | (000S) | | | | (000S) |
| | | | | | | | | |
| UPC Broadband Holding BV |
5.000% due 03/31/2013 | | EC | | 500 | | $ | | 639 |
5.000% due 12/31/2013 | | | | 500 | | | | 639 |
|
| UPC Holding BV |
7.750% due 01/15/2014 | | | | 200 | | | | 241 |
8.625% due 01/15/2014 | | | | 800 | | | | 1,008 |
| | | | | | | | |
|
Total Foreign Currency-Denominated Issues (Cost $15,796) | | 16,831 |
| | | | | | | | |
|
| | | | |
| | | | | SHARES | | | | |
| CONVERTIBLE PREFERRED STOCK 0.1% |
| Chesapeake Energy Corp. | | | | | | |
4.500% due 12/31/2049 | | | | 5,000 | | | | 468 |
| | | | | | | | |
|
Total Convertible Preferred Stock
(Cost $499) | | 468 |
| | | | | | | | |
|
| |
| PREFERRED SECURITIES 1.2% |
| Fresenius Medical Care Capital Trust II |
7.875% due 02/01/2008 | | | | 2,050 | | | | 2,086 |
|
| Xerox Capital Trust I |
8.000% due 02/01/2027 | | | | 3,100,000 | | | | 3,127 |
| | | | | | | | |
|
Total Preferred Stock (Cost $5,370) | | 5,213 |
| | | | | | | | |
|
| | | | |
| | | | | PRINCIPAL
AMOUNT
(000S) | | | | |
| SHORT-TERM INSTRUMENTS (j) 7.4% |
| |
| COMMERCIAL PAPER 3.6% |
| Societe Generale N.A. |
5.250% due 07/05/2006 | | $ | | 300 | | | | 300 |
5.245% due 08/08/2006 | | | | 2,700 | | | | 2,686 |
|
| UBS Finance Delaware LLC |
5.225% due 08/08/2006 | | | | 6,000 | | | | 5,969 |
5.250% due 08/08/2006 | | | | 7,400 | | | | 7,361 |
| | | | | | | | |
|
| | | | | | | | | 16,316 |
| | | | | | | | |
|
| |
| | | | | | | | |
| REPURCHASE AGREEMENT 0.8% |
| State Street Bank |
4.900% due 07/03/2006 | | $ | | 3,644 | | $ | | 3,644 |
| | | | | | | | |
|
(Dated 06/30/2006. Collateralized by Federal Home Loan Bank 4.875% due 07/02/2005 valued at $3,720. Repurchase proceeds are $3,645.) |
| |
| BELGIUM TREASURY BILLS 2.7% |
2.808% due 09/14/2006 | | EUR | | 9,500 | | | | 12,083 |
| | | | | | | | |
|
| |
| SPAIN TREASURY BILLS 0.0% |
3.004% due 12/22/2006 | | | | 200 | | | | 252 |
| | | | | | | | |
|
| |
| U.S. TREASURY BILLS 0.3% |
4.725% due 08/31/2006 - 09/14/2006 (d)(e)(f) | | $ | | 1,280 | | | | 1,269 |
| | | | | | | | |
|
| |
Total Short-Term Instruments
(Cost $33,416) | | 33,564 |
| | | | | | | | |
|
| |
Total Investments (a) 100.8%
(Cost $459,918) | | $454,275 |
| |
Written Options (h) (0.0%)
(Premiums $283) | | (73) |
| |
| Other Assets and Liabilities (Net) (0.8%) | | (3,497) |
| | | | | | | | |
|
| Net Assets 100.0% | | $450,705 |
| | | | | | | | |
|
| | |
| Notes to Schedule of Investments (amounts in thousands, except number of contracts): |
| |
(a) As of June 30, 2006, portfolio securities with an aggregate market value of $8,370 were valued in good faith and pursuant to guidelines established by the Board of Trustees. |
| |
(b) Security is in default. |
| |
(c) Payment in-kind bond security. |
| |
(d) Securities are grouped by coupon or range of coupons and represent a range of maturities. |
| |
(e) Securities with an aggregate market value of $248 have been pledged as collateral for swap and swaption contracts on June 30, 2006. |
| |
(f) Securities with an aggregate market value of $1,021 have been segregated with the custodian to cover margin requirements for the following open futures contracts on June 30, 2006: |
| | | | | | | | | | |
| Description | | Type | | Expiration
Month | | # of
Contracts | | Unrealized
(Depreciation) | |
90-Day Eurodollar December Futures | | Long | | 12/2006 | | 844 | | $ | (1,651 | ) |
| | | | | | | | |
|
|
|
| | | | |
| 12 | | PIMCO Variable Insurance Trust | | See Accompanying Notes |
| | |
| |
| | | June 30, 2006 (Unaudited) |
| | | | | | | | | | | | | | | |
(g) Swap agreements outstanding on June 30, 2006: | |
| Credit Default Swaps | |
| Counterparty | | Reference Entity | | Buy/Sell
Protection+ | | (Pay)/Receive
Fixed Rate | | Expiration
Date | | Notional
Amount | | Unrealized
Appreciation/
(Depreciation) | |
Bank of America | | Ford Motor Credit Co. 7.000% due 10/01/2013 | | Sell | | 4.750% | | 12/20/2006 | | $ | 1,500 | | $ | 24 | |
Bank of America | | Dow Jones CDX N.A. HY6 Index | | Sell | | 3.450% | | 06/20/2011 | | | 900 | | | 18 | |
Citibank N.A. | | CMS Energy Corp. 8.500% due 04/05/2011 | | Sell | | 1.900% | | 06/20/2011 | | | 500 | | | 6 | |
Citibank N.A. | | CMS Energy Corp. 6.875% due 12/15/2015 | | Sell | | 1.720% | | 06/20/2011 | | | 1,000 | | | 5 | |
Credit Suisse First Boston | | CMS Energy Corp. 7.500% due 01/15/2009 | | Sell | | 1.800% | | 12/20/2010 | | | 625 | | | 6 | |
Credit Suisse First Boston | | Abitibi-Consolidated, Inc.
8.550% due 08/01/2010 | | Sell | | 5.350% | | 09/20/2011 | | | 1,000 | | | 27 | |
Deutsche Bank AG | | Russia Government International Bond, 5.000% until 03/31/2007 and 7.500% thereafter,
due 03/31/2030 | | Sell | | 0.440% | | 06/20/2007 | | | 2,500 | | | 1 | |
Goldman Sachs & Co. | | ArvinMeritor, Inc. 8.750% due 03/01/2012 | | Sell | | 2.400% | | 03/20/2007 | | | 700 | | | 9 | |
Goldman Sachs & Co. | | Host Marriott LP 7.125% due 11/01/2013 | | Sell | | 1.770% | | 12/20/2010 | | | 500 | | | 12 | |
J.P. Morgan Chase & Co. | | Lear Corp. 8.110% due 05/15/2009 | | Sell | | 7.750% | | 03/20/2007 | | | 1,400 | | | 59 | |
J.P. Morgan Chase & Co. | | Abitibi-Consolidated, Inc.
8.375% due 04/01/2015 | | Sell | | 1.500% | | 06/20/2007 | | | 500 | | | 0 | |
Lehman Brothers, Inc. | | Primedia, Inc. 8.875% due 05/15/2011 | | Sell | | 2.500% | | 03/20/2007 | | | 1,000 | | | (1 | ) |
Merrill Lynch & Co., Inc. | | AES Corp. 8.750% due 06/15/2008 | | Sell | | 0.950% | | 06/20/2007 | | | 1,300 | | | 3 | |
Merrill Lynch & Co., Inc. | | AES Corp. 8.750% due 06/15/2008 | | Sell | | 0.950% | | 06/20/2007 | | | 700 | | | 1 | |
Morgan Stanley Dean Witter & Co. | | Qwest Capital Funding, Inc.
7.250% due 02/15/2011 | | Sell | | 1.800% | | 06/20/2010 | | | 2,000 | | | (14 | ) |
Morgan Stanley Dean Witter & Co. | | Multiple reference entities of Gazprom | | Sell | | 1.050% | | 04/20/2011 | | | 3,000 | | | (29 | ) |
| | | | | | | | | | | | | |
|
|
|
| | | | | | | | | | | | | | $ | 127 | |
| | | | | | | | | | | | | |
|
|
|
|
| + If the Portfolio is a seller of protection and a credit event occurs, as defined under the terms of that particular swap agreement, the Portfolio will pay to the buyer of the protection an amount up to the notional value of the swap and in certain instances, take delivery of the security. As a buyer of protection, the Portfolio will generally receive from the seller of protection an amount up to the notional amount of the swap if a credit event occurs. | |
| | | | | | | | | | | | | | | | |
(h) Written options outstanding on June 30, 2006: | | | | | | | | | | | | | | |
| Options on Exchange-Traded Futures Contracts | | | | | | | | | | | | | | |
| Description | | | | Exercise
Price | | Expiration
Date | | # of
Contracts | | Premium | | Value | |
Call - CBOT U.S. Treasury 10-Year Note September Futures | | $ | 108.000 | | 08/25/2006 | | 319 | | $ | 113 | | $ | 10 | |
Call - CBOT U.S. Treasury 10-Year Note September Futures | | | 107.000 | | 08/25/2006 | | 129 | | | 54 | | | 12 | |
Put - CBOT U.S. Treasury 10-Year Note September Futures | | | 103.000 | | 08/25/2006 | | 319 | | | 94 | | | 45 | |
Put - CBOT U.S. Treasury 10-Year Note September Futures | | | 102.000 | | 08/25/2006 | | 129 | | | 22 | | | 6 | |
| | | | | | | | | | | |
|
|
|
| | | | | | | | | | | | $ | 283 | | $ | 73 | |
| | | | | | | | | | | |
|
|
|
| | | | | | | | | | | | | | | | |
(i) Restricted securities as of June 30, 2006: | |
| Issuer Description | | Coupon | | Maturity
Date | | Acquisition
Date | | Cost | | Market
Value | | | Market Value
as Percentage
of Net Assets | |
Bombardier Capital, Inc. | | 7.090% | | 03/30/2007 | | 08/11/2003 | | $ 1,002 | | $ | 1,005 | | | | 0.22% | |
Continental Airlines, Inc. | | 6.920% | | 04/02/2013 | | 07/01/2003 | | 733 | | | 808 | | | | 0.18% | |
Ferrellgas Partners LP | | 8.870% | | 08/01/2009 | | 06/30/2003 | | 1,286 | | | 1,242 | | | | 0.28% | |
| | | | | | | | |
|
|
| | | | | | | | | $ 3,021 | | $ | 3,055 | | | | 0.68% | |
| | | | | | | | |
|
|
(j) Forward foreign currency contracts outstanding on June 30, 2006: | |
| Type | | | | Principal Amount Covered by Contract | | Settlement Month | | Unrealized Appreciation | | Unrealized (Depreciation) | | | Net Unrealized (Depreciation) | |
Sell | | EUR | | 11,581 | | 07/2006 | | $ 0 | | $ | (262 | ) | | $ | (262 | ) |
Buy | | JPY | | 545,951 | | 08/2006 | | 1 | | | (26 | ) | | | (25 | ) |
| | | | | | | | |
|
|
| | | | | | | | | $ 1 | | $ | (288 | ) | | $ | (287 | ) |
| | | | | | | | |
|
|
| | | | | | |
| See Accompanying Notes | | Semiannual Report | | June 30, 2006 | | 13 |
Notes to Financial Statements
1. ORGANIZATION
The High Yield Portfolio (the “Portfolio”) is a series of the PIMCO Variable Insurance Trust (the “Trust”). The Trust is registered under the Investment Company Act of 1940 (the “Act”), as amended, as an open-end investment management company organized as a Delaware business trust on October 3, 1997. The Portfolio offers three classes of shares: Institutional, Administrative and Advisor. Information presented in these financial statements pertains to the Institutional Class of the Portfolio. Certain detailed financial information for the Administrative Class and Advisor Class is provided separately and is available upon request. The Trust is designed to be used as an investment vehicle by Separate Accounts of insurance companies that fund variable annuity contracts and variable life insurance policies and by qualified pension and retirement plans.
2. SIGNIFICANT ACCOUNTING POLICIES
The following is a summary of significant accounting policies consistently followed by the Portfolio in the preparation of its financial statements in conformity with accounting principles generally accepted in the United States of America (“GAAP”). The preparation of financial statements in accordance with GAAP requires management to make estimates and assumptions that affect the reported amounts and disclosures in the financial statements. Actual results could differ from those estimates.
Security Valuation. Portfolio securities are valued as of the close of regular trading (normally 4:00 p.m., Eastern Time) on each day that the New York Stock Exchange (“NYSE”) is open. Portfolio securities and other assets for which market quotes are readily available are stated at market value. Market value is generally determined on the basis of last reported sales prices, or if no sales are reported, based on quotes obtained from a quotation reporting system, established market makers, or pricing services. Fixed-income securities and non-exchange traded derivatives are normally valued on the basis of quotes obtained from brokers and dealers or pricing services. Prices obtained from independent pricing services use information provided by market makers or estimates of market values obtained from yield data relating to investments or securities with similar characteristics. Certain fixed-income securities purchased on a delayed-delivery basis are marked to market daily until settlement at the forward settlement date. Short-term investments having a maturity of 60 days or less are generally valued at amortized cost. Exchange traded options, futures and options on futures are valued at the settlement price determined by the relevant exchange.
Investments initially valued in currencies other than the U.S. dollar are converted to the U.S. dollar using exchange rates obtained from pricing services. As a result, the NAV of the Portfolio’s shares may be affected by changes in the value of currencies in relation to the U.S. dollar. The value of securities traded in markets outside the United States or denominated in currencies other than the U.S. dollar may be affected significantly on a day that the NYSE is closed and an investor is not able to purchase, redeem or exchange shares.
Securities and other assets for which market quotes are not readily available are valued at fair value as determined in good faith by the Board of Trustees or persons acting at their direction. The Board of Trustees has adopted methods for valuing securities and other assets in circumstances where market quotes are not readily available, and has delegated to Pacific Investment Management Company LLC (“PIMCO”) the responsibility for applying the valuation methods. In the event that market quotes are not readily available, and the security or asset cannot be valued pursuant to one of the valuation methods, the value of the security or asset will be determined in good faith by the Valuation Committee of the Board of Trustees, generally based upon recommendations provided by PIMCO.
Market quotes are considered not readily available in circumstances where there is an absence of current or reliable market-based data (e.g., trade information, bid/asked information, broker quotes), including where events occur after the close of the relevant market, but prior to the close of regular trading, that materially affect the values of the Portfolio’s securities or assets. In addition, market quotes are considered not readily available when, due to extraordinary circumstances, the exchanges or markets on which the securities trade do not open for trading for the entire day and no other market prices are available. The Board has delegated to PIMCO the responsibility for monitoring significant events that may materially affect the values of the Portfolio’s securities or assets and for determining whether the value of the applicable securities or assets should be re-evaluated in light of such significant events when the Portfolio uses fair value pricing to determine its NAV, securities will not be priced on the basis of quotations from the primary market in which they are traded, but rather may be priced by another method that the Board of Trustees or persons acting at their direction believe accurately reflects fair value. The Trust’s policy is intended to result in a calculation of the Portfolio’s NAV that fairly reflects security values as of the time of pricing. However, fair values determined by the Board of Trustees or persons acting at their direction may not accurately reflect the price that the Portfolio could obtain for a security if it were to dispose of that security as of the time of pricing. Because foreign securities can trade on non-business days, the NAV of the Portfolio may change on days when shareholders will not be able to purchase or redeem shares. The prices used by the Portfolio may differ from the value that would be realized if the securities were sold and the differences could be material to the financial statements.
Securities Transactions and Investment Income. Securities transactions are recorded as of the trade date. Securities purchased or sold on a when-issued or delayed-delivery basis may be settled a month or more after the trade date. Realized gains and losses from securities sold are recorded on the identified cost basis. Dividend income is recorded on the ex-dividend date, except certain dividends from foreign securities where the ex-dividend date may have passed, which are recorded as soon as the Portfolio is informed of the ex-dividend date. Interest income, adjusted for the accretion of discounts and amortization of premiums, is recorded on the accrual basis. Paydown gains and losses on mortgage-related or asset-backed securities are recorded as components of interest income in the Statement of Operations.
Dividends and Distributions to Shareholders. Dividends from net investment income, if any, are declared on each day the Portfolio is open for business and are distributed to shareholders monthly. Net realized capital gains earned by the Portfolio, if any, will be distributed no less frequently than once each year. Most shareholders choose to reinvest their dividends and capital gain distribution in additional shares of the Portfolio.
Income dividends and capital gain distributions are determined in accordance with income tax regulations which may differ from GAAP. Differences between tax regulations and GAAP may change the fiscal year when income and capital items are recognized for tax and GAAP purposes. Examples of events that give rise to timing differences include wash sales, straddles, net operating losses and capital loss carryforwards. Further, the character of investment income and capital gains may be different for certain transactions under the two methods of accounting. Examples of characterization differences include the treatment of mortgage paydowns, swaps, foreign currency transactions and contingent debt instruments. As a result, income dividends and capital gain distributions declared during a fiscal period may differ significantly from the net investment income and realized capital gain reported in the Portfolio’s annual financial statements presented under GAAP.
| | | | |
| 14 | | PIMCO Variable Insurance Trust | | |
| | |
| |
| | | June 30, 2006 (Unaudited) |
Distributions classified as a tax basis return of capital, if any, are reflected in the accompanying Statements of Changes in Net Assets and have been reclassified to paid in capital. In addition, other amounts have been reclassified between undistributed net investment income, accumulated undistributed net realized gains or losses and/or paid in capital to more appropriately conform financial accounting to tax characterizations of dividend distributions.
Multiclass Operations. Each class offered by the Portfolio has equal rights as to assets and voting privileges (except that shareholders of a class have exclusive voting rights regarding any matter relating solely to that class of shares). Income and non-class specific expenses of the Portfolio are allocated daily to each class of shares based on the relative value of settled shares. Realized and unrealized capital gains and losses of the Portfolio are allocated daily to each class of shares based on the relative net assets of each class. Class specific expenses, where applicable, currently include administrative, distribution and servicing fees.
Bridge Debt Commitments. At the period ended June 30, 2006, the Portfolio had $2,008,182 in commitments outstanding to fund high-yield bridge debt. The Portfolio is entitled to a fee upon the expiration of the commitment period. The bridge debt terms approximate market rates at the time the commitment is entered into.
Loan Participants and Assignments. The Portfolio may invest in direct debt instruments which are interests in amounts owned by corporate, governmental, or other borrowers to lenders or lending syndicates. The Portfolio’s investments in loans may be in the form of participations in loans or assignments of all or a portion of loans from third parties. A loan is often administered by a bank or other financial institution (the “lender”) that acts as agent for all holders. The agent administers the terms of the loan, as specified in the loan agreement. When investing in a loan participation, the Portfolio has the right to receive payments of principal, interest and any fees to which it is entitled only from the lender selling the loan agreement and only upon receipt by the lender of payments from the borrower. The Portfolio generally has no right to enforce compliance with the terms of the loan agreement with the borrower. As a result, the Portfolio may be subject to the credit risk of both the borrower and the lender that is selling the loan agreement. When the Portfolio purchases assignments from lenders it acquires direct rights against the borrower on the loan. At the end of the period, the Portfolio had unfunded loan commitments of $2,008,182.
Delayed-Delivery Transactions. The Portfolio may purchase or sell securities on a when-issued or delayed-delivery basis. These transactions involve a commitment by the Portfolio to purchase or sell securities for a predetermined price or yield, with payment and delivery taking place beyond the customary settlement period. When delayed-delivery purchases are outstanding, the Portfolio will designate liquid assets in an amount sufficient to meet the purchase price. When purchasing a security on a delayed-delivery basis, the Portfolio assumes the rights and risks of ownership of the security, including the risk of price and yield fluctuations, and takes such fluctuations into account when determining its net asset value. The Portfolio may dispose of or renegotiate a delayed-delivery transaction after it is entered into, and may sell when-issued securities before they are delivered, which may result in a capital gain or loss. When the Portfolio has sold a security on a delayed-delivery basis, the Portfolio does not participate in future gains and losses with respect to the security.
Federal Income Taxes. The Portfolio intends to qualify as a regulated investment company under sub-chapter M of the Internal Revenue Code and distribute all of its taxable income and net realized gains, if applicable, to shareholders. Accordingly, no provision for Federal income taxes has been made.
Foreign Currency. The accounting records of the Portfolio are maintained in U.S. dollar. The market values of foreign securities, currency holdings and other assets and liabilities are translated into U.S. dollar based on the current exchange rates each business day. Fluctuations in the value of currency holdings and other assets and liabilities resulting from changes in exchange rates are recorded as unrealized foreign currency gains or losses. Realized gains or losses and unrealized appreciation or depreciation on investment securities and income and expenses are translated on the respective dates of such transactions. The effects of changes in foreign currency exchange rates on investments in securities are not segregated in the Statement of Operations from the effects of changes in market prices of those securities, but are included with the net realized and unrealized gain or loss on investment securities.
| | | | | | |
|
| Non-U.S. currency symbols utilized throughout the report are defined as follows: |
| EUR | | Euro | | | | |
| JPY | | Japanese Yen | | | | |
Forward Currency Transactions. The Portfolio may enter into forward currency contracts in connection with settling planned purchases or sales of securities, to hedge the currency exposure associated with some or all of the Portfolio’s securities or as a part of an investment strategy. A forward currency contract is an agreement between two parties to buy and sell a currency at a set price on a future date. The market value of a forward currency contract fluctuates with changes in forward currency exchange rates. Forward currency contracts are marked to market daily and the change in value is recorded by the Portfolio as an unrealized gain or loss. Realized gains or losses equal to the difference between the value of the contract at the time it was opened and the value at the time it was closed are recorded upon delivery or receipt of the currency or, if a forward currency contract is offset by entering into another forward currency contract with the same broker, upon settlement of the net gain or loss. These contracts may involve market risk in excess of the unrealized gain or loss reflected in the Portfolio’s Statement of Assets and Liabilities. In addition, the Portfolio could be exposed to risk if the counterparties are unable to meet the terms of the contracts or if the value of the currency changes unfavorably to the U.S. dollar.
Futures Contracts. The Portfolio is authorized to enter into futures contracts. The Portfolio may use futures contracts to manage its exposure to the securities markets or to movements in interest rates and currency values. The primary risks associated with the use of futures contracts are the imperfect correlation between the change in market value of the securities held by the Portfolio and the prices of futures contracts, the possibility of an illiquid market, and the inability of the counterparty to meet the terms of the contract. Futures contracts are valued based upon their quoted daily settlement prices. Upon entering into a futures contract, the Portfolio is required to deposit with its custodian, in a segregated account in the name of the futures broker, an amount of cash or U.S. Government and Agency Obligations in accordance with the initial margin requirements of the broker or exchange. Futures contracts are marked to market daily and an appropriate payable or receivable for the change in value (“variation margin”) is recorded by the Portfolio. Gains or losses are recognized but not considered realized until the contracts expire or are closed. Futures contracts involve, to varying degrees, risk of loss in excess of the variation margin disclosed in the Statement of Assets and Liabilities.
Payment In-Kind Securities. The portfolio may invest in payment in-kind securities. Payment in-kind securities (PIKs) give the issuer the option at each interest payment date of making interest payments in either cash or additional debt securities. Those additional debt securities usually have the same term, including maturity dates and interest rates, and associated risks as the original bonds. The daily market quotations of the original bonds include the accrued
| | | | | | |
| | | Semiannual Report | | June 30, 2006 | | 15 |
Notes to Financial Statements (Cont.)
interest (referred to as a dirty price) and require a pro-rata adjustment from interest receivable to the unrealized appreciation or depreciation on investment in the Statements of Assets and Liabilities.
Options Contracts. The Portfolio may write call and put options on futures, swaps, securities or currencies it owns or in which it may invest. Writing put options tends to increase the Portfolio’s exposure to the underlying instrument. Writing call options tends to decrease the Portfolio’s exposure to the underlying instrument. When the Portfolio writes a call or put option, an amount equal to the premium received is recorded as a liability and subsequently marked to market to reflect the current value of the option written. These liabilities are reflected as written options outstanding in the Statement of Assets and Liabilities. Certain options may be written with premiums to determined on a future date. The premiums for these options are based upon implied volatility parameters at specified terms. Premiums received from writing options which expire are treated as realized gains. Premiums received from writing options which are exercised or closed are added to the proceeds or offset against amounts paid on the underlying future, swap, security or currency transaction to determine the realized gain or loss. The Portfolio as a writer of an option has no control over whether the underlying future, swap, security or currency may be sold (call) or purchased (put) and as a result bears the market risk of an unfavorable change in the price of the future, swap, security or currency underlying the written option. There is the risk the Portfolio may not be able to enter into a closing transaction because of an illiquid market.
The Portfolio may also purchase put and call options. Purchasing call options tends to increase the Portfolio’s exposure to the underlying instrument. Purchasing put options tends to decrease the Portfolio’s exposure to the underlying instrument. The Portfolio pays a premium which is included in the Portfolio’s Statement of Assets and Liabilities as an investment and subsequently marked to market to reflect the current value of the option. Premiums paid for purchasing options which expire are treated as realized losses. The risk associated with purchasing put and call options is limited to the premium paid. Certain options may be purchased with premiums to be determined on a future date. The premiums for these options are based upon implied volatility parameters at specified terms. Premiums paid for purchasing options which are exercised or closed are added to the amounts paid or offset against the proceeds on the underlying future, swap, security or currency transaction to determine the realized gain or loss.
Repurchase Agreements. The Portfolio may engage in repurchase transactions. Under the terms of a typical repurchase agreement, the Portfolio takes possession of an underlying debt obligation subject to an obligation of the seller to repurchase, and the Portfolio to resell, the obligation at an agreed-upon price and time. The market value of the collateral must be equal to or exceed at all times the total amount of the repurchase obligations, including interest. Securities purchased under repurchase agreements are reflected as an asset in the Statement of Assets and Liabilities. Generally, in the event of counterparty default, the Portfolio has the right to use the collateral to offset losses incurred. If the counterparty should default, the Portfolio will seek to sell the securities which it holds as collateral. This could involve procedural costs or delays in addition to a loss on the securities if their value should fall below their repurchase price.
Restricted Securities. The Portfolio is permitted to invest in securities that are subject to legal or contractual restrictions on resale. These securities generally may be resold in transactions exempt from registration or to the public if the securities are registered. Disposal of these securities may involve time-consuming negotiations and expenses, and prompt sale at an acceptable price may be difficult.
Swap Agreements. The Portfolio may engage in swap transactions, including, but not limited to, swap agreements on credit default to manage its exposure to interest rates and credit risk. In connection with these agreements, securities may be identified as collateral in accordance with the terms of the respective swap agreements.
Credit default swap agreements involve one party making a stream of payments to another party in exchange for the right to receive a specified return in the event of a default by a third party, typically corporate issues or sovereign issues of an emerging country, on its obligation. The Portfolio may use credit default swaps to provide a measure of protection against defaults of the issuers (i.e., to reduce risk where the Portfolio owns or has exposure to the sovereign issuer) or to take an active long or short position with respect to the likelihood of a particular issuer’s default. As a seller of protection, the Portfolio generally receives an upfront payment or a fixed rate of income throughout the term of the swap provided that there is no credit event. If the Portfolio is a seller of protection and a credit event occurs, as defined under the terms of that particular swap agreement, the Portfolio will pay to the buyer of the protection an amount up to the notional value of the swap and in certain instances take delivery of the security. As the seller, the Portfolio would effectively add leverage to its portfolio because, in addition to its total net assets, the Portfolio would be subject to investment exposure on the notional amount of the swap. As a buyer of protection, the Portfolio generally receives an amount up to the notional value of the swap if a credit event occurs. The treatment of a credit default swaps and other swap agreements that provide for contingent, non-periodic, bullet-type payments as “notional principal contracts” for federal income tax purposes is uncertain. Were the Internal Revenue Service in take the position that a credit default swap or other bullet-type swap is not a “notional principal contract” for federal income tax purposes, payments received by the Portfolio from such investments might be subject to income taxes.
Swaps are marked to market daily based upon quotations from market makers and the change in value, if any, is recorded as unrealized gain or loss in the Statement of Operations. Payments received or made at the beginning of the measurement period are reflected as such in the Statement of Assets and Liabilities. These upfront payments are recorded as realized gain or loss in the Statement of Operations upon termination or maturity of the swap. A liquidation payment received or made at the termination of the swap is recorded as realized gain or loss in the Statement of Operations. Net periodic payments received or paid by the Portfolio are included as part of realized gain or loss in the Statement of Operations. Entering into these agreements involves, to varying degrees, elements of credit, market and documentation risk in excess of the amounts recognized in the Statement of Assets and Liabilities. Such risks involve the possibility that there will be no liquid market for these agreements, that the counterparty to the agreements may default on its obligation to perform or disagree as to the meaning of contractual terms in the agreements and that there may be unfavorable changes in interest rates.
Guarantees and Indemnifications. Under the Trust’s organizational documents, each Trustee, officer, employee or other agent of the Trust (including the Trust’s investment manager) is indemnified against certain liabilities that may arise out of performance of their duties to the Portfolio. Additionally, in the normal course of business, the Portfolio enters into contracts that contain a variety of indemnification clauses. The Portfolio’s maximum exposure under these arrangements is unknown as this would involve future claims that may be made against the Portfolio that have not yet occurred. However, the Portfolio has not had prior claims or losses pursuant to these contracts, and believes the risk of loss to be remote.
New Accounting Policies. In July 2006, the Financial Accounting Standards Board issued Interpretation No. 48, “Accounting for Uncertainty in Income Taxes—an Interpretation of FASB Statement No. 109” (the “Interpretation”). The Interpretation is effective for fiscal years beginning after December 15, 2006. Management is currently evaluating the application of the Interpretation to the Portfolio and will provide additional information in relation to the Interpretation in the Portfolio’s annual financial statements for the year ending December 31, 2006.
3. FEES, EXPENSES, AND RELATED PARTY TRANSACTIONS
Investment Advisory Fee. PIMCO is a majority-owned subsidiary of Allianz Global Investors of America L.P. (“AGI”), and serves as investment adviser (the
| | | | |
| 16 | | PIMCO Variable Insurance Trust | | |
| | |
| |
| | | June 30, 2006 (Unaudited) |
“Adviser”) to the Trust, pursuant to an investment advisory contract. The Adviser receives a monthly fee at an annual rate based on average daily net assets of the Portfolio. The Advisory Fee is charged at an annual rate of 0.25%.
Administration Fee. PIMCO serves as administrator (the “Administrator”), and provides administrative services to the Trust for which it receives a monthly administrative fee based on average daily net assets of the Portfolio. As the Administrator, PIMCO bears the costs of various third-party services, including audit, custodial, portfolio accounting, legal, transfer agency and printing costs. The Administration Fee is charged at the annual rate of 0.35%.
Distribution and Servicing Fees. Allianz Global Investors Distributors LLC (“AGID”) is an indirect wholly-owned subsidiary of AGI and serves as the distributor of the Trust’s shares. The Trust is permitted to reimburse AGID on a quarterly basis, out of the Administrative Class assets of the Portfolio in the amount of 0.15% on an annual basis of the average daily net assets of that class, for payments made to financial intermediaries that provide services in connection with the distribution of shares or administration of plans or programs that use Portfolio shares as their funding medium. The effective rate paid to AGID was 0.15% during the current fiscal year.
Expenses. The Trust is responsible for the following expenses: (i) salaries and other compensation of any of the Trust’s executive officers and employees who are not officers, directors, stockholders or employees of PIMCO or its subsidiaries or affiliates; (ii) taxes and governmental fees; (iii) brokerage fees and commissions and other portfolio transaction expenses; (iv) the costs of borrowing money, including interest expenses and bank overdraft charges; (v) fees and expenses of the Trustees who are not “interested persons” of PIMCO or the Trust, and any counsel retained exclusively for their benefit; (vi) extraordinary expenses, including costs of litigation and indemnification expenses; (vii) organization expenses and (viii) any expenses allocated or allocable to a specific class of shares, which include service fees payable with respect to the Administrative Class shares and may include certain other expenses as permitted by the Trust’s Multiple Class Plan adopted pursuant to Rule 18f-3 under the Act and subject to review and approval by the Trustees. The ratio of expenses to average net assets per share class, as disclosed in the Financial Highlights, may differ from the annual portfolio operating expenses per share class as disclosed in the Prospectus for the reasons set forth above.
For the current period ended June 30, 2006, each unaffiliated Trustee received an annual retainer of $15,000, plus $2,000 for each Board of Trustees quarterly meeting attended, $500 for each Board of Trustees committee meeting attended and $500 for each special board meeting attended, plus reimbursement of related expenses. In addition, each Committee Chair received an additional annual retainer of $500 and each Audit Committee Chair received an additional annual retainer of $1,500. These expenses are allocated on a pro-rata basis to each Portfolio of the Trust according to its respective net assets. The Trust pays no compensation directly to any Trustee or any other officer who is affiliated with the Administrator, all of whom receive remuneration for their services to the Trust from the Administrator or its affiliates.
4. PURCHASES AND SALES OF SECURITIES
The length of time the Portfolio has held a particular security is not generally a consideration in investment decisions. A change in the securities held by the Portfolio is known as “portfolio turnover”. The Portfolio may engage in frequent and active trading of portfolio securities to achieve its investment objective, particularly during periods of volatile market movements. High portfolio turnover (e.g., over 100%) involves correspondingly greater expenses to the Portfolio, including brokerage commissions or dealer mark-ups and other transaction costs on the sale of securities and reinvestments in other securities. Such sales may also result in realization of taxable capital gains, including short-term capital gains (which are generally taxed at ordinary income tax rates). The trading costs and tax effects associated with portfolio turnover may adversely affect the Portfolio’s performance.
Purchases and sales of securities (excluding short-term investments) for the period ended June 30, 2006 were as follows (amounts in thousands):
| | | | | | | | | | | | | | | | |
| | U.S Government/Agency | | | | | All Other |
| | Purchases | | | | | Sales | | | | | Purchases | | | | | Sales |
| $ | 0 | | | | $ | 0 | | | | $ | 227,130 | | | | $ | 218,953 |
5. TRANSACTIONS IN WRITTEN CALL AND PUT OPTIONS
Transactions in written call and put options were as follows (amounts in thousands, except number of contracts):
| | | | | | | | | | | | | | | | | |
| | | | | # of
Contracts |
| | | |
| Notional
Amount
in $ |
| | | | | Premium | |
Balance at 12/31/2005 | | | | 707 | | | | | $ | 17,000 | | | | | $ | 285 | |
Sales | | | | 2,167 | | | | | | 1,500 | | | | | | 638 | |
Closing Buys | | | | (1,978 | ) | | | | | (18,500 | ) | | | | | (640 | ) |
Expirations | | | | 0 | | | | | | 0 | | | | | | 0 | |
Exercised | | | | 0 | | | | | | 0 | | | | | | 0 | |
Balance at 06/30/2006 | | | | 896 | | | | | $ | 0 | | | | | $ | 283 | |
6. SHARES OF BENEFICIAL INTEREST
The Portfolio may issue an unlimited number of shares of beneficial interest with a $0.001 par value. Changes in shares of beneficial interest were as follows (shares and amounts in thousands):
| | | | | | | | | | | | | | | | | | |
| | | | | Six Months Ended
06/30/2006 | | | | | Year Ended
12/31/2005 | |
| | | | | Shares | | | Amount | | | | | Shares | | | Amount | |
| | | | | | |
Receipts for shares sold | | | | | | | | | | | | | | | | | | |
Institutional Class | | | | 43 | | | $ | 360 | | | | | 42 | | | $ | 336 | |
Administrative Class | | | | 7,675 | | | | 62,810 | | | | | 20,365 | | | | 167,640 | |
Advisor Class | | | | 1 | | | | 10 | | | | | 0 | | | | 0 | |
Issued as reinvestment of distributions | | | | | | | | | | | | | | | | | | |
Institutional Class | | | | 4 | | | | 29 | | | | | 4 | | | | 37 | |
Administrative Class | | | | 2,019 | | | | 16,529 | | | | | 3,377 | | | | 27,827 | |
Advisor Class | | | | 0 | | | | 0 | | | | | 0 | | | | 0 | |
Cost of shares redeemed | | | | | | | | | | | | | | | | | | |
Institutional Class | | | | (1 | ) | | | (12 | ) | | | | (3 | ) | | | (25 | ) |
Administrative Class | | | | (9,932 | ) | | | (80,878 | ) | | | | (16,769 | ) | | | (138,029 | ) |
Advisor Class | | | | 0 | | | | 0 | | | | | 0 | | | | 0 | |
Net increase (decrease) resulting from Portfolio share transactions | | | | (191 | ) | | $ | (1,152 | ) | | | | 7,016 | | | $ | 57,786 | |
The following schedule shows the number of shareholders each owning 5% or more of the Portfolio and the total percentage of the Portfolio held by such shareholders:
| | | | | | | |
| | | | | Number of
Shareholders | | % of Portfolio
Held | |
Institutional Class | | | | 1 | | 94 | |
Administrative Class | | | | 3 | | 79 | * |
Advisor Class | | | | 1 | | 100 | |
* Allianz Life Insurance Co. of North America, an indirect wholly subsidiary of AGI and a related party to the Portfolio, owned 25% or more of the outstanding shares of beneficial interest of the Portfolio, and therefore may be presumed to “control” the Portfolio, as that term is defined in the 1940 Act.
| | | | | | |
| | | Semiannual Report | | June 30, 2006 | | 17 |
Notes to Financial Statements (Cont.)
7. FEDERAL INCOME TAX MATTERS
As of June 30, 2006, the aggregate cost of investments was the same for federal income tax and financial statement purposes. The net unrealized appreciation (depreciation) of investment securities for federal income tax purposes is as follows (amounts in thousands):
| | | | |
Aggregate
Gross
Unrealized
Appreciation | | Aggregate
Gross
Unrealized
(Depreciation) | | Net
Unrealized
(Depreciation) |
$ 5,358 | | $ (11,001) | | $ (5,643) |
8. REGULATORY AND LITIGATION MATTERS
On June 1, 2004, the Attorney General of the State of New Jersey announced that it had dismissed PIMCO from a complaint filed by the New Jersey Attorney General on February 17, 2004, and that it had entered into a settlement agreement (the “New Jersey Settlement”) with Allianz Global Investors of America L.P. (“AGI”) (formerly known as Allianz Dresdner Asset Management of America L.P.), PEA Capital LLC (an entity affiliated with PIMCO through common ownership) (“PEA”) and Allianz Global Investors Distributors LLC (“AGID”), in connection with the same matter. In the New Jersey Settlement, AGI, PEA and AGID neither admitted nor denied the allegations or conclusions of law, but did agree to pay New Jersey a civil fine of $15 million and $3 million for investigative costs and further potential enforcement initiatives against unrelated parties. They also undertook to implement certain governance changes. The complaint relating to the New Jersey Settlement alleged, among other things, that AGI, PEA and AGID had failed to disclose that they improperly allowed certain hedge funds to engage in “market timing” in certain funds. The complaint sought injunctive relief, civil monetary penalties, restitution and disgorgement of profits.
Since February 2004, PIMCO, AGI, PEA, AGID, and certain of their affiliates, including the PIMCO Funds, the Allianz Funds (formerly known as PIMCO Funds: Multi-Manager Series), and the Trustees and employees of the PIMCO Funds, have been named as defendants in fifteen lawsuits filed in various jurisdictions. Eleven of those lawsuits concern “market timing,” and they have been transferred to and consolidated for pre-trial proceedings in a multi-district litigation proceeding in the U.S. District Court for the District of Maryland; the other four lawsuits concern “revenue sharing” and have been consolidated into a single action in the U.S. District Court for the District of Connecticut. The lawsuits have been commenced as putative class actions on behalf of investors who purchased, held or redeemed shares of the various series of the PIMCO Funds and the Allianz Funds during specified periods, or as derivative actions on behalf of the PIMCO Funds and Allianz Funds.
The market timing actions in the District of Maryland generally allege that certain hedge funds were allowed to engage in “market timing” in certain of the PIMCO Funds and the Allianz Funds and this alleged activity was not disclosed. Pursuant to tolling agreements entered into with the derivative and class action plaintiffs, PIMCO, the Trustees, and certain employees of PIMCO who were previously named as defendants have all been dropped as defendants in the market timing actions; the plaintiffs continue to assert claims on behalf of the shareholders of the PIMCO Funds or on behalf of the PIMCO Funds themselves against other defendants. By order dated November 3, 2005, the U.S. District Court for the District of Maryland granted the PIMCO Funds’ motion to dismiss claims asserted against it in a consolidated amended complaint where the PIMCO Funds were named, in the complaint, as a nominal defendant. The revenue sharing action in the District of Connecticut generally alleges that fund assets were inappropriately used to pay brokers to promote PIMCO Funds and the Allianz Funds, including directing fund brokerage transactions to such brokers, and that such alleged arrangements were not fully disclosed to shareholders. On August 11, 2005 the U.S. District Court for the District of Connecticut conducted a hearing on defendants’ motion to dismiss the consolidated amended complaint in the revenue sharing action but has not yet ruled on the motion to dismiss. The market timing and revenue sharing lawsuits seek, among other things, unspecified compensatory damages plus interest and, in some cases, punitive damages, the rescission of investment advisory contracts, the return of fees paid under those contracts and restitution.
Under Section 9(a) of the Investment Company Act of 1940, as amended (“1940 Act”), if the New Jersey Settlement or any of the lawsuits described above were to result in a court injunction against AGI, PEA, AGID and/or their affiliates, PIMCO could, in the absence of exemptive relief granted by the SEC, be barred from serving as an investment adviser, and AGID could be barred from serving as principal underwriter, to any registered investment company, including the Portfolios of the Trust. In connection with an inquiry from the SEC concerning the status of the New Jersey Settlement under Section 9(a), PEA, AGID, AGI and certain of their affiliates (including PIMCO) (together, the “Applicants”) have sought exemptive relief from the SEC under Section 9(c) of the 1940 Act. The SEC has granted the Applicants a temporary exemption from the provisions of Section 9(a) with respect to the New Jersey Settlement until the earlier of (i) September 13, 2006 and (ii) the date on which the SEC takes final action on their application for a permanent order. There is no assurance that the SEC will issue a permanent order.
Two nearly identical class action civil complaints have been filed in August 2005, in the Northern District of Illinois Eastern Division alleging that the plaintiffs each purchased and sold a 10-year Treasury note futures contract and suffered damages from an alleged shortage when PIMCO held both physical and futures positions in 10-year Treasury notes for its client accounts. The two actions have been consolidated into one action, and the two separate complaints have been replaced by a consolidated complaint. PIMCO is a named defendant, and the PIMCO Funds have been added as a defendant, to the consolidated action. PIMCO strongly believes the complaint (and any consolidated complaint filed hereafter) is without merit and intends to vigorously defend itself.
Certain Portfolios of the Trust were recently served in an adversary proceeding brought by the Official Committee of Asbestos Claimants of G-I Holdings, Inc. in G-I Holdings, Inc.’s bankruptcy in the District of New Jersey. PIMCO was previously named in this lawsuit and remains a defendant. The plaintiff seeks to recover for the bankruptcy estate assets that were transferred by the predecessor entity of G-I Holdings, Inc. to a wholly-owned subsidiary in 1994. The subsidiary has since issued notes, of which certain Portfolios of the Trust are alleged to be holders. The complaint alleges that in 2000, more than two hundred noteholders—including certain Portfolios of the Trust—were granted a second priority lien on the assets of the subsidiary in exchange for their consent to a refinancing transaction and the granting of a first priority lien to the lending banks. The plaintiff is seeking invalidation of the lien in favor of the noteholders and/or the value of the lien.
It is possible that these matters and/or other developments resulting from these matters could result in increased fund redemptions or other adverse consequences to the Portfolios. However, PIMCO and AGID believe that these matters are not likely to have a material adverse effect on the Portfolios or on PIMCO’s or AGID’s ability to perform their respective investment advisory or distribution services relating to the Portfolios.
| | | | |
| 18 | | PIMCO Variable Insurance Trust | | |
Investment Adviser and Administrator
Pacific Investment Management Company LLC
840 Newport Center Drive
Newport Beach, California 92660
Distributor
Allianz Global Investors Distributors LLC
2187 Atlantic Street
Stamford, Connecticut 06902
Custodian
State Street Bank & Trust Company
801 Pennsylvania
Kansas City, Missouri 64105
Transfer Agent
Boston Financial Data Services–Midwest
330 W. 9th Street
Kansas City, Missouri 64105
Legal Counsel
Dechert LLP
1775 I Street, N.W.
Washington, D.C. 20006
Independent Registered Public Accounting Firm
PricewaterhouseCoopers LLP
1055 Broadway
Kansas City, Missouri 64105
P I M C O

Share Class Administrative
Semiannual Report June 30, 2006
PIMCO Variable Insurance Trust
Long-Term U.S. Government Portfolio
Table of Contents
This material is authorized for use only when preceded or accompanied by the current PIMCO Variable Insurance Trust (the “Trust”) prospectus. Investors should consider the investment objectives, risks, charges and expenses of this Trust carefully before investing. Ask your financial professional to explain all charges that may apply. This and other information is contained in the Trust’s prospectus. The variable product prospectus may be obtained by contacting your Investment Consultant. Please read the Trust and variable product prospectus carefully before you invest or send money.
Chairman’s Letter
Dear PIMCO Variable Insurance Trust Shareholder:
It is our pleasure to present to you the semiannual report for the PIMCO Variable Insurance Trust covering the six-month period ended June 30, 2006.
Highlights of the global bond markets during the six-month period included:
| | n | | Most fixed-income sectors lost ground during the first half of 2006, as concern about accelerating inflation and central bank tightening pushed interest rates higher worldwide. The benchmark Lehman Brothers Aggregate Bond Index (which includes Treasury, Investment-Grade Corporate, and Residential Mortgage-Backed Securities) returned -0.72% for the first six months of the year. On June 30, the benchmark ten-year Treasury yielded 5.14%, 0.75% higher than at the start of the year. The U.S. yield curve remained flat as shorter-maturity yields rose by a comparable amount. |
| | n | | The Federal Reserve tightened four times during the reporting period, bringing the Federal Funds Rate to 5.25%. The increase near the end of the period was the Federal Reserve’s 17th consecutive rate hike since the start of its tightening cycle in 2004. The Federal Reserve was not alone, as central banks in Europe, India, and China tightened credit in unison for the first time since 2000. The Bank of Japan, whose zero-interest-rate policy has flooded global markets with liquidity, looked set to reverse this policy in the coming months. |
In these pages please find a more complete Portfolio review as it relates to financial-market activities, as well as details about total-return investment performance for the six-month reporting period. Thank you for the trust you have placed in us. We will continue to work diligently to meet your investment needs.
Sincerely,
Brent R. Harris
Chairman, PIMCO Variable Insurance Trust
July 31, 2006
| | | | | | |
| | | Semiannual Report | | June 30, 2006 | | 1 |
Important Information About the Portfolio
PIMCO Variable Insurance Trust (the “Trust”) is an open-end management investment company currently consisting of nineteen separate investment portfolios, including the Long-Term U.S. Government Portfolio (the “Portfolio”). The Portfolio is only available as a funding vehicle under variable life insurance policies or variable annuity contracts issued by insurance companies (“Variable Contracts”). Individuals may not purchase shares of the Portfolio directly. Shares of the Portfolio also may be sold to qualified pension and retirement plans outside of the separate account context.
We believe that bond funds have an important role to play in a well diversified investment portfolio. It is important to note, however, that in an environment where interest rates may trend upward, rising rates would negatively impact the performance of most bond funds, and fixed-income securities held by a fund are likely to decrease in value. The price volatility of fixed-income securities can also increase during periods of rising interest rates resulting in increased losses to a fund. Bond funds and individual bonds with a longer duration (a measure of the expected life of a security) tend to be more sensitive to changes in interest rates, usually making them more volatile than securities or funds with shorter durations. The longer-term performance of most bond funds has benefited from capital gains in part resulting from an extended period of declining interest rates. In the event interest rates increase, these capital gains should not be expected to recur.
The Portfolio may be subject to various risks in addition to those described above. Some of these risks may include, but are not limited to, the following: credit risk, market risk, issuer risk, derivatives risk, mortgage risk, leveraging risk and management risk. A complete description of these risks is contained in the Portfolio’s prospectus. The Portfolio may use derivative instruments for hedging purposes or as part of an investment strategy. Use of these instruments may involve certain costs and risks such as liquidity risk, interest rate risk, market risk, credit risk, management risk and the risk that the Portfolio could not close out a position when it would be most advantageous to do so. A Portfolio investing in derivatives could lose more than the principal amount invested in these instruments.
On the performance summary page in this Semiannual Report, the Total Return Investment Performance table measures performance assuming that all dividend and capital gain distributions were reinvested.
An investment in the Portfolio is not a deposit of a bank and is not guaranteed or insured by the Federal Deposit Insurance Corporation or any other government agency. It is possible to lose money on investments in the Portfolio.
PIMCO has adopted written proxy voting policies and procedures (“Proxy Policy”) as required by Rule 206(4)-6 under the Investment Advisers Act of 1940. The Proxy Policy has been adopted by the Trust as the policies and procedures that PIMCO will use when voting proxies on behalf of the Portfolio. Copies of the written Proxy Policy and the factors that PIMCO may consider in determining how to vote proxies for the Portfolio, and information about how the Portfolio voted proxies relating to portfolio securities held during the most recent twelve-month period ended June 30, are available without charge, upon request, by calling the Trust at 1-866-746-2606 and on the Securities and Exchange Commission’s (“SEC”) website at http://www.sec.gov.
The Portfolio files its complete schedule of portfolio holdings with the SEC for the first and third quarters of each fiscal year on Form N-Q. A copy of the Trust’s Form N-Q is available on the SEC’s website at http://www.sec.gov and may be reviewed and copied at the SEC’s Public Reference Room in Washington D.C. Information on the operation of the Public Reference Room may be obtained by calling 1-800-SEC-0330.
PIMCO Variable Insurance Trust is distributed by Allianz Global Investors Distributors LLC, 2187 Atlantic Street, Stamford, CT 06902.
| | | | |
| 2 | | PIMCO Variable Insurance Trust | | |
The following disclosure provides important information regarding the Portfolio’s Expense Example (“Example” or “Expense Example”), which appears in this Semiannual Report. Please refer to this information when reviewing the Expense Example for the Portfolio.
Example
As a shareholder of the Portfolio, you incur two types of costs: (1) transaction costs and (2) ongoing costs, including advisory and administrative fees; distribution and/or service (12b-1) fees (Administrative Class only); and other Portfolio expenses. The Example is intended to help you understand your ongoing costs (in dollars) of investing in the Portfolio and to compare these costs with the ongoing costs of investing in other mutual funds. The Expense Example does not reflect any fees or other expenses imposed by the Variable Contracts. If it did, the expenses reflected in the Expense Examples would be higher. The Example is based on an investment of $1,000 invested at the beginning of the period and held for the entire period indicated, which is from January 1, 2006 to Semiannual.
Actual Expenses
The information in the table under the heading “Actual Performance” provides information about actual account values and actual expenses. You may use the information in these columns, together with the amount you invested, to estimate the expenses that you paid over the period. Simply divide your account value by $1,000 (for example, an $8,600 account value divided by $1,000 = 8.60), then multiply the result by the number in the appropriate column for your share class, in the row titled “Expenses Paid During Period” to estimate the expenses you paid on your account during this period.
Hypothetical Example for Comparison Purposes
The information in the table under the heading “Hypothetical Performance (5% return before expenses)” provides information about hypothetical account values and hypothetical expenses based on the Portfolio’s actual expense ratio and an assumed rate of return of 5% per year before expenses, which is not the Portfolio’s actual return. The hypothetical account values and expenses may not be used to estimate the actual ending account balance or expenses you paid for the period. You may use this information to compare the ongoing costs of investing in the Portfolio and other portfolios. To do so, compare this 5% hypothetical example with the 5% hypothetical examples that appear in the shareholder reports of the other portfolios.
Please note that the expenses shown in the table are meant to highlight your ongoing costs only and do not reflect any transactional costs. Therefore, the information under the heading “Hypothetical Performance (5% return before expenses)” is useful in comparing ongoing costs only, and will not help you determine the relative total costs of owning different portfolios. In addition, if these transactional costs were included, your costs would have been higher.
The expense ratio may vary period to period because of various factors, such as an increase in expenses not covered by the advisory and administrative fees (such as expenses of the trustees and their counsel or litigation expense).
Portfolio Benchmark
Lehman Brothers Long-Term Treasury consists of U.S. Treasury issues with maturities of 10 or more years. It is not possible to invest directly in such an unmanaged index.
| | | | | | |
| | | Semiannual Report | | June 30, 2006 | | 3 |
| | | | |
| | |
| PIMCO Long-Term U.S. Government Portfolio | | | | |
| | | | |
Cumulative Returns Through June 30, 2006
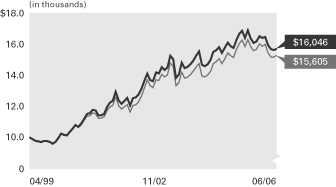
Long-Term U.S. Government Lehman Brothers
Portfolio Administrative Long Term Treasury
Class Index
------------------------- ------------------
04/30/1999 $10,000 $10,000
05/31/1999 9,882 9,843
06/30/1999 9,766 9,739
07/31/1999 9,730 9,692
08/31/1999 9,672 9,654
09/30/1999 9,758 9,726
10/31/1999 9,754 9,731
11/30/1999 9,686 9,665
12/31/1999 9,572 9,521
01/31/2000 9,680 9,657
02/29/2000 9,944 9,949
03/31/2000 10,257 10,289
04/30/2000 10,164 10,207
05/31/2000 10,119 10,170
06/30/2000 10,372 10,391
07/31/2000 10,582 10,570
08/31/2000 10,837 10,811
09/30/2000 10,719 10,680
10/31/2000 10,933 10,846
11/30/2000 11,270 11,189
12/31/2000 11,605 11,452
01/31/2001 11,660 11,472
02/28/2001 11,886 11,668
03/31/2001 11,831 11,609
04/30/2001 11,488 11,294
05/31/2001 11,513 11,308
06/30/2001 11,609 11,406
07/31/2001 12,079 11,830
08/31/2001 12,366 12,083
09/30/2001 12,503 12,174
10/31/2001 13,117 12,771
11/30/2001 12,517 12,164
12/31/2001 12,285 11,936
01/31/2002 12,479 12,089
02/28/2002 12,701 12,230
03/31/2002 12,176 11,736
04/30/2002 12,675 12,182
05/31/2002 12,736 12,219
06/30/2002 12,945 12,439
07/31/2002 13,333 12,822
08/31/2002 13,864 13,382
09/30/2002 14,351 13,940
10/31/2002 13,912 13,539
11/30/2002 13,842 13,390
12/31/2002 14,446 13,938
01/31/2003 14,368 13,891
02/28/2003 14,793 14,312
03/31/2003 14,608 14,132
04/30/2003 14,780 14,275
05/31/2003 15,578 15,078
06/30/2003 15,351 14,848
07/31/2003 14,062 13,520
08/31/2003 14,286 13,735
09/30/2003 15,106 14,451
10/31/2003 14,728 14,049
11/30/2003 14,813 14,116
12/31/2003 15,009 14,284
01/31/2004 15,245 14,529
02/29/2004 15,593 14,819
03/31/2004 15,865 15,044
04/30/2004 14,957 14,200
05/31/2004 14,856 14,130
06/30/2004 14,984 14,259
07/31/2004 15,276 14,501
08/31/2004 15,858 15,039
09/30/2004 15,949 15,166
10/31/2004 16,170 15,389
11/30/2004 15,765 15,046
12/31/2004 16,145 15,385
01/31/2005 16,472 15,773
02/28/2005 16,222 15,569
03/31/2005 16,121 15,465
04/30/2005 16,646 15,994
05/31/2005 17,070 16,410
06/30/2005 17,290 16,656
07/31/2005 16,792 16,219
08/31/2005 17,315 16,691
09/30/2005 16,767 16,212
10/31/2005 16,447 15,913
11/30/2005 16,550 16,012
12/31/2005 16,912 16,385
01/31/2006 16,803 16,235
02/28/2006 16,865 16,350
03/31/2006 16,302 15,793
04/30/2006 16,029 15,485
05/31/2006 15,975 15,486
06/30/2006 16,046 15,605
$10,000 invested at the beginning of the first full month following the inception date of the Portfolio’s Administrative Class.
Sector Breakdown‡
| | |
U.S. Treasury Obligations | | 33.6% |
U.S. Government Agencies | | 31.7% |
Short-Term Instruments | | 11.9% |
Mortgage-Backed Securities | | 11.4% |
Other | | 11.4% |
| | ‡ | % of Total Investments as of June 30, 2006 |
| | | | | | | | | | | | |
| Average Annual Total Return for the period ended June 30, 2006 |
| | | | | | | 6 Months* | | 1 Year | | 5 Years | | Since
Inception
(04/30/99) |
| | |
| | PIMCO Long-Term U.S. Government Portfolio Administrative Class | | -5.12% | | -7.20% | | 6.68% | | 6.82% |
| | |
| | Lehman Brothers Long-Term Treasury Index | | -4.76% | | -6.31% | | 6.47% | | 6.41% |
All Portfolio returns are net of fees and expenses.
* Cumulative return.
Past performance is no guarantee of future results. The performance quoted represents past performance. Investment return and principal value will fluctuate so the Portfolio shares, when redeemed, may be worth more or less than their original cost. The Portfolio’s performance does not reflect the deduction of additional charges and expenses imposed in connection with investing in Variable Contracts, which will reduce returns. Current performance may be lower or higher than the performance data quoted. Performance data current to the most recent month-end is available by calling (800) 927-4648.
| | | | | | | | | | |
| Expense Example | | | | Actual Performance | | | | Hypothetical Performance |
| | | | | | | | | (5% return before expenses) |
Beginning Account Value (01/01/06) | | | | $ | 1,000.00 | | | | $ | 1,000.00 |
Ending Account Value (06/30/06) | | | | $ | 948.80 | | | | $ | 1,021.72 |
Expenses Paid During Period† | | | | $ | 3.00 | | | | $ | 3.11 |
† Expenses are equal to the Portfolio’s Administrative Class annualized expense ratio of 0.62%, multiplied by the average account value over the period, multiplied by 181/365 (to reflect the one-half year period). Overall fees and expenses of investing in the Portfolio will be higher because the example does not reflect Variable Contract fees and expenses.
Please refer to page 3 herein for a description of the Portfolio’s benchmark and an explanation of the information presented in the above Expense Example.
Portfolio Insights
| » | | The PIMCO Long-Term U.S. Government Portfolio seeks to achieve its investment objective by investing under normal circumstances at least 80% of its assets in a diversified portfolio of Fixed-Income Securities that are issued or guaranteed by the U.S. Government, its agencies or government-sponsored enterprises (“U.S. Government Securities”). |
| » | | The Portfolio’s emphasis on the short-term portion of the curve, especially the 0-1 year maturity bucket, throughout the six-month reporting period ended June 30, 2006 was a negative for relative performance because these rates rose the most as the yield curve flattened. |
| » | | Because swap spreads widened over the first six months of 2006, the modest allocation to interest rate swaps negatively impacted returns relative to the benchmark. |
| » | | An out-of-benchmark allocation to structured mortgages had a positive effect on relative performance as mortgages outperformed long-term Treasuries over the six-month reporting period ended June 30, 2006. |
| » | | Long municipal bonds outperformance versus Treasuries with a similar duration was positive for the Portfolio’s relative performance during the six-month period due to a modest out-of-benchmark allocation to long municipal bonds. |
| » | | A modest out-of-benchmark allocation to short Treasury Inflation-Protected Securities (“TIPS”) was positive for the six-month period ended June 30, 2006 while the modest out-of-benchmark allocation to long TIPS was negative as they respectively outperformed and underperformed long-term Treasuries. Overall, TIPS were positive over the six-month reporting period. |
| | | | | | |
| 4 | | PIMCO Variable Insurance Trust | | | | |
| | |
| |
| Financial Highlights Long-Term U.S. Government Portfolio | | |
| | | | | | | | | | | | | | | | | | | | | | | | |
| Selected Per Share Data for the Year or Period Ended: | | 06/30/2006+ | | | 12/31/2005 | | | 12/31/2004 | | | 12/31/2003 | | | 12/31/2002 | | | 12/31/2001 | |
| | | | | | |
Administrative Class | | | | | | | | | | | | | | | | | | | | | | | | |
| Net asset value beginning of period | | $ | 11.00 | | | $ | 11.19 | | | $ | 11.01 | | | $ | 11.09 | | | $ | 10.27 | | | $ | 10.56 | |
| Net investment income (a) | | | 0.22 | | | | 0.40 | | | | 0.33 | | | | 0.30 | | | | 0.44 | | | | 0.51 | |
| Net realized/unrealized gain (loss) on investments (a) | | | (0.78 | ) | | | 0.12 | | | | 0.49 | | | | 0.12 | | | | 1.31 | | | | 0.09 | |
| Total income (loss) from investment operations | | | (0.56 | ) | | | 0.52 | | | | 0.82 | | | | 0.42 | | | | 1.75 | | | | 0.60 | |
| Dividends from net investment income | | | (0.22 | ) | | | (0.40 | ) | | | (0.34 | ) | | | (0.33 | ) | | | (0.44 | ) | | | (0.52 | ) |
| Distributions from net realized capital gains | | | 0.00 | | | | (0.31 | ) | | | (0.30 | ) | | | (0.17 | ) | | | (0.49 | ) | | | (0.37 | ) |
| Total distributions | | | (0.22 | ) | | | (0.71 | ) | | | (0.64 | ) | | | (0.50 | ) | | | (0.93 | ) | | | (0.89 | ) |
| Net asset value end of period | | $ | 10.22 | | | $ | 11.00 | | | $ | 11.19 | | | $ | 11.01 | | | $ | 11.09 | | | $ | 10.27 | |
| Total return | | | (5.12 | )% | | | 4.75 | % | | | 7.57 | % | | | 3.90 | % | | | 17.59 | % | | | 5.86 | % |
| Net assets end of period (000s) | | $ | 81,589 | | | $ | 89,426 | | | $ | 92,122 | | | $ | 94,003 | | | $ | 92,256 | | | $ | 33,013 | |
| Ratio of expenses to average net assets | | | 0.62 | %*(d) | | | 0.65 | % | | | 0.66 | %(c) | | | 0.66 | %(c) | | | 0.65 | %(b) | | | 0.65 | %(b) |
| Ratio of net investment income to average net assets | | | 4.17 | %* | | | 3.52 | % | | | 2.93 | % | | | 2.72 | % | | | 4.05 | % | | | 4.75 | % |
| Portfolio turnover rate | | | 551 | % | | | 533 | % | | | 237 | % | | | 619 | % | | | 586 | % | | | 457 | % |
+ Unaudited
* Annualized
(a) Per share amounts based on average number of shares outstanding during the period.
(b) If the investment manager had not reimbursed expenses, the ratio of expenses to average net assets would have been 0.66%.
(c) Ratio of expenses to average net assets excluding interest expense is 0.62%.
(d) Effective October 31, 2005, the advisory fee was reduced to 0.225%.
| | | | | | |
| See Accompanying Notes | | Semiannual Report | | June 30, 2006 | | 5 |
| | |
| |
| Statement of Assets and Liabilities Long-Term U.S. Government Portfolio | | |
| | | | |
| (Amounts in thousands, except per share amounts) | | June 30, 2006
(Unaudited) | |
| |
Assets: | | | | |
Investments, at value | | $ | 103,633 | |
Cash | | | 5 | |
Receivable for investments sold | | | 4,479 | |
Receivable for investments sold on delayed-delivery basis | | | 28,809 | |
Receivable for Portfolio shares sold | | | 84 | |
Interest and dividends receivable | | | 1,131 | |
Variation margin receivable | | | 229 | |
Swap premiums paid | | | 803 | |
Unrealized appreciation on swap agreements | | | 265 | |
| | | | 139,438 | |
| |
Liabilities: | | | | |
Payable for investments purchased | | $ | 3,360 | |
Payable for investments purchased on delayed-delivery basis | | | 48,810 | |
Payable for short sales | | | 3,001 | |
Payable for Portfolio shares redeemed | | | 4 | |
Written options outstanding | | | 260 | |
Accrued investment advisory fee | | | 16 | |
Accrued administration fee | | | 18 | |
Accrued servicing fee | | | 9 | |
Swap premiums received | | | 1,590 | |
Unrealized depreciation on swap agreements | | | 146 | |
| | | | 57,214 | |
| |
Net Assets | | $ | 82,224 | |
| |
Net Assets Consist of: | | | | |
Paid in capital | | $ | 86,590 | |
Undistributed net investment income | | | 70 | |
Accumulated undistributed net realized (loss) | | | (2,709 | ) |
Net unrealized (depreciation) | | | (1,727 | ) |
| | | $ | 82,224 | |
| |
Net Assets: | | | | |
Institutional Class | | $ | 635 | |
Administrative Class | | | 81,589 | |
| |
Shares Issued and Outstanding: | | | | |
Institutional Class | | | 62 | |
Administrative Class | | | 7,986 | |
| |
Net Asset Value and Redemption Price Per Share (Net Assets Per Share Outstanding) | | | | |
Institutional Class | | $ | 10.22 | |
Administrative Class | | | 10.22 | |
| |
Cost of Investments Owned | | $ | 105,230 | |
Proceeds Received on Short Sales | | $ | 2,989 | |
Premiums Received on Written Options | | $ | 216 | |
| | | | |
| 6 | | PIMCO Variable Insurance Trust | | See Accompanying Notes |
| | |
| |
| Statement of Operations Long-Term U.S. Government Portfolio | | |
| | | | |
| (Amounts in thousands) | | Six Months Ended
June 30, 2006
(Unaudited) | |
| |
Investment Income: | | | | |
Interest | | $ | 2,031 | |
Total Income | | | 2,031 | |
| |
Expenses: | | | | |
Investment advisory fees | | | 95 | |
Administration fees | | | 105 | |
Distribution and/or servicing fees – Administrative Class | | | 63 | |
Trustees’ fees | | | 1 | |
Interest expense | | | 1 | |
Total Expenses | | | 265 | |
| |
Net Investment Income | | | 1,766 | |
| |
Net Realized and Unrealized Gain (Loss): | | | | |
Net realized (loss) on investments | | | (2,354 | ) |
Net realized (loss) on futures contracts, options and swaps | | | (1,485 | ) |
Net change in unrealized (depreciation) on investments | | | (2,095 | ) |
Net change in unrealized (depreciation) on futures contracts, options and swaps | | | (431 | ) |
Net (Loss) | | | (6,365 | ) |
| |
Net (Decrease) in Net Assets Resulting from Operations | | $ | (4,599 | ) |
| | | | | | |
| See Accompanying Notes | | Semiannual Report | | June 30, 2006 | | 7 |
| | |
| |
| Statements of Changes in Net Assets Long-Term U.S. Government Portfolio | | |
| | | | | | | | |
| (Amounts in Thousands) | | Six Months Ended
June 30, 2006
(Unaudited) | | | Year Ended
December 31, 2005 | |
| | |
Increase (Decrease) in Net Assets from: | | | | | | | | |
| | |
Operations: | | | | | | | | |
Net investment income | | $ | 1,766 | | | $ | 3,214 | |
Net realized gain (loss) | | | (3,839 | ) | | | 2,492 | |
Net change in unrealized (depreciation) | | | (2,526 | ) | | | (1,461 | ) |
Net increase (decrease) resulting from operations | | | (4,599 | ) | | | 4,245 | |
| | |
Distributions to Shareholders: | | | | | | | | |
| From net investment income | | | | | | | | |
Institutional Class | | | (11 | ) | | | (13 | ) |
Administrative Class | | | (1,755 | ) | | | (3,237 | ) |
| From net realized capital gains | | | | | | | | |
Institutional Class | | | 0 | | | | (11 | ) |
Administrative Class | | | 0 | | | | (2,439 | ) |
| | |
Total Distributions | | | (1,766 | ) | | | (5,700 | ) |
| | |
Portfolio Share Transactions: | | | | | | | | |
| Receipts for shares sold | | | | | | | | |
Institutional Class | | | 342 | | | | 261 | |
Administrative Class | | | 3,885 | | | | 6,964 | |
| Issued as reinvestment of distributions | | | | | | | | |
Institutional Class | | | 11 | | | | 24 | |
Administrative Class | | | 1,755 | | | | 5,676 | |
| Cost of shares redeemed | | | | | | | | |
Institutional Class | | | (79 | ) | | | (195 | ) |
Administrative Class | | | (7,142 | ) | | | (13,891 | ) |
Net (decrease) resulting from Portfolio share transactions | | | (1,228 | ) | | | (1,161 | ) |
| | |
Total Decrease in Net Assets | | | (7,593 | ) | | | (2,616 | ) |
| | |
Net Assets: | | | | | | | | |
Beginning of period | | | 89,817 | | | | 92,433 | |
End of period* | | $ | 82,224 | | | $ | 89,817 | |
| | |
*Including undistributed net investment income of: | | $ | 70 | | | $ | 70 | |
| | | | |
| 8 | | PIMCO Variable Insurance Trust | | See Accompanying Notes |
| | |
| |
| Schedule of Investments Long-Term U.S. Government Portfolio | | June 30, 2006 (Unaudited) |
| | | | |
| | | PRINCIPAL | | |
| | | AMOUNT | | VALUE |
| | | (000S) | | (000S) |
| | | | | |
| | | | | | | | |
| CORPORATE BONDS & NOTES 5.1% |
| |
| BANKING & FINANCE 4.3% |
| Allstate Life Global Funding Trusts |
5.160% due 01/25/2008 | | $ | | 200 | | $ | | 200 |
|
| Citigroup, Inc. |
5.166% due 01/30/2009 | | | | 600 | | | | 600 |
|
| Lehman Brothers Holdings, Inc. |
5.180% due 01/23/2009 | | | | 1,400 | | | | 1,402 |
|
| Pricoa Global Funding I |
5.180% due 01/25/2008 | | | | 200 | | | | 200 |
|
| U.S. Trade Funding Corp. |
4.260% due 11/15/2014 | | | | 743 | | | | 714 |
|
| Wells Fargo & Co. |
5.509% due 03/23/2010 | | | | 400 | | | | 400 |
| | | | | | | | |
|
| | | | | | | | | 3,516 |
| | | | | | | | |
|
| |
| INDUSTRIALS 0.5% |
| DaimlerChrysler N.A. Holding Corp. |
5.740% due 03/13/2009 | | | | 400 | | | | 401 |
| | | | | | | | |
|
| |
| UTILITIES 0.3% |
| Verizon Global Funding Corp. |
5.300% due 08/15/2007 | | | | 300 | | | | 300 |
| | | | | | | | |
|
Total Corporate Bonds & Notes (Cost $4,243) | | 4,217 |
| | | | | | | | |
|
| |
| MUNICIPAL BONDS & NOTES 1.6% |
| Chicago, Illinois Motor Fuel Tax Revenue Bonds, (AMBAC Insured), Series 2003 |
5.000% due 01/01/2033 | | | | 200 | | | | 204 |
|
| Dawson Ridge, Colorado Metropolitan District No. 1 General Obligation Bonds, Series 1992 |
0.000% due 10/01/2022 | | | | 800 | | | | 361 |
|
| Detroit, Michigan School District General Obligation Bonds, (FGID Q-SBLF Insured), Series 2003 |
5.000% due 05/01/2033 | | | | 100 | | | | 101 |
|
| Irving, Texas Independent School District General Obligation Notes, (PSF Insured), Series 2003 |
5.000% due 02/15/2031 | | | | 200 | | | | 203 |
|
| New York City, New York Municipal Water Finance Authority Revenue Bonds, Series 2002 |
5.125% due 06/15/2034 | | | | 200 | | | | 205 |
|
| San Antonio, Texas Water Revenue Bonds, (FSA Insured), Series 2002 |
5.000% due 05/15/2032 | | | | 250 | | | | 252 |
| | | | | | | | |
|
Total Municipal Bonds & Notes (Cost $1,289) | | 1,326 |
| | | | | | | | |
|
| |
| U.S. GOVERNMENT AGENCIES 39.9% |
| Fannie Mae |
4.500% due 09/01/2035 | | | | 473 | | | | 429 |
5.000% due 11/01/2019 - 08/25/2033 (b) | | | | 616 | | | | 588 |
5.249% due 04/26/2035 | | | | 9 | | | | 9 |
5.250% due 06/15/2008 | | | | 11,100 | | | | 11,060 |
5.375% due 02/25/2022 | | | | 150 | | | | 138 |
5.402% due 07/25/2035 | | | | 900 | | | | 901 |
5.500% due 07/13/2036 | | | | 900 | | | | 864 |
5.794% due 08/25/2021 | | | | 27 | | | | 27 |
5.800% due 02/09/2026 | | | | 500 | | | | 483 |
5.944% due 08/25/2022 | | | | 15 | | | | 15 |
6.080% due 09/01/2028 | | | | 64 | | | | 68 |
6.222% due 04/25/2032 | | | | 36 | | | | 37 |
6.244% due 04/25/2021 | | | | 21 | | | | 21 |
| | | | | | | | |
| Federal Farm Credit Bank |
5.150% due 03/25/2020 | | $ | | 250 | | $ | | 236 |
|
| Federal Home Loan Bank |
3.875% due 10/23/2006 | | | | 2,000 | | | | 1,991 |
4.000% due 07/14/2008 | | | | 1,000 | | | | 971 |
5.120% due 01/10/2013 | | | | 5,000 | | | | 4,839 |
6.000% due 02/12/2021 | | | | 50 | | | | 51 |
6.125% due 06/08/2018 | | | | 80 | | | | 83 |
|
| Federal Housing Administration |
6.896% due 07/01/2020 | | | | 464 | | | | 462 |
|
| Freddie Mac |
3.750% due 11/15/2006 | | | | 2,000 | | | | 1,988 |
4.500% due 05/15/2025 | | | | 400 | | | | 355 |
5.000% due 03/18/2014 - 09/15/2035 (b) | | | | 2,000 | | | | 1,819 |
5.211% due 10/25/2044 | | | | 258 | | | | 259 |
5.400% due 03/17/2021 | | | | 1,000 | | | | 950 |
5.500% due 08/15/2030 - 06/15/2034 (b) | | | | 1,003 | | | | 930 |
5.625% due 11/23/2035 | | | | 900 | | | | 823 |
5.950% due 02/15/2027 | | | | 22 | | | | 22 |
6.250% due 02/15/2021 | | | | 29 | | | | 29 |
7.000% due 07/15/2023 - 12/01/2031 (b) | | | | 90 | | | | 93 |
|
| Government National Mortgage Association |
4.500% due 08/20/2030 | | | | 27 | | | | 27 |
6.000% due 08/20/2033 | | | | 1,185 | | | | 1,140 |
|
| Small Business Administration Participation Certificates |
5.240% due 08/01/2023 | | | | 865 | | | | 842 |
|
| Tennessee Valley Authority |
5.375% due 04/01/2056 | | | | 300 | | | | 285 |
| | | | | | | | |
|
Total U.S. Government Agencies (Cost $33,361) | | | | 32,835 |
| | | | | | | | |
|
| |
| U.S. TREASURY OBLIGATIONS 42.4% |
| Treasury Inflation Protected Securities (d) |
3.375% due 01/15/2007 | | | | 191 | | | | 191 |
2.375% due 01/15/2025 | | | | 962 | | | | 937 |
2.000% due 01/15/2026 (f) | | | | 1,523 | | | | 1,395 |
|
| U.S. Treasury Bond |
6.250% due 08/15/2023 | | | | 8,500 | | | | 9,377 |
|
| U.S. Treasury Note |
4.125% due 08/15/2010 | | | | 15,800 | | | | 15,238 |
|
| U.S. Treasury Strip |
0.000% due 08/15/2019 (c) | | | | 15,400 | | | | 7,725 |
| | | | | | | | |
|
Total U.S. Treasury Obligations (Cost $35,874) | | 34,863 |
| | | | | | | | |
|
| |
| MORTGAGE-BACKED SECURITIES 14.3% |
| Bear Stearns Adjustable Rate Mortgage Trust |
5.062% due 03/25/2033 | | | | 596 | | | | 590 |
5.306% due 03/25/2033 | | | | 173 | | | | 171 |
4.812% due 01/25/2034 | | | | 98 | | | | 96 |
4.750% due 10/25/2035 | | | | 500 | | | | 480 |
4.750% due 11/25/2035 | | | | 431 | | | | 423 |
|
| Bear Stearns Alt-A Trust |
5.602% due 02/25/2034 | | | | 48 | | | | 48 |
|
| Countrywide Alternative Loan Trust |
5.500% due 10/25/2033 | | | | 1,163 | | | | 1,040 |
5.532% due 05/25/2035 | | | | 329 | | | | 329 |
|
| Countrywide Home Loan Mortgage Pass-Through Trust |
5.642% due 03/25/2035 | | | | 532 | | | | 535 |
5.662% due 06/25/2035 | | | | 3,310 | | | | 3,309 |
| | | | | | | | |
| CS First Boston Mortgage Securities Corp. |
6.230% due 11/25/2032 | | $ | | 31 | | $ | | 31 |
5.872% due 04/25/2033 | | | | 41 | | | | 41 |
|
| First Republic Mortgage Loan Trust |
5.549% due 11/15/2031 | | | | 331 | | | | 333 |
|
| Freddie Mac |
7.275% due 07/25/2011 | | | | 154 | | | | 152 |
|
| Harborview Mortgage Loan Trust |
5.472% due 05/19/2035 | | | | 273 | | | | 273 |
|
| Impac CMB Trust |
5.249% due 09/25/2034 | | | | 805 | | | | 772 |
|
| LB-UBS Commercial Mortgage Trust |
5.401% due 03/15/2026 | | | | 21 | | | | 21 |
2.720% due 03/15/2027 | | | | 574 | | | | 556 |
|
| MASTR Asset Securitization Trust |
5.500% due 09/25/2033 | | | | 462 | | | | 442 |
|
| Residential Accredit Loans, Inc. |
5.722% due 01/25/2033 | | | | 56 | | | | 56 |
5.722% due 03/25/2033 | | | | 118 | | | | 118 |
|
| Residential Funding Mortgage Security I |
6.500% due 03/25/2032 | | | | 107 | | | | 107 |
|
| Sequoia Mortgage Trust |
5.607% due 06/20/2032 | | | | 85 | | | | 85 |
5.617% due 07/20/2033 | | | | 536 | | | | 538 |
|
| Structured Asset Mortgage Investments, Inc. |
5.582% due 09/19/2032 | | | | 645 | | | | 646 |
5.672% due 06/18/2033 | | | | 171 | | | | 171 |
|
| Washington Mutual MSC Mortgage Pass-Through Certificates |
6.218% due 02/25/2031 | | | | 49 | | | | 49 |
5.374% due 02/25/2033 | | | | 39 | | | | 38 |
6.391% due 02/25/2033 | | | | 28 | | | | 28 |
6.556% due 05/25/2033 | | | | 38 | | | | 38 |
|
| Washington Mutual, Inc. |
5.552% due 04/25/2045 | | | | 259 | | | | 260 |
| | | | | | | | |
|
Total Mortgage-Backed Securities (Cost $11,908) | | 11,776 |
| | | | | | | | |
|
| | | | | | | |
| ASSET-BACKED SECURITIES 3.5% |
| AAA Trust |
5.422% due 04/25/2035 | | | | 46 | | | | 46 |
|
| Accredited Mortgage Loan Trust |
5.422% due 07/25/2035 | | | | 11 | | | | 11 |
|
| ACE Securities Corp. |
5.442% due 02/25/2035 | | | | 3 | | | | 3 |
|
| Bayview Financial Acquisition Trust |
5.791% due 08/28/2034 | | | | 250 | | | | 250 |
|
| Bear Stearns Asset-Backed Securities, Inc. |
5.822% due 11/25/2042 | | | | 246 | | | | 247 |
|
| Chase Funding Mortgage Loan Asset-Backed Certificates |
5.822% due 10/25/2031 | | | | 31 | | | | 31 |
|
| First Franklin Mortgage Loan Asset-Backed Certificates |
5.563% due 11/25/2034 | | | | 9 | | | | 9 |
|
| Home Equity Mortgage Trust |
5.442% due 07/25/2035 | | | | 25 | | | | 25 |
|
| LA Arena Funding LLC |
7.656% due 12/15/2026 | | | | 89 | | | | 92 |
| | | | | | |
| See Accompanying Notes | | Semiannual Report | | June 30, 2006 | | 9 |
| | |
| |
| Schedule of Investments Long-Term U.S. Government Portfolio (Cont.) | | |
| | | | | | | | |
| | | | | PRINCIPAL | | | | |
| | | | | AMOUNT | | | | VALUE |
| | | | | (000S) | | | | (000S) |
| | | | | | | | | |
| Peco Energy Transition Trust |
6.130% due 03/01/2009 | | $ | | 1 | | $ | | 1 |
|
| Renaissance Home Equity Loan Trust |
5.762% due 08/25/2033 | | | | 16 | | | | 16 |
5.822% due 12/25/2033 | | | | 92 | | | | 93 |
|
| Residential Asset Mortgage Products, Inc. |
5.422% due 11/25/2024 | | | | 104 | | | | 104 |
5.402% due 05/25/2026 | | | | 872 | | | | 872 |
|
| Residential Asset Securities Corp. |
5.692% due 01/25/2033 | | | | 156 | | | | 157 |
|
| SMS Student Loan Trust |
5.636% due 10/27/2025 | | | | 71 | | | | 71 |
|
| Specialty Underwriting & Residential Finance |
5.662% due 01/25/2034 | | | | 12 | | | | 12 |
|
| Structured Asset Securities Corp. |
5.612% due 01/25/2033 | | | | 22 | | | | 22 |
5.453% due 12/25/2035 | | | | 663 | | | | 664 |
|
| White River Capital, Inc. |
4.590% due 07/08/2008 | | | | 25 | | | | 25 |
|
| Whole Auto Loan Trust |
3.040% due 04/15/2009 | | | | 156 | | | | 156 |
| | | | | | | | |
|
Total Asset-Backed Securities (Cost $2,903) | | 2,907 |
| | | | | | | | |
|
| |
| SOVEREIGN ISSUES 4.0% |
| Financing Corp. Fico |
10.700% due 10/06/2017 | | | | 650 | | | | 926 |
|
| Overseas Private Investment Corp. |
3.800% due 08/15/2007 | | | | 1,000 | | | | 1,135 |
5.140% due 08/15/2007 | | | | 830 | | | | 826 |
4.736% due 03/15/2022 | | | | 400 | | | | 371 |
| | | | | | | | |
|
Total Sovereign Issues (Cost $3,236) | | 3,258 |
| | | | | | | | |
|
| | | | |
| | | | | NOTIONAL
AMOUNT | | | | |
| PURCHASED CALL OPTIONS 0.0% |
| 2-Year Interest Rate Swap (OTC) Pay 3-Month USD-LIBOR Floating Rate Index |
Strike @ 5.500% Exp. 06/30/2007 | | | | 3,300 | | | | 16 |
| |
| | | | | #OF
CONTRACTS | | | | |
| U.S. Treasury 10- Year Notes September Futures (CBOT) |
Strike @ $111.000 Exp. 08/24/2006 | | | | 282 | | | | 5 |
| U.S. Treasury 5-Year Note September Futures (CBOT) |
Strike @ $106.500 Exp. 08/25/2006 | | | | 78 | | $ | | 1 |
| | | | | | | | |
|
Total Purchased Call Options (Cost $23) | | 22 |
| | | | | | | | |
|
| | | | | | | | |
| PURCHASED PUT OPTIONS 0.1% |
| 90-Day Eurodollar December Futures (CME) |
Strike @ $91.750 Exp. 12/18/2006 | | | | 46 | | | | 0 |
Strike @ $92.000 Exp. 12/18/2006 | | | | 60 | | | | 0 |
Strike @ $92.750 Exp. 12/18/2006 | | | | 41 | | | | 0 |
Strike @ $94.000 Exp. 12/18/2006 | | | | 253 | | | | 18 |
Strike @ $94.000 Exp. 12/17/2007 | | | | 109 | | | | 44 |
|
| 90-Day Eurodollar June Futures (CME) |
Strike @ $91.250 Exp. 06/18/2007 | | | | 15 | | | | 0 |
|
| 90-Day Eurodollar March Futures (CME) |
Strike @ $92.000 Exp. 03/19/2007 | | | | 20 | | | | 0 |
|
| 90-Day Eurodollar September Futures (CME) |
Strike @ $92.500 Exp. 09/18/2006 | | | | 22 | | | | 0 |
|
| U.S. Treasury 30-Year Bond September Futures (CBOT) |
Strike @ $93.000 Exp. 08/25/2006 | | | | 135 | | | | 2 |
Strike @ $97.000 Exp. 08/25/2006 | | | | 89 | | | | 2 |
| | | | | | | | |
|
Total Purchased Put Options (Cost $25) | | 66 |
| | | | | | | | |
|
| |
| | | | | PRINCIPAL
AMOUNT
(000S) | | | | |
| SHORT-TERM INSTRUMENTS 15.1% |
| |
| CERTIFICATE OF DEPOSIT 0.4% |
| Countrywide Bank N.A. | | | | | | | | |
5.209% due 09/15/2006 | | $ | | 300 | | | | 300 |
| | | | | | | | |
|
| |
| COMMERCIAL PAPER 6.0% |
| Countrywide Funding Corp. | | | | | | | | |
4.911% due 10/18/2006 | | | | 500 | | | | 500 |
|
| Fannie Mae | | | | | | | | |
4.809% due 07/05/2006 | | | | 2,200 | | | | 2,199 |
|
| Federal Home Loan Bank | | | | | | | | |
5.030% due 07/03/2006 | | | | 2,200 | | | | 2,200 |
| | | | | | | | |
|
| | | | | | | | | 4,899 |
| | | | | | | | |
|
| |
| | | | | | | | | |
| REPURCHASE AGREEMENTS 5.5% | |
| Credit Suisse First Boston | | | | | | | | | |
4.580% due 07/03/2006 | | $ | | 1,800 | | $ | | 1,800 | |
(Dated 06/30/2006. Collateralized by U.S. Treasury Notes 4.000% due 06/15/2009 valued at $1,851. Repurchase proceeds are $1,801.) | | | | | | | | | |
|
|
| Lehman Brothers, Inc. | | | | | | | | | |
4.600% due 07/03/2006 | | | | 2,400 | | | | 2,400 | |
(Dated 06/30/2006. Collateralized by U.S. Treasury Notes 3.250% due 08/15/2007 valued at $2,452. Repurchase proceeds are $2,401.) | | | | | | | | | |
|
|
| State Street Bank | | | | | | | | | |
4.900% due 07/03/2006 | | | | 324 | | | | 324 | |
(Dated 06/30/2006. Collateralized by Freddie Mac 2.75% due 07/02/2009 valued at $333. Repurchase proceeds are $324.) | | | | | | | | | |
| | | | | | | | |
|
|
| | | | | | | | | 4,524 | |
| | | | | | | | |
|
|
| | |
| U.S. TREASURY BILLS 3.2% | |
4.790% due 08/31/2006 - 09/14/2006 (b)(e)(f) | | | | 2,670 | | | | 2,640 | |
| | | | | | | | |
|
|
Total Short-Term Instruments (Cost $12,368) | | 12,363 | |
| | | | | | | | |
|
|
| | |
Total Investments (a) 126.0%
(Cost $105,230) | | $ | | 103,633 | |
| | |
Written Options (h) (0.3%)
(Premiums $216) | | | | (260 | ) |
| | |
| Other Assets and Liabilities (Net) (25.7%) | | (21,149 | ) |
| | | | | | | | |
|
|
| Net Assets 100.0% | | | | | | $ | | 82,224 | |
| | | | | | | | |
|
|
|
Notes to Schedule of Investments (amounts in thousands, except number of contracts): |
(a) As of June 30, 2006, portfolio securities with an aggregate market value of $2,121 were valued in good faith and pursuant to guidelines established by the Board of Trustees. |
| |
(b) Securities are grouped by coupon or range of coupons and represent a range of maturities. |
| |
(c) Principal only security. |
| |
(d) Principal amount of security is adjusted for inflation. |
| |
(e) Securities with an aggregate market value of $1,484 have been pledged as collateral for swap and swaption contracts on June 30, 2006. |
| |
| | | | |
| 10 | | PIMCO Variable Insurance Trust | | See Accompanying Notes |
| | |
| |
| | | June 30, 2006 (Unaudited) |
|
(f) Securities with an aggregate market value of $1,052 have been segregated with the custodian to cover margin requirements for the following open futures contracts on June 30, 2006: |
| | | | | | | | | | |
| Description | | Type | | Expiration
Month | | # of
Contracts | | Unrealized
Appreciation/
(Depreciation) | |
90-Day Eurodollar December Futures | | Long | | 12/2006 | | 200 | | $ | (108 | ) |
90-Day Eurodollar March Futures | | Long | | 03/2007 | | 58 | | | (31 | ) |
U.S. Treasury 5-Year Note September Futures | | Short | | 09/2006 | | 25 | | | 14 | |
U.S. Treasury 10-Year Note September Futures | | Short | | 09/2006 | | 74 | | | 35 | |
U.S. Treasury 30-Year Bond September Futures | | Long | | 09/2006 | | 321 | | | (125 | ) |
| | | | | | | | |
|
|
|
| | | | | | | | | $ | (215 | ) |
| | | | | | | | |
|
|
|
| | | | | | | | | | | | | | | |
(g) Swap agreements outstanding on June 30, 2006: | |
| Interest Rate Swaps | |
| Counterparty | | Floating Rate Index | | Pay/Receive
Floating Rate | | Fixed Rate | | Expiration
Date | | Notional
Amount | | Unrealized
Appreciation/
(Depreciation) | |
Deutsche Bank AG | | 3-month USD-LIBOR | | Pay | | 5.000% | | 12/20/2036 | | $ | 900 | | $ | (8 | ) |
Goldman Sachs & Co. | | 3-month USD-LIBOR | | Pay | | 5.000% | | 12/20/2036 | | | 3,400 | | | (31 | ) |
Morgan Stanley Dean Witter & Co. | | 3-month USD-LIBOR | | Pay | | 5.000% | | 12/20/2036 | | | 6,400 | | | (107 | ) |
Royal Bank of Scotland PLC | | 3-month USD-LIBOR | | Receive | | 5.000% | | 12/20/2016 | | | 17,300 | | | 212 | |
UBS Warburg LLC | | 3-month USD-LIBOR | | Receive | | 5.000% | | 12/20/2008 | | | 6,600 | | | 6 | |
UBS Warburg LLC | | 3-month USD-LIBOR | | Pay | | 5.000% | | 12/20/2011 | | | 17,700 | | | 47 | |
| | | | | | | | | | | | | |
|
|
|
| | | | | | | | | | | | | | $ | 119 | |
| | | | | | | | | | | | | |
|
|
|
| | | | | | | | | | | | | | | | | |
(h) Written options outstanding on June 30, 2006: |
| Options on Exchange-Traded Futures Contracts |
| Description | | | | | | Exercise
Price | | Expiration
Date | | # of
Contracts | | Premium | | Value |
Call - CBOT U.S. Treasury 20-Year Note September Futures | | $ | 110.000 | | 08/25/2006 | | 43 | | $ | 22 | | $ | 8 |
Put - CBOT U.S. Treasury 20-Year Note September Futures | | | 103.000 | | 08/25/2006 | | 43 | | | 13 | | | 8 |
Put - CME 90-Day Eurodollar December Futures | | | | | | | 95.000 | | 12/18/2006 | | 88 | | | 37 | | | 133 |
| | | | | | | | | | | | | |
|
| |
|
|
| | | | | | | | | | | | | | $ | 72 | | $ | 149 |
| | | | | | | | | | | | | |
|
| |
|
|
| | | | | | | | | | | | | | | | | | | |
| Interest Rate Swaptions |
| Description | | Counterparty | | Floating Rate Index | | Pay/Receive
Floating Rate | | Exercise
Rate | | Expiration
Date | | Notional
Amount | | Premium | | Value |
Call - OTC 7-Year Interest Rate Swap | | Bank of America | | 3-month USD-LIBOR | | Receive | | 4.500% | | 05/02/2008 | | $ | 700 | | $ | 14 | | $ | 2 |
Put - OTC 7-Year Interest Rate Swap | | Bank of America | | 3-month USD-LIBOR | | Pay | | 5.500% | | 05/02/2008 | | | 700 | | | 17 | | | 21 |
Call - OTC 7-Year Interest Rate Swap | | J.P. Morgan Chase & Co. | | 3-month USD-LIBOR | | Receive | | 4.500% | | 05/02/2008 | | | 1,500 | | | 33 | | | 4 |
Put - OTC 7-Year Interest Rate Swap | | J.P. Morgan Chase & Co. | | 3-month USD-LIBOR | | Pay | | 5.500% | | 05/02/2008 | | | 1,500 | | | 35 | | | 45 |
Call - OTC 7-Year Interest Rate Swap | | Merrill Lynch & Co., Inc. | | 3-month USD-LIBOR | | Receive | | 4.500% | | 05/02/2008 | | | 700 | | | 14 | | | 2 |
Put - OTC 7-Year Interest Rate Swap | | Merrill Lynch & Co., Inc. | | 3-month USD-LIBOR | | Pay | | 5.500% | | 05/02/2008 | | | 700 | | | 16 | | | 21 |
Call - OTC 5-Year Interest Rate Swap | | Royal Bank of Scotland PLC | | 3-month USD-LIBOR | | Receive | | 5.600% | | 06/29/2007 | | | 1,400 | | | 15 | | | 16 |
| | | | | | | | | | | | |
|
| |
|
|
| | | | | | | | | | | | | | | | $ | 144 | | $ | 111 |
| | | | | | | | | | | | | | | |
|
| |
|
|
| | | | | | | | | | | | | |
(i) Short sales outstanding on June 30, 2006: | | | | | | | | | |
| Description | | Coupon | | Maturity
Date | | Principal
Amount | | Proceeds | | Valueà |
Fannie Mae | | 6.000% | | 07/13/2036 | | $ | 2,000 | | $ | 1,980 | | $ | 1,969 |
U.S. Treasury Bond | | 5.375% | | 02/15/2031 | | | 200 | | | 208 | | | 207 |
U.S. Treasury Bond | | 4.500% | | 02/15/2036 | | | 900 | | | 801 | | | 825 |
| | | | | | | | | |
|
| |
|
|
| | | | | | | | | | $ | 2,989 | | $ | 3,001 |
| | | | | | | | | |
|
| |
|
|
|
| à Market value includes $22 of interest payable on short sales. |
| | | | | | |
| See Accompanying Notes | | Semiannual Report | | June 30, 2006 | | 11 |
Notes to Financial Statements
1. ORGANIZATION
The Long-Term U.S. Government Portfolio (the “Portfolio”) is a series of the PIMCO Variable Insurance Trust (the “Trust”). The Trust is registered under the Investment Company Act of 1940 (the “Act”), as amended, as an open-end investment management company organized as a Delaware business trust on October 3, 1997. The Portfolio offers two classes of shares: Institutional and Administrative. Information presented in these financial statements pertains to the Administrative Class of the Portfolio. Certain detailed financial information for the Institutional Class is available upon request. The Trust is designed to be used as an investment vehicle by Separate Accounts of insurance companies that fund variable annuity contracts and variable life insurance policies and by qualified pension and retirement plans.
2. SIGNIFICANT ACCOUNTING POLICIES
The following is a summary of significant accounting policies consistently followed by the Portfolio in the preparation of its financial statements in conformity with accounting principles generally accepted in the United States of America (“GAAP”). The preparation of financial statements in accordance with GAAP requires management to make estimates and assumptions that affect the reported amounts and disclosures in the financial statements. Actual results could differ from those estimates.
Security Valuation. Portfolio securities are valued as of the close of regular trading (normally 4:00 p.m., Eastern Time) on each day that the New York Stock Exchange (“NYSE”) is open. Portfolio securities and other assets for which market quotes are readily available are stated at market value. Market value is generally determined on the basis of last reported sales prices, or if no sales are reported, based on quotes obtained from a quotation reporting system, established market makers, or pricing services. Fixed-income securities and non-exchange traded derivatives are normally valued on the basis of quotes obtained from brokers and dealers or pricing services. Prices obtained from independent pricing services use information provided by market makers or estimates of market values obtained from yield data relating to investments or securities with similar characteristics. Certain fixed-income securities purchased on a delayed-delivery basis are marked to market daily until settlement at the forward settlement date. Short-term investments having a maturity of 60 days or less are generally valued at amortized cost. Exchange traded options, futures and options on futures are valued at the settlement price determined by the relevant exchange.
Investments initially valued in currencies other than the U.S. dollar are converted to the U.S. dollar using exchange rates obtained from pricing services. As a result, the NAV of the Portfolio’s shares may be affected by changes in the value of currencies in relation to the U.S. dollar. The value of securities traded in markets outside the United States or denominated in currencies other than the U.S. dollar may be affected significantly on a day that the NYSE is closed and an investor is not able to purchase, redeem or exchange shares.
Securities and other assets for which market quotes are not readily available are valued at fair value as determined in good faith by the Board of Trustees or persons acting at their direction. The Board of Trustees has adopted methods for valuing securities and other assets in circumstances where market quotes are not readily available, and has delegated to Pacific Investment Management Company LLC (“PIMCO”) the responsibility for applying the valuation methods. In the event that market quotes are not readily available, and the security or asset cannot be valued pursuant to one of the valuation methods, the value of the security or asset will be determined in good faith by the Valuation Committee of the Board of Trustees, generally based upon recommendations provided by PIMCO.
Market quotes are considered not readily available in circumstances where there is an absence of current or reliable market-based data (e.g., trade information, bid/asked information, broker quotes), including where events occur after the close of the relevant market, but prior to the close of regular trading, that materially affect the values of the Portfolio’s securities or assets. In addition, market quotes are considered not readily available when, due to extraordinary circumstances, the exchanges or markets on which the securities trade do not open for trading for the entire day and no other market prices are available. The Board has delegated to PIMCO the responsibility for monitoring significant events that may materially affect the values of the Portfolio’s securities or assets and for determining whether the value of the applicable securities or assets should be re-evaluated in light of such significant events. When the Portfolio uses fair value pricing to determine its NAV, securities will not be priced on the basis of quotations from the primary market in which they are traded, but rather may be priced by another method that the Board of Trustees or persons acting at their direction believe accurately reflects fair value. The Trust’s policy is intended to result in a calculation of the Portfolio’s NAV that fairly reflects security values as of the time of pricing. However, fair values determined by the Board of Trustees or persons acting at their direction may not accurately reflect the price that the Portfolio could obtain for a security if it were to dispose of that security as of the time of pricing. Because foreign securities can trade on non-business days, the NAV of the Portfolio may change on days when shareholders will not be able to purchase or redeem shares. The prices used by the Portfolio may differ from the value that would be realized if the securities were sold and the differences could be material to the financial statements.
Securities Transactions and Investment Income. Securities transactions are recorded as of the trade date. Securities purchased or sold on a when-issued or delayed-delivery basis may be settled a month or more after the trade date. Realized gains and losses from securities sold are recorded on the identified cost basis. Dividend income is recorded on the ex-dividend date, except certain dividends from foreign securities where the ex-dividend date may have passed, which are recorded as soon as the Portfolio is informed of the ex-dividend date. Interest income, adjusted for the accretion of discounts and amortization of premiums, is recorded on the accrual basis. Paydown gains and losses on mortgage-related or asset-backed securities are recorded as components of interest income in the Statement of Operations.
Dividends and Distributions to Shareholders. Dividends from net investment income, if any, are declared on each day the Portfolio is open for business and are distributed to shareholders monthly. Net realized capital gains earned by the Portfolio, if any, will be distributed no less frequently than once each year. Most shareholders choose to reinvest their dividends and capital gain distribution in additional shares of the Portfolio.
Income dividends and capital gain distributions are determined in accordance with income tax regulations which may differ from GAAP. Differences between tax regulations and GAAP may change the fiscal year when income and capital items are recognized for tax and GAAP purposes. Examples of events that give rise to timing differences include wash sales, straddles, net operating losses and capital loss carryforwards. Further, the character of investment income and capital gains may be different for certain transactions under the two methods of accounting. Examples of characterization differences include the treatment of mortgage paydowns, swaps, foreign currency transactions and contingent debt instruments. As a result, income dividends and capital gain distributions declared during a fiscal period may differ significantly from the net investment income and realized capital gain reported in the Portfolio’s annual financial statements presented under GAAP.
| | | | |
| 12 | | PIMCO Variable Insurance Trust | | |
| | |
| |
| | | June 30, 2006 (Unaudited) |
Distributions classified as a tax basis return of capital, if any, are reflected in the accompanying Statements of Changes in Net Assets and have been reclassified to paid in capital. In addition, other amounts have been reclassified between undistributed net investment income, accumulated undistributed net realized gains or losses and/or paid in capital to more appropriately conform financial accounting to tax characterizations of dividend distributions.
Multiclass Operations. Each class offered by the Portfolio has equal rights as to assets and voting privileges (except that shareholders of a class have exclusive voting rights regarding any matter relating solely to that class of shares). Income and non-class specific expenses of the Portfolio are allocated daily to each class of shares based on the relative value of settled shares. Realized and unrealized capital gains and losses of the Portfolio are allocated daily to each class of shares based on the relative net assets of each class. Class specific expenses, where applicable, currently include administrative, distribution and servicing fees.
Delayed-Delivery Transactions. The Portfolio may purchase or sell securities on a when-issued or delayed-delivery basis. These transactions involve a commitment by the Portfolio to purchase or sell securities for a predetermined price or yield, with payment and delivery taking place beyond the customary settlement period. When delayed-delivery purchases are outstanding, the Portfolio will designate liquid assets in an amount sufficient to meet the purchase price. When purchasing a security on a delayed-delivery basis, the Portfolio assumes the rights and risks of ownership of the security, including the risk of price and yield fluctuations, and takes such fluctuations into account when determining its net asset value. The Portfolio may dispose of or renegotiate a delayed-delivery transaction after it is entered into, and may sell when-issued securities before they are delivered, which may result in a capital gain or loss. When the Portfolio has sold a security on a delayed-delivery basis, the Portfolio does not participate in future gains and losses with respect to the security.
Federal Income Taxes. The Portfolio intends to qualify as a regulated investment company under sub-chapter M of the Internal Revenue Code and distribute all of its taxable income and net realized gains, if applicable, to shareholders. Accordingly, no provision for Federal income taxes has been made.
Futures Contracts. The Portfolio is authorized to enter into futures contracts. The Portfolio may use futures contracts to manage its exposure to the securities markets or to movements in interest rates and currency values. The primary risks associated with the use of futures contracts are the imperfect correlation between the change in market value of the securities held by the Portfolio and the prices of futures contracts, the possibility of an illiquid market, and the inability of the counterparty to meet the terms of the contract. Futures contracts are valued based upon their quoted daily settlement prices. Upon entering into a futures contract, the Portfolio is required to deposit with its custodian, in a segregated account in the name of the futures broker, an amount of cash or U.S. Government and Agency Obligations in accordance with the initial margin requirements of the broker or exchange. Futures contracts are marked to market daily and an appropriate payable or receivable for the change in value (“variation margin”) is recorded by the Portfolio. Gains or losses are recognized but not considered realized until the contracts expire or are closed. Futures contracts involve, to varying degrees, risk of loss in excess of the variation margin disclosed in the Statement of Assets and Liabilities.
Inflation-Indexed Bonds. The Portfolio may invest in inflation-indexed bonds. Inflation-indexed bonds are fixed-income securities whose principal value is periodically adjusted to the rate of inflation. The interest rate on these bonds is generally fixed at issuance at a rate lower than typical bonds. Over the life of an inflation-indexed bond, however, interest will be paid based on a principal value, which is adjusted for inflation. Any increase in the principal amount of an inflation-indexed bond will be included as interest income in the Statement of Operations, even though investors do not receive their principal until maturity.
Options Contracts. The Portfolio may write call and put options on futures, swaps, securities or currencies it owns or in which it may invest. Writing put options tends to increase the Portfolio’s exposure to the underlying instrument. Writing call options tends to decrease the Portfolio’s exposure to the underlying instrument. When the Portfolio writes a call or put option, an amount equal to the premium received is recorded as a liability and subsequently marked to market to reflect the current value of the option written. These liabilities are reflected as written options outstanding in the Statement of Assets and Liabilities. Certain options may be written with premiums to determined on a future date. The premiums for these options are based upon implied volatility parameters at specified terms. Premiums received from writing options which expire are treated as realized gains. Premiums received from writing options which are exercised or closed are added to the proceeds or offset against amounts paid on the underlying future, swap, security or currency transaction to determine the realized gain or loss. The Portfolio as a writer of an option has no control over whether the underlying future, swap, security or currency may be sold (call) or purchased (put) and as a result bears the market risk of an unfavorable change in the price of the future, swap, security or currency underlying the written option. There is the risk the Portfolio may not be able to enter into a closing transaction because of an illiquid market.
The Portfolio may also purchase put and call options. Purchasing call options tends to increase the Portfolio’s exposure to the underlying instrument. Purchasing put options tends to decrease the Portfolio’s exposure to the underlying instrument. The Portfolio pays a premium which is included in the Portfolio’s Statement of Assets and Liabilities as an investment and subsequently marked to market to reflect the current value of the option. Premiums paid for purchasing options which expire are treated as realized losses. Certain options may be purchased with premiums to be determined on a future date. The premiums for these options are based upon implied volatility parameters at specified terms. The risk associated with purchasing put and call options is limited to the premium paid. Premiums paid for purchasing options which are exercised or closed are added to the amounts paid or offset against the proceeds on the underlying future, swap, security or currency transaction to determine the realized gain or loss.
Repurchase Agreements. The Portfolio may engage in repurchase transactions. Under the terms of a typical repurchase agreement, the Portfolio takes possession of an underlying debt obligation subject to an obligation of the seller to repurchase, and the Portfolio to resell, the obligation at an agreed-upon price and time. The market value of the collateral must be equal to or exceed at all times the total amount of the repurchase obligations, including interest. Securities purchased under repurchase agreements are reflected as an asset in the Statement of Assets and Liabilities. Generally, in the event of counterparty default, the Portfolio has the right to use the collateral to offset losses incurred. If the counterparty should default, the Portfolio will seek to sell the securities which it holds as collateral. This could involve procedural costs or delays in addition to a loss on the securities if their value should fall below their repurchase price.
Short Sales. The Portfolio may enter into short sales transactions. A short sale is a transaction in which the Portfolio sells securities it does not own in anticipation of a decline in the market price of the securities. Securities sold in short sale transactions and interest payable on such securities, if any, are reflected as a liability in the Statement of Assets and Liabilities. The Portfolio is obligated to deliver securities at the market price at the time the short position is closed. Possible losses from short sales may be unlimited, whereas losses from purchases cannot exceed the total amount invested.
Mortgage-Related and Other Asset-Backed Securities. The Portfolio may invest in mortgage-related or other asset-backed securities. These securities include mortgage pass-through securities, collateralized mortgage obligations (“CMOs”), commercial mortgage-backed securities, mortgage dollar rolls, CMO
| | | | | | |
| | | Semiannual Report | | June 30, 2006 | | 13 |
Notes to Financial Statements (Cont.)
residuals, stripped mortgage-backed securities (“SMBSs”) and other securities that directly or indirectly represent a participation in, or are secured by and payable from, mortgage loans on real property. The value of some mortgage- or asset-backed securities may be particularly sensitive to changes in prevailing interest rates. Early repayment of principal on some mortgage-related securities may expose a Fund to a lower rate of return upon reinvestment of principal. The value of these securities may fluctuate in response to the market’s perception of the creditworthiness of the issuers. Additionally, although mortgages and mortgage-related securities are generally supported by some form of government or private guarantee and/or insurance, there is no assurance that private guarantors or insurers will meet their obligations.
One type of SMBS has one class receiving all of the interest from the mortgage assets (the interest-only, or “IO” class), while the other class will receive all of the principal (the principal-only, or “PO” class). Payments received for IOs are included in interest income in the Statement of Operations. Because principal will not be received at the maturity of an IO, adjustments are made to the book value of the security on a daily basis until maturity. These adjustments are included in interest income in the Statement of Operations. Payments received for POs are treated as reductions to the cost and par value of the securities.
Swap Agreements. The Portfolio may engage in swap transactions, including, but not limited to, swap agreements on interest rate to manage its exposure to interest rates and credit risk. In connection with these agreements, securities may be identified as collateral in accordance with the terms of the respective swap agreements.
Interest rate swap agreements involve the exchange by the Portfolio with another party of their respective commitments to pay or receive interest, e.g., an exchange of floating rate payments for fixed rate payments with respect to the notional amount of principal.
Swaps are marked to market daily based upon quotations from market makers and the change in value, if any, is recorded as unrealized gain or loss in the Statement of Operations. Payments received or made at the beginning of the measurement period are reflected as such in the Statement of Assets and Liabilities. These upfront payments are recorded as realized gain or loss in the Statement of Operations upon termination or maturity of the swap. A liquidation payment received or made at the termination of the swap is recorded as realized gain or loss in the Statement of Operations. Net periodic payments received or paid by the Portfolio are included as part of realized gain or loss in the Statement of Operations. Entering into these agreements involves, to varying degrees, elements of credit, market and documentation risk in excess of the amounts recognized in the Statement of Assets and Liabilities. Such risks involve the possibility that there will be no liquid market for these agreements, that the counterparty to the agreements may default on its obligation to perform or disagree as to the meaning of contractual terms in the agreements and that there may be unfavorable changes in interest rates.
U.S. Government Agencies or Government-Sponsored Enterprises. Securities issued by U.S. Government agencies or government-sponsored enterprises may not be guaranteed by the U.S. Treasury. The Government National Mortgage Association (“GNMA”), a wholly owned U.S. Government corporation, is authorized to guarantee, with the full faith and credit of the U.S. Government, the timely payment of principal and interest on securities issued by institutions approved by GNMA and backed by pools of mortgages insured by the Federal Housing Administration or guaranteed by the Department of Veterans Affairs. Government-related guarantors (i.e., not backed by the full faith and credit of the U.S. Government) include the Federal National Mortgage Association (“FNMA” or “Fannie Mae”) and the Federal Home Loan Mortgage Corporation (“FHLMC” or “Freddie Mac”). Pass-through securities issued by FNMA are guaranteed as to timely payment of principal and interest by FNMA but are not backed by the full faith and credit of the U.S. Government. FHLMC guarantees the timely payment of interest and ultimate collection of principal, but its participation certificates are not backed by the full faith and credit of the U.S. Government.
Guarantees and Indemnifications. Under the Trust’s organizational documents, each Trustee, officer, employee or other agent of the Trust (including the Trust’s investment manager) is indemnified against certain liabilities that may arise out of performance of their duties to the Portfolio. Additionally, in the normal course of business, the Portfolio enters into contracts that contain a variety of indemnification clauses. The Portfolio’s maximum exposure under these arrangements is unknown as this would involve future claims that may be made against the Portfolio that have not yet occurred. However, the Portfolio has not had prior claims or losses pursuant to these contracts, and believes the risk of loss to be remote.
New Accounting Policies. In July 2006, the Financial Accounting Standards Board issued Interpretation No. 48, “Accounting for Uncertainty in Income Taxes—an Interpretation of FASB Statement No. 109” (the “Interpretation”). The Interpretation is effective for fiscal years beginning after December 15, 2006. Management is currently evaluating the application of the Interpretation to the Portfolio and will provide additional information in relation to the Interpretation in the Portfolio’s annual financial statements for the year ending December 31, 2006.
3. FEES, EXPENSES, AND RELATED PARTY TRANSACTIONS
Investment Advisory Fee. PIMCO is a majority-owned subsidiary of Allianz Global Investors of America L.P. (“AGI”), and serves as investment adviser (the “Adviser”) to the Trust, pursuant to an investment advisory contract. The Adviser receives a monthly fee at an annual rate based on average daily net assets of the Portfolio. The Advisory Fee is charged at an annual rate of 0.225%.
Administration Fee. PIMCO serves as administrator (the “Administrator”), and provides administrative services to the Trust for which it receives a monthly administrative fee based on average daily net assets of the Portfolio. As the Administrator, PIMCO bears the costs of various third-party services, including audit, custodial, portfolio accounting, legal, transfer agency and printing costs. The Administration Fee is charged at the annual rate of 0.25%.
Distribution and Servicing Fees. Allianz Global Investors Distributors LLC (“AGID”) is an indirect wholly-owned subsidiary of AGI and serves as the distributor of the Trust’s shares. The Trust is permitted to reimburse AGID on a quarterly basis, out of the Administrative Class assets of the Portfolio in the amount of 0.15% on an annual basis of the average daily net assets of that class, for payments made to financial intermediaries that provide services in connection with the distribution of shares or administration of plans or programs that use Portfolio shares as their funding medium. The effective rate paid to AGID was 0.15% during the current fiscal year.
Expenses. The Trust is responsible for the following expenses: (i) salaries and other compensation of any of the Trust’s executive officers and employees who are not officers, directors, stockholders or employees of PIMCO or its subsidiaries or affiliates; (ii) taxes and governmental fees; (iii) brokerage fees and commissions and other portfolio transaction expenses; (iv) the costs of borrowing money, including interest expenses and bank overdraft charges; (v) fees and expenses of the Trustees who are not “interested persons” of PIMCO or the Trust, and any counsel retained exclusively for their benefit; (vi) extraordinary expenses, including costs of litigation and indemnification expenses; (vii) organization expenses and (viii) any expenses allocated or allocable to a specific class of shares, which include service fees payable with respect to the Administrative Class shares and may include certain other expenses as permitted by the Trust’s Multiple Class Plan adopted pursuant to Rule 18f-3 under the Act and subject to review and approval
| | | | |
| 14 | | PIMCO Variable Insurance Trust | | |
| | |
| |
| | | June 30, 2006 (Unaudited) |
by the Trustees. The ratio of expenses to average net assets per share class, as disclosed in the Financial Highlights, may differ from the annual portfolio operating expenses per share class as disclosed in the Prospectus for the reasons set forth above.
For the current period ended June 30, 2006, each unaffiliated Trustee received an annual retainer of $15,000, plus $2,000 for each Board of Trustees quarterly meeting attended, $500 for each Board of Trustees committee meeting attended and $500 for each special board meeting attended, plus reimbursement of related expenses. In addition, each Committee Chair received an additional annual retainer of $500 and each Audit Committee Chair received an additional annual retainer of $1,500. These expenses are allocated on a pro-rata basis to each Portfolio of the Trust according to its respective net assets. The Trust pays no compensation directly to any Trustee or any other officer who is affiliated with the Administrator, all of whom receive remuneration for their services to the Trust from the Administrator or its affiliates.
4. PURCHASES AND SALES OF SECURITIES
The length of time the Portfolio has held a particular security is not generally a consideration in investment decisions. A change in the securities held by the Portfolio is known as “portfolio turnover”. The Portfolio may engage in frequent and active trading of portfolio securities to achieve its investment objective, particularly during periods of volatile market movements. High portfolio turnover (e.g., over 100%) involves correspondingly greater expenses to the Portfolio, including brokerage commissions or dealer mark-ups and other transaction costs on the sale of securities and reinvestments in other securities. Such sales may also result in realization of taxable capital gains, including short-term capital gains (which are generally taxed at ordinary income tax rates). The trading costs and tax effects associated with portfolio turnover may adversely affect the Portfolio’s performance.
Purchases and sales of securities (excluding short-term investments) for the period ended June 30, 2006 were as follows (amounts in thousands):
| | | | | | | | | | | | | | | | |
| | U.S Government/Agency | | | | | All Other |
| | Purchases | | | | | Sales | | | | | Purchases | | | | | Sales |
| $ | 576,682 | | | | $ | 593,972 | | | | $ | 4,345 | | | | $ | 1,148 |
5. TRANSACTIONS IN WRITTEN CALL AND PUT OPTIONS
Transactions in written call and put options were as follows (amounts in thousands, except number of contracts):
| | | | | | | | | | | | | | | | |
| | | | | # of
Contracts |
| | | |
| Notional
Amount
in $ | | | | | Premium | |
Balance at 12/31/2005 | | | | 92 | | | | | $ | 5,800 | | | | $ | 170 | |
Sales | | | | 132 | | | | | | 1,400 | | | | | 70 | |
Closing Buys | | | | 0 | | | | | | 0 | | | | | 0 | |
Expirations | | | | (50 | ) | | | | | 0 | | | | | (24 | ) |
Exercised | | | | 0 | | | | | | 0 | | | | | 0 | |
Balance at 06/30/2006 | | | | 174 | | | | | $ | 7,200 | | | | $ | 216 | |
6. SHARES OF BENEFICIAL INTEREST
The Portfolio may issue an unlimited number of shares of beneficial interest with a $0.001 par value. Changes in shares of beneficial interest were as follows (shares and amounts in thousands):
| | | | | | | | | | | | | | | | | | |
| | | | | Six Months Ended
06/30/2006 | | | | | Year Ended
12/31/2005 | |
| | | | | Shares | | | Amount | | | | | Shares | | | Amount | |
| | | | | | |
Receipts for shares sold | | | | | | | | | | | | | | | | | | |
Institutional Class | | | | 33 | | | $ | 342 | | | | | 23 | | | $ | 261 | |
Administrative Class | | | | 373 | | | | 3,885 | | | | | 612 | | | | 6,964 | |
Issued as reinvestment of distributions | | | | | | | | | | | | | | | | | | |
Institutional Class | | | | 1 | | | | 11 | | | | | 2 | | | | 24 | |
Administrative Class | | | | 168 | | | | 1,755 | | | | | 510 | | | | 5,676 | |
Cost of shares redeemed | | | | | | | | | | | | | | | | | | |
Institutional Class | | | | (8 | ) | | | (79 | ) | | | | (17 | ) | | | (195 | ) |
Administrative Class | | | | (680 | ) | | | (7,142 | ) | | | | (1,227 | ) | | | (13,891 | ) |
Net decrease resulting from Portfolio share transactions | | | | (113 | ) | | $ | (1,228 | ) | | | | (97 | ) | | $ | (1,161 | ) |
The following schedule shows the number of shareholders each owning 5% or more of the Portfolio and the total percentage of the Portfolio held by such shareholders:
| | | | | | |
| | | | | Number of
Shareholders | | % of Portfolio
Held |
Institutional Class | | | | 1 | | 98 |
Administrative Class | | | | 3 | | 94 |
7. FEDERAL INCOME TAX MATTERS
As of June 30, 2006, the aggregate cost of investments was the same for federal income tax and financial statement purposes. The net unrealized appreciation (depreciation) of investment securities for federal income tax purposes is as follows (amounts in thousands):
| | | | |
Aggregate
Gross
Unrealized
Appreciation | | Aggregate
Gross
Unrealized
(Depreciation) | | Net
Unrealized
(Depreciation) |
$ 245 | | $ (1,842) | | $ (1,597) |
8. REGULATORY AND LITIGATION MATTERS
On June 1, 2004, the Attorney General of the State of New Jersey announced that it had dismissed PIMCO from a complaint filed by the New Jersey Attorney General on February 17, 2004, and that it had entered into a settlement agreement (the “New Jersey Settlement”) with Allianz Global Investors of America L.P. (“AGI”) (formerly known as Allianz Dresdner Asset Management of America L.P.), PEA Capital LLC (an entity affiliated with PIMCO through common ownership) (“PEA”) and Allianz Global Investors Distributors LLC (“AGID”), in connection with the same matter. In the New Jersey Settlement, AGI, PEA and AGID neither admitted nor denied the allegations or conclusions of law, but did agree to pay New Jersey a civil fine of $15 million and $3 million for investigative costs and further potential enforcement initiatives against unrelated parties. They also undertook to implement certain governance changes. The complaint relating to the New Jersey Settlement alleged, among other things, that AGI, PEA and AGID had failed to disclose that they improperly allowed certain hedge funds to engage in “market timing” in certain funds. The complaint sought injunctive relief, civil monetary penalties, restitution and disgorgement of profits.
| | | | | | |
| | | Semiannual Report | | June 30, 2006 | | 15 |
Notes to Financial Statements (Cont.)
Since February 2004, PIMCO, AGI, PEA, AGID, and certain of their affiliates, including the PIMCO Funds, the Allianz Funds (formerly known as PIMCO Funds: Multi-Manager Series), and the Trustees and employees of the PIMCO Funds, have been named as defendants in fifteen lawsuits filed in various jurisdictions. Eleven of those lawsuits concern “market timing,” and they have been transferred to and consolidated for pre-trial proceedings in a multi-district litigation proceeding in the U.S. District Court for the District of Maryland; the other four lawsuits concern “revenue sharing” and have been consolidated into a single action in the U.S. District Court for the District of Connecticut. The lawsuits have been commenced as putative class actions on behalf of investors who purchased, held or redeemed shares of the various series of the PIMCO Funds and the Allianz Funds during specified periods, or as derivative actions on behalf of the PIMCO Funds and Allianz Funds.
The market timing actions in the District of Maryland generally allege that certain hedge funds were allowed to engage in “market timing” in certain of the PIMCO Funds and the Allianz Funds and this alleged activity was not disclosed. Pursuant to tolling agreements entered into with the derivative and class action plaintiffs, PIMCO, the Trustees, and certain employees of PIMCO who were previously named as defendants have all been dropped as defendants in the market timing actions; the plaintiffs continue to assert claims on behalf of the shareholders of the PIMCO Funds or on behalf of the PIMCO Funds themselves against other defendants. By order dated November 3, 2005, the U.S. District Court for the District of Maryland granted the PIMCO Funds’ motion to dismiss claims asserted against it in a consolidated amended complaint where the PIMCO Funds were named, in the complaint, as a nominal defendant. The revenue sharing action in the District of Connecticut generally alleges that fund assets were inappropriately used to pay brokers to promote the PIMCO Funds and Allianz Funds, including directing fund brokerage transactions to such brokers, and that such alleged arrangements were not fully disclosed to shareholders. On August 11, 2005 the U.S. District Court for the District of Connecticut conducted a hearing on defendants’ motion to dismiss the consolidated amended complaint in the revenue sharing action but has not yet ruled on the motion to dismiss. The market timing and revenue sharing lawsuits seek, among other things, unspecified compensatory damages plus interest and, in some cases, punitive damages, the rescission of investment advisory contracts, the return of fees paid under those contracts and restitution.
Under Section 9(a) of the Investment Company Act of 1940, as amended (“1940 Act”), if the New Jersey Settlement or any of the lawsuits described above were to result in a court injunction against AGI, PEA, AGID and/or their affiliates, PIMCO could, in the absence of exemptive relief granted by the SEC, be barred from serving as an investment adviser, and AGID could be barred from serving as principal underwriter, to any registered investment company, including the Portfolios of the Trust. In connection with an inquiry from the SEC concerning the status of the New Jersey Settlement under Section 9(a), PEA, AGID, AGI and certain of their affiliates (including PIMCO) (together, the “Applicants”) have sought exemptive relief from the SEC under Section 9(c) of the 1940 Act. The SEC has granted the Applicants a temporary exemption from the provisions of Section 9(a) with respect to the New Jersey Settlement until the earlier of (i) September 13, 2006 and (ii) the date on which the SEC takes final action on their application for a permanent order. There is no assurance that the SEC will issue a permanent order.
Two nearly identical class action civil complaints have been filed in August 2005, in the Northern District of Illinois Eastern Division alleging that the plaintiffs each purchased and sold a 10-year Treasury note futures contract and suffered damages from an alleged shortage when PIMCO held both physical and futures positions in 10-year Treasury notes for its client accounts. The two actions have been consolidated into one action, and the two separate complaints have been replaced by a consolidated complaint. PIMCO is a named defendant, and the PIMCO Funds have been added as a defendant, to the consolidated action. PIMCO strongly believes the complaint (and any consolidated complaint filed hereafter) is without merit and intends to vigorously defend itself.
Certain Portfolios of the Trust were recently served in an adversary proceeding brought by the Official Committee of Asbestos Claimants of G-I Holdings, Inc. in G-I Holdings, Inc.’s bankruptcy in the District of New Jersey. PIMCO was previously named in this lawsuit and remains a defendant. The plaintiff seeks to recover for the bankruptcy estate assets that were transferred by the predecessor entity of G-I Holdings, Inc. to a wholly-owned subsidiary in 1994. The subsidiary has since issued notes, of which certain Portfolios of the Trust are alleged to be holders. The complaint alleges that in 2000, more than two hundred noteholders—including certain Portfolios of the Trust—were granted a second priority lien on the assets of the subsidiary in exchange for their consent to a refinancing transaction and the granting of a first priority lien to the lending banks. The plaintiff is seeking invalidation of the lien in favor of the noteholders and/or the value of the lien.
It is possible that these matters and/or other developments resulting from these matters could result in increased fund redemptions or other adverse consequences to the Portfolios. However, PIMCO and AGID believe that these matters are not likely to have a material adverse effect on the Portfolios or on PIMCO’s or AGID’s ability to perform their respective investment advisory or distribution services relating to the Portfolios.
| | | | |
| 16 | | PIMCO Variable Insurance Trust | | |
Investment Adviser and Administrator
Pacific Investment Management Company LLC
840 Newport Center Drive
Newport Beach, California 92660
Distributor
Allianz Global Investors Distributors LLC
2187 Atlantic Street
Stamford, Connecticut 06902
Custodian
State Street Bank & Trust Company
801 Pennsylvania
Kansas City, Missouri 64105
Transfer Agent
Boston Financial Data Services–Midwest
330 W. 9th Street
Kansas City, Missouri 64105
Legal Counsel
Dechert LLP
1775 I Street, N.W.
Washington, D.C. 20006
Independent Registered Public Accounting Firm
PricewaterhouseCoopers LLP
1055 Broadway
Kansas City, Missouri 64105
P I M C O

Share Class Institutional
Semiannual Report June 30, 2006
PIMCO Variable Insurance Trust
Long-Term U.S. Government Portfolio
Table of Contents
This material is authorized for use only when preceded or accompanied by the current PIMCO Variable Insurance Trust (the “Trust”) prospectus. Investors should consider the investment objectives, risks, charges and expenses of this Trust carefully before investing. Ask your financial professional to explain all charges that may apply. This and other information is contained in the Trust’s prospectus. The variable product prospectus may be obtained by contacting your Investment Consultant. Please read the Trust and variable product prospectus carefully before you invest or send money.
Chairman’s Letter
Dear PIMCO Variable Insurance Trust Shareholder:
It is our pleasure to present to you the semiannual report for the PIMCO Variable Insurance Trust covering the six-month period ended June 30, 2006.
Highlights of the global bond markets during the six-month period included:
| | n | | Most fixed-income sectors lost ground during the first half of 2006, as concern about accelerating inflation and central bank tightening pushed interest rates higher worldwide. The benchmark Lehman Brothers Aggregate Bond Index (which includes Treasury, Investment-Grade Corporate, and Residential Mortgage-Backed Securities) returned -0.72% for the first six months of the year. On June 30, the benchmark ten-year Treasury yielded 5.14%, 0.75% higher than at the start of the year. The U.S. yield curve remained flat as shorter-maturity yields rose by a comparable amount. |
| | n | | The Federal Reserve tightened four times during the reporting period, bringing the Federal Funds Rate to 5.25%. The increase near the end of the period was the Federal Reserve’s 17th consecutive rate hike since the start of its tightening cycle in 2004. The Federal Reserve was not alone, as central banks in Europe, India, and China tightened credit in unison for the first time since 2000. The Bank of Japan, whose zero-interest-rate policy has flooded global markets with liquidity, looked set to reverse this policy in the coming months. |
In these pages please find a more complete Portfolio review as it relates to financial-market activities, as well as details about total-return investment performance for the six-month reporting period. Thank you for the trust you have placed in us. We will continue to work diligently to meet your investment needs.
Sincerely,
Brent R. Harris
Chairman, PIMCO Variable Insurance Trust
July 31, 2006
| | | | | | |
| | | Semiannual Report | | June 30, 2006 | | 1 |
Important Information About the Portfolio
PIMCO Variable Insurance Trust (the “Trust”) is an open-end management investment company currently consisting of nineteen separate investment portfolios, including the Long-Term U.S. Government Portfolio (the “Portfolio”). The Portfolio is only available as a funding vehicle under variable life insurance policies or variable annuity contracts issued by insurance companies (“Variable Contracts”). Individuals may not purchase shares of the Portfolio directly. Shares of the Portfolio also may be sold to qualified pension and retirement plans outside of the separate account context.
We believe that bond funds have an important role to play in a well diversified investment portfolio. It is important to note, however, that in an environment where interest rates may trend upward, rising rates would negatively impact the performance of most bond funds, and fixed-income securities held by a fund are likely to decrease in value. The price volatility of fixed-income securities can also increase during periods of rising interest rates resulting in increased losses to a fund. Bond funds and individual bonds with a longer duration (a measure of the expected life of a security) tend to be more sensitive to changes in interest rates, usually making them more volatile than securities or funds with shorter durations. The longer-term performance of most bond funds has benefited from capital gains in part resulting from an extended period of declining interest rates. In the event interest rates increase, these capital gains should not be expected to recur.
The Portfolio may be subject to various risks in addition to those described above. Some of these risks may include, but are not limited to, the following: credit risk, market risk, issuer risk, derivatives risk, mortgage risk, leveraging risk and management risk. A complete description of these risks is contained in the Portfolio’s prospectus. The Portfolio may use derivative instruments for hedging purposes or as part of an investment strategy. Use of these instruments may involve certain costs and risks such as liquidity risk, interest rate risk, market risk, credit risk, management risk and the risk that the Portfolio could not close out a position when it would be most advantageous to do so. A Portfolio investing in derivatives could lose more than the principal amount invested in these instruments.
On the performance summary page in this Semiannual Report, the Total Return Investment Performance table measures performance assuming that all dividend and capital gain distributions were reinvested.
An investment in the Portfolio is not a deposit of a bank and is not guaranteed or insured by the Federal Deposit Insurance Corporation or any other government agency. It is possible to lose money on investments in the Portfolio.
PIMCO has adopted written proxy voting policies and procedures (“Proxy Policy”) as required by Rule 206(4)-6 under the Investment Advisers Act of 1940. The Proxy Policy has been adopted by the Trust as the policies and procedures that PIMCO will use when voting proxies on behalf of the Portfolio. Copies of the written Proxy Policy and the factors that PIMCO may consider in determining how to vote proxies for the Portfolio, and information about how the Portfolio voted proxies relating to portfolio securities held during the most recent twelve-month period ended June 30, are available without charge, upon request, by calling the Trust at 1-866-746-2606 and on the Securities and Exchange Commission’s (“SEC”) website at http://www.sec.gov.
The Portfolio files its complete schedule of portfolio holdings with the SEC for the first and third quarters of each fiscal year on Form N-Q. A copy of the Trust’s Form N-Q is available on the SEC’s website at http://www.sec.gov and may be reviewed and copied at the SEC’s Public Reference Room in Washington D.C. Information on the operation of the Public Reference Room may be obtained by calling 1-800-SEC-0330.
PIMCO Variable Insurance Trust is distributed by Allianz Global Investors Distributors LLC, 2187 Atlantic Street, Stamford, CT 06902.
| | | | |
| 2 | | PIMCO Variable Insurance Trust | | |
The following disclosure provides important information regarding the Portfolio’s Expense Example (“Example” or “Expense Example”), which appears in this Semiannual Report. Please refer to this information when reviewing the Expense Example for the Portfolio.
Example
As a shareholder of the Portfolio, you incur two types of costs: (1) transaction costs and (2) ongoing costs, including advisory and administrative fees; distribution and/or service (12b-1) fees (Administrative Class only); and other Portfolio expenses. The Example is intended to help you understand your ongoing costs (in dollars) of investing in the Portfolio and to compare these costs with the ongoing costs of investing in other mutual funds. The Expense Example does not reflect any fees or other expenses imposed by the Variable Contracts. If it did, the expenses reflected in the Expense Examples would be higher. The Example is based on an investment of $1,000 invested at the beginning of the period and held for the entire period indicated, which is from January 1, 2006 to Semiannual.
Actual Expenses
The information in the table under the heading “Actual Performance” provides information about actual account values and actual expenses. You may use the information in these columns, together with the amount you invested, to estimate the expenses that you paid over the period. Simply divide your account value by $1,000 (for example, an $8,600 account value divided by $1,000 = 8.60), then multiply the result by the number in the appropriate column for your share class, in the row titled “Expenses Paid During Period” to estimate the expenses you paid on your account during this period.
Hypothetical Example for Comparison Purposes
The information in the table under the heading “Hypothetical Performance (5% return before expenses)” provides information about hypothetical account values and hypothetical expenses based on the Portfolio’s actual expense ratio and an assumed rate of return of 5% per year before expenses, which is not the Portfolio’s actual return. The hypothetical account values and expenses may not be used to estimate the actual ending account balance or expenses you paid for the period. You may use this information to compare the ongoing costs of investing in the Portfolio and other portfolios. To do so, compare this 5% hypothetical example with the 5% hypothetical examples that appear in the shareholder reports of the other portfolios.
Please note that the expenses shown in the table are meant to highlight your ongoing costs only and do not reflect any transactional costs. Therefore, the information under the heading “Hypothetical Performance (5% return before expenses)” is useful in comparing ongoing costs only, and will not help you determine the relative total costs of owning different portfolios. In addition, if these transactional costs were included, your costs would have been higher.
The expense ratio may vary period to period because of various factors, such as an increase in expenses not covered by the advisory and administrative fees (such as expenses of the trustees and their counsel or litigation expense).
Portfolio Benchmark
Lehman Brothers Long-Term Treasury consists of U.S. Treasury issues with maturities of 10 or more years. It is not possible to invest directly in such an unmanaged index.
| | | | | | |
| | | Semiannual Report | | June 30, 2006 | | 3 |
|
|
| PIMCO Long-Term U.S. Government Portfolio |
|
Cumulative Returns Through June 30, 2006
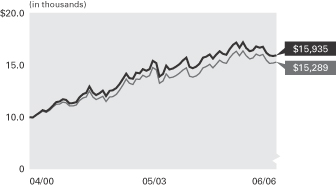
Long-Term U.S. Government Lehman Brothers Long
Portfolio Institutional Class Term Treasury Index
----------------------------- -------------------
04/30/2000 $10,000 $10,000
05/31/2000 9,957 9,964
06/30/2000 10,207 10,180
07/31/2000 10,414 10,355
08/31/2000 10,668 10,591
09/30/2000 10,552 10,463
10/31/2000 10,765 10,626
11/30/2000 11,097 10,962
12/31/2000 11,429 11,220
01/31/2001 11,485 11,239
02/28/2001 11,708 11,431
03/31/2001 11,657 11,374
04/30/2001 11,320 11,065
05/31/2001 11,346 11,079
06/30/2001 11,443 11,174
07/31/2001 11,908 11,590
08/31/2001 12,192 11,838
09/30/2001 12,328 11,927
10/31/2001 12,935 12,512
11/30/2001 12,346 11,918
12/31/2001 12,118 11,694
01/31/2002 12,311 11,844
02/28/2002 12,532 11,982
03/31/2002 12,016 11,498
04/30/2002 12,509 11,935
05/31/2002 12,572 11,972
06/30/2002 12,779 12,187
07/31/2002 13,164 12,562
08/31/2002 13,690 13,111
09/30/2002 14,173 13,657
10/31/2002 13,741 13,265
11/30/2002 13,674 13,118
12/31/2002 14,272 13,656
01/31/2003 14,197 13,609
02/28/2003 14,618 14,021
03/31/2003 14,437 13,845
04/30/2003 14,609 13,986
05/31/2003 15,400 14,772
06/30/2003 15,178 14,547
07/31/2003 13,905 13,246
08/31/2003 14,128 13,457
09/30/2003 14,941 14,158
10/31/2003 14,569 13,764
11/30/2003 14,655 13,830
12/31/2003 14,850 13,995
01/31/2004 15,086 14,235
02/29/2004 15,433 14,518
03/31/2004 15,703 14,739
04/30/2004 14,807 13,912
05/31/2004 14,708 13,844
06/30/2004 14,837 13,970
07/31/2004 15,128 14,207
08/31/2004 15,706 14,734
09/30/2004 15,798 14,858
10/31/2004 16,019 15,077
11/30/2004 15,620 14,741
12/31/2004 15,998 15,073
01/31/2005 16,324 15,453
02/28/2005 16,078 15,254
03/31/2005 15,980 15,152
04/30/2005 16,503 15,670
05/31/2005 16,925 16,077
06/30/2005 17,145 16,318
07/31/2005 16,653 15,890
08/31/2005 17,175 16,352
09/30/2005 16,633 15,883
10/31/2005 16,318 15,590
11/30/2005 16,422 15,688
12/31/2005 16,783 16,053
01/31/2006 16,677 15,906
02/28/2006 16,740 16,019
03/31/2006 16,184 15,472
04/30/2006 15,914 15,171
05/31/2006 15,863 15,172
06/30/2006 15,935 15,289
$10,000 invested at the beginning of the first full month following the inception date of the Portfolio’s Institutional Class.
Sector Breakdown‡
| | |
U.S. Treasury Obligations | | 33.6% |
U.S. Government Agencies | | 31.7% |
Short-Term Instruments | | 11.9% |
Mortgage-Backed Securities | | 11.4% |
Other | | 11.4% |
| | ‡ | % of Total Investments as of June 30, 2006 |
| | | | | | | | | | | | |
Average Annual Total Return for the period ended June 30, 2006 |
| | | | | | | 6 Months* | | 1 Year | | 5 Years | | Since Inception
(04/10/00)** |
| | |
| | PIMCO Long-Term U.S. Government Portfolio Institutional Class | | -5.05% | | -7.06% | | 6.84% | | 7.32% |
| | |
| | Lehman Brothers Long Term Treasury Index | | -4.76% | | -6.31% | | 6.47% | | 6.89% |
All Portfolio returns are net of fees and expenses.
* Cumulative return.
** The Institutional Class shares commenced operations on 04/10/00. Index comparisons began on 03/31/00.
Past performance is no guarantee of future results. The performance quoted represents past performance. Investment return and principal value will fluctuate so the Portfolio shares, when redeemed, may be worth more or less than their original cost. The Portfolio’s performance does not reflect the deduction of additional charges and expenses imposed in connection with investing in Variable Contracts, which will reduce returns. Current performance may be lower or higher than the performance data quoted. Performance data current to the most recent month-end is available by calling (800) 927-4648.
| | | | | | | | |
| Expense Example | | Actual Performance | | | | Hypothetical Performance |
| | | | | | | (5% return before expenses) |
Beginning Account Value (01/01/06) | | $ | 1,000.00 | | | | $ | 1,000.00 |
Ending Account Value (06/30/06) | | $ | 949.50 | | | | $ | 1,022.46 |
Expenses Paid During Period† | | $ | 2.27 | | | | $ | 2.36 |
† Expenses are equal to the Portfolio’s Institutional Class annualized expense ratio of 0.47%, multiplied by the average account value over the period, multiplied by 181/365 (to reflect the one-half year period). Overall fees and expenses of investing in the Portfolio will be higher because the example does not reflect Variable Contract fees and expenses.
Please refer to page 3 herein for a description of the Portfolio’s benchmark and an explanation of the information presented in the above Expense Example.
Portfolio Insights
| » | | The PIMCO Long-Term U.S. Government Portfolio seeks to achieve its investment objective by investing under normal circumstances at least 80% of its assets in a diversified portfolio of Fixed-Income Securities that are issued or guaranteed by the U.S. Government, its agencies or government-sponsored enterprises (“U.S. Government Securities”). |
| » | | The Portfolio’s emphasis on the short-term portion of the curve, especially the 0-1 year maturity bucket, throughout the six-month reporting period ended June 30, 2006 was a negative for relative performance because these rates rose the most as the yield curve flattened. |
| » | | Because swap spreads widened over the first six months of 2006, the modest allocation to interest rate swaps negatively impacted returns relative to the benchmark. |
| » | | An out-of-benchmark allocation to structured mortgages had a positive effect on relative performance as mortgages outperformed long-term Treasuries over the six-month reporting period ended June 30, 2006. |
| » | | Long municipal bonds outperformance versus Treasuries with a similar duration was positive for the Portfolio’s relative performance during the six-month period due to a modest out-of-benchmark allocation to long municipal bonds. |
| » | | A modest out-of-benchmark allocation to short Treasury Inflation-Protected Securities (“TIPS”) was positive for the six-month period ended June 30, 2006 while the modest out-of-benchmark allocation to long TIPS was negative as they respectively outperformed and underperformed long-term Treasuries. Overall, TIPS were positive over the six-month reporting period. |
| | | | | | |
| 4 | | PIMCO Variable Insurance Trust | | | | |
|
|
| Financial Highlights Long-Term U.S. Government Portfolio |
| | | | | | | | | | | | | | | | | | | | | | | | |
| Selected Per Share Data for the Year or Period Ended: | | 06/30/2006+ | | | 12/31/2005 | | | 12/31/2004 | | | 12/31/2003 | | | 12/31/2002 | | | 12/31/2001 | |
| | | | | | |
Institutional Class | | | | | | | | | | | | | | | | | | | | | | | | |
| Net asset value beginning of period | | $ | 11.00 | | | $ | 11.19 | | | $ | 11.01 | | | $ | 11.09 | | | $ | 10.27 | | | $ | 10.56 | |
| Net investment income (a) | | | 0.23 | | | | 0.42 | | | | 0.36 | | | | 0.32 | | | | 0.46 | | | | 0.54 | |
| Net realized/unrealized gain (loss) on investments (a) | | | (0.78 | ) | | | 0.12 | | | | 0.48 | | | | 0.12 | | | | 1.31 | | | | 0.08 | |
| Total income (loss) from investment operations | | | (0.55 | ) | | | 0.54 | | | | 0.84 | | | | 0.44 | | | | 1.77 | | | | 0.62 | |
| Dividends from net investment income | | | (0.23 | ) | | | (0.42 | ) | | | (0.36 | ) | | | (0.35 | ) | | | (0.46 | ) | | | (0.54 | ) |
| Distributions from net realized capital gains | | | 0.00 | | | | (0.31 | ) | | | (0.30 | ) | | | (0.17 | ) | | | (0.49 | ) | | | (0.37 | ) |
| Total distributions | | | (0.23 | ) | | | (0.73 | ) | | | (0.66 | ) | | | (0.52 | ) | | | (0.95 | ) | | | (0.91 | ) |
| Net asset value end of period | | $ | 10.22 | | | $ | 11.00 | | | $ | 11.19 | | | $ | 11.01 | | | $ | 11.09 | | | $ | 10.27 | |
| Total return | | | (5.05 | )% | | | 4.90 | % | | | 7.73 | % | | | 4.05 | % | | | 17.77 | % | | | 6.03 | % |
| Net assets end of period (000s) | | $ | 635 | | | $ | 391 | | | $ | 311 | | | $ | 13 | | | $ | 13 | | | $ | 11 | |
| Ratio of expenses to average net assets | | | 0.47 | %*(d) | | | 0.50 | % | | | 0.50 | % | | | 0.51 | %(c) | | | 0.50 | %(b) | | | 0.50 | % |
| Ratio of net investment income to average net assets | | | 4.46 | %* | | | 3.75 | % | | | 3.22 | % | | | 2.85 | % | | | 4.22 | % | | | 5.05 | % |
| Portfolio turnover rate | | | 551 | % | | | 533 | % | | | 237 | % | | | 619 | % | | | 586 | % | | | 457 | % |
+ Unaudited
* Annualized
(a) Per share amounts based on average number of shares outstanding during the period.
(b) If the investment manager had not reimbursed expenses, the ratio of expenses to average net assets would have been 0.51%.
(c) Ratio of expenses to average net assets excluding interest expense is 0.50%.
(d) The advisory fee was reduced to 0.225%.
| | | | | | |
| See Accompanying Notes | | Semiannual Report | | June 30, 2006 | | 5 |
| | |
| |
| Statement of Assets and Liabilities Long-Term U.S. Government Portfolio | | |
| | | | |
| (Amounts in thousands, except per share amounts) | | June 30, 2006
(Unaudited) | |
| |
Assets: | | | | |
Investments, at value | | $ | 103,633 | |
Cash | | | 5 | |
Receivable for investments sold | | | 4,479 | |
Receivable for investments sold on delayed-delivery basis | | | 28,809 | |
Receivable for Portfolio shares sold | | | 84 | |
Interest and dividends receivable | | | 1,131 | |
Variation margin receivable | | | 229 | |
Swap premiums paid | | | 803 | |
Unrealized appreciation on swap agreements | | | 265 | |
| | | | 139,438 | |
| |
Liabilities: | | | | |
Payable for investments purchased | | $ | 3,360 | |
Payable for investments purchased on delayed-delivery basis | | | 48,810 | |
Payable for short sales | | | 3,001 | |
Payable for Portfolio shares redeemed | | | 4 | |
Written options outstanding | | | 260 | |
Accrued investment advisory fee | | | 16 | |
Accrued administration fee | | | 18 | |
Accrued servicing fee | | | 9 | |
Swap premiums received | | | 1,590 | |
Unrealized depreciation on swap agreements | | | 146 | |
| | | | 57,214 | |
| |
Net Assets | | $ | 82,224 | |
| |
Net Assets Consist of: | | | | |
Paid in capital | | $ | 86,590 | |
Undistributed net investment income | | | 70 | |
Accumulated undistributed net realized (loss) | | | (2,709 | ) |
Net unrealized (depreciation) | | | (1,727 | ) |
| | | $ | 82,224 | |
| |
Net Assets: | | | | |
Institutional Class | | $ | 635 | |
Administrative Class | | | 81,589 | |
| |
Shares Issued and Outstanding: | | | | |
Institutional Class | | | 62 | |
Administrative Class | | | 7,986 | |
| |
Net Asset Value and Redemption Price Per Share (Net Assets Per Share Outstanding) | | | | |
Institutional Class | | $ | 10.22 | |
Administrative Class | | | 10.22 | |
| |
Cost of Investments Owned | | $ | 105,230 | |
Proceeds Received on Short Sales | | $ | 2,989 | |
Premiums Received on Written Options | | $ | 216 | |
| | | | |
| 6 | | PIMCO Variable Insurance Trust | | See Accompanying Notes |
| | |
| |
| Statement of Operations Long-Term U.S. Government Portfolio | | |
| | | | |
| (Amounts in thousands) | | Six Months Ended
June 30, 2006
(Unaudited) | |
| |
Investment Income: | | | | |
Interest | | $ | 2,031 | |
Total Income | | | 2,031 | |
| |
Expenses: | | | | |
Investment advisory fees | | | 95 | |
Administration fees | | | 105 | |
Distribution and/or servicing fees – Administrative Class | | | 63 | |
Trustees’ fees | | | 1 | |
Interest expense | | | 1 | |
Total Expenses | | | 265 | |
| |
Net Investment Income | | | 1,766 | |
| |
Net Realized and Unrealized Gain (Loss): | | | | |
Net realized (loss) on investments | | | (2,354 | ) |
Net realized (loss) on futures contracts, options and swaps | | | (1,485 | ) |
Net change in unrealized (depreciation) on investments | | | (2,095 | ) |
Net change in unrealized (depreciation) on futures contracts, options and swaps | | | (431 | ) |
Net (Loss) | | | (6,365 | ) |
| |
Net (Decrease) in Net Assets Resulting from Operations | | $ | (4,599 | ) |
| | | | | | |
| See Accompanying Notes | | Semiannual Report | | June 30, 2006 | | 7 |
| | |
| |
| Statements of Changes in Net Assets Long-Term U.S. Government Portfolio | | |
| | | | | | | | |
| (Amounts in Thousands) | | Six Months Ended
June 30, 2006
(Unaudited) | | | Year Ended
December 31, 2005 | |
| | |
Increase (Decrease) in Net Assets from: | | | | | | | | |
| | |
Operations: | | | | | | | | |
Net investment income | | $ | 1,766 | | | $ | 3,214 | |
Net realized gain (loss) | | | (3,839 | ) | | | 2,492 | |
Net change in unrealized (depreciation) | | | (2,526 | ) | | | (1,461 | ) |
Net increase (decrease) resulting from operations | | | (4,599 | ) | | | 4,245 | |
| | |
Distributions to Shareholders: | | | | | | | | |
| From net investment income | | | | | | | | |
Institutional Class | | | (11 | ) | | | (13 | ) |
Administrative Class | | | (1,755 | ) | | | (3,237 | ) |
| From net realized capital gains | | | | | | | | |
Institutional Class | | | 0 | | | | (11 | ) |
Administrative Class | | | 0 | | | | (2,439 | ) |
| | |
Total Distributions | | | (1,766 | ) | | | (5,700 | ) |
| | |
Portfolio Share Transactions: | | | | | | | | |
| Receipts for shares sold | | | | | | | | |
Institutional Class | | | 342 | | | | 261 | |
Administrative Class | | | 3,885 | | | | 6,964 | |
| Issued as reinvestment of distributions | | | | | | | | |
Institutional Class | | | 11 | | | | 24 | |
Administrative Class | | | 1,755 | | | | 5,676 | |
| Cost of shares redeemed | | | | | | | | |
Institutional Class | | | (79 | ) | | | (195 | ) |
Administrative Class | | | (7,142 | ) | | | (13,891 | ) |
Net (decrease) resulting from Portfolio share transactions | | | (1,228 | ) | | | (1,161 | ) |
| | |
Total Decrease in Net Assets | | | (7,593 | ) | | | (2,616 | ) |
| | |
Net Assets: | | | | | | | | |
Beginning of period | | | 89,817 | | | | 92,433 | |
End of period* | | $ | 82,224 | | | $ | 89,817 | |
| | |
*Including undistributed net investment income of: | | $ | 70 | | | $ | 70 | |
| | | | |
| 8 | | PIMCO Variable Insurance Trust | | See Accompanying Notes |
| | |
| |
| Schedule of Investments Long-Term U.S. Government Portfolio | | June 30, 2006 (Unaudited) |
| | | | | | | | |
| | | | | PRINCIPAL | | | | |
| | | | | AMOUNT | | | | VALUE |
| | | | | (000S) | | | | (000S) |
| | | | | | | | | |
| CORPORATE BONDS & NOTES 5.1% |
| |
| BANKING & FINANCE 4.3% |
| Allstate Life Global Funding Trusts |
5.160% due 01/25/2008 | | $ | | 200 | | $ | | 200 |
|
| Citigroup, Inc. |
5.166% due 01/30/2009 | | | | 600 | | | | 600 |
|
| Lehman Brothers Holdings, Inc. |
5.180% due 01/23/2009 | | | | 1,400 | | | | 1,402 |
|
| Pricoa Global Funding I |
5.180% due 01/25/2008 | | | | 200 | | | | 200 |
|
| U.S. Trade Funding Corp. |
4.260% due 11/15/2014 | | | | 743 | | | | 714 |
|
| Wells Fargo & Co. |
5.509% due 03/23/2010 | | | | 400 | | | | 400 |
| | | | | | | | |
|
| | | | | | | | | 3,516 |
| | | | | | | | |
|
| |
| INDUSTRIALS 0.5% |
| DaimlerChrysler N.A. Holding Corp. |
5.740% due 03/13/2009 | | | | 400 | | | | 401 |
| | | | | | | | |
|
| |
| UTILITIES 0.3% |
| Verizon Global Funding Corp. |
5.300% due 08/15/2007 | | | | 300 | | | | 300 |
| | | | | | | | |
|
Total Corporate Bonds & Notes (Cost $4,243) | | 4,217 |
| | | | | | | | |
|
| |
| MUNICIPAL BONDS & NOTES 1.6% |
| Chicago, Illinois Motor Fuel Tax Revenue Bonds, (AMBAC Insured), Series 2003 |
5.000% due 01/01/2033 | | | | 200 | | | | 204 |
|
| Dawson Ridge, Colorado Metropolitan District No. 1 General Obligation Bonds, Series 1992 |
0.000% due 10/01/2022 | | | | 800 | | | | 361 |
|
| Detroit, Michigan School District General Obligation Bonds, (FGID Q-SBLF Insured), Series 2003 |
5.000% due 05/01/2033 | | | | 100 | | | | 101 |
|
| Irving, Texas Independent School District General Obligation Notes, (PSF Insured), Series 2003 |
5.000% due 02/15/2031 | | | | 200 | | | | 203 |
|
| New York City, New York Municipal Water Finance Authority Revenue Bonds, Series 2002 |
5.125% due 06/15/2034 | | | | 200 | | | | 205 |
|
| San Antonio, Texas Water Revenue Bonds, (FSA Insured), Series 2002 |
5.000% due 05/15/2032 | | | | 250 | | | | 252 |
| | | | | | | | |
|
Total Municipal Bonds & Notes (Cost $1,289) | | 1,326 |
| | | | | | | | |
|
| |
| U.S. GOVERNMENT AGENCIES 39.9% |
| Fannie Mae |
4.500% due 09/01/2035 | | | | 473 | | | | 429 |
5.000% due 11/01/2019 - 08/25/2033 (b) | | | | 616 | | | | 588 |
5.249% due 04/26/2035 | | | | 9 | | | | 9 |
5.250% due 06/15/2008 | | | | 11,100 | | | | 11,060 |
5.375% due 02/25/2022 | | | | 150 | | | | 138 |
5.402% due 07/25/2035 | | | | 900 | | | | 901 |
5.500% due 07/13/2036 | | | | 900 | | | | 864 |
5.794% due 08/25/2021 | | | | 27 | | | | 27 |
5.800% due 02/09/2026 | | | | 500 | | | | 483 |
5.944% due 08/25/2022 | | | | 15 | | | | 15 |
6.080% due 09/01/2028 | | | | 64 | | | | 68 |
6.222% due 04/25/2032 | | | | 36 | | | | 37 |
6.244% due 04/25/2021 | | | | 21 | | | | 21 |
| | | | | | | | |
| Federal Farm Credit Bank |
5.150% due 03/25/2020 | | $ | | 250 | | $ | | 236 |
|
| Federal Home Loan Bank |
3.875% due 10/23/2006 | | | | 2,000 | | | | 1,991 |
4.000% due 07/14/2008 | | | | 1,000 | | | | 971 |
5.120% due 01/10/2013 | | | | 5,000 | | | | 4,839 |
6.000% due 02/12/2021 | | | | 50 | | | | 51 |
6.125% due 06/08/2018 | | | | 80 | | | | 83 |
|
| Federal Housing Administration |
6.896% due 07/01/2020 | | | | 464 | | | | 462 |
|
| Freddie Mac |
3.750% due 11/15/2006 | | | | 2,000 | | | | 1,988 |
4.500% due 05/15/2025 | | | | 400 | | | | 355 |
5.000% due 03/18/2014 - 09/15/2035 (b) | | | | 2,000 | | | | 1,819 |
5.211% due 10/25/2044 | | | | 258 | | | | 259 |
5.400% due 03/17/2021 | | | | 1,000 | | | | 950 |
5.500% due 08/15/2030 - 06/15/2034 (b) | | | | 1,003 | | | | 930 |
5.625% due 11/23/2035 | | | | 900 | | | | 823 |
5.950% due 02/15/2027 | | | | 22 | | | | 22 |
6.250% due 02/15/2021 | | | | 29 | | | | 29 |
7.000% due 07/15/2023 - 12/01/2031 (b) | | | | 90 | | | | 93 |
|
| Government National Mortgage Association |
4.500% due 08/20/2030 | | | | 27 | | | | 27 |
6.000% due 08/20/2033 | | | | 1,185 | | | | 1,140 |
|
| Small Business Administration Participation Certificates |
5.240% due 08/01/2023 | | | | 865 | | | | 842 |
|
| Tennessee Valley Authority |
5.375% due 04/01/2056 | | | | 300 | | | | 285 |
| | | | | | | | |
|
Total U.S. Government Agencies (Cost $33,361) | | | | 32,835 |
| | | | | | | | |
|
| |
| U.S. TREASURY OBLIGATIONS 42.4% |
| Treasury Inflation Protected Securities (d) |
3.375% due 01/15/2007 | | | | 191 | | | | 191 |
2.375% due 01/15/2025 | | | | 962 | | | | 937 |
2.000% due 01/15/2026 (f) | | | | 1,523 | | | | 1,395 |
|
| U.S. Treasury Bond |
6.250% due 08/15/2023 | | | | 8,500 | | | | 9,377 |
|
| U.S. Treasury Note |
4.125% due 08/15/2010 | | | | 15,800 | | | | 15,238 |
|
| U.S. Treasury Strip |
0.000% due 08/15/2019 (c) | | | | 15,400 | | | | 7,725 |
| | | | | | | | |
|
Total U.S. Treasury Obligations (Cost $35,874) | | 34,863 |
| | | | | | | | |
|
| |
| MORTGAGE-BACKED SECURITIES 14.3% |
| Bear Stearns Adjustable Rate Mortgage Trust |
5.062% due 03/25/2033 | | | | 596 | | | | 590 |
5.306% due 03/25/2033 | | | | 173 | | | | 171 |
4.812% due 01/25/2034 | | | | 98 | | | | 96 |
4.750% due 10/25/2035 | | | | 500 | | | | 480 |
4.750% due 11/25/2035 | | | | 431 | | | | 423 |
|
| Bear Stearns Alt-A Trust |
5.602% due 02/25/2034 | | | | 48 | | | | 48 |
|
| Countrywide Alternative Loan Trust |
5.500% due 10/25/2033 | | | | 1,163 | | | | 1,040 |
5.532% due 05/25/2035 | | | | 329 | | | | 329 |
|
| Countrywide Home Loan Mortgage Pass-Through Trust |
5.642% due 03/25/2035 | | | | 532 | | | | 535 |
5.662% due 06/25/2035 | | | | 3,310 | | | | 3,309 |
| | | | | | | | |
| CS First Boston Mortgage Securities Corp. |
6.230% due 11/25/2032 | | $ | | 31 | | $ | | 31 |
5.872% due 04/25/2033 | | | | 41 | | | | 41 |
|
| First Republic Mortgage Loan Trust |
5.549% due 11/15/2031 | | | | 331 | | | | 333 |
|
| Freddie Mac |
7.275% due 07/25/2011 | | | | 154 | | | | 152 |
|
| Harborview Mortgage Loan Trust |
5.472% due 05/19/2035 | | | | 273 | | | | 273 |
|
| Impac CMB Trust |
5.249% due 09/25/2034 | | | | 805 | | | | 772 |
|
| LB-UBS Commercial Mortgage Trust |
5.401% due 03/15/2026 | | | | 21 | | | | 21 |
2.720% due 03/15/2027 | | | | 574 | | | | 556 |
|
| MASTR Asset Securitization Trust |
5.500% due 09/25/2033 | | | | 462 | | | | 442 |
|
| Residential Accredit Loans, Inc. |
5.722% due 01/25/2033 | | | | 56 | | | | 56 |
5.722% due 03/25/2033 | | | | 118 | | | | 118 |
|
| Residential Funding Mortgage Security I |
6.500% due 03/25/2032 | | | | 107 | | | | 107 |
|
| Sequoia Mortgage Trust |
5.607% due 06/20/2032 | | | | 85 | | | | 85 |
5.617% due 07/20/2033 | | | | 536 | | | | 538 |
|
| Structured Asset Mortgage Investments, Inc. |
5.582% due 09/19/2032 | | | | 645 | | | | 646 |
5.672% due 06/18/2033 | | | | 171 | | | | 171 |
|
| Washington Mutual MSC Mortgage Pass-Through Certificates |
6.218% due 02/25/2031 | | | | 49 | | | | 49 |
5.374% due 02/25/2033 | | | | 39 | | | | 38 |
6.391% due 02/25/2033 | | | | 28 | | | | 28 |
6.556% due 05/25/2033 | | | | 38 | | | | 38 |
|
| Washington Mutual, Inc. |
5.552% due 04/25/2045 | | | | 259 | | | | 260 |
| | | | | | | | |
|
Total Mortgage-Backed Securities (Cost $11,908) | | 11,776 |
| | | | | | | | |
|
| | | | | | | |
| ASSET-BACKED SECURITIES 3.5% |
| AAA Trust |
5.422% due 04/25/2035 | | | | 46 | | | | 46 |
|
| Accredited Mortgage Loan Trust |
5.422% due 07/25/2035 | | | | 11 | | | | 11 |
|
| ACE Securities Corp. |
5.442% due 02/25/2035 | | | | 3 | | | | 3 |
|
| Bayview Financial Acquisition Trust |
5.791% due 08/28/2034 | | | | 250 | | | | 250 |
|
| Bear Stearns Asset-Backed Securities, Inc. |
5.822% due 11/25/2042 | | | | 246 | | | | 247 |
|
| Chase Funding Mortgage Loan Asset-Backed Certificates |
5.822% due 10/25/2031 | | | | 31 | | | | 31 |
|
| First Franklin Mortgage Loan Asset-Backed Certificates |
5.563% due 11/25/2034 | | | | 9 | | | | 9 |
|
| Home Equity Mortgage Trust |
5.442% due 07/25/2035 | | | | 25 | | | | 25 |
|
| LA Arena Funding LLC |
7.656% due 12/15/2026 | | | | 89 | | | | 92 |
| | | | | | |
| See Accompanying Notes | | Semiannual Report | | June 30, 2006 | | 9 |
| | |
| |
| Schedule of Investments Long-Term U.S. Government Portfolio (Cont.) | | |
| | | | | | | | |
| | | | | PRINCIPAL | | | | |
| | | | | AMOUNT | | | | VALUE |
| | | | | (000S) | | | | (000S) |
| | | | | | | | | |
| Peco Energy Transition Trust |
6.130% due 03/01/2009 | | $ | | 1 | | $ | | 1 |
|
| Renaissance Home Equity Loan Trust |
5.762% due 08/25/2033 | | | | 16 | | | | 16 |
5.822% due 12/25/2033 | | | | 92 | | | | 93 |
|
| Residential Asset Mortgage Products, Inc. |
5.422% due 11/25/2024 | | | | 104 | | | | 104 |
5.402% due 05/25/2026 | | | | 872 | | | | 872 |
|
| Residential Asset Securities Corp. |
5.692% due 01/25/2033 | | | | 156 | | | | 157 |
|
| SMS Student Loan Trust |
5.636% due 10/27/2025 | | | | 71 | | | | 71 |
|
| Specialty Underwriting & Residential Finance |
5.662% due 01/25/2034 | | | | 12 | | | | 12 |
|
| Structured Asset Securities Corp. |
5.612% due 01/25/2033 | | | | 22 | | | | 22 |
5.453% due 12/25/2035 | | | | 663 | | | | 664 |
|
| White River Capital, Inc. |
4.590% due 07/08/2008 | | | | 25 | | | | 25 |
|
| Whole Auto Loan Trust |
3.040% due 04/15/2009 | | | | 156 | | | | 156 |
| | | | | | | | |
|
Total Asset-Backed Securities (Cost $2,903) | | 2,907 |
| | | | | | | | |
|
| |
| SOVEREIGN ISSUES 4.0% |
| Financing Corp. Fico |
10.700% due 10/06/2017 | | | | 650 | | | | 926 |
|
| Overseas Private Investment Corp. |
3.800% due 08/15/2007 | | | | 1,000 | | | | 1,135 |
5.140% due 08/15/2007 | | | | 830 | | | | 826 |
4.736% due 03/15/2022 | | | | 400 | | | | 371 |
| | | | | | | | |
|
Total Sovereign Issues (Cost $3,236) | | 3,258 |
| | | | | | | | |
|
| | | | |
| | | | | NOTIONAL
AMOUNT | | | | |
| PURCHASED CALL OPTIONS 0.0% |
| 2-Year Interest Rate Swap (OTC) Pay 3-Month USD-LIBOR Floating Rate Index |
Strike @ 5.500%
Exp. 06/30/2007 | | | | 3,300 | | | | 16 |
| |
| | | | | #OF
CONTRACTS | | | | |
| U.S. Treasury 10- Year Notes September Futures (CBOT) |
Strike @ $111.000
Exp. 08/24/2006 | | | | 282 | | | | 5 |
| U.S. Treasury 5-Year Note September Futures (CBOT) |
Strike @ $106.500
Exp. 08/25/2006 | | | | 78 | | $ | | 1 |
| | | | | | | | |
|
Total Purchased Call Options (Cost $23) | | 22 |
| | | | | | | | |
|
| | | | | | | | |
| PURCHASED PUT OPTIONS 0.1% |
| 90-Day Eurodollar December Futures (CME) |
Strike @ $91.750
Exp. 12/18/2006 | | | | 46 | | | | 0 |
Strike @ $92.000
Exp. 12/18/2006 | | | | 60 | | | | 0 |
Strike @ $92.750
Exp. 12/18/2006 | | | | 41 | | | | 0 |
Strike @ $94.000
Exp. 12/18/2006 | | | | 253 | | | | 18 |
Strike @ $94.000
Exp. 12/17/2007 | | | | 109 | | | | 44 |
|
| 90-Day Eurodollar June Futures (CME) |
Strike @ $91.250
Exp. 06/18/2007 | | | | 15 | | | | 0 |
|
| 90-Day Eurodollar March Futures (CME) |
Strike @ $92.000
Exp. 03/19/2007 | | | | 20 | | | | 0 |
|
| 90-Day Eurodollar September Futures (CME) |
Strike @ $92.500
Exp. 09/18/2006 | | | | 22 | | | | 0 |
|
| U.S. Treasury 30-Year Bond September Futures (CBOT) |
Strike @ $93.000
Exp. 08/25/2006 | | | | 135 | | | | 2 |
Strike @ $97.000
Exp. 08/25/2006 | | | | 89 | | | | 2 |
| | | | | | | | |
|
Total Purchased Put Options (Cost $25) | | 66 |
| | | | | | | | |
|
| |
| | | | | PRINCIPAL
AMOUNT
(000S) | | | �� | |
| SHORT-TERM INSTRUMENTS 15.1% |
| |
| CERTIFICATE OF DEPOSIT 0.4% |
| Countrywide Bank N.A. | | | | | | | | |
5.209% due 09/15/2006 | | $ | | 300 | | | | 300 |
| | | | | | | | |
|
| |
| COMMERCIAL PAPER 6.0% |
| Countrywide Funding Corp. | | | | | | | | |
4.911% due 10/18/2006 | | | | 500 | | | | 500 |
|
| Fannie Mae | | | | | | | | |
4.809% due 07/05/2006 | | | | 2,200 | | | | 2,199 |
|
| Federal Home Loan Bank | | | | | | | | |
5.030% due 07/03/2006 | | | | 2,200 | | | | 2,200 |
| | | | | | | | |
|
| | | | | | | | | 4,899 |
| | | | | | | | |
|
| |
| | | | | | | | |
| REPURCHASE AGREEMENTS 5.5% |
| Credit Suisse First Boston | | | | | | | | |
4.580% due 07/03/2006 | | $ | | 1,800 | | $ | | 1,800 |
(Dated 06/30/2006. Collateralized by U.S. Treasury Notes 4.000% due 06/15/2009 valued at $1,851. Repurchase proceeds are $1,801.) | | | | | | | | |
|
| Lehman Brothers, Inc. | | | | | | | | |
4.600% due 07/03/2006 | | | | 2,400 | | | | 2,400 |
(Dated 06/30/2006. Collateralized by U.S. Treasury Notes 3.250% due 08/15/2007 valued at $2,452. Repurchase proceeds are $2,401.) | | | | | | | | |
|
| State Street Bank | | | | | | | | |
4.900% due 07/03/2006 | | | | 324 | | | | 324 |
(Dated 06/30/2006. Collateralized by Freddie Mac 2.75% due 07/02/2009 valued at $333. Repurchase proceeds are $324.) | | | | | | | | |
| | | | | | | | |
|
| | | | | | | | | 4,524 |
| | | | | | | | |
|
| |
| U.S. TREASURY BILLS 3.2% |
4.790% due 08/31/2006 - 09/14/2006 (b)(e)(f) | | | | 2,670 | | | | 2,640 |
| | | | | | | | |
|
Total Short-Term Instruments (Cost $12,368) | | 12,363 |
| | | | | | | | |
|
| |
Total Investments (a) 126.0%
(Cost $105,230) | | $ | | 103,633 |
| |
Written Options (h) (0.3%)
(Premiums $216) | | | | (260) |
| |
| Other Assets and Liabilities (Net) (25.7%) | | (21,149) |
| | | | | | | | |
|
| Net Assets 100.0% | | | | | | $ | | 82,224 |
| | | | | | | | |
|
|
Notes to Schedule of Investments (amounts in thousands, except number of contracts): |
(a) As of June 30, 2006, portfolio securities with an aggregate market value of $2,121 were valued in good faith and pursuant to guidelines established by the Board of Trustees. |
| |
(b) Securities are grouped by coupon or range of coupons and represent a range of maturities. |
| |
(c) Principal only security. |
| |
(d) Principal amount of security is adjusted for inflation. |
| |
(e) Securities with an aggregate market value of $1,484 have been pledged as collateral for swap and swaption contracts on June 30, 2006. |
| |
| | | | |
| 10 | | PIMCO Variable Insurance Trust | | See Accompanying Notes |
| | |
| |
| | | June 30, 2006 (Unaudited) |
|
(f) Securities with an aggregate market value of $1,052 have been segregated with the custodian to cover margin requirements for the following open futures contracts on June 30, 2006: |
| | | | | | | | | | |
| Description | | Type | | Expiration
Month | | # of
Contracts | | Unrealized
Appreciation/
(Depreciation) | |
90-Day Eurodollar December Futures | | Long | | 12/2006 | | 200 | | $ | (108 | ) |
90-Day Eurodollar March Futures | | Long | | 03/2007 | | 58 | | | (31 | ) |
U.S. Treasury 5-Year Note September Futures | | Short | | 09/2006 | | 25 | | | 14 | |
U.S. Treasury 10-Year Note September Futures | | Short | | 09/2006 | | 74 | | | 35 | |
U.S. Treasury 30-Year Bond September Futures | | Long | | 09/2006 | | 321 | | | (125 | ) |
| | | | | | | | |
|
|
|
| | | | | | | | | $ | (215 | ) |
| | | | | | | | |
|
|
|
| | | | | | | | | | | | | | | |
(g) Swap agreements outstanding on June 30, 2006: | |
| Interest Rate Swaps | |
| Counterparty | | Floating Rate Index | | Pay/Receive
Floating Rate | | Fixed Rate | | Expiration
Date | | Notional
Amount | | Unrealized
Appreciation/
(Depreciation) | |
Deutsche Bank AG | | 3-month USD-LIBOR | | Pay | | 5.000% | | 12/20/2036 | | $ | 900 | | $ | (8 | ) |
Goldman Sachs & Co. | | 3-month USD-LIBOR | | Pay | | 5.000% | | 12/20/2036 | | | 3,400 | | | (31 | ) |
Morgan Stanley Dean Witter & Co. | | 3-month USD-LIBOR | | Pay | | 5.000% | | 12/20/2036 | | | 6,400 | | | (107 | ) |
Royal Bank of Scotland PLC | | 3-month USD-LIBOR | | Receive | | 5.000% | | 12/20/2016 | | | 17,300 | | | 212 | |
UBS Warburg LLC | | 3-month USD-LIBOR | | Receive | | 5.000% | | 12/20/2008 | | | 6,600 | | | 6 | |
UBS Warburg LLC | | 3-month USD-LIBOR | | Pay | | 5.000% | | 12/20/2011 | | | 17,700 | | | 47 | |
| | | | | | | | | | | | | |
|
|
|
| | | | | | | | | | | | | | $ | 119 | |
| | | | | | | | | | | | | |
|
|
|
| | | | | | | | | | | | | | | | | |
(h) Written options outstanding on June 30, 2006: |
| Options on Exchange-Traded Futures Contracts |
| Description | | | | | | Exercise
Price | | Expiration
Date | | # of
Contracts | | Premium | | Value |
Call - CBOT U.S. Treasury 20-Year Note September Futures | | $ | 110.000 | | 08/25/2006 | | 43 | | $ | 22 | | $ | 8 |
Put - CBOT U.S. Treasury 20-Year Note September Futures | | | 103.000 | | 08/25/2006 | | 43 | | | 13 | | | 8 |
Put - CME 90-Day Eurodollar December Futures | | | | | | | 95.000 | | 12/18/2006 | | 88 | | | 37 | | | 133 |
| | | | | | | | | | | | | |
|
| |
|
|
| | | | | | | | | | | | | | $ | 72 | | $ | 149 |
| | | | | | | | | | | | | |
|
| |
|
|
| | | | | | | | | | | | | | | | | | | |
| Interest Rate Swaptions |
| Description | | Counterparty | | Floating Rate Index | | Pay/Receive
Floating Rate | | Exercise
Rate | | Expiration
Date | | Notional
Amount | | Premium | | Value |
Call - OTC 7-Year Interest Rate Swap | | Bank of America | | 3-month USD-LIBOR | | Receive | | 4.500% | | 05/02/2008 | | $ | 700 | | $ | 14 | | $ | 2 |
Put - OTC 7-Year Interest Rate Swap | | Bank of America | | 3-month USD-LIBOR | | Pay | | 5.500% | | 05/02/2008 | | | 700 | | | 17 | | | 21 |
Call - OTC 7-Year Interest Rate Swap | | J.P. Morgan Chase & Co. | | 3-month USD-LIBOR | | Receive | | 4.500% | | 05/02/2008 | | | 1,500 | | | 33 | | | 4 |
Put - OTC 7-Year Interest Rate Swap | | J.P. Morgan Chase & Co. | | 3-month USD-LIBOR | | Pay | | 5.500% | | 05/02/2008 | | | 1,500 | | | 35 | | | 45 |
Call - OTC 7-Year Interest Rate Swap | | Merrill Lynch & Co., Inc. | | 3-month USD-LIBOR | | Receive | | 4.500% | | 05/02/2008 | | | 700 | | | 14 | | | 2 |
Put - OTC 7-Year Interest Rate Swap | | Merrill Lynch & Co., Inc. | | 3-month USD-LIBOR | | Pay | | 5.500% | | 05/02/2008 | | | 700 | | | 16 | | | 21 |
Call - OTC 5-Year Interest Rate Swap | | Royal Bank of Scotland PLC | | 3-month USD-LIBOR | | Receive | | 5.600% | | 06/29/2007 | | | 1,400 | | | 15 | | | 16 |
| | | | | | | | | | | | |
|
| |
|
|
| | | | | | | | | | | | | | | | $ | 144 | | $ | 111 |
| | | | | | | | | | | | | | | |
|
| |
|
|
| | | | | | | | | | | | | |
(i) Short sales outstanding on June 30, 2006: | | | | | | | | | |
| Description | | Coupon | | Maturity
Date | | Principal
Amount | | Proceeds | | Valueà |
Fannie Mae | | 6.000% | | 07/13/2036 | | $ | 2,000 | | $ | 1,980 | | $ | 1,969 |
U.S. Treasury Bond | | 5.375% | | 02/15/2031 | | | 200 | | | 208 | | | 207 |
U.S. Treasury Bond | | 4.500% | | 02/15/2036 | | | 900 | | | 801 | | | 825 |
| | | | | | | | | |
|
| |
|
|
| | | | | | | | | | $ | 2,989 | | $ | 3,001 |
| | | | | | | | | |
|
| |
|
|
|
| à Market value includes $22 of interest payable on short sales. |
| | | | | | |
| See Accompanying Notes | | Semiannual Report | | June 30, 2006 | | 11 |
Notes to Financial Statements
1. ORGANIZATION
The Long-Term U.S. Government Portfolio (the “Portfolio”) is a series of the PIMCO Variable Insurance Trust (the “Trust”). The Trust is registered under the Investment Company Act of 1940 (the “Act”), as amended, as an open-end investment management company organized as a Delaware business trust on October 3, 1997. The Portfolio offers two classes of shares: Institutional and Administrative. Information presented in these financial statements pertains to the Institutional Class of the Portfolio. Certain detailed financial information for the Administrative Class is available upon request. The Trust is designed to be used as an investment vehicle by Separate Accounts of insurance companies that fund variable annuity contracts and variable life insurance policies and by qualified pension and retirement plans.
2. SIGNIFICANT ACCOUNTING POLICIES
The following is a summary of significant accounting policies consistently followed by the Portfolio in the preparation of its financial statements in conformity with accounting principles generally accepted in the United States of America (“GAAP”). The preparation of financial statements in accordance with GAAP requires management to make estimates and assumptions that affect the reported amounts and disclosures in the financial statements. Actual results could differ from those estimates.
Security Valuation. Portfolio securities are valued as of the close of regular trading (normally 4:00 p.m., Eastern Time) on each day that the New York Stock Exchange (“NYSE”) is open. Portfolio securities and other assets for which market quotes are readily available are stated at market value. Market value is generally determined on the basis of last reported sales prices, or if no sales are reported, based on quotes obtained from a quotation reporting system, established market makers, or pricing services. Fixed-income securities and non-exchange traded derivatives are normally valued on the basis of quotes obtained from brokers and dealers or pricing services. Prices obtained from independent pricing services use information provided by market makers or estimates of market values obtained from yield data relating to investments or securities with similar characteristics. Certain fixed-income securities purchased on a delayed-delivery basis are marked to market daily until settlement at the forward settlement date. Short-term investments having a maturity of 60 days or less are generally valued at amortized cost. Exchange traded options, futures and options on futures are valued at the settlement price determined by the relevant exchange.
Investments initially valued in currencies other than the U.S. dollar are converted to the U.S. dollar using exchange rates obtained from pricing services. As a result, the NAV of the Portfolio’s shares may be affected by changes in the value of currencies in relation to the U.S. dollar. The value of securities traded in markets outside the United States or denominated in currencies other than the U.S. dollar may be affected significantly on a day that the NYSE is closed and an investor is not able to purchase, redeem or exchange shares.
Securities and other assets for which market quotes are not readily available are valued at fair value as determined in good faith by the Board of Trustees or persons acting at their direction. The Board of Trustees has adopted methods for valuing securities and other assets in circumstances where market quotes are not readily available, and has delegated to Pacific Investment Management Company LLC (“PIMCO”) the responsibility for applying the valuation methods. In the event that market quotes are not readily available, and the security or asset cannot be valued pursuant to one of the valuation methods, the value of the security or asset will be determined in good faith by the Valuation Committee of the Board of Trustees, generally based upon recommendations provided by PIMCO.
Market quotes are considered not readily available in circumstances where there is an absence of current or reliable market-based data (e.g., trade information, bid/asked information, broker quotes), including where events occur after the close of the relevant market, but prior to the close of regular trading, that materially affect the values of the Portfolio’s securities or assets. In addition, market quotes are considered not readily available when, due to extraordinary circumstances, the exchanges or markets on which the securities trade do not open for trading for the entire day and no other market prices are available. The Board has delegated to PIMCO the responsibility for monitoring significant events that may materially affect the values of the Portfolio’s securities or assets and for determining whether the value of the applicable securities or assets should be re-evaluated in light of such significant events. When the Portfolio uses fair value pricing to determine its NAV, securities will not be priced on the basis of quotations from the primary market in which they are traded, but rather may be priced by another method that the Board of Trustees or persons acting at their direction believe accurately reflects fair value. The Trust’s policy is intended to result in a calculation of the Portfolio’s NAV that fairly reflects security values as of the time of pricing. However, fair values determined by the Board of Trustees or persons acting at their direction may not accurately reflect the price that the Portfolio could obtain for a security if it were to dispose of that security as of the time of pricing. Because foreign securities can trade on non-business days, the NAV of the Portfolio may change on days when shareholders will not be able to purchase or redeem shares. The prices used by the Portfolio may differ from the value that would be realized if the securities were sold and the differences could be material to the financial statements.
Securities Transactions and Investment Income. Securities transactions are recorded as of the trade date. Securities purchased or sold on a when-issued or delayed-delivery basis may be settled a month or more after the trade date. Realized gains and losses from securities sold are recorded on the identified cost basis. Dividend income is recorded on the ex-dividend date, except certain dividends from foreign securities where the ex-dividend date may have passed, which are recorded as soon as the Portfolio is informed of the ex-dividend date. Interest income, adjusted for the accretion of discounts and amortization of premiums, is recorded on the accrual basis. Paydown gains and losses on mortgage-related or asset-backed securities are recorded as components of interest income in the Statement of Operations.
Dividends and Distributions to Shareholders. Dividends from net investment income, if any, are declared on each day the Portfolio is open for business and are distributed to shareholders monthly. Net realized capital gains earned by the Portfolio, if any, will be distributed no less frequently than once each year. Most shareholders choose to reinvest their dividends and capital gain distribution in additional shares of the Portfolio.
Income dividends and capital gain distributions are determined in accordance with income tax regulations which may differ from GAAP. Differences between tax regulations and GAAP may change the fiscal year when income and capital items are recognized for tax and GAAP purposes. Examples of events that give rise to timing differences include wash sales, straddles, net operating losses and capital loss carryforwards. Further, the character of investment income and capital gains may be different for certain transactions under the two methods of accounting. Examples of characterization differences include the treatment of mortgage paydowns, swaps, foreign currency transactions and contingent debt instruments. As a result, income dividends and capital gain distributions declared during a fiscal period may differ significantly from the net investment income and realized capital gain reported in the Portfolio’s annual financial statements presented under GAAP.
| | | | |
| 12 | | PIMCO Variable Insurance Trust | | |
| | |
| |
| | | June 30, 2006 (Unaudited) |
Distributions classified as a tax basis return of capital, if any, are reflected in the accompanying Statements of Changes in Net Assets and have been reclassified to paid in capital. In addition, other amounts have been reclassified between undistributed net investment income, accumulated undistributed net realized gains or losses and/or paid in capital to more appropriately conform financial accounting to tax characterizations of dividend distributions.
Multiclass Operations. Each class offered by the Portfolio has equal rights as to assets and voting privileges (except that shareholders of a class have exclusive voting rights regarding any matter relating solely to that class of shares). Income and non-class specific expenses of the Portfolio are allocated daily to each class of shares based on the relative value of settled shares. Realized and unrealized capital gains and losses of the Portfolio are allocated daily to each class of shares based on the relative net assets of each class. Class specific expenses, where applicable, currently include administrative, distribution and servicing fees.
Delayed-Delivery Transactions. The Portfolio may purchase or sell securities on a when-issued or delayed-delivery basis. These transactions involve a commitment by the Portfolio to purchase or sell securities for a predetermined price or yield, with payment and delivery taking place beyond the customary settlement period. When delayed-delivery purchases are outstanding, the Portfolio will designate liquid assets in an amount sufficient to meet the purchase price. When purchasing a security on a delayed-delivery basis, the Portfolio assumes the rights and risks of ownership of the security, including the risk of price and yield fluctuations, and takes such fluctuations into account when determining its net asset value. The Portfolio may dispose of or renegotiate a delayed-delivery transaction after it is entered into, and may sell when-issued securities before they are delivered, which may result in a capital gain or loss. When the Portfolio has sold a security on a delayed-delivery basis, the Portfolio does not participate in future gains and losses with respect to the security.
Federal Income Taxes. The Portfolio intends to qualify as a regulated investment company under sub-chapter M of the Internal Revenue Code and distribute all of its taxable income and net realized gains, if applicable, to shareholders. Accordingly, no provision for Federal income taxes has been made.
Futures Contracts. The Portfolio is authorized to enter into futures contracts. The Portfolio may use futures contracts to manage its exposure to the securities markets or to movements in interest rates and currency values. The primary risks associated with the use of futures contracts are the imperfect correlation between the change in market value of the securities held by the Portfolio and the prices of futures contracts, the possibility of an illiquid market, and the inability of the counterparty to meet the terms of the contract. Futures contracts are valued based upon their quoted daily settlement prices. Upon entering into a futures contract, the Portfolio is required to deposit with its custodian, in a segregated account in the name of the futures broker, an amount of cash or U.S. Government and Agency Obligations in accordance with the initial margin requirements of the broker or exchange. Futures contracts are marked to market daily and an appropriate payable or receivable for the change in value (“variation margin”) is recorded by the Portfolio. Gains or losses are recognized but not considered realized until the contracts expire or are closed. Futures contracts involve, to varying degrees, risk of loss in excess of the variation margin disclosed in the Statement of Assets and Liabilities.
Inflation-Indexed Bonds. The Portfolio may invest in inflation-indexed bonds. Inflation-indexed bonds are fixed-income securities whose principal value is periodically adjusted to the rate of inflation. The interest rate on these bonds is generally fixed at issuance at a rate lower than typical bonds. Over the life of an inflation-indexed bond, however, interest will be paid based on a principal value, which is adjusted for inflation. Any increase in the principal amount of an inflation-indexed bond will be included as interest income in the Statement of Operations, even though investors do not receive their principal until maturity.
Options Contracts. The Portfolio may write call and put options on futures, swaps, securities or currencies it owns or in which it may invest. Writing put options tends to increase the Portfolio’s exposure to the underlying instrument. Writing call options tends to decrease the Portfolio’s exposure to the underlying instrument. When the Portfolio writes a call or put option, an amount equal to the premium received is recorded as a liability and subsequently marked to market to reflect the current value of the option written. These liabilities are reflected as written options outstanding in the Statement of Assets and Liabilities. Certain options may be written with premiums to determined on a future date. The premiums for these options are based upon implied volatility parameters at specified terms. Premiums received from writing options which expire are treated as realized gains. Premiums received from writing options which are exercised or closed are added to the proceeds or offset against amounts paid on the underlying future, swap, security or currency transaction to determine the realized gain or loss. The Portfolio as a writer of an option has no control over whether the underlying future, swap, security or currency may be sold (call) or purchased (put) and as a result bears the market risk of an unfavorable change in the price of the future, swap, security or currency underlying the written option. There is the risk the Portfolio may not be able to enter into a closing transaction because of an illiquid market.
The Portfolio may also purchase put and call options. Purchasing call options tends to increase the Portfolio’s exposure to the underlying instrument. Purchasing put options tends to decrease the Portfolio’s exposure to the underlying instrument. The Portfolio pays a premium which is included in the Portfolio’s Statement of Assets and Liabilities as an investment and subsequently marked to market to reflect the current value of the option. Premiums paid for purchasing options which expire are treated as realized losses. Certain options may be purchased with premiums to be determined on a future date. The premiums for these options are based upon implied volatility parameters at specified terms. The risk associated with purchasing put and call options is limited to the premium paid. Premiums paid for purchasing options which are exercised or closed are added to the amounts paid or offset against the proceeds on the underlying future, swap, security or currency transaction to determine the realized gain or loss.
Repurchase Agreements. The Portfolio may engage in repurchase transactions. Under the terms of a typical repurchase agreement, the Portfolio takes possession of an underlying debt obligation subject to an obligation of the seller to repurchase, and the Portfolio to resell, the obligation at an agreed-upon price and time. The market value of the collateral must be equal to or exceed at all times the total amount of the repurchase obligations, including interest. Securities purchased under repurchase agreements are reflected as an asset in the Statement of Assets and Liabilities. Generally, in the event of counterparty default, the Portfolio has the right to use the collateral to offset losses incurred. If the counterparty should default, the Portfolio will seek to sell the securities which it holds as collateral. This could involve procedural costs or delays in addition to a loss on the securities if their value should fall below their repurchase price.
Short Sales. The Portfolio may enter into short sales transactions. A short sale is a transaction in which the Portfolio sells securities it does not own in anticipation of a decline in the market price of the securities. Securities sold in short sale transactions and interest payable on such securities, if any, are reflected as a liability in the Statement of Assets and Liabilities. The Portfolio is obligated to deliver securities at the market price at the time the short position is closed. Possible losses from short sales may be unlimited, whereas losses from purchases cannot exceed the total amount invested.
Mortgage-Related and Other Asset-Backed Securities. The Portfolio may invest in mortgage-related or other asset-backed securities. These securities include mortgage pass-through securities, collateralized mortgage obligations (“CMOs”), commercial mortgage-backed securities, mortgage dollar rolls, CMO
| | | | | | |
| | | Semiannual Report | | June 30, 2006 | | 13 |
Notes to Financial Statements (Cont.)
residuals, stripped mortgage-backed securities (“SMBSs”) and other securities that directly or indirectly represent a participation in, or are secured by and payable from, mortgage loans on real property. The value of some mortgage- or asset-backed securities may be particularly sensitive to changes in prevailing interest rates. Early repayment of principal on some mortgage-related securities may expose a Fund to a lower rate of return upon reinvestment of principal. The value of these securities may fluctuate in response to the market’s perception of the creditworthiness of the issuers. Additionally, although mortgages and mortgage-related securities are generally supported by some form of government or private guarantee and/or insurance, there is no assurance that private guarantors or insurers will meet their obligations.
One type of SMBS has one class receiving all of the interest from the mortgage assets (the interest-only, or “IO” class), while the other class will receive all of the principal (the principal-only, or “PO” class). Payments received for IOs are included in interest income in the Statement of Operations. Because principal will not be received at the maturity of an IO, adjustments are made to the book value of the security on a daily basis until maturity. These adjustments are included in interest income in the Statement of Operations. Payments received for POs are treated as reductions to the cost and par value of the securities.
Swap Agreements. The Portfolio may engage in swap transactions, including, but not limited to, swap agreements on interest rate to manage its exposure to interest rates and credit risk. In connection with these agreements, securities may be identified as collateral in accordance with the terms of the respective swap agreements.
Interest rate swap agreements involve the exchange by the Portfolio with another party of their respective commitments to pay or receive interest, e.g., an exchange of floating rate payments for fixed rate payments with respect to the notional amount of principal.
Swaps are marked to market daily based upon quotations from market makers and the change in value, if any, is recorded as unrealized gain or loss in the Statement of Operations. Payments received or made at the beginning of the measurement period are reflected as such in the Statement of Assets and Liabilities. These upfront payments are recorded as realized gain or loss in the Statement of Operations upon termination or maturity of the swap. A liquidation payment received or made at the termination of the swap is recorded as realized gain or loss in the Statement of Operations. Net periodic payments received or paid by the Portfolio are included as part of realized gain or loss in the Statement of Operations. Entering into these agreements involves, to varying degrees, elements of credit, market and documentation risk in excess of the amounts recognized in the Statement of Assets and Liabilities. Such risks involve the possibility that there will be no liquid market for these agreements, that the counterparty to the agreements may default on its obligation to perform or disagree as to the meaning of contractual terms in the agreements and that there may be unfavorable changes in interest rates.
U.S. Government Agencies or Government-Sponsored Enterprises. Securities issued by U.S. Government agencies or government-sponsored enterprises may not be guaranteed by the U.S. Treasury. The Government National Mortgage Association (“GNMA”), a wholly owned U.S. Government corporation, is authorized to guarantee, with the full faith and credit of the U.S. Government, the timely payment of principal and interest on securities issued by institutions approved by GNMA and backed by pools of mortgages insured by the Federal Housing Administration or guaranteed by the Department of Veterans Affairs. Government-related guarantors (i.e., not backed by the full faith and credit of the U.S. Government) include the Federal National Mortgage Association (“FNMA” or “Fannie Mae”) and the Federal Home Loan Mortgage Corporation (“FHLMC” or “Freddie Mac”). Pass-through securities issued by FNMA are guaranteed as to timely payment of principal and interest by FNMA but are not backed by the full faith and credit of the U.S. Government. FHLMC guarantees the timely payment of interest and ultimate collection of principal, but its participation certificates are not backed by the full faith and credit of the U.S. Government.
Guarantees and Indemnifications. Under the Trust’s organizational documents, each Trustee, officer, employee or other agent of the Trust (including the Trust’s investment manager) is indemnified against certain liabilities that may arise out of performance of their duties to the Portfolio. Additionally, in the normal course of business, the Portfolio enters into contracts that contain a variety of indemnification clauses. The Portfolio’s maximum exposure under these arrangements is unknown as this would involve future claims that may be made against the Portfolio that have not yet occurred. However, the Portfolio has not had prior claims or losses pursuant to these contracts, and believes the risk of loss to be remote.
New Accounting Policies. In July 2006, the Financial Accounting Standards Board issued Interpretation No. 48, “Accounting for Uncertainty in Income Taxes—an Interpretation of FASB Statement No. 109” (the “Interpretation”). The Interpretation is effective for fiscal years beginning after December 15, 2006. Management is currently evaluating the application of the Interpretation to the Portfolio and will provide additional information in relation to the Interpretation in the Portfolio’s annual financial statements for the year ending December 31, 2006.
3. FEES, EXPENSES, AND RELATED PARTY TRANSACTIONS
Investment Advisory Fee. PIMCO is a majority-owned subsidiary of Allianz Global Investors of America L.P. (“AGI”), and serves as investment adviser (the “Adviser”) to the Trust, pursuant to an investment advisory contract. The Adviser receives a monthly fee at an annual rate based on average daily net assets of the Portfolio. The Advisory Fee is charged at an annual rate of 0.225%.
Administration Fee. PIMCO serves as administrator (the “Administrator”), and provides administrative services to the Trust for which it receives a monthly administrative fee based on average daily net assets of the Portfolio. As the Administrator, PIMCO bears the costs of various third-party services, including audit, custodial, portfolio accounting, legal, transfer agency and printing costs. The Administration Fee is charged at the annual rate of 0.25%.
Distribution and Servicing Fees. Allianz Global Investors Distributors LLC (“AGID”) is an indirect wholly-owned subsidiary of AGI and serves as the distributor of the Trust’s shares. The Trust is permitted to reimburse AGID on a quarterly basis, out of the Administrative Class assets of the Portfolio in the amount of 0.15% on an annual basis of the average daily net assets of that class, for payments made to financial intermediaries that provide services in connection with the distribution of shares or administration of plans or programs that use Portfolio shares as their funding medium. The effective rate paid to AGID was 0.15% during the current fiscal year.
Expenses. The Trust is responsible for the following expenses: (i) salaries and other compensation of any of the Trust’s executive officers and employees who are not officers, directors, stockholders or employees of PIMCO or its subsidiaries or affiliates; (ii) taxes and governmental fees; (iii) brokerage fees and commissions and other portfolio transaction expenses; (iv) the costs of borrowing money, including interest expenses and bank overdraft charges; (v) fees and expenses of the Trustees who are not “interested persons” of PIMCO or the Trust, and any counsel retained exclusively for their benefit; (vi) extraordinary expenses, including costs of litigation and indemnification expenses; (vii) organization expenses and (viii) any expenses allocated or allocable to a specific class of shares, which include service fees payable with respect to the Administrative Class shares and may include certain other expenses as permitted by the Trust’s Multiple Class Plan adopted pursuant to Rule 18f-3 under the Act and subject to review and approval
| | | | |
| 14 | | PIMCO Variable Insurance Trust | | |
| | |
| |
| | | June 30, 2006 (Unaudited) |
by the Trustees. The ratio of expenses to average net assets per share class, as disclosed in the Financial Highlights, may differ from the annual portfolio operating expenses per share class as disclosed in the Prospectus for the reasons set forth above.
For the current period ended June 30, 2006, each unaffiliated Trustee received an annual retainer of $15,000, plus $2,000 for each Board of Trustees quarterly meeting attended, $500 for each Board of Trustees committee meeting attended and $500 for each special board meeting attended, plus reimbursement of related expenses. In addition, each Committee Chair received an additional annual retainer of $500 and each Audit Committee Chair received an additional annual retainer of $1,500. These expenses are allocated on a pro-rata basis to each Portfolio of the Trust according to its respective net assets. The Trust pays no compensation directly to any Trustee or any other officer who is affiliated with the Administrator, all of whom receive remuneration for their services to the Trust from the Administrator or its affiliates.
4. PURCHASES AND SALES OF SECURITIES
The length of time the Portfolio has held a particular security is not generally a consideration in investment decisions. A change in the securities held by the Portfolio is known as “portfolio turnover”. The Portfolio may engage in frequent and active trading of portfolio securities to achieve its investment objective, particularly during periods of volatile market movements. High portfolio turnover (e.g., over 100%) involves correspondingly greater expenses to the Portfolio, including brokerage commissions or dealer mark-ups and other transaction costs on the sale of securities and reinvestments in other securities. Such sales may also result in realization of taxable capital gains, including short-term capital gains (which are generally taxed at ordinary income tax rates). The trading costs and tax effects associated with portfolio turnover may adversely affect the Portfolio’s performance.
Purchases and sales of securities (excluding short-term investments) for the period ended June 30, 2006 were as follows (amounts in thousands):
| | | | | | | | | | | | | | | | |
| | U.S Government/Agency | | | | | All Other |
| | Purchases | | | | | Sales | | | | | Purchases | | | | | Sales |
| $ | 576,682 | | | | $ | 593,972 | | | | $ | 4,345 | | | | $ | 1,148 |
5. TRANSACTIONS IN WRITTEN CALL AND PUT OPTIONS
Transactions in written call and put options were as follows (amounts in thousands, except number of contracts):
| | | | | | | | | | | | | | | | |
| | | | | # of
Contracts |
| | | |
| Notional
Amount
in $ | | | | | Premium | |
Balance at 12/31/2005 | | | | 92 | | | | | $ | 5,800 | | | | $ | 170 | |
Sales | | | | 132 | | | | | | 1,400 | | | | | 70 | |
Closing Buys | | | | 0 | | | | | | 0 | | | | | 0 | |
Expirations | | | | (50 | ) | | | | | 0 | | | | | (24 | ) |
Exercised | | | | 0 | | | | | | 0 | | | | | 0 | |
Balance at 06/30/2006 | | | | 174 | | | | | $ | 7,200 | | | | $ | 216 | |
6. SHARES OF BENEFICIAL INTEREST
The Portfolio may issue an unlimited number of shares of beneficial interest with a $0.001 par value. Changes in shares of beneficial interest were as follows (shares and amounts in thousands):
| | | | | | | | | | | | | | | | | | |
| | | | | Six Months Ended
06/30/2006 | | | | | Year Ended
12/31/2005 | |
| | | | | Shares | | | Amount | | | | | Shares | | | Amount | |
| | | | | | |
Receipts for shares sold | | | | | | | | | | | | | | | | | | |
Institutional Class | | | | 33 | | | $ | 342 | | | | | 23 | | | $ | 261 | |
Administrative Class | | | | 373 | | | | 3,885 | | | | | 612 | | | | 6,964 | |
Issued as reinvestment of distributions | | | | | | | | | | | | | | | | | | |
Institutional Class | | | | 1 | | | | 11 | | | | | 2 | | | | 24 | |
Administrative Class | | | | 168 | | | | 1,755 | | | | | 510 | | | | 5,676 | |
Cost of shares redeemed | | | | | | | | | | | | | | | | | | |
Institutional Class | | | | (8 | ) | | | (79 | ) | | | | (17 | ) | | | (195 | ) |
Administrative Class | | | | (680 | ) | | | (7,142 | ) | | | | (1,227 | ) | | | (13,891 | ) |
Net decrease resulting from Portfolio share transactions | | | | (113 | ) | | $ | (1,228 | ) | | | | (97 | ) | | $ | (1,161 | ) |
The following schedule shows the number of shareholders each owning 5% or more of the Portfolio and the total percentage of the Portfolio held by such shareholders:
| | | | | | |
| | | | | Number of
Shareholders | | % of Portfolio
Held |
Institutional Class | | | | 1 | | 98 |
Administrative Class | | | | 3 | | 94 |
7. FEDERAL INCOME TAX MATTERS
As of June 30, 2006, the aggregate cost of investments was the same for federal income tax and financial statement purposes. The net unrealized appreciation (depreciation) of investment securities for federal income tax purposes is as follows (amounts in thousands):
| | | | |
Aggregate
Gross
Unrealized
Appreciation | | Aggregate
Gross
Unrealized
(Depreciation) | | Net
Unrealized
(Depreciation) |
$ 245 | | $ (1,842) | | $ (1,597) |
8. REGULATORY AND LITIGATION MATTERS
On June 1, 2004, the Attorney General of the State of New Jersey announced that it had dismissed PIMCO from a complaint filed by the New Jersey Attorney General on February 17, 2004, and that it had entered into a settlement agreement (the “New Jersey Settlement”) with Allianz Global Investors of America L.P. (“AGI”) (formerly known as Allianz Dresdner Asset Management of America L.P.), PEA Capital LLC (an entity affiliated with PIMCO through common ownership) (“PEA”) and Allianz Global Investors Distributors LLC (“AGID”), in connection with the same matter. In the New Jersey Settlement, AGI, PEA and AGID neither admitted nor denied the allegations or conclusions of law, but did agree to pay New Jersey a civil fine of $15 million and $3 million for investigative costs and further potential enforcement initiatives against unrelated parties. They also undertook to implement certain governance changes. The complaint relating to the New Jersey Settlement alleged, among other things, that AGI, PEA and AGID had failed to disclose that they improperly allowed certain hedge funds to engage in “market timing” in certain funds. The complaint sought injunctive relief, civil monetary penalties, restitution and disgorgement of profits.
| | | | | | |
| | | Semiannual Report | | June 30, 2006 | | 15 |
Notes to Financial Statements (Cont.)
Since February 2004, PIMCO, AGI, PEA, AGID, and certain of their affiliates, including the PIMCO Funds, the Allianz Funds (formerly known as PIMCO Funds: Multi-Manager Series), and the Trustees and employees of the PIMCO Funds, have been named as defendants in fifteen lawsuits filed in various jurisdictions. Eleven of those lawsuits concern “market timing,” and they have been transferred to and consolidated for pre-trial proceedings in a multi-district litigation proceeding in the U.S. District Court for the District of Maryland; the other four lawsuits concern “revenue sharing” and have been consolidated into a single action in the U.S. District Court for the District of Connecticut. The lawsuits have been commenced as putative class actions on behalf of investors who purchased, held or redeemed shares of the various series of the PIMCO Funds and the Allianz Funds during specified periods, or as derivative actions on behalf of the PIMCO Funds and Allianz Funds.
The market timing actions in the District of Maryland generally allege that certain hedge funds were allowed to engage in “market timing” in certain of the PIMCO Funds and the Allianz Funds and this alleged activity was not disclosed. Pursuant to tolling agreements entered into with the derivative and class action plaintiffs, PIMCO, the Trustees, and certain employees of PIMCO who were previously named as defendants have all been dropped as defendants in the market timing actions; the plaintiffs continue to assert claims on behalf of the shareholders of the PIMCO Funds or on behalf of the PIMCO Funds themselves against other defendants. By order dated November 3, 2005, the U.S. District Court for the District of Maryland granted the PIMCO Funds’ motion to dismiss claims asserted against it in a consolidated amended complaint where the PIMCO Funds were named, in the complaint, as a nominal defendant. The revenue sharing action in the District of Connecticut generally alleges that fund assets were inappropriately used to pay brokers to promote the PIMCO Funds and Allianz Funds, including directing fund brokerage transactions to such brokers, and that such alleged arrangements were not fully disclosed to shareholders. On August 11, 2005 the U.S. District Court for the District of Connecticut conducted a hearing on defendants’ motion to dismiss the consolidated amended complaint in the revenue sharing action but has not yet ruled on the motion to dismiss. The market timing and revenue sharing lawsuits seek, among other things, unspecified compensatory damages plus interest and, in some cases, punitive damages, the rescission of investment advisory contracts, the return of fees paid under those contracts and restitution.
Under Section 9(a) of the Investment Company Act of 1940, as amended (“1940 Act”), if the New Jersey Settlement or any of the lawsuits described above were to result in a court injunction against AGI, PEA, AGID and/or their affiliates, PIMCO could, in the absence of exemptive relief granted by the SEC, be barred from serving as an investment adviser, and AGID could be barred from serving as principal underwriter, to any registered investment company, including the Portfolios of the Trust. In connection with an inquiry from the SEC concerning the status of the New Jersey Settlement under Section 9(a), PEA, AGID, AGI and certain of their affiliates (including PIMCO) (together, the “Applicants”) have sought exemptive relief from the SEC under Section 9(c) of the 1940 Act. The SEC has granted the Applicants a temporary exemption from the provisions of Section 9(a) with respect to the New Jersey Settlement until the earlier of (i) September 13, 2006 and (ii) the date on which the SEC takes final action on their application for a permanent order. There is no assurance that the SEC will issue a permanent order.
Two nearly identical class action civil complaints have been filed in August 2005, in the Northern District of Illinois Eastern Division alleging that the plaintiffs each purchased and sold a 10-year Treasury note futures contract and suffered damages from an alleged shortage when PIMCO held both physical and futures positions in 10-year Treasury notes for its client accounts. The two actions have been consolidated into one action, and the two separate complaints have been replaced by a consolidated complaint. PIMCO is a named defendant, and the PIMCO Funds have been added as a defendant, to the consolidated action. PIMCO strongly believes the complaint (and any consolidated complaint filed hereafter) is without merit and intends to vigorously defend itself.
Certain Portfolios of the Trust were recently served in an adversary proceeding brought by the Official Committee of Asbestos Claimants of G-I Holdings, Inc. in G-I Holdings, Inc.’s bankruptcy in the District of New Jersey. PIMCO was previously named in this lawsuit and remains a defendant. The plaintiff seeks to recover for the bankruptcy estate assets that were transferred by the predecessor entity of G-I Holdings, Inc. to a wholly-owned subsidiary in 1994. The subsidiary has since issued notes, of which certain Portfolios of the Trust are alleged to be holders. The complaint alleges that in 2000, more than two hundred noteholders—including certain Portfolios of the Trust—were granted a second priority lien on the assets of the subsidiary in exchange for their consent to a refinancing transaction and the granting of a first priority lien to the lending banks. The plaintiff is seeking invalidation of the lien in favor of the noteholders and/or the value of the lien.
It is possible that these matters and/or other developments resulting from these matters could result in increased fund redemptions or other adverse consequences to the Portfolios. However, PIMCO and AGID believe that these matters are not likely to have a material adverse effect on the Portfolios or on PIMCO’s or AGID’s ability to perform their respective investment advisory or distribution services relating to the Portfolios.
| | | | |
| 16 | | PIMCO Variable Insurance Trust | | |
Investment Adviser and Administrator
Pacific Investment Management Company LLC
840 Newport Center Drive
Newport Beach, California 92660
Distributor
Allianz Global Investors Distributors LLC
2187 Atlantic Street
Stamford, Connecticut 06902
Custodian
State Street Bank & Trust Company
801 Pennsylvania
Kansas City, Missouri 64105
Transfer Agent
Boston Financial Data Services–Midwest
330 W. 9th Street
Kansas City, Missouri 64105
Legal Counsel
Dechert LLP
1775 I Street, N.W.
Washington, D.C. 20006
Independent Registered Public Accounting Firm
PricewaterhouseCoopers LLP
1055 Broadway
Kansas City, Missouri 64105
P I M C O

Share Class Administrative
Semiannual Report June 30, 2006
PIMCO Variable Insurance Trust
Low Duration Portfolio
Table of Contents
This material is authorized for use only when preceded or accompanied by the current PIMCO Variable Insurance Trust (the “Trust”) prospectus. Investors should consider the investment objectives, risks, charges and expenses of this Trust carefully before investing. Ask your financial professional to explain all charges that may apply. This and other information is contained in the Trust’s prospectus. The variable product prospectus may be obtained by contacting your Investment Consultant. Please read the Trust and variable product prospectus carefully before you invest or send money.
Chairman’s Letter
Dear PIMCO Variable Insurance Trust Shareholder:
It is our pleasure to present to you the semiannual report for the PIMCO Variable Insurance Trust covering the six-month period ended June 30, 2006.
Highlights of the global bond markets during the six-month period included:
| | n | | Most fixed-income sectors lost ground during the first half of 2006, as concern about accelerating inflation and central bank tightening pushed interest rates higher worldwide. The benchmark Lehman Brothers Aggregate Bond Index (which includes Treasury, Investment-Grade Corporate, and Residential Mortgage-Backed Securities) returned -0.72% for the first six months of the year. On June 30, the benchmark ten-year Treasury yielded 5.14%, 0.75% higher than at the start of the year. The U.S. yield curve remained flat as shorter-maturity yields rose by a comparable amount. |
| | n | | The Federal Reserve tightened four times during the reporting period, bringing the Federal Funds Rate to 5.25%. The increase near the end of the period was the Federal Reserve’s 17th consecutive rate hike since the start of its tightening cycle in 2004. The Federal Reserve was not alone, as central banks in Europe, India, and China tightened credit in unison for the first time since 2000. The Bank of Japan, whose zero-interest-rate policy has flooded global markets with liquidity, looked set to reverse this policy in the coming months. |
In these pages please find a more complete Portfolio review as it relates to financial-market activities, as well as details about total-return investment performance for the six-month reporting period. Thank you for the trust you have placed in us. We will continue to work diligently to meet your investment needs.
Sincerely,
Brent R. Harris
Chairman, PIMCO Variable Insurance Trust
July 31, 2006
| | | | | | |
| | | Semiannual Report | | June 30, 2006 | | 1 |
Important Information About the Portfolio
PIMCO Variable Insurance Trust (the “Trust”) is an open-end management investment company currently consisting of nineteen separate investment portfolios, including the Low Duration Portfolio (the “Portfolio”). The Portfolio is only available as a funding vehicle under variable life insurance policies or variable annuity contracts issued by insurance companies (“Variable Contracts”). Individuals may not purchase shares of the Portfolio directly. Shares of the Portfolio also may be sold to qualified pension and retirement plans outside of the separate account context.
We believe that bond funds have an important role to play in a well diversified investment portfolio. It is important to note, however, that in an environment where interest rates may trend upward, rising rates would negatively impact the performance of most bond funds, and fixed-income securities held by a fund are likely to decrease in value. The price volatility of fixed-income securities can also increase during periods of rising interest rates resulting in increased losses to a fund. Bond funds and individual bonds with a longer duration (a measure of the expected life of a security) tend to be more sensitive to changes in interest rates, usually making them more volatile than securities or funds with shorter durations. The longer-term performance of most bond funds has benefited from capital gains in part resulting from an extended period of declining interest rates. In the event interest rates increase, these capital gains should not be expected to recur.
The Portfolio may be subject to various risks in addition to those described above. Some of these risks may include, but are not limited to, the following: credit risk, high yield risk, market risk, issuer risk, liquidity risk, derivatives risk, mortgage risk, non-U.S. investment risk, currency risk, leveraging risk and management risk. A complete description of these risks is contained in the Portfolio’s prospectus. The Portfolio may use derivative instruments for hedging purposes or as part of an investment strategy. Use of these instruments may involve certain costs and risks such as liquidity risk, interest rate risk, market risk, credit risk, management risk and the risk that the Portfolio could not close out a position when it would be most advantageous to do so. A Portfolio investing in derivatives could lose more than the principal amount invested in these instruments. Investing in non-U.S. securities may entail risk due to non-U.S. economic and political developments.
On the performance summary page in this Semiannual Report, the Total Return Investment Performance table measures performance assuming that all dividend and capital gain distributions were reinvested.
An investment in the Portfolio is not a deposit of a bank and is not guaranteed or insured by the Federal Deposit Insurance Corporation or any other government agency. It is possible to lose money on investments in the Portfolio.
PIMCO has adopted written proxy voting policies and procedures (“Proxy Policy”) as required by Rule 206(4)-6 under the Investment Advisers Act of 1940. The Proxy Policy has been adopted by the Trust as the policies and procedures that PIMCO will use when voting proxies on behalf of the Portfolio. Copies of the written Proxy Policy and the factors that PIMCO may consider in determining how to vote proxies for the Portfolio, and information about how the Portfolio voted proxies relating to portfolio securities held during the most recent twelve-month period ended June 30, are available without charge, upon request, by calling the Trust at 1-866-746-2606 and on the Securities and Exchange Commission’s (“SEC”) website at http://www.sec.gov.
The Portfolio files its complete schedule of portfolio holdings with the SEC for the first and third quarters of each fiscal year on Form N-Q. A copy of the Trust’s Form N-Q is available on the SEC’s website at http://www.sec.gov and may be reviewed and copied at the SEC’s Public Reference Room in Washington D.C. Information on the operation of the Public Reference Room may be obtained by calling 1-800-SEC-0330.
PIMCO Variable Insurance Trust is distributed by Allianz Global Investors Distributors LLC, 2187 Atlantic Street, Stamford, CT 06902.
| | | | |
| 2 | | PIMCO Variable Insurance Trust | | |
The following disclosure provides important information regarding the Portfolio’s Expense Example (“Example” or “Expense Example”), which appears in this Semiannual Report. Please refer to this information when reviewing the Expense Example for the Portfolio.
Example
As a shareholder of the Portfolio, you incur two types of costs: (1) transaction costs and (2) ongoing costs, including advisory and administrative fees; distribution and/or service (12b-1) fees (Administrative Class only); and other Portfolio expenses. The Example is intended to help you understand your ongoing costs (in dollars) of investing in the Portfolio and to compare these costs with the ongoing costs of investing in other mutual funds. The Expense Example does not reflect any fees or other expenses imposed by the Variable Contracts. If it did, the expenses reflected in the Expense Examples would be higher. The Example is based on an investment of $1,000 invested at the beginning of the period and held for the entire period indicated, which is from January 1, 206 to June 30, 2006.
Actual Expenses
The information in the table under the heading “Actual Performance” provides information about actual account values and actual expenses. You may use the information in these columns, together with the amount you invested, to estimate the expenses that you paid over the period. Simply divide your account value by $1,000 (for example, an $8,600 account value divided by $1,000 = 8.60), then multiply the result by the number in the appropriate column for your share class, in the row titled “Expenses Paid During Period” to estimate the expenses you paid on your account during this period.
Hypothetical Example for Comparison Purposes
The information in the table under the heading “Hypothetical Performance (5% return before expenses)” provides information about hypothetical account values and hypothetical expenses based on the Portfolio’s actual expense ratio and an assumed rate of return of 5% per year before expenses, which is not the Portfolio’s actual return. The hypothetical account values and expenses may not be used to estimate the actual ending account balance or expenses you paid for the period. You may use this information to compare the ongoing costs of investing in the Portfolio and other portfolios. To do so, compare this 5% hypothetical example with the 5% hypothetical examples that appear in the shareholder reports of the other portfolios.
Please note that the expenses shown in the table are meant to highlight your ongoing costs only and do not reflect any transactional costs. Therefore, the information under the heading “Hypothetical Performance (5% return before expenses)” is useful in comparing ongoing costs only, and will not help you determine the relative total costs of owning different portfolios. In addition, if these transactional costs were included, your costs would have been higher.
The expense ratio may vary period to period because of various factors, such as an increase in expenses not covered by the advisory and administrative fees (such as expenses of the trustees and their counsel or litigation expense).
Portfolio Benchmark
The Merrill Lynch 1-3 Year Treasury Index is an unmanaged index that tracks the performance of the direct sovereign debt of the U.S. Government having a maturity of at least 1 year and less than 3 years. It is not possible to invest directly in the index.
| | | | | | |
| | | Semiannual Report | | June 30, 2006 | | 3 |
| | | | |
| | |
| PIMCO Low Duration Portfolio | | | | |
| | | | |
Cumulative Returns Through June 30, 2006
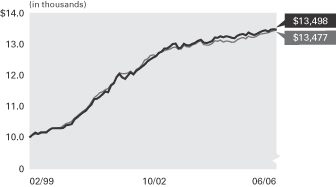
Low Duration Portfolio Merrill Lynch 1-3 Year
Administrative Class U.S. Treasury Index
---------------------- ----------------------
02/28/1999 $10,000 $10,000
03/31/1999 10,082 10,070
04/30/1999 10,151 10,102
05/31/1999 10,116 10,095
06/30/1999 10,164 10,127
07/31/1999 10,165 10,159
08/31/1999 10,162 10,188
09/30/1999 10,243 10,255
10/31/1999 10,293 10,282
11/30/1999 10,303 10,301
12/31/1999 10,292 10,316
01/31/2000 10,290 10,312
02/29/2000 10,308 10,381
03/31/2000 10,386 10,445
04/30/2000 10,406 10,472
05/31/2000 10,432 10,516
06/30/2000 10,584 10,625
07/31/2000 10,646 10,692
08/31/2000 10,727 10,771
09/30/2000 10,806 10,848
10/31/2000 10,859 10,906
11/30/2000 10,971 11,009
12/31/2000 11,054 11,141
01/31/2001 11,234 11,280
02/28/2001 11,251 11,354
03/31/2001 11,314 11,448
04/30/2001 11,395 11,479
05/31/2001 11,488 11,544
06/30/2001 11,464 11,583
07/31/2001 11,681 11,713
08/31/2001 11,754 11,780
09/30/2001 11,949 11,974
10/31/2001 12,055 12,087
11/30/2001 11,947 12,061
12/31/2001 11,896 12,065
01/31/2002 12,008 12,090
02/28/2002 12,101 12,148
03/31/2002 12,043 12,066
04/30/2002 12,153 12,201
05/31/2002 12,218 12,250
06/30/2002 12,294 12,353
07/31/2002 12,355 12,503
08/31/2002 12,464 12,546
09/30/2002 12,530 12,650
10/31/2002 12,587 12,679
11/30/2002 12,625 12,641
12/31/2002 12,735 12,759
01/31/2003 12,777 12,758
02/28/2003 12,876 12,811
03/31/2003 12,889 12,835
04/30/2003 12,941 12,859
05/31/2003 13,027 12,907
06/30/2003 13,043 12,927
07/31/2003 12,883 12,856
08/31/2003 12,914 12,865
09/30/2003 13,031 12,982
10/31/2003 12,982 12,934
11/30/2003 12,981 12,927
12/31/2003 13,033 13,002
01/31/2004 13,068 13,028
02/29/2004 13,128 13,091
03/31/2004 13,164 13,131
04/30/2004 13,074 13,005
05/31/2004 13,059 12,993
06/30/2004 13,084 12,992
07/31/2004 13,122 13,039
08/31/2004 13,237 13,129
09/30/2004 13,226 13,117
10/31/2004 13,280 13,157
11/30/2004 13,247 13,092
12/31/2004 13,274 13,120
01/31/2005 13,257 13,115
02/28/2005 13,226 13,085
03/31/2005 13,212 13,086
04/30/2005 13,290 13,159
05/31/2005 13,330 13,209
06/30/2005 13,348 13,235
07/31/2005 13,313 13,197
08/31/2005 13,399 13,279
09/30/2005 13,346 13,246
10/31/2005 13,316 13,245
11/30/2005 13,355 13,287
12/31/2005 13,408 13,338
01/31/2006 13,446 13,361
02/28/2006 13,471 13,371
03/31/2006 13,428 13,390
04/30/2006 13,498 13,432
05/31/2006 13,504 13,452
06/30/2006 13,498 13,477
$10,000 invested at the beginning of the first full month following the inception date of the Portfolio’s Administrative Class.
Sector Breakdown‡
| | |
Short-Term Instruments | | 51.7% |
U.S. Government Agencies | | 23.1% |
Corporate Bonds & Notes | | 12.3% |
Mortgage-Backed Securities | | 7.1% |
Asset-Backed Securities | | 5.6% |
Other | | 0.2% |
| | ‡ | % of Total Investments as of June 30, 2006 |
| | | | | | | | | | | | |
| Average Annual Total Return for the period ended June 30, 2006 |
| | | | | | | 6 Months* | | 1 Year | | 5 Years | | Since
Inception
(02/16/99)** |
| | |
| | PIMCO Low Duration Portfolio Administrative Class | | 0.67% | | 1.12% | | 3.32% | | 4.11% |
| | |
| | Merrill Lynch 1-3 Year Treasury Index | | 1.04% | | 1.83% | | 3.07% | | 4.15% |
All Portfolio returns are net of fees and expenses.
* Cumulative return.
** The Portfolio began operations on 02/16/99. Index comparisons began on 02/28/99.
Past performance is no guarantee of future results. The performance quoted represents past performance. Investment return and principal value will fluctuate so the Portfolio shares, when redeemed, may be worth more or less than their original cost. The Portfolio’s performance does not reflect the deduction of additional charges and expenses imposed in connection with investing in Variable Contracts, which will reduce returns. Current performance may be lower or higher than the performance data quoted. Performance data current to the most recent month-end is available by calling (800) 927-4648.
| | | | | | | | | | |
| Expense Example | | | | Actual Performance | | | | Hypothetical Performance |
| | | | | | | | | (5% return before expenses) |
Beginning Account Value (01/01/06) | | | | $ | 1,000.00 | | | | $ | 1,000.00 |
Ending Account Value (06/30/06) | | | | $ | 1,006.70 | | | | $ | 1,021.57 |
Expenses Paid During Period† | | | | $ | 3.23 | | | | $ | 3.26 |
† Expenses are equal to the Portfolio’s Administrative Class annualized expense ratio of 0.65%, multiplied by the average account value over the period, multiplied by 181/365 (to reflect the one-half year period). Overall fees and expenses of investing in the Portfolio will be higher because the example does not reflect Variable Contract fees and expenses.
Please refer to page 3 herein for a description of the Portfolio’s benchmark and an explanation of the information presented in the above Expense Example.
Portfolio Insights
| » | | The PIMCO Low Duration Portfolio seeks to achieve its investment objective by investing, under normal circumstances, at least 65% of its total assets in a diversified portfolio of Fixed-Income Securities of varying maturities. |
| » | | Duration and maturity structure were the most significant detractors from the Portfolio’s performance during the six-month period ended June 30, 2006. |
| » | | The Portfolio’s above index duration detracted from returns as concerns about accelerating inflation and more monetary tightening pushed interest rates higher. |
| » | | The Portfolio’s broader-than-index maturity structure with a curve steepening bias detracted from returns as the yield curve continued to flatten. |
| » | | A mortgage emphasis added to returns as this sector outperformed Treasuries on a like-duration basis. Security selection within the mortgage sector also enhanced performance. |
| » | | Investment grade and high-yield corporate bonds were positive as these issues benefited from a strengthening economy and investors’ search for extra yield. |
| » | | Minimal exposure to high-quality emerging markets was slightly positive for performance as emerging markets bonds benefited from continued improvement in credit fundamentals and investors’ demand for higher-yielding securities early in the period. |
| | | | |
| 4 | | PIMCO Variable Insurance Trust | | |
| | |
| |
| Financial Highlights Low Duration Portfolio | | |
| | | | | | | | | | | | | | | | | | | | | | | | |
| Selected Per Share Data for the Year or Period Ended: | | 06/30/2006+ | | | 12/31/2005 | | | 12/31/2004 | | | 12/31/2003 | | | 12/31/2002 | | | 12/31/2001 | |
| | | | | | |
Administrative Class | | | | | | | | | | | | | | | | | | | | | | | | |
| Net asset value beginning of period | | $ | 10.09 | | | $ | 10.30 | | | $ | 10.27 | | | $ | 10.23 | | | $ | 9.95 | | | $ | 9.82 | |
| Net investment income (a) | | | 0.20 | | | | 0.29 | | | | 0.13 | | | | 0.13 | | | | 0.34 | | | | 0.52 | |
| Net realized/unrealized gain (loss) on investments (a) | | | (0.13 | ) | | | (0.18 | ) | | | 0.06 | | | | 0.11 | | | | 0.35 | | | | 0.21 | |
| Total income from investment operations | | | 0.07 | | | | 0.11 | | | | 0.19 | | | | 0.24 | | | | 0.69 | | | | 0.73 | |
| Dividends from net investment income | | | (0.20 | ) | | | (0.29 | ) | | | (0.13 | ) | | | (0.19 | ) | | | (0.35 | ) | | | (0.54 | ) |
| Distributions from net realized capital gains | | | 0.00 | | | | (0.03 | ) | | | (0.03 | ) | | | (0.01 | ) | | | (0.06 | ) | | | (0.06 | ) |
| Total distributions | | | (0.20 | ) | | | (0.32 | ) | | | (0.16 | ) | | | (0.20 | ) | | | (0.41 | ) | | | (0.60 | ) |
| Net asset value end of period | | $ | 9.96 | | | $ | 10.09 | | | $ | 10.30 | | | $ | 10.27 | | | $ | 10.23 | | | $ | 9.95 | |
| Total return | | | 0.67 | % | | | 1.01 | % | | | 1.85 | % | | | 2.34 | % | | | 7.05 | % | | | 7.61 | % |
| Net assets end of period (000s) | | $ | 595,962 | | | $ | 458,677 | | | $ | 281,711 | | | $ | 115,419 | | | $ | 19,495 | | | $ | 5,175 | |
| Ratio of expenses to average net assets | | | 0.65 | %* | | | 0.65 | % | | | 0.65 | % | | | 0.65 | % | | | 0.66 | %(b)(c) | | | 0.69 | %(b)(d) |
| Ratio of net investment income to average net assets | | | 3.93 | %* | | | 2.83 | % | | | 1.24 | % | | | 1.30 | % | | | 3.39 | % | | | 5.19 | % |
| Portfolio turnover rate | | | 127 | % | | | 184 | % | | | 483 | % | | | 284 | % | | | 339 | % | | | 661 | % |
+ Unaudited
* Annualized
(a) Per share amounts based on average number of shares outstanding during the period.
(b) Ratio of expenses to average net assets excluding interest expense is 0.65%.
(c) If the investment manager had not reimbursed expenses, the ratio of expenses to average net assets would have been 0.67%.
(d) If the investment manager had not reimbursed expenses, the ratio of expenses to average net assets would have been 0.70%.
| | | | | | |
| See Accompanying Notes | | Semiannual Report | | June 30, 2006 | | 5 |
| | |
| |
| Statement of Assets and Liabilities Low Duration Portfolio | | |
| | | | |
| (Amounts in thousands, except per share amounts) | | June 30, 2006
(Unaudited) | |
| |
Assets: | | | | |
Investments, at value | | $ | 720,320 | |
Foreign currency, at value | | | 8 | |
Receivable for investments sold | | | 9 | |
Receivable for Portfolio shares sold | | | 1,709 | |
Interest and dividends receivable | | | 1,181 | |
Variation margin receivable | | | 197 | |
Swap premiums paid | | | 59 | |
Unrealized appreciation on forward foreign currency contracts | | | 212 | |
Unrealized appreciation on swap agreements | | | 70 | |
Other assets | | | 1 | |
| | | | 723,766 | |
| |
Liabilities: | | | | |
Payable for investments purchased | | $ | 98,291 | |
Payable for Portfolio shares redeemed | | | 143 | |
Written options outstanding | | | 1,344 | |
Accrued investment advisory fee | | | 135 | |
Accrued administration fee | | | 135 | |
Accrued servicing fee | | | 70 | |
Variation margin payable | | | 23 | |
Unrealized depreciation on forward foreign currency contracts | | | 2,162 | |
Unrealized depreciation on swap agreements | | | 12 | |
| | | | 102,315 | |
| |
Net Assets | | $ | 621,451 | |
| |
Net Assets Consist of: | | | | |
Paid in capital | | $ | 635,900 | |
Undistributed net investment income | | | 680 | |
Accumulated undistributed net realized (loss) | | | (8,247 | ) |
Net unrealized (depreciation) | | | (6,882 | ) |
| | | $ | 621,451 | |
| |
Net Assets: | | | | |
Institutional Class | | $ | 25,479 | |
Administrative Class | | | 595,962 | |
Advisor Class | | | 10 | |
| |
Shares Issued and Outstanding: | | | | |
Institutional Class | | | 2,557 | |
Administrative Class | | | 59,807 | |
Advisor Class | | | 1 | |
| |
Net Asset Value and Redemption Price Per Share (Net Assets Per Share Outstanding) | | | | |
Institutional Class | | $ | 9.96 | |
Administrative Class | | | 9.96 | |
Advisor Class | | | 9.96 | |
| |
Cost of Investments Owned | | $ | 719,941 | |
Cost of Foreign Currency Held | | $ | 8 | |
Premiums Received on Written Options | | $ | 1,189 | |
| | | | |
| 6 | | PIMCO Variable Insurance Trust | | See Accompanying Notes |
| | |
| |
| Statement of Operations Low Duration Portfolio | | |
| | | | |
| (Amounts in Thousands) | | Six Months Ended
June 30, 2006
(Unaudited) | |
| |
Investment Income: | | | | |
Interest, net of foreign taxes | | $ | 12,579 | |
Dividends | | | 20 | |
Miscellaneous income | | | 5 | |
Total Income | | | 12,604 | |
| |
Expenses: | | | | |
Investment advisory fees | | | 686 | |
Administration fees | | | 686 | |
Servicing fees – Administrative Class | | | 394 | |
Trustees’ fees | | | 3 | |
Total Expenses | | | 1,769 | |
| |
Net Investment Income | | | 10,835 | |
| |
Net Realized and Unrealized Gain (Loss): | | | | |
Net realized (loss) on investments | | | (1,479 | ) |
Net realized gain on futures contracts, options and swaps | | | 1,174 | |
Net realized (loss) on foreign currency transactions | | | (1,885 | ) |
Net change in unrealized (depreciation) on investments | | | (2,194 | ) |
Net change in unrealized (depreciation) on futures contracts, options and swaps | | | (5,438 | ) |
Net change in unrealized appreciation on translation of assets and liabilities denominated in foreign currencies | | | 2,742 | |
Net (Loss) | | | (7,080 | ) |
| |
Net Increase in Net Assets Resulting from Operations | | $ | 3,755 | |
| | | | | | |
| See Accompanying Notes | | Semiannual Report | | June 30, 2006 | | 7 |
| | |
| |
| Statements of Changes in Net Assets Low Duration Portfolio | | |
| | | | | | | | |
| (Amounts in Thousands) | | Six Months Ended
June 30, 2006
(Unaudited) | | | Year Ended
December 31, 2005 | |
| | |
Increase (Decrease) in Net Assets from: | | | | | | | | |
| | |
Operations: | | | | | | | | |
Net investment income | | $ | 10,835 | | | $ | 10,648 | |
Net realized (loss) | | | (2,190 | ) | | | (3,618 | ) |
Net change in unrealized (depreciation) | | | (4,890 | ) | | | (2,598 | ) |
Net increase resulting from operations | | | 3,755 | | | | 4,432 | |
| | |
Distributions to Shareholders: | | | | | | | | |
| From net investment income | | | | | | | | |
Institutional Class | | | (467 | ) | | | (513 | ) |
Administrative Class | | | (10,469 | ) | | | (10,349 | ) |
Advisor Class | | | 0 | | | | 0 | |
| From net realized capital gains | | | | | | | | |
Institutional Class | | | 0 | | | | (48 | ) |
Administrative Class | | | 0 | | | | (1,196 | ) |
Advisor Class | | | 0 | | | | 0 | |
| | |
Total Distributions | | | (10,936 | ) | | | (12,106 | ) |
| | |
Portfolio Share Transactions: | | | | | | | | |
| Receipts for shares sold | | | | | | | | |
Institutional Class | | | 10,012 | | | | 10,460 | |
Administrative Class | | | 184,037 | | | | 239,555 | |
Advisor Class | | | 10 | | | | 0 | |
| Issued as reinvestment of distributions | | | | | | | | |
Institutional Class | | | 467 | | | | 561 | |
Administrative Class | | | 10,471 | | | | 11,545 | |
Advisor Class | | | 0 | | | | 0 | |
| Cost of shares redeemed | | | | | | | | |
Institutional Class | | | (2,796 | ) | | | (4,836 | ) |
Administrative Class | | | (50,338 | ) | | | (66,805 | ) |
Advisor Class | | | 0 | | | | 0 | |
Net increase resulting from Portfolio share transactions | | | 151,863 | | | | 190,480 | |
| | |
Total Increase in Net Assets | | | 144,682 | | | | 182,806 | |
| | |
Net Assets: | | | | | | | | |
Beginning of period | | | 476,769 | | | | 293,963 | |
End of period* | | $ | 621,451 | | | $ | 476,769 | |
| | |
*Including undistributed net investment income of: | | $ | 680 | | | $ | 781 | |
| | | | |
| 8 | | PIMCO Variable Insurance Trust | | See Accompanying Notes |
| | |
| |
| Schedule of Investments Low Duration Portfolio | | June 30, 2006 (Unaudited) |
| | | | | | | | |
| | | | | PRINCIPAL | | | | |
| | | | | AMOUNT | | | | VALUE |
| | | | | (000S) | | | | (000S) |
| |
| CORPORATE BONDS & NOTES 14.3% |
| |
| BANKING & FINANCE 11.1% |
| American Express Credit Corp. |
5.170% due 06/12/2007 | | $ | | 1,000 | | $ | | 1,001 |
|
| American General Finance Corp. |
5.489% due 03/23/2007 | | | | 200 | | | | 200 |
|
| Bank of America Corp. |
5.406% due 06/19/2009 | | | | 6,100 | | | | 6,102 |
|
| Bear Stearns Cos., Inc. |
5.299% due 04/29/2008 | | | | 3,400 | | | | 3,409 |
5.589% due 03/30/2009 | | | | 2,300 | | | | 2,302 |
|
| CIT Group, Inc. |
5.404% due 05/23/2008 | | | | 4,600 | | | | 4,614 |
5.420% due 11/03/2010 | | | | 1,400 | | | | 1,406 |
|
| Citigroup, Inc. |
4.200% due 12/20/2007 | | | | 4,100 | | | | 4,021 |
5.520% due 12/26/2008 | | | | 200 | | | | 200 |
5.166% due 01/30/2009 | | | | 1,900 | | | | 1,901 |
|
| Ford Motor Credit Co. |
7.750% due 02/15/2007 | | | | 400 | | | | 401 |
6.374% due 03/21/2007 | | | | 2,000 | | | | 1,993 |
7.200% due 06/15/2007 | | | | 100 | | | | 99 |
|
| General Electric Capital Corp. |
5.222% due 01/08/2016 | | | | 300 | | | | 300 |
|
| Goldman Sachs Group, Inc. |
5.125% due 10/05/2007 | | | | 1,600 | | | | 1,603 |
5.226% due 07/29/2008 | | | | 1,200 | | | | 1,202 |
5.527% due 12/22/2008 | | | | 2,100 | | | | 2,103 |
5.420% due 07/23/2009 | | | | 1,300 | | | | 1,310 |
|
| HSBC Bank USA N.A. |
5.176% due 07/28/2008 | | | | 3,100 | | | | 3,104 |
|
| HSBC Finance Corp. |
5.459% due 09/15/2008 | | | | 500 | | | | 501 |
|
| Lehman Brothers Holdings, Inc. |
5.659% due 12/23/2010 | | | | 900 | | | | 902 |
|
| Merrill Lynch & Co., Inc. |
5.441% due 06/16/2008 | | | | 6,000 | | | | 6,009 |
|
| Morgan Stanley |
5.276% due 02/09/2009 | | | | 1,100 | | | | 1,102 |
5.318% due 01/18/2011 | | | | 1,500 | | | | 1,503 |
|
| Prudential Financial, Inc. |
4.104% due 11/15/2006 | | | | 400 | | | | 398 |
|
| Royal Bank of Scotland Group PLC |
5.424% due 12/21/2007 | | | | 1,200 | | | | 1,201 |
|
| Santander U.S. Debt S.A. Unipersonal |
5.434% due 09/21/2007 | | | | 2,000 | | | | 2,002 |
5.484% due 09/19/2008 | | | | 2,800 | | | | 2,803 |
|
| Unicredito Italiano |
5.231% due 12/03/2007 | | | | 5,400 | | | | 5,414 |
|
| Wachovia Bank N.A. |
5.270% due 05/25/2010 | | | | 6,000 | | | | 6,002 |
|
| Wells Fargo |
5.340% due 03/10/2008 | | | | 4,000 | | | | 4,003 |
| | | | | | | | |
|
| | | | | | | | | 69,111 |
| | | | | | | | |
|
| |
| INDUSTRIALS 1.7% | | | | | | | | |
| Altria Group, Inc. |
7.650% due 07/01/2008 | | | | 200 | | | | 207 |
|
| Clear Channel Communications, Inc. |
6.000% due 11/01/2006 | | | | 250 | | | | 250 |
| | | | | | | | |
| CSC Holdings, Inc. |
7.250% due 07/15/2008 | | $ | | 3,500 | | $ | | 3,522 |
|
| DaimlerChrysler N.A. Holding Corp. |
5.780% due 09/10/2007 | | | | 4,758 | | | | 4,774 |
|
| International Paper Co. |
7.625% due 01/15/2007 | | | | 250 | | | | 252 |
|
| Oracle Corp. & Ozark Holding, Inc. |
5.280% due 01/13/2009 | | | | 1,200 | | | | 1,202 |
| | | | | | | | |
|
| | | | | | | | | 10,207 |
| | | | | | | | |
|
| |
| UTILITIES 1.5% | | | | | | | | |
| AT&T, Inc. |
5.262% due 05/15/2008 | | | | 5,900 | | | | 5,903 |
|
| Entergy Mississippi, Inc. |
4.350% due 04/01/2008 | | | | 100 | | | | 97 |
|
| Qwest Capital Funding, Inc. |
6.375% due 07/15/2008 | | | | 1,870 | | | | 1,851 |
|
| Telefonica Emisones SAU |
5.714% due 06/19/2009 | | | | 1,700 | | | | 1,702 |
| | | | | | | | |
|
| | | | | | | | | 9,553 |
| | | | | | | | |
|
Total Corporate Bonds & Notes
(Cost $88,855) | | | | 88,871 |
| | | | | | | | |
|
| |
| U.S. GOVERNMENT AGENCIES 26.8% |
| Fannie Mae |
3.716% due 07/01/2034 | | | | 422 | | | | 416 |
4.350% due 03/01/2035 | | | | 414 | | | | 409 |
4.503% due 05/01/2035 | | | | 1,045 | | | | 1,025 |
4.526% due 05/01/2035 | | | | 1,045 | | | | 1,028 |
4.542% due 09/01/2035 | | | | 1,705 | | | | 1,681 |
4.599% due 11/01/2035 | | | | 1,904 | | | | 1,878 |
4.655% due 08/01/2035 | | | | 3,865 | | | | 3,773 |
4.683% due 07/01/2035 | | | | 673 | | | | 659 |
5.000% due 03/01/2018 - 04/25/2033 (b) | | | | 66,650 | | | | 64,227 |
5.211% due 07/01/2042 | | | | 738 | | | | 742 |
5.249% due 04/26/2035 | | | | 44 | | | | 44 |
5.261% due 09/01/2041 | | | | 919 | | | | 926 |
5.312% due 09/22/2006 | | | | 1,300 | | | | 1,300 |
5.372% due 09/25/2035 | | | | 581 | | | | 581 |
5.411% due 09/01/2040 | | | | 19 | | | | 20 |
5.442% due 03/25/2034 | | | | 255 | | | | 256 |
5.500% due 12/01/2009 - 07/13/2036 (b) | | | | 74,532 | | | | 73,025 |
5.672% due 09/25/2042 - 03/25/2044 (b) | | | | 2,056 | | | | 2,065 |
5.695% due 09/01/2034 | | | | 100 | | | | 99 |
5.722% due 05/25/2031 - 11/25/2032 (b) | | | | 1,752 | | | | 1,757 |
5.736% due 12/01/2036 | | | | 102 | | | | 102 |
5.977% due 11/01/2035 | | | | 657 | | | | 671 |
6.000% due 08/01/2016 - 03/01/2033 (b) | | | | 151 | | | | 150 |
6.500% due 01/01/2033 | | | | 29 | | | | 29 |
|
| Federal Housing Administration |
6.390% due 10/01/2020 | | | | 20 | | | | 21 |
|
| Freddie Mac |
4.715% due 06/01/2035 | | | | 2,733 | | | | 2,646 |
4.922% due 07/01/2035 | | | | 1,093 | | | | 1,066 |
5.000% due 10/01/2018 - 07/15/2024 (b) | | | | 2,257 | | | | 2,227 |
5.211% due 02/25/2045 | | | | 1,598 | | | | 1,587 |
5.500% due 08/15/2030 | | | | 13 | | | | 13 |
5.549% due 12/15/2030 | | | | 658 | | | | 659 |
5.582% due 08/25/2031 | | | | 640 | | | | 643 |
5.597% due 06/15/2018 | | | | 235 | | | | 235 |
6.000% due 09/01/2016 - 02/01/2033 (b) | | | | 134 | | | | 132 |
6.500% due 07/25/2043 | | | | 213 | | | | 215 |
| | | | | | | | |
| Government National Mortgage Association |
4.000% due 07/16/2027 | | $ | | 310 | | $ | | 305 |
| | | | | | | | |
|
Total U.S. Government Agencies
(Cost $169,232) | | | | 166,612 |
| | | | | | | | |
|
| |
| MORTGAGE-BACKED SECURITIES 8.2% |
| American Home Mortgage Investment Trust |
4.290% due 10/25/2034 | | | | 1,867 | | | | 1,816 |
4.390% due 02/25/2045 | | | | 766 | | | | 739 |
|
| Banc of America Funding Corp. |
4.116% due 05/25/2035 | | | | 8,620 | | | | 8,311 |
|
| Banc of America Mortgage Securities |
6.500% due 10/25/2031 | | | | 125 | | | | 126 |
5.403% due 10/20/2032 | | | | 5 | | | | 5 |
|
| Bear Stearns Adjustable Rate Mortgage Trust |
5.330% due 01/25/2033 | | | | 16 | | | | 16 |
5.450% due 03/25/2033 | | | | 56 | | | | 55 |
5.062% due 04/25/2033 | | | | 34 | | | | 34 |
4.819% due 01/25/2034 | | | | 163 | | | | 160 |
4.750% due 11/25/2035 | | | | 3,619 | | | | 3,553 |
|
| Bear Stearns Alt-A Trust |
5.406% due 05/25/2035 | | | | 1,202 | | | | 1,188 |
|
| Citigroup Mortgage Loan Trust, Inc. |
4.900% due 12/25/2035 | | | | 924 | | | | 918 |
|
| Countrywide Alternative Loan Trust |
6.500% due 06/25/2033 | | | | 27 | | | | 27 |
6.000% due 10/25/2033 | | | | 149 | | | | 144 |
4.500% due 06/25/2035 | | | | 3,638 | | | | 3,565 |
5.602% due 02/25/2036 | | | | 4,565 | | | | 4,575 |
|
| Countrywide Home Loan Mortgage Pass-Through Trust |
5.592% due 04/25/2034 | | | | 151 | | | | 151 |
5.250% due 11/20/2035 | | | | 1,441 | | | | 1,418 |
|
| CS First Boston Mortgage Securities Corp. |
4.938% due 05/15/2010 | | | | 752 | | | | 741 |
5.020% due 03/25/2032 | | | | 14 | | | | 14 |
6.056% due 06/25/2032 | | | | 1 | | | | 1 |
5.686% due 10/25/2032 | | | | 3 | | | | 3 |
5.872% due 08/25/2033 | | | | 13 | | | | 13 |
|
| GMAC Mortgage Corp. Loan Trust |
5.009% due 11/19/2035 | | | | 969 | | | | 957 |
GSR Mortgage Loan Trust | | | | | | | | |
6.000% due 03/25/2032 | | | | 4 | | | | 4 |
4.541% due 09/25/2035 | | | | 3,703 | | | | 3,605 |
|
| Impac CMB Trust |
5.722% due 07/25/2033 | | | | 77 | | | | 77 |
5.572% due 01/25/2034 | | | | 106 | | | | 106 |
|
| LB-UBS Commercial Mortgage Trust |
4.990% due 11/15/2030 | | | | 991 | | | | 977 |
|
| MASTR Adjustable Rate Mortgages Trust |
3.787% due 12/21/2034 | | | | 220 | | | | 220 |
|
| MASTR Asset Securitization Trust |
5.500% due 09/25/2033 | | | | 84 | | | | 80 |
|
| Mellon Residential Funding Corp. |
5.439% due 06/15/2030 | | | | 703 | | | | 706 |
|
| MLCC Mortgage Investors, Inc. |
6.628% due 01/25/2029 | | | | 192 | | | | 194 |
|
| Prime Mortgage Trust |
5.722% due 02/25/2034 | | | | 86 | | | | 86 |
5.722% due 02/25/2034 | | | | 27 | | | | 27 |
|
| Salomon Brothers Mortgage Securities VII |
4.000% due 12/25/2018 | | | | 369 | | | | 347 |
| | | | | | |
| See Accompanying Notes | | Semiannual Report | | June 30, 2006 | | 9 |
| | |
| |
| Schedule of Investments Low Duration Portfolio (Cont.) | | |
| | | | |
| | | PRINCIPAL | | |
| | | AMOUNT | | VALUE |
| | | (000S) | | (000S) |
| | | | | |
| | | | | | | | |
| Sequoia Mortgage Trust |
5.607% due 05/20/2032 | | $ | | 21 | | $ | | 21 |
5.567% due 08/20/2032 | | | | 15 | | | | 15 |
|
| Structured Adjustable Rate Mortgage Loan Trust |
4.580% due 02/25/2034 | | | | 1,311 | | | | 1,285 |
5.355% due 08/25/2034 | | | | 1,635 | | | | 1,624 |
5.682% due 01/25/2035 | | | | 1,543 | | | | 1,558 |
|
| Structured Asset Mortgage Investments, Inc. |
5.582% due 09/19/2032 | | | | 31 | | | | 31 |
5.602% due 02/25/2035 | | | | 487 | | | | 486 |
|
| Structured Asset Securities Corp. |
6.150% due 07/25/2032 | | | | 1 | | | | 1 |
5.422% due 09/25/2035 | | | | 2,911 | | | | 2,913 |
|
| Washington Mutual, Inc. |
4.816% due 10/25/2032 | | | | 293 | | | | 290 |
5.009% due 02/27/2034 | | | | 85 | | | | 84 |
5.202% due 05/25/2041 | | | | 460 | | | | 462 |
5.543% due 06/25/2042 | | | | 395 | | | | 395 |
5.410% due 08/25/2042 | | | | 160 | | | | 160 |
5.612% due 10/25/2045 | | | | 4,156 | | | | 4,183 |
5.592% due 12/26/2045 | | | | 815 | | | | 818 |
|
| Wells Fargo Mortgage-Backed Securities Trust |
3.540% due 09/25/2034 | | | | 273 | | | | 272 |
4.950% due 03/25/2036 | | | | 1,635 | | | | 1,613 |
| | | | | | | | |
|
Total Mortgage-Backed Securities
(Cost $51,746) | | | | 51,170 |
| | | | | | | | |
|
| |
| ASSET-BACKED SECURITIES 6.5% |
| AAA Trust | | | | | | | | |
5.422% due 04/25/2035 | | | | 125 | | | | 125 |
|
| ACE Securities Corp. |
5.432% due 10/25/2035 | | | | 2,626 | | | | 2,628 |
|
| Amortizing Residential Collateral Trust |
5.612% due 07/25/2032 | | | | 13 | | | | 13 |
|
| Argent Securities, Inc. |
5.442% due 10/25/2035 | | | | 476 | | | | 477 |
5.462% due 12/25/2035 | | | | 1,780 | | | | 1,781 |
|
| Asset-Backed Funding Certificates |
5.432% due 08/25/2035 | | | | 882 | | | | 883 |
|
| Asset-Backed Securities Corp. Home Equity |
6.299% due 03/15/2032 | | | | 549 | | | | 550 |
5.422% due 07/25/2035 | | | | 79 | | | | 80 |
|
| Bear Stearns Asset-Backed Securities, Inc. |
5.522% due 09/25/2034 | | | | 286 | | | | 286 |
5.522% due 06/15/2043 | | | | 310 | | | | 310 |
|
| Carrington Mortgage Loan Trust |
5.402% due 06/25/2035 | | | | 73 | | | | 73 |
|
| Centex Home Equity |
5.412% due 06/25/2035 | | | | 526 | | | | 526 |
|
| Chase Manhattan Auto Owner Trust |
4.770% due 03/15/2008 | | | | 2,200 | | | | 2,196 |
|
| CIT Group Home Equity Loan Trust |
5.592% due 06/25/2033 | | | | 8 | | | | 8 |
|
| Citigroup Mortgage Loan Trust, Inc. |
5.412% due 07/25/2035 | | | | 117 | | | | 117 |
5.422% due 07/25/2035 | | | | 217 | | | | 217 |
5.432% due 09/25/2035 | | | | 411 | | | | 411 |
|
| Conseco Finance Securitizations Corp. |
6.090% due 09/01/2033 | | | | 3,351 | | | | 3,353 |
| | | | | | | | |
| Countrywide Asset-Backed Certificates |
5.802% due 12/25/2031 | | $ | | 120 | | $ | | 120 |
5.442% due 03/25/2035 | | | | 63 | | | | 63 |
5.402% due 06/25/2035 | | | | 87 | | | | 87 |
5.422% due 08/25/2035 | | | | 562 | | | | 562 |
5.402% due 10/25/2035 | | | | 315 | | | | 315 |
|
| CS First Boston Mortgage Securities Corp. |
5.632% due 01/25/2032 | | | | 19 | | | | 20 |
|
| Equity One ABS, Inc. |
5.602% due 11/25/2032 | | | | 17 | | | | 17 |
|
| FBR Securitization Trust |
5.462% due 09/25/2035 | | | | 719 | | | | 719 |
5.442% due 11/25/2035 | | | | 3,416 | | | | 3,419 |
|
| First Franklin Mortgage Loan Asset-Backed Certificates |
5.432% due 03/25/2025 | | | | 270 | | | | 270 |
|
| First NLC Trust |
5.432% due 09/25/2035 | | | | 255 | | | | 255 |
5.432% due 12/25/2035 | | | | 412 | | | | 413 |
|
| Fremont Home Loan Trust |
5.412% due 01/25/2036 | | | | 690 | | | | 690 |
|
| GSAMP Trust |
5.512% due 10/25/2033 | | | | 71 | | | | 71 |
5.612% due 03/25/2034 | | | | 393 | | | | 394 |
GSR Mortgage Loan Trust | | | | | | | | |
5.422% due 12/25/2030 | | | | 740 | | | | 741 |
|
| HFC Home Equity Loan Asset-Backed Certificates |
5.617% due 09/20/2033 | | | | 297 | | | | 298 |
|
| Indymac Residential Asset-Backed Trust |
5.422% due 03/25/2036 | | | | 760 | | | | 761 |
|
| Long Beach Mortgage Loan Trust |
5.522% due 11/25/2034 | | | | 1,203 | | | | 1,204 |
5.442% due 09/25/2035 | | | | 690 | | | | 690 |
5.412% due 01/25/2036 | | | | 931 | | | | 931 |
5.402% due 02/25/2036 | | | | 943 | | | | 944 |
|
| New Century Home Equity Loan Trust |
5.432% due 09/25/2035 | | | | 802 | | | | 803 |
|
| Option One Mortgage Loan Trust |
5.422% due 08/25/2035 | | | | 53 | | | | 53 |
5.422% due 11/25/2035 | | | | 1,634 | | | | 1,635 |
|
| Park Place Securities, Inc. |
5.432% due 08/25/2035 | | | | 481 | | | | 482 |
|
| Quest Trust |
5.402% due 12/25/2035 | | | | 341 | | | | 341 |
|
| Renaissance Home Equity Loan Trust |
5.472% due 10/25/2035 | | | | 750 | | | | 751 |
|
| Residential Asset Mortgage Products, Inc. |
5.432% due 10/25/2025 | | | | 1,237 | | | | 1,238 |
5.662% due 09/25/2033 | | | | 8 | | | | 8 |
5.572% due 02/25/2034 | | | | 127 | | | | 127 |
5.422% due 03/25/2035 | | | | 886 | | | | 887 |
|
| SLM Student Loan Trust |
5.120% due 07/25/2013 | | | | 650 | | | | 651 |
5.110% due 01/26/2015 | | | | 904 | | | | 903 |
|
| Soundview Home Equity Loan Trust |
5.432% due 05/25/2035 | | | | 127 | | | | 127 |
5.422% due 07/25/2035 | | | | 15 | | | | 15 |
5.432% due 11/25/2035 | | | | 1,335 | | | | 1,336 |
5.422% due 12/25/2035 | | | | 431 | | | | 431 |
|
| Structured Asset Securities Corp. |
5.422% due 08/25/2035 | | | | 391 | | | | 391 |
5.452% due 12/25/2035 | | | | 1,459 | | | | 1,460 |
| | | | | | | | |
| Truman Capital Mortgage Loan Trust |
5.662% due 01/25/2034 | | $ | | 206 | | $ | | 207 |
|
| Wachovia Auto Owner Trust |
4.820% due 02/20/2009 | | | | 1,300 | | | | 1,296 |
| | | | | | | | |
|
Total Asset-Backed Securities
(Cost $40,143) | | | | 40,160 |
| | | | | | | | |
|
| |
| | | | | NOTIONAL
AMOUNT
(000S) | | | | |
| |
| PURCHASED CALL OPTIONS 0.1% |
| 2-Year Interest Rate Swap (OTC) Pay 3-Month USD-LIBOR Floating Rate Index |
Strike @ 4.500% Exp. 10/04/2006 | | | | 12,500 | | | | 0 |
Strike @ 4.750% Exp. 08/07/2006 | | | | 19,000 | | | | 0 |
Strike @ 4.750% Exp. 08/08/2006 | | | | 6,000 | | | | 0 |
Strike @ 4.800% Exp. 12/22/2006 | | | | 14,000 | | | | 2 |
Strike @ 5.000% Exp. 03/08/2007 | | | | 16,000 | | | | 14 |
Strike @ 5.000% Exp. 03/08/2007 | | | | 7,000 | | | | 6 |
Strike @ 5.080% Exp. 04/19/2007 | | | | 13,800 | | | | 20 |
Strike @ 5.130% Exp. 10/25/2006 | | | | 24,300 | | | | 7 |
Strike @ 5.130% Exp. 10/25/2006 | | | | 5,000 | | | | 2 |
Strike @ 5.170% Exp. 02/01/2007 | | | | 15,200 | | | | 18 |
Strike @ 5.200% Exp. 05/09/2007 | | | | 33,600 | | | | 73 |
Strike @ 5.250% Exp. 06/07/2007 | | | | 30,000 | | | | 82 |
| | | | | | | | |
|
Total Purchased Call Options
(Cost $743) | | | | 224 |
| | | | | | | | |
|
| |
| | | | | #OF
CONTRACTS | | | | |
| |
| PURCHASED PUT OPTIONS 0.0% |
| 90-Day Eurodollar December Futures (CME) |
Strike @ $92.250 Exp. 12/18/2006 | | | | 96 | | | | 1 |
Strike @ $92.500 Exp. 12/18/2006 | | | | 120 | | | | 1 |
|
| 90-Day Eurodollar June Futures (CME) |
Strike @ $91.000 Exp. 06/18/2007 | | | | 337 | | | | 2 |
Strike @ $91.250 Exp. 06/18/2007 | | | | 423 | | | | 3 |
|
| 90-Day Eurodollar March Futures (CME) |
Strike @ $92.000 Exp. 03/19/2007 | | | | 469 | | | | 3 |
|
| 90-Day Eurodollar September Futures (CME) |
Strike @ $92.750 Exp. 09/18/2006 | | | | 556 | | | | 3 |
| | | | | | | | |
|
Total Purchased Put Options
(Cost $19) | | | | 13 |
| | | | | | | | |
|
| |
| | | | | NOTIONAL
AMOUNT
(000S) | | | | |
| |
| PURCHASED STRADDLE OPTIONS 0.0% |
| Call & Put – OTC U.S. dollar versus Japanese Yen Forward Delta Neutral Straddle |
Strike @ $0.000 (g) Exp. 08/23/2007 | | $ | | 7,000 | | | | 4 |
| | | | | | | | |
|
Total Purchased Straddle Options (Cost $0) | | 4 |
| | | | | | | | |
|
| | | | |
| 10 | | PIMCO Variable Insurance Trust | | See Accompanying Notes |
| | |
| |
| | | June 30, 2006 (Unaudited) |
| | | | | | | | |
| PREFERRED STOCK 0.1% |
| DG Funding Trust | | | | | | | | |
7.210% due 12/31/2049 | | | | 60 | | $ | | 633 |
| | | | | | | | |
|
Total Preferred Stock (Cost $632) | | | | 633 |
| | | | | | | | |
|
| |
| | | | | PRINCIPAL
AMOUNT
(000S) | | | | |
| SHORT-TERM INSTRUMENTS 59.9% |
| |
| BELGIUM TREASURY BILLS 4.7% |
2.757% due 10/12/2006 | | EUR | | 23,060 | | | | 29,262 |
| | | | | | | | |
|
| |
| |
| COMMERCIAL PAPER 37.1% |
| Barclays U.S. Fund | | | | | | | | |
5.055% due 08/16/2006 | | $ | | 12,200 | | | | 12,125 |
5.105% due 08/22/2006 | | | | 5,900 | | | | 5,858 |
|
| BNP Paribas Finance | | | | | | | | |
4.930% due 07/13/2006 | | | | 2,400 | | | | 2,397 |
5.079% due 08/22/2006 | | | | 15,600 | | | | 15,490 |
|
| Caisse d’Amortissement de la Dette Sociale |
5.270% due 08/03/2006 | | | | 17,000 | | | | 16,923 |
|
| Cox Communications, Inc. |
5.160% due 07/17/2006 | | | | 600 | | | | 600 |
|
| Danske Corp. | | | | | | | | |
5.280% due 07/17/2006 | | | | 5,400 | | | | 5,389 |
4.955% due 07/20/2006 | | | | 600 | | | | 599 |
4.980% due 07/26/2006 | | | | 4,100 | | | | 4,087 |
5.080% due 08/24/2006 | | | | 8,800 | | | | 8,735 |
|
| Dexia Delaware LLC | | | | | | | | |
5.275% due 07/05/2006 | | | | 3,300 | | | | 3,299 |
4.980% due 07/25/2006 | | | | 15,600 | | | | 15,553 |
|
| DnB NORBank ASA |
4.960% due 07/17/2006 | | | | 10,900 | | | | 10,879 |
|
| Fannie Mae |
4.809% due 07/05/2006 | | | | 17,200 | | | | 17,195 |
|
| Federal Home Loan Bank |
5.030% due 07/03/2006 | | | | 17,200 | | | | 17,200 |
| | | | | | | | |
| Fortis Funding |
5.265% due 07/26/2006 | | $ | | 3,100 | | $ | | 3,090 |
|
| General Electric Capital Corp. |
4.975% due 07/24/2006 | | | | 2,400 | | | | 2,393 |
|
| HBOS Treasury Services PLC |
4.985% due 07/26/2006 | | | | 14,900 | | | | 14,853 |
|
| Rabobank USA Financial Corp. |
5.250% due 07/03/2006 | | | | 17,200 | | | | 17,200 |
|
| Skandinaviska Enskilda Banken |
4.960% due 07/20/2006 | | | | 500 | | | | 499 |
|
| Societe Generale N.A. | | | | | | | | |
5.270% due 07/03/2006 | | | | 300 | | | | 300 |
5.245% due 08/08/2006 | | | | 16,500 | | | | 16,413 |
5.055% due 08/15/2006 | | | | 1,100 | | | | 1,093 |
4.985% due 08/22/2006 | | | | 1,000 | | | | 993 |
|
| Total Captial S.A. |
5.270% due 07/03/2006 | | | | 17,200 | | | | 17,200 |
|
| UBS Finance Delaware LLC |
5.270% due 07/03/2006 | | | | 400 | | | | 400 |
5.050% due 07/05/2006 | | | | 4,700 | | | | 4,699 |
4.790% due 07/07/2006 | | | | 3,900 | | | | 3,898 |
4.930% due 07/10/2006 | | | | 1,000 | | | | 999 |
5.095% due 09/22/2006 | | | | 9,000 | | | | 8,887 |
|
| Westpac Capital Corp. | | | | | | | | |
4.980% due 07/24/2006 | | | | 1,200 | | | | 1,196 |
| | | | | | | | |
|
| | | | | | | | | 230,442 |
| | | | | | | | |
|
| |
| FRANCE TREASURY BILLS 6.1% |
2.775% due 07/06/2006 -
11/23/2006 (b) | | EUR | | 29,900 | | | | 37,957 |
| | | | | | | | |
|
| |
| GERMANY TREASURY BILLS 8.5% |
2.590% due 07/12/2006 -
10/18/2006 (b) | | | | 41,410 | | | | 52,871 |
| | | | | | | | |
|
| | | | | | | | |
| REPURCHASE AGREEMENTS 2.5% |
| Credit Suisse First Boston | | | | |
4.580% due 07/03/2006 | | $ | | 4,600 | | $ | | 4,600 |
(Dated 06/30/2006. Collateralized by U.S. Treasury
Notes 4.000% due 06/15/2009 valued at $4,729. Repurchase proceeds are $4,602.) |
4.600% due 07/03/2006 | | | | 5,000 | | | | 5,000 |
(Dated 06/30/2006. Collateralized by U.S. Treasury Notes 3.250% due 08/15/2007 valued at $5,107. Repurchase proceeds are $5,002.) |
|
| State Street Bank | | | | | | | | |
4.900% due 07/03/2006 | | | | 5,892 | | | | 5,892 |
(Dated 06/30/2006. Collateralized by Freddie Mac 2.750% due 02/09/2007 valued at $6,011. Repurchase proceeds are $5,894.) |
| | | | | | | | |
|
| | | | | | | | | 15,492 |
| | | | | | | | |
|
| |
| SPAIN TREASURY BILLS 0.4% |
2.890% due 12/22/2006 | | EUR | | 2,500 | | | | 3,153 |
| | | | | | | | |
|
| |
| U.S. TREASURY BILLS 0.6% |
4.568% due 08/31/2006 -
09/14/2006 (b)(c) | | $ | | 3,495 | | | | 3,456 |
| | | | | | | | |
|
Total Short-Term Instruments
(Cost $368,571) | | | | 372,633 |
| | | | | | | | |
|
| |
Total Investments (a) 115.9%
(Cost $719,941) | | $ | | 720,320 |
| |
Written Options (e) (0.2%)
(Premiums $1,189) | | | | (1,344) |
| |
| Other Assets and Liabilities (Net) (15.7%) | | | | (97,525) |
| | | | | | | | |
|
| Net Assets 100.0% | | | | | | $ | | 621,451 |
| | | | | | | | |
|
| | |
Notes to Schedule of Investments (amounts in thousands, except number of contracts): |
| |
(a) As of June 30, 2006, portfolio securities with an aggregate market value of $1,606 were valued in good faith and pursuant to guidelines established by the Board of Trustees. |
| |
(b) Securities are grouped by coupon or range of coupons and represent a range of maturities. |
| |
(c) Securities with an aggregate market value of $3,456 have been segregated with the custodian to cover margin requirements for the following open futures contracts on June 30, 2006: |
| | | | | | | | | | |
| Description | | Type | | Expiration
Month | | # of
Contracts | | Unrealized
Appreciation/
(Depreciation) | |
90-Day Eurodollar December Futures | | Long | | 12/2006 | | 800 | | $ | (1,196 | ) |
90-Day Eurodollar December Futures | | Long | | 12/2007 | | 291 | | | (455 | ) |
90-Day Eurodollar June Futures | | Long | | 06/2007 | | 625 | | | (1,177 | ) |
90-Day Eurodollar March Futures | | Long | | 03/2007 | | 977 | | | (1,904 | ) |
90-Day Eurodollar March Futures | | Short | | 03/2008 | | 61 | | | 74 | |
90-Day Eurodollar September Futures | | Long | | 09/2007 | | 460 | | | (807 | ) |
U.S. Treasury 5-Year Note September Futures | | Short | | 09/2006 | | 349 | | | 191 | |
U.S. Treasury 10-Year Note September Futures | | Short | | 09/2006 | | 102 | | | 61 | |
U.S. Treasury 30-Year Bond September Futures | | Long | | 09/2006 | | 5 | | | (2 | ) |
| | | | | | | | |
|
|
|
| | | | | | | | | $ | (5,215 | ) |
| | | | | | | | |
|
|
|
| | | | | | |
| See Accompanying Notes | | Semiannual Report | | June 30, 2006 | | 11 |
Schedule of Investments Low Duration Portfolio (Cont.)
| | | | | | | | | | | | | | | | | |
(d) Swap agreements outstanding on June 30, 2006: | | | | |
| Interest Rate Swaps | | | | | | | | | | | | | | | | | |
| Counterparty | | Floating Rate Index | | Pay/Receive
Floating Rate | | Fixed Rate | | Expiration
Date | | | | Notional
Amount | | Unrealized
Appreciation/
(Depreciation) | |
BNP Paribas Bank | | 5-year French CPI Ex Tobacco Daily Reference Index | | Pay | | 2.090% | | 10/15/2010 | | | | EUR | 1,300 | | $ | (4 | ) |
Barclays Bank PLC | | 6-month GBP-LIBOR | | Pay | | 5.000% | | 06/15/2007 | | | | GBP | 400 | | | (3 | ) |
Lehman Brothers, Inc. | | 6-month GBP-LIBOR | | Pay | | 4.500% | | 09/20/2009 | | | | | 200 | | | (5 | ) |
Goldman Sachs & Co. | | 3-month USD-LIBOR | | Receive | | 5.000% | | 12/20/2011 | | | | $ | 2,900 | | | 25 | |
| | | | | | | | | | | | | | | |
|
|
|
| | | | | | | | | | | | | | | | $ | 13 | |
| | | | | | | | | | | | | | | |
|
|
|
| | | | | | | |
| Credit Default Swaps | | | | | | | | | | | | | | | | | |
| Counterparty | | Reference Entity | | Buy/Sell
Protection+ | | (Pay)/Receive
Fixed Rate | | Expiration
Date | | | | Notional
Amount | | Unrealized
Appreciation | |
Bear Stearns & Co., Inc. | | General Motors Acceptance Corp. 6.875% due 08/28/2012 | | Sell | | 2.100% | | 12/20/2006 | | | | $ | 2,600 | | $ | 6 | |
Bear Stearns & Co., Inc. | | Ford Motor Credit Co. 7.000% due 10/01/2013 | | Sell | | 4.650% | | 06/20/2007 | | | | | 400 | | | 8 | |
Bear Stearns & Co., Inc. | | Ford Motor Credit Co. 7.000% due 10/01/2013 | | Sell | | 4.700% | | 06/20/2007 | | | | | 300 | | | 6 | |
Citibank N.A. | | Ford Motor Credit Co. 7.000% due 10/01/2013 | | Sell | | 2.445% | | 12/20/2006 | | | | | 100 | | | 0 | |
Goldman Sachs & Co. | | Ford Motor Credit Co. 7.000% due 10/01/2013 | | Sell | | 2.400% | | 12/20/2006 | | | | | 200 | | | 1 | |
Goldman Sachs & Co. | | Ford Motor Credit Co. 7.000% due 10/01/2013 | | Sell | | 4.500% | | 06/20/2007 | | | | | 200 | | | 4 | |
J.P. Morgan Chase & Co. | | Russia Government International Bond,
5.000% until 03/31/2007 and 7.500%
thereafter, due 03/31/2030 | | Sell | | 0.690% | | 03/20/2007 | | | | | 1,200 | | | 5 | |
Morgan Stanley Dean Witter & Co. | | Ford Motor Credit Co. 7.000% due 10/01/2013 | | Sell | | 4.700% | | 12/20/2006 | | | | | 1,000 | | | 15 | |
Morgan Stanley Dean Witter & Co. | | Russia Government International Bond,
5.000% until 03/31/2007 and 7.500%
thereafter, due 03/31/2030 | | Sell | | 0.460% | | 06/20/2007 | | | | | 200 | | | 0 | |
| | | | | | | | | | | | | | | |
|
|
|
| | | | | | | | | | | | | | | | $ | 45 | |
| | | | | | | | | | | | | | | |
|
|
|
|
| + If the Portfolio is a seller of protection and a credit event occurs, as defined under the terms of that particular swap agreement, the Portfolio will pay to the buyer of the protection an amount up to the notional value of the swap and in certain instances, take delivery of the security. As a buyer of protection, the Portfolio will generally receive from the seller of protection an amount up to the notional amount of the swap if a credit event occurs. | |
| | | | | | | | | | | | |
(e) Written options outstanding on June 30, 2006: |
| Options on Exchange-Traded Futures Contracts | | | | | | | | |
| Description | | Exercise
Price | | Expiration
Date | | # of
Contracts | | Premium | | Value |
Call - CBOT U.S. Treasury 10-Year Note September Futures | | $108.000 | | 08/25/2006 | | 40 | | $ | 7 | | $ | 1 |
Put - CBOT U.S. Treasury 10-Year Note September Futures | | 103.000 | | 08/25/2006 | | 40 | | | 4 | | | 6 |
Put - CME 90-Day Eurodollar December Futures | | 95.000 | | 12/18/2006 | | 13 | | | 6 | | | 20 |
Put - CME 90-Day Eurodollar December Futures | | 95.250 | | 12/18/2006 | | 422 | | | 331 | | | 894 |
Put - CME 90-Day Eurodollar December Futures | | 95.500 | | 12/18/2006 | | 45 | | | 49 | | | 123 |
Put - CME 90-Day Eurodollar March Futures | | 94.750 | | 03/19/2007 | | 19 | | | 10 | | | 20 |
Put - CME 90-Day Eurodollar September Futures | | 95.000 | | 09/18/2006 | | 14 | | | 8 | | | 20 |
| | | | | | | | |
|
| |
|
|
| | | | | | | | | $ | 415 | | $ | 1,084 |
| | | | | | | | |
|
| |
|
|
| | | | | | | | | | | | | | | | | | | | |
| | | | | | | |
| Interest Rate Swaptions | | | | | | | | | | | | | | | | |
| Description | | Counterparty | | Floating Rate
Index | | Pay/Receive
Floating Rate | | Exercise
Rate | | Expiration
Date | | | | Notional
Amount | | Premium | | Value |
Put - OTC 1-Year Interest Rate Swap | | HSBC Bank USA | | 6-month GBP-LIBOR | | Pay | | 4.500% | | 12/20/2006 | | GBP | | 1,700 | | $ | 8 | | $ | 19 |
Call - OTC 5-Year Interest Rate Swap | | Bear Stearns & Co., Inc. | | 3-month USD-LIBOR | | Receive | | 5.210% | | 10/25/2006 | | $ | | 6,100 | | | 22 | | | 7 |
Call - OTC 5-Year Interest Rate Swap | | Bear Stearns & Co., Inc. | | 3-month USD-LIBOR | | Receive | | 5.040% | | 03/08/2007 | | | | 7,000 | | | 68 | | | 14 |
Call - OTC 5-Year Interest Rate Swap | | Citibank N.A. | | 3-month USD-LIBOR | | Receive | | 4.540% | | 10/04/2006 | | | | 2,100 | | | 25 | | | 0 |
Call - OTC 5-Year Interest Rate Swap | | Citibank N.A. | | 3-month USD-LIBOR | | Receive | | 4.850% | | 12/22/2006 | | | | 6,000 | | | 79 | | | 2 |
Call - OTC 5-Year Interest Rate Swap | | Goldman Sachs & Co. | | 3-month USD-LIBOR | | Receive | | 4.780% | | 08/07/2006 | | | | 8,000 | | | 65 | | | 0 |
Call - OTC 5-Year Interest Rate Swap | | Goldman Sachs & Co. | | 3-month USD-LIBOR | | Receive | | 5.210% | | 10/25/2006 | | | | 4,500 | | | 20 | | | 5 |
Call - OTC 5-Year Interest Rate Swap | | Merrill Lynch & Co., Inc. | | 3-month USD-LIBOR | | Receive | | 4.780% | | 08/08/2006 | | | | 3,000 | | | 28 | | | 0 |
Call - OTC 5-Year Interest Rate Swap | | Merrill Lynch & Co., Inc. | | 3-month USD-LIBOR | | Receive | | 4.540% | | 10/04/2006 | | | | 3,000 | | | 36 | | | 0 |
Call - OTC 5-Year Interest Rate Swap | | Royal Bank of Scotland PLC | | 3-month USD-LIBOR | | Receive | | 5.040% | | 03/08/2007 | | | | 3,000 | | | 33 | | | 6 |
Call - OTC 5-Year Interest Rate Swap | | Royal Bank of Scotland PLC | | 3-month USD-LIBOR | | Receive | | 5.220% | | 04/19/2007 | | | | 6,000 | | | 47 | | | 26 |
Call - OTC 5-Year Interest Rate Swap | | Royal Bank of Scotland PLC | | 3-month USD-LIBOR | | Receive | | 5.315% | | 05/09/2007 | | | | 14,700 | | | 152 | | | 87 |
Call - OTC 5-Year Interest Rate Swap | | Royal Bank of Scotland PLC | | 3-month USD-LIBOR | | Receive | | 5.340% | | 06/07/2007 | | | | 13,000 | | | 132 | | | 89 |
Call - OTC 5-Year Interest Rate Swap | | Wachovia Bank N.A. | | 3-month USD-LIBOR | | Receive | | 5.210% | | 10/25/2006 | | | | 2,200 | | | 9 | | | 2 |
Call - OTC 5-Year Interest Rate Swap | | Wachovia Bank N.A. | | 3-month USD-LIBOR | | Receive | | 5.240% | | 02/01/2007 | | | | 6,600 | | | 41 | | | 25 |
| | | | | | | | | | | | | | | | |
|
| |
|
|
| | | | | | | | | | | | | | | | | $ | 765 | | $ | 282 |
| | | | | | | | | | | | | | | | |
|
| |
|
|
| | | | |
| 12 | | PIMCO Variable Insurance Trust | | See Accompanying Notes |
| | |
| |
| | | June 30, 2006 (Unaudited) |
| | | | | | | | | | | | | | | | | | | | | | | |
| Straddle Options | | | | | | | | | | | | | | | | | | | | | | | |
| Description | | Counterparty | | | | Exercise Price* | | Expiration Date | | | | Notional
Amount | | Premium* | | Value | |
Call & Put - OTC U.S. dollar versus Japanese Yen
Forward Delta Neutral Straddle | | Goldman Sachs & Co. | | | | $ | 0.000 | | 08/23/2007 | | | | $ | 3,100 | | $ | 3 | | $ | (17 | ) |
Call & Put - OTC U.S. dollar versus Japanese Yen
Forward Delta Neutral Straddle | | J.P. Morgan Chase & Co. | | | | | 0.000 | | 08/23/2007 | | | | | 1,000 | | | 6 | | | (5 | ) |
| | | | | | | | | | | | | | | | | | |
|
| |
|
|
|
| | | | | | | | | | | | | | | | | | | $ | 9 | | $ | (22 | ) |
| | | | | | | | | | | | | | | | | | |
|
| |
|
|
|
| | | | |
| * Exercise price and final premium determined on a future final date, based upon implied volatility parameters. | | | | | | | | | | | | |
| | | | | | | | | | | | | | | | | |
(f) Forward foreign currency contracts outstanding on June 30, 2006: | | | | | |
| Type | | | | Principal
Amount
Covered by
Contract | | Settlement
Month | | Unrealized
Appreciation | | Unrealized
(Depreciation) | | | Net Unrealized
Appreciation/
(Depreciation) | |
Buy | | BRL | | 852 | | 07/2006 | | $ | 25 | | $ | 0 | | | $ | 25 | |
Sell | | | | 853 | | 07/2006 | | | 0 | | | (20 | ) | | | (20 | ) |
Buy | | | | 422 | | 09/2006 | | | 11 | | | 0 | | | | 11 | |
Buy | | CAD | | 1,897 | | 07/2006 | | | 0 | | | (20 | ) | | | (20 | ) |
Buy | | CLP | | 174,323 | | 07/2006 | | | 0 | | | (7 | ) | | | (7 | ) |
Sell | | | | 174,323 | | 07/2006 | | | 4 | | | 0 | | | | 4 | |
Buy | | | | 86,000 | | 08/2006 | | | 0 | | | (2 | ) | | | (2 | ) |
Buy | | | | 44,534 | | 09/2006 | | | 0 | | | 0 | | | | 0 | |
Buy | | CNY | | 4,059 | | 03/2007 | | | 0 | | | (4 | ) | | | (4 | ) |
Buy | | EUR | | 167 | | 07/2006 | | | 4 | | | 0 | | | | 4 | |
Sell | | | | 51,095 | | 07/2006 | | | 71 | | | (623 | ) | | | (552 | ) |
Sell | | | | 14,390 | | 08/2006 | | | 0 | | | (330 | ) | | | (330 | ) |
Sell | | | | 26,000 | | 09/2006 | | | 0 | | | (471 | ) | | | (471 | ) |
Buy | | GBP | | 537 | | 07/2006 | | | 4 | | | 0 | | | | 4 | |
Buy | | INR | | 12,200 | | 08/2006 | | | 0 | | | (7 | ) | | | (7 | ) |
Sell | | | | 7,230 | | 08/2006 | | | 3 | | | 0 | | | | 3 | |
Buy | | | | 2,596 | | 09/2006 | | | 0 | | | (1 | ) | | | (1 | ) |
Buy | | JPY | | 2,039,610 | | 08/2006 | | | 0 | | | (571 | ) | | | (571 | ) |
Buy | | KRW | | 144,129 | | 08/2006 | | | 3 | | | 0 | | | | 3 | |
Buy | | | | 611,190 | | 09/2006 | | | 16 | | | 0 | | | | 16 | |
Sell | | | | 369,284 | | 09/2006 | | | 0 | | | (10 | ) | | | (10 | ) |
Buy | | | | 843,255 | | 05/2007 | | | 0 | | | (2 | ) | | | (2 | ) |
Buy | | MXN | | 3,960 | | 08/2006 | | | 0 | | | (24 | ) | | | (24 | ) |
Sell | | | | 2,377 | | 08/2006 | | | 6 | | | 0 | | | | 6 | |
Buy | | | | 1,125 | | 09/2006 | | | 0 | | | (6 | ) | | | (6 | ) |
Buy | | PEN | | 1,616 | | 08/2006 | | | 10 | | | 0 | | | | 10 | |
Sell | | | | 1,616 | | 08/2006 | | | 0 | | | (19 | ) | | | (19 | ) |
Buy | | | | 141 | | 09/2006 | | | 1 | | | 0 | | | | 1 | |
Sell | | | | 141 | | 09/2006 | | | 0 | | | (2 | ) | | | (2 | ) |
Buy | | PLN | | 162 | | 09/2006 | | | 1 | | | 0 | | | | 1 | |
Buy | | | | 349 | | 11/2006 | | | 0 | | | (3 | ) | | | (3 | ) |
Buy | | RUB | | 11,341 | | 08/2006 | | | 20 | | | 0 | | | | 20 | |
Sell | | | | 6,780 | | 08/2006 | | | 0 | | | (8 | ) | | | (8 | ) |
Buy | | | | 3,058 | | 09/2006 | | | 4 | | | 0 | | | | 4 | |
Buy | | SGD | | 1,140 | | 08/2006 | | | 13 | | | (2 | ) | | | 11 | |
Sell | | | | 676 | | 08/2006 | | | 0 | | | (8 | ) | | | (8 | ) |
Buy | | | | 172 | | 09/2006 | | | 2 | | | 0 | | | | 2 | |
Buy | | SKK | | 13,910 | | 09/2006 | | | 13 | | | 0 | | | | 13 | |
Sell | | | | 6,644 | | 09/2006 | | | 0 | | | (6 | ) | | | (6 | ) |
Buy | | TWD | | 10,582 | | 08/2006 | | | 0 | | | (8 | ) | | | (8 | ) |
Sell | | | | 7,383 | | 08/2006 | | | 0 | | | 0 | | | | 0 | |
Buy | | | | 3,337 | | 09/2006 | | | 0 | | | (1 | ) | | | (1 | ) |
Buy | | ZAR | | 106 | | 08/2006 | | | 0 | | | (2 | ) | | | (2 | ) |
Sell | | | | 106 | | 08/2006 | | | 1 | | | 0 | | | | 1 | |
Buy | | | | 106 | | 10/2006 | | | 0 | | | (1 | ) | | | (1 | ) |
Buy | | | | 202 | | 11/2006 | | | 0 | | | (4 | ) | | | (4 | ) |
| | | | | | | | |
|
| |
|
|
| |
|
|
|
| | | | | | | | | $ | 212 | | $ | (2,162 | ) | | $ | (1,950 | ) |
| | | | | | | | |
|
| |
|
|
| |
|
|
|
(g) Exercise price and premium determined on a future date, based upon implied volatility parameters. | |
| | | | | | |
| See Accompanying Notes | | Semiannual Report | | June 30, 2006 | | 13 |
Notes to Financial Statements
1. ORGANIZATION
The Low Duration Portfolio (the “Portfolio”) is a series of the PIMCO Variable Insurance Trust (the “Trust”). The Trust is registered under the Investment Company Act of 1940 (the “Act”), as amended, as an open-end investment management company organized as a Delaware business trust on October 3, 1997. The Portfolio offers three classes of shares: Institutional, Administrative and Advisor. Information presented in these financial statements pertains to the Administrative Class of the Portfolio. Certain detailed financial information for the Institutional Class and Advisor Class is provided separately and is available upon request. The Trust is designed to be used as an investment vehicle by Separate Accounts of insurance companies that fund variable annuity contracts and variable life insurance policies and by qualified pension and retirement plans.
2. SIGNIFICANT ACCOUNTING POLICIES
The following is a summary of significant accounting policies consistently followed by the Portfolio in the preparation of its financial statements in conformity with accounting principles generally accepted in the United States of America (“GAAP”). The preparation of financial statements in accordance with GAAP requires management to make estimates and assumptions that affect the reported amounts and disclosures in the financial statements. Actual results could differ from those estimates.
Security Valuation. Portfolio securities are valued as of the close of regular trading (normally 4:00 p.m., Eastern Time) on each day that the New York Stock Exchange (“NYSE”) is open. Portfolio securities and other assets for which market quotes are readily available are stated at market value. Market value is generally determined on the basis of last reported sales prices, or if no sales are reported, based on quotes obtained from a quotation reporting system, established market makers, or pricing services. Fixed-income securities and non-exchange traded derivatives are normally valued on the basis of quotes obtained from brokers and dealers or pricing services. Prices obtained from independent pricing services use information provided by market makers or estimates of market values obtained from yield data relating to investments or securities with similar characteristics. Certain fixed-income securities purchased on a delayed-delivery basis are marked to market daily until settlement at the forward settlement date. Short-term investments having a maturity of 60 days or less are generally valued at amortized cost. Exchange traded options, futures and options on futures are valued at the settlement price determined by the relevant exchange.
Investments initially valued in currencies other than the U.S. dollar are converted to the U.S. dollar using exchange rates obtained from pricing services. As a result, the NAV of the Portfolio’s shares may be affected by changes in the value of currencies in relation to the U.S. dollar. The value of securities traded in markets outside the United States or denominated in currencies other than the U.S. dollar may be affected significantly on a day that the NYSE is closed and an investor is not able to purchase, redeem or exchange shares.
Securities and other assets for which market quotes are not readily available are valued at fair value as determined in good faith by the Board of Trustees or persons acting at their direction. The Board of Trustees has adopted methods for valuing securities and other assets in circumstances where market quotes are not readily available, and has delegated to Pacific Investment Management Company LLC (“PIMCO”) the responsibility for applying the valuation methods. In the event that market quotes are not readily available, and the security or asset cannot be valued pursuant to one of the valuation methods, the value of the security or asset will be determined in good faith by the Valuation Committee of the Board of Trustees, generally based upon recommendations provided by PIMCO.
Market quotes are considered not readily available in circumstances where there is an absence of current or reliable market-based data (e.g., trade information, bid/asked information, broker quotes), including where events occur after the close of the relevant market, but prior to the close of regular trading, that materially affect the values of the Portfolio’s securities or assets. In addition, market quotes are considered not readily available when, due to extraordinary circumstances, the exchanges or markets on which the securities trade do not open for trading for the entire day and no other market prices are available. The Board has delegated to PIMCO the responsibility for monitoring significant events that may materially affect the values of the Portfolio’s securities or assets and for determining whether the value of the applicable securities or assets should be re-evaluated in light of such significant events when the Portfolio uses fair value pricing to determine its NAV, securities will not be priced on the basis of quotations from the primary market in which they are traded, but rather may be priced by another method that the Board of Trustees or persons acting at their direction believe accurately reflects fair value. The Trust’s policy is intended to result in a calculation of the Portfolio’s NAV that fairly reflects security values as of the time of pricing. However, fair values determined by the Board of Trustees or persons acting at their direction may not accurately reflect the price that the Portfolio could obtain for a security if it were to dispose of that security as of the time of pricing. Because foreign securities can trade on non-business days, the NAV of the Portfolio may change on days when shareholders will not be able to purchase or redeem shares. The prices used by the Portfolio may differ from the value that would be realized if the securities were sold and the differences could be material to the financial statements.
Securities Transactions and Investment Income. Securities transactions are recorded as of the trade date. Securities purchased or sold on a when-issued or delayed-delivery basis may be settled a month or more after the trade date. Realized gains and losses from securities sold are recorded on the identified cost basis. Dividend income is recorded on the ex-dividend date, except certain dividends from foreign securities where the ex-dividend date may have passed, which are recorded as soon as the Portfolio is informed of the ex-dividend date. Interest income, adjusted for the accretion of discounts and amortization of premiums, is recorded on the accrual basis. Paydown gains and losses on mortgage-related or asset-backed securities are recorded as components of interest income in the Statement of Operations.
Dividends and Distributions to Shareholders. Dividends from net investment income, if any, are declared on each day the Portfolio is open for business and are distributed to shareholders monthly. Net realized capital gains earned by the Portfolio, if any, will be distributed no less frequently than once each year. Most shareholders choose to reinvest their dividends and capital gain distribution in additional shares of the Portfolio.
Income dividends and capital gain distributions are determined in accordance with income tax regulations which may differ from GAAP. Differences between tax regulations and GAAP may change the fiscal year when income and capital items are recognized for tax and GAAP purposes. Examples of events that give rise to timing differences include wash sales, straddles, net operating losses and capital loss carryforwards. Further, the character of investment income and capital gains may be different for certain transactions under the two methods of accounting. Examples of characterization differences include the treatment of mortgage paydowns, swaps, foreign currency transactions and contingent debt instruments. As a result, income dividends and capital gain distributions declared during a fiscal period may differ significantly from the net investment income and realized capital gain reported in the Portfolio’s annual financial statements presented under GAAP.
Distributions classified as a tax basis return of capital, if any, are reflected in the accompanying Statements of Changes in Net Assets and have been reclassified to
| | | | |
| 14 | | PIMCO Variable Insurance Trust | | |
| | |
| |
| | | June 30, 2006 (Unaudited) |
paid in capital. In addition, other amounts have been reclassified between undistributed net investment income, accumulated undistributed net realized gains or losses and/or paid in capital to more appropriately conform financial accounting to tax characterizations of dividend distributions.
Multiclass Operations. Each class offered by the Portfolio has equal rights as to assets and voting privileges (except that shareholders of a class have exclusive voting rights regarding any matter relating solely to that class of shares). Income and non-class specific expenses of the Portfolio are allocated daily to each class of shares based on the relative value of settled shares. Realized and unrealized capital gains and losses of the Portfolio are allocated daily to each class of shares based on the relative net assets of each class. Class specific expenses, where applicable, currently include administrative, distribution and servicing fees.
Federal Income Taxes. The Portfolio intends to qualify as a regulated investment company under sub-chapter M of the Internal Revenue Code and distribute all of its taxable income and net realized gains, if applicable, to shareholders. Accordingly, no provision for Federal income taxes has been made.
Foreign Currency. The accounting records of the Portfolio are maintained in U.S. dollar. The market values of foreign securities, currency holdings and other assets and liabilities are translated into U.S. dollar based on the current exchange rates each business day. Fluctuations in the value of currency holdings and other assets and liabilities resulting from changes in exchange rates are recorded as unrealized foreign currency gains or losses. Realized gains or losses and unrealized appreciation or depreciation on investment securities and income and expenses are translated on the respective dates of such transactions. The effects of changes in foreign currency exchange rates on investments in securities are not segregated in the Statement of Operations from the effects of changes in market prices of those securities, but are included with the net realized and unrealized gain or loss on investment securities.
| | | | | | |
|
Non-U.S. currency symbols utilized throughout the report are defined
as follows: |
| BRL | | Brazilian Real | | MXN | | Mexican Peso |
| CAD | | Canadian Dollar | | PEN | | Peruvian New Sol |
| CLP | | Chilean Peso | | PLN | | Polish Zloty |
| CNY | | Chinese Yuan Renminbi | | RUB | | Russian Ruble |
| EUR | | Euro | | SGD | | Singapore Dollar |
| GBP | | British Pound | | SKK | | Slovakian Koruna |
| INR | | Indian Rupee | | TWD | | Taiwan Dollar |
| JPY | | Japanese Yen | | ZAR | | South African Rand |
| KRW | | South Korean Won | | | | |
Forward Currency Transactions. The Portfolio may enter into forward currency contracts in connection with settling planned purchases or sales of securities, to hedge the currency exposure associated with some or all of the Portfolio’s securities or as a part of an investment strategy. A forward currency contract is an agreement between two parties to buy and sell a currency at a set price on a future date. The market value of a forward currency contract fluctuates with changes in forward currency exchange rates. Forward currency contracts are marked to market daily and the change in value is recorded by the Portfolio as an unrealized gain or loss. Realized gains or losses equal to the difference between the value of the contract at the time it was opened and the value at the time it was closed are recorded upon delivery or receipt of the currency or, if a forward currency contract is offset by entering into another forward currency contract with the same broker, upon settlement of the net gain or loss. These contracts may involve market risk in excess of the unrealized gain or loss reflected in the Portfolio’s Statement of Assets and Liabilities. In addition, the Portfolio could be exposed to risk if the counterparties are unable to meet the terms of the contracts or if the value of the currency changes unfavorably to the U.S. dollar.
Futures Contracts. The Portfolio is authorized to enter into futures contracts. The Portfolio may use futures contracts to manage its exposure to the securities markets or to movements in interest rates and currency values. The primary risks associated with the use of futures contracts are the imperfect correlation between the change in market value of the securities held by the Portfolio and the prices of futures contracts, the possibility of an illiquid market, and the inability of the counterparty to meet the terms of the contract. Futures contracts are valued based upon their quoted daily settlement prices. Upon entering into a futures contract, the Portfolio is required to deposit with its custodian, in a segregated account in the name of the futures broker, an amount of cash or U.S. Government and Agency Obligations in accordance with the initial margin requirements of the broker or exchange. Futures contracts are marked to market daily and an appropriate payable or receivable for the change in value (“variation margin”) is recorded by the Portfolio. Gains or losses are recognized but not considered realized until the contracts expire or are closed. Futures contracts involve, to varying degrees, risk of loss in excess of the variation margin disclosed in the Statement of Assets and Liabilities.
Options Contracts. The Portfolio may write call and put options on futures, swaps, securities or currencies it owns or in which it may invest. Writing put options tends to increase the Portfolio’s exposure to the underlying instrument. Writing call options tends to decrease the Portfolio’s exposure to the underlying instrument. When the Portfolio writes a call or put option, an amount equal to the premium received is recorded as a liability and subsequently marked to market to reflect the current value of the option written. These liabilities are reflected as written options outstanding in the Statement of Assets and Liabilities. Certain options may be written with premiums to determined on a future date. The premiums for these options are based upon implied volatility parameters at specified terms. Premiums received from writing options which expire are treated as realized gains. Premiums received from writing options which are exercised or closed are added to the proceeds or offset against amounts paid on the underlying future, swap, security or currency transaction to determine the realized gain or loss. The Portfolio as a writer of an option has no control over whether the underlying future, swap, security or currency may be sold (call) or purchased (put) and as a result bears the market risk of an unfavorable change in the price of the future, swap, security or currency underlying the written option. There is the risk the Portfolio may not be able to enter into a closing transaction because of an illiquid market.
The Portfolio may also purchase put and call options. Purchasing call options tends to increase the Portfolio’s exposure to the underlying instrument. Purchasing put options tends to decrease the Portfolio’s exposure to the underlying instrument. The Portfolio pays a premium which is included in the Portfolio’s Statement of Assets and Liabilities as an investment and subsequently marked to market to reflect the current value of the option. Premiums paid for purchasing options which expire are treated as realized losses. Certain options may be purchased with premiums to be determined on a future date. The premiums for these options are based upon implied volatility parameters at specified terms. The risk associated with purchasing put and call options is limited to the premium paid. Premiums paid for purchasing options which are exercised or closed are added to the amounts paid or offset against the proceeds on the underlying future, swap, security or currency transaction to determine the realized gain or loss.
Repurchase Agreements. The Portfolio may engage in repurchase transactions. Under the terms of a typical repurchase agreement, the Portfolio takes possession of an underlying debt obligation subject to an obligation of the seller to repurchase, and the Portfolio to resell, the obligation at an agreed-upon price and
| | | | | | |
| | | Semiannual Report | | June 30, 2006 | | 15 |
Notes to Financial Statements (Cont.)
time. The market value of the collateral must be equal to or exceed at all times the total amount of the repurchase obligations, including interest. Securities purchased under repurchase agreements are reflected as an asset in the Statement of Assets and Liabilities. Generally, in the event of counterparty default, the Portfolio has the right to use the collateral to offset losses incurred. If the counterparty should default, the Portfolio will seek to sell the securities which it holds as collateral. This could involve procedural costs or delays in addition to a loss on the securities if their value should fall below their repurchase price.
Mortgage-Related and Other Asset-Backed Securities. The Portfolio may invest in mortgage-related or other asset-backed securities. These securities include mortgage pass-through securities, collateralized mortgage obligations (“CMOs”), commercial mortgage-backed securities, mortgage dollar rolls, CMO residuals, stripped mortgage-backed securities (“SMBSs”) and other securities that directly or indirectly represent a participation in, or are secured by and payable from, mortgage loans on real property. The value of some mortgage- or asset-backed securities may be particularly sensitive to changes in prevailing interest rates. Early repayment of principal on some mortgage-related securities may expose a Portfolio to a lower rate of return upon reinvestment of principal. The value of these securities may fluctuate in response to the market’s perception of the creditworthiness of the issuers. Additionally, although mortgages and mortgage-related securities are generally supported by some form of government or private guarantee and/or insurance, there is no assurance that private guarantors or insurers will meet their obligations.
Swap Agreements. The Portfolio may engage in swap transactions, including, but not limited to, swap agreements on interest rate and credit default to manage its exposure to interest rates and credit risk. In connection with these agreements, securities may be identified as collateral in accordance with the terms of the respective swap agreements.
Interest rate swap agreements involve the exchange by the Portfolio with another party of their respective commitments to pay or receive interest, e.g., an exchange of floating rate payments for fixed rate payments with respect to the notional amount of principal.
Credit default swap agreements involve one party making a stream of payments to another party in exchange for the right to receive a specified return in the event of a default by a third party, typically corporate issues or sovereign issues of an emerging country, on its obligation. The Portfolio may use credit default swaps to provide a measure of protection against defaults of the issuers (i.e., to reduce risk where the Portfolio owns or has exposure to the sovereign issuer) or to take an active long or short position with respect to the likelihood of a particular issuer’s default. As a seller of protection, the Portfolio generally receives an upfront payment or a fixed rate of income throughout the term of the swap provided that there is no credit event. If the Portfolio is a seller of protection and a credit event occurs, as defined under the terms of that particular swap agreement, the Portfolio will pay to the buyer of the protection an amount up to the notional value of the swap and in certain instances take delivery of the security. As the seller, the Portfolio would effectively add leverage to its portfolio because, in addition to its total net assets, the Portfolio would be subject to investment exposure on the notional amount of the swap. As a buyer of protection, the Portfolio generally receives an amount up to the notional value of the swap if a credit event occurs. The treatment of credit default swaps and other swap agreements that provide for contingent, non-periodic, bullet-type payments as “notional principal contracts” for federal income tax purposes is uncertain. Were the Internal Revenue Service to take the position that a credit default swap or other bullet-type swap is not a “notional principal contract” for federal income tax purposes, payments received by the Portfolio from such investments might be subject to income taxes.
Swaps are marked to market daily based upon quotations from market makers and the change in value, if any, is recorded as unrealized gain or loss in the Statement of Operations. Payments received or made at the beginning of the measurement period are reflected as such in the Statement of Assets and Liabilities. These upfront payments are recorded as realized gain or loss in the Statement of Operations upon termination or maturity of the swap. A liquidation payment received or made at the termination of the swap is recorded as realized gain or loss in the Statement of Operations. Net periodic payments received or paid by the Portfolio are included as part of realized gain or loss in the Statement of Operations. Entering into these agreements involves, to varying degrees, elements of credit, market and documentation risk in excess of the amounts recognized in the Statement of Assets and Liabilities. Such risks involve the possibility that there will be no liquid market for these agreements, that the counterparty to the agreements may default on its obligation to perform or disagree as to the meaning of contractual terms in the agreements and that there may be unfavorable changes in interest rates.
U.S. Government Agencies or Government-Sponsored Enterprises. Securities issued by U.S. Government agencies or government-sponsored enterprises may not be guaranteed by the U.S. Treasury. The Government National Mortgage Association (“GNMA”), a wholly owned U.S. Government corporation, is authorized to guarantee, with the full faith and credit of the U.S. Government, the timely payment of principal and interest on securities issued by institutions approved by GNMA and backed by pools of mortgages insured by the Federal Housing Administration or guaranteed by the Department of Veterans Affairs. Government-related guarantors (i.e., not backed by the full faith and credit of the U.S. Government) include the Federal National Mortgage Association (“FNMA” or “Fannie Mae”) and the Federal Home Loan Mortgage Corporation (“FHLMC” or “Freddie Mac”). Pass-through securities issued by FNMA are guaranteed as to timely payment of principal and interest by FNMA but are not backed by the full faith and credit of the U.S. Government. FHLMC guarantees the timely payment of interest and ultimate collection of principal, but its participation certificates are not backed by the full faith and credit of the U.S. Government.
Guarantees and Indemnifications. Under the Trust’s organizational documents, each Trustee, officer, employee or other agent of the Trust (including the Trust’s investment manager) is indemnified against certain liabilities that may arise out of performance of their duties to the Portfolio. Additionally, in the normal course of business, the Portfolio enters into contracts that contain a variety of indemnification clauses. The Portfolio’s maximum exposure under these arrangements is unknown as this would involve future claims that may be made against the Portfolio that have not yet occurred. However, the Portfolio has not had prior claims or losses pursuant to these contracts, and believes the risk of loss to be remote.
New Accounting Policies. In July 2006, the Financial Accounting Standards Board issued Interpretation No. 48, “Accounting for Uncertainty in Income Taxes—an Interpretation of FASB Statement No. 109” (the “Interpretation”). The Interpretation is effective for fiscal years beginning after December 15, 2006. Management is currently evaluating the application of the Interpretation to the Portfolio and will provide additional information in relation to the Interpretation in the Portfolio’s annual financial statements for the year ending December 31, 2006.
3. FEES, EXPENSES, AND RELATED PARTY TRANSACTIONS
Investment Advisory Fee. PIMCO is a majority-owned subsidiary of Allianz Global Investors of America L.P. (“AGI”), and serves as investment adviser (the “Adviser”) to the Trust, pursuant to an investment advisory contract. The Adviser receives a monthly fee at an annual rate based on average daily net assets of the Portfolio. The Advisory Fee is charged at an annual rate of 0.25%.
| | | | |
| 16 | | PIMCO Variable Insurance Trust | | |
| | |
| |
| | | June 30, 2006 (Unaudited) |
Administration Fee. PIMCO serves as administrator (the “Administrator”), and provides administrative services to the Trust for which it receives a monthly administrative fee based on average daily net assets of the Portfolio. As the Administrator, PIMCO bears the costs of various third-party services, including audit, custodial, portfolio accounting, legal, transfer agency and printing costs. The Administration Fee is charged at the annual rate of 0.25%.
Distribution and Servicing Fees. Allianz Global Investors Distributors LLC (“AGID”) is an indirect wholly-owned subsidiary of AGI and serves as the distributor of the Trust’s shares. The Trust is permitted to reimburse AGID on a quarterly basis, out of the Administrative Class assets of the Portfolio in the amount of 0.15% on an annual basis of the average daily net assets of that class, for payments made to financial intermediaries that provide services in connection with the distribution of shares or administration of plans or programs that use Portfolio shares as their funding medium. The effective rate paid to AGID was 0.15% during the current fiscal year.
Expenses. The Trust is responsible for the following expenses: (i) salaries and other compensation of any of the Trust’s executive officers and employees who are not officers, directors, stockholders or employees of PIMCO or its subsidiaries or affiliates; (ii) taxes and governmental fees; (iii) brokerage fees and commissions and other portfolio transaction expenses; (iv) the costs of borrowing money, including interest expenses and bank overdraft charges; (v) fees and expenses of the Trustees who are not “interested persons” of PIMCO or the Trust, and any counsel retained exclusively for their benefit; (vi) extraordinary expenses, including costs of litigation and indemnification expenses; (vii) organization expenses and (viii) any expenses allocated or allocable to a specific class of shares, which include service fees payable with respect to the Administrative Class shares and may include certain other expenses as permitted by the Trust’s Multiple Class Plan adopted pursuant to Rule 18f-3 under the Act and subject to review and approval by the Trustees. The ratio of expenses to average net assets per share class, as disclosed in the Financial Highlights, may differ from the annual portfolio operating expenses per share class as disclosed in the Prospectus for the reasons set forth above.
For the current period ended June 30, 2006, each unaffiliated Trustee received an annual retainer of $15,000, plus $2,000 for each Board of Trustees quarterly meeting attended, $500 for each Board of Trustees committee meeting attended and $500 for each special board meeting attended, plus reimbursement of related expenses. In addition, each Committee Chair received an additional annual retainer of $500 and each Audit Committee Chair received an additional annual retainer of $1,500. These expenses are allocated on a pro-rata basis to each Portfolio of the Trust according to its respective net assets. The Trust pays no compensation directly to any Trustee or any other officer who is affiliated with the Administrator, all of whom receive remuneration for their services to the Trust from the Administrator or its affiliates.
4. PURCHASES AND SALES OF SECURITIES
The length of time the Portfolio has held a particular security is not generally a consideration in investment decisions. A change in the securities held by the Portfolio is known as “portfolio turnover”. The Portfolio may engage in frequent and active trading of portfolio securities to achieve its investment objective, particularly during periods of volatile market movements. High portfolio turnover (e.g., over 100%) involves correspondingly greater expenses to the Portfolio, including brokerage commissions or dealer mark-ups and other transaction costs on the sale of securities and reinvestments in other securities. Such sales may also result in realization of taxable capital gains, including short-term capital gains (which are generally taxed at ordinary income tax rates). The trading costs and tax effects associated with portfolio turnover may adversely affect the Portfolio’s performance.
Purchases and sales of securities (excluding short-term investments) for the period ended June 30, 2006 were as follows (amounts in thousands):
| | | | | | | | | | | | | | | | |
| | U.S Government/Agency | | | | | All Other |
| | Purchases | | | | | Sales | | | | | Purchases | | | | | Sales |
| $ | 478,547 | | | | $ | 426,544 | | | | $ | 66,669 | | | | $ | 27,434 |
5. TRANSACTIONS IN WRITTEN CALL AND PUT OPTIONS
Transactions in written call and put options were as follows (amounts in thousands, except number of contracts):
| | | | | | | | | | | | | | | | | | | | | | | |
| | | | | # of
Contracts |
| | | |
| Notional
Amount
in $ |
| | | |
| Notional
Amount
in GBP |
| | | | | Premium | |
Balance at 12/31/2005 | | | | 460 | | | | | $ | 56,300 | | | | | GBP | 2,200 | | | | | $ | 868 | |
Sales | | | | 358 | | | | | | 75,100 | | | | | | 0 | | | | | | 664 | |
Closing Buys | | | | (208 | ) | | | | | (32,700 | ) | | | | | 0 | | | | | | (271 | ) |
Expirations | | | | (17 | ) | | | | | (9,400 | ) | | | | | (500 | ) | | | | | (72 | ) |
Exercised | | | | 0 | | | | | | 0 | | | | | | 0 | | | | | | 0 | |
Balance at 06/30/2006 | | | | 593 | | | | | $ | 89,300 | | | | | GBP | 1,700 | | | | | $ | 1,189 | |
6. SHARES OF BENEFICIAL INTEREST
The Portfolio may issue an unlimited number of shares of beneficial interest with a $0.001 par value. Changes in shares of beneficial interest were as follows (shares and amounts in thousands):
| | | | | | | | | | | | | | | | | | |
| | | | | Six Months Ended
06/30/2006 | | | | | Year Ended
12/31/2005 | |
| | | | | Shares | | | Amount | | | | | Shares | | | Amount | |
| | | | | | |
Receipts for shares sold | | | | | | | | | | | | | | | | | | |
Institutional Class | | | | 996 | | | $ | 10,012 | | | | | 1,021 | | | $ | 10,460 | |
Administrative Class | | | | 18,333 | | | | 184,037 | | | | | 23,493 | | | | 239,555 | |
Advisor Class | | | | 1 | | | | 10 | | | | | 0 | | | | 0 | |
Issued as reinvestment of distributions | | | | | | | | | | | | | | | | | | |
Institutional Class | | | | 47 | | | | 467 | | | | | 55 | | | | 561 | |
Administrative Class | | | | 1,045 | | | | 10,471 | | | | | 1,136 | | | | 11,545 | |
Advisor Class | | | | 0 | | | | 0 | | | | | 0 | | | | 0 | |
Cost of shares redeemed | | | | | | | | | | | | | | | | | | |
Institutional Class | | | | (279 | ) | | | (2,796 | ) | | | | (473 | ) | | | (4,836 | ) |
Administrative Class | | | | (5,023 | ) | | | (50,338 | ) | | | | (6,536 | ) | | | (66,805 | ) |
Advisor Class | | | | 0 | | | | 0 | | | | | 0 | | | | 0 | |
Net increase resulting from Portfolio share transactions | | | | 15,120 | | | $ | 151,863 | | | | | 18,696 | | | $ | 190,480 | |
The following schedule shows the number of shareholders each owning 5% or more of the Portfolio and the total percentage of the Portfolio held by such shareholders:
| | | | | | |
| | | | | Number of
Shareholders | | % of Portfolio Held |
Institutional Class | | | | 2 | | 100 |
Administrative Class | | | | 2 | | 63 |
Advisor Class | | | | 1 | | 100 |
| | | | | | |
| | | Semiannual Report | | June 30, 2006 | | 17 |
Notes to Financial Statements (Cont.)
7. FEDERAL INCOME TAX MATTERS
As of June 30, 2006, the aggregate cost of investments was the same for federal income tax and financial statement purposes. The net unrealized appreciation (depreciation) of investment securities for federal income tax purposes is as follows (amounts in thousands):
| | | | |
Aggregate
Gross
Unrealized
Appreciation | | Aggregate
Gross
Unrealized
(Depreciation) | | Net
Unrealized
Appreciation |
$ 4,322 | | $ (3,943) | | $ 379 |
8. REGULATORY AND LITIGATION MATTERS
On June 1, 2004, the Attorney General of the State of New Jersey announced that it had dismissed PIMCO from a complaint filed by the New Jersey Attorney General on February 17, 2004, and that it had entered into a settlement agreement (the “New Jersey Settlement”) with Allianz Global Investors of America L.P. (“AGI”) (formerly known as Allianz Dresdner Asset Management of America L.P.), PEA Capital LLC (an entity affiliated with PIMCO through common ownership) (“PEA”) and Allianz Global Investors Distributors LLC (“AGID”), in connection with the same matter. In the New Jersey Settlement, AGI, PEA and AGID neither admitted nor denied the allegations or conclusions of law, but did agree to pay New Jersey a civil fine of $15 million and $3 million for investigative costs and further potential enforcement initiatives against unrelated parties. They also undertook to implement certain governance changes. The complaint relating to the New Jersey Settlement alleged, among other things, that AGI, PEA and AGID had failed to disclose that they improperly allowed certain hedge funds to engage in “market timing” in certain funds. The complaint sought injunctive relief, civil monetary penalties, restitution and disgorgement of profits.
Since February 2004, PIMCO, AGI, PEA, AGID, and certain of their affiliates, including the PIMCO Funds, the Allianz Funds (formerly known as PIMCO Funds: Multi-Manager Series), and the Trustees and employees of the PIMCO Funds, have been named as defendants in fifteen lawsuits filed in various jurisdictions. Eleven of those lawsuits concern “market timing,” and they have been transferred to and consolidated for pre-trial proceedings in a multi-district litigation proceeding in the U.S. District Court for the District of Maryland; the other four lawsuits concern “revenue sharing” and have been consolidated into a single action in the U.S. District Court for the District of Connecticut. The lawsuits have been commenced as putative class actions on behalf of investors who purchased, held or redeemed shares of the various series of the PIMCO Funds and the Allianz Funds during specified periods, or as derivative actions on behalf of the PIMCO Funds and Allianz Funds.
The market timing actions in the District of Maryland generally allege that certain hedge funds were allowed to engage in “market timing” in certain of the PIMCO Funds and the Allianz Funds and this alleged activity was not disclosed. Pursuant to tolling agreements entered into with the derivative and class action plaintiffs, PIMCO, the Trustees, and certain employees of PIMCO who were previously named as defendants have all been dropped as defendants in the market timing actions; the plaintiffs continue to assert claims on behalf of the shareholders of the PIMCO Funds or on behalf of the PIMCO Funds themselves against other defendants. By order dated November 3, 2005, the U.S. District Court for the District of Maryland granted the PIMCO Funds’ motion to dismiss claims asserted against it in a consolidated amended complaint where the PIMCO Funds were named, in the complaint, as a nominal defendant. The revenue sharing action in the District of Connecticut generally alleges that fund assets were inappropriately used to pay brokers to promote the PIMCO Funds and Allianz Funds, including directing fund brokerage transactions to such brokers, and that such alleged arrangements were not fully disclosed to shareholders. On August 11, 2005 the U.S. District Court for the District of Connecticut conducted a hearing on defendants’ motion to dismiss the consolidated amended complaint in the revenue sharing action but has not yet ruled on the motion to dismiss. The market timing and revenue sharing lawsuits seek, among other things, unspecified compensatory damages plus interest and, in some cases, punitive damages, the rescission of investment advisory contracts, the return of fees paid under those contracts and restitution.
Under Section 9(a) of the Investment Company Act of 1940, as amended (“1940 Act”), if the New Jersey Settlement or any of the lawsuits described above were to result in a court injunction against AGI, PEA, AGID and/or their affiliates, PIMCO could, in the absence of exemptive relief granted by the SEC, be barred from serving as an investment adviser, and AGID could be barred from serving as principal underwriter, to any registered investment company, including the Portfolios of the Trust. In connection with an inquiry from the SEC concerning the status of the New Jersey Settlement under Section 9(a), PEA, AGID, AGI and certain of their affiliates (including PIMCO) (together, the “Applicants”) have sought exemptive relief from the SEC under Section 9(c) of the 1940 Act. The SEC has granted the Applicants a temporary exemption from the provisions of Section 9(a) with respect to the New Jersey Settlement until the earlier of (i) September 13, 2006 and (ii) the date on which the SEC takes final action on their application for a permanent order. There is no assurance that the SEC will issue a permanent order.
Two nearly identical class action civil complaints have been filed in August 2005, in the Northern District of Illinois Eastern Division alleging that the plaintiffs each purchased and sold a 10-year Treasury note futures contract and suffered damages from an alleged shortage when PIMCO held both physical and futures positions in 10-year Treasury notes for its client accounts. The two actions have been consolidated into one action, and the two separate complaints have been replaced by a consolidated complaint. PIMCO is a named defendant, and the PIMCO Funds have been added as a defendant, to the consolidated action. PIMCO strongly believes the complaint (and any consolidated complaint filed hereafter) is without merit and intends to vigorously defend itself.
Certain Portfolios of the Trust were recently served in an adversary proceeding brought by the Official Committee of Asbestos Claimants of G-I Holdings, Inc. in G-I Holdings, Inc.’s bankruptcy in the District of New Jersey. PIMCO was previously named in this lawsuit and remains a defendant. The plaintiff seeks to recover for the bankruptcy estate assets that were transferred by the predecessor entity of G-I Holdings, Inc. to a wholly-owned subsidiary in 1994. The subsidiary has since issued notes, of which certain Portfolios of the Trust are alleged to be holders. The complaint alleges that in 2000, more than two hundred noteholders—including certain Portfolios of the Trust—were granted a second priority lien on the assets of the subsidiary in exchange for their consent to a refinancing transaction and the granting of a first priority lien to the lending banks. The plaintiff is seeking invalidation of the lien in favor of the noteholders and/or the value of the lien.
It is possible that these matters and/or other developments resulting from these matters could result in increased fund redemptions or other adverse consequences to the Portfolios. However, PIMCO and AGID believe that these matters are not likely to have a material adverse effect on the Portfolios or on PIMCO’s or AGID’s ability to perform their respective investment advisory or distribution services relating to the Portfolios.
| | | | |
| 18 | | PIMCO Variable Insurance Trust | | |
Investment Adviser and Administrator
Pacific Investment Management Company LLC
840 Newport Center Drive
Newport Beach, California 92660
Distributor
Allianz Global Investors Distributors LLC
2187 Atlantic Street
Stamford, Connecticut 06902
Custodian
State Street Bank & Trust Company
801 Pennsylvania
Kansas City, Missouri 64105
Transfer Agent
Boston Financial Data Services–Midwest
330 W. 9th Street
Kansas City, Missouri 64105
Legal Counsel
Dechert LLP
1775 I Street, N.W.
Washington, D.C. 20006
Independent Registered Public Accounting Firm
PricewaterhouseCoopers LLP
1055 Broadway
Kansas City, Missouri 64105
P I M C O

Share Class Institutional
Semiannual Report June 30, 2006
PIMCO Variable Insurance Trust
Low Duration Portfolio
Table of Contents
This material is authorized for use only when preceded or accompanied by the current PIMCO Variable Insurance Trust (the “Trust”) prospectus. Investors should consider the investment objectives, risks, charges and expenses of this Trust carefully before investing. Ask your financial professional to explain all charges that may apply. This and other information is contained in the Trust’s prospectus. The variable product prospectus may be obtained by contacting your Investment Consultant. Please read the Trust and variable product prospectus carefully before you invest or send money.
Chairman’s Letter
Dear PIMCO Variable Insurance Trust Shareholder:
It is our pleasure to present to you the semiannual report for the PIMCO Variable Insurance Trust covering the six-month period ended June 30, 2006.
Highlights of the global bond markets during the six-month period included:
| | n | | Most fixed-income sectors lost ground during the first half of 2006, as concern about accelerating inflation and central bank tightening pushed interest rates higher worldwide. The benchmark Lehman Brothers Aggregate Bond Index (which includes Treasury, Investment-Grade Corporate, and Residential Mortgage-Backed Securities) returned -0.72% for the first six months of the year. On June 30, the benchmark ten-year Treasury yielded 5.14%, 0.75% higher than at the start of the year. The U.S. yield curve remained flat as shorter-maturity yields rose by a comparable amount. |
| | n | | The Federal Reserve tightened four times during the reporting period, bringing the Federal Funds Rate to 5.25%. The increase near the end of the period was the Federal Reserve’s 17th consecutive rate hike since the start of its tightening cycle in 2004. The Federal Reserve was not alone, as central banks in Europe, India, and China tightened credit in unison for the first time since 2000. The Bank of Japan, whose zero-interest-rate policy has flooded global markets with liquidity, looked set to reverse this policy in the coming months. |
In these pages please find a more complete Portfolio review as it relates to financial-market activities, as well as details about total-return investment performance for the six-month reporting period. Thank you for the trust you have placed in us. We will continue to work diligently to meet your investment needs.
Sincerely,
Brent R. Harris
Chairman, PIMCO Variable Insurance Trust
July 31, 2006
| | | | | | |
| | | Semiannual Report | | June 30, 2006 | | 1 |
Important Information About the Portfolio
PIMCO Variable Insurance Trust (the “Trust”) is an open-end management investment company currently consisting of nineteen separate investment portfolios, including the Low Duration Portfolio (the “Portfolio”). The Portfolio is only available as a funding vehicle under variable life insurance policies or variable annuity contracts issued by insurance companies (“Variable Contracts”). Individuals may not purchase shares of the Portfolio directly. Shares of the Portfolio also may be sold to qualified pension and retirement plans outside of the separate account context.
We believe that bond funds have an important role to play in a well diversified investment portfolio. It is important to note, however, that in an environment where interest rates may trend upward, rising rates would negatively impact the performance of most bond funds, and fixed-income securities held by a fund are likely to decrease in value. The price volatility of fixed-income securities can also increase during periods of rising interest rates resulting in increased losses to a fund. Bond funds and individual bonds with a longer duration (a measure of the expected life of a security) tend to be more sensitive to changes in interest rates, usually making them more volatile than securities or funds with shorter durations. The longer-term performance of most bond funds has benefited from capital gains in part resulting from an extended period of declining interest rates. In the event interest rates increase, these capital gains should not be expected to recur.
The Portfolio may be subject to various risks in addition to those described above. Some of these risks may include, but are not limited to, the following: credit risk, high yield risk, market risk, issuer risk, liquidity risk, derivatives risk, mortgage risk, non-U.S. investment risk, currency risk, leveraging risk and management risk. A complete description of these risks is contained in the Portfolio’s prospectus. The Portfolio may use derivative instruments for hedging purposes or as part of an investment strategy. Use of these instruments may involve certain costs and risks such as liquidity risk, interest rate risk, market risk, credit risk, management risk and the risk that the Portfolio could not close out a position when it would be most advantageous to do so. A Portfolio investing in derivatives could lose more than the principal amount invested in these instruments. Investing in non-U.S. securities may entail risk due to non-U.S. economic and political developments.
On the performance summary page in this Semiannual Report, the Total Return Investment Performance table measures performance assuming that all dividend and capital gain distributions were reinvested.
An investment in the Portfolio is not a deposit of a bank and is not guaranteed or insured by the Federal Deposit Insurance Corporation or any other government agency. It is possible to lose money on investments in the Portfolio.
PIMCO has adopted written proxy voting policies and procedures (“Proxy Policy”) as required by Rule 206(4)-6 under the Investment Advisers Act of 1940. The Proxy Policy has been adopted by the Trust as the policies and procedures that PIMCO will use when voting proxies on behalf of the Portfolio. Copies of the written Proxy Policy and the factors that PIMCO may consider in determining how to vote proxies for the Portfolio, and information about how the Portfolio voted proxies relating to portfolio securities held during the most recent twelve-month period ended June 30, are available without charge, upon request, by calling the Trust at 1-866-746-2606 and on the Securities and Exchange Commission’s (“SEC”) website at http://www.sec.gov.
The Portfolio files its complete schedule of portfolio holdings with the SEC for the first and third quarters of each fiscal year on Form N-Q. A copy of the Trust’s Form N-Q is available on the SEC’s website at http://www.sec.gov and may be reviewed and copied at the SEC’s Public Reference Room in Washington D.C. Information on the operation of the Public Reference Room may be obtained by calling 1-800-SEC-0330.
PIMCO Variable Insurance Trust is distributed by Allianz Global Investors Distributors LLC, 2187 Atlantic Street, Stamford, CT 06902.
| | | | |
| 2 | | PIMCO Variable Insurance Trust | | |
The following disclosure provides important information regarding the Portfolio’s Expense Example (“Example” or “Expense Example”), which appears in this Semiannual Report. Please refer to this information when reviewing the Expense Example for the Portfolio.
Example
As a shareholder of the Portfolio, you incur two types of costs: (1) transaction costs and (2) ongoing costs, including advisory and administrative fees; distribution and/or service (12b-1) fees (Administrative Class only); and other Portfolio expenses. The Example is intended to help you understand your ongoing costs (in dollars) of investing in the Portfolio and to compare these costs with the ongoing costs of investing in other mutual funds. The Expense Example does not reflect any fees or other expenses imposed by the Variable Contracts. If it did, the expenses reflected in the Expense Examples would be higher. The Example is based on an investment of $1,000 invested at the beginning of the period and held for the entire period indicated, which is from January 1, 206 to June 30, 2006.
Actual Expenses
The information in the table under the heading “Actual Performance” provides information about actual account values and actual expenses. You may use the information in these columns, together with the amount you invested, to estimate the expenses that you paid over the period. Simply divide your account value by $1,000 (for example, an $8,600 account value divided by $1,000 = 8.60), then multiply the result by the number in the appropriate column for your share class, in the row titled “Expenses Paid During Period” to estimate the expenses you paid on your account during this period.
Hypothetical Example for Comparison Purposes
The information in the table under the heading “Hypothetical Performance (5% return before expenses)” provides information about hypothetical account values and hypothetical expenses based on the Portfolio’s actual expense ratio and an assumed rate of return of 5% per year before expenses, which is not the Portfolio’s actual return. The hypothetical account values and expenses may not be used to estimate the actual ending account balance or expenses you paid for the period. You may use this information to compare the ongoing costs of investing in the Portfolio and other portfolios. To do so, compare this 5% hypothetical example with the 5% hypothetical examples that appear in the shareholder reports of the other portfolios.
Please note that the expenses shown in the table are meant to highlight your ongoing costs only and do not reflect any transactional costs. Therefore, the information under the heading “Hypothetical Performance (5% return before expenses)” is useful in comparing ongoing costs only, and will not help you determine the relative total costs of owning different portfolios. In addition, if these transactional costs were included, your costs would have been higher.
The expense ratio may vary period to period because of various factors, such as an increase in expenses not covered by the advisory and administrative fees (such as expenses of the trustees and their counsel or litigation expense).
Portfolio Benchmark
The Merrill Lynch 1-3 Year Treasury Index is an unmanaged index that tracks the performance of the direct sovereign debt of the U.S. Government having a maturity of at least 1 year and less than 3 years. It is not possible to invest directly in the index.
| | | | | | |
| | | Semiannual Report | | June 30, 2006 | | 3 |
|
|
| PIMCO Low Duration Portfolio |
|
Cumulative Returns Through June 30, 2006
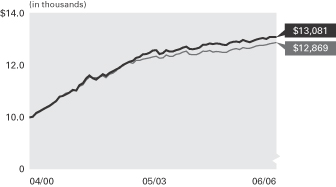
Low Duration Portfolio Merrill Lynch 1-3 yr.
Institutional Class Treasury Index
----------------------- ---------------------
04/30/2000 $10,000 $10,000
05/31/2000 10,026 10,041
06/30/2000 10,165 10,145
07/31/2000 10,226 10,209
08/31/2000 10,305 10,285
09/30/2000 10,382 10,359
10/31/2000 10,434 10,414
11/30/2000 10,544 10,513
12/31/2000 10,626 10,638
01/31/2001 10,800 10,771
02/28/2001 10,818 10,841
03/31/2001 10,879 10,932
04/30/2001 10,959 10,961
05/31/2001 11,049 11,023
06/30/2001 11,028 11,060
07/31/2001 11,238 11,184
08/31/2001 11,309 11,249
09/30/2001 11,498 11,434
10/31/2001 11,602 11,542
11/30/2001 11,499 11,517
12/31/2001 11,452 11,521
01/31/2002 11,561 11,545
02/28/2002 11,652 11,600
03/31/2002 11,597 11,522
04/30/2002 11,705 11,651
05/31/2002 11,769 11,697
06/30/2002 11,843 11,795
07/31/2002 11,904 11,939
08/31/2002 12,010 11,980
09/30/2002 12,076 12,079
10/31/2002 12,133 12,107
11/30/2002 12,171 12,070
12/31/2002 12,279 12,184
01/31/2003 12,321 12,183
02/28/2003 12,418 12,233
03/31/2003 12,432 12,256
04/30/2003 12,483 12,279
05/31/2003 12,568 12,325
06/30/2003 12,584 12,343
07/31/2003 12,431 12,276
08/31/2003 12,463 12,285
09/30/2003 12,577 12,396
10/31/2003 12,532 12,350
11/30/2003 12,533 12,344
12/31/2003 12,584 12,415
01/31/2004 12,619 12,440
02/29/2004 12,678 12,500
03/31/2004 12,715 12,539
04/30/2004 12,630 12,418
05/31/2004 12,617 12,407
06/30/2004 12,642 12,406
07/31/2004 12,681 12,451
08/31/2004 12,793 12,537
09/30/2004 12,784 12,526
10/31/2004 12,838 12,564
11/30/2004 12,808 12,502
12/31/2004 12,836 12,528
01/31/2005 12,821 12,523
02/28/2005 12,792 12,495
03/31/2005 12,780 12,496
04/30/2005 12,857 12,566
05/31/2005 12,898 12,613
06/30/2005 12,916 12,638
07/31/2005 12,884 12,602
08/31/2005 12,969 12,680
09/30/2005 12,920 12,649
10/31/2005 12,893 12,648
11/30/2005 12,931 12,688
12/31/2005 12,985 12,737
01/31/2006 13,022 12,758
02/28/2006 13,049 12,768
03/31/2006 13,009 12,786
04/30/2006 13,078 12,826
05/31/2006 13,085 12,845
06/30/2006 13,081 12,869
$10,000 invested at the beginning of the first full month following the inception date of the Portfolio’s Institutional Class.
Sector Breakdown‡
| | |
Short-Term Instruments | | 51.7% |
U.S. Government Agencies | | 23.1% |
Corporate Bonds & Notes | | 12.3% |
Mortgage-Backed Securities | | 7.1% |
Asset-Backed Securities | | 5.6% |
Other | | 0.2% |
| | ‡ | % of Total Investments as of June 30, 2006 |
| | | | | | | | | | | | |
| Average Annual Total Return for the period ended June 30, 2006 |
| | | | | | | 6 Months* | | 1 Year | | 5 Years | | Since
Inception (04/10/00)** |
| | |
| | PIMCO Low Duration Portfolio Institutional Class | | 0.74% | | 1.28% | | 3.47% | | 4.39% |
| | |
| | Merrill Lynch 1-3 yr. Treasury Index | | 1.04% | | 1.83% | | 3.07% | | 4.16% |
All Portfolio returns are net of fees and expenses.
* Cumulative return.
** The Institutional Class shares commenced operations on 04/10/00. Index comparisons began on 03/31/00.
Past performance is no guarantee of future results. The performance quoted represents past performance. Investment return and principal value will fluctuate so the Portfolio shares, when redeemed, may be worth more or less than their original cost. The Portfolio’s performance does not reflect the deduction of additional charges and expenses imposed in connection with investing in Variable Contracts, which will reduce returns. Current performance may be lower or higher than the performance data quoted. Performance data current to the most recent month-end is available by calling (800) 927-4648.
| | | | | | | | |
| Expense Example | | Actual Performance | | | | Hypothetical Performance |
| | | | | | | (5% return before expenses) |
Beginning Account Value (01/01/06) | | $ | 1,000.00 | | | | $ | 1,000.00 |
Ending Account Value (06/30/06) | | $ | 1,007.40 | | | | $ | 1,022.32 |
Expenses Paid During Period† | | $ | 2.49 | | | | $ | 2.51 |
† Expenses are equal to the Portfolio’s Institutional Class annualized expense ratio of 0.50%, multiplied by the average account value over the period, multiplied by 181/365 (to reflect the one-half year period). Overall fees and expenses of investing in the Portfolio will be higher because the example does not reflect Variable Contract fees and expenses.
Please refer to page 3 herein for a description of the Portfolio’s benchmark and an explanation of the information presented in the above Expense Example.
Portfolio Insights
| » | | The PIMCO Low Duration Portfolio seeks to achieve its investment objective by investing, under normal circumstances, at least 65% of its total assets in a diversified portfolio of Fixed-Income Securities of varying maturities. |
| » | | Duration and maturity structure were the most significant detractors from the Portfolio’s performance during the six-month period ended June 30, 2006. |
| » | | The Portfolio’s above index duration detracted from returns as concerns about accelerating inflation and more monetary tightening pushed interest rates higher. |
| » | | The Portfolio’s broader-than-index maturity structure with a curve steepening bias detracted from returns as the yield curve continued to flatten. |
| » | | A mortgage emphasis added to returns as this sector outperformed Treasuries on a like-duration basis. Security selection within the mortgage sector also enhanced performance. |
| » | | Investment grade and high-yield corporate bonds were positive as these issues benefited from a strengthening economy and investors’ search for extra yield. |
| » | | Minimal exposure to high-quality emerging markets was slightly positive for performance as emerging markets bonds benefited from continued improvement in credit fundamentals and investors’ demand for higher-yielding securities early in the period. |
| | | | | | |
| 4 | | PIMCO Variable Insurance Trust | | | | |
|
|
| Financial Highlights Low Duration Portfolio |
| | | | | | | | | | | | | | | | | | | | | | | | |
| Selected Per Share Data for the Year or Period Ended: | | 06/30/2006+ | | | 12/31/2005 | | | 12/31/2004 | | | 12/31/2003 | | | 12/31/2002 | | | 12/31/2001 | |
| | | | | | |
Institutional Class | | | | | | | | | | | | | | | | | | | | | | | | |
| Net asset value beginning of period | | $ | 10.09 | | | $ | 10.30 | | | $ | 10.27 | | | $ | 10.23 | | | $ | 9.95 | | | $ | 9.82 | |
| Net investment income (a) | | | 0.20 | | | | 0.30 | | | | 0.15 | | | | 0.17 | | | | 0.38 | | | | 0.60 | |
| Net realized/unrealized gain (loss) on investments (a) | | | (0.13 | ) | | | (0.18 | ) | | | 0.05 | | | | 0.08 | | | | 0.33 | | | | 0.15 | |
| Total income from investment operations | | | 0.07 | | | | 0.12 | | | | 0.20 | | | | 0.25 | | | | 0.71 | | | | 0.75 | |
| Dividends from net investment income | | | (0.20 | ) | | | (0.30 | ) | | | (0.14 | ) | | | (0.20 | ) | | | (0.37 | ) | | | (0.56 | ) |
| Distributions from net realized capital gains | | | 0.00 | | | | (0.03 | ) | | | (0.03 | ) | | | (0.01 | ) | | | (0.06 | ) | | | (0.06 | ) |
| Total distributions | | | (0.20 | ) | | | (0.33 | ) | | | (0.17 | ) | | | (0.21 | ) | | | (0.43 | ) | | | (0.62 | ) |
| Net asset value end of period | | $ | 9.96 | | | $ | 10.09 | | | $ | 10.30 | | | $ | 10.27 | | | $ | 10.23 | | | $ | 9.95 | |
| Total return | | | 0.74 | % | | | 1.16 | % | | | 2.00 | % | | | 2.49 | % | | | 7.22 | % | | | 7.77 | % |
| Net assets end of period (000s) | | $ | 25,479 | | | $ | 18,093 | | | $ | 12,252 | | | $ | 11 | | | $ | 11 | | | $ | 468 | |
| Ratio of expenses to average net assets | | | 0.50 | %* | | | 0.50 | % | | | 0.50 | % | | | 0.50 | % | | | 0.51 | %(b) | | | 0.55 | %(b) |
| Ratio of net investment income to average net assets | | | 4.09 | %* | | | 2.92 | % | | | 1.49 | % | | | 1.68 | % | | | 3.78 | % | | | 6.01 | % |
| Portfolio turnover rate | | | 127 | % | | | 184 | % | | | 483 | % | | | 284 | % | | | 339 | % | | | 661 | % |
+ Unaudited
* Annualized
(a) Per share amounts based on average number of shares outstanding during the period.
(b) Ratio of expenses to average net assets excluding interest expense is 0.50%.
| | | | | | |
| See Accompanying Notes | | Semiannual Report | | June 30, 2006 | | 5 |
| | |
| |
| Statement of Assets and Liabilities Low Duration Portfolio | | |
| | | | |
| (Amounts in thousands, except per share amounts) | | June 30, 2006
(Unaudited) | |
| |
Assets: | | | | |
Investments, at value | | $ | 720,320 | |
Foreign currency, at value | | | 8 | |
Receivable for investments sold | | | 9 | |
Receivable for Portfolio shares sold | | | 1,709 | |
Interest and dividends receivable | | | 1,181 | |
Variation margin receivable | | | 197 | |
Swap premiums paid | | | 59 | |
Unrealized appreciation on forward foreign currency contracts | | | 212 | |
Unrealized appreciation on swap agreements | | | 70 | |
Other assets | | | 1 | |
| | | | 723,766 | |
| |
Liabilities: | | | | |
Payable for investments purchased | | $ | 98,291 | |
Payable for Portfolio shares redeemed | | | 143 | |
Written options outstanding | | | 1,344 | |
Accrued investment advisory fee | | | 135 | |
Accrued administration fee | | | 135 | |
Accrued servicing fee | | | 70 | |
Variation margin payable | | | 23 | |
Unrealized depreciation on forward foreign currency contracts | | | 2,162 | |
Unrealized depreciation on swap agreements | | | 12 | |
| | | | 102,315 | |
| |
Net Assets | | $ | 621,451 | |
| |
Net Assets Consist of: | | | | |
Paid in capital | | $ | 635,900 | |
Undistributed net investment income | | | 680 | |
Accumulated undistributed net realized (loss) | | | (8,247 | ) |
Net unrealized (depreciation) | | | (6,882 | ) |
| | | $ | 621,451 | |
| |
Net Assets: | | | | |
Institutional Class | | $ | 25,479 | |
Administrative Class | | | 595,962 | |
Advisor Class | | | 10 | |
| |
Shares Issued and Outstanding: | | | | |
Institutional Class | | | 2,557 | |
Administrative Class | | | 59,807 | |
Advisor Class | | | 1 | |
| |
Net Asset Value and Redemption Price Per Share (Net Assets Per Share Outstanding) | | | | |
Institutional Class | | $ | 9.96 | |
Administrative Class | | | 9.96 | |
Advisor Class | | | 9.96 | |
| |
Cost of Investments Owned | | $ | 719,941 | |
Cost of Foreign Currency Held | | $ | 8 | |
Premiums Received on Written Options | | $ | 1,189 | |
| | | | |
| 6 | | PIMCO Variable Insurance Trust | | See Accompanying Notes |
| | |
| |
| Statement of Operations Low Duration Portfolio | | |
| | | | |
| (Amounts in Thousands) | | Six Months Ended
June 30, 2006
(Unaudited) | |
| |
Investment Income: | | | | |
Interest, net of foreign taxes | | $ | 12,579 | |
Dividends | | | 20 | |
Miscellaneous income | | | 5 | |
Total Income | | | 12,604 | |
| |
Expenses: | | | | |
Investment advisory fees | | | 686 | |
Administration fees | | | 686 | |
Servicing fees – Administrative Class | | | 394 | |
Trustees’ fees | | | 3 | |
Total Expenses | | | 1,769 | |
| |
Net Investment Income | | | 10,835 | |
| |
Net Realized and Unrealized Gain (Loss): | | | | |
Net realized (loss) on investments | | | (1,479 | ) |
Net realized gain on futures contracts, options and swaps | | | 1,174 | |
Net realized (loss) on foreign currency transactions | | | (1,885 | ) |
Net change in unrealized (depreciation) on investments | | | (2,194 | ) |
Net change in unrealized (depreciation) on futures contracts, options and swaps | | | (5,438 | ) |
Net change in unrealized appreciation on translation of assets and liabilities denominated in foreign currencies | | | 2,742 | |
Net (Loss) | | | (7,080 | ) |
| |
Net Increase in Net Assets Resulting from Operations | | $ | 3,755 | |
| | | | | | |
| See Accompanying Notes | | Semiannual Report | | June 30, 2006 | | 7 |
| | |
| |
| Statements of Changes in Net Assets Low Duration Portfolio | | |
| | | | | | | | |
| (Amounts in Thousands) | | Six Months Ended
June 30, 2006
(Unaudited) | | | Year Ended
December 31, 2005 | |
| | |
Increase (Decrease) in Net Assets from: | | | | | | | | |
| | |
Operations: | | | | | | | | |
Net investment income | | $ | 10,835 | | | $ | 10,648 | |
Net realized (loss) | | | (2,190 | ) | | | (3,618 | ) |
Net change in unrealized (depreciation) | | | (4,890 | ) | | | (2,598 | ) |
Net increase resulting from operations | | | 3,755 | | | | 4,432 | |
| | |
Distributions to Shareholders: | | | | | | | | |
| From net investment income | | | | | | | | |
Institutional Class | | | (467 | ) | | | (513 | ) |
Administrative Class | | | (10,469 | ) | | | (10,349 | ) |
Advisor Class | | | 0 | | | | 0 | |
| From net realized capital gains | | | | | | | | |
Institutional Class | | | 0 | | | | (48 | ) |
Administrative Class | | | 0 | | | | (1,196 | ) |
Advisor Class | | | 0 | | | | 0 | |
| | |
Total Distributions | | | (10,936 | ) | | | (12,106 | ) |
| | |
Portfolio Share Transactions: | | | | | | | | |
| Receipts for shares sold | | | | | | | | |
Institutional Class | | | 10,012 | | | | 10,460 | |
Administrative Class | | | 184,037 | | | | 239,555 | |
Advisor Class | | | 10 | | | | 0 | |
| Issued as reinvestment of distributions | | | | | | | | |
Institutional Class | | | 467 | | | | 561 | |
Administrative Class | | | 10,471 | | | | 11,545 | |
Advisor Class | | | 0 | | | | 0 | |
| Cost of shares redeemed | | | | | | | | |
Institutional Class | | | (2,796 | ) | | | (4,836 | ) |
Administrative Class | | | (50,338 | ) | | | (66,805 | ) |
Advisor Class | | | 0 | | | | 0 | |
Net increase resulting from Portfolio share transactions | | | 151,863 | | | | 190,480 | |
| | |
Total Increase in Net Assets | | | 144,682 | | | | 182,806 | |
| | |
Net Assets: | | | | | | | | |
Beginning of period | | | 476,769 | | | | 293,963 | |
End of period* | | $ | 621,451 | | | $ | 476,769 | |
| | |
*Including undistributed net investment income of: | | $ | 680 | | | $ | 781 | |
| | | | |
| 8 | | PIMCO Variable Insurance Trust | | See Accompanying Notes |
| | |
| |
| Schedule of Investments Low Duration Portfolio | | June 30, 2006 (Unaudited) |
| | | | | | | | |
| | | | | PRINCIPAL | | | | |
| | | | | AMOUNT | | | | VALUE |
| | | | | (000S) | | | | (000S) |
| | | | | | | | | |
| CORPORATE BONDS & NOTES 14.3% |
| |
| BANKING & FINANCE 11.1% |
| American Express Credit Corp. |
5.170% due 06/12/2007 | | $ | | 1,000 | | $ | | 1,001 |
|
| American General Finance Corp. |
5.489% due 03/23/2007 | | | | 200 | | | | 200 |
|
| Bank of America Corp. |
5.406% due 06/19/2009 | | | | 6,100 | | | | 6,102 |
|
| Bear Stearns Cos., Inc. |
5.299% due 04/29/2008 | | | | 3,400 | | | | 3,409 |
5.589% due 03/30/2009 | | | | 2,300 | | | | 2,302 |
|
| CIT Group, Inc. |
5.404% due 05/23/2008 | | | | 4,600 | | | | 4,614 |
5.420% due 11/03/2010 | | | | 1,400 | | | | 1,406 |
|
| Citigroup, Inc. |
4.200% due 12/20/2007 | | | | 4,100 | | | | 4,021 |
5.520% due 12/26/2008 | | | | 200 | | | | 200 |
5.166% due 01/30/2009 | | | | 1,900 | | | | 1,901 |
|
| Ford Motor Credit Co. |
7.750% due 02/15/2007 | | | | 400 | | | | 401 |
6.374% due 03/21/2007 | | | | 2,000 | | | | 1,993 |
7.200% due 06/15/2007 | | | | 100 | | | | 99 |
|
| General Electric Capital Corp. |
5.222% due 01/08/2016 | | | | 300 | | | | 300 |
|
| Goldman Sachs Group, Inc. |
5.125% due 10/05/2007 | | | | 1,600 | | | | 1,603 |
5.226% due 07/29/2008 | | | | 1,200 | | | | 1,202 |
5.527% due 12/22/2008 | | | | 2,100 | | | | 2,103 |
5.420% due 07/23/2009 | | | | 1,300 | | | | 1,310 |
|
| HSBC Bank USA N.A. |
5.176% due 07/28/2008 | | | | 3,100 | | | | 3,104 |
|
| HSBC Finance Corp. |
5.459% due 09/15/2008 | | | | 500 | | | | 501 |
|
| Lehman Brothers Holdings, Inc. |
5.659% due 12/23/2010 | | | | 900 | | | | 902 |
|
| Merrill Lynch & Co., Inc. |
5.441% due 06/16/2008 | | | | 6,000 | | | | 6,009 |
|
| Morgan Stanley |
5.276% due 02/09/2009 | | | | 1,100 | | | | 1,102 |
5.318% due 01/18/2011 | | | | 1,500 | | | | 1,503 |
|
| Prudential Financial, Inc. |
4.104% due 11/15/2006 | | | | 400 | | | | 398 |
|
| Royal Bank of Scotland Group PLC |
5.424% due 12/21/2007 | | | | 1,200 | | | | 1,201 |
|
| Santander U.S. Debt S.A. Unipersonal |
5.434% due 09/21/2007 | | | | 2,000 | | | | 2,002 |
5.484% due 09/19/2008 | | | | 2,800 | | | | 2,803 |
|
| Unicredito Italiano |
5.231% due 12/03/2007 | | | | 5,400 | | | | 5,414 |
|
| Wachovia Bank N.A. |
5.270% due 05/25/2010 | | | | 6,000 | | | | 6,002 |
|
| Wells Fargo |
5.340% due 03/10/2008 | | | | 4,000 | | | | 4,003 |
| | | | | | | | |
|
| | | | | | | | | 69,111 |
| | | | | | | | |
|
| |
| INDUSTRIALS 1.7% | | | | | | | | |
| Altria Group, Inc. |
7.650% due 07/01/2008 | | | | 200 | | | | 207 |
|
| Clear Channel Communications, Inc. |
6.000% due 11/01/2006 | | | | 250 | | | | 250 |
| | | | | | | | |
| CSC Holdings, Inc. |
7.250% due 07/15/2008 | | $ | | 3,500 | | $ | | 3,522 |
|
| DaimlerChrysler N.A. Holding Corp. |
5.780% due 09/10/2007 | | | | 4,758 | | | | 4,774 |
|
| International Paper Co. |
7.625% due 01/15/2007 | | | | 250 | | | | 252 |
|
| Oracle Corp. & Ozark Holding, Inc. |
5.280% due 01/13/2009 | | | | 1,200 | | | | 1,202 |
| | | | | | | | |
|
| | | | | | | | | 10,207 |
| | | | | | | | |
|
| |
| UTILITIES 1.5% | | | | | | | | |
| AT&T, Inc. |
5.262% due 05/15/2008 | | | | 5,900 | | | | 5,903 |
|
| Entergy Mississippi, Inc. |
4.350% due 04/01/2008 | | | | 100 | | | | 97 |
|
| Qwest Capital Funding, Inc. |
6.375% due 07/15/2008 | | | | 1,870 | | | | 1,851 |
|
| Telefonica Emisones SAU |
5.714% due 06/19/2009 | | | | 1,700 | | | | 1,702 |
| | | | | | | | |
|
| | | | | | | | | 9,553 |
| | | | | | | | |
|
Total Corporate Bonds & Notes
(Cost $88,855) | | | | 88,871 |
| | | | | | | | |
|
| |
| U.S. GOVERNMENT AGENCIES 26.8% |
| Fannie Mae |
3.716% due 07/01/2034 | | | | 422 | | | | 416 |
4.350% due 03/01/2035 | | | | 414 | | | | 409 |
4.503% due 05/01/2035 | | | | 1,045 | | | | 1,025 |
4.526% due 05/01/2035 | | | | 1,045 | | | | 1,028 |
4.542% due 09/01/2035 | | | | 1,705 | | | | 1,681 |
4.599% due 11/01/2035 | | | | 1,904 | | | | 1,878 |
4.655% due 08/01/2035 | | | | 3,865 | | | | 3,773 |
4.683% due 07/01/2035 | | | | 673 | | | | 659 |
5.000% due 03/01/2018 - 04/25/2033 (b) | | | | 66,650 | | | | 64,227 |
5.211% due 07/01/2042 | | | | 738 | | | | 742 |
5.249% due 04/26/2035 | | | | 44 | | | | 44 |
5.261% due 09/01/2041 | | | | 919 | | | | 926 |
5.312% due 09/22/2006 | | | | 1,300 | | | | 1,300 |
5.372% due 09/25/2035 | | | | 581 | | | | 581 |
5.411% due 09/01/2040 | | | | 19 | | | | 20 |
5.442% due 03/25/2034 | | | | 255 | | | | 256 |
5.500% due 12/01/2009 - 07/13/2036 (b) | | | | 74,532 | | | | 73,025 |
5.672% due 09/25/2042 - 03/25/2044 (b) | | | | 2,056 | | | | 2,065 |
5.695% due 09/01/2034 | | | | 100 | | | | 99 |
5.722% due 05/25/2031 - 11/25/2032 (b) | | | | 1,752 | | | | 1,757 |
5.736% due 12/01/2036 | | | | 102 | | | | 102 |
5.977% due 11/01/2035 | | | | 657 | | | | 671 |
6.000% due 08/01/2016 - 03/01/2033 (b) | | | | 151 | | | | 150 |
6.500% due 01/01/2033 | | | | 29 | | | | 29 |
|
| Federal Housing Administration |
6.390% due 10/01/2020 | | | | 20 | | | | 21 |
|
| Freddie Mac |
4.715% due 06/01/2035 | | | | 2,733 | | | | 2,646 |
4.922% due 07/01/2035 | | | | 1,093 | | | | 1,066 |
5.000% due 10/01/2018 - 07/15/2024 (b) | | | | 2,257 | | | | 2,227 |
5.211% due 02/25/2045 | | | | 1,598 | | | | 1,587 |
5.500% due 08/15/2030 | | | | 13 | | | | 13 |
5.549% due 12/15/2030 | | | | 658 | | | | 659 |
5.582% due 08/25/2031 | | | | 640 | | | | 643 |
5.597% due 06/15/2018 | | | | 235 | | | | 235 |
6.000% due 09/01/2016 - 02/01/2033 (b) | | | | 134 | | | | 132 |
6.500% due 07/25/2043 | | | | 213 | | | | 215 |
| | | | | | | | |
| Government National Mortgage Association |
4.000% due 07/16/2027 | | $ | | 310 | | $ | | 305 |
| | | | | | | | |
|
Total U.S. Government Agencies
(Cost $169,232) | | | | 166,612 |
| | | | | | | | |
|
| |
| MORTGAGE-BACKED SECURITIES 8.2% |
| American Home Mortgage Investment Trust |
4.290% due 10/25/2034 | | | | 1,867 | | | | 1,816 |
4.390% due 02/25/2045 | | | | 766 | | | | 739 |
|
| Banc of America Funding Corp. |
4.116% due 05/25/2035 | | | | 8,620 | | | | 8,311 |
|
| Banc of America Mortgage Securities |
6.500% due 10/25/2031 | | | | 125 | | | | 126 |
5.403% due 10/20/2032 | | | | 5 | | | | 5 |
|
| Bear Stearns Adjustable Rate Mortgage Trust |
5.330% due 01/25/2033 | | | | 16 | | | | 16 |
5.450% due 03/25/2033 | | | | 56 | | | | 55 |
5.062% due 04/25/2033 | | | | 34 | | | | 34 |
4.819% due 01/25/2034 | | | | 163 | | | | 160 |
4.750% due 11/25/2035 | | | | 3,619 | | | | 3,553 |
|
| Bear Stearns Alt-A Trust |
5.406% due 05/25/2035 | | | | 1,202 | | | | 1,188 |
|
| Citigroup Mortgage Loan Trust, Inc. |
4.900% due 12/25/2035 | | | | 924 | | | | 918 |
|
| Countrywide Alternative Loan Trust |
6.500% due 06/25/2033 | | | | 27 | | | | 27 |
6.000% due 10/25/2033 | | | | 149 | | | | 144 |
4.500% due 06/25/2035 | | | | 3,638 | | | | 3,565 |
5.602% due 02/25/2036 | | | | 4,565 | | | | 4,575 |
|
| Countrywide Home Loan Mortgage Pass-Through Trust |
5.592% due 04/25/2034 | | | | 151 | | | | 151 |
5.250% due 11/20/2035 | | | | 1,441 | | | | 1,418 |
|
| CS First Boston Mortgage Securities Corp. |
4.938% due 05/15/2010 | | | | 752 | | | | 741 |
5.020% due 03/25/2032 | | | | 14 | | | | 14 |
6.056% due 06/25/2032 | | | | 1 | | | | 1 |
5.686% due 10/25/2032 | | | | 3 | | | | 3 |
5.872% due 08/25/2033 | | | | 13 | | | | 13 |
|
| GMAC Mortgage Corp. Loan Trust |
5.009% due 11/19/2035 | | | | 969 | | | | 957 |
GSR Mortgage Loan Trust | | | | | | | | |
6.000% due 03/25/2032 | | | | 4 | | | | 4 |
4.541% due 09/25/2035 | | | | 3,703 | | | | 3,605 |
|
| Impac CMB Trust |
5.722% due 07/25/2033 | | | | 77 | | | | 77 |
5.572% due 01/25/2034 | | | | 106 | | | | 106 |
|
| LB-UBS Commercial Mortgage Trust |
4.990% due 11/15/2030 | | | | 991 | | | | 977 |
|
| MASTR Adjustable Rate Mortgages Trust |
3.787% due 12/21/2034 | | | | 220 | | | | 220 |
|
| MASTR Asset Securitization Trust |
5.500% due 09/25/2033 | | | | 84 | | | | 80 |
|
| Mellon Residential Funding Corp. |
5.439% due 06/15/2030 | | | | 703 | | | | 706 |
|
| MLCC Mortgage Investors, Inc. |
6.628% due 01/25/2029 | | | | 192 | | | | 194 |
|
| Prime Mortgage Trust |
5.722% due 02/25/2034 | | | | 86 | | | | 86 |
5.722% due 02/25/2034 | | | | 27 | | | | 27 |
|
| Salomon Brothers Mortgage Securities VII |
4.000% due 12/25/2018 | | | | 369 | | | | 347 |
| | | | | | |
| See Accompanying Notes | | Semiannual Report | | June 30, 2006 | | 9 |
| | |
| |
| Schedule of Investments Low Duration Portfolio (Cont.) | | |
| | | | | | | | |
| | | | | PRINCIPAL | | | | |
| | | | | AMOUNT | | | | VALUE |
| | | | | (000S) | | | | (000S) |
| | | | | | | | | |
| Sequoia Mortgage Trust |
5.607% due 05/20/2032 | | $ | | 21 | | $ | | 21 |
5.567% due 08/20/2032 | | | | 15 | | | | 15 |
|
| Structured Adjustable Rate Mortgage Loan Trust |
4.580% due 02/25/2034 | | | | 1,311 | | | | 1,285 |
5.355% due 08/25/2034 | | | | 1,635 | | | | 1,624 |
5.682% due 01/25/2035 | | | | 1,543 | | | | 1,558 |
|
| Structured Asset Mortgage Investments, Inc. |
5.582% due 09/19/2032 | | | | 31 | | | | 31 |
5.602% due 02/25/2035 | | | | 487 | | | | 486 |
|
| Structured Asset Securities Corp. |
6.150% due 07/25/2032 | | | | 1 | | | | 1 |
5.422% due 09/25/2035 | | | | 2,911 | | | | 2,913 |
|
| Washington Mutual, Inc. |
4.816% due 10/25/2032 | | | | 293 | | | | 290 |
5.009% due 02/27/2034 | | | | 85 | | | | 84 |
5.202% due 05/25/2041 | | | | 460 | | | | 462 |
5.543% due 06/25/2042 | | | | 395 | | | | 395 |
5.410% due 08/25/2042 | | | | 160 | | | | 160 |
5.612% due 10/25/2045 | | | | 4,156 | | | | 4,183 |
5.592% due 12/26/2045 | | | | 815 | | | | 818 |
|
| Wells Fargo Mortgage-Backed Securities Trust |
3.540% due 09/25/2034 | | | | 273 | | | | 272 |
4.950% due 03/25/2036 | | | | 1,635 | | | | 1,613 |
| | | | | | | | |
|
Total Mortgage-Backed Securities
(Cost $51,746) | | | | 51,170 |
| | | | | | | | |
|
| |
| ASSET-BACKED SECURITIES 6.5% |
| AAA Trust | | | | | | | | |
5.422% due 04/25/2035 | | | | 125 | | | | 125 |
|
| ACE Securities Corp. |
5.432% due 10/25/2035 | | | | 2,626 | | | | 2,628 |
|
| Amortizing Residential Collateral Trust |
5.612% due 07/25/2032 | | | | 13 | | | | 13 |
|
| Argent Securities, Inc. |
5.442% due 10/25/2035 | | | | 476 | | | | 477 |
5.462% due 12/25/2035 | | | | 1,780 | | | | 1,781 |
|
| Asset-Backed Funding Certificates |
5.432% due 08/25/2035 | | | | 882 | | | | 883 |
|
| Asset-Backed Securities Corp. Home Equity |
6.299% due 03/15/2032 | | | | 549 | | | | 550 |
5.422% due 07/25/2035 | | | | 79 | | | | 80 |
|
| Bear Stearns Asset-Backed Securities, Inc. |
5.522% due 09/25/2034 | | | | 286 | | | | 286 |
5.522% due 06/15/2043 | | | | 310 | | | | 310 |
|
| Carrington Mortgage Loan Trust |
5.402% due 06/25/2035 | | | | 73 | | | | 73 |
|
| Centex Home Equity |
5.412% due 06/25/2035 | | | | 526 | | | | 526 |
|
| Chase Manhattan Auto Owner Trust |
4.770% due 03/15/2008 | | | | 2,200 | | | | 2,196 |
|
| CIT Group Home Equity Loan Trust |
5.592% due 06/25/2033 | | | | 8 | | | | 8 |
|
| Citigroup Mortgage Loan Trust, Inc. |
5.412% due 07/25/2035 | | | | 117 | | | | 117 |
5.422% due 07/25/2035 | | | | 217 | | | | 217 |
5.432% due 09/25/2035 | | | | 411 | | | | 411 |
|
| Conseco Finance Securitizations Corp. |
6.090% due 09/01/2033 | | | | 3,351 | | | | 3,353 |
| | | | | | | | |
| Countrywide Asset-Backed Certificates |
5.802% due 12/25/2031 | | $ | | 120 | | $ | | 120 |
5.442% due 03/25/2035 | | | | 63 | | | | 63 |
5.402% due 06/25/2035 | | | | 87 | | | | 87 |
5.422% due 08/25/2035 | | | | 562 | | | | 562 |
5.402% due 10/25/2035 | | | | 315 | | | | 315 |
|
| CS First Boston Mortgage Securities Corp. |
5.632% due 01/25/2032 | | | | 19 | | | | 20 |
|
| Equity One ABS, Inc. |
5.602% due 11/25/2032 | | | | 17 | | | | 17 |
|
| FBR Securitization Trust |
5.462% due 09/25/2035 | | | | 719 | | | | 719 |
5.442% due 11/25/2035 | | | | 3,416 | | | | 3,419 |
|
| First Franklin Mortgage Loan Asset-Backed Certificates |
5.432% due 03/25/2025 | | | | 270 | | | | 270 |
|
| First NLC Trust |
5.432% due 09/25/2035 | | | | 255 | | | | 255 |
5.432% due 12/25/2035 | | | | 412 | | | | 413 |
|
| Fremont Home Loan Trust |
5.412% due 01/25/2036 | | | | 690 | | | | 690 |
|
| GSAMP Trust |
5.512% due 10/25/2033 | | | | 71 | | | | 71 |
5.612% due 03/25/2034 | | | | 393 | | | | 394 |
GSR Mortgage Loan Trust | | | | | | | | |
5.422% due 12/25/2030 | | | | 740 | | | | 741 |
|
| HFC Home Equity Loan Asset-Backed Certificates |
5.617% due 09/20/2033 | | | | 297 | | | | 298 |
|
| Indymac Residential Asset-Backed Trust |
5.422% due 03/25/2036 | | | | 760 | | | | 761 |
|
| Long Beach Mortgage Loan Trust |
5.522% due 11/25/2034 | | | | 1,203 | | | | 1,204 |
5.442% due 09/25/2035 | | | | 690 | | | | 690 |
5.412% due 01/25/2036 | | | | 931 | | | | 931 |
5.402% due 02/25/2036 | | | | 943 | | | | 944 |
|
| New Century Home Equity Loan Trust |
5.432% due 09/25/2035 | | | | 802 | | | | 803 |
|
| Option One Mortgage Loan Trust |
5.422% due 08/25/2035 | | | | 53 | | | | 53 |
5.422% due 11/25/2035 | | | | 1,634 | | | | 1,635 |
|
| Park Place Securities, Inc. |
5.432% due 08/25/2035 | | | | 481 | | | | 482 |
|
| Quest Trust |
5.402% due 12/25/2035 | | | | 341 | | | | 341 |
|
| Renaissance Home Equity Loan Trust |
5.472% due 10/25/2035 | | | | 750 | | | | 751 |
|
| Residential Asset Mortgage Products, Inc. |
5.432% due 10/25/2025 | | | | 1,237 | | | | 1,238 |
5.662% due 09/25/2033 | | | | 8 | | | | 8 |
5.572% due 02/25/2034 | | | | 127 | | | | 127 |
5.422% due 03/25/2035 | | | | 886 | | | | 887 |
|
| SLM Student Loan Trust |
5.120% due 07/25/2013 | | | | 650 | | | | 651 |
5.110% due 01/26/2015 | | | | 904 | | | | 903 |
|
| Soundview Home Equity Loan Trust |
5.432% due 05/25/2035 | | | | 127 | | | | 127 |
5.422% due 07/25/2035 | | | | 15 | | | | 15 |
5.432% due 11/25/2035 | | | | 1,335 | | | | 1,336 |
5.422% due 12/25/2035 | | | | 431 | | | | 431 |
|
| Structured Asset Securities Corp. |
5.422% due 08/25/2035 | | | | 391 | | | | 391 |
5.452% due 12/25/2035 | | | | 1,459 | | | | 1,460 |
| | | | | | | | |
| Truman Capital Mortgage Loan Trust |
5.662% due 01/25/2034 | | $ | | 206 | | $ | | 207 |
|
| Wachovia Auto Owner Trust |
4.820% due 02/20/2009 | | | | 1,300 | | | | 1,296 |
| | | | | | | | |
|
Total Asset-Backed Securities
(Cost $40,143) | | | | 40,160 |
| | | | | | | | |
|
| |
| | | | | NOTIONAL
AMOUNT
(000S) | | | | |
| |
| PURCHASED CALL OPTIONS 0.1% |
| 2-Year Interest Rate Swap (OTC) Pay 3-Month USD-LIBOR Floating Rate Index |
Strike @ 4.500% Exp. 10/04/2006 | | | | 12,500 | | | | 0 |
Strike @ 4.750% Exp. 08/07/2006 | | | | 19,000 | | | | 0 |
Strike @ 4.750% Exp. 08/08/2006 | | | | 6,000 | | | | 0 |
Strike @ 4.800% Exp. 12/22/2006 | | | | 14,000 | | | | 2 |
Strike @ 5.000% Exp. 03/08/2007 | | | | 16,000 | | | | 14 |
Strike @ 5.000% Exp. 03/08/2007 | | | | 7,000 | | | | 6 |
Strike @ 5.080% Exp. 04/19/2007 | | | | 13,800 | | | | 20 |
Strike @ 5.130% Exp. 10/25/2006 | | | | 24,300 | | | | 7 |
Strike @ 5.130% Exp. 10/25/2006 | | | | 5,000 | | | | 2 |
Strike @ 5.170% Exp. 02/01/2007 | | | | 15,200 | | | | 18 |
Strike @ 5.200% Exp. 05/09/2007 | | | | 33,600 | | | | 73 |
Strike @ 5.250% Exp. 06/07/2007 | | | | 30,000 | | | | 82 |
| | | | | | | | |
|
Total Purchased Call Options
(Cost $743) | | | | 224 |
| | | | | | | | |
|
| |
| | | | | #OF
CONTRACTS | | | | |
| |
| PURCHASED PUT OPTIONS 0.0% |
| 90-Day Eurodollar December Futures (CME) |
Strike @ $92.250 Exp. 12/18/2006 | | | | 96 | | | | 1 |
Strike @ $92.500 Exp. 12/18/2006 | | | | 120 | | | | 1 |
|
| 90-Day Eurodollar June Futures (CME) |
Strike @ $91.000 Exp. 06/18/2007 | | | | 337 | | | | 2 |
Strike @ $91.250 Exp. 06/18/2007 | | | | 423 | | | | 3 |
|
| 90-Day Eurodollar March Futures (CME) |
Strike @ $92.000 Exp. 03/19/2007 | | | | 469 | | | | 3 |
|
| 90-Day Eurodollar September Futures (CME) |
Strike @ $92.750 Exp. 09/18/2006 | | | | 556 | | | | 3 |
| | | | | | | | |
|
Total Purchased Put Options
(Cost $19) | | | | 13 |
| | | | | | | | |
|
| |
| | | | | NOTIONAL
AMOUNT
(000S) | | | | |
| |
| PURCHASED STRADDLE OPTIONS 0.0% |
| Call & Put – OTC U.S. dollar versus Japanese Yen Forward Delta Neutral Straddle |
Strike @ $0.000 (g) Exp. 08/23/2007 | | $ | | 7,000 | | | | 4 |
| | | | | | | | |
|
Total Purchased Straddle Options (Cost $0) | | 4 |
| | | | | | | | |
|
| | | | |
| 10 | | PIMCO Variable Insurance Trust | | See Accompanying Notes |
| | |
| |
| | | June 30, 2006 (Unaudited) |
| | | | | | | | |
| PREFERRED STOCK 0.1% |
| DG Funding Trust | | | | | | | | |
7.210% due 12/31/2049 | | | | 60 | | $ | | 633 |
| | | | | | | | |
|
Total Preferred Stock (Cost $632) | | | | 633 |
| | | | | | | | |
|
| |
| | | | | PRINCIPAL
AMOUNT
(000S) | | | | |
| SHORT-TERM INSTRUMENTS 59.9% |
| |
| BELGIUM TREASURY BILLS 4.7% |
2.757% due 10/12/2006 | | EUR | | 23,060 | | | | 29,262 |
| | | | | | | | |
|
| |
| |
| COMMERCIAL PAPER 37.1% |
| Barclays U.S. Fund | | | | | | | | |
5.055% due 08/16/2006 | | $ | | 12,200 | | | | 12,125 |
5.105% due 08/22/2006 | | | | 5,900 | | | | 5,858 |
|
| BNP Paribas Finance | | | | | | | | |
4.930% due 07/13/2006 | | | | 2,400 | | | | 2,397 |
5.079% due 08/22/2006 | | | | 15,600 | | | | 15,490 |
|
| Caisse d’Amortissement de la Dette Sociale |
5.270% due 08/03/2006 | | | | 17,000 | | | | 16,923 |
|
| Cox Communications, Inc. |
5.160% due 07/17/2006 | | | | 600 | | | | 600 |
|
| Danske Corp. | | | | | | | | |
5.280% due 07/17/2006 | | | | 5,400 | | | | 5,389 |
4.955% due 07/20/2006 | | | | 600 | | | | 599 |
4.980% due 07/26/2006 | | | | 4,100 | | | | 4,087 |
5.080% due 08/24/2006 | | | | 8,800 | | | | 8,735 |
|
| Dexia Delaware LLC | | | | | | | | |
5.275% due 07/05/2006 | | | | 3,300 | | | | 3,299 |
4.980% due 07/25/2006 | | | | 15,600 | | | | 15,553 |
|
| DnB NORBank ASA |
4.960% due 07/17/2006 | | | | 10,900 | | | | 10,879 |
|
| Fannie Mae |
4.809% due 07/05/2006 | | | | 17,200 | | | | 17,195 |
|
| Federal Home Loan Bank |
5.030% due 07/03/2006 | | | | 17,200 | | | | 17,200 |
| | | | | | | | |
| Fortis Funding |
5.265% due 07/26/2006 | | $ | | 3,100 | | $ | | 3,090 |
|
| General Electric Capital Corp. |
4.975% due 07/24/2006 | | | | 2,400 | | | | 2,393 |
|
| HBOS Treasury Services PLC |
4.985% due 07/26/2006 | | | | 14,900 | | | | 14,853 |
|
| Rabobank USA Financial Corp. |
5.250% due 07/03/2006 | | | | 17,200 | | | | 17,200 |
|
| Skandinaviska Enskilda Banken |
4.960% due 07/20/2006 | | | | 500 | | | | 499 |
|
| Societe Generale N.A. | | | | | | | | |
5.270% due 07/03/2006 | | | | 300 | | | | 300 |
5.245% due 08/08/2006 | | | | 16,500 | | | | 16,413 |
5.055% due 08/15/2006 | | | | 1,100 | | | | 1,093 |
4.985% due 08/22/2006 | | | | 1,000 | | | | 993 |
|
| Total Captial S.A. |
5.270% due 07/03/2006 | | | | 17,200 | | | | 17,200 |
|
| UBS Finance Delaware LLC |
5.270% due 07/03/2006 | | | | 400 | | | | 400 |
5.050% due 07/05/2006 | | | | 4,700 | | | | 4,699 |
4.790% due 07/07/2006 | | | | 3,900 | | | | 3,898 |
4.930% due 07/10/2006 | | | | 1,000 | | | | 999 |
5.095% due 09/22/2006 | | | | 9,000 | | | | 8,887 |
|
| Westpac Capital Corp. | | | | | | | | |
4.980% due 07/24/2006 | | | | 1,200 | | | | 1,196 |
| | | | | | | | |
|
| | | | | | | | | 230,442 |
| | | | | | | | |
|
| |
| FRANCE TREASURY BILLS 6.1% |
2.775% due 07/06/2006 -
11/23/2006 (b) | | EUR | | 29,900 | | | | 37,957 |
| | | | | | | | |
|
| |
| GERMANY TREASURY BILLS 8.5% |
2.590% due 07/12/2006 -
10/18/2006 (b) | | | | 41,410 | | | | 52,871 |
| | | | | | | | |
|
| | | | | | | | | |
| REPURCHASE AGREEMENTS 2.5% | |
| Credit Suisse First Boston | | | | | |
4.580% due 07/03/2006 | | $ | | 4,600 | | $ | | 4,600 | |
(Dated 06/30/2006. Collateralized by U.S. Treasury
Notes 4.000% due 06/15/2009 valued at $4,729. Repurchase proceeds are $4,602.) | |
4.600% due 07/03/2006 | | | | 5,000 | | | | 5,000 | |
(Dated 06/30/2006. Collateralized by U.S. Treasury Notes 3.250% due 08/15/2007 valued at $5,107. Repurchase proceeds are $5,002.) | |
|
|
| State Street Bank | | | | | | | | | |
4.900% due 07/03/2006 | | | | 5,892 | | | | 5,892 | |
(Dated 06/30/2006. Collateralized by Freddie Mac 2.750% due 02/09/2007 valued at $6,011. Repurchase proceeds are $5,894.) | |
| | | | | | | | |
|
|
| | | | | | | | | 15,492 | |
| | | | | | | | |
|
|
| | |
| SPAIN TREASURY BILLS 0.4% | |
2.890% due 12/22/2006 | | EUR | | 2,500 | | | | 3,153 | |
| | | | | | | | |
|
|
| | |
| U.S. TREASURY BILLS 0.6% | |
4.568% due 08/31/2006 -
09/14/2006 (b)(c) | | $ | | 3,495 | | | | 3,456 | |
| | | | | | | | |
|
|
Total Short-Term Instruments
(Cost $368,571) | | | | 372,633 | |
| | | | | | | | |
|
|
| | |
Total Investments (a) 115.9%
(Cost $719,941) | | $ | | 720,320 | |
| | |
Written Options (e) (0.2%)
(Premiums $1,189) | | | | (1,344 | ) |
| | |
| Other Assets and Liabilities (Net) (15.7%) | | | | (97,525 | ) |
| | | | | | | | |
|
|
| Net Assets 100.0% | | | | | | $ | | 621,451 | |
| | | | | | | | |
|
|
| | |
Notes to Schedule of Investments (amounts in thousands, except number of contracts): |
| |
(a) As of June 30, 2006, portfolio securities with an aggregate market value of $1,606 were valued in good faith and pursuant to guidelines established by the Board of Trustees. |
| |
(b) Securities are grouped by coupon or range of coupons and represent a range of maturities. |
| |
(c) Securities with an aggregate market value of $3,456 have been segregated with the custodian to cover margin requirements for the following open futures contracts on June 30, 2006: |
| | | | | | | | | | |
| Description | | Type | | Expiration
Month | | # of
Contracts | | Unrealized
Appreciation/
(Depreciation) | |
90-Day Eurodollar December Futures | | Long | | 12/2006 | | 800 | | $ | (1,196 | ) |
90-Day Eurodollar December Futures | | Long | | 12/2007 | | 291 | | | (455 | ) |
90-Day Eurodollar June Futures | | Long | | 06/2007 | | 625 | | | (1,177 | ) |
90-Day Eurodollar March Futures | | Long | | 03/2007 | | 977 | | | (1,904 | ) |
90-Day Eurodollar March Futures | | Short | | 03/2008 | | 61 | | | 74 | |
90-Day Eurodollar September Futures | | Long | | 09/2007 | | 460 | | | (807 | ) |
U.S. Treasury 5-Year Note September Futures | | Short | | 09/2006 | | 349 | | | 191 | |
U.S. Treasury 10-Year Note September Futures | | Short | | 09/2006 | | 102 | | | 61 | |
U.S. Treasury 30-Year Bond September Futures | | Long | | 09/2006 | | 5 | | | (2 | ) |
| | | | | | | | |
|
|
|
| | | | | | | | | $ | (5,215 | ) |
| | | | | | | | |
|
|
|
| | | | | | |
| See Accompanying Notes | | Semiannual Report | | June 30, 2006 | | 11 |
Schedule of Investments Low Duration Portfolio (Cont.)
| | | | | | | | | | | | | | | | | |
(d) Swap agreements outstanding on June 30, 2006: | | | | |
| Interest Rate Swaps | | | | | | | | | | | | | | | | | |
| Counterparty | | Floating Rate Index | | Pay/Receive
Floating Rate | | Fixed Rate | | Expiration
Date | | | | Notional
Amount | | Unrealized
Appreciation/
(Depreciation) | |
BNP Paribas Bank | | 5-year French CPI Ex Tobacco Daily Reference Index | | Pay | | 2.090% | | 10/15/2010 | | | | EUR | 1,300 | | $ | (4 | ) |
Barclays Bank PLC | | 6-month GBP-LIBOR | | Pay | | 5.000% | | 06/15/2007 | | | | GBP | 400 | | | (3 | ) |
Lehman Brothers, Inc. | | 6-month GBP-LIBOR | | Pay | | 4.500% | | 09/20/2009 | | | | | 200 | | | (5 | ) |
Goldman Sachs & Co. | | 3-month USD-LIBOR | | Receive | | 5.000% | | 12/20/2011 | | | | $ | 2,900 | | | 25 | |
| | | | | | | | | | | | | | | |
|
|
|
| | | | | | | | | | | | | | | | $ | 13 | |
| | | | | | | | | | | | | | | |
|
|
|
| | | | | | | |
| Credit Default Swaps | | | | | | | | | | | | | | | | | |
| Counterparty | | Reference Entity | | Buy/Sell
Protection+ | | (Pay)/Receive
Fixed Rate | | Expiration
Date | | | | Notional
Amount | | Unrealized
Appreciation | |
Bear Stearns & Co., Inc. | | General Motors Acceptance Corp. 6.875% due 08/28/2012 | | Sell | | 2.100% | | 12/20/2006 | | | | $ | 2,600 | | $ | 6 | |
Bear Stearns & Co., Inc. | | Ford Motor Credit Co. 7.000% due 10/01/2013 | | Sell | | 4.650% | | 06/20/2007 | | | | | 400 | | | 8 | |
Bear Stearns & Co., Inc. | | Ford Motor Credit Co. 7.000% due 10/01/2013 | | Sell | | 4.700% | | 06/20/2007 | | | | | 300 | | | 6 | |
Citibank N.A. | | Ford Motor Credit Co. 7.000% due 10/01/2013 | | Sell | | 2.445% | | 12/20/2006 | | | | | 100 | | | 0 | |
Goldman Sachs & Co. | | Ford Motor Credit Co. 7.000% due 10/01/2013 | | Sell | | 2.400% | | 12/20/2006 | | | | | 200 | | | 1 | |
Goldman Sachs & Co. | | Ford Motor Credit Co. 7.000% due 10/01/2013 | | Sell | | 4.500% | | 06/20/2007 | | | | | 200 | | | 4 | |
J.P. Morgan Chase & Co. | | Russia Government International Bond,
5.000% until 03/31/2007 and 7.500%
thereafter, due 03/31/2030 | | Sell | | 0.690% | | 03/20/2007 | | | | | 1,200 | | | 5 | |
Morgan Stanley Dean Witter & Co. | | Ford Motor Credit Co. 7.000% due 10/01/2013 | | Sell | | 4.700% | | 12/20/2006 | | | | | 1,000 | | | 15 | |
Morgan Stanley Dean Witter & Co. | | Russia Government International Bond,
5.000% until 03/31/2007 and 7.500%
thereafter, due 03/31/2030 | | Sell | | 0.460% | | 06/20/2007 | | | | | 200 | | | 0 | |
| | | | | | | | | | | | | | | |
|
|
|
| | | | | | | | | | | | | | | | $ | 45 | |
| | | | | | | | | | | | | | | |
|
|
|
|
| + If the Portfolio is a seller of protection and a credit event occurs, as defined under the terms of that particular swap agreement, the Portfolio will pay to the buyer of the protection an amount up to the notional value of the swap and in certain instances, take delivery of the security. As a buyer of protection, the Portfolio will generally receive from the seller of protection an amount up to the notional amount of the swap if a credit event occurs. | |
| | | | | | | | | | | | |
(e) Written options outstanding on June 30, 2006: |
| Options on Exchange-Traded Futures Contracts | | | | | | | | |
| Description | | Exercise
Price | | Expiration
Date | | # of
Contracts | | Premium | | Value |
Call - CBOT U.S. Treasury 10-Year Note September Futures | | $108.000 | | 08/25/2006 | | 40 | | $ | 7 | | $ | 1 |
Put - CBOT U.S. Treasury 10-Year Note September Futures | | 103.000 | | 08/25/2006 | | 40 | | | 4 | | | 6 |
Put - CME 90-Day Eurodollar December Futures | | 95.000 | | 12/18/2006 | | 13 | | | 6 | | | 20 |
Put - CME 90-Day Eurodollar December Futures | | 95.250 | | 12/18/2006 | | 422 | | | 331 | | | 894 |
Put - CME 90-Day Eurodollar December Futures | | 95.500 | | 12/18/2006 | | 45 | | | 49 | | | 123 |
Put - CME 90-Day Eurodollar March Futures | | 94.750 | | 03/19/2007 | | 19 | | | 10 | | | 20 |
Put - CME 90-Day Eurodollar September Futures | | 95.000 | | 09/18/2006 | | 14 | | | 8 | | | 20 |
| | | | | | | | |
|
| |
|
|
| | | | | | | | | $ | 415 | | $ | 1,084 |
| | | | | | | | |
|
| |
|
|
| | | | | | | | | | | | | | | | | | | | |
| | | | | | | |
| Interest Rate Swaptions | | | | | | | | | | | | | | | | |
| Description | | Counterparty | | Floating Rate
Index | | Pay/Receive
Floating Rate | | Exercise
Rate | | Expiration
Date | | | | Notional
Amount | | Premium | | Value |
Put - OTC 1-Year Interest Rate Swap | | HSBC Bank USA | | 6-month GBP-LIBOR | | Pay | | 4.500% | | 12/20/2006 | | GBP | | 1,700 | | $ | 8 | | $ | 19 |
Call - OTC 5-Year Interest Rate Swap | | Bear Stearns & Co., Inc. | | 3-month USD-LIBOR | | Receive | | 5.210% | | 10/25/2006 | | $ | | 6,100 | | | 22 | | | 7 |
Call - OTC 5-Year Interest Rate Swap | | Bear Stearns & Co., Inc. | | 3-month USD-LIBOR | | Receive | | 5.040% | | 03/08/2007 | | | | 7,000 | | | 68 | | | 14 |
Call - OTC 5-Year Interest Rate Swap | | Citibank N.A. | | 3-month USD-LIBOR | | Receive | | 4.540% | | 10/04/2006 | | | | 2,100 | | | 25 | | | 0 |
Call - OTC 5-Year Interest Rate Swap | | Citibank N.A. | | 3-month USD-LIBOR | | Receive | | 4.850% | | 12/22/2006 | | | | 6,000 | | | 79 | | | 2 |
Call - OTC 5-Year Interest Rate Swap | | Goldman Sachs & Co. | | 3-month USD-LIBOR | | Receive | | 4.780% | | 08/07/2006 | | | | 8,000 | | | 65 | | | 0 |
Call - OTC 5-Year Interest Rate Swap | | Goldman Sachs & Co. | | 3-month USD-LIBOR | | Receive | | 5.210% | | 10/25/2006 | | | | 4,500 | | | 20 | | | 5 |
Call - OTC 5-Year Interest Rate Swap | | Merrill Lynch & Co., Inc. | | 3-month USD-LIBOR | | Receive | | 4.780% | | 08/08/2006 | | | | 3,000 | | | 28 | | | 0 |
Call - OTC 5-Year Interest Rate Swap | | Merrill Lynch & Co., Inc. | | 3-month USD-LIBOR | | Receive | | 4.540% | | 10/04/2006 | | | | 3,000 | | | 36 | | | 0 |
Call - OTC 5-Year Interest Rate Swap | | Royal Bank of Scotland PLC | | 3-month USD-LIBOR | | Receive | | 5.040% | | 03/08/2007 | | | | 3,000 | | | 33 | | | 6 |
Call - OTC 5-Year Interest Rate Swap | | Royal Bank of Scotland PLC | | 3-month USD-LIBOR | | Receive | | 5.220% | | 04/19/2007 | | | | 6,000 | | | 47 | | | 26 |
Call - OTC 5-Year Interest Rate Swap | | Royal Bank of Scotland PLC | | 3-month USD-LIBOR | | Receive | | 5.315% | | 05/09/2007 | | | | 14,700 | | | 152 | | | 87 |
Call - OTC 5-Year Interest Rate Swap | | Royal Bank of Scotland PLC | | 3-month USD-LIBOR | | Receive | | 5.340% | | 06/07/2007 | | | | 13,000 | | | 132 | | | 89 |
Call - OTC 5-Year Interest Rate Swap | | Wachovia Bank N.A. | | 3-month USD-LIBOR | | Receive | | 5.210% | | 10/25/2006 | | | | 2,200 | | | 9 | | | 2 |
Call - OTC 5-Year Interest Rate Swap | | Wachovia Bank N.A. | | 3-month USD-LIBOR | | Receive | | 5.240% | | 02/01/2007 | | | | 6,600 | | | 41 | | | 25 |
| | | | | | | | | | | | | | | | |
|
| |
|
|
| | | | | | | | | | | | | | | | | $ | 765 | | $ | 282 |
| | | | | | | | | | | | | | | | |
|
| |
|
|
| | | | |
| 12 | | PIMCO Variable Insurance Trust | | See Accompanying Notes |
| | |
| |
| | | June 30, 2006 (Unaudited) |
| | | | | | | | | | | | | | | | | | | | | | | |
| Straddle Options | | | | | | | | | | | | | | | | | | | | | | | |
| Description | | Counterparty | | | | Exercise Price* | | Expiration Date | | | | Notional
Amount | | Premium* | | Value | |
Call & Put - OTC U.S. dollar versus Japanese Yen
Forward Delta Neutral Straddle | | Goldman Sachs & Co. | | | | $ | 0.000 | | 08/23/2007 | | | | $ | 3,100 | | $ | 3 | | $ | (17 | ) |
Call & Put - OTC U.S. dollar versus Japanese Yen
Forward Delta Neutral Straddle | | J.P. Morgan Chase & Co. | | | | | 0.000 | | 08/23/2007 | | | | | 1,000 | | | 6 | | | (5 | ) |
| | | | | | | | | | | | | | | | | | |
|
| |
|
|
|
| | | | | | | | | | | | | | | | | | | $ | 9 | | $ | (22 | ) |
| | | | | | | | | | | | | | | | | | |
|
| |
|
|
|
| | | | |
| * Exercise price and final premium determined on a future final date, based upon implied volatility parameters. | | | | | | | | | | | | |
| | | | | | | | | | | | | | | | | |
(f) Forward foreign currency contracts outstanding on June 30, 2006: | | | | | |
| Type | | | | Principal
Amount
Covered by
Contract | | Settlement
Month | | Unrealized
Appreciation | | Unrealized
(Depreciation) | | | Net Unrealized
Appreciation/
(Depreciation) | |
Buy | | BRL | | 852 | | 07/2006 | | $ | 25 | | $ | 0 | | | $ | 25 | |
Sell | | | | 853 | | 07/2006 | | | 0 | | | (20 | ) | | | (20 | ) |
Buy | | | | 422 | | 09/2006 | | | 11 | | | 0 | | | | 11 | |
Buy | | CAD | | 1,897 | | 07/2006 | | | 0 | | | (20 | ) | | | (20 | ) |
Buy | | CLP | | 174,323 | | 07/2006 | | | 0 | | | (7 | ) | | | (7 | ) |
Sell | | | | 174,323 | | 07/2006 | | | 4 | | | 0 | | | | 4 | |
Buy | | | | 86,000 | | 08/2006 | | | 0 | | | (2 | ) | | | (2 | ) |
Buy | | | | 44,534 | | 09/2006 | | | 0 | | | 0 | | | | 0 | |
Buy | | CNY | | 4,059 | | 03/2007 | | | 0 | | | (4 | ) | | | (4 | ) |
Buy | | EUR | | 167 | | 07/2006 | | | 4 | | | 0 | | | | 4 | |
Sell | | | | 51,095 | | 07/2006 | | | 71 | | | (623 | ) | | | (552 | ) |
Sell | | | | 14,390 | | 08/2006 | | | 0 | | | (330 | ) | | | (330 | ) |
Sell | | | | 26,000 | | 09/2006 | | | 0 | | | (471 | ) | | | (471 | ) |
Buy | | GBP | | 537 | | 07/2006 | | | 4 | | | 0 | | | | 4 | |
Buy | | INR | | 12,200 | | 08/2006 | | | 0 | | | (7 | ) | | | (7 | ) |
Sell | | | | 7,230 | | 08/2006 | | | 3 | | | 0 | | | | 3 | |
Buy | | | | 2,596 | | 09/2006 | | | 0 | | | (1 | ) | | | (1 | ) |
Buy | | JPY | | 2,039,610 | | 08/2006 | | | 0 | | | (571 | ) | | | (571 | ) |
Buy | | KRW | | 144,129 | | 08/2006 | | | 3 | | | 0 | | | | 3 | |
Buy | | | | 611,190 | | 09/2006 | | | 16 | | | 0 | | | | 16 | |
Sell | | | | 369,284 | | 09/2006 | | | 0 | | | (10 | ) | | | (10 | ) |
Buy | | | | 843,255 | | 05/2007 | | | 0 | | | (2 | ) | | | (2 | ) |
Buy | | MXN | | 3,960 | | 08/2006 | | | 0 | | | (24 | ) | | | (24 | ) |
Sell | | | | 2,377 | | 08/2006 | | | 6 | | | 0 | | | | 6 | |
Buy | | | | 1,125 | | 09/2006 | | | 0 | | | (6 | ) | | | (6 | ) |
Buy | | PEN | | 1,616 | | 08/2006 | | | 10 | | | 0 | | | | 10 | |
Sell | | | | 1,616 | | 08/2006 | | | 0 | | | (19 | ) | | | (19 | ) |
Buy | | | | 141 | | 09/2006 | | | 1 | | | 0 | | | | 1 | |
Sell | | | | 141 | | 09/2006 | | | 0 | | | (2 | ) | | | (2 | ) |
Buy | | PLN | | 162 | | 09/2006 | | | 1 | | | 0 | | | | 1 | |
Buy | | | | 349 | | 11/2006 | | | 0 | | | (3 | ) | | | (3 | ) |
Buy | | RUB | | 11,341 | | 08/2006 | | | 20 | | | 0 | | | | 20 | |
Sell | | | | 6,780 | | 08/2006 | | | 0 | | | (8 | ) | | | (8 | ) |
Buy | | | | 3,058 | | 09/2006 | | | 4 | | | 0 | | | | 4 | |
Buy | | SGD | | 1,140 | | 08/2006 | | | 13 | | | (2 | ) | | | 11 | |
Sell | | | | 676 | | 08/2006 | | | 0 | | | (8 | ) | | | (8 | ) |
Buy | | | | 172 | | 09/2006 | | | 2 | | | 0 | | | | 2 | |
Buy | | SKK | | 13,910 | | 09/2006 | | | 13 | | | 0 | | | | 13 | |
Sell | | | | 6,644 | | 09/2006 | | | 0 | | | (6 | ) | | | (6 | ) |
Buy | | TWD | | 10,582 | | 08/2006 | | | 0 | | | (8 | ) | | | (8 | ) |
Sell | | | | 7,383 | | 08/2006 | | | 0 | | | 0 | | | | 0 | |
Buy | | | | 3,337 | | 09/2006 | | | 0 | | | (1 | ) | | | (1 | ) |
Buy | | ZAR | | 106 | | 08/2006 | | | 0 | | | (2 | ) | | | (2 | ) |
Sell | | | | 106 | | 08/2006 | | | 1 | | | 0 | | | | 1 | |
Buy | | | | 106 | | 10/2006 | | | 0 | | | (1 | ) | | | (1 | ) |
Buy | | | | 202 | | 11/2006 | | | 0 | | | (4 | ) | | | (4 | ) |
| | | | | | | | |
|
| |
|
|
| |
|
|
|
| | | | | | | | | $ | 212 | | $ | (2,162 | ) | | $ | (1,950 | ) |
| | | | | | | | |
|
| |
|
|
| |
|
|
|
(g) Exercise price and premium determined on a future date, based upon implied volatility parameters. | |
| | | | | | |
| See Accompanying Notes | | Semiannual Report | | June 30, 2006 | | 13 |
Notes to Financial Statements
1. ORGANIZATION
The Low Duration Portfolio (the “Portfolio”) is a series of the PIMCO Variable Insurance Trust (the “Trust”). The Trust is registered under the Investment Company Act of 1940 (the “Act”), as amended, as an open-end investment management company organized as a Delaware business trust on October 3, 1997. The Portfolio offers three classes of shares: Institutional, Administrative and Advisor. Information presented in these financial statements pertains to the Institutional Class of the Portfolio. Certain detailed financial information for the Administrative Class and Advisor Class is provided separately and is available upon request. The Trust is designed to be used as an investment vehicle by Separate Accounts of insurance companies that fund variable annuity contracts and variable life insurance policies and by qualified pension and retirement plans.
2. SIGNIFICANT ACCOUNTING POLICIES
The following is a summary of significant accounting policies consistently followed by the Portfolio in the preparation of its financial statements in conformity with accounting principles generally accepted in the United States of America (“GAAP”). The preparation of financial statements in accordance with GAAP requires management to make estimates and assumptions that affect the reported amounts and disclosures in the financial statements. Actual results could differ from those estimates.
Security Valuation. Portfolio securities are valued as of the close of regular trading (normally 4:00 p.m., Eastern Time) on each day that the New York Stock Exchange (“NYSE”) is open. Portfolio securities and other assets for which market quotes are readily available are stated at market value. Market value is generally determined on the basis of last reported sales prices, or if no sales are reported, based on quotes obtained from a quotation reporting system, established market makers, or pricing services. Fixed-income securities and non-exchange traded derivatives are normally valued on the basis of quotes obtained from brokers and dealers or pricing services. Prices obtained from independent pricing services use information provided by market makers or estimates of market values obtained from yield data relating to investments or securities with similar characteristics. Certain fixed-income securities purchased on a delayed-delivery basis are marked to market daily until settlement at the forward settlement date. Short-term investments having a maturity of 60 days or less are generally valued at amortized cost. Exchange traded options, futures and options on futures are valued at the settlement price determined by the relevant exchange.
Investments initially valued in currencies other than the U.S. dollar are converted to the U.S. dollar using exchange rates obtained from pricing services. As a result, the NAV of the Portfolio’s shares may be affected by changes in the value of currencies in relation to the U.S. dollar. The value of securities traded in markets outside the United States or denominated in currencies other than the U.S. dollar may be affected significantly on a day that the NYSE is closed and an investor is not able to purchase, redeem or exchange shares.
Securities and other assets for which market quotes are not readily available are valued at fair value as determined in good faith by the Board of Trustees or persons acting at their direction. The Board of Trustees has adopted methods for valuing securities and other assets in circumstances where market quotes are not readily available, and has delegated to Pacific Investment Management Company LLC (“PIMCO”) the responsibility for applying the valuation methods. In the event that market quotes are not readily available, and the security or asset cannot be valued pursuant to one of the valuation methods, the value of the security or asset will be determined in good faith by the Valuation Committee of the Board of Trustees, generally based upon recommendations provided by PIMCO.
Market quotes are considered not readily available in circumstances where there is an absence of current or reliable market-based data (e.g., trade information, bid/asked information, broker quotes), including where events occur after the close of the relevant market, but prior to the close of regular trading, that materially affect the values of the Portfolio’s securities or assets. In addition, market quotes are considered not readily available when, due to extraordinary circumstances, the exchanges or markets on which the securities trade do not open for trading for the entire day and no other market prices are available. The Board has delegated to PIMCO the responsibility for monitoring significant events that may materially affect the values of the Portfolio’s securities or assets and for determining whether the value of the applicable securities or assets should be re-evaluated in light of such significant events when the Portfolio uses fair value pricing to determine its NAV, securities will not be priced on the basis of quotations from the primary market in which they are traded, but rather may be priced by another method that the Board of Trustees or persons acting at their direction believe accurately reflects fair value. The Trust’s policy is intended to result in a calculation of the Portfolio’s NAV that fairly reflects security values as of the time of pricing. However, fair values determined by the Board of Trustees or persons acting at their direction may not accurately reflect the price that the Portfolio could obtain for a security if it were to dispose of that security as of the time of pricing. Because foreign securities can trade on non-business days, the NAV of the Portfolio may change on days when shareholders will not be able to purchase or redeem shares. The prices used by the Portfolio may differ from the value that would be realized if the securities were sold and the differences could be material to the financial statements.
Securities Transactions and Investment Income. Securities transactions are recorded as of the trade date. Securities purchased or sold on a when-issued or delayed-delivery basis may be settled a month or more after the trade date. Realized gains and losses from securities sold are recorded on the identified cost basis. Dividend income is recorded on the ex-dividend date, except certain dividends from foreign securities where the ex-dividend date may have passed, which are recorded as soon as the Portfolio is informed of the ex-dividend date. Interest income, adjusted for the accretion of discounts and amortization of premiums, is recorded on the accrual basis. Paydown gains and losses on mortgage-related or asset-backed securities are recorded as components of interest income in the Statement of Operations.
Dividends and Distributions to Shareholders. Dividends from net investment income, if any, are declared on each day the Portfolio is open for business and are distributed to shareholders monthly. Net realized capital gains earned by the Portfolio, if any, will be distributed no less frequently than once each year. Most shareholders choose to reinvest their dividends and capital gain distribution in additional shares of the Portfolio.
Income dividends and capital gain distributions are determined in accordance with income tax regulations which may differ from GAAP. Differences between tax regulations and GAAP may change the fiscal year when income and capital items are recognized for tax and GAAP purposes. Examples of events that give rise to timing differences include wash sales, straddles, net operating losses and capital loss carryforwards. Further, the character of investment income and capital gains may be different for certain transactions under the two methods of accounting. Examples of characterization differences include the treatment of mortgage paydowns, swaps, foreign currency transactions and contingent debt instruments. As a result, income dividends and capital gain distributions declared during a fiscal period may differ significantly from the net investment income and realized capital gain reported in the Portfolio’s annual financial statements presented under GAAP.
Distributions classified as a tax basis return of capital, if any, are reflected in the accompanying Statements of Changes in Net Assets and have been reclassified to
| | | | |
| 14 | | PIMCO Variable Insurance Trust | | |
| | |
| |
| | | June 30, 2006 (Unaudited) |
paid in capital. In addition, other amounts have been reclassified between undistributed net investment income, accumulated undistributed net realized gains or losses and/or paid in capital to more appropriately conform financial accounting to tax characterizations of dividend distributions.
Multiclass Operations. Each class offered by the Portfolio has equal rights as to assets and voting privileges (except that shareholders of a class have exclusive voting rights regarding any matter relating solely to that class of shares). Income and non-class specific expenses of the Portfolio are allocated daily to each class of shares based on the relative value of settled shares. Realized and unrealized capital gains and losses of the Portfolio are allocated daily to each class of shares based on the relative net assets of each class. Class specific expenses, where applicable, currently include administrative, distribution and servicing fees.
Federal Income Taxes. The Portfolio intends to qualify as a regulated investment company under sub-chapter M of the Internal Revenue Code and distribute all of its taxable income and net realized gains, if applicable, to shareholders. Accordingly, no provision for Federal income taxes has been made.
Foreign Currency. The accounting records of the Portfolio are maintained in U.S. dollar. The market values of foreign securities, currency holdings and other assets and liabilities are translated into U.S. dollar based on the current exchange rates each business day. Fluctuations in the value of currency holdings and other assets and liabilities resulting from changes in exchange rates are recorded as unrealized foreign currency gains or losses. Realized gains or losses and unrealized appreciation or depreciation on investment securities and income and expenses are translated on the respective dates of such transactions. The effects of changes in foreign currency exchange rates on investments in securities are not segregated in the Statement of Operations from the effects of changes in market prices of those securities, but are included with the net realized and unrealized gain or loss on investment securities.
| | | | | | |
|
| Non-U.S. currency symbols utilized throughout the report are defined as follows: |
| BRL | | Brazilian Real | | MXN | | Mexican Peso |
| CAD | | Canadian Dollar | | PEN | | Peruvian New Sol |
| CLP | | Chilean Peso | | PLN | | Polish Zloty |
| CNY | | Chinese Yuan Renminbi | | RUB | | Russian Ruble |
| EUR | | Euro | | SGD | | Singapore Dollar |
| GBP | | British Pound | | SKK | | Slovakian Koruna |
| INR | | Indian Rupee | | TWD | | Taiwan Dollar |
| JPY | | Japanese Yen | | ZAR | | South African Rand |
| KRW | | South Korean Won | | | | |
Forward Currency Transactions. The Portfolio may enter into forward currency contracts in connection with settling planned purchases or sales of securities, to hedge the currency exposure associated with some or all of the Portfolio’s securities or as a part of an investment strategy. A forward currency contract is an agreement between two parties to buy and sell a currency at a set price on a future date. The market value of a forward currency contract fluctuates with changes in forward currency exchange rates. Forward currency contracts are marked to market daily and the change in value is recorded by the Portfolio as an unrealized gain or loss. Realized gains or losses equal to the difference between the value of the contract at the time it was opened and the value at the time it was closed are recorded upon delivery or receipt of the currency or, if a forward currency contract is offset by entering into another forward currency contract with the same broker, upon settlement of the net gain or loss. These contracts may involve market risk in excess of the unrealized gain or loss reflected in the Portfolio’s Statement of Assets and Liabilities. In addition, the Portfolio could be exposed to risk if the counterparties are unable to meet the terms of the contracts or if the value of the currency changes unfavorably to the U.S. dollar.
Futures Contracts. The Portfolio is authorized to enter into futures contracts. The Portfolio may use futures contracts to manage its exposure to the securities markets or to movements in interest rates and currency values. The primary risks associated with the use of futures contracts are the imperfect correlation between the change in market value of the securities held by the Portfolio and the prices of futures contracts, the possibility of an illiquid market, and the inability of the counterparty to meet the terms of the contract. Futures contracts are valued based upon their quoted daily settlement prices. Upon entering into a futures contract, the Portfolio is required to deposit with its custodian, in a segregated account in the name of the futures broker, an amount of cash or U.S. Government and Agency Obligations in accordance with the initial margin requirements of the broker or exchange. Futures contracts are marked to market daily and an appropriate payable or receivable for the change in value (“variation margin”) is recorded by the Portfolio. Gains or losses are recognized but not considered realized until the contracts expire or are closed. Futures contracts involve, to varying degrees, risk of loss in excess of the variation margin disclosed in the Statement of Assets and Liabilities.
Options Contracts. The Portfolio may write call and put options on futures, swaps, securities or currencies it owns or in which it may invest. Writing put options tends to increase the Portfolio’s exposure to the underlying instrument. Writing call options tends to decrease the Portfolio’s exposure to the underlying instrument. When the Portfolio writes a call or put option, an amount equal to the premium received is recorded as a liability and subsequently marked to market to reflect the current value of the option written. These liabilities are reflected as written options outstanding in the Statement of Assets and Liabilities. Certain options may be written with premiums to determined on a future date. The premiums for these options are based upon implied volatility parameters at specified terms. Premiums received from writing options which expire are treated as realized gains. Premiums received from writing options which are exercised or closed are added to the proceeds or offset against amounts paid on the underlying future, swap, security or currency transaction to determine the realized gain or loss. The Portfolio as a writer of an option has no control over whether the underlying future, swap, security or currency may be sold (call) or purchased (put) and as a result bears the market risk of an unfavorable change in the price of the future, swap, security or currency underlying the written option. There is the risk the Portfolio may not be able to enter into a closing transaction because of an illiquid market.
The Portfolio may also purchase put and call options. Purchasing call options tends to increase the Portfolio’s exposure to the underlying instrument. Purchasing put options tends to decrease the Portfolio’s exposure to the underlying instrument. The Portfolio pays a premium which is included in the Portfolio’s Statement of Assets and Liabilities as an investment and subsequently marked to market to reflect the current value of the option. Premiums paid for purchasing options which expire are treated as realized losses. Certain options may be purchased with premiums to be determined on a future date. The premiums for these options are based upon implied volatility parameters at specified terms. The risk associated with purchasing put and call options is limited to the premium paid. Premiums paid for purchasing options which are exercised or closed are added to the amounts paid or offset against the proceeds on the underlying future, swap, security or currency transaction to determine the realized gain or loss.
Repurchase Agreements. The Portfolio may engage in repurchase transactions. Under the terms of a typical repurchase agreement, the Portfolio takes possession of an underlying debt obligation subject to an obligation of the seller to repurchase, and the Portfolio to resell, the obligation at an agreed-upon price and
| | | | | | |
| | | Semiannual Report | | June 30, 2006 | | 15 |
Notes to Financial Statements (Cont.)
time. The market value of the collateral must be equal to or exceed at all times the total amount of the repurchase obligations, including interest. Securities purchased under repurchase agreements are reflected as an asset in the Statement of Assets and Liabilities. Generally, in the event of counterparty default, the Portfolio has the right to use the collateral to offset losses incurred. If the counterparty should default, the Portfolio will seek to sell the securities which it holds as collateral. This could involve procedural costs or delays in addition to a loss on the securities if their value should fall below their repurchase price.
Mortgage-Related and Other Asset-Backed Securities. The Portfolio may invest in mortgage-related or other asset-backed securities. These securities include mortgage pass-through securities, collateralized mortgage obligations (“CMOs”), commercial mortgage-backed securities, mortgage dollar rolls, CMO residuals, stripped mortgage-backed securities (“SMBSs”) and other securities that directly or indirectly represent a participation in, or are secured by and payable from, mortgage loans on real property. The value of some mortgage- or asset-backed securities may be particularly sensitive to changes in prevailing interest rates. Early repayment of principal on some mortgage-related securities may expose a Portfolio to a lower rate of return upon reinvestment of principal. The value of these securities may fluctuate in response to the market’s perception of the creditworthiness of the issuers. Additionally, although mortgages and mortgage-related securities are generally supported by some form of government or private guarantee and/or insurance, there is no assurance that private guarantors or insurers will meet their obligations.
Swap Agreements. The Portfolio may engage in swap transactions, including, but not limited to, swap agreements on interest rate and credit default to manage its exposure to interest rates and credit risk. In connection with these agreements, securities may be identified as collateral in accordance with the terms of the respective swap agreements.
Interest rate swap agreements involve the exchange by the Portfolio with another party of their respective commitments to pay or receive interest, e.g., an exchange of floating rate payments for fixed rate payments with respect to the notional amount of principal.
Credit default swap agreements involve one party making a stream of payments to another party in exchange for the right to receive a specified return in the event of a default by a third party, typically corporate issues or sovereign issues of an emerging country, on its obligation. The Portfolio may use credit default swaps to provide a measure of protection against defaults of the issuers (i.e., to reduce risk where the Portfolio owns or has exposure to the sovereign issuer) or to take an active long or short position with respect to the likelihood of a particular issuer’s default. As a seller of protection, the Portfolio generally receives an upfront payment or a fixed rate of income throughout the term of the swap provided that there is no credit event. If the Portfolio is a seller of protection and a credit event occurs, as defined under the terms of that particular swap agreement, the Portfolio will pay to the buyer of the protection an amount up to the notional value of the swap and in certain instances take delivery of the security. As the seller, the Portfolio would effectively add leverage to its portfolio because, in addition to its total net assets, the Portfolio would be subject to investment exposure on the notional amount of the swap. As a buyer of protection, the Portfolio generally receives an amount up to the notional value of the swap if a credit event occurs. The treatment of credit default swaps and other swap agreements that provide for contingent, non-periodic, bullet-type payments as “notional principal contracts” for federal income tax purposes is uncertain. Were the Internal Revenue Service to take the position that a credit default swap or other bullet-type swap is not a “notional principal contract” for federal income tax purposes, payments received by the Portfolio from such investments might be subject to income taxes.
Swaps are marked to market daily based upon quotations from market makers and the change in value, if any, is recorded as unrealized gain or loss in the Statement of Operations. Payments received or made at the beginning of the measurement period are reflected as such in the Statement of Assets and Liabilities. These upfront payments are recorded as realized gain or loss in the Statement of Operations upon termination or maturity of the swap. A liquidation payment received or made at the termination of the swap is recorded as realized gain or loss in the Statement of Operations. Net periodic payments received or paid by the Portfolio are included as part of realized gain or loss in the Statement of Operations. Entering into these agreements involves, to varying degrees, elements of credit, market and documentation risk in excess of the amounts recognized in the Statement of Assets and Liabilities. Such risks involve the possibility that there will be no liquid market for these agreements, that the counterparty to the agreements may default on its obligation to perform or disagree as to the meaning of contractual terms in the agreements and that there may be unfavorable changes in interest rates.
U.S. Government Agencies or Government-Sponsored Enterprises. Securities issued by U.S. Government agencies or government-sponsored enterprises may not be guaranteed by the U.S. Treasury. The Government National Mortgage Association (“GNMA”), a wholly owned U.S. Government corporation, is authorized to guarantee, with the full faith and credit of the U.S. Government, the timely payment of principal and interest on securities issued by institutions approved by GNMA and backed by pools of mortgages insured by the Federal Housing Administration or guaranteed by the Department of Veterans Affairs. Government-related guarantors (i.e., not backed by the full faith and credit of the U.S. Government) include the Federal National Mortgage Association (“FNMA” or “Fannie Mae”) and the Federal Home Loan Mortgage Corporation (“FHLMC” or “Freddie Mac”). Pass-through securities issued by FNMA are guaranteed as to timely payment of principal and interest by FNMA but are not backed by the full faith and credit of the U.S. Government. FHLMC guarantees the timely payment of interest and ultimate collection of principal, but its participation certificates are not backed by the full faith and credit of the U.S. Government.
Guarantees and Indemnifications. Under the Trust’s organizational documents, each Trustee, officer, employee or other agent of the Trust (including the Trust’s investment manager) is indemnified against certain liabilities that may arise out of performance of their duties to the Portfolio. Additionally, in the normal course of business, the Portfolio enters into contracts that contain a variety of indemnification clauses. The Portfolio’s maximum exposure under these arrangements is unknown as this would involve future claims that may be made against the Portfolio that have not yet occurred. However, the Portfolio has not had prior claims or losses pursuant to these contracts, and believes the risk of loss to be remote.
New Accounting Policies. In July 2006, the Financial Accounting Standards Board issued Interpretation No. 48, “Accounting for Uncertainty in Income Taxes—an Interpretation of FASB Statement No. 109” (the “Interpretation”). The Interpretation is effective for fiscal years beginning after December 15, 2006. Management is currently evaluating the application of the Interpretation to the Portfolio and will provide additional information in relation to the Interpretation in the Portfolio’s annual financial statements for the year ending December 31, 2006.
3. FEES, EXPENSES, AND RELATED PARTY TRANSACTIONS
Investment Advisory Fee. PIMCO is a majority-owned subsidiary of Allianz Global Investors of America L.P. (“AGI”), and serves as investment adviser (the “Adviser”) to the Trust, pursuant to an investment advisory contract. The Adviser receives a monthly fee at an annual rate based on average daily net assets of the Portfolio. The Advisory Fee is charged at an annual rate of 0.25%.
| | | | |
| 16 | | PIMCO Variable Insurance Trust | | |
| | |
| |
| | | June 30, 2006 (Unaudited) |
Administration Fee. PIMCO serves as administrator (the “Administrator”), and provides administrative services to the Trust for which it receives a monthly administrative fee based on average daily net assets of the Portfolio. As the Administrator, PIMCO bears the costs of various third-party services, including audit, custodial, portfolio accounting, legal, transfer agency and printing costs. The Administration Fee is charged at the annual rate of 0.25%.
Distribution and Servicing Fees. Allianz Global Investors Distributors LLC (“AGID”) is an indirect wholly-owned subsidiary of AGI and serves as the distributor of the Trust’s shares. The Trust is permitted to reimburse AGID on a quarterly basis, out of the Administrative Class assets of the Portfolio in the amount of 0.15% on an annual basis of the average daily net assets of that class, for payments made to financial intermediaries that provide services in connection with the distribution of shares or administration of plans or programs that use Portfolio shares as their funding medium. The effective rate paid to AGID was 0.15% during the current fiscal year.
Expenses. The Trust is responsible for the following expenses: (i) salaries and other compensation of any of the Trust’s executive officers and employees who are not officers, directors, stockholders or employees of PIMCO or its subsidiaries or affiliates; (ii) taxes and governmental fees; (iii) brokerage fees and commissions and other portfolio transaction expenses; (iv) the costs of borrowing money, including interest expenses and bank overdraft charges; (v) fees and expenses of the Trustees who are not “interested persons” of PIMCO or the Trust, and any counsel retained exclusively for their benefit; (vi) extraordinary expenses, including costs of litigation and indemnification expenses; (vii) organization expenses and (viii) any expenses allocated or allocable to a specific class of shares, which include service fees payable with respect to the Administrative Class shares and may include certain other expenses as permitted by the Trust’s Multiple Class Plan adopted pursuant to Rule 18f-3 under the Act and subject to review and approval by the Trustees. The ratio of expenses to average net assets per share class, as disclosed in the Financial Highlights, may differ from the annual portfolio operating expenses per share class as disclosed in the Prospectus for the reasons set forth above.
For the current period ended June 30, 2006, each unaffiliated Trustee received an annual retainer of $15,000, plus $2,000 for each Board of Trustees quarterly meeting attended, $500 for each Board of Trustees committee meeting attended and $500 for each special board meeting attended, plus reimbursement of related expenses. In addition, each Committee Chair received an additional annual retainer of $500 and each Audit Committee Chair received an additional annual retainer of $1,500. These expenses are allocated on a pro-rata basis to each Portfolio of the Trust according to its respective net assets. The Trust pays no compensation directly to any Trustee or any other officer who is affiliated with the Administrator, all of whom receive remuneration for their services to the Trust from the Administrator or its affiliates.
4. PURCHASES AND SALES OF SECURITIES
The length of time the Portfolio has held a particular security is not generally a consideration in investment decisions. A change in the securities held by the Portfolio is known as “portfolio turnover”. The Portfolio may engage in frequent and active trading of portfolio securities to achieve its investment objective, particularly during periods of volatile market movements. High portfolio turnover (e.g., over 100%) involves correspondingly greater expenses to the Portfolio, including brokerage commissions or dealer mark-ups and other transaction costs on the sale of securities and reinvestments in other securities. Such sales may also result in realization of taxable capital gains, including short-term capital gains (which are generally taxed at ordinary income tax rates). The trading costs and tax effects associated with portfolio turnover may adversely affect the Portfolio’s performance.
Purchases and sales of securities (excluding short-term investments) for the period ended June 30, 2006 were as follows (amounts in thousands):
| | | | | | | | | | | | | | | | |
| | U.S Government/Agency | | | | | All Other |
| | Purchases | | | | | Sales | | | | | Purchases | | | | | Sales |
| $ | 478,547 | | | | $ | 426,544 | | | | $ | 66,669 | | | | $ | 27,434 |
5. TRANSACTIONS IN WRITTEN CALL AND PUT OPTIONS
Transactions in written call and put options were as follows (amounts in thousands, except number of contracts):
| | | | | | | | | | | | | | | | | | | | | | | |
| | | | | # of
Contracts |
| | | |
| Notional
Amount
in $ |
| | | |
| Notional
Amount
in GBP |
| | | | | Premium | |
Balance at 12/31/2005 | | | | 460 | | | | | $ | 56,300 | | | | | GBP | 2,200 | | | | | $ | 868 | |
Sales | | | | 358 | | | | | | 75,100 | | | | | | 0 | | | | | | 664 | |
Closing Buys | | | | (208 | ) | | | | | (32,700 | ) | | | | | 0 | | | | | | (271 | ) |
Expirations | | | | (17 | ) | | | | | (9,400 | ) | | | | | (500 | ) | | | | | (72 | ) |
Exercised | | | | 0 | | | | | | 0 | | | | | | 0 | | | | | | 0 | |
Balance at 06/30/2006 | | | | 593 | | | | | $ | 89,300 | | | | | GBP | 1,700 | | | | | $ | 1,189 | |
6. SHARES OF BENEFICIAL INTEREST
The Portfolio may issue an unlimited number of shares of beneficial interest with a $0.001 par value. Changes in shares of beneficial interest were as follows (shares and amounts in thousands):
| | | | | | | | | | | | | | | | | | |
| | | | | Six Months Ended
06/30/2006 | | | | | Year Ended
12/31/2005 | |
| | | | | Shares | | | Amount | | | | | Shares | | | Amount | |
| | | | | | |
Receipts for shares sold | | | | | | | | | | | | | | | | | | |
Institutional Class | | | | 996 | | | $ | 10,012 | | | | | 1,021 | | | $ | 10,460 | |
Administrative Class | | | | 18,333 | | | | 184,037 | | | | | 23,493 | | | | 239,555 | |
Advisor Class | | | | 1 | | | | 10 | | | | | 0 | | | | 0 | |
Issued as reinvestment of distributions | | | | | | | | | | | | | | | | | | |
Institutional Class | | | | 47 | | | | 467 | | | | | 55 | | | | 561 | |
Administrative Class | | | | 1,045 | | | | 10,471 | | | | | 1,136 | | | | 11,545 | |
Advisor Class | | | | 0 | | | | 0 | | | | | 0 | | | | 0 | |
Cost of shares redeemed | | | | | | | | | | | | | | | | | | |
Institutional Class | | | | (279 | ) | | | (2,796 | ) | | | | (473 | ) | | | (4,836 | ) |
Administrative Class | | | | (5,023 | ) | | | (50,338 | ) | | | | (6,536 | ) | | | (66,805 | ) |
Advisor Class | | | | 0 | | | | 0 | | | | | 0 | | | | 0 | |
Net increase resulting from Portfolio share transactions | | | | 15,120 | | | $ | 151,863 | | | | | 18,696 | | | $ | 190,480 | |
The following schedule shows the number of shareholders each owning 5% or more of the Portfolio and the total percentage of the Portfolio held by such shareholders:
| | | | | | |
| | | | | Number of
Shareholders | | % of Portfolio Held |
Institutional Class | | | | 2 | | 100 |
Administrative Class | | | | 2 | | 63 |
Advisor Class | | | | 1 | | 100 |
| | | | | | |
| | | Semiannual Report | | June 30, 2006 | | 17 |
Notes to Financial Statements (Cont.)
7. FEDERAL INCOME TAX MATTERS
As of June 30, 2006, the aggregate cost of investments was the same for federal income tax and financial statement purposes. The net unrealized appreciation (depreciation) of investment securities for federal income tax purposes is as follows (amounts in thousands):
| | | | |
Aggregate
Gross
Unrealized
Appreciation | | Aggregate
Gross
Unrealized
(Depreciation) | | Net
Unrealized
Appreciation |
$ 4,322 | | $ (3,943) | | $ 379 |
8. REGULATORY AND LITIGATION MATTERS
On June 1, 2004, the Attorney General of the State of New Jersey announced that it had dismissed PIMCO from a complaint filed by the New Jersey Attorney General on February 17, 2004, and that it had entered into a settlement agreement (the “New Jersey Settlement”) with Allianz Global Investors of America L.P. (“AGI”) (formerly known as Allianz Dresdner Asset Management of America L.P.), PEA Capital LLC (an entity affiliated with PIMCO through common ownership) (“PEA”) and Allianz Global Investors Distributors LLC (“AGID”), in connection with the same matter. In the New Jersey Settlement, AGI, PEA and AGID neither admitted nor denied the allegations or conclusions of law, but did agree to pay New Jersey a civil fine of $15 million and $3 million for investigative costs and further potential enforcement initiatives against unrelated parties. They also undertook to implement certain governance changes. The complaint relating to the New Jersey Settlement alleged, among other things, that AGI, PEA and AGID had failed to disclose that they improperly allowed certain hedge funds to engage in “market timing” in certain funds. The complaint sought injunctive relief, civil monetary penalties, restitution and disgorgement of profits.
Since February 2004, PIMCO, AGI, PEA, AGID, and certain of their affiliates, including the PIMCO Funds, the Allianz Funds (formerly known as PIMCO Funds: Multi-Manager Series), and the Trustees and employees of the PIMCO Funds, have been named as defendants in fifteen lawsuits filed in various jurisdictions. Eleven of those lawsuits concern “market timing,” and they have been transferred to and consolidated for pre-trial proceedings in a multi-district litigation proceeding in the U.S. District Court for the District of Maryland; the other four lawsuits concern “revenue sharing” and have been consolidated into a single action in the U.S. District Court for the District of Connecticut. The lawsuits have been commenced as putative class actions on behalf of investors who purchased, held or redeemed shares of the various series of the PIMCO Funds and the Allianz Funds during specified periods, or as derivative actions on behalf of the PIMCO Funds and Allianz Funds.
The market timing actions in the District of Maryland generally allege that certain hedge funds were allowed to engage in “market timing” in certain of the PIMCO Funds and the Allianz Funds and this alleged activity was not disclosed. Pursuant to tolling agreements entered into with the derivative and class action plaintiffs, PIMCO, the Trustees, and certain employees of PIMCO who were previously named as defendants have all been dropped as defendants in the market timing actions; the plaintiffs continue to assert claims on behalf of the shareholders of the PIMCO Funds or on behalf of the PIMCO Funds themselves against other defendants. By order dated November 3, 2005, the U.S. District Court for the District of Maryland granted the PIMCO Funds’ motion to dismiss claims asserted against it in a consolidated amended complaint where the PIMCO Funds were named, in the complaint, as a nominal defendant. The revenue sharing action in the District of Connecticut generally alleges that fund assets were inappropriately used to pay brokers to promote the PIMCO Funds and Allianz Funds, including directing fund brokerage transactions to such brokers, and that such alleged arrangements were not fully disclosed to shareholders. On August 11, 2005 the U.S. District Court for the District of Connecticut conducted a hearing on defendants’ motion to dismiss the consolidated amended complaint in the revenue sharing action but has not yet ruled on the motion to dismiss. The market timing and revenue sharing lawsuits seek, among other things, unspecified compensatory damages plus interest and, in some cases, punitive damages, the rescission of investment advisory contracts, the return of fees paid under those contracts and restitution.
Under Section 9(a) of the Investment Company Act of 1940, as amended (“1940 Act”), if the New Jersey Settlement or any of the lawsuits described above were to result in a court injunction against AGI, PEA, AGID and/or their affiliates, PIMCO could, in the absence of exemptive relief granted by the SEC, be barred from serving as an investment adviser, and AGID could be barred from serving as principal underwriter, to any registered investment company, including the Portfolios of the Trust. In connection with an inquiry from the SEC concerning the status of the New Jersey Settlement under Section 9(a), PEA, AGID, AGI and certain of their affiliates (including PIMCO) (together, the “Applicants”) have sought exemptive relief from the SEC under Section 9(c) of the 1940 Act. The SEC has granted the Applicants a temporary exemption from the provisions of Section 9(a) with respect to the New Jersey Settlement until the earlier of (i) September 13, 2006 and (ii) the date on which the SEC takes final action on their application for a permanent order. There is no assurance that the SEC will issue a permanent order.
Two nearly identical class action civil complaints have been filed in August 2005, in the Northern District of Illinois Eastern Division alleging that the plaintiffs each purchased and sold a 10-year Treasury note futures contract and suffered damages from an alleged shortage when PIMCO held both physical and futures positions in 10-year Treasury notes for its client accounts. The two actions have been consolidated into one action, and the two separate complaints have been replaced by a consolidated complaint. PIMCO is a named defendant, and the PIMCO Funds have been added as a defendant, to the consolidated action. PIMCO strongly believes the complaint (and any consolidated complaint filed hereafter) is without merit and intends to vigorously defend itself.
Certain Portfolios of the Trust were recently served in an adversary proceeding brought by the Official Committee of Asbestos Claimants of G-I Holdings, Inc. in G-I Holdings, Inc.’s bankruptcy in the District of New Jersey. PIMCO was previously named in this lawsuit and remains a defendant. The plaintiff seeks to recover for the bankruptcy estate assets that were transferred by the predecessor entity of G-I Holdings, Inc. to a wholly-owned subsidiary in 1994. The subsidiary has since issued notes, of which certain Portfolios of the Trust are alleged to be holders. The complaint alleges that in 2000, more than two hundred noteholders—including certain Portfolios of the Trust—were granted a second priority lien on the assets of the subsidiary in exchange for their consent to a refinancing transaction and the granting of a first priority lien to the lending banks. The plaintiff is seeking invalidation of the lien in favor of the noteholders and/or the value of the lien.
It is possible that these matters and/or other developments resulting from these matters could result in increased fund redemptions or other adverse consequences to the Portfolios. However, PIMCO and AGID believe that these matters are not likely to have a material adverse effect on the Portfolios or on PIMCO’s or AGID’s ability to perform their respective investment advisory or distribution services relating to the Portfolios.
| | | | |
| 18 | | PIMCO Variable Insurance Trust | | |
Investment Adviser and Administrator
Pacific Investment Management Company LLC
840 Newport Center Drive
Newport Beach, California 92660
Distributor
Allianz Global Investors Distributors LLC
2187 Atlantic Street
Stamford, Connecticut 06902
Custodian
State Street Bank & Trust Company
801 Pennsylvania
Kansas City, Missouri 64105
Transfer Agent
Boston Financial Data Services–Midwest
330 W. 9th Street
Kansas City, Missouri 64105
Legal Counsel
Dechert LLP
1775 I Street, N.W.
Washington, D.C. 20006
Independent Registered Public Accounting Firm
PricewaterhouseCoopers LLP
1055 Broadway
Kansas City, Missouri 64105
P I M C O

Share Class Administrative
Semiannual Report June 30, 2006
PIMCO Variable Insurance Trust
Money Market Portfolio
Table of Contents
This material is authorized for use only when preceded or accompanied by the current PIMCO Variable Insurance Trust (the “Trust”) prospectus. Investors should consider the investment objectives, risks, charges and expenses of this Trust carefully before investing. Ask your financial professional to explain all charges that may apply. This and other information is contained in the Trust’s prospectus. The variable product prospectus may be obtained by contacting your Investment Consultant. Please read the Trust and variable product prospectus carefully before you invest or send money.
Chairman’s Letter
Dear PIMCO Variable Insurance Trust Shareholder:
It is our pleasure to present to you the semiannual report for the PIMCO Variable Insurance Trust covering the six-month period ended June 30, 2006.
Highlights of the global bond markets during the six-month period included:
| | n | | Most fixed-income sectors lost ground during the first half of 2006, as concern about accelerating inflation and central bank tightening pushed interest rates higher worldwide. The benchmark Lehman Brothers Aggregate Bond Index (which includes Treasury, Investment-Grade Corporate, and Residential Mortgage-Backed Securities) returned -0.72% for the first six months of the year. On June 30, the benchmark ten-year Treasury yielded 5.14%, 0.75% higher than at the start of the year. The U.S. yield curve remained flat as shorter-maturity yields rose by a comparable amount. |
| | n | | The Federal Reserve tightened four times during the reporting period, bringing the Federal Funds Rate to 5.25%. The increase near the end of the period was the Federal Reserve’s 17th consecutive rate hike since the start of its tightening cycle in 2004. The Federal Reserve was not alone, as central banks in Europe, India, and China tightened credit in unison for the first time since 2000. The Bank of Japan, whose zero-interest-rate policy has flooded global markets with liquidity, looked set to reverse this policy in the coming months. |
In these pages please find a more complete Portfolio review as it relates to financial-market activities, as well as details about total-return investment performance for the six-month reporting period. Thank you for the trust you have placed in us. We will continue to work diligently to meet your investment needs.
Sincerely,
Brent R. Harris
Chairman, PIMCO Variable Insurance Trust
July 31, 2006
| | | | | | |
| | | Semiannual Report | | June 30, 2006 | | 1 |
Important Information About the Portfolio
PIMCO Variable Insurance Trust (the “Trust”) is an open-end management investment company currently consisting of nineteen separate investment portfolios, including the Money Market Portfolio (the “Portfolio”). The Portfolio is only available as a funding vehicle under variable life insurance policies or variable annuity contracts issued by insurance companies (“Variable Contracts”). Individuals may not purchase shares of the Portfolio directly. Shares of the Portfolio also may be sold to qualified pension and retirement plans outside of the separate account context.
We believe that bond funds have an important role to play in a well diversified investment portfolio. It is important to note, however, that in an environment where interest rates may trend upward, rising rates would negatively impact the performance of most bond funds, and fixed-income securities held by a fund are likely to decrease in value. The price volatility of fixed-income securities can also increase during periods of rising interest rates resulting in increased losses to a fund. Bond funds and individual bonds with a longer duration (a measure of the expected life of a security) tend to be more sensitive to changes in interest rates, usually making them more volatile than securities or funds with shorter durations. The longer-term performance of most bond funds has benefited from capital gains in part resulting from an extended period of declining interest rates. In the event interest rates increase, these capital gains should not be expected to recur.
The Portfolio may be subject to various risks in addition to those described above. Some of these risks may include, but are not limited to, the following: credit risk, market risk, issuer risk, non-U.S. investment risk and management risk. A complete description of these risks is contained in the Portfolio’s prospectus. Investing in non-U.S. securities may entail risk due to non-U.S. economic and political developments.
On the performance summary page in this Semiannual Report, the Total Return Investment Performance table measures performance assuming that all dividend and capital gain distributions were reinvested.
An investment in the Portfolio is not a deposit of a bank and is not guaranteed or insured by the Federal Deposit Insurance Corporation or any other government agency. It is possible to lose money on investments in the Portfolio.
PIMCO has adopted written proxy voting policies and procedures (“Proxy Policy”) as required by Rule 206(4)-6 under the Investment Advisers Act of 1940. The Proxy Policy has been adopted by the Trust as the policies and procedures that PIMCO will use when voting proxies on behalf of the Portfolio. Copies of the written Proxy Policy and the factors that PIMCO may consider in determining how to vote proxies for the Portfolio, and information about how the Portfolio voted proxies relating to portfolio securities held during the most recent twelve-month period ended June 30, are available without charge, upon request, by calling the Trust at 1-866-746-2606 and on the Securities and Exchange Commission’s (“SEC”) website at http://www.sec.gov.
The Portfolio files its complete schedule of portfolio holdings with the SEC for the first and third quarters of each fiscal year on Form N-Q. A copy of the Trust’s Form N-Q is available on the SEC’s website at http://www.sec.gov and may be reviewed and copied at the SEC’s Public Reference Room in Washington D.C. Information on the operation of the Public Reference Room may be obtained by calling 1-800-SEC-0330.
PIMCO Variable Insurance Trust is distributed by Allianz Global Investors Distributors LLC, 2187 Atlantic Street, Stamford, CT 06902.
| | | | |
| 2 | | PIMCO Variable Insurance Trust | | |
The following disclosure provides important information regarding the Portfolio’s Expense Example (“Example” or “Expense Example”), which appears in this Semiannual Report. Please refer to this information when reviewing the Expense Example for the Portfolio.
Example
As a shareholder of the Portfolio, you incur two types of costs: (1) transaction costs and (2) ongoing costs, including advisory and administrative fees; distribution and/or service (12b-1) fees (Administrative Class only); and other Portfolio expenses. The Example is intended to help you understand your ongoing costs (in dollars) of investing in the Portfolio and to compare these costs with the ongoing costs of investing in other mutual funds. The Expense Example does not reflect any fees or other expenses imposed by the Variable Contracts. If it did, the expenses reflected in the Expense Examples would be higher. The Example is based on an investment of $1,000 invested at the beginning of the period and held for the entire period indicated, which is from January 1, 2006 to June 30, 2006.
Actual Expenses
The information in the table under the heading “Actual Performance” provides information about actual account values and actual expenses. You may use the information in these columns, together with the amount you invested, to estimate the expenses that you paid over the period. Simply divide your account value by $1,000 (for example, an $8,600 account value divided by $1,000 = 8.60), then multiply the result by the number in the appropriate column for your share class, in the row titled “Expenses Paid During Period” to estimate the expenses you paid on your account during this period.
Hypothetical Example for Comparison Purposes
The information in the table under the heading “Hypothetical Performance (5% return before expenses)” provides information about hypothetical account values and hypothetical expenses based on the Portfolio’s actual expense ratio and an assumed rate of return of 5% per year before expenses, which is not the Portfolio’s actual return. The hypothetical account values and expenses may not be used to estimate the actual ending account balance or expenses you paid for the period. You may use this information to compare the ongoing costs of investing in the Portfolio and other portfolios. To do so, compare this 5% hypothetical example with the 5% hypothetical examples that appear in the shareholder reports of the other portfolios.
Please note that the expenses shown in the table are meant to highlight your ongoing costs only and do not reflect any transactional costs. Therefore, the information under the heading “Hypothetical Performance (5% return before expenses)” is useful in comparing ongoing costs only, and will not help you determine the relative total costs of owning different portfolios. In addition, if these transactional costs were included, your costs would have been higher.
The expense ratio may vary period to period because of various factors, such as an increase in expenses not covered by the advisory and administrative fees (such as expenses of the trustees and their counsel or litigation expense).
Portfolio Benchmark
Citigroup 3-Month Treasury Bill Index is an unmanaged index representing monthly return equivalents of yield averages of the last 3-Month Treasury Bill issues. It is not possible to invest directly in the index.
| | | | | | |
| | | Semiannual Report | | June 30, 2006 | | 3 |
| | | | |
| | |
| PIMCO Money Market Portfolio | | | | |
| | | | |
Cumulative Returns Through June 30, 2006
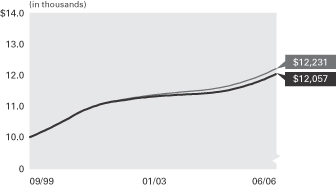
Money Market Portfolio Citigroup
Administrative Class 3 Month T-Bill Index
-------------------- --------------------
09/30/1999 $10,000 $10,000
10/31/1999 10,041 10,041
11/30/1999 10,082 10,081
12/31/1999 10,130 10,124
01/31/2000 10,174 10,169
02/29/2000 10,218 10,212
03/31/2000 10,268 10,260
04/30/2000 10,311 10,308
05/31/2000 10,361 10,359
06/30/2000 10,415 10,407
07/31/2000 10,466 10,458
08/31/2000 10,520 10,509
09/30/2000 10,570 10,562
10/31/2000 10,617 10,617
11/30/2000 10,680 10,671
12/31/2000 10,739 10,727
01/31/2001 10,791 10,783
02/28/2001 10,836 10,829
03/31/2001 10,881 10,877
04/30/2001 10,919 10,919
05/31/2001 10,961 10,959
06/30/2001 10,996 10,994
07/31/2001 11,027 11,028
08/31/2001 11,063 11,062
09/30/2001 11,088 11,094
10/31/2001 11,112 11,123
11/30/2001 11,132 11,146
12/31/2001 11,150 11,166
01/31/2002 11,164 11,183
02/28/2002 11,178 11,198
03/31/2002 11,192 11,215
04/30/2002 11,206 11,231
05/31/2002 11,222 11,248
06/30/2002 11,235 11,263
07/31/2002 11,249 11,280
08/31/2002 11,263 11,296
09/30/2002 11,275 11,312
10/31/2002 11,288 11,328
11/30/2002 11,296 11,342
12/31/2002 11,306 11,356
01/31/2003 11,317 11,368
02/28/2003 11,325 11,378
03/31/2003 11,332 11,390
04/30/2003 11,340 11,401
05/31/2003 11,348 11,412
06/30/2003 11,354 11,422
07/31/2003 11,361 11,432
08/31/2003 11,366 11,442
09/30/2003 11,371 11,450
10/31/2003 11,377 11,460
11/30/2003 11,383 11,468
12/31/2003 11,388 11,478
01/31/2004 11,394 11,487
02/29/2004 11,399 11,495
03/31/2004 11,404 11,504
04/30/2004 11,410 11,513
05/31/2004 11,414 11,522
06/30/2004 11,420 11,532
07/31/2004 11,428 11,543
08/31/2004 11,437 11,555
09/30/2004 11,447 11,569
10/31/2004 11,459 11,584
11/30/2004 11,472 11,601
12/31/2004 11,490 11,620
01/31/2005 11,506 11,641
02/28/2005 11,523 11,661
03/31/2005 11,544 11,686
04/30/2005 11,566 11,711
05/31/2005 11,590 11,739
06/30/2005 11,615 11,767
07/31/2005 11,642 11,796
08/31/2005 11,672 11,828
09/30/2005 11,704 11,860
10/31/2005 11,735 11,895
11/30/2005 11,769 11,931
12/31/2005 11,808 11,969
01/31/2006 11,844 12,009
02/28/2006 11,880 12,047
03/31/2006 11,924 12,091
04/30/2006 11,963 12,136
05/31/2006 12,008 12,184
06/30/2006 12,057 12,231
$10,000 invested at the beginning of the first full month following the inception date of the Portfolio’s Administrative Class.
Sector Breakdown‡
| | |
Commercial Paper | | 92.1% |
Certificates of Deposit | | 7.5% |
Repurchase Agreements | | 0.4% |
| | ‡ | % of Total Investments as of June 30, 2006 |
| | | | | | | | | | | | | | | | | | |
| Average Annual Total Return for the period ended June 30, 2006 | | | | |
| | | | | | | 7-Day Yield | | | 30-Day Yield | | | 6 Months* | | 1 Year | | 5 Years | | Since
Inception
(09/30/99) |
| | |
| | PIMCO Money Market Portfolio Administrative Class | | 4.77 | % | | 4.70 | % | | 2.10% | | 3.80% | | 1.86% | | 2.81% |
| | |
| | Citigroup 3-Month Treasury Bill Index | | — | | | — | | | 2.19% | | 3.95% | | 2.16% | | 3.03% |
All Portfolio returns are net of fees and expenses.
* Cumulative return.
Past performance is no guarantee of future results. The performance quoted represents past performance. Money market funds are not insured or guaranteed by the FDIC or any other government agency, and although these funds seek to preserve the value of your investment at $1.00 per share, it is possible to lose money by investing in money market funds. The Portfolio’s performance does not reflect the deduction of additional charges and expenses imposed in connection with investing in Variable Contracts, which will reduce returns. Current performance may be lower or higher than the performance data quoted. Performance data current to the most recent month-end is available by calling (800) 927-4648.
| | | | | | | | | | |
| Expense Example | | | | Actual Performance | | | | Hypothetical Performance |
| | | | | | | | | (5% return before expenses) |
Beginning Account Value (01/01/06) | | | | $ | 1,000.00 | | | | $ | 1,000.00 |
Ending Account Value (06/30/06) | | | | $ | 1,021.00 | | | | $ | 1,022.32 |
Expenses Paid During Period† | | | | $ | 2.51 | | | | $ | 2.51 |
† Expenses are equal to the Portfolio’s Administrative Class annualized expense ratio of 0.50%, multiplied by the average account value over the period, multiplied by 181/365 (to reflect the one-half year period). Overall fees and expenses of investing in the Portfolio will be higher because the example does not reflect Variable Contract fees and expenses.
Please refer to page 3 herein for a description of the Portfolio’s benchmark and an explanation of the information presented in the above Expense Example.
Portfolio Insights
| » | | The PIMCO Money Market Portfolio seeks to achieve its investment objective by investing at least 95% of its total assets in a diversified portfolio of money market securities that are in the highest rating category for short-term obligations. |
| » | | The Portfolio emphasizes high-quality commercial paper, shorter-term agency and high-quality corporate debt issues due to strong liquidity, attractive yields and limited credit risks. |
| » | | High quality (A1/P1) commercial paper yields rose approximately 1.00% for three-month maturities, reflecting similar Federal Reserve rate increases. |
| » | | U.S. and non-U.S. issued high-quality (A1/P1) commercial paper was emphasized due to attractive yields, modest interest rate sensitivity and limited credit risk. |
| » | | Higher-quality (A1/P1) three-month commercial paper yield spreads relative to Treasuries slightly widened by about 0.06% to approximately 0.46%, which provided additional income. |
| | | | | | |
| 4 | | PIMCO Variable Insurance Trust | | | | |
| | |
| |
| Financial Highlights Money Market Portfolio | | |
| | | | | | | | | | | | | | | | | | | | | | | | |
| Selected Per Share Data for the Year or Period Ended: | | 06/30/2006+ | | | 12/31/2005 | | | 12/31/2004 | | | 12/31/2003 | | | 12/31/2002 | | | 12/31/2001 | |
| | | | | | |
Administrative Class | | | | | | | | | | | | | | | | | | | | | | | | |
| Net asset value beginning of period | | $ | 1.00 | | | $ | 1.00 | | | $ | 1.00 | | | $ | 1.00 | | | $ | 1.00 | | | $ | 1.00 | |
| Net investment income (a) | | | 0.02 | | | | 0.03 | | | | 0.01 | | | | 0.01 | | | | 0.01 | | | | 0.04 | |
| Total income from investment operations | | | 0.02 | | | | 0.03 | | | | 0.01 | | | | 0.01 | | | | 0.01 | | | | 0.04 | |
| Dividends from net investment income | | | (0.02 | ) | | | (0.03 | ) | | | (0.01 | ) | | | (0.01 | ) | | | (0.01 | ) | | | (0.04 | ) |
| Net asset value end of period | | $ | 1.00 | | | $ | 1.00 | | | $ | 1.00 | | | $ | 1.00 | | | $ | 1.00 | | | $ | 1.00 | |
| Total return | | | 2.10 | % | | | 2.77 | % | | | 0.89 | % | | | 0.72 | % | | | 1.41 | % | | | 3.83 | % |
| Net assets end of period (000s) | | $ | 59,301 | | | $ | 43,434 | | | $ | 32,184 | | | $ | 27,032 | | | $ | 25,850 | | | $ | 12,860 | |
| Ratio of expenses to average net assets | | | 0.50 | %* | | | 0.50 | % | | | 0.50 | % | | | 0.50 | % | | | 0.50 | % | | | 0.50 | %(b) |
| Ratio of net investment income to average net assets | | | 4.26 | %* | | | 2.81 | % | | | 0.91 | % | | | 0.70 | % | | | 1.41 | % | | | 3.37 | % |
+ Unaudited
* Annualized
(a) Per share amounts based on average number of shares outstanding during the period.
(b) If the investment manager had not reimbursed expenses, the ratio of expenses to average net assets would have been 0.51%.
| | | | | | |
| See Accompanying Notes | | Semiannual Report | | June 30, 2006 | | 5 |
|
|
| Statement of Assets and Liabilities Money Market Portfolio |
| | | | |
| (Amounts in thousands, except per share amounts) | | June 30, 2006
(Unaudited) | |
| |
Assets: | | | | |
Investments, at value | | $ | 160,648 | |
Interest and dividends receivable | | | 40 | |
| | | | 160,688 | |
| |
Liabilities: | | | | |
Payable for Portfolio shares redeemed | | $ | 218 | |
Dividends payable | | | 1 | |
Accrued investment advisory fee | | | 20 | |
Accrued administration fee | | | 27 | |
Accrued servicing fee | | | 6 | |
| | | | 272 | |
| |
Net Assets | | $ | 160,416 | |
| |
Net Assets Consist of: | | | | |
Paid in capital | | $ | 160,418 | |
Undistributed net investment income | | | 14 | |
Accumulated undistributed net realized (loss) | | | (16 | ) |
| | | $ | 160,416 | |
| |
Net Assets: | | | | |
Institutional Class | | $ | 101,115 | |
Administrative Class | | | 59,301 | |
| |
Shares Issued and Outstanding: | | | | |
Institutional Class | | | 101,115 | |
Administrative Class | | | 59,301 | |
| |
Net Asset Value and Redemption Price Per Share (Net Assets Per Share Outstanding) | | | | |
Institutional Class | | $ | 1.00 | |
Administrative Class | | | 1.00 | |
| |
Cost of Investments Owned | | $ | 160,648 | |
| | | | |
| 6 | | PIMCO Variable Insurance Trust | | See Accompanying Notes |
|
|
| Statement of Operations Money Market Portfolio |
| | | | |
| (Amounts in Thousands) | | Six Months Ended
June 30, 2006
(Unaudited) | |
| |
Investment Income: | | | | |
Interest | | $ | 3,530 | |
Total Income | | | 3,530 | |
| |
Expenses: | | | | |
Investment advisory fees | | | 112 | |
Administration fees | | | 149 | |
Servicing fees – Administrative Class | | | 33 | |
Trustees’ fees | | | 1 | |
Interest expense | | | 2 | |
Total Expenses | | | 297 | |
| |
Net Investment Income | | | 3,233 | |
| |
Net Realized and Unrealized Gain (Loss): | | | | |
Net realized (loss) on investments | | | (10 | ) |
Net (Loss) | | | (10 | ) |
| |
Net Increase in Net Assets Resulting from Operations | | $ | 3,223 | |
| | | | | | |
| See Accompanying Notes | | Semiannual Report | | June 30, 2006 | | 7 |
|
|
| Statements of Changes in Net Assets Money Market Portfolio |
| | | | | | | | |
| (Amounts in Thousands) | | Six Months Ended
June 30, 2006
(Unaudited) | | | Year Ended
December 31, 2005 | |
| | |
Increase (Decrease) in Net Assets from: | | | | | | | | |
| | |
Operations: | | | | | | | | |
Net investment income | | $ | 3,233 | | | $ | 3,324 | |
Net realized (loss) | | | (10 | ) | | | (3 | ) |
Net increase resulting from operations | | | 3,223 | | | | 3,321 | |
| | |
Distributions to Shareholders: | | | | | | | | |
| From net investment income | | | | | | | | |
Institutional Class | | | (2,283 | ) | | | (2,245 | ) |
Administrative Class | | | (942 | ) | | | (1,076 | ) |
| | |
Total Distributions | | | (3,225 | ) | | | (3,321 | ) |
| | |
Portfolio Share Transactions: | | | | | | | | |
| Receipts for shares sold | | | | | | | | |
Institutional Class | | | 44,772 | | | | 23,543 | |
Administrative Class | | | 32,420 | | | | 31,350 | |
| Issued in reorganization | | | | | | | | |
Institutional Class | | | 0 | | | | 99,297 | |
Administrative Class | | | 0 | | | | 0 | |
| Issued as reinvestment of distributions | | | | | | | | |
Institutional Class | | | 2,282 | | | | 2,245 | |
Administrative Class | | | 942 | | | | 1,076 | |
| Cost of shares redeemed | | | | | | | | |
Institutional Class | | | (46,133 | ) | | | (24,902 | ) |
Administrative Class | | | (17,494 | ) | | | (21,176 | ) |
Net increase resulting from Portfolio share transactions | | | 16,789 | | | | 111,433 | |
| | |
Total Increase in Net Assets | | | 16,787 | | | | 111,433 | |
| | |
Net Assets: | | | | | | | | |
Beginning of period | | | 143,629 | | | | 32,196 | |
End of period* | | $ | 160,416 | | | $ | 143,629 | |
| | |
*Including undistributed net investment income of: | | $ | 14 | | | $ | 6 | |
| | | | |
| 8 | | PIMCO Variable Insurance Trust | | See Accompanying Notes |
| | |
| |
| Schedule of Investments Money Market Portfolio | | June 30, 2006 (Unaudited) |
| | | | |
| | | PRINCIPAL | | |
| | | AMOUNT | | VALUE |
| | | (000S) | | (000S) |
| | | | | |
| | | | | | | | |
| SHORT-TERM INSTRUMENTS 100.1% |
| |
| CERTIFICATES OF DEPOSIT 7.5% | | | | |
| Citibank New York N.A. | | | | | | | | |
5.135% due 08/17/2006 | | $ | | 1,400 | | $ | | 1,400 |
5.400% due 09/21/2006 | | | | 3,300 | | | | 3,300 |
|
| Wells Fargo Bank N.A. | | | | | | | | |
5.180% due 07/05/2006 | | | | 7,400 | | | | 7,400 |
| | | | | | | | |
|
| | | | | | | | | 12,100 |
| | | | | | | | |
|
| |
| COMMERCIAL PAPER 92.2% | | | | |
| Abbey National N.A. LLC | | | | | | | | |
5.000% due 08/28/2006 | | | | 4,300 | | | | 4,267 |
|
| ANZ National (Int’l) Ltd. | | | | | | | | |
4.860% due 07/10/2006 | | | | 1,000 | | | | 999 |
|
| Bank of America Corp. | | | | | | | | |
5.055% due 08/17/2006 | | | | 5,000 | | | | 4,968 |
|
| Bank of Ireland | | | | | | | | |
5.200% due 09/22/2006 | | | | 1,500 | | | | 1,482 |
|
| Barclays U.S. Funding Corp. | | | | | | | | |
5.105% due 08/22/2006 | | | | 2,700 | | | | 2,681 |
|
| BNP Paribas Finance | | | | | | | | |
5.270% due 07/03/2006 | | | | 800 | | | | 800 |
|
| Calyon N.A. Inc. | | | | | | | | |
5.230% due 08/03/2006 | | | | 4,600 | | | | 4,579 |
|
| CBA (de) Finance | | | | | | | | |
5.080% due 08/21/2006 | | | | 4,400 | | | | 4,370 |
|
| Danske Corp. | | | | | | | | |
5.080% due 08/24/2006 | | | | 4,400 | | | | 4,368 |
|
| Dexia Delaware LLC | | | | | | | | |
5.275% due 07/06/2006 | | | | 6,000 | | | | 5,997 |
|
| DnB NORBank ASA | | | | | | | | |
5.125% due 08/18/2006 | | | | 1,600 | | | | 1,590 |
|
| Fannie Mae | | | | | | | | |
4.810% due 09/20/2006 | | | | 1,600 | | | | 1,583 |
5.010% due 09/07/2006 | | | | 1,400 | | | | 1,400 |
|
| Fortis Funding | | | | | | | | |
5.060% due 07/06/2006 | | | | 4,100 | | | | 4,098 |
|
| Freddie Mac | | | | | | | | |
0.010% due 09/12/2006 | | | | 4,300 | | | | 4,258 |
4.785% due 09/12/2006 | | | | 9,500 | | | | 9,410 |
4.875% due 09/26/2006 | | | | 500 | | | | 494 |
4.910% due 12/12/2006 | | | | 3,100 | | | | 3,029 |
4.932% due 08/08/2006 | | | | 4,800 | | | | 4,776 |
|
| General Electric Capital Corp. | | | | |
5.060% due 08/16/2006 | | | | 4,300 | | | | 4,273 |
|
| HBOS Treasury Services PLC | | | | | | | | |
4.940% due 07/14/2006 | | | | 1,700 | | | | 1,697 |
5.100% due 08/23/2006 | | | | 2,900 | | | | 2,879 |
|
| ING U.S. Funding LLC | | | | | | | | |
5.235% due 08/03/2006 | | | | 4,600 | | | | 4,579 |
|
| IXIS Commercial Paper Corp. | | | | | | | | |
5.200% due 08/11/2006 | | | | 4,600 | | | | 4,574 |
|
| KFW International Finance | | | | | | | | |
5.090% due 07/10/2006 | | | | 7,300 | | | | 7,293 |
|
| Nordea N.A., Inc. | | | | | | | | |
4.930% due 07/06/2006 | | | | 1,700 | | | | 1,699 |
|
| Sanofi Aventis | | | | | | | | |
4.980% due 07/05/2006 | | | | 4,800 | | | | 4,799 |
|
| Skandinaviska Enskilda Banken | | | | |
4.960% due 07/20/2006 | | | | 4,800 | | | | 4,789 |
|
| Societe Generale N.A. | | | | | | | | |
4.890% due 07/06/2006 | | | | 5,200 | | | | 5,198 |
| | | | | | | | |
| Stadshypoket Delaware, Inc. | | | | | | | | |
5.090% due 08/18/2006 | | $ | | 4,500 | | $ | | 4,471 |
|
| Statens Bostadsfin Bank | | | | | | | | |
4.890% due 07/06/2006 | | | | 4,300 | | | | 4,298 |
|
| Svenska Handelsbanken, Inc. | | | | |
5.000% due 08/28/2006 | | | | 4,800 | | | | 4,763 |
|
| Swedbank, Inc. | | | | | | | | |
4.830% due 08/24/2006 | | | | 4,300 | | | | 4,270 |
4.890% due 08/24/2006 | | | | 1,000 | | | | 993 |
|
| TotalFinaElf Captial S.A. | | | | | | | | |
5.270% due 07/03/2006 | | | | 7,600 | | | | 7,600 |
|
| Toyota Motor Credit Co. | | | | | | | | |
5.270% due 08/09/2006 | | | | 4,700 | | | | 4,675 |
|
| UBS Finance Delaware LLC | | | | | | | | |
5.235% due 08/08/2006 | | | | 6,000 | | | | 5,969 |
|
| Unicredit Delaware, Inc. | | | | | | | | |
5.150% due 11/24/2006 | | | | 2,500 | | | | 2,449 |
|
| Westpac Capital Corp. | | | | | | | | |
5.140% due 12/01/2006 | | | | 1,500 | | | | 1,468 |
| | | | | | | | |
|
| | | | | | | | | 147,885 |
| | | | | | | | |
|
| |
| REPURCHASE AGREEMENT 0.4% | | | | |
| State Street Bank | | | | | | | | |
4.900% due 07/03/2006 | | | | 663 | | | | 663 |
| | | | | | | | |
|
(Dated 06/30/2006. Collateralized by Fannie Mae
5.000% due 01/15/2007 valued at $678. Repurchase proceeds are $663.) |
Total Short-Term Instruments
(Cost $160,648) | | 160,648 |
| | | | | | | | |
|
| |
Total Investments 100.1%
(Cost $160,648) | | $ | | 160,648 |
| |
| Other Assets and Liabilities (Net) (0.1%) | | (232) |
| | | | | | | | |
|
| Net Assets 100.0% | | $ | | 160,416 |
| | | | | | | | |
|
| | | | | | |
| See Accompanying Notes | | Semiannual Report | | June 30, 2006 | | 9 |
Notes to Financial Statements
1. ORGANIZATION
The Money Market Portfolio (the “Portfolio”) is a series of the PIMCO Variable Insurance Trust (the “Trust”). The Trust is registered under the Investment Company Act of 1940 (the “Act”), as amended, as an open-end investment management company organized as a Delaware business trust on October 3, 1997. The Portfolio offers two classes of shares: Institutional and Administrative. Information presented in these financial statements pertains to the Administrative Class of the Portfolio. Certain detailed financial information for the Institutional Class is provided separately and is available upon request. The Trust is designed to be used as an investment vehicle by Separate Accounts of insurance companies that fund variable annuity contracts and variable life insurance policies and by qualified pension and retirement plans.
2. SIGNIFICANT ACCOUNTING POLICIES
The following is a summary of significant accounting policies consistently followed by the Portfolio in the preparation of its financial statements in conformity with accounting principles generally accepted in the United States of America (“GAAP”). The preparation of financial statements in accordance with GAAP requires management to make estimates and assumptions that affect the reported amounts and disclosures in the financial statements. Actual results could differ from those estimates.
Security Valuation. Portfolio securities held by the Portfolio are valued at amortized cost, which approximates current market value.
Securities Transactions and Investment Income. Securities transactions are recorded as of the trade date. Securities purchased or sold on a when-issued or delayed-delivery basis may be settled a month or more after the trade date. Realized gains and losses from securities sold are recorded on the identified cost basis. Dividend income is recorded on the ex-dividend date, except certain dividends from foreign securities where the ex-dividend date may have passed, which are recorded as soon as the Portfolio is informed of the ex-dividend date. Interest income, adjusted for the accretion of discounts and amortization of premiums, is recorded on the accrual basis. Paydown gains and losses on mortgage-related or asset-backed securities are recorded as components of interest income in the Statement of Operations.
Dividends and Distributions to Shareholders. Dividends from net investment income, if any, are declared on each day the Portfolio is open for business and are distributed to shareholders monthly. Net realized capital gains earned by the Portfolio, if any, will be distributed no less frequently than once each year. Most shareholders choose to reinvest their dividends and capital gain distribution in additional shares of the Portfolio.
Income dividends and capital gain distributions are determined in accordance with income tax regulations which may differ from GAAP. Differences between tax regulations and GAAP may change the fiscal year when income and capital items are recognized for tax and GAAP purposes. Examples of events that give rise to timing differences include wash sales, straddles, net operating losses and capital loss carryforwards. Further, the character of investment income and capital gains may be different for certain transactions under the two methods of accounting. Examples of characterization differences include the treatment of mortgage paydowns, swaps, foreign currency transactions and contingent debt instruments. As a result, income dividends and capital gain distributions declared during a fiscal period may differ significantly from the net investment income and realized capital gain reported in the Portfolio’s annual financial statements presented under GAAP.
Distributions classified as a tax basis return of capital, if any, are reflected in the accompanying Statements of Changes in Net Assets and have been reclassified to paid in capital. In addition, other amounts have been reclassified between undistributed net investment income, accumulated undistributed net realized gains or losses and/or paid in capital to more appropriately conform financial accounting to tax characterizations of dividend distributions.
Multiclass Operations. Each class offered by the Portfolio has equal rights as to assets and voting privileges (except that shareholders of a class have exclusive voting rights regarding any matter relating solely to that class of shares). Income and non-class specific expenses of the Portfolio are allocated daily to each class of shares based on the relative value of settled shares. Realized and unrealized capital gains and losses of the Portfolio are allocated daily to each class of shares based on the relative net assets of each class. Class specific expenses, where applicable, currently include administrative, distribution and servicing fees.
Federal Income Taxes. The Portfolio intends to qualify as a regulated investment company under sub-chapter M of the Internal Revenue Code and distribute all of its taxable income and net realized gains, if applicable, to shareholders. Accordingly, no provision for Federal income taxes has been made.
Repurchase Agreements. The Portfolio may engage in repurchase transactions. Under the terms of a typical repurchase agreement, the Portfolio takes possession of an underlying debt obligation subject to an obligation of the seller to repurchase, and the Portfolio to resell, the obligation at an agreed-upon price and time. The market value of the collateral must be equal to or exceed at all times the total amount of the repurchase obligations, including interest. Securities purchased under repurchase agreements are reflected as an asset in the Statement of Assets and Liabilities. Generally, in the event of counterparty default, the Portfolio has the right to use the collateral to offset losses incurred. If the counterparty should default, the Portfolio will seek to sell the securities which it holds as collateral. This could involve procedural costs or delays in addition to a loss on the securities if their value should fall below their repurchase price.
U.S. Government Agencies or Government-Sponsored Enterprises. Securities issued by U.S. Government agencies or government-sponsored enterprises may not be guaranteed by the U.S. Treasury. The Government National Mortgage Association (“GNMA”), a wholly owned U.S. Government corporation, is authorized to guarantee, with the full faith and credit of the U.S. Government, the timely payment of principal and interest on securities issued by institutions approved by GNMA and backed by pools of mortgages insured by the Federal Housing Administration or guaranteed by the Department of Veterans Affairs. Government-related guarantors (i.e., not backed by the full faith and credit of the U.S. Government) include the Federal National Mortgage Association (“FNMA” or “Fannie Mae”) and the Federal Home Loan Mortgage Corporation (“FHLMC” or “Freddie Mac”). Pass-through securities issued by FNMA are guaranteed as to timely payment of principal and interest by FNMA but are not backed by the full faith and credit of the U.S. Government. FHLMC guarantees the timely payment of interest and ultimate collection of principal, but its participation certificates are not backed by the full faith and credit of the U.S. Government.
Guarantees and Indemnifications. Under the Trust’s organizational documents, each Trustee, officer, employee or other agent of the Trust (including the Trust’s investment manager) is indemnified against certain liabilities that may arise out of performance of their duties to the Portfolio. Additionally, in the normal course of business, the Portfolio enters into contracts that contain a variety of indemnification clauses. The Portfolio’s maximum exposure under these arrangements is unknown as this would involve future claims that may be made against the Portfolio that have not yet occurred. However, the Portfolio has not had prior claims or losses pursuant to these contracts, and believes the risk of loss to be remote.
| | | | |
| 10 | | PIMCO Variable Insurance Trust | | |
| | |
| |
| | | June 30, 2006 (Unaudited) |
New Accounting Policies. In July 2006, the Financial Accounting Standards Board issued Interpretation No. 48, “Accounting for Uncertainty in Income Taxes—an Interpretation of FASB Statement No. 109” (the “Interpretation”). The Interpretation is effective for fiscal years beginning after December 15, 2006. Management is currently evaluating the application of the Interpretation to the Portfolio and will provide additional information in relation to the Interpretation in the Portfolio’s annual financial statements for the year ending December 31, 2006.
3. FEES, EXPENSES, AND RELATED PARTY TRANSACTIONS
Investment Advisory Fee. PIMCO is a majority-owned subsidiary of Allianz Global Investors of America L.P. (“AGI”), and serves as investment adviser (the “Adviser”) to the Trust, pursuant to an investment advisory contract. The Adviser receives a monthly fee at an annual rate based on average daily net assets of the Portfolio. The Advisory Fee is charged at an annual rate of 0.15%.
Administration Fee. PIMCO serves as administrator (the “Administrator”), and provides administrative services to the Trust for which it receives a monthly administrative fee based on average daily net assets of the Portfolio. As the Administrator, PIMCO bears the costs of various third-party services, including audit, custodial, portfolio accounting, legal, transfer agency and printing costs. The Administration Fee is charged at the annual rate of 0.20%.
Distribution and Servicing Fees. Allianz Global Investors Distributors LLC (“AGID”) is an indirect wholly-owned subsidiary of AGI and serves as the distributor of the Trust’s shares. The Trust is permitted to reimburse AGID on a quarterly basis, out of the Administrative Class assets of the Portfolio in the amount of 0.15% on an annual basis of the average daily net assets of that class, for payments made to financial intermediaries that provide services in connection with the distribution of shares or administration of plans or programs that use Portfolio shares as their funding medium. The effective rate paid to AGID was 0.15% during the current fiscal year.
Expenses. The Trust is responsible for the following expenses: (i) salaries and other compensation of any of the Trust’s executive officers and employees who are not officers, directors, stockholders or employees of PIMCO or its subsidiaries or affiliates; (ii) taxes and governmental fees; (iii) brokerage fees and commissions and other portfolio transaction expenses; (iv) the costs of borrowing money, including interest expenses and bank overdraft charges; (v) fees and expenses of the Trustees who are not “interested persons” of PIMCO or the Trust, and any counsel retained exclusively for their benefit; (vi) extraordinary expenses, including costs of litigation and indemnification expenses; (vii) organization expenses and (viii) any expenses allocated or allocable to a specific class of shares, which include service fees payable with respect to the Administrative Class shares and may include certain other expenses as permitted by the Trust’s Multiple Class Plan adopted pursuant to Rule 18f-3 under the Act and subject to review and approval by the Trustees. The ratio of expenses to average net assets per share class, as disclosed in the Financial Highlights, may differ from the annual portfolio operating expenses per share class as disclosed in the Prospectus for the reasons set forth above.
For the current period ended June 30, 2006, each unaffiliated Trustee received an annual retainer of $15,000, plus $2,000 for each Board of Trustees quarterly meeting attended, $500 for each Board of Trustees committee meeting attended and $500 for each special board meeting attended, plus reimbursement of related expenses. In addition, each Committee Chair received an additional annual retainer of $500 and each Audit Committee Chair received an additional annual retainer of $1,500. These expenses are allocated on a pro-rata basis to each Portfolio of the Trust according to its respective net assets. The Trust pays no compensation directly to any Trustee or any other officer who is affiliated with the Administrator, all of whom receive remuneration for their services to the Trust from the Administrator or its affiliates.
4. REORGANIZATION
The Acquiring Portfolio (“Money Market Portfolio”), as listed below, acquired the assets and certain liabilities of the Acquired Fund (“CIGNA Times Square VP Money Market Fund”), also listed below, in a tax-free exchange for shares of the Acquiring Portfolio, pursuant to a plan of reorganization approved by the Acquired Portfolio’s shareholders (shares and amounts in thousands):
| | | | | | | | | | | | | | | | | | | | | | | |
| Acquiring Portfolio | | | | Acquired Fund | | Date | | Shares
Issued by
Acquiring
Portfolio | | Value of
Shares
Issued by
Acquiring
Portfolio | | Total Net
Assets of
Acquired
Fund | | Total Net
Assets of
Acquiring
Portfolio | | Total Net
Assets of
Acquiring
Portfolio After
Acquisition | | Acquired
Fund’s
Unrealized
Appreciation |
Money Market Portfolio | | CIGNA Times Square VP Money Market Fund | | April 22, 2005 | | 99,297 | | $ | 99,297 | | $ | 99,297 | | $ | 31,353 | | $ | 130,650 | | $ | 0 |
| | | | | | |
| | | Semiannual Report | | June 30, 2006 | | 11 |
Notes to Financial Statements
5. SHARES OF BENEFICIAL INTEREST
The Portfolio may issue an unlimited number of shares of beneficial interest with a $0.001 par value. Changes in shares of beneficial interest were as follows (shares and amounts in thousands):
| | | | | | | | | | | | | | | | | | |
| | | | | Six Months Ended 06/30/2006 | | | | | Year Ended 12/31/2005 | |
| | | | | Shares | | | Amount | | | | | Shares | | | Amount | |
| | | | | | |
Receipts for shares sold | | | | | | | | | | | | | | | | | | |
Institutional Class | | | | 44,771 | | | $ | 44,772 | | | | | 23,543 | | | $ | 23,543 | |
Administrative Class | | | | 32,419 | | | | 32,420 | | | | | 31,350 | | | | 31,350 | |
Issued in reorganization | | | | | | | | | | | | | | | | | | |
Institutional Class | | | | 0 | | | | 0 | | | | | 99,297 | | | | 99,297 | |
Administrative Class | | | | 0 | | | | 0 | | | | | 0 | | | | 0 | |
Issued as reinvestment of distributions | | | | | | | | | | | | | | | | | | |
Institutional Class | | | | 2,282 | | | | 2,282 | | | | | 2,245 | | | | 2,245 | |
Administrative Class | | | | 942 | | | | 942 | | | | | 1,076 | | | | 1,076 | |
Cost of shares redeemed | | | | | | | | | | | | | | | | | | |
Institutional Class | | | | (46,133 | ) | | | (46,133 | ) | | | | (24,902 | ) | | | (24,902 | ) |
Administrative Class | | | | (17,494 | ) | | | (17,494 | ) | | | | (21,176 | ) | | | (21,176 | ) |
Net increase resulting from Portfolio share transactions | | | | 16,787 | | | $ | 16,789 | | | | | 111,433 | | | $ | 111,433 | |
The following schedule shows the number of shareholders each owning 5% or more of the Portfolio and the total percentage of the Portfolio held by such shareholders:
| | | | | | |
| | | | | Number of
Shareholders | | % of Portfolio
Held |
Institutional Class | | | | 3 | | 93 |
Administrative Class | | | | 2 | | 93 |
6. FEDERAL INCOME TAX MATTERS
As of June 30, 2006, the aggregate cost of investments was the same for federal income tax and financial statement purposes. The net unrealized appreciation (depreciation) of investment securities for federal income tax purposes is as follows (amounts in thousands):
| | | | |
Aggregate
Gross
Unrealized
Appreciation | | Aggregate
Gross
Unrealized
(Depreciation) | | Net
Unrealized
(Depreciation) |
$ 0 | | $ 0 | | $ 0 |
7. REGULATORY AND LITIGATION MATTERS
On June 1, 2004, the Attorney General of the State of New Jersey announced that it had dismissed PIMCO from a complaint filed by the New Jersey Attorney General on February 17, 2004, and that it had entered into a settlement agreement (the “New Jersey Settlement”) with Allianz Global Investors of America L.P. (“AGI”) (formerly known as Allianz Dresdner Asset Management of America L.P.), PEA Capital LLC (an entity affiliated with PIMCO through common ownership) (“PEA”) and Allianz Global Investors Distributors LLC (“AGID”), in connection with the same matter. In the New Jersey Settlement, AGI, PEA and AGID neither admitted nor denied the allegations or conclusions of law, but did agree to pay New Jersey a civil fine of $15 million and $3 million for investigative costs and further potential enforcement initiatives against unrelated parties. They also undertook to implement certain governance changes. The complaint relating to the New Jersey Settlement alleged, among other things, that AGI, PEA and AGID had failed to disclose that they improperly allowed certain hedge funds to engage in “market timing” in certain funds. The complaint sought injunctive relief, civil monetary penalties, restitution and disgorgement of profits.
Since February 2004, PIMCO, AGI, PEA, AGID, and certain of their affiliates, including the PIMCO Funds, the Allianz Funds (formerly known as PIMCO Funds: Multi-Manager Series), and the Trustees and employees of the PIMCO Funds, have been named as defendants in fifteen lawsuits filed in various jurisdictions. Eleven of those lawsuits concern “market timing,” and they have been transferred to and consolidated for pre-trial proceedings in a multi-district litigation proceeding in the U.S. District Court for the District of Maryland; the other four lawsuits concern “revenue sharing” and have been consolidated into a single action in the U.S. District Court for the District of Connecticut. The lawsuits have been commenced as putative class actions on behalf of investors who purchased, held or redeemed shares of the various series of the PIMCO Funds and the Allianz Funds during specified periods, or as derivative actions on behalf of the PIMCO Funds and Allianz Funds.
The market timing actions in the District of Maryland generally allege that certain hedge funds were allowed to engage in “market timing” in certain of the PIMCO Funds and the Allianz Funds and this alleged activity was not disclosed. Pursuant to tolling agreements entered into with the derivative and class action plaintiffs, PIMCO, the Trustees, and certain employees of PIMCO who were previously named as defendants have all been dropped as defendants in the market timing actions; the plaintiffs continue to assert claims on behalf of the shareholders of the PIMCO Funds or on behalf of the PIMCO Funds themselves against other defendants. By order dated November 3, 2005, the U.S. District Court for the District of Maryland granted the PIMCO Funds’ motion to dismiss claims asserted against it in a consolidated amended complaint where the PIMCO Funds were named, in the complaint, as a nominal defendant. The revenue sharing action in the District of Connecticut generally alleges that fund assets were inappropriately used to pay brokers to promote the PIMCO Funds and Allianz Funds, including directing fund brokerage transactions to such brokers, and that such alleged arrangements were not fully disclosed to shareholders. On August 11, 2005 the U.S. District Court for the District of Connecticut conducted a hearing on defendants’ motion to dismiss the consolidated amended complaint in the revenue sharing action but has not yet ruled on the motion to dismiss. The market timing and revenue sharing lawsuits seek, among other things, unspecified compensatory damages plus interest and, in some cases, punitive damages, the rescission of investment advisory contracts, the return of fees paid under those contracts and restitution.
Under Section 9(a) of the Investment Company Act of 1940, as amended (“1940 Act”), if the New Jersey Settlement or any of the lawsuits described above were to result in a court injunction against AGI, PEA, AGID and/or their affiliates, PIMCO could, in the absence of exemptive relief granted by the SEC, be barred from serving as an investment adviser, and AGID could be barred from serving as principal underwriter, to any registered investment company, including the Portfolios of the Trust. In connection with an inquiry from the SEC concerning the status of the New Jersey Settlement under Section 9(a), PEA, AGID, AGI and certain of their affiliates (including PIMCO) (together, the “Applicants”) have sought exemptive relief from the SEC under Section 9(c) of the 1940 Act. The SEC has granted the Applicants a temporary exemption from the provisions of Section 9(a) with respect to the New Jersey Settlement until the earlier of (i) September 13, 2006 and (ii) the date on which the SEC takes final action on their application for a permanent order. There is no assurance that the SEC will issue a permanent order.
Two nearly identical class action civil complaints have been filed in August 2005, in the Northern District of Illinois Eastern Division alleging that the plaintiffs each purchased and sold a 10-year Treasury note futures contract and suffered damages from an alleged shortage when PIMCO held both physical and futures positions in
| | | | |
| 12 | | PIMCO Variable Insurance Trust | | |
| | |
| |
| | | June 30, 2006 (Unaudited) |
10-year Treasury notes for its client accounts. The two actions have been consolidated into one action, and the two separate complaints have been replaced by a consolidated complaint. PIMCO is a named defendant, and the PIMCO Funds have been added as a defendant, to the consolidated action. PIMCO strongly believes the complaint (and any consolidated complaint filed hereafter) is without merit and intends to vigorously defend itself.
Certain Portfolios of the Trust were recently served in an adversary proceeding brought by the Official Committee of Asbestos Claimants of G-I Holdings, Inc. in G-I Holdings, Inc.’s bankruptcy in the District of New Jersey. PIMCO was previously named in this lawsuit and remains a defendant. The plaintiff seeks to recover for the bankruptcy estate assets that were transferred by the predecessor entity of G-I Holdings, Inc. to a wholly-owned subsidiary in 1994. The subsidiary has since issued notes, of which certain Portfolios of the Trust are alleged to be holders. The complaint alleges that in 2000, more than two hundred noteholders—including certain Portfolios of the Trust—were granted a second priority lien on the assets of the subsidiary in exchange for their consent to a refinancing transaction and the granting of a first priority lien to the lending banks. The plaintiff is seeking invalidation of the lien in favor of the noteholders and/or the value of the lien.
It is possible that these matters and/or other developments resulting from these matters could result in increased fund redemptions or other adverse consequences to the Portfolios. However, PIMCO and AGID believe that these matters are not likely to have a material adverse effect on the Portfolios or on PIMCO’s or AGID’s ability to perform their respective investment advisory or distribution services relating to the Portfolios.
| | | | | | |
| | | Semiannual Report | | June 30, 2006 | | 13 |
Investment Adviser and Administrator
Pacific Investment Management Company LLC
840 Newport Center Drive
Newport Beach, California 92660
Distributor
Allianz Global Investors Distributors LLC
2187 Atlantic Street
Stamford, Connecticut 06902
Custodian
State Street Bank & Trust Company
801 Pennsylvania
Kansas City, Missouri 64105
Transfer Agent
Boston Financial Data Services–Midwest
330 W. 9th Street
Kansas City, Missouri 64105
Legal Counsel
Dechert LLP
1775 I Street, N.W.
Washington, D.C. 20006
Independent Registered Public Accounting Firm
PricewaterhouseCoopers LLP
1055 Broadway
Kansas City, Missouri 64105
P I M C O

Share Class Institutional
Semiannual Report June 30, 2006
PIMCO Variable Insurance Trust
Money Market Portfolio
Table of Contents
This material is authorized for use only when preceded or accompanied by the current PIMCO Variable Insurance Trust (the “Trust”) prospectus. Investors should consider the investment objectives, risks, charges and expenses of this Trust carefully before investing. Ask your financial professional to explain all charges that may apply. This and other information is contained in the Trust’s prospectus. The variable product prospectus may be obtained by contacting your Investment Consultant. Please read the Trust and variable product prospectus carefully before you invest or send money.
Chairman’s Letter
Dear PIMCO Variable Insurance Trust Shareholder:
It is our pleasure to present to you the semiannual report for the PIMCO Variable Insurance Trust covering the six-month period ended June 30, 2006.
Highlights of the global bond markets during the six-month period included:
| | n | | Most fixed-income sectors lost ground during the first half of 2006, as concern about accelerating inflation and central bank tightening pushed interest rates higher worldwide. The benchmark Lehman Brothers Aggregate Bond Index (which includes Treasury, Investment-Grade Corporate, and Residential Mortgage-Backed Securities) returned -0.72% for the first six months of the year. On June 30, the benchmark ten-year Treasury yielded 5.14%, 0.75% higher than at the start of the year. The U.S. yield curve remained flat as shorter-maturity yields rose by a comparable amount. |
| | n | | The Federal Reserve tightened four times during the reporting period, bringing the Federal Funds Rate to 5.25%. The increase near the end of the period was the Federal Reserve’s 17th consecutive rate hike since the start of its tightening cycle in 2004. The Federal Reserve was not alone, as central banks in Europe, India, and China tightened credit in unison for the first time since 2000. The Bank of Japan, whose zero-interest-rate policy has flooded global markets with liquidity, looked set to reverse this policy in the coming months. |
In these pages please find a more complete Portfolio review as it relates to financial-market activities, as well as details about total-return investment performance for the six-month reporting period. Thank you for the trust you have placed in us. We will continue to work diligently to meet your investment needs.
Sincerely,
Brent R. Harris
Chairman, PIMCO Variable Insurance Trust
July 31, 2006
| | | | | | |
| | | Semiannual Report | | June 30, 2006 | | 1 |
Important Information About the Portfolio
PIMCO Variable Insurance Trust (the “Trust”) is an open-end management investment company currently consisting of nineteen separate investment portfolios, including the Money Market Portfolio (the “Portfolio”). The Portfolio is only available as a funding vehicle under variable life insurance policies or variable annuity contracts issued by insurance companies (“Variable Contracts”). Individuals may not purchase shares of the Portfolio directly. Shares of the Portfolio also may be sold to qualified pension and retirement plans outside of the separate account context.
We believe that bond funds have an important role to play in a well diversified investment portfolio. It is important to note, however, that in an environment where interest rates may trend upward, rising rates would negatively impact the performance of most bond funds, and fixed-income securities held by a fund are likely to decrease in value. The price volatility of fixed-income securities can also increase during periods of rising interest rates resulting in increased losses to a fund. Bond funds and individual bonds with a longer duration (a measure of the expected life of a security) tend to be more sensitive to changes in interest rates, usually making them more volatile than securities or funds with shorter durations. The longer-term performance of most bond funds has benefited from capital gains in part resulting from an extended period of declining interest rates. In the event interest rates increase, these capital gains should not be expected to recur.
The Portfolio may be subject to various risks in addition to those described above. Some of these risks may include, but are not limited to, the following: credit risk, market risk, issuer risk, non-U.S. investment risk and management risk. A complete description of these risks is contained in the Portfolio’s prospectus. Investing in non-U.S. securities may entail risk due to non-U.S. economic and political developments.
On the performance summary page in this Semiannual Report, the Total Return Investment Performance table measures performance assuming that all dividend and capital gain distributions were reinvested.
An investment in the Portfolio is not a deposit of a bank and is not guaranteed or insured by the Federal Deposit Insurance Corporation or any other government agency. It is possible to lose money on investments in the Portfolio.
PIMCO has adopted written proxy voting policies and procedures (“Proxy Policy”) as required by Rule 206(4)-6 under the Investment Advisers Act of 1940. The Proxy Policy has been adopted by the Trust as the policies and procedures that PIMCO will use when voting proxies on behalf of the Portfolio. Copies of the written Proxy Policy and the factors that PIMCO may consider in determining how to vote proxies for the Portfolio, and information about how the Portfolio voted proxies relating to portfolio securities held during the most recent twelve-month period ended June 30, are available without charge, upon request, by calling the Trust at 1-866-746-2606 and on the Securities and Exchange Commission’s (“SEC”) website at http://www.sec.gov.
The Portfolio files its complete schedule of portfolio holdings with the SEC for the first and third quarters of each fiscal year on Form N-Q. A copy of the Trust’s Form N-Q is available on the SEC’s website at http://www.sec.gov and may be reviewed and copied at the SEC’s Public Reference Room in Washington D.C. Information on the operation of the Public Reference Room may be obtained by calling 1-800-SEC-0330.
PIMCO Variable Insurance Trust is distributed by Allianz Global Investors Distributors LLC, 2187 Atlantic Street, Stamford, CT 06902.
| | | | |
| 2 | | PIMCO Variable Insurance Trust | | |
The following disclosure provides important information regarding the Portfolio’s Expense Example (“Example” or “Expense Example”), which appears in this Semiannual Report. Please refer to this information when reviewing the Expense Example for the Portfolio.
Example
As a shareholder of the Portfolio, you incur two types of costs: (1) transaction costs and (2) ongoing costs, including advisory and administrative fees; distribution and/or service (12b-1) fees (Administrative Class only); and other Portfolio expenses. The Example is intended to help you understand your ongoing costs (in dollars) of investing in the Portfolio and to compare these costs with the ongoing costs of investing in other mutual funds. The Expense Example does not reflect any fees or other expenses imposed by the Variable Contracts. If it did, the expenses reflected in the Expense Examples would be higher. The Example is based on an investment of $1,000 invested at the beginning of the period and held for the entire period indicated, which is from January 1, 2006 to June 30, 2006.
Actual Expenses
The information in the table under the heading “Actual Performance” provides information about actual account values and actual expenses. You may use the information in these columns, together with the amount you invested, to estimate the expenses that you paid over the period. Simply divide your account value by $1,000 (for example, an $8,600 account value divided by $1,000 = 8.60), then multiply the result by the number in the appropriate column for your share class, in the row titled “Expenses Paid During Period” to estimate the expenses you paid on your account during this period.
Hypothetical Example for Comparison Purposes
The information in the table under the heading “Hypothetical Performance (5% return before expenses)” provides information about hypothetical account values and hypothetical expenses based on the Portfolio’s actual expense ratio and an assumed rate of return of 5% per year before expenses, which is not the Portfolio’s actual return. The hypothetical account values and expenses may not be used to estimate the actual ending account balance or expenses you paid for the period. You may use this information to compare the ongoing costs of investing in the Portfolio and other portfolios. To do so, compare this 5% hypothetical example with the 5% hypothetical examples that appear in the shareholder reports of the other portfolios.
Please note that the expenses shown in the table are meant to highlight your ongoing costs only and do not reflect any transactional costs. Therefore, the information under the heading “Hypothetical Performance (5% return before expenses)” is useful in comparing ongoing costs only, and will not help you determine the relative total costs of owning different portfolios. In addition, if these transactional costs were included, your costs would have been higher.
The expense ratio may vary period to period because of various factors, such as an increase in expenses not covered by the advisory and administrative fees (such as expenses of the trustees and their counsel or litigation expense).
Portfolio Benchmark
Citigroup 3-Month Treasury Bill Index is an unmanaged index representing monthly return equivalents of yield averages of the last 3-Month Treasury Bill issues. It is not possible to invest directly in the index.
| | | | | | |
| | | Semiannual Report | | June 30, 2006 | | 3 |
|
|
| PIMCO Money Market Portfolio |
|
Cumulative Returns Through June 30, 2006
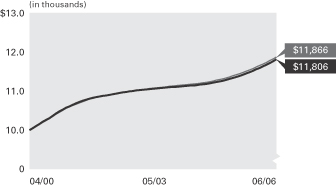
Money Market Portfolio Citigroup 3 Month
Institutional Class Treasury Bill Index
---------------------- -------------------
04/30/2000 $10,000 $10,000
05/31/2000 10,050 10,049
06/30/2000 10,103 10,096
07/31/2000 10,153 10,145
08/31/2000 10,207 10,195
09/30/2000 10,257 10,246
10/31/2000 10,304 10,299
11/30/2000 10,366 10,352
12/31/2000 10,426 10,407
01/31/2001 10,478 10,460
02/28/2001 10,523 10,505
03/31/2001 10,569 10,552
04/30/2001 10,607 10,592
05/31/2001 10,649 10,631
06/30/2001 10,684 10,665
07/31/2001 10,716 10,699
08/31/2001 10,752 10,731
09/30/2001 10,778 10,762
10/31/2001 10,803 10,790
11/30/2001 10,824 10,813
12/31/2001 10,842 10,832
01/31/2002 10,857 10,849
02/28/2002 10,872 10,864
03/31/2002 10,887 10,879
04/30/2002 10,903 10,895
05/31/2002 10,919 10,911
06/30/2002 10,933 10,927
07/31/2002 10,948 10,943
08/31/2002 10,964 10,958
09/30/2002 10,977 10,974
10/31/2002 10,990 10,989
11/30/2002 10,999 11,003
12/31/2002 11,011 11,016
01/31/2003 11,023 11,028
02/28/2003 11,032 11,038
03/31/2003 11,041 11,049
04/30/2003 11,050 11,060
05/31/2003 11,059 11,071
06/30/2003 11,067 11,081
07/31/2003 11,074 11,090
08/31/2003 11,081 11,099
09/30/2003 11,087 11,108
10/31/2003 11,095 11,117
11/30/2003 11,101 11,126
12/31/2003 11,108 11,134
01/31/2004 11,115 11,143
02/29/2004 11,121 11,151
03/31/2004 11,128 11,160
04/30/2004 11,135 11,169
05/31/2004 11,141 11,178
06/30/2004 11,149 11,187
07/31/2004 11,158 11,198
08/31/2004 11,168 11,210
09/30/2004 11,180 11,223
10/31/2004 11,193 11,238
11/30/2004 11,207 11,254
12/31/2004 11,226 11,273
01/31/2005 11,243 11,293
02/28/2005 11,261 11,313
03/31/2005 11,283 11,336
04/30/2005 11,306 11,361
05/31/2005 11,331 11,388
06/30/2005 11,357 11,415
07/31/2005 11,385 11,444
08/31/2005 11,415 11,474
09/30/2005 11,448 11,506
10/31/2005 11,480 11,539
11/30/2005 11,515 11,574
12/31/2005 11,554 11,611
01/31/2006 11,591 11,650
02/28/2006 11,627 11,687
03/31/2006 11,672 11,730
04/30/2006 11,712 11,774
05/31/2006 11,757 11,820
06/30/2006 11,806 11,866
$10,000 invested at the beginning of the first full month following the inception date of the Portfolio’s Institutional Class.
Sector Breakdown‡
| | |
Commercial Paper | | 92.1% |
Certificates of Deposit | | 7.5% |
Repurchase Agreements | | 0.4% |
U.S. Government Agencies | | 3.0% |
| | ‡ | % of Total Investments as of June 30, 2006 |
| | | | | | | | | | | | |
Average Annual Total Return for the period ended June 30, 2006 |
| | | | | | | 6 Months* | | 1 Year | | 5 Years | | Since Inception (04/10/00)** |
| | |
| | PIMCO Money Market Portfolio Institutional Class | | 2.18% | | 3.96% | | 2.02% | | 2.76% |
| | |
| | Citigroup 3 Month Treasury Bill Index | | 2.19% | | 3.95% | | 2.16% | | 2.85% |
All Portfolio returns are net of fees and expenses.
* Cumulative return.
** The Institutional Class shares commenced operations on 04/10/00. Index comparisons began on 03/31/00.
Past performance is no guarantee of future results. The performance quoted represents past performance. Money market funds are not insured or guaranteed by the FDIC or any other government agency, and although these funds seek to preserve the value of your investment at $1.00 per share, it is possible to lose money by investing in money market funds. The Portfolio’s performance does not reflect the deduction of additional charges and expenses imposed in connection with investing in Variable Contracts, which will reduce returns. Current performance may be lower or higher than the performance data quoted. Performance data current to the most recent month-end is available by calling (800) 927-4648.
| | | | | | | | |
| Expense Example | | Actual Performance | | | | Hypothetical Performance |
| | | | | | | (5% return before expenses) |
Beginning Account Value (01/01/06) | | $ | 1,000.00 | | | | $ | 1,000.00 |
Ending Account Value (06/30/06) | | $ | 1,021.80 | | | | $ | 1,023.06 |
Expenses Paid During Period† | | $ | 1.75 | | | | $ | 1.76 |
† Expenses are equal to the Portfolio’s Institutional Class annualized expense ratio of 0.35%, multiplied by the average account value over the period, multiplied by 181/365 (to reflect the one-half year period). Overall fees and expenses of investing in the Portfolio will be higher because the example does not reflect Variable Contract fees and expenses.
Please refer to page 3 herein for a description of the Portfolio’s benchmark and an explanation of the information presented in the above Expense Example. .
Portfolio Insights
| » | | The PIMCO Money Market Portfolio seeks to achieve its investment objective by investing at least 95% of its total assets in a diversified portfolio of money market securities that are in the highest rating category for short-term obligations. |
| » | | The Portfolio emphasizes high-quality commercial paper, shorter-term agency and high-quality corporate debt issues due to strong liquidity, attractive yields and limited credit risks. |
| » | | High quality (A1/P1) commercial paper yields rose approximately 1.00% for three-month maturities, reflecting similar Federal Reserve rate increases. |
| » | | U.S. and non-U.S. issued high-quality (A1/P1) commercial paper was emphasized due to attractive yields, modest interest rate sensitivity and limited credit risk. |
| » | | Higher-quality (A1/P1) three-month commercial paper yield spreads relative to Treasuries slightly widened by about 0.06% to approximately 0.46%, which provided additional income. |
| | | | | | |
| 4 | | PIMCO Variable Insurance Trust | | | | |
|
|
| Financial Highlights Money Market Portfolio |
| | | | | | | | | | | | | | | | | | | | | | | | |
| Selected Per Share Data for the Year or Period Ended: | | 06/30/2006+ | | | 12/31/2005 | | | 12/31/2004 | | | 12/31/2003 | | | 12/31/2002 | | | 12/31/2001 | |
| | | | | | |
Institutional Class | | | | | | | | | | | | | | | | | | | | | | | | |
| Net asset value beginning of period | | $ | 1.00 | | | $ | 1.00 | | | $ | 1.00 | | | $ | 1.00 | | | $ | 1.00 | | | $ | 1.00 | |
| Net investment income (a) | | | 0.02 | | | | 0.03 | | | | 0.01 | | | | 0.01 | | | | 0.02 | | | | 0.04 | |
| Total income from investment operations | | | 0.02 | | | | 0.03 | | | | 0.01 | | | | 0.01 | | | | 0.02 | | | | 0.04 | |
| Dividends from net investment income | | | (0.02 | ) | | | (0.03 | ) | | | (0.01 | ) | | | (0.01 | ) | | | (0.02 | ) | | | (0.04 | ) |
| Total distributions | | | (0.02 | ) | | | (0.03 | ) | | | (0.01 | ) | | | (0.01 | ) | | | (0.02 | ) | | | (0.04 | ) |
| Net asset value end of period | | $ | 1.00 | | | $ | 1.00 | | | $ | 1.00 | | | $ | 1.00 | | | $ | 1.00 | | | $ | 1.00 | |
| Total return | | | 2.18 | % | | | 2.93 | % | | | 1.06 | % | | | 0.88 | % | | | 1.56 | % | | | 3.99 | % |
| Net assets end of period (000s) | | $ | 101,115 | | | $ | 100,195 | | | $ | 12 | | | $ | 11 | | | $ | 11 | | | $ | 11 | |
| Ratio of expenses to average net assets | | | 0.35 | %* | | | 0.35 | % | | | 0.35 | % | | | 0.35 | % | | | 0.35 | % | | | 0.35 | % |
| Ratio of net investment income to average net assets | | | 4.37 | %* | | | 3.23 | % | | | 1.04 | % | | | 0.85 | % | | | 1.58 | % | | | 4.59 | % |
+ Unaudited
* Annualized
(a) Per share amounts based on average number of shares outstanding during the period.
| | | | | | |
| See Accompanying Notes | | Semiannual Report | | June 30, 2006 | | 5 |
|
|
| Statement of Assets and Liabilities Money Market Portfolio |
| | | | |
| (Amounts in thousands, except per share amounts) | | June 30, 2006
(Unaudited) | |
| |
Assets: | | | | |
Investments, at value | | $ | 160,648 | |
Interest and dividends receivable | | | 40 | |
| | | | 160,688 | |
| |
Liabilities: | | | | |
Payable for Portfolio shares redeemed | | $ | 218 | |
Dividends payable | | | 1 | |
Accrued investment advisory fee | | | 20 | |
Accrued administration fee | | | 27 | |
Accrued servicing fee | | | 6 | |
| | | | 272 | |
| |
Net Assets | | $ | 160,416 | |
| |
Net Assets Consist of: | | | | |
Paid in capital | | $ | 160,418 | |
Undistributed net investment income | | | 14 | |
Accumulated undistributed net realized (loss) | | | (16 | ) |
| | | $ | 160,416 | |
| |
Net Assets: | | | | |
Institutional Class | | $ | 101,115 | |
Administrative Class | | | 59,301 | |
| |
Shares Issued and Outstanding: | | | | |
Institutional Class | | | 101,115 | |
Administrative Class | | | 59,301 | |
| |
Net Asset Value and Redemption Price Per Share (Net Assets Per Share Outstanding) | | | | |
Institutional Class | | $ | 1.00 | |
Administrative Class | | | 1.00 | |
| |
Cost of Investments Owned | | $ | 160,648 | |
| | | | |
| 6 | | PIMCO Variable Insurance Trust | | See Accompanying Notes |
|
|
| Statement of Operations Money Market Portfolio |
| | | | |
| (Amounts in Thousands) | | Six Months Ended
June 30, 2006
(Unaudited) | |
| |
Investment Income: | | | | |
Interest | | $ | 3,530 | |
Total Income | | | 3,530 | |
| |
Expenses: | | | | |
Investment advisory fees | | | 112 | |
Administration fees | | | 149 | |
Servicing fees – Administrative Class | | | 33 | |
Trustees’ fees | | | 1 | |
Interest expense | | | 2 | |
Total Expenses | | | 297 | |
| |
Net Investment Income | | | 3,233 | |
| |
Net Realized and Unrealized Gain (Loss): | | | | |
Net realized (loss) on investments | | | (10 | ) |
Net (Loss) | | | (10 | ) |
| |
Net Increase in Net Assets Resulting from Operations | | $ | 3,223 | |
| | | | | | |
| See Accompanying Notes | | Semiannual Report | | June 30, 2006 | | 7 |
|
|
| Statements of Changes in Net Assets Money Market Portfolio |
| | | | | | | | |
| (Amounts in Thousands) | | Six Months Ended
June 30, 2006
(Unaudited) | | | Year Ended
December 31, 2005 | |
| | |
Increase (Decrease) in Net Assets from: | | | | | | | | |
| | |
Operations: | | | | | | | | |
Net investment income | | $ | 3,233 | | | $ | 3,324 | |
Net realized (loss) | | | (10 | ) | | | (3 | ) |
Net increase resulting from operations | | | 3,223 | | | | 3,321 | |
| | |
Distributions to Shareholders: | | | | | | | | |
| From net investment income | | | | | | | | |
Institutional Class | | | (2,283 | ) | | | (2,245 | ) |
Administrative Class | | | (942 | ) | | | (1,076 | ) |
| | |
Total Distributions | | | (3,225 | ) | | | (3,321 | ) |
| | |
Portfolio Share Transactions: | | | | | | | | |
| Receipts for shares sold | | | | | | | | |
Institutional Class | | | 44,772 | | | | 23,543 | |
Administrative Class | | | 32,420 | | | | 31,350 | |
| Issued in reorganization | | | | | | | | |
Institutional Class | | | 0 | | | | 99,297 | |
Administrative Class | | | 0 | | | | 0 | |
| Issued as reinvestment of distributions | | | | | | | | |
Institutional Class | | | 2,282 | | | | 2,245 | |
Administrative Class | | | 942 | | | | 1,076 | |
| Cost of shares redeemed | | | | | | | | |
Institutional Class | | | (46,133 | ) | | | (24,902 | ) |
Administrative Class | | | (17,494 | ) | | | (21,176 | ) |
Net increase resulting from Portfolio share transactions | | | 16,789 | | | | 111,433 | |
| | |
Total Increase in Net Assets | | | 16,787 | | | | 111,433 | |
| | |
Net Assets: | | | | | | | | |
Beginning of period | | | 143,629 | | | | 32,196 | |
End of period* | | $ | 160,416 | | | $ | 143,629 | |
| | |
*Including undistributed net investment income of: | | $ | 14 | | | $ | 6 | |
| | | | |
| 8 | | PIMCO Variable Insurance Trust | | See Accompanying Notes |
| | |
| |
| Schedule of Investments Money Market Portfolio | | June 30, 2006 (Unaudited) |
| | | | | | | | |
| | | | | PRINCIPAL | | | | |
| | | | | AMOUNT | | | | VALUE |
| | | | | (000S) | | | | (000S) |
| | | | | | | | | |
| SHORT-TERM INSTRUMENTS 100.1% |
| |
| CERTIFICATES OF DEPOSIT 7.5% | | | | |
| Citibank New York N.A. | | | | | | | | |
5.135% due 08/17/2006 | | $ | | 1,400 | | $ | | 1,400 |
5.400% due 09/21/2006 | | | | 3,300 | | | | 3,300 |
|
| Wells Fargo Bank N.A. | | | | | | | | |
5.180% due 07/05/2006 | | | | 7,400 | | | | 7,400 |
| | | | | | | | |
|
| | | | | | | | | 12,100 |
| | | | | | | | |
|
| |
| COMMERCIAL PAPER 92.2% | | | | |
| Abbey National N.A. LLC | | | | | | | | |
5.000% due 08/28/2006 | | | | 4,300 | | | | 4,267 |
|
| ANZ National (Int’l) Ltd. | | | | | | | | |
4.860% due 07/10/2006 | | | | 1,000 | | | | 999 |
|
| Bank of America Corp. | | | | | | | | |
5.055% due 08/17/2006 | | | | 5,000 | | | | 4,968 |
|
| Bank of Ireland | | | | | | | | |
5.200% due 09/22/2006 | | | | 1,500 | | | | 1,482 |
|
| Barclays U.S. Funding Corp. | | | | | | | | |
5.105% due 08/22/2006 | | | | 2,700 | | | | 2,681 |
|
| BNP Paribas Finance | | | | | | | | |
5.270% due 07/03/2006 | | | | 800 | | | | 800 |
|
| Calyon N.A. Inc. | | | | | | | | |
5.230% due 08/03/2006 | | | | 4,600 | | | | 4,579 |
|
| CBA (de) Finance | | | | | | | | |
5.080% due 08/21/2006 | | | | 4,400 | | | | 4,370 |
|
| Danske Corp. | | | | | | | | |
5.080% due 08/24/2006 | | | | 4,400 | | | | 4,368 |
|
| Dexia Delaware LLC | | | | | | | | |
5.275% due 07/06/2006 | | | | 6,000 | | | | 5,997 |
|
| DnB NORBank ASA | | | | | | | | |
5.125% due 08/18/2006 | | | | 1,600 | | | | 1,590 |
|
| Fannie Mae | | | | | | | | |
4.810% due 09/20/2006 | | | | 1,600 | | | | 1,583 |
5.010% due 09/07/2006 | | | | 1,400 | | | | 1,400 |
|
| Fortis Funding | | | | | | | | |
5.060% due 07/06/2006 | | | | 4,100 | | | | 4,098 |
|
| Freddie Mac | | | | | | | | |
0.010% due 09/12/2006 | | | | 4,300 | | | | 4,258 |
4.785% due 09/12/2006 | | | | 9,500 | | | | 9,410 |
4.875% due 09/26/2006 | | | | 500 | | | | 494 |
4.910% due 12/12/2006 | | | | 3,100 | | | | 3,029 |
4.932% due 08/08/2006 | | | | 4,800 | | | | 4,776 |
|
| General Electric Capital Corp. | | | | |
5.060% due 08/16/2006 | | | | 4,300 | | | | 4,273 |
|
| HBOS Treasury Services PLC | | | | | | | | |
4.940% due 07/14/2006 | | | | 1,700 | | | | 1,697 |
5.100% due 08/23/2006 | | | | 2,900 | | | | 2,879 |
|
| ING U.S. Funding LLC | | | | | | | | |
5.235% due 08/03/2006 | | | | 4,600 | | | | 4,579 |
|
| IXIS Commercial Paper Corp. | | | | | | | | |
5.200% due 08/11/2006 | | | | 4,600 | | | | 4,574 |
|
| KFW International Finance | | | | | | | | |
5.090% due 07/10/2006 | | | | 7,300 | | | | 7,293 |
|
| Nordea N.A., Inc. | | | | | | | | |
4.930% due 07/06/2006 | | | | 1,700 | | | | 1,699 |
|
| Sanofi Aventis | | | | | | | | |
4.980% due 07/05/2006 | | | | 4,800 | | | | 4,799 |
|
| Skandinaviska Enskilda Banken | | | | |
4.960% due 07/20/2006 | | | | 4,800 | | | | 4,789 |
|
| Societe Generale N.A. | | | | | | | | |
4.890% due 07/06/2006 | | | | 5,200 | | | | 5,198 |
| | | | | | | | |
| Stadshypoket Delaware, Inc. | | | | | | | | |
5.090% due 08/18/2006 | | $ | | 4,500 | | $ | | 4,471 |
|
| Statens Bostadsfin Bank | | | | | | | | |
4.890% due 07/06/2006 | | | | 4,300 | | | | 4,298 |
|
| Svenska Handelsbanken, Inc. | | | | |
5.000% due 08/28/2006 | | | | 4,800 | | | | 4,763 |
|
| Swedbank, Inc. | | | | | | | | |
4.830% due 08/24/2006 | | | | 4,300 | | | | 4,270 |
4.890% due 08/24/2006 | | | | 1,000 | | | | 993 |
|
| TotalFinaElf Captial S.A. | | | | | | | | |
5.270% due 07/03/2006 | | | | 7,600 | | | | 7,600 |
|
| Toyota Motor Credit Co. | | | | | | | | |
5.270% due 08/09/2006 | | | | 4,700 | | | | 4,675 |
|
| UBS Finance Delaware LLC | | | | | | | | |
5.235% due 08/08/2006 | | | | 6,000 | | | | 5,969 |
|
| Unicredit Delaware, Inc. | | | | | | | | |
5.150% due 11/24/2006 | | | | 2,500 | | | | 2,449 |
|
| Westpac Capital Corp. | | | | | | | | |
5.140% due 12/01/2006 | | | | 1,500 | | | | 1,468 |
| | | | | | | | |
|
| | | | | | | | | 147,885 |
| | | | | | | | |
|
| |
| REPURCHASE AGREEMENT 0.4% | | | | |
| State Street Bank | | | | | | | | |
4.900% due 07/03/2006 | | | | 663 | | | | 663 |
| | | | | | | | |
|
(Dated 06/30/2006. Collateralized by Fannie Mae
5.000% due 01/15/2007 valued at $678. Repurchase proceeds are $663.) |
Total Short-Term Instruments
(Cost $160,648) | | 160,648 |
| | | | | | | | |
|
| |
Total Investments 100.1%
(Cost $160,648) | | $ | | 160,648 |
| |
| Other Assets and Liabilities (Net) (0.1%) | | (232) |
| | | | | | | | |
|
| Net Assets 100.0% | | $ | | 160,416 |
| | | | | | | | |
|
| | | | | | |
| See Accompanying Notes | | Semiannual Report | | June 30, 2006 | | 9 |
Notes to Financial Statements
1. ORGANIZATION
The Money Market Portfolio (the “Portfolio”) is a series of the PIMCO Variable Insurance Trust (the “Trust”). The Trust is registered under the Investment Company Act of 1940 (the “Act”), as amended, as an open-end investment management company organized as a Delaware business trust on October 3, 1997. The Portfolio offers two classes of shares: Institutional and Administrative. Information presented in these financial statements pertains to the Administrative Class of the Portfolio. Certain detailed financial information for the Institutional Class is provided separately and is available upon request. The Trust is designed to be used as an investment vehicle by Separate Accounts of insurance companies that fund variable annuity contracts and variable life insurance policies and by qualified pension and retirement plans.
2. SIGNIFICANT ACCOUNTING POLICIES
The following is a summary of significant accounting policies consistently followed by the Portfolio in the preparation of its financial statements in conformity with accounting principles generally accepted in the United States of America (“GAAP”). The preparation of financial statements in accordance with GAAP requires management to make estimates and assumptions that affect the reported amounts and disclosures in the financial statements. Actual results could differ from those estimates.
Security Valuation. Portfolio securities held by the Portfolio are valued at amortized cost, which approximates current market value.
Securities Transactions and Investment Income. Securities transactions are recorded as of the trade date. Securities purchased or sold on a when-issued or delayed-delivery basis may be settled a month or more after the trade date. Realized gains and losses from securities sold are recorded on the identified cost basis. Dividend income is recorded on the ex-dividend date, except certain dividends from foreign securities where the ex-dividend date may have passed, which are recorded as soon as the Portfolio is informed of the ex-dividend date. Interest income, adjusted for the accretion of discounts and amortization of premiums, is recorded on the accrual basis. Paydown gains and losses on mortgage-related or asset-backed securities are recorded as components of interest income in the Statement of Operations.
Dividends and Distributions to Shareholders. Dividends from net investment income, if any, are declared on each day the Portfolio is open for business and are distributed to shareholders monthly. Net realized capital gains earned by the Portfolio, if any, will be distributed no less frequently than once each year. Most shareholders choose to reinvest their dividends and capital gain distribution in additional shares of the Portfolio.
Income dividends and capital gain distributions are determined in accordance with income tax regulations which may differ from GAAP. Differences between tax regulations and GAAP may change the fiscal year when income and capital items are recognized for tax and GAAP purposes. Examples of events that give rise to timing differences include wash sales, straddles, net operating losses and capital loss carryforwards. Further, the character of investment income and capital gains may be different for certain transactions under the two methods of accounting. Examples of characterization differences include the treatment of mortgage paydowns, swaps, foreign currency transactions and contingent debt instruments. As a result, income dividends and capital gain distributions declared during a fiscal period may differ significantly from the net investment income and realized capital gain reported in the Portfolio’s annual financial statements presented under GAAP.
Distributions classified as a tax basis return of capital, if any, are reflected in the accompanying Statements of Changes in Net Assets and have been reclassified to paid in capital. In addition, other amounts have been reclassified between undistributed net investment income, accumulated undistributed net realized gains or losses and/or paid in capital to more appropriately conform financial accounting to tax characterizations of dividend distributions.
Multiclass Operations. Each class offered by the Portfolio has equal rights as to assets and voting privileges (except that shareholders of a class have exclusive voting rights regarding any matter relating solely to that class of shares). Income and non-class specific expenses of the Portfolio are allocated daily to each class of shares based on the relative value of settled shares. Realized and unrealized capital gains and losses of the Portfolio are allocated daily to each class of shares based on the relative net assets of each class. Class specific expenses, where applicable, currently include administrative, distribution and servicing fees.
Federal Income Taxes. The Portfolio intends to qualify as a regulated investment company under sub-chapter M of the Internal Revenue Code and distribute all of its taxable income and net realized gains, if applicable, to shareholders. Accordingly, no provision for Federal income taxes has been made.
Repurchase Agreements. The Portfolio may engage in repurchase transactions. Under the terms of a typical repurchase agreement, the Portfolio takes possession of an underlying debt obligation subject to an obligation of the seller to repurchase, and the Portfolio to resell, the obligation at an agreed-upon price and time. The market value of the collateral must be equal to or exceed at all times the total amount of the repurchase obligations, including interest. Securities purchased under repurchase agreements are reflected as an asset in the Statement of Assets and Liabilities. Generally, in the event of counterparty default, the Portfolio has the right to use the collateral to offset losses incurred. If the counterparty should default, the Portfolio will seek to sell the securities which it holds as collateral. This could involve procedural costs or delays in addition to a loss on the securities if their value should fall below their repurchase price.
U.S. Government Agencies or Government-Sponsored Enterprises. Securities issued by U.S. Government agencies or government-sponsored enterprises may not be guaranteed by the U.S. Treasury. The Government National Mortgage Association (“GNMA”), a wholly owned U.S. Government corporation, is authorized to guarantee, with the full faith and credit of the U.S. Government, the timely payment of principal and interest on securities issued by institutions approved by GNMA and backed by pools of mortgages insured by the Federal Housing Administration or guaranteed by the Department of Veterans Affairs. Government-related guarantors (i.e., not backed by the full faith and credit of the U.S. Government) include the Federal National Mortgage Association (“FNMA” or “Fannie Mae”) and the Federal Home Loan Mortgage Corporation (“FHLMC” or “Freddie Mac”). Pass-through securities issued by FNMA are guaranteed as to timely payment of principal and interest by FNMA but are not backed by the full faith and credit of the U.S. Government. FHLMC guarantees the timely payment of interest and ultimate collection of principal, but its participation certificates are not backed by the full faith and credit of the U.S. Government.
Guarantees and Indemnifications. Under the Trust’s organizational documents, each Trustee, officer, employee or other agent of the Trust (including the Trust’s investment manager) is indemnified against certain liabilities that may arise out of performance of their duties to the Portfolio. Additionally, in the normal course of business, the Portfolio enters into contracts that contain a variety of indemnification clauses. The Portfolio’s maximum exposure under these arrangements is unknown as this would involve future claims that may be made against the Portfolio that have not yet occurred. However, the Portfolio has not had prior claims or losses pursuant to these contracts, and believes the risk of loss to be remote.
| | | | |
| 10 | | PIMCO Variable Insurance Trust | | |
| | |
| |
| | | June 30, 2006 (Unaudited) |
New Accounting Policies. In July 2006, the Financial Accounting Standards Board issued Interpretation No. 48, “Accounting for Uncertainty in Income Taxes—an Interpretation of FASB Statement No. 109” (the “Interpretation”). The Interpretation is effective for fiscal years beginning after December 15, 2006. Management is currently evaluating the application of the Interpretation to the Portfolio and will provide additional information in relation to the Interpretation in the Portfolio’s annual financial statements for the year ending December 31, 2006.
3. FEES, EXPENSES, AND RELATED PARTY TRANSACTIONS
Investment Advisory Fee. PIMCO is a majority-owned subsidiary of Allianz Global Investors of America L.P. (“AGI”), and serves as investment adviser (the “Adviser”) to the Trust, pursuant to an investment advisory contract. The Adviser receives a monthly fee at an annual rate based on average daily net assets of the Portfolio. The Advisory Fee is charged at an annual rate of 0.15%.
Administration Fee. PIMCO serves as administrator (the “Administrator”), and provides administrative services to the Trust for which it receives a monthly administrative fee based on average daily net assets of the Portfolio. As the Administrator, PIMCO bears the costs of various third-party services, including audit, custodial, portfolio accounting, legal, transfer agency and printing costs. The Administration Fee is charged at the annual rate of 0.20%.
Distribution and Servicing Fees. Allianz Global Investors Distributors LLC (“AGID”) is an indirect wholly-owned subsidiary of AGI and serves as the distributor of the Trust’s shares. The Trust is permitted to reimburse AGID on a quarterly basis, out of the Administrative Class assets of the Portfolio in the amount of 0.15% on an annual basis of the average daily net assets of that class, for payments made to financial intermediaries that provide services in connection with the distribution of shares or administration of plans or programs that use Portfolio shares as their funding medium. The effective rate paid to AGID was 0.15% during the current fiscal year.
Expenses. The Trust is responsible for the following expenses: (i) salaries and other compensation of any of the Trust’s executive officers and employees who are not officers, directors, stockholders or employees of PIMCO or its subsidiaries or affiliates; (ii) taxes and governmental fees; (iii) brokerage fees and commissions and other portfolio transaction expenses; (iv) the costs of borrowing money, including interest expenses and bank overdraft charges; (v) fees and expenses of the Trustees who are not “interested persons” of PIMCO or the Trust, and any counsel retained exclusively for their benefit; (vi) extraordinary expenses, including costs of litigation and indemnification expenses; (vii) organization expenses and (viii) any expenses allocated or allocable to a specific class of shares, which include service fees payable with respect to the Administrative Class shares and may include certain other expenses as permitted by the Trust’s Multiple Class Plan adopted pursuant to Rule 18f-3 under the Act and subject to review and approval by the Trustees. The ratio of expenses to average net assets per share class, as disclosed in the Financial Highlights, may differ from the annual portfolio operating expenses per share class as disclosed in the Prospectus for the reasons set forth above.
For the current period ended June 30, 2006, each unaffiliated Trustee received an annual retainer of $15,000, plus $2,000 for each Board of Trustees quarterly meeting attended, $500 for each Board of Trustees committee meeting attended and $500 for each special board meeting attended, plus reimbursement of related expenses. In addition, each Committee Chair received an additional annual retainer of $500 and each Audit Committee Chair received an additional annual retainer of $1,500. These expenses are allocated on a pro-rata basis to each Portfolio of the Trust according to its respective net assets. The Trust pays no compensation directly to any Trustee or any other officer who is affiliated with the Administrator, all of whom receive remuneration for their services to the Trust from the Administrator or its affiliates.
4. REORGANIZATION
The Acquiring Portfolio (“Money Market Portfolio”), as listed below, acquired the assets and certain liabilities of the Acquired Fund (“CIGNA Times Square VP Money Market Fund”), also listed below, in a tax-free exchange for shares of the Acquiring Portfolio, pursuant to a plan of reorganization approved by the Acquired Portfolio’s shareholders (shares and amounts in thousands):
| | | | | | | | | | | | | | | | | | | | | |
| Acquiring Portfolio | | Acquired Fund | | Date | | Shares
Issued by
Acquiring
Portfolio | | Value of
Shares
Issued by
Acquiring
Portfolio | | Total Net
Assets of
Acquired
Fund | | Total Net
Assets of
Acquiring
Portfolio | | Total Net
Assets of
Acquiring
Portfolio After
Acquisition | | Acquired
Fund’s
Unrealized
Appreciation |
Money Market Portfolio | | CIGNA Times Square VP Money Market Fund | | April 22, 2005 | | 99,297 | | $ | 99,297 | | $ | 99,297 | | $ | 31,353 | | $ | 130,650 | | $ | 0 |
| | | | | | |
| | | Semiannual Report | | June 30, 2006 | | 11 |
Notes to Financial Statements
5. SHARES OF BENEFICIAL INTEREST
The Portfolio may issue an unlimited number of shares of beneficial interest with a $0.001 par value. Changes in shares of beneficial interest were as follows (shares and amounts in thousands):
| | | | | | | | | | | | | | | | | | |
| | | | | Six Months Ended 06/30/2006 | | | | | Year Ended 12/31/2005 | |
| | | | | Shares | | | Amount | | | | | Shares | | | Amount | |
| | | | | | |
Receipts for shares sold | | | | | | | | | | | | | | | | | | |
Institutional Class | | | | 44,771 | | | $ | 44,772 | | | | | 23,543 | | | $ | 23,543 | |
Administrative Class | | | | 32,419 | | | | 32,420 | | | | | 31,350 | | | | 31,350 | |
Issued in reorganization | | | | | | | | | | | | | | | | | | |
Institutional Class | | | | 0 | | | | 0 | | | | | 99,297 | | | | 99,297 | |
Administrative Class | | | | 0 | | | | 0 | | | | | 0 | | | | 0 | |
Issued as reinvestment of distributions | | | | | | | | | | | | | | | | | | |
Institutional Class | | | | 2,282 | | | | 2,282 | | | | | 2,245 | | | | 2,245 | |
Administrative Class | | | | 942 | | | | 942 | | | | | 1,076 | | | | 1,076 | |
Cost of shares redeemed | | | | | | | | | | | | | | | | | | |
Institutional Class | | | | (46,133 | ) | | | (46,133 | ) | | | | (24,902 | ) | | | (24,902 | ) |
Administrative Class | | | | (17,494 | ) | | | (17,494 | ) | | | | (21,176 | ) | | | (21,176 | ) |
Net increase resulting from Portfolio share transactions | | | | 16,787 | | | $ | 16,789 | | | | | 111,433 | | | $ | 111,433 | |
The following schedule shows the number of shareholders each owning 5% or more of the Portfolio and the total percentage of the Portfolio held by such shareholders:
| | | | | | |
| | | | | Number of
Shareholders | | % of Portfolio
Held |
Institutional Class | | | | 3 | | 93 |
Administrative Class | | | | 2 | | 93 |
6. FEDERAL INCOME TAX MATTERS
As of June 30, 2006, the aggregate cost of investments was the same for federal income tax and financial statement purposes. The net unrealized appreciation (depreciation) of investment securities for federal income tax purposes is as follows (amounts in thousands):
| | | | |
Aggregate
Gross
Unrealized
Appreciation | | Aggregate
Gross
Unrealized
(Depreciation) | | Net
Unrealized
(Depreciation) |
$ 0 | | $ 0 | | $ 0 |
7. REGULATORY AND LITIGATION MATTERS
On June 1, 2004, the Attorney General of the State of New Jersey announced that it had dismissed PIMCO from a complaint filed by the New Jersey Attorney General on February 17, 2004, and that it had entered into a settlement agreement (the “New Jersey Settlement”) with Allianz Global Investors of America L.P. (“AGI”) (formerly known as Allianz Dresdner Asset Management of America L.P.), PEA Capital LLC (an entity affiliated with PIMCO through common ownership) (“PEA”) and Allianz Global Investors Distributors LLC (“AGID”), in connection with the same matter. In the New Jersey Settlement, AGI, PEA and AGID neither admitted nor denied the allegations or conclusions of law, but did agree to pay New Jersey a civil fine of $15 million and $3 million for investigative costs and further potential enforcement initiatives against unrelated parties. They also undertook to implement certain governance changes. The complaint relating to the New Jersey Settlement alleged, among other things, that AGI, PEA and AGID had failed to disclose that they improperly allowed certain hedge funds to engage in “market timing” in certain funds. The complaint sought injunctive relief, civil monetary penalties, restitution and disgorgement of profits.
Since February 2004, PIMCO, AGI, PEA, AGID, and certain of their affiliates, including the PIMCO Funds, the Allianz Funds (formerly known as PIMCO Funds: Multi-Manager Series), and the Trustees and employees of the PIMCO Funds, have been named as defendants in fifteen lawsuits filed in various jurisdictions. Eleven of those lawsuits concern “market timing,” and they have been transferred to and consolidated for pre-trial proceedings in a multi-district litigation proceeding in the U.S. District Court for the District of Maryland; the other four lawsuits concern “revenue sharing” and have been consolidated into a single action in the U.S. District Court for the District of Connecticut. The lawsuits have been commenced as putative class actions on behalf of investors who purchased, held or redeemed shares of the various series of the PIMCO Funds and the Allianz Funds during specified periods, or as derivative actions on behalf of the PIMCO Funds and Allianz Funds.
The market timing actions in the District of Maryland generally allege that certain hedge funds were allowed to engage in “market timing” in certain of the PIMCO Funds and the Allianz Funds and this alleged activity was not disclosed. Pursuant to tolling agreements entered into with the derivative and class action plaintiffs, PIMCO, the Trustees, and certain employees of PIMCO who were previously named as defendants have all been dropped as defendants in the market timing actions; the plaintiffs continue to assert claims on behalf of the shareholders of the PIMCO Funds or on behalf of the PIMCO Funds themselves against other defendants. By order dated November 3, 2005, the U.S. District Court for the District of Maryland granted the PIMCO Funds’ motion to dismiss claims asserted against it in a consolidated amended complaint where the PIMCO Funds were named, in the complaint, as a nominal defendant. The revenue sharing action in the District of Connecticut generally alleges that fund assets were inappropriately used to pay brokers to promote the PIMCO Funds and Allianz Funds, including directing fund brokerage transactions to such brokers, and that such alleged arrangements were not fully disclosed to shareholders. On August 11, 2005 the U.S. District Court for the District of Connecticut conducted a hearing on defendants’ motion to dismiss the consolidated amended complaint in the revenue sharing action but has not yet ruled on the motion to dismiss. The market timing and revenue sharing lawsuits seek, among other things, unspecified compensatory damages plus interest and, in some cases, punitive damages, the rescission of investment advisory contracts, the return of fees paid under those contracts and restitution.
Under Section 9(a) of the Investment Company Act of 1940, as amended (“1940 Act”), if the New Jersey Settlement or any of the lawsuits described above were to result in a court injunction against AGI, PEA, AGID and/or their affiliates, PIMCO could, in the absence of exemptive relief granted by the SEC, be barred from serving as an investment adviser, and AGID could be barred from serving as principal underwriter, to any registered investment company, including the Portfolios of the Trust. In connection with an inquiry from the SEC concerning the status of the New Jersey Settlement under Section 9(a), PEA, AGID, AGI and certain of their affiliates (including PIMCO) (together, the “Applicants”) have sought exemptive relief from the SEC under Section 9(c) of the 1940 Act. The SEC has granted the Applicants a temporary exemption from the provisions of Section 9(a) with respect to the New Jersey Settlement until the earlier of (i) September 13, 2006 and (ii) the date on which the SEC takes final action on their application for a permanent order. There is no assurance that the SEC will issue a permanent order.
Two nearly identical class action civil complaints have been filed in August 2005, in the Northern District of Illinois Eastern Division alleging that the plaintiffs each purchased and sold a 10-year Treasury note futures contract and suffered damages from an alleged shortage when PIMCO held both physical and futures positions in
| | | | |
| 12 | | PIMCO Variable Insurance Trust | | |
| | |
| |
| | | June 30, 2006 (Unaudited) |
10-year Treasury notes for its client accounts. The two actions have been consolidated into one action, and the two separate complaints have been replaced by a consolidated complaint. PIMCO is a named defendant, and the PIMCO Funds have been added as a defendant, to the consolidated action. PIMCO strongly believes the complaint (and any consolidated complaint filed hereafter) is without merit and intends to vigorously defend itself.
Certain Portfolios of the Trust were recently served in an adversary proceeding brought by the Official Committee of Asbestos Claimants of G-I Holdings, Inc. in G-I Holdings, Inc.’s bankruptcy in the District of New Jersey. PIMCO was previously named in this lawsuit and remains a defendant. The plaintiff seeks to recover for the bankruptcy estate assets that were transferred by the predecessor entity of G-I Holdings, Inc. to a wholly-owned subsidiary in 1994. The subsidiary has since issued notes, of which certain Portfolios of the Trust are alleged to be holders. The complaint alleges that in 2000, more than two hundred noteholders—including certain Portfolios of the Trust—were granted a second priority lien on the assets of the subsidiary in exchange for their consent to a refinancing transaction and the granting of a first priority lien to the lending banks. The plaintiff is seeking invalidation of the lien in favor of the noteholders and/or the value of the lien.
It is possible that these matters and/or other developments resulting from these matters could result in increased fund redemptions or other adverse consequences to the Portfolios. However, PIMCO and AGID believe that these matters are not likely to have a material adverse effect on the Portfolios or on PIMCO’s or AGID’s ability to perform their respective investment advisory or distribution services relating to the Portfolios.
| | | | | | |
| | | Semiannual Report | | June 30, 2006 | | 13 |
Investment Adviser and Administrator
Pacific Investment Management Company LLC
840 Newport Center Drive
Newport Beach, California 92660
Distributor
Allianz Global Investors Distributors LLC
2187 Atlantic Street
Stamford, Connecticut 06902
Custodian
State Street Bank & Trust Company
801 Pennsylvania
Kansas City, Missouri 64105
Transfer Agent
Boston Financial Data Services–Midwest
330 W. 9th Street
Kansas City, Missouri 64105
Legal Counsel
Dechert LLP
1775 I Street, N.W.
Washington, D.C. 20006
Independent Registered Public Accounting Firm
PricewaterhouseCoopers LLP
1055 Broadway
Kansas City, Missouri 64105
P I M C O

Share Class Administrative
Semiannual Report June 30, 2006
PIMCO Variable Insurance Trust
Real Return Portfolio
Table of Contents
This material is authorized for use only when preceded or accompanied by the current PIMCO Variable Insurance Trust (the “Trust”) prospectus. Investors should consider the investment objectives, risks, charges and expenses of this Trust carefully before investing. Ask your financial professional to explain all charges that may apply. This and other information is contained in the Trust’s prospectus. The variable product prospectus may be obtained by contacting your Investment Consultant. Please read the Trust and variable product prospectus carefully before you invest or send money.
Chairman’s Letter
Dear PIMCO Variable Insurance Trust Shareholder:
It is our pleasure to present to you the semiannual report for the PIMCO Variable Insurance Trust covering the six-month period ended June 30, 2006.
Highlights of the global bond markets during the six-month period included:
| | n | | Most fixed-income sectors lost ground during the first half of 2006, as concern about accelerating inflation and central bank tightening pushed interest rates higher worldwide. The benchmark Lehman Brothers Aggregate Bond Index (which includes Treasury, Investment-Grade Corporate, and Residential Mortgage-Backed Securities) returned -0.72% for the first six months of the year. On June 30, the benchmark ten-year Treasury yielded 5.14%, 0.75% higher than at the start of the year. The U.S. yield curve remained flat as shorter-maturity yields rose by a comparable amount. |
| | n | | The Federal Reserve tightened four times during the reporting period, bringing the Federal Funds Rate to 5.25%. The increase near the end of the period was the Federal Reserve’s 17th consecutive rate hike since the start of its tightening cycle in 2004. The Federal Reserve was not alone, as central banks in Europe, India, and China tightened credit in unison for the first time since 2000. The Bank of Japan, whose zero-interest-rate policy has flooded global markets with liquidity, looked set to reverse this policy in the coming months. |
In these pages please find a more complete Portfolio review as it relates to financial-market activities, as well as details about total-return investment performance for the six-month reporting period. Thank you for the trust you have placed in us. We will continue to work diligently to meet your investment needs.
Sincerely,
Brent R. Harris
Chairman, PIMCO Variable Insurance Trust
July 31, 2006
| | | | | | |
| | | Semiannual Report | | June 30, 2006 | | 1 |
Important Information About the Portfolio
PIMCO Variable Insurance Trust (the “Trust”) is an open-end management investment company currently consisting of nineteen separate investment portfolios, including the Real Return Portfolio (the “Portfolio”). The Portfolio is only available as a funding vehicle under variable life insurance policies or variable annuity contracts issued by insurance companies (“Variable Contracts”). Individuals may not purchase shares of the Portfolio directly. Shares of the Portfolio also may be sold to qualified pension and retirement plans outside of the separate account context.
We believe that bond funds have an important role to play in a well diversified investment portfolio. It is important to note, however, that in an environment where interest rates may trend upward, rising rates would negatively impact the performance of most bond funds, and fixed-income securities held by a fund are likely to decrease in value. The price volatility of fixed-income securities can also increase during periods of rising interest rates resulting in increased losses to a fund. Bond funds and individual bonds with a longer duration (a measure of the expected life of a security) tend to be more sensitive to changes in interest rates, usually making them more volatile than securities or funds with shorter durations. The longer-term performance of most bond funds has benefited from capital gains in part resulting from an extended period of declining interest rates. In the event interest rates increase, these capital gains should not be expected to recur.
The Portfolio may be subject to various risks in addition to those described above. Some of these risks may include, but are not limited to, the following: credit risk, high yield risk, market risk, issuer risk, liquidity risk, derivatives risk, mortgage risk, non-U.S. investment risk, currency risk, issuer non-diversification risk, leveraging risk and management risk. A complete description of these risks is contained in the Portfolio’s prospectus. The Portfolio may use derivative instruments for hedging purposes or as part of an investment strategy. Use of these instruments may involve certain costs and risks such as liquidity risk, interest rate risk, market risk, credit risk, management risk and the risk that the Portfolio could not close out a position when it would be most advantageous to do so. A Portfolio investing in derivatives could lose more than the principal amount invested in these instruments. Investing in non-U.S. securities may entail risk due to non-U.S. economic and political developments; this risk may be increased when investing in emerging markets.
On the performance summary page in this Semiannual Report, the Total Return Investment Performance table measures performance assuming that all dividend and capital gain distributions were reinvested.
An investment in the Portfolio is not a deposit of a bank and is not guaranteed or insured by the Federal Deposit Insurance Corporation or any other government agency. It is possible to lose money on investments in the Portfolio.
PIMCO has adopted written proxy voting policies and procedures (“Proxy Policy”) as required by Rule 206(4)-6 under the Investment Advisers Act of 1940. The Proxy Policy has been adopted by the Trust as the policies and procedures that PIMCO will use when voting proxies on behalf of the Portfolio. Copies of the written Proxy Policy and the factors that PIMCO may consider in determining how to vote proxies for the Portfolio, and information about how the Portfolio voted proxies relating to portfolio securities held during the most recent twelve-month period ended June 30, are available without charge, upon request, by calling the Trust at 1-866-746-2606 and on the Securities and Exchange Commission’s (“SEC”) website at http://www.sec.gov.
The Portfolio files its complete schedule of portfolio holdings with the SEC for the first and third quarters of each fiscal year on Form N-Q. A copy of the Trust’s Form N-Q is available on the SEC’s website at http://www.sec.gov and may be reviewed and copied at the SEC’s Public Reference Room in Washington D.C. Information on the operation of the Public Reference Room may be obtained by calling 1-800-SEC-0330.
PIMCO Variable Insurance Trust is distributed by Allianz Global Investors Distributors LLC, 2187 Atlantic Street, Stamford, CT 06902.
| | | | |
| 2 | | PIMCO Variable Insurance Trust | | |
The following disclosure provides important information regarding the Portfolio’s Expense Example (“Example” or “Expense Example”), which appears in this Semiannual Report. Please refer to this information when reviewing the Expense Example for the Portfolio.
Example
As a shareholder of the Portfolio, you incur two types of costs: (1) transaction costs and (2) ongoing costs, including advisory and administrative fees; distribution and/or service (12b-1) fees (Administrative Class only); and other Portfolio expenses. The Example is intended to help you understand your ongoing costs (in dollars) of investing in the Portfolio and to compare these costs with the ongoing costs of investing in other mutual funds. The Expense Example does not reflect any fees or other expenses imposed by the Variable Contracts. If it did, the expenses reflected in the Expense Examples would be higher. The Example is based on an investment of $1,000 invested at the beginning of the period and held for the entire period indicated, which is from January 1, 2006 to June 30, 2006.
Actual Expenses
The information in the table under the heading “Actual Performance” provides information about actual account values and actual expenses. You may use the information in these columns, together with the amount you invested, to estimate the expenses that you paid over the period. Simply divide your account value by $1,000 (for example, an $8,600 account value divided by $1,000 = 8.60), then multiply the result by the number in the appropriate column for your share class, in the row titled “Expenses Paid During Period” to estimate the expenses you paid on your account during this period.
Hypothetical Example for Comparison Purposes
The information in the table under the heading “Hypothetical Performance (5% return before expenses)” provides information about hypothetical account values and hypothetical expenses based on the Portfolio’s actual expense ratio and an assumed rate of return of 5% per year before expenses, which is not the Portfolio’s actual return. The hypothetical account values and expenses may not be used to estimate the actual ending account balance or expenses you paid for the period. You may use this information to compare the ongoing costs of investing in the Portfolio and other portfolios. To do so, compare this 5% hypothetical example with the 5% hypothetical examples that appear in the shareholder reports of the other portfolios.
Please note that the expenses shown in the table are meant to highlight your ongoing costs only and do not reflect any transactional costs. Therefore, the information under the heading “Hypothetical Performance (5% return before expenses)” is useful in comparing ongoing costs only, and will not help you determine the relative total costs of owning different portfolios. In addition, if these transactional costs were included, your costs would have been higher.
The expense ratio may vary period to period because of various factors, such as an increase in expenses not covered by the advisory and administrative fees (such as expenses of the trustees and their counsel or litigation expense).
Portfolio Benchmark
Lehman Brothers U.S. TIPS Index is an unmanaged market index comprised of all U.S. Treasury Inflation Protected Securities rated investment grade (Baa3 or better), have at least one year to final maturity, and at least $250 million par amount outstanding.
| | | | | | |
| | | Semiannual Report | | June 30, 2006 | | 3 |
| | | | |
| | |
| PIMCO Real Return Portfolio | | | | |
| | | | |
Cumulative Returns Through June 30, 2006
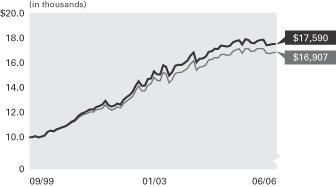
Real Return Portfolio Lehman Brothers
Administrative Class U.S. TIPS Index
-------------------- ---------------
09/30/1999 $10,000 $10,000
10/31/1999 10,013 10,020
11/30/1999 10,090 10,081
12/31/1999 9,997 10,000
01/31/2000 10,060 10,045
02/29/2000 10,131 10,139
03/31/2000 10,441 10,434
04/30/2000 10,545 10,573
05/31/2000 10,489 10,545
06/30/2000 10,655 10,678
07/31/2000 10,737 10,769
08/31/2000 10,822 10,849
09/30/2000 10,913 10,905
10/31/2000 11,100 11,037
11/30/2000 11,269 11,197
12/31/2000 11,407 11,318
01/31/2001 11,711 11,555
02/28/2001 11,902 11,750
03/31/2001 12,000 11,863
04/30/2001 12,122 11,929
05/31/2001 12,263 12,070
06/30/2001 12,247 12,056
07/31/2001 12,461 12,257
08/31/2001 12,534 12,274
09/30/2001 12,659 12,345
10/31/2001 12,963 12,638
11/30/2001 12,625 12,357
12/31/2001 12,506 12,212
01/31/2002 12,579 12,284
02/28/2002 12,734 12,471
03/31/2002 12,667 12,393
04/30/2002 13,045 12,732
05/31/2002 13,260 12,934
06/30/2002 13,436 13,117
07/31/2002 13,710 13,334
08/31/2002 14,199 13,811
09/30/2002 14,557 14,159
10/31/2002 14,187 13,781
11/30/2002 14,191 13,771
12/31/2002 14,728 14,234
01/31/2003 14,778 14,342
02/28/2003 15,360 14,879
03/31/2003 15,126 14,638
04/30/2003 15,102 14,600
05/31/2003 15,843 15,293
06/30/2003 15,729 15,136
07/31/2003 15,023 14,438
08/31/2003 15,298 14,697
09/30/2003 15,815 15,183
10/31/2003 15,890 15,265
11/30/2003 15,872 15,275
12/31/2003 16,029 15,430
01/31/2004 16,246 15,607
02/29/2004 16,644 15,968
03/31/2004 16,888 16,223
04/30/2004 16,106 15,436
05/31/2004 16,388 15,714
06/30/2004 16,397 15,721
07/31/2004 16,552 15,868
08/31/2004 16,943 16,293
09/30/2004 16,999 16,326
10/31/2004 17,187 16,489
11/30/2004 17,169 16,449
12/31/2004 17,458 16,736
01/31/2005 17,415 16,738
02/28/2005 17,387 16,666
03/31/2005 17,432 16,681
04/30/2005 17,723 17,000
05/31/2005 17,829 17,117
06/30/2005 17,883 17,189
07/31/2005 17,544 16,829
08/31/2005 17,958 17,217
09/30/2005 17,912 17,193
10/31/2005 17,684 16,973
11/30/2005 17,638 17,002
12/31/2005 17,824 17,212
01/31/2006 17,905 17,210
02/28/2006 17,930 17,202
03/31/2006 17,482 16,824
04/30/2006 17,525 16,810
05/31/2006 17,583 16,860
06/30/2006 17,590 16,907
$10,000 invested at the beginning of the first full month following the inception date of the Portfolio’s Administrative Class.
Sector Breakdown‡
| | |
U.S. Treasury Obligations | | 50.9% |
Short-Term Instruments | | 32.5% |
U.S. Government Agencies | | 6.4% |
Asset-Backed Securities | | 5.2% |
Other | | 5.0% |
| | ‡ | % of Total Investments as of June 30, 2006 |
| | | | | | | | | | | | |
| Average Annual Total Return for the period ended June 30, 2006 | | | | |
| | | | | | | 6 Months* | | 1 Year | | 5 Years | | Since
Inception
(09/30/99) |
| | |
| | PIMCO Real Return Portfolio Administrative Class | | -1.31% | | -1.64% | | 7.51% | | 8.72% |
| | |
| | Lehman Brothers U.S. TIPS Index | | -1.77% | | -1.64% | | 7.00% | | 8.09% |
All Portfolio returns are net of fees and expenses.
* Cumulative return.
Past performance is no guarantee of future results. The performance quoted represents past performance. Investment return and principal value will fluctuate so the Portfolio shares, when redeemed, may be worth more or less than their original cost. The Portfolio’s performance does not reflect the deduction of additional charges and expenses imposed in connection with investing in Variable Contracts, which will reduce returns. Current performance may be lower or higher than the performance data quoted. Performance data current to the most recent month-end is available by calling (800) 927-4648.
| | | | | | | | | | |
| Expense Example | | | | Actual Performance | | | | Hypothetical Performance |
| | | | | | | | | (5% return before expenses) |
Beginning Account Value (01/01/06) | | | | $ | 1,000.00 | | | | $ | 1,000.00 |
Ending Account Value (06/30/06) | | | | $ | 986.90 | | | | $ | 1,021.52 |
Expenses Paid During Period† | | | | $ | 3.25 | | | | $ | 3.31 |
† Expenses are equal to the Portfolio’s Administrative Class annualized expense ratio of 0.66%, multiplied by the average account value over the period, multiplied by 181/365 (to reflect the one-half year period). Overall fees and expenses of investing in the Portfolio will be higher because the example does not reflect Variable Contract fees and expenses.
Please refer to page 3 herein for a description of the Portfolio’s benchmark and an explanation of the information presented in the above Expense Example.
Portfolio Insights
| » | | The PIMCO Real Return Portfolio seeks to achieve its investment objective by investing under normal circumstances at least 80% of its net assets in inflation-indexed bonds of varying maturities issued by the U.S. and non-U.S. governments, their agencies or instrumentalities, and corporations. |
| » | | For the six-month period ending June 30, 2006, ten-year real yields increased by 0.48%, compared to a 0.82% increase for conventional U.S. Treasury issues of similar maturity. |
| » | | The Portfolio’s above benchmark duration for the first three-months of the period detracted from overall performance, as real yields rose on strong U.S. economic growth. The effective duration of the Portfolio was 6.79 years on June 30, 2006 compared to a duration of 6.11 years for the benchmark. |
| » | | The Portfolio’s emphasis on U.S. nominal bonds was negative for performance, as nominal yields rose faster than real yields based on higher inflation expectations and the outlook for further Federal Reserve tightening. |
| » | | Exposure to short maturity U.S. nominal bonds for the period detracted significantly from performance due to a substantial flattening of the nominal yield curve. |
| » | | Currency exposure added to performance resulting from a depreciation of the U.S. dollar relative to the Euro and Japanese Yen. |
| » | | Mortgage holdings during the period were positive due to favorable coupon selection, particularly 15-year FNMA 5.0% and 30-year FNMA 5.5% coupons, which outperformed the broader Index. |
| » | | Positions in pay-fixed swaps were beneficial with swap spreads mostly widening over the period. |
| | | | |
| 4 | | PIMCO Variable Insurance Trust | | |
|
|
| Financial Highlights Real Return Portfolio |
| | | | | | | | | | | | | | | | | | | | | | | | |
| Selected Per Share Data for the Year or Period Ended: | | 06/30/2006+ | | | 12/31/2005 | | | 12/31/2004 | | | 12/31/2003 | | | 12/31/2002 | | | 12/31/2001 | |
| | | | | | |
Administrative Class | | | | | | | | | | | | | | | | | | | | | | | | |
| Net asset value beginning of period | | $ | 12.69 | | | $ | 12.92 | | | $ | 12.36 | | | $ | 11.90 | | | $ | 10.56 | | | $ | 10.34 | |
| Net investment income (a) | | | 0.24 | | | | 0.36 | | | | 0.13 | | | | 0.27 | | | | 0.48 | | | | 0.61 | |
| Net realized/unrealized gain (loss) on investments (a) | | | (0.41 | ) | | | (0.09 | ) | | | 0.97 | | | | 0.77 | | | | 1.36 | | | | 0.38 | |
| Total income (loss) from investment operations | | | (0.17 | ) | | | 0.27 | | | | 1.10 | | | | 1.04 | | | | 1.84 | | | | 0.99 | |
| Dividends from net investment income | | | (0.24 | ) | | | (0.36 | ) | | | (0.13 | ) | | | (0.32 | ) | | | (0.48 | ) | | | (0.63 | ) |
| Distributions from net realized capital gains | | | 0.00 | | | | (0.14 | ) | | | (0.41 | ) | | | (0.26 | ) | | | (0.02 | ) | | | (0.14 | ) |
| Total distributions | | | (0.24 | ) | | | (0.50 | ) | | | (0.54 | ) | | | (0.58 | ) | | | (0.50 | ) | | | (0.77 | ) |
| Net asset value end of period | | $ | 12.28 | | | $ | 12.69 | | | $ | 12.92 | | | $ | 12.36 | | | $ | 11.90 | | | $ | 10.56 | |
| Total return | | | (1.31 | )% | | | 2.09 | % | | | 8.92 | % | | | 8.84 | % | | | 17.77 | % | | | 9.63 | % |
| Net assets end of period (000s) | | $ | 1,084,003 | | | $ | 1,012,042 | | | $ | 636,565 | | | $ | 275,029 | | | $ | 90,724 | | | $ | 7,406 | |
| Ratio of expenses to average net assets | | | 0.66 | %*(c) | | | 0.66 | %(c) | | | 0.65 | % | | | 0.66 | %(c) | | | 0.66 | %(c) | | | 0.66 | %(b)(c) |
| Ratio of net investment income to average net assets | | | 3.94 | %* | | | 2.79 | % | | | 1.03 | % | | | 2.21 | % | | | 4.19 | % | | | 5.63 | % |
| Portfolio turnover rate | | | 530 | % | | | 1,102 | % | | | 1,064 | % | | | 738 | % | | | 87 | % | | | 58 | % |
+ Unaudited
* Annualized
(a) Per share amounts based on average number of shares outstanding during the period.
(b) If the investment manager had not reimbursed expenses, the ratio of expenses to average net assets would have been 0.67%.
(c) Ratio of expenses to average net assets excluding interest expense is 0.65%.
| | | | | | |
| See Accompanying Notes | | Semiannual Report | | June 30, 2006 | | 5 |
|
|
| Statement of Assets and Liabilities Real Return Portfolio |
| | | | |
| (Amounts in thousands, except per share amounts) | | June 30, 2006
(Unaudited) | |
| |
Assets: | | | | |
Investments, at value | | $ | 2,350,300 | |
Cash | | | 77 | |
Foreign currency, at value | | | 1,422 | |
Receivable for investments sold | | | 12 | |
Receivable for investments sold on delayed-delivery basis | | | 22,982 | |
Receivable for Portfolio shares sold | | | 766 | |
Interest and dividends receivable | | | 4,444 | |
Variation margin receivable | | | 255 | |
Swap premiums paid | | | 5,195 | |
Unrealized appreciation on forward foreign currency contracts | | | 348 | |
Unrealized appreciation on swap agreements | | | 2,046 | |
| | | | 2,387,847 | |
| |
Liabilities: | | | | |
Payable for investments purchased | | $ | 32,923 | |
Payable for investments purchased on delayed-delivery basis | | | 1,206,598 | |
Payable for short sales | | | 7,365 | |
Payable for Portfolio shares redeemed | | | 3,639 | |
Written options outstanding | | | 675 | |
Accrued investment advisory fee | | | 247 | |
Accrued administration fee | | | 247 | |
Accrued servicing fee | | | 129 | |
Dividends payable | | | 11 | |
Variation margin payable | | | 56 | |
Swap premiums received | | | 1,677 | |
Unrealized depreciation on forward foreign currency contracts | | | 3,648 | |
Unrealized depreciation on swap agreements | | | 402 | |
Other liabilities | | | 3,250 | |
| | | | 1,260,867 | |
| |
Net Assets | | $ | 1,126,980 | |
| |
Net Assets Consist of: | | | | |
Paid in capital | | $ | 1,156,146 | |
Undistributed net investment income | | | 5,699 | |
Accumulated undistributed net realized (loss) | | | (42,472 | ) |
Net unrealized appreciation | | | 7,607 | |
| | | $ | 1,126,980 | |
| |
Net Assets: | | | | �� |
Institutional Class | | $ | 42,291 | |
Administrative Class | | | 1,084,003 | |
Advisor Class | | | 686 | |
| |
Shares Issued and Outstanding: | | | | |
Institutional Class | | | 3,444 | |
Administrative Class | | | 88,285 | |
Advisor Class | | | 56 | |
| |
Net Asset Value and Redemption Price Per Share (Net Assets Per Share Outstanding) | | | | |
Institutional Class | | $ | 12.28 | |
Administrative Class | | | 12.28 | |
Advisor Class | | | 12.28 | |
| |
Cost of Investments Owned | | $ | 2,337,734 | |
Cost of Foreign Currency Held | | $ | 1,398 | |
Proceeds Received on Short Sales | | $ | 7,304 | |
Premiums Received on Written Options | | $ | 1,008 | |
| | | | |
| 6 | | PIMCO Variable Insurance Trust | | See Accompanying Notes |
|
|
| Statement of Operations Real Return Portfolio |
| | | | |
| (Amounts in Thousands) | | Six Months Ended
June 30, 2006
(Unaudited) | |
| |
Investment Income: | | | | |
Interest | | $ | 25,056 | |
Miscellaneous income | | | 2 | |
Total Income | | | 25,058 | |
| |
Expenses: | | | | |
Investment advisory fees | | | 1,362 | |
Administration fees | | | 1,362 | |
Servicing fees – Administrative Class | | | 785 | |
Trustee’s Fees | | | 6 | |
Interest expense | | | 60 | |
Total Expenses | | | 3,575 | |
| |
Net Investment Income | | | 21,483 | |
| |
Net Realized and Unrealized Gain (Loss): | | | | |
Net realized (loss) on investments | | | (45,095 | ) |
Net realized gain on futures contracts, options and swaps | | | 5,187 | |
Net realized (loss) on foreign currency transactions | | | (1,030 | ) |
Net change in unrealized appreciation on investments | | | 725 | |
Net change in unrealized appreciation on futures contracts, options and swaps | | | 1,515 | |
Net change in unrealized appreciation on translation of assets and liabilities denominated in foreign currencies | | | 2,739 | |
Net (Loss) | | | (35,959 | ) |
| |
Net (Decrease) in Net Assets Resulting from Operations | | $ | (14,476 | ) |
| | | | | | |
| See Accompanying Notes | | Semiannual Report | | June 30, 2006 | | 7 |
|
|
| Statements of Changes in Net Assets Real Return Portfolio |
| | | | | | | | |
| (Amounts in Thousands) | | Six Months Ended
June 30, 2006
(Unaudited) | | | Year Ended
December 31, 2005 | |
| | |
Increase (Decrease) in Net Assets from: | | | | | | | | |
| | |
Operations: | | | | | | | | |
Net investment income | | $ | 21,483 | | | $ | 24,960 | |
Net realized gain (loss) | | | (40,938 | ) | | | 521 | |
Net change in unrealized appreciation (depreciation) | | | 4,979 | | | | (6,910 | ) |
Net increase (decrease) resulting from operations | | | (14,476 | ) | | | 18,571 | |
| | |
Distributions to Shareholders: | | | | | | | | |
| From net investment income | | | | | | | | |
Institutional Class | | | (880 | ) | | | (1,276 | ) |
Administrative Class | | | (20,757 | ) | | | (24,317 | ) |
Advisor Class | | | (3 | ) | | | 0 | |
| From net realized capital gains | | | | | | | | |
Institutional Class | | | 0 | | | | (483 | ) |
Administrative Class | | | 0 | | | | (10,897 | ) |
Advisor Class | | | 0 | | | | 0 | |
| | |
Total Distributions | | | (21,640 | ) | | | (36,973 | ) |
| | |
Portfolio Share Transactions: | | | | | | | | |
| Receipts for shares sold | | | | | | | | |
Institutional Class | | | 1,995 | | | | 11,510 | |
Administrative Class | | | 206,303 | | | | 460,693 | |
Advisor Class | | | 804 | | | | 0 | |
| Issued as reinvestment of distributions | | | | | | | | |
Institutional Class | | | 880 | | | | 1,759 | |
Administrative Class | | | 20,703 | | | | 35,153 | |
Advisor Class | | | 3 | | | | 0 | |
| Cost of shares redeemed | | | | | | | | |
Institutional Class | | | (3,802 | ) | | | (4,483 | ) |
Administrative Class | | | (120,373 | ) | | | (102,785 | ) |
Advisor Class | | | (118 | ) | | | 0 | |
Net increase resulting from Portfolio share transactions | | | 106,395 | | | | 401,847 | |
| | |
Total Increase in Net Assets | | | 70,279 | | | | 383,445 | |
| | |
Net Assets: | | | | | | | | |
Beginning of period | | | 1,056,701 | | | | 673,256 | |
End of period* | | $ | 1,126,980 | | | $ | 1,056,701 | |
| | |
*Including undistributed net investment income of: | | $ | 5,699 | | | $ | 5,856 | |
| | | | |
| 8 | | PIMCO Variable Insurance Trust | | See Accompanying Notes |
| | |
| |
| Schedule of Investments Real Return Portfolio | | June 30, 2006 (Unaudited) |
| | | | | | | | |
| | | | | PRINCIPAL | | | | |
| | | | | AMOUNT | | | | VALUE |
| | | | | (000S) | | | | (000S) |
| | | | | | | | | |
| BANK LOAN OBLIGATIONS 0.1% |
| Georgia-Pacific Corp. | | | | | | | | |
6.726% due 12/20/2012 | | $ | | 45 | | $ | | 46 |
6.880% due 12/20/2012 | | | | 762 | | | | 761 |
7.170% due 12/20/2012 | | | | 190 | | | | 190 |
| | | | | | | | |
|
Total Bank Loan Obligations (Cost $997) | | 997 |
| | | | | | | | |
|
| |
| CORPORATE BONDS & NOTES 5.2% |
| |
| BANKING & FINANCE 4.4% |
| Atlantic & Western Re Ltd. | | | | | | | | |
11.508% due 01/09/2007 | | | | 1,400 | | | | 1,379 |
11.758% due 01/09/2009 | | | | 900 | | | | 848 |
|
| BAE Systems Holdings, Inc. | | | | | | | | |
5.570% due 08/15/2008 | | | | 300 | | | | 301 |
|
| Charter One Bank N.A. | | | | | | | | |
5.157% due 04/24/2009 | | | | 8,400 | | | | 8,405 |
|
| Citigroup, Inc. | | | | | | | | |
5.199% due 05/02/2008 | | | | 1,000 | | | | 1,001 |
5.166% due 01/30/2009 | | | | 1,000 | | | | 1,000 |
|
| Ford Motor Credit Co. | | | | | | | | |
6.374% due 03/21/2007 | | | | 6,400 | | | | 6,378 |
|
| General Electric Capital Corp. | | | | |
5.311% due 03/04/2008 | | | | 2,800 | | | | 2,803 |
5.340% due 12/12/2008 | | | | 900 | | | | 901 |
|
| General Motors Acceptance Corp. | | | | |
6.750% due 12/01/2014 | | | | 1,600 | | | | 1,488 |
|
| Goldman Sachs Group, Inc. | | | | | | | | |
5.386% due 08/01/2006 | | | | 2,800 | | | | 2,800 |
5.790% due 06/28/2010 | | | | 4,700 | | | | 4,728 |
|
| Mirage Resorts, Inc. | | | | | | | | |
7.250% due 10/15/2006 | | | | 100 | | | | 101 |
|
| Morgan Stanley Warehouse Facilities |
4.719% due 08/16/2006 (h) | | | | 6,200 | | | | 6,200 |
|
| Phoenix Quake Ltd. | | | | | | | | |
7.958% due 07/03/2008 | | | | 500 | | | | 507 |
|
| Phoenix Quake Wind Ltd. | | | | | | | | |
7.440% due 07/03/2008 | | | | 2,000 | | | | 2,021 |
|
| Rabobank Nederland | | | | | | | | |
5.088% due 01/15/2009 | | | | 800 | | | | 800 |
|
| Toyota Motor Credit Corp. | | | | | | | | |
5.192% due 09/18/2006 | | | | 4,600 | | | | 4,600 |
|
| Travelers Property Casualty Corp. |
3.750% due 03/15/2008 | | | | 100 | | | | 97 |
|
| Vita Capital Ltd. | | | | | | | | |
6.340% due 01/01/2007 | | | | 700 | | | | 702 |
|
| Wachovia Bank N.A. | | | | | | | | |
5.308% due 12/02/2010 | | | | 2,400 | | | | 2,402 |
| | | | | | | | |
|
| | | | | | | | | 49,462 |
| | | | | | | | |
|
| |
| INDUSTRIALS 0.7% | | | | | | | | |
| Caesars Entertainment, Inc. | | | | | | | | |
8.500% due 11/15/2006 | | | | 300 | | | | 303 |
|
| CSC Holdings, Inc. | | | | | | | | |
7.875% due 12/15/2007 | | | | 600 | | | | 609 |
|
| DaimlerChrysler N.A. Holding Corp. |
5.486% due 03/07/2007 | | | | 3,500 | | | | 3,501 |
|
| EchoStar DBS Corp. | | | | | | | | |
5.750% due 10/01/2008 | | | | 500 | | | | 490 |
| | | | | | | | |
| El Paso Corp. | | | | | | | | |
7.625% due 08/16/2007 | | $ | | 100 | | $ | | 101 |
6.950% due 12/15/2007 | | | | 100 | | | | 101 |
7.625% due 09/01/2008 | | | | 1,000 | | | | 1,018 |
|
| HCA, Inc. | | | | | | | | |
7.250% due 05/20/2008 | | | | 100 | | | | 102 |
|
| Host Marriott LP | | | | | | | | |
9.500% due 01/15/2007 | | | | 300 | | | | 309 |
9.250% due 10/01/2007 | | | | 100 | | | | 104 |
|
| Pemex Project Funding Master Trust |
7.375% due 12/15/2014 | | | | 500 | | | | 517 |
8.625% due 02/01/2022 | | | | 200 | | | | 224 |
|
| Royal Caribbean Cruises Ltd. | | | | | | | | |
7.250% due 08/15/2006 | | | | 400 | | | | 402 |
7.000% due 10/15/2007 | | | | 200 | | | | 203 |
|
| Starwood Hotels & Resorts Worldwide, Inc. |
7.375% due 05/01/2007 | | | | 100 | | | | 101 |
| | | | | | | | |
|
| | | | | | | | | 8,085 |
| | | | | | | | |
|
| |
| UTILITIES 0.1% | | | | | | | | |
| Cleveland Electric Illuminating Co. |
6.860% due 10/01/2008 | | | | 100 | | | | 102 |
|
| Embarq Corp. | | | | | | | | |
7.082% due 06/01/2016 | | | | 300 | | | | 299 |
|
| Nisource Finance Corp. | | | | | | | | |
5.764% due 11/23/2009 | | | | 800 | | | | 802 |
| | | | | | | | |
|
| | | | | | | | | 1,203 |
| | | | | | | | |
|
Total Corporate Bonds & Notes
(Cost $58,671) | | 58,750 |
| | | | | | | | |
|
| |
| MUNICIPAL BONDS & NOTES 0.1% |
| Badger, Wisconsin Tobacco Asset Securitization Corporations Revenue Notes, Series 2002 |
6.000% due 06/01/2017 (a) | | | | 475 | | | | 501 |
|
| New York City, New York Municipal Water Finance Authority Revenue Notes, Series 2006 |
5.781% due 06/15/2038 (a) | | | | 130 | | | | 121 |
|
| Rhode Island State Tobacco Settlement Financing Corporations Revenue Notes, Series 2002 |
6.000% due 06/01/2023 (a) | | | | 500 | | | | 523 |
| | | | | | | | |
|
Total Municipal Bonds & Notes
(Cost $1,012) | | 1,145 |
| | | | | | | | |
|
| |
| U.S. GOVERNMENT AGENCIES 13.3% |
| Fannie Mae | | | | | | | | |
4.192% due 11/01/2034 | | | | 7,868 | | | | 7,714 |
4.500% due 10/25/2022 | | | | 200 | | | | 199 |
4.606% due 07/01/2035 | | | | 1,045 | | | | 1,031 |
4.681% due 02/25/2036 | | | | 2,900 | | | | 2,810 |
4.716% due 01/01/2035 | | | | 847 | | | | 832 |
5.111% due 09/07/2006 | | | | 27,600 | | | | 27,590 |
5.211% due 03/01/2044 - 09/01/2044 (c) | | | | 13,622 | | | | 13,686 |
5.299% due 09/21/2006 | | | | 14,100 | | | | 14,098 |
5.472% due 08/25/2034 | | | | 985 | | | | 984 |
5.500% due 03/01/2034 - 07/13/2036 (c) | | | | 45,489 | | | | 43,717 |
5.672% due 05/25/2042 | | | | 384 | | | | 385 |
5.950% due 02/25/2044 | | | | 1,500 | | | | 1,487 |
6.361% due 11/01/2024 | | | | 23 | | | | 24 |
|
| Freddie Mac | | | | | | | | |
4.000% due 03/15/2023 - 10/15/2023 (c) | | | | 1,434 | | | | 1,403 |
4.555% due 01/01/2034 | | | | 847 | | | | 829 |
5.211% due 10/25/2044 - 02/25/2045 (c) | | | | 27,174 | | | | 27,276 |
| | | | | | | | |
5.549% due 12/15/2030 | | $ | | 598 | | $ | | 599 |
5.582% due 08/25/2031 | | | | 267 | | | | 268 |
|
| Small Business Administration |
4.504% due 02/01/2014 | | | | 1,938 | | | | 1,826 |
|
| Small Business Administration Participation Certificates |
4.880% due 11/01/2024 | | | | 3,881 | | | | 3,670 |
| | | | | | | | |
|
Total U.S. Government Agencies
(Cost $151,517) | | 150,428 |
| | | | | | | | |
|
| |
| U.S. TREASURY OBLIGATIONS 106.1% |
| Treasury Inflation Protected Securities (b) |
3.375% due 01/15/2007 | | | | 255 | | | | 256 |
3.625% due 01/15/2008 | | | | 72,756 | | | | 74,029 |
3.875% due 01/15/2009 | | | | 79,566 | | | | 82,438 |
4.250% due 01/15/2010 | | | | 50,443 | | | | 53,603 |
0.875% due 04/15/2010 | | | | 108,925 | | | | 102,785 |
3.500% due 01/15/2011 | | | | 48,130 | | | | 50,358 |
2.375% due 04/15/2011 | | | | 18,044 | | | | 17,978 |
3.375% due 01/15/2012 | | | | 4,558 | | | | 4,776 |
3.000% due 07/15/2012 | | | | 107,133 | | | | 110,356 |
1.875% due 07/15/2013 | | | | 43,406 | | | | 41,712 |
2.000% due 01/15/2014 | | | | 102,388 | | | | 98,861 |
2.000% due 07/15/2014 | | | | 99,400 | | | | 95,754 |
1.625% due 01/15/2015 | | | | 3,497 | | | | 3,261 |
1.875% due 07/15/2015 | | | | 115,676 | | | | 109,797 |
2.000% due 01/15/2016 | | | | 16,209 | | | | 15,484 |
2.375% due 01/15/2025 | | | | 93,066 | | | | 90,609 |
2.000% due 01/15/2026 | | | | 39,962 | | | | 36,600 |
3.625% due 04/15/2028 | | | | 66,504 | | | | 78,934 |
3.875% due 04/15/2029 | | | | 83,450 | | | | 103,282 |
3.375% due 04/15/2032 | | | | 1,824 | | | | 2,154 |
|
| U.S. Treasury Bonds | | | | | | | | |
8.875% due 08/15/2017 | | | | 1,000 | | | | 1,305 |
6.625% due 02/15/2027 | | | | 1,300 | | | | 1,514 |
4.500% due 02/15/2036 | | | | 4,400 | | | | 3,947 |
|
| U.S. Treasury Notes | | | | | | | | |
4.500% due 02/28/2011 | | | | 1,700 | | | | 1,658 |
4.875% due 04/30/2011 | | | | 10,600 | | | | 10,495 |
4.250% due 11/15/2014 | | | | 1,000 | | | | 941 |
4.125% due 05/15/2015 | | | | 100 | | | | 93 |
4.500% due 11/15/2015 | | | | 2,800 | | | | 2,668 |
| | | | | | | | |
|
Total U.S. Treasury Obligations
(Cost $1,187,521) | | 1,195,648 |
| | | | | | | | |
|
| |
| MORTGAGE-BACKED SECURITIES 4.6% |
| Banc of America Funding Corp. |
4.622% due 02/20/2036 | | | | 3,602 | | | | 3,519 |
|
| Banc of America Mortgage Securities |
6.500% due 02/25/2033 | | | | 232 | | | | 231 |
|
| Bear Stearns Adjustable Rate Mortgage Trust |
4.203% due 01/25/2034 | | | | 2,567 | | | | 2,554 |
|
| Citigroup Mortgage Loan Trust, Inc. |
4.700% due 12/25/2035 | | | | 4,662 | | | | 4,572 |
4.900% due 12/25/2035 | | | | 277 | | | | 275 |
|
| Countrywide Alternative Loan Trust |
5.392% due 06/25/2046 | | | | 992 | | | | 989 |
|
| Countrywide Home Loan Mortgage Pass-Through Trust |
3.795% due 11/19/2033 | | | | 291 | | | | 278 |
5.662% due 06/25/2035 | | | | 867 | | | | 867 |
|
| CS First Boston Mortgage Securities Corp. |
4.938% due 05/15/2010 | | | | 1,222 | | | | 1,204 |
|
| First Horizon Alternative Mortgage Securities |
4.744% due 06/25/2034 | | | | 1,123 | | | | 1,101 |
| | | | | | |
| See Accompanying Notes | | Semiannual Report | | June 30, 2006 | | 9 |
| | |
| |
| Schedule of Investments Real Return Portfolio (Cont.) | | |
| | | | |
| | | PRINCIPAL | | |
| | | AMOUNT | | VALUE |
| | | (000S) | | (000S) |
| | | | | |
| | | | | | | | |
| GE Capital Commercial Mortgage Corp. |
4.229% due 12/10/2037 | | $ | | 8,709 | | $ | | 8,415 |
|
| GGP Mall Properties Trust | | | | | | | | |
5.007% due 11/15/2011 | | | | 1,431 | | | | 1,429 |
|
| Greenpoint Mortgage Funding Trust |
5.542% due 05/25/2045 | | | | 1,860 | | | | 1,867 |
5.592% due 11/25/2045 | | | | 1,203 | | | | 1,206 |
|
| GSR Mortgage Loan Trust | | | | | | | | |
4.540% due 09/25/2035 | | | | 2,469 | | | | 2,403 |
|
| Lehman XS Trust | | | | | | | | |
5.402% due 06/25/2036 | | | | 1,500 | | | | 1,502 |
5.402% due 04/25/2046 | | | | 2,937 | | | | 2,938 |
|
| MASTR Adjustable Rate Mortgages Trust |
3.786% due 11/21/2034 | | | | 700 | | | | 659 |
|
| Mellon Residential Funding Corp. |
5.639% due 12/15/2030 | | | | 1,275 | | | | 1,280 |
5.549% due 11/15/2031 | | | | 1,558 | | | | 1,561 |
|
| Sequoia Mortgage Trust | | | | | | | | |
5.602% due 10/19/2026 | | | | 537 | | | | 538 |
|
| Structured Adjustable Rate Mortgage Loan Trust |
4.580% due 02/25/2034 | | | | 885 | | | | 867 |
5.682% due 01/25/2035 | | | | 819 | | | | 827 |
|
| Structured Asset Mortgage Investments, Inc. |
5.540% due 05/25/2035 | | | | 500 | | | | 501 |
|
| Washington Mutual, Inc. | | | | | | | | |
5.612% due 08/25/2045 | | | | 428 | | | | 429 |
5.612% due 10/25/2045 | | | | 6,531 | | | | 6,573 |
5.582% due 12/25/2045 | | | | 939 | | | | 942 |
5.259% due 07/25/2046 | | | | 2,400 | | | | 2,398 |
| | | | | | | | |
|
Total Mortgage-Backed Securities
(Cost $52,187) | | 51,925 |
| | | | | | | | |
|
| |
| ASSET-BACKED SECURITIES 10.8% |
| AAA Trust | | | | | | | | |
5.422% due 11/26/2035 | | | | 198 | | | | 198 |
|
| ACE Securities Corp. | | | | | | | | |
5.432% due 10/25/2035 | | | | 3,202 | | | | 3,205 |
|
| Aegis Asset-Backed Securities Trust |
5.522% due 09/25/2034 | | | | 253 | | | | 254 |
|
| Argent Securities, Inc. | | | | | | | | |
5.442% due 10/25/2035 | | | | 953 | | | | 953 |
5.462% due 12/25/2035 | | | | 3,617 | | | | 3,619 |
5.402% due 03/25/2036 | | | | 1,614 | | | | 1,615 |
5.392% due 05/25/2036 | | | | 1,131 | | | | 1,131 |
|
| Asset-Backed Funding Certificates |
5.432% due 08/25/2035 | | | | 662 | | | | 663 |
|
| Bayview Financial Acquisition Trust |
5.791% due 08/28/2034 | | | | 1,499 | | | | 1,501 |
|
| Bear Stearns Asset-Backed Securities, Inc. |
5.652% due 10/25/2032 | | | | 58 | | | | 58 |
5.522% due 09/25/2034 | | | | 1,238 | | | | 1,239 |
5.402% due 11/25/2035 | | | | 797 | | | | 797 |
5.652% due 01/25/2036 | | | | 304 | | | | 304 |
5.772% due 03/25/2043 | | | | 191 | | | | 191 |
|
| Capital One Auto Finance Trust |
5.117% due 05/15/2007 | | | | 1,483 | | | | 1,483 |
|
| Carrington Mortgage Loan Trust |
5.402% due 06/25/2035 | | | | 55 | | | | 55 |
|
| Centex Home Equity | | | | | | | | |
5.372% due 06/25/2036 | | | | 3,589 | | | | 3,590 |
| | | | | | | | |
| Chase Credit Card Master Trust |
5.579% due 11/17/2008 | | $ | | 1,200 | | $ | | 1,201 |
|
| Citigroup Mortgage Loan Trust, Inc. |
5.402% due 12/27/2036 | | | | 2,142 | | | | 2,144 |
|
| Countrywide Asset-Backed Certificates |
5.452% due 02/25/2036 | | | | 1,095 | | | | 1,096 |
5.392% due 03/25/2036 | | | | 1,937 | | | | 1,937 |
5.392% due 04/25/2036 | | | | 1,014 | | | | 1,015 |
5.371% due 07/25/2036 | | | | 2,300 | | | | 2,303 |
5.395% due 07/25/2036 | | | | 900 | | | | 901 |
|
| Equity One ABS, Inc. | | | | | | | | |
5.622% due 04/25/2034 | | | | 255 | | | | 257 |
|
| FBR Securitization Trust | | | | | | | | |
5.442% due 09/25/2035 | | | | 782 | | | | 783 |
5.502% due 09/25/2035 | | | | 2,400 | | | | 2,402 |
5.432% due 10/25/2035 | | | | 6,540 | | | | 6,545 |
5.442% due 10/25/2035 | | | | 712 | | | | 713 |
|
| First Franklin Mortgage Loan Asset-Backed Certificates |
5.412% due 01/25/2036 | | | | 2,308 | | | | 2,310 |
|
| First NLC Trust | | | | | | | | |
5.432% due 12/25/2035 | | | | 1,340 | | | | 1,341 |
|
| Ford Credit Auto Owner Trust | | | | | | | | |
4.240% due 03/15/2008 | | | | 1,074 | | | | 1,069 |
|
| Fremont Home Loan Trust | | | | | | | | |
5.412% due 01/25/2036 | | | | 3,071 | | | | 3,074 |
|
| GSAMP Trust | | | | | | | | |
5.612% due 03/25/2034 | | | | 357 | | | | 358 |
5.412% due 11/25/2035 | | | | 2,995 | | | | 2,997 |
5.432% due 01/25/2036 | | | | 2,593 | | | | 2,595 |
|
| GSR Mortgage Loan Trust | | | | | | | | |
5.422% due 12/25/2030 | | | | 1,481 | | | | 1,481 |
|
| Home Equity Asset Trust | | | | | | | | |
5.432% due 02/25/2036 | | | | 851 | | | | 852 |
5.402% due 05/25/2036 | | | | 955 | | | | 955 |
|
| HSI Asset Securitization Corp. Trust |
5.402% due 12/25/2035 | | | | 1,163 | | | | 1,164 |
|
| Indymac Residential Asset-Backed Trust |
5.422% due 03/25/2036 | | | | 1,293 | | | | 1,294 |
|
| JP Morgan Mortgage Acquisition Corp. |
5.392% due 01/25/2026 | | | | 1,456 | | | | 1,457 |
|
| Long Beach Mortgage Loan Trust |
5.522% due 11/25/2034 | | | | 1,138 | | | | 1,139 |
5.412% due 01/25/2036 | | | | 620 | | | | 621 |
5.402% due 02/25/2036 | | | | 864 | | | | 865 |
5.392% due 03/25/2036 | | | | 403 | | | | 403 |
5.382% due 04/25/2036 | | | | 369 | | | | 369 |
|
| Mastr Asset-Backed Securities Trust |
5.402% due 01/25/2036 | | | | 2,062 | | | | 2,064 |
|
| Merrill Lynch Mortgage Investors, Inc. |
5.422% due 06/25/2036 | | | | 318 | | | | 319 |
5.479% due 06/25/2036 | | | | 3,100 | | | | 3,100 |
5.402% due 01/25/2037 | | | | 748 | | | | 748 |
5.400% due 05/25/2037 | | | | 1,200 | | | | 1,201 |
|
| Morgan Stanley ABS Capital I |
5.381% due 06/25/2036 | | | | 4,600 | | | | 4,599 |
|
| Nelnet Student Loan Trust | | | | | | | | |
5.051% due 10/27/2014 | | | | 300 | | | | 300 |
5.190% due 07/25/2016 | | | | 700 | | | | 702 |
5.190% due 10/25/2016 | | | | 1,200 | | | | 1,201 |
| | | | | | | | |
| New Century Home Equity Loan Trust |
5.432% due 09/25/2035 | | $ | | 633 | | $ | | 634 |
5.442% due 10/25/2035 | | | | 179 | | | | 179 |
|
| Newcastle Mortgage Securities Trust |
5.392% due 04/25/2036 | | | | 695 | | | | 696 |
|
| Nomura Asset Acceptance Corp. |
5.462% due 01/25/2036 | | | | 889 | | | | 889 |
|
| Option One Mortgage Loan Trust |
5.422% due 11/25/2035 | | | | 1,242 | | | | 1,243 |
|
| Renaissance Home Equity Loan Trust |
5.702% due 12/25/2032 | | | | 217 | | | | 217 |
5.472% due 10/25/2035 | | | | 231 | | | | 231 |
|
| Residential Asset Mortgage Products, Inc. |
5.402% due 12/25/2007 | | | | 1,034 | | | | 1,035 |
5.482% due 09/25/2013 | | | | 106 | | | | 106 |
5.432% due 01/25/2025 | | | | 57 | | | | 57 |
5.662% due 11/25/2033 | | | | 507 | | | | 508 |
|
| Residential Asset Securities Corp. |
5.422% due 09/25/2025 | | | | 129 | | | | 129 |
5.422% due 05/25/2027 | | | | 377 | | | | 377 |
5.392% due 06/25/2027 | | | | 272 | | | | 272 |
5.622% due 01/25/2034 | | | | 3 | | | | 3 |
5.131% due 06/25/2036 | | | | 3,180 | | | | 3,181 |
5.362% due 06/25/2036 | | | | 1,884 | | | | 1,884 |
|
| Residential Funding Mortgage Securities II, Inc. |
5.462% due 09/25/2035 | | | | 2,133 | | | | 2,135 |
|
| SACO I, Inc. | | | | | | | | |
5.432% due 10/25/2033 | | | | 1,592 | | | | 1,593 |
|
| Securitized Asset-Backed Receivables LLC Trust |
5.392% due 10/25/2035 | | | | 546 | | | | 546 |
|
| SG Mortgage Securities Trust |
5.422% due 09/25/2035 | | | | 56 | | | | 56 |
|
| SLM Student Loan Trust | | | | | | | | |
5.070% due 01/25/2013 | | | | 1,216 | | | | 1,216 |
5.120% due 07/25/2013 | | | | 565 | | | | 566 |
5.190% due 10/25/2013 | | | | 776 | | | | 778 |
|
| Soundview Home Equity Loan Trust |
5.432% due 05/25/2035 | | | | 1,082 | | | | 1,082 |
5.392% due 02/25/2036 | | | | 308 | | | | 308 |
5.392% due 03/25/2036 | | | | 712 | | | | 712 |
5.392% due 04/25/2036 | | | | 161 | | | | 161 |
5.298% due 07/25/2036 | | | | 3,400 | | | | 3,399 |
|
| Structured Asset Investment Loan Trust |
5.412% due 07/25/2035 | | | | 272 | | | | 272 |
|
| Structured Asset Securities Corp. |
4.900% due 04/25/2035 | | | | 1,850 | | | | 1,776 |
5.452% due 12/25/2035 | | | | 2,388 | | | | 2,390 |
|
| Susquehanna Auto Lease Trust |
4.991% due 04/16/2007 | | | | 417 | | | | 418 |
|
| Truman Capital Mortgage Loan Trust |
5.662% due 01/25/2034 | | | | 103 | | | | 103 |
|
| USAA Auto Owner Trust | | | | | | | | |
5.030% due 11/17/2007 | | | | 800 | | | | 798 |
|
| Wachovia Auto Owner Trust | | | | | | | | |
4.820% due 02/20/2009 | | | | 9,800 | | | | 9,771 |
|
| Wachovia Mortgage Loan Trust LLC |
5.432% due 10/25/2035 | | | | 940 | | | | 941 |
| | | | | | | | |
|
Total Asset-Backed Securities
(Cost $121,422) | | 121,393 |
| | | | | | | | |
|
| |
| | | | |
| 10 | | PIMCO Variable Insurance Trust | | See Accompanying Notes |
| | |
| |
| | | June 30, 2006 (Unaudited) |
| | | | |
| | | PRINCIPAL | | |
| | | AMOUNT | | VALUE |
| | | (000S) | | (000S) |
| | | | | |
| | | | | | | | |
| SOVEREIGN ISSUES 0.1% |
| Colombia Government International Bond |
10.000% due 01/23/2012 | | $ | | 350 | | $ | | 397 |
|
| Mexico Government International Bond |
6.375% due 01/16/2013 | | | | 177 | | | | 178 |
| | | | | | | | |
|
Total Sovereign Issues (Cost $526) | | 575 |
| | | | | | | | |
|
| |
| FOREIGN CURRENCY-DENOMINATED ISSUES (l) 0.5% |
| Canadian Government Bond |
3.000% due 12/01/2036 (b) | | CAD | | 530 | | | | 597 |
|
| France Government Bond |
3.000% due 07/25/2012 (b) | | EUR | | 1,648 | | | | 2,268 |
|
| Italy Buoni Poliennali Del Tesoro |
2.150% due 09/15/2014 (b) | | | | 533 | | | | 691 |
|
| Pylon Ltd. | | | | | | | | |
4.463% due 12/18/2008 (h) | | | | 700 | | | | 906 |
6.863% due 12/22/2008 | | | | 1,100 | | | | 1,421 |
| | | | | | | | |
|
Total Foreign Currency-Denominated Issues (Cost $5,794) | | 5,883 |
| | | | | | | | |
|
| |
| | | | | NOTIONAL
AMOUNT
(000S) | | | | |
| PURCHASED CALL OPTIONS 0.0% |
| 2-Year Interest Rate Swap (OTC) Pay 3-Month USD-LIBOR Floating Rate Index |
Strike @ 5.250%
Exp. 06/07/2007 | | $ | | 52,000 | | | | 143 |
| |
| | | | | #OF
CONTRACTS | | | | |
| U.S. Treasury 10-Year Note September Futures (CBOT) |
Strike @ $110.000
Exp. 08/25/2006 | | | | 318 | | | | 5 |
| | | | | | | | |
|
Total Purchased Call Options (Cost $228) | | 148 |
| | | | | | | | |
|
| |
| | | | | NOTIONAL
AMOUNT
(000S) | | | | |
| PURCHASED PUT OPTIONS 0.0% |
Treasury Inflation Protected Securities (OTC)
0.875% due 04/15/2010 |
Strike @ $83.875 Exp. 09/21/2006 | | $ | | 91,000 | | | | 0 |
|
Treasury Inflation Protected Securities (OTC)
1.875% due 07/15/2015 |
Strike @ $68.000 Exp. 09/18/2006 | | | | 90,000 | | | | 0 |
|
Treasury Inflation Protected Securities (OTC)
2.375% due 01/15/2025 |
Strike @ $58.000 Exp. 07/24/2006 | | | | 87,000 | | | | 0 |
|
Treasury Inflation Protected Securities (OTC)
3.000% due 07/15/2012 |
Strike @ $84.000 Exp. 07/24/2006 | | | | 111,000 | | | | 0 |
|
Treasury Inflation Protected Securities (OTC)
3.625% due 01/15/2008 |
Strike @ $96.000 Exp. 07/17/2006 | | | | 65,000 | | | | 0 |
|
| U.S. dollar versus Japanese Yen (OTC) |
Strike @ JY114.000 Exp. 07/03/2006 | | | | 13,400 | | | | 22 |
| | | | | | | | |
| 90-Day Eurodollar March Futures (CME) |
Strike @ $92.000 Exp. 03/19/2007 | | | | 288 | | $ | | 2 |
Strike @ $92.250 Exp. 03/19/2007 | | | | 23 | | | | 0 |
|
| U.S. Treasury 10-Year Note September Futures (CBOT) |
Strike @ $99.000 Exp. 08/25/2006 | | | | 354 | | | | 6 |
Strike @ $100.000 Exp. 08/25/2006 | | | | 1,245 | | | | 134 |
|
| U.S. Treasury 5-Year Note September Futures (CBOT) |
Strike @ $100.500 Exp. 08/25/2006 | | | | 215 | | | | 4 |
| | | | | | | | |
|
Total Purchased Put Options (Cost $282) | | 168 |
| | | | | | | | |
|
| |
| | | | | PRINCIPAL
AMOUNT
(000S) | | | | |
| SHORT-TERM INSTRUMENTS (l) 67.7% |
| |
| COMMERCIAL PAPER 51.9% |
| Abbey National N.A. LLC | | | | | | | | |
5.250% due 07/05/2006 | | $ | | 30,700 | | | | 30,691 |
|
| ASB Bank Ltd. | | | | | | | | |
5.050% due 08/10/2006 | | | | 2,000 | | | | 1,989 |
|
| Barclays U.S. Funding Corp. | | | | |
4.890% due 07/05/2006 | | | | 24,200 | | | | 24,193 |
4.955% due 07/18/2006 | | | | 1,200 | | | | 1,198 |
5.050% due 08/14/2006 | | | | 1,200 | | | | 1,193 |
|
| BNP Paribas Finance | | | | | | | | |
5.270% due 07/03/2006 | | | | 6,900 | | | | 6,900 |
|
| Caisse d’Amortissement de la Dette Sociale |
5.270% due 08/03/2006 | | | | 30,800 | | | | 30,660 |
|
| Cox Communications, Inc. | | | | | | | | |
4.720% due 07/17/2006 | | | | 1,100 | | | | 1,100 |
|
| Danske Corp. | | | | | | | | |
5.280% due 07/17/2006 | | | | 27,500 | | | | 27,444 |
4.955% due 07/20/2006 | | | | 5,400 | | | | 5,387 |
5.080% due 08/24/2006 | | | | 700 | | | | 695 |
|
| Dexia Delaware LLC | | | | | | | | |
5.275% due 07/05/2006 | | | | 30,800 | | | | 30,791 |
|
| DnB NORBank ASA | | | | | | | | |
5.180% due 09/08/2006 | | | | 31,000 | | | | 30,678 |
|
| Fannie Mae | | | | | | | | |
4.809% due 07/05/2006 | | | | 5,600 | | | | 5,598 |
|
| Federal Home Loan Bank | | | | | | | | |
5.030% due 07/03/2006 | | | | 30,900 | | | | 30,900 |
0.010% due 07/14/2006 | | | | 30,900 | | | | 30,851 |
|
| Fortis Funding LLC | | | | | | | | |
5.175% due 07/10/2006 | | | | 30,800 | | | | 30,769 |
5.265% due 07/26/2006 | | | | 2,900 | | | | 2,890 |
|
| HBOS Treasury Services PLC | | | | |
5.040% due 08/08/2006 | | | | 1,000 | | | | 995 |
|
| Nordea N.A., Inc. | | | | | | | | |
5.090% due 08/24/2006 | | | | 30,000 | | | | 29,780 |
|
| Rabobank USA Financial Corp. |
5.250% due 07/03/2006 | | | | 30,900 | | | | 30,900 |
|
| Skandinaviska Enskilda Banken AB |
4.960% due 07/20/2006 | | | | 27,800 | | | | 27,735 |
5.000% due 07/27/2006 | | | | 1,100 | | | | 1,096 |
| | | | | | | | |
| Societe Generale N.A. | | | | | | | | |
4.890% due 07/06/2006 | | $ | | 16,600 | | $ | | 16,593 |
5.040% due 08/08/2006 | | | | 17,400 | | | | 17,312 |
5.055% due 08/15/2006 | | | | 300 | | | | 298 |
|
| Stadshypoket Delaware, Inc. |
5.090% due 08/18/2006 | | | | 31,300 | | | | 31,096 |
|
| Swedbank, Inc. | | | | | | | | |
5.230% due 08/03/2006 | | | | 30,800 | | | | 30,661 |
|
| Time Warner Telecom, Inc. |
5.240% due 09/18/2006 | | | | 11,100 | | | | 10,968 |
|
| Total Captial S.A. | | | | | | | | |
5.270% due 07/03/2006 | | | | 30,900 | | | | 30,900 |
|
| UBS Finance Delaware LLC |
5.270% due 07/03/2006 | | | | 200 | | | | 200 |
5.050% due 07/05/2006 | | | | 1,800 | | | | 1,800 |
4.930% due 07/13/2006 | | | | 28,700 | | | | 28,661 |
5.235% due 08/08/2006 | | | | 2,300 | | | | 2,288 |
4.990% due 08/22/2006 | | | | 1,100 | | | | 1,092 |
|
| Westpac Capital Corp. | | | | | | | | |
5.040% due 08/02/2006 | | | | 28,800 | | | | 28,679 |
| | | | | | | | |
|
| | | | | | | | | 584,981 |
| | | | | | | | |
|
| |
| |
| FRANCE TREASURY BILLS 8.4% |
2.785% due 10/12/2006 | | EUR | | 6,990 | | | | 95,109 |
| | | | | | | | |
|
| |
| |
| GERMANY TREASURY BILLS 6.5% |
2.665% due 08/16/2006 | | | | 48,340 | | | | 73,583 |
| | | | | | | | |
|
| |
| |
| TRI-PARTY REPURCHASE AGREEMENT 0.3% |
| State Street Bank | | | | | | | | |
4.900% due 07/03/2006 | | $ | | 3,075 | | | | 3,075 |
| | | | | | | | |
|
(Dated 06/30/2006. Collateralized by Freddie Mac 3.800% due 12/27/2006 valued at $3,137. Repurchase proceeds are $3,076.) |
| |
| |
| U.S. TREASURY BILLS 0.6% |
4.801% due 09/14/2006 (e)(f)(g) | | | | 6,565 | | | | 6,492 |
| | | | | | | | |
|
Total Short-Term Instruments
(Cost $757,577) | | 763,240 |
| | | | | | | | |
|
| |
Total Investments (d) 208.5%
(Cost $2,337,734) | | $ | | 2,350,300 |
| | | | | | | | | |
Written Options (k) (0.1%)
(Premiums $1,008) | | (675) |
| |
| Other Assets and Liabilities (Net) (108.4%) | | (1,222,645) |
| | | | | | | | |
|
| Net Assets 100.0% | | $ | | 1,126,980 |
| | | | | | | | |
|
| | | | | | |
| See Accompanying Notes | | Semiannual Report | | June 30, 2006 | | 11 |
Schedule of Investments Real Return Portfolio (Cont.)
| | |
| Notes to Schedule of Investments (amounts in thousands, except number of contracts): |
| |
(a) Residual Interest bond. |
| |
(b) Principal amount of security is adjusted for inflation. |
| |
(c) Securities are grouped by coupon or range of coupons and represent a range of maturities. |
| |
(d) As of June 30, 2006, portfolio securities with an aggregate market value of $19,567 were valued in good faith and pursuant to guidelines established by the Board of Trustees. |
| |
(e) Securities with an aggregate market value of $2,472 have been pledged as collateral for delayed-delivery securities on June 30, 2006. |
| |
(f) Securities with an aggregate market value of $742 have been pledged as collateral for swap and swaption contracts on June 30, 2006. |
| |
(g) Securities with an aggregate market value of $2,092 have been segregated with the custodian to cover margin requirements for the following open futures contracts on June 30, 2006: |
| | | | | | | | | | |
| Description | | Type | | Expiration
Month | | # of
Contracts | | Unrealized
Appreciation/
(Depreciation) | |
90-Day Eurodollar December Futures | | Long | | 12/2007 | | 33 | | $ | (38 | ) |
90-Day Eurodollar June Futures | | Long | | 06/2007 | | 33 | | | (42 | ) |
90-Day Eurodollar March Futures | | Long | | 03/2008 | | 33 | | | (38 | ) |
90-Day Eurodollar September Futures | | Long | | 09/2007 | | 33 | | | (40 | ) |
Euro-Bund 10-Year Note September Futures | | Short | | 09/2006 | | 162 | | | 109 | |
U.S. Treasury 10-Year Note September Futures | | Long | | 09/2006 | | 563 | | | (320 | ) |
U.S. Treasury 30-Year Bond September Futures | | Short | | 09/2006 | | 90 | | | 45 | |
U.S. Treasury 5-Year Note September Futures | | Long | | 09/2006 | | 215 | | | (145 | ) |
| | | | | | | | |
|
|
|
| | | | | | | | | $ | (469 | ) |
| | | | | | | | |
|
|
|
| | | | | | | | | | | | | | |
(h) Restricted securities as of June 30, 2006: |
| Issuer Description | | Coupon | | Maturity
Date | | Acquisition
Date | | Cost | | Market Value | | Market Value as
a Percentage of
Net Assets |
Pylon Ltd. | | 4.463% | | 12/18/2008 | | 12/11/2003 | | $ | 700 | | $ | 906 | | 0.08% |
Morgan Stanley Warehouse Facilities | | 4.719% | | 08/16/2006 | | 06/28/2004 | | | 6,200 | | | 6,200 | | 0.55% |
| | | | | | | | |
|
| |
|
| |
|
| | | | | | | | | $ | 6,900 | | $ | 7,106 | | 0.63% |
| | | | | | | | |
|
| |
|
| |
|
| | | | | | | | | | | | | | | |
(i) Swap agreements outstanding on June 30, 2006: | |
| Interest Rate Swaps | | | | | | | | | | | | | | | |
| Counterparty | | Floating Rate Index | | Pay/Receive
Floating Rate | | Fixed
Rate | | Expiration
Date | | Notional
Amount | | Unrealized
Appreciation/
(Depreciation) | |
HSBC Bank USA | | 6-month GBP-LIBOR | | Receive | | 4.250% | | 06/12/2036 | | GBP | 2,500 | | $ | 189 | |
J.P. Morgan Chase & Co. | | 6-month GBP-LIBOR | | Pay | | 5.000% | | 06/15/2008 | | | 5,000 | | | 12 | |
Barclays Bank PLC | | 5-year French CPI Ex Tobacco Daily Reference Index | | Pay | | 2.103% | | 10/15/2010 | | EUR | 2,500 | | | (4 | ) |
BNP Paribas Bank | | 5-year French CPI Ex Tobacco Daily Reference Index | | Pay | | 2.090% | | 10/15/2010 | | | 2,500 | | | (9 | ) |
BNP Paribas Bank | | 5-year French CPI Ex Tobacco Daily Reference Index | | Pay | | 2.150% | | 01/19/2016 | | | 15,000 | | | (252 | ) |
Goldman Sachs & Co. | | 6-month EUR-LIBOR | | Receive | | 4.500% | | 06/17/2015 | | | 7,500 | | | 626 | |
UBS Warburg LLC | | 5-year French CPI Ex Tobacco Daily Reference Index | | Pay | | 2.146% | | 10/15/2010 | | | 3,700 | | | (9 | ) |
Bank of America | | 3-month USD-LIBOR | | Receive | | 5.000% | | 12/20/2016 | | $ | 22,700 | | | 281 | |
Barclays Bank PLC | | 3-month USD-LIBOR | | Pay | | 5.000% | | 12/20/2008 | | | 5,900 | | | (5 | ) |
Deutsche Bank AG | | 3-month USD-LIBOR | | Receive | | 5.000% | | 06/21/2021 | | | 5,400 | | | 49 | |
Deutsche Bank AG | | 3-month USD-LIBOR | | Receive | | 5.000% | | 12/20/2026 | | | 5,700 | | | 6 | |
Goldman Sachs & Co. | | 3-month USD-LIBOR | | Pay | | 5.000% | | 12/20/2008 | | | 23,500 | | | (21 | ) |
Goldman Sachs & Co. | | 3-month USD-LIBOR | | Receive | | 5.000% | | 12/20/2013 | | | 6,500 | | | 78 | |
Goldman Sachs & Co. | | 3-month USD-LIBOR | | Receive | | 5.000% | | 12/20/2016 | | | 49,500 | | | 612 | |
J.P. Morgan Chase & Co. | | 3-month USD-LIBOR | | Pay | | 5.000% | | 12/20/2011 | | | 3,700 | | | (33 | ) |
Lehman Brothers, Inc. | | 3-month USD-LIBOR | | Receive | | 5.000% | | 12/20/2036 | | | 4,200 | | | 38 | |
Morgan Stanley Dean Witter & Co. | | 3-month USD-LIBOR | | Pay | | 5.000% | | 12/20/2008 | | | 30,000 | | | (27 | ) |
Morgan Stanley Dean Witter & Co. | | 3-month USD-LIBOR | | Receive | | 5.000% | | 12/20/2016 | | | 100 | | | 1 | |
Morgan Stanley Dean Witter & Co. | | 3-month USD-LIBOR | | Receive | | 5.000% | | 12/20/2036 | | | 5,100 | | | 46 | |
Royal Bank of Scotland PLC | | 3-month USD-LIBOR | | Pay | | 5.000% | | 12/20/2011 | | | 3,100 | | | (27 | ) |
UBS Warburg LLC | | 3-month USD-LIBOR | | Pay | | 5.000% | | 12/20/2008 | | | 9,000 | | | (8 | ) |
| | | | | | | | | | | | | |
|
|
|
| | | | | | | | | | | | | | $ | 1,543 | |
| | | | | | | | | | | | | |
|
|
|
| | | | |
| 12 | | PIMCO Variable Insurance Trust | | See Accompanying Notes |
| | |
| |
| | | June 30, 2006 (Unaudited) |
| | | | | | | | | | | | | | | |
| Credit Default Swaps | | | | | | | | | | | | | | | |
| Counterparty | | Reference Entity | | Buy/Sell
Protection+ | | (Pay)/Receive
Fixed Rate | | Expiration
Date | | Notional
Amount | | Unrealized
Appreciation/
(Depreciation) | |
Goldman Sachs & Co. | | General Motors Acceptance Corp. 6.875% due 08/28/2012 | | Sell | | 3.400% | | 06/20/2011 | | $ | 700 | | $ | 20 | |
J.P. Morgan Chase & Co. | | General Motors Corp. 7.125% due 07/15/2013 | | Sell | | 4.600% | | 06/20/2007 | | | 1,000 | | | (7 | ) |
J.P. Morgan Chase & Co. | | General Motors Corp. 7.125% due 07/15/2013 | | Sell | | 6.400% | | 06/20/2007 | | | 1,500 | | | 14 | |
UBS Warburg LLC | | Ford Motor Credit Co. 7.000% due 10/01/2013 | | Sell | | 5.250% | | 09/20/2007 | | | 1,300 | | | 38 | |
UBS Warburg LLC | | General Motors Acceptance Corp. 6.875% due 08/28/2012 | | Sell | | 3.600% | | 06/20/2011 | | | 1,000 | | | 36 | |
| | | | | | | | | | | | | |
|
|
|
| | | | | | | | | | | | | | $ | 101 | |
| | | | | | | | | | | | | |
|
|
|
| |
| + If the Portfolio is a seller of protection and a credit event occurs, as defined under the terms of that particular swap agreement, the Portfolio will pay to the buyer of the protection an amount up to the notional value of the swap and in certain instances, take delivery of the security. As a buyer of protection, the Portfolio will generally receive from the seller of protection an amount up to the notional amount of the swap if a credit event occurs. | | | | |
| | | | | | | | | | | | | |
(j) Short sales outstanding on June 30, 2006: | | | |
| Description | | Coupon | | Maturity
Date | | Principal
Amount | | Proceeds | | Valueà |
U.S. Treasury Note | | 3.625% | | 05/15/2013 | | $ | 300 | | $ | 275 | | $ | 276 |
U.S. Treasury Note | | 4.250% | | 08/15/2013 | | | 4,400 | | | 4,216 | | | 4,253 |
U.S. Treasury Note | | 4.000% | | 02/15/2014 | | | 3,000 | | | 2,813 | | | 2,836 |
| | | | | | | | | |
|
| |
|
|
| | | | | | | | | | $ | 7,304 | | $ | 7,365 |
| | | | | | | | | |
|
| |
|
|
| | | | | | | | | | | | | | | |
| |
| à Market value includes $126 of interest payable on short sales. | | | |
(k) Written options outstanding on June 30, 2006: | | | |
| Options on Exchange-Traded Futures Contracts | | | |
| Description | | Exercise
Price | | Expiration
Date | | # of
Contracts | | Premium | | Value |
Call - CBOT U.S. Treasury 10-Year Note September Futures | | $ | 108.000 | | 08/25/2006 | | 920 | | $ | 135 | | $ | 29 |
Call - CBOT U.S. Treasury 10-Year Note September Futures | | | 107.000 | | 08/25/2006 | | 258 | | | 24 | | | 24 |
Put - CBOT U.S. Treasury 10-Year Note September Futures | | | 103.000 | | 08/25/2006 | | 1,178 | | | 173 | | | 165 |
| | | | | | | | | | | |
|
| |
|
|
| | | | | | | | | | | | $ | 332 | | $ | 218 |
| | | | | | | | | | | |
|
| |
|
|
| | | | | | | | | | | | | | | | | | | |
| | | | | | | | |
| Interest Rate Swaptions | | | | | | | | | | | | | | | | | | | |
| Description | | Counterparty | | Floating Rate
Index | | Pay/Receive
Floating Rate | | Exercise
Rate | | Expiration
Date | | Notional
Amount | | Premium | | Value |
Call - OTC 10-Year Interest Rate Swap | | Barclays Bank PLC | | 3-month USD-LIBOR | | Receive | | 5.300% | | 01/02/2007 | | $ | 23,000 | | $ | 120 | | $ | 95 |
Put - OTC 10-Year Interest Rate Swap | | Barclays Bank PLC | | 3-month USD-LIBOR | | Pay | | 5.900% | | 01/02/2007 | | | 13,000 | | | 148 | | | 141 |
Put - OTC 1-Year Interest Rate Swap | | Barclays Bank PLC | | 3-month USD-LIBOR | | Pay | | 6.100% | | 01/02/2007 | | | 10,000 | | | 66 | | | 64 |
Call - OTC 5-Year Interest Rate Swap | | Royal Bank of Scotland PLC | | 3-month USD-LIBOR | | Receive | | 5.340% | | 06/07/2007 | | | 19,000 | | | 193 | | | 130 |
Call - OTC 5-Year Interest Rate Swap | | Wachovia Bank N.A. | | 3-month USD-LIBOR | | Receive | | 5.325% | | 06/07/2007 | | | 4,000 | | | 34 | | | 27 |
| | | | | | | | | | | | | | | |
|
| |
|
|
| | | | | | | | | | | | | | | | $ | 561 | | $ | 457 |
| | | | | | | | | | | | | | | |
|
| |
|
|
| | | | | | | | |
| Foreign Currency Options | | | | | | | | | | | | | | | | | | | |
| | | | | | | | | | | | | | | |
| Description | | Counterparty | | Exercise
Price | | Expiration
Date | | Notional
Amount | | Premium | | Value |
Put - OTC U.S. dollar versus Japanese Yen | | Bank of America | | JPY 104.000 | | 07/03/2006 | | $ | 10,100 | | $ | 22 | | $ | 0 |
Put - OTC U.S. dollar versus Japanese Yen | | Bank of America | | 106.500 | | 07/03/2006 | | | 8,100 | | | 53 | | | 0 |
Put - OTC U.S. dollar versus Japanese Yen | | Credit Suisse First Boston | | 106.500 | | 07/03/2006 | | | 5,400 | | | 35 | | | 0 |
Put - OTC U.S. dollar versus Japanese Yen | | Goldman Sachs & Co. | | 104.000 | | 07/03/2006 | | | 2,300 | | | 5 | | | 0 |
| | | | | | | | | | | |
|
| |
|
|
| | | | | | | | | | | | $ | 115 | | $ | 0 |
| | | | | | | | | | | |
|
| |
|
|
| | | | | | |
| See Accompanying Notes | | Semiannual Report | | June 30, 2006 | | 13 |
Schedule of Investments Real Return Portfolio (Cont.)
| | | | | | | | | | | | | | | | | |
(l) Forward foreign currency contracts outstanding on June 30, 2006: | | | | | |
| Type | | | | Principal Amount Covered by Contract | | Settlement Month | | Unrealized
Appreciation | | Unrealized
(Depreciation) | | | Net Unrealized Appreciation/ (Depreciation) | |
Sell | | CAD | | 609 | | 07/2006 | | $ | 6 | | $ | 0 | | | $ | 6 | |
Buy | | EUR | | 11,877 | | 07/2006 | | | 336 | | | 0 | | | | 336 | |
Sell | | | | 6,903 | | 07/2006 | | | 0 | | | (68 | ) | | | (68 | ) |
Sell | | | | 129,792 | | 08/2006 | | | 0 | | | (2,834 | ) | | | (2,834 | ) |
Buy | | JPY | | 625,120 | | 07/2006 | | | 0 | | | (3 | ) | | | (3 | ) |
Buy | | | | 2,811,673 | | 08/2006 | | | 0 | | | (743 | ) | | | (743 | ) |
Buy | | PLN | | 264 | | 09/2006 | | | 1 | | | 0 | | | | 1 | |
Buy | | RUB | | 2,255 | | 09/2006 | | | 3 | | | 0 | | | | 3 | |
Buy | | SKK | | 2,349 | | 09/2006 | | | 2 | | | 0 | | | | 2 | |
| | | | | | | | |
|
| |
|
|
| |
|
|
|
| | | | | | | | | $ | 348 | | $ | (3,648 | ) | | $ | (3,300 | ) |
| | | | | | | | |
|
| |
|
|
| |
|
|
|
| | | | |
| 14 | | PIMCO Variable Insurance Trust | | See Accompanying Notes |
| | |
| |
| Notes to Financial Statements | | June 30, 2006 (Unaudited) |
1. ORGANIZATION
The Real Return Portfolio (the “Portfolio”) is a series of the PIMCO Variable Insurance Trust (the “Trust”). The Trust is registered under the Investment Company Act of 1940 (the “Act”), as amended, as an open-end investment management company organized as a Delaware business trust on October 3, 1997. The Portfolio offers three classes of shares: Institutional, Administrative and Advisor. Information presented in these financial statements pertains to the Administrative Class of the Portfolio. Certain detailed financial information for the Institutional Class and Advisor Class is provided separately and is available upon request. The Trust is designed to be used as an investment vehicle by Separate Accounts of insurance companies that fund variable annuity contracts and variable life insurance policies and by qualified pension and retirement plans.
2. SIGNIFICANT ACCOUNTING POLICIES
The following is a summary of significant accounting policies consistently followed by the Portfolio in the preparation of its financial statements in conformity with accounting principles generally accepted in the United States of America (“GAAP”). The preparation of financial statements in accordance with GAAP requires management to make estimates and assumptions that affect the reported amounts and disclosures in the financial statements. Actual results could differ from those estimates.
Security Valuation. Portfolio securities are valued as of the close of regular trading (normally 4:00 p.m., Eastern Time) on each day that the New York Stock Exchange (“NYSE”) is open. Portfolio securities and other assets for which market quotes are readily available are stated at market value. Market value is generally determined on the basis of last reported sales prices, or if no sales are reported, based on quotes obtained from a quotation reporting system, established market makers, or pricing services. Fixed-income securities and non-exchange traded derivatives are normally valued on the basis of quotes obtained from brokers and dealers or pricing services. Prices obtained from independent pricing services use information provided by market makers or estimates of market values obtained from yield data relating to investments or securities with similar characteristics. Certain fixed-income securities purchased on a delayed-delivery basis are marked to market daily until settlement at the forward settlement date. Short-term investments having a maturity of 60 days or less are generally valued at amortized cost. Exchange traded options, futures and options on futures are valued at the settlement price determined by the relevant exchange.
Investments initially valued in currencies other than the U.S. dollar are converted to the U.S. dollar using exchange rates obtained from pricing services. As a result, the NAV of the Portfolio’s shares may be affected by changes in the value of currencies in relation to the U.S. dollar. The value of securities traded in markets outside the United States or denominated in currencies other than the U.S. dollar may be affected significantly on a day that the NYSE is closed and an investor is not able to purchase, redeem or exchange shares.
Securities and other assets for which market quotes are not readily available are valued at fair value as determined in good faith by the Board of Trustees or persons acting at their direction. The Board of Trustees has adopted methods for valuing securities and other assets in circumstances where market quotes are not readily available, and has delegated to Pacific Investment Management Company LLC (“PIMCO”) the responsibility for applying the valuation methods. In the event that market quotes are not readily available, and the security or asset cannot be valued pursuant to one of the valuation methods, the value of the security or asset will be determined in good faith by the Valuation Committee of the Board of Trustees, generally based upon recommendations provided by PIMCO.
Market quotes are considered not readily available in circumstances where there is an absence of current or reliable market-based data (e.g., trade information, bid/asked information, broker quotes), including where events occur after the close of the relevant market, but prior to the close of regular trading, that materially affect the values of the Portfolio’s securities or assets. In addition, market quotes are considered not readily available when, due to extraordinary circumstances, the exchanges or markets on which the securities trade do not open for trading for the entire day and no other market prices are available. The Board has delegated to PIMCO the responsibility for monitoring significant events that may materially affect the values of the Portfolio’s securities or assets and for determining whether the value of the applicable securities or assets should be re-evaluated in light of such significant events when the Portfolio uses fair value pricing to determine its NAV, securities will not be priced on the basis of quotations from the primary market in which they are traded, but rather may be priced by another method that the Board of Trustees or persons acting at their direction believe accurately reflects fair value. The Trust’s policy is intended to result in a calculation of the Portfolio’s NAV that fairly reflects security values as of the time of pricing. However, fair values determined by the Board of Trustees or persons acting at their direction may not accurately reflect the price that the Portfolio could obtain for a security if it were to dispose of that security as of the time of pricing. Because foreign securities can trade on non-business days, the NAV of the Portfolio may change on days when shareholders will not be able to purchase or redeem shares. The prices used by the Portfolio may differ from the value that would be realized if the securities were sold and the differences could be material to the financial statements.
Securities Transactions and Investment Income. Securities transactions are recorded as of the trade date. Securities purchased or sold on a when-issued or delayed-delivery basis may be settled a month or more after the trade date. Realized gains and losses from securities sold are recorded on the identified cost basis. Dividend income is recorded on the ex-dividend date, except certain dividends from foreign securities where the ex-dividend date may have passed, which are recorded as soon as the Portfolio is informed of the ex-dividend date. Interest income, adjusted for the accretion of discounts and amortization of premiums, is recorded on the accrual basis. Paydown gains and losses on mortgage-related or asset-backed securities are recorded as components of interest income in the Statement of Operations.
Dividends and Distributions to Shareholders. Dividends from net investment income, if any, are declared on each day the Portfolio is open for business and are distributed to shareholders monthly. Net realized capital gains earned by the Portfolio, if any, will be distributed no less frequently than once each year. Most shareholders choose to reinvest their dividends and capital gain distribution in additional shares of the Portfolio.
Income dividends and capital gain distributions are determined in accordance with income tax regulations which may differ from GAAP. Differences between tax regulations and GAAP may change the fiscal year when income and capital items are recognized for tax and GAAP purposes. Examples of events that give rise to timing differences include wash sales, straddles, net operating losses and capital loss carryforwards. Further, the character of investment income and capital gains may be different for certain transactions under the two methods of accounting. Examples of characterization differences include the treatment of mortgage paydowns, swaps, foreign currency transactions and contingent debt instruments. As a result, income dividends and capital gain distributions declared during a fiscal period may differ significantly from the net investment income and realized capital gain reported in the Portfolio’s annual financial statements presented under GAAP.
Distributions classified as a tax basis return of capital, if any, are reflected in the accompanying Statements of Changes in Net Assets and have been reclassified to
| | | | | | |
| | | Semiannual Report | | June 30, 2006 | | 15 |
Notes to Financial Statements (Cont.)
paid in capital. In addition, other amounts have been reclassified between undistributed net investment income, accumulated undistributed net realized gains or losses and/or paid in capital to more appropriately conform financial accounting to tax characterizations of dividend distributions.
Multiclass Operations. Each class offered by the Portfolio has equal rights as to assets and voting privileges (except that shareholders of a class have exclusive voting rights regarding any matter relating solely to that class of shares). Income and non-class specific expenses of the Portfolio are allocated daily to each class of shares based on the relative value of settled shares. Realized and unrealized capital gains and losses of the Portfolio are allocated daily to each class of shares based on the relative net assets of each class. Class specific expenses, where applicable, currently include administrative, distribution and servicing fees.
Delayed-Delivery Transactions. The Portfolio may purchase or sell securities on a when-issued or delayed-delivery basis. These transactions involve a commitment by the Portfolio to purchase or sell securities for a predetermined price or yield, with payment and delivery taking place beyond the customary settlement period. When delayed-delivery purchases are outstanding, the Portfolio will designate liquid assets in an amount sufficient to meet the purchase price. When purchasing a security on a delayed-delivery basis, the Portfolio assumes the rights and risks of ownership of the security, including the risk of price and yield fluctuations, and takes such fluctuations into account when determining its net asset value. The Portfolio may dispose of or renegotiate a delayed-delivery transaction after it is entered into, and may sell when-issued securities before they are delivered, which may result in a capital gain or loss. When the Portfolio has sold a security on a delayed-delivery basis, the Portfolio does not participate in future gains and losses with respect to the security.
Federal Income Taxes. The Portfolio intends to qualify as a regulated investment company under sub-chapter M of the Internal Revenue Code and distribute all of its taxable income and net realized gains, if applicable, to shareholders. Accordingly, no provision for Federal income taxes has been made.
Foreign Currency. The accounting records of the Portfolio are maintained in U.S. dollar. The market values of foreign securities, currency holdings and other assets and liabilities are translated into U.S. dollar based on the current exchange rates each business day. Fluctuations in the value of currency holdings and other assets and liabilities resulting from changes in exchange rates are recorded as unrealized foreign currency gains or losses. Realized gains or losses and unrealized appreciation or depreciation on investment securities and income and expenses are translated on the respective dates of such transactions. The effects of changes in foreign currency exchange rates on investments in securities are not segregated in the Statement of Operations from the effects of changes in market prices of those securities, but are included with the net realized and unrealized gain or loss on investment securities.
| | | | | | |
|
| Non-U.S. currency symbols utilized throughout the report are defined as follows: |
| CAD | | Canadian Dollar | | PLN | | Polish Zloty |
| EUR | | Euro | | RUB | | Russian Ruble |
| GBP | | British Pound | | SKK | | Slovakian Koruna |
| JPY | | Japanese Yen | | | | |
Forward Currency Transactions. The Portfolio may enter into forward currency contracts in connection with settling planned purchases or sales of securities, to hedge the currency exposure associated with some or all of the Portfolio’s securities or as a part of an investment strategy. A forward currency contract is an agreement between two parties to buy and sell a currency at a set price on a future date. The market value of a forward currency contract fluctuates with changes in forward currency exchange rates. Forward currency contracts are marked to market daily and the change in value is recorded by the Portfolio as an unrealized gain or loss. Realized gains or losses equal to the difference between the value of the contract at the time it was opened and the value at the time it was closed are recorded upon delivery or receipt of the currency or, if a forward currency contract is offset by entering into another forward currency contract with the same broker, upon settlement of the net gain or loss. These contracts may involve market risk in excess of the unrealized gain or loss reflected in the Portfolio’s Statement of Assets and Liabilities. In addition, the Portfolio could be exposed to risk if the counterparties are unable to meet the terms of the contracts or if the value of the currency changes unfavorably to the U.S. dollar.
Futures Contracts. The Portfolio is authorized to enter into futures contracts. The Portfolio may use futures contracts to manage its exposure to the securities markets or to movements in interest rates and currency values. The primary risks associated with the use of futures contracts are the imperfect correlation between the change in market value of the securities held by the Portfolio and the prices of futures contracts, the possibility of an illiquid market, and the inability of the counterparty to meet the terms of the contract. Futures contracts are valued based upon their quoted daily settlement prices. Upon entering into a futures contract, the Portfolio is required to deposit with its custodian, in a segregated account in the name of the futures broker, an amount of cash or U.S. Government and Agency Obligations in accordance with the initial margin requirements of the broker or exchange. Futures contracts are marked to market daily and an appropriate payable or receivable for the change in value (“variation margin”) is recorded by the Portfolio. Gains or losses are recognized but not considered realized until the contracts expire or are closed. Futures contracts involve, to varying degrees, risk of loss in excess of the variation margin disclosed in the Statement of Assets and Liabilities.
Inflation-Indexed Bonds. The Portfolio may invest in inflation-indexed bonds. Inflation-indexed bonds are fixed-income securities whose principal value is periodically adjusted to the rate of inflation. The interest rate on these bonds is generally fixed at issuance at a rate lower than typical bonds. Over the life of an inflation-indexed bond, however, interest will be paid based on a principal value, which is adjusted for inflation. Any increase in the principal amount of an inflation-indexed bond will be included as interest income in the Statement of Operations, even though investors do not receive their principal until maturity.
Loan Participant and Assignments. The Portfolio may invest in direct debt instruments which are interests in amounts owned by corporate, governmental, or other borrowers to lenders or lending syndicates. The Portfolio’s investments in loans may be in the form of participations in loans or assignments of all or a portion of loans from third parties. A loan is often administered by a bank or other financial institution (the “lender”) that acts as agent for all holders. Then agent administers the terms of the loan, as specified in the loan agreement. When investing in a loan participation, the Portfolio has the right to receive payments of principal, interest and any fees to which it is entitled only from the lender selling the loan agreement and only upon receipt by the lender of payments from the borrower. The Portfolio generally has no right to enforce compliance with the terms of the loan agreement with the borrower. As a result, the Portfolio may be subject to the credit of both the borrower and the lender that is selling the loan agreement. When the Portfolio purchases assignments from lenders it acquires direct rights against the borrower on the loan. At the end of the period, the Portfolio had no unfunded loan commitments.
Options Contracts. The Portfolio may write call and put options on futures, swaps, securities or currencies it owns or in which it may invest. Writing put options tends to increase the Portfolio’s exposure to the underlying instrument. Writing call options tends to decrease the Portfolio’s exposure to the underlying instrument. When the Portfolio writes a call or put option, an amount equal to the
| | | | |
| 16 | | PIMCO Variable Insurance Trust | | |
| | |
| |
| | | June 30, 2006 (Unaudited) |
premium received is recorded as a liability and subsequently marked to market to reflect the current value of the option written. These liabilities are reflected as written options outstanding in the Statement of Assets and Liabilities. Certain options may be written with premiums to determined on a future date. The premiums for these options are based upon implied volatility parameters at specified terms. Premiums received from writing options which expire are treated as realized gains. Premiums received from writing options which are exercised or closed are added to the proceeds or offset against amounts paid on the underlying future, swap, security or currency transaction to determine the realized gain or loss. The Portfolio as a writer of an option has no control over whether the underlying future, swap, security or currency may be sold (call) or purchased (put) and as a result bears the market risk of an unfavorable change in the price of the future, swap, security or currency underlying the written option. There is the risk the Portfolio may not be able to enter into a closing transaction because of an illiquid market.
The Portfolio may also purchase put and call options. Purchasing call options tends to increase the Portfolio’s exposure to the underlying instrument. Purchasing put options tends to decrease the Portfolio’s exposure to the underlying instrument. The Portfolio pays a premium which is included in the Portfolio’s Statement of Assets and Liabilities as an investment and subsequently marked to market to reflect the current value of the option. Premiums paid for purchasing options which expire are treated as realized losses. Certain options may be purchased with premiums to be determined on a future date. The premiums for these options are based upon implied volatility parameters at specified terms. The risk associated with purchasing put and call options is limited to the premium paid. Premiums paid for purchasing options which are exercised or closed are added to the amounts paid or offset against the proceeds on the underlying future, swap, security or currency transaction to determine the realized gain or loss.
Repurchase Agreements. The Portfolio may engage in repurchase transactions. Under the terms of a typical repurchase agreement, the Portfolio takes possession of an underlying debt obligation subject to an obligation of the seller to repurchase, and the Portfolio to resell, the obligation at an agreed-upon price and time. The underlying securities for all repurchase agreements are held in safekeeping at the Portfolio’s custodian or designated subcustodians under triparty repurchase agreements. The market value of the collateral must be equal to or exceed at all times the total amount of the repurchase obligations, including interest. Securities purchased under repurchase agreements are reflected as an asset in the Statement of Assets and Liabilities. Generally, in the event of counterparty default, the Portfolio has the right to use the collateral to offset losses incurred. If the counterparty should default, the Portfolio will seek to sell the securities which it holds as collateral. This could involve procedural costs or delays in addition to a loss on the securities if their value should fall below their repurchase price.
Short Sales. The Portfolio may enter into short sales transactions. A short sale is a transaction in which the Portfolio sells securities it does not own in anticipation of a decline in the market price of the securities. Securities sold in short sale transactions and interest payable on such securities, if any, are reflected as a liability in the Statement of Assets and Liabilities. The Portfolio is obligated to deliver securities at the market price at the time the short position is closed. Possible losses from short sales may be unlimited, whereas losses from purchases cannot exceed the total amount invested.
Mortgage-Related and Other Asset-Backed Securities. The Portfolio may invest in mortgage-related or other asset-backed securities. These securities include mortgage pass-through securities, collateralized mortgage obligations (“CMOs”), commercial mortgage-backed securities, mortgage dollar rolls, CMO residuals, stripped mortgage-backed securities (“SMBSs”) and other securities
that directly or indirectly represent a participation in, or are secured by and payable from, mortgage loans on real property. The value of some mortgage- or asset-backed securities may be particularly sensitive to changes in prevailing interest rates. Early repayment of principal on some mortgage-related securities may expose the Portfolio to a lower rate of return upon reinvestment of principal. The value of these securities may fluctuate in response to the market’s perception of the creditworthiness of the issuers. Additionally, although mortgages and mortgage-related securities are generally supported by some form of government or private guarantee and/or insurance, there is no assurance that private guarantors or insurers will meet their obligations.
One type of SMBS has one class receiving all of the interest from the mortgage assets (the interest-only, or “IO” class), while the other class will receive all of the principal (the principal-only, or “PO” class). Payments received for IOs are included in interest income in the Statement of Operations. Because principal will not be received at the maturity of an IO, adjustments are made to the book value of the security on a daily basis until maturity. These adjustments are included in interest income in the Statement of Operations. Payments received for POs are treated as reductions to the cost and par value of the securities.
Swap Agreements. The Portfolio may engage in swap transactions, including, but not limited to, swap agreements on interest rate and credit default to manage its exposure to interest rates and credit risk. In connection with these agreements, securities may be identified as collateral in accordance with the terms of the respective swap agreements.
Interest rate swap agreements involve the exchange by the Portfolio with another party of their respective commitments to pay or receive interest, e.g., an exchange of floating rate payments for fixed rate payments with respect to the notional amount of principal.
Credit default swap agreements involve one party making a stream of payments to another party in exchange for the right to receive a specified return in the event of a default by a third party, typically corporate issues or sovereign issues of an emerging country, on its obligation. The Portfolio may use credit default swaps to provide a measure of protection against defaults of the issuers (i.e., to reduce risk where the Portfolio owns or has exposure to the sovereign issuer) or to take an active long or short position with respect to the likelihood of a particular issuer’s default. As a seller of protection, the Portfolio generally receives an upfront payment or a fixed rate of income throughout the term of the swap provided that there is no credit event. If the Portfolio is a seller of protection and a credit event occurs, as defined under the terms of that particular swap agreement, the Portfolio will pay to the buyer of the protection an amount up to the notional value of the swap and in certain instances take delivery of the security. As the seller, the Portfolio would effectively add leverage to its portfolio because, in addition to its total net assets, the Portfolio would be subject to investment exposure on the notional amount of the swap. As a buyer of protection, the Portfolio generally receives an amount up to the notional value of the swap if a credit event occurs. The treatment of a credit default swaps and other swap agreements that provide for contingent, non-periodic, bullet-type payments as “notional principal contracts” for federal income tax purposes is uncertain. Were the Internal Revenue Service in take the position that a credit default swap or other bullet-type swap is not a “notional principal contract” for federal income tax purposes, payments received by the Portfolio from such investments might be subject to income taxes.
Swaps are marked to market daily based upon quotations from market makers and the change in value, if any, is recorded as unrealized gain or loss in the Statement of Operations. Payments received or made at the beginning of the measurement period are reflected as such in the Statement of Assets and Liabilities. These upfront payments are recorded as realized gain or loss in the Statement of Operations upon termination or maturity of the swap. A liquidation payment received or made at the termination of the swap is recorded as realized gain or loss in the Statement of Operations. Net periodic payments received by the Portfolio are included as part of realized gain or loss in the Statement of
| | | | | | |
| | | Semiannual Report | | June 30, 2006 | | 17 |
Notes to Financial Statements (Cont.)
Operations. Entering into these agreements involves, to varying degrees, elements of credit, market and documentation risk in excess of the amounts recognized in the Statement of Assets and Liabilities. Such risks involve the possibility that there will be no liquid market for these agreements, that the counterparty to the agreements may default on its obligation to perform or disagree as to the meaning of contractual terms in the agreements and that there may be unfavorable changes in interest rates.
U.S. Government Agencies or Government-Sponsored Enterprises. Securities issued by U.S. Government agencies or government-sponsored enterprises may not be guaranteed by the U.S. Treasury. The Government National Mortgage Association (“GNMA”), a wholly owned U.S. Government corporation, is authorized to guarantee, with the full faith and credit of the U.S. Government, the timely payment of principal and interest on securities issued by institutions approved by GNMA and backed by pools of mortgages insured by the Federal Housing Administration or guaranteed by the Department of Veterans Affairs. Government-related guarantors (i.e., not backed by the full faith and credit of the U.S. Government) include the Federal National Mortgage Association (“FNMA” or “Fannie Mae”) and the Federal Home Loan Mortgage Corporation (“FHLMC” or “Freddie Mac”). Pass-through securities issued by FNMA are guaranteed as to timely payment of principal and interest by FNMA but are not backed by the full faith and credit of the U.S. Government. FHLMC guarantees the timely payment of interest and ultimate collection of principal, but its participation certificates are not backed by the full faith and credit of the U.S. Government.
Guarantees and Indemnifications. Under the Trust’s organizational documents, each Trustee, officer, employee or other agent of the Trust (including the Trust’s investment manager) is indemnified against certain liabilities that may arise out of performance of their duties to the Portfolio. Additionally, in the normal course of business, the Portfolio enters into contracts that contain a variety of indemnification clauses. The Portfolio’s maximum exposure under these arrangements is unknown as this would involve future claims that may be made against the Portfolio that have not yet occurred. However, the Portfolio has not had prior claims or losses pursuant to these contracts, and believes the risk of loss to be remote.
New Accounting Policies. In July 2006, the Financial Accounting Standards Board issued Interpretation No. 48, “Accounting for Uncertainty in Income Taxes—an Interpretation of FASB Statement No. 109” (the “Interpretation”). The Interpretation is effective for fiscal years beginning after December 15, 2006. Management is currently evaluating the application of the Interpretation to the Portfolio and will provide additional information in relation to the Interpretation in the Portfolio’s annual financial statements for the year ending December 31, 2006.
3. FEES, EXPENSES, AND RELATED PARTY TRANSACTIONS
Investment Advisory Fee. PIMCO is a majority-owned subsidiary of Allianz Global Investors of America L.P. (“AGI”), and serves as investment adviser (the “Adviser”) to the Trust, pursuant to an investment advisory contract. The Adviser receives a monthly fee at an annual rate based on average daily net assets of the Portfolio. The Advisory Fee is charged at an annual rate of 0.25%.
Administration Fee. PIMCO serves as administrator (the “Administrator”), and provides administrative services to the Trust for which it receives a monthly administrative fee based on average daily net assets of the Portfolio. As the Administrator, PIMCO bears the costs of various third-party services, including audit, custodial, portfolio accounting, legal, transfer agency and printing costs. The Administration Fee is charged at the annual rate of 0.25%.
Distribution and Servicing Fees. Allianz Global Investors Distributors LLC (“AGID”) is an indirect wholly-owned subsidiary of AGI and serves as the distributor of the Trust’s shares. The Trust is permitted to reimburse AGID on a quarterly basis, out of the Administrative Class assets of the Portfolio in the amount of 0.15% on an annual basis of the average daily net assets of that class, for payments made to financial intermediaries that provide services in connection with the distribution of shares or administration of plans or programs that use Portfolio shares as their funding medium. The effective rate paid to AGID was 0.15% during the current fiscal year.
Expenses. The Trust is responsible for the following expenses: (i) salaries and other compensation of any of the Trust’s executive officers and employees who are not officers, directors, stockholders or employees of PIMCO or its subsidiaries or affiliates; (ii) taxes and governmental fees; (iii) brokerage fees and commissions and other portfolio transaction expenses; (iv) the costs of borrowing money, including interest expenses and bank overdraft charges; (v) fees and expenses of the Trustees who are not “interested persons” of PIMCO or the Trust, and any counsel retained exclusively for their benefit; (vi) extraordinary expenses, including costs of litigation and indemnification expenses; (vii) organization expenses and (viii) any expenses allocated or allocable to a specific class of shares, which include service fees payable with respect to the Administrative Class shares and may include certain other expenses as permitted by the Trust’s Multiple Class Plan adopted pursuant to Rule 18f-3 under the Act and subject to review and approval by the Trustees. The ratio of expenses to average net assets per share class, as disclosed in the Financial Highlights, may differ from the annual portfolio operating expenses per share class as disclosed in the Prospectus for the reasons set forth above.
For the current period ended June 30, 2006, each unaffiliated Trustee received an annual retainer of $15,000, plus $2,000 for each Board of Trustees quarterly meeting attended, $500 for each Board of Trustees committee meeting attended and $500 for each special board meeting attended, plus reimbursement of related expenses. In addition, each Committee Chair received an additional annual retainer of $500 and each Audit Committee Chair received an additional annual retainer of $1,500. These expenses are allocated on a pro-rata basis to each Portfolio of the Trust according to its respective net assets. The Trust pays no compensation directly to any Trustee or any other officer who is affiliated with the Administrator, all of whom receive remuneration for their services to the Trust from the Administrator or its affiliates.
4. PURCHASES AND SALES OF SECURITIES
The length of time the Portfolio has held a particular security is not generally a consideration in investment decisions. A change in the securities held by the Portfolio is known as “portfolio turnover”. The Portfolio may engage in frequent and active trading of portfolio securities to achieve its investment objective, particularly during periods of volatile market movements. High portfolio turnover (e.g., over 100%) involves correspondingly greater expenses to the Portfolio, including brokerage commissions or dealer mark-ups and other transaction costs on the sale of securities and reinvestments in other securities. Such sales may also result in realization of taxable capital gains, including short-term capital gains (which are generally taxed at ordinary income tax rates). The trading costs and tax effects associated with portfolio turnover may adversely affect the Portfolio’s performance.
Purchases and sales of securities (excluding short-term investments) for the period ended June 30, 2006 were as follows (amounts in thousands):
| | | | | | | | | | | | | | | | |
| | U.S Government/Agency | | | | | All Other |
| | Purchases | | | | | Sales | | | | | Purchases | | | | | Sales |
| $ | 8,549,666 | | | | $ | 8,379,973 | | | | $ | $109,598 | | | | $ | 27,378 |
| | | | |
| 18 | | PIMCO Variable Insurance Trust | | |
| | |
| |
| | | June 30, 2006 (Unaudited) |
5. TRANSACTIONS IN WRITTEN CALL AND PUT OPTIONS
Transactions in written call and put options were as follows (amounts in thousands, except number of contracts):
| | | | | | | | | | | | | | | | |
| | | | | # of
Contracts |
| | | |
| Notional
Amount
in $ | | | | | Premium | |
Balance at 12/31/2005 | | | | 158 | | | | | $ | 0 | | | | $ | 34 | |
Sales | | | | 3,113 | | | | | | 94,900 | | | | | 1,241 | |
Closing Buys | | | | (429 | ) | | | | | 0 | | | | | (89 | ) |
Expirations | | | | (371 | ) | | | | | 0 | | | | | (91 | ) |
Exercised | | | | (115 | ) | | | | | 0 | | | | | (87 | ) |
Balance at 06/30/2006 | | | | 2,356 | | | | | $ | 94,900 | | | | $ | 1,008 | |
6. SHARES OF BENEFICIAL INTEREST
The Portfolio may issue an unlimited number of shares of beneficial interest with a $0.001 par value. Changes in shares of beneficial interest were as follows (shares and amounts in thousands):
| | | | | | | | | | | | | | | | | | |
| �� | | | | Six Months Ended 06/30/2006 | | | | | Year Ended 12/31/2005 | |
| | | | | Shares | | | Amount | | | | | Shares | | | Amount | |
| | | | | | |
Receipts for shares sold | | | | | | | | | | | | | | | | | | |
Institutional Class | | | | 160 | | | $ | 1,995 | | | | | 890 | | | $ | 11,510 | |
Administrative Class | | | | 16,583 | | | | 206,303 | | | | | 35,702 | | | | 460,693 | |
Advisor Class | | | | 66 | | | | 804 | | | | | 0 | | | | 0 | |
Issued as reinvestment of distributions | | | | | | | | | | | | | | | | | | |
Institutional Class | | | | 71 | | | | 880 | | | | | 137 | | | | 1,759 | |
Administrative Class | | | | 1,666 | | | | 20,703 | | | | | 2,742 | | | | 35,153 | |
Advisor Class | | | | 0 | | | | 3 | | | | | 0 | | | | 0 | |
Cost of shares redeemed | | | | | | | | | | | | | | | | | | |
Institutional Class | | | | (305 | ) | | | (3,802 | ) | | | | (349 | ) | | | (4,483 | ) |
Administrative Class | | | | (9,697 | ) | | | (120,373 | ) | | | | (7,983 | ) | | | (102,785 | ) |
Advisor Class | | | | (10 | ) | | | (118 | ) | | | | 0 | | | | 0 | |
Net increase resulting from Portfolio share transactions | | | | 8,534 | | | $ | 106,395 | | | | | 31,139 | | | $ | 401,847 | |
The following schedule shows the number of shareholders each owning 5% or more of the Portfolio and the total percentage of the Portfolio held by such shareholders:
| | | | | | |
| | | | | Number of
Shareholders | | % of Portfolio
Held |
Institutional Class | | | | 2 | | 95 |
Administrative Class | | | | 4 | | 56* |
Advisor Class | | | | 2 | | 90 |
* One of the shareholders, Allianz Life Insurance Co. of North America, is an indirect wholly owned subsidiary of AGI and a related party to the Portfolio.
7. FEDERAL INCOME TAX MATTERS
As of June 30, 2006, the aggregate cost of investments was the same for federal income tax and financial statement purposes. The net unrealized appreciation (depreciation) of investment securities for federal income tax purposes is as follows (amounts in thousands):
| | | | |
Aggregate
Gross
Unrealized
Appreciation | | Aggregate
Gross
Unrealized
(Depreciation) | | Net
Unrealized
Appreciation |
$ 15,040 | | $ (2,474) | | $ 12,566 |
8. REGULATORY AND LITIGATION MATTERS
On June 1, 2004, the Attorney General of the State of New Jersey announced that it had dismissed PIMCO from a complaint filed by the New Jersey Attorney General on February 17, 2004, and that it had entered into a settlement agreement (the “New Jersey Settlement”) with Allianz Global Investors of America L.P. (“AGI”) (formerly known as Allianz Dresdner Asset Management of America L.P.), PEA Capital LLC (an entity affiliated with PIMCO through common ownership) (“PEA”) and Allianz Global Investors Distributors LLC (“AGID”), in connection with the same matter. In the New Jersey Settlement, AGI, PEA and AGID neither admitted nor denied the allegations or conclusions of law, but did agree to pay New Jersey a civil fine of $15 million and $3 million for investigative costs and further potential enforcement initiatives against unrelated parties. They also undertook to implement certain governance changes. The complaint relating to the New Jersey Settlement alleged, among other things, that AGI, PEA and AGID had failed to disclose that they improperly allowed certain hedge funds to engage in “market timing” in certain funds. The complaint sought injunctive relief, civil monetary penalties, restitution and disgorgement of profits.
Since February 2004, PIMCO, AGI, PEA, AGID, and certain of their affiliates, including the PIMCO Funds, the Allianz Funds (formerly known as PIMCO Funds: Multi-Manager Series), and the Trustees and employees of the PIMCO Funds, have been named as defendants in fifteen lawsuits filed in various jurisdictions. Eleven of those lawsuits concern “market timing,” and they have been transferred to and consolidated for pre-trial proceedings in a multi-district litigation proceeding in the U.S. District Court for the District of Maryland; the other four lawsuits concern “revenue sharing” and have been consolidated into a single action in the U.S. District Court for the District of Connecticut. The lawsuits have been commenced as putative class actions on behalf of investors who purchased, held or redeemed shares of the various series of the PIMCO Funds and the Allianz Funds during specified periods, or as derivative actions on behalf of the PIMCO Funds and Allianz Funds.
The market timing actions in the District of Maryland generally allege that certain hedge funds were allowed to engage in “market timing” in certain of the PIMCO Funds and the Allianz Funds and this alleged activity was not disclosed. Pursuant to tolling agreements entered into with the derivative and class action plaintiffs, PIMCO, the Trustees, and certain employees of PIMCO who were previously named as defendants have all been dropped as defendants in the market timing actions; the plaintiffs continue to assert claims on behalf of the shareholders of the PIMCO Funds or on behalf of the PIMCO Funds themselves against other defendants. By order dated November 3, 2005, the U.S. District Court for the District of Maryland granted the PIMCO Funds’ motion to dismiss claims asserted against it in a consolidated amended complaint where the PIMCO Funds were named, in the complaint, as a nominal defendant. The revenue sharing action in the District of Connecticut generally alleges that fund assets were inappropriately used to pay brokers to promote the PIMCO Funds and Allianz Funds, including directing fund brokerage transactions to such brokers, and that such alleged arrangements were not fully disclosed to shareholders. On August 11, 2005 the U.S. District Court for the District of Connecticut conducted a hearing on defendants’ motion to dismiss the consolidated amended complaint in the revenue sharing action but has not yet ruled on the motion to dismiss. The market timing and revenue sharing lawsuits seek, among other things, unspecified compensatory damages plus interest and, in some cases, punitive damages, the rescission of investment advisory contracts, the return of fees paid under those contracts and restitution.
Under Section 9(a) of the Investment Company Act of 1940, as amended (“1940 Act”), if the New Jersey Settlement or any of the lawsuits described above were to result in a court injunction against AGI, PEA, AGID and/or their affiliates, PIMCO could, in the absence of exemptive relief granted by the SEC, be barred from serving as an investment adviser, and AGID could be barred from serving as principal underwriter, to any registered investment company, including the
| | | | | | |
| | | Semiannual Report | | June 30, 2006 | | 19 |
Notes to Financial Statements (Cont.)
Portfolios of the Trust. In connection with an inquiry from the SEC concerning the status of the New Jersey Settlement under Section 9(a), PEA, AGID, AGI and certain of their affiliates (including PIMCO) (together, the “Applicants”) have sought exemptive relief from the SEC under Section 9(c) of the 1940 Act. The SEC has granted the Applicants a temporary exemption from the provisions of Section 9(a) with respect to the New Jersey Settlement until the earlier of (i) September 13, 2006 and (ii) the date on which the SEC takes final action on their application for a permanent order. There is no assurance that the SEC will issue a permanent order.
Two nearly identical class action civil complaints have been filed in August 2005, in the Northern District of Illinois Eastern Division alleging that the plaintiffs each purchased and sold a 10-year Treasury note futures contract and suffered damages from an alleged shortage when PIMCO held both physical and futures positions in 10-year Treasury notes for its client accounts. The two actions have been consolidated into one action, and the two separate complaints have been replaced by a consolidated complaint. PIMCO is a named defendant, and the PIMCO Funds have been added as a defendant, to the consolidated action. PIMCO strongly believes the complaint (and any consolidated complaint filed hereafter) is without merit and intends to vigorously defend itself.
Certain Portfolios of the Trust were recently served in an adversary proceeding brought by the Official Committee of Asbestos Claimants of G-I Holdings, Inc. in G-I Holdings, Inc.’s bankruptcy in the District of New Jersey. PIMCO was previously named in this lawsuit and remains a defendant. The plaintiff seeks to recover for the bankruptcy estate assets that were transferred by the predecessor entity of G-I Holdings, Inc. to a wholly-owned subsidiary in 1994. The subsidiary has since issued notes, of which certain Portfolios of the Trust are alleged to be holders. The complaint alleges that in 2000, more than two hundred noteholders—including certain Portfolios of the Trust—were granted a second priority lien on the assets of the subsidiary in exchange for their consent to a refinancing transaction and the granting of a first priority lien to the lending banks. The plaintiff is seeking invalidation of the lien in favor of the noteholders and/or the value of the lien.
It is possible that these matters and/or other developments resulting from these matters could result in increased fund redemptions or other adverse consequences to the Portfolios. However, PIMCO and AGID believe that these matters are not likely to have a material adverse effect on the Portfolios or on PIMCO’s or AGID’s ability to perform their respective investment advisory or distribution services relating to the Portfolios.
| | | | |
| 20 | | PIMCO Variable Insurance Trust | | |
Investment Adviser and Administrator
Pacific Investment Management Company LLC
840 Newport Center Drive
Newport Beach, California 92660
Distributor
Allianz Global Investors Distributors LLC
2187 Atlantic Street
Stamford, Connecticut 06902
Custodian
State Street Bank & Trust Company
801 Pennsylvania
Kansas City, Missouri 64105
Transfer Agent
Boston Financial Data Services–Midwest
330 W. 9th Street
Kansas City, Missouri 64105
Legal Counsel
Dechert LLP
1775 I Street, N.W.
Washington, D.C. 20006
Independent Registered Public Accounting Firm
PricewaterhouseCoopers LLP
1055 Broadway
Kansas City, Missouri 64105
P I M C O

Share Class Institutional
Semiannual Report June 30, 2006
PIMCO Variable Insurance Trust
Real Return Portfolio
Table of Contents
This material is authorized for use only when preceded or accompanied by the current PIMCO Variable Insurance Trust (the “Trust”) prospectus. Investors should consider the investment objectives, risks, charges and expenses of this Trust carefully before investing. Ask your financial professional to explain all charges that may apply. This and other information is contained in the Trust’s prospectus. The variable product prospectus may be obtained by contacting your Investment Consultant. Please read the Trust and variable product prospectus carefully before you invest or send money.
Chairman’s Letter
Dear PIMCO Variable Insurance Trust Shareholder:
It is our pleasure to present to you the semiannual report for the PIMCO Variable Insurance Trust covering the six-month period ended June 30, 2006.
Highlights of the global bond markets during the six-month period included:
| | n | | Most fixed-income sectors lost ground during the first half of 2006, as concern about accelerating inflation and central bank tightening pushed interest rates higher worldwide. The benchmark Lehman Brothers Aggregate Bond Index (which includes Treasury, Investment-Grade Corporate, and Residential Mortgage-Backed Securities) returned -0.72% for the first six months of the year. On June 30, the benchmark ten-year Treasury yielded 5.14%, 0.75% higher than at the start of the year. The U.S. yield curve remained flat as shorter-maturity yields rose by a comparable amount. |
| | n | | The Federal Reserve tightened four times during the reporting period, bringing the Federal Funds Rate to 5.25%. The increase near the end of the period was the Federal Reserve’s 17th consecutive rate hike since the start of its tightening cycle in 2004. The Federal Reserve was not alone, as central banks in Europe, India, and China tightened credit in unison for the first time since 2000. The Bank of Japan, whose zero-interest-rate policy has flooded global markets with liquidity, looked set to reverse this policy in the coming months. |
In these pages please find a more complete Portfolio review as it relates to financial-market activities, as well as details about total-return investment performance for the six-month reporting period. Thank you for the trust you have placed in us. We will continue to work diligently to meet your investment needs.
Sincerely,
Brent R. Harris
Chairman, PIMCO Variable Insurance Trust
July 31, 2006
| | | | | | |
| | | Semiannual Report | | June 30, 2006 | | 1 |
Important Information About the Portfolio
PIMCO Variable Insurance Trust (the “Trust”) is an open-end management investment company currently consisting of nineteen separate investment portfolios, including the Real Return Portfolio (the “Portfolio”). The Portfolio is only available as a funding vehicle under variable life insurance policies or variable annuity contracts issued by insurance companies (“Variable Contracts”). Individuals may not purchase shares of the Portfolio directly. Shares of the Portfolio also may be sold to qualified pension and retirement plans outside of the separate account context.
We believe that bond funds have an important role to play in a well diversified investment portfolio. It is important to note, however, that in an environment where interest rates may trend upward, rising rates would negatively impact the performance of most bond funds, and fixed-income securities held by a fund are likely to decrease in value. The price volatility of fixed-income securities can also increase during periods of rising interest rates resulting in increased losses to a fund. Bond funds and individual bonds with a longer duration (a measure of the expected life of a security) tend to be more sensitive to changes in interest rates, usually making them more volatile than securities or funds with shorter durations. The longer-term performance of most bond funds has benefited from capital gains in part resulting from an extended period of declining interest rates. In the event interest rates increase, these capital gains should not be expected to recur.
The Portfolio may be subject to various risks in addition to those described above. Some of these risks may include, but are not limited to, the following: credit risk, high yield risk, market risk, issuer risk, liquidity risk, derivatives risk, mortgage risk, non-U.S. investment risk, currency risk, issuer non-diversification risk, leveraging risk and management risk. A complete description of these risks is contained in the Portfolio’s prospectus. The Portfolio may use derivative instruments for hedging purposes or as part of an investment strategy. Use of these instruments may involve certain costs and risks such as liquidity risk, interest rate risk, market risk, credit risk, management risk and the risk that the Portfolio could not close out a position when it would be most advantageous to do so. A Portfolio investing in derivatives could lose more than the principal amount invested in these instruments. Investing in non-U.S. securities may entail risk due to non-U.S. economic and political developments; this risk may be increased when investing in emerging markets.
On the performance summary page in this Semiannual Report, the Total Return Investment Performance table measures performance assuming that all dividend and capital gain distributions were reinvested.
An investment in the Portfolio is not a deposit of a bank and is not guaranteed or insured by the Federal Deposit Insurance Corporation or any other government agency. It is possible to lose money on investments in the Portfolio.
PIMCO has adopted written proxy voting policies and procedures (“Proxy Policy”) as required by Rule 206(4)-6 under the Investment Advisers Act of 1940. The Proxy Policy has been adopted by the Trust as the policies and procedures that PIMCO will use when voting proxies on behalf of the Portfolio. Copies of the written Proxy Policy and the factors that PIMCO may consider in determining how to vote proxies for the Portfolio, and information about how the Portfolio voted proxies relating to portfolio securities held during the most recent twelve-month period ended June 30, are available without charge, upon request, by calling the Trust at 1-866-746-2606 and on the Securities and Exchange Commission’s (“SEC”) website at http://www.sec.gov.
The Portfolio files its complete schedule of portfolio holdings with the SEC for the first and third quarters of each fiscal year on Form N-Q. A copy of the Trust’s Form N-Q is available on the SEC’s website at http://www.sec.gov and may be reviewed and copied at the SEC’s Public Reference Room in Washington D.C. Information on the operation of the Public Reference Room may be obtained by calling 1-800-SEC-0330.
PIMCO Variable Insurance Trust is distributed by Allianz Global Investors Distributors LLC, 2187 Atlantic Street, Stamford, CT 06902.
| | | | |
| 2 | | PIMCO Variable Insurance Trust | | |
The following disclosure provides important information regarding the Portfolio’s Expense Example (“Example” or “Expense Example”), which appears in this Semiannual Report. Please refer to this information when reviewing the Expense Example for the Portfolio.
Example
As a shareholder of the Portfolio, you incur two types of costs: (1) transaction costs and (2) ongoing costs, including advisory and administrative fees; distribution and/or service (12b-1) fees (Administrative Class only); and other Portfolio expenses. The Example is intended to help you understand your ongoing costs (in dollars) of investing in the Portfolio and to compare these costs with the ongoing costs of investing in other mutual funds. The Expense Example does not reflect any fees or other expenses imposed by the Variable Contracts. If it did, the expenses reflected in the Expense Examples would be higher. The Example is based on an investment of $1,000 invested at the beginning of the period and held for the entire period indicated, which is from January 1, 2006 to June 30, 2006.
Actual Expenses
The information in the table under the heading “Actual Performance” provides information about actual account values and actual expenses. You may use the information in these columns, together with the amount you invested, to estimate the expenses that you paid over the period. Simply divide your account value by $1,000 (for example, an $8,600 account value divided by $1,000 = 8.60), then multiply the result by the number in the appropriate column for your share class, in the row titled “Expenses Paid During Period” to estimate the expenses you paid on your account during this period.
Hypothetical Example for Comparison Purposes
The information in the table under the heading “Hypothetical Performance (5% return before expenses)” provides information about hypothetical account values and hypothetical expenses based on the Portfolio’s actual expense ratio and an assumed rate of return of 5% per year before expenses, which is not the Portfolio’s actual return. The hypothetical account values and expenses may not be used to estimate the actual ending account balance or expenses you paid for the period. You may use this information to compare the ongoing costs of investing in the Portfolio and other portfolios. To do so, compare this 5% hypothetical example with the 5% hypothetical examples that appear in the shareholder reports of the other portfolios.
Please note that the expenses shown in the table are meant to highlight your ongoing costs only and do not reflect any transactional costs. Therefore, the information under the heading “Hypothetical Performance (5% return before expenses)” is useful in comparing ongoing costs only, and will not help you determine the relative total costs of owning different portfolios. In addition, if these transactional costs were included, your costs would have been higher.
The expense ratio may vary period to period because of various factors, such as an increase in expenses not covered by the advisory and administrative fees (such as expenses of the trustees and their counsel or litigation expense).
Portfolio Benchmark
Lehman Brothers U.S. TIPS Index is an unmanaged market index comprised of all U.S. Treasury Inflation Protected Securities rated investment grade (Baa3 or better), have at least one year to final maturity, and at least $250 million par amount outstanding.
| | | | | | |
| | | Semiannual Report | | June 30, 2006 | | 3 |
|
|
| PIMCO Real Return Portfolio |
|
Cumulative Returns Through June 30, 2006
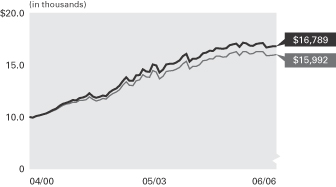
Real Return Portfolio Lehman Brothers
Institutional Class U.S. TIPS Index
------------------- ---------------
04/30/2000 $10,000 $10,000
05/31/2000 9,947 9,974
06/30/2000 10,088 10,100
07/31/2000 10,160 10,186
08/31/2000 10,242 10,261
09/30/2000 10,329 10,315
10/31/2000 10,507 10,440
11/30/2000 10,668 10,591
12/31/2000 10,800 10,705
01/31/2001 11,089 10,929
02/28/2001 11,270 11,114
03/31/2001 11,365 11,220
04/30/2001 11,482 11,283
05/31/2001 11,617 11,416
06/30/2001 11,603 11,403
07/31/2001 11,808 11,593
08/31/2001 11,879 11,609
09/30/2001 11,998 11,677
10/31/2001 12,287 11,953
11/30/2001 11,968 11,687
12/31/2001 11,857 11,551
01/31/2002 11,928 11,619
02/28/2002 12,076 11,795
03/31/2002 12,014 11,722
04/30/2002 12,374 12,042
05/31/2002 12,580 12,234
06/30/2002 12,747 12,407
07/31/2002 13,009 12,612
08/31/2002 13,475 13,063
09/30/2002 13,816 13,392
10/31/2002 13,466 13,035
11/30/2002 13,472 13,026
12/31/2002 13,984 13,463
01/31/2003 14,033 13,565
02/28/2003 14,588 14,073
03/31/2003 14,367 13,845
04/30/2003 14,346 13,809
05/31/2003 15,052 14,464
06/30/2003 14,945 14,316
07/31/2003 14,276 13,656
08/31/2003 14,540 13,901
09/30/2003 15,032 14,361
10/31/2003 15,106 14,439
11/30/2003 15,090 14,447
12/31/2003 15,242 14,594
01/31/2004 15,450 14,762
02/29/2004 15,831 15,103
03/31/2004 16,064 15,345
04/30/2004 15,322 14,600
05/31/2004 15,593 14,863
06/30/2004 15,603 14,869
07/31/2004 15,753 15,008
08/31/2004 16,127 15,411
09/30/2004 16,182 15,441
10/31/2004 16,363 15,596
11/30/2004 16,348 15,558
12/31/2004 16,626 15,830
01/31/2005 16,586 15,831
02/28/2005 16,562 15,763
03/31/2005 16,606 15,778
04/30/2005 16,886 16,079
05/31/2005 16,989 16,189
06/30/2005 17,042 16,258
07/31/2005 16,721 15,917
08/31/2005 17,119 16,284
09/30/2005 17,077 16,261
10/31/2005 16,861 16,054
11/30/2005 16,820 16,081
12/31/2005 16,999 16,279
01/31/2006 17,079 16,278
02/28/2006 17,105 16,270
03/31/2006 16,680 15,913
04/30/2006 16,723 15,900
05/31/2006 16,781 15,946
06/30/2006 16,789 15,992
$10,000 invested at the beginning of the first full month following the inception date of the Portfolio’s Institutional Class.
Sector Breakdown‡
| | |
U.S. Treasury Obligations | | 50.9% |
Short-Term Instruments | | 32.5% |
U.S. Government Agencies | | 6.4% |
Asset-Backed Securities | | 5.2% |
Other | | 5.0% |
| | ‡ | % of Total Investments as of June 30, 2006 |
| | | | | | | | | | | | |
| Average Annual Total Return for the period ended June 30, 2006 |
| | | | | | | 6 Months* | | 1 Year | | 5 Years | | Since Inception (04/10/00)** |
| | |
| | PIMCO Real Return Portfolio Institutional Class | | -1.23% | | -1.49% | | 7.67% | | 8.80% |
| | |
| | Lehman Brothers U.S. TIPS Index | | -1.77% | | -1.64% | | 7.00% | | 8.03% |
All Portfolio returns are net of fees and expenses.
* Cumulative return.
** The Institutional Class shares commenced operations on 04/10/00. Index comparisons began on 03/31/00.
Past performance is no guarantee of future results. The performance quoted represents past performance. Investment return and principal value will fluctuate so the Portfolio shares, when redeemed, may be worth more or less than their original cost. The Portfolio’s performance does not reflect the deduction of additional charges and expenses imposed in connection with investing in Variable Contracts, which will reduce returns. Current performance may be lower or higher than the performance data quoted. Performance data current to the most recent month-end is available by calling (800) 927-4648.
| | | | | | | | |
| Expense Example | | Actual Performance | | | | Hypothetical Performance |
| | | | | | | (5% return before expenses) |
Beginning Account Value (01/01/06) | | $ | 1,000.00 | | | | $ | 1,000.00 |
Ending Account Value (06/30/06) | | $ | 987.70 | | | | $ | 1,022.27 |
Expenses Paid During Period† | | $ | 2.51 | | | | $ | 2.56 |
† Expenses are equal to the Portfolio’s Institutional Class annualized expense ratio of 0.51%, multiplied by the average account value over the period, multiplied by 181/365 (to reflect the one-half year period). Overall fees and expenses of investing in the Portfolio will be higher because the example does not reflect Variable Contract fees and expenses.
Please refer to page 3 herein for a description of the Portfolio’s benchmark and an explanation of the information presented in the above Expense Example.
Portfolio Insights
| » | | The PIMCO Real Return Portfolio seeks to achieve its investment objective by investing under normal circumstances at least 80% of its net assets in inflation-indexed bonds of varying maturities issued by the U.S. and non-U.S. governments, their agencies or instrumentalities, and corporations. |
| » | | For the six-month period ending June 30, 2006, ten-year real yields increased by 0.48%, compared to a 0.82% increase for conventional U.S. Treasury issues of similar maturity. |
| » | | The Portfolio’s above benchmark duration for the first three-months of the period detracted from overall performance, as real yields rose on strong U.S. economic growth. The effective duration of the Portfolio was 6.79 years on June 30, 2006 compared to a duration of 6.11 years for the benchmark. |
| » | | The Portfolio’s emphasis on U.S. nominal bonds was negative for performance, as nominal yields rose faster than real yields based on higher inflation expectations and the outlook for further Federal Reserve tightening. |
| » | | Exposure to short maturity U.S. nominal bonds for the period detracted significantly from performance due to a substantial flattening of the nominal yield curve. |
| » | | Currency exposure added to performance resulting from a depreciation of the U.S. dollar relative to the Euro and Japanese Yen. |
| » | | Mortgage holdings during the period were positive due to favorable coupon selection, particularly 15-year FNMA 5.0% and 30-year FNMA 5.5% coupons, which outperformed the broader Index. |
| » | | Positions in pay-fixed swaps were beneficial with swap spreads mostly widening over the period. |
| | | | | | |
| 4 | | PIMCO Variable Insurance Trust | | | | |
|
|
| Financial Highlights Real Return Portfolio |
| | | | | | | | | | | | | | | | | | | | | | | | |
| Selected Per Share Data for the Year or Period Ended: | | 06/30/2006+ | | | 12/31/2005 | | | 12/31/2004 | | | 12/31/2003 | | | 12/31/2002 | | | 12/31/2001 | |
| | | | | | |
Institutional Class | | | | | | | | | | | | | | | | | | | | | | | | |
| Net asset value beginning of period | | $ | 12.69 | | | $ | 12.92 | | | $ | 12.36 | | | $ | 11.90 | | | $ | 10.56 | | | $ | 10.34 | |
| Net investment income (a) | | | 0.25 | | | | 0.37 | | | | 0.15 | | | | 0.25 | | | | 0.49 | | | | 0.57 | |
| Net realized/unrealized gain (loss) on investments (a) | | | (0.41 | ) | | | (0.08 | ) | | | 0.96 | | | | 0.81 | | | | 1.36 | | | | 0.43 | |
| Total income (loss) from investment operations | | | (0.16 | ) | | | 0.29 | | | | 1.11 | | | | 1.06 | | | | 1.85 | | | | 1.00 | |
| Dividends from net investment income | | | (0.25 | ) | | | (0.38 | ) | | | (0.14 | ) | | | (0.34 | ) | | | (0.49 | ) | | | (0.64 | ) |
| Distributions from net realized capital gains | | | 0.00 | | | | (0.14 | ) | | | (0.41 | ) | | | (0.26 | ) | | | (0.02 | ) | | | (0.14 | ) |
| Total distributions | | | (0.25 | ) | | | (0.52 | ) | | | (0.55 | ) | | | (0.60 | ) | | | (0.51 | ) | | | (0.78 | ) |
| Net asset value end of period | | $ | 12.28 | | | $ | 12.69 | | | $ | 12.92 | | | $ | 12.36 | | | $ | 11.90 | | | $ | 10.56 | |
| Total return | | | (1.23 | )% | | | 2.24 | % | | | 9.08 | % | | | 9.00 | % | | | 17.93 | % | | | 9.79 | % |
| Net assets end of period (000s) | | $ | 42,291 | | | $ | 44,659 | | | $ | 36,691 | | | $ | 26,540 | | | $ | 16 | | | $ | 14 | |
| Ratio of expenses to average net assets | | | 0.51 | %*(b) | | | 0.51 | %(b) | | | 0.50 | % | | | 0.51 | %(b) | | | 0.51 | %(b) | | | 0.50 | % |
| Ratio of net investment income to average net assets | | | 4.09 | %* | | | 2.88 | % | | | 1.14 | % | | | 2.06 | % | | | 4.40 | % | | | 5.32 | % |
| Portfolio turnover rate | | | 530 | % | | | 1,102 | % | | | 1,064 | % | | | 738 | % | | | 87 | % | | | 58 | % |
+ Unaudited
* Annualized
(a) Per share amounts based on average number of shares outstanding during the period.
(b) Ratio of expenses to average net assets excluding interest expense is 0.50%.
| | | | | | |
| See Accompanying Notes | | Semiannual Report | | June 30, 2006 | | 5 |
|
|
| Statement of Assets and Liabilities Real Return Portfolio |
| | | | |
| (Amounts in thousands, except per share amounts) | | June 30, 2006
(Unaudited) | |
| |
Assets: | | | | |
Investments, at value | | $ | 2,350,300 | |
Cash | | | 77 | |
Foreign currency, at value | | | 1,422 | |
Receivable for investments sold | | | 12 | |
Receivable for investments sold on delayed-delivery basis | | | 22,982 | |
Receivable for Portfolio shares sold | | | 766 | |
Interest and dividends receivable | | | 4,444 | |
Variation margin receivable | | | 255 | |
Swap premiums paid | | | 5,195 | |
Unrealized appreciation on forward foreign currency contracts | | | 348 | |
Unrealized appreciation on swap agreements | | | 2,046 | �� |
| | | | 2,387,847 | |
| |
Liabilities: | | | | |
Payable for investments purchased | | $ | 32,923 | |
Payable for investments purchased on delayed-delivery basis | | | 1,206,598 | |
Payable for short sales | | | 7,365 | |
Payable for Portfolio shares redeemed | | | 3,639 | |
Written options outstanding | | | 675 | |
Accrued investment advisory fee | | | 247 | |
Accrued administration fee | | | 247 | |
Accrued servicing fee | | | 129 | |
Dividends payable | | | 11 | |
Variation margin payable | | | 56 | |
Swap premiums received | | | 1,677 | |
Unrealized depreciation on forward foreign currency contracts | | | 3,648 | |
Unrealized depreciation on swap agreements | | | 402 | |
Other liabilities | | | 3,250 | |
| | | | 1,260,867 | |
| |
Net Assets | | $ | 1,126,980 | |
| |
Net Assets Consist of: | | | | |
Paid in capital | | $ | 1,156,146 | |
Undistributed net investment income | | | 5,699 | |
Accumulated undistributed net realized (loss) | | | (42,472 | ) |
Net unrealized appreciation | | | 7,607 | |
| | | $ | 1,126,980 | |
| |
Net Assets: | | | | |
Institutional Class | | $ | 42,291 | |
Administrative Class | | | 1,084,003 | |
Advisor Class | | | 686 | |
| |
Shares Issued and Outstanding: | | | | |
Institutional Class | | | 3,444 | |
Administrative Class | | | 88,285 | |
Advisor Class | | | 56 | |
| |
Net Asset Value and Redemption Price Per Share (Net Assets Per Share Outstanding) | | | | |
Institutional Class | | $ | 12.28 | |
Administrative Class | | | 12.28 | |
Advisor Class | | | 12.28 | |
| |
Cost of Investments Owned | | $ | 2,337,734 | |
Cost of Foreign Currency Held | | $ | 1,398 | |
Proceeds Received on Short Sales | | $ | 7,304 | |
Premiums Received on Written Options | | $ | 1,008 | |
| | | | |
| 6 | | PIMCO Variable Insurance Trust | | See Accompanying Notes |
|
|
| Statement of Operations Real Return Portfolio |
| | | | |
| (Amounts in Thousands) | | Six Months Ended
June 30, 2006
(Unaudited) | |
| |
Investment Income: | | | | |
Interest | | $ | 25,056 | |
Miscellaneous income | | | 2 | |
Total Income | | | 25,058 | |
| |
Expenses: | | | | |
Investment advisory fees | | | 1,362 | |
Administration fees | | | 1,362 | |
Servicing fees – Administrative Class | | | 785 | |
Trustee’s Fees | | | 6 | |
Interest expense | | | 60 | |
Total Expenses | | | 3,575 | |
| |
Net Investment Income | | | 21,483 | |
| |
Net Realized and Unrealized Gain (Loss): | | | | |
Net realized (loss) on investments | | | (45,095 | ) |
Net realized gain on futures contracts, options and swaps | | | 5,187 | |
Net realized (loss) on foreign currency transactions | | | (1,030 | ) |
Net change in unrealized appreciation on investments | | | 725 | |
Net change in unrealized appreciation on futures contracts, options and swaps | | | 1,515 | |
Net change in unrealized appreciation on translation of assets and liabilities denominated in foreign currencies | | | 2,739 | |
Net (Loss) | | | (35,959 | ) |
| |
Net (Decrease) in Net Assets Resulting from Operations | | $ | (14,476 | ) |
| | | | | | |
| See Accompanying Notes | | Semiannual Report | | June 30, 2006 | | 7 |
|
|
| Statements of Changes in Net Assets Real Return Portfolio |
| | | | | | | | |
| (Amounts in Thousands) | | Six Months Ended
June 30, 2006
(Unaudited) | | | Year Ended
December 31, 2005 | |
| | |
Increase (Decrease) in Net Assets from: | | | | | | | | |
| | |
Operations: | | | | | | | | |
Net investment income | | $ | 21,483 | | | $ | 24,960 | |
Net realized gain (loss) | | | (40,938 | ) | | | 521 | |
Net change in unrealized appreciation (depreciation) | | | 4,979 | | | | (6,910 | ) |
Net increase (decrease) resulting from operations | | | (14,476 | ) | | | 18,571 | |
| | |
Distributions to Shareholders: | | | | | | | | |
| From net investment income | | | | | | | | |
Institutional Class | | | (880 | ) | | | (1,276 | ) |
Administrative Class | | | (20,757 | ) | | | (24,317 | ) |
Advisor Class | | | (3 | ) | | | 0 | |
| From net realized capital gains | | | | | | | | |
Institutional Class | | | 0 | | | | (483 | ) |
Administrative Class | | | 0 | | | | (10,897 | ) |
Advisor Class | | | 0 | | | | 0 | |
| | |
Total Distributions | | | (21,640 | ) | | | (36,973 | ) |
| | |
Portfolio Share Transactions: | | | | | | | | |
| Receipts for shares sold | | | | | | | | |
Institutional Class | | | 1,995 | | | | 11,510 | |
Administrative Class | | | 206,303 | | | | 460,693 | |
Advisor Class | | | 804 | | | | 0 | |
| Issued as reinvestment of distributions | | | | | | | | |
Institutional Class | | | 880 | | | | 1,759 | |
Administrative Class | | | 20,703 | | | | 35,153 | |
Advisor Class | | | 3 | | | | 0 | |
| Cost of shares redeemed | | | | | | | | |
Institutional Class | | | (3,802 | ) | | | (4,483 | ) |
Administrative Class | | | (120,373 | ) | | | (102,785 | ) |
Advisor Class | | | (118 | ) | | | 0 | |
Net increase resulting from Portfolio share transactions | | | 106,395 | | | | 401,847 | |
| | |
Total Increase in Net Assets | | | 70,279 | | | | 383,445 | |
| | |
Net Assets: | | | | | | | | |
Beginning of period | | | 1,056,701 | | | | 673,256 | |
End of period* | | $ | 1,126,980 | | | $ | 1,056,701 | |
| | |
*Including undistributed net investment income of: | | $ | 5,699 | | | $ | 5,856 | |
| | | | |
| 8 | | PIMCO Variable Insurance Trust | | See Accompanying Notes |
| | |
| |
| Schedule of Investments Real Return Portfolio | | June 30, 2006 (Unaudited) |
| | | | | | | | |
| | | | | PRINCIPAL | | | | |
| | | | | AMOUNT | | | | VALUE |
| | | | | (000S) | | | | (000S) |
| | | | | | | | | |
| BANK LOAN OBLIGATIONS 0.1% |
| Georgia-Pacific Corp. | | | | | | | | |
6.726% due 12/20/2012 | | $ | | 45 | | $ | | 46 |
6.880% due 12/20/2012 | | | | 762 | | | | 761 |
7.170% due 12/20/2012 | | | | 190 | | | | 190 |
| | | | | | | | |
|
Total Bank Loan Obligations (Cost $997) | | 997 |
| | | | | | | | |
|
| |
| CORPORATE BONDS & NOTES 5.2% |
| |
| BANKING & FINANCE 4.4% |
| Atlantic & Western Re Ltd. | | | | | | | | |
11.508% due 01/09/2007 | | | | 1,400 | | | | 1,379 |
11.758% due 01/09/2009 | | | | 900 | | | | 848 |
|
| BAE Systems Holdings, Inc. | | | | | | | | |
5.570% due 08/15/2008 | | | | 300 | | | | 301 |
|
| Charter One Bank N.A. | | | | | | | | |
5.157% due 04/24/2009 | | | | 8,400 | | | | 8,405 |
|
| Citigroup, Inc. | | | | | | | | |
5.199% due 05/02/2008 | | | | 1,000 | | | | 1,001 |
5.166% due 01/30/2009 | | | | 1,000 | | | | 1,000 |
|
| Ford Motor Credit Co. | | | | | | | | |
6.374% due 03/21/2007 | | | | 6,400 | | | | 6,378 |
|
| General Electric Capital Corp. | | | | |
5.311% due 03/04/2008 | | | | 2,800 | | | | 2,803 |
5.340% due 12/12/2008 | | | | 900 | | | | 901 |
|
| General Motors Acceptance Corp. | | | | |
6.750% due 12/01/2014 | | | | 1,600 | | | | 1,488 |
|
| Goldman Sachs Group, Inc. | | | | | | | | |
5.386% due 08/01/2006 | | | | 2,800 | | | | 2,800 |
5.790% due 06/28/2010 | | | | 4,700 | | | | 4,728 |
|
| Mirage Resorts, Inc. | | | | | | | | |
7.250% due 10/15/2006 | | | | 100 | | | | 101 |
|
| Morgan Stanley Warehouse Facilities |
4.719% due 08/16/2006 (h) | | | | 6,200 | | | | 6,200 |
|
| Phoenix Quake Ltd. | | | | | | | | |
7.958% due 07/03/2008 | | | | 500 | | | | 507 |
|
| Phoenix Quake Wind Ltd. | | | | | | | | |
7.440% due 07/03/2008 | | | | 2,000 | | | | 2,021 |
|
| Rabobank Nederland | | | | | | | | |
5.088% due 01/15/2009 | | | | 800 | | | | 800 |
|
| Toyota Motor Credit Corp. | | | | | | | | |
5.192% due 09/18/2006 | | | | 4,600 | | | | 4,600 |
|
| Travelers Property Casualty Corp. |
3.750% due 03/15/2008 | | | | 100 | | | | 97 |
|
| Vita Capital Ltd. | | | | | | | | |
6.340% due 01/01/2007 | | | | 700 | | | | 702 |
|
| Wachovia Bank N.A. | | | | | | | | |
5.308% due 12/02/2010 | | | | 2,400 | | | | 2,402 |
| | | | | | | | |
|
| | | | | | | | | 49,462 |
| | | | | | | | |
|
| |
| INDUSTRIALS 0.7% | | | | | | | | |
| Caesars Entertainment, Inc. | | | | | | | | |
8.500% due 11/15/2006 | | | | 300 | | | | 303 |
|
| CSC Holdings, Inc. | | | | | | | | |
7.875% due 12/15/2007 | | | | 600 | | | | 609 |
|
| DaimlerChrysler N.A. Holding Corp. |
5.486% due 03/07/2007 | | | | 3,500 | | | | 3,501 |
|
| EchoStar DBS Corp. | | | | | | | | |
5.750% due 10/01/2008 | | | | 500 | | | | 490 |
| | | | | | | | |
| El Paso Corp. | | | | | | | | |
7.625% due 08/16/2007 | | $ | | 100 | | $ | | 101 |
6.950% due 12/15/2007 | | | | 100 | | | | 101 |
7.625% due 09/01/2008 | | | | 1,000 | | | | 1,018 |
|
| HCA, Inc. | | | | | | | | |
7.250% due 05/20/2008 | | | | 100 | | | | 102 |
|
| Host Marriott LP | | | | | | | | |
9.500% due 01/15/2007 | | | | 300 | | | | 309 |
9.250% due 10/01/2007 | | | | 100 | | | | 104 |
|
| Pemex Project Funding Master Trust |
7.375% due 12/15/2014 | | | | 500 | | | | 517 |
8.625% due 02/01/2022 | | | | 200 | | | | 224 |
|
| Royal Caribbean Cruises Ltd. | | | | | | | | |
7.250% due 08/15/2006 | | | | 400 | | | | 402 |
7.000% due 10/15/2007 | | | | 200 | | | | 203 |
|
| Starwood Hotels & Resorts Worldwide, Inc. |
7.375% due 05/01/2007 | | | | 100 | | | | 101 |
| | | | | | | | |
|
| | | | | | | | | 8,085 |
| | | | | | | | |
|
| |
| UTILITIES 0.1% | | | | | | | | |
| Cleveland Electric Illuminating Co. |
6.860% due 10/01/2008 | | | | 100 | | | | 102 |
|
| Embarq Corp. | | | | | | | | |
7.082% due 06/01/2016 | | | | 300 | | | | 299 |
|
| Nisource Finance Corp. | | | | | | | | |
5.764% due 11/23/2009 | | | | 800 | | | | 802 |
| | | | | | | | |
|
| | | | | | | | | 1,203 |
| | | | | | | | |
|
Total Corporate Bonds & Notes
(Cost $58,671) | | 58,750 |
| | | | | | | | |
|
| |
| MUNICIPAL BONDS & NOTES 0.1% |
| Badger, Wisconsin Tobacco Asset Securitization Corporations Revenue Notes, Series 2002 |
6.000% due 06/01/2017 (a) | | | | 475 | | | | 501 |
|
| New York City, New York Municipal Water Finance Authority Revenue Notes, Series 2006 |
5.781% due 06/15/2038 (a) | | | | 130 | | | | 121 |
|
| Rhode Island State Tobacco Settlement Financing Corporations Revenue Notes, Series 2002 |
6.000% due 06/01/2023 (a) | | | | 500 | | | | 523 |
| | | | | | | | |
|
Total Municipal Bonds & Notes
(Cost $1,012) | | 1,145 |
| | | | | | | | |
|
| |
| U.S. GOVERNMENT AGENCIES 13.3% |
| Fannie Mae | | | | | | | | |
4.192% due 11/01/2034 | | | | 7,868 | | | | 7,714 |
4.500% due 10/25/2022 | | | | 200 | | | | 199 |
4.606% due 07/01/2035 | | | | 1,045 | | | | 1,031 |
4.681% due 02/25/2036 | | | | 2,900 | | | | 2,810 |
4.716% due 01/01/2035 | | | | 847 | | | | 832 |
5.111% due 09/07/2006 | | | | 27,600 | | | | 27,590 |
5.211% due 03/01/2044 - 09/01/2044 (c) | | | | 13,622 | | | | 13,686 |
5.299% due 09/21/2006 | | | | 14,100 | | | | 14,098 |
5.472% due 08/25/2034 | | | | 985 | | | | 984 |
5.500% due 03/01/2034 - 07/13/2036 (c) | | | | 45,489 | | | | 43,717 |
5.672% due 05/25/2042 | | | | 384 | | | | 385 |
5.950% due 02/25/2044 | | | | 1,500 | | | | 1,487 |
6.361% due 11/01/2024 | | | | 23 | | | | 24 |
|
| Freddie Mac | | | | | | | | |
4.000% due 03/15/2023 - 10/15/2023 (c) | | | | 1,434 | | | | 1,403 |
4.555% due 01/01/2034 | | | | 847 | | | | 829 |
5.211% due 10/25/2044 - 02/25/2045 (c) | | | | 27,174 | | | | 27,276 |
| | | | | | | | |
5.549% due 12/15/2030 | | $ | | 598 | | $ | | 599 |
5.582% due 08/25/2031 | | | | 267 | | | | 268 |
|
| Small Business Administration |
4.504% due 02/01/2014 | | | | 1,938 | | | | 1,826 |
|
| Small Business Administration Participation Certificates |
4.880% due 11/01/2024 | | | | 3,881 | | | | 3,670 |
| | | | | | | | |
|
Total U.S. Government Agencies
(Cost $151,517) | | 150,428 |
| | | | | | | | |
|
| |
| U.S. TREASURY OBLIGATIONS 106.1% |
| Treasury Inflation Protected Securities (b) |
3.375% due 01/15/2007 | | | | 255 | | | | 256 |
3.625% due 01/15/2008 | | | | 72,756 | | | | 74,029 |
3.875% due 01/15/2009 | | | | 79,566 | | | | 82,438 |
4.250% due 01/15/2010 | | | | 50,443 | | | | 53,603 |
0.875% due 04/15/2010 | | | | 108,925 | | | | 102,785 |
3.500% due 01/15/2011 | | | | 48,130 | | | | 50,358 |
2.375% due 04/15/2011 | | | | 18,044 | | | | 17,978 |
3.375% due 01/15/2012 | | | | 4,558 | | | | 4,776 |
3.000% due 07/15/2012 | | | | 107,133 | | | | 110,356 |
1.875% due 07/15/2013 | | | | 43,406 | | | | 41,712 |
2.000% due 01/15/2014 | | | | 102,388 | | | | 98,861 |
2.000% due 07/15/2014 | | | | 99,400 | | | | 95,754 |
1.625% due 01/15/2015 | | | | 3,497 | | | | 3,261 |
1.875% due 07/15/2015 | | | | 115,676 | | | | 109,797 |
2.000% due 01/15/2016 | | | | 16,209 | | | | 15,484 |
2.375% due 01/15/2025 | | | | 93,066 | | | | 90,609 |
2.000% due 01/15/2026 | | | | 39,962 | | | | 36,600 |
3.625% due 04/15/2028 | | | | 66,504 | | | | 78,934 |
3.875% due 04/15/2029 | | | | 83,450 | | | | 103,282 |
3.375% due 04/15/2032 | | | | 1,824 | | | | 2,154 |
|
| U.S. Treasury Bonds | | | | | | | | |
8.875% due 08/15/2017 | | | | 1,000 | | | | 1,305 |
6.625% due 02/15/2027 | | | | 1,300 | | | | 1,514 |
4.500% due 02/15/2036 | | | | 4,400 | | | | 3,947 |
|
| U.S. Treasury Notes | | | | | | | | |
4.500% due 02/28/2011 | | | | 1,700 | | | | 1,658 |
4.875% due 04/30/2011 | | | | 10,600 | | | | 10,495 |
4.250% due 11/15/2014 | | | | 1,000 | | | | 941 |
4.125% due 05/15/2015 | | | | 100 | | | | 93 |
4.500% due 11/15/2015 | | | | 2,800 | | | | 2,668 |
| | | | | | | | |
|
Total U.S. Treasury Obligations
(Cost $1,187,521) | | 1,195,648 |
| | | | | | | | |
|
| |
| MORTGAGE-BACKED SECURITIES 4.6% |
| Banc of America Funding Corp. |
4.622% due 02/20/2036 | | | | 3,602 | | | | 3,519 |
|
| Banc of America Mortgage Securities |
6.500% due 02/25/2033 | | | | 232 | | | | 231 |
|
| Bear Stearns Adjustable Rate Mortgage Trust |
4.203% due 01/25/2034 | | | | 2,567 | | | | 2,554 |
|
| Citigroup Mortgage Loan Trust, Inc. |
4.700% due 12/25/2035 | | | | 4,662 | | | | 4,572 |
4.900% due 12/25/2035 | | | | 277 | | | | 275 |
|
| Countrywide Alternative Loan Trust |
5.392% due 06/25/2046 | | | | 992 | | | | 989 |
|
| Countrywide Home Loan Mortgage Pass-Through Trust |
3.795% due 11/19/2033 | | | | 291 | | | | 278 |
5.662% due 06/25/2035 | | | | 867 | | | | 867 |
|
| CS First Boston Mortgage Securities Corp. |
4.938% due 05/15/2010 | | | | 1,222 | | | | 1,204 |
|
| First Horizon Alternative Mortgage Securities |
4.744% due 06/25/2034 | | | | 1,123 | | | | 1,101 |
| | | | | | |
| See Accompanying Notes | | Semiannual Report | | June 30, 2006 | | 9 |
| | |
| |
| Schedule of Investments Real Return Portfolio (Cont.) | | |
| | | | | | | | |
| | | | | PRINCIPAL | | | | |
| | | | | AMOUNT | | | | VALUE |
| | | | | (000S) | | | | (000S) |
| | | | | | | | | |
| GE Capital Commercial Mortgage Corp. |
4.229% due 12/10/2037 | | $ | | 8,709 | | $ | | 8,415 |
|
| GGP Mall Properties Trust | | | | | | | | |
5.007% due 11/15/2011 | | | | 1,431 | | | | 1,429 |
|
| Greenpoint Mortgage Funding Trust |
5.542% due 05/25/2045 | | | | 1,860 | | | | 1,867 |
5.592% due 11/25/2045 | | | | 1,203 | | | | 1,206 |
|
| GSR Mortgage Loan Trust | | | | | | | | |
4.540% due 09/25/2035 | | | | 2,469 | | | | 2,403 |
|
| Lehman XS Trust | | | | | | | | |
5.402% due 06/25/2036 | | | | 1,500 | | | | 1,502 |
5.402% due 04/25/2046 | | | | 2,937 | | | | 2,938 |
|
| MASTR Adjustable Rate Mortgages Trust |
3.786% due 11/21/2034 | | | | 700 | | | | 659 |
|
| Mellon Residential Funding Corp. |
5.639% due 12/15/2030 | | | | 1,275 | | | | 1,280 |
5.549% due 11/15/2031 | | | | 1,558 | | | | 1,561 |
|
| Sequoia Mortgage Trust | | | | | | | | |
5.602% due 10/19/2026 | | | | 537 | | | | 538 |
|
| Structured Adjustable Rate Mortgage Loan Trust |
4.580% due 02/25/2034 | | | | 885 | | | | 867 |
5.682% due 01/25/2035 | | | | 819 | | | | 827 |
|
| Structured Asset Mortgage Investments, Inc. |
5.540% due 05/25/2035 | | | | 500 | | | | 501 |
|
| Washington Mutual, Inc. | | | | | | | | |
5.612% due 08/25/2045 | | | | 428 | | | | 429 |
5.612% due 10/25/2045 | | | | 6,531 | | | | 6,573 |
5.582% due 12/25/2045 | | | | 939 | | | | 942 |
5.259% due 07/25/2046 | | | | 2,400 | | | | 2,398 |
| | | | | | | | |
|
Total Mortgage-Backed Securities
(Cost $52,187) | | 51,925 |
| | | | | | | | |
|
| |
| ASSET-BACKED SECURITIES 10.8% |
| AAA Trust | | | | | | | | |
5.422% due 11/26/2035 | | | | 198 | | | | 198 |
|
| ACE Securities Corp. | | | | | | | | |
5.432% due 10/25/2035 | | | | 3,202 | | | | 3,205 |
|
| Aegis Asset-Backed Securities Trust |
5.522% due 09/25/2034 | | | | 253 | | | | 254 |
|
| Argent Securities, Inc. | | | | | | | | |
5.442% due 10/25/2035 | | | | 953 | | | | 953 |
5.462% due 12/25/2035 | | | | 3,617 | | | | 3,619 |
5.402% due 03/25/2036 | | | | 1,614 | | | | 1,615 |
5.392% due 05/25/2036 | | | | 1,131 | | | | 1,131 |
|
| Asset-Backed Funding Certificates |
5.432% due 08/25/2035 | | | | 662 | | | | 663 |
|
| Bayview Financial Acquisition Trust |
5.791% due 08/28/2034 | | | | 1,499 | | | | 1,501 |
|
| Bear Stearns Asset-Backed Securities, Inc. |
5.652% due 10/25/2032 | | | | 58 | | | | 58 |
5.522% due 09/25/2034 | | | | 1,238 | | | | 1,239 |
5.402% due 11/25/2035 | | | | 797 | | | | 797 |
5.652% due 01/25/2036 | | | | 304 | | | | 304 |
5.772% due 03/25/2043 | | | | 191 | | | | 191 |
|
| Capital One Auto Finance Trust |
5.117% due 05/15/2007 | | | | 1,483 | | | | 1,483 |
|
| Carrington Mortgage Loan Trust |
5.402% due 06/25/2035 | | | | 55 | | | | 55 |
|
| Centex Home Equity | | | | | | | | |
5.372% due 06/25/2036 | | | | 3,589 | | | | 3,590 |
| | | | | | | | |
| Chase Credit Card Master Trust |
5.579% due 11/17/2008 | | $ | | 1,200 | | $ | | 1,201 |
|
| Citigroup Mortgage Loan Trust, Inc. |
5.402% due 12/27/2036 | | | | 2,142 | | | | 2,144 |
|
| Countrywide Asset-Backed Certificates |
5.452% due 02/25/2036 | | | | 1,095 | | | | 1,096 |
5.392% due 03/25/2036 | | | | 1,937 | | | | 1,937 |
5.392% due 04/25/2036 | | | | 1,014 | | | | 1,015 |
5.371% due 07/25/2036 | | | | 2,300 | | | | 2,303 |
5.395% due 07/25/2036 | | | | 900 | | | | 901 |
|
| Equity One ABS, Inc. | | | | | | | | |
5.622% due 04/25/2034 | | | | 255 | | | | 257 |
|
| FBR Securitization Trust | | | | | | | | |
5.442% due 09/25/2035 | | | | 782 | | | | 783 |
5.502% due 09/25/2035 | | | | 2,400 | | | | 2,402 |
5.432% due 10/25/2035 | | | | 6,540 | | | | 6,545 |
5.442% due 10/25/2035 | | | | 712 | | | | 713 |
|
| First Franklin Mortgage Loan Asset-Backed Certificates |
5.412% due 01/25/2036 | | | | 2,308 | | | | 2,310 |
|
| First NLC Trust | | | | | | | | |
5.432% due 12/25/2035 | | | | 1,340 | | | | 1,341 |
|
| Ford Credit Auto Owner Trust | | | | | | | | |
4.240% due 03/15/2008 | | | | 1,074 | | | | 1,069 |
|
| Fremont Home Loan Trust | | | | | | | | |
5.412% due 01/25/2036 | | | | 3,071 | | | | 3,074 |
|
| GSAMP Trust | | | | | | | | |
5.612% due 03/25/2034 | | | | 357 | | | | 358 |
5.412% due 11/25/2035 | | | | 2,995 | | | | 2,997 |
5.432% due 01/25/2036 | | | | 2,593 | | | | 2,595 |
|
| GSR Mortgage Loan Trust | | | | | | | | |
5.422% due 12/25/2030 | | | | 1,481 | | | | 1,481 |
|
| Home Equity Asset Trust | | | | | | | | |
5.432% due 02/25/2036 | | | | 851 | | | | 852 |
5.402% due 05/25/2036 | | | | 955 | | | | 955 |
|
| HSI Asset Securitization Corp. Trust |
5.402% due 12/25/2035 | | | | 1,163 | | | | 1,164 |
|
| Indymac Residential Asset-Backed Trust |
5.422% due 03/25/2036 | | | | 1,293 | | | | 1,294 |
|
| JP Morgan Mortgage Acquisition Corp. |
5.392% due 01/25/2026 | | | | 1,456 | | | | 1,457 |
|
| Long Beach Mortgage Loan Trust |
5.522% due 11/25/2034 | | | | 1,138 | | | | 1,139 |
5.412% due 01/25/2036 | | | | 620 | | | | 621 |
5.402% due 02/25/2036 | | | | 864 | | | | 865 |
5.392% due 03/25/2036 | | | | 403 | | | | 403 |
5.382% due 04/25/2036 | | | | 369 | | | | 369 |
|
| Mastr Asset-Backed Securities Trust |
5.402% due 01/25/2036 | | | | 2,062 | | | | 2,064 |
|
| Merrill Lynch Mortgage Investors, Inc. |
5.422% due 06/25/2036 | | | | 318 | | | | 319 |
5.479% due 06/25/2036 | | | | 3,100 | | | | 3,100 |
5.402% due 01/25/2037 | | | | 748 | | | | 748 |
5.400% due 05/25/2037 | | | | 1,200 | | | | 1,201 |
|
| Morgan Stanley ABS Capital I |
5.381% due 06/25/2036 | | | | 4,600 | | | | 4,599 |
|
| Nelnet Student Loan Trust | | | | | | | | |
5.051% due 10/27/2014 | | | | 300 | | | | 300 |
5.190% due 07/25/2016 | | | | 700 | | | | 702 |
5.190% due 10/25/2016 | | | | 1,200 | | | | 1,201 |
| | | | | | | | |
| New Century Home Equity Loan Trust |
5.432% due 09/25/2035 | | $ | | 633 | | $ | | 634 |
5.442% due 10/25/2035 | | | | 179 | | | | 179 |
|
| Newcastle Mortgage Securities Trust |
5.392% due 04/25/2036 | | | | 695 | | | | 696 |
|
| Nomura Asset Acceptance Corp. |
5.462% due 01/25/2036 | | | | 889 | | | | 889 |
|
| Option One Mortgage Loan Trust |
5.422% due 11/25/2035 | | | | 1,242 | | | | 1,243 |
|
| Renaissance Home Equity Loan Trust |
5.702% due 12/25/2032 | | | | 217 | | | | 217 |
5.472% due 10/25/2035 | | | | 231 | | | | 231 |
|
| Residential Asset Mortgage Products, Inc. |
5.402% due 12/25/2007 | | | | 1,034 | | | | 1,035 |
5.482% due 09/25/2013 | | | | 106 | | | | 106 |
5.432% due 01/25/2025 | | | | 57 | | | | 57 |
5.662% due 11/25/2033 | | | | 507 | | | | 508 |
|
| Residential Asset Securities Corp. |
5.422% due 09/25/2025 | | | | 129 | | | | 129 |
5.422% due 05/25/2027 | | | | 377 | | | | 377 |
5.392% due 06/25/2027 | | | | 272 | | | | 272 |
5.622% due 01/25/2034 | | | | 3 | | | | 3 |
5.131% due 06/25/2036 | | | | 3,180 | | | | 3,181 |
5.362% due 06/25/2036 | | | | 1,884 | | | | 1,884 |
|
| Residential Funding Mortgage Securities II, Inc. |
5.462% due 09/25/2035 | | | | 2,133 | | | | 2,135 |
|
| SACO I, Inc. | | | | | | | | |
5.432% due 10/25/2033 | | | | 1,592 | | | | 1,593 |
|
| Securitized Asset-Backed Receivables LLC Trust |
5.392% due 10/25/2035 | | | | 546 | | | | 546 |
|
| SG Mortgage Securities Trust |
5.422% due 09/25/2035 | | | | 56 | | | | 56 |
|
| SLM Student Loan Trust | | | | | | | | |
5.070% due 01/25/2013 | | | | 1,216 | | | | 1,216 |
5.120% due 07/25/2013 | | | | 565 | | | | 566 |
5.190% due 10/25/2013 | | | | 776 | | | | 778 |
|
| Soundview Home Equity Loan Trust |
5.432% due 05/25/2035 | | | | 1,082 | | | | 1,082 |
5.392% due 02/25/2036 | | | | 308 | | | | 308 |
5.392% due 03/25/2036 | | | | 712 | | | | 712 |
5.392% due 04/25/2036 | | | | 161 | | | | 161 |
5.298% due 07/25/2036 | | | | 3,400 | | | | 3,399 |
|
| Structured Asset Investment Loan Trust |
5.412% due 07/25/2035 | | | | 272 | | | | 272 |
|
| Structured Asset Securities Corp. |
4.900% due 04/25/2035 | | | | 1,850 | | | | 1,776 |
5.452% due 12/25/2035 | | | | 2,388 | | | | 2,390 |
|
| Susquehanna Auto Lease Trust |
4.991% due 04/16/2007 | | | | 417 | | | | 418 |
|
| Truman Capital Mortgage Loan Trust |
5.662% due 01/25/2034 | | | | 103 | | | | 103 |
|
| USAA Auto Owner Trust | | | | | | | | |
5.030% due 11/17/2007 | | | | 800 | | | | 798 |
|
| Wachovia Auto Owner Trust | | | | | | | | |
4.820% due 02/20/2009 | | | | 9,800 | | | | 9,771 |
|
| Wachovia Mortgage Loan Trust LLC |
5.432% due 10/25/2035 | | | | 940 | | | | 941 |
| | | | | | | | |
|
Total Asset-Backed Securities
(Cost $121,422) | | 121,393 |
| | | | | | | | |
|
| |
| | | | |
| 10 | | PIMCO Variable Insurance Trust | | See Accompanying Notes |
| | |
| |
| | | June 30, 2006 (Unaudited) |
| | | | | | | | |
| | | | | PRINCIPAL | | | | |
| | | | | AMOUNT | | | | VALUE |
| | | | | (000S) | | | | (000S) |
| | | | | | | | | |
| SOVEREIGN ISSUES 0.1% |
| Colombia Government International Bond |
10.000% due 01/23/2012 | | $ | | 350 | | $ | | 397 |
|
| Mexico Government International Bond |
6.375% due 01/16/2013 | | | | 177 | | | | 178 |
| | | | | | | | |
|
Total Sovereign Issues (Cost $526) | | 575 |
| | | | | | | | |
|
| |
| FOREIGN CURRENCY-DENOMINATED ISSUES (l) 0.5% |
| Canadian Government Bond |
3.000% due 12/01/2036 (b) | | CAD | | 530 | | | | 597 |
|
| France Government Bond |
3.000% due 07/25/2012 (b) | | EUR | | 1,648 | | | | 2,268 |
|
| Italy Buoni Poliennali Del Tesoro |
2.150% due 09/15/2014 (b) | | | | 533 | | | | 691 |
|
| Pylon Ltd. | | | | | | | | |
4.463% due 12/18/2008 (h) | | | | 700 | | | | 906 |
6.863% due 12/22/2008 | | | | 1,100 | | | | 1,421 |
| | | | | | | | |
|
Total Foreign Currency-Denominated Issues (Cost $5,794) | | 5,883 |
| | | | | | | | |
|
| |
| | | | | NOTIONAL
AMOUNT
(000S) | | | | |
| PURCHASED CALL OPTIONS 0.0% |
| 2-Year Interest Rate Swap (OTC) Pay 3-Month USD-LIBOR Floating Rate Index |
Strike @ 5.250%
Exp. 06/07/2007 | | $ | | 52,000 | | | | 143 |
| |
| | | | | #OF
CONTRACTS | | | | |
| U.S. Treasury 10-Year Note September Futures (CBOT) |
Strike @ $110.000 Exp. 08/25/2006 | | | | 318 | | | | 5 |
| | | | | | | | |
|
Total Purchased Call Options (Cost $228) | | 148 |
| | | | | | | | |
|
| |
| | | | | NOTIONAL
AMOUNT
(000S) | | | | |
| PURCHASED PUT OPTIONS 0.0% |
Treasury Inflation Protected Securities (OTC)
0.875% due 04/15/2010 |
Strike @ $83.875 Exp. 09/21/2006 | | $ | | 91,000 | | | | 0 |
|
Treasury Inflation Protected Securities (OTC)
1.875% due 07/15/2015 |
Strike @ $68.000 Exp. 09/18/2006 | | | | 90,000 | | | | 0 |
|
Treasury Inflation Protected Securities (OTC)
2.375% due 01/15/2025 |
Strike @ $58.000 Exp. 07/24/2006 | | | | 87,000 | | | | 0 |
|
Treasury Inflation Protected Securities (OTC)
3.000% due 07/15/2012 |
Strike @ $84.000 Exp. 07/24/2006 | | | | 111,000 | | | | 0 |
|
Treasury Inflation Protected Securities (OTC)
3.625% due 01/15/2008 |
Strike @ $96.000 Exp. 07/17/2006 | | | | 65,000 | | | | 0 |
|
| U.S. dollar versus Japanese Yen (OTC) |
Strike @ JY114.000 Exp. 07/03/2006 | | | | 13,400 | | | | 22 |
| | | | | | | | |
| 90-Day Eurodollar March Futures (CME) |
Strike @ $92.000 Exp. 03/19/2007 | | | | 288 | | $ | | 2 |
Strike @ $92.250 Exp. 03/19/2007 | | | | 23 | | | | 0 |
|
| U.S. Treasury 10-Year Note September Futures (CBOT) |
Strike @ $99.000 Exp. 08/25/2006 | | | | 354 | | | | 6 |
Strike @ $100.000 Exp. 08/25/2006 | | | | 1,245 | | | | 134 |
|
| U.S. Treasury 5-Year Note September Futures (CBOT) |
Strike @ $100.500 Exp. 08/25/2006 | | | | 215 | | | | 4 |
| | | | | | | | |
|
Total Purchased Put Options (Cost $282) | | 168 |
| | | | | | | | |
|
| |
| | | | | PRINCIPAL
AMOUNT
(000S) | | | | |
| SHORT-TERM INSTRUMENTS (l) 67.7% |
| |
| COMMERCIAL PAPER 51.9% |
| Abbey National N.A. LLC | | | | |
5.250% due 07/05/2006 | | $ | | 30,700 | | | | 30,691 |
|
| ASB Bank Ltd. | | | | | | | | |
5.050% due 08/10/2006 | | | | 2,000 | | | | 1,989 |
|
| Barclays U.S. Funding Corp. | | | | |
4.890% due 07/05/2006 | | | | 24,200 | | | | 24,193 |
4.955% due 07/18/2006 | | | | 1,200 | | | | 1,198 |
5.050% due 08/14/2006 | | | | 1,200 | | | | 1,193 |
|
| BNP Paribas Finance | | | | | | | | |
5.270% due 07/03/2006 | | | | 6,900 | | | | 6,900 |
|
| Caisse d’Amortissement de la Dette Sociale |
5.270% due 08/03/2006 | | | | 30,800 | | | | 30,660 |
|
| Cox Communications, Inc. | | | | |
4.720% due 07/17/2006 | | | | 1,100 | | | | 1,100 |
|
| Danske Corp. | | | | | | | | |
5.280% due 07/17/2006 | | | | 27,500 | | | | 27,444 |
4.955% due 07/20/2006 | | | | 5,400 | | | | 5,387 |
5.080% due 08/24/2006 | | | | 700 | | | | 695 |
|
| Dexia Delaware LLC | | | | | | | | |
5.275% due 07/05/2006 | | | | 30,800 | | | | 30,791 |
|
| DnB NORBank ASA | | | | | | | | |
5.180% due 09/08/2006 | | | | 31,000 | | | | 30,678 |
|
| Fannie Mae | | | | | | | | |
4.809% due 07/05/2006 | | | | 5,600 | | | | 5,598 |
|
| Federal Home Loan Bank | | | | |
5.030% due 07/03/2006 | | | | 30,900 | | | | 30,900 |
0.010% due 07/14/2006 | | | | 30,900 | | | | 30,851 |
|
| Fortis Funding LLC | | | | | | | | |
5.175% due 07/10/2006 | | | | 30,800 | | | | 30,769 |
5.265% due 07/26/2006 | | | | 2,900 | | | | 2,890 |
|
| HBOS Treasury Services PLC | | | | |
5.040% due 08/08/2006 | | | | 1,000 | | | | 995 |
|
| Nordea N.A., Inc. | | | | | | | | |
5.090% due 08/24/2006 | | | | 30,000 | | | | 29,780 |
|
| Rabobank USA Financial Corp. |
5.250% due 07/03/2006 | | | | 30,900 | | | | 30,900 |
|
| Skandinaviska Enskilda Banken AB |
4.960% due 07/20/2006 | | | | 27,800 | | | | 27,735 |
5.000% due 07/27/2006 | | | | 1,100 | | | | 1,096 |
| | | | | | | | |
| Societe Generale N.A. | | | | | | | | |
4.890% due 07/06/2006 | | $ | | 16,600 | | $ | | 16,593 |
5.040% due 08/08/2006 | | | | 17,400 | | | | 17,312 |
5.055% due 08/15/2006 | | | | 300 | | | | 298 |
|
| Stadshypoket Delaware, Inc. |
5.090% due 08/18/2006 | | | | 31,300 | | | | 31,096 |
|
| Swedbank, Inc. | | | | | | | | |
5.230% due 08/03/2006 | | | | 30,800 | | | | 30,661 |
|
| Time Warner Telecom, Inc. |
5.240% due 09/18/2006 | | | | 11,100 | | | | 10,968 |
|
| Total Captial S.A. | | | | | | | | |
5.270% due 07/03/2006 | | | | 30,900 | | | | 30,900 |
|
| UBS Finance Delaware LLC |
5.270% due 07/03/2006 | | | | 200 | | | | 200 |
5.050% due 07/05/2006 | | | | 1,800 | | | | 1,800 |
4.930% due 07/13/2006 | | | | 28,700 | | | | 28,661 |
5.235% due 08/08/2006 | | | | 2,300 | | | | 2,288 |
4.990% due 08/22/2006 | | | | 1,100 | | | | 1,092 |
|
| Westpac Capital Corp. | | | | | | | | |
5.040% due 08/02/2006 | | | | 28,800 | | | | 28,679 |
| | | | | | | | |
|
| | | | | | | | | 584,981 |
| | | | | | | | |
|
| |
| |
| FRANCE TREASURY BILLS 8.4% |
2.785% due 10/12/2006 | | EUR | | 6,990 | | | | 95,109 |
| | | | | | | | |
|
| |
| |
| GERMANY TREASURY BILLS 6.5% |
2.665% due 08/16/2006 | | | | 48,340 | | | | 73,583 |
| | | | | | | | |
|
| |
| |
| TRI-PARTY REPURCHASE AGREEMENT 0.3% |
| State Street Bank | | | | | | | | |
4.900% due 07/03/2006 | | $ | | 3,075 | | | | 3,075 |
| | | | | | | | |
|
(Dated 06/30/2006. Collateralized by Freddie Mac 3.800% due 12/27/2006 valued at $3,137. Repurchase proceeds are $3,076.) |
| |
| |
| U.S. TREASURY BILLS 0.6% |
4.801% due 09/14/2006 (e)(f)(g) | | | | 6,565 | | | | 6,492 |
| | | | | | | | |
|
Total Short-Term Instruments
(Cost $757,577) | | 763,240 |
| | | | | | | | |
|
| |
Total Investments (d) 208.5%
(Cost $2,337,734) | | $ | | 2,350,300 |
| | | | | | | | | |
Written Options (k) (0.1%)
(Premiums $1,008) | | (675) |
| |
| Other Assets and Liabilities (Net) (108.4%) | | (1,222,645) |
| | | | | | | | |
|
| Net Assets 100.0% | | $ | | 1,126,980 |
| | | | | | | | |
|
| | | | | | |
| See Accompanying Notes | | Semiannual Report | | June 30, 2006 | | 11 |
Schedule of Investments Real Return Portfolio (Cont.)
| | |
| Notes to Schedule of Investments (amounts in thousands, except number of contracts): |
| |
(a) Residual Interest bond. |
| |
(b) Principal amount of security is adjusted for inflation. |
| |
(c) Securities are grouped by coupon or range of coupons and represent a range of maturities. |
| |
(d) As of June 30, 2006, portfolio securities with an aggregate market value of $19,567 were valued in good faith and pursuant to guidelines established by the Board of Trustees. |
| |
(e) Securities with an aggregate market value of $2,472 have been pledged as collateral for delayed-delivery securities on June 30, 2006. |
| |
(f) Securities with an aggregate market value of $742 have been pledged as collateral for swap and swaption contracts on June 30, 2006. |
| |
(g) Securities with an aggregate market value of $2,092 have been segregated with the custodian to cover margin requirements for the following open futures contracts on June 30, 2006: |
| | | | | | | | | | |
| Description | | Type | | Expiration
Month | | # of
Contracts | | Unrealized
Appreciation/
(Depreciation) | |
90-Day Eurodollar December Futures | | Long | | 12/2007 | | 33 | | $ | (38 | ) |
90-Day Eurodollar June Futures | | Long | | 06/2007 | | 33 | | | (42 | ) |
90-Day Eurodollar March Futures | | Long | | 03/2008 | | 33 | | | (38 | ) |
90-Day Eurodollar September Futures | | Long | | 09/2007 | | 33 | | | (40 | ) |
Euro-Bund 10-Year Note September Futures | | Short | | 09/2006 | | 162 | | | 109 | |
U.S. Treasury 10-Year Note September Futures | | Long | | 09/2006 | | 563 | | | (320 | ) |
U.S. Treasury 30-Year Bond September Futures | | Short | | 09/2006 | | 90 | | | 45 | |
U.S. Treasury 5-Year Note September Futures | | Long | | 09/2006 | | 215 | | | (145 | ) |
| | | | | | | | |
|
|
|
| | | | | | | | | $ | (469 | ) |
| | | | | | | | |
|
|
|
| | | | | | | | | | | | | | |
(h) Restricted securities as of June 30, 2006: |
| Issuer Description | | Coupon | | Maturity
Date | | Acquisition
Date | | Cost | | Market Value | | Market Value as
a Percentage of
Net Assets |
Pylon Ltd. | | 4.463% | | 12/18/2008 | | 12/11/2003 | | $ | 700 | | $ | 906 | | 0.08% |
Morgan Stanley Warehouse Facilities | | 4.719% | | 08/16/2006 | | 06/28/2004 | | | 6,200 | | | 6,200 | | 0.55% |
| | | | | | | | |
|
| |
|
| |
|
| | | | | | | | | $ | 6,900 | | $ | 7,106 | | 0.63% |
| | | | | | | | |
|
| |
|
| |
|
| | | | | | | | | | | | | | | |
(i) Swap agreements outstanding on June 30, 2006: | |
| Interest Rate Swaps | | | | | | | | | | | | | | | |
| Counterparty | | Floating Rate Index | | Pay/Receive
Floating Rate | | Fixed
Rate | | Expiration
Date | | Notional
Amount | | Unrealized
Appreciation/
(Depreciation) | |
HSBC Bank USA | | 6-month GBP-LIBOR | | Receive | | 4.250% | | 06/12/2036 | | GBP | 2,500 | | $ | 189 | |
J.P. Morgan Chase & Co. | | 6-month GBP-LIBOR | | Pay | | 5.000% | | 06/15/2008 | | | 5,000 | | | 12 | |
Barclays Bank PLC | | 5-year French CPI Ex Tobacco Daily Reference Index | | Pay | | 2.103% | | 10/15/2010 | | EUR | 2,500 | | | (4 | ) |
BNP Paribas Bank | | 5-year French CPI Ex Tobacco Daily Reference Index | | Pay | | 2.090% | | 10/15/2010 | | | 2,500 | | | (9 | ) |
BNP Paribas Bank | | 5-year French CPI Ex Tobacco Daily Reference Index | | Pay | | 2.150% | | 01/19/2016 | | | 15,000 | | | (252 | ) |
Goldman Sachs & Co. | | 6-month EUR-LIBOR | | Receive | | 4.500% | | 06/17/2015 | | | 7,500 | | | 626 | |
UBS Warburg LLC | | 5-year French CPI Ex Tobacco Daily Reference Index | | Pay | | 2.146% | | 10/15/2010 | | | 3,700 | | | (9 | ) |
Bank of America | | 3-month USD-LIBOR | | Receive | | 5.000% | | 12/20/2016 | | $ | 22,700 | | | 281 | |
Barclays Bank PLC | | 3-month USD-LIBOR | | Pay | | 5.000% | | 12/20/2008 | | | 5,900 | | | (5 | ) |
Deutsche Bank AG | | 3-month USD-LIBOR | | Receive | | 5.000% | | 06/21/2021 | | | 5,400 | | | 49 | |
Deutsche Bank AG | | 3-month USD-LIBOR | | Receive | | 5.000% | | 12/20/2026 | | | 5,700 | | | 6 | |
Goldman Sachs & Co. | | 3-month USD-LIBOR | | Pay | | 5.000% | | 12/20/2008 | | | 23,500 | | | (21 | ) |
Goldman Sachs & Co. | | 3-month USD-LIBOR | | Receive | | 5.000% | | 12/20/2013 | | | 6,500 | | | 78 | |
Goldman Sachs & Co. | | 3-month USD-LIBOR | | Receive | | 5.000% | | 12/20/2016 | | | 49,500 | | | 612 | |
J.P. Morgan Chase & Co. | | 3-month USD-LIBOR | | Pay | | 5.000% | | 12/20/2011 | | | 3,700 | | | (33 | ) |
Lehman Brothers, Inc. | | 3-month USD-LIBOR | | Receive | | 5.000% | | 12/20/2036 | | | 4,200 | | | 38 | |
Morgan Stanley Dean Witter & Co. | | 3-month USD-LIBOR | | Pay | | 5.000% | | 12/20/2008 | | | 30,000 | | | (27 | ) |
Morgan Stanley Dean Witter & Co. | | 3-month USD-LIBOR | | Receive | | 5.000% | | 12/20/2016 | | | 100 | | | 1 | |
Morgan Stanley Dean Witter & Co. | | 3-month USD-LIBOR | | Receive | | 5.000% | | 12/20/2036 | | | 5,100 | | | 46 | |
Royal Bank of Scotland PLC | | 3-month USD-LIBOR | | Pay | | 5.000% | | 12/20/2011 | | | 3,100 | | | (27 | ) |
UBS Warburg LLC | | 3-month USD-LIBOR | | Pay | | 5.000% | | 12/20/2008 | | | 9,000 | | | (8 | ) |
| | | | | | | | | | | | | |
|
|
|
| | | | | | | | | | | | | | $ | 1,543 | |
| | | | | | | | | | | | | |
|
|
|
| | | | |
| 12 | | PIMCO Variable Insurance Trust | | See Accompanying Notes |
| | |
| |
| | | June 30, 2006 (Unaudited) |
| | | | | | | | | | | | | | | |
| Credit Default Swaps | | | | | | | | | | | | | | | |
| Counterparty | | Reference Entity | | Buy/Sell
Protection+ | | (Pay)/Receive
Fixed Rate | | Expiration
Date | | Notional
Amount | | Unrealized
Appreciation/
(Depreciation) | |
Goldman Sachs & Co. | | General Motors Acceptance Corp. 6.875% due 08/28/2012 | | Sell | | 3.400% | | 06/20/2011 | | $ | 700 | | $ | 20 | |
J.P. Morgan Chase & Co. | | General Motors Corp. 7.125% due 07/15/2013 | | Sell | | 4.600% | | 06/20/2007 | | | 1,000 | | | (7 | ) |
J.P. Morgan Chase & Co. | | General Motors Corp. 7.125% due 07/15/2013 | | Sell | | 6.400% | | 06/20/2007 | | | 1,500 | | | 14 | |
UBS Warburg LLC | | Ford Motor Credit Co. 7.000% due 10/01/2013 | | Sell | | 5.250% | | 09/20/2007 | | | 1,300 | | | 38 | |
UBS Warburg LLC | | General Motors Acceptance Corp. 6.875% due 08/28/2012 | | Sell | | 3.600% | | 06/20/2011 | | | 1,000 | | | 36 | |
| | | | | | | | | | | | | |
|
|
|
| | | | | | | | | | | | | | $ | 101 | |
| | | | | | | | | | | | | |
|
|
|
| |
| + If the Portfolio is a seller of protection and a credit event occurs, as defined under the terms of that particular swap agreement, the Portfolio will pay to the buyer of the protection an amount up to the notional value of the swap and in certain instances, take delivery of the security. As a buyer of protection, the Portfolio will generally receive from the seller of protection an amount up to the notional amount of the swap if a credit event occurs. | | | | |
| | | | | | | | | | | | | |
(j) Short sales outstanding on June 30, 2006: | | | |
| Description | | Coupon | | Maturity
Date | | Principal
Amount | | Proceeds | | Valueà |
U.S. Treasury Note | | 3.625% | | 05/15/2013 | | $ | 300 | | $ | 275 | | $ | 276 |
U.S. Treasury Note | | 4.250% | | 08/15/2013 | | | 4,400 | | | 4,216 | | | 4,253 |
U.S. Treasury Note | | 4.000% | | 02/15/2014 | | | 3,000 | | | 2,813 | | | 2,836 |
| | | | | | | | | |
|
| |
|
|
| | | | | | | | | | $ | 7,304 | | $ | 7,365 |
| | | | | | | | | |
|
| |
|
|
| | | | | | | | | | | | | | | |
| |
| à Market value includes $126 of interest payable on short sales. | | | |
(k) Written options outstanding on June 30, 2006: | | | |
| Options on Exchange-Traded Futures Contracts | | | |
| Description | | Exercise
Price | | Expiration
Date | | # of
Contracts | | Premium | | Value |
Call - CBOT U.S. Treasury 10-Year Note September Futures | | $ | 108.000 | | 08/25/2006 | | 920 | | $ | 135 | | $ | 29 |
Call - CBOT U.S. Treasury 10-Year Note September Futures | | | 107.000 | | 08/25/2006 | | 258 | | | 24 | | | 24 |
Put - CBOT U.S. Treasury 10-Year Note September Futures | | | 103.000 | | 08/25/2006 | | 1,178 | | | 173 | | | 165 |
| | | | | | | | | | | |
|
| |
|
|
| | | | | | | | | | | | $ | 332 | | $ | 218 |
| | | | | | | | | | | |
|
| |
|
|
| | | | | | | | | | | | | | | | | | | |
| | | | | | | | |
| Interest Rate Swaptions | | | | | | | | | | | | | | | | | | | |
| Description | | Counterparty | | Floating Rate
Index | | Pay/Receive
Floating Rate | | Exercise
Rate | | Expiration
Date | | Notional
Amount | | Premium | | Value |
Call - OTC 10-Year Interest Rate Swap | | Barclays Bank PLC | | 3-month USD-LIBOR | | Receive | | 5.300% | | 01/02/2007 | | $ | 23,000 | | $ | 120 | | $ | 95 |
Put - OTC 10-Year Interest Rate Swap | | Barclays Bank PLC | | 3-month USD-LIBOR | | Pay | | 5.900% | | 01/02/2007 | | | 13,000 | | | 148 | | | 141 |
Put - OTC 1-Year Interest Rate Swap | | Barclays Bank PLC | | 3-month USD-LIBOR | | Pay | | 6.100% | | 01/02/2007 | | | 10,000 | | | 66 | | | 64 |
Call - OTC 5-Year Interest Rate Swap | | Royal Bank of Scotland PLC | | 3-month USD-LIBOR | | Receive | | 5.340% | | 06/07/2007 | | | 19,000 | | | 193 | | | 130 |
Call - OTC 5-Year Interest Rate Swap | | Wachovia Bank N.A. | | 3-month USD-LIBOR | | Receive | | 5.325% | | 06/07/2007 | | | 4,000 | | | 34 | | | 27 |
| | | | | | | | | | | | | | | |
|
| |
|
|
| | | | | | | | | | | | | | | | $ | 561 | | $ | 457 |
| | | | | | | | | | | | | | | |
|
| |
|
|
| | | | | | | | |
| Foreign Currency Options | | | | | | | | | | | | | | | | | | | |
| | | | | | | | | | | | | | | |
| Description | | Counterparty | | Exercise
Price | | Expiration
Date | | Notional
Amount | | Premium | | Value |
Put - OTC U.S. dollar versus Japanese Yen | | Bank of America | | JPY 104.000 | | 07/03/2006 | | $ | 10,100 | | $ | 22 | | $ | 0 |
Put - OTC U.S. dollar versus Japanese Yen | | Bank of America | | 106.500 | | 07/03/2006 | | | 8,100 | | | 53 | | | 0 |
Put - OTC U.S. dollar versus Japanese Yen | | Credit Suisse First Boston | | 106.500 | | 07/03/2006 | | | 5,400 | | | 35 | | | 0 |
Put - OTC U.S. dollar versus Japanese Yen | | Goldman Sachs & Co. | | 104.000 | | 07/03/2006 | | | 2,300 | | | 5 | | | 0 |
| | | | | | | | | | | |
|
| |
|
|
| | | | | | | | | | | | $ | 115 | | $ | 0 |
| | | | | | | | | | | |
|
| |
|
|
| | | | | | |
| See Accompanying Notes | | Semiannual Report | | June 30, 2006 | | 13 |
Schedule of Investments Real Return Portfolio (Cont.)
| | | | | | | | | | | | | | | | | |
(l) Forward foreign currency contracts outstanding on June 30, 2006: | | | | | |
| Type | | | | Principal Amount Covered by Contract | | Settlement Month | | Unrealized
Appreciation | | Unrealized
(Depreciation) | | | Net Unrealized Appreciation/ (Depreciation) | |
Sell | | CAD | | 609 | | 07/2006 | | $ | 6 | | $ | 0 | | | $ | 6 | |
Buy | | EUR | | 11,877 | | 07/2006 | | | 336 | | | 0 | | | | 336 | |
Sell | | | | 6,903 | | 07/2006 | | | 0 | | | (68 | ) | | | (68 | ) |
Sell | | | | 129,792 | | 08/2006 | | | 0 | | | (2,834 | ) | | | (2,834 | ) |
Buy | | JPY | | 625,120 | | 07/2006 | | | 0 | | | (3 | ) | | | (3 | ) |
Buy | | | | 2,811,673 | | 08/2006 | | | 0 | | | (743 | ) | | | (743 | ) |
Buy | | PLN | | 264 | | 09/2006 | | | 1 | | | 0 | | | | 1 | |
Buy | | RUB | | 2,255 | | 09/2006 | | | 3 | | | 0 | | | | 3 | |
Buy | | SKK | | 2,349 | | 09/2006 | | | 2 | | | 0 | | | | 2 | |
| | | | | | | | |
|
| |
|
|
| |
|
|
|
| | | | | | | | | $ | 348 | | $ | (3,648 | ) | | $ | (3,300 | ) |
| | | | | | | | |
|
| |
|
|
| |
|
|
|
| | | | |
| 14 | | PIMCO Variable Insurance Trust | | See Accompanying Notes |
| | |
| |
| Notes to Financial Statements | | June 30, 2006 (Unaudited) |
1. ORGANIZATION
The Real Return Portfolio (the “Portfolio”) is a series of the PIMCO Variable Insurance Trust (the “Trust”). The Trust is registered under the Investment Company Act of 1940 (the “Act”), as amended, as an open-end investment management company organized as a Delaware business trust on October 3, 1997. The Portfolio offers three classes of shares: Institutional, Administrative and Advisor. Information presented in these financial statements pertains to the Institutional Class of the Portfolio. Certain detailed financial information for the Administrative Class and Advisor Class is provided separately and is available upon request. The Trust is designed to be used as an investment vehicle by Separate Accounts of insurance companies that fund variable annuity contracts and variable life insurance policies and by qualified pension and retirement plans.
2. SIGNIFICANT ACCOUNTING POLICIES
The following is a summary of significant accounting policies consistently followed by the Portfolio in the preparation of its financial statements in conformity with accounting principles generally accepted in the United States of America (“GAAP”). The preparation of financial statements in accordance with GAAP requires management to make estimates and assumptions that affect the reported amounts and disclosures in the financial statements. Actual results could differ from those estimates.
Security Valuation. Portfolio securities are valued as of the close of regular trading (normally 4:00 p.m., Eastern Time) on each day that the New York Stock Exchange (“NYSE”) is open. Portfolio securities and other assets for which market quotes are readily available are stated at market value. Market value is generally determined on the basis of last reported sales prices, or if no sales are reported, based on quotes obtained from a quotation reporting system, established market makers, or pricing services. Fixed-income securities and non-exchange traded derivatives are normally valued on the basis of quotes obtained from brokers and dealers or pricing services. Prices obtained from independent pricing services use information provided by market makers or estimates of market values obtained from yield data relating to investments or securities with similar characteristics. Certain fixed-income securities purchased on a delayed-delivery basis are marked to market daily until settlement at the forward settlement date. Short-term investments having a maturity of 60 days or less are generally valued at amortized cost. Exchange traded options, futures and options on futures are valued at the settlement price determined by the relevant exchange.
Investments initially valued in currencies other than the U.S. dollar are converted to the U.S. dollar using exchange rates obtained from pricing services. As a result, the NAV of the Portfolio’s shares may be affected by changes in the value of currencies in relation to the U.S. dollar. The value of securities traded in markets outside the United States or denominated in currencies other than the U.S. dollar may be affected significantly on a day that the NYSE is closed and an investor is not able to purchase, redeem or exchange shares.
Securities and other assets for which market quotes are not readily available are valued at fair value as determined in good faith by the Board of Trustees or persons acting at their direction. The Board of Trustees has adopted methods for valuing securities and other assets in circumstances where market quotes are not readily available, and has delegated to Pacific Investment Management Company LLC (“PIMCO”) the responsibility for applying the valuation methods. In the event that market quotes are not readily available, and the security or asset cannot be valued pursuant to one of the valuation methods, the value of the security or asset will be determined in good faith by the Valuation Committee of the Board of Trustees, generally based upon recommendations provided by PIMCO.
Market quotes are considered not readily available in circumstances where there is an absence of current or reliable market-based data (e.g., trade information, bid/asked information, broker quotes), including where events occur after the close of the relevant market, but prior to the close of regular trading, that materially affect the values of the Portfolio’s securities or assets. In addition, market quotes are considered not readily available when, due to extraordinary circumstances, the exchanges or markets on which the securities trade do not open for trading for the entire day and no other market prices are available. The Board has delegated to PIMCO the responsibility for monitoring significant events that may materially affect the values of the Portfolio’s securities or assets and for determining whether the value of the applicable securities or assets should be re-evaluated in light of such significant events when the Portfolio uses fair value pricing to determine its NAV, securities will not be priced on the basis of quotations from the primary market in which they are traded, but rather may be priced by another method that the Board of Trustees or persons acting at their direction believe accurately reflects fair value. The Trust’s policy is intended to result in a calculation of the Portfolio’s NAV that fairly reflects security values as of the time of pricing. However, fair values determined by the Board of Trustees or persons acting at their direction may not accurately reflect the price that the Portfolio could obtain for a security if it were to dispose of that security as of the time of pricing. Because foreign securities can trade on non-business days, the NAV of the Portfolio may change on days when shareholders will not be able to purchase or redeem shares. The prices used by the Portfolio may differ from the value that would be realized if the securities were sold and the differences could be material to the financial statements.
Securities Transactions and Investment Income. Securities transactions are recorded as of the trade date. Securities purchased or sold on a when-issued or delayed-delivery basis may be settled a month or more after the trade date. Realized gains and losses from securities sold are recorded on the identified cost basis. Dividend income is recorded on the ex-dividend date, except certain dividends from foreign securities where the ex-dividend date may have passed, which are recorded as soon as the Portfolio is informed of the ex-dividend date. Interest income, adjusted for the accretion of discounts and amortization of premiums, is recorded on the accrual basis. Paydown gains and losses on mortgage-related or asset-backed securities are recorded as components of interest income in the Statement of Operations.
Dividends and Distributions to Shareholders. Dividends from net investment income, if any, are declared on each day the Portfolio is open for business and are distributed to shareholders monthly. Net realized capital gains earned by the Portfolio, if any, will be distributed no less frequently than once each year. Most shareholders choose to reinvest their dividends and capital gain distribution in additional shares of the Portfolio.
Income dividends and capital gain distributions are determined in accordance with income tax regulations which may differ from GAAP. Differences between tax regulations and GAAP may change the fiscal year when income and capital items are recognized for tax and GAAP purposes. Examples of events that give rise to timing differences include wash sales, straddles, net operating losses and capital loss carryforwards. Further, the character of investment income and capital gains may be different for certain transactions under the two methods of accounting. Examples of characterization differences include the treatment of mortgage paydowns, swaps, foreign currency transactions and contingent debt instruments. As a result, income dividends and capital gain distributions declared during a fiscal period may differ significantly from the net investment income and realized capital gain reported in the Portfolio’s annual financial statements presented under GAAP.
Distributions classified as a tax basis return of capital, if any, are reflected in the accompanying Statements of Changes in Net Assets and have been reclassified to
| | | | | | |
| | | Semiannual Report | | June 30, 2006 | | 15 |
Notes to Financial Statements (Cont.)
paid in capital. In addition, other amounts have been reclassified between undistributed net investment income, accumulated undistributed net realized gains or losses and/or paid in capital to more appropriately conform financial accounting to tax characterizations of dividend distributions.
Multiclass Operations. Each class offered by the Portfolio has equal rights as to assets and voting privileges (except that shareholders of a class have exclusive voting rights regarding any matter relating solely to that class of shares). Income and non-class specific expenses of the Portfolio are allocated daily to each class of shares based on the relative value of settled shares. Realized and unrealized capital gains and losses of the Portfolio are allocated daily to each class of shares based on the relative net assets of each class. Class specific expenses, where applicable, currently include administrative, distribution and servicing fees.
Delayed-Delivery Transactions. The Portfolio may purchase or sell securities on a when-issued or delayed-delivery basis. These transactions involve a commitment by the Portfolio to purchase or sell securities for a predetermined price or yield, with payment and delivery taking place beyond the customary settlement period. When delayed-delivery purchases are outstanding, the Portfolio will designate liquid assets in an amount sufficient to meet the purchase price. When purchasing a security on a delayed-delivery basis, the Portfolio assumes the rights and risks of ownership of the security, including the risk of price and yield fluctuations, and takes such fluctuations into account when determining its net asset value. The Portfolio may dispose of or renegotiate a delayed-delivery transaction after it is entered into, and may sell when-issued securities before they are delivered, which may result in a capital gain or loss. When the Portfolio has sold a security on a delayed-delivery basis, the Portfolio does not participate in future gains and losses with respect to the security.
Federal Income Taxes. The Portfolio intends to qualify as a regulated investment company under sub-chapter M of the Internal Revenue Code and distribute all of its taxable income and net realized gains, if applicable, to shareholders. Accordingly, no provision for Federal income taxes has been made.
Foreign Currency. The accounting records of the Portfolio are maintained in U.S. dollar. The market values of foreign securities, currency holdings and other assets and liabilities are translated into U.S. dollar based on the current exchange rates each business day. Fluctuations in the value of currency holdings and other assets and liabilities resulting from changes in exchange rates are recorded as unrealized foreign currency gains or losses. Realized gains or losses and unrealized appreciation or depreciation on investment securities and income and expenses are translated on the respective dates of such transactions. The effects of changes in foreign currency exchange rates on investments in securities are not segregated in the Statement of Operations from the effects of changes in market prices of those securities, but are included with the net realized and unrealized gain or loss on investment securities.
| | | | | | |
|
| Non-U.S. currency symbols utilized throughout the report are defined as follows: |
| CAD | | Canadian Dollar | | PLN | | Polish Zloty |
| EUR | | Euro | | RUB | | Russian Ruble |
| GBP | | British Pound | | SKK | | Slovakian Koruna |
| JPY | | Japanese Yen | | | | |
Forward Currency Transactions. The Portfolio may enter into forward currency contracts in connection with settling planned purchases or sales of securities, to hedge the currency exposure associated with some or all of the Portfolio’s securities or as a part of an investment strategy. A forward currency contract is an agreement between two parties to buy and sell a currency at a set price on a future date. The market value of a forward currency contract fluctuates with changes in forward currency exchange rates. Forward currency contracts are marked to market daily and the change in value is recorded by the Portfolio as an unrealized gain or loss. Realized gains or losses equal to the difference between the value of the contract at the time it was opened and the value at the time it was closed are recorded upon delivery or receipt of the currency or, if a forward currency contract is offset by entering into another forward currency contract with the same broker, upon settlement of the net gain or loss. These contracts may involve market risk in excess of the unrealized gain or loss reflected in the Portfolio’s Statement of Assets and Liabilities. In addition, the Portfolio could be exposed to risk if the counterparties are unable to meet the terms of the contracts or if the value of the currency changes unfavorably to the U.S. dollar.
Futures Contracts. The Portfolio is authorized to enter into futures contracts. The Portfolio may use futures contracts to manage its exposure to the securities markets or to movements in interest rates and currency values. The primary risks associated with the use of futures contracts are the imperfect correlation between the change in market value of the securities held by the Portfolio and the prices of futures contracts, the possibility of an illiquid market, and the inability of the counterparty to meet the terms of the contract. Futures contracts are valued based upon their quoted daily settlement prices. Upon entering into a futures contract, the Portfolio is required to deposit with its custodian, in a segregated account in the name of the futures broker, an amount of cash or U.S. Government and Agency Obligations in accordance with the initial margin requirements of the broker or exchange. Futures contracts are marked to market daily and an appropriate payable or receivable for the change in value (“variation margin”) is recorded by the Portfolio. Gains or losses are recognized but not considered realized until the contracts expire or are closed. Futures contracts involve, to varying degrees, risk of loss in excess of the variation margin disclosed in the Statement of Assets and Liabilities.
Inflation-Indexed Bonds. The Portfolio may invest in inflation-indexed bonds. Inflation-indexed bonds are fixed-income securities whose principal value is periodically adjusted to the rate of inflation. The interest rate on these bonds is generally fixed at issuance at a rate lower than typical bonds. Over the life of an inflation-indexed bond, however, interest will be paid based on a principal value, which is adjusted for inflation. Any increase in the principal amount of an inflation-indexed bond will be included as interest income in the Statement of Operations, even though investors do not receive their principal until maturity.
Loan Participant and Assignments. The Portfolio may invest in direct debt instruments which are interests in amounts owned by corporate, governmental, or other borrowers to lenders or lending syndicates. The Portfolio’s investments in loans may be in the form of participations in loans or assignments of all or a portion of loans from third parties. A loan is often administered by a bank or other financial institution (the “lender”) that acts as agent for all holders. Then agent administers the terms of the loan, as specified in the loan agreement. When investing in a loan participation, the Portfolio has the right to receive payments of principal, interest and any fees to which it is entitled only from the lender selling the loan agreement and only upon receipt by the lender of payments from the borrower. The Portfolio generally has no right to enforce compliance with the terms of the loan agreement with the borrower. As a result, the Portfolio may be subject to the credit of both the borrower and the lender that is selling the loan agreement. When the Portfolio purchases assignments from lenders it acquires direct rights against the borrower on the loan. At the end of the period, the Portfolio had no unfunded loan commitments.
Options Contracts. The Portfolio may write call and put options on futures, swaps, securities or currencies it owns or in which it may invest. Writing put options tends to increase the Portfolio’s exposure to the underlying instrument. Writing call options tends to decrease the Portfolio’s exposure to the underlying instrument. When the Portfolio writes a call or put option, an amount equal to the
| | | | |
| 16 | | PIMCO Variable Insurance Trust | | |
| | |
| |
| | | June 30, 2006 (Unaudited) |
premium received is recorded as a liability and subsequently marked to market to reflect the current value of the option written. These liabilities are reflected as written options outstanding in the Statement of Assets and Liabilities. Certain options may be written with premiums to determined on a future date. The premiums for these options are based upon implied volatility parameters at specified terms. Premiums received from writing options which expire are treated as realized gains. Premiums received from writing options which are exercised or closed are added to the proceeds or offset against amounts paid on the underlying future, swap, security or currency transaction to determine the realized gain or loss. The Portfolio as a writer of an option has no control over whether the underlying future, swap, security or currency may be sold (call) or purchased (put) and as a result bears the market risk of an unfavorable change in the price of the future, swap, security or currency underlying the written option. There is the risk the Portfolio may not be able to enter into a closing transaction because of an illiquid market.
The Portfolio may also purchase put and call options. Purchasing call options tends to increase the Portfolio’s exposure to the underlying instrument. Purchasing put options tends to decrease the Portfolio’s exposure to the underlying instrument. The Portfolio pays a premium which is included in the Portfolio’s Statement of Assets and Liabilities as an investment and subsequently marked to market to reflect the current value of the option. Premiums paid for purchasing options which expire are treated as realized losses. Certain options may be purchased with premiums to be determined on a future date. The premiums for these options are based upon implied volatility parameters at specified terms. The risk associated with purchasing put and call options is limited to the premium paid. Premiums paid for purchasing options which are exercised or closed are added to the amounts paid or offset against the proceeds on the underlying future, swap, security or currency transaction to determine the realized gain or loss.
Repurchase Agreements. The Portfolio may engage in repurchase transactions. Under the terms of a typical repurchase agreement, the Portfolio takes possession of an underlying debt obligation subject to an obligation of the seller to repurchase, and the Portfolio to resell, the obligation at an agreed-upon price and time. The underlying securities for all repurchase agreements are held in safekeeping at the Portfolio’s custodian or designated subcustodians under triparty repurchase agreements. The market value of the collateral must be equal to or exceed at all times the total amount of the repurchase obligations, including interest. Securities purchased under repurchase agreements are reflected as an asset in the Statement of Assets and Liabilities. Generally, in the event of counterparty default, the Portfolio has the right to use the collateral to offset losses incurred. If the counterparty should default, the Portfolio will seek to sell the securities which it holds as collateral. This could involve procedural costs or delays in addition to a loss on the securities if their value should fall below their repurchase price.
Short Sales. The Portfolio may enter into short sales transactions. A short sale is a transaction in which the Portfolio sells securities it does not own in anticipation of a decline in the market price of the securities. Securities sold in short sale transactions and interest payable on such securities, if any, are reflected as a liability in the Statement of Assets and Liabilities. The Portfolio is obligated to deliver securities at the market price at the time the short position is closed. Possible losses from short sales may be unlimited, whereas losses from purchases cannot exceed the total amount invested.
Mortgage-Related and Other Asset-Backed Securities. The Portfolio may invest in mortgage-related or other asset-backed securities. These securities include mortgage pass-through securities, collateralized mortgage obligations (“CMOs”), commercial mortgage-backed securities, mortgage dollar rolls, CMO residuals, stripped mortgage-backed securities (“SMBSs”) and other securities
that directly or indirectly represent a participation in, or are secured by and payable from, mortgage loans on real property. The value of some mortgage- or asset-backed securities may be particularly sensitive to changes in prevailing interest rates. Early repayment of principal on some mortgage-related securities may expose the Portfolio to a lower rate of return upon reinvestment of principal. The value of these securities may fluctuate in response to the market’s perception of the creditworthiness of the issuers. Additionally, although mortgages and mortgage-related securities are generally supported by some form of government or private guarantee and/or insurance, there is no assurance that private guarantors or insurers will meet their obligations.
One type of SMBS has one class receiving all of the interest from the mortgage assets (the interest-only, or “IO” class), while the other class will receive all of the principal (the principal-only, or “PO” class). Payments received for IOs are included in interest income in the Statement of Operations. Because principal will not be received at the maturity of an IO, adjustments are made to the book value of the security on a daily basis until maturity. These adjustments are included in interest income in the Statement of Operations. Payments received for POs are treated as reductions to the cost and par value of the securities.
Swap Agreements. The Portfolio may engage in swap transactions, including, but not limited to, swap agreements on interest rate and credit default to manage its exposure to interest rates and credit risk. In connection with these agreements, securities may be identified as collateral in accordance with the terms of the respective swap agreements.
Interest rate swap agreements involve the exchange by the Portfolio with another party of their respective commitments to pay or receive interest, e.g., an exchange of floating rate payments for fixed rate payments with respect to the notional amount of principal.
Credit default swap agreements involve one party making a stream of payments to another party in exchange for the right to receive a specified return in the event of a default by a third party, typically corporate issues or sovereign issues of an emerging country, on its obligation. The Portfolio may use credit default swaps to provide a measure of protection against defaults of the issuers (i.e., to reduce risk where the Portfolio owns or has exposure to the sovereign issuer) or to take an active long or short position with respect to the likelihood of a particular issuer’s default. As a seller of protection, the Portfolio generally receives an upfront payment or a fixed rate of income throughout the term of the swap provided that there is no credit event. If the Portfolio is a seller of protection and a credit event occurs, as defined under the terms of that particular swap agreement, the Portfolio will pay to the buyer of the protection an amount up to the notional value of the swap and in certain instances take delivery of the security. As the seller, the Portfolio would effectively add leverage to its portfolio because, in addition to its total net assets, the Portfolio would be subject to investment exposure on the notional amount of the swap. As a buyer of protection, the Portfolio generally receives an amount up to the notional value of the swap if a credit event occurs. The treatment of a credit default swaps and other swap agreements that provide for contingent, non-periodic, bullet-type payments as “notional principal contracts” for federal income tax purposes is uncertain. Were the Internal Revenue Service in take the position that a credit default swap or other bullet-type swap is not a “notional principal contract” for federal income tax purposes, payments received by the Portfolio from such investments might be subject to income taxes.
Swaps are marked to market daily based upon quotations from market makers and the change in value, if any, is recorded as unrealized gain or loss in the Statement of Operations. Payments received or made at the beginning of the measurement period are reflected as such in the Statement of Assets and Liabilities. These upfront payments are recorded as realized gain or loss in the Statement of Operations upon termination or maturity of the swap. A liquidation payment received or made at the termination of the swap is recorded as realized gain or loss in the Statement of Operations. Net periodic payments received by the Portfolio are included as part of realized gain or loss in the Statement of
| | | | | | |
| | | Semiannual Report | | June 30, 2006 | | 17 |
Notes to Financial Statements (Cont.)
Operations. Entering into these agreements involves, to varying degrees, elements of credit, market and documentation risk in excess of the amounts recognized in the Statement of Assets and Liabilities. Such risks involve the possibility that there will be no liquid market for these agreements, that the counterparty to the agreements may default on its obligation to perform or disagree as to the meaning of contractual terms in the agreements and that there may be unfavorable changes in interest rates.
U.S. Government Agencies or Government-Sponsored Enterprises. Securities issued by U.S. Government agencies or government-sponsored enterprises may not be guaranteed by the U.S. Treasury. The Government National Mortgage Association (“GNMA”), a wholly owned U.S. Government corporation, is authorized to guarantee, with the full faith and credit of the U.S. Government, the timely payment of principal and interest on securities issued by institutions approved by GNMA and backed by pools of mortgages insured by the Federal Housing Administration or guaranteed by the Department of Veterans Affairs. Government-related guarantors (i.e., not backed by the full faith and credit of the U.S. Government) include the Federal National Mortgage Association (“FNMA” or “Fannie Mae”) and the Federal Home Loan Mortgage Corporation (“FHLMC” or “Freddie Mac”). Pass-through securities issued by FNMA are guaranteed as to timely payment of principal and interest by FNMA but are not backed by the full faith and credit of the U.S. Government. FHLMC guarantees the timely payment of interest and ultimate collection of principal, but its participation certificates are not backed by the full faith and credit of the U.S. Government.
Guarantees and Indemnifications. Under the Trust’s organizational documents, each Trustee, officer, employee or other agent of the Trust (including the Trust’s investment manager) is indemnified against certain liabilities that may arise out of performance of their duties to the Portfolio. Additionally, in the normal course of business, the Portfolio enters into contracts that contain a variety of indemnification clauses. The Portfolio’s maximum exposure under these arrangements is unknown as this would involve future claims that may be made against the Portfolio that have not yet occurred. However, the Portfolio has not had prior claims or losses pursuant to these contracts, and believes the risk of loss to be remote.
New Accounting Policies. In July 2006, the Financial Accounting Standards Board issued Interpretation No. 48, “Accounting for Uncertainty in Income Taxes—an Interpretation of FASB Statement No. 109” (the “Interpretation”). The Interpretation is effective for fiscal years beginning after December 15, 2006. Management is currently evaluating the application of the Interpretation to the Portfolio and will provide additional information in relation to the Interpretation in the Portfolio’s annual financial statements for the year ending December 31, 2006.
3. FEES, EXPENSES, AND RELATED PARTY TRANSACTIONS
Investment Advisory Fee. PIMCO is a majority-owned subsidiary of Allianz Global Investors of America L.P. (“AGI”), and serves as investment adviser (the “Adviser”) to the Trust, pursuant to an investment advisory contract. The Adviser receives a monthly fee at an annual rate based on average daily net assets of the Portfolio. The Advisory Fee is charged at an annual rate of 0.25%.
Administration Fee. PIMCO serves as administrator (the “Administrator”), and provides administrative services to the Trust for which it receives a monthly administrative fee based on average daily net assets of the Portfolio. As the Administrator, PIMCO bears the costs of various third-party services, including audit, custodial, portfolio accounting, legal, transfer agency and printing costs. The Administration Fee is charged at the annual rate of 0.25%.
Distribution and Servicing Fees. Allianz Global Investors Distributors LLC (“AGID”) is an indirect wholly-owned subsidiary of AGI and serves as the distributor of the Trust’s shares. The Trust is permitted to reimburse AGID on a quarterly basis, out of the Administrative Class assets of the Portfolio in the amount of 0.15% on an annual basis of the average daily net assets of that class, for payments made to financial intermediaries that provide services in connection with the distribution of shares or administration of plans or programs that use Portfolio shares as their funding medium. The effective rate paid to AGID was 0.15% during the current fiscal year.
Expenses. The Trust is responsible for the following expenses: (i) salaries and other compensation of any of the Trust’s executive officers and employees who are not officers, directors, stockholders or employees of PIMCO or its subsidiaries or affiliates; (ii) taxes and governmental fees; (iii) brokerage fees and commissions and other portfolio transaction expenses; (iv) the costs of borrowing money, including interest expenses and bank overdraft charges; (v) fees and expenses of the Trustees who are not “interested persons” of PIMCO or the Trust, and any counsel retained exclusively for their benefit; (vi) extraordinary expenses, including costs of litigation and indemnification expenses; (vii) organization expenses and (viii) any expenses allocated or allocable to a specific class of shares, which include service fees payable with respect to the Administrative Class shares and may include certain other expenses as permitted by the Trust’s Multiple Class Plan adopted pursuant to Rule 18f-3 under the Act and subject to review and approval by the Trustees. The ratio of expenses to average net assets per share class, as disclosed in the Financial Highlights, may differ from the annual portfolio operating expenses per share class as disclosed in the Prospectus for the reasons set forth above.
For the current period ended June 30, 2006, each unaffiliated Trustee received an annual retainer of $15,000, plus $2,000 for each Board of Trustees quarterly meeting attended, $500 for each Board of Trustees committee meeting attended and $500 for each special board meeting attended, plus reimbursement of related expenses. In addition, each Committee Chair received an additional annual retainer of $500 and each Audit Committee Chair received an additional annual retainer of $1,500. These expenses are allocated on a pro-rata basis to each Portfolio of the Trust according to its respective net assets. The Trust pays no compensation directly to any Trustee or any other officer who is affiliated with the Administrator, all of whom receive remuneration for their services to the Trust from the Administrator or its affiliates.
4. PURCHASES AND SALES OF SECURITIES
The length of time the Portfolio has held a particular security is not generally a consideration in investment decisions. A change in the securities held by the Portfolio is known as “portfolio turnover”. The Portfolio may engage in frequent and active trading of portfolio securities to achieve its investment objective, particularly during periods of volatile market movements. High portfolio turnover (e.g., over 100%) involves correspondingly greater expenses to the Portfolio, including brokerage commissions or dealer mark-ups and other transaction costs on the sale of securities and reinvestments in other securities. Such sales may also result in realization of taxable capital gains, including short-term capital gains (which are generally taxed at ordinary income tax rates). The trading costs and tax effects associated with portfolio turnover may adversely affect the Portfolio’s performance.
Purchases and sales of securities (excluding short-term investments) for the period ended June 30, 2006 were as follows (amounts in thousands):
| | | | | | | | | | | | | | | | |
| | U.S Government/Agency | | | | | All Other |
| | Purchases | | | | | Sales | | | | | Purchases | | | | | Sales |
| $ | 8,549,666 | | | | $ | 8,379,973 | | | | $ | $109,598 | | | | $ | 27,378 |
| | | | |
| 18 | | PIMCO Variable Insurance Trust | | |
| | |
| |
| | | June 30, 2006 (Unaudited) |
5. TRANSACTIONS IN WRITTEN CALL AND PUT OPTIONS
Transactions in written call and put options were as follows (amounts in thousands, except number of contracts):
| | | | | | | | | | | | | | | | |
| | | | | # of
Contracts |
| | | |
| Notional
Amount
in $ | | | | | Premium | |
Balance at 12/31/2005 | | | | 158 | | | | | $ | 0 | | | | $ | 34 | |
Sales | | | | 3,113 | | | | | | 94,900 | | | | | 1,241 | |
Closing Buys | | | | (429 | ) | | | | | 0 | | | | | (89 | ) |
Expirations | | | | (371 | ) | | | | | 0 | | | | | (91 | ) |
Exercised | | | | (115 | ) | | | | | 0 | | | | | (87 | ) |
Balance at 06/30/2006 | | | | 2,356 | | | | | $ | 94,900 | | | | $ | 1,008 | |
6. SHARES OF BENEFICIAL INTEREST
The Portfolio may issue an unlimited number of shares of beneficial interest with a $0.001 par value. Changes in shares of beneficial interest were as follows (shares and amounts in thousands):
| | | | | | | | | | | | | | | | | | |
| | | | | Six Months Ended 06/30/2006 | | | | | Year Ended 12/31/2005 | |
| | | | | Shares | | | Amount | | | | | Shares | | | Amount | |
| | | | | | |
Receipts for shares sold | | | | | | | | | | | | | | | | | | |
Institutional Class | | | | 160 | | | $ | 1,995 | | | | | 890 | | | $ | 11,510 | |
Administrative Class | | | | 16,583 | | | | 206,303 | | | | | 35,702 | | | | 460,693 | |
Advisor Class | | | | 66 | | | | 804 | | | | | 0 | | | | 0 | |
Issued as reinvestment of distributions | | | | | | | | | | | | | | | | | | |
Institutional Class | | | | 71 | | | | 880 | | | | | 137 | | | | 1,759 | |
Administrative Class | | | | 1,666 | | | | 20,703 | | | | | 2,742 | | | | 35,153 | |
Advisor Class | | | | 0 | | | | 3 | | | | | 0 | | | | 0 | |
Cost of shares redeemed | | | | | | | | | | | | | | | | | | |
Institutional Class | | | | (305 | ) | | | (3,802 | ) | | | | (349 | ) | | | (4,483 | ) |
Administrative Class | | | | (9,697 | ) | | | (120,373 | ) | | | | (7,983 | ) | | | (102,785 | ) |
Advisor Class | | | | (10 | ) | | | (118 | ) | | | | 0 | | | | 0 | |
Net increase resulting from Portfolio share transactions | | | | 8,534 | | | $ | 106,395 | | | | | 31,139 | | | $ | 401,847 | |
The following schedule shows the number of shareholders each owning 5% or more of the Portfolio and the total percentage of the Portfolio held by such shareholders:
| | | | | | |
| | | | | Number of
Shareholders | | % of Portfolio
Held |
Institutional Class | | | | 2 | | 95 |
Administrative Class | | | | 4 | | 56* |
Advisor Class | | | | 2 | | 90 |
* One of the shareholders, Allianz Life Insurance Co. of North America, is an indirect wholly owned subsidiary of AGI and a related party to the Portfolio.
7. FEDERAL INCOME TAX MATTERS
As of June 30, 2006, the aggregate cost of investments was the same for federal income tax and financial statement purposes. The net unrealized appreciation (depreciation) of investment securities for federal income tax purposes is as follows (amounts in thousands):
| | | | |
Aggregate
Gross
Unrealized
Appreciation | | Aggregate
Gross
Unrealized
(Depreciation) | | Net
Unrealized
Appreciation |
$ 15,040 | | $ (2,474) | | $ 12,566 |
8. REGULATORY AND LITIGATION MATTERS
On June 1, 2004, the Attorney General of the State of New Jersey announced that it had dismissed PIMCO from a complaint filed by the New Jersey Attorney General on February 17, 2004, and that it had entered into a settlement agreement (the “New Jersey Settlement”) with Allianz Global Investors of America L.P. (“AGI”) (formerly known as Allianz Dresdner Asset Management of America L.P.), PEA Capital LLC (an entity affiliated with PIMCO through common ownership) (“PEA”) and Allianz Global Investors Distributors LLC (“AGID”), in connection with the same matter. In the New Jersey Settlement, AGI, PEA and AGID neither admitted nor denied the allegations or conclusions of law, but did agree to pay New Jersey a civil fine of $15 million and $3 million for investigative costs and further potential enforcement initiatives against unrelated parties. They also undertook to implement certain governance changes. The complaint relating to the New Jersey Settlement alleged, among other things, that AGI, PEA and AGID had failed to disclose that they improperly allowed certain hedge funds to engage in “market timing” in certain funds. The complaint sought injunctive relief, civil monetary penalties, restitution and disgorgement of profits.
Since February 2004, PIMCO, AGI, PEA, AGID, and certain of their affiliates, including the PIMCO Funds, the Allianz Funds (formerly known as PIMCO Funds: Multi-Manager Series), and the Trustees and employees of the PIMCO Funds, have been named as defendants in fifteen lawsuits filed in various jurisdictions. Eleven of those lawsuits concern “market timing,” and they have been transferred to and consolidated for pre-trial proceedings in a multi-district litigation proceeding in the U.S. District Court for the District of Maryland; the other four lawsuits concern “revenue sharing” and have been consolidated into a single action in the U.S. District Court for the District of Connecticut. The lawsuits have been commenced as putative class actions on behalf of investors who purchased, held or redeemed shares of the various series of the PIMCO Funds and the Allianz Funds during specified periods, or as derivative actions on behalf of the PIMCO Funds and Allianz Funds.
The market timing actions in the District of Maryland generally allege that certain hedge funds were allowed to engage in “market timing” in certain of the PIMCO Funds and the Allianz Funds and this alleged activity was not disclosed. Pursuant to tolling agreements entered into with the derivative and class action plaintiffs, PIMCO, the Trustees, and certain employees of PIMCO who were previously named as defendants have all been dropped as defendants in the market timing actions; the plaintiffs continue to assert claims on behalf of the shareholders of the PIMCO Funds or on behalf of the PIMCO Funds themselves against other defendants. By order dated November 3, 2005, the U.S. District Court for the District of Maryland granted the PIMCO Funds’ motion to dismiss claims asserted against it in a consolidated amended complaint where the PIMCO Funds were named, in the complaint, as a nominal defendant. The revenue sharing action in the District of Connecticut generally alleges that fund assets were inappropriately used to pay brokers to promote the PIMCO Funds and Allianz Funds, including directing fund brokerage transactions to such brokers, and that such alleged arrangements were not fully disclosed to shareholders. On August 11, 2005 the U.S. District Court for the District of Connecticut conducted a hearing on defendants’ motion to dismiss the consolidated amended complaint in the revenue sharing action but has not yet ruled on the motion to dismiss. The market timing and revenue sharing lawsuits seek, among other things, unspecified compensatory damages plus interest and, in some cases, punitive damages, the rescission of investment advisory contracts, the return of fees paid under those contracts and restitution.
Under Section 9(a) of the Investment Company Act of 1940, as amended (“1940 Act”), if the New Jersey Settlement or any of the lawsuits described above were to result in a court injunction against AGI, PEA, AGID and/or their affiliates, PIMCO could, in the absence of exemptive relief granted by the SEC, be barred from serving as an investment adviser, and AGID could be barred from serving as principal underwriter, to any registered investment company, including the
| | | | | | |
| | | Semiannual Report | | June 30, 2006 | | 19 |
Notes to Financial Statements (Cont.)
Portfolios of the Trust. In connection with an inquiry from the SEC concerning the status of the New Jersey Settlement under Section 9(a), PEA, AGID, AGI and certain of their affiliates (including PIMCO) (together, the “Applicants”) have sought exemptive relief from the SEC under Section 9(c) of the 1940 Act. The SEC has granted the Applicants a temporary exemption from the provisions of Section 9(a) with respect to the New Jersey Settlement until the earlier of (i) September 13, 2006 and (ii) the date on which the SEC takes final action on their application for a permanent order. There is no assurance that the SEC will issue a permanent order.
Two nearly identical class action civil complaints have been filed in August 2005, in the Northern District of Illinois Eastern Division alleging that the plaintiffs each purchased and sold a 10-year Treasury note futures contract and suffered damages from an alleged shortage when PIMCO held both physical and futures positions in 10-year Treasury notes for its client accounts. The two actions have been consolidated into one action, and the two separate complaints have been replaced by a consolidated complaint. PIMCO is a named defendant, and the PIMCO Funds have been added as a defendant, to the consolidated action. PIMCO strongly believes the complaint (and any consolidated complaint filed hereafter) is without merit and intends to vigorously defend itself.
Certain Portfolios of the Trust were recently served in an adversary proceeding brought by the Official Committee of Asbestos Claimants of G-I Holdings, Inc. in G-I Holdings, Inc.’s bankruptcy in the District of New Jersey. PIMCO was previously named in this lawsuit and remains a defendant. The plaintiff seeks to recover for the bankruptcy estate assets that were transferred by the predecessor entity of G-I Holdings, Inc. to a wholly-owned subsidiary in 1994. The subsidiary has since issued notes, of which certain Portfolios of the Trust are alleged to be holders. The complaint alleges that in 2000, more than two hundred noteholders—including certain Portfolios of the Trust—were granted a second priority lien on the assets of the subsidiary in exchange for their consent to a refinancing transaction and the granting of a first priority lien to the lending banks. The plaintiff is seeking invalidation of the lien in favor of the noteholders and/or the value of the lien.
It is possible that these matters and/or other developments resulting from these matters could result in increased fund redemptions or other adverse consequences to the Portfolios. However, PIMCO and AGID believe that these matters are not likely to have a material adverse effect on the Portfolios or on PIMCO’s or AGID’s ability to perform their respective investment advisory or distribution services relating to the Portfolios.
| | | | |
| 20 | | PIMCO Variable Insurance Trust | | |
Investment Adviser and Administrator
Pacific Investment Management Company LLC
840 Newport Center Drive
Newport Beach, California 92660
Distributor
Allianz Global Investors Distributors LLC
2187 Atlantic Street
Stamford, Connecticut 06902
Custodian
State Street Bank & Trust Company
801 Pennsylvania
Kansas City, Missouri 64105
Transfer Agent
Boston Financial Data Services–Midwest
330 W. 9th Street
Kansas City, Missouri 64105
Legal Counsel
Dechert LLP
1775 I Street, N.W.
Washington, D.C. 20006
Independent Registered Public Accounting Firm
PricewaterhouseCoopers LLP
1055 Broadway
Kansas City, Missouri 64105
P I M C O

Share Class Advisor
Semiannual Report June 30, 2006
PIMCO Variable Insurance Trust
Real Return Portfolio
Table of Contents
This material is authorized for use only when preceded or accompanied by the current PIMCO Variable Insurance Trust (the “Trust”) prospectus. Investors should consider the investment objectives, risks, charges and expenses of this Trust carefully before investing. Ask your financial professional to explain all charges that may apply. This and other information is contained in the Trust’s prospectus. The variable product prospectus may be obtained by contacting your Investment Consultant. Please read the Trust and variable product prospectus carefully before you invest or send money.
Chairman’s Letter
Dear PIMCO Variable Insurance Trust Shareholder:
It is our pleasure to present to you the semiannual report for the PIMCO Variable Insurance Trust covering the six-month period ended June 30, 2006.
Highlights of the global bond markets during the six-month period included:
| | n | | Most fixed-income sectors lost ground during the first half of 2006, as concern about accelerating inflation and central bank tightening pushed interest rates higher worldwide. The benchmark Lehman Brothers Aggregate Bond Index (which includes Treasury, Investment-Grade Corporate, and Residential Mortgage-Backed Securities) returned -0.72% for the first six months of the year. On June 30, the benchmark ten-year Treasury yielded 5.14%, 0.75% higher than at the start of the year. The U.S. yield curve remained flat as shorter-maturity yields rose by a comparable amount. |
| | n | | The Federal Reserve tightened four times during the reporting period, bringing the Federal Funds Rate to 5.25%. The increase near the end of the period was the Federal Reserve’s 17th consecutive rate hike since the start of its tightening cycle in 2004. The Federal Reserve was not alone, as central banks in Europe, India, and China tightened credit in unison for the first time since 2000. The Bank of Japan, whose zero-interest-rate policy has flooded global markets with liquidity, looked set to reverse this policy in the coming months. |
In these pages please find a more complete Portfolio review as it relates to financial-market activities, as well as details about total-return investment performance for the six-month reporting period. Thank you for the trust you have placed in us. We will continue to work diligently to meet your investment needs.
Sincerely,
Brent R. Harris
Chairman, PIMCO Variable Insurance Trust
July 31, 2006
| | | | | | |
| | | Semiannual Report | | June 30, 2006 | | 1 |
Important Information About the Portfolio
PIMCO Variable Insurance Trust (the “Trust”) is an open-end management investment company currently consisting of nineteen separate investment portfolios, including the Real Return Portfolio (the “Portfolio”). The Portfolio is only available as a funding vehicle under variable life insurance policies or variable annuity contracts issued by insurance companies (“Variable Contracts”). Individuals may not purchase shares of the Portfolio directly. Shares of the Portfolio also may be sold to qualified pension and retirement plans outside of the separate account context.
We believe that bond funds have an important role to play in a well diversified investment portfolio. It is important to note, however, that in an environment where interest rates may trend upward, rising rates would negatively impact the performance of most bond funds, and fixed-income securities held by a fund are likely to decrease in value. The price volatility of fixed-income securities can also increase during periods of rising interest rates resulting in increased losses to a fund. Bond funds and individual bonds with a longer duration (a measure of the expected life of a security) tend to be more sensitive to changes in interest rates, usually making them more volatile than securities or funds with shorter durations. The longer-term performance of most bond funds has benefited from capital gains in part resulting from an extended period of declining interest rates. In the event interest rates increase, these capital gains should not be expected to recur.
The Portfolio may be subject to various risks in addition to those described above. Some of these risks may include, but are not limited to, the following: credit risk, high yield risk, market risk, issuer risk, liquidity risk, derivatives risk, mortgage risk, non-U.S. investment risk, currency risk, issuer non-diversification risk, leveraging risk and management risk. A complete description of these risks is contained in the Portfolio’s prospectus. The Portfolio may use derivative instruments for hedging purposes or as part of an investment strategy. Use of these instruments may involve certain costs and risks such as liquidity risk, interest rate risk, market risk, credit risk, management risk and the risk that the Portfolio could not close out a position when it would be most advantageous to do so. A Portfolio investing in derivatives could lose more than the principal amount invested in these instruments. Investing in non-U.S. securities may entail risk due to non-U.S. economic and political developments; this risk may be increased when investing in emerging markets.
On the performance summary page in this Semiannual Report, the Total Return Investment Performance table measures performance assuming that all dividend and capital gain distributions were reinvested.
An investment in the Portfolio is not a deposit of a bank and is not guaranteed or insured by the Federal Deposit Insurance Corporation or any other government agency. It is possible to lose money on investments in the Portfolio.
PIMCO has adopted written proxy voting policies and procedures (“Proxy Policy”) as required by Rule 206(4)-6 under the Investment Advisers Act of 1940. The Proxy Policy has been adopted by the Trust as the policies and procedures that PIMCO will use when voting proxies on behalf of the Portfolio. Copies of the written Proxy Policy and the factors that PIMCO may consider in determining how to vote proxies for the Portfolio, and information about how the Portfolio voted proxies relating to portfolio securities held during the most recent twelve-month period ended June 30, are available without charge, upon request, by calling the Trust at 1-866-746-2606 and on the Securities and Exchange Commission’s (“SEC”) website at http://www.sec.gov.
The Portfolio files its complete schedule of portfolio holdings with the SEC for the first and third quarters of each fiscal year on Form N-Q. A copy of the Trust’s Form N-Q is available on the SEC’s website at http://www.sec.gov and may be reviewed and copied at the SEC’s Public Reference Room in Washington D.C. Information on the operation of the Public Reference Room may be obtained by calling 1-800-SEC-0330.
PIMCO Variable Insurance Trust is distributed by Allianz Global Investors Distributors LLC, 2187 Atlantic Street, Stamford, CT 06902.
| | | | |
| 2 | | PIMCO Variable Insurance Trust | | |
The following disclosure provides important information regarding the Portfolio’s Expense Example (“Example” or “Expense Example”), which appears in this Semiannual Report. Please refer to this information when reviewing the Expense Example for the Portfolio.
Example
As a shareholder of the Portfolio, you incur two types of costs: (1) transaction costs and (2) ongoing costs, including advisory and administrative fees; distribution and/or service (12b-1) fees (Administrative Class only); and other Portfolio expenses. The Example is intended to help you understand your ongoing costs (in dollars) of investing in the Portfolio and to compare these costs with the ongoing costs of investing in other mutual funds. The Expense Example does not reflect any fees or other expenses imposed by the Variable Contracts. If it did, the expenses reflected in the Expense Examples would be higher. The Example is based on an investment of $1,000 invested at the beginning of the period and held for the entire period indicated, which is from January 1, 2006 to June 30, 2006.
Actual Expenses
The information in the table under the heading “Actual Performance” provides information about actual account values and actual expenses. You may use the information in these columns, together with the amount you invested, to estimate the expenses that you paid over the period. Simply divide your account value by $1,000 (for example, an $8,600 account value divided by $1,000 = 8.60), then multiply the result by the number in the appropriate column for your share class, in the row titled “Expenses Paid During Period” to estimate the expenses you paid on your account during this period.
Hypothetical Example for Comparison Purposes
The information in the table under the heading “Hypothetical Performance (5% return before expenses)” provides information about hypothetical account values and hypothetical expenses based on the Portfolio’s actual expense ratio and an assumed rate of return of 5% per year before expenses, which is not the Portfolio’s actual return. The hypothetical account values and expenses may not be used to estimate the actual ending account balance or expenses you paid for the period. You may use this information to compare the ongoing costs of investing in the Portfolio and other portfolios. To do so, compare this 5% hypothetical example with the 5% hypothetical examples that appear in the shareholder reports of the other portfolios.
Please note that the expenses shown in the table are meant to highlight your ongoing costs only and do not reflect any transactional costs. Therefore, the information under the heading “Hypothetical Performance (5% return before expenses)” is useful in comparing ongoing costs only, and will not help you determine the relative total costs of owning different portfolios. In addition, if these transactional costs were included, your costs would have been higher.
The expense ratio may vary period to period because of various factors, such as an increase in expenses not covered by the advisory and administrative fees (such as expenses of the trustees and their counsel or litigation expense).
Portfolio Benchmark
Lehman Brothers U.S. TIPS Index is an unmanaged market index comprised of all U.S. Treasury Inflation Protected Securities rated investment grade (Baa3 or better), have at least one year to final maturity, and at least $250 million par amount outstanding.
| | | | | | |
| | | Semiannual Report | | June 30, 2006 | | 3 |
|
|
| PIMCO Real Return Portfolio |
|
Cumulative Returns Through June 30, 2006

Real Return Portfolio Lehman Brothers
Advisor Class U.S. TIPS Index
--------------------- ---------------
02/28/2006 $10,000 $10,000
03/31/2006 9,749 9,781
04/30/2006 9,773 9,772
05/31/2006 9,806 9,801
06/30/2006 9,809 9,829
$10,000 invested at the beginning of the first full month following the inception date of the Portfolio’s Advisor Class.
Sector Breakdown‡
| | |
U.S. Treasury Obligations | | 50.9% |
Short-Term Instruments | | 32.5% |
U.S. Government Agencies | | 6.4% |
Asset-Backed Securities | | 5.2% |
Other | | 5.0% |
| | ‡ | % of Total Investments as of June 30, 2006 |
| | | | | | |
| Cumulative Total Return for the period ended June 30, 2006 |
| | | | | | | Since
Inception
(02/28/06) |
| | |
| | PIMCO Real Return Portfolio Advisor Class | | -1.91% |
| | |
| | Lehman Brothers U.S. TIPS Index | | -1.71% |
Past performance is no guarantee of future results. The performance quoted represents past performance. Investment return and principal value will fluctuate so that Fund shares, when redeemed, may be worth more or less than their original cost. The Portfolio’s performance does not reflect the deduction of additional charges and expenses imposed in connection with investing in Variable Contracts, which will reduce returns. Current performance may be lower or higher than the performance data quoted. Performance data current to the most recent month-end is available by calling (800) 927-4648.
| | | | | | | | | | |
| Expense Example | | | | Actual Performance | | | | Hypothetical Performance |
| | | | | | | | | (5% return before expenses) |
Beginning Account Value (02/28/06) | | | | $ | 1,000.00 | | | | $ | 1,000.00 |
Ending Account Value (06/30/06) | | | | $ | 980.90 | | | | $ | 1,014.29 |
Expenses Paid During Period† | | | | $ | 2.54 | | | | $ | 2.58 |
† Expenses are equal to the Portfolio’s Advisor Class annualized expense ratio of 0.75%, multiplied by the average account value over the period, multiplied by 123/365 (to reflect the period since the Portfolio’s Advisor Class shares commenced operations on 02/28/06). Overall fees and expenses of investing in the Portfolio will be higher because the example does not reflect Variable Contract fees and expenses.
Please refer to page 3 herein for a description of the Portfolio’s benchmark and an explanation of the information presented in the above Expense Example.
Portfolio Insights
| » | | The PIMCO Real Return Portfolio seeks to achieve its investment objective by investing under normal circumstances at least 80% of its net assets in inflation-indexed bonds of varying maturities issued by the U.S. and non-U.S. governments, their agencies or instrumentalities, and corporations. |
| » | | For the six-month period ending June 30, 2006, ten-year real yields increased by 0.48%, compared to a 0.82% increase for conventional U.S. Treasury issues of similar maturity. |
| » | | The Portfolio’s above benchmark duration for the first three-months of the period detracted from overall performance, as real yields rose on strong U.S. economic growth. The effective duration of the Portfolio was 6.79 years on June 30, 2006 compared to a duration of 6.11 years for the benchmark. |
| » | | The Portfolio’s emphasis on U.S. nominal bonds was negative for performance, as nominal yields rose faster than real yields based on higher inflation expectations and the outlook for further Federal Reserve tightening. |
| » | | Exposure to short maturity U.S. nominal bonds for the period detracted significantly from performance due to a substantial flattening of the nominal yield curve. |
| » | | Currency exposure added to performance resulting from a depreciation of the U.S. dollar relative to the Euro and Japanese Yen. |
| » | | Mortgage holdings during the period were positive due to favorable coupon selection, particularly 15-year FNMA 5.0% and 30-year FNMA 5.5% coupons, which outperformed the broader Index. |
| » | | Positions in pay-fixed swaps were beneficial with swap spreads mostly widening over the period. |
| | | | |
| 4 | | PIMCO Variable Insurance Trust | | |
| | |
| |
| Financial Highlights Real Return Portfolio | | |
| | | | |
| Selected Per Share Data for the Period Ended: | | 02/28/2006-
06/30/2006+ | |
| |
Advisor Class | | | | |
| Net asset value beginning of period | | $ | 12.69 | |
| Net investment income (a) | | | 0.17 | |
| Net realized/unrealized (loss) on investments (a) | | | (0.41 | ) |
| Total (loss) from investment operations | | | (0.24 | ) |
| Dividends from net investment income | | | (0.17 | ) |
| Total distributions | | | (0.17 | ) |
| Net asset value end of period | | $ | 12.28 | |
| Total return (expressed in base currency) | | | (1.91 | )% |
| Net assets end of period (000s) | | $ | 686 | |
| Ratio of expenses to average net assets | | | 0.76 | %*(b) |
| Ratio of net investment income to average net assets | | | 4.26 | %* |
| Portfolio turnover rate | | | 530 | % |
+ Unaudited
* Annualized
(a) Per share amounts based on average number of shares outstanding during the period.
(b) Ratio of expenses to average net assets excluding interest expense is 0.75%.
| | | | | | |
| See Accompanying Notes | | Semiannual Report | | June 30, 2006 | | 5 |
|
|
| Statement of Assets and Liabilities Real Return Portfolio |
| | | | |
| (Amounts in thousands, except per share amounts) | | June 30, 2006
(Unaudited) | |
| |
Assets: | | | | |
Investments, at value | | $ | 2,350,300 | |
Cash | | | 77 | |
Foreign currency, at value | | | 1,422 | |
Receivable for investments sold | | | 12 | |
Receivable for investments sold on delayed-delivery basis | | | 22,982 | |
Receivable for Portfolio shares sold | | | 766 | |
Interest and dividends receivable | | | 4,444 | |
Variation margin receivable | | | 255 | |
Swap premiums paid | | | 5,195 | |
Unrealized appreciation on forward foreign currency contracts | | | 348 | |
Unrealized appreciation on swap agreements | | | 2,046 | |
| | | | 2,387,847 | |
| |
Liabilities: | | | | |
Payable for investments purchased | | $ | 32,923 | |
Payable for investments purchased on delayed-delivery basis | | | 1,206,598 | |
Payable for short sales | | | 7,365 | |
Payable for Portfolio shares redeemed | | | 3,639 | |
Written options outstanding | | | 675 | |
Accrued investment advisory fee | | | 247 | |
Accrued administration fee | | | 247 | |
Accrued servicing fee | | | 129 | |
Dividends payable | | | 11 | |
Variation margin payable | | | 56 | |
Swap premiums received | | | 1,677 | |
Unrealized depreciation on forward foreign currency contracts | | | 3,648 | |
Unrealized depreciation on swap agreements | | | 402 | |
Other liabilities | | | 3,250 | |
| | | | 1,260,867 | |
| |
Net Assets | | $ | 1,126,980 | |
| |
Net Assets Consist of: | | | | |
Paid in capital | | $ | 1,156,146 | |
Undistributed net investment income | | | 5,699 | |
Accumulated undistributed net realized (loss) | | | (42,472 | ) |
Net unrealized appreciation | | | 7,607 | |
| | | $ | 1,126,980 | |
| |
Net Assets: | | | | |
Institutional Class | | $ | 42,291 | |
Administrative Class | | | 1,084,003 | |
Advisor Class | | | 686 | |
| |
Shares Issued and Outstanding: | | | | |
Institutional Class | | | 3,444 | |
Administrative Class | | | 88,285 | |
Advisor Class | | | 56 | |
| |
Net Asset Value and Redemption Price Per Share (Net Assets Per Share Outstanding) | | | | |
Institutional Class | | $ | 12.28 | |
Administrative Class | | | 12.28 | |
Advisor Class | | | 12.28 | |
| |
Cost of Investments Owned | | $ | 2,337,734 | |
Cost of Foreign Currency Held | | $ | 1,398 | |
Proceeds Received on Short Sales | | $ | 7,304 | |
Premiums Received on Written Options | | $ | 1,008 | |
| | | | |
| 6 | | PIMCO Variable Insurance Trust | | See Accompanying Notes |
|
|
| Statement of Operations Real Return Portfolio |
| | | | |
| (Amounts in Thousands) | | Six Months Ended
June 30, 2006
(Unaudited) | |
| |
Investment Income: | | | | |
Interest | | $ | 25,056 | |
Miscellaneous income | | | 2 | |
Total Income | | | 25,058 | |
| |
Expenses: | | | | |
Investment advisory fees | | | 1,362 | |
Administration fees | | | 1,362 | |
Servicing fees – Administrative Class | | | 785 | |
Trustee’s Fees | | | 6 | |
Interest expense | | | 60 | |
Total Expenses | | | 3,575 | |
| |
Net Investment Income | | | 21,483 | |
| |
Net Realized and Unrealized Gain (Loss): | | | | |
Net realized (loss) on investments | | | (45,095 | ) |
Net realized gain on futures contracts, options and swaps | | | 5,187 | |
Net realized (loss) on foreign currency transactions | | | (1,030 | ) |
Net change in unrealized appreciation on investments | | | 725 | |
Net change in unrealized appreciation on futures contracts, options and swaps | | | 1,515 | |
Net change in unrealized appreciation on translation of assets and liabilities denominated in foreign currencies | | | 2,739 | |
Net (Loss) | | | (35,959 | ) |
| |
Net (Decrease) in Net Assets Resulting from Operations | | $ | (14,476 | ) |
| | | | | | |
| See Accompanying Notes | | Semiannual Report | | June 30, 2006 | | 7 |
|
|
| Statements of Changes in Net Assets Real Return Portfolio |
| | | | | | | | |
| (Amounts in Thousands) | | Six Months Ended
June 30, 2006
(Unaudited) | | | Year Ended
December 31, 2005 | |
| | |
Increase (Decrease) in Net Assets from: | | | | | | | | |
| | |
Operations: | | | | | | | | |
Net investment income | | $ | 21,483 | | | $ | 24,960 | |
Net realized gain (loss) | | | (40,938 | ) | | | 521 | |
Net change in unrealized appreciation (depreciation) | | | 4,979 | | | | (6,910 | ) |
Net increase (decrease) resulting from operations | | | (14,476 | ) | | | 18,571 | |
| | |
Distributions to Shareholders: | | | | | | | | |
| From net investment income | | | | | | | | |
Institutional Class | | | (880 | ) | | | (1,276 | ) |
Administrative Class | | | (20,757 | ) | | | (24,317 | ) |
Advisor Class | | | (3 | ) | | | 0 | |
| From net realized capital gains | | | | | | | | |
Institutional Class | | | 0 | | | | (483 | ) |
Administrative Class | | | 0 | | | | (10,897 | ) |
Advisor Class | | | 0 | | | | 0 | |
| | |
Total Distributions | | | (21,640 | ) | | | (36,973 | ) |
| | |
Portfolio Share Transactions: | | | | | | | | |
| Receipts for shares sold | | | | | | | | |
Institutional Class | | | 1,995 | | | | 11,510 | |
Administrative Class | | | 206,303 | | | | 460,693 | |
Advisor Class | | | 804 | | | | 0 | |
| Issued as reinvestment of distributions | | | | | | | | |
Institutional Class | | | 880 | | | | 1,759 | |
Administrative Class | | | 20,703 | | | | 35,153 | |
Advisor Class | | | 3 | | | | 0 | |
| Cost of shares redeemed | | | | | | | | |
Institutional Class | | | (3,802 | ) | | | (4,483 | ) |
Administrative Class | | | (120,373 | ) | | | (102,785 | ) |
Advisor Class | | | (118 | ) | | | 0 | |
Net increase resulting from Portfolio share transactions | | | 106,395 | | | | 401,847 | |
| | |
Total Increase in Net Assets | | | 70,279 | | | | 383,445 | |
| | |
Net Assets: | | | | | | | | |
Beginning of period | | | 1,056,701 | | | | 673,256 | |
End of period* | | $ | 1,126,980 | | | $ | 1,056,701 | |
| | |
*Including undistributed net investment income of: | | $ | 5,699 | | | $ | 5,856 | |
| | | | |
| 8 | | PIMCO Variable Insurance Trust | | See Accompanying Notes |
| | |
| |
| Schedule of Investments Real Return Portfolio | | June 30, 2006 (Unaudited) |
| | | | | | | | |
| | | | | PRINCIPAL | | | | |
| | | | | AMOUNT | | | | VALUE |
| | | | | (000S) | | | | (000S) |
| BANK LOAN OBLIGATIONS 0.1% |
| Georgia-Pacific Corp. | | | | | | | | |
6.726% due 12/20/2012 | | $ | | 45 | | $ | | 46 |
6.880% due 12/20/2012 | | | | 762 | | | | 761 |
7.170% due 12/20/2012 | | | | 190 | | | | 190 |
| | | | | | | | |
|
Total Bank Loan Obligations (Cost $997) | | 997 |
| | | | | | | | |
|
| |
| CORPORATE BONDS & NOTES 5.2% |
| |
| BANKING & FINANCE 4.4% |
| Atlantic & Western Re Ltd. | | | | | | | | |
11.508% due 01/09/2007 | | | | 1,400 | | | | 1,379 |
11.758% due 01/09/2009 | | | | 900 | | | | 848 |
|
| BAE Systems Holdings, Inc. | | | | | | | | |
5.570% due 08/15/2008 | | | | 300 | | | | 301 |
|
| Charter One Bank N.A. | | | | | | | | |
5.157% due 04/24/2009 | | | | 8,400 | | | | 8,405 |
|
| Citigroup, Inc. | | | | | | | | |
5.199% due 05/02/2008 | | | | 1,000 | | | | 1,001 |
5.166% due 01/30/2009 | | | | 1,000 | | | | 1,000 |
|
| Ford Motor Credit Co. | | | | | | | | |
6.374% due 03/21/2007 | | | | 6,400 | | | | 6,378 |
|
| General Electric Capital Corp. | | | | |
5.311% due 03/04/2008 | | | | 2,800 | | | | 2,803 |
5.340% due 12/12/2008 | | | | 900 | | | | 901 |
|
| General Motors Acceptance Corp. | | | | |
6.750% due 12/01/2014 | | | | 1,600 | | | | 1,488 |
|
| Goldman Sachs Group, Inc. | | | | | | | | |
5.386% due 08/01/2006 | | | | 2,800 | | | | 2,800 |
5.790% due 06/28/2010 | | | | 4,700 | | | | 4,728 |
|
| Mirage Resorts, Inc. | | | | | | | | |
7.250% due 10/15/2006 | | | | 100 | | | | 101 |
|
| Morgan Stanley Warehouse Facilities |
4.719% due 08/16/2006 (h) | | | | 6,200 | | | | 6,200 |
|
| Phoenix Quake Ltd. | | | | | | | | |
7.958% due 07/03/2008 | | | | 500 | | | | 507 |
|
| Phoenix Quake Wind Ltd. | | | | | | | | |
7.440% due 07/03/2008 | | | | 2,000 | | | | 2,021 |
|
| Rabobank Nederland | | | | | | | | |
5.088% due 01/15/2009 | | | | 800 | | | | 800 |
|
| Toyota Motor Credit Corp. | | | | | | | | |
5.192% due 09/18/2006 | | | | 4,600 | | | | 4,600 |
|
| Travelers Property Casualty Corp. |
3.750% due 03/15/2008 | | | | 100 | | | | 97 |
|
| Vita Capital Ltd. | | | | | | | | |
6.340% due 01/01/2007 | | | | 700 | | | | 702 |
|
| Wachovia Bank N.A. | | | | | | | | |
5.308% due 12/02/2010 | | | | 2,400 | | | | 2,402 |
| | | | | | | | |
|
| | | | | | | | | 49,462 |
| | | | | | | | |
|
| |
| INDUSTRIALS 0.7% | | | | | | | | |
| Caesars Entertainment, Inc. | | | | | | | | |
8.500% due 11/15/2006 | | | | 300 | | | | 303 |
|
| CSC Holdings, Inc. | | | | | | | | |
7.875% due 12/15/2007 | | | | 600 | | | | 609 |
|
| DaimlerChrysler N.A. Holding Corp. |
5.486% due 03/07/2007 | | | | 3,500 | | | | 3,501 |
|
| EchoStar DBS Corp. | | | | | | | | |
5.750% due 10/01/2008 | | | | 500 | | | | 490 |
| | | | | | | | |
| El Paso Corp. | | | | | | | | |
7.625% due 08/16/2007 | | $ | | 100 | | $ | | 101 |
6.950% due 12/15/2007 | | | | 100 | | | | 101 |
7.625% due 09/01/2008 | | | | 1,000 | | | | 1,018 |
|
| HCA, Inc. | | | | | | | | |
7.250% due 05/20/2008 | | | | 100 | | | | 102 |
|
| Host Marriott LP | | | | | | | | |
9.500% due 01/15/2007 | | | | 300 | | | | 309 |
9.250% due 10/01/2007 | | | | 100 | | | | 104 |
|
| | | | | | | | |
| Pemex Project Funding Master Trust |
7.375% due 12/15/2014 | | | | 500 | | | | 517 |
8.625% due 02/01/2022 | | | | 200 | | | | 224 |
|
| Royal Caribbean Cruises Ltd. | | | | | | | | |
7.250% due 08/15/2006 | | | | 400 | | | | 402 |
7.000% due 10/15/2007 | | | | 200 | | | | 203 |
|
| Starwood Hotels & Resorts Worldwide, Inc. |
7.375% due 05/01/2007 | | | | 100 | | | | 101 |
| | | | | | | | |
|
| | | | | | | | | 8,085 |
| | | | | | | | |
|
| |
| UTILITIES 0.1% | | | | | | | | |
| Cleveland Electric Illuminating Co. |
6.860% due 10/01/2008 | | | | 100 | | | | 102 |
|
| Embarq Corp. | | | | | | | | |
7.082% due 06/01/2016 | | | | 300 | | | | 299 |
|
| Nisource Finance Corp. | | | | | | | | |
5.764% due 11/23/2009 | | | | 800 | | | | 802 |
| | | | | | | | |
|
| | | | | | | | | 1,203 |
| | | | | | | | |
|
Total Corporate Bonds & Notes
(Cost $58,671) | | 58,750 |
| | | | | | | | |
|
| |
| MUNICIPAL BONDS & NOTES 0.1% |
| Badger, Wisconsin Tobacco Asset Securitization Corporations Revenue Notes, Series 2002 |
6.000% due 06/01/2017 (a) | | | | 475 | | | | 501 |
|
| New York City, New York Municipal Water Finance Authority Revenue Notes, Series 2006 |
5.781% due 06/15/2038 (a) | | | | 130 | | | | 121 |
|
| Rhode Island State Tobacco Settlement Financing Corporations Revenue Notes, Series 2002 |
6.000% due 06/01/2023 (a) | | | | 500 | | | | 523 |
| | | | | | | | |
|
Total Municipal Bonds & Notes
(Cost $1,012) | | 1,145 |
| | | | | | | | |
|
| |
| U.S. GOVERNMENT AGENCIES 13.3% |
| Fannie Mae | | | | | | | | |
4.192% due 11/01/2034 | | | | 7,868 | | | | 7,714 |
4.500% due 10/25/2022 | | | | 200 | | | | 199 |
4.606% due 07/01/2035 | | | | 1,045 | | | | 1,031 |
4.681% due 02/25/2036 | | | | 2,900 | | | | 2,810 |
4.716% due 01/01/2035 | | | | 847 | | | | 832 |
5.111% due 09/07/2006 | | | | 27,600 | | | | 27,590 |
5.211% due 03/01/2044 - 09/01/2044 (c) | | | | 13,622 | | | | 13,686 |
5.299% due 09/21/2006 | | | | 14,100 | | | | 14,098 |
5.472% due 08/25/2034 | | | | 985 | | | | 984 |
5.500% due 03/01/2034 - 07/13/2036 (c) | | | | 45,489 | | | | 43,717 |
5.672% due 05/25/2042 | | | | 384 | | | | 385 |
5.950% due 02/25/2044 | | | | 1,500 | | | | 1,487 |
6.361% due 11/01/2024 | | | | 23 | | | | 24 |
|
| Freddie Mac | | | | | | | | |
4.000% due 03/15/2023 - 10/15/2023 (c) | | | | 1,434 | | | | 1,403 |
4.555% due 01/01/2034 | | | | 847 | | | | 829 |
5.211% due 10/25/2044 - 02/25/2045 (c) | | | | 27,174 | | | | 27,276 |
| | | | | | | | |
5.549% due 12/15/2030 | | $ | | 598 | | $ | | 599 |
5.582% due 08/25/2031 | | | | 267 | | | | 268 |
|
| Small Business Administration |
4.504% due 02/01/2014 | | | | 1,938 | | | | 1,826 |
|
| Small Business Administration Participation Certificates |
4.880% due 11/01/2024 | | | | 3,881 | | | | 3,670 |
| | | | | | | | |
|
Total U.S. Government Agencies
(Cost $151,517) | | 150,428 |
| | | | | | | | |
|
| |
| U.S. TREASURY OBLIGATIONS 106.1% |
| Treasury Inflation Protected Securities (b) |
3.375% due 01/15/2007 | | | | 255 | | | | 256 |
3.625% due 01/15/2008 | | | | 72,756 | | | | 74,029 |
3.875% due 01/15/2009 | | | | 79,566 | | | | 82,438 |
4.250% due 01/15/2010 | | | | 50,443 | | | | 53,603 |
0.875% due 04/15/2010 | | | | 108,925 | | | | 102,785 |
3.500% due 01/15/2011 | | | | 48,130 | | | | 50,358 |
2.375% due 04/15/2011 | | | | 18,044 | | | | 17,978 |
3.375% due 01/15/2012 | | | | 4,558 | | | | 4,776 |
3.000% due 07/15/2012 | | | | 107,133 | | | | 110,356 |
1.875% due 07/15/2013 | | | | 43,406 | | | | 41,712 |
2.000% due 01/15/2014 | | | | 102,388 | | | | 98,861 |
2.000% due 07/15/2014 | | | | 99,400 | | | | 95,754 |
1.625% due 01/15/2015 | | | | 3,497 | | | | 3,261 |
1.875% due 07/15/2015 | | | | 115,676 | | | | 109,797 |
2.000% due 01/15/2016 | | | | 16,209 | | | | 15,484 |
2.375% due 01/15/2025 | | | | 93,066 | | | | 90,609 |
2.000% due 01/15/2026 | | | | 39,962 | | | | 36,600 |
3.625% due 04/15/2028 | | | | 66,504 | | | | 78,934 |
3.875% due 04/15/2029 | | | | 83,450 | | | | 103,282 |
3.375% due 04/15/2032 | | | | 1,824 | | | | 2,154 |
|
| U.S. Treasury Bonds | | | | | | | | |
8.875% due 08/15/2017 | | | | 1,000 | | | | 1,305 |
6.625% due 02/15/2027 | | | | 1,300 | | | | 1,514 |
4.500% due 02/15/2036 | | | | 4,400 | | | | 3,947 |
|
| U.S. Treasury Notes | | | | | | | | |
4.500% due 02/28/2011 | | | | 1,700 | | | | 1,658 |
4.875% due 04/30/2011 | | | | 10,600 | | | | 10,495 |
4.250% due 11/15/2014 | | | | 1,000 | | | | 941 |
4.125% due 05/15/2015 | | | | 100 | | | | 93 |
4.500% due 11/15/2015 | | | | 2,800 | | | | 2,668 |
| | | | | | | | |
|
Total U.S. Treasury Obligations
(Cost $1,187,521) | | 1,195,648 |
| | | | | | | | |
|
| |
| MORTGAGE-BACKED SECURITIES 4.6% |
| Banc of America Funding Corp. |
4.622% due 02/20/2036 | | | | 3,602 | | | | 3,519 |
|
| Banc of America Mortgage Securities |
6.500% due 02/25/2033 | | | | 232 | | | | 231 |
|
| Bear Stearns Adjustable Rate Mortgage Trust |
4.203% due 01/25/2034 | | | | 2,567 | | | | 2,554 |
|
| Citigroup Mortgage Loan Trust, Inc. |
4.700% due 12/25/2035 | | | | 4,662 | | | | 4,572 |
4.900% due 12/25/2035 | | | | 277 | | | | 275 |
|
| Countrywide Alternative Loan Trust |
5.392% due 06/25/2046 | | | | 992 | | | | 989 |
|
| Countrywide Home Loan Mortgage Pass-Through Trust |
3.795% due 11/19/2033 | | | | 291 | | | | 278 |
5.662% due 06/25/2035 | | | | 867 | | | | 867 |
|
| CS First Boston Mortgage Securities Corp. |
4.938% due 05/15/2010 | | | | 1,222 | | | | 1,204 |
|
| First Horizon Alternative Mortgage Securities |
4.744% due 06/25/2034 | | | | 1,123 | | | | 1,101 |
| | | | | | |
| See Accompanying Notes | | Semiannual Report | | June 30, 2006 | | 9 |
| | |
| |
| Schedule of Investments Real Return Portfolio (Cont.) | | |
| | | | | | | | |
| | | | | PRINCIPAL | | | | |
| | | | | AMOUNT | | | | VALUE |
| | | | | (000S) | | | | (000S) |
| GE Capital Commercial Mortgage Corp. |
4.229% due 12/10/2037 | | $ | | 8,709 | | $ | | 8,415 |
|
| GGP Mall Properties Trust | | | | | | | | |
5.007% due 11/15/2011 | | | | 1,431 | | | | 1,429 |
|
| Greenpoint Mortgage Funding Trust |
5.542% due 05/25/2045 | | | | 1,860 | | | | 1,867 |
5.592% due 11/25/2045 | | | | 1,203 | | | | 1,206 |
|
| GSR Mortgage Loan Trust | | | | | | | | |
4.540% due 09/25/2035 | | | | 2,469 | | | | 2,403 |
|
| Lehman XS Trust | | | | | | | | |
5.402% due 06/25/2036 | | | | 1,500 | | | | 1,502 |
5.402% due 04/25/2046 | | | | 2,937 | | | | 2,938 |
|
| MASTR Adjustable Rate Mortgages Trust |
3.786% due 11/21/2034 | | | | 700 | | | | 659 |
|
| Mellon Residential Funding Corp. |
5.639% due 12/15/2030 | | | | 1,275 | | | | 1,280 |
5.549% due 11/15/2031 | | | | 1,558 | | | | 1,561 |
|
| Sequoia Mortgage Trust | | | | | | | | |
5.602% due 10/19/2026 | | | | 537 | | | | 538 |
|
| Structured Adjustable Rate Mortgage Loan Trust |
4.580% due 02/25/2034 | | | | 885 | | | | 867 |
5.682% due 01/25/2035 | | | | 819 | | | | 827 |
|
| Structured Asset Mortgage Investments, Inc. |
5.540% due 05/25/2035 | | | | 500 | | | | 501 |
|
| Washington Mutual, Inc. | | | | | | | | |
5.612% due 08/25/2045 | | | | 428 | | | | 429 |
5.612% due 10/25/2045 | | | | 6,531 | | | | 6,573 |
5.582% due 12/25/2045 | | | | 939 | | | | 942 |
5.259% due 07/25/2046 | | | | 2,400 | | | | 2,398 |
| | | | | | | | |
|
Total Mortgage-Backed Securities
(Cost $52,187) | | 51,925 |
| | | | | | | | |
|
| |
| ASSET-BACKED SECURITIES 10.8% |
| AAA Trust | | | | | | | | |
5.422% due 11/26/2035 | | | | 198 | | | | 198 |
|
| ACE Securities Corp. | | | | | | | | |
5.432% due 10/25/2035 | | | | 3,202 | | | | 3,205 |
|
| Aegis Asset-Backed Securities Trust |
5.522% due 09/25/2034 | | | | 253 | | | | 254 |
|
| Argent Securities, Inc. | | | | | | | | |
5.442% due 10/25/2035 | | | | 953 | | | | 953 |
5.462% due 12/25/2035 | | | | 3,617 | | | | 3,619 |
5.402% due 03/25/2036 | | | | 1,614 | | | | 1,615 |
5.392% due 05/25/2036 | | | | 1,131 | | | | 1,131 |
|
| Asset-Backed Funding Certificates |
5.432% due 08/25/2035 | | | | 662 | | | | 663 |
|
| Bayview Financial Acquisition Trust |
5.791% due 08/28/2034 | | | | 1,499 | | | | 1,501 |
|
| Bear Stearns Asset-Backed Securities, Inc. |
5.652% due 10/25/2032 | | | | 58 | | | | 58 |
5.522% due 09/25/2034 | | | | 1,238 | | | | 1,239 |
5.402% due 11/25/2035 | | | | 797 | | | | 797 |
5.652% due 01/25/2036 | | | | 304 | | | | 304 |
5.772% due 03/25/2043 | | | | 191 | | | | 191 |
|
| Capital One Auto Finance Trust |
5.117% due 05/15/2007 | | | | 1,483 | | | | 1,483 |
|
| Carrington Mortgage Loan Trust |
5.402% due 06/25/2035 | | | | 55 | | | | 55 |
|
| Centex Home Equity | | | | | | | | |
5.372% due 06/25/2036 | | | | 3,589 | | | | 3,590 |
| | | | | | | | |
| Chase Credit Card Master Trust |
5.579% due 11/17/2008 | | $ | | 1,200 | | $ | | 1,201 |
|
| Citigroup Mortgage Loan Trust, Inc. |
5.402% due 12/27/2036 | | | | 2,142 | | | | 2,144 |
|
| Countrywide Asset-Backed Certificates |
5.452% due 02/25/2036 | | | | 1,095 | | | | 1,096 |
5.392% due 03/25/2036 | | | | 1,937 | | | | 1,937 |
5.392% due 04/25/2036 | | | | 1,014 | | | | 1,015 |
5.371% due 07/25/2036 | | | | 2,300 | | | | 2,303 |
5.395% due 07/25/2036 | | | | 900 | | | | 901 |
|
| Equity One ABS, Inc. | | | | | | | | |
5.622% due 04/25/2034 | | | | 255 | | | | 257 |
|
| FBR Securitization Trust | | | | | | | | |
5.442% due 09/25/2035 | | | | 782 | | | | 783 |
5.502% due 09/25/2035 | | | | 2,400 | | | | 2,402 |
5.432% due 10/25/2035 | | | | 6,540 | | | | 6,545 |
5.442% due 10/25/2035 | | | | 712 | | | | 713 |
|
| First Franklin Mortgage Loan Asset-Backed Certificates |
5.412% due 01/25/2036 | | | | 2,308 | | | | 2,310 |
|
| First NLC Trust | | | | | | | | |
5.432% due 12/25/2035 | | | | 1,340 | | | | 1,341 |
|
| Ford Credit Auto Owner Trust | | | | | | | | |
4.240% due 03/15/2008 | | | | 1,074 | | | | 1,069 |
|
| Fremont Home Loan Trust | | | | | | | | |
5.412% due 01/25/2036 | | | | 3,071 | | | | 3,074 |
|
| GSAMP Trust | | | | | | | | |
5.612% due 03/25/2034 | | | | 357 | | | | 358 |
5.412% due 11/25/2035 | | | | 2,995 | | | | 2,997 |
5.432% due 01/25/2036 | | | | 2,593 | | | | 2,595 |
|
| GSR Mortgage Loan Trust | | | | | | | | |
5.422% due 12/25/2030 | | | | 1,481 | | | | 1,481 |
|
| Home Equity Asset Trust | | | | | | | | |
5.432% due 02/25/2036 | | | | 851 | | | | 852 |
5.402% due 05/25/2036 | | | | 955 | | | | 955 |
|
| HSI Asset Securitization Corp. Trust |
5.402% due 12/25/2035 | | | | 1,163 | | | | 1,164 |
|
| Indymac Residential Asset-Backed Trust |
5.422% due 03/25/2036 | | | | 1,293 | | | | 1,294 |
|
| JP Morgan Mortgage Acquisition Corp. |
5.392% due 01/25/2026 | | | | 1,456 | | | | 1,457 |
|
| Long Beach Mortgage Loan Trust |
5.522% due 11/25/2034 | | | | 1,138 | | | | 1,139 |
5.412% due 01/25/2036 | | | | 620 | | | | 621 |
5.402% due 02/25/2036 | | | | 864 | | | | 865 |
5.392% due 03/25/2036 | | | | 403 | | | | 403 |
5.382% due 04/25/2036 | | | | 369 | | | | 369 |
|
| Mastr Asset-Backed Securities Trust |
5.402% due 01/25/2036 | | | | 2,062 | | | | 2,064 |
|
| Merrill Lynch Mortgage Investors, Inc. |
5.422% due 06/25/2036 | | | | 318 | | | | 319 |
5.479% due 06/25/2036 | | | | 3,100 | | | | 3,100 |
5.402% due 01/25/2037 | | | | 748 | | | | 748 |
5.400% due 05/25/2037 | | | | 1,200 | | | | 1,201 |
|
| Morgan Stanley ABS Capital I |
5.381% due 06/25/2036 | | | | 4,600 | | | | 4,599 |
|
| Nelnet Student Loan Trust | | | | | | | | |
5.051% due 10/27/2014 | | | | 300 | | | | 300 |
5.190% due 07/25/2016 | | | | 700 | | | | 702 |
5.190% due 10/25/2016 | | | | 1,200 | | | | 1,201 |
| | | | | | | | |
| New Century Home Equity Loan Trust |
5.432% due 09/25/2035 | | $ | | 633 | | $ | | 634 |
5.442% due 10/25/2035 | | | | 179 | | | | 179 |
|
| Newcastle Mortgage Securities Trust |
5.392% due 04/25/2036 | | | | 695 | | | | 696 |
|
| Nomura Asset Acceptance Corp. |
5.462% due 01/25/2036 | | | | 889 | | | | 889 |
|
| Option One Mortgage Loan Trust |
5.422% due 11/25/2035 | | | | 1,242 | | | | 1,243 |
|
| Renaissance Home Equity Loan Trust |
5.702% due 12/25/2032 | | | | 217 | | | | 217 |
5.472% due 10/25/2035 | | | | 231 | | | | 231 |
|
| Residential Asset Mortgage Products, Inc. |
5.402% due 12/25/2007 | | | | 1,034 | | | | 1,035 |
5.482% due 09/25/2013 | | | | 106 | | | | 106 |
5.432% due 01/25/2025 | | | | 57 | | | | 57 |
5.662% due 11/25/2033 | | | | 507 | | | | 508 |
|
| Residential Asset Securities Corp. |
5.422% due 09/25/2025 | | | | 129 | | | | 129 |
5.422% due 05/25/2027 | | | | 377 | | | | 377 |
5.392% due 06/25/2027 | | | | 272 | | | | 272 |
5.622% due 01/25/2034 | | | | 3 | | | | 3 |
5.131% due 06/25/2036 | | | | 3,180 | | | | 3,181 |
5.362% due 06/25/2036 | | | | 1,884 | | | | 1,884 |
|
| Residential Funding Mortgage Securities II, Inc. |
5.462% due 09/25/2035 | | | | 2,133 | | | | 2,135 |
|
| SACO I, Inc. | | | | | | | | |
5.432% due 10/25/2033 | | | | 1,592 | | | | 1,593 |
|
| Securitized Asset-Backed Receivables LLC Trust |
5.392% due 10/25/2035 | | | | 546 | | | | 546 |
|
| SG Mortgage Securities Trust |
5.422% due 09/25/2035 | | | | 56 | | | | 56 |
|
| SLM Student Loan Trust | | | | | | | | |
5.070% due 01/25/2013 | | | | 1,216 | | | | 1,216 |
5.120% due 07/25/2013 | | | | 565 | | | | 566 |
5.190% due 10/25/2013 | | | | 776 | | | | 778 |
|
| Soundview Home Equity Loan Trust |
5.432% due 05/25/2035 | | | | 1,082 | | | | 1,082 |
5.392% due 02/25/2036 | | | | 308 | | | | 308 |
5.392% due 03/25/2036 | | | | 712 | | | | 712 |
5.392% due 04/25/2036 | | | | 161 | | | | 161 |
5.298% due 07/25/2036 | | | | 3,400 | | | | 3,399 |
|
| Structured Asset Investment Loan Trust |
5.412% due 07/25/2035 | | | | 272 | | | | 272 |
|
| Structured Asset Securities Corp. |
4.900% due 04/25/2035 | | | | 1,850 | | | | 1,776 |
5.452% due 12/25/2035 | | | | 2,388 | | | | 2,390 |
|
| Susquehanna Auto Lease Trust |
4.991% due 04/16/2007 | | | | 417 | | | | 418 |
|
| Truman Capital Mortgage Loan Trust |
5.662% due 01/25/2034 | | | | 103 | | | | 103 |
|
| USAA Auto Owner Trust | | | | | | | | |
5.030% due 11/17/2007 | | | | 800 | | | | 798 |
|
| Wachovia Auto Owner Trust | | | | | | | | |
4.820% due 02/20/2009 | | | | 9,800 | | | | 9,771 |
|
| Wachovia Mortgage Loan Trust LLC |
5.432% due 10/25/2035 | | | | 940 | | | | 941 |
| | | | | | | | |
|
Total Asset-Backed Securities
(Cost $121,422) | | 121,393 |
| | | | | | | | |
|
| |
| | | | |
| 10 | | PIMCO Variable Insurance Trust | | See Accompanying Notes |
| | |
| |
| | | June 30, 2006 (Unaudited) |
| | | | | | | | |
| | | | | PRINCIPAL | | | | |
| | | | | AMOUNT | | | | VALUE |
| | | | | (000S) | | | | (000S) |
| SOVEREIGN ISSUES 0.1% |
| Colombia Government International Bond |
10.000% due 01/23/2012 | | $ | | 350 | | $ | | 397 |
|
| Mexico Government International Bond |
6.375% due 01/16/2013 | | | | 177 | | | | 178 |
| | | | | | | | |
|
Total Sovereign Issues (Cost $526) | | 575 |
| | | | | | | | |
|
| |
| FOREIGN CURRENCY-DENOMINATED ISSUES (l) 0.5% |
| Canadian Government Bond |
3.000% due 12/01/2036 (b) | | CAD | | 530 | | | | 597 |
|
| France Government Bond |
3.000% due 07/25/2012 (b) | | EUR | | 1,648 | | | | 2,268 |
|
| Italy Buoni Poliennali Del Tesoro |
2.150% due 09/15/2014 (b) | | | | 533 | | | | 691 |
|
| Pylon Ltd. | | | | | | | | |
4.463% due 12/18/2008 (h) | | | | 700 | | | | 906 |
6.863% due 12/22/2008 | | | | 1,100 | | | | 1,421 |
| | | | | | | | |
|
Total Foreign Currency-Denominated Issues (Cost $5,794) | | 5,883 |
| | | | | | | | |
|
| |
| | | | | NOTIONAL
AMOUNT
(000S) | | | | |
| PURCHASED CALL OPTIONS 0.0% |
| 2-Year Interest Rate Swap (OTC) Pay 3-Month USD-LIBOR Floating Rate Index |
Strike @ 5.250%
Exp. 06/07/2007 | | $ | | 52,000 | | | | 143 |
| |
| | | | | #OF
CONTRACTS | | | | |
| U.S. Treasury 10-Year Note September Futures (CBOT) |
Strike @ $110.000 Exp. 08/25/2006 | | | | 318 | | | | 5 |
| | | | | | | | |
|
Total Purchased Call Options (Cost $228) | | 148 |
| | | | | | | | |
|
| |
| | | | | NOTIONAL
AMOUNT
(000S) | | | | |
| PURCHASED PUT OPTIONS 0.0% |
Treasury Inflation Protected Securities (OTC)
0.875% due 04/15/2010 |
Strike @ $83.875 Exp. 09/21/2006 | | $ | | 91,000 | | | | 0 |
|
Treasury Inflation Protected Securities (OTC)
1.875% due 07/15/2015 |
Strike @ $68.000 Exp. 09/18/2006 | | | | 90,000 | | | | 0 |
|
Treasury Inflation Protected Securities (OTC)
2.375% due 01/15/2025 |
Strike @ $58.000 Exp. 07/24/2006 | | | | 87,000 | | | | 0 |
|
Treasury Inflation Protected Securities (OTC)
3.000% due 07/15/2012 |
Strike @ $84.000 Exp. 07/24/2006 | | | | 111,000 | | | | 0 |
|
Treasury Inflation Protected Securities (OTC)
3.625% due 01/15/2008 |
Strike @ $96.000 Exp. 07/17/2006 | | | | 65,000 | | | | 0 |
|
| U.S. dollar versus Japanese Yen (OTC) |
Strike @ JY114.000 Exp. 07/03/2006 | | | | 13,400 | | | | 22 |
| | | | | | | | |
| 90-Day Eurodollar March Futures (CME) |
Strike @ $92.000 Exp. 03/19/2007 | | | | 288 | | $ | | 2 |
Strike @ $92.250 Exp. 03/19/2007 | | | | 23 | | | | 0 |
|
| U.S. Treasury 10-Year Note September Futures (CBOT) |
Strike @ $99.000 Exp. 08/25/2006 | | | | 354 | | | | 6 |
Strike @ $100.000 Exp. 08/25/2006 | | | | 1,245 | | | | 134 |
|
| U.S. Treasury 5-Year Note September Futures (CBOT) |
Strike @ $100.500 Exp. 08/25/2006 | | | | 215 | | | | 4 |
| | | | | | | | |
|
Total Purchased Put Options (Cost $282) | | 168 |
| | | | | | | | |
|
| |
| | | | | PRINCIPAL
AMOUNT
(000S) | | | | |
| SHORT-TERM INSTRUMENTS (l) 67.7% |
| |
| COMMERCIAL PAPER 51.9% |
| Abbey National N.A. LLC | | | | | | | | |
5.250% due 07/05/2006 | | $ | | 30,700 | | | | 30,691 |
|
| ASB Bank Ltd. | | | | | | | | |
5.050% due 08/10/2006 | | | | 2,000 | | | | 1,989 |
|
| Barclays U.S. Funding Corp. | | | | | | | | |
4.890% due 07/05/2006 | | | | 24,200 | | | | 24,193 |
4.955% due 07/18/2006 | | | | 1,200 | | | | 1,198 |
5.050% due 08/14/2006 | | | | 1,200 | | | | 1,193 |
|
| BNP Paribas Finance | | | | | | | | |
5.270% due 07/03/2006 | | | | 6,900 | | | | 6,900 |
|
| Caisse d’Amortissement de la Dette Sociale |
5.270% due 08/03/2006 | | | | 30,800 | | | | 30,660 |
|
| Cox Communications, Inc. | | | | | | | | |
4.720% due 07/17/2006 | | | | 1,100 | | | | 1,100 |
|
| Danske Corp. | | | | | | | | |
5.280% due 07/17/2006 | | | | 27,500 | | | | 27,444 |
4.955% due 07/20/2006 | | | | 5,400 | | | | 5,387 |
5.080% due 08/24/2006 | | | | 700 | | | | 695 |
|
| Dexia Delaware LLC | | | | | | | | |
5.275% due 07/05/2006 | | | | 30,800 | | | | 30,791 |
|
| DnB NORBank ASA | | | | | | | | |
5.180% due 09/08/2006 | | | | 31,000 | | | | 30,678 |
|
| Fannie Mae | | | | | | | | |
4.809% due 07/05/2006 | | | | 5,600 | | | | 5,598 |
|
| Federal Home Loan Bank | | | | | | | | |
5.030% due 07/03/2006 | | | | 30,900 | | | | 30,900 |
0.010% due 07/14/2006 | | | | 30,900 | | | | 30,851 |
|
| Fortis Funding LLC | | | | | | | | |
5.175% due 07/10/2006 | | | | 30,800 | | | | 30,769 |
5.265% due 07/26/2006 | | | | 2,900 | | | | 2,890 |
|
| HBOS Treasury Services PLC | | | | | | | | |
5.040% due 08/08/2006 | | | | 1,000 | | | | 995 |
|
| Nordea N.A., Inc. | | | | | | | | |
5.090% due 08/24/2006 | | | | 30,000 | | | | 29,780 |
|
| Rabobank USA Financial Corp. |
5.250% due 07/03/2006 | | | | 30,900 | | | | 30,900 |
|
| Skandinaviska Enskilda Banken AB |
4.960% due 07/20/2006 | | | | 27,800 | | | | 27,735 |
5.000% due 07/27/2006 | | | | 1,100 | | | | 1,096 |
| | | | | | | | |
| Societe Generale N.A. | | | | | | | | |
4.890% due 07/06/2006 | | $ | | 16,600 | | $ | | 16,593 |
5.040% due 08/08/2006 | | | | 17,400 | | | | 17,312 |
5.055% due 08/15/2006 | | | | 300 | | | | 298 |
|
| Stadshypoket Delaware, Inc. |
5.090% due 08/18/2006 | | | | 31,300 | | | | 31,096 |
|
| Swedbank, Inc. | | | | | | | | |
5.230% due 08/03/2006 | | | | 30,800 | | | | 30,661 |
|
| Time Warner Telecom, Inc. |
5.240% due 09/18/2006 | | | | 11,100 | | | | 10,968 |
|
| Total Captial S.A. | | | | | | | | |
5.270% due 07/03/2006 | | | | 30,900 | | | | 30,900 |
|
| UBS Finance Delaware LLC |
5.270% due 07/03/2006 | | | | 200 | | | | 200 |
5.050% due 07/05/2006 | | | | 1,800 | | | | 1,800 |
4.930% due 07/13/2006 | | | | 28,700 | | | | 28,661 |
5.235% due 08/08/2006 | | | | 2,300 | | | | 2,288 |
4.990% due 08/22/2006 | | | | 1,100 | | | | 1,092 |
|
| Westpac Capital Corp. | | | | | | | | |
5.040% due 08/02/2006 | | | | 28,800 | | | | 28,679 |
| | | | | | | | |
|
| | | | | | | | | 584,981 |
| | | | | | | | |
|
| |
| |
| FRANCE TREASURY BILLS 8.4% |
2.785% due 10/12/2006 | | EUR | | 6,990 | | | | 95,109 |
| | | | | | | | |
|
| |
| |
| GERMANY TREASURY BILLS 6.5% |
2.665% due 08/16/2006 | | | | 48,340 | | | | 73,583 |
| | | | | | | | |
|
| |
| |
| TRI-PARTY REPURCHASE AGREEMENT 0.3% |
| State Street Bank | | | | | | | | |
4.900% due 07/03/2006 | | $ | | 3,075 | | | | 3,075 |
| | | | | | | | |
|
(Dated 06/30/2006. Collateralized by Freddie Mac 3.800% due 12/27/2006 valued at $3,137. Repurchase proceeds are $3,076.) |
| |
| |
| U.S. TREASURY BILLS 0.6% |
4.801% due 09/14/2006 (e)(f)(g) | | | | 6,565 | | | | 6,492 |
| | | | | | | | |
|
Total Short-Term Instruments
(Cost $757,577) | | 763,240 |
| | | | | | | | |
|
| |
Total Investments (d) 208.5%
(Cost $2,337,734) | | $ | | 2,350,300 |
| | | | | | | | | |
Written Options (k) (0.1%)
(Premiums $1,008) | | (675) |
| |
| Other Assets and Liabilities (Net) (108.4%) | | (1,222,645) |
| | | | | | | | |
|
| Net Assets 100.0% | | $ | | 1,126,980 |
| | | | | | | | |
|
| | | | | | |
| See Accompanying Notes | | Semiannual Report | | June 30, 2006 | | 11 |
Schedule of Investments Real Return Portfolio (Cont.)
| | |
| Notes to Schedule of Investments (amounts in thousands, except number of contracts): |
| |
(a) Residual Interest bond. |
| |
(b) Principal amount of security is adjusted for inflation. |
| |
(c) Securities are grouped by coupon or range of coupons and represent a range of maturities. |
| |
(d) As of June 30, 2006, portfolio securities with an aggregate market value of $19,567 were valued in good faith and pursuant to guidelines established by the Board of Trustees. |
| |
(e) Securities with an aggregate market value of $2,472 have been pledged as collateral for delayed-delivery securities on June 30, 2006. |
| |
(f) Securities with an aggregate market value of $742 have been pledged as collateral for swap and swaption contracts on June 30, 2006. |
| |
(g) Securities with an aggregate market value of $2,092 have been segregated with the custodian to cover margin requirements for the following open futures contracts on June 30, 2006: |
| | | | | | | | | | |
| Description | | Type | | Expiration
Month | | # of
Contracts | | Unrealized
Appreciation/
(Depreciation) | |
90-Day Eurodollar December Futures | | Long | | 12/2007 | | 33 | | $ | (38 | ) |
90-Day Eurodollar June Futures | | Long | | 06/2007 | | 33 | | | (42 | ) |
90-Day Eurodollar March Futures | | Long | | 03/2008 | | 33 | | | (38 | ) |
90-Day Eurodollar September Futures | | Long | | 09/2007 | | 33 | | | (40 | ) |
Euro-Bund 10-Year Note September Futures | | Short | | 09/2006 | | 162 | | | 109 | |
U.S. Treasury 10-Year Note September Futures | | Long | | 09/2006 | | 563 | | | (320 | ) |
U.S. Treasury 30-Year Bond September Futures | | Short | | 09/2006 | | 90 | | | 45 | |
U.S. Treasury 5-Year Note September Futures | | Long | | 09/2006 | | 215 | | | (145 | ) |
| | | | | | | | |
|
|
|
| | | | | | | | | $ | (469 | ) |
| | | | | | | | |
|
|
|
| | | | | | | | | | | | | | |
(h) Restricted securities as of June 30, 2006: |
| Issuer Description | | Coupon | | Maturity
Date | | Acquisition
Date | | Cost | | Market Value | | Market Value as
a Percentage of
Net Assets |
Pylon Ltd. | | 4.463% | | 12/18/2008 | | 12/11/2003 | | $ | 700 | | $ | 906 | | 0.08% |
Morgan Stanley Warehouse Facilities | | 4.719% | | 08/16/2006 | | 06/28/2004 | | | 6,200 | | | 6,200 | | 0.55% |
| | | | | | | | |
|
| |
|
| |
|
| | | | | | | | | $ | 6,900 | | $ | 7,106 | | 0.63% |
| | | | | | | | |
|
| |
|
| |
|
| | | | | | | | | | | | | | | |
(i) Swap agreements outstanding on June 30, 2006: | |
| Interest Rate Swaps | | | | | | | | | | | | | | | |
| Counterparty | | Floating Rate Index | | Pay/Receive
Floating Rate | | Fixed
Rate | | Expiration
Date | | Notional
Amount | | Unrealized
Appreciation/
(Depreciation) | |
HSBC Bank USA | | 6-month GBP-LIBOR | | Receive | | 4.250% | | 06/12/2036 | | GBP | 2,500 | | $ | 189 | |
J.P. Morgan Chase & Co. | | 6-month GBP-LIBOR | | Pay | | 5.000% | | 06/15/2008 | | | 5,000 | | | 12 | |
Barclays Bank PLC | | 5-year French CPI Ex Tobacco Daily Reference Index | | Pay | | 2.103% | | 10/15/2010 | | EUR | 2,500 | | | (4 | ) |
BNP Paribas Bank | | 5-year French CPI Ex Tobacco Daily Reference Index | | Pay | | 2.090% | | 10/15/2010 | | | 2,500 | | | (9 | ) |
BNP Paribas Bank | | 5-year French CPI Ex Tobacco Daily Reference Index | | Pay | | 2.150% | | 01/19/2016 | | | 15,000 | | | (252 | ) |
Goldman Sachs & Co. | | 6-month EUR-LIBOR | | Receive | | 4.500% | | 06/17/2015 | | | 7,500 | | | 626 | |
UBS Warburg LLC | | 5-year French CPI Ex Tobacco Daily Reference Index | | Pay | | 2.146% | | 10/15/2010 | | | 3,700 | | | (9 | ) |
Bank of America | | 3-month USD-LIBOR | | Receive | | 5.000% | | 12/20/2016 | | $ | 22,700 | | | 281 | |
Barclays Bank PLC | | 3-month USD-LIBOR | | Pay | | 5.000% | | 12/20/2008 | | | 5,900 | | | (5 | ) |
Deutsche Bank AG | | 3-month USD-LIBOR | | Receive | | 5.000% | | 06/21/2021 | | | 5,400 | | | 49 | |
Deutsche Bank AG | | 3-month USD-LIBOR | | Receive | | 5.000% | | 12/20/2026 | | | 5,700 | | | 6 | |
Goldman Sachs & Co. | | 3-month USD-LIBOR | | Pay | | 5.000% | | 12/20/2008 | | | 23,500 | | | (21 | ) |
Goldman Sachs & Co. | | 3-month USD-LIBOR | | Receive | | 5.000% | | 12/20/2013 | | | 6,500 | | | 78 | |
Goldman Sachs & Co. | | 3-month USD-LIBOR | | Receive | | 5.000% | | 12/20/2016 | | | 49,500 | | | 612 | |
J.P. Morgan Chase & Co. | | 3-month USD-LIBOR | | Pay | | 5.000% | | 12/20/2011 | | | 3,700 | | | (33 | ) |
Lehman Brothers, Inc. | | 3-month USD-LIBOR | | Receive | | 5.000% | | 12/20/2036 | | | 4,200 | | | 38 | |
Morgan Stanley Dean Witter & Co. | | 3-month USD-LIBOR | | Pay | | 5.000% | | 12/20/2008 | | | 30,000 | | | (27 | ) |
Morgan Stanley Dean Witter & Co. | | 3-month USD-LIBOR | | Receive | | 5.000% | | 12/20/2016 | | | 100 | | | 1 | |
Morgan Stanley Dean Witter & Co. | | 3-month USD-LIBOR | | Receive | | 5.000% | | 12/20/2036 | | | 5,100 | | | 46 | |
Royal Bank of Scotland PLC | | 3-month USD-LIBOR | | Pay | | 5.000% | | 12/20/2011 | | | 3,100 | | | (27 | ) |
UBS Warburg LLC | | 3-month USD-LIBOR | | Pay | | 5.000% | | 12/20/2008 | | | 9,000 | | | (8 | ) |
| | | | | | | | | | | | | |
|
|
|
| | | | | | | | | | | | | | $ | 1,543 | |
| | | | | | | | | | | | | |
|
|
|
| | | | |
| 12 | | PIMCO Variable Insurance Trust | | See Accompanying Notes |
| | |
| |
| | | June 30, 2006 (Unaudited) |
| | | | | | | | | | | | | | | |
| Credit Default Swaps | | | | | | | | | | | | | | | |
| Counterparty | | Reference Entity | | Buy/Sell
Protection+ | | (Pay)/Receive
Fixed Rate | | Expiration
Date | | Notional
Amount | | Unrealized
Appreciation/
(Depreciation) | |
Goldman Sachs & Co. | | General Motors Acceptance Corp. 6.875% due 08/28/2012 | | Sell | | 3.400% | | 06/20/2011 | | $ | 700 | | $ | 20 | |
J.P. Morgan Chase & Co. | | General Motors Corp. 7.125% due 07/15/2013 | | Sell | | 4.600% | | 06/20/2007 | | | 1,000 | | | (7 | ) |
J.P. Morgan Chase & Co. | | General Motors Corp. 7.125% due 07/15/2013 | | Sell | | 6.400% | | 06/20/2007 | | | 1,500 | | | 14 | |
UBS Warburg LLC | | Ford Motor Credit Co. 7.000% due 10/01/2013 | | Sell | | 5.250% | | 09/20/2007 | | | 1,300 | | | 38 | |
UBS Warburg LLC | | General Motors Acceptance Corp. 6.875% due 08/28/2012 | | Sell | | 3.600% | | 06/20/2011 | | | 1,000 | | | 36 | |
| | | | | | | | | | | | | |
|
|
|
| | | | | | | | | | | | | | $ | 101 | |
| | | | | | | | | | | | | |
|
|
|
| |
| + If the Portfolio is a seller of protection and a credit event occurs, as defined under the terms of that particular swap agreement, the Portfolio will pay to the buyer of the protection an amount up to the notional value of the swap and in certain instances, take delivery of the security. As a buyer of protection, the Portfolio will generally receive from the seller of protection an amount up to the notional amount of the swap if a credit event occurs. | | | | |
| | | | | | | | | | | | | |
(j) Short sales outstanding on June 30, 2006: | | | |
| Description | | Coupon | | Maturity
Date | | Principal
Amount | | Proceeds | | Valueà |
U.S. Treasury Note | | 3.625% | | 05/15/2013 | | $ | 300 | | $ | 275 | | $ | 276 |
U.S. Treasury Note | | 4.250% | | 08/15/2013 | | | 4,400 | | | 4,216 | | | 4,253 |
U.S. Treasury Note | | 4.000% | | 02/15/2014 | | | 3,000 | | | 2,813 | | | 2,836 |
| | | | | | | | | |
|
| |
|
|
| | | | | | | | | | $ | 7,304 | | $ | 7,365 |
| | | | | | | | | |
|
| |
|
|
| | | | | | | | | | | | | | | |
| |
| à Market value includes $126 of interest payable on short sales. | | | |
(k) Written options outstanding on June 30, 2006: | | | |
| Options on Exchange-Traded Futures Contracts | | | |
| Description | | Exercise
Price | | Expiration
Date | | # of
Contracts | | Premium | | Value |
Call - CBOT U.S. Treasury 10-Year Note September Futures | | $ | 108.000 | | 08/25/2006 | | 920 | | $ | 135 | | $ | 29 |
Call - CBOT U.S. Treasury 10-Year Note September Futures | | | 107.000 | | 08/25/2006 | | 258 | | | 24 | | | 24 |
Put - CBOT U.S. Treasury 10-Year Note September Futures | | | 103.000 | | 08/25/2006 | | 1,178 | | | 173 | | | 165 |
| | | | | | | | | | | |
|
| |
|
|
| | | | | | | | | | | | $ | 332 | | $ | 218 |
| | | | | | | | | | | |
|
| |
|
|
| | | | | | | | | | | | | | | | | | | |
| | | | | | | | |
| Interest Rate Swaptions | | | | | | | | | | | | | | | | | | | |
| Description | | Counterparty | | Floating Rate
Index | | Pay/Receive
Floating Rate | | Exercise
Rate | | Expiration
Date | | Notional
Amount | | Premium | | Value |
Call - OTC 10-Year Interest Rate Swap | | Barclays Bank PLC | | 3-month USD-LIBOR | | Receive | | 5.300% | | 01/02/2007 | | $ | 23,000 | | $ | 120 | | $ | 95 |
Put - OTC 10-Year Interest Rate Swap | | Barclays Bank PLC | | 3-month USD-LIBOR | | Pay | | 5.900% | | 01/02/2007 | | | 13,000 | | | 148 | | | 141 |
Put - OTC 1-Year Interest Rate Swap | | Barclays Bank PLC | | 3-month USD-LIBOR | | Pay | | 6.100% | | 01/02/2007 | | | 10,000 | | | 66 | | | 64 |
Call - OTC 5-Year Interest Rate Swap | | Royal Bank of Scotland PLC | | 3-month USD-LIBOR | | Receive | | 5.340% | | 06/07/2007 | | | 19,000 | | | 193 | | | 130 |
Call - OTC 5-Year Interest Rate Swap | | Wachovia Bank N.A. | | 3-month USD-LIBOR | | Receive | | 5.325% | | 06/07/2007 | | | 4,000 | | | 34 | | | 27 |
| | | | | | | | | | | | | | | |
|
| |
|
|
| | | | | | | | | | | | | | | | $ | 561 | | $ | 457 |
| | | | | | | | | | | | | | | |
|
| |
|
|
| | | | | | | | |
| Foreign Currency Options | | | | | | | | | | | | | | | | | | | |
| | | | | | | | | | | | | | | |
| Description | | Counterparty | | Exercise
Price | | Expiration
Date | | Notional
Amount | | Premium | | Value |
Put - OTC U.S. dollar versus Japanese Yen | | Bank of America | | JPY 104.000 | | 07/03/2006 | | $ | 10,100 | | $ | 22 | | $ | 0 |
Put - OTC U.S. dollar versus Japanese Yen | | Bank of America | | 106.500 | | 07/03/2006 | | | 8,100 | | | 53 | | | 0 |
Put - OTC U.S. dollar versus Japanese Yen | | Credit Suisse First Boston | | 106.500 | | 07/03/2006 | | | 5,400 | | | 35 | | | 0 |
Put - OTC U.S. dollar versus Japanese Yen | | Goldman Sachs & Co. | | 104.000 | | 07/03/2006 | | | 2,300 | | | 5 | | | 0 |
| | | | | | | | | | | |
|
| |
|
|
| | | | | | | | | | | | $ | 115 | | $ | 0 |
| | | | | | | | | | | |
|
| |
|
|
| | | | | | |
| See Accompanying Notes | | Semiannual Report | | June 30, 2006 | | 13 |
Schedule of Investments Real Return Portfolio (Cont.)
| | | | | | | | | | | | | | | | | |
(l) Forward foreign currency contracts outstanding on June 30, 2006: | | | | | |
| Type | | | | Principal Amount Covered by Contract | | Settlement Month | | Unrealized
Appreciation | | Unrealized
(Depreciation) | | | Net Unrealized Appreciation/ (Depreciation) | |
Sell | | CAD | | 609 | | 07/2006 | | $ | 6 | | $ | 0 | | | $ | 6 | |
Buy | | EUR | | 11,877 | | 07/2006 | | | 336 | | | 0 | | | | 336 | |
Sell | | | | 6,903 | | 07/2006 | | | 0 | | | (68 | ) | | | (68 | ) |
Sell | | | | 129,792 | | 08/2006 | | | 0 | | | (2,834 | ) | | | (2,834 | ) |
Buy | | JPY | | 625,120 | | 07/2006 | | | 0 | | | (3 | ) | | | (3 | ) |
Buy | | | | 2,811,673 | | 08/2006 | | | 0 | | | (743 | ) | | | (743 | ) |
Buy | | PLN | | 264 | | 09/2006 | | | 1 | | | 0 | | | | 1 | |
Buy | | RUB | | 2,255 | | 09/2006 | | | 3 | | | 0 | | | | 3 | |
Buy | | SKK | | 2,349 | | 09/2006 | | | 2 | | | 0 | | | | 2 | |
| | | | | | | | |
|
| |
|
|
| |
|
|
|
| | | | | | | | | $ | 348 | | $ | (3,648 | ) | | $ | (3,300 | ) |
| | | | | | | | |
|
| |
|
|
| |
|
|
|
| | | | |
| 14 | | PIMCO Variable Insurance Trust | | See Accompanying Notes |
| | |
| |
| Notes to Financial Statements | | June 30, 2006 (Unaudited) |
1. ORGANIZATION
The Real Return Portfolio (the “Portfolio”) is a series of the PIMCO Variable Insurance Trust (the “Trust”). The Trust is registered under the Investment Company Act of 1940 (the “Act”), as amended, as an open-end investment management company organized as a Delaware business trust on October 3, 1997. The Portfolio offers three classes of shares: Institutional, Administrative and Advisor. Information presented in these financial statements pertains to the Advisor Class of the Portfolio. Certain detailed financial information for the Institutional Class and Administrative Class is provided separately and is available upon request. The Trust is designed to be used as an investment vehicle by Separate Accounts of insurance companies that fund variable annuity contracts and variable life insurance policies and by qualified pension and retirement plans.
2. SIGNIFICANT ACCOUNTING POLICIES
The following is a summary of significant accounting policies consistently followed by the Portfolio in the preparation of its financial statements in conformity with accounting principles generally accepted in the United States of America (“GAAP”). The preparation of financial statements in accordance with GAAP requires management to make estimates and assumptions that affect the reported amounts and disclosures in the financial statements. Actual results could differ from those estimates.
Security Valuation. Portfolio securities are valued as of the close of regular trading (normally 4:00 p.m., Eastern Time) on each day that the New York Stock Exchange (“NYSE”) is open. Portfolio securities and other assets for which market quotes are readily available are stated at market value. Market value is generally determined on the basis of last reported sales prices, or if no sales are reported, based on quotes obtained from a quotation reporting system, established market makers, or pricing services. Fixed-income securities and non-exchange traded derivatives are normally valued on the basis of quotes obtained from brokers and dealers or pricing services. Prices obtained from independent pricing services use information provided by market makers or estimates of market values obtained from yield data relating to investments or securities with similar characteristics. Certain fixed-income securities purchased on a delayed-delivery basis are marked to market daily until settlement at the forward settlement date. Short-term investments having a maturity of 60 days or less are generally valued at amortized cost. Exchange traded options, futures and options on futures are valued at the settlement price determined by the relevant exchange.
Investments initially valued in currencies other than the U.S. dollar are converted to the U.S. dollar using exchange rates obtained from pricing services. As a result, the NAV of the Portfolio’s shares may be affected by changes in the value of currencies in relation to the U.S. dollar. The value of securities traded in markets outside the United States or denominated in currencies other than the U.S. dollar may be affected significantly on a day that the NYSE is closed and an investor is not able to purchase, redeem or exchange shares.
Securities and other assets for which market quotes are not readily available are valued at fair value as determined in good faith by the Board of Trustees or persons acting at their direction. The Board of Trustees has adopted methods for valuing securities and other assets in circumstances where market quotes are not readily available, and has delegated to Pacific Investment Management Company LLC (“PIMCO”) the responsibility for applying the valuation methods. In the event that market quotes are not readily available, and the security or asset cannot be valued pursuant to one of the valuation methods, the value of the security or asset will be determined in good faith by the Valuation Committee of the Board of Trustees, generally based upon recommendations provided by PIMCO.
Market quotes are considered not readily available in circumstances where there is an absence of current or reliable market-based data (e.g., trade information, bid/asked information, broker quotes), including where events occur after the close of the relevant market, but prior to the close of regular trading, that materially affect the values of the Portfolio’s securities or assets. In addition, market quotes are considered not readily available when, due to extraordinary circumstances, the exchanges or markets on which the securities trade do not open for trading for the entire day and no other market prices are available. The Board has delegated to PIMCO the responsibility for monitoring significant events that may materially affect the values of the Portfolio’s securities or assets and for determining whether the value of the applicable securities or assets should be re-evaluated in light of such significant events when the Portfolio uses fair value pricing to determine its NAV, securities will not be priced on the basis of quotations from the primary market in which they are traded, but rather may be priced by another method that the Board of Trustees or persons acting at their direction believe accurately reflects fair value. The Trust’s policy is intended to result in a calculation of the Portfolio’s NAV that fairly reflects security values as of the time of pricing. However, fair values determined by the Board of Trustees or persons acting at their direction may not accurately reflect the price that the Portfolio could obtain for a security if it were to dispose of that security as of the time of pricing. Because foreign securities can trade on non-business days, the NAV of the Portfolio may change on days when shareholders will not be able to purchase or redeem shares. The prices used by the Portfolio may differ from the value that would be realized if the securities were sold and the differences could be material to the financial statements.
Securities Transactions and Investment Income. Securities transactions are recorded as of the trade date. Securities purchased or sold on a when-issued or delayed-delivery basis may be settled a month or more after the trade date. Realized gains and losses from securities sold are recorded on the identified cost basis. Dividend income is recorded on the ex-dividend date, except certain dividends from foreign securities where the ex-dividend date may have passed, which are recorded as soon as the Portfolio is informed of the ex-dividend date. Interest income, adjusted for the accretion of discounts and amortization of premiums, is recorded on the accrual basis. Paydown gains and losses on mortgage-related or asset-backed securities are recorded as components of interest income in the Statement of Operations.
Dividends and Distributions to Shareholders. Dividends from net investment income, if any, are declared on each day the Portfolio is open for business and are distributed to shareholders monthly. Net realized capital gains earned by the Portfolio, if any, will be distributed no less frequently than once each year. Most shareholders choose to reinvest their dividends and capital gain distribution in additional shares of the Portfolio.
Income dividends and capital gain distributions are determined in accordance with income tax regulations which may differ from GAAP. Differences between tax regulations and GAAP may change the fiscal year when income and capital items are recognized for tax and GAAP purposes. Examples of events that give rise to timing differences include wash sales, straddles, net operating losses and capital loss carryforwards. Further, the character of investment income and capital gains may be different for certain transactions under the two methods of accounting. Examples of characterization differences include the treatment of mortgage paydowns, swaps, foreign currency transactions and contingent debt instruments. As a result, income dividends and capital gain distributions declared during a fiscal period may differ significantly from the net investment income and realized capital gain reported in the Portfolio’s annual financial statements presented under GAAP.
Distributions classified as a tax basis return of capital, if any, are reflected in the accompanying Statements of Changes in Net Assets and have been reclassified to
| | | | | | |
| | | Semiannual Report | | June 30, 2006 | | 15 |
Notes to Financial Statements (Cont.)
paid in capital. In addition, other amounts have been reclassified between undistributed net investment income, accumulated undistributed net realized gains or losses and/or paid in capital to more appropriately conform financial accounting to tax characterizations of dividend distributions.
Multiclass Operations. Each class offered by the Portfolio has equal rights as to assets and voting privileges (except that shareholders of a class have exclusive voting rights regarding any matter relating solely to that class of shares). Income and non-class specific expenses of the Portfolio are allocated daily to each class of shares based on the relative value of settled shares. Realized and unrealized capital gains and losses of the Portfolio are allocated daily to each class of shares based on the relative net assets of each class. Class specific expenses, where applicable, currently include administrative, distribution and servicing fees.
Delayed-Delivery Transactions. The Portfolio may purchase or sell securities on a when-issued or delayed-delivery basis. These transactions involve a commitment by the Portfolio to purchase or sell securities for a predetermined price or yield, with payment and delivery taking place beyond the customary settlement period. When delayed-delivery purchases are outstanding, the Portfolio will designate liquid assets in an amount sufficient to meet the purchase price. When purchasing a security on a delayed-delivery basis, the Portfolio assumes the rights and risks of ownership of the security, including the risk of price and yield fluctuations, and takes such fluctuations into account when determining its net asset value. The Portfolio may dispose of or renegotiate a delayed-delivery transaction after it is entered into, and may sell when-issued securities before they are delivered, which may result in a capital gain or loss. When the Portfolio has sold a security on a delayed-delivery basis, the Portfolio does not participate in future gains and losses with respect to the security.
Federal Income Taxes. The Portfolio intends to qualify as a regulated investment company under sub-chapter M of the Internal Revenue Code and distribute all of its taxable income and net realized gains, if applicable, to shareholders. Accordingly, no provision for Federal income taxes has been made.
Foreign Currency. The accounting records of the Portfolio are maintained in U.S. dollar. The market values of foreign securities, currency holdings and other assets and liabilities are translated into U.S. dollar based on the current exchange rates each business day. Fluctuations in the value of currency holdings and other assets and liabilities resulting from changes in exchange rates are recorded as unrealized foreign currency gains or losses. Realized gains or losses and unrealized appreciation or depreciation on investment securities and income and expenses are translated on the respective dates of such transactions. The effects of changes in foreign currency exchange rates on investments in securities are not segregated in the Statement of Operations from the effects of changes in market prices of those securities, but are included with the net realized and unrealized gain or loss on investment securities.
| | | | | | |
|
| Non-U.S. currency symbols utilized throughout the report are defined as follows: |
| CAD | | Canadian Dollar | | PLN | | Polish Zloty |
| EUR | | Euro | | RUB | | Russian Ruble |
| GBP | | British Pound | | SKK | | Slovakian Koruna |
| JPY | | Japanese Yen | | | | |
Forward Currency Transactions. The Portfolio may enter into forward currency contracts in connection with settling planned purchases or sales of securities, to hedge the currency exposure associated with some or all of the Portfolio’s securities or as a part of an investment strategy. A forward currency contract is an agreement between two parties to buy and sell a currency at a set price on a future date. The market value of a forward currency contract fluctuates with changes in forward currency exchange rates. Forward currency contracts are marked to market daily and the change in value is recorded by the Portfolio as an unrealized gain or loss. Realized gains or losses equal to the difference between the value of the contract at the time it was opened and the value at the time it was closed are recorded upon delivery or receipt of the currency or, if a forward currency contract is offset by entering into another forward currency contract with the same broker, upon settlement of the net gain or loss. These contracts may involve market risk in excess of the unrealized gain or loss reflected in the Portfolio’s Statement of Assets and Liabilities. In addition, the Portfolio could be exposed to risk if the counterparties are unable to meet the terms of the contracts or if the value of the currency changes unfavorably to the U.S. dollar.
Futures Contracts. The Portfolio is authorized to enter into futures contracts. The Portfolio may use futures contracts to manage its exposure to the securities markets or to movements in interest rates and currency values. The primary risks associated with the use of futures contracts are the imperfect correlation between the change in market value of the securities held by the Portfolio and the prices of futures contracts, the possibility of an illiquid market, and the inability of the counterparty to meet the terms of the contract. Futures contracts are valued based upon their quoted daily settlement prices. Upon entering into a futures contract, the Portfolio is required to deposit with its custodian, in a segregated account in the name of the futures broker, an amount of cash or U.S. Government and Agency Obligations in accordance with the initial margin requirements of the broker or exchange. Futures contracts are marked to market daily and an appropriate payable or receivable for the change in value (“variation margin”) is recorded by the Portfolio. Gains or losses are recognized but not considered realized until the contracts expire or are closed. Futures contracts involve, to varying degrees, risk of loss in excess of the variation margin disclosed in the Statement of Assets and Liabilities.
Inflation-Indexed Bonds. The Portfolio may invest in inflation-indexed bonds. Inflation-indexed bonds are fixed-income securities whose principal value is periodically adjusted to the rate of inflation. The interest rate on these bonds is generally fixed at issuance at a rate lower than typical bonds. Over the life of an inflation-indexed bond, however, interest will be paid based on a principal value, which is adjusted for inflation. Any increase in the principal amount of an inflation-indexed bond will be included as interest income in the Statement of Operations, even though investors do not receive their principal until maturity.
Loan Participant and Assignments. The Portfolio may invest in direct debt instruments which are interests in amounts owned by corporate, governmental, or other borrowers to lenders or lending syndicates. The Portfolio’s investments in loans may be in the form of participations in loans or assignments of all or a portion of loans from third parties. A loan is often administered by a bank or other financial institution (the “lender”) that acts as agent for all holders. Then agent administers the terms of the loan, as specified in the loan agreement. When investing in a loan participation, the Portfolio has the right to receive payments of principal, interest and any fees to which it is entitled only from the lender selling the loan agreement and only upon receipt by the lender of payments from the borrower. The Portfolio generally has no right to enforce compliance with the terms of the loan agreement with the borrower. As a result, the Portfolio may be subject to the credit of both the borrower and the lender that is selling the loan agreement. When the Portfolio purchases assignments from lenders it acquires direct rights against the borrower on the loan. At the end of the period, the Portfolio had no unfunded loan commitments.
Options Contracts. The Portfolio may write call and put options on futures, swaps, securities or currencies it owns or in which it may invest. Writing put options tends to increase the Portfolio’s exposure to the underlying instrument. Writing call options tends to decrease the Portfolio’s exposure to the underlying instrument. When the Portfolio writes a call or put option, an amount equal to the
| | | | |
| 16 | | PIMCO Variable Insurance Trust | | |
| | |
| |
| | | June 30, 2006 (Unaudited) |
premium received is recorded as a liability and subsequently marked to market to reflect the current value of the option written. These liabilities are reflected as written options outstanding in the Statement of Assets and Liabilities. Certain options may be written with premiums to determined on a future date. The premiums for these options are based upon implied volatility parameters at specified terms. Premiums received from writing options which expire are treated as realized gains. Premiums received from writing options which are exercised or closed are added to the proceeds or offset against amounts paid on the underlying future, swap, security or currency transaction to determine the realized gain or loss. The Portfolio as a writer of an option has no control over whether the underlying future, swap, security or currency may be sold (call) or purchased (put) and as a result bears the market risk of an unfavorable change in the price of the future, swap, security or currency underlying the written option. There is the risk the Portfolio may not be able to enter into a closing transaction because of an illiquid market.
The Portfolio may also purchase put and call options. Purchasing call options tends to increase the Portfolio’s exposure to the underlying instrument. Purchasing put options tends to decrease the Portfolio’s exposure to the underlying instrument. The Portfolio pays a premium which is included in the Portfolio’s Statement of Assets and Liabilities as an investment and subsequently marked to market to reflect the current value of the option. Premiums paid for purchasing options which expire are treated as realized losses. Certain options may be purchased with premiums to be determined on a future date. The premiums for these options are based upon implied volatility parameters at specified terms. The risk associated with purchasing put and call options is limited to the premium paid. Premiums paid for purchasing options which are exercised or closed are added to the amounts paid or offset against the proceeds on the underlying future, swap, security or currency transaction to determine the realized gain or loss.
Repurchase Agreements. The Portfolio may engage in repurchase transactions. Under the terms of a typical repurchase agreement, the Portfolio takes possession of an underlying debt obligation subject to an obligation of the seller to repurchase, and the Portfolio to resell, the obligation at an agreed-upon price and time. The underlying securities for all repurchase agreements are held in safekeeping at the Portfolio’s custodian or designated subcustodians under triparty repurchase agreements. The market value of the collateral must be equal to or exceed at all times the total amount of the repurchase obligations, including interest. Securities purchased under repurchase agreements are reflected as an asset in the Statement of Assets and Liabilities. Generally, in the event of counterparty default, the Portfolio has the right to use the collateral to offset losses incurred. If the counterparty should default, the Portfolio will seek to sell the securities which it holds as collateral. This could involve procedural costs or delays in addition to a loss on the securities if their value should fall below their repurchase price.
Short Sales. The Portfolio may enter into short sales transactions. A short sale is a transaction in which the Portfolio sells securities it does not own in anticipation of a decline in the market price of the securities. Securities sold in short sale transactions and interest payable on such securities, if any, are reflected as a liability in the Statement of Assets and Liabilities. The Portfolio is obligated to deliver securities at the market price at the time the short position is closed. Possible losses from short sales may be unlimited, whereas losses from purchases cannot exceed the total amount invested.
Mortgage-Related and Other Asset-Backed Securities. The Portfolio may invest in mortgage-related or other asset-backed securities. These securities include mortgage pass-through securities, collateralized mortgage obligations (“CMOs”), commercial mortgage-backed securities, mortgage dollar rolls, CMO residuals, stripped mortgage-backed securities (“SMBSs”) and other securities
that directly or indirectly represent a participation in, or are secured by and payable from, mortgage loans on real property. The value of some mortgage- or asset-backed securities may be particularly sensitive to changes in prevailing interest rates. Early repayment of principal on some mortgage-related securities may expose the Portfolio to a lower rate of return upon reinvestment of principal. The value of these securities may fluctuate in response to the market’s perception of the creditworthiness of the issuers. Additionally, although mortgages and mortgage-related securities are generally supported by some form of government or private guarantee and/or insurance, there is no assurance that private guarantors or insurers will meet their obligations.
One type of SMBS has one class receiving all of the interest from the mortgage assets (the interest-only, or “IO” class), while the other class will receive all of the principal (the principal-only, or “PO” class). Payments received for IOs are included in interest income in the Statement of Operations. Because principal will not be received at the maturity of an IO, adjustments are made to the book value of the security on a daily basis until maturity. These adjustments are included in interest income in the Statement of Operations. Payments received for POs are treated as reductions to the cost and par value of the securities.
Swap Agreements. The Portfolio may engage in swap transactions, including, but not limited to, swap agreements on interest rate and credit default to manage its exposure to interest rates and credit risk. In connection with these agreements, securities may be identified as collateral in accordance with the terms of the respective swap agreements.
Interest rate swap agreements involve the exchange by the Portfolio with another party of their respective commitments to pay or receive interest, e.g., an exchange of floating rate payments for fixed rate payments with respect to the notional amount of principal.
Credit default swap agreements involve one party making a stream of payments to another party in exchange for the right to receive a specified return in the event of a default by a third party, typically corporate issues or sovereign issues of an emerging country, on its obligation. The Portfolio may use credit default swaps to provide a measure of protection against defaults of the issuers (i.e., to reduce risk where the Portfolio owns or has exposure to the sovereign issuer) or to take an active long or short position with respect to the likelihood of a particular issuer’s default. As a seller of protection, the Portfolio generally receives an upfront payment or a fixed rate of income throughout the term of the swap provided that there is no credit event. If the Portfolio is a seller of protection and a credit event occurs, as defined under the terms of that particular swap agreement, the Portfolio will pay to the buyer of the protection an amount up to the notional value of the swap and in certain instances take delivery of the security. As the seller, the Portfolio would effectively add leverage to its portfolio because, in addition to its total net assets, the Portfolio would be subject to investment exposure on the notional amount of the swap. As a buyer of protection, the Portfolio generally receives an amount up to the notional value of the swap if a credit event occurs. The treatment of a credit default swaps and other swap agreements that provide for contingent, non-periodic, bullet-type payments as “notional principal contracts” for federal income tax purposes is uncertain. Were the Internal Revenue Service in take the position that a credit default swap or other bullet-type swap is not a “notional principal contract” for federal income tax purposes, payments received by the Portfolio from such investments might be subject to income taxes.
Swaps are marked to market daily based upon quotations from market makers and the change in value, if any, is recorded as unrealized gain or loss in the Statement of Operations. Payments received or made at the beginning of the measurement period are reflected as such in the Statement of Assets and Liabilities. These upfront payments are recorded as realized gain or loss in the Statement of Operations upon termination or maturity of the swap. A liquidation payment received or made at the termination of the swap is recorded as realized gain or loss in the Statement of Operations. Net periodic payments received by the Portfolio are included as part of realized gain or loss in the Statement of
| | | | | | |
| | | Semiannual Report | | June 30, 2006 | | 17 |
Notes to Financial Statements (Cont.)
Operations. Entering into these agreements involves, to varying degrees, elements of credit, market and documentation risk in excess of the amounts recognized in the Statement of Assets and Liabilities. Such risks involve the possibility that there will be no liquid market for these agreements, that the counterparty to the agreements may default on its obligation to perform or disagree as to the meaning of contractual terms in the agreements and that there may be unfavorable changes in interest rates.
U.S. Government Agencies or Government-Sponsored Enterprises. Securities issued by U.S. Government agencies or government-sponsored enterprises may not be guaranteed by the U.S. Treasury. The Government National Mortgage Association (“GNMA”), a wholly owned U.S. Government corporation, is authorized to guarantee, with the full faith and credit of the U.S. Government, the timely payment of principal and interest on securities issued by institutions approved by GNMA and backed by pools of mortgages insured by the Federal Housing Administration or guaranteed by the Department of Veterans Affairs. Government-related guarantors (i.e., not backed by the full faith and credit of the U.S. Government) include the Federal National Mortgage Association (“FNMA” or “Fannie Mae”) and the Federal Home Loan Mortgage Corporation (“FHLMC” or “Freddie Mac”). Pass-through securities issued by FNMA are guaranteed as to timely payment of principal and interest by FNMA but are not backed by the full faith and credit of the U.S. Government. FHLMC guarantees the timely payment of interest and ultimate collection of principal, but its participation certificates are not backed by the full faith and credit of the U.S. Government.
Guarantees and Indemnifications. Under the Trust’s organizational documents, each Trustee, officer, employee or other agent of the Trust (including the Trust’s investment manager) is indemnified against certain liabilities that may arise out of performance of their duties to the Portfolio. Additionally, in the normal course of business, the Portfolio enters into contracts that contain a variety of indemnification clauses. The Portfolio’s maximum exposure under these arrangements is unknown as this would involve future claims that may be made against the Portfolio that have not yet occurred. However, the Portfolio has not had prior claims or losses pursuant to these contracts, and believes the risk of loss to be remote.
New Accounting Policies. In July 2006, the Financial Accounting Standards Board issued Interpretation No. 48, “Accounting for Uncertainty in Income Taxes—an Interpretation of FASB Statement No. 109” (the “Interpretation”). The Interpretation is effective for fiscal years beginning after December 15, 2006. Management is currently evaluating the application of the Interpretation to the Portfolio and will provide additional information in relation to the Interpretation in the Portfolio’s annual financial statements for the year ending December 31, 2006.
3. FEES, EXPENSES, AND RELATED PARTY TRANSACTIONS
Investment Advisory Fee. PIMCO is a majority-owned subsidiary of Allianz Global Investors of America L.P. (“AGI”), and serves as investment adviser (the “Adviser”) to the Trust, pursuant to an investment advisory contract. The Adviser receives a monthly fee at an annual rate based on average daily net assets of the Portfolio. The Advisory Fee is charged at an annual rate of 0.25%.
Administration Fee. PIMCO serves as administrator (the “Administrator”), and provides administrative services to the Trust for which it receives a monthly administrative fee based on average daily net assets of the Portfolio. As the Administrator, PIMCO bears the costs of various third-party services, including audit, custodial, portfolio accounting, legal, transfer agency and printing costs. The Administration Fee is charged at the annual rate of 0.25%.
Distribution and Servicing Fees. Allianz Global Investors Distributors LLC (“AGID”) is an indirect wholly-owned subsidiary of AGI and serves as the distributor of the Trust’s shares. The Trust is permitted to reimburse AGID on a quarterly basis, out of the Administrative Class assets of the Portfolio in the amount of 0.15% on an annual basis of the average daily net assets of that class, for payments made to financial intermediaries that provide services in connection with the distribution of shares or administration of plans or programs that use Portfolio shares as their funding medium. The effective rate paid to AGID was 0.15% during the current fiscal year.
Expenses. The Trust is responsible for the following expenses: (i) salaries and other compensation of any of the Trust’s executive officers and employees who are not officers, directors, stockholders or employees of PIMCO or its subsidiaries or affiliates; (ii) taxes and governmental fees; (iii) brokerage fees and commissions and other portfolio transaction expenses; (iv) the costs of borrowing money, including interest expenses and bank overdraft charges; (v) fees and expenses of the Trustees who are not “interested persons” of PIMCO or the Trust, and any counsel retained exclusively for their benefit; (vi) extraordinary expenses, including costs of litigation and indemnification expenses; (vii) organization expenses and (viii) any expenses allocated or allocable to a specific class of shares, which include service fees payable with respect to the Administrative Class shares and may include certain other expenses as permitted by the Trust’s Multiple Class Plan adopted pursuant to Rule 18f-3 under the Act and subject to review and approval by the Trustees. The ratio of expenses to average net assets per share class, as disclosed in the Financial Highlights, may differ from the annual portfolio operating expenses per share class as disclosed in the Prospectus for the reasons set forth above.
For the current period ended June 30, 2006, each unaffiliated Trustee received an annual retainer of $15,000, plus $2,000 for each Board of Trustees quarterly meeting attended, $500 for each Board of Trustees committee meeting attended and $500 for each special board meeting attended, plus reimbursement of related expenses. In addition, each Committee Chair received an additional annual retainer of $500 and each Audit Committee Chair received an additional annual retainer of $1,500. These expenses are allocated on a pro-rata basis to each Portfolio of the Trust according to its respective net assets. The Trust pays no compensation directly to any Trustee or any other officer who is affiliated with the Administrator, all of whom receive remuneration for their services to the Trust from the Administrator or its affiliates.
4. PURCHASES AND SALES OF SECURITIES
The length of time the Portfolio has held a particular security is not generally a consideration in investment decisions. A change in the securities held by the Portfolio is known as “portfolio turnover”. The Portfolio may engage in frequent and active trading of portfolio securities to achieve its investment objective, particularly during periods of volatile market movements. High portfolio turnover (e.g., over 100%) involves correspondingly greater expenses to the Portfolio, including brokerage commissions or dealer mark-ups and other transaction costs on the sale of securities and reinvestments in other securities. Such sales may also result in realization of taxable capital gains, including short-term capital gains (which are generally taxed at ordinary income tax rates). The trading costs and tax effects associated with portfolio turnover may adversely affect the Portfolio’s performance.
Purchases and sales of securities (excluding short-term investments) for the period ended June 30, 2006 were as follows (amounts in thousands):
| | | | | | | | | | | | | | | | |
| | U.S Government/Agency | | | | | All Other |
| | Purchases | | | | | Sales | | | | | Purchases | | | | | Sales |
| $ | 8,549,666 | | | | $ | 8,379,973 | | | | $ | $109,598 | | | | $ | 27,378 |
| | | | |
| 18 | | PIMCO Variable Insurance Trust | | |
| | |
| |
| | | June 30, 2006 (Unaudited) |
5. TRANSACTIONS IN WRITTEN CALL AND PUT OPTIONS
Transactions in written call and put options were as follows (amounts in thousands, except number of contracts):
| | | | | | | | | | | | | | | | |
| | | | | # of
Contracts |
| | | |
| Notional
Amount
in $ | | | | | Premium | |
Balance at 12/31/2005 | | | | 158 | | | | | $ | 0 | | | | $ | 34 | |
Sales | | | | 3,113 | | | | | | 94,900 | | | | | 1,241 | |
Closing Buys | | | | (429 | ) | | | | | 0 | | | | | (89 | ) |
Expirations | | | | (371 | ) | | | | | 0 | | | | | (91 | ) |
Exercised | | | | (115 | ) | | | | | 0 | | | | | (87 | ) |
Balance at 06/30/2006 | | | | 2,356 | | | | | $ | 94,900 | | | | $ | 1,008 | |
6. SHARES OF BENEFICIAL INTEREST
The Portfolio may issue an unlimited number of shares of beneficial interest with a $0.001 par value. Changes in shares of beneficial interest were as follows (shares and amounts in thousands):
| | | | | | | | | | | | | | | | | | |
| | | | | Six Months Ended 06/30/2006 | | | | | Year Ended 12/31/2005 | |
| | | | | Shares | | | Amount | | | | | Shares | | | Amount | |
| | | | | | |
Receipts for shares sold | | | | | | | | | | | | | | | | | | |
Institutional Class | | | | 160 | | | $ | 1,995 | | | | | 890 | | | $ | 11,510 | |
Administrative Class | | | | 16,583 | | | | 206,303 | | | | | 35,702 | | | | 460,693 | |
Advisor Class | | | | 66 | | | | 804 | | | | | 0 | | | | 0 | |
Issued as reinvestment of distributions | | | | | | | | | | | | | | | | | | |
Institutional Class | | | | 71 | | | | 880 | | | | | 137 | | | | 1,759 | |
Administrative Class | | | | 1,666 | | | | 20,703 | | | | | 2,742 | | | | 35,153 | |
Advisor Class | | | | 0 | | | | 3 | | | | | 0 | | | | 0 | |
Cost of shares redeemed | | | | | | | | | | | | | | | | | | |
Institutional Class | | | | (305 | ) | | | (3,802 | ) | | | | (349 | ) | | | (4,483 | ) |
Administrative Class | | | | (9,697 | ) | | | (120,373 | ) | | | | (7,983 | ) | | | (102,785 | ) |
Advisor Class | | | | (10 | ) | | | (118 | ) | | | | 0 | | | | 0 | |
Net increase resulting from Portfolio share transactions | | | | 8,534 | | | $ | 106,395 | | | | | 31,139 | | | $ | 401,847 | |
The following schedule shows the number of shareholders each owning 5% or more of the Portfolio and the total percentage of the Portfolio held by such shareholders:
| | | | | | |
| | | | | Number of
Shareholders | | % of Portfolio
Held |
Institutional Class | | | | 2 | | 95 |
Administrative Class | | | | 4 | | 56* |
Advisor Class | | | | 2 | | 90 |
* One of the shareholders, Allianz Life Insurance Co. of North America, is an indirect wholly owned subsidiary of AGI and a related party to the Portfolio.
7. FEDERAL INCOME TAX MATTERS
As of June 30, 2006, the aggregate cost of investments was the same for federal income tax and financial statement purposes. The net unrealized appreciation (depreciation) of investment securities for federal income tax purposes is as follows (amounts in thousands):
| | | | |
Aggregate
Gross
Unrealized
Appreciation | | Aggregate
Gross
Unrealized
(Depreciation) | | Net
Unrealized
Appreciation |
$ 15,040 | | $ (2,474) | | $ 12,566 |
8. REGULATORY AND LITIGATION MATTERS
On June 1, 2004, the Attorney General of the State of New Jersey announced that it had dismissed PIMCO from a complaint filed by the New Jersey Attorney General on February 17, 2004, and that it had entered into a settlement agreement (the “New Jersey Settlement”) with Allianz Global Investors of America L.P. (“AGI”) (formerly known as Allianz Dresdner Asset Management of America L.P.), PEA Capital LLC (an entity affiliated with PIMCO through common ownership) (“PEA”) and Allianz Global Investors Distributors LLC (“AGID”), in connection with the same matter. In the New Jersey Settlement, AGI, PEA and AGID neither admitted nor denied the allegations or conclusions of law, but did agree to pay New Jersey a civil fine of $15 million and $3 million for investigative costs and further potential enforcement initiatives against unrelated parties. They also undertook to implement certain governance changes. The complaint relating to the New Jersey Settlement alleged, among other things, that AGI, PEA and AGID had failed to disclose that they improperly allowed certain hedge funds to engage in “market timing” in certain funds. The complaint sought injunctive relief, civil monetary penalties, restitution and disgorgement of profits.
Since February 2004, PIMCO, AGI, PEA, AGID, and certain of their affiliates, including the PIMCO Funds, the Allianz Funds (formerly known as PIMCO Funds: Multi-Manager Series), and the Trustees and employees of the PIMCO Funds, have been named as defendants in fifteen lawsuits filed in various jurisdictions. Eleven of those lawsuits concern “market timing,” and they have been transferred to and consolidated for pre-trial proceedings in a multi-district litigation proceeding in the U.S. District Court for the District of Maryland; the other four lawsuits concern “revenue sharing” and have been consolidated into a single action in the U.S. District Court for the District of Connecticut. The lawsuits have been commenced as putative class actions on behalf of investors who purchased, held or redeemed shares of the various series of the PIMCO Funds and the Allianz Funds during specified periods, or as derivative actions on behalf of the PIMCO Funds and Allianz Funds.
The market timing actions in the District of Maryland generally allege that certain hedge funds were allowed to engage in “market timing” in certain of the PIMCO Funds and the Allianz Funds and this alleged activity was not disclosed. Pursuant to tolling agreements entered into with the derivative and class action plaintiffs, PIMCO, the Trustees, and certain employees of PIMCO who were previously named as defendants have all been dropped as defendants in the market timing actions; the plaintiffs continue to assert claims on behalf of the shareholders of the PIMCO Funds or on behalf of the PIMCO Funds themselves against other defendants. By order dated November 3, 2005, the U.S. District Court for the District of Maryland granted the PIMCO Funds’ motion to dismiss claims asserted against it in a consolidated amended complaint where the PIMCO Funds were named, in the complaint, as a nominal defendant. The revenue sharing action in the District of Connecticut generally alleges that fund assets were inappropriately used to pay brokers to promote the PIMCO Funds and Allianz Funds, including directing fund brokerage transactions to such brokers, and that such alleged arrangements were not fully disclosed to shareholders. On August 11, 2005 the U.S. District Court for the District of Connecticut conducted a hearing on defendants’ motion to dismiss the consolidated amended complaint in the revenue sharing action but has not yet ruled on the motion to dismiss. The market timing and revenue sharing lawsuits seek, among other things, unspecified compensatory damages plus interest and, in some cases, punitive damages, the rescission of investment advisory contracts, the return of fees paid under those contracts and restitution.
Under Section 9(a) of the Investment Company Act of 1940, as amended (“1940 Act”), if the New Jersey Settlement or any of the lawsuits described above were to result in a court injunction against AGI, PEA, AGID and/or their affiliates, PIMCO could, in the absence of exemptive relief granted by the SEC, be barred from serving as an investment adviser, and AGID could be barred from serving as principal underwriter, to any registered investment company, including the
| | | | | | |
| | | Semiannual Report | | June 30, 2006 | | 19 |
Notes to Financial Statements (Cont.)
Portfolios of the Trust. In connection with an inquiry from the SEC concerning the status of the New Jersey Settlement under Section 9(a), PEA, AGID, AGI and certain of their affiliates (including PIMCO) (together, the “Applicants”) have sought exemptive relief from the SEC under Section 9(c) of the 1940 Act. The SEC has granted the Applicants a temporary exemption from the provisions of Section 9(a) with respect to the New Jersey Settlement until the earlier of (i) September 13, 2006 and (ii) the date on which the SEC takes final action on their application for a permanent order. There is no assurance that the SEC will issue a permanent order.
Two nearly identical class action civil complaints have been filed in August 2005, in the Northern District of Illinois Eastern Division alleging that the plaintiffs each purchased and sold a 10-year Treasury note futures contract and suffered damages from an alleged shortage when PIMCO held both physical and futures positions in 10-year Treasury notes for its client accounts. The two actions have been consolidated into one action, and the two separate complaints have been replaced by a consolidated complaint. PIMCO is a named defendant, and the PIMCO Funds have been added as a defendant, to the consolidated action. PIMCO strongly believes the complaint (and any consolidated complaint filed hereafter) is without merit and intends to vigorously defend itself.
Certain Portfolios of the Trust were recently served in an adversary proceeding brought by the Official Committee of Asbestos Claimants of G-I Holdings, Inc. in G-I Holdings, Inc.’s bankruptcy in the District of New Jersey. PIMCO was previously named in this lawsuit and remains a defendant. The plaintiff seeks to recover for the bankruptcy estate assets that were transferred by the predecessor entity of G-I Holdings, Inc. to a wholly-owned subsidiary in 1994. The subsidiary has since issued notes, of which certain Portfolios of the Trust are alleged to be holders. The complaint alleges that in 2000, more than two hundred noteholders—including certain Portfolios of the Trust—were granted a second priority lien on the assets of the subsidiary in exchange for their consent to a refinancing transaction and the granting of a first priority lien to the lending banks. The plaintiff is seeking invalidation of the lien in favor of the noteholders and/or the value of the lien.
It is possible that these matters and/or other developments resulting from these matters could result in increased fund redemptions or other adverse consequences to the Portfolios. However, PIMCO and AGID believe that these matters are not likely to have a material adverse effect on the Portfolios or on PIMCO’s or AGID’s ability to perform their respective investment advisory or distribution services relating to the Portfolios.
| | | | |
| 20 | | PIMCO Variable Insurance Trust | | |
Investment Adviser and Administrator
Pacific Investment Management Company LLC
840 Newport Center Drive
Newport Beach, California 92660
Distributor
Allianz Global Investors Distributors LLC
2187 Atlantic Street
Stamford, Connecticut 06902
Custodian
State Street Bank & Trust Company
801 Pennsylvania
Kansas City, Missouri 64105
Transfer Agent
Boston Financial Data Services–Midwest
330 W. 9th Street
Kansas City, Missouri 64105
Legal Counsel
Dechert LLP
1775 I Street, N.W.
Washington, D.C. 20006
Independent Registered Public Accounting Firm
PricewaterhouseCoopers LLP
1055 Broadway
Kansas City, Missouri 64105
P I M C O

Share Class Administrative
Semiannual Report June 30, 2006
PIMCO Variable Insurance Trust
RealEstateRealReturn Strategy Portfolio
Table of Contents
This material is authorized for use only when preceded or accompanied by the current PIMCO Variable Insurance Trust (the “Trust”) prospectus. Investors should consider the investment objectives, risks, charges and expenses of this Trust carefully before investing. Ask your financial professional to explain all charges that may apply. This and other information is contained in the Trust’s prospectus. The variable product prospectus may be obtained by contacting your Investment Consultant. Please read the Trust and variable product prospectus carefully before you invest or send money.
Chairman’s Letter
Dear PIMCO Variable Insurance Trust Shareholder:
It is our pleasure to present to you the semiannual report for the PIMCO Variable Insurance Trust covering the six-month period ended June 30, 2006.
Highlights of the global bond markets during the six-month period included:
| | n | | Most fixed-income sectors lost ground during the first half of 2006, as concern about accelerating inflation and central bank tightening pushed interest rates higher worldwide. The benchmark Lehman Brothers Aggregate Bond Index (which includes Treasury, Investment-Grade Corporate, and Residential Mortgage-Backed Securities) returned -0.72% for the first six months of the year. On June 30, the benchmark ten-year Treasury yielded 5.14%, 0.75% higher than at the start of the year. The U.S. yield curve remained flat as shorter-maturity yields rose by a comparable amount. |
| | n | | The Federal Reserve tightened four times during the reporting period, bringing the Federal Funds Rate to 5.25%. The increase near the end of the period was the Federal Reserve’s 17th consecutive rate hike since the start of its tightening cycle in 2004. The Federal Reserve was not alone, as central banks in Europe, India, and China tightened credit in unison for the first time since 2000. The Bank of Japan, whose zero-interest-rate policy has flooded global markets with liquidity, looked set to reverse this policy in the coming months. |
In these pages please find a more complete Portfolio review as it relates to financial-market activities, as well as details about total-return investment performance for the six-month reporting period. Thank you for the trust you have placed in us. We will continue to work diligently to meet your investment needs.
Sincerely,
Brent R. Harris
Chairman, PIMCO Variable Insurance Trust
July 31, 2006
| | | | | | |
| | | Semiannual Report | | June 30, 2006 | | 1 |
Important Information About the Portfolio
PIMCO Variable Insurance Trust (the “Trust”) is an open-end management investment company currently consisting of nineteen separate investment portfolios, including the RealEstateRealReturn Strategy Portfolio (the “Portfolio”). The Portfolio is only available as a funding vehicle under variable life insurance policies or variable annuity contracts issued by insurance companies (“Variable Contracts”). Individuals may not purchase shares of the Portfolio directly. Shares of the Portfolio also may be sold to qualified pension and retirement plans outside of the separate account context.
We believe that bond funds have an important role to play in a well diversified investment portfolio. It is important to note, however, that in an environment where interest rates may trend upward, rising rates would negatively impact the performance of most bond funds, and fixed-income securities held by a fund are likely to decrease in value. The price volatility of fixed-income securities can also increase during periods of rising interest rates resulting in increased losses to a fund. Bond funds and individual bonds with a longer duration (a measure of the expected life of a security) tend to be more sensitive to changes in interest rates, usually making them more volatile than securities or funds with shorter durations. The longer-term performance of most bond funds has benefited from capital gains in part resulting from an extended period of declining interest rates. In the event interest rates increase, these capital gains should not be expected to recur.
The Portfolio may be subject to various risks in addition to those described above. Some of these risks may include, but are not limited to, the following: credit risk, high yield risk, market risk, issuer risk, liquidity risk, derivatives risk, mortgage risk, non-U.S. investment risk, real estate risk, currency risk, issuer non-diversification risk, leveraging risk and management risk. A complete description of these risks is contained in the Portfolio’s prospectus. The Portfolio may use derivative instruments for hedging purposes or as part of an investment strategy. Use of these instruments may involve certain costs and risks such as liquidity risk, interest rate risk, market risk, credit risk, management risk and the risk that the Portfolio could not close out a position when it would be most advantageous to do so. A Portfolio investing in derivatives could lose more than the principal amount invested in these instruments. Investing in non-U.S. securities may entail risk due to non-U.S. economic and political developments.
On the performance summary page in this Semiannual Report, the Total Return Investment Performance table measures performance assuming that all dividend and capital gain distributions were reinvested.
An investment in the Portfolio is not a deposit of a bank and is not guaranteed or insured by the Federal Deposit Insurance Corporation or any other government agency. It is possible to lose money on investments in the Portfolio.
PIMCO has adopted written proxy voting policies and procedures (“Proxy Policy”) as required by Rule 206(4)-6 under the Investment Advisers Act of 1940. The Proxy Policy has been adopted by the Trust as the policies and procedures that PIMCO will use when voting proxies on behalf of the Portfolio. Copies of the written Proxy Policy and the factors that PIMCO may consider in determining how to vote proxies for the Portfolio, and information about how the Portfolio voted proxies relating to portfolio securities held during the most recent twelve-month period ended June 30, are available without charge, upon request, by calling the Trust at 1-866-746-2606 and on the Securities and Exchange Commission’s (“SEC”) website at http://www.sec.gov.
The Portfolio files its complete schedule of portfolio holdings with the SEC for the first and third quarters of each fiscal year on Form N-Q. A copy of the Trust’s Form N-Q is available on the SEC’s website at http://www.sec.gov and may be reviewed and copied at the SEC’s Public Reference Room in Washington D.C. Information on the operation of the Public Reference Room may be obtained by calling 1-800-SEC-0330.
PIMCO Variable Insurance Trust is distributed by Allianz Global Investors Distributors LLC, 2187 Atlantic Street, Stamford, CT 06902.
| | | | |
| 2 | | PIMCO Variable Insurance Trust | | |
The following disclosure provides important information regarding the Portfolio’s Expense Example (“Example” or “Expense Example”), which appears in this Semiannual Report. Please refer to this information when reviewing the Expense Example for the Portfolio.
Example
As a shareholder of the Portfolio, you incur two types of costs: (1) transaction costs and (2) ongoing costs, including advisory and administrative fees; distribution and/or service (12b-1) fees (Administrative Class only); and other Portfolio expenses. The Example is intended to help you understand your ongoing costs (in dollars) of investing in the Portfolio and to compare these costs with the ongoing costs of investing in other mutual funds. The Expense Example does not reflect any fees or other expenses imposed by the Variable Contracts. If it did, the expenses reflected in the Expense Examples would be higher. The Example is based on an investment of $1,000 invested at the beginning of the period and held for the entire period indicated, which is from January 1, 2006 to June 30, 2006.
Actual Expenses
The information in the table under the heading “Actual Performance” provides information about actual account values and actual expenses. You may use the information in these columns, together with the amount you invested, to estimate the expenses that you paid over the period. Simply divide your account value by $1,000 (for example, an $8,600 account value divided by $1,000 = 8.60), then multiply the result by the number in the appropriate column for your share class, in the row titled “Expenses Paid During Period” to estimate the expenses you paid on your account during this period.
Hypothetical Example for Comparison Purposes
The information in the table under the heading “Hypothetical Performance (5% return before expenses)” provides information about hypothetical account values and hypothetical expenses based on the Portfolio’s actual expense ratio and an assumed rate of return of 5% per year before expenses, which is not the Portfolio’s actual return. The hypothetical account values and expenses may not be used to estimate the actual ending account balance or expenses you paid for the period. You may use this information to compare the ongoing costs of investing in the Portfolio and other portfolios. To do so, compare this 5% hypothetical example with the 5% hypothetical examples that appear in the shareholder reports of the other portfolios.
Please note that the expenses shown in the table are meant to highlight your ongoing costs only and do not reflect any transactional costs. Therefore, the information under the heading “Hypothetical Performance (5% return before expenses)” is useful in comparing ongoing costs only, and will not help you determine the relative total costs of owning different portfolios. In addition, if these transactional costs were included, your costs would have been higher.
The expense ratio may vary period to period because of various factors, such as an increase in expenses not covered by the advisory and administrative fees (such as expenses of the trustees and their counsel or litigation expense).
Portfolio Benchmark
Dow Jones Wilshire Real Estate Investment Trust Index, a subset of the Wilshire Real Estate Securities Index (WRESI), is an unmanaged index comprised of US publicly traded Real Estate Investment Trusts. It is not possible to invest in such an unmanaged index.
| | | | | | |
| | | Semiannual Report | | June 30, 2006 | | 3 |
| | | | |
| | |
| PIMCO RealEstateRealReturn Strategy Portfolio | | | | |
| | | | |
Cumulative Returns Through June 30, 2006
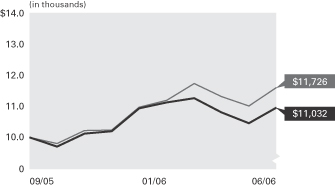
RealEstateRealReturn Dow Jones Wilshire
Strategy Portfolio Real Estate Investment
Administrative Class Trust Index
-------------------- -----------------------
09/30/2005 $10,000 $10,000
10/31/2005 9,680 9,785
11/30/2005 10,130 10,239
12/31/2005 10,210 10,250
01/31/2006 11,010 11,048
02/28/2006 11,210 11,286
03/31/2006 11,364 11,868
04/30/2006 10,870 11,417
05/31/2006 10,488 11,087
06/30/2006 11,032 11,726
$10,000 invested at the beginning of the first full month following the inception date of the Portfolio’s Administrative Class.
Sector Breakdown‡
| | |
U.S. Treasury Obligations# | | 50.8% |
Short-Term Instruments# | | 49.2% |
| | ‡ | % of Total Investments as of June 30, 2006 |
| | # | Primarily serving as collateral for real estate-linked derivative positions |
| | | | | | | | |
| Average Annual Total Return for the period ended June 30, 2006 |
| | | | | | | 6 Months* | | Since
Inception
(09/30/05) |
| | |
| | PIMCO RealEstateRealReturn Strategy Portfolio Administrative Class | | 8.05% | | 10.32% |
| | |
| | Dow Jones Wilshire Real Estate Investment Trust Index | | 14.40% | | 17.26% |
All Portfolio returns are net of fees and expenses.
* Cumulative return.
Past performance is no guarantee of future results. The performance quoted represents past performance. Investment return and principal value will fluctuate so the Portfolio shares, when redeemed, may be worth more or less than their original cost. The Portfolio’s performance does not reflect the deduction of additional charges and expenses imposed in connection with investing in Variable Contracts, which will reduce returns. Current performance may be lower or higher than the performance data quoted. Performance data current to the most recent month-end is available by calling (800) 927-4648.
| | | | | | | | | | |
| Expense Example | | | | Actual Performance | | | | Hypothetical Performance |
| | | | | | | | | (5% return before expenses) |
Beginning Account Value (01/01/06) | | | | $ | 1,000.00 | | | | $ | 1,000.00 |
Ending Account Value (06/30/06) | | | | $ | 1,080.50 | | | | $ | 1,020.33 |
Expenses Paid During Period† | | | | $ | 4.64 | | | | $ | 4.51 |
† Expenses are equal to the Portfolio’s Administrative Class annualized expense ratio of 0.89%, multiplied by the average account value over the period, multiplied by 181/365 (to reflect the period since the Portfolio’s Administrative Class shares commenced operations on 09/30/05). Overall fees and expenses of investing in the Portfolio will be higher because the example does not reflect Variable Contract fees and expenses.
Please refer to page 3 herein for a description of the Portfolio’s benchmark and an explanation of the information presented in the following Expense Example.
Portfolio Insights
| » | | The PIMCO RealEstateRealReturn Strategy Portfolio seeks to achieve its investment objective by investing under normal circumstances in real estate-linked derivative instruments backed by a portfolio of inflation-indexed securities and other Fixed-Income Instruments. |
| » | | The Portfolio invested the collateral backing its Real Estate Investment Trusts (“REITs”) derivatives positions primarily in Treasury Inflation-Protected Securities (“TIPS”), implementing a “double real®” strategy. For the six-month period ending June 30, 2006, this was negative for performance, as TIPS underperformed the financing and transaction costs associated with gaining index exposure. This is attributable to short-term instruments such as LIBOR outperforming instruments with longer duration such as TIPS. |
| » | | The Portfolio’s above benchmark duration for most of the period detracted from overall performance, as real yields rose on strong U.S. economic growth. The effective duration of the Fund was 7.62 years on June 30, 2006 compared to a duration of 7.68 years for the benchmark. |
| » | | Exposure to short maturity U.S. nominal bonds for the period detracted significantly from performance due to a substantial flattening of the nominal yield curve. |
| » | | Currency exposure added to performance resulting from a depreciation of the U.S. dollar relative to the Euro and Japanese Yen. |
| | | | |
| 4 | | PIMCO Variable Insurance Trust | | |
|
|
| Financial Highlights RealEstateRealReturn Strategy Portfolio |
| | | | | | |
| Selected Per Share Data for the Period Ended: | | 06/30/2006+ | | | 09/30/2005-12/31/2005 | |
| | |
Administrative Class | | | | | | |
| Net asset value beginning of period | | $ 10.21 | | | $ 10.00 | |
| Net investment income (a) | | 0.19 | | | 0.19 | |
| Net realized/unrealized gain on investments (a) | | 0.63 | | | 0.02 | |
| Total income from investment operations | | 0.82 | | | 0.21 | |
| Dividends from net investment income | | (0.22 | ) | | 0.00 | |
| Total distributions | | (0.22 | ) | | 0.00 | |
| Net asset value end of period | | $ 10.81 | | | $ 10.21 | |
| Total return | | 8.05 | % | | 2.10 | % |
| Net assets end of period (000s) | | $ 3,309 | | | $ 3,062 | |
| Ratio of expenses to average net assets | | 0.90 | %*(c) | | 0.89 | %*(b) |
| Ratio of net investment income to average net assets | | 3.52 | %* | | 7.78 | %* |
| Portfolio turnover rate | | 703 | % | | 163 | % |
+ Unaudited
* Annualized
(a) Per share amounts based on average number of shares outstanding during the period.
(b) If the investment manager had not reimbursed expenses, the ratio of expenses to average net assets would have been 3.83%.
(c) Ratio of expenses to average net assets excluding interest expense is 0.89%.
| | | | | | |
| See Accompanying Notes | | Semiannual Report | | June 30, 2006 | | 5 |
|
|
| Statement of Assets and Liabilities RealEstateRealReturn Strategy Portfolio |
| | | | |
| (Amounts in thousands, except per share amounts) | | June 30, 2006
(Unaudited) | |
| |
Assets: | | | | |
Investments, at value | | $ | 5,129 | |
Repurchase agreement, at value | | | 1,230 | |
Receivable for investments sold on delayed-delivery basis | | | 254 | |
Interest and dividends receivable | | | 3 | |
Variation margin receivable | | | 1 | |
Swap premiums paid | | | 4 | |
Unrealized appreciation on swap agreements | | | 173 | |
| | | | 6,794 | |
| |
Liabilities: | | | | |
Payable for investments purchased on delayed-delivery basis | | $ | 3,460 | |
Written options outstanding | | | 1 | |
Accrued investment advisory fee | | | 1 | |
Accrued administration fee | | | 1 | |
Variation margin payable | | | 2 | |
Unrealized depreciation on forward foreign currency contracts | | | 11 | |
Other liabilities | | | 9 | |
| | | | 3,485 | |
| |
Net Assets | | $ | 3,309 | |
| |
Net Assets Consist of: | | | | |
Paid in capital | | $ | 3,064 | |
Undistributed net investment income | | | 99 | |
Accumulated undistributed net realized (loss) | | | (36 | ) |
Net unrealized appreciation | | | 182 | |
| | | $ | 3,309 | |
| |
Net Assets: | | | | |
Administrative Class | | $ | 3,309 | |
| |
Shares Issued and Outstanding: | | | | |
Administrative Class | | | 306 | |
| |
Net Asset Value and Redemption Price Per Share (Net Assets Per Share Outstanding) | | | | |
Administrative Class | | $ | 10.81 | |
| |
Cost of Investments Owned | | $ | 5,084 | |
Cost of Repurchase Agreements Owned | | $ | 1,230 | |
Premiums Received on Written Options | | $ | 1 | |
| | | | |
| 6 | | PIMCO Variable Insurance Trust | | See Accompanying Notes |
|
|
| Statement of Operations RealEstateRealReturn Strategy Portfolio |
| | | | |
| (Amounts in Thousands) | | Six Months Ended
June 30, 2006
(Unaudited) | |
| |
Investment Income: | | | | |
Interest | | $ | 71 | |
Total Income | | | 71 | |
| |
Expenses: | | | | |
Investment advisory fees | | | 8 | |
Administration fees | | | 4 | |
Servicing fees – Administrative Class | | | 2 | |
Total Expenses | | | 14 | |
| |
Net Investment Income | | | 57 | |
| |
Net Realized and Unrealized Gain (Loss): | | | | |
Net realized (loss) on investments | | | (154 | ) |
Net realized gain on futures contracts, options and swaps | | | 185 | |
Net realized (loss) on foreign currency transactions | | | (4 | ) |
Net change in unrealized (depreciation) on investments | | | (16 | ) |
Net change in unrealized appreciation on futures contracts, options and swaps | | | 170 | |
Net change in unrealized appreciation on translation of assets and liabilities denominated in foreign currencies | | | 10 | |
Net Gain | | | 191 | |
| |
Net Increase in Net Assets Resulting from Operations | | $ | 248 | |
| | | | | | |
| See Accompanying Notes | | Semiannual Report | | June 30, 2006 | | 7 |
|
|
| Statements of Changes in Net Assets RealEstateRealReturn Strategy Portfolio |
| | | | | | |
| (Amounts in Thousands) | | Six Months Ended
June 30, 2006
(Unaudited) | | | Period from
September 30, 2005 to
December 31, 2005 | |
| | |
Increase (Decrease) in Net Assets from: | | | | | | |
| | |
Operations: | | | | | | |
Net investment income | | $ 57 | | | $ 56 | |
Net realized gain (loss) | | 27 | | | (13 | ) |
Net change in unrealized appreciation | | 164 | | | 19 | |
Net increase resulting from operations | | 248 | | | 62 | |
| | |
Distributions to Shareholders: | | | | | | |
| From net investment income | | | | | | |
Administrative Class | | (65 | ) | | 0 | |
| | |
Total Distributions | | (65 | ) | | 0 | |
| | |
Portfolio Share Transactions: | | | | | | |
| Receipts for shares sold | | | | | | |
Administrative Class | | 0 | | | 3,000 | |
| Issued as reinvestment of distributions | | | | | | |
Administrative Class | | 64 | | | 0 | |
Net increase resulting from Portfolio share transactions | | 64 | | | 3,000 | |
| | |
Total Increase in Net Assets | | 247 | | | 3,062 | |
| | |
Net Assets: | | | | | | |
Beginning of period | | 3,062 | | | 0 | |
End of period * | | $ 3,309 | | | $ 3,062 | |
| | |
*Including undistributed net investment income of: | | $ 99 | | | $ 107 | |
| | | | |
| 8 | | PIMCO Variable Insurance Trust | | See Accompanying Notes |
| | |
| |
| Schedule of Investments RealEstateRealReturn Strategy Portfolio | | June 30, 2006 (Unaudited) |
| | | | | | | | |
| | | | | PRINCIPAL | | | | |
| | | | | AMOUNT | | | | VALUE |
| | | | | (000S) | | | | (000S) |
| |
| U.S. TREASURY OBLIGATIONS 97.6% |
| Treasury Inflation Protected Securities (a) |
3.500% due 01/15/2011 | | $ | | 116 | | $ | | 122 |
3.000% due 07/15/2012 | | | | 450 | | | | 464 |
1.875% due 07/15/2015 | | | | 1,217 | | | | 1,155 |
2.375% due 01/15/2025 | | | | 1,288 | | | | 1,254 |
2.000% due 01/15/2026 | | | | 255 | | | | 233 |
| | | | | | | | |
|
Total U.S. Treasury Obligations (Cost $3,203) | | 3,228 |
| | | | | | | | |
|
| | | | | | | |
| | | | | NOTIONAL
AMOUNT
(000S) | | | | |
| PURCHASED PUT OPTIONS 0.0% |
| Treasury Inflation Protected Security (OTC) |
1.875% due 07/15/2015 | | | | | | | | |
Strike @ $71.000
Exp. 07/24/2006 | | | | 2,000 | | | | 0 |
|
| | | | | | | |
| | | | | # OF
CONTRACTS | | | | |
| 90-Day Eurodollar September Futures (CME) |
Strike @ $90.500
Exp. 09/17/2007 | | | | 8 | | | | 0 |
|
| U.S. Treasury 10-Year Note September Futures (CBOT) |
6.000% due 09/20/2006 | | | | | | | | |
Strike @ $101.000
Exp. 08/25/2006 | | | | 4 | | | | 0 |
| | | | | | | | |
|
Total Purchased Put Options (Cost $1) | | 0 |
| | | | | | | | |
|
| | | | | | | |
| | | | | PRINCIPAL
AMOUNT
(000S) | | | | |
| SHORT-TERM INSTRUMENTS (f) 94.6% |
| |
| COMMERCIAL PAPER 39.1% |
| Fannie Mae | | | | | | | | |
5.190% due 08/04/2006 | | $ | | 500 | | | | 498 |
|
| Federal Home Loan Bank | | | | | | | | |
4.986% due 07/26/2006 | | | | 400 | | | | 399 |
|
| Freddie Mac | | | | | | | | |
5.253% due 09/05/2006 | | | | 400 | | | | 396 |
| | | | | | | | |
|
| | | | | | | | | 1,293 |
| | | | | | | | |
|
| | | | | | | |
| |
| FRANCE TREASURY BILLS 16.7% |
2.701% due 07/13/2006 -09/28/2006 (b) | | EUR | | 435 | | | | 553 |
| | | | | | | | |
|
| |
| | | | | | | | |
| REPURCHASE AGREEMENTS 37.2% |
| Credit Suisse First Boston |
4.580% due 07/03/2006 | | $ | | 800 | | $ | | 800 |
(Dated 06/30/2006. Collateralized by U.S. Treasury Notes 4.000% due 06/15/2009 valued at $822. Repurchase proceeds are $800.) |
|
| State Street Bank |
4.900% due 07/03/2006 | | | | 430 | | | | 430 |
(Dated 06/30/2006. Collateralized by Federal Home Loan Bank 3.750% due 07/02/2023 valued at $439. Repurchase proceeds are $430.) |
| | | | | | | | |
|
| | | | | | | | | 1,230 |
| | | | | | | | |
|
| |
| |
| U.S. TREASURY BILLS 1.6% |
4.783% due 08/31/2006 -09/14/2006 (b)(c) | | | | 55 | | | | 55 |
| | | | | | | | |
|
Total Short-Term Instruments
(Cost $3,110) | | 3,131 |
| | | | | | | | |
|
| |
Total Investments 192.2%
(Cost $6,314) | | $ | | 6,359 |
| |
Written Options (e) (0.0%)
(Premiums $1) | | (1) |
| |
| Other Assets and Liabilities (Net) (92.2%) | | (3,049) |
| | | | | | | | |
|
| Net Assets 100.0% | | | | | | $ | | 3,309 |
| | | | | | | | |
|
| | | | | | |
| See Accompanying Notes | | Semiannual Report | | June 30, 2006 | | 9 |
Schedule of Investments RealEstateRealReturn Strategy Portfolio (Cont.)
|
Notes to Schedule of Investments (amounts in thousands, except number of contracts): |
(a) Principal amount of security is adjusted for inflation. |
| |
(b) Securities are grouped by coupon or range of coupons and represent a range of maturities. |
| |
(c) Securities with an aggregate market value of $55 have been segregated with the custodian to cover margin requirements for the following open futures contracts on June 30, 2006: |
| | | | | | | | | | |
| Description | | Type | | Expiration
Month | | # of
Contracts | | Unrealized
Appreciation/
(Depreciation) | |
90-Day Eurodollar December Futures | | Long | | 12/2006 | | 2 | | $ | (4 | ) |
90-Day Eurodollar June Futures | | Long | | 06/2007 | | 2 | | | (4 | ) |
90-Day Eurodollar March Futures | | Long | | 03/2007 | | 2 | | | (4 | ) |
90-Day Eurodollar September Futures | | Long | | 09/2007 | | 2 | | | (4 | ) |
U.S. Treasury 30-Year Bond September Futures | | Short | | 09/2006 | | 4 | | | 1 | |
| | | | | | | | |
|
|
|
| | | | | | | | | $ | (15 | ) |
| | | | | | | | |
|
|
|
| | | | | | | | | | | | | | |
(d) Swap agreements outstanding on June 30, 2006: | | | | | | |
| Interest Rate Swaps |
| Counterparty | | Floating Rate Index | | Pay/Receive
Floating Rate | | Fixed Rate | | Expiration
Date | | Notional
Amount | | Unrealized
Appreciation |
Morgan Stanley Dean Witter & Co. | | 3-month USD-LIBOR | | Receive | | 5.000% | | 12/20/2016 | | $ | 100,000 | | $ | 1 |
| | | | | | | | | | | | | |
|
|
| | | | | | |
| Total Return Swaps | | | | | | | | | | | | | | |
| Counterparty | | Receive Total Return | | Pay | | | | Expiration
Date | | # of
Contracts | | Unrealized
Appreciation |
Credit Suisse First Boston | | Wilshire REIT Total Return Index | | 1-month USD-LIBOR plus 0.350% | | 07/31/2006 | | | 1 | | $ | 172 |
| | | | | | | | | | | | | |
|
|
| | | | | | | | | | | | | |
(e) Written options outstanding on June 30, 2006: |
| Options on Exchange-Traded Futures Contracts |
| Description | | Exercise
Price | | Expiration
Date | | # of
Contracts | | Premium | | Value |
Call - CBOT U.S. Treasury 10-Year Note September Futures | | $ | 108.000 | | 08/25/2006 | | 1 | | $ | 0 | | $ | 0 |
Call - CBOT U.S. Treasury 10-Year Note September Futures | | | 107.000 | | 08/25/2006 | | 3 | | | 0 | | | 0 |
Put - CBOT U.S. Treasury 10-Year Note September Futures | | | 103.000 | | 08/25/2006 | | 4 | | | 1 | | | 1 |
| | | | | | | | | |
|
| |
|
|
| | | | | | | | | | $ | 1 | | $ | 1 |
| | | | | | | | | |
|
| |
|
|
| | | | | | | | | | | | | | | | | |
(f) Forward foreign currency contracts outstanding on June 30, 2006: | | | | | |
| Type | | | | Principal
Amount
Covered by
Contract | | Settlement
Month | | Unrealized
Appreciation | | Unrealized
(Depreciation) | | | Net
Unrealized
Appreciation/
(Depreciation) | |
Sell | | CHF | | 1 | | 09/2006 | | $ | 0 | | $ | 0 | | | $ | 0 | |
Buy | | EUR | | 16 | | 07/2006 | | | 0 | | | 0 | | | | 0 | |
Sell | | | | 415 | | 08/2006 | | | 0 | | | (9 | ) | | | (9 | ) |
Buy | | JPY | | 10,495 | | 08/2006 | | | 0 | | | (2 | ) | | | (2 | ) |
| | | | | | | | |
|
| |
|
|
| |
|
|
|
| | | | | | | | | $ | 0 | | $ | (11 | ) | | $ | (11 | ) |
| | | | | | | | |
|
| |
|
|
| |
|
|
|
| | | | |
| 10 | | PIMCO Variable Insurance Trust | | See Accompanying Notes |
| | |
| |
| Notes to Financial Statements | | June 30, 2006 (Unaudited) |
1. ORGANIZATION
The RealEstateRealReturn Strategy Portfolio (the “Portfolio”) is a series of the PIMCO Variable Insurance Trust (the “Trust”). The Trust is registered under the Investment Company Act of 1940 (the “Act”), as amended, as an open-end investment management company organized as a Delaware business trust on October 3, 1997. The Portfolio offers one class of shares: Administrative. Information presented in these financial statements pertains to the Administrative Class of the Portfolio. The Trust is designed to be used as an investment vehicle by Separate Accounts of insurance companies that fund variable annuity contracts and variable life insurance policies and by qualified pension and retirement plans.
2. SIGNIFICANT ACCOUNTING POLICIES
The following is a summary of significant accounting policies consistently followed by the Portfolio in the preparation of its financial statements in conformity with accounting principles generally accepted in the United States of America (“GAAP”). The preparation of financial statements in accordance with GAAP requires management to make estimates and assumptions that affect the reported amounts and disclosures in the financial statements. Actual results could differ from those estimates.
Security Valuation. Portfolio securities are valued as of the close of regular trading (normally 4:00 p.m., Eastern Time) on each day that the New York Stock Exchange (“NYSE”) is open. Portfolio securities and other assets for which market quotes are readily available are stated at market value. Market value is generally determined on the basis of last reported sales prices, or if no sales are reported, based on quotes obtained from a quotation reporting system, established market makers, or pricing services. Fixed-income securities and non-exchange traded derivatives are normally valued on the basis of quotes obtained from brokers and dealers or pricing services. Prices obtained from independent pricing services use information provided by market makers or estimates of market values obtained from yield data relating to investments or securities with similar characteristics. Certain fixed-income securities purchased on a delayed-delivery basis are marked to market daily until settlement at the forward settlement date. Short-term investments having a maturity of 60 days or less are generally valued at amortized cost. Exchange traded options, futures and options on futures are valued at the settlement price determined by the relevant exchange.
Investments initially valued in currencies other than the U.S. dollar are converted to the U.S. dollar using exchange rates obtained from pricing services. As a result, the NAV of the Portfolio’s shares may be affected by changes in the value of currencies in relation to the U.S. dollar. The value of securities traded in markets outside the United States or denominated in currencies other than the U.S. dollar may be affected significantly on a day that the NYSE is closed and an investor is not able to purchase, redeem or exchange shares.
Securities and other assets for which market quotes are not readily available are valued at fair value as determined in good faith by the Board of Trustees or persons acting at their direction. The Board of Trustees has adopted methods for valuing securities and other assets in circumstances where market quotes are not readily available, and has delegated to Pacific Investment Management Company LLC (“PIMCO”) the responsibility for applying the valuation methods. In the event that market quotes are not readily available, and the security or asset cannot be valued pursuant to one of the valuation methods, the value of the security or asset will be determined in good faith by the Valuation Committee of the Board of Trustees, generally based upon recommendations provided by PIMCO.
Market quotes are considered not readily available in circumstances where there is an absence of current or reliable market-based data (e.g., trade information, bid/asked information, broker quotes), including where events occur after the close of the relevant market, but prior to the close of regular trading, that materially affect the values of the Portfolio’s securities or assets. In addition, market quotes are considered not readily available when, due to extraordinary circumstances, the exchanges or markets on which the securities trade do not open for trading for the entire day and no other market prices are available. The Board has delegated to PIMCO the responsibility for monitoring significant events that may materially affect the values of the Portfolio’s securities or assets and for determining whether the value of the applicable securities or assets should be re-evaluated in light of such significant events when the Portfolio uses fair value pricing to determine its NAV, securities will not be priced on the basis of quotations from the primary market in which they are traded, but rather may be priced by another method that the Board of Trustees or persons acting at their direction believe accurately reflects fair value. The Trust’s policy is intended to result in a calculation of the Portfolio’s NAV that fairly reflects security values as of the time of pricing. However, fair values determined by the Board of Trustees or persons acting at their direction may not accurately reflect the price that the Portfolio could obtain for a security if it were to dispose of that security as of the time of pricing. Because foreign securities can trade on non-business days, the NAV of the Portfolio may change on days when shareholders will not be able to purchase or redeem shares. The prices used by the Portfolio may differ from the value that would be realized if the securities were sold and the differences could be material to the financial statements.
Securities Transactions and Investment Income. Securities transactions are recorded as of the trade date. Securities purchased or sold on a when-issued or delayed-delivery basis may be settled a month or more after the trade date. Realized gains and losses from securities sold are recorded on the identified cost basis. Dividend income is recorded on the ex-dividend date, except certain dividends from foreign securities where the ex-dividend date may have passed, which are recorded as soon as the Portfolio is informed of the ex-dividend date. Interest income, adjusted for the accretion of discounts and amortization of premiums, is recorded on the accrual basis. Paydown gains and losses on mortgage-related or asset-backed securities are recorded as components of interest income in the Statement of Operations.
Dividends and Distributions to Shareholders. Dividends from net investment income, if any, are declared and distributed to shareholders quarterly. Net realized capital gains earned by the Portfolio, if any, will be distributed no less frequently than once each year. Most shareholders choose to reinvest their dividends and capital gain distribution in additional shares of the Portfolio.
Income dividends and capital gain distributions are determined in accordance with income tax regulations which may differ from GAAP. Differences between tax regulations and GAAP may change the fiscal year when income and capital items are recognized for tax and GAAP purposes. Examples of events that give rise to timing differences include wash sales, straddles, net operating losses and capital loss carryforwards. Further, the character of investment income and capital gains may be different for certain transactions under the two methods of accounting. Examples of characterization differences include the treatment of mortgage paydowns, swaps, foreign currency transactions and contingent debt instruments. As a result, income dividends and capital gain distributions declared during a fiscal period may differ significantly from the net investment income and realized capital gain reported in the Portfolio’s annual financial statements presented under GAAP.
Distributions classified as a tax basis return of capital, if any, are reflected in the accompanying Statements of Changes in Net Assets and have been reclassified to paid in capital. In addition, other amounts have been reclassified between undistributed net investment income, accumulated undistributed net realized gains or losses and/or paid in capital to more appropriately conform financial accounting to tax characterizations of dividend distributions.
| | | | | | |
| | | Semiannual Report | | June 30, 2006 | | 11 |
Notes to Financial Statements (Cont.)
Delayed-Delivery Transactions. The Portfolio may purchase or sell securities on a when-issued or delayed-delivery basis. These transactions involve a commitment by the Portfolio to purchase or sell securities for a predetermined price or yield, with payment and delivery taking place beyond the customary settlement period. When delayed-delivery purchases are outstanding, the Portfolio will designate liquid assets in an amount sufficient to meet the purchase price. When purchasing a security on a delayed-delivery basis, the Portfolio assumes the rights and risks of ownership of the security, including the risk of price and yield fluctuations, and takes such fluctuations into account when determining its net asset value. The Portfolio may dispose of or renegotiate a delayed-delivery transaction after it is entered into, and may sell when-issued securities before they are delivered, which may result in a capital gain or loss. When the Portfolio has sold a security on a delayed-delivery basis, the Portfolio does not participate in future gains and losses with respect to the security.
Federal Income Taxes. The Portfolio intends to qualify as a regulated investment company under sub-chapter M of the Internal Revenue Code and distribute all of its taxable income and net realized gains, if applicable, to shareholders. Accordingly, no provision for Federal income taxes has been made.
Foreign Currency. The accounting records of the Portfolio are maintained in U.S. dollar. The market values of foreign securities, currency holdings and other assets and liabilities are translated into U.S. dollar based on the current exchange rates each business day. Fluctuations in the value of currency holdings and other assets and liabilities resulting from changes in exchange rates are recorded as unrealized foreign currency gains or losses. Realized gains or losses and unrealized appreciation or depreciation on investment securities and income and expenses are translated on the respective dates of such transactions. The effects of changes in foreign currency exchange rates on investments in securities are not segregated in the Statement of Operations from the effects of changes in market prices of those securities, but are included with the net realized and unrealized gain or loss on investment securities.
| | | | | | |
|
| Non-U.S. currency symbols utilized throughout the report are defined as follows: |
| CHF | | Swiss Franc | | JPY | | Japanese Yen |
| EUR | | Euro | | | | |
Forward Currency Transactions. The Portfolio may enter into forward currency contracts in connection with settling planned purchases or sales of securities, to hedge the currency exposure associated with some or all of the Portfolio’s securities or as a part of an investment strategy. A forward currency contract is an agreement between two parties to buy and sell a currency at a set price on a future date. The market value of a forward currency contract fluctuates with changes in forward currency exchange rates. Forward currency contracts are marked to market daily and the change in value is recorded by the Portfolio as an unrealized gain or loss. Realized gains or losses equal to the difference between the value of the contract at the time it was opened and the value at the time it was closed are recorded upon delivery or receipt of the currency or, if a forward currency contract is offset by entering into another forward currency contract with the same broker, upon settlement of the net gain or loss. These contracts may involve market risk in excess of the unrealized gain or loss reflected in the Portfolio’s Statement of Assets and Liabilities. In addition, the Portfolio could be exposed to risk if the counterparties are unable to meet the terms of the contracts or if the value of the currency changes unfavorably to the U.S. dollar.
Futures Contracts. The Portfolio is authorized to enter into futures contracts. The Portfolio may use futures contracts to manage its exposure to the securities markets or to movements in interest rates and currency values. The primary risks associated with the use of futures contracts are the imperfect correlation between the change in market value of the securities held by the Portfolio and the prices of futures contracts, the possibility of an illiquid market, and the inability of the counterparty to meet the terms of the contract. Futures contracts are valued based upon their quoted daily settlement prices. Upon entering into a futures contract, the Portfolio is required to deposit with its custodian, in a segregated account in the name of the futures broker, an amount of cash or U.S. Government and Agency Obligations in accordance with the initial margin requirements of the broker or exchange. Futures contracts are marked to market daily and an appropriate payable or receivable for the change in value (“variation margin”) is recorded by the Portfolio. Gains or losses are recognized but not considered realized until the contracts expire or are closed. Futures contracts involve, to varying degrees, risk of loss in excess of the variation margin disclosed in the Statement of Assets and Liabilities.
Inflation-Indexed Bonds. The Portfolio may invest in inflation-indexed bonds. Inflation-indexed bonds are fixed-income securities whose principal value is periodically adjusted to the rate of inflation. The interest rate on these bonds is generally fixed at issuance at a rate lower than typical bonds. Over the life of an inflation-indexed bond, however, interest will be paid based on a principal value, which is adjusted for inflation. Any increase in the principal amount of an inflation-indexed bond will be included as interest income in the Statement of Operations, even though investors do not receive their principal until maturity.
Options Contracts. The Portfolio may write call and put options on futures, swaps, securities or currencies it owns or in which it may invest. Writing put options tends to increase the Portfolio’s exposure to the underlying instrument. Writing call options tends to decrease the Portfolio’s exposure to the underlying instrument. When the Portfolio writes a call or put option, an amount equal to the premium received is recorded as a liability and subsequently marked to market to reflect the current value of the option written. These liabilities are reflected as written options outstanding in the Statement of Assets and Liabilities. Certain options may be written with premiums to determined on a future date. The premiums for these options are based upon implied volatility parameters at specified terms. Premiums received from writing options which expire are treated as realized gains. Premiums received from writing options which are exercised or closed are added to the proceeds or offset against amounts paid on the underlying future, swap, security or currency transaction to determine the realized gain or loss. The Portfolio as a writer of an option has no control over whether the underlying future, swap, security or currency may be sold (call) or purchased (put) and as a result bears the market risk of an unfavorable change in the price of the future, swap, security or currency underlying the written option. There is the risk the Portfolio may not be able to enter into a closing transaction because of an illiquid market.
The Portfolio may also purchase put and call options. Purchasing call options tends to increase the Portfolio’s exposure to the underlying instrument. Purchasing put options tends to decrease the Portfolio’s exposure to the underlying instrument. The Portfolio pays a premium which is included in the Portfolio’s Statement of Assets and Liabilities as an investment and subsequently marked to market to reflect the current value of the option. Premiums paid for purchasing options which expire are treated as realized losses. Certain options may be purchased with premiums to be determined on a future date. The premiums for these options are based upon implied volatility parameters at specified terms. The risk associated with purchasing put and call options is limited to the premium paid. Premiums paid for purchasing options which are exercised or closed are added to the amounts paid or offset against the proceeds on the underlying future, swap, security or currency transaction to determine the realized gain or loss.
Repurchase Agreements. The Portfolio may engage in repurchase transactions. Under the terms of a typical repurchase agreement, the Portfolio takes possession
| | | | |
| 12 | | PIMCO Variable Insurance Trust | | |
| | |
| |
| | | June 30, 2006 (Unaudited) |
of an underlying debt obligation subject to an obligation of the seller to repurchase, and the Portfolio to resell, the obligation at an agreed-upon price and time. The underlying securities for all repurchase agreements are held in safekeeping at the Portfolio’s custodian or designated subcustodians under triparty repurchase agreements. The market value of the collateral must be equal to or exceed at all times the total amount of the repurchase obligations, including interest. Securities purchased under repurchase agreements are reflected as an asset in the Statement of Assets and Liabilities. Generally, in the event of counterparty default, the Portfolio has the right to use the collateral to offset losses incurred. If the counterparty should default, the Portfolio will seek to sell the securities which it holds as collateral. This could involve procedural costs or delays in addition to a loss on the securities if their value should fall below their repurchase price.
Swap Agreements. The Portfolio may engage in swap transactions, including, but not limited to, swap agreements on interest rate and total return to manage its exposure to interest rates and credit risk. In connection with these agreements, securities may be identified as collateral in accordance with the terms of the respective swap agreements.
Interest rate swap agreements involve the exchange by the Portfolio with another party of their respective commitments to pay or receive interest, e.g., an exchange of floating rate payments for fixed rate payments with respect to the notional amount of principal.
Total return swap agreements involve commitments to pay interest in exchange for a market-linked return, both based on notional amounts. To the extent the total return of the security or index underlying the transaction exceeds or falls short of the offsetting interest rate obligation, the Portfolio will receive a payment from or make a payment to the counterparty.
Swaps are marked to market daily based upon quotations from market makers and the change in value, if any, is recorded as unrealized gain or loss in the Statement of Operations. Payments received or made at the beginning of the measurement period are reflected as such in the Statement of Assets and Liabilities. These upfront payments are recorded as realized gain or loss in the Statement of Operations upon termination or maturity of the swap. A liquidation payment received or made at the termination of the swap is recorded as realized gain or loss in the Statement of Operations. Net periodic payments received or paid by the Portfolio are included as part of realized gain or loss in the Statement of Operations. Entering into these agreements involves, to varying degrees, elements of credit, market and documentation risk in excess of the amounts recognized in the Statement of Assets and Liabilities. Such risks involve the possibility that there will be no liquid market for these agreements, that the counterparty to the agreements may default on its obligation to perform or disagree as to the meaning of contractual terms in the agreements and that there may be unfavorable changes in interest rates.
U.S. Government Agencies or Government-Sponsored Enterprises. Securities issued by U.S. Government agencies or government-sponsored enterprises may not be guaranteed by the U.S. Treasury. The Government National Mortgage Association (“GNMA”), a wholly owned U.S. Government corporation, is authorized to guarantee, with the full faith and credit of the U.S. Government, the timely payment of principal and interest on securities issued by institutions approved by GNMA and backed by pools of mortgages insured by the Federal Housing Administration or guaranteed by the Department of Veterans Affairs. Government-related guarantors (i.e., not backed by the full faith and credit of the U.S. Government) include the Federal National Mortgage Association (“FNMA” or “Fannie Mae”) and the Federal Home Loan Mortgage Corporation (“FHLMC” or “Freddie Mac”). Pass-through securities issued by FNMA are guaranteed as to timely payment of principal and interest by FNMA but are not backed by the full faith and credit of the U.S. Government. FHLMC guarantees the timely payment of interest and ultimate collection of principal, but its participation certificates are not backed by the full faith and credit of the U.S. Government.
Guarantees and Indemnifications. Under the Trust’s organizational documents, each Trustee, officer, employee or other agent of the Trust (including the Trust’s investment manager) is indemnified against certain liabilities that may arise out of performance of their duties to the Portfolio. Additionally, in the normal course of business, the Portfolio enters into contracts that contain a variety of indemnification clauses. The Portfolio’s maximum exposure under these arrangements is unknown as this would involve future claims that may be made against the Portfolio that have not yet occurred. However, the Portfolio has not had prior claims or losses pursuant to these contracts, and believes the risk of loss to be remote.
New Accounting Policies. In July 2006, the Financial Accounting Standards Board issued Interpretation No. 48, “Accounting for Uncertainty in Income Taxes—an Interpretation of FASB Statement No. 109” (the “Interpretation”). The Interpretation is effective for fiscal years beginning after December 15, 2006. Management is currently evaluating the application of the Interpretation to the Portfolio and will provide additional information in relation to the Interpretation in the Portfolio’s annual financial statements for the year ending December 31, 2006.
3. FEES, EXPENSES, AND RELATED PARTY TRANSACTIONS
Investment Advisory Fee. PIMCO is a majority-owned subsidiary of Allianz Global Investors of America L.P. (“AGI”), and serves as investment adviser (the “Adviser”) to the Trust, pursuant to an investment advisory contract. The Adviser receives a monthly fee at an annual rate based on average daily net assets of the Portfolio. The Advisory Fee is charged at an annual rate of 0.49%.
Administration Fee. PIMCO serves as administrator (the “Administrator”), and provides administrative services to the Trust for which it receives a monthly administrative fee based on average daily net assets of the Portfolio. As the Administrator, PIMCO bears the costs of various third-party services, including audit, custodial, portfolio accounting, legal, transfer agency and printing costs. The Administration Fee is charged at the annual rate of 0.25%.
Distribution and Servicing Fees. Allianz Global Investors Distributors LLC (“AGID”) is an indirect wholly-owned subsidiary of AGI and serves as the distributor of the Trust’s shares. The Trust is permitted to reimburse AGID on a quarterly basis, out of the Administrative Class assets of the Portfolio in the amount of 0.15% on an annual basis of the average daily net assets of that class, for payments made to financial intermediaries that provide services in connection with the distribution of shares or administration of plans or programs that use Portfolio shares as their funding medium. The effective rate paid to AGID was 0.15% during the current fiscal year.
Expenses. The Trust is responsible for the following expenses: (i) salaries and other compensation of any of the Trust’s executive officers and employees who are not officers, directors, stockholders or employees of PIMCO or its subsidiaries or affiliates; (ii) taxes and governmental fees; (iii) brokerage fees and commissions and other portfolio transaction expenses; (iv) the costs of borrowing money, including interest expenses and bank overdraft charges; (v) fees and expenses of the Trustees who are not “interested persons” of PIMCO or the Trust, and any counsel retained exclusively for their benefit; (vi) extraordinary expenses, including costs of litigation and indemnification expenses; (vii) organization expenses and (viii) any expenses allocated or allocable to a specific class of shares, which include service fees payable with respect to the Administrative Class shares and may include certain other expenses as permitted by the Trust’s Multiple Class Plan adopted pursuant to Rule 18f-3 under the Act and subject to review and approval
| | | | | | |
| | | Semiannual Report | | June 30, 2006 | | 13 |
Notes to Financial Statements (Cont.)
by the Trustees. The ratio of expenses to average net assets per share class, as disclosed in the Financial Highlights, may differ from the annual portfolio operating expenses per share class as disclosed in the Prospectus for the reasons set forth above.
PIMCO has agreed to waive a portion of its administrative fees to the extent that the payment of the Portfolio’s pro rata share of organization expenses and Trustee fees cause the actual expense ratio to rise above the rates disclosed in the then-current prospectus plus 0.49 basis points as set forth below (calculated as a percentage of the Portfolio’s average daily net assets attributable to each class):
| | | |
| Administrative Class | | 0.89 | % |
PIMCO may be reimbursed for these waived amounts in future periods, not to exceed thirty-six months. Expenses that have been waived and may still be reimbursed by the Administrator, to the extent the Portfolio’s annualized total portfolio operating expenses plus the amount so reimbursed does not exceed the operating expense limitation, are as follows (amounts in thousands):
| | | | | | | | | | |
| | | | | | 12/31/2005 | | | | | 06/30/2006 |
Amount Available for Reimbursement | | | | $ | 21 | | | | $ | 0 |
For the current period ended June 30, 2006, each unaffiliated Trustee received an annual retainer of $15,000, plus $2,000 for each Board of Trustees quarterly meeting attended, $500 for each Board of Trustees committee meeting attended and $500 for each special board meeting attended, plus reimbursement of related expenses. In addition, each Committee Chair received an additional annual retainer of $500 and each Audit Committee Chair received an additional annual retainer of $1,500. These expenses are allocated on a pro-rata basis to each Portfolio of the Trust according to its respective net assets. The Trust pays no compensation directly to any Trustee or any other officer who is affiliated with the Administrator, all of whom receive remuneration for their services to the Trust from the Administrator or its affiliates.
4. PURCHASES AND SALES OF SECURITIES
The length of time the Portfolio has held a particular security is not generally a consideration in investment decisions. A change in the securities held by the Portfolio is known as “portfolio turnover”. The Portfolio may engage in frequent and active trading of portfolio securities to achieve its investment objective, particularly during periods of volatile market movements. High portfolio turnover (e.g., over 100%) involves correspondingly greater expenses to the Portfolio, including brokerage commissions or dealer mark-ups and other transaction costs on the sale of securities and reinvestments in other securities. Such sales may also result in realization of taxable capital gains, including short-term capital gains (which are generally taxed at ordinary income tax rates). The trading costs and tax effects associated with portfolio turnover may adversely affect the Portfolio’s performance.
Purchases and sales of securities (excluding short-term investments) for the period ended June 30, 2006 were as follows (amounts in thousands):
| | | | | | | | | | | | |
| U.S Government/Agency | | | | All Other |
| Purchases | | | | Sales | | | | Purchases | | | | Sales |
| $ 24,837 | | | | $ 24,406 | | | | $ 0 | | | | $ 0 |
5. TRANSACTIONS IN WRITTEN CALL AND PUT OPTIONS
Transactions in written call and put options were as follows (amounts in thousands, except number of contracts):
| | | | | | | | | | | |
| | | | | # of
Contracts |
| | | | | Premium | |
Balance at 12/31/2005 | | | | 2 | | | | | $ | 1 | |
Sales | | | | 10 | | | | | | 1 | |
Closing Buys | | | | 0 | | | | | | 0 | |
Expirations | | | | (4 | ) | | | | | (1 | ) |
Exercised | | | | 0 | | | | | | 0 | |
Balance at 06/30/2006 | | | | 8 | | | | | $ | 1 | |
6. SHARES OF BENEFICIAL INTEREST
The Portfolio may issue an unlimited number of shares of beneficial interest with a $0.001 par value. Changes in shares of beneficial interest were as follows (shares and amounts in thousands):
| | | | | | | | | | | | | | |
| | | | | Six Months Ended
06/30/2006 | | | | Period from
09/30/2005 to
12/31/2005 |
| | | | | Shares | | Amount | | | | Shares | | Amount |
| | | | | | |
Receipts for shares sold | | | | | | | | | | | | | | |
Administrative Class | | | | 0 | | $ | 0 | | | | 300 | | $ | 3,000 |
Issued as reinvestment of distributions | | | | | | | | | | | | | | |
Administrative Class | | | | 6 | | | 64 | | | | 0 | | | 0 |
Net increase resulting from Portfolio share transactions | | | | 6 | | $ | 64 | | | | 300 | | $ | 3,000 |
The following schedule shows the number of shareholders each owning 5% or more of the Portfolio and the total percentage of the Portfolio held by such shareholders:
| | | | | | |
| | | | | Number of
Shareholders | | % of Portfolio
Held |
Administrative Class | | | | 1 | | 100 |
7. FEDERAL INCOME TAX MATTERS
As of June 30, 2006, the aggregate cost of investments was the same for federal income tax and financial statement purposes. The net unrealized appreciation (depreciation) of investment securities for federal income tax purposes is as follows (amounts in thousands):
| | | | |
Aggregate
Gross
Unrealized
Appreciation | | Aggregate
Gross
Unrealized
(Depreciation) | | Net
Unrealized
(Depreciation) |
$ 46 | | $ (1) | | $ 45 |
| | | | |
| 14 | | PIMCO Variable Insurance Trust | | |
| | |
| |
| | | June 30, 2006 (Unaudited) |
8. REGULATORY AND LITIGATION MATTERS
On June 1, 2004, the Attorney General of the State of New Jersey announced that it had dismissed PIMCO from a complaint filed by the New Jersey Attorney General on February 17, 2004, and that it had entered into a settlement agreement (the “New Jersey Settlement”) with Allianz Global Investors of America L.P. (“AGI”) (formerly known as Allianz Dresdner Asset Management of America L.P.), PEA Capital LLC (an entity affiliated with PIMCO through common ownership) (“PEA”) and Allianz Global Investors Distributors LLC (“AGID”), in connection with the same matter. In the New Jersey Settlement, AGI, PEA and AGID neither admitted nor denied the allegations or conclusions of law, but did agree to pay New Jersey a civil fine of $15 million and $3 million for investigative costs and further potential enforcement initiatives against unrelated parties. They also undertook to implement certain governance changes. The complaint relating to the New Jersey Settlement alleged, among other things, that AGI, PEA and AGID had failed to disclose that they improperly allowed certain hedge funds to engage in “market timing” in certain funds. The complaint sought injunctive relief, civil monetary penalties, restitution and disgorgement of profits.
Since February 2004, PIMCO, AGI, PEA, AGID, and certain of their affiliates, including the PIMCO Funds, the Allianz Funds (formerly known as PIMCO Funds: Multi-Manager Series), and the Trustees and employees of the PIMCO Funds, have been named as defendants in fifteen lawsuits filed in various jurisdictions. Eleven of those lawsuits concern “market timing,” and they have been transferred to and consolidated for pre-trial proceedings in a multi-district litigation proceeding in the U.S. District Court for the District of Maryland; the other four lawsuits concern “revenue sharing” and have been consolidated into a single action in the U.S. District Court for the District of Connecticut. The lawsuits have been commenced as putative class actions on behalf of investors who purchased, held or redeemed shares of the various series of the PIMCO Funds and the Allianz Funds during specified periods, or as derivative actions on behalf of the PIMCO Funds and Allianz Funds.
The market timing actions in the District of Maryland generally allege that certain hedge funds were allowed to engage in “market timing” in certain of the PIMCO Funds and the Allianz Funds and this alleged activity was not disclosed. Pursuant to tolling agreements entered into with the derivative and class action plaintiffs, PIMCO, the Trustees, and certain employees of PIMCO who were previously named as defendants have all been dropped as defendants in the market timing actions; the plaintiffs continue to assert claims on behalf of the shareholders of the PIMCO Funds or on behalf of the PIMCO Funds themselves against other defendants. By order dated November 3, 2005, the U.S. District Court for the District of Maryland granted the PIMCO Funds’ motion to dismiss claims asserted against it in a consolidated amended complaint where the PIMCO Funds were named, in the complaint, as a nominal defendant. The revenue sharing action in the District of Connecticut generally alleges that fund assets were inappropriately used to pay brokers to promote the PIMCO Funds and Allianz Funds including directing fund brokerage transactions to such brokers, and that such alleged arrangements were not fully disclosed to shareholders. On August 11, 2005 the U.S. District Court for the District of Connecticut conducted a hearing on defendants’ motion to dismiss the consolidated amended complaint in the revenue sharing action but has not yet ruled on the motion to dismiss. The market timing and revenue sharing lawsuits seek, among other things, unspecified compensatory damages plus interest and, in some cases, punitive damages, the rescission of investment advisory contracts, the return of fees paid under those contracts and restitution.
Under Section 9(a) of the Investment Company Act of 1940, as amended (“1940 Act”), if the New Jersey Settlement or any of the lawsuits described above were to result in a court injunction against AGI, PEA, AGID and/or their affiliates, PIMCO could, in the absence of exemptive relief granted by the SEC, be barred from serving as an investment adviser, and AGID could be barred from serving as principal underwriter, to any registered investment company, including the Portfolios of the Trust. In connection with an inquiry from the SEC concerning the status of the New Jersey Settlement under Section 9(a), PEA, AGID, AGI and certain of their affiliates (including PIMCO) (together, the “Applicants”) have sought exemptive relief from the SEC under Section 9(c) of the 1940 Act. The SEC has granted the Applicants a temporary exemption from the provisions of Section 9(a) with respect to the New Jersey Settlement until the earlier of (i) September 13, 2006 and (ii) the date on which the SEC takes final action on their application for a permanent order. There is no assurance that the SEC will issue a permanent order.
Two nearly identical class action civil complaints have been filed in August 2005, in the Northern District of Illinois Eastern Division alleging that the plaintiffs each purchased and sold a 10-year Treasury note futures contract and suffered damages from an alleged shortage when PIMCO held both physical and futures positions in 10-year Treasury notes for its client accounts. The two actions have been consolidated into one action, and the two separate complaints have been replaced by a consolidated complaint. PIMCO is a named defendant, and the PIMCO Funds have been added as a defendant, to the consolidated action. PIMCO strongly believes the complaint (and any consolidated complaint filed hereafter) is without merit and intends to vigorously defend itself.
Certain Portfolios of the Trust were recently served in an adversary proceeding brought by the Official Committee of Asbestos Claimants of G-I Holdings, Inc. in G-I Holdings, Inc.’s bankruptcy in the District of New Jersey. PIMCO was previously named in this lawsuit and remains a defendant. The plaintiff seeks to recover for the bankruptcy estate assets that were transferred by the predecessor entity of G-I Holdings, Inc. to a wholly-owned subsidiary in 1994. The subsidiary has since issued notes, of which certain Portfolios of the Trust are alleged to be holders. The complaint alleges that in 2000, more than two hundred noteholders—including certain Portfolios of the Trust—were granted a second priority lien on the assets of the subsidiary in exchange for their consent to a refinancing transaction and the granting of a first priority lien to the lending banks. The plaintiff is seeking invalidation of the lien in favor of the noteholders and/or the value of the lien.
It is possible that these matters and/or other developments resulting from these matters could result in increased fund redemptions or other adverse consequences to the Portfolios. However, PIMCO and AGID believe that these matters are not likely to have a material adverse effect on the Portfolios or on PIMCO’s or AGID’s ability to perform their respective investment advisory or distribution services relating to the Portfolios.
| | | | | | |
| | | Semiannual Report | | June 30, 2006 | | 15 |
Investment Adviser and Administrator
Pacific Investment Management Company LLC
840 Newport Center Drive
Newport Beach, California 92660
Distributor
Allianz Global Investors Distributors LLC
2187 Atlantic Street
Stamford, Connecticut 06902
Custodian
State Street Bank & Trust Company
801 Pennsylvania
Kansas City, Missouri 64105
Transfer Agent
Boston Financial Data Services–Midwest
330 W. 9th Street
Kansas City, Missouri 64105
Legal Counsel
Dechert LLP
1775 I Street, N.W.
Washington, D.C. 20006
Independent Registered Public Accounting Firm
PricewaterhouseCoopers LLP
1055 Broadway
Kansas City, Missouri 64105
P I M C O

Share Class Administrative Semiannual Report June 30, 2006 PIMCO Variable Insurance Trust Short-Term Portfolio
Table of Contents
This material is authorized for use only when preceded or accompanied by the current PIMCO Variable Insurance Trust (the “Trust”) prospectus. Investors should consider the investment objectives, risks, charges and expenses of this Trust carefully before investing. Ask your financial professional to explain all charges that may apply. This and other information is contained in the Trust’s prospectus. The variable product prospectus may be obtained by contacting your Investment Consultant. Please read the Trust and variable product prospectus carefully before you invest or send money.
Chairman’s Letter
Dear PIMCO Variable Insurance Trust Shareholder:
It is our pleasure to present to you the semiannual report for the PIMCO Variable Insurance Trust covering the six-month period ended June 30, 2006.
Highlights of the global bond markets during the six-month period included:
| | n | | Most fixed-income sectors lost ground during the first half of 2006, as concern about accelerating inflation and central bank tightening pushed interest rates higher worldwide. The benchmark Lehman Brothers Aggregate Bond Index (which includes Treasury, Investment-Grade Corporate, and Residential Mortgage-Backed Securities) returned -0.72% for the first six months of the year. On June 30, the benchmark ten-year Treasury yielded 5.14%, 0.75% higher than at the start of the year. The U.S. yield curve remained flat as shorter-maturity yields rose by a comparable amount. |
| | n | | The Federal Reserve tightened four times during the reporting period, bringing the Federal Funds Rate to 5.25%. The increase near the end of the period was the Federal Reserve’s 17th consecutive rate hike since the start of its tightening cycle in 2004. The Federal Reserve was not alone, as central banks in Europe, India, and China tightened credit in unison for the first time since 2000. The Bank of Japan, whose zero-interest-rate policy has flooded global markets with liquidity, looked set to reverse this policy in the coming months. |
In these pages please find a more complete Portfolio review as it relates to financial-market activities, as well as details about total-return investment performance for the six-month reporting period. Thank you for the trust you have placed in us. We will continue to work diligently to meet your investment needs.
Sincerely,
Brent R. Harris
Chairman, PIMCO Variable Insurance Trust
July 31, 2006
| | | | | | |
| | | Semiannual Report | | June 30, 2006 | | 1 |
Important Information About the Portfolio
PIMCO Variable Insurance Trust (the “Trust”) is an open-end management investment company currently consisting of nineteen separate investment portfolios, including the Short-Term Portfolio (the “Portfolio”). The Portfolio is only available as a funding vehicle under variable life insurance policies or variable annuity contracts issued by insurance companies (“Variable Contracts”). Individuals may not purchase shares of the Portfolio directly. Shares of the Portfolio also may be sold to qualified pension and retirement plans outside of the separate account context.
We believe that bond funds have an important role to play in a well diversified investment portfolio. It is important to note, however, that in an environment where interest rates may trend upward, rising rates would negatively impact the performance of most bond funds, and fixed-income securities held by a fund are likely to decrease in value. The price volatility of fixed-income securities can also increase during periods of rising interest rates resulting in increased losses to a fund. Bond funds and individual bonds with a longer duration (a measure of the expected life of a security) tend to be more sensitive to changes in interest rates, usually making them more volatile than securities or funds with shorter durations. The longer-term performance of most bond funds has benefited from capital gains in part resulting from an extended period of declining interest rates. In the event interest rates increase, these capital gains should not be expected to recur.
The Portfolio may be subject to various risks in addition to those described above. Some of these risks may include, but are not limited to, the following: credit risk, high yield risk, market risk, issuer risk, derivatives risk, mortgage risk, non-U.S. investment risk, currency risk, leveraging risk and management risk. A complete description of these risks is contained in the Portfolio’s prospectus. The Portfolio may use derivative instruments for hedging purposes or as part of an investment strategy. Use of these instruments may involve certain costs and risks such as liquidity risk, interest rate risk, market risk, credit risk, management risk and the risk that the Portfolio could not close out a position when it would be most advantageous to do so. A Portfolio investing in derivatives could lose more than the principal amount invested in these instruments. Investing in non-U.S. securities may entail risk due to non-U.S. economic and political developments.
On the performance summary page in this Semiannual Report, the Total Return Investment Performance table measures performance assuming that all dividend and capital gain distributions were reinvested.
An investment in the Portfolio is not a deposit of a bank and is not guaranteed or insured by the Federal Deposit Insurance Corporation or any other government agency. It is possible to lose money on investments in the Portfolio.
PIMCO has adopted written proxy voting policies and procedures (“Proxy Policy”) as required by Rule 206(4)-6 under the Investment Advisers Act of 1940. The Proxy Policy has been adopted by the Trust as the policies and procedures that PIMCO will use when voting proxies on behalf of the Portfolio. Copies of the written Proxy Policy and the factors that PIMCO may consider in determining how to vote proxies for the Portfolio, and information about how the Portfolio voted proxies relating to portfolio securities held during the most recent twelve-month period ended June 30, are available without charge, upon request, by calling the Trust at 1-866-746-2606 and on the Securities and Exchange Commission’s (“SEC”) website at http://www.sec.gov.
The Portfolio files its complete schedule of portfolio holdings with the SEC for the first and third quarters of each fiscal year on Form N-Q. A copy of the Trust’s Form N-Q is available on the SEC’s website at http://www.sec.gov and may be reviewed and copied at the SEC’s Public Reference Room in Washington D.C. Information on the operation of the Public Reference Room may be obtained by calling 1-800-SEC-0330.
PIMCO Variable Insurance Trust is distributed by Allianz Global Investors Distributors LLC, 2187 Atlantic Street, Stamford, CT 06902.
| | | | |
| 2 | | PIMCO Variable Insurance Trust | | |
The following disclosure provides important information regarding the Portfolio’s Expense Example (“Example” or “Expense Example”), which appears in this Semiannual Report. Please refer to this information when reviewing the Expense Example for the Portfolio.
Example
As a shareholder of the Portfolio, you incur two types of costs: (1) transaction costs and (2) ongoing costs, including advisory and administrative fees; distribution and/or service (12b-1) fees (Administrative Class only); and other Portfolio expenses. The Example is intended to help you understand your ongoing costs (in dollars) of investing in the Portfolio and to compare these costs with the ongoing costs of investing in other mutual funds. The Expense Example does not reflect any fees or other expenses imposed by the Variable Contracts. If it did, the expenses reflected in the Expense Examples would be higher. The Example is based on an investment of $1,000 invested at the beginning of the period and held for the entire period indicated, which is from January 1, 2006 to June 30, 2006.
Actual Expenses
The information in the table under the heading “Actual Performance” provides information about actual account values and actual expenses. You may use the information in these columns, together with the amount you invested, to estimate the expenses that you paid over the period. Simply divide your account value by $1,000 (for example, an $8,600 account value divided by $1,000 = 8.60), then multiply the result by the number in the appropriate column for your share class, in the row titled “Expenses Paid During Period” to estimate the expenses you paid on your account during this period.
Hypothetical Example for Comparison Purposes
The information in the table under the heading “Hypothetical Performance (5% return before expenses)” provides information about hypothetical account values and hypothetical expenses based on the Portfolio’s actual expense ratio and an assumed rate of return of 5% per year before expenses, which is not the Portfolio’s actual return. The hypothetical account values and expenses may not be used to estimate the actual ending account balance or expenses you paid for the period. You may use this information to compare the ongoing costs of investing in the Portfolio and other portfolios. To do so, compare this 5% hypothetical example with the 5% hypothetical examples that appear in the shareholder reports of the other portfolios.
Please note that the expenses shown in the table are meant to highlight your ongoing costs only and do not reflect any transactional costs. Therefore, the information under the heading “Hypothetical Performance (5% return before expenses)” is useful in comparing ongoing costs only, and will not help you determine the relative total costs of owning different portfolios. In addition, if these transactional costs were included, your costs would have been higher.
The expense ratio may vary period to period because of various factors, such as an increase in expenses not covered by the advisory and administrative fees (such as expenses of the trustees and their counsel or litigation expense).
Portfolio Benchmark
Citigroup 3-Month Treasury Bill Index is an unmanaged index representing monthly return equivalents of yield averages of the last 3-Month Treasury Bill issues. It is not possible to invest directly in the index.
| | | | | | |
| | | Semiannual Report | | June 30, 2006 | | 3 |
| | | | |
| | |
| PIMCO Short-Term Portfolio | | | | |
| | | | |
Cumulative Returns Through June 30, 2006
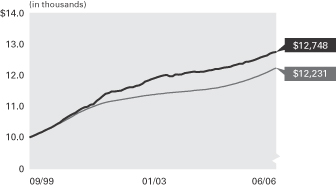
Short-Term Portfolio Citigroup 3 Month
Administrative Class T-Bill Index
-------------------- ------------
09/30/1999 $10,000 $10,000
10/31/1999 10,042 10,041
11/30/1999 10,081 10,081
12/31/1999 10,132 10,124
01/31/2000 10,175 10,169
02/29/2000 10,218 10,212
03/31/2000 10,267 10,260
04/30/2000 10,310 10,308
05/31/2000 10,369 10,359
06/30/2000 10,426 10,407
07/31/2000 10,486 10,458
08/31/2000 10,562 10,509
09/30/2000 10,632 10,562
10/31/2000 10,692 10,617
11/30/2000 10,749 10,671
12/31/2000 10,782 10,727
01/31/2001 10,858 10,783
02/28/2001 10,920 10,829
03/31/2001 10,965 10,877
04/30/2001 10,984 10,919
05/31/2001 11,047 10,959
06/30/2001 11,066 10,994
07/31/2001 11,174 11,028
08/31/2001 11,236 11,062
09/30/2001 11,328 11,094
10/31/2001 11,399 11,123
11/30/2001 11,429 11,146
12/31/2001 11,478 11,166
01/31/2002 11,478 11,183
02/28/2002 11,493 11,198
03/31/2002 11,498 11,215
04/30/2002 11,552 11,231
05/31/2002 11,590 11,248
06/30/2002 11,613 11,263
07/31/2002 11,611 11,280
08/31/2002 11,653 11,296
09/30/2002 11,673 11,312
10/31/2002 11,721 11,328
11/30/2002 11,795 11,342
12/31/2002 11,825 11,356
01/31/2003 11,865 11,368
02/28/2003 11,899 11,378
03/31/2003 11,931 11,390
04/30/2003 11,963 11,401
05/31/2003 11,994 11,412
06/30/2003 12,007 11,422
07/31/2003 11,963 11,432
08/31/2003 11,966 11,442
09/30/2003 12,025 11,450
10/31/2003 12,015 11,460
11/30/2003 12,027 11,468
12/31/2003 12,067 11,478
01/31/2004 12,078 11,487
02/29/2004 12,099 11,495
03/31/2004 12,110 11,504
04/30/2004 12,097 11,513
05/31/2004 12,107 11,522
06/30/2004 12,105 11,532
07/31/2004 12,130 11,543
08/31/2004 12,154 11,555
09/30/2004 12,167 11,569
10/31/2004 12,194 11,584
11/30/2004 12,199 11,601
12/31/2004 12,224 11,620
01/31/2005 12,243 11,641
02/28/2005 12,250 11,661
03/31/2005 12,273 11,686
04/30/2005 12,311 11,711
05/31/2005 12,338 11,739
06/30/2005 12,366 11,767
07/31/2005 12,371 11,796
08/31/2005 12,426 11,828
09/30/2005 12,435 11,860
10/31/2005 12,455 11,895
11/30/2005 12,490 11,931
12/31/2005 12,532 11,969
01/31/2006 12,570 12,009
02/28/2006 12,608 12,047
03/31/2006 12,630 12,091
04/30/2006 12,693 12,136
05/31/2006 12,725 12,184
06/30/2006 12,748 12,231
$10,000 invested at the beginning of the first full month following the inception date of the Portfolio’s Administrative Class.
Sector Breakdown‡
| | |
Short-Term Instruments | | 37.1% |
Asset-Backed Securities | | 23.2% |
U.S. Government Agencies | | 17.3% |
Corporate Bonds & Notes | | 14.7% |
Mortgage-Backed Securities | | 7.2% |
Other | | 0.5% |
| | ‡ | % of Total Investments as of June 30, 2006 |
| | | | | | | | | | | | |
| Average Annual Total Return for the period ended June 30, 2006 |
| | | | | | | 6 Months* | | 1 Year | | 5 Years | | Since
Inception
(09/30/99) |
| | |
| | PIMCO Short-Term Portfolio Administrative Class | | 1.73% | | 3.09% | | 2.87% | | 3.66% |
| | |
| | Citigroup 3-Month Treasury Bill Index | | 2.19% | | 3.95% | | 2.16% | | 3.03% |
All Portfolio returns are net of fees and expenses.
* Cumulative return.
Past performance is no guarantee of future results. The performance quoted represents past performance. Investment return and principal value will fluctuate so the Portfolio shares, when redeemed, may be worth more or less than their original cost. The Portfolio’s performance does not reflect the deduction of additional charges and expenses imposed in connection with investing in Variable Contracts, which will reduce returns. Current performance may be lower or higher than the performance data quoted. Performance data current to the most recent month-end is available by calling (800) 927-4648.
| | | | | | | | | | |
| Expense Example | | | | Actual Performance | | | | Hypothetical Performance |
| | | | | | | | | (5% return before expenses) |
Beginning Account Value (01/01/06) | | | | $ | 1,000.00 | | | | $ | 1,000.00 |
Ending Account Value (06/30/06) | | | | $ | 1,017.30 | | | | $ | 1,021.82 |
Expenses Paid During Period† | | | | $ | 3.00 | | | | $ | 3.01 |
† Expenses are equal to the Portfolio’s Administrative Class annualized expense ratio of 0.60%, multiplied by the average account value over the period, multiplied by 181/365 (to reflect the one-half year period). Overall fees and expenses of investing in the Portfolio will be higher because the example does not reflect Variable Contract fees and expenses.
Please refer to page 3 herein for a description of the Portfolio’s benchmark and an explanation of the information presented in the above Expense Example.
Portfolio Insights
| » | | The PIMCO Short-Term Portfolio seeks to achieve its investment objective by investing under normal circumstances at least 65% of its total assets in a diversified portfolio of Fixed-Income Instruments of varying maturities. |
| » | | The first half of the year was a difficult environment for the Short-Term strategy as most bonds lagged money market instruments; concern about accelerating inflation and central bank tightening pushed interest rates higher worldwide. |
| » | | U.S. interest rate exposure was the dominant cause of underperformance as Federal Reserve rate hikes totaled 1.00% during the first half of the year. |
| » | | The Portfolio’s curve steepening bias was a negative contributor to performance as the U.S. treasury yield curve flattened in conjunction with increasing rates—three month rates increased approximately 0.90% while intermediate rates only increased about by 0.75%. |
| » | | Broad diversification to higher-yielding bond sectors, including mortgages, corporates, and emerging market securities, helped partially buffer the underperformance associated with rising rates. |
| » | | Asset-backed bonds helped returns amid strong demand for their higher yield relative to money market instruments and for their collateral protection. |
| » | | Long exposure to the Yen and to Euro currency helped performance as both currencies appreciated relative to the U.S. dollar during the first half of the year. |
| | | | | | |
| 4 | | PIMCO Variable Insurance Trust | | | | |
|
|
| Financial Highlights Short-Term Portfolio |
| | | | | | | | | | | | | | | | | | | | | | | | |
| Selected Per Share Data for the Year or Period Ended: | | 06/30/2006+ | | | 12/31/2005 | | | 12/31/2004 | | | 12/31/2003 | | | 12/31/2002 | | | 12/31/2001 | |
| | | | | | |
Administrative Class | | | | | | | | | | | | | | | | | | | | | | | | |
| Net asset value beginning of period | | $ | 10.05 | | | $ | 10.08 | | | $ | 10.10 | | | $ | 10.08 | | | $ | 10.08 | | | $ | 10.01 | |
| Net investment income (a) | | | 0.20 | | | | 0.28 | | | | 0.12 | | | | 0.13 | | | | 0.28 | | | | 0.48 | |
| Net realized/unrealized gain (loss) on investments (a) | | | (0.03 | ) | | | (0.03 | ) | | | 0.01 | | | | 0.07 | | | | 0.02 | | | | 0.15 | |
| Total income from investment operations | | | 0.17 | | | | 0.25 | | | | 0.13 | | | | 0.20 | | | | 0.30 | | | | 0.63 | |
| Dividends from net investment income | | | (0.20 | ) | | | (0.28 | ) | | | (0.13 | ) | | | (0.17 | ) | | | (0.29 | ) | | | (0.52 | ) |
| Distributions from net realized capital gains | | | 0.00 | | | | 0.00 | | | | (0.02 | ) | | | (0.01 | ) | | | (0.01 | ) | | | (0.04 | ) |
| Total distributions | | | (0.20 | ) | | | (0.28 | ) | | | (0.15 | ) | | | (0.18 | ) | | | (0.30 | ) | | | (0.56 | ) |
| Net asset value end of period | | $ | 10.02 | | | $ | 10.05 | | | $ | 10.08 | | | $ | 10.10 | | | $ | 10.08 | | | $ | 10.08 | |
| Total return | | | 1.73 | % | | | 2.52 | % | | | 1.30 | % | | | 2.05 | % | | | 3.02 | % | | | 6.45 | % |
| Net assets end of period (000s) | | $ | 9,431 | | | $ | 8,186 | | | $ | 8,274 | | | $ | 5,948 | | | $ | 4,340 | | | $ | 1,683 | |
| Ratio of expenses to average net assets | | | 0.60 | %* | | | 0.60 | % | | | 0.60 | % | | | 0.60 | % | | | 0.60 | %(d) | | | 0.61 | %(b)(c) |
| Ratio of net investment income to average net assets | | | 4.07 | %* | | | 2.77 | % | | | 1.18 | % | | | 1.33 | % | | | 2.81 | % | | | 4.71 | % |
| Portfolio turnover rate | | | 46 | % | | | 154 | % | | | 251 | % | | | 199 | % | | | 60 | % | | | 94 | % |
+ Unaudited
* Annualized
(a) Per share amounts based on average number of shares outstanding during the period.
(b) Ratio of expenses to average net assets excluding interest expense is 0.60%.
(c) If the investment manager had not reimbursed expenses, the ratio of expenses to average net assets would have been 0.62%.
(d) If the investment manager had not reimbursed expenses, the ratio of expenses to average net assets would have been 0.61%.
| | | | | | |
| See Accompanying Notes | | Semiannual Report | | June 30, 2006 | | 5 |
|
|
| Statement of Assets and Liabilities Short-Term Portfolio |
| | | | |
| (Amounts in thousands, except per share amounts) | | June 30, 2006
(Unaudited) | |
| |
Assets: | | | | |
Investments, at value | | $ | 25,050 | |
Cash | | | 3 | |
Foreign currency, at value | | | 493 | |
Receivable for investments sold on delayed-delivery basis | | | 205 | |
Receivable for Portfolio shares sold | | | 179 | |
Interest and dividends receivable | | | 63 | |
Variation margin receivable | | | 4 | |
Swap premiums paid | | | 17 | |
Unrealized appreciation on forward foreign currency contracts | | | 10 | |
Unrealized appreciation on swap agreements | | | 5 | |
| | | | 26,029 | |
| |
Liabilities: | | | | |
Payable for investments purchased | | $ | 5 | |
Payable for short sales | | | 204 | |
Payable for Portfolio shares redeemed | | | 2 | |
Written options outstanding | | | 5 | |
Accrued investment advisory fee | | | 5 | |
Accrued administration fee | | | 4 | |
Accrued servicing fee | | | 1 | |
Swap premiums received | | | 49 | |
Unrealized depreciation on forward foreign currency contracts | | | 64 | |
Unrealized depreciation on swap agreements | | | 16 | |
| | | | 355 | |
| |
Net Assets | | $ | 25,674 | |
| |
Net Assets Consist of: | | | | |
Paid in capital | | $ | 25,875 | |
Undistributed net investment income | | | 36 | |
Accumulated undistributed net realized (loss) | | | (56 | ) |
Net unrealized (depreciation) | | | (181 | ) |
| | | $ | 25,674 | |
| |
Net Assets: | | | | |
Institutional Class | | $ | 16,243 | |
Administrative Class | | | 9,431 | |
| |
Shares Issued and Outstanding: | | | | |
Institutional Class | | | 1,622 | |
Administrative Class | | | 942 | |
| |
Net Asset Value and Redemption Price Per Share (Net Assets Per Share Outstanding) | | | | |
Institutional Class | | $ | 10.02 | |
Administrative Class | | | 10.02 | |
| |
Cost of Investments Owned | | $ | 25,085 | |
Cost of Foreign Currency Held | | $ | 493 | |
Proceeds Received on Short Sales | | $ | 201 | |
Premiums Received on Written Options | | $ | 11 | |
| | | | |
| 6 | | PIMCO Variable Insurance Trust | | See Accompanying Notes |
|
|
| Statement of Operations Short-Term Portfolio |
| | | | |
| (Amounts in Thousands) | | Six Months Ended
June 30, 2006
(Unaudited) | |
| |
Investment Income: | | | | |
Interest | | $ | 749 | |
Total Income | | | 749 | |
| |
Expenses: | | | | |
Investment advisory fees | | | 41 | |
Administration fees | | | 32 | |
Servicing fees – Administrative Class | | | 7 | |
Total Expenses | | | 80 | |
| |
Net Investment Income | | | 669 | |
| |
Net Realized and Unrealized Gain (Loss): | | | | |
Net realized gain on investments | | | 18 | |
Net realized (loss) on futures contracts, options and swaps | | | (75 | ) |
Net realized gain on foreign currency transactions | | | 47 | |
Net change in unrealized (depreciation) on investments | | | (8 | ) |
Net change in unrealized (depreciation) on futures contracts, options and swaps | | | (56 | ) |
Net change in unrealized (depreciation) on translation of assets and liabilities denominated in foreign currencies | | | (25 | ) |
Net (Loss) | | | (99 | ) |
| |
Net Increase in Net Assets Resulting from Operations | | $ | 570 | |
| | | | | | |
| See Accompanying Notes | | Semiannual Report | | June 30, 2006 | | 7 |
|
|
| Statements of Changes in Net Assets Short-Term Portfolio |
| | | | | | | | |
| (Amounts in Thousands) | | Six Months Ended
June 30, 2006
(Unaudited) | | | Year Ended
December 31, 2005 | |
| | |
Increase (Decrease) in Net Assets from: | | | | | | | | |
| | |
Operations: | | | | | | | | |
Net investment income | | $ | 669 | | | $ | 1,099 | |
Net realized gain (loss) | | | (10 | ) | | | 13 | |
Net change in unrealized (depreciation) | | | (89 | ) | | | (123 | ) |
Net increase resulting from operations | | | 570 | | | | 989 | |
| | |
Distributions to Shareholders: | | | | | | | | |
| From net investment income | | | | | | | | |
Institutional Class | | | (487 | ) | | | (891 | ) |
Administrative Class | | | (182 | ) | | | (218 | ) |
| | |
Total Distributions | | | (669 | ) | | | (1,109 | ) |
| | |
Portfolio Share Transactions: | | | | | | | | |
| Receipts for shares sold | | | | | | | | |
Institutional Class | | | 16,084 | | | | 20,119 | |
Administrative Class | | | 3,411 | | | | 3,074 | |
| Issued as reinvestment of distributions | | | | | | | | |
Institutional Class | | | 487 | | | | 892 | |
Administrative Class | | | 182 | | | | 218 | |
| Cost of shares redeemed | | | | | | | | |
Institutional Class | | | (32,679 | ) | | | (13,817 | ) |
Administrative Class | | | (2,317 | ) | | | (3,355 | ) |
Net increase (decrease) resulting from Portfolio share transactions | | | (14,832 | ) | | | 7,131 | |
| | |
Total Increase (Decrease) in Net Assets | | | (14,931 | ) | | | 7,011 | |
| | |
Net Assets: | | | | | | | | |
Beginning of period | | | 40,605 | | | | 33,594 | |
End of period* | | $ | 25,674 | | | $ | 40,605 | |
| | |
*Including undistributed net investment income of: | | $ | 36 | | | $ | 36 | |
| | | | |
| 8 | | PIMCO Variable Insurance Trust | | See Accompanying Notes |
| | |
| |
| Schedule of Investments Short-Term Portfolio | | June 30, 2006 (Unaudited) |
| | | | | | | | |
| | | | | PRINCIPAL | | | | |
| | | | | AMOUNT | | | | VALUE |
| | | | | (000S) | | | | (000S) |
| |
| CORPORATE BONDS & NOTES 14.3% |
| |
| BANKING & FINANCE 8.9% | | | | | | | | |
| Citigroup, Inc. | | | | | | | | |
5.199% due 05/02/2008 | | $ | | 250 | | $ | | 250 |
|
| Ford Motor Credit Co. | | | | | | | | |
5.510% due 03/13/2007 | | | | 100 | | | | 99 |
|
| General Electric Capital Corp. | | | | |
5.220% due 05/10/2010 | | | | 100 | | | | 100 |
|
| General Motors Acceptance Corp. | | | | |
5.968% due 01/16/2007 | | | | 100 | | | | 100 |
6.039% due 03/20/2007 | | | | 70 | | | | 70 |
|
| Goldman Sachs Group, Inc. | | | | | | | | |
5.633% due 10/05/2007 | | | | 100 | | | | 100 |
5.539% due 06/23/2009 | | | | 200 | | | | 200 |
|
| HSBC Finance Corp. | | | | | | | | |
5.200% due 05/10/2007 | | | | 170 | | | | 170 |
5.459% due 09/15/2008 | | | | 100 | | | | 100 |
|
| Lehman Brothers Holdings, Inc. | | | | |
5.659% due 12/23/2010 | | | | 100 | | | | 100 |
|
| MBNA Europe Funding PLC | | | | | | | | |
5.336% due 09/07/2007 | | | | 300 | | | | 300 |
|
| Mirage Resorts, Inc. | | | | | | | | |
6.750% due 08/01/2007 | | | | 100 | | | | 101 |
|
| Morgan Stanley | | | | | | | | |
5.276% due 02/09/2009 | | | | 100 | | | | 100 |
|
| Rabobank Nederland | | | | | | | | |
5.088% due 01/15/2009 | | | | 200 | | | | 200 |
|
| Riggs Capital Trust | | | | | | | | |
8.875% due 03/15/2027 | | | | 100 | | | | 106 |
|
| Royal Bank of Scotland PLC | | | | | | | | |
5.038% due 04/11/2008 | | | | 100 | | | | 100 |
|
| VTB Capital S.A. for Vneshtorgbank | | | | |
6.174% due 09/21/2007 | | | | 100 | | | | 100 |
| | | | | | | | |
|
| | | | | | | | | 2,296 |
| | | | | | | | |
|
| |
| |
| INDUSTRIALS 3.7% | | | | | | | | |
| Airgas, Inc. | | | | | | | | |
9.125% due 10/01/2011 | | | | 100 | | | | 105 |
|
| ConocoPhillips | | | | | | | | |
5.028% due 04/11/2007 | | | | 100 | | | | 100 |
|
| Constellation Brands, Inc. | | | | | | | | |
8.625% due 08/01/2006 | | | | 60 | | | | 60 |
|
| CSC Holdings, Inc. | | | | | | | | |
7.875% due 12/15/2007 | | | | 100 | | | | 102 |
|
| DaimlerChrysler N.A. Holding Corp. | | | | |
5.486% due 03/07/2007 | | | | 50 | | | | 50 |
|
| Enterprise Products Operating LP | | | | |
4.000% due 10/15/2007 | | | | 30 | | | | 29 |
|
| Historic TW, Inc. | | | | | | | | |
8.180% due 08/15/2007 | | | | 100 | | | | 103 |
|
| HJ Heinz Co. | | | | | | | | |
6.428% due 12/01/2008 | | | | 100 | | | | 102 |
|
| Kerr-McGee Corp. | | | | | | | | |
5.875% due 09/15/2006 | | | | 200 | | | | 201 |
|
| Kroger Co. | | | | | | | | |
7.625% due 09/15/2006 | | | | 100 | | | | 100 |
| | | | | | | | |
|
| | | | | | | | | 952 |
| | | | | | | | |
|
| |
| | | | | | | | |
| UTILITIES 1.7% | | | | | | | | |
| Entergy Gulf States, Inc. | | | | | | | | |
3.600% due 06/01/2008 | | $ | | 100 | | $ | | 96 |
|
| Ohio Edison Co. | | | | | | | | |
4.000% due 05/01/2008 | | | | 30 | | | | 29 |
|
| Public Service Enterprise Group, Inc. | | |
5.799% due 09/21/2008 | | | | 100 | | | | 100 |
|
| Verizon Global Funding Corp. | | | | | | | | |
5.300% due 08/15/2007 | | | | 200 | | | | 200 |
| | | | | | | | |
|
| | | | | | | | | 425 |
| | | | | | | | |
|
Total Corporate Bonds & Notes (Cost $3,686) | | | | 3,673 |
| | | | | | | | |
|
| |
| U.S. GOVERNMENT AGENCIES 16.9% |
| Fannie Mae | | | | | | | | |
5.000% due 07/25/2020 | | | | 177 | | | | 176 |
5.111% due 09/07/2006 | | | | 700 | | | | 700 |
5.211% due 03/01/2044 | | | | 215 | | | | 216 |
5.312% due 09/22/2006 | | | | 1,000 | | | | 1,000 |
5.442% due 03/25/2034 | | | | 70 | | | | 70 |
5.472% due 08/25/2034 | | | | 30 | | | | 30 |
5.500% due 11/01/2016 | | | | 120 | | | | 118 |
5.672% due 05/25/2042 | | | | 32 | | | | 32 |
5.842% due 10/01/2031 | | | | 24 | | | | 24 |
6.000% due 06/01/2017 | | | | 33 | | | | 33 |
|
| Freddie Mac | | | | | | | | |
3.500% due 01/15/2013 - 03/15/2022 (b) | | | | 250 | | | | 245 |
5.211% due 10/25/2044 - 02/25/2045 (b) | | | | 1,161 | | | | 1,161 |
5.411% due 07/25/2044 | | | | 238 | | | | 237 |
5.500% due 08/15/2030 | | | | 17 | | | | 17 |
5.549% due 06/15/2031 | | | | 77 | | | | 77 |
9.500% due 12/01/2019 | | | | 20 | | | | 22 |
|
| Government National Mortgage Association |
5.000% due 02/20/2032 | | | | 55 | | | | 55 |
6.000% due 03/15/2032 - 03/20/2032 (b) | | | | 110 | | | | 110 |
| | | | | | | | |
|
Total U.S. Government Agencies (Cost $4,338) | | | | 4,323 |
| | | | | | | | |
|
| |
| MORTGAGE-BACKED SECURITIES 7.0% |
| Banc of America Mortgage Securities | | |
6.607% due 07/25/2032 | | | | 4 | | | | 4 |
5.437% due 10/20/2032 | | | | 5 | | | | 5 |
|
| Bear Stearns Adjustable Rate Mortgage Trust |
4.666% due 12/25/2033 | | | | 18 | | | | 17 |
4.214% due 01/25/2034 | | | | 13 | | | | 13 |
4.799% due 11/25/2035 | | | | 259 | | | | 254 |
|
| Bear Stearns Alt-A Trust | | | | | | | | |
5.602% due 02/25/2034 | | | | 12 | | | | 12 |
|
| Countrywide Alternative Loan Trust | | |
5.602% due 02/25/2037 | | | | 194 | | | | 195 |
5.417% due 05/20/2046 | | | | 97 | | | | 97 |
|
| Countrywide Home Loan Mortgage Pass-Through Trust |
5.662% due 06/25/2035 | | | | 79 | | | | 79 |
|
| CS First Boston Mortgage Securities Corp. | | |
4.954% due 03/25/2032 | | | | 42 | | | | 42 |
5.691% due 05/25/2032 | | | | 5 | | | | 5 |
|
| First Republic Mortgage Loan Trust | | |
5.499% due 08/15/2032 | | | | 84 | | | | 84 |
|
| Greenpoint Mortgage Funding Trust | | |
5.542% due 05/25/2045 | | | | 159 | | | | 160 |
| | | | | | | | |
| GSR Mortgage Loan Trust | | | | | | | | |
4.541% due 09/25/2035 | | $ | | 88 | | $ | | 86 |
|
| Harborview Mortgage Loan Trust | | |
5.472% due 05/19/2035 | | | | 205 | | | | 205 |
|
| Mellon Residential Funding Corp. | | | | |
5.639% due 12/15/2030 | | | | 31 | | | | 31 |
|
| Sequoia Mortgage Funding Co. | | | | |
0.800% due 10/21/2007 (a) | | | | 638 | | | | 3 |
|
| Structured Asset Mortgage Investments, Inc. |
5.582% due 09/19/2032 | | | | 26 | | | | 26 |
5.542% due 05/25/2036 | | | | 100 | | | | 100 |
5.552% due 05/25/2045 | | | | 208 | | | | 209 |
|
| Washington Mutual, Inc. | | | | | | | | |
5.592% due 12/25/2027 | | | | 47 | | | | 47 |
5.123% due 10/25/2032 | | | | 4 | | | | 4 |
5.543% due 06/25/2042 | | | | 27 | | | | 27 |
5.143% due 02/25/2046 | | | | 96 | | | | 95 |
| | | | | | | | |
|
Total Mortgage-Backed Securities (Cost $1,804) | | | | 1,800 |
| | | | | | | | |
|
| | | | | | | |
| | | | | | | | |
| ASSET-BACKED SECURITIES 22.6% |
| AAA Trust | | | | | | | | |
5.422% due 11/26/2035 | | | | 20 | | | | 20 |
|
| ACE Securities Corp. | | | | | | | | |
5.402% due 02/25/2036 | | | | 156 | | | | 156 |
|
| Ameriquest Mortgage Securities, Inc. | | |
5.402% due 03/25/2035 | | | | 74 | | | | 74 |
|
| Argent Securities, Inc. | | | | | | | | |
5.422% due 11/25/2035 | | | | 163 | | | | 163 |
5.462% due 02/25/2036 | | | | 287 | | | | 287 |
5.392% due 05/25/2036 | | | | 87 | | | | 87 |
|
| Bear Stearns Asset-Backed Securities, Inc. |
5.652% due 10/25/2032 | | | | 4 | | | | 4 |
5.392% due 12/25/2035 | | | | 69 | | | | 69 |
5.522% due 06/15/2043 | | | | 5 | | | | 5 |
|
| Centex Home Equity | | | | | | | | |
5.432% due 10/25/2035 | | | | 53 | | | | 53 |
|
| Chase Manhattan Auto Owner Trust | | | | |
4.730% due 03/15/2008 | | | | 10 | | | | 10 |
|
| Countrywide Asset-Backed Certificates |
5.802% due 12/25/2031 | | | | 6 | | | | 6 |
5.692% due 05/25/2032 | | | | 1 | | | | 1 |
5.482% due 08/25/2033 | | | | 156 | | | | 156 |
5.492% due 12/25/2035 | | | | 232 | | | | 232 |
5.392% due 02/25/2036 | | | | 177 | | | | 177 |
5.392% due 03/25/2036 | | | | 93 | | | | 93 |
5.392% due 04/25/2036 | | | | 92 | | | | 92 |
|
| CS First Boston Mortgage Securities Corp. |
5.672% due 07/25/2032 | | | | 3 | | | | 3 |
5.692% due 08/25/2032 | | | | 3 | | | | 3 |
|
| FBR Securitization Trust |
5.432% due 10/25/2035 | | | | 53 | | | | 53 |
5.442% due 10/25/2035 | | | | 219 | | | | 219 |
|
| First Franklin Mortgage Loan Asset-Backed Certificates |
5.731% due 03/25/2034 | | | | 1 | | | | 1 |
5.392% due 01/25/2036 | | | | 84 | | | | 84 |
5.412% due 01/25/2036 | | | | 85 | | | | 86 |
|
| First NLC Trust |
5.432% due 12/25/2035 | | | | 258 | | | | 258 |
5.442% due 12/31/2036 | | | | 78 | | | | 78 |
| | | | | | |
| See Accompanying Notes | | Semiannual Report | | June 30, 2006 | | 9 |
| | |
| |
| Schedule of Investments Short-Term Portfolio (Cont.) | | |
| | | | |
| | | PRINCIPAL | | |
| | | AMOUNT | | VALUE |
| | | (000S) | | (000S) |
| | | | | |
| | | | | | | | |
| Fremont Home Loan Trust |
5.412% due 01/25/2036 | | $ | | 251 | | $ | | 251 |
|
| GSAMP Trust |
5.412% due 11/25/2035 | | | | 81 | | | | 81 |
5.442% due 12/25/2035 | | | | 72 | | | | 72 |
5.432% due 01/25/2036 | | | | 247 | | | | 247 |
|
| Home Equity Asset Trust |
5.402% due 05/25/2036 | | | | 87 | | | | 87 |
|
| Home Equity Mortgage Trust |
5.442% due 07/25/2035 | | | | 3 | | | | 3 |
|
| Irwin Home Equity |
5.862% due 07/25/2032 | | | | 8 | | | | 8 |
|
| Long Beach Mortgage Loan Trust |
5.412% due 01/25/2036 | | | | 155 | | | | 155 |
5.392% due 03/25/2036 | | | | 81 | | | | 81 |
|
| Mastr Asset-Backed Securities Trust |
5.402% due 12/25/2035 | | | | 85 | | | | 85 |
|
| Merrill Lynch Mortgage Investors, Inc. |
5.392% due 02/25/2037 | | | | 86 | | | | 86 |
|
| Morgan Stanley Capital I |
5.392% due 02/25/2036 | | | | 85 | | | | 85 |
|
| Nelnet Student Loan Trust |
5.174% due 08/23/2011 | | | | 98 | | | | 98 |
5.190% due 07/25/2016 | | | | 100 | | | | 100 |
|
| Novastar Home Equity Loan |
5.982% due 09/25/2031 | | | | 3 | | | | 3 |
|
| Quest Trust | | | | | | | | |
5.882% due 06/25/2034 | | | | 15 | | | | 15 |
|
| Renaissance Home Equity Loan Trust | | |
5.762% due 08/25/2033 | | | | 19 | | | | 20 |
5.822% due 12/25/2033 | | | | 92 | | | | 93 |
5.682% due 11/25/2034 | | | | 41 | | | | 41 |
|
| Residential Asset Mortgage Products, Inc. | | |
5.482% due 09/25/2013 | | | | 3 | | | | 3 |
5.652% due 12/25/2033 | | | | 1 | | | | 1 |
5.402% due 01/25/2036 | | | | 72 | | | | 72 |
5.161% due 02/25/2036 | | | | 86 | | | | 86 |
|
| Residential Asset Securities Corp. | | |
5.422% due 10/25/2035 | | | | 188 | | | | 189 |
5.402% due 01/25/2036 | | | | 85 | | | | 86 |
|
| Residential Funding Mortgage Securities II, Inc. |
5.462% due 09/25/2035 | | | | 284 | | | | 285 |
|
| SACO I, Inc. | | | | | | | | |
5.432% due 12/25/2035 | | | | 199 | | | | 199 |
5.402% due 04/25/2036 | | | | 70 | | | | 70 |
|
| Saxon Asset Securities Trust | | | | | | | | |
5.592% due 01/25/2032 | | | | 1 | | | | 1 |
|
| Soundview Home Equity Loan Trust | | |
5.492% due 04/25/2035 | | | | 51 | | | | 51 |
5.392% due 03/25/2036 | | | | 79 | | | | 79 |
5.392% due 05/25/2036 | | | | 90 | | | | 91 |
|
| Structured Asset Investment Loan Trust | | |
5.412% due 07/25/2035 | | | | 39 | | | | 39 |
|
| Structured Asset Securities Corp. | | |
5.612% due 01/25/2033 | | | | 4 | | | | 4 |
|
| Susquehanna Auto Lease Trust | | |
4.991% due 04/16/2007 | | | | 60 | | | | 60 |
|
| Wachovia Auto Owner Trust | | | | | | | | |
4.820% due 02/20/2009 | | | | 400 | | | | 399 |
| | | | | | | | |
| Wells Fargo Home Equity Trust | | |
5.492% due 02/25/2018 | | $ | | 7 | | $ | | 7 |
| | | | | | | | |
|
Total Asset-Backed Securities (Cost $5,800) | | | | 5,803 |
| | | | | | | | |
|
| | | | | | | |
| SOVEREIGN ISSUES 0.6% |
| Russia Government International Bond | | |
10.000% due 06/26/2007 | | | | 140 | | | | 146 |
| | | | | | | | |
|
Total Sovereign Issues (Cost $147) | | 146 |
| | | | | | | | |
|
| | | | | | | |
| | | | | NOTIONAL
AMOUNT
(000S) | | | | |
| PURCHASED CALL OPTIONS 0.0% |
| 2-Year Interest Rate Swap (OTC) Pay 3-Month USD-LIBOR Floating Rate Index |
Strike @ 5.080% Exp. 04/19/2007 | | | | 500 | | | | 1 |
Strike @ 5.500% Exp. 06/29/2007 | | | | 1,000 | | | | 5 |
Strike @ 5.130% Exp. 10/25/2006 | | | | 5,000 | | | | 1 |
| | | | | | | | |
|
Total Purchased Call Options (Cost $15) | | 7 |
| | | | | | | | |
|
| | | | | | | |
| | | | | PRINCIPAL
AMOUNT
(000S) | | | | |
| SHORT-TERM INSTRUMENTS 36.2% |
| |
| CERTIFICATES OF DEPOSIT 1.9% | | |
| Countrywide Bank N.A. | | | | | | | | |
5.209% due 09/15/2006 | | | | 500 | | | | 500 |
| | | | | | | | |
|
| | | | | | | | | 500 |
| | | | | | | | |
|
| |
| |
| COMMERCIAL PAPER 29.9% | | |
| Danske Corp. | | | | | | | | |
5.080% due 08/24/2006 | | | | 700 | | | | 695 |
|
| DNB NORBank ASA | | | | | | | | |
4.960% due 07/17/2006 | | | | 100 | | | | 100 |
5.080% due 08/02/2006 | | | | 600 | | | | 597 |
|
| Fannie Mae | | | | | | | | |
4.809% due 07/05/2006 | | | | 300 | | | | 300 |
|
| Federal Home Loan Bank | | | | | | | | |
5.030% due 07/03/2006 | | | | 700 | | | | 700 |
|
| HBOS Treasury Services PLC | | | | | | | | |
5.055% due 08/17/2006 | | | | 600 | | | | 596 |
|
| ING U.S. Funding LLC | | | | | | | | |
5.230% due 08/03/2006 | | | | 700 | | | | 697 |
|
| Nordea N.A., Inc. | | | | | | | | |
5.090% due 08/24/2006 | | | | 700 | | | | 695 |
|
| Rabobank USA Financial Corp. | | |
5.240% due 07/03/2006 | | | | 500 | | | | 500 |
|
| Societe Generale N.A. | | | | | | | | |
5.055% due 08/15/2006 | | | | 700 | | | | 696 |
|
| Spintab AB | | | | | | | | |
5.120% due 08/01/2006 | | | | 700 | | | | 697 |
|
| Total Captial S.A. | | | | | | | | |
5.270% due 07/03/2006 | | | | 700 | | | | 700 |
|
| UBS Finance Delaware LLC | | | | | | |
5.235% due 08/08/2006 | | | | 700 | | | | 696 |
| | | | | | | | |
|
| | | | | | | | | 7,669 |
| | | | | | | | |
|
| | | | | | | | |
| FRANCE TREASURY BILL 2.4% | | |
2.667% due 08/24/2006 | | EUR | | 480 | | $ | | 612 |
| | | | | | | | |
|
| |
| |
| GERMANY TREASURY BILL 0.1% | | |
2.668% due 08/16/2006 | | | | 20 | | | | 25 |
| | | | | | | | |
|
| |
| |
| REPURCHASE AGREEMENT 1.6% | | |
| State Street Bank | | | | | | | | |
4.900% due 07/03/2006 | | $ | | 417 | | | | 417 |
| | | | | | | | |
|
(Dated 06/30/2006. Collateralized by Freddie Mac
2.750% due 02/09/2007 valued at $428. Repurchase proceeds are $417.) |
| |
| |
| U.S. TREASURY BILLS 0.3% |
4.733% due 08/31/2006 -09/14/2006 (b)(d) | | | | 75 | | | | 75 |
| | | | | | | | |
|
Total Short-Term Instruments
(Cost $9,295) | | 9,298 |
| | | | | | | | |
|
| | | | | | | |
Total Investments (c) 97.6%
(Cost $25,085) | | $ | | 25,050 |
| | | | | | | |
Written Options (f) (0.0%)
(Premiums $11) | | (5) |
| | | | | | | |
| Other Assets and Liabilities (Net) 2.4% | | 629 |
| | | | | | | | |
|
| Net Assets 100.0% | | $ | | 25,674 |
| | | | | | | | |
|
| | | | |
| 10 | | PIMCO Variable Insurance Trust | | See Accompanying Notes |
| | |
| |
| | | June 30, 2006 (Unaudited) |
|
Notes to Schedule of Investments (amounts in thousands, except number of contracts): |
(a) Interest only security. |
| |
(b) Securities are grouped by coupon or range of coupons and represent a range of maturities. |
| |
(c) As of June 30, 2006, portfolio securities with an aggregate market value of $197 were valued in good faith and pursuant to guidelines established by the Board of Trustees. |
| |
(d) Securities with an aggregate market value of $75 have been segregated with the custodian to cover margin requirements for the following open futures contracts on June 30, 2006: |
| | | | | | | | | | |
| Description | | Type | | Expiration
Month | | # of
Contracts | | Unrealized
(Depreciation) | |
90-Day Eurodollar September Futures | | Long | | 09/2006 | | 62 | | $ | (88 | ) |
| | | | | | | | |
|
|
|
| | | | | | | | | | | | | | | |
(e) Swap agreements outstanding on June 30, 2006: | |
| Interest Rate Swaps | | | | | | | | | | | | | | | |
| Counterparty | | Floating Rate Index | | Pay/Receive
Floating Rate | | Fixed Rate | | Expiration
Date | | Notional
Amount | | Unrealized
Appreciation/
(Depreciation) | |
Goldman Sachs & Co. | | 3-month USD-LIBOR | | Receive | | 5.000% | | 12/20/2016 | | $ | 400 | | $ | 5 | |
J.P. Morgan Chase & Co. | | 3-month USD-LIBOR | | Pay | | 5.000% | | 12/20/2011 | | | 100 | | | (1 | ) |
Royal Bank of Scotland PLC | | 3-month USD-LIBOR | | Pay | | 5.000% | | 12/20/2011 | | | 400 | | | (4 | ) |
UBS Warburg LLC | | 3-month USD-LIBOR | | Pay | | 4.000% | | 06/21/2007 | | | 3,200 | | | (11 | ) |
| | | | | | | | | | | | | |
|
|
|
| | | | | | | | | | | | | | $ | (11 | ) |
| | | | | | | | | | | | | |
|
|
|
| | | | | | | | | | | | | | | | | | | |
(f) Written options outstanding on June 30, 2006: | | | | | | | | | | | | | |
| Swaptions | | | | | | | | | | | | | |
| Description | | Counterparty | | Floating Rate Index | | Pay/Receive
Floating Rate | | Exercise Rate | | Expiration Date | | Notional Amount | | Premium | | Value |
Call - OTC 5-Year Interest Rate Swap | | Goldman Sachs & Co. | | 3-month USD-LIBOR | | Receive | | 5.210% | | 10/25/2006 | | $ | 1,000 | | $ | 4 | | $ | 1 |
Call - OTC 5-Year Interest Rate Swap | | Royal Bank of Scotland PLC | | 3-month USD-LIBOR | | Receive | | 5.220% | | 04/19/2007 | | | 200 | | | 2 | | | 1 |
Call - OTC 5-Year Interest Rate Swap | | Wachovia Bank N.A. | | 3-month USD-LIBOR | | Receive | | 5.210% | | 10/25/2006 | | | 1,100 | | | 4 | | | 1 |
| | | | | | | | | | | | | | | |
|
| |
|
|
| | | | | | | | | | | | | | | | $ | 10 | | $ | 3 |
| | | | | | | | | | | | | | | |
|
| |
|
|
| | | | | | | | | | | | | | | |
| Foreign Currency Options | | | | | | | | | | | | | | | |
| Description | | Counterparty | | Exercise
Price | | Expiration
Date | | Notional
Amount | | Premium | | Value |
Put - OTC U.S. dollar versus Japanese Yen | | Bank of America | | JPY 112.000 | | 07/26/2006 | | $ | 400 | | $ | 1 | | $ | 2 |
| | | | | | | | | | | |
|
| |
|
|
| | | | | | | | | | | | | |
(g) Short sales outstanding on June 30, 2006: | | | | | | | | | | | |
| Description | | Coupon | | Maturity
Date | | Principal
Amount | | Proceeds | | Valueà |
| U.S. Treasury Note | | 5.000% | | 02/15/2011 | | $ | 200 | | $ | 201 | | $ | 204 |
| | | | | | | | | |
|
| |
|
|
|
| à Market value includes $4 of interest payable on short sales. |
| | | | | | | | | | | | | | | | | |
(h) Forward foreign currency contracts outstanding on June 30, 2006: | | | | | |
| Type | | | | Principal
Amount
Covered by
Contract | | Settlement
Month | | Unrealized
Appreciation | | Unrealized
(Depreciation) | | | Net
Unrealized
Appreciation/
(Depreciation) | |
Buy | | CNY | | 231 | | 03/2007 | | $ | 0 | | $ | 0 | | | $ | 0 | |
Buy | | EUR | | 600 | | 07/2006 | | | 5 | | | (2 | ) | | | 3 | |
Sell | | | | 602 | | 07/2006 | | | 0 | | | (26 | ) | | | (26 | ) |
Sell | | | | 76 | | 08/2006 | | | 0 | | | (2 | ) | | | (2 | ) |
Sell | | | | 802 | | 09/2006 | | | 0 | | | (15 | ) | | | (15 | ) |
Buy | | JPY | | 5,300 | | 07/2006 | | | 1 | | | 0 | | | | 1 | |
Buy | | | | 233,975 | | 08/2006 | | | 2 | | | (15 | ) | | | (13 | ) |
Sell | | | | 133,830 | | 08/2006 | | | 2 | | | (4 | ) | | | (2 | ) |
| | | | | | | | |
|
| |
|
|
| |
|
|
|
| | | | | | | | | $ | 10 | | $ | (64 | ) | | $ | (54 | ) |
| | | | | | | | |
|
| |
|
|
| |
|
|
|
| | | | | | |
| See Accompanying Notes | | Semiannual Report | | June 30, 2006 | | 11 |
Notes to Financial Statements
1. ORGANIZATION
The Short-Term Portfolio (the “Portfolio”) is a series of the PIMCO Variable Insurance Trust (the “Trust”). The Trust is registered under the Investment Company Act of 1940 (the “Act”), as amended, as an open-end investment management company organized as a Delaware business trust on October 3, 1997. The Portfolio offers two classes of shares: Institutional and Administrative. Information presented in these financial statements pertains to the Administrative Class of the Portfolio. Certain detailed financial information for the Institutional Class is provided separately and is available upon request. The Trust is designed to be used as an investment vehicle by Separate Accounts of insurance companies that fund variable annuity contracts and variable life insurance policies and by qualified pension and retirement plans.
2. SIGNIFICANT ACCOUNTING POLICIES
The following is a summary of significant accounting policies consistently followed by the Portfolio in the preparation of its financial statements in conformity with accounting principles generally accepted in the United States of America (“GAAP”). The preparation of financial statements in accordance with GAAP requires management to make estimates and assumptions that affect the reported amounts and disclosures in the financial statements. Actual results could differ from those estimates.
Security Valuation. Portfolio securities are valued as of the close of regular trading (normally 4:00 p.m., Eastern Time) on each day that the New York Stock Exchange (“NYSE”) is open. Portfolio securities and other assets for which market quotes are readily available are stated at market value. Market value is generally determined on the basis of last reported sales prices, or if no sales are reported, based on quotes obtained from a quotation reporting system, established market makers, or pricing services. Fixed-income securities and non-exchange traded derivatives are normally valued on the basis of quotes obtained from brokers and dealers or pricing services. Prices obtained from independent pricing services use information provided by market makers or estimates of market values obtained from yield data relating to investments or securities with similar characteristics. Certain fixed-income securities purchased on a delayed-delivery basis are marked to market daily until settlement at the forward settlement date. Short-term investments having a maturity of 60 days or less are generally valued at amortized cost. Exchange traded options, futures and options on futures are valued at the settlement price determined by the relevant exchange.
Investments initially valued in currencies other than the U.S. dollar are converted to the U.S. dollar using exchange rates obtained from pricing services. As a result, the NAV of the Portfolio’s shares may be affected by changes in the value of currencies in relation to the U.S. dollar. The value of securities traded in markets outside the United States or denominated in currencies other than the U.S. dollar may be affected significantly on a day that the NYSE is closed and an investor is not able to purchase, redeem or exchange shares.
Securities and other assets for which market quotes are not readily available are valued at fair value as determined in good faith by the Board of Trustees or persons acting at their direction. The Board of Trustees has adopted methods for valuing securities and other assets in circumstances where market quotes are not readily available, and has delegated to Pacific Investment Management Company LLC (“PIMCO”) the responsibility for applying the valuation methods. In the event that market quotes are not readily available, and the security or asset cannot be valued pursuant to one of the valuation methods, the value of the security or asset will be determined in good faith by the Valuation Committee of the Board of Trustees, generally based upon recommendations provided by PIMCO.
Market quotes are considered not readily available in circumstances where there is an absence of current or reliable market-based data (e.g., trade information, bid/asked information, broker quotes), including where events occur after the close of the relevant market, but prior to the close of regular trading, that materially affect the values of the Portfolio’s securities or assets. In addition, market quotes are considered not readily available when, due to extraordinary circumstances, the exchanges or markets on which the securities trade do not open for trading for the entire day and no other market prices are available. The Board has delegated to PIMCO the responsibility for monitoring significant events that may materially affect the values of the Portfolio’s securities or assets and for determining whether the value of the applicable securities or assets should be re-evaluated in light of such significant events. When the Portfolio uses fair value pricing to determine its NAV, securities will not be priced on the basis of quotations from the primary market in which they are traded, but rather may be priced by another method that the Board of Trustees or persons acting at their direction believe accurately reflects fair value. The Trust’s policy is intended to result in a calculation of the Portfolio’s NAV that fairly reflects security values as of the time of pricing. However, fair values determined by the Board of Trustees or persons acting at their direction may not accurately reflect the price that the Portfolio could obtain for a security if it were to dispose of that security as of the time of pricing. Because foreign securities can trade on non-business days, the NAV of the Portfolio may change on days when shareholders will not be able to purchase or redeem shares. The prices used by the Portfolio may differ from the value that would be realized if the securities were sold and the differences could be material to the financial statements.
Securities Transactions and Investment Income. Securities transactions are recorded as of the trade date. Securities purchased or sold on a when-issued or delayed-delivery basis may be settled a month or more after the trade date. Realized gains and losses from securities sold are recorded on the identified cost basis. Dividend income is recorded on the ex-dividend date, except certain dividends from foreign securities where the ex-dividend date may have passed, which are recorded as soon as the Portfolio is informed of the ex-dividend date. Interest income, adjusted for the accretion of discounts and amortization of premiums, is recorded on the accrual basis. Paydown gains and losses on mortgage-related or asset-backed securities are recorded as components of interest income in the Statement of Operations.
Dividends and Distributions to Shareholders. Dividends from net investment income, if any, are declared on each day the Portfolio is open for business and are distributed to shareholders monthly. Net realized capital gains earned by the Portfolio, if any, will be distributed no less frequently than once each year. Most shareholders choose to reinvest their dividends and capital gain distribution in additional shares of the Portfolio.
Income dividends and capital gain distributions are determined in accordance with income tax regulations which may differ from GAAP. Differences between tax regulations and GAAP may change the fiscal year when income and capital items are recognized for tax and GAAP purposes. Examples of events that give rise to timing differences include wash sales, straddles, net operating losses and capital loss carryforwards. Further, the character of investment income and capital gains may be different for certain transactions under the two methods of accounting. Examples of characterization differences include the treatment of mortgage paydowns, swaps, foreign currency transactions and contingent debt instruments. As a result, income dividends and capital gain distributions declared during a fiscal period may differ significantly from the net investment income and realized capital gain reported in the Portfolio’s annual financial statements presented under GAAP.
Distributions classified as a tax basis return of capital, if any, are reflected in the accompanying Statements of Changes in Net Assets and have been reclassified to paid in capital. In addition, other amounts have been reclassified between undistributed net investment income, accumulated undistributed net realized gains
| | | | |
| 12 | | PIMCO Variable Insurance Trust | | |
| | |
| |
| | | June 30, 2006 (Unaudited) |
or losses and/or paid in capital to more appropriately conform financial accounting to tax characterizations of dividend distributions.
Multiclass Operations. Each class offered by the Portfolio has equal rights as to assets and voting privileges (except that shareholders of a class have exclusive voting rights regarding any matter relating solely to that class of shares). Income and non-class specific expenses of the Portfolio are allocated daily to each class of shares based on the relative value of settled shares. Realized and unrealized capital gains and losses of the Portfolio are allocated daily to each class of shares based on the relative net assets of each class. Class specific expenses, where applicable, currently include administrative, distribution and servicing fees.
Delayed-Delivery Transactions. The Portfolio may purchase or sell securities on a when-issued or delayed-delivery basis. These transactions involve a commitment by the Portfolio to purchase or sell securities for a predetermined price or yield, with payment and delivery taking place beyond the customary settlement period. When delayed-delivery purchases are outstanding, the Portfolio will designate liquid assets in an amount sufficient to meet the purchase price. When purchasing a security on a delayed-delivery basis, the Portfolio assumes the rights and risks of ownership of the security, including the risk of price and yield fluctuations, and takes such fluctuations into account when determining its net asset value. The Portfolio may dispose of or renegotiate a delayed-delivery transaction after it is entered into, and may sell when-issued securities before they are delivered, which may result in a capital gain or loss. When the Portfolio has sold a security on a delayed-delivery basis, the Portfolio does not participate in future gains and losses with respect to the security.
Federal Income Taxes. The Portfolio intends to qualify as a regulated investment company under sub-chapter M of the Internal Revenue Code and distribute all of its taxable income and net realized gains, if applicable, to shareholders. Accordingly, no provision for Federal income taxes has been made.
Foreign Currency. The accounting records of the Portfolio are maintained in U.S. dollar. The market values of foreign securities, currency holdings and other assets and liabilities are translated into U.S. dollar based on the current exchange rates each business day. Fluctuations in the value of currency holdings and other assets and liabilities resulting from changes in exchange rates are recorded as unrealized foreign currency gains or losses. Realized gains or losses and unrealized appreciation or depreciation on investment securities and income and expenses are translated on the respective dates of such transactions. The effects of changes in foreign currency exchange rates on investments in securities are not segregated in the Statement of Operations from the effects of changes in market prices of those securities, but are included with the net realized and unrealized gain or loss on investment securities.
| | | | | | |
|
| Non-U.S. currency symbols utilized throughout the report are defined as follows: |
| CNY | | Chinese Yuan Renminbi | | | | |
| EUR | | Euro | | | | |
| JPY | | Japanese Yen | | | | |
Forward Currency Transactions. The Portfolio may enter into forward currency contracts in connection with settling planned purchases or sales of securities, to hedge the currency exposure associated with some or all of the Portfolio’s securities or as a part of an investment strategy. A forward currency contract is an agreement between two parties to buy and sell a currency at a set price on a future date. The market value of a forward currency contract fluctuates with changes in forward currency exchange rates. Forward currency contracts are marked to market daily and the change in value is recorded by the Portfolio as an unrealized gain or loss. Realized gains or losses equal to the difference between the value of the contract at the time it was opened and the value at the time it was closed are recorded upon delivery or receipt of the currency or, if a forward currency contract is offset by entering into another forward currency contract with the same broker, upon settlement of the net gain or loss. These contracts may involve market risk in excess of the unrealized gain or loss reflected in the Portfolio’s Statement of Assets and Liabilities. In addition, the Portfolio could be exposed to risk if the counterparties are unable to meet the terms of the contracts or if the value of the currency changes unfavorably to the U.S. dollar.
Futures Contracts. The Portfolio is authorized to enter into futures contracts. The Portfolio may use futures contracts to manage its exposure to the securities markets or to movements in interest rates and currency values. The primary risks associated with the use of futures contracts are the imperfect correlation between the change in market value of the securities held by the Portfolio and the prices of futures contracts, the possibility of an illiquid market, and the inability of the counterparty to meet the terms of the contract. Futures contracts are valued based upon their quoted daily settlement prices. Upon entering into a futures contract, the Portfolio is required to deposit with its custodian, in a segregated account in the name of the futures broker, an amount of cash or U.S. Government and Agency Obligations in accordance with the initial margin requirements of the broker or exchange. Futures contracts are marked to market daily and an appropriate payable or receivable for the change in value (“variation margin”) is recorded by the Portfolio. Gains or losses are recognized but not considered realized until the contracts expire or are closed. Futures contracts involve, to varying degrees, risk of loss in excess of the variation margin disclosed in the Statement of Assets and Liabilities.
Guarantees and Indemnifications. Under the Trust’s organizational documents, each Trustee, officer, employee or other agent of the Trust (including the Trust’s investment manager) is indemnified against certain liabilities that may arise out of performance of their duties to the Portfolio. Additionally, in the normal course of business, the Portfolio enters into contracts that contain a variety of indemnification clauses. The Portfolio’s maximum exposure under these arrangements is unknown as this would involve future claims that may be made against the Portfolio that have not yet occurred. However, the Portfolio has not had prior claims or losses pursuant to these contracts, and believes the risk of loss to be remote.
Options Contracts. The Portfolio may write call and put options on futures, swaps, securities or currencies it owns or in which it may invest. Writing put options tends to increase the Portfolio’s exposure to the underlying instrument. Writing call options tends to decrease the Portfolio’s exposure to the underlying instrument. When the Portfolio writes a call or put option, an amount equal to the premium received is recorded as a liability and subsequently marked to market to reflect the current value of the option written. These liabilities are reflected as written options outstanding in the Statement of Assets and Liabilities. Certain options may be written with premiums to determined on a future date. The premiums for these options are based upon implied volatility parameters at specified terms. Premiums received from writing options which expire are treated as realized gains. Premiums received from writing options which are exercised or closed are added to the proceeds or offset against amounts paid on the underlying future, swap, security or currency transaction to determine the realized gain or loss. The Portfolio as a writer of an option has no control over whether the underlying future, swap, security or currency may be sold (call) or purchased (put) and as a result bears the market risk of an unfavorable change in the price of the future, swap, security or currency underlying the written option. Certain options may be purchase with premiums to determined on a future date. The premiums for these options are based upon implied volatility parameters at specified terms. There is the risk the Portfolio may not be able to enter into a closing transaction because of an illiquid market.
| | | | | | |
| | | Semiannual Report | | June 30, 2006 | | 13 |
Notes to Financial Statements (Cont.)
The Portfolio may also purchase put and call options. Purchasing call options tends to increase the Portfolio’s exposure to the underlying instrument. Purchasing put options tends to decrease the Portfolio’s exposure to the underlying instrument. The Portfolio pays a premium which is included in the Portfolio’s Statement of Assets and Liabilities as an investment and subsequently marked to market to reflect the current value of the option. Premiums paid for purchasing options which expire are treated as realized losses. Certain options may be purchased with premiums to be determined on a future date. The premiums for these options are based upon implied volatility parameters at specified terms. The risk associated with purchasing put and call options is limited to the premium paid. Premiums paid for purchasing options which are exercised or closed are added to the amounts paid or offset against the proceeds on the underlying future, swap, security or currency transaction to determine the realized gain or loss.
Repurchase Agreements. The Portfolio may engage in repurchase transactions. Under the terms of a typical repurchase agreement, the Portfolio takes possession of an underlying debt obligation subject to an obligation of the seller to repurchase, and the Portfolio to resell, the obligation at an agreed-upon price and time. The market value of the collateral must be equal to or exceed at all times the total amount of the repurchase obligations, including interest. Securities purchased under repurchase agreements are reflected as an asset in the Statement of Assets and Liabilities. Generally, in the event of counterparty default, the Portfolio has the right to use the collateral to offset losses incurred. If the counterparty should default, the Portfolio will seek to sell the securities which it holds as collateral. This could involve procedural costs or delays in addition to a loss on the securities if their value should fall below their repurchase price.
Short Sales. The Portfolio may enter into short sales transactions. A short sale is a transaction in which the Portfolio sells securities it does not own in anticipation of a decline in the market price of the securities. Securities sold in short sale transactions and interest payable on such securities, if any, are reflected as a liability in the Statement of Assets and Liabilities. The Portfolio is obligated to deliver securities at the market price at the time the short position is closed. Possible losses from short sales may be unlimited, whereas losses from purchases cannot exceed the total amount invested.
Mortgage-Related and Other Asset-Backed Securities. The Portfolio may invest in mortgage-related or other asset-backed securities. These securities include mortgage pass-through securities, collateralized mortgage obligations (“CMOs”), commercial mortgage-backed securities, mortgage dollar rolls, CMO residuals, stripped mortgage-backed securities (“SMBSs”) and other securities that directly or indirectly represent a participation in, or are secured by and payable from, mortgage loans on real property. The value of some mortgage- or asset-backed securities may be particularly sensitive to changes in prevailing interest rates. Early repayment of principal on some mortgage-related securities may expose a Portfolio to a lower rate of return upon reinvestment of principal. The value of these securities may fluctuate in response to the market’s perception of the creditworthiness of the issuers. Additionally, although mortgages and mortgage-related securities are generally supported by some form of government or private guarantee and/or insurance, there is no assurance that private guarantors or insurers will meet their obligations.
One type of SMBS has one class receiving all of the interest from the mortgage assets (the interest-only, or “IO” class), while the other class will receive all of the principal (the principal-only, or “PO” class). Payments received for IOs are included in interest income in the Statement of Operations. Because principal will not be received at the maturity of an IO, adjustments are made to the book value of the security on a daily basis until maturity. These adjustments are included in interest income in the Statement of Operations. Payments received for POs are treated as reductions to the cost and par value of the securities.
Swap Agreements. The Portfolio may engage in swap transactions, including, but not limited to, swap agreements on interest rate, total return, forward spread-lock and credit default to manage its exposure to interest rates and credit risk. In connection with these agreements, securities may be identified as collateral in accordance with the terms of the respective swap agreements.
Interest rate swap agreements involve the exchange by the Portfolio with another party of their respective commitments to pay or receive interest, e.g., an exchange of floating rate payments for fixed rate payments with respect to the notional amount of principal.
Swaps are marked to market daily based upon quotations from market makers and the change in value, if any, is recorded as unrealized gain or loss in the Statement of Operations. Payments received or made at the beginning of the measurement period are reflected as such in the Statement of Assets and Liabilities. These upfront payments are recorded as realized gain or loss in the Statement of Operations upon termination or maturity of the swap. A liquidation payment received or made at the termination of the swap is recorded as realized gain or loss in the Statement of Operations. Net periodic payments received or paid by the Portfolio are included as part of realized gain or loss in the Statement of Operations. Entering into these agreements involves, to varying degrees, elements of credit, market and documentation risk in excess of the amounts recognized in the Statement of Assets and Liabilities. Such risks involve the possibility that there will be no liquid market for these agreements, that the counterparty to the agreements may default on its obligation to perform or disagree as to the meaning of contractual terms in the agreements and that there may be unfavorable changes in interest rates.
U.S. Government Agencies or Government-Sponsored Enterprises. Securities issued by U.S. Government agencies or government-sponsored enterprises may not be guaranteed by the U.S. Treasury. The Government National Mortgage Association (“GNMA”), a wholly owned U.S. Government corporation, is authorized to guarantee, with the full faith and credit of the U.S. Government, the timely payment of principal and interest on securities issued by institutions approved by GNMA and backed by pools of mortgages insured by the Federal Housing Administration or guaranteed by the Department of Veterans Affairs. Government-related guarantors (i.e., not backed by the full faith and credit of the U.S. Government) include the Federal National Mortgage Association (“FNMA” or “Fannie Mae”) and the Federal Home Loan Mortgage Corporation (“FHLMC” or “Freddie Mac”). Pass-through securities issued by FNMA are guaranteed as to timely payment of principal and interest by FNMA but are not backed by the full faith and credit of the U.S. Government. FHLMC guarantees the timely payment of interest and ultimate collection of principal, but its participation certificates are not backed by the full faith and credit of the U.S. Government.
New Accounting Policies. In July 2006, the Financial Accounting Standards Board issued Interpretation No. 48, “Accounting for Uncertainty in Income Taxes—an Interpretation of FASB Statement No. 109” (the “Interpretation”). The Interpretation is effective for fiscal years beginning after December 15, 2006. Management is currently evaluating the application of the Interpretation to the Portfolio and will provide additional information in relation to the Interpretation in the Portfolio’s annual financial statements for the year ending December 31, 2006.
3. FEES, EXPENSES, AND RELATED PARTY TRANSACTIONS
Investment Advisory Fee. PIMCO is a majority-owned subsidiary of Allianz Global Investors of America L.P. (“AGI”), and serves as investment adviser (the “Adviser”) to the Trust, pursuant to an investment advisory contract. The Adviser receives a monthly fee at an annual rate based on average daily net assets of the Portfolio. The Advisory Fee is charged at an annual rate of 0.25%.
| | | | |
| 14 | | PIMCO Variable Insurance Trust | | |
| | |
| |
| | | June 30, 2006 (Unaudited) |
Administration Fee. PIMCO serves as administrator (the “Administrator”), and provides administrative services to the Trust for which it receives a monthly administrative fee based on average daily net assets of the Portfolio. As the Administrator, PIMCO bears the costs of various third-party services, including audit, custodial, portfolio accounting, legal, transfer agency and printing costs. The Administration Fee is charged at the annual rate of 0.20%.
Distribution and Servicing Fees. Allianz Global Investors Distributors LLC (“AGID”) is an indirect wholly-owned subsidiary of AGI and serves as the distributor of the Trust’s shares. The Trust is permitted to reimburse AGID on a quarterly basis, out of the Administrative Class assets of the Portfolio in the amount of 0.15% on an annual basis of the average daily net assets of that class, for payments made to financial intermediaries that provide services in connection with the distribution of shares or administration of plans or programs that use Portfolio shares as their funding medium. The effective rate paid to AGID was 0.15% during the current fiscal year.
Expenses. The Trust is responsible for the following expenses: (i) salaries and other compensation of any of the Trust’s executive officers and employees who are not officers, directors, stockholders or employees of PIMCO or its subsidiaries or affiliates; (ii) taxes and governmental fees; (iii) brokerage fees and commissions and other portfolio transaction expenses; (iv) the costs of borrowing money, including interest expenses and bank overdraft charges; (v) fees and expenses of the Trustees who are not “interested persons” of PIMCO or the Trust, and any counsel retained exclusively for their benefit; (vi) extraordinary expenses, including costs of litigation and indemnification expenses; (vii) organization expenses and (viii) any expenses allocated or allocable to a specific class of shares, which include service fees payable with respect to the Administrative Class shares and may include certain other expenses as permitted by the Trust’s Multiple Class Plan adopted pursuant to Rule 18f-3 under the Act and subject to review and approval by the Trustees. The ratio of expenses to average net assets per share class, as disclosed in the Financial Highlights, may differ from the annual portfolio operating expenses per share class as disclosed in the Prospectus for the reasons set forth above.
For the current period ended June 30, 2006, each unaffiliated Trustee received an annual retainer of $15,000, plus $2,000 for each Board of Trustees quarterly meeting attended, $500 for each Board of Trustees committee meeting attended and $500 for each special board meeting attended, plus reimbursement of related expenses. In addition, each Committee Chair received an additional annual retainer of $500 and each Audit Committee Chair received an additional annual retainer of $1,500. These expenses are allocated on a pro-rata basis to each Portfolio of the Trust according to its respective net assets. The Trust pays no compensation directly to any Trustee or any other officer who is affiliated with the Administrator, all of whom receive remuneration for their services to the Trust from the Administrator or its affiliates.
4. PURCHASES AND SALES OF SECURITIES
The length of time the Portfolio has held a particular security is not generally a consideration in investment decisions. A change in the securities held by the Portfolio is known as “portfolio turnover”. The Portfolio may engage in frequent and active trading of portfolio securities to achieve its investment objective, particularly during periods of volatile market movements. High portfolio turnover (e.g., over 100%) involves correspondingly greater expenses to the Portfolio, including brokerage commissions or dealer mark-ups and other transaction costs on the sale of securities and reinvestments in other securities. Such sales may also result in realization of taxable capital gains, including short-term capital gains (which are generally taxed at ordinary income tax rates). The trading costs and tax effects associated with portfolio turnover may adversely affect the Portfolio’s performance.
Purchases and sales of securities (excluding short-term investments) for the period ended June 30, 2006 were as follows (amounts in thousands):
| | | | | | | | | | | | |
| U.S Government/Agency | | | | All Other |
| Purchases | | | | Sales | | | | Purchases | | | | Sales |
| $ 2,046 | | | | $ 4,720 | | | | $ 7,331 | | | | $ 5,624 |
5. TRANSACTIONS IN WRITTEN CALL AND PUT OPTIONS
Transactions in written call and put options were as follows (amounts in thousands, except number of contracts):
| | | | | | | | | | | | | | | | | |
| | | | | # of
Contracts |
| | | |
| Notional
Amount
in $ |
| | | | | Premium | |
Balance at 12/31/2005 | | | | 48 | | | | | $ | 3,600 | | | | | $ | 38 | |
Sales | | | | 0 | | | | | | 4,700 | | | | | | 24 | |
Closing Buys | | | | (8 | ) | | | | | (3,100 | ) | | | | | (25 | ) |
Expirations | | | | (40 | ) | | | | | (2,500 | ) | | | | | (26 | ) |
Exercised | | | | 0 | | | | | | 0 | | | | | | 0 | |
Balance at 06/30/2006 | | | | 0 | | | | | $ | 2,700 | | | | | $ | 11 | |
6. SHARES OF BENEFICIAL INTEREST
The Portfolio may issue an unlimited number of shares of beneficial interest with a $0.001 par value. Changes in shares of beneficial interest were as follows (shares and amounts in thousands):
| | | | | | | | | | | | | | | | | | |
| | | | | Six Months Ended
06/30/2006 | | | | | Year Ended
12/31/2005 | |
| | | | | Shares | | | Amount | | | | | Shares | | | Amount | |
| | | | | | |
Receipts for shares sold | | | | | | | | | | | | | | | | | | |
Institutional Class | | | | 1,602 | | | $ | 16,084 | | | | | 1,998 | | | $ | 20,119 | |
Administrative Class | | | | 340 | | | | 3,411 | | | | | 305 | | | | 3,074 | |
Issued as reinvestment of distributions | | | | | | | | | | | | | | | | | | |
Institutional Class | | | | 49 | | | | 487 | | | | | 89 | | | | 892 | |
Administrative Class | | | | 18 | | | | 182 | | | | | 22 | | | | 218 | |
Cost of shares redeemed | | | | | | | | | | | | | | | | | | |
Institutional Class | | | | (3,255 | ) | | | (32,679 | ) | | | | (1,373 | ) | | | (13,817 | ) |
Administrative Class | | | | (231 | ) | | | (2,317 | ) | | | | (333 | ) | | | (3,355 | ) |
Net increase (decrease) resulting from Portfolio share transactions | | | | (1,477 | ) | | $ | (14,832 | ) | | | | 708 | | | $ | 7,131 | |
The following schedule shows the number of shareholders each owning 5% or more of the Portfolio and the total percentage of the Portfolio held by such shareholders:
| | | | | | |
| | | | | Number of
Shareholders | | % of Portfolio
Held |
Institutional Class | | | | 2 | | 97 |
Administrative Class | | | | 4 | | 85 |
7. FEDERAL INCOME TAX MATTERS
As of June 30, 2006, the aggregate cost of investments was the same for federal income tax and financial statement purposes. The net unrealized appreciation (depreciation) of investment securities for federal income tax purposes is as follows (amounts in thousands):
| | | | |
Aggregate Gross Unrealized Appreciation | | Aggregate
Gross
Unrealized
(Depreciation) | | Net
Unrealized
(Depreciation) |
$ 17 | | $ (52) | | $ (35) |
| | | | | | |
| | | Semiannual Report | | June 30, 2006 | | 15 |
Notes to Financial Statements (Cont.)
8. REGULATORY AND LITIGATION MATTERS
On June 1, 2004, the Attorney General of the State of New Jersey announced that it had dismissed PIMCO from a complaint filed by the New Jersey Attorney General on February 17, 2004, and that it had entered into a settlement agreement (the “New Jersey Settlement”) with Allianz Global Investors of America L.P. (“AGI”) (formerly known as Allianz Dresdner Asset Management of America L.P.), PEA Capital LLC (an entity affiliated with PIMCO through common ownership) (“PEA”) and Allianz Global Investors Distributors LLC (“AGID”), in connection with the same matter. In the New Jersey Settlement, AGI, PEA and AGID neither admitted nor denied the allegations or conclusions of law, but did agree to pay New Jersey a civil fine of $15 million and $3 million for investigative costs and further potential enforcement initiatives against unrelated parties. They also undertook to implement certain governance changes. The complaint relating to the New Jersey Settlement alleged, among other things, that AGI, PEA and AGID had failed to disclose that they improperly allowed certain hedge funds to engage in “market timing” in certain funds. The complaint sought injunctive relief, civil monetary penalties, restitution and disgorgement of profits.
Since February 2004, PIMCO, AGI, PEA, AGID, and certain of their affiliates, including the PIMCO Funds, the Allianz Funds (formerly known as PIMCO Funds: Multi-Manager Series), and the Trustees and employees of the PIMCO Funds, have been named as defendants in fifteen lawsuits filed in various jurisdictions. Eleven of those lawsuits concern “market timing,” and they have been transferred to and consolidated for pre-trial proceedings in a multi-district litigation proceeding in the U.S. District Court for the District of Maryland; the other four lawsuits concern “revenue sharing” and have been consolidated into a single action in the U.S. District Court for the District of Connecticut. The lawsuits have been commenced as putative class actions on behalf of investors who purchased, held or redeemed shares of the various series of the PIMCO Funds and the Allianz Funds during specified periods, or as derivative actions on behalf of the PIMCO Funds and Allianz Funds.
The market timing actions in the District of Maryland generally allege that certain hedge funds were allowed to engage in “market timing” in certain of the PIMCO Funds and the Allianz Funds and this alleged activity was not disclosed. Pursuant to tolling agreements entered into with the derivative and class action plaintiffs, PIMCO, the Trustees, and certain employees of PIMCO who were previously named as defendants have all been dropped as defendants in the market timing actions; the plaintiffs continue to assert claims on behalf of the shareholders of the PIMCO Funds or on behalf of the PIMCO Funds themselves against other defendants. By order dated November 3, 2005, the U.S. District Court for the District of Maryland granted the PIMCO Funds’ motion to dismiss claims asserted against it in a consolidated amended complaint where the PIMCO Funds were named, in the complaint, as a nominal defendant. The revenue sharing action in the District of Connecticut generally alleges that fund assets were inappropriately used to pay brokers to promote the PIMCO Funds and Allianz Funds, including directing fund brokerage transactions to such brokers, and that such alleged arrangements were not fully disclosed to shareholders. On August 11, 2005 the U.S. District Court for the District of Connecticut conducted a hearing on defendants’ motion to dismiss the consolidated amended complaint in the revenue sharing action but has not yet ruled on the motion to dismiss. The market timing and revenue sharing lawsuits seek, among other things, unspecified compensatory damages plus interest and, in some cases, punitive damages, the rescission of investment advisory contracts, the return of fees paid under those contracts and restitution.
Under Section 9(a) of the Investment Company Act of 1940, as amended (“1940 Act”), if the New Jersey Settlement or any of the lawsuits described above were to result in a court injunction against AGI, PEA, AGID and/or their affiliates, PIMCO could, in the absence of exemptive relief granted by the SEC, be barred from serving as an investment adviser, and AGID could be barred from serving as principal underwriter, to any registered investment company, including the Portfolios of the Trust. In connection with an inquiry from the SEC concerning the status of the New Jersey Settlement under Section 9(a), PEA, AGID, AGI and certain of their affiliates (including PIMCO) (together, the “Applicants”) have sought exemptive relief from the SEC under Section 9(c) of the 1940 Act. The SEC has granted the Applicants a temporary exemption from the provisions of Section 9(a) with respect to the New Jersey Settlement until the earlier of (i) September 13, 2006 and (ii) the date on which the SEC takes final action on their application for a permanent order. There is no assurance that the SEC will issue a permanent order.
Two nearly identical class action civil complaints have been filed in August 2005, in the Northern District of Illinois Eastern Division alleging that the plaintiffs each purchased and sold a 10-year Treasury note futures contract and suffered damages from an alleged shortage when PIMCO held both physical and futures positions in 10-year Treasury notes for its client accounts. The two actions have been consolidated into one action, and the two separate complaints have been replaced by a consolidated complaint. PIMCO is a named defendant, and the PIMCO Funds have been added as a defendant, to the consolidated action. PIMCO strongly believes the complaint (and any consolidated complaint filed hereafter) is without merit and intends to vigorously defend itself.
Certain Portfolios of the Trust were recently served in an adversary proceeding brought by the Official Committee of Asbestos Claimants of G-I Holdings, Inc. in G-I Holdings, Inc.’s bankruptcy in the District of New Jersey. PIMCO was previously named in this lawsuit and remains a defendant. The plaintiff seeks to recover for the bankruptcy estate assets that were transferred by the predecessor entity of G-I Holdings, Inc. to a wholly-owned subsidiary in 1994. The subsidiary has since issued notes, of which certain Portfolios of the Trust are alleged to be holders. The complaint alleges that in 2000, more than two hundred noteholders—including certain Portfolios of the Trust—were granted a second priority lien on the assets of the subsidiary in exchange for their consent to a refinancing transaction and the granting of a first priority lien to the lending banks. The plaintiff is seeking invalidation of the lien in favor of the noteholders and/or the value of the lien.
It is possible that these matters and/or other developments resulting from these matters could result in increased fund redemptions or other adverse consequences to the Portfolios. However, PIMCO and AGID believe that these matters are not likely to have a material adverse effect on the Portfolios or on PIMCO’s or AGID’s ability to perform their respective investment advisory or distribution services relating to the Portfolios.
| | | | |
| 16 | | PIMCO Variable Insurance Trust | | |
Investment Adviser and Administrator
Pacific Investment Management Company LLC
840 Newport Center Drive
Newport Beach, California 92660
Distributor
Allianz Global Investors Distributors LLC
2187 Atlantic Street
Stamford, Connecticut 06902
Custodian
State Street Bank & Trust Company
801 Pennsylvania
Kansas City, Missouri 64105
Transfer Agent
Boston Financial Data Services–Midwest
330 W. 9th Street
Kansas City, Missouri 64105
Legal Counsel
Dechert LLP
1775 I Street, N.W.
Washington, D.C. 20006
Independent Registered Public Accounting Firm
PricewaterhouseCoopers LLP
1055 Broadway
Kansas City, Missouri 64105
P I M C O
Share Class Institutional
Semiannual Report June 30, 2006
PIMCO Variable Insurance Trust
Short-Term Portfolio
Table of Contents
This material is authorized for use only when preceded or accompanied by the current PIMCO Variable Insurance Trust (the “Trust”) prospectus. Investors should consider the investment objectives, risks, charges and expenses of this Trust carefully before investing. Ask your financial professional to explain all charges that may apply. This and other information is contained in the Trust’s prospectus. The variable product prospectus may be obtained by contacting your Investment Consultant. Please read the Trust and variable product prospectus carefully before you invest or send money.
Chairman’s Letter
Dear PIMCO Variable Insurance Trust Shareholder:
It is our pleasure to present to you the semiannual report for the PIMCO Variable Insurance Trust covering the six-month period ended June 30, 2006.
Highlights of the global bond markets during the six-month period included:
| | n | | Most fixed-income sectors lost ground during the first half of 2006, as concern about accelerating inflation and central bank tightening pushed interest rates higher worldwide. The benchmark Lehman Brothers Aggregate Bond Index (which includes Treasury, Investment-Grade Corporate, and Residential Mortgage-Backed Securities) returned -0.72% for the first six months of the year. On June 30, the benchmark ten-year Treasury yielded 5.14%, 0.75% higher than at the start of the year. The U.S. yield curve remained flat as shorter-maturity yields rose by a comparable amount. |
| | n | | The Federal Reserve tightened four times during the reporting period, bringing the Federal Funds Rate to 5.25%. The increase near the end of the period was the Federal Reserve’s 17th consecutive rate hike since the start of its tightening cycle in 2004. The Federal Reserve was not alone, as central banks in Europe, India, and China tightened credit in unison for the first time since 2000. The Bank of Japan, whose zero-interest-rate policy has flooded global markets with liquidity, looked set to reverse this policy in the coming months. |
In these pages please find a more complete Portfolio review as it relates to financial-market activities, as well as details about total-return investment performance for the six-month reporting period. Thank you for the trust you have placed in us. We will continue to work diligently to meet your investment needs.
Sincerely,
Brent R. Harris
Chairman, PIMCO Variable Insurance Trust
July 31, 2006
| | | | | | |
| | | Semiannual Report | | June 30, 2006 | | 1 |
Important Information About the Portfolio
PIMCO Variable Insurance Trust (the “Trust”) is an open-end management investment company currently consisting of nineteen separate investment portfolios, including the Short-Term Portfolio (the “Portfolio”). The Portfolio is only available as a funding vehicle under variable life insurance policies or variable annuity contracts issued by insurance companies (“Variable Contracts”). Individuals may not purchase shares of the Portfolio directly. Shares of the Portfolio also may be sold to qualified pension and retirement plans outside of the separate account context.
We believe that bond funds have an important role to play in a well diversified investment portfolio. It is important to note, however, that in an environment where interest rates may trend upward, rising rates would negatively impact the performance of most bond funds, and fixed-income securities held by a fund are likely to decrease in value. The price volatility of fixed-income securities can also increase during periods of rising interest rates resulting in increased losses to a fund. Bond funds and individual bonds with a longer duration (a measure of the expected life of a security) tend to be more sensitive to changes in interest rates, usually making them more volatile than securities or funds with shorter durations. The longer-term performance of most bond funds has benefited from capital gains in part resulting from an extended period of declining interest rates. In the event interest rates increase, these capital gains should not be expected to recur.
The Portfolio may be subject to various risks in addition to those described above. Some of these risks may include, but are not limited to, the following: credit risk, high yield risk, market risk, issuer risk, derivatives risk, mortgage risk, non-U.S. investment risk, currency risk, leveraging risk and management risk. A complete description of these risks is contained in the Portfolio’s prospectus. The Portfolio may use derivative instruments for hedging purposes or as part of an investment strategy. Use of these instruments may involve certain costs and risks such as liquidity risk, interest rate risk, market risk, credit risk, management risk and the risk that the Portfolio could not close out a position when it would be most advantageous to do so. A Portfolio investing in derivatives could lose more than the principal amount invested in these instruments. Investing in non-U.S. securities may entail risk due to non-U.S. economic and political developments.
On the performance summary page in this Semiannual Report, the Total Return Investment Performance table measures performance assuming that all dividend and capital gain distributions were reinvested.
An investment in the Portfolio is not a deposit of a bank and is not guaranteed or insured by the Federal Deposit Insurance Corporation or any other government agency. It is possible to lose money on investments in the Portfolio.
PIMCO has adopted written proxy voting policies and procedures (“Proxy Policy”) as required by Rule 206(4)-6 under the Investment Advisers Act of 1940. The Proxy Policy has been adopted by the Trust as the policies and procedures that PIMCO will use when voting proxies on behalf of the Portfolio. Copies of the written Proxy Policy and the factors that PIMCO may consider in determining how to vote proxies for the Portfolio, and information about how the Portfolio voted proxies relating to portfolio securities held during the most recent twelve-month period ended June 30, are available without charge, upon request, by calling the Trust at 1-866-746-2606 and on the Securities and Exchange Commission’s (“SEC”) website at http://www.sec.gov.
The Portfolio files its complete schedule of portfolio holdings with the SEC for the first and third quarters of each fiscal year on Form N-Q. A copy of the Trust’s Form N-Q is available on the SEC’s website at http://www.sec.gov and may be reviewed and copied at the SEC’s Public Reference Room in Washington D.C. Information on the operation of the Public Reference Room may be obtained by calling 1-800-SEC-0330.
PIMCO Variable Insurance Trust is distributed by Allianz Global Investors Distributors LLC, 2187 Atlantic Street, Stamford, CT 06902.
| | | | |
| 2 | | PIMCO Variable Insurance Trust | | |
The following disclosure provides important information regarding the Portfolio’s Expense Example (“Example” or “Expense Example”), which appears in this Semiannual Report. Please refer to this information when reviewing the Expense Example for the Portfolio.
Example
As a shareholder of the Portfolio, you incur two types of costs: (1) transaction costs and (2) ongoing costs, including advisory and administrative fees; distribution and/or service (12b-1) fees (Administrative Class only); and other Portfolio expenses. The Example is intended to help you understand your ongoing costs (in dollars) of investing in the Portfolio and to compare these costs with the ongoing costs of investing in other mutual funds. The Expense Example does not reflect any fees or other expenses imposed by the Variable Contracts. If it did, the expenses reflected in the Expense Examples would be higher. The Example is based on an investment of $1,000 invested at the beginning of the period and held for the entire period indicated, which is from January 1, 2006 to June 30, 2006.
Actual Expenses
The information in the table under the heading “Actual Performance” provides information about actual account values and actual expenses. You may use the information in these columns, together with the amount you invested, to estimate the expenses that you paid over the period. Simply divide your account value by $1,000 (for example, an $8,600 account value divided by $1,000 = 8.60), then multiply the result by the number in the appropriate column for your share class, in the row titled “Expenses Paid During Period” to estimate the expenses you paid on your account during this period.
Hypothetical Example for Comparison Purposes
The information in the table under the heading “Hypothetical Performance (5% return before expenses)” provides information about hypothetical account values and hypothetical expenses based on the Portfolio’s actual expense ratio and an assumed rate of return of 5% per year before expenses, which is not the Portfolio’s actual return. The hypothetical account values and expenses may not be used to estimate the actual ending account balance or expenses you paid for the period. You may use this information to compare the ongoing costs of investing in the Portfolio and other portfolios. To do so, compare this 5% hypothetical example with the 5% hypothetical examples that appear in the shareholder reports of the other portfolios.
Please note that the expenses shown in the table are meant to highlight your ongoing costs only and do not reflect any transactional costs. Therefore, the information under the heading “Hypothetical Performance (5% return before expenses)” is useful in comparing ongoing costs only, and will not help you determine the relative total costs of owning different portfolios. In addition, if these transactional costs were included, your costs would have been higher.
The expense ratio may vary period to period because of various factors, such as an increase in expenses not covered by the advisory and administrative fees (such as expenses of the trustees and their counsel or litigation expense).
Portfolio Benchmark
Citigroup 3-Month Treasury Bill Index is an unmanaged index representing monthly return equivalents of yield averages of the last 3-Month Treasury Bill issues. It is not possible to invest directly in the index.
| | | | | | |
| | | Semiannual Report | | June 30, 2006 | | 3 |
|
|
| PIMCO Short-Term Portfolio |
|
Cumulative Returns Through June 30, 2006
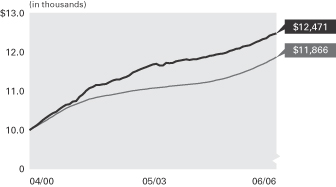
Short-Term Portfolio
Institutional Class Lipper Money Market Index
------------------- -------------------------
04/30/2000 $10,000 $10,000
05/31/2000 10,058 10,049
06/30/2000 10,114 10,096
07/31/2000 10,174 10,145
08/31/2000 10,249 10,195
09/30/2000 10,318 10,246
10/31/2000 10,377 10,299
11/30/2000 10,433 10,352
12/31/2000 10,464 10,407
01/31/2001 10,539 10,460
02/28/2001 10,600 10,505
03/31/2001 10,644 10,552
04/30/2001 10,664 10,592
05/31/2001 10,727 10,631
06/30/2001 10,746 10,665
07/31/2001 10,852 10,699
08/31/2001 10,914 10,731
09/30/2001 11,005 10,762
10/31/2001 11,075 10,790
11/30/2001 11,104 10,813
12/31/2001 11,153 10,832
01/31/2002 11,155 10,849
02/28/2002 11,171 10,864
03/31/2002 11,177 10,879
04/30/2002 11,230 10,895
05/31/2002 11,269 10,911
06/30/2002 11,293 10,927
07/31/2002 11,292 10,943
08/31/2002 11,335 10,958
09/30/2002 11,356 10,974
10/31/2002 11,404 10,989
11/30/2002 11,477 11,003
12/31/2002 11,508 11,016
01/31/2003 11,548 11,028
02/28/2003 11,582 11,038
03/31/2003 11,615 11,049
04/30/2003 11,648 11,060
05/31/2003 11,679 11,071
06/30/2003 11,694 11,081
07/31/2003 11,652 11,090
08/31/2003 11,656 11,099
09/30/2003 11,715 11,108
10/31/2003 11,707 11,117
11/30/2003 11,720 11,126
12/31/2003 11,761 11,134
01/31/2004 11,773 11,143
02/29/2004 11,795 11,151
03/31/2004 11,807 11,160
04/30/2004 11,796 11,169
05/31/2004 11,807 11,178
06/30/2004 11,806 11,187
07/31/2004 11,832 11,198
08/31/2004 11,856 11,210
09/30/2004 11,871 11,223
10/31/2004 11,899 11,238
11/30/2004 11,905 11,254
12/31/2004 11,931 11,273
01/31/2005 11,951 11,293
02/28/2005 11,959 11,313
03/31/2005 11,984 11,336
04/30/2005 12,022 11,361
05/31/2005 12,050 11,388
06/30/2005 12,079 11,415
07/31/2005 12,085 11,444
08/31/2005 12,140 11,474
09/30/2005 12,151 11,506
10/31/2005 12,172 11,539
11/30/2005 12,207 11,574
12/31/2005 12,250 11,611
01/31/2006 12,289 11,650
02/28/2006 12,327 11,687
03/31/2006 12,350 11,730
04/30/2006 12,414 11,774
05/31/2006 12,446 11,820
06/30/2006 12,471 11,866
$10,000 invested at the beginning of the first full month following the inception date of the Portfolio’s Institutional Class.
Sector Breakdown‡
| | |
Short-Term Instruments | | 37.1% |
Asset-Backed Securities | | 23.2% |
U.S. Government Agencies | | 17.3% |
Corporate Bonds & Notes | | 14.7% |
Mortgage-Backed Securities | | 7.2% |
Other | | 0.5% |
| | ‡ | % of Total Investments as of June 30, 2006 |
| | | | | | | | | | | | |
| Average Annual Total Return for the period ended June 30, 2006 |
| | | | | | | 6 Months* | | 1 Year | | 5 Years | | Since Inception
(04/28/00)** |
| | |
| | PIMCO Short-Term Portfolio Institutional Class | | 1.80% | | 3.24% | | 3.02% | | 3.64% |
| | |
| | Lipper Money Market Index | | 2.19% | | 3.95% | | 2.16% | | 2.81% |
All Portfolio returns are net of fees and expenses.
* Cumulative return.
** The Institutional Class shares commenced operations on 04/28/00. Index comparisons began on 04/30/00.
Past performance is no guarantee of future results. The performance quoted represents past performance. Investment return and principal value will fluctuate so the Portfolio shares, when redeemed, may be worth more or less than their original cost. The Portfolio’s performance does not reflect the deduction of additional charges and expenses imposed in connection with investing in Variable Contracts, which will reduce returns. Current performance may be lower or higher than the performance data quoted. Performance data current to the most recent month-end is available by calling (800) 927-4648.
| | | | | | | | |
| Expense Example | | Actual Performance | | | | Hypothetical Performance |
| | | | | | | (5% return before expenses) |
Beginning Account Value (01/01/06) | | $ | 1,000.00 | | | | $ | 1,000.00 |
Ending Account Value (06/30/06) | | $ | 1,018.00 | | | | $ | 1,022.56 |
Expenses Paid During Period† | | $ | 2.25 | | | | $ | 2.26 |
† Expenses are equal to the Portfolio’s Institutional Class annualized expense ratio of 0.45%, multiplied by the average account value over the period, multiplied by 181/365 (to reflect the one-half year period). Overall fees and expenses of investing in the Portfolio will be higher because the example does not reflect Variable Contract fees and expenses.
Please refer to page 3 herein for a description of the Portfolio’s benchmark and an explanation of the information presented in the above Expense Example.
Portfolio Insights
| » | | The PIMCO Short-Term Portfolio seeks to achieve its investment objective by investing under normal circumstances at least 65% of its total assets in a diversified portfolio of Fixed-Income Instruments of varying maturities. |
| » | | The first half of the year was a difficult environment for the Short-Term strategy as most bonds lagged money market instruments; concern about accelerating inflation and central bank tightening pushed interest rates higher worldwide. |
| » | | U.S. interest rate exposure was the dominant cause of underperformance as Federal Reserve rate hikes totaled 1.00% during the first half of the year. |
| » | | The Portfolio’s curve steepening bias was a negative contributor to performance as the U.S. treasury yield curve flattened in conjunction with increasing rates—three month rates increased approximately 0.90% while intermediate rates only increased about by 0.75%. |
| » | | Broad diversification to higher-yielding bond sectors, including mortgages, corporates, and emerging market securities, helped partially buffer the underperformance associated with rising rates. |
| » | | Asset-backed bonds helped returns amid strong demand for their higher yield relative to money market instruments and for their collateral protection. |
| » | | Long exposure to the Yen and to Euro currency helped performance as both currencies appreciated relative to the U.S. dollar during the first half of the year. |
| | | | | | |
| 4 | | PIMCO Variable Insurance Trust | | | | |
|
|
| Financial Highlights Short-Term Portfolio |
| | | | | | | | | | | | | | | | | | | | | | | | |
| Selected Per Share Data for the Year or Period Ended: | | 06/30/2006+ | | | 12/31/2005 | | | 12/31/2004 | | | 12/31/2003 | | | 12/31/2002 | | | 12/31/2001 | |
| | | | | | |
Institutional Class | | | | | | | | | | | | | | | | | | | | | | | | |
| Net asset value beginning of period | | $ | 10.05 | | | $ | 10.08 | | | $ | 10.10 | | | $ | 10.08 | | | $ | 10.08 | | | $ | 10.01 | |
| Net investment income (a) | | | 0.21 | | | | 0.30 | | | | 0.14 | | | | 0.14 | | | | 0.30 | | | | 0.53 | |
| Net realized/unrealized gain (loss) on investments (a) | | | (0.03 | ) | | | (0.03 | ) | | | — | | | | 0.08 | | | | 0.01 | | | | 0.12 | |
| Total income from investment operations | | | 0.18 | | | | 0.27 | | | | 0.14 | | | | 0.22 | | | | 0.31 | | | | 0.65 | |
| Dividends from net investment income | | | (0.21 | ) | | | (0.30 | ) | | | (0.14 | ) | | | (0.19 | ) | | | (0.30 | ) | | | (0.54 | ) |
| Distributions from net realized capital gains | | | 0.00 | | | | 0.00 | | | | (0.02 | ) | | | (0.01 | ) | | | (0.01 | ) | | | (0.04 | ) |
| Total distributions | | | (0.21 | ) | | | (0.30 | ) | | | (0.16 | ) | | | (0.20 | ) | | | (0.31 | ) | | | (0.58 | ) |
| Net asset value end of period | | $ | 10.02 | | | $ | 10.05 | | | $ | 10.08 | | | $ | 10.10 | | | $ | 10.08 | | | $ | 10.08 | |
| Total return | | | 1.80 | % | | | 2.67 | % | | | 1.45 | % | | | 2.20 | % | | | 3.18 | % | | | 6.59 | % |
| Net assets end of period (000s) | | $ | 16,243 | | | $ | 32,419 | | | $ | 25,320 | | | $ | 14,932 | | | $ | 4,893 | | | $ | 4,093 | |
| Ratio of expenses to average net assets | | | 0.45 | %* | | | 0.45 | % | | | 0.45 | % | | | 0.45 | % | | | 0.45 | % | | | 0.47 | %(b)(c) |
| Ratio of net investment income to average net assets | | | 4.13 | %* | | | 2.95 | % | | | 1.34 | % | | | 1.36 | % | | | 2.99 | % | | | 5.27 | % |
| Portfolio turnover rate | | | 46 | % | | | 154 | % | | | 251 | % | | | 199 | % | | | 60 | % | | | 94 | % |
+ Unaudited
* Annualized
(a) Per share amounts based on average number of shares outstanding during the period.
(b) Ratio of expenses to average net assets excluding interest expense is 0.45%.
(c) If the investment manager had not reimbursed expenses, the ratio of expenses to average net assets would have been 0.46%.
| | | | | | |
| See Accompanying Notes | | Semiannual Report | | June 30, 2006 | | 5 |
|
|
| Statement of Assets and Liabilities Short-Term Portfolio |
| | | | |
| (Amounts in thousands, except per share amounts) | | June 30, 2006
(Unaudited) | |
| |
Assets: | | | | |
Investments, at value | | $ | 25,050 | |
Cash | | | 3 | |
Foreign currency, at value | | | 493 | |
Receivable for investments sold on delayed-delivery basis | | | 205 | |
Receivable for Portfolio shares sold | | | 179 | |
Interest and dividends receivable | | | 63 | |
Variation margin receivable | | | 4 | |
Swap premiums paid | | | 17 | |
Unrealized appreciation on forward foreign currency contracts | | | 10 | |
Unrealized appreciation on swap agreements | | | 5 | |
| | | | 26,029 | |
| |
Liabilities: | | | | |
Payable for investments purchased | | $ | 5 | |
Payable for short sales | | | 204 | |
Payable for Portfolio shares redeemed | | | 2 | |
Written options outstanding | | | 5 | |
Accrued investment advisory fee | | | 5 | |
Accrued administration fee | | | 4 | |
Accrued servicing fee | | | 1 | |
Swap premiums received | | | 49 | |
Unrealized depreciation on forward foreign currency contracts | | | 64 | |
Unrealized depreciation on swap agreements | | | 16 | |
| | | | 355 | |
| |
Net Assets | | $ | 25,674 | |
| |
Net Assets Consist of: | | | | |
Paid in capital | | $ | 25,875 | |
Undistributed net investment income | | | 36 | |
Accumulated undistributed net realized (loss) | | | (56 | ) |
Net unrealized (depreciation) | | | (181 | ) |
| | | $ | 25,674 | |
| |
Net Assets: | | | | |
Institutional Class | | $ | 16,243 | |
Administrative Class | | | 9,431 | |
| |
Shares Issued and Outstanding: | | | | |
Institutional Class | | | 1,622 | |
Administrative Class | | | 942 | |
| |
Net Asset Value and Redemption Price Per Share (Net Assets Per Share Outstanding) | | | | |
Institutional Class | | $ | 10.02 | |
Administrative Class | | | 10.02 | |
| |
Cost of Investments Owned | | $ | 25,085 | |
Cost of Foreign Currency Held | | $ | 493 | |
Proceeds Received on Short Sales | | $ | 201 | |
Premiums Received on Written Options | | $ | 11 | |
| | | | |
| 6 | | PIMCO Variable Insurance Trust | | See Accompanying Notes |
|
|
| Statement of Operations Short-Term Portfolio |
| | | | |
| (Amounts in Thousands) | | Six Months Ended
June 30, 2006
(Unaudited) | |
| |
Investment Income: | | | | |
Interest | | $ | 749 | |
Total Income | | | 749 | |
| |
Expenses: | | | | |
Investment advisory fees | | | 41 | |
Administration fees | | | 32 | |
Servicing fees – Administrative Class | | | 7 | |
Total Expenses | | | 80 | |
| |
Net Investment Income | | | 669 | |
| |
Net Realized and Unrealized Gain (Loss): | | | | |
Net realized gain on investments | | | 18 | |
Net realized (loss) on futures contracts, options and swaps | | | (75 | ) |
Net realized gain on foreign currency transactions | | | 47 | |
Net change in unrealized (depreciation) on investments | | | (8 | ) |
Net change in unrealized (depreciation) on futures contracts, options and swaps | | | (56 | ) |
Net change in unrealized (depreciation) on translation of assets and liabilities denominated in foreign currencies | | | (25 | ) |
Net (Loss) | | | (99 | ) |
| |
Net Increase in Net Assets Resulting from Operations | | $ | 570 | |
| | | | | | |
| See Accompanying Notes | | Semiannual Report | | June 30, 2006 | | 7 |
|
|
| Statements of Changes in Net Assets Short-Term Portfolio |
| | | | | | | | |
| (Amounts in Thousands) | | Six Months Ended
June 30, 2006
(Unaudited) | | | Year Ended
December 31, 2005 | |
| | |
Increase (Decrease) in Net Assets from: | | | | | | | | |
| | |
Operations: | | | | | | | | |
Net investment income | | $ | 669 | | | $ | 1,099 | |
Net realized gain (loss) | | | (10 | ) | | | 13 | |
Net change in unrealized (depreciation) | | | (89 | ) | | | (123 | ) |
Net increase resulting from operations | | | 570 | | | | 989 | |
| | |
Distributions to Shareholders: | | | | | | | | |
| From net investment income | | | | | | | | |
Institutional Class | | | (487 | ) | | | (891 | ) |
Administrative Class | | | (182 | ) | | | (218 | ) |
| | |
Total Distributions | | | (669 | ) | | | (1,109 | ) |
| | |
Portfolio Share Transactions: | | | | | | | | |
| Receipts for shares sold | | | | | | | | |
Institutional Class | | | 16,084 | | | | 20,119 | |
Administrative Class | | | 3,411 | | | | 3,074 | |
| Issued as reinvestment of distributions | | | | | | | | |
Institutional Class | | | 487 | | | | 892 | |
Administrative Class | | | 182 | | | | 218 | |
| Cost of shares redeemed | | | | | | | | |
Institutional Class | | | (32,679 | ) | | | (13,817 | ) |
Administrative Class | | | (2,317 | ) | | | (3,355 | ) |
Net increase (decrease) resulting from Portfolio share transactions | | | (14,832 | ) | | | 7,131 | |
| | |
Total Increase (Decrease) in Net Assets | | | (14,931 | ) | | | 7,011 | |
| | |
Net Assets: | | | | | | | | |
Beginning of period | | | 40,605 | | | | 33,594 | |
End of period* | | $ | 25,674 | | | $ | 40,605 | |
| | |
*Including undistributed net investment income of: | | $ | 36 | | | $ | 36 | |
| | | | |
| 8 | | PIMCO Variable Insurance Trust | | See Accompanying Notes |
| | |
| |
| Schedule of Investments Short-Term Portfolio | | June 30, 2006 (Unaudited) |
| | | | | | | | |
| | | | | PRINCIPAL | | | | |
| | | | | AMOUNT | | | | VALUE |
| | | | | (000S) | | | | (000S) |
| | | | | | | | | |
| CORPORATE BONDS & NOTES 14.3% |
| |
| BANKING & FINANCE 8.9% | | | | | | | | |
| Citigroup, Inc. | | | | | | | | |
5.199% due 05/02/2008 | | $ | | 250 | | $ | | 250 |
|
| Ford Motor Credit Co. | | | | | | | | |
5.510% due 03/13/2007 | | | | 100 | | | | 99 |
|
| General Electric Capital Corp. | | | | |
5.220% due 05/10/2010 | | | | 100 | | | | 100 |
|
| General Motors Acceptance Corp. | | | | |
5.968% due 01/16/2007 | | | | 100 | | | | 100 |
6.039% due 03/20/2007 | | | | 70 | | | | 70 |
|
| Goldman Sachs Group, Inc. | | | | | | | | |
5.633% due 10/05/2007 | | | | 100 | | | | 100 |
5.539% due 06/23/2009 | | | | 200 | | | | 200 |
|
| HSBC Finance Corp. | | | | | | | | |
5.200% due 05/10/2007 | | | | 170 | | | | 170 |
5.459% due 09/15/2008 | | | | 100 | | | | 100 |
|
| Lehman Brothers Holdings, Inc. | | | | |
5.659% due 12/23/2010 | | | | 100 | | | | 100 |
|
| MBNA Europe Funding PLC | | | | | | | | |
5.336% due 09/07/2007 | | | | 300 | | | | 300 |
|
| Mirage Resorts, Inc. | | | | | | | | |
6.750% due 08/01/2007 | | | | 100 | | | | 101 |
|
| Morgan Stanley | | | | | | | | |
5.276% due 02/09/2009 | | | | 100 | | | | 100 |
|
| Rabobank Nederland | | | | | | | | |
5.088% due 01/15/2009 | | | | 200 | | | | 200 |
|
| Riggs Capital Trust | | | | | | | | |
8.875% due 03/15/2027 | | | | 100 | | | | 106 |
|
| Royal Bank of Scotland PLC | | | | | | | | |
5.038% due 04/11/2008 | | | | 100 | | | | 100 |
|
| VTB Capital S.A. for Vneshtorgbank | | | | |
6.174% due 09/21/2007 | | | | 100 | | | | 100 |
| | | | | | | | |
|
| | | | | | | | | 2,296 |
| | | | | | | | |
|
| |
| |
| INDUSTRIALS 3.7% | | | | | | | | |
| Airgas, Inc. | | | | | | | | |
9.125% due 10/01/2011 | | | | 100 | | | | 105 |
|
| ConocoPhillips | | | | | | | | |
5.028% due 04/11/2007 | | | | 100 | | | | 100 |
|
| Constellation Brands, Inc. | | | | | | | | |
8.625% due 08/01/2006 | | | | 60 | | | | 60 |
|
| CSC Holdings, Inc. | | | | | | | | |
7.875% due 12/15/2007 | | | | 100 | | | | 102 |
|
| DaimlerChrysler N.A. Holding Corp. | | | | |
5.486% due 03/07/2007 | | | | 50 | | | | 50 |
|
| Enterprise Products Operating LP | | | | |
4.000% due 10/15/2007 | | | | 30 | | | | 29 |
|
| Historic TW, Inc. | | | | | | | | |
8.180% due 08/15/2007 | | | | 100 | | | | 103 |
|
| HJ Heinz Co. | | | | | | | | |
6.428% due 12/01/2008 | | | | 100 | | | | 102 |
|
| Kerr-McGee Corp. | | | | | | | | |
5.875% due 09/15/2006 | | | | 200 | | | | 201 |
|
| Kroger Co. | | | | | | | | |
7.625% due 09/15/2006 | | | | 100 | | | | 100 |
| | | | | | | | |
|
| | | | | | | | | 952 |
| | | | | | | | |
|
| |
| | | | | | | | |
| UTILITIES 1.7% | | | | | | | | |
| Entergy Gulf States, Inc. | | | | | | | | |
3.600% due 06/01/2008 | | $ | | 100 | | $ | | 96 |
|
| Ohio Edison Co. | | | | | | | | |
4.000% due 05/01/2008 | | | | 30 | | | | 29 |
|
| Public Service Enterprise Group, Inc. | | |
5.799% due 09/21/2008 | | | | 100 | | | | 100 |
|
| Verizon Global Funding Corp. | | | | | | | | |
5.300% due 08/15/2007 | | | | 200 | | | | 200 |
| | | | | | | | |
|
| | | | | | | | | 425 |
| | | | | | | | |
|
Total Corporate Bonds & Notes (Cost $3,686) | | | | 3,673 |
| | | | | | | | |
|
| |
| U.S. GOVERNMENT AGENCIES 16.9% |
| Fannie Mae | | | | | | | | |
5.000% due 07/25/2020 | | | | 177 | | | | 176 |
5.111% due 09/07/2006 | | | | 700 | | | | 700 |
5.211% due 03/01/2044 | | | | 215 | | | | 216 |
5.312% due 09/22/2006 | | | | 1,000 | | | | 1,000 |
5.442% due 03/25/2034 | | | | 70 | | | | 70 |
5.472% due 08/25/2034 | | | | 30 | | | | 30 |
5.500% due 11/01/2016 | | | | 120 | | | | 118 |
5.672% due 05/25/2042 | | | | 32 | | | | 32 |
5.842% due 10/01/2031 | | | | 24 | | | | 24 |
6.000% due 06/01/2017 | | | | 33 | | | | 33 |
|
| Freddie Mac | | | | | | | | |
3.500% due 01/15/2013 - 03/15/2022 (b) | | | | 250 | | | | 245 |
5.211% due 10/25/2044 - 02/25/2045 (b) | | | | 1,161 | | | | 1,161 |
5.411% due 07/25/2044 | | | | 238 | | | | 237 |
5.500% due 08/15/2030 | | | | 17 | | | | 17 |
5.549% due 06/15/2031 | | | | 77 | | | | 77 |
9.500% due 12/01/2019 | | | | 20 | | | | 22 |
|
| Government National Mortgage Association |
5.000% due 02/20/2032 | | | | 55 | | | | 55 |
6.000% due 03/15/2032 - 03/20/2032 (b) | | | | 110 | | | | 110 |
| | | | | | | | |
|
Total U.S. Government Agencies (Cost $4,338) | | | | 4,323 |
| | | | | | | | |
|
| |
| MORTGAGE-BACKED SECURITIES 7.0% |
| Banc of America Mortgage Securities | | |
6.607% due 07/25/2032 | | | | 4 | | | | 4 |
5.437% due 10/20/2032 | | | | 5 | | | | 5 |
|
| Bear Stearns Adjustable Rate Mortgage Trust |
4.666% due 12/25/2033 | | | | 18 | | | | 17 |
4.214% due 01/25/2034 | | | | 13 | | | | 13 |
4.799% due 11/25/2035 | | | | 259 | | | | 254 |
|
| Bear Stearns Alt-A Trust | | | | | | | | |
5.602% due 02/25/2034 | | | | 12 | | | | 12 |
|
| Countrywide Alternative Loan Trust | | |
5.602% due 02/25/2037 | | | | 194 | | | | 195 |
5.417% due 05/20/2046 | | | | 97 | | | | 97 |
|
| Countrywide Home Loan Mortgage Pass-Through Trust |
5.662% due 06/25/2035 | | | | 79 | | | | 79 |
|
| CS First Boston Mortgage Securities Corp. | | |
4.954% due 03/25/2032 | | | | 42 | | | | 42 |
5.691% due 05/25/2032 | | | | 5 | | | | 5 |
|
| First Republic Mortgage Loan Trust | | |
5.499% due 08/15/2032 | | | | 84 | | | | 84 |
|
| Greenpoint Mortgage Funding Trust | | |
5.542% due 05/25/2045 | | | | 159 | | | | 160 |
| | | | | | | | |
| GSR Mortgage Loan Trust | | | | | | | | |
4.541% due 09/25/2035 | | $ | | 88 | | $ | | 86 |
|
| Harborview Mortgage Loan Trust | | |
5.472% due 05/19/2035 | | | | 205 | | | | 205 |
|
| Mellon Residential Funding Corp. | | | | |
5.639% due 12/15/2030 | | | | 31 | | | | 31 |
|
| Sequoia Mortgage Funding Co. | | | | |
0.800% due 10/21/2007 (a) | | | | 638 | | | | 3 |
|
| Structured Asset Mortgage Investments, Inc. |
5.582% due 09/19/2032 | | | | 26 | | | | 26 |
5.542% due 05/25/2036 | | | | 100 | | | | 100 |
5.552% due 05/25/2045 | | | | 208 | | | | 209 |
|
| Washington Mutual, Inc. | | | | | | | | |
5.592% due 12/25/2027 | | | | 47 | | | | 47 |
5.123% due 10/25/2032 | | | | 4 | | | | 4 |
5.543% due 06/25/2042 | | | | 27 | | | | 27 |
5.143% due 02/25/2046 | | | | 96 | | | | 95 |
| | | | | | | | |
|
Total Mortgage-Backed Securities (Cost $1,804) | | | | 1,800 |
| | | | | | | | |
|
| | | | | | | |
| ASSET-BACKED SECURITIES 22.6% |
| AAA Trust | | | | | | | | |
5.422% due 11/26/2035 | | | | 20 | | | | 20 |
|
| ACE Securities Corp. | | | | | | | | |
5.402% due 02/25/2036 | | | | 156 | | | | 156 |
|
| Ameriquest Mortgage Securities, Inc. | | |
5.402% due 03/25/2035 | | | | 74 | | | | 74 |
|
| Argent Securities, Inc. | | | | | | | | |
5.422% due 11/25/2035 | | | | 163 | | | | 163 |
5.462% due 02/25/2036 | | | | 287 | | | | 287 |
5.392% due 05/25/2036 | | | | 87 | | | | 87 |
|
| Bear Stearns Asset-Backed Securities, Inc. |
5.652% due 10/25/2032 | | | | 4 | | | | 4 |
5.392% due 12/25/2035 | | | | 69 | | | | 69 |
5.522% due 06/15/2043 | | | | 5 | | | | 5 |
|
| Centex Home Equity | | | | | | | | |
5.432% due 10/25/2035 | | | | 53 | | | | 53 |
|
| Chase Manhattan Auto Owner Trust | | | | |
4.730% due 03/15/2008 | | | | 10 | | | | 10 |
|
| Countrywide Asset-Backed Certificates |
5.802% due 12/25/2031 | | | | 6 | | | | 6 |
5.692% due 05/25/2032 | | | | 1 | | | | 1 |
5.482% due 08/25/2033 | | | | 156 | | | | 156 |
5.492% due 12/25/2035 | | | | 232 | | | | 232 |
5.392% due 02/25/2036 | | | | 177 | | | | 177 |
5.392% due 03/25/2036 | | | | 93 | | | | 93 |
5.392% due 04/25/2036 | | | | 92 | | | | 92 |
|
| CS First Boston Mortgage Securities Corp. |
5.672% due 07/25/2032 | | | | 3 | | | | 3 |
5.692% due 08/25/2032 | | | | 3 | | | | 3 |
|
| FBR Securitization Trust |
5.432% due 10/25/2035 | | | | 53 | | | | 53 |
5.442% due 10/25/2035 | | | | 219 | | | | 219 |
|
| First Franklin Mortgage Loan Asset-Backed Certificates |
5.731% due 03/25/2034 | | | | 1 | | | | 1 |
5.392% due 01/25/2036 | | | | 84 | | | | 84 |
5.412% due 01/25/2036 | | | | 85 | | | | 86 |
|
| First NLC Trust |
5.432% due 12/25/2035 | | | | 258 | | | | 258 |
5.442% due 12/31/2036 | | | | 78 | | | | 78 |
| | | | | | |
| See Accompanying Notes | | Semiannual Report | | June 30, 2006 | | 9 |
| | |
| |
| Schedule of Investments Short-Term Portfolio (Cont.) | | |
| | | | | | | | |
| | | | | PRINCIPAL | | | | |
| | | | | AMOUNT | | | | VALUE |
| | | | | (000S) | | | | (000S) |
| | | | | | | | | |
| Fremont Home Loan Trust |
5.412% due 01/25/2036 | | $ | | 251 | | $ | | 251 |
|
| GSAMP Trust |
5.412% due 11/25/2035 | | | | 81 | | | | 81 |
5.442% due 12/25/2035 | | | | 72 | | | | 72 |
5.432% due 01/25/2036 | | | | 247 | | | | 247 |
|
| Home Equity Asset Trust |
5.402% due 05/25/2036 | | | | 87 | | | | 87 |
|
| Home Equity Mortgage Trust |
5.442% due 07/25/2035 | | | | 3 | | | | 3 |
|
| Irwin Home Equity |
5.862% due 07/25/2032 | | | | 8 | | | | 8 |
|
| Long Beach Mortgage Loan Trust |
5.412% due 01/25/2036 | | | | 155 | | | | 155 |
5.392% due 03/25/2036 | | | | 81 | | | | 81 |
|
| Mastr Asset-Backed Securities Trust |
5.402% due 12/25/2035 | | | | 85 | | | | 85 |
|
| Merrill Lynch Mortgage Investors, Inc. |
5.392% due 02/25/2037 | | | | 86 | | | | 86 |
|
| Morgan Stanley Capital I |
5.392% due 02/25/2036 | | | | 85 | | | | 85 |
|
| Nelnet Student Loan Trust |
5.174% due 08/23/2011 | | | | 98 | | | | 98 |
5.190% due 07/25/2016 | | | | 100 | | | | 100 |
|
| Novastar Home Equity Loan |
5.982% due 09/25/2031 | | | | 3 | | | | 3 |
|
| Quest Trust | | | | | | | | |
5.882% due 06/25/2034 | | | | 15 | | | | 15 |
|
| Renaissance Home Equity Loan Trust | | |
5.762% due 08/25/2033 | | | | 19 | | | | 20 |
5.822% due 12/25/2033 | | | | 92 | | | | 93 |
5.682% due 11/25/2034 | | | | 41 | | | | 41 |
|
| Residential Asset Mortgage Products, Inc. | | |
5.482% due 09/25/2013 | | | | 3 | | | | 3 |
5.652% due 12/25/2033 | | | | 1 | | | | 1 |
5.402% due 01/25/2036 | | | | 72 | | | | 72 |
5.161% due 02/25/2036 | | | | 86 | | | | 86 |
|
| Residential Asset Securities Corp. | | |
5.422% due 10/25/2035 | | | | 188 | | | | 189 |
5.402% due 01/25/2036 | | | | 85 | | | | 86 |
|
| Residential Funding Mortgage Securities II, Inc. |
5.462% due 09/25/2035 | | | | 284 | | | | 285 |
|
| SACO I, Inc. | | | | | | | | |
5.432% due 12/25/2035 | | | | 199 | | | | 199 |
5.402% due 04/25/2036 | | | | 70 | | | | 70 |
|
| Saxon Asset Securities Trust | | | | | | | | |
5.592% due 01/25/2032 | | | | 1 | | | | 1 |
|
| Soundview Home Equity Loan Trust | | |
5.492% due 04/25/2035 | | | | 51 | | | | 51 |
5.392% due 03/25/2036 | | | | 79 | | | | 79 |
5.392% due 05/25/2036 | | | | 90 | | | | 91 |
|
| Structured Asset Investment Loan Trust | | |
5.412% due 07/25/2035 | | | | 39 | | | | 39 |
|
| Structured Asset Securities Corp. | | |
5.612% due 01/25/2033 | | | | 4 | | | | 4 |
|
| Susquehanna Auto Lease Trust | | |
4.991% due 04/16/2007 | | | | 60 | | | | 60 |
|
| Wachovia Auto Owner Trust | | | | | | | | |
4.820% due 02/20/2009 | | | | 400 | | | | 399 |
| | | | | | | | |
| Wells Fargo Home Equity Trust | | |
5.492% due 02/25/2018 | | $ | | 7 | | $ | | 7 |
| | | | | | | | |
|
Total Asset-Backed Securities (Cost $5,800) | | | | 5,803 |
| | | | | | | | |
|
| | | | | | | |
| SOVEREIGN ISSUES 0.6% |
| Russia Government International Bond | | |
10.000% due 06/26/2007 | | | | 140 | | | | 146 |
| | | | | | | | |
|
Total Sovereign Issues (Cost $147) | | 146 |
| | | | | | | | |
|
| | | | | | | |
| | | | | NOTIONAL
AMOUNT
(000S) | | | | |
| PURCHASED CALL OPTIONS 0.0% |
| 2-Year Interest Rate Swap (OTC) Pay 3-Month USD-LIBOR Floating Rate Index |
Strike @ 5.080% Exp. 04/19/2007 | | | | 500 | | | | 1 |
Strike @ 5.500% Exp. 06/29/2007 | | | | 1,000 | | | | 5 |
Strike @ 5.130% Exp. 10/25/2006 | | | | 5,000 | | | | 1 |
| | | | | | | | |
|
Total Purchased Call Options (Cost $15) | | 7 |
| | | | | | | | |
|
| | | | | | | |
| | | | | PRINCIPAL
AMOUNT
(000S) | | | | |
| SHORT-TERM INSTRUMENTS 36.2% |
| |
| CERTIFICATES OF DEPOSIT 1.9% | | |
| Countrywide Bank N.A. | | | | | | | | |
5.209% due 09/15/2006 | | | | 500 | | | | 500 |
| | | | | | | | |
|
| | | | | | | | | 500 |
| | | | | | | | |
|
| |
| |
| COMMERCIAL PAPER 29.9% | | |
| Danske Corp. | | | | | | | | |
5.080% due 08/24/2006 | | | | 700 | | | | 695 |
|
| DNB NORBank ASA | | | | | | | | |
4.960% due 07/17/2006 | | | | 100 | | | | 100 |
5.080% due 08/02/2006 | | | | 600 | | | | 597 |
|
| Fannie Mae | | | | | | | | |
4.809% due 07/05/2006 | | | | 300 | | | | 300 |
|
| Federal Home Loan Bank | | | | | | | | |
5.030% due 07/03/2006 | | | | 700 | | | | 700 |
|
| HBOS Treasury Services PLC | | | | | | | | |
5.055% due 08/17/2006 | | | | 600 | | | | 596 |
|
| ING U.S. Funding LLC | | | | | | | | |
5.230% due 08/03/2006 | | | | 700 | | | | 697 |
|
| Nordea N.A., Inc. | | | | | | | | |
5.090% due 08/24/2006 | | | | 700 | | | | 695 |
|
| Rabobank USA Financial Corp. | | |
5.240% due 07/03/2006 | | | | 500 | | | | 500 |
|
| Societe Generale N.A. | | | | | | | | |
5.055% due 08/15/2006 | | | | 700 | | | | 696 |
|
| Spintab AB | | | | | | | | |
5.120% due 08/01/2006 | | | | 700 | | | | 697 |
|
| Total Captial S.A. | | | | | | | | |
5.270% due 07/03/2006 | | | | 700 | | | | 700 |
|
| UBS Finance Delaware LLC | | | | | | |
5.235% due 08/08/2006 | | | | 700 | | | | 696 |
| | | | | | | | |
|
| | | | | | | | | 7,669 |
| | | | | | | | |
|
| | | | | | | | |
| FRANCE TREASURY BILL 2.4% | | |
2.667% due 08/24/2006 | | EUR | | 480 | | $ | | 612 |
| | | | | | | | |
|
| |
| |
| GERMANY TREASURY BILL 0.1% | | |
2.668% due 08/16/2006 | | | | 20 | | | | 25 |
| | | | | | | | |
|
| |
| |
| REPURCHASE AGREEMENT 1.6% | | |
| State Street Bank | | | | | | | | |
4.900% due 07/03/2006 | | $ | | 417 | | | | 417 |
| | | | | | | | |
|
(Dated 06/30/2006. Collateralized by Freddie Mac
2.750% due 02/09/2007 valued at $428. Repurchase proceeds are $417.) |
| |
| |
| U.S. TREASURY BILLS 0.3% |
4.733% due 08/31/2006 -09/14/2006 (b)(d) | | | | 75 | | | | 75 |
| | | | | | | | |
|
Total Short-Term Instruments
(Cost $9,295) | | 9,298 |
| | | | | | | | |
|
| | | | | | | |
Total Investments (c) 97.6%
(Cost $25,085) | | $ | | 25,050 |
| | | | | | | |
Written Options (f) (0.0%)
(Premiums $11) | | (5) |
| | | | | | | |
| Other Assets and Liabilities (Net) 2.4% | | 629 |
| | | | | | | | |
|
| Net Assets 100.0% | | $ | | 25,674 |
| | | | | | | | |
|
| | | | |
| 10 | | PIMCO Variable Insurance Trust | | See Accompanying Notes |
| | |
| |
| | | June 30, 2006 (Unaudited) |
|
Notes to Schedule of Investments (amounts in thousands, except number of contracts): |
(a) Interest only security. |
| |
(b) Securities are grouped by coupon or range of coupons and represent a range of maturities. |
| |
(c) As of June 30, 2006, portfolio securities with an aggregate market value of $197 were valued in good faith and pursuant to guidelines established by the Board of Trustees. |
| |
(d) Securities with an aggregate market value of $75 have been segregated with the custodian to cover margin requirements for the following open futures contracts on June 30, 2006: |
| | | | | | | | | | |
| Description | | Type | | Expiration
Month | | # of
Contracts | | Unrealized
(Depreciation) | |
90-Day Eurodollar September Futures | | Long | | 09/2006 | | 62 | | $ | (88 | ) |
| | | | | | | | |
|
|
|
| | | | | | | | | | | | | | | |
(e) Swap agreements outstanding on June 30, 2006: | |
| Interest Rate Swaps | | | | | | | | | | | | | | | |
| Counterparty | | Floating Rate Index | | Pay/Receive
Floating Rate | | Fixed Rate | | Expiration
Date | | Notional
Amount | | Unrealized
Appreciation/
(Depreciation) | |
Goldman Sachs & Co. | | 3-month USD-LIBOR | | Receive | | 5.000% | | 12/20/2016 | | $ | 400 | | $ | 5 | |
J.P. Morgan Chase & Co. | | 3-month USD-LIBOR | | Pay | | 5.000% | | 12/20/2011 | | | 100 | | | (1 | ) |
Royal Bank of Scotland PLC | | 3-month USD-LIBOR | | Pay | | 5.000% | | 12/20/2011 | | | 400 | | | (4 | ) |
UBS Warburg LLC | | 3-month USD-LIBOR | | Pay | | 4.000% | | 06/21/2007 | | | 3,200 | | | (11 | ) |
| | | | | | | | | | | | | |
|
|
|
| | | | | | | | | | | | | | $ | (11 | ) |
| | | | | | | | | | | | | |
|
|
|
| | | | | | | | | | | | | | | | | | | |
(f) Written options outstanding on June 30, 2006: | | | | | | | | | | | | | |
| Swaptions | | | | | | | | | | | | | |
| Description | | Counterparty | | Floating Rate Index | | Pay/Receive
Floating Rate | | Exercise Rate | | Expiration Date | | Notional Amount | | Premium | | Value |
Call - OTC 5-Year Interest Rate Swap | | Goldman Sachs & Co. | | 3-month USD-LIBOR | | Receive | | 5.210% | | 10/25/2006 | | $ | 1,000 | | $ | 4 | | $ | 1 |
Call - OTC 5-Year Interest Rate Swap | | Royal Bank of Scotland PLC | | 3-month USD-LIBOR | | Receive | | 5.220% | | 04/19/2007 | | | 200 | | | 2 | | | 1 |
Call - OTC 5-Year Interest Rate Swap | | Wachovia Bank N.A. | | 3-month USD-LIBOR | | Receive | | 5.210% | | 10/25/2006 | | | 1,100 | | | 4 | | | 1 |
| | | | | | | | | | | | | | | |
|
| |
|
|
| | | | | | | | | | | | | | | | $ | 10 | | $ | 3 |
| | | | | | | | | | | | | | | |
|
| |
|
|
| | | | | | | | | | | | | | | |
| Foreign Currency Options | | | | | | | | | | | | | | | |
| Description | | Counterparty | | Exercise
Price | | Expiration
Date | | Notional
Amount | | Premium | | Value |
Put - OTC U.S. dollar versus Japanese Yen | | Bank of America | | JPY 112.000 | | 07/26/2006 | | $ | 400 | | $ | 1 | | $ | 2 |
| | | | | | | | | | | |
|
| |
|
|
| | | | | | | | | | | | | |
(g) Short sales outstanding on June 30, 2006: | | | | | | | | | | | |
| Description | | Coupon | | Maturity
Date | | Principal
Amount | | Proceeds | | Valueà |
| U.S. Treasury Note | | 5.000% | | 02/15/2011 | | $ | 200 | | $ | 201 | | $ | 204 |
| | | | | | | | | |
|
| |
|
|
|
| à Market value includes $4 of interest payable on short sales. |
| | | | | | | | | | | | | | | | | |
(h) Forward foreign currency contracts outstanding on June 30, 2006: | | | | | |
| Type | | | | Principal
Amount
Covered by
Contract | | Settlement
Month | | Unrealized
Appreciation | | Unrealized
(Depreciation) | | | Net
Unrealized
Appreciation/
(Depreciation) | |
Buy | | CNY | | 231 | | 03/2007 | | $ | 0 | | $ | 0 | | | $ | 0 | |
Buy | | EUR | | 600 | | 07/2006 | | | 5 | | | (2 | ) | | | 3 | |
Sell | | | | 602 | | 07/2006 | | | 0 | | | (26 | ) | | | (26 | ) |
Sell | | | | 76 | | 08/2006 | | | 0 | | | (2 | ) | | | (2 | ) |
Sell | | | | 802 | | 09/2006 | | | 0 | | | (15 | ) | | | (15 | ) |
Buy | | JPY | | 5,300 | | 07/2006 | | | 1 | | | 0 | | | | 1 | |
Buy | | | | 233,975 | | 08/2006 | | | 2 | | | (15 | ) | | | (13 | ) |
Sell | | | | 133,830 | | 08/2006 | | | 2 | | | (4 | ) | | | (2 | ) |
| | | | | | | | |
|
| |
|
|
| |
|
|
|
| | | | | | | | | $ | 10 | | $ | (64 | ) | | $ | (54 | ) |
| | | | | | | | |
|
| |
|
|
| |
|
|
|
| | | | | | |
| See Accompanying Notes | | Semiannual Report | | June 30, 2006 | | 11 |
Notes to Financial Statements
1. ORGANIZATION
The Short-Term Portfolio (the “Portfolio”) is a series of the PIMCO Variable Insurance Trust (the “Trust”). The Trust is registered under the Investment Company Act of 1940 (the “Act”), as amended, as an open-end investment management company organized as a Delaware business trust on October 3, 1997. The Portfolio offers two classes of shares: Institutional and Administrative. Information presented in these financial statements pertains to the Institutional Class of the Portfolio. Certain detailed financial information for the Administrative Class is provided separately and is available upon request. The Trust is designed to be used as an investment vehicle by Separate Accounts of insurance companies that fund variable annuity contracts and variable life insurance policies and by qualified pension and retirement plans.
2. SIGNIFICANT ACCOUNTING POLICIES
The following is a summary of significant accounting policies consistently followed by the Portfolio in the preparation of its financial statements in conformity with accounting principles generally accepted in the United States of America (“GAAP”). The preparation of financial statements in accordance with GAAP requires management to make estimates and assumptions that affect the reported amounts and disclosures in the financial statements. Actual results could differ from those estimates.
Security Valuation. Portfolio securities are valued as of the close of regular trading (normally 4:00 p.m., Eastern Time) on each day that the New York Stock Exchange (“NYSE”) is open. Portfolio securities and other assets for which market quotes are readily available are stated at market value. Market value is generally determined on the basis of last reported sales prices, or if no sales are reported, based on quotes obtained from a quotation reporting system, established market makers, or pricing services. Fixed-income securities and non-exchange traded derivatives are normally valued on the basis of quotes obtained from brokers and dealers or pricing services. Prices obtained from independent pricing services use information provided by market makers or estimates of market values obtained from yield data relating to investments or securities with similar characteristics. Certain fixed-income securities purchased on a delayed-delivery basis are marked to market daily until settlement at the forward settlement date. Short-term investments having a maturity of 60 days or less are generally valued at amortized cost. Exchange traded options, futures and options on futures are valued at the settlement price determined by the relevant exchange.
Investments initially valued in currencies other than the U.S. dollar are converted to the U.S. dollar using exchange rates obtained from pricing services. As a result, the NAV of the Portfolio’s shares may be affected by changes in the value of currencies in relation to the U.S. dollar. The value of securities traded in markets outside the United States or denominated in currencies other than the U.S. dollar may be affected significantly on a day that the NYSE is closed and an investor is not able to purchase, redeem or exchange shares.
Securities and other assets for which market quotes are not readily available are valued at fair value as determined in good faith by the Board of Trustees or persons acting at their direction. The Board of Trustees has adopted methods for valuing securities and other assets in circumstances where market quotes are not readily available, and has delegated to Pacific Investment Management Company LLC (“PIMCO”) the responsibility for applying the valuation methods. In the event that market quotes are not readily available, and the security or asset cannot be valued pursuant to one of the valuation methods, the value of the security or asset will be determined in good faith by the Valuation Committee of the Board of Trustees, generally based upon recommendations provided by PIMCO.
Market quotes are considered not readily available in circumstances where there is an absence of current or reliable market-based data (e.g., trade information, bid/asked information, broker quotes), including where events occur after the close of the relevant market, but prior to the close of regular trading, that materially affect the values of the Portfolio’s securities or assets. In addition, market quotes are considered not readily available when, due to extraordinary circumstances, the exchanges or markets on which the securities trade do not open for trading for the entire day and no other market prices are available. The Board has delegated to PIMCO the responsibility for monitoring significant events that may materially affect the values of the Portfolio’s securities or assets and for determining whether the value of the applicable securities or assets should be re-evaluated in light of such significant events. When the Portfolio uses fair value pricing to determine its NAV, securities will not be priced on the basis of quotations from the primary market in which they are traded, but rather may be priced by another method that the Board of Trustees or persons acting at their direction believe accurately reflects fair value. The Trust’s policy is intended to result in a calculation of the Portfolio’s NAV that fairly reflects security values as of the time of pricing. However, fair values determined by the Board of Trustees or persons acting at their direction may not accurately reflect the price that the Portfolio could obtain for a security if it were to dispose of that security as of the time of pricing. Because foreign securities can trade on non-business days, the NAV of the Portfolio may change on days when shareholders will not be able to purchase or redeem shares. The prices used by the Portfolio may differ from the value that would be realized if the securities were sold and the differences could be material to the financial statements.
Securities Transactions and Investment Income. Securities transactions are recorded as of the trade date. Securities purchased or sold on a when-issued or delayed-delivery basis may be settled a month or more after the trade date. Realized gains and losses from securities sold are recorded on the identified cost basis. Dividend income is recorded on the ex-dividend date, except certain dividends from foreign securities where the ex-dividend date may have passed, which are recorded as soon as the Portfolio is informed of the ex-dividend date. Interest income, adjusted for the accretion of discounts and amortization of premiums, is recorded on the accrual basis. Paydown gains and losses on mortgage-related or asset-backed securities are recorded as components of interest income in the Statement of Operations.
Dividends and Distributions to Shareholders. Dividends from net investment income, if any, are declared on each day the Portfolio is open for business and are distributed to shareholders monthly. Net realized capital gains earned by the Portfolio, if any, will be distributed no less frequently than once each year. Most shareholders choose to reinvest their dividends and capital gain distribution in additional shares of the Portfolio.
Income dividends and capital gain distributions are determined in accordance with income tax regulations which may differ from GAAP. Differences between tax regulations and GAAP may change the fiscal year when income and capital items are recognized for tax and GAAP purposes. Examples of events that give rise to timing differences include wash sales, straddles, net operating losses and capital loss carryforwards. Further, the character of investment income and capital gains may be different for certain transactions under the two methods of accounting. Examples of characterization differences include the treatment of mortgage paydowns, swaps, foreign currency transactions and contingent debt instruments. As a result, income dividends and capital gain distributions declared during a fiscal period may differ significantly from the net investment income and realized capital gain reported in the Portfolio’s annual financial statements presented under GAAP.
Distributions classified as a tax basis return of capital, if any, are reflected in the accompanying Statements of Changes in Net Assets and have been reclassified to paid in capital. In addition, other amounts have been reclassified between undistributed net investment income, accumulated undistributed net realized gains
| | | | |
| 12 | | PIMCO Variable Insurance Trust | | |
| | |
| |
| | | June 30, 2006 (Unaudited) |
or losses and/or paid in capital to more appropriately conform financial accounting to tax characterizations of dividend distributions.
Multiclass Operations. Each class offered by the Portfolio has equal rights as to assets and voting privileges (except that shareholders of a class have exclusive voting rights regarding any matter relating solely to that class of shares). Income and non-class specific expenses of the Portfolio are allocated daily to each class of shares based on the relative value of settled shares. Realized and unrealized capital gains and losses of the Portfolio are allocated daily to each class of shares based on the relative net assets of each class. Class specific expenses, where applicable, currently include administrative, distribution and servicing fees.
Delayed-Delivery Transactions. The Portfolio may purchase or sell securities on a when-issued or delayed-delivery basis. These transactions involve a commitment by the Portfolio to purchase or sell securities for a predetermined price or yield, with payment and delivery taking place beyond the customary settlement period. When delayed-delivery purchases are outstanding, the Portfolio will designate liquid assets in an amount sufficient to meet the purchase price. When purchasing a security on a delayed-delivery basis, the Portfolio assumes the rights and risks of ownership of the security, including the risk of price and yield fluctuations, and takes such fluctuations into account when determining its net asset value. The Portfolio may dispose of or renegotiate a delayed-delivery transaction after it is entered into, and may sell when-issued securities before they are delivered, which may result in a capital gain or loss. When the Portfolio has sold a security on a delayed-delivery basis, the Portfolio does not participate in future gains and losses with respect to the security.
Federal Income Taxes. The Portfolio intends to qualify as a regulated investment company under sub-chapter M of the Internal Revenue Code and distribute all of its taxable income and net realized gains, if applicable, to shareholders. Accordingly, no provision for Federal income taxes has been made.
Foreign Currency. The accounting records of the Portfolio are maintained in U.S. dollar. The market values of foreign securities, currency holdings and other assets and liabilities are translated into U.S. dollar based on the current exchange rates each business day. Fluctuations in the value of currency holdings and other assets and liabilities resulting from changes in exchange rates are recorded as unrealized foreign currency gains or losses. Realized gains or losses and unrealized appreciation or depreciation on investment securities and income and expenses are translated on the respective dates of such transactions. The effects of changes in foreign currency exchange rates on investments in securities are not segregated in the Statement of Operations from the effects of changes in market prices of those securities, but are included with the net realized and unrealized gain or loss on investment securities.
| | | | | | |
|
| Non-U.S. currency symbols utilized throughout the report are defined as follows: |
| CNY | | Chinese Yuan Renminbi | | | | |
| EUR | | Euro | | | | |
| JPY | | Japanese Yen | | | | |
Forward Currency Transactions. The Portfolio may enter into forward currency contracts in connection with settling planned purchases or sales of securities, to hedge the currency exposure associated with some or all of the Portfolio’s securities or as a part of an investment strategy. A forward currency contract is an agreement between two parties to buy and sell a currency at a set price on a future date. The market value of a forward currency contract fluctuates with changes in forward currency exchange rates. Forward currency contracts are marked to market daily and the change in value is recorded by the Portfolio as an unrealized gain or loss. Realized gains or losses equal to the difference between the value of the contract at the time it was opened and the value at the time it was closed are recorded upon delivery or receipt of the currency or, if a forward currency contract is offset by entering into another forward currency contract with the same broker, upon settlement of the net gain or loss. These contracts may involve market risk in excess of the unrealized gain or loss reflected in the Portfolio’s Statement of Assets and Liabilities. In addition, the Portfolio could be exposed to risk if the counterparties are unable to meet the terms of the contracts or if the value of the currency changes unfavorably to the U.S. dollar.
Futures Contracts. The Portfolio is authorized to enter into futures contracts. The Portfolio may use futures contracts to manage its exposure to the securities markets or to movements in interest rates and currency values. The primary risks associated with the use of futures contracts are the imperfect correlation between the change in market value of the securities held by the Portfolio and the prices of futures contracts, the possibility of an illiquid market, and the inability of the counterparty to meet the terms of the contract. Futures contracts are valued based upon their quoted daily settlement prices. Upon entering into a futures contract, the Portfolio is required to deposit with its custodian, in a segregated account in the name of the futures broker, an amount of cash or U.S. Government and Agency Obligations in accordance with the initial margin requirements of the broker or exchange. Futures contracts are marked to market daily and an appropriate payable or receivable for the change in value (“variation margin”) is recorded by the Portfolio. Gains or losses are recognized but not considered realized until the contracts expire or are closed. Futures contracts involve, to varying degrees, risk of loss in excess of the variation margin disclosed in the Statement of Assets and Liabilities.
Guarantees and Indemnifications. Under the Trust’s organizational documents, each Trustee, officer, employee or other agent of the Trust (including the Trust’s investment manager) is indemnified against certain liabilities that may arise out of performance of their duties to the Portfolio. Additionally, in the normal course of business, the Portfolio enters into contracts that contain a variety of indemnification clauses. The Portfolio’s maximum exposure under these arrangements is unknown as this would involve future claims that may be made against the Portfolio that have not yet occurred. However, the Portfolio has not had prior claims or losses pursuant to these contracts, and believes the risk of loss to be remote.
Options Contracts. The Portfolio may write call and put options on futures, swaps, securities or currencies it owns or in which it may invest. Writing put options tends to increase the Portfolio’s exposure to the underlying instrument. Writing call options tends to decrease the Portfolio’s exposure to the underlying instrument. When the Portfolio writes a call or put option, an amount equal to the premium received is recorded as a liability and subsequently marked to market to reflect the current value of the option written. These liabilities are reflected as written options outstanding in the Statement of Assets and Liabilities. Certain options may be written with premiums to determined on a future date. The premiums for these options are based upon implied volatility parameters at specified terms. Premiums received from writing options which expire are treated as realized gains. Premiums received from writing options which are exercised or closed are added to the proceeds or offset against amounts paid on the underlying future, swap, security or currency transaction to determine the realized gain or loss. The Portfolio as a writer of an option has no control over whether the underlying future, swap, security or currency may be sold (call) or purchased (put) and as a result bears the market risk of an unfavorable change in the price of the future, swap, security or currency underlying the written option. Certain options may be purchase with premiums to determined on a future date. The premiums for these options are based upon implied volatility parameters at specified terms. There is the risk the Portfolio may not be able to enter into a closing transaction because of an illiquid market.
| | | | | | |
| | | Semiannual Report | | June 30, 2006 | | 13 |
Notes to Financial Statements (Cont.)
The Portfolio may also purchase put and call options. Purchasing call options tends to increase the Portfolio’s exposure to the underlying instrument. Purchasing put options tends to decrease the Portfolio’s exposure to the underlying instrument. The Portfolio pays a premium which is included in the Portfolio’s Statement of Assets and Liabilities as an investment and subsequently marked to market to reflect the current value of the option. Premiums paid for purchasing options which expire are treated as realized losses. Certain options may be purchased with premiums to be determined on a future date. The premiums for these options are based upon implied volatility parameters at specified terms. The risk associated with purchasing put and call options is limited to the premium paid. Premiums paid for purchasing options which are exercised or closed are added to the amounts paid or offset against the proceeds on the underlying future, swap, security or currency transaction to determine the realized gain or loss.
Repurchase Agreements. The Portfolio may engage in repurchase transactions. Under the terms of a typical repurchase agreement, the Portfolio takes possession of an underlying debt obligation subject to an obligation of the seller to repurchase, and the Portfolio to resell, the obligation at an agreed-upon price and time. The market value of the collateral must be equal to or exceed at all times the total amount of the repurchase obligations, including interest. Securities purchased under repurchase agreements are reflected as an asset in the Statement of Assets and Liabilities. Generally, in the event of counterparty default, the Portfolio has the right to use the collateral to offset losses incurred. If the counterparty should default, the Portfolio will seek to sell the securities which it holds as collateral. This could involve procedural costs or delays in addition to a loss on the securities if their value should fall below their repurchase price.
Short Sales. The Portfolio may enter into short sales transactions. A short sale is a transaction in which the Portfolio sells securities it does not own in anticipation of a decline in the market price of the securities. Securities sold in short sale transactions and interest payable on such securities, if any, are reflected as a liability in the Statement of Assets and Liabilities. The Portfolio is obligated to deliver securities at the market price at the time the short position is closed. Possible losses from short sales may be unlimited, whereas losses from purchases cannot exceed the total amount invested.
Mortgage-Related and Other Asset-Backed Securities. The Portfolio may invest in mortgage-related or other asset-backed securities. These securities include mortgage pass-through securities, collateralized mortgage obligations (“CMOs”), commercial mortgage-backed securities, mortgage dollar rolls, CMO residuals, stripped mortgage-backed securities (“SMBSs”) and other securities that directly or indirectly represent a participation in, or are secured by and payable from, mortgage loans on real property. The value of some mortgage- or asset-backed securities may be particularly sensitive to changes in prevailing interest rates. Early repayment of principal on some mortgage-related securities may expose a Portfolio to a lower rate of return upon reinvestment of principal. The value of these securities may fluctuate in response to the market’s perception of the creditworthiness of the issuers. Additionally, although mortgages and mortgage-related securities are generally supported by some form of government or private guarantee and/or insurance, there is no assurance that private guarantors or insurers will meet their obligations.
One type of SMBS has one class receiving all of the interest from the mortgage assets (the interest-only, or “IO” class), while the other class will receive all of the principal (the principal-only, or “PO” class). Payments received for IOs are included in interest income in the Statement of Operations. Because principal will not be received at the maturity of an IO, adjustments are made to the book value of the security on a daily basis until maturity. These adjustments are included in interest income in the Statement of Operations. Payments received for POs are treated as reductions to the cost and par value of the securities.
Swap Agreements. The Portfolio may engage in swap transactions, including, but not limited to, swap agreements on interest rate, total return, forward spread-lock and credit default to manage its exposure to interest rates and credit risk. In connection with these agreements, securities may be identified as collateral in accordance with the terms of the respective swap agreements.
Interest rate swap agreements involve the exchange by the Portfolio with another party of their respective commitments to pay or receive interest, e.g., an exchange of floating rate payments for fixed rate payments with respect to the notional amount of principal.
Swaps are marked to market daily based upon quotations from market makers and the change in value, if any, is recorded as unrealized gain or loss in the Statement of Operations. Payments received or made at the beginning of the measurement period are reflected as such in the Statement of Assets and Liabilities. These upfront payments are recorded as realized gain or loss in the Statement of Operations upon termination or maturity of the swap. A liquidation payment received or made at the termination of the swap is recorded as realized gain or loss in the Statement of Operations. Net periodic payments received or paid by the Portfolio are included as part of realized gain or loss in the Statement of Operations. Entering into these agreements involves, to varying degrees, elements of credit, market and documentation risk in excess of the amounts recognized in the Statement of Assets and Liabilities. Such risks involve the possibility that there will be no liquid market for these agreements, that the counterparty to the agreements may default on its obligation to perform or disagree as to the meaning of contractual terms in the agreements and that there may be unfavorable changes in interest rates.
U.S. Government Agencies or Government-Sponsored Enterprises. Securities issued by U.S. Government agencies or government-sponsored enterprises may not be guaranteed by the U.S. Treasury. The Government National Mortgage Association (“GNMA”), a wholly owned U.S. Government corporation, is authorized to guarantee, with the full faith and credit of the U.S. Government, the timely payment of principal and interest on securities issued by institutions approved by GNMA and backed by pools of mortgages insured by the Federal Housing Administration or guaranteed by the Department of Veterans Affairs. Government-related guarantors (i.e., not backed by the full faith and credit of the U.S. Government) include the Federal National Mortgage Association (“FNMA” or “Fannie Mae”) and the Federal Home Loan Mortgage Corporation (“FHLMC” or “Freddie Mac”). Pass-through securities issued by FNMA are guaranteed as to timely payment of principal and interest by FNMA but are not backed by the full faith and credit of the U.S. Government. FHLMC guarantees the timely payment of interest and ultimate collection of principal, but its participation certificates are not backed by the full faith and credit of the U.S. Government.
New Accounting Policies. In July 2006, the Financial Accounting Standards Board issued Interpretation No. 48, “Accounting for Uncertainty in Income Taxes—an Interpretation of FASB Statement No. 109” (the “Interpretation”). The Interpretation is effective for fiscal years beginning after December 15, 2006. Management is currently evaluating the application of the Interpretation to the Portfolio and will provide additional information in relation to the Interpretation in the Portfolio’s annual financial statements for the year ending December 31, 2006.
3. FEES, EXPENSES, AND RELATED PARTY TRANSACTIONS
Investment Advisory Fee. PIMCO is a majority-owned subsidiary of Allianz Global Investors of America L.P. (“AGI”), and serves as investment adviser (the “Adviser”) to the Trust, pursuant to an investment advisory contract. The Adviser receives a monthly fee at an annual rate based on average daily net assets of the Portfolio. The Advisory Fee is charged at an annual rate of 0.25%.
| | | | |
| 14 | | PIMCO Variable Insurance Trust | | |
| | |
| |
| | | June 30, 2006 (Unaudited) |
Administration Fee. PIMCO serves as administrator (the “Administrator”), and provides administrative services to the Trust for which it receives a monthly administrative fee based on average daily net assets of the Portfolio. As the Administrator, PIMCO bears the costs of various third-party services, including audit, custodial, portfolio accounting, legal, transfer agency and printing costs. The Administration Fee is charged at the annual rate of 0.20%.
Distribution and Servicing Fees. Allianz Global Investors Distributors LLC (“AGID”) is an indirect wholly-owned subsidiary of AGI and serves as the distributor of the Trust’s shares. The Trust is permitted to reimburse AGID on a quarterly basis, out of the Administrative Class assets of the Portfolio in the amount of 0.15% on an annual basis of the average daily net assets of that class, for payments made to financial intermediaries that provide services in connection with the distribution of shares or administration of plans or programs that use Portfolio shares as their funding medium. The effective rate paid to AGID was 0.15% during the current fiscal year.
Expenses. The Trust is responsible for the following expenses: (i) salaries and other compensation of any of the Trust’s executive officers and employees who are not officers, directors, stockholders or employees of PIMCO or its subsidiaries or affiliates; (ii) taxes and governmental fees; (iii) brokerage fees and commissions and other portfolio transaction expenses; (iv) the costs of borrowing money, including interest expenses and bank overdraft charges; (v) fees and expenses of the Trustees who are not “interested persons” of PIMCO or the Trust, and any counsel retained exclusively for their benefit; (vi) extraordinary expenses, including costs of litigation and indemnification expenses; (vii) organization expenses and (viii) any expenses allocated or allocable to a specific class of shares, which include service fees payable with respect to the Administrative Class shares and may include certain other expenses as permitted by the Trust’s Multiple Class Plan adopted pursuant to Rule 18f-3 under the Act and subject to review and approval by the Trustees. The ratio of expenses to average net assets per share class, as disclosed in the Financial Highlights, may differ from the annual portfolio operating expenses per share class as disclosed in the Prospectus for the reasons set forth above.
For the current period ended June 30, 2006, each unaffiliated Trustee received an annual retainer of $15,000, plus $2,000 for each Board of Trustees quarterly meeting attended, $500 for each Board of Trustees committee meeting attended and $500 for each special board meeting attended, plus reimbursement of related expenses. In addition, each Committee Chair received an additional annual retainer of $500 and each Audit Committee Chair received an additional annual retainer of $1,500. These expenses are allocated on a pro-rata basis to each Portfolio of the Trust according to its respective net assets. The Trust pays no compensation directly to any Trustee or any other officer who is affiliated with the Administrator, all of whom receive remuneration for their services to the Trust from the Administrator or its affiliates.
4. PURCHASES AND SALES OF SECURITIES
The length of time the Portfolio has held a particular security is not generally a consideration in investment decisions. A change in the securities held by the Portfolio is known as “portfolio turnover”. The Portfolio may engage in frequent and active trading of portfolio securities to achieve its investment objective, particularly during periods of volatile market movements. High portfolio turnover (e.g., over 100%) involves correspondingly greater expenses to the Portfolio, including brokerage commissions or dealer mark-ups and other transaction costs on the sale of securities and reinvestments in other securities. Such sales may also result in realization of taxable capital gains, including short-term capital gains (which are generally taxed at ordinary income tax rates). The trading costs and tax effects associated with portfolio turnover may adversely affect the Portfolio’s performance.
Purchases and sales of securities (excluding short-term investments) for the period ended June 30, 2006 were as follows (amounts in thousands):
| | | | | | | | | | | | | | |
| | | U.S Government/Agency | | | | All Other |
| | | Purchases | | | | Sales | | | | Purchases | | | | Sales |
| | | $ 2,046 | | | | $ 4,720 | | | | $ 7,331 | | | | $ 5,624 |
5. TRANSACTIONS IN WRITTEN CALL AND PUT OPTIONS
Transactions in written call and put options were as follows (amounts in thousands, except number of contracts):
| | | | | | | | | | | | | | | | | |
| | | | | # of
Contracts |
| | | |
| Notional
Amount
in $ |
| | | | | Premium | |
Balance at 12/31/2005 | | | | 48 | | | | | $ | 3,600 | | | | | $ | 38 | |
Sales | | | | 0 | | | | | | 4,700 | | | | | | 24 | |
Closing Buys | | | | (8 | ) | | | | | (3,100 | ) | | | | | (25 | ) |
Expirations | | | | (40 | ) | | | | | (2,500 | ) | | | | | (26 | ) |
Exercised | | | | 0 | | | | | | 0 | | | | | | 0 | |
Balance at 06/30/2006 | | | | 0 | | | | | $ | 2,700 | | | | | $ | 11 | |
6. SHARES OF BENEFICIAL INTEREST
The Portfolio may issue an unlimited number of shares of beneficial interest with a $0.001 par value. Changes in shares of beneficial interest were as follows (shares and amounts in thousands):
| | | | | | | | | | | | | | | | | | |
| | | | | Six Months Ended
06/30/2006 | | | | | Year Ended
12/31/2005 | |
| | | | | Shares | | | Amount | | | | | Shares | | | Amount | |
| | | | | | |
Receipts for shares sold | | | | | | | | | | | | | | | | | | |
Institutional Class | | | | 1,602 | | | $ | 16,084 | | | | | 1,998 | | | $ | 20,119 | |
Administrative Class | | | | 340 | | | | 3,411 | | | | | 305 | | | | 3,074 | |
Issued as reinvestment of distributions | | | | | | | | | | | | | | | | | | |
Institutional Class | | | | 49 | | | | 487 | | | | | 89 | | | | 892 | |
Administrative Class | | | | 18 | | | | 182 | | | | | 22 | | | | 218 | |
Cost of shares redeemed | | | | | | | | | | | | | | | | | | |
Institutional Class | | | | (3,255 | ) | | | (32,679 | ) | | | | (1,373 | ) | | | (13,817 | ) |
Administrative Class | | | | (231 | ) | | | (2,317 | ) | | | | (333 | ) | | | (3,355 | ) |
Net increase (decrease) resulting from Portfolio share transactions | | | | (1,477 | ) | | $ | (14,832 | ) | | | | 708 | | | $ | 7,131 | |
The following schedule shows the number of shareholders each owning 5% or more of the Portfolio and the total percentage of the Portfolio held by such shareholders:
| | | | | | |
| | | | | Number of
Shareholders | | % of Portfolio
Held |
Institutional Class | | | | 2 | | 97 |
Administrative Class | | | | 4 | | 85 |
7. FEDERAL INCOME TAX MATTERS
As of June 30, 2006, the aggregate cost of investments was the same for federal income tax and financial statement purposes. The net unrealized appreciation (depreciation) of investment securities for federal income tax purposes is as follows (amounts in thousands):
| | | | |
Aggregate Gross Unrealized Appreciation | | Aggregate
Gross
Unrealized
(Depreciation) | | Net
Unrealized
(Depreciation) |
$ 17 | | $ (52) | | $ (35) |
| | | | | | |
| | | Semiannual Report | | June 30, 2006 | | 15 |
Notes to Financial Statements (Cont.)
8. REGULATORY AND LITIGATION MATTERS
On June 1, 2004, the Attorney General of the State of New Jersey announced that it had dismissed PIMCO from a complaint filed by the New Jersey Attorney General on February 17, 2004, and that it had entered into a settlement agreement (the “New Jersey Settlement”) with Allianz Global Investors of America L.P. (“AGI”) (formerly known as Allianz Dresdner Asset Management of America L.P.), PEA Capital LLC (an entity affiliated with PIMCO through common ownership) (“PEA”) and Allianz Global Investors Distributors LLC (“AGID”), in connection with the same matter. In the New Jersey Settlement, AGI, PEA and AGID neither admitted nor denied the allegations or conclusions of law, but did agree to pay New Jersey a civil fine of $15 million and $3 million for investigative costs and further potential enforcement initiatives against unrelated parties. They also undertook to implement certain governance changes. The complaint relating to the New Jersey Settlement alleged, among other things, that AGI, PEA and AGID had failed to disclose that they improperly allowed certain hedge funds to engage in “market timing” in certain funds. The complaint sought injunctive relief, civil monetary penalties, restitution and disgorgement of profits.
Since February 2004, PIMCO, AGI, PEA, AGID, and certain of their affiliates, including the PIMCO Funds, the Allianz Funds (formerly known as PIMCO Funds: Multi-Manager Series), and the Trustees and employees of the PIMCO Funds, have been named as defendants in fifteen lawsuits filed in various jurisdictions. Eleven of those lawsuits concern “market timing,” and they have been transferred to and consolidated for pre-trial proceedings in a multi-district litigation proceeding in the U.S. District Court for the District of Maryland; the other four lawsuits concern “revenue sharing” and have been consolidated into a single action in the U.S. District Court for the District of Connecticut. The lawsuits have been commenced as putative class actions on behalf of investors who purchased, held or redeemed shares of the various series of the PIMCO Funds and the Allianz Funds during specified periods, or as derivative actions on behalf of the PIMCO Funds and Allianz Funds.
The market timing actions in the District of Maryland generally allege that certain hedge funds were allowed to engage in “market timing” in certain of the PIMCO Funds and the Allianz Funds and this alleged activity was not disclosed. Pursuant to tolling agreements entered into with the derivative and class action plaintiffs, PIMCO, the Trustees, and certain employees of PIMCO who were previously named as defendants have all been dropped as defendants in the market timing actions; the plaintiffs continue to assert claims on behalf of the shareholders of the PIMCO Funds or on behalf of the PIMCO Funds themselves against other defendants. By order dated November 3, 2005, the U.S. District Court for the District of Maryland granted the PIMCO Funds’ motion to dismiss claims asserted against it in a consolidated amended complaint where the PIMCO Funds were named, in the complaint, as a nominal defendant. The revenue sharing action in the District of Connecticut generally alleges that fund assets were inappropriately used to pay brokers to promote the PIMCO Funds and Allianz Funds, including directing fund brokerage transactions to such brokers, and that such alleged arrangements were not fully disclosed to shareholders. On August 11, 2005 the U.S. District Court for the District of Connecticut conducted a hearing on defendants’ motion to dismiss the consolidated amended complaint in the revenue sharing action but has not yet ruled on the motion to dismiss. The market timing and revenue sharing lawsuits seek, among other things, unspecified compensatory damages plus interest and, in some cases, punitive damages, the rescission of investment advisory contracts, the return of fees paid under those contracts and restitution.
Under Section 9(a) of the Investment Company Act of 1940, as amended (“1940 Act”), if the New Jersey Settlement or any of the lawsuits described above were to result in a court injunction against AGI, PEA, AGID and/or their affiliates, PIMCO could, in the absence of exemptive relief granted by the SEC, be barred from serving as an investment adviser, and AGID could be barred from serving as principal underwriter, to any registered investment company, including the Portfolios of the Trust. In connection with an inquiry from the SEC concerning the status of the New Jersey Settlement under Section 9(a), PEA, AGID, AGI and certain of their affiliates (including PIMCO) (together, the “Applicants”) have sought exemptive relief from the SEC under Section 9(c) of the 1940 Act. The SEC has granted the Applicants a temporary exemption from the provisions of Section 9(a) with respect to the New Jersey Settlement until the earlier of (i) September 13, 2006 and (ii) the date on which the SEC takes final action on their application for a permanent order. There is no assurance that the SEC will issue a permanent order.
Two nearly identical class action civil complaints have been filed in August 2005, in the Northern District of Illinois Eastern Division alleging that the plaintiffs each purchased and sold a 10-year Treasury note futures contract and suffered damages from an alleged shortage when PIMCO held both physical and futures positions in 10-year Treasury notes for its client accounts. The two actions have been consolidated into one action, and the two separate complaints have been replaced by a consolidated complaint. PIMCO is a named defendant, and the PIMCO Funds have been added as a defendant, to the consolidated action. PIMCO strongly believes the complaint (and any consolidated complaint filed hereafter) is without merit and intends to vigorously defend itself.
Certain Portfolios of the Trust were recently served in an adversary proceeding brought by the Official Committee of Asbestos Claimants of G-I Holdings, Inc. in G-I Holdings, Inc.’s bankruptcy in the District of New Jersey. PIMCO was previously named in this lawsuit and remains a defendant. The plaintiff seeks to recover for the bankruptcy estate assets that were transferred by the predecessor entity of G-I Holdings, Inc. to a wholly-owned subsidiary in 1994. The subsidiary has since issued notes, of which certain Portfolios of the Trust are alleged to be holders. The complaint alleges that in 2000, more than two hundred noteholders—including certain Portfolios of the Trust—were granted a second priority lien on the assets of the subsidiary in exchange for their consent to a refinancing transaction and the granting of a first priority lien to the lending banks. The plaintiff is seeking invalidation of the lien in favor of the noteholders and/or the value of the lien.
It is possible that these matters and/or other developments resulting from these matters could result in increased fund redemptions or other adverse consequences to the Portfolios. However, PIMCO and AGID believe that these matters are not likely to have a material adverse effect on the Portfolios or on PIMCO’s or AGID’s ability to perform their respective investment advisory or distribution services relating to the Portfolios.
| | | | |
| 16 | | PIMCO Variable Insurance Trust | | |
Investment Adviser and Administrator
Pacific Investment Management Company LLC
840 Newport Center Drive
Newport Beach, California 92660
Distributor
Allianz Global Investors Distributors LLC
2187 Atlantic Street
Stamford, Connecticut 06902
Custodian
State Street Bank & Trust Company
801 Pennsylvania
Kansas City, Missouri 64105
Transfer Agent
Boston Financial Data Services–Midwest
330 W. 9th Street
Kansas City, Missouri 64105
Legal Counsel
Dechert LLP
1775 I Street, N.W.
Washington, D.C. 20006
Independent Registered Public Accounting Firm
PricewaterhouseCoopers LLP
1055 Broadway
Kansas City, Missouri 64105
P I M C O

Share Class Administrative
Semiannual Report June 30, 2006
PIMCO Variable Insurance Trust
StocksPLUS® Growth and Income Portfolio
Table of Contents
This material is authorized for use only when preceded or accompanied by the current PIMCO Variable Insurance Trust (the “Trust”) prospectus. Investors should consider the investment objectives, risks, charges and expenses of this Trust carefully before investing. Ask your financial professional to explain all charges that may apply. This and other information is contained in the Trust’s prospectus. The variable product prospectus may be obtained by contacting your Investment Consultant. Please read the Trust and variable product prospectus carefully before you invest or send money.
Chairman’s Letter
Dear PIMCO Variable Insurance Trust Shareholder:
It is our pleasure to present to you the semiannual report for the PIMCO Variable Insurance Trust covering the six-month period ended June 30, 2006.
Highlights of the global bond markets during the six-month period included:
| | n | | Most fixed-income sectors lost ground during the first half of 2006, as concern about accelerating inflation and central bank tightening pushed interest rates higher worldwide. The benchmark Lehman Brothers Aggregate Bond Index (which includes Treasury, Investment-Grade Corporate, and Residential Mortgage-Backed Securities) returned -0.72% for the first six months of the year. On June 30, the benchmark ten-year Treasury yielded 5.14%, 0.75% higher than at the start of the year. The U.S. yield curve remained flat as shorter-maturity yields rose by a comparable amount. |
| | n | | The Federal Reserve tightened four times during the reporting period, bringing the Federal Funds Rate to 5.25%. The increase near the end of the period was the Federal Reserve’s 17th consecutive rate hike since the start of its tightening cycle in 2004. The Federal Reserve was not alone, as central banks in Europe, India, and China tightened credit in unison for the first time since 2000. The Bank of Japan, whose zero-interest-rate policy has flooded global markets with liquidity, looked set to reverse this policy in the coming months. |
In these pages please find a more complete Portfolio review as it relates to financial-market activities, as well as details about total-return investment performance for the six-month reporting period. Thank you for the trust you have placed in us. We will continue to work diligently to meet your investment needs.
Sincerely,
Brent R. Harris
Chairman, PIMCO Variable Insurance Trust
July 31, 2006
| | | | | | |
| | | Semiannual Report | | June 30, 2006 | | 1 |
Important Information About the Portfolio
PIMCO Variable Insurance Trust (the “Trust”) is an open-end management investment company currently consisting of nineteen separate investment portfolios, including the StocksPLUS® Growth and Income Portfolio (the “Portfolio”). The Portfolio is only available as a funding vehicle under variable life insurance policies or variable annuity contracts issued by insurance companies (“Variable Contracts”). Individuals may not purchase shares of the Portfolio directly. Shares of the Portfolio also may be sold to qualified pension and retirement plans outside of the separate account context.
We believe that bond funds have an important role to play in a well diversified investment portfolio. It is important to note, however, that in an environment where interest rates may trend upward, rising rates would negatively impact the performance of most bond funds, and fixed-income securities held by a fund are likely to decrease in value. The price volatility of fixed-income securities can also increase during periods of rising interest rates resulting in increased losses to a fund. Bond funds and individual bonds with a longer duration (a measure of the expected life of a security) tend to be more sensitive to changes in interest rates, usually making them more volatile than securities or funds with shorter durations. The longer-term performance of most bond funds has benefited from capital gains in part resulting from an extended period of declining interest rates. In the event interest rates increase, these capital gains should not be expected to recur.
The Portfolio may be subject to various risks in addition to those described above. Some of these risks may include, but are not limited to, the following: credit risk, high yield risk, market risk, issuer risk, liquidity risk, derivatives risk, equity risk, mortgage risk, non-U.S. investment risk, currency risk, leveraging risk and management risk. A complete description of these risks is contained in the Portfolio’s prospectus. The Portfolio may use derivative instruments for hedging purposes or as part of an investment strategy. Use of these instruments may involve certain costs and risks such as liquidity risk, interest rate risk, market risk, credit risk, management risk and the risk that the Portfolio could not close out a position when it would be most advantageous to do so. A Portfolio investing in derivatives could lose more than the principal amount invested in these instruments. Investing in non-U.S. securities may entail risk due to non-U.S. economic and political developments; this risk may be increased when investing in emerging markets.
On the performance summary page in this Semiannual Report, the Total Return Investment Performance table measures performance assuming that all dividend and capital gain distributions were reinvested.
An investment in the Portfolio is not a deposit of a bank and is not guaranteed or insured by the Federal Deposit Insurance Corporation or any other government agency. It is possible to lose money on investments in the Portfolio.
PIMCO has adopted written proxy voting policies and procedures (“Proxy Policy”) as required by Rule 206(4)-6 under the Investment Advisers Act of 1940. The Proxy Policy has been adopted by the Trust as the policies and procedures that PIMCO will use when voting proxies on behalf of the Portfolio. Copies of the written Proxy Policy and the factors that PIMCO may consider in determining how to vote proxies for the Portfolio, and information about how the Portfolio voted proxies relating to portfolio securities held during the most recent twelve-month period ended June 30, are available without charge, upon request, by calling the Trust at 1-866-746-2606 and on the Securities and Exchange Commission’s (“SEC”) website at http://www.sec.gov.
The Portfolio files its complete schedule of portfolio holdings with the SEC for the first and third quarters of each fiscal year on Form N-Q. A copy of the Trust’s Form N-Q is available on the SEC’s website at http://www.sec.gov and may be reviewed and copied at the SEC’s Public Reference Room in Washington D.C. Information on the operation of the Public Reference Room may be obtained by calling 1-800-SEC-0330.
PIMCO Variable Insurance Trust is distributed by Allianz Global Investors Distributors LLC, 2187 Atlantic Street, Stamford, CT 06902.
| | | | |
| 2 | | PIMCO Variable Insurance Trust | | |
The following disclosure provides important information regarding the Portfolio’s Expense Example (“Example” or “Expense Example”), which appears in this Semiannual Report. Please refer to this information when reviewing the Expense Example for the Portfolio.
Example
As a shareholder of the Portfolio, you incur two types of costs: (1) transaction costs and (2) ongoing costs, including advisory and administrative fees; distribution and/or service (12b-1) fees (Administrative Class only); and other Portfolio expenses. The Example is intended to help you understand your ongoing costs (in dollars) of investing in the Portfolio and to compare these costs with the ongoing costs of investing in other mutual funds. The Expense Example does not reflect any fees or other expenses imposed by the Variable Contracts. If it did, the expenses reflected in the Expense Examples would be higher. The Example is based on an investment of $1,000 invested at the beginning of the period and held for the entire period indicated, which is from January 1, 2006 to June 30, 2006.
Actual Expenses
The information in the table under the heading “Actual Performance” provides information about actual account values and actual expenses. You may use the information in these columns, together with the amount you invested, to estimate the expenses that you paid over the period. Simply divide your account value by $1,000 (for example, an $8,600 account value divided by $1,000 = 8.60), then multiply the result by the number in the appropriate column for your share class, in the row titled “Expenses Paid During Period” to estimate the expenses you paid on your account during this period.
Hypothetical Example for Comparison Purposes
The information in the table under the heading “Hypothetical Performance (5% return before expenses)” provides information about hypothetical account values and hypothetical expenses based on the Portfolio’s actual expense ratio and an assumed rate of return of 5% per year before expenses, which is not the Portfolio’s actual return. The hypothetical account values and expenses may not be used to estimate the actual ending account balance or expenses you paid for the period. You may use this information to compare the ongoing costs of investing in the Portfolio and other portfolios. To do so, compare this 5% hypothetical example with the 5% hypothetical examples that appear in the shareholder reports of the other portfolios.
Please note that the expenses shown in the table are meant to highlight your ongoing costs only and do not reflect any transactional costs. Therefore, the information under the heading “Hypothetical Performance (5% return before expenses)” is useful in comparing ongoing costs only, and will not help you determine the relative total costs of owning different portfolios. In addition, if these transactional costs were included, your costs would have been higher.
The expense ratio may vary period to period because of various factors, such as an increase in expenses not covered by the advisory and administrative fees (such as expenses of the trustees and their counsel or litigation expense).
Portfolio Benchmark
The S&P 500 Index is an unmanaged index generally considered representative of the stock market as a whole. It is not possible to invest directly in the index.
| | | | | | |
| | | Semiannual Report | | June 30, 2006 | | 3 |
| | | | |
| | |
| PIMCO StocksPLUS® Growth and Income Portfolio | | | | |
| | | | |
Cumulative Returns Through June 30, 2006
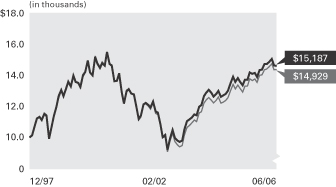
StocksPLUS/(R)/ Growth
and Income Portfolio
Administrative Class S&P 500 Index
---------------------- -------------
12/31/1997 $10,000 $10,000
01/31/1998 10,140 10,111
02/28/1998 10,820 10,840
03/31/1998 11,370 11,395
04/30/1998 11,490 11,510
05/31/1998 11,260 11,312
06/30/1998 11,701 11,771
07/31/1998 11,570 11,646
08/31/1998 9,906 9,962
09/30/1998 10,669 10,600
10/31/1998 11,552 11,462
11/30/1998 12,222 12,157
12/31/1998 13,011 12,858
01/31/1999 13,446 13,395
02/28/1999 12,990 12,979
03/31/1999 13,541 13,498
04/30/1999 14,052 14,021
05/31/1999 13,697 13,690
06/30/1999 14,493 14,450
07/31/1999 14,031 13,999
08/31/1999 13,968 13,929
09/30/1999 13,663 13,548
10/31/1999 14,525 14,405
11/30/1999 14,759 14,698
12/31/1999 15,594 15,564
01/31/2000 14,720 14,782
02/29/2000 14,501 14,502
03/31/2000 15,844 15,920
04/30/2000 15,355 15,441
05/31/2000 15,042 15,125
06/30/2000 15,398 15,497
07/31/2000 15,209 15,255
08/31/2000 16,210 16,203
09/30/2000 15,351 15,347
10/31/2000 15,219 15,282
11/30/2000 14,074 14,077
12/31/2000 14,113 14,146
01/31/2001 14,649 14,648
02/28/2001 13,295 13,313
03/31/2001 12,450 12,469
04/30/2001 13,336 13,438
05/31/2001 13,503 13,528
06/30/2001 13,178 13,199
07/31/2001 13,126 13,069
08/31/2001 12,332 12,251
09/30/2001 11,338 11,262
10/31/2001 11,589 11,476
11/30/2001 12,396 12,357
12/31/2001 12,499 12,465
01/31/2002 12,365 12,283
02/28/2002 12,178 12,046
03/31/2002 12,603 12,499
04/30/2002 11,877 11,742
05/31/2002 11,810 11,655
06/30/2002 10,948 10,825
07/31/2002 10,016 9,981
08/31/2002 10,178 10,047
09/30/2002 9,078 8,955
10/31/2002 9,922 9,743
11/30/2002 10,534 10,316
12/31/2002 9,972 9,710
01/31/2003 9,766 9,456
02/28/2003 9,669 9,314
03/31/2003 9,776 9,404
04/30/2003 10,592 10,179
05/31/2003 11,172 10,715
06/30/2003 11,300 10,852
07/31/2003 11,439 11,043
08/31/2003 11,675 11,259
09/30/2003 11,601 11,139
10/31/2003 12,227 11,769
11/30/2003 12,338 11,873
12/31/2003 13,001 12,496
01/31/2004 13,240 12,725
02/29/2004 13,451 12,902
03/31/2004 13,251 12,707
04/30/2004 12,970 12,508
05/31/2004 13,139 12,679
06/30/2004 13,382 12,926
07/31/2004 12,944 12,498
08/31/2004 13,043 12,549
09/30/2004 13,166 12,685
10/31/2004 13,393 12,878
11/30/2004 13,932 13,399
12/31/2004 14,407 13,855
01/31/2005 14,035 13,518
02/28/2005 14,307 13,802
03/31/2005 14,037 13,558
04/30/2005 13,780 13,301
05/31/2005 14,195 13,724
06/30/2005 14,191 13,743
07/31/2005 14,723 14,254
08/31/2005 14,622 14,124
09/30/2005 14,691 14,239
10/31/2005 14,388 14,001
11/30/2005 14,907 14,531
12/31/2005 14,909 14,536
01/31/2006 15,318 14,921
02/28/2006 15,333 14,961
03/31/2006 15,483 15,148
04/30/2006 15,703 15,351
05/31/2006 15,233 14,909
06/30/2006 15,187 14,929
$10,000 invested at the beginning of the first full month following the inception date of the Portfolio’s Administrative Class.
Sector Breakdown‡
| | |
Short-Term Instruments# | | 44.5% |
Corporate Bonds & Notes# | | 24.9% |
U.S. Treasury Obligations# | | 12.6% |
U.S. Government Agencies# | | 9.8% |
Other | | 8.2% |
| | ‡ | % of Total Investments as of June 30, 2006 |
| | # | Primarily serving as collateral for equity-linked derivative positions |
| | | | | | | | | | | | |
| Average Annual Total Return for the period ended June 30, 2006 |
| | | | | | | 6 Months* | | 1 Year | | 5 Years | | Since
Inception
(12/31/97) |
| | |
| | PIMCO StocksPLUS® Growth and Income Portfolio Administrative Class | | 1.86% | | 7.02% | | 2.88% | | 5.04% |
| | |
| | S&P 500 Index | | 2.71% | | 8.63% | | 2.49% | | 4.83% |
All Portfolio returns are net of fees and expenses.
* Cumulative return.
Past performance is no guarantee of future results. The performance quoted represents past performance. Investment return and principal value will fluctuate so the Portfolio shares, when redeemed, may be worth more or less than their original cost. The Portfolio’s performance does not reflect the deduction of additional charges and expenses imposed in connection with investing in Variable Contracts, which will reduce returns. Current performance may be lower or higher than the performance data quoted. Performance data current to the most recent month-end is available by calling (800) 927-4648.
| | | | | | | | | | |
| Expense Example | | | | Actual Performance | | | | Hypothetical Performance |
| | | | | | | | | (5% return before expenses) |
Beginning Account Value (01/01/06) | | | | $ | 1,000.00 | | | | $ | 1,000.00 |
Ending Account Value (06/30/06) | | | | $ | 1,018.60 | | | | $ | 1,021.57 |
Expenses Paid During Period† | | | | $ | 3.25 | | | | $ | 3.26 |
† Expenses are equal to the Portfolio’s Administrative Class annualized expense ratio of 0.60%, multiplied by the average account value over the period, multiplied by 181/365 (to reflect the one-half year period). Overall fees and expenses of investing in the Portfolio will be higher because the example does not reflect Variable Contract fees and expenses.
Please refer to page 3 herein for a description of the Portfolio’s benchmark and an explanation of the information presented in the above Expense Example.
Portfolio Insights
| » | | The PIMCO StocksPLUS® Growth and Income Portfolio seeks to achieve its investment objective by investing under normal circumstances substantially all of its assets in S&P 500 derivatives, backed by a portfolio of Fixed-Income Instruments. |
| » | | The first half of the year was a difficult environment for the StocksPLUS® strategy as most bonds lagged money market instruments; concern about accelerating inflation and central bank tightening pushed interest rates higher worldwide. |
| » | | U.S. interest rate exposure was the dominant cause of underperformance as interest rates increased along the yield curve. |
| » | | An emphasis on Eurodollar instruments and other shorter (one year or less) holdings was negative as rate increases were more pronounced in this part of the curve. |
| » | | Broad diversification to higher-yielding bond sectors, including mortgages and limited exposure to corporates and emerging market securities, helped partially buffer the underperformance associated with rising rates. |
| » | | Long exposure to the Yen and Euro currency was positive as both currencies appreciated relative to the U.S. dollar. |
| | | | |
| 4 | | PIMCO Variable Insurance Trust | | |
|
|
| Financial Highlights StocksPLUS® Growth and Income Portfolio |
| | | | | | | | | | | | | | | | | | | | | | | | |
| Selected Per Share Data for the Year or Period Ended: | | 06/30/2006+ | | | 12/31/2005 | | | 12/31/2004 | | | 12/31/2003 | | | 12/31/2002 | | | 12/31/2001 | |
| | | | | | |
Administrative Class | | | | | | | | | | | | | | | | | | | | | | | | |
| Net asset value beginning of period | | $ | 10.20 | | | $ | 10.09 | | | $ | 9.26 | | | $ | 7.25 | | | $ | 9.35 | | | $ | 11.05 | |
| Net investment income (a) | | | 0.20 | | | | 0.29 | | | | 0.13 | | | | 0.13 | | | | 0.26 | | | | 0.50 | |
| Net realized/unrealized gain (loss) on investments (a) | | | (0.01 | ) | | | 0.06 | | | | 0.86 | | | | 2.06 | | | | (2.14 | ) | | | (1.78 | ) |
| Total income (loss) from investment operations | | | 0.19 | | | | 0.35 | | | | 0.99 | | | | 2.19 | | | | (1.88 | ) | | | (1.28 | ) |
| Dividends from net investment income | | | (0.19 | ) | | | (0.24 | ) | | | (0.16 | ) | | | (0.18 | ) | | | (0.22 | ) | | | (0.42 | ) |
| Total distributions | | | (0.19 | ) | | | (0.24 | ) | | | (0.16 | ) | | | (0.18 | ) | | | (0.22 | ) | | | (0.42 | ) |
| Net asset value end of period | | $ | 10.20 | | | $ | 10.20 | | | $ | 10.09 | | | $ | 9.26 | | | $ | 7.25 | | | $ | 9.35 | |
| Total return | | | 1.86 | % | | | 3.49 | % | | | 10.81 | % | | | 30.38 | % | | | (20.22 | )% | | | (11.43 | )% |
| Net assets end of period (000s) | | $ | 79,905 | | | $ | 229,193 | | | $ | 266,851 | | | $ | 267,880 | | | $ | 218,993 | | | $ | 259,926 | |
| Ratio of expenses to average net assets | | | 0.60 | %*(d) | | | 0.65 | % | | | 0.65 | % | | | 0.65 | % | | | 0.65 | %(b) | | | 0.67 | %(c) |
| Ratio of net investment income to average net assets | | | 3.85 | %* | | | 2.87 | % | | | 1.39 | % | | | 1.54 | % | | | 3.13 | % | | | 5.02 | % |
| Portfolio turnover rate | | | 57 | % | | | 264 | % | | | 249 | % | | | 134 | % | | | 192 | % | | | 547 | % |
+ Unaudited
* Annualized
(a) Per share amounts based on average number of shares outstanding during the period.
(b) If the investment manager had not reimbursed expenses, the ratio of expenses to average net assets would have been 0.66%.
(c) Ratio of expenses to average net assets excluding interest expense is 0.65%.
(d) Effective October 31, 2005, the advisory fee was reduced to 0.35%.
| | | | | | |
| See Accompanying Notes | | Semiannual Report | | June 30, 2006 | | 5 |
|
|
| Statement of Assets and Liabilities StocksPLUS® Growth and Income Portfolio |
| | | | |
| (Amounts in thousands, except per share amounts) | | June 30, 2006
(Unaudited) | |
| |
Assets: | | | | |
Investments, at value | | $ | 90,859 | |
Cash | | | 2 | |
Foreign currency, at value | | | 1,741 | |
Receivable for Portfolio shares sold | | | 50 | |
Interest and dividends receivable | | | 444 | |
Variation margin receivable | | | 742 | |
Swap premiums paid | | | 87 | |
Unrealized appreciation on forward foreign currency contracts | | | 172 | |
Unrealized appreciation on swap agreements | | | 139 | |
| | | | 94,236 | |
| |
Liabilities: | | | | |
Payable for investments purchased | | $ | 4,835 | |
Payable for Portfolio shares redeemed | | | 187 | |
Written options outstanding | | | 1,390 | |
Accrued investment advisory fee | | | 26 | |
Accrued administration fee | | | 8 | |
Accrued servicing fee | | | 12 | |
Variation margin payable | | | 1,017 | |
Swap premiums received | | | 53 | |
Unrealized depreciation on forward foreign currency contracts | | | 636 | |
Unrealized depreciation on swap agreements | | | 5 | |
| | | | 8,169 | |
| |
Net Assets | | $ | 86,067 | |
| |
Net Assets Consist of: | | | | |
Paid in capital | | $ | 141,777 | |
Undistributed net investment income | | | 5,520 | |
Accumulated undistributed net realized (loss) | | | (59,814 | ) |
Net unrealized (depreciation) | | | (1,416 | ) |
| | | $ | 86,067 | |
| |
Net Assets: | | | | |
Institutional Class | | $ | 6,161 | |
Administrative Class | | | 79,905 | |
| |
Shares Issued and Outstanding: | | | | |
Institutional Class | | | 599 | |
Administrative Class | | | 7,833 | |
| |
Net Asset Value and Redemption Price Per Share (Net Assets Per Share Outstanding) | | | | |
Institutional Class | | $ | 10.28 | |
Administrative Class | | | 10.20 | |
| |
Cost of Investments Owned | | $ | 91,384 | |
Cost of Foreign Currency Held | | $ | 1,755 | |
Premiums Received on Written Options | | $ | 611 | |
| | | | |
| 6 | | PIMCO Variable Insurance Trust | | See Accompanying Notes |
|
|
| Statement of Operations StocksPLUS® Growth and Income Portfolio |
| | | | |
| (Amounts in Thousands) | | Six Months Ended
June 30, 2006
(Unaudited) | |
| |
Investment Income: | | | | |
Interest | | $ | 4,032 | |
Dividends | | | 57 | |
Miscellaneous income | | | 2 | |
Total Income | | | 4,091 | |
| |
Expenses: | | | | |
Investment advisory fees | | | 320 | |
Administration fees | | | 91 | |
Servicing fees – Administrative Class | | | 133 | |
Trustees’ fees | | | 1 | |
Total Expenses | | | 545 | |
| |
Net Investment Income | | | 3,546 | |
| |
Net Realized and Unrealized Gain (Loss): | | | | |
Net realized (loss) on investments | | | (422 | ) |
Net realized gain on futures contracts, options and swaps | | | 4,075 | |
Net realized (loss) on foreign currency transactions | | | (184 | ) |
Net change in unrealized appreciation on investments | | | 203 | |
Net change in unrealized appreciation on futures contracts, options and swaps | | | 1,302 | |
Net change in unrealized appreciation on translation of assets and liabilities denominated in foreign currencies | | | 631 | |
Net Gain | | | 5,605 | |
| |
Net Increase in Net Assets Resulting from Operations | | $ | 9,151 | |
| | | | | | |
| See Accompanying Notes | | Semiannual Report | | June 30, 2006 | | 7 |
|
|
| Statements of Changes in Net Assets StocksPLUS® Growth and Income Portfolio |
| | | | | | | | |
| (Amounts in Thousands) | | Six Months Ended
June 30, 2006
(Unaudited) | | | Year Ended
December 31, 2005 | |
| | |
Increase (Decrease) in Net Assets from: | | | | | | | | |
| | |
Operations: | | | | | | | | |
Net investment income | | $ | 3,546 | | | $ | 7,131 | |
Net realized gain | | | 3,469 | | | | 11,323 | |
Net change in unrealized appreciation (depreciation) | | | 2,136 | | | | (10,541 | ) |
Net increase resulting from operations | | | 9,151 | | | | 7,913 | |
| | |
Distributions to Shareholders: | | | | | | | | |
| From net investment income | | | | | | | | |
Institutional Class | | | (111 | ) | | | (127 | ) |
Administrative Class | | | (2,039 | ) | | | (5,480 | ) |
| | |
Total Distributions | | | (2,150 | ) | | | (5,607 | ) |
| | |
Portfolio Share Transactions: | | | | | | | | |
| Receipts for shares sold | | | | | | | | |
Institutional Class | | | 1,207 | | | | 3,215 | |
Administrative Class | | | 1,775 | | | | 4,123 | |
| Issued as reinvestment of distributions | | | | | | | | |
Institutional Class | | | 111 | | | | 127 | |
Administrative Class | | | 2,039 | | | | 5,480 | |
| Cost of shares redeemed | | | | | | | | |
Institutional Class | | | (883 | ) | | | (1,264 | ) |
Administrative Class | | | (160,111 | ) | | | (49,470 | ) |
Net (decrease) resulting from Portfolio share transactions | | | (155,862 | ) | | | (37,789 | ) |
| | |
Total Decrease in Net Assets | | | (148,861 | ) | | | (35,483 | ) |
| | |
Net Assets: | | | | | | | | |
Beginning of period | | | 234,928 | | | | 270,411 | |
End of period* | | $ | 86,067 | | | $ | 234,928 | |
| | |
*Including undistributed net investment income of: | | $ | 5,520 | | | $ | 4,124 | |
| | | | |
| 8 | | PIMCO Variable Insurance Trust | | See Accompanying Notes |
| | |
| |
| Schedule of Investments StocksPLUS® Growth and Income Portfolio | | June 30, 2006 (Unaudited) |
| | | | | | | | |
| | | | | PRINCIPAL | | | | |
| | | | | AMOUNT | | | | VALUE |
| | | | | (000S) | | | | (000S) |
| | | | | | | | | |
| BANK LOAN OBLIGATIONS 1.2% |
| Georgia-Pacific Corp. | | | | | | | | |
6.979% due 12/20/2012 | | $ | | 45 | | $ | | 46 |
7.170% due 12/20/2012 | | | | 190 | | | | 190 |
7.300% due 12/20/2012 | | | | 762 | | | | 761 |
| | | | | | | | |
|
Total Bank Loan Obligations
(Cost $997) | | | | 997 |
| | | | | | | | |
|
| |
| CORPORATE BONDS & NOTES 26.3% |
| |
| BANKING & FINANCE 13.7% |
| Bank of America Corp. | | | | | | | | |
5.406% due 06/19/2009 | | | | 800 | | | | 800 |
|
| CIT Group, Inc. | | | | | | | | |
5.000% due 11/24/2008 | | | | 300 | | | | 296 |
|
| Citigroup, Inc. | | | | | | | | |
4.200% due 12/20/2007 | | | | 2,500 | | | | 2,452 |
|
| Enron Credit Linked Notes Trust | | | | |
8.000% due 08/15/2005 (a) | | | | 1,700 | | | | 1,122 |
|
| Export-Import Bank of Korea | | | | | | | | |
5.410% due 11/16/2010 | | | | 1,900 | | | | 1,901 |
|
| Ford Motor Credit Co. | | | | | | | | |
6.374% due 03/21/2007 | | | | 1,700 | | | | 1,694 |
6.320% due 09/28/2007 | | | | 600 | | | | 587 |
4.950% due 01/15/2008 | | | | 100 | | | | 94 |
|
| General Motors Acceptance Corp. | | | | |
5.968% due 01/16/2007 | | | | 600 | | | | 598 |
6.599% due 09/23/2008 | | | | 1,500 | | | | 1,470 |
|
| HSBC Finance Corp. | | | | | | | | |
6.538% due 11/13/2007 | | | | 100 | | | | 101 |
|
| Royal Bank of Scotland Group PLC | | | | |
5.424% due 12/21/2007 | | | | 600 | | | | 600 |
|
| Simsbury CLO Ltd. | | | | | | | | |
5.669% due 09/24/2011 | | | | 123 | | | | 123 |
| | | | | | | | |
|
| | | | | | | | | 11,838 |
| | | | | | | | |
|
| |
| INDUSTRIALS 9.8% | | | | | | | | |
| El Paso Corp. | | | | | | | | |
7.625% due 08/16/2007 | | | | 500 | | | | 508 |
6.500% due 06/01/2008 | | | | 1,100 | | | | 1,097 |
|
| Electronic Data Systems Corp. | | | | |
6.334% due 08/17/2006 | | | | 400 | | | | 400 |
|
| HCA, Inc. | | | | | | | | |
7.250% due 05/20/2008 | | | | 120 | | | | 122 |
|
| Host Marriott LP | | | | | | | | |
9.500% due 01/15/2007 | | | | 25 | | | | 26 |
|
| JC Penney Corp., Inc. | | | | | | | | |
7.375% due 08/15/2008 | | | | 100 | | | | 103 |
|
| Mandalay Resort Group | | | | | | | | |
6.500% due 07/31/2009 | | | | 2,200 | | | | 2,167 |
|
| Northwest Pipeline Corp. | | | | | | | | |
6.625% due 12/01/2007 | | | | 1,372 | | | | 1,379 |
|
| Pemex Project Funding Master Trust | | | | |
5.871% due 12/03/2012 | | | | 700 | | | | 699 |
|
| Southern Natural Gas Co. | | | | | | | | |
6.700% due 10/01/2007 | | | | 500 | | | | 503 |
|
| Transcontinental Gas Pipe Line Corp. | | |
6.348% due 04/15/2008 | | | | 1,100 | | | | 1,104 |
|
| Xerox Corp. | | | | | | | | |
9.750% due 01/15/2009 | | | | 300 | | | | 322 |
| | | | | | | | |
|
| | | | | | | | | 8,430 |
| | | | | | | | |
|
| |
| | | | | | | | |
| UTILITIES 2.8% | | | | | | | | |
| AT&T, Inc. | | | | | | | | |
4.389% due 06/05/2007 | | $ | | 300 | | $ | | 297 |
|
| CMS Energy Corp. | | | | | | | | |
9.875% due 10/15/2007 | | | | 1,300 | | | | 1,359 |
|
| Qwest Corp. | | | | | | | | |
8.579% due 06/15/2013 | | | | 700 | | | | 744 |
| | | | | | | | |
|
| | | | | | | | | 2,400 |
| | | | | | | | |
|
Total Corporate Bonds & Notes
(Cost $23,349) | | | | 22,668 |
| | | | | | | | |
|
| |
| MUNICIPAL BONDS & NOTES 0.7% |
| Golden State, California Tobacco Securitization Corporations Revenue Notes, Series 2003 |
5.000% due 06/01/2021 | | | | 555 | | | | 558 |
| | | | | | | | |
|
Total Municipal Bonds & Notes
(Cost $553) | | | | 558 |
| | | | | | | | |
|
| |
| U.S. GOVERNMENT AGENCIES 10.3% |
| Fannie Mae | | | | | | | | |
5.000% due 12/01/2017 - 09/01/2018 (c) | | | | 1,104 | | | | 1,066 |
5.500% due 07/13/2036 | | | | 5,000 | | | | 4,803 |
6.000% due 04/01/2016 - 11/01/2033 (c) | | | | 241 | | | | 240 |
8.000% due 05/01/2030 - 09/01/2031 (c) | | | | 54 | | | | 56 |
|
| Federal Home Loan Bank | | | | | | | | |
0.000% due 02/27/2012 | | | | 500 | | | | 436 |
|
| Freddie Mac | | | | | | | | |
5.500% due 08/15/2030 | | | | 38 | | | | 38 |
6.000% due 07/01/2016 - 05/01/2033 (c) | | | | 1,083 | | | | 1,073 |
6.500% due 10/25/2043 | | | | 587 | | | | 589 |
|
| Government National Mortgage Association |
4.000% due 07/16/2027 | | | | 155 | | | | 153 |
5.125% due 11/20/2029 | | | | 185 | | | | 187 |
5.375% due 02/20/2027 | | | | 171 | | | | 171 |
8.000% due 04/15/2027 - 12/15/2029 (c) | | | | 74 | | | | 79 |
8.500% due 04/20/2030 | | | | 3 | | | | 3 |
| | | | | | | | |
|
Total U.S. Government Agencies (Cost $9,119) | | | | 8,894 |
| | | | | | | | |
|
| |
| U.S. TREASURY OBLIGATIONS 13.3% |
| Treasury Inflation Protected Securities (b) |
3.625% due 01/15/2008 (e) | | | | 11,222 | | | | 11,419 |
| | | | | | | | |
|
Total U.S. Treasury Obligations
(Cost $11,622) | | | | 11,419 |
| | | | | | | | |
|
| |
| MORTGAGE-BACKED SECURITIES 2.6% |
| Banc of America Funding Corp. | | | | |
4.114% due 05/25/2035 | | | | 507 | | | | 489 |
|
| Banc of America Mortgage Securities |
6.500% due 10/25/2031 | | | | 250 | | | | 251 |
|
| Bear Stearns Adjustable Rate Mortgage Trust |
5.339% due 02/25/2033 | | | | 184 | | | | 183 |
|
| Countrywide Alternative Loan Trust |
6.000% due 10/25/2033 | | | | 448 | | | | 431 |
|
| CS First Boston Mortgage Securities Corp. |
5.691% due 05/25/2032 | | | | 148 | | | | 147 |
|
| Impac CMB Trust |
5.702% due 10/25/2033 | | | | 38 | | | | 38 |
5.572% due 04/25/2034 | | | | 212 | | | | 212 |
| | | | | | | | | |
| Residential Funding Mortgage Security I |
6.500% due 03/25/2032 | | $ | | 257 | | | $ | | 256 |
|
| Structured Asset Mortgage Investments, Inc. |
5.602% due 02/25/2035 | | | | 195 | | | | | 195 |
| | | | | | | | | |
|
Total Mortgage-Backed Securities
(Cost $2,264) | | | | | 2,202 |
| | | | | | | | | |
|
| |
| ASSET-BACKED SECURITIES 0.5% |
| Countrywide Asset-Backed Certificates |
5.472% due 05/25/2035 | | | | 438 | | | | | 439 |
| | | | | | | | | |
|
Total Asset-Backed Securities
(Cost $438) | | 439 |
| | | | | | | | | |
|
| |
| SOVEREIGN ISSUES 1.6% |
| Korea Development Bank |
5.469% due 11/22/2012 | | | | 500 | | | | | 501 |
|
| Mexico Government International Bond |
5.750% due 01/13/2009 | | | | 900 | | | | | 909 |
| | | | | | | | | |
|
Total Sovereign Issues
(Cost $1,400) | | | | | 1,410 |
| | | | | | | | | |
|
| |
| | | | | NOTIONAL
AMOUNT
(000S) | | | | | |
| PURCHASED CALL OPTIONS 0.0% |
| 2-Year Interest Rate Swap (OTC) Pay 3-Month USD-LIBOR Floating Rate Index |
Strike @ 4.500% Exp. 10/04/2006 | | | | 7,300 | | | | | 0 |
Strike @ 4.800% Exp. 12/22/2006 | | | | 7,000 | | | | | 1 |
Strike @ 5.000% Exp. 03/08/2007 | | | | 9,000 | | | | | 8 |
Strike @ 5.080% Exp. 04/19/2007 | | | | 9,200 | | | | | 13 |
Strike @ 5.130% Exp. 10/25/2006 | | | | 16,000 | | | | | 5 |
| | | | | | | | | |
|
Total Purchased Call Options (Cost $171) | | 27 |
| | | | | | | | | |
|
| |
| | | | | #OF
CONTRACTS | | | | | |
| PURCHASED PUT OPTIONS 0.0% |
| 90-Day Eurodollar December Futures (CME) |
Strike @ $92.000 Exp. 12/18/2006 | | | | 55 | | | | | 0 |
Strike @ $92.250 Exp. 12/18/2006 | | | | 444 | | | | | 3 |
|
| 90-Day Eurodollar March Futures (CME) |
Strike @ $92.000 Exp. 03/19/2007 | | | | 354 | | | | | 2 |
|
| S&P 500 Index September Futures (CME) |
Strike @ $550.000 Exp. 09/15/2006 | | | | 183 | | | | | 0 |
Strike @ $650.000 Exp. 09/15/2006 | | | | 68 | | | | | 0 |
| | | | | | | | | |
|
Total Purchased Put Options (Cost $14) | | 5 |
| | | | | | | | | |
|
| |
| | | | | SHARES | | | | | |
| PREFERRED STOCK 2.1% |
| DG Funding Trust | | | | | |
7.210% due 12/31/2049 | | | | 173 | | | | | 1,826 |
| | | | | | | | | |
|
Total Preferred Stock (Cost $1,823) | | 1,826 |
| | | | | | | | | |
|
| | | | | | |
| See Accompanying Notes | | Semiannual Report | | June 30, 2006 | | 9 |
| | |
| |
| Schedule of Investments StocksPLUS® Growth and Income Portfolio (Cont.) | | June 30, 2006 (Unaudited) |
| | | | | | | | |
| | | | | PRINCIPAL | | | | |
| | | | | AMOUNT | | | | VALUE |
| | | | | (000S) | | | | (000S) |
| SHORT-TERM INSTRUMENTS (h) 47.0% |
| |
| CERTIFICATES OF DEPOSIT 3.3% |
| Barclay Bank PLC | | | | | | | | |
4.485% due 01/29/2007 | | $ | | 1,900 | | $ | | 1,900 |
|
| Danske Corp. | | | | | | | | |
5.080% due 08/24/2006 | | | | 900 | | | | 893 |
| | | | | | | | |
|
| | | | | | | | | 2,793 |
| | | | | | | | |
|
| |
| COMMERCIAL PAPER 14.0% | | |
| Abbey National N.A. LLC | | | | | | | | |
5.100% due 07/05/2006 | | | | 2,200 | | | | 2,199 |
|
| Calyon N.A. Inc. | | | | | | | | |
5.230% due 08/03/2006 | | | | 1,000 | | | | 995 |
|
| Cox Communications, Inc. | | | | | | |
4.720% due 07/17/2006 | | | | 300 | | | | 300 |
|
| Fannie Mae | | | | | | | | |
4.958% due 09/13/2006 | | | | 2,200 | | | | 2,175 |
| | | | | | | | |
| Nordea N.A., Inc. | | | | | | | | |
5.300% due 09/11/2006 | | $ | | 2,300 | | $ | | 2,275 |
|
| Total Captial S.A. | | | | | | | | |
5.270% due 07/03/2006 | | | | 2,300 | | | | 2,300 |
|
| UBS Finance Delaware LLC | | | | | | |
5.270% due 07/03/2006 | | | | 100 | | | | 100 |
5.080% due 08/21/2006 | | | | 1,700 | | | | 1,688 |
| | | | | | | | |
|
| | | | | | | | | 12,032 |
| | | | | | | | |
|
| |
| REPURCHASE AGREEMENT 2.3% | | |
| State Street Bank | | | | | | | | |
4.900% due 07/03/2006 | | | | 1,983 | | | | 1,983 |
| | | | | | | | |
|
(Dated 06/30/2006. Collateralized by Freddie Mac 2.750% due 02/09/2007 valued at $2,023. Repurchase proceeds are $1,984.) |
| |
| |
| FRANCE TREASURY BILLS 5.7% |
2.603% due 07/06/2006 - 10/12/2006 (c) | | EUR | | 3,820 | | | | 4,872 |
| | | | | | | | |
|
| | | | | | | | |
| GERMANY TREASURY BILLS 13.6% | | |
2.586% due 07/12/2006 - 08/16/2006 (c) | | EUR | | 9,180 | | $ | | 11,726 |
| | | | | | | | |
|
| |
| U.S. TREASURY BILLS 8.1% |
4.722% due 08/31/2006 - 09/14/2006 (c)(e) | | $ | | 7,065 | | | | 7,008 |
| | | | | | | | |
|
Total Short-Term Instruments
(Cost $39,634) | | 40,414 |
| | | | | | | | |
|
| |
| Total Investments (d) 105.6% (Cost $91,384) | | | | $ | | 90,859 |
| |
| Written Options (g) (1.6%) (Premiums $611) | | | | | | (1,390) |
| |
| Other Assets and Liabilities (Net) (4.0%) | | (3,402) |
| | | | | | | | |
|
| Net Assets 100.0% | | | | | | $ | | 86,067 |
| | | | | | | | |
|
| |
| | | | |
| 10 | | PIMCO Variable Insurance Trust | | See Accompanying Notes |
| | |
| Notes to Schedule of Investments (amounts in thousands, except number of contracts): | | |
| |
(a) Security is in default. |
| |
(b) Principal amount of security is adjusted for inflation. |
| |
(c) Securities are grouped by coupon or range of coupons and represent a range of maturities. |
| |
(d) As of June 30, 2006, portfolio securities with an aggregate market value of $559 were valued in good faith and pursuant to guidelines established by the Board of Trustees. |
| |
(e) Securities with an aggregate market value of $18,426 have been segregated with the custodian to cover margin requirements for the following open futures contracts on June 30, 2006: |
| | | | | | | | | | |
| Description | | Type | | Expiration
Month | | # of
Contracts | | Unrealized
Appreciation/
(Depreciation) | |
90-Day Eurodollar December Futures | | Long | | 12/2006 | | 5 | | $ | (3 | ) |
90-Day Eurodollar December Futures | | Long | | 12/2007 | | 1 | | | (1 | ) |
90-Day Eurodollar March Futures | | Short | | 03/2008 | | 41 | | | 51 | |
E-mini S&P 500 Index September Futures | | Short | | 09/2006 | | 18 | | | (29 | ) |
S&P 500 Index September Futures | | Short | | 09/2006 | | 251 | | | 197 | |
U.S. Treasury 2-Year Note September Futures | | Long | | 09/2006 | | 2 | | | (1 | ) |
U.S. Treasury 30-Year Bond September Futures | | Long | | 09/2006 | | 90 | | | 19 | |
| | | | | | | | |
|
|
|
| | | | | | | | | $ | 233 | |
| | | | | | | | |
|
|
|
| | | | | | | | | | | | | | | |
(f) Swap agreements outstanding on June 30, 2006: | |
| Interest Rate Swaps | | | | | | | | | | | | | | | |
| Counterparty | | Floating Rate Index | | Pay/Receive
Floating Rate | | Fixed Rate | | Expiration
Date | | Notional
Amount | | Unrealized
Appreciation/
(Depreciation) | |
BNP Paribas Bank | | 5-year French CPI Ex Tobacco Daily Reference Index | | Pay | | 2.09% | | 10/15/10 | | EUR | 1000 | | $ | (3 | ) |
Goldman Sachs & Co. | | 6-month JPY-LIBOR | | Receive | | 2.00% | | 06/15/12 | | JPY | 62000 | | | (2 | ) |
Morgan Stanley Dean Witter & Co. | | 6-month JPY-LIBOR | | Receive | | 2.00% | | 06/15/12 | | | 260000 | | | 10 | |
Goldman Sachs & Co. | | 3-month USD-LIBOR | | Receive | | 5.00% | | 12/20/11 | | $ | 1700 | | | 15 | |
Lehman Brothers, Inc. | | 3-month USD-LIBOR | | Receive | | 5.00% | | 12/20/13 | | | 2000 | | | 23 | |
| | | | | | | | | | | | | |
|
|
|
| | | | | | | | | | | | | | $ | 43 | |
| | | | | | | | | | | | | |
|
|
|
| | |
| |
| | | June 30, 2006 (Unaudited) |
| | | | | | | | | | | | | | |
| Credit Default Swaps | | | | | | | | | | | | | | |
| Counterparty | | Reference Entity | | Buy/Sell
Protection+ | | (Pay)/Receive
Fixed Rate | | Expiration
Date | | Notional
Amount | | Unrealized
Appreciation |
HSBC Bank USA | | Ford Motor Credit Co. 7.000% due 10/01/2013 | | Sell | | 2.77% | | 06/20/07 | | $ | 500 | | $ | 1 |
J.P. Morgan Chase & Co. | | Russia Government International Bond, 5.000% until 03/31/2007 and 7.500% thereafter, due 03/31/2030 | | Sell | | 0.77% | | 05/20/07 | | | 200 | | | 1 |
J.P. Morgan Chase & Co. | | Ford Motor Credit Co. 7.000% due 10/01/2013 | | Sell | | 4.60% | | 06/20/07 | | | 500 | | | 10 |
Lehman Brothers, Inc. | | Russia Government International Bond, 5.000% until 03/31/2007 and 7.500% thereafter, due 03/31/2030 | | Sell | | 0.61% | | 03/20/07 | | | 3000 | | | 10 |
Lehman Brothers, Inc. | | Russia Government International Bond, 5.000% until 03/31/2007 and 7.500% thereafter, due 03/31/2030 | | Sell | | 0.87% | | 04/20/07 | | | 600 | | | 3 |
| | | | | | | | | | | | | |
|
|
| | | | | | | | | | | | | | $ | 25 |
| | | | | | | | | | | | | |
|
|
|
| + If the Portfolio is a seller of protection and a credit event occurs, as defined under the terms of that particular swap agreement, the Portfolio will Pay to the buyer of the protection an Amount up to the Notional value of the swap and in certain instances, take delivery of the security. as a buyer of protection, the Portfolio will generally Receive from the seller of protection an amount up to the notional amount of the swap if a credit event occurs. |
| | | | | | | | | | | |
| | | | | |
| Total Return Swaps | | | | | | | | | | | |
| Counterparty | | Receive Total Return | | Pay | | Expiration
Date | | # of
Contracts | | Unrealized
Appreciation |
Credit Suisse First Boston | | S&P 500 Index | | 1-month USD-LIBOR plus 0.030% | | 05/15/2007 | | 3,581 | | $ | 66 |
| | | | | | | | | | |
|
|
| | | | | | | | | | | | | | | | | | |
(g) Written options outstanding on June 30, 2006: | | | | | | | | | | |
| Options on Exchange-Traded Futures Contracts | | | | | | | | | | |
| Description | | | | | | Exercise
Price | | Expiration
Date | | # of
Contracts | | Premium | | Value |
Put - CME 90-Day Eurodollar December Futures | | | | | | $95.000 | | 12/18/2006 | | 7 | | $ | 3 | | $ | 11 |
Put - CME 90-Day Eurodollar December Futures | | | | | | 95.250 | | 12/18/2006 | | 602 | | | 398 | | | 1,275 |
Put - CME 90-Day Eurodollar December Futures | | | | | | 95.500 | | 12/18/2006 | | 15 | | | 16 | | | 41 |
Put - CME 90-Day Eurodollar March Futures | | | | | | 94.750 | | 03/19/2007 | | 8 | | | 4 | | | 8 |
Put - CME 90-Day Eurodollar September Futures | | | | | | 95.000 | | 09/18/2006 | | 7 | | | 4 | | | 10 |
| | | | | | | | | | | | | | |
|
| |
|
|
| | | | | | | | | | | | | | | $ | 425 | | $ | 1,345 |
| | | | | | | | | | | | | | |
|
| |
|
|
| | | | | | | | | | | | | | | | | | | |
| Interest Rate Swaptions | | | | | | | | | | | | | |
| Description | | Counterparty | | Pay/Receive
Floating Rate Index | | Floating
Rate | | Exercise
Rate | | Expiration
Date | | Notional
Amount | | Premium | | Value |
Put - OTC 1-Year Interest Rate Swap | | HSBC Bank USA | | 6-month GBP-LIBOR | | Pay | | 4.50% | | 12/20/06 | | GBP | 1,000 | | $ | 5 | | $ | 11 |
Call - OTC 5-Year Interest Rate Swap | | Bear Stearns & Co., Inc. | | 3-month USD-LIBOR | | Receive | | 5.21% | | 10/25/06 | | $ | 3,000 | | | 11 | | | 3 |
Call - OTC 5-Year Interest Rate Swap | | Bear Stearns & Co., Inc. | | 3-month USD-LIBOR | | Receive | | 5.04% | | 03/08/07 | | | 3,000 | | | 29 | | | 6 |
Call - OTC 5-Year Interest Rate Swap | | Citibank N.A. | | 3-month USD-LIBOR | | Receive | | 4.54% | | 10/04/06 | | | 1,600 | | | 19 | | | 0 |
Call - OTC 5-Year Interest Rate Swap | | Citibank N.A. | | 0-month USD-LIBOR | | Receive | | 4.85% | | 12/22/06 | | | 3,000 | | | 39 | | | 1 |
Call - OTC 5-Year Interest Rate Swap | | Goldman Sachs & Co. | | 3-month USD-LIBOR | | Receive | | 5.21% | | 10/25/06 | | | 2,600 | | | 12 | | | 3 |
Call - OTC 5-Year Interest Rate Swap | | Merrill Lynch & Co., Inc. | | 3-month USD-LIBOR | | Receive | | 4.54% | | 10/04/06 | | | 2,000 | | | 24 | | | 0 |
Call - OTC 5-Year Interest Rate Swap | | Royal Bank of Scotland PLC | | 3-month USD-LIBOR | | Receive | | 5.04% | | 03/08/07 | | | 1,000 | | | 11 | | | 2 |
Call - OTC 5-Year Interest Rate Swap | | Royal Bank of Scotland PLC | | 3-month USD-LIBOR | | Receive | | 5.22% | | 04/19/07 | | | 4,000 | | | 32 | | | 18 |
Call - OTC 5-Year Interest Rate Swap | | Wachovia Bank N.A. | | 3-month USD-LIBOR | | Receive | | 5.21% | | 10/25/06 | | | 900 | | | 4 | | | 1 |
| | | | | | | | | | | | |
|
| |
|
|
| | | | | | | | | | | | | | | | $ | 186 | | $ | 45 |
| | | | | | | | | | | | | | | |
|
| |
|
|
| | | | | | | | | | | | | | | | | |
(h) Forward foreign currency contracts outstanding on June 30, 2006: | | | | | |
| Type | | | | Principal Amount
Covered by
Contract | | Settlement
Month | | Unrealized
Appreciation | | Unrealized
(Depreciation) | | | Net Unrealized
Appreciation/
(Depreciation) | |
Buy | | CNY | | 1,818 | | 03/2007 | | $ | 0 | | $ | (1 | ) | | $ | (1 | ) |
Buy | | EUR | | 9,511 | | 07/2006 | | | 170 | | | (9 | ) | | | 161 | |
Sell | | | | 22,558 | | 07/2006 | | | 0 | | | (550 | ) | | | (550 | ) |
Buy | | GBP | | 308 | | 07/2006 | | | 2 | | | 0 | | | | 2 | |
Buy | | JPY | | 253,979 | | 08/2006 | | | 0 | | | (76 | ) | | | (76 | ) |
Buy | | KRW | | 122,504 | | 05/2007 | | | 0 | | | 0 | | | | 0 | |
| | | | | | | | |
|
| |
|
|
| |
|
|
|
| | | | | | | | | $ | 172 | | $ | (636 | ) | | $ | (464 | ) |
| | | | | | | | |
|
| |
|
|
| |
|
|
|
| | | | | | |
| See Accompanying Notes | | Semiannual Report | | June 30, 2006 | | 11 |
Notes to Financial Statements
1. ORGANIZATION
The StocksPLUS® Growth and Income Portfolio (the “Portfolio”) is a series of the PIMCO Variable Insurance Trust (the “Trust”). The Trust is registered under the Investment Company Act of 1940 (the “Act”), as amended, as an open-end investment management company organized as a Delaware business trust on October 3, 1997. The Portfolio offers three classes of shares: Institutional, Administrative and Advisor. Information presented in these financial statements pertains to the Administrative Class of the Portfolio. Certain detailed financial information for the Institutional Class and Advisor Class is provided separately and is available upon request. The Trust is designed to be used as an investment vehicle by Separate Accounts of insurance companies that fund variable annuity contracts and variable life insurance policies and by qualified pension and retirement plans.
2. SIGNIFICANT ACCOUNTING POLICIES
The following is a summary of significant accounting policies consistently followed by the Portfolio in the preparation of its financial statements in conformity with accounting principles generally accepted in the United States of America (“GAAP”). The preparation of financial statements in accordance with GAAP requires management to make estimates and assumptions that affect the reported amounts and disclosures in the financial statements. Actual results could differ from those estimates.
Security Valuation. Portfolio securities are valued as of the close of regular trading (normally 4:00 p.m., Eastern Time) on each day that the New York Stock Exchange (“NYSE”) is open. Portfolio securities and other assets for which market quotes are readily available are stated at market value. Market value is generally determined on the basis of last reported sales prices, or if no sales are reported, based on quotes obtained from a quotation reporting system, established market makers, or pricing services. Fixed-income securities and non-exchange traded derivatives are normally valued on the basis of quotes obtained from brokers and dealers or pricing services. Prices obtained from independent pricing services use information provided by market makers or estimates of market values obtained from yield data relating to investments or securities with similar characteristics. Certain fixed-income securities purchased on a delayed-delivery basis are marked to market daily until settlement at the forward settlement date. Short-term investments having a maturity of 60 days or less are generally valued at amortized cost. Exchange traded options, futures and options on futures are valued at the settlement price determined by the relevant exchange.
Investments initially valued in currencies other than the U.S. dollar are converted to the U.S. dollar using exchange rates obtained from pricing services. As a result, the NAV of the Portfolio’s shares may be affected by changes in the value of currencies in relation to the U.S. dollar. The value of securities traded in markets outside the United States or denominated in currencies other than the U.S. dollar may be affected significantly on a day that the NYSE is closed and an investor is not able to purchase, redeem or exchange shares.
Securities and other assets for which market quotes are not readily available are valued at fair value as determined in good faith by the Board of Trustees or persons acting at their direction. The Board of Trustees has adopted methods for valuing securities and other assets in circumstances where market quotes are not readily available, and has delegated to Pacific Investment Management Company LLC (“PIMCO”) the responsibility for applying the valuation methods. In the event that market quotes are not readily available, and the security or asset cannot be valued pursuant to one of the valuation methods, the value of the security or asset will be determined in good faith by the Valuation Committee of the Board of Trustees, generally based upon recommendations provided by PIMCO.
Market quotes are considered not readily available in circumstances where there is an absence of current or reliable market-based data (e.g., trade information, bid/asked information, broker quotes), including where events occur after the close of the relevant market, but prior to the close of regular trading, that materially affect the values of the Portfolio’s securities or assets. In addition, market quotes are considered not readily available when, due to extraordinary circumstances, the exchanges or markets on which the securities trade do not open for trading for the entire day and no other market prices are available. The Board has delegated to PIMCO the responsibility for monitoring significant events that may materially affect the values of the Portfolio’s securities or assets and for determining whether the value of the applicable securities or assets should be re-evaluated in light of such significant events. When the Portfolio uses fair value pricing to determine its NAV, securities will not be priced on the basis of quotations from the primary market in which they are traded, but rather may be priced by another method that the Board of Trustees or persons acting at their direction believe accurately reflects fair value. The Trust’s policy is intended to result in a calculation of the Portfolio’s NAV that fairly reflects security values as of the time of pricing. However, fair values determined by the Board of Trustees or persons acting at their direction may not accurately reflect the price that the Portfolio could obtain for a security if it were to dispose of that security as of the time of pricing. Because foreign securities can trade on non-business days, the NAV of the Portfolio may change on days when shareholders will not be able to purchase or redeem shares. The prices used by the Portfolio may differ from the value that would be realized if the securities were sold and the differences could be material to the financial statements.
Securities Transactions and Investment Income. Securities transactions are recorded as of the trade date. Securities purchased or sold on a when-issued or delayed-delivery basis may be settled a month or more after the trade date. Realized gains and losses from securities sold are recorded on the identified cost basis. Dividend income is recorded on the ex-dividend date, except certain dividends from foreign securities where the ex-dividend date may have passed, which are recorded as soon as the Portfolio is informed of the ex-dividend date. Interest income, adjusted for the accretion of discounts and amortization of premiums, is recorded on the accrual basis. Paydown gains and losses on mortgage-related or asset-backed securities are recorded as components of interest income in the Statement of Operations.
Dividends and Distributions to Shareholders. Dividends from net investment income, if any, are declared on each day the Portfolio is open for business and are distributed to shareholders quarterly. Net realized capital gains earned by the Portfolio, if any, will be distributed no less frequently than once each year. Most shareholders choose to reinvest their dividends and capital gain distribution in additional shares of the Portfolio.
Income dividends and capital gain distributions are determined in accordance with income tax regulations which may differ from GAAP. Differences between tax regulations and GAAP may change the fiscal year when income and capital items are recognized for tax and GAAP purposes. Examples of events that give rise to timing differences include wash sales, straddles, net operating losses and capital loss carryforwards. Further, the character of investment income and capital gains may be different for certain transactions under the two methods of accounting. Examples of characterization differences include the treatment of mortgage paydowns, swaps, foreign currency transactions and contingent debt instruments. As a result, income dividends and capital gain distributions declared during a fiscal period may differ significantly from the net investment income and realized capital gain reported in the Portfolio’s annual financial statements presented under GAAP.
Distributions classified as a tax basis return of capital, if any, are reflected in the accompanying Statements of Changes in Net Assets and have been reclassified to paid in capital. In addition, other amounts have been reclassified between undistributed net investment income, accumulated undistributed net realized gains
| | | | |
| 12 | | PIMCO Variable Insurance Trust | | |
| | |
| |
| | | June 30, 2006 (Unaudited) |
or losses and/or paid in capital to more appropriately conform financial accounting to tax characterizations of dividend distributions.
Multiclass Operations. Each class offered by the Portfolio has equal rights as to assets and voting privileges (except that shareholders of a class have exclusive voting rights regarding any matter relating solely to that class of shares). Income and non-class specific expenses of the Portfolio are allocated daily to each class of shares based on the relative value of settled shares. Realized and unrealized capital gains and losses of the Portfolio are allocated daily to each class of shares based on the relative net assets of each class. Class specific expenses, where applicable, currently include administrative, distribution and servicing fees.
Federal Income Taxes. The Portfolio intends to qualify as a regulated investment company under sub-chapter M of the Internal Revenue Code and distribute all of its taxable income and net realized gains, if applicable, to shareholders. Accordingly, no provision for Federal income taxes has been made.
Foreign Currency. The accounting records of the Portfolio are maintained in U.S. dollar. The market values of foreign securities, currency holdings and other assets and liabilities are translated into U.S. dollar based on the current exchange rates each business day. Fluctuations in the value of currency holdings and other assets and liabilities resulting from changes in exchange rates are recorded as unrealized foreign currency gains or losses. Realized gains or losses and unrealized appreciation or depreciation on investment securities and income and expenses are translated on the respective dates of such transactions. The effects of changes in foreign currency exchange rates on investments in securities are not segregated in the Statement of Operations from the effects of changes in market prices of those securities, but are included with the net realized and unrealized gain or loss on investment securities.
| | | | | | |
|
Non-U.S. currency symbols utilized throughout the report are defined
as follows: |
| CNY | | Chinese Yuan Renminbi | | JPY | | Japanese Yen |
| EUR | | Euro | | KRW | | South Korean Won |
| GBP | | British Pound | | | | |
Forward Currency Transactions. The Portfolio may enter into forward currency contracts in connection with settling planned purchases or sales of securities, to hedge the currency exposure associated with some or all of the Portfolio’s securities or as a part of an investment strategy. A forward currency contract is an agreement between two parties to buy and sell a currency at a set price on a future date. The market value of a forward currency contract fluctuates with changes in forward currency exchange rates. Forward currency contracts are marked to market daily and the change in value is recorded by the Portfolio as an unrealized gain or loss. Realized gains or losses equal to the difference between the value of the contract at the time it was opened and the value at the time it was closed are recorded upon delivery or receipt of the currency or, if a forward currency contract is offset by entering into another forward currency contract with the same broker, upon settlement of the net gain or loss. These contracts may involve market risk in excess of the unrealized gain or loss reflected in the Portfolio’s Statement of Assets and Liabilities. In addition, the Portfolio could be exposed to risk if the counterparties are unable to meet the terms of the contracts or if the value of the currency changes unfavorably to the U.S. dollar.
Futures Contracts. The Portfolio is authorized to enter into futures contracts. The Portfolio may use futures contracts to manage its exposure to the securities markets or to movements in interest rates and currency values. The primary risks associated with the use of futures contracts are the imperfect correlation between the change in market value of the securities held by the Portfolio and the prices of futures contracts, the possibility of an illiquid market, and the inability of the counterparty to meet the terms of the contract. Futures contracts are valued based upon their quoted daily settlement prices. Upon entering into a futures contract, the Portfolio is required to deposit with its custodian, in a segregated account in the name of the futures broker, an amount of cash or U.S. Government and Agency Obligations in accordance with the initial margin requirements of the broker or exchange. Futures contracts are marked to market daily and an appropriate payable or receivable for the change in value (“variation margin”) is recorded by the Portfolio. Gains or losses are recognized but not considered realized until the contracts expire or are closed. Futures contracts involve, to varying degrees, risk of loss in excess of the variation margin disclosed in the Statement of Assets and Liabilities.
Inflation-Indexed Bonds. The Portfolio may invest in inflation-indexed bonds. Inflation-indexed bonds are fixed-income securities whose principal value is periodically adjusted to the rate of inflation. The interest rate on these bonds is generally fixed at issuance at a rate lower than typical bonds. Over the life of an inflation-indexed bond, however, interest will be paid based on a principal value, which is adjusted for inflation. Any increase in the principal amount of an inflation-indexed bond will be included as interest income in the Statement of Operations, even though investors do not receive their principal until maturity.
Loan Participant and Assignments. The Portfolio may invest in direct debt instruments which are interests in amounts owned by corporate, governmental, or other borrowers to lenders or lending syndicates. The Portfolio’s investments in loans may be in the form of participations in loans or assignments of all or a portion of loans from third parties. A loan is often administered by a bank or other financial institution (the “lender”) that acts as agent for all holders. Then agent administers the terms of the loan, as specified in the loan agreement. When investing in a loan participation, the Portfolio has the right to receive payments of principal, interest and any fees to which it is entitled only from the lender selling the loan agreement and only upon receipt by the lender of payments from the borrower. The Portfolio generally has no right to enforce compliance with the terms of the loan agreement with the borrower. As a result, the Portfolio may be subject to the credit of both the borrower and the lender that is selling the loan agreement. When the Portfolio purchases assignments from lenders it acquires direct rights against the borrower on the loan. At the end of the period, the Portfolio had no unfunded loan commitments.
Options Contracts. The Portfolio may write call and put options on futures, swaps, securities or currencies it owns or in which it may invest. Writing put options tends to increase the Portfolio’s exposure to the underlying instrument. Writing call options tends to decrease the Portfolio’s exposure to the underlying instrument. When the Portfolio writes a call or put option, an amount equal to the premium received is recorded as a liability and subsequently marked to market to reflect the current value of the option written. These liabilities are reflected as written options outstanding in the Statement of Assets and Liabilities. Certain options may be written with premiums to determined on a future date. The premiums for these options are based upon implied volatility parameters at specified terms. Premiums received from writing options which expire are treated as realized gains. Premiums received from writing options which are exercised or closed are added to the proceeds or offset against amounts paid on the underlying future, swap, security or currency transaction to determine the realized gain or loss. The Portfolio as a writer of an option has no control over whether the underlying future, swap, security or currency may be sold (call) or purchased (put) and as a result bears the market risk of an unfavorable change in the price of the future, swap, security or currency underlying the written option. There is the risk the Portfolio may not be able to enter into a closing transaction because of an illiquid market.
The Portfolio may also purchase put and call options. Purchasing call options tends to increase the Portfolio’s exposure to the underlying instrument. Purchasing put
| | | | | | |
| | | Semiannual Report | | June 30, 2006 | | 13 |
Notes to Financial Statements (Cont.)
options tends to decrease the Portfolio’s exposure to the underlying instrument. The Portfolio pays a premium which is included in the Portfolio’s Statement of Assets and Liabilities as an investment and subsequently marked to market to reflect the current value of the option. Premiums paid for purchasing options which expire are treated as realized losses. Certain options may be purchased with premiums to be determined on a future date. The premiums for these options are based upon implied volatility parameters at specified terms. The risk associated with purchasing put and call options is limited to the premium paid. Premiums paid for purchasing options which are exercised or closed are added to the amounts paid or offset against the proceeds on the underlying future, swap, security or currency transaction to determine the realized gain or loss.
Repurchase Agreements. The Portfolio may engage in repurchase transactions. Under the terms of a typical repurchase agreement, the Portfolio takes possession of an underlying debt obligation subject to an obligation of the seller to repurchase, and the Portfolio to resell, the obligation at an agreed-upon price and time. The market value of the collateral must be equal to or exceed at all times the total amount of the repurchase obligations, including interest. Securities purchased under repurchase agreements are reflected as an asset in the Statement of Assets and Liabilities. Generally, in the event of counterparty default, the Portfolio has the right to use the collateral to offset losses incurred. If the counterparty should default, the Portfolio will seek to sell the securities which it holds as collateral. This could involve procedural costs or delays in addition to a loss on the securities if their value should fall below their repurchase price.
Mortgage-Related and Other Asset-Backed Securities. The Portfolio may invest in mortgage-related or other asset-backed securities. These securities include mortgage pass-through securities, collateralized mortgage obligations (“CMOs”), commercial mortgage-backed securities, mortgage dollar rolls, CMO residuals, stripped mortgage-backed securities (“SMBSs”) and other securities that directly or indirectly represent a participation in, or are secured by and payable from, mortgage loans on real property. The value of some mortgage- or asset-backed securities may be particularly sensitive to changes in prevailing interest rates. Early repayment of principal on some mortgage-related securities may expose a Portfolio to a lower rate of return upon reinvestment of principal. The value of these securities may fluctuate in response to the market’s perception of the creditworthiness of the issuers. Additionally, although mortgages and mortgage-related securities are generally supported by some form of government or private guarantee and/or insurance, there is no assurance that private guarantors or insurers will meet their obligations.
One type of SMBS has one class receiving all of the interest from the mortgage assets (the interest-only, or “IO” class), while the other class will receive all of the principal (the principal-only, or “PO” class). Payments received for IOs are included in interest income in the Statement of Operations. Because principal will not be received at the maturity of an IO, adjustments are made to the book value of the security on a daily basis until maturity. These adjustments are included in interest income in the Statement of Operations. Payments received for POs are treated as reductions to the cost and par value of the securities.
Swap Agreements. The Portfolio may engage in swap transactions, including, but not limited to, swap agreements on interest rate, total return, forward spread-lock and credit default to manage its exposure to interest rates and credit risk. In connection with these agreements, securities may be identified as collateral in accordance with the terms of the respective swap agreements.
Interest rate swap agreements involve the exchange by the Portfolio with another party of their respective commitments to pay or receive interest, e.g., an exchange of floating rate payments for fixed rate payments with respect to the notional amount of principal.
Total return swap agreements involve commitments to pay interest in exchange for a market-linked return, both based on notional amounts. To the extent the total return of the security or index underlying the transaction exceeds or falls short of the offsetting interest rate obligation, the Portfolio will receive a payment from or make a payment to the counterparty.
Forward spread-lock swap agreements involve commitments to pay or receive a settlement amount calculated as the difference between the swap spread and a fixed spread, multiplied by the notional amount times the duration of the swap. The swap spread is the difference between the benchmark swap rate (market rate) and the specific Treasury rate.
Credit default swap agreements involve one party making a stream of payments to another party in exchange for the right to receive a specified return in the event of a default by a third party, typically corporate issues or sovereign issues of an emerging country, on its obligation. The Portfolio may use credit default swaps to provide a measure of protection against defaults of the issuers (i.e., to reduce risk where the Portfolio owns or has exposure to the sovereign issuer) or to take an active long or short position with respect to the likelihood of a particular issuer’s default. As a seller of protection, the Portfolio generally receives an upfront payment or a fixed rate of income throughout the term of the swap provided that there is no credit event. If the Portfolio is a seller of protection and a credit event occurs, as defined under the terms of that particular swap agreement, the Portfolio will pay to the buyer of the protection an amount up to the notional value of the swap and in certain instances take delivery of the security. As the seller, the Portfolio would effectively add leverage to its portfolio because, in addition to its total net assets, the Portfolio would be subject to investment exposure on the notional amount of the swap. As a buyer of protection, the Portfolio generally receives an amount up to the notional value of the swap if a credit event occurs. The treatment of a credit default swaps and other swap agreements that provide for contingent, non-periodic, bullet-type payments as “notional principal contracts” for federal income tax purposes is uncertain. Were the Internal Revenue Service in take the position that a credit default swap or other bullet -type swap is not a “notional principal contract” for federal income tax purposes, payments received by the Portfolio from such investments might be subject to income taxes.
Swaps are marked to market daily based upon quotations from market makers and the change in value, if any, is recorded as unrealized gain or loss in the Statement of Operations. Payments received or made at the beginning of the measurement period are reflected as such in the Statement of Assets and Liabilities. These upfront payments are recorded as realized gain or loss in the Statement of Operations upon termination or maturity of the swap. A liquidation payment received or made at the termination of the swap is recorded as realized gain or loss in the Statement of Operations. Net periodic payments received or paid by the Portfolio are included as part of realized gain or loss in the Statement of Operations. Entering into these agreements involves, to varying degrees, elements of credit, market and documentation risk in excess of the amounts recognized in the Statement of Assets and Liabilities. Such risks involve the possibility that there will be no liquid market for these agreements, that the counterparty to the agreements may default on its obligation to perform or disagree as to the meaning of contractual terms in the agreements and that there may be unfavorable changes in interest rates.
U.S. Government Agencies or Government-Sponsored Enterprises. Securities issued by U.S. Government agencies or government-sponsored enterprises may not be guaranteed by the U.S. Treasury. The Government National Mortgage Association (“GNMA”), a wholly owned U.S. Government corporation, is authorized to guarantee, with the full faith and credit of the U.S. Government, the timely payment of principal and interest on securities issued by institutions approved by GNMA and backed by pools of mortgages insured by the Federal Housing Administration or guaranteed by the Department of Veterans Affairs.
| | | | |
| 14 | | PIMCO Variable Insurance Trust | | |
| | |
| |
| | | June 30, 2006 (Unaudited) |
Government-related guarantors (i.e., not backed by the full faith and credit of the U.S. Government) include the Federal National Mortgage Association (“FNMA” or “Fannie Mae”) and the Federal Home Loan Mortgage Corporation (“FHLMC” or “Freddie Mac”). Pass-through securities issued by FNMA are guaranteed as to timely payment of principal and interest by FNMA but are not backed by the full faith and credit of the U.S. Government. FHLMC guarantees the timely payment of interest and ultimate collection of principal, but its participation certificates are not backed by the full faith and credit of the U.S. Government.
Guarantees and Indemnifications. Under the Trust’s organizational documents, each Trustee, officer, employee or other agent of the Trust (including the Trust’s investment manager) is indemnified against certain liabilities that may arise out of performance of their duties to the Portfolio. Additionally, in the normal course of business, the Portfolio enters into contracts that contain a variety of indemnification clauses. The Portfolio’s maximum exposure under these arrangements is unknown as this would involve future claims that may be made against the Portfolio that have not yet occurred. However, the Portfolio has not had prior claims or losses pursuant to these contracts, and believes the risk of loss to be remote.
New Accounting Policies. In July 2006, the Financial Accounting Standards Board issued Interpretation No. 48, “Accounting for Uncertainty in Income Taxes—an Interpretation of FASB Statement No. 109” (the “Interpretation”). The Interpretation is effective for fiscal years beginning after December 15, 2006. Management is currently evaluating the application of the Interpretation to the Portfolio and will provide additional information in relation to the Interpretation in the Portfolio’s annual financial statements for the year ending December 31, 2006.
3. FEES, EXPENSES, AND RELATED PARTY TRANSACTIONS
Investment Advisory Fee. PIMCO is a majority-owned subsidiary of Allianz Global Investors of America L.P. (“AGI”), and serves as investment adviser (the “Adviser”) to the Trust, pursuant to an investment advisory contract. The Adviser receives a monthly fee at an annual rate based on average daily net assets of the Portfolio. The Advisory Fee is charged at an annual rate of 0.35%.
Administration Fee. PIMCO serves as administrator (the “Administrator”), and provides administrative services to the Trust for which it receives a monthly administrative fee based on average daily net assets of the Portfolio. As the Administrator, PIMCO bears the costs of various third-party services, including audit, custodial, portfolio accounting, legal, transfer agency and printing costs. The Administration Fee is charged at the annual rate of 0.10%.
Distribution and Servicing Fees. Allianz Global Investors Distributors LLC (“AGID”) is an indirect wholly-owned subsidiary of AGI and serves as the distributor of the Trust’s shares. The Trust is permitted to reimburse AGID on a quarterly basis, out of the Administrative Class assets of the Portfolio in the amount of 0.15% on an annual basis of the average daily net assets of that class, for payments made to financial intermediaries that provide services in connection with the distribution of shares or administration of plans or programs that use Portfolio shares as their funding medium. The effective rate paid to AGID was 0.15% during the current fiscal year.
Expenses. The Trust is responsible for the following expenses: (i) salaries and other compensation of any of the Trust’s executive officers and employees who are not officers, directors, stockholders or employees of PIMCO or its subsidiaries or affiliates; (ii) taxes and governmental fees; (iii) brokerage fees and commissions and other portfolio transaction expenses; (iv) the costs of borrowing money, including interest expenses and bank overdraft charges; (v) fees and expenses of the Trustees who are not “interested persons” of PIMCO or the Trust, and any counsel retained exclusively for their benefit; (vi) extraordinary expenses, including costs of litigation and indemnification expenses; (vii) organization expenses and (viii) any expenses allocated or allocable to a specific class of shares, which include service fees payable with respect to the Administrative Class shares and may include certain other expenses as permitted by the Trust’s Multiple Class Plan adopted pursuant to Rule 18f-3 under the Act and subject to review and approval by the Trustees. The ratio of expenses to average net assets per share class, as disclosed in the Financial Highlights, may differ from the annual portfolio operating expenses per share class as disclosed in the Prospectus for the reasons set forth above.
For the current period ended June 30, 2006, each unaffiliated Trustee received an annual retainer of $15,000, plus $2,000 for each Board of Trustees quarterly meeting attended, $500 for each Board of Trustees committee meeting attended and $500 for each special board meeting attended, plus reimbursement of related expenses. In addition, each Committee Chair received an additional annual retainer of $500 and each Audit Committee Chair received an additional annual retainer of $1,500. These expenses are allocated on a pro-rata basis to each Portfolio of the Trust according to its respective net assets. The Trust pays no compensation directly to any Trustee or any other officer who is affiliated with the Administrator, all of whom receive remuneration for their services to the Trust from the Administrator or its affiliates.
4. PURCHASES AND SALES OF SECURITIES
The length of time the Portfolio has held a particular security is not generally a consideration in investment decisions. A change in the securities held by the Portfolio is known as “portfolio turnover”. The Portfolio may engage in frequent and active trading of portfolio securities to achieve its investment objective, particularly during periods of volatile market movements. High portfolio turnover (e.g., over 100%) involves correspondingly greater expenses to the Portfolio, including brokerage commissions or dealer mark-ups and other transaction costs on the sale of securities and reinvestments in other securities. Such sales may also result in realization of taxable capital gains, including short-term capital gains (which are generally taxed at ordinary income tax rates). The trading costs and tax effects associated with portfolio turnover may adversely affect the Portfolio’s performance.
Purchases and sales of securities (excluding short-term investments) for the period ended June 30, 2006 were as follows (amounts in thousands):
| | | | | | | | | | | | | | | | |
| | U.S Government/Agency | | | | | All Other |
| | Purchases | | | | | Sales | | | | | Purchases | | | | | Sales |
| $ | 39,083 | | | | $ | 61,058 | | | | $ | 20,963 | | | | $ | 62,446 |
5. SECURITY TRANSACTIONS WITH AFFILIATED PORTFOLIO
The Portfolio is permitted to purchase or sell securities from or to certain related affiliated portfolios under specified conditions outlined in procedures adopted by the Board of Trustees of the Trust. The procedures have been designed to ensure that any purchase or sale of securities by the Portfolio from or to another portfolio that are, or could be, considered an affiliate by virtue of having a common investment advisor (or affiliated investment advisors), common Trustees and/or common officers complies with Rule 17a-7 of the Act. Further, as defined under the procedures, each transaction is effected at the current market price. During the period ended June 30, 2006, the Portfolio below engaged in purchases and sales of securities pursuant to the Rule 17a-7 of the Act (amounts in thousands):
| | | | |
| Purchases | | | | Sales |
$ 70,214 | | | | $ 0 |
| | | | | | |
| | | Semiannual Report | | June 30, 2006 | | 15 |
Notes to Financial Statements (Cont.)
6. TRANSACTIONS IN WRITTEN CALL AND PUT OPTIONS
Transactions in written call and put options were as follows (amounts in thousands, except number of contracts):
| | | | | | | | | | | | | | | | | | | | | | | |
| | | | | # of
Contracts |
| | | |
| Notional
Amount
in $ |
| | | |
| Notional
Amount
in GBP |
| | | | | Premium | |
Balance at 12/31/2005 | | | | 314 | | | | | $ | 25,900 | | | | | GBP | 1,300 | | | | | $ | 490 | |
Sales | | | | 967 | | | | | | 15,800 | | | | | | 0 | | | | | | 623 | |
Closing Buys | | | | (15 | ) | | | | | (18,500 | ) | | | | | 0 | | | | | | (210 | ) |
Expirations | | | | (627 | ) | | | | | (2,100 | ) | | | | | (300 | ) | | | | | (292 | ) |
Exercised | | | | 0 | | | | | | 0 | | | | | | 0 | | | | | | 0 | |
Balance at 06/30/2006 | | | | 639 | | | | | $ | 22,100 | | | | | GBP | 1,000 | | | | | $ | 611 | |
7. SHARES OF BENEFICIAL INTEREST
The Portfolio may issue an unlimited number of shares of beneficial interest with a $0.001 par value. Changes in shares of beneficial interest were as follows (shares and amounts in thousands):
| | | | | | | | | | | | | | | | | | |
| | | | | Six Months Ended 06/30/2006 | | | | | Year Ended 12/31/2005 | |
| | | | | Shares | | | Amount | | | | | Shares | | | Amount | |
| | | | | | |
Receipts for shares sold | | | | | | | | | | | | | | | | | | |
Institutional Class | | | | 114 | | | $ | 1,207 | | | | | 318 | | | $ | 3,215 | |
Administrative Class | | | | 168 | | | | 1,775 | | | | | 414 | | | | 4,123 | |
Issued as reinvestment of distributions | | | | | | | | | | | | | | | | | | |
Institutional Class | | | | 11 | | | | 111 | | | | | 13 | | | | 127 | |
Administrative Class | | | | 199 | | | | 2,039 | | | | | 543 | | | | 5,480 | |
Cost of shares redeemed | | | | | | | | | | | | | | | | | | |
Institutional Class | | | | (84 | ) | | | (883 | ) | | | | (124 | ) | | | (1,264 | ) |
Administrative Class | | | | (15,001 | ) | | | (160,111 | ) | | | | (4,939 | ) | | | (49,470 | ) |
Net decrease resulting from Portfolio share transactions | | | | (14,593 | ) | | $ | (155,862 | ) | | | | (3,775 | ) | | $ | (37,789 | ) |
The following schedule shows the number of shareholders each owning 5% or more of the Portfolio and the total percentage of the Portfolio held by such shareholders:
| | | | | | | |
| | | | | Number of
Shareholders | | % of Portfolio Held | |
Institutional Class | | | | 3 | | 100 | |
Administrative Class | | | | 4 | | 85 | * |
* Allianz Life Insurance Co. of North America, an indirect wholly subsidiary of AGI and a related party to the Portfolio, owned 25% or more of the outstanding shares of beneficial interest of the Portfolio, and therefore may be presumed to “control” the Portfolio, as that term is defined in the 1940 Act.
8. FEDERAL INCOME TAX MATTERS
As of June 30, 2006, the aggregate cost of investments was the same for federal income tax and financial statement purposes. The net unrealized appreciation (depreciation) of investment securities for federal income tax purposes is as follows (amounts in thousands):
| | | | |
Aggregate
Gross
Unrealized
Appreciation | | Aggregate
Gross
Unrealized
(Depreciation) | | Net
Unrealized
(Depreciation) |
$ 851 | | $ (3,176) | | $ (525) |
9. REGULATORY AND LITIGATION MATTERS
On June 1, 2004, the Attorney General of the State of New Jersey announced that it had dismissed PIMCO from a complaint filed by the New Jersey Attorney General on February 17, 2004, and that it had entered into a settlement agreement (the “New Jersey Settlement”) with Allianz Global Investors of America L.P. (“AGI”) (formerly known as Allianz Dresdner Asset Management of America L.P.), PEA Capital LLC (an entity affiliated with PIMCO through common ownership) (“PEA”) and Allianz Global Investors Distributors LLC (“AGID”), in connection with the same matter. In the New Jersey Settlement, AGI, PEA and AGID neither admitted nor denied the allegations or conclusions of law, but did agree to pay New Jersey a civil fine of $15 million and $3 million for investigative costs and further potential enforcement initiatives against unrelated parties. They also undertook to implement certain governance changes. The complaint relating to the New Jersey Settlement alleged, among other things, that AGI, PEA and AGID had failed to disclose that they improperly allowed certain hedge funds to engage in “market timing” in certain funds. The complaint sought injunctive relief, civil monetary penalties, restitution and disgorgement of profits.
Since February 2004, PIMCO, AGI, PEA, AGID, and certain of their affiliates, including the PIMCO Funds, the Allianz Funds (formerly known as PIMCO Funds: Multi-Manager Series), and the Trustees and employees of the PIMCO Funds, have been named as defendants in fifteen lawsuits filed in various jurisdictions. Eleven of those lawsuits concern “market timing,” and they have been transferred to and consolidated for pre-trial proceedings in a multi-district litigation proceeding in the U.S. District Court for the District of Maryland; the other four lawsuits concern “revenue sharing” and have been consolidated into a single action in the U.S. District Court for the District of Connecticut. The lawsuits have been commenced as putative class actions on behalf of investors who purchased, held or redeemed shares of the various series of the PIMCO Funds and the Allianz Funds during specified periods, or as derivative actions on behalf of the PIMCO Funds and Allianz Funds.
The market timing actions in the District of Maryland generally allege that certain hedge funds were allowed to engage in “market timing” in certain of the PIMCO Funds and the Allianz Funds and this alleged activity was not disclosed. Pursuant to tolling agreements entered into with the derivative and class action plaintiffs, PIMCO, the Trustees, and certain employees of PIMCO who were previously named as defendants have all been dropped as defendants in the market timing actions; the plaintiffs continue to assert claims on behalf of the shareholders of the PIMCO Funds or on behalf of the PIMCO Funds themselves against other defendants. By order dated November 3, 2005, the U.S. District Court for the District of Maryland granted the PIMCO Funds’ motion to dismiss claims asserted against it in a consolidated amended complaint where the PIMCO Funds were named, in the complaint, as a nominal defendant. The revenue sharing action in the District of Connecticut generally alleges that fund assets were inappropriately used to pay brokers to promote PIMCO Funds and the Allianz Funds, including directing fund brokerage transactions to such brokers, and that such alleged arrangements were not fully disclosed to shareholders. On August 11, 2005 the U.S. District Court for the District of Connecticut conducted a hearing on defendants’ motion to dismiss the consolidated amended complaint in the revenue sharing action but has not yet ruled on the motion to dismiss. The market timing and revenue sharing lawsuits seek, among other things, unspecified compensatory damages plus interest and, in some cases, punitive damages, the rescission of investment advisory contracts, the return of fees paid under those contracts and restitution.
Under Section 9(a) of the Investment Company Act of 1940, as amended (“1940 Act”), if the New Jersey Settlement or any of the lawsuits described above were to result in a court injunction against AGI, PEA, AGID and/or their affiliates, PIMCO could, in the absence of exemptive relief granted by the SEC, be barred from serving as an investment adviser, and AGID could be barred from serving as principal underwriter, to any registered investment company, including the
| | | | |
| 16 | | PIMCO Variable Insurance Trust | | |
| | |
| |
| | | June 30, 2006 (Unaudited) |
Portfolios of the Trust. In connection with an inquiry from the SEC concerning the status of the New Jersey Settlement under Section 9(a), PEA, AGID, AGI and certain of their affiliates (including PIMCO) (together, the “Applicants”) have sought exemptive relief from the SEC under Section 9(c) of the 1940 Act. The SEC has granted the Applicants a temporary exemption from the provisions of Section 9(a) with respect to the New Jersey Settlement until the earlier of (i) September 13, 2006 and (ii) the date on which the SEC takes final action on their application for a permanent order. There is no assurance that the SEC will issue a permanent order.
Two nearly identical class action civil complaints have been filed in August 2005, in the Northern District of Illinois Eastern Division alleging that the plaintiffs each purchased and sold a 10-year Treasury note futures contract and suffered damages from an alleged shortage when PIMCO held both physical and futures positions in 10-year Treasury notes for its client accounts. The two actions have been consolidated into one action, and the two separate complaints have been replaced by a consolidated complaint. PIMCO is a named defendant, and the PIMCO Funds have been added as a defendant, to the consolidated action. PIMCO strongly believes the complaint (and any consolidated complaint filed hereafter) is without merit and intends to vigorously defend itself.
Certain Portfolios of the Trust were recently served in an adversary proceeding brought by the Official Committee of Asbestos Claimants of G-I Holdings, Inc. in G-I Holdings, Inc.’s bankruptcy in the District of New Jersey. PIMCO was previously named in this lawsuit and remains a defendant. The plaintiff seeks to recover for the bankruptcy estate assets that were transferred by the predecessor entity of G-I Holdings, Inc. to a wholly-owned subsidiary in 1994. The subsidiary has since issued notes, of which certain Portfolios of the Trust are alleged to be holders. The complaint alleges that in 2000, more than two hundred noteholders—including certain Portfolios of the Trust—were granted a second priority lien on the assets of the subsidiary in exchange for their consent to a refinancing transaction and the granting of a first priority lien to the lending banks. The plaintiff is seeking invalidation of the lien in favor of the noteholders and/or the value of the lien.
It is possible that these matters and/or other developments resulting from these matters could result in increased fund redemptions or other adverse consequences to the Portfolios. However, PIMCO and AGID believe that these matters are not likely to have a material adverse effect on the Portfolios or on PIMCO’s or AGID’s ability to perform their respective investment advisory or distribution services relating to the Portfolios.
| | | | | | |
| | | Semiannual Report | | June 30, 2006 | | 17 |
Investment Adviser and Administrator
Pacific Investment Management Company LLC
840 Newport Center Drive
Newport Beach, California 92660
Distributor
Allianz Global Investors Distributors LLC
2187 Atlantic Street
Stamford, Connecticut 06902
Custodian
State Street Bank & Trust Company
801 Pennsylvania
Kansas City, Missouri 64105
Transfer Agent
Boston Financial Data Services–Midwest
330 W. 9th Street
Kansas City, Missouri 64105
Legal Counsel
Dechert LLP
1775 I Street, N.W.
Washington, D.C. 20006
Independent Registered Public Accounting Firm
PricewaterhouseCoopers LLP
1055 Broadway
Kansas City, Missouri 64105
P I M C O

Share Class Institutional
Semiannual Report June 30, 2006
PIMCO Variable Insurance Trust
StocksPLUS® Growth and Income Portfolio
Table of Contents
This material is authorized for use only when preceded or accompanied by the current PIMCO Variable Insurance Trust (the “Trust”) prospectus. Investors should consider the investment objectives, risks, charges and expenses of this Trust carefully before investing. Ask your financial professional to explain all charges that may apply. This and other information is contained in the Trust’s prospectus. The variable product prospectus may be obtained by contacting your Investment Consultant. Please read the Trust and variable product prospectus carefully before you invest or send money.
Chairman’s Letter
Dear PIMCO Variable Insurance Trust Shareholder:
It is our pleasure to present to you the semiannual report for the PIMCO Variable Insurance Trust covering the six-month period ended June 30, 2006.
Highlights of the global bond markets during the six-month period included:
| | n | | Most fixed-income sectors lost ground during the first half of 2006, as concern about accelerating inflation and central bank tightening pushed interest rates higher worldwide. The benchmark Lehman Brothers Aggregate Bond Index (which includes Treasury, Investment-Grade Corporate, and Residential Mortgage-Backed Securities) returned -0.72% for the first six months of the year. On June 30, the benchmark ten-year Treasury yielded 5.14%, 0.75% higher than at the start of the year. The U.S. yield curve remained flat as shorter-maturity yields rose by a comparable amount. |
| | n | | The Federal Reserve tightened four times during the reporting period, bringing the Federal Funds Rate to 5.25%. The increase near the end of the period was the Federal Reserve’s 17th consecutive rate hike since the start of its tightening cycle in 2004. The Federal Reserve was not alone, as central banks in Europe, India, and China tightened credit in unison for the first time since 2000. The Bank of Japan, whose zero-interest-rate policy has flooded global markets with liquidity, looked set to reverse this policy in the coming months. |
In these pages please find a more complete Portfolio review as it relates to financial-market activities, as well as details about total-return investment performance for the six-month reporting period. Thank you for the trust you have placed in us. We will continue to work diligently to meet your investment needs.
Sincerely,
Brent R. Harris
Chairman, PIMCO Variable Insurance Trust
July 31, 2006
| | | | | | |
| | | Semiannual Report | | June 30, 2006 | | 1 |
Important Information About the Portfolio
PIMCO Variable Insurance Trust (the “Trust”) is an open-end management investment company currently consisting of nineteen separate investment portfolios, including the StocksPLUS® Growth and Income Portfolio (the “Portfolio”). The Portfolio is only available as a funding vehicle under variable life insurance policies or variable annuity contracts issued by insurance companies (“Variable Contracts”). Individuals may not purchase shares of the Portfolio directly. Shares of the Portfolio also may be sold to qualified pension and retirement plans outside of the separate account context.
We believe that bond funds have an important role to play in a well diversified investment portfolio. It is important to note, however, that in an environment where interest rates may trend upward, rising rates would negatively impact the performance of most bond funds, and fixed-income securities held by a fund are likely to decrease in value. The price volatility of fixed-income securities can also increase during periods of rising interest rates resulting in increased losses to a fund. Bond funds and individual bonds with a longer duration (a measure of the expected life of a security) tend to be more sensitive to changes in interest rates, usually making them more volatile than securities or funds with shorter durations. The longer-term performance of most bond funds has benefited from capital gains in part resulting from an extended period of declining interest rates. In the event interest rates increase, these capital gains should not be expected to recur.
The Portfolio may be subject to various risks in addition to those described above. Some of these risks may include, but are not limited to, the following: credit risk, high yield risk, market risk, issuer risk, liquidity risk, derivatives risk, equity risk, mortgage risk, non-U.S. investment risk, currency risk, leveraging risk and management risk. A complete description of these risks is contained in the Portfolio’s prospectus. The Portfolio may use derivative instruments for hedging purposes or as part of an investment strategy. Use of these instruments may involve certain costs and risks such as liquidity risk, interest rate risk, market risk, credit risk, management risk and the risk that the Portfolio could not close out a position when it would be most advantageous to do so. A Portfolio investing in derivatives could lose more than the principal amount invested in these instruments. Investing in non-U.S. securities may entail risk due to non-U.S. economic and political developments; this risk may be increased when investing in emerging markets.
On the performance summary page in this Semiannual Report, the Total Return Investment Performance table measures performance assuming that all dividend and capital gain distributions were reinvested.
An investment in the Portfolio is not a deposit of a bank and is not guaranteed or insured by the Federal Deposit Insurance Corporation or any other government agency. It is possible to lose money on investments in the Portfolio.
PIMCO has adopted written proxy voting policies and procedures (“Proxy Policy”) as required by Rule 206(4)-6 under the Investment Advisers Act of 1940. The Proxy Policy has been adopted by the Trust as the policies and procedures that PIMCO will use when voting proxies on behalf of the Portfolio. Copies of the written Proxy Policy and the factors that PIMCO may consider in determining how to vote proxies for the Portfolio, and information about how the Portfolio voted proxies relating to portfolio securities held during the most recent twelve-month period ended June 30, are available without charge, upon request, by calling the Trust at 1-866-746-2606 and on the Securities and Exchange Commission’s (“SEC”) website at http://www.sec.gov.
The Portfolio files its complete schedule of portfolio holdings with the SEC for the first and third quarters of each fiscal year on Form N-Q. A copy of the Trust’s Form N-Q is available on the SEC’s website at http://www.sec.gov and may be reviewed and copied at the SEC’s Public Reference Room in Washington D.C. Information on the operation of the Public Reference Room may be obtained by calling 1-800-SEC-0330.
PIMCO Variable Insurance Trust is distributed by Allianz Global Investors Distributors LLC, 2187 Atlantic Street, Stamford, CT 06902.
| | | | |
| 2 | | PIMCO Variable Insurance Trust | | |
The following disclosure provides important information regarding the Portfolio’s Expense Example (“Example” or “Expense Example”), which appears in this Semiannual Report. Please refer to this information when reviewing the Expense Example for the Portfolio.
Example
As a shareholder of the Portfolio, you incur two types of costs: (1) transaction costs and (2) ongoing costs, including advisory and administrative fees; distribution and/or service (12b-1) fees (Administrative Class only); and other Portfolio expenses. The Example is intended to help you understand your ongoing costs (in dollars) of investing in the Portfolio and to compare these costs with the ongoing costs of investing in other mutual funds. The Expense Example does not reflect any fees or other expenses imposed by the Variable Contracts. If it did, the expenses reflected in the Expense Examples would be higher. The Example is based on an investment of $1,000 invested at the beginning of the period and held for the entire period indicated, which is from January 1, 2006 to June 30, 2006.
Actual Expenses
The information in the table under the heading “Actual Performance” provides information about actual account values and actual expenses. You may use the information in these columns, together with the amount you invested, to estimate the expenses that you paid over the period. Simply divide your account value by $1,000 (for example, an $8,600 account value divided by $1,000 = 8.60), then multiply the result by the number in the appropriate column for your share class, in the row titled “Expenses Paid During Period” to estimate the expenses you paid on your account during this period.
Hypothetical Example for Comparison Purposes
The information in the table under the heading “Hypothetical Performance (5% return before expenses)” provides information about hypothetical account values and hypothetical expenses based on the Portfolio’s actual expense ratio and an assumed rate of return of 5% per year before expenses, which is not the Portfolio’s actual return. The hypothetical account values and expenses may not be used to estimate the actual ending account balance or expenses you paid for the period. You may use this information to compare the ongoing costs of investing in the Portfolio and other portfolios. To do so, compare this 5% hypothetical example with the 5% hypothetical examples that appear in the shareholder reports of the other portfolios.
Please note that the expenses shown in the table are meant to highlight your ongoing costs only and do not reflect any transactional costs. Therefore, the information under the heading “Hypothetical Performance (5% return before expenses)” is useful in comparing ongoing costs only, and will not help you determine the relative total costs of owning different portfolios. In addition, if these transactional costs were included, your costs would have been higher.
The expense ratio may vary period to period because of various factors, such as an increase in expenses not covered by the advisory and administrative fees (such as expenses of the trustees and their counsel or litigation expense).
Portfolio Benchmark
The S&P 500 Index is an unmanaged index generally considered representative of the stock market as a whole. It is not possible to invest directly in the index.
| | | | | | |
| | | Semiannual Report | | June 30, 2006 | | 3 |
|
|
| PIMCO StocksPLUS® Growth and Income Portfolio |
|
Cumulative Returns Through June 30, 2006
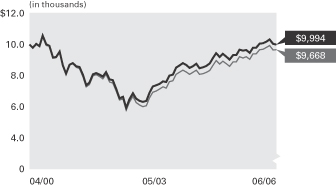
StocksPLUS/(R)/ Growth and Income
Portfolio Institutional Class S&P 500 Index
--------------------------------- -------------
04/30/2000 $10,000 $10,000
05/31/2000 9,803 9,795
06/30/2000 10,038 10,036
07/31/2000 9,907 9,879
08/31/2000 10,567 10,493
09/30/2000 10,012 9,939
10/31/2000 9,927 9,897
11/30/2000 9,179 9,117
12/31/2000 9,209 9,161
01/31/2001 9,559 9,486
02/28/2001 8,676 8,621
03/31/2001 8,126 8,075
04/30/2001 8,709 8,703
05/31/2001 8,817 8,761
06/30/2001 8,605 8,548
07/31/2001 8,571 8,464
08/31/2001 8,052 7,934
09/30/2001 7,403 7,293
10/31/2001 7,567 7,432
11/30/2001 8,103 8,002
12/31/2001 8,170 8,072
01/31/2002 8,083 7,955
02/28/2002 7,961 7,801
03/31/2002 8,238 8,095
04/30/2002 7,764 7,604
05/31/2002 7,720 7,548
06/30/2002 7,158 7,010
07/31/2002 6,549 6,464
08/31/2002 6,664 6,507
09/30/2002 5,946 5,799
10/31/2002 6,488 6,310
11/30/2002 6,888 6,681
12/31/2002 6,530 6,288
01/31/2003 6,386 6,124
02/28/2003 6,323 6,032
03/31/2003 6,402 6,090
04/30/2003 6,934 6,592
05/31/2003 7,314 6,939
06/30/2003 7,397 7,028
07/31/2003 7,488 7,152
08/31/2003 7,651 7,291
09/30/2003 7,603 7,214
10/31/2003 8,011 7,622
11/30/2003 8,084 7,689
12/31/2003 8,517 8,092
01/31/2004 8,673 8,241
02/29/2004 8,820 8,355
03/31/2004 8,690 8,229
04/30/2004 8,506 8,100
05/31/2004 8,616 8,211
06/30/2004 8,775 8,371
07/31/2004 8,489 8,094
08/31/2004 8,554 8,127
09/30/2004 8,634 8,215
10/31/2004 8,792 8,340
11/30/2004 9,143 8,678
12/31/2004 9,453 8,973
01/31/2005 9,211 8,754
02/28/2005 9,397 8,938
03/31/2005 9,212 8,780
04/30/2005 9,044 8,614
05/31/2005 9,325 8,888
06/30/2005 9,322 8,900
07/31/2005 9,669 9,231
08/31/2005 9,604 9,147
09/30/2005 9,649 9,221
10/31/2005 9,460 9,067
11/30/2005 9,799 9,410
12/31/2005 9,801 9,414
01/31/2006 10,068 9,663
02/28/2006 10,078 9,689
03/31/2006 10,175 9,810
04/30/2006 10,329 9,941
05/31/2006 10,032 9,655
06/30/2006 9,994 9,668
$10,000 invested at the beginning of the first full month following the inception date of the Portfolio’s Institutional Class.
Sector Breakdown‡
| | |
Short-Term Instruments | | 44.5% |
Corporate Bonds & Notes | | 24.9% |
U.S. Treasury Obligations | | 12.6% |
U.S. Government Agencies | | 9.8% |
Other | | 8.2% |
| | ‡ | % of Total Investments as of June 30, 2006 |
| | | | | | | | | | | | |
| Average Annual Total Return for the period ended June 30, 2006 |
| | | | | | | 6 Months* | | 1 Year | | 5 Years | | Since Inception
(04/28/00)** |
| | |
| | PIMCO StocksPLUS® Growth and Income Portfolio Institutional Class | | 1.97% | | 7.20% | | 3.04% | | -0.01% |
| | |
| | S&P 500 Index | | 2.71% | | 8.63% | | 2.49% | | -0.55% |
All Portfolio returns are net of fees and expenses.
* Cumulative return.
** The Institutional Class shares commenced operations on 04/28/00. Index comparisons began on 04/30/00.
Past performance is no guarantee of future results. The performance quoted represents past performance. Investment return and principal value will fluctuate so the Portfolio shares, when redeemed, may be worth more or less than their original cost. The Portfolio’s performance does not reflect the deduction of additional charges and expenses imposed in connection with investing in Variable Contracts, which will reduce returns. Current performance may be lower or higher than the performance data quoted. Performance data current to the most recent month-end is available by calling (800) 927-4648.
| | | | | | | | |
| Expense Example | | Actual Performance | | | | Hypothetical Performance |
| | | | | | | (5% return before expenses) |
Beginning Account Value (01/01/06) | | $ | 1,000.00 | | | | $ | 1,000.00 |
Ending Account Value (06/30/06) | | $ | 1,019.70 | | | | $ | 1,022.56 |
Expenses Paid During Period† | | $ | 2.25 | | | | $ | 2.26 |
† Expenses are equal to the Portfolio’s Institutional Class annualized expense ratio of 0.45%, multiplied by the average account value over the period, multiplied by 181/365 (to reflect the one-half year period). Overall fees and expenses of investing in the Portfolio will be higher because the example does not reflect Variable Contract fees and expenses
Please refer to page 3 herein for a description of the Portfolio’s benchmark and an explanation of the information presented in the above Expense Example.
Portfolio Insights
| » | | The PIMCO StocksPLUS® Growth and Income Portfolio seeks to achieve its investment objective by investing under normal circumstances substantially all of its assets in S&P 500 derivatives, backed by a portfolio of Fixed-Income Instruments. |
| » | | The first half of the year was a difficult environment for the StocksPLUS® strategy as most bonds lagged money market instruments; concern about accelerating inflation and central bank tightening pushed interest rates higher worldwide. |
| » | | U.S. interest rate exposure was the dominant cause of underperformance as interest rates increased along the yield curve. |
| » | | An emphasis on Eurodollar instruments and other shorter (one year or less) holdings was negative as rate increases were more pronounced in this part of the curve. |
| » | | Broad diversification to higher-yielding bond sectors, including mortgages and limited exposure to corporates and emerging market securities, helped partially buffer the underperformance associated with rising rates. |
| » | | Long exposure to the Yen and Euro currency was positive as both currencies appreciated relative to the U.S. dollar. |
| | | | | | |
| 4 | | PIMCO Variable Insurance Trust | | | | |
|
|
| Financial Highlights StocksPLUS® Growth and Income Portfolio |
| | | | | | | | | | | | | | | | | | | | | | | | |
| Selected Per Share Data for the Year or Period Ended: | | 06/30/2006+ | | | 12/31/2005 | | | 12/31/2004 | | | 12/31/2003 | | | 12/31/2002 | | | 12/31/2001 | |
| | | | | | |
Institutional Class | | | | | | | | | | | | | | | | | | | | | | | | |
| Net asset value beginning of period | | $ | 10.27 | | | $ | 10.14 | | | $ | 9.29 | | | $ | 7.27 | | | $ | 9.36 | | | $ | 11.05 | |
| Net investment income (a) | | | 0.22 | | | | 0.31 | | | | 0.15 | | | | 0.14 | | | | 0.26 | | | | 0.49 | |
| Net realized/unrealized gain (loss) on investments (a) | | | (0.02 | ) | | | 0.06 | | | | 0.86 | | | | 2.06 | | | | (2.13 | ) | | | (1.75 | ) |
| Total income (loss) from investment operations | | | 0.20 | | | | 0.37 | | | | 1.01 | | | | 2.20 | | | | (1.87 | ) | | | (1.26 | ) |
| Dividends from net investment income | | | (0.19 | ) | | | (0.24 | ) | | | (0.16 | ) | | | (0.18 | ) | | | (0.22 | ) | | | (0.43 | ) |
| Total distributions | | | (0.19 | ) | | | (0.24 | ) | | | (0.16 | ) | | | (0.18 | ) | | | (0.22 | ) | | | (0.43 | ) |
| Net asset value end of period | | $ | 10.28 | | | $ | 10.27 | | | $ | 10.14 | | | $ | 9.29 | | | $ | 7.27 | | | $ | 9.36 | |
| Total return | | | 1.97 | % | | | 3.68 | % | | | 10.99 | % | | | 30.44 | % | | | (20.08 | )% | | | (11.28 | )% |
| Net assets end of period (000s) | | $ | 6,161 | | | $ | 5,735 | | | $ | 3,560 | | | $ | 2,203 | | | $ | 786 | | | $ | 187 | |
| Ratio of expenses to average net assets | | | 0.45 | %*(e) | | | 0.50 | % | | | 0.50 | % | | | 0.50 | % | | | 0.50 | %(d) | | | 0.52 | %(b)(c) |
| Ratio of net investment income to average net assets | | | 4.15 | %* | | | 3.12 | % | | | 1.55 | % | | | 1.65 | % | | | 3.28 | % | | | 4.98 | % |
| Portfolio turnover rate | | | 57 | % | | | 264 | % | | | 249 | % | | | 134 | % | | | 192 | % | | | 547 | % |
+ Unaudited
* Annualized
(a) Per share amounts based on average number of shares outstanding during the period.
(b) Ratio of expenses to average net assets excluding interest expense is 0.50%.
(c) If the investment manager had not reimbursed expenses, the ratio of expenses to average net assets would have been 0.53%.
(d) If the investment manager had not reimbursed expenses, the ratio of expenses to average net assets would have been 0.51%.
(e) Effective October 31, 2005, the advisory fee was reduced to 0.35%.
| | | | | | |
| See Accompanying Notes | | Semiannual Report | | June 30, 2006 | | 5 |
|
|
| Statement of Assets and Liabilities StocksPLUS® Growth and Income Portfolio |
| | | | |
| (Amounts in thousands, except per share amounts) | | June 30, 2006
(Unaudited) | |
| |
Assets: | | | | |
Investments, at value | | $ | 90,859 | |
Cash | | | 2 | |
Foreign currency, at value | | | 1,741 | |
Receivable for Portfolio shares sold | | | 50 | |
Interest and dividends receivable | | | 444 | |
Variation margin receivable | | | 742 | |
Swap premiums paid | | | 87 | |
Unrealized appreciation on forward foreign currency contracts | | | 172 | |
Unrealized appreciation on swap agreements | | | 139 | |
| | | | 94,236 | |
| |
Liabilities: | | | | |
Payable for investments purchased | | $ | 4,835 | |
Payable for Portfolio shares redeemed | | | 187 | |
Written options outstanding | | | 1,390 | |
Accrued investment advisory fee | | | 26 | |
Accrued administration fee | | | 8 | |
Accrued servicing fee | | | 12 | |
Variation margin payable | | | 1,017 | |
Swap premiums received | | | 53 | |
Unrealized depreciation on forward foreign currency contracts | | | 636 | |
Unrealized depreciation on swap agreements | | | 5 | |
| | | | 8,169 | |
| |
Net Assets | | $ | 86,067 | |
| |
Net Assets Consist of: | | | | |
Paid in capital | | $ | 141,777 | |
Undistributed net investment income | | | 5,520 | |
Accumulated undistributed net realized (loss) | | | (59,814 | ) |
Net unrealized (depreciation) | | | (1,416 | ) |
| | | $ | 86,067 | |
| |
Net Assets: | | | | |
Institutional Class | | $ | 6,161 | |
Administrative Class | | | 79,905 | |
| |
Shares Issued and Outstanding: | | | | |
Institutional Class | | | 599 | |
Administrative Class | | | 7,833 | |
| |
Net Asset Value and Redemption Price Per Share (Net Assets Per Share Outstanding) | | | | |
Institutional Class | | $ | 10.28 | |
Administrative Class | | | 10.20 | |
| |
Cost of Investments Owned | | $ | 91,384 | |
Cost of Foreign Currency Held | | $ | 1,755 | |
Premiums Received on Written Options | | $ | 611 | |
| | | | |
| 6 | | PIMCO Variable Insurance Trust | | See Accompanying Notes |
|
|
| Statement of Operations StocksPLUS® Growth and Income Portfolio |
| | | | |
| (Amounts in Thousands) | | Six Months Ended
June 30, 2006
(Unaudited) | |
| |
Investment Income: | | | | |
Interest | | $ | 4,032 | |
Dividends | | | 57 | |
Miscellaneous income | | | 2 | |
Total Income | | | 4,091 | |
| |
Expenses: | | | | |
Investment advisory fees | | | 320 | |
Administration fees | | | 91 | |
Servicing fees – Administrative Class | | | 133 | |
Trustees’ fees | | | 1 | |
Total Expenses | | | 545 | |
| |
Net Investment Income | | | 3,546 | |
| |
Net Realized and Unrealized Gain (Loss): | | | | |
Net realized (loss) on investments | | | (422 | ) |
Net realized gain on futures contracts, options and swaps | | | 4,075 | |
Net realized (loss) on foreign currency transactions | | | (184 | ) |
Net change in unrealized appreciation on investments | | | 203 | |
Net change in unrealized appreciation on futures contracts, options and swaps | | | 1,302 | |
Net change in unrealized appreciation on translation of assets and liabilities denominated in foreign currencies | | | 631 | |
Net Gain | | | 5,605 | |
| |
Net Increase in Net Assets Resulting from Operations | | $ | 9,151 | |
| | | | | | |
| See Accompanying Notes | | Semiannual Report | | June 30, 2006 | | 7 |
|
|
| Statements of Changes in Net Assets StocksPLUS® Growth and Income Portfolio |
| | | | | | | | |
| (Amounts in Thousands) | | Six Months Ended
June 30, 2006
(Unaudited) | | | Year Ended
December 31, 2005 | |
| | |
Increase (Decrease) in Net Assets from: | | | | | | | | |
| | |
Operations: | | | | | | | | |
Net investment income | | $ | 3,546 | | | $ | 7,131 | |
Net realized gain | | | 3,469 | | | | 11,323 | |
Net change in unrealized appreciation (depreciation) | | | 2,136 | | | | (10,541 | ) |
Net increase resulting from operations | | | 9,151 | | | | 7,913 | |
| | |
Distributions to Shareholders: | | | | | | | | |
| From net investment income | | | | | | | | |
Institutional Class | | | (111 | ) | | | (127 | ) |
Administrative Class | | | (2,039 | ) | | | (5,480 | ) |
| | |
Total Distributions | | | (2,150 | ) | | | (5,607 | ) |
| | |
Portfolio Share Transactions: | | | | | | | | |
| Receipts for shares sold | | | | | | | | |
Institutional Class | | | 1,207 | | | | 3,215 | |
Administrative Class | | | 1,775 | | | | 4,123 | |
| Issued as reinvestment of distributions | | | | | | | | |
Institutional Class | | | 111 | | | | 127 | |
Administrative Class | | | 2,039 | | | | 5,480 | |
| Cost of shares redeemed | | | | | | | | |
Institutional Class | | | (883 | ) | | | (1,264 | ) |
Administrative Class | | | (160,111 | ) | | | (49,470 | ) |
Net (decrease) resulting from Portfolio share transactions | | | (155,862 | ) | | | (37,789 | ) |
| | |
Total Decrease in Net Assets | | | (148,861 | ) | | | (35,483 | ) |
| | |
Net Assets: | | | | | | | | |
Beginning of period | | | 234,928 | | | | 270,411 | |
End of period* | | $ | 86,067 | | | $ | 234,928 | |
| | |
*Including undistributed net investment income of: | | $ | 5,520 | | | $ | 4,124 | |
| | | | |
| 8 | | PIMCO Variable Insurance Trust | | See Accompanying Notes |
| | |
| |
| Schedule of Investments StocksPLUS® Growth and Income Portfolio | | June 30, 2006 (Unaudited) |
| | | | | | | | |
| | | | | PRINCIPAL | | | | |
| | | | | AMOUNT | | | | VALUE |
| | | | | (000S) | | | | (000S) |
| | | | | | | | | |
| BANK LOAN OBLIGATIONS 1.2% |
| Georgia-Pacific Corp. | | | | | | | | |
6.979% due 12/20/2012 | | $ | | 45 | | $ | | 46 |
7.170% due 12/20/2012 | | | | 190 | | | | 190 |
7.300% due 12/20/2012 | | | | 762 | | | | 761 |
| | | | | | | | |
|
Total Bank Loan Obligations
(Cost $997) | | | | 997 |
| | | | | | | | |
|
| |
| CORPORATE BONDS & NOTES 26.3% |
| |
| BANKING & FINANCE 13.7% |
| Bank of America Corp. | | | | | | | | |
5.406% due 06/19/2009 | | | | 800 | | | | 800 |
|
| CIT Group, Inc. | | | | | | | | |
5.000% due 11/24/2008 | | | | 300 | | | | 296 |
|
| Citigroup, Inc. | | | | | | | | |
4.200% due 12/20/2007 | | | | 2,500 | | | | 2,452 |
|
| Enron Credit Linked Notes Trust | | | | |
8.000% due 08/15/2005 (a) | | | | 1,700 | | | | 1,122 |
|
| Export-Import Bank of Korea | | | | | | | | |
5.410% due 11/16/2010 | | | | 1,900 | | | | 1,901 |
|
| Ford Motor Credit Co. | | | | | | | | |
6.374% due 03/21/2007 | | | | 1,700 | | | | 1,694 |
6.320% due 09/28/2007 | | | | 600 | | | | 587 |
4.950% due 01/15/2008 | | | | 100 | | | | 94 |
|
| General Motors Acceptance Corp. | | | | |
5.968% due 01/16/2007 | | | | 600 | | | | 598 |
6.599% due 09/23/2008 | | | | 1,500 | | | | 1,470 |
|
| HSBC Finance Corp. | | | | | | | | |
6.538% due 11/13/2007 | | | | 100 | | | | 101 |
|
| Royal Bank of Scotland Group PLC | | | | |
5.424% due 12/21/2007 | | | | 600 | | | | 600 |
|
| Simsbury CLO Ltd. | | | | | | | | |
5.669% due 09/24/2011 | | | | 123 | | | | 123 |
| | | | | | | | |
|
| | | | | | | | | 11,838 |
| | | | | | | | |
|
| |
| INDUSTRIALS 9.8% | | | | | | | | |
| El Paso Corp. | | | | | | | | |
7.625% due 08/16/2007 | | | | 500 | | | | 508 |
6.500% due 06/01/2008 | | | | 1,100 | | | | 1,097 |
|
| Electronic Data Systems Corp. | | | | |
6.334% due 08/17/2006 | | | | 400 | | | | 400 |
|
| HCA, Inc. | | | | | | | | |
7.250% due 05/20/2008 | | | | 120 | | | | 122 |
|
| Host Marriott LP | | | | | | | | |
9.500% due 01/15/2007 | | | | 25 | | | | 26 |
|
| JC Penney Corp., Inc. | | | | | | | | |
7.375% due 08/15/2008 | | | | 100 | | | | 103 |
|
| Mandalay Resort Group | | | | | | | | |
6.500% due 07/31/2009 | | | | 2,200 | | | | 2,167 |
|
| Northwest Pipeline Corp. | | | | | | | | |
6.625% due 12/01/2007 | | | | 1,372 | | | | 1,379 |
|
| Pemex Project Funding Master Trust | | | | |
5.871% due 12/03/2012 | | | | 700 | | | | 699 |
|
| Southern Natural Gas Co. | | | | | | | | |
6.700% due 10/01/2007 | | | | 500 | | | | 503 |
|
| Transcontinental Gas Pipe Line Corp. | | |
6.348% due 04/15/2008 | | | | 1,100 | | | | 1,104 |
|
| Xerox Corp. | | | | | | | | |
9.750% due 01/15/2009 | | | | 300 | | | | 322 |
| | | | | | | | |
|
| | | | | | | | | 8,430 |
| | | | | | | | |
|
| |
| | | | | | | | |
| UTILITIES 2.8% | | | | | | | | |
| AT&T, Inc. | | | | | | | | |
4.389% due 06/05/2007 | | $ | | 300 | | $ | | 297 |
|
| CMS Energy Corp. | | | | | | | | |
9.875% due 10/15/2007 | | | | 1,300 | | | | 1,359 |
|
| Qwest Corp. | | | | | | | | |
8.579% due 06/15/2013 | | | | 700 | | | | 744 |
| | | | | | | | |
|
| | | | | | | | | 2,400 |
| | | | | | | | |
|
Total Corporate Bonds & Notes
(Cost $23,349) | | | | 22,668 |
| | | | | | | | |
|
| |
| MUNICIPAL BONDS & NOTES 0.7% |
| Golden State, California Tobacco Securitization Corporations Revenue Notes, Series 2003 |
5.000% due 06/01/2021 | | | | 555 | | | | 558 |
| | | | | | | | |
|
Total Municipal Bonds & Notes
(Cost $553) | | | | 558 |
| | | | | | | | |
|
| |
| U.S. GOVERNMENT AGENCIES 10.3% |
| Fannie Mae | | | | | | | | |
5.000% due 12/01/2017 - 09/01/2018 (c) | | | | 1,104 | | | | 1,066 |
5.500% due 07/13/2036 | | | | 5,000 | | | | 4,803 |
6.000% due 04/01/2016 - 11/01/2033 (c) | | | | 241 | | | | 240 |
8.000% due 05/01/2030 - 09/01/2031 (c) | | | | 54 | | | | 56 |
|
| Federal Home Loan Bank | | | | | | | | |
0.000% due 02/27/2012 | | | | 500 | | | | 436 |
|
| Freddie Mac | | | | | | | | |
5.500% due 08/15/2030 | | | | 38 | | | | 38 |
6.000% due 07/01/2016 - 05/01/2033 (c) | | | | 1,083 | | | | 1,073 |
6.500% due 10/25/2043 | | | | 587 | | | | 589 |
|
| Government National Mortgage Association |
4.000% due 07/16/2027 | | | | 155 | | | | 153 |
5.125% due 11/20/2029 | | | | 185 | | | | 187 |
5.375% due 02/20/2027 | | | | 171 | | | | 171 |
8.000% due 04/15/2027 - 12/15/2029 (c) | | | | 74 | | | | 79 |
8.500% due 04/20/2030 | | | | 3 | | | | 3 |
| | | | | | | | |
|
Total U.S. Government Agencies (Cost $9,119) | | | | 8,894 |
| | | | | | | | |
|
| |
| U.S. TREASURY OBLIGATIONS 13.3% |
| Treasury Inflation Protected Securities (b) |
3.625% due 01/15/2008 (e) | | | | 11,222 | | | | 11,419 |
| | | | | | | | |
|
Total U.S. Treasury Obligations
(Cost $11,622) | | | | 11,419 |
| | | | | | | | |
|
| |
| MORTGAGE-BACKED SECURITIES 2.6% |
| Banc of America Funding Corp. | | | | |
4.114% due 05/25/2035 | | | | 507 | | | | 489 |
|
| Banc of America Mortgage Securities |
6.500% due 10/25/2031 | | | | 250 | | | | 251 |
|
| Bear Stearns Adjustable Rate Mortgage Trust |
5.339% due 02/25/2033 | | | | 184 | | | | 183 |
|
| Countrywide Alternative Loan Trust |
6.000% due 10/25/2033 | | | | 448 | | | | 431 |
|
| CS First Boston Mortgage Securities Corp. |
5.691% due 05/25/2032 | | | | 148 | | | | 147 |
|
| Impac CMB Trust |
5.702% due 10/25/2033 | | | | 38 | | | | 38 |
5.572% due 04/25/2034 | | | | 212 | | | | 212 |
| | | | | | | | |
| Residential Funding Mortgage Security I |
6.500% due 03/25/2032 | | $ | | 257 | | $ | | 256 |
|
| Structured Asset Mortgage Investments, Inc. |
5.602% due 02/25/2035 | | | | 195 | | | | 195 |
| | | | | | | | |
|
Total Mortgage-Backed Securities
(Cost $2,264) | | | | 2,202 |
| | | | | | | | |
|
| |
| ASSET-BACKED SECURITIES 0.5% |
| Countrywide Asset-Backed Certificates |
5.472% due 05/25/2035 | | | | 438 | | | | 439 |
| | | | | | | | |
|
Total Asset-Backed Securities
(Cost $438) | | 439 |
| | | | | | | | |
|
| |
| SOVEREIGN ISSUES 1.6% |
| Korea Development Bank |
5.469% due 11/22/2012 | | | | 500 | | | | 501 |
|
| Mexico Government International Bond |
5.750% due 01/13/2009 | | | | 900 | | | | 909 |
| | | | | | | | |
|
Total Sovereign Issues
(Cost $1,400) | | | | 1,410 |
| | | | | | | | |
|
| |
| | | | | NOTIONAL
AMOUNT
(000S) | | | | |
| PURCHASED CALL OPTIONS 0.0% |
| 2-Year Interest Rate Swap (OTC) Pay 3-Month USD-LIBOR Floating Rate Index |
Strike @ 4.500% Exp. 10/04/2006 | | | | 7,300 | | | | 0 |
Strike @ 4.800% Exp. 12/22/2006 | | | | 7,000 | | | | 1 |
Strike @ 5.000% Exp. 03/08/2007 | | | | 9,000 | | | | 8 |
Strike @ 5.080% Exp. 04/19/2007 | | | | 9,200 | | | | 13 |
Strike @ 5.130% Exp. 10/25/2006 | | | | 16,000 | | | | 5 |
| | | | | | | | |
|
Total Purchased Call Options (Cost $171) | | 27 |
| | | | | | | | |
|
| |
| | | | | #OF
CONTRACTS | | | | |
| PURCHASED PUT OPTIONS 0.0% |
| 90-Day Eurodollar December Futures (CME) |
Strike @ $92.000 Exp. 12/18/2006 | | | | 55 | | | | 0 |
Strike @ $92.250 Exp. 12/18/2006 | | | | 444 | | | | 3 |
|
| 90-Day Eurodollar March Futures (CME) |
Strike @ $92.000 Exp. 03/19/2007 | | | | 354 | | | | 2 |
|
| S&P 500 Index September Futures (CME) |
Strike @ $550.000 Exp. 09/15/2006 | | | | 183 | | | | 0 |
Strike @ $650.000 Exp. 09/15/2006 | | | | 68 | | | | 0 |
| | | | | | | | |
|
Total Purchased Put Options (Cost $14) | | 5 |
| | | | | | | | |
|
| |
| | | | | SHARES | | | | |
| PREFERRED STOCK 2.1% |
| DG Funding Trust | | | | |
7.210% due 12/31/2049 | | | | 173 | | | | 1,826 |
| | | | | | | | |
|
Total Preferred Stock (Cost $1,823) | | 1,826 |
| | | | | | | | |
|
| | | | | | |
| See Accompanying Notes | | Semiannual Report | | June 30, 2006 | | 9 |
| | |
| |
| Schedule of Investments StocksPLUS® Growth and Income Portfolio (Cont.) | | June 30, 2006 (Unaudited) |
| | | | | | | | |
| | | | | PRINCIPAL | | | | |
| | | | | AMOUNT | | | | VALUE |
| | | | | (000S) | | | | (000S) |
| | | | | | | | | |
| SHORT-TERM INSTRUMENTS (h) 47.0% |
| |
| CERTIFICATES OF DEPOSIT 3.3% |
| Barclay Bank PLC | | | | | | | | |
4.485% due 01/29/2007 | | $ | | 1,900 | | $ | | 1,900 |
|
| Danske Corp. | | | | | | | | |
5.080% due 08/24/2006 | | | | 900 | | | | 893 |
| | | | | | | | |
|
| | | | | | | | | 2,793 |
| | | | | | | | |
|
| |
| COMMERCIAL PAPER 14.0% | | |
| Abbey National N.A. LLC | | | | | | | | |
5.100% due 07/05/2006 | | | | 2,200 | | | | 2,199 |
|
| Calyon N.A. Inc. | | | | | | | | |
5.230% due 08/03/2006 | | | | 1,000 | | | | 995 |
|
| Cox Communications, Inc. | | | | | | |
4.720% due 07/17/2006 | | | | 300 | | | | 300 |
|
| Fannie Mae | | | | | | | | |
4.958% due 09/13/2006 | | | | 2,200 | | | | 2,175 |
| | | | | | | | |
| Nordea N.A., Inc. | | | | | | | | |
5.300% due 09/11/2006 | | $ | | 2,300 | | $ | | 2,275 |
|
| Total Captial S.A. | | | | | | | | |
5.270% due 07/03/2006 | | | | 2,300 | | | | 2,300 |
|
| UBS Finance Delaware LLC | | | | | | |
5.270% due 07/03/2006 | | | | 100 | | | | 100 |
5.080% due 08/21/2006 | | | | 1,700 | | | | 1,688 |
| | | | | | | | |
|
| | | | | | | | | 12,032 |
| | | | | | | | |
|
| |
| REPURCHASE AGREEMENT 2.3% | | |
| State Street Bank | | | | | | | | |
4.900% due 07/03/2006 | | | | 1,983 | | | | 1,983 |
| | | | | | | | |
|
(Dated 06/30/2006. Collateralized by Freddie Mac 2.750% due 02/09/2007 valued at $2,023. Repurchase proceeds are $1,984.) |
| |
| |
| FRANCE TREASURY BILLS 5.7% |
2.603% due 07/06/2006 - 10/12/2006 (c) | | EUR | | 3,820 | | | | 4,872 |
| | | | | | | | |
|
| | | | | | | | |
| GERMANY TREASURY BILLS 13.6% | | |
2.586% due 07/12/2006 - 08/16/2006 (c) | | EUR | | 9,180 | | $ | | 11,726 |
| | | | | | | | |
|
| |
| U.S. TREASURY BILLS 8.1% |
4.722% due 08/31/2006 - 09/14/2006 (c)(e) | | $ | | 7,065 | | | | 7,008 |
| | | | | | | | |
|
Total Short-Term Instruments
(Cost $39,634) | | 40,414 |
| | | | | | | | |
|
| |
| Total Investments (d) 105.6% (Cost $91,384) | | | | $ | | 90,859 |
| |
| Written Options (g) (1.6%) (Premiums $611) | | | | | | (1,390) |
| |
| Other Assets and Liabilities (Net) (4.0%) | | (3,402) |
| | | | | | | | |
|
| Net Assets 100.0% | | | | | | $ | | 86,067 |
| | | | | | | | |
|
| |
| | | | |
| 10 | | PIMCO Variable Insurance Trust | | See Accompanying Notes |
| | |
| Notes to Schedule of Investments (amounts in thousands, except number of contracts): | | |
| |
(a) Security is in default. |
| |
(b) Principal amount of security is adjusted for inflation. |
| |
(c) Securities are grouped by coupon or range of coupons and represent a range of maturities. |
| |
(d) As of June 30, 2006, portfolio securities with an aggregate market value of $559 were valued in good faith and pursuant to guidelines established by the Board of Trustees. |
| |
(e) Securities with an aggregate market value of $18,426 have been segregated with the custodian to cover margin requirements for the following open futures contracts on June 30, 2006: |
| | | | | | | | | | |
| Description | | Type | | Expiration
Month | | # of
Contracts | | Unrealized
Appreciation/
(Depreciation) | |
90-Day Eurodollar December Futures | | Long | | 12/2006 | | 5 | | $ | (3 | ) |
90-Day Eurodollar December Futures | | Long | | 12/2007 | | 1 | | | (1 | ) |
90-Day Eurodollar March Futures | | Short | | 03/2008 | | 41 | | | 51 | |
E-mini S&P 500 Index September Futures | | Short | | 09/2006 | | 18 | | | (29 | ) |
S&P 500 Index September Futures | | Short | | 09/2006 | | 251 | | | 197 | |
U.S. Treasury 2-Year Note September Futures | | Long | | 09/2006 | | 2 | | | (1 | ) |
U.S. Treasury 30-Year Bond September Futures | | Long | | 09/2006 | | 90 | | | 19 | |
| | | | | | | | |
|
|
|
| | | | | | | | | $ | 233 | |
| | | | | | | | |
|
|
|
| | | | | | | | | | | | | | | |
(f) Swap agreements outstanding on June 30, 2006: | |
| Interest Rate Swaps | | | | | | | | | | | | | | | |
| Counterparty | | Floating Rate Index | | Pay/Receive
Floating Rate | | Fixed Rate | | Expiration
Date | | Notional
Amount | | Unrealized
Appreciation/
(Depreciation) | |
BNP Paribas Bank | | 5-year French CPI Ex Tobacco Daily Reference Index | | Pay | | 2.09% | | 10/15/10 | | EUR | 1000 | | $ | (3 | ) |
Goldman Sachs & Co. | | 6-month JPY-LIBOR | | Receive | | 2.00% | | 06/15/12 | | JPY | 62000 | | | (2 | ) |
Morgan Stanley Dean Witter & Co. | | 6-month JPY-LIBOR | | Receive | | 2.00% | | 06/15/12 | | | 260000 | | | 10 | |
Goldman Sachs & Co. | | 3-month USD-LIBOR | | Receive | | 5.00% | | 12/20/11 | | $ | 1700 | | | 15 | |
Lehman Brothers, Inc. | | 3-month USD-LIBOR | | Receive | | 5.00% | | 12/20/13 | | | 2000 | | | 23 | |
| | | | | | | | | | | | | |
|
|
|
| | | | | | | | | | | | | | $ | 43 | |
| | | | | | | | | | | | | |
|
|
|
| | |
| |
| | | June 30, 2006 (Unaudited) |
| | | | | | | | | | | | | | |
| Credit Default Swaps | | | | | | | | | | | | | | |
| Counterparty | | Reference Entity | | Buy/Sell
Protection+ | | (Pay)/Receive
Fixed Rate | | Expiration
Date | | Notional
Amount | | Unrealized
Appreciation |
HSBC Bank USA | | Ford Motor Credit Co. 7.000% due 10/01/2013 | | Sell | | 2.77% | | 06/20/07 | | $ | 500 | | $ | 1 |
J.P. Morgan Chase & Co. | | Russia Government International Bond, 5.000% until 03/31/2007 and 7.500% thereafter, due 03/31/2030 | | Sell | | 0.77% | | 05/20/07 | | | 200 | | | 1 |
J.P. Morgan Chase & Co. | | Ford Motor Credit Co. 7.000% due 10/01/2013 | | Sell | | 4.60% | | 06/20/07 | | | 500 | | | 10 |
Lehman Brothers, Inc. | | Russia Government International Bond, 5.000% until 03/31/2007 and 7.500% thereafter, due 03/31/2030 | | Sell | | 0.61% | | 03/20/07 | | | 3000 | | | 10 |
Lehman Brothers, Inc. | | Russia Government International Bond, 5.000% until 03/31/2007 and 7.500% thereafter, due 03/31/2030 | | Sell | | 0.87% | | 04/20/07 | | | 600 | | | 3 |
| | | | | | | | | | | | | |
|
|
| | | | | | | | | | | | | | $ | 25 |
| | | | | | | | | | | | | |
|
|
|
| + If the Portfolio is a seller of protection and a credit event occurs, as defined under the terms of that particular swap agreement, the Portfolio will Pay to the buyer of the protection an Amount up to the Notional value of the swap and in certain instances, take delivery of the security. as a buyer of protection, the Portfolio will generally Receive from the seller of protection an amount up to the notional amount of the swap if a credit event occurs. |
| | | | | | | | | | | |
| | | | | |
| Total Return Swaps | | | | | | | | | | | |
| Counterparty | | Receive Total Return | | Pay | | Expiration
Date | | # of
Contracts | | Unrealized
Appreciation |
Credit Suisse First Boston | | S&P 500 Index | | 1-month USD-LIBOR plus 0.030% | | 05/15/2007 | | 3,581 | | $ | 66 |
| | | | | | | | | | |
|
|
| | | | | | | | | | | | | | | | | | |
(g) Written options outstanding on June 30, 2006: | | | | | | | | | | |
| Options on Exchange-Traded Futures Contracts | | | | | | | | | | |
| Description | | | | | | Exercise
Price | | Expiration
Date | | # of
Contracts | | Premium | | Value |
Put - CME 90-Day Eurodollar December Futures | | | | | | $95.000 | | 12/18/2006 | | 7 | | $ | 3 | | $ | 11 |
Put - CME 90-Day Eurodollar December Futures | | | | | | 95.250 | | 12/18/2006 | | 602 | | | 398 | | | 1,275 |
Put - CME 90-Day Eurodollar December Futures | | | | | | 95.500 | | 12/18/2006 | | 15 | | | 16 | | | 41 |
Put - CME 90-Day Eurodollar March Futures | | | | | | 94.750 | | 03/19/2007 | | 8 | | | 4 | | | 8 |
Put - CME 90-Day Eurodollar September Futures | | | | | | 95.000 | | 09/18/2006 | | 7 | | | 4 | | | 10 |
| | | | | | | | | | | | | | |
|
| |
|
|
| | | | | | | | | | | | | | | $ | 425 | | $ | 1,345 |
| | | | | | | | | | | | | | |
|
| |
|
|
| | | | | | | | | | | | | | | | | | | |
| Interest Rate Swaptions | | | | | | | | | | | | | |
| Description | | Counterparty | | Pay/Receive
Floating Rate Index | | Floating
Rate | | Exercise
Rate | | Expiration
Date | | Notional
Amount | | Premium | | Value |
Put - OTC 1-Year Interest Rate Swap | | HSBC Bank USA | | 6-month GBP-LIBOR | | Pay | | 4.50% | | 12/20/06 | | GBP | 1,000 | | $ | 5 | | $ | 11 |
Call - OTC 5-Year Interest Rate Swap | | Bear Stearns & Co., Inc. | | 3-month USD-LIBOR | | Receive | | 5.21% | | 10/25/06 | | $ | 3,000 | | | 11 | | | 3 |
Call - OTC 5-Year Interest Rate Swap | | Bear Stearns & Co., Inc. | | 3-month USD-LIBOR | | Receive | | 5.04% | | 03/08/07 | | | 3,000 | | | 29 | | | 6 |
Call - OTC 5-Year Interest Rate Swap | | Citibank N.A. | | 3-month USD-LIBOR | | Receive | | 4.54% | | 10/04/06 | | | 1,600 | | | 19 | | | 0 |
Call - OTC 5-Year Interest Rate Swap | | Citibank N.A. | | 0-month USD-LIBOR | | Receive | | 4.85% | | 12/22/06 | | | 3,000 | | | 39 | | | 1 |
Call - OTC 5-Year Interest Rate Swap | | Goldman Sachs & Co. | | 3-month USD-LIBOR | | Receive | | 5.21% | | 10/25/06 | | | 2,600 | | | 12 | | | 3 |
Call - OTC 5-Year Interest Rate Swap | | Merrill Lynch & Co., Inc. | | 3-month USD-LIBOR | | Receive | | 4.54% | | 10/04/06 | | | 2,000 | | | 24 | | | 0 |
Call - OTC 5-Year Interest Rate Swap | | Royal Bank of Scotland PLC | | 3-month USD-LIBOR | | Receive | | 5.04% | | 03/08/07 | | | 1,000 | | | 11 | | | 2 |
Call - OTC 5-Year Interest Rate Swap | | Royal Bank of Scotland PLC | | 3-month USD-LIBOR | | Receive | | 5.22% | | 04/19/07 | | | 4,000 | | | 32 | | | 18 |
Call - OTC 5-Year Interest Rate Swap | | Wachovia Bank N.A. | | 3-month USD-LIBOR | | Receive | | 5.21% | | 10/25/06 | | | 900 | | | 4 | | | 1 |
| | | | | | | | | | | | |
|
| |
|
|
| | | | | | | | | | | | | | | | $ | 186 | | $ | 45 |
| | | | | | | | | | | | | | | |
|
| |
|
|
| | | | | | | | | | | | | | | | | |
(h) Forward foreign currency contracts outstanding on June 30, 2006: | | | | | |
| Type | | | | Principal Amount
Covered by
Contract | | Settlement
Month | | Unrealized
Appreciation | | Unrealized
(Depreciation) | | | Net Unrealized
Appreciation/
(Depreciation) | |
Buy | | CNY | | 1,818 | | 03/2007 | | $ | 0 | | $ | (1 | ) | | $ | (1 | ) |
Buy | | EUR | | 9,511 | | 07/2006 | | | 170 | | | (9 | ) | | | 161 | |
Sell | | | | 22,558 | | 07/2006 | | | 0 | | | (550 | ) | | | (550 | ) |
Buy | | GBP | | 308 | | 07/2006 | | | 2 | | | 0 | | | | 2 | |
Buy | | JPY | | 253,979 | | 08/2006 | | | 0 | | | (76 | ) | | | (76 | ) |
Buy | | KRW | | 122,504 | | 05/2007 | | | 0 | | | 0 | | | | 0 | |
| | | | | | | | |
|
| |
|
|
| |
|
|
|
| | | | | | | | | $ | 172 | | $ | (636 | ) | | $ | (464 | ) |
| | | | | | | | |
|
| |
|
|
| |
|
|
|
| | | | | | |
| See Accompanying Notes | | Semiannual Report | | June 30, 2006 | | 11 |
Notes to Financial Statements
1. ORGANIZATION
The StocksPLUS® Growth and Income Portfolio (the “Portfolio”) is a series of the PIMCO Variable Insurance Trust (the “Trust”). The Trust is registered under the Investment Company Act of 1940 (the “Act”), as amended, as an open-end investment management company organized as a Delaware business trust on October 3, 1997. The Portfolio offers three classes of shares: Institutional, Administrative and Advisor. Information presented in these financial statements pertains to the Institutional Class of the Portfolio. Certain detailed financial information for the Administrative Class and Advisor Class is provided separately and is available upon request. The Trust is designed to be used as an investment vehicle by Separate Accounts of insurance companies that fund variable annuity contracts and variable life insurance policies and by qualified pension and retirement plans.
2. SIGNIFICANT ACCOUNTING POLICIES
The following is a summary of significant accounting policies consistently followed by the Portfolio in the preparation of its financial statements in conformity with accounting principles generally accepted in the United States of America (“GAAP”). The preparation of financial statements in accordance with GAAP requires management to make estimates and assumptions that affect the reported amounts and disclosures in the financial statements. Actual results could differ from those estimates.
Security Valuation. Portfolio securities are valued as of the close of regular trading (normally 4:00 p.m., Eastern Time) on each day that the New York Stock Exchange (“NYSE”) is open. Portfolio securities and other assets for which market quotes are readily available are stated at market value. Market value is generally determined on the basis of last reported sales prices, or if no sales are reported, based on quotes obtained from a quotation reporting system, established market makers, or pricing services. Fixed-income securities and non-exchange traded derivatives are normally valued on the basis of quotes obtained from brokers and dealers or pricing services. Prices obtained from independent pricing services use information provided by market makers or estimates of market values obtained from yield data relating to investments or securities with similar characteristics. Certain fixed-income securities purchased on a delayed-delivery basis are marked to market daily until settlement at the forward settlement date. Short-term investments having a maturity of 60 days or less are generally valued at amortized cost. Exchange traded options, futures and options on futures are valued at the settlement price determined by the relevant exchange.
Investments initially valued in currencies other than the U.S. dollar are converted to the U.S. dollar using exchange rates obtained from pricing services. As a result, the NAV of the Portfolio’s shares may be affected by changes in the value of currencies in relation to the U.S. dollar. The value of securities traded in markets outside the United States or denominated in currencies other than the U.S. dollar may be affected significantly on a day that the NYSE is closed and an investor is not able to purchase, redeem or exchange shares.
Securities and other assets for which market quotes are not readily available are valued at fair value as determined in good faith by the Board of Trustees or persons acting at their direction. The Board of Trustees has adopted methods for valuing securities and other assets in circumstances where market quotes are not readily available, and has delegated to Pacific Investment Management Company LLC (“PIMCO”) the responsibility for applying the valuation methods. In the event that market quotes are not readily available, and the security or asset cannot be valued pursuant to one of the valuation methods, the value of the security or asset will be determined in good faith by the Valuation Committee of the Board of Trustees, generally based upon recommendations provided by PIMCO.
Market quotes are considered not readily available in circumstances where there is an absence of current or reliable market-based data (e.g., trade information, bid/asked information, broker quotes), including where events occur after the close of the relevant market, but prior to the close of regular trading, that materially affect the values of the Portfolio’s securities or assets. In addition, market quotes are considered not readily available when, due to extraordinary circumstances, the exchanges or markets on which the securities trade do not open for trading for the entire day and no other market prices are available. The Board has delegated to PIMCO the responsibility for monitoring significant events that may materially affect the values of the Portfolio’s securities or assets and for determining whether the value of the applicable securities or assets should be re-evaluated in light of such significant events. When the Portfolio uses fair value pricing to determine its NAV, securities will not be priced on the basis of quotations from the primary market in which they are traded, but rather may be priced by another method that the Board of Trustees or persons acting at their direction believe accurately reflects fair value. The Trust’s policy is intended to result in a calculation of the Portfolio’s NAV that fairly reflects security values as of the time of pricing. However, fair values determined by the Board of Trustees or persons acting at their direction may not accurately reflect the price that the Portfolio could obtain for a security if it were to dispose of that security as of the time of pricing. Because foreign securities can trade on non-business days, the NAV of the Portfolio may change on days when shareholders will not be able to purchase or redeem shares. The prices used by the Portfolio may differ from the value that would be realized if the securities were sold and the differences could be material to the financial statements.
Securities Transactions and Investment Income. Securities transactions are recorded as of the trade date. Securities purchased or sold on a when-issued or delayed-delivery basis may be settled a month or more after the trade date. Realized gains and losses from securities sold are recorded on the identified cost basis. Dividend income is recorded on the ex-dividend date, except certain dividends from foreign securities where the ex-dividend date may have passed, which are recorded as soon as the Portfolio is informed of the ex-dividend date. Interest income, adjusted for the accretion of discounts and amortization of premiums, is recorded on the accrual basis. Paydown gains and losses on mortgage-related or asset-backed securities are recorded as components of interest income in the Statement of Operations.
Dividends and Distributions to Shareholders. Dividends from net investment income, if any, are declared on each day the Portfolio is open for business and are distributed to shareholders quarterly. Net realized capital gains earned by the Portfolio, if any, will be distributed no less frequently than once each year. Most shareholders choose to reinvest their dividends and capital gain distribution in additional shares of the Portfolio.
Income dividends and capital gain distributions are determined in accordance with income tax regulations which may differ from GAAP. Differences between tax regulations and GAAP may change the fiscal year when income and capital items are recognized for tax and GAAP purposes. Examples of events that give rise to timing differences include wash sales, straddles, net operating losses and capital loss carryforwards. Further, the character of investment income and capital gains may be different for certain transactions under the two methods of accounting. Examples of characterization differences include the treatment of mortgage paydowns, swaps, foreign currency transactions and contingent debt instruments. As a result, income dividends and capital gain distributions declared during a fiscal period may differ significantly from the net investment income and realized capital gain reported in the Portfolio’s annual financial statements presented under GAAP.
Distributions classified as a tax basis return of capital, if any, are reflected in the accompanying Statements of Changes in Net Assets and have been reclassified to paid in capital. In addition, other amounts have been reclassified between undistributed net investment income, accumulated undistributed net realized gains
| | | | |
| 12 | | PIMCO Variable Insurance Trust | | |
| | |
| |
| | | June 30, 2006 (Unaudited) |
or losses and/or paid in capital to more appropriately conform financial accounting to tax characterizations of dividend distributions.
Multiclass Operations. Each class offered by the Portfolio has equal rights as to assets and voting privileges (except that shareholders of a class have exclusive voting rights regarding any matter relating solely to that class of shares). Income and non-class specific expenses of the Portfolio are allocated daily to each class of shares based on the relative value of settled shares. Realized and unrealized capital gains and losses of the Portfolio are allocated daily to each class of shares based on the relative net assets of each class. Class specific expenses, where applicable, currently include administrative, distribution and servicing fees.
Federal Income Taxes. The Portfolio intends to qualify as a regulated investment company under sub-chapter M of the Internal Revenue Code and distribute all of its taxable income and net realized gains, if applicable, to shareholders. Accordingly, no provision for Federal income taxes has been made.
Foreign Currency. The accounting records of the Portfolio are maintained in U.S. dollar. The market values of foreign securities, currency holdings and other assets and liabilities are translated into U.S. dollar based on the current exchange rates each business day. Fluctuations in the value of currency holdings and other assets and liabilities resulting from changes in exchange rates are recorded as unrealized foreign currency gains or losses. Realized gains or losses and unrealized appreciation or depreciation on investment securities and income and expenses are translated on the respective dates of such transactions. The effects of changes in foreign currency exchange rates on investments in securities are not segregated in the Statement of Operations from the effects of changes in market prices of those securities, but are included with the net realized and unrealized gain or loss on investment securities.
| | | | | | |
|
| Non-U.S. currency symbols utilized throughout the report are defined as follows: |
| CNY | | Chinese Yuan Renminbi | | JPY | | Japanese Yen |
| EUR | | Euro | | KRW | | South Korean Won |
| GBP | | British Pound | | | | |
Forward Currency Transactions. The Portfolio may enter into forward currency contracts in connection with settling planned purchases or sales of securities, to hedge the currency exposure associated with some or all of the Portfolio’s securities or as a part of an investment strategy. A forward currency contract is an agreement between two parties to buy and sell a currency at a set price on a future date. The market value of a forward currency contract fluctuates with changes in forward currency exchange rates. Forward currency contracts are marked to market daily and the change in value is recorded by the Portfolio as an unrealized gain or loss. Realized gains or losses equal to the difference between the value of the contract at the time it was opened and the value at the time it was closed are recorded upon delivery or receipt of the currency or, if a forward currency contract is offset by entering into another forward currency contract with the same broker, upon settlement of the net gain or loss. These contracts may involve market risk in excess of the unrealized gain or loss reflected in the Portfolio’s Statement of Assets and Liabilities. In addition, the Portfolio could be exposed to risk if the counterparties are unable to meet the terms of the contracts or if the value of the currency changes unfavorably to the U.S. dollar.
Futures Contracts. The Portfolio is authorized to enter into futures contracts. The Portfolio may use futures contracts to manage its exposure to the securities markets or to movements in interest rates and currency values. The primary risks associated with the use of futures contracts are the imperfect correlation between the change in market value of the securities held by the Portfolio and the prices of futures contracts, the possibility of an illiquid market, and the inability of the counterparty to meet the terms of the contract. Futures contracts are valued based upon their quoted daily settlement prices. Upon entering into a futures contract, the Portfolio is required to deposit with its custodian, in a segregated account in the name of the futures broker, an amount of cash or U.S. Government and Agency Obligations in accordance with the initial margin requirements of the broker or exchange. Futures contracts are marked to market daily and an appropriate payable or receivable for the change in value (“variation margin”) is recorded by the Portfolio. Gains or losses are recognized but not considered realized until the contracts expire or are closed. Futures contracts involve, to varying degrees, risk of loss in excess of the variation margin disclosed in the Statement of Assets and Liabilities.
Inflation-Indexed Bonds. The Portfolio may invest in inflation-indexed bonds. Inflation-indexed bonds are fixed-income securities whose principal value is periodically adjusted to the rate of inflation. The interest rate on these bonds is generally fixed at issuance at a rate lower than typical bonds. Over the life of an inflation-indexed bond, however, interest will be paid based on a principal value, which is adjusted for inflation. Any increase in the principal amount of an inflation-indexed bond will be included as interest income in the Statement of Operations, even though investors do not receive their principal until maturity.
Loan Participant and Assignments. The Portfolio may invest in direct debt instruments which are interests in amounts owned by corporate, governmental, or other borrowers to lenders or lending syndicates. The Portfolio’s investments in loans may be in the form of participations in loans or assignments of all or a portion of loans from third parties. A loan is often administered by a bank or other financial institution (the “lender”) that acts as agent for all holders. Then agent administers the terms of the loan, as specified in the loan agreement. When investing in a loan participation, the Portfolio has the right to receive payments of principal, interest and any fees to which it is entitled only from the lender selling the loan agreement and only upon receipt by the lender of payments from the borrower. The Portfolio generally has no right to enforce compliance with the terms of the loan agreement with the borrower. As a result, the Portfolio may be subject to the credit of both the borrower and the lender that is selling the loan agreement. When the Portfolio purchases assignments from lenders it acquires direct rights against the borrower on the loan. At the end of the period, the Portfolio had no unfunded loan commitments.
Options Contracts. The Portfolio may write call and put options on futures, swaps, securities or currencies it owns or in which it may invest. Writing put options tends to increase the Portfolio’s exposure to the underlying instrument. Writing call options tends to decrease the Portfolio’s exposure to the underlying instrument. When the Portfolio writes a call or put option, an amount equal to the premium received is recorded as a liability and subsequently marked to market to reflect the current value of the option written. These liabilities are reflected as written options outstanding in the Statement of Assets and Liabilities. Certain options may be written with premiums to determined on a future date. The premiums for these options are based upon implied volatility parameters at specified terms. Premiums received from writing options which expire are treated as realized gains. Premiums received from writing options which are exercised or closed are added to the proceeds or offset against amounts paid on the underlying future, swap, security or currency transaction to determine the realized gain or loss. The Portfolio as a writer of an option has no control over whether the underlying future, swap, security or currency may be sold (call) or purchased (put) and as a result bears the market risk of an unfavorable change in the price of the future, swap, security or currency underlying the written option. There is the risk the Portfolio may not be able to enter into a closing transaction because of an illiquid market.
The Portfolio may also purchase put and call options. Purchasing call options tends to increase the Portfolio’s exposure to the underlying instrument. Purchasing put
| | | | | | |
| | | Semiannual Report | | June 30, 2006 | | 13 |
Notes to Financial Statements (Cont.)
options tends to decrease the Portfolio’s exposure to the underlying instrument. The Portfolio pays a premium which is included in the Portfolio’s Statement of Assets and Liabilities as an investment and subsequently marked to market to reflect the current value of the option. Premiums paid for purchasing options which expire are treated as realized losses. Certain options may be purchased with premiums to be determined on a future date. The premiums for these options are based upon implied volatility parameters at specified terms. The risk associated with purchasing put and call options is limited to the premium paid. Premiums paid for purchasing options which are exercised or closed are added to the amounts paid or offset against the proceeds on the underlying future, swap, security or currency transaction to determine the realized gain or loss.
Repurchase Agreements. The Portfolio may engage in repurchase transactions. Under the terms of a typical repurchase agreement, the Portfolio takes possession of an underlying debt obligation subject to an obligation of the seller to repurchase, and the Portfolio to resell, the obligation at an agreed-upon price and time. The market value of the collateral must be equal to or exceed at all times the total amount of the repurchase obligations, including interest. Securities purchased under repurchase agreements are reflected as an asset in the Statement of Assets and Liabilities. Generally, in the event of counterparty default, the Portfolio has the right to use the collateral to offset losses incurred. If the counterparty should default, the Portfolio will seek to sell the securities which it holds as collateral. This could involve procedural costs or delays in addition to a loss on the securities if their value should fall below their repurchase price.
Mortgage-Related and Other Asset-Backed Securities. The Portfolio may invest in mortgage-related or other asset-backed securities. These securities include mortgage pass-through securities, collateralized mortgage obligations (“CMOs”), commercial mortgage-backed securities, mortgage dollar rolls, CMO residuals, stripped mortgage-backed securities (“SMBSs”) and other securities that directly or indirectly represent a participation in, or are secured by and payable from, mortgage loans on real property. The value of some mortgage- or asset-backed securities may be particularly sensitive to changes in prevailing interest rates. Early repayment of principal on some mortgage-related securities may expose a Portfolio to a lower rate of return upon reinvestment of principal. The value of these securities may fluctuate in response to the market’s perception of the creditworthiness of the issuers. Additionally, although mortgages and mortgage-related securities are generally supported by some form of government or private guarantee and/or insurance, there is no assurance that private guarantors or insurers will meet their obligations.
One type of SMBS has one class receiving all of the interest from the mortgage assets (the interest-only, or “IO” class), while the other class will receive all of the principal (the principal-only, or “PO” class). Payments received for IOs are included in interest income in the Statement of Operations. Because principal will not be received at the maturity of an IO, adjustments are made to the book value of the security on a daily basis until maturity. These adjustments are included in interest income in the Statement of Operations. Payments received for POs are treated as reductions to the cost and par value of the securities.
Swap Agreements. The Portfolio may engage in swap transactions, including, but not limited to, swap agreements on interest rate, total return, forward spread-lock and credit default to manage its exposure to interest rates and credit risk. In connection with these agreements, securities may be identified as collateral in accordance with the terms of the respective swap agreements.
Interest rate swap agreements involve the exchange by the Portfolio with another party of their respective commitments to pay or receive interest, e.g., an exchange of floating rate payments for fixed rate payments with respect to the notional amount of principal.
Total return swap agreements involve commitments to pay interest in exchange for a market-linked return, both based on notional amounts. To the extent the total return of the security or index underlying the transaction exceeds or falls short of the offsetting interest rate obligation, the Portfolio will receive a payment from or make a payment to the counterparty.
Forward spread-lock swap agreements involve commitments to pay or receive a settlement amount calculated as the difference between the swap spread and a fixed spread, multiplied by the notional amount times the duration of the swap. The swap spread is the difference between the benchmark swap rate (market rate) and the specific Treasury rate.
Credit default swap agreements involve one party making a stream of payments to another party in exchange for the right to receive a specified return in the event of a default by a third party, typically corporate issues or sovereign issues of an emerging country, on its obligation. The Portfolio may use credit default swaps to provide a measure of protection against defaults of the issuers (i.e., to reduce risk where the Portfolio owns or has exposure to the sovereign issuer) or to take an active long or short position with respect to the likelihood of a particular issuer’s default. As a seller of protection, the Portfolio generally receives an upfront payment or a fixed rate of income throughout the term of the swap provided that there is no credit event. If the Portfolio is a seller of protection and a credit event occurs, as defined under the terms of that particular swap agreement, the Portfolio will pay to the buyer of the protection an amount up to the notional value of the swap and in certain instances take delivery of the security. As the seller, the Portfolio would effectively add leverage to its portfolio because, in addition to its total net assets, the Portfolio would be subject to investment exposure on the notional amount of the swap. As a buyer of protection, the Portfolio generally receives an amount up to the notional value of the swap if a credit event occurs. The treatment of a credit default swaps and other swap agreements that provide for contingent, non-periodic, bullet-type payments as “notional principal contracts” for federal income tax purposes is uncertain. Were the Internal Revenue Service in take the position that a credit default swap or other bullet -type swap is not a “notional principal contract” for federal income tax purposes, payments received by the Portfolio from such investments might be subject to income taxes.
Swaps are marked to market daily based upon quotations from market makers and the change in value, if any, is recorded as unrealized gain or loss in the Statement of Operations. Payments received or made at the beginning of the measurement period are reflected as such in the Statement of Assets and Liabilities. These upfront payments are recorded as realized gain or loss in the Statement of Operations upon termination or maturity of the swap. A liquidation payment received or made at the termination of the swap is recorded as realized gain or loss in the Statement of Operations. Net periodic payments received or paid by the Portfolio are included as part of realized gain or loss in the Statement of Operations. Entering into these agreements involves, to varying degrees, elements of credit, market and documentation risk in excess of the amounts recognized in the Statement of Assets and Liabilities. Such risks involve the possibility that there will be no liquid market for these agreements, that the counterparty to the agreements may default on its obligation to perform or disagree as to the meaning of contractual terms in the agreements and that there may be unfavorable changes in interest rates.
U.S. Government Agencies or Government-Sponsored Enterprises. Securities issued by U.S. Government agencies or government-sponsored enterprises may not be guaranteed by the U.S. Treasury. The Government National Mortgage Association (“GNMA”), a wholly owned U.S. Government corporation, is authorized to guarantee, with the full faith and credit of the U.S. Government, the timely payment of principal and interest on securities issued by institutions approved by GNMA and backed by pools of mortgages insured by the Federal Housing Administration or guaranteed by the Department of Veterans Affairs.
| | | | |
| 14 | | PIMCO Variable Insurance Trust | | |
| | |
| |
| | | June 30, 2006 (Unaudited) |
Government-related guarantors (i.e., not backed by the full faith and credit of the U.S. Government) include the Federal National Mortgage Association (“FNMA” or “Fannie Mae”) and the Federal Home Loan Mortgage Corporation (“FHLMC” or “Freddie Mac”). Pass-through securities issued by FNMA are guaranteed as to timely payment of principal and interest by FNMA but are not backed by the full faith and credit of the U.S. Government. FHLMC guarantees the timely payment of interest and ultimate collection of principal, but its participation certificates are not backed by the full faith and credit of the U.S. Government.
Guarantees and Indemnifications. Under the Trust’s organizational documents, each Trustee, officer, employee or other agent of the Trust (including the Trust’s investment manager) is indemnified against certain liabilities that may arise out of performance of their duties to the Portfolio. Additionally, in the normal course of business, the Portfolio enters into contracts that contain a variety of indemnification clauses. The Portfolio’s maximum exposure under these arrangements is unknown as this would involve future claims that may be made against the Portfolio that have not yet occurred. However, the Portfolio has not had prior claims or losses pursuant to these contracts, and believes the risk of loss to be remote.
New Accounting Policies. In July 2006, the Financial Accounting Standards Board issued Interpretation No. 48, “Accounting for Uncertainty in Income Taxes—an Interpretation of FASB Statement No. 109” (the “Interpretation”). The Interpretation is effective for fiscal years beginning after December 15, 2006. Management is currently evaluating the application of the Interpretation to the Portfolio and will provide additional information in relation to the Interpretation in the Portfolio’s annual financial statements for the year ending December 31, 2006.
3. FEES, EXPENSES, AND RELATED PARTY TRANSACTIONS
Investment Advisory Fee. PIMCO is a majority-owned subsidiary of Allianz Global Investors of America L.P. (“AGI”), and serves as investment adviser (the “Adviser”) to the Trust, pursuant to an investment advisory contract. The Adviser receives a monthly fee at an annual rate based on average daily net assets of the Portfolio. The Advisory Fee is charged at an annual rate of 0.35%.
Administration Fee. PIMCO serves as administrator (the “Administrator”), and provides administrative services to the Trust for which it receives a monthly administrative fee based on average daily net assets of the Portfolio. As the Administrator, PIMCO bears the costs of various third-party services, including audit, custodial, portfolio accounting, legal, transfer agency and printing costs. The Administration Fee is charged at the annual rate of 0.10%.
Distribution and Servicing Fees. Allianz Global Investors Distributors LLC (“AGID”) is an indirect wholly-owned subsidiary of AGI and serves as the distributor of the Trust’s shares. The Trust is permitted to reimburse AGID on a quarterly basis, out of the Administrative Class assets of the Portfolio in the amount of 0.15% on an annual basis of the average daily net assets of that class, for payments made to financial intermediaries that provide services in connection with the distribution of shares or administration of plans or programs that use Portfolio shares as their funding medium. The effective rate paid to AGID was 0.15% during the current fiscal year.
Expenses. The Trust is responsible for the following expenses: (i) salaries and other compensation of any of the Trust’s executive officers and employees who are not officers, directors, stockholders or employees of PIMCO or its subsidiaries or affiliates; (ii) taxes and governmental fees; (iii) brokerage fees and commissions and other portfolio transaction expenses; (iv) the costs of borrowing money, including interest expenses and bank overdraft charges; (v) fees and expenses of the Trustees who are not “interested persons” of PIMCO or the Trust, and any counsel retained exclusively for their benefit; (vi) extraordinary expenses, including costs of litigation and indemnification expenses; (vii) organization expenses and (viii) any expenses allocated or allocable to a specific class of shares, which include service fees payable with respect to the Administrative Class shares and may include certain other expenses as permitted by the Trust’s Multiple Class Plan adopted pursuant to Rule 18f-3 under the Act and subject to review and approval by the Trustees. The ratio of expenses to average net assets per share class, as disclosed in the Financial Highlights, may differ from the annual portfolio operating expenses per share class as disclosed in the Prospectus for the reasons set forth above.
For the current period ended June 30, 2006, each unaffiliated Trustee received an annual retainer of $15,000, plus $2,000 for each Board of Trustees quarterly meeting attended, $500 for each Board of Trustees committee meeting attended and $500 for each special board meeting attended, plus reimbursement of related expenses. In addition, each Committee Chair received an additional annual retainer of $500 and each Audit Committee Chair received an additional annual retainer of $1,500. These expenses are allocated on a pro-rata basis to each Portfolio of the Trust according to its respective net assets. The Trust pays no compensation directly to any Trustee or any other officer who is affiliated with the Administrator, all of whom receive remuneration for their services to the Trust from the Administrator or its affiliates.
4. PURCHASES AND SALES OF SECURITIES
The length of time the Portfolio has held a particular security is not generally a consideration in investment decisions. A change in the securities held by the Portfolio is known as “portfolio turnover”. The Portfolio may engage in frequent and active trading of portfolio securities to achieve its investment objective, particularly during periods of volatile market movements. High portfolio turnover (e.g., over 100%) involves correspondingly greater expenses to the Portfolio, including brokerage commissions or dealer mark-ups and other transaction costs on the sale of securities and reinvestments in other securities. Such sales may also result in realization of taxable capital gains, including short-term capital gains (which are generally taxed at ordinary income tax rates). The trading costs and tax effects associated with portfolio turnover may adversely affect the Portfolio’s performance.
Purchases and sales of securities (excluding short-term investments) for the period ended June 30, 2006 were as follows (amounts in thousands):
| | | | | | | | | | | | | | | | | | |
| | | | U.S Government/Agency | | | | | All Other |
| | | | Purchases | | | | | Sales | | | | | Purchases | | | | | Sales |
| | | $ | 39,083 | | | | $ | 61,058 | | | | $ | 20,963 | | | | $ | 62,446 |
5. SECURITY TRANSACTIONS WITH AFFILIATED PORTFOLIO
The Portfolio is permitted to purchase or sell securities from or to certain related affiliated portfolios under specified conditions outlined in procedures adopted by the Board of Trustees of the Trust. The procedures have been designed to ensure that any purchase or sale of securities by the Portfolio from or to another portfolio that are, or could be, considered an affiliate by virtue of having a common investment advisor (or affiliated investment advisors), common Trustees and/or common officers complies with Rule 17a-7 of the Act. Further, as defined under the procedures, each transaction is effected at the current market price. During the period ended June 30, 2006, the Portfolio below engaged in purchases and sales of securities pursuant to the Rule 17a-7 of the Act (amounts in thousands):
| | | | | | | | |
| Purchases | | | | | | Sales | | |
$ 70,214 | | | | | | $ 0 | | |
| | | | | | |
| | | Semiannual Report | | June 30, 2006 | | 15 |
Notes to Financial Statements (Cont.)
6. TRANSACTIONS IN WRITTEN CALL AND PUT OPTIONS
Transactions in written call and put options were as follows (amounts in thousands, except number of contracts):
| | | | | | | | | | | | | | | | | | | | | | | |
| | | | | # of
Contracts |
| | | |
| Notional
Amount
in $ |
| | | |
| Notional
Amount
in GBP |
| | | | | Premium | |
Balance at 12/31/2005 | | | | 314 | | | | | $ | 25,900 | | | | | GBP | 1,300 | | | | | $ | 490 | |
Sales | | | | 967 | | | | | | 15,800 | | | | | | 0 | | | | | | 623 | |
Closing Buys | | | | (15 | ) | | | | | (18,500 | ) | | | | | 0 | | | | | | (210 | ) |
Expirations | | | | (627 | ) | | | | | (2,100 | ) | | | | | (300 | ) | | | | | (292 | ) |
Exercised | | | | 0 | | | | | | 0 | | | | | | 0 | | | | | | 0 | |
Balance at 06/30/2006 | | | | 639 | | | | | $ | 22,100 | | | | | GBP | 1,000 | | | | | $ | 611 | |
7. SHARES OF BENEFICIAL INTEREST
The Portfolio may issue an unlimited number of shares of beneficial interest with a $0.001 par value. Changes in shares of beneficial interest were as follows (shares and amounts in thousands):
| | | | | | | | | | | | | | | | | | |
| | | | | Six Months Ended 06/30/2006 | | | | | Year Ended 12/31/2005 | |
| | | | | Shares | | | Amount | | | | | Shares | | | Amount | |
| | | | | | |
Receipts for shares sold | | | | | | | | | | | | | | | | | | |
Institutional Class | | | | 114 | | | $ | 1,207 | | | | | 318 | | | $ | 3,215 | |
Administrative Class | | | | 168 | | | | 1,775 | | | | | 414 | | | | 4,123 | |
Issued as reinvestment of distributions | | | | | | | | | | | | | | | | | | |
Institutional Class | | | | 11 | | | | 111 | | | | | 13 | | | | 127 | |
Administrative Class | | | | 199 | | | | 2,039 | | | | | 543 | | | | 5,480 | |
Cost of shares redeemed | | | | | | | | | | | | | | | | | | |
Institutional Class | | | | (84 | ) | | | (883 | ) | | | | (124 | ) | | | (1,264 | ) |
Administrative Class | | | | (15,001 | ) | | | (160,111 | ) | | | | (4,939 | ) | | | (49,470 | ) |
Net decrease resulting from Portfolio share transactions | | | | (14,593 | ) | | $ | (155,862 | ) | | | | (3,775 | ) | | $ | (37,789 | ) |
The following schedule shows the number of shareholders each owning 5% or more of the Portfolio and the total percentage of the Portfolio held by such shareholders:
| | | | | | | |
| | | | | Number of
Shareholders | | % of Portfolio Held | |
Institutional Class | | | | 3 | | 100 | |
Administrative Class | | | | 4 | | 85 | * |
* Allianz Life Insurance Co. of North America, an indirect wholly subsidiary of AGI and a related party to the Portfolio, owned 25% or more of the outstanding shares of beneficial interest of the Portfolio, and therefore may be presumed to “control” the Portfolio, as that term is defined in the 1940 Act.
8. FEDERAL INCOME TAX MATTERS
As of June 30, 2006, the aggregate cost of investments was the same for federal income tax and financial statement purposes. The net unrealized appreciation (depreciation) of investment securities for federal income tax purposes is as follows (amounts in thousands):
| | | | |
Aggregate
Gross
Unrealized
Appreciation | | Aggregate
Gross
Unrealized
(Depreciation) | | Net
Unrealized
(Depreciation) |
$ 851 | | $ (3,176) | | $ (525) |
9. REGULATORY AND LITIGATION MATTERS
On June 1, 2004, the Attorney General of the State of New Jersey announced that it had dismissed PIMCO from a complaint filed by the New Jersey Attorney General on February 17, 2004, and that it had entered into a settlement agreement (the “New Jersey Settlement”) with Allianz Global Investors of America L.P. (“AGI”) (formerly known as Allianz Dresdner Asset Management of America L.P.), PEA Capital LLC (an entity affiliated with PIMCO through common ownership) (“PEA”) and Allianz Global Investors Distributors LLC (“AGID”), in connection with the same matter. In the New Jersey Settlement, AGI, PEA and AGID neither admitted nor denied the allegations or conclusions of law, but did agree to pay New Jersey a civil fine of $15 million and $3 million for investigative costs and further potential enforcement initiatives against unrelated parties. They also undertook to implement certain governance changes. The complaint relating to the New Jersey Settlement alleged, among other things, that AGI, PEA and AGID had failed to disclose that they improperly allowed certain hedge funds to engage in “market timing” in certain funds. The complaint sought injunctive relief, civil monetary penalties, restitution and disgorgement of profits.
Since February 2004, PIMCO, AGI, PEA, AGID, and certain of their affiliates, including the PIMCO Funds, the Allianz Funds (formerly known as PIMCO Funds: Multi-Manager Series), and the Trustees and employees of the PIMCO Funds, have been named as defendants in fifteen lawsuits filed in various jurisdictions. Eleven of those lawsuits concern “market timing,” and they have been transferred to and consolidated for pre-trial proceedings in a multi-district litigation proceeding in the U.S. District Court for the District of Maryland; the other four lawsuits concern “revenue sharing” and have been consolidated into a single action in the U.S. District Court for the District of Connecticut. The lawsuits have been commenced as putative class actions on behalf of investors who purchased, held or redeemed shares of the various series of the PIMCO Funds and the Allianz Funds during specified periods, or as derivative actions on behalf of the PIMCO Funds and Allianz Funds.
The market timing actions in the District of Maryland generally allege that certain hedge funds were allowed to engage in “market timing” in certain of the PIMCO Funds and the Allianz Funds and this alleged activity was not disclosed. Pursuant to tolling agreements entered into with the derivative and class action plaintiffs, PIMCO, the Trustees, and certain employees of PIMCO who were previously named as defendants have all been dropped as defendants in the market timing actions; the plaintiffs continue to assert claims on behalf of the shareholders of the PIMCO Funds or on behalf of the PIMCO Funds themselves against other defendants. By order dated November 3, 2005, the U.S. District Court for the District of Maryland granted the PIMCO Funds’ motion to dismiss claims asserted against it in a consolidated amended complaint where the PIMCO Funds were named, in the complaint, as a nominal defendant. The revenue sharing action in the District of Connecticut generally alleges that fund assets were inappropriately used to pay brokers to promote PIMCO Funds and the Allianz Funds, including directing fund brokerage transactions to such brokers, and that such alleged arrangements were not fully disclosed to shareholders. On August 11, 2005 the U.S. District Court for the District of Connecticut conducted a hearing on defendants’ motion to dismiss the consolidated amended complaint in the revenue sharing action but has not yet ruled on the motion to dismiss. The market timing and revenue sharing lawsuits seek, among other things, unspecified compensatory damages plus interest and, in some cases, punitive damages, the rescission of investment advisory contracts, the return of fees paid under those contracts and restitution.
Under Section 9(a) of the Investment Company Act of 1940, as amended (“1940 Act”), if the New Jersey Settlement or any of the lawsuits described above were to result in a court injunction against AGI, PEA, AGID and/or their affiliates, PIMCO could, in the absence of exemptive relief granted by the SEC, be barred from serving as an investment adviser, and AGID could be barred from serving as principal underwriter, to any registered investment company, including the
| | | | |
| 16 | | PIMCO Variable Insurance Trust | | |
| | |
| |
| | | June 30, 2006 (Unaudited) |
Portfolios of the Trust. In connection with an inquiry from the SEC concerning the status of the New Jersey Settlement under Section 9(a), PEA, AGID, AGI and certain of their affiliates (including PIMCO) (together, the “Applicants”) have sought exemptive relief from the SEC under Section 9(c) of the 1940 Act. The SEC has granted the Applicants a temporary exemption from the provisions of Section 9(a) with respect to the New Jersey Settlement until the earlier of (i) September 13, 2006 and (ii) the date on which the SEC takes final action on their application for a permanent order. There is no assurance that the SEC will issue a permanent order.
Two nearly identical class action civil complaints have been filed in August 2005, in the Northern District of Illinois Eastern Division alleging that the plaintiffs each purchased and sold a 10-year Treasury note futures contract and suffered damages from an alleged shortage when PIMCO held both physical and futures positions in 10-year Treasury notes for its client accounts. The two actions have been consolidated into one action, and the two separate complaints have been replaced by a consolidated complaint. PIMCO is a named defendant, and the PIMCO Funds have been added as a defendant, to the consolidated action. PIMCO strongly believes the complaint (and any consolidated complaint filed hereafter) is without merit and intends to vigorously defend itself.
Certain Portfolios of the Trust were recently served in an adversary proceeding brought by the Official Committee of Asbestos Claimants of G-I Holdings, Inc. in G-I Holdings, Inc.’s bankruptcy in the District of New Jersey. PIMCO was previously named in this lawsuit and remains a defendant. The plaintiff seeks to recover for the bankruptcy estate assets that were transferred by the predecessor entity of G-I Holdings, Inc. to a wholly-owned subsidiary in 1994. The subsidiary has since issued notes, of which certain Portfolios of the Trust are alleged to be holders. The complaint alleges that in 2000, more than two hundred noteholders—including certain Portfolios of the Trust—were granted a second priority lien on the assets of the subsidiary in exchange for their consent to a refinancing transaction and the granting of a first priority lien to the lending banks. The plaintiff is seeking invalidation of the lien in favor of the noteholders and/or the value of the lien.
It is possible that these matters and/or other developments resulting from these matters could result in increased fund redemptions or other adverse consequences to the Portfolios. However, PIMCO and AGID believe that these matters are not likely to have a material adverse effect on the Portfolios or on PIMCO’s or AGID’s ability to perform their respective investment advisory or distribution services relating to the Portfolios.
| | | | | | |
| | | Semiannual Report | | June 30, 2006 | | 17 |
Investment Adviser and Administrator
Pacific Investment Management Company LLC
840 Newport Center Drive
Newport Beach, California 92660
Distributor
Allianz Global Investors Distributors LLC
2187 Atlantic Street
Stamford, Connecticut 06902
Custodian
State Street Bank & Trust Company
801 Pennsylvania
Kansas City, Missouri 64105
Transfer Agent
Boston Financial Data Services–Midwest
330 W. 9th Street
Kansas City, Missouri 64105
Legal Counsel
Dechert LLP
1775 I Street, N.W.
Washington, D.C. 20006
Independent Registered Public Accounting Firm
PricewaterhouseCoopers LLP
1055 Broadway
Kansas City, Missouri 64105
P I M C O

Share Class Administrative
Semiannual Report June 30, 2006
PIMCO Variable Insurance Trust
StocksPLUS®Total Return Portfolio
Table of Contents
This material is authorized for use only when preceded or accompanied by the current PIMCO Variable Insurance Trust (the “Trust”) prospectus. Investors should consider the investment objectives, risks, charges and expenses of this Trust carefully before investing. Ask your financial professional to explain all charges that may apply. This and other information is contained in the Trust’s prospectus. The variable product prospectus may be obtained by contacting your Investment Consultant. Please read the Trust and variable product prospectus carefully before you invest or send money.
Chairman’s Letter
Dear PIMCO Variable Insurance Trust Shareholder:
It is our pleasure to present to you the semiannual report for the PIMCO Variable Insurance Trust covering the six-month period ended June 30, 2006.
Highlights of the global bond markets during the six-month period included:
| | n | | Most fixed-income sectors lost ground during the first half of 2006, as concern about accelerating inflation and central bank tightening pushed interest rates higher worldwide. The benchmark Lehman Brothers Aggregate Bond Index (which includes Treasury, Investment-Grade Corporate, and Residential Mortgage-Backed Securities) returned -0.72% for the first six months of the year. On June 30, the benchmark ten-year Treasury yielded 5.14%, 0.75% higher than at the start of the year. The U.S. yield curve remained flat as shorter-maturity yields rose by a comparable amount. |
| | n | | The Federal Reserve tightened four times during the reporting period, bringing the Federal Funds Rate to 5.25%. The increase near the end of the period was the Federal Reserve’s 17th consecutive rate hike since the start of its tightening cycle in 2004. The Federal Reserve was not alone, as central banks in Europe, India, and China tightened credit in unison for the first time since 2000. The Bank of Japan, whose zero-interest-rate policy has flooded global markets with liquidity, looked set to reverse this policy in the coming months. |
In these pages please find a more complete Portfolio review as it relates to financial-market activities, as well as details about total-return investment performance for the six-month reporting period. Thank you for the trust you have placed in us. We will continue to work diligently to meet your investment needs.
Sincerely,
Brent R. Harris
Chairman, PIMCO Variable Insurance Trust
July 31, 2006
| | | | | | |
| | | Semiannual Report | | June 30, 2006 | | 1 |
Important Information About the Portfolio
PIMCO Variable Insurance Trust (the “Trust”) is an open-end management investment company currently consisting of nineteen separate investment portfolios, including the StocksPLUS® Total Return Portfolio (the “Portfolio”). The Portfolio is only available as a funding vehicle under variable life insurance policies or variable annuity contracts issued by insurance companies (“Variable Contracts”). Individuals may not purchase shares of the Portfolio directly. Shares of the Portfolio also may be sold to qualified pension and retirement plans outside of the separate account context.
We believe that bond funds have an important role to play in a well diversified investment portfolio. It is important to note, however, that in an environment where interest rates may trend upward, rising rates would negatively impact the performance of most bond funds, and fixed-income securities held by a fund are likely to decrease in value. The price volatility of fixed-income securities can also increase during periods of rising interest rates resulting in increased losses to a fund. Bond funds and individual bonds with a longer duration (a measure of the expected life of a security) tend to be more sensitive to changes in interest rates, usually making them more volatile than securities or funds with shorter durations. The longer-term performance of most bond funds has benefited from capital gains in part resulting from an extended period of declining interest rates. In the event interest rates increase, these capital gains should not be expected to recur.
The Portfolio may be subject to various risks in addition to those described above. Some of these risks may include, but are not limited to, the following: credit risk, high yield risk, market risk, issuer risk, liquidity risk, derivatives risk, equity risk, mortgage risk, non-U.S. investment risk, currency risk, leveraging risk and management risk. A complete description of these risks is contained in the Portfolio’s prospectus. The Portfolio may use derivative instruments for hedging purposes or as part of an investment strategy. Use of these instruments may involve certain costs and risks such as liquidity risk, interest rate risk, market risk, credit risk, management risk and the risk that the Portfolio could not close out a position when it would be most advantageous to do so. A Portfolio investing in derivatives could lose more than the principal amount invested in these instruments. Investing in non-U.S. securities may entail risk due to non-U.S. economic and political developments; this risk may be increased when investing in emerging markets.
On the performance summary page in this Semiannual Report, the Total Return Investment Performance table measures performance assuming that all dividend and capital gain distributions were reinvested.
An investment in the Portfolio is not a deposit of a bank and is not guaranteed or insured by the Federal Deposit Insurance Corporation or any other government agency. It is possible to lose money on investments in the Portfolio.
PIMCO has adopted written proxy voting policies and procedures (“Proxy Policy”) as required by Rule 206(4)-6 under the Investment Advisers Act of 1940. The Proxy Policy has been adopted by the Trust as the policies and procedures that PIMCO will use when voting proxies on behalf of the Portfolio. Copies of the written Proxy Policy and the factors that PIMCO may consider in determining how to vote proxies for the Portfolio, and information about how the Portfolio voted proxies relating to portfolio securities held during the most recent twelve-month period ended June 30, are available without charge, upon request, by calling the Trust at 1-866-746-2606 and on the Securities and Exchange Commission’s (“SEC”) website at http://www.sec.gov.
The Portfolio files its complete schedule of portfolio holdings with the SEC for the first and third quarters of each fiscal year on Form N-Q. A copy of the Trust’s Form N-Q is available on the SEC’s website at http://www.sec.gov and may be reviewed and copied at the SEC’s Public Reference Room in Washington D.C. Information on the operation of the Public Reference Room may be obtained by calling 1-800-SEC-0330.
PIMCO Variable Insurance Trust is distributed by Allianz Global Investors Distributors LLC, 2187 Atlantic Street, Stamford, CT 06902.
| | | | |
| 2 | | PIMCO Variable Insurance Trust | | |
The following disclosure provides important information regarding the Portfolio’s Expense Example (“Example” or “Expense Example”), which appears in this Semiannual Report. Please refer to this information when reviewing the Expense Example for the Portfolio.
Example
As a shareholder of the Portfolio, you incur two types of costs: (1) transaction costs and (2) ongoing costs, including advisory and administrative fees; distribution and/or service (12b-1) fees (Administrative Class only); and other Portfolio expenses. The Example is intended to help you understand your ongoing costs (in dollars) of investing in the Portfolio and to compare these costs with the ongoing costs of investing in other mutual funds. The Expense Example does not reflect any fees or other expenses imposed by the Variable Contracts. If it did, the expenses reflected in the Expense Examples would be higher. The Example is based on an investment of $1,000 invested at the beginning of the period and held for the entire period indicated, which is from January 1, 2006 to June 30, 2006.
Actual Expenses
The information in the table under the heading “Actual Performance” provides information about actual account values and actual expenses. You may use the information in these columns, together with the amount you invested, to estimate the expenses that you paid over the period. Simply divide your account value by $1,000 (for example, an $8,600 account value divided by $1,000 = 8.60), then multiply the result by the number in the appropriate column for your share class, in the row titled “Expenses Paid During Period” to estimate the expenses you paid on your account during this period.
Hypothetical Example for Comparison Purposes
The information in the table under the heading “Hypothetical Performance (5% return before expenses)” provides information about hypothetical account values and hypothetical expenses based on the Portfolio’s actual expense ratio and an assumed rate of return of 5% per year before expenses, which is not the Portfolio’s actual return. The hypothetical account values and expenses may not be used to estimate the actual ending account balance or expenses you paid for the period. You may use this information to compare the ongoing costs of investing in the Portfolio and other portfolios. To do so, compare this 5% hypothetical example with the 5% hypothetical examples that appear in the shareholder reports of the other portfolios.
Please note that the expenses shown in the table are meant to highlight your ongoing costs only and do not reflect any transactional costs. Therefore, the information under the heading “Hypothetical Performance (5% return before expenses)” is useful in comparing ongoing costs only, and will not help you determine the relative total costs of owning different portfolios. In addition, if these transactional costs were included, your costs would have been higher.
The expense ratio may vary period to period because of various factors, such as an increase in expenses not covered by the advisory and administrative fees (such as expenses of the trustees and their counsel or litigation expense).
Portfolio Benchmark
The S&P 500 Index is an unmanaged index generally considered representative of the stock market as a whole. It is not possible to invest directly in the index.
| | | | | | |
| | | Semiannual Report | | June 30, 2006 | | 3 |
| | | | |
| | |
| PIMCO StocksPLUS® Total Return Portfolio | | | | |
| | | | |
Cumulative Returns Through June 30, 2006
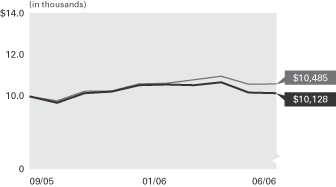
StocksPLUS/(R)/
Total Return Portfolio
Administrative Class S&P 500 Index
-------------------- -------------
09/30/2005 $10,000 $10,000
10/31/2005 9,760 9,833
11/30/2005 10,130 10,205
12/31/2005 10,190 10,209
01/31/2006 10,430 10,479
02/28/2006 10,460 10,508
03/31/2006 10,434 10,638
04/30/2006 10,544 10,781
05/31/2006 10,153 10,471
06/30/2006 10,128 10,485
$10,000 invested at the beginning of the first full month following the inception date of the Portfolio’s Administrative Class.
Sector Breakdown‡
| | |
U.S. Government Agencies# | | 47.6% |
Short-Term Instruments# | | 42.2% |
Corporate Bonds & Notes# | | 6.2% |
Other | | 4.0% |
| | ‡ | % of Total Investments as of June 30, 2006 |
| | # | Primarily serving as collateral for equity-linked derivative positions |
| | | | | | | | |
| Average Annual Total Return for the period ended June 30, 2006 | | |
| | | | | | | 6 Months* | | Since
Inception
(09/30/05) |
| | |
| | PIMCO StocksPLUS® Total Return Portfolio Administrative Class | | -0.61% | | 1.28% |
| | |
| | S&P 500 Index | | 2.71% | | 4.85% |
All Portfolio returns are net of fees and expenses.
* Cumulative return.
Past performance is no guarantee of future results. The performance quoted represents past performance. Investment return and principal value will fluctuate so the Portfolio shares, when redeemed, may be worth more or less than their original cost. The Portfolio’s performance does not reflect the deduction of additional charges and expenses imposed in connection with investing in Variable Contracts, which will reduce returns. Current performance may be lower or higher than the performance data quoted. Performance data current to the most recent month-end is available by calling (800) 927-4648.
| | | | | | | | | | |
| Expense Example | | | | Actual Performance | | | | Hypothetical Performance |
| | | | | | | | | (5% return before expenses) |
Beginning Account Value (01/01/06) | | | | $ | 1,000.00 | | | | $ | 1,000.00 |
Ending Account Value (06/30/06) | | | | $ | 993.90 | | | | $ | 1,020.38 |
Expenses Paid During Period† | | | | $ | 4.40 | | | | $ | 4.46 |
† Expenses are equal to the Portfolio’s Administrative Class annualized expense ratio of 0.89%, multiplied by the average account value over the period, multiplied by 181/365 (to reflect the one-half year period). Overall fees and expenses of investing in the Portfolio will be higher because the example does not reflect Variable Contract fees and expenses.
Please refer to page 3 herein for a description of the Portfolio’s benchmark and an explanation of the information presented in the above Expense Example.
Portfolio Insights
| » | | The PIMCO StocksPLUS® Total Return Portfolio seeks to exceed the total return of the S&P 500 by investing under normal circumstances substantially all of its assets in S&P 500 derivatives, backed by a portfolio of Fixed-Income Instruments. |
| » | | The first half of the year was a difficult environment for the StocksPLUS® Total Return strategy as most bonds lagged money market instruments; concern about accelerating inflation and central bank tightening pushed interest rates higher worldwide. |
| » | | U.S. interest rate exposure was the dominant cause of underperformance as interest rates increased along the yield curve. |
| » | | Holdings of Eurodollar instruments and other shorter (one year or less) holdings were particularly negative as rate increases were more pronounced in this part of the curve. |
| » | | Broad diversification to higher-yielding bond sectors, primarily mortgages but also limited exposure to emerging market securities, helped partially buffer the underperformance associated with rising rates. |
| » | | Other tactical strategies including municipal bond holdings and long exposure to the Yen and Euro currency helped returns. |
| | | | |
| 4 | | PIMCO Variable Insurance Trust | | |
|
|
| Financial Highlights StocksPLUS® Total Return Portfolio |
| | | | | | | | |
| Selected Per Share Data for the Period Ended: | | 06/30/2006+ | | | 09/30/2005-
12/31/2005 | |
| | |
Administrative Class | | | | | | | | |
| Net asset value beginning of period | | $ | 10.19 | | | $ | 10.00 | |
| Net investment income (a) | | | 0.20 | | | | 0.09 | |
| Net realized/unrealized gain (loss) on investments (a) | | | (0.26 | ) | | | 0.10 | |
| Total income (loss) from investment operations | | | (0.06 | ) | | | 0.19 | |
| Dividends from net investment income | | | (0.05 | ) | | | 0.00 | |
| Distributions from net realized capital gains | | | 0.00 | | | | 0.00 | |
| Total distributions | | | (0.05 | ) | | | 0.00 | |
| Net asset value end of period | | $ | 10.08 | | | $ | 10.19 | |
| Total return | | | (0.61 | )% | | | 1.90 | % |
| Net assets end of period (000s) | | $ | 3,241 | | | $ | 3,056 | |
| Ratio of expenses to average net assets | | | 0.89 | %* | | | 0.90 | %*(b)(c) |
| Ratio of net investment income to average net assets | | | 3.86 | %* | | | 3.77 | %* |
| Portfolio turnover rate | | | 240 | % | | | 43 | % |
+ Unaudited
* Annualized
(a) Per share amounts based on average number of shares outstanding during the period.
(b) If the investment manager had not reimbursed expenses, the ratio of expenses to average net assets would have been 2.10%.
(c) Ratio of expenses to average net assets excluding interest expense is 0.89%.
| | | | | | |
| See Accompanying Notes | | Semiannual Report | | June 30, 2006 | | 5 |
|
|
| Statement of Assets and Liabilities StocksPLUS® Total Return Portfolio |
| | | | |
| (Amounts in thousands, except per share amounts) | | June 30, 2006
(Unaudited) | |
| |
Assets: | | | | |
Investments, at value | | $ | 3,481 | |
Repurchase agreement, at value | | | 469 | |
Foreign currency, at value | | | 26 | |
Receivable for investments sold | | | 2 | |
Interest and dividends receivable | | | 7 | |
Variation margin receivable | | | 3 | |
Unrealized appreciation on forward foreign currency contracts | | | 2 | |
| | | | 3,990 | |
| |
Liabilities: | | | | |
Payable for investments purchased | | $ | 725 | |
Accrued investment advisory fee | | | 1 | |
Accrued administration fee | | | 1 | |
Variation margin payable | | | 8 | |
Swap premiums received | | | 4 | |
Unrealized depreciation on forward foreign currency contracts | | | 8 | |
Unrealized depreciation on swap agreements | | | 2 | |
| | | | 749 | |
| |
Net Assets | | $ | 3,241 | |
| |
Net Assets Consist of: | | | | |
Paid in capital | | $ | 3,226 | |
Undistributed net investment income | | | 74 | |
Accumulated undistributed net realized gain | | | 111 | |
Net unrealized (depreciation) | | | (170 | ) |
| | | $ | 3,241 | |
| |
Net Assets: | | | | |
Administrative Class | | $ | 3,241 | |
| |
Shares Issued and Outstanding: | | | | |
Administrative Class | | | 322 | |
| |
Net Asset Value and Redemption Price Per Share (Net Assets Per Share Outstanding) | | | | |
Administrative Class | | $ | 10.08 | |
| |
Cost of Investments Owned | | $ | 3,509 | |
Cost of Repurchase Agreements Owned | | $ | 469 | |
Cost of Foreign Currency Held | | $ | 26 | |
| | | | |
| 6 | | PIMCO Variable Insurance Trust | | See Accompanying Notes |
|
|
| Statement of Operations StocksPLUS® Total Return Portfolio |
| | | | |
| (Amounts in Thousands) | | Six Months Ended
June 30, 2006
(Unaudited) | |
| |
Investment Income: | | | | |
Interest | | $ | 75 | |
Total Income | | | 75 | |
| |
Expenses: | | | | |
Investment advisory fees | | | 8 | |
Administration fees | | | 4 | |
Distribution and/or servicing fees – Administrative Class | | | 2 | |
Total Expenses | | | 14 | |
| |
Net Investment Income | | | 61 | |
| |
Net Realized and Unrealized Gain (Loss): | | | | |
Net realized (loss) on investments | | | (16 | ) |
Net realized gain on futures contracts, options and swaps | | | 141 | |
Net realized (loss) on foreign currency transactions | | | (5 | ) |
Net change in unrealized (depreciation) on investments | | | (44 | ) |
Net change in unrealized (depreciation) on futures contracts, options and swaps | | | (173 | ) |
Net change in unrealized appreciation on translation of assets and liabilities denominated in foreign currencies | | | 10 | |
Net (Loss) | | | (87 | ) |
| |
Net (Decrease) in Net Assets Resulting from Operations | | $ | (26 | ) |
| | | | | | |
| See Accompanying Notes | | Semiannual Report | | June 30, 2006 | | 7 |
| | |
| |
| Statements of Changes in Net Assets StocksPLUS® Total Return Portfolio | | |
| | | | | | | | |
| (Amounts in Thousands) | | Six Months Ended
June 30, 2006
(Unaudited) | | | Period from
September 30, 2005 to
December 31, 2005 | |
| | |
Increase (Decrease) in Net Assets from: | | | | | | | | |
| | |
Operations: | | | | | | | | |
Net investment income | | $ | 61 | | | $ | 28 | |
Net realized gain (loss) | | | 120 | | | | (9 | ) |
Net change in unrealized appreciation (depreciation) | | | (207 | ) | | | 37 | |
Net increase (decrease) resulting from operations | | | (26 | ) | | | 56 | |
| | |
Distributions to Shareholders: | | | | | | | | |
| From net investment income | | | | | | | | |
Administrative Class | | | (15 | ) | | | 0 | |
| | |
Total Distributions | | | (15 | ) | | | 0 | |
| | |
Portfolio Share Transactions: | | | | | | | | |
| Receipts for shares sold | | | | | | | | |
Administrative Class | | | 352 | | | | 3,000 | |
| Issued as reinvestment of distributions | | | | | | | | |
Administrative Class | | | 15 | | | | 0 | |
| Cost of shares redeemed | | | | | | | | |
Administrative Class | | | (141 | ) | | | 0 | |
Net increase resulting from Portfolio share transactions | | | 226 | | | | 3,000 | |
| | |
Total Increase in Net Assets | | | 185 | | | | 3,056 | |
| | |
Net Assets: | | | | | | | | |
Beginning of period | | | 3,056 | | | | 0 | |
End of period* | | $ | 3,241 | | | $ | 3,056 | |
| | |
*Including undistributed net investment income of: | | $ | 74 | | | $ | 28 | |
| | | | |
| 8 | | PIMCO Variable Insurance Trust | | See Accompanying Notes |
| | |
| |
| Schedule of Investments StocksPLUS® Total Return Portfolio | | June 30, 2006 (Unaudited) |
| | | | | | | | |
| | | | | PRINCIPAL | | | | |
| | | | | AMOUNT | | | | VALUE |
| | | | | (000S) | | | | (000S) |
| |
| CORPORATE BONDS & NOTES 7.5% |
| |
| | | | | | | | | |
| BANKING & FINANCE 5.6% |
| Bank of America Corp. |
5.406% due 06/19/2009 | | $ | | 30 | | $ | | 30 |
|
| Citigroup, Inc. |
5.520% due 12/26/2008 | | | | 100 | | | | 100 |
|
| General Electric Capital Corp. |
5.568% due 01/03/2008 | | | | 20 | | | | 20 |
|
| Lehman Brothers Holdings, Inc. |
5.180% due 10/22/2008 | | | | 30 | | | | 30 |
| | | | | | | | |
|
| | | | | | | | | 180 |
| | | | | | | | |
|
| |
| INDUSTRIALS 1.6% |
| DaimlerChrysler N.A. Holding Corp. |
5.780% due 09/10/2007 | | | | 30 | | | | 30 |
|
| Morgan Stanley Bank AG for OAO Gazprom |
9.625% due 03/01/2013 | | | | 20 | | | | 23 |
| | | | | | | | |
|
| | | | | | | | | 53 |
| | | | | | | | |
|
| |
| UTILITIES 0.3% |
| MidAmerican Energy Holdings Co. |
6.125% due 04/01/2036 | | | | 10 | | | | 10 |
| | | | | | | | |
|
Total Corporate Bonds & Notes (Cost $244) | | | | 243 |
| | | | | | | | |
|
| |
| MUNICIPAL BONDS & NOTES 0.3% |
| New Jersey State Tobacco Settlement Financing Corporations Revenue Bonds, Series 2002 |
5.750% due 06/01/2032 | | | | 10 | | | | 10 |
| | | | | | | | |
|
Total Municipal Bonds & Notes (Cost $10) | | | | 10 |
| | | | | | | | |
|
| |
| U.S. GOVERNMENT AGENCIES 58.0% |
| Fannie Mae |
4.486% due 06/01/2035 - 09/01/2035 (a) | | | | 48 | | | | 47 |
4.614% due 09/01/2035 | | | | 19 | | | | 19 |
4.686% due 10/01/2035 | | | | 14 | | | | 14 |
4.693% due 12/01/2033 | | | | 13 | | | | 13 |
4.711% due 12/01/2033 | | | | 7 | | | | 7 |
4.835% due 06/01/2035 | | | | 19 | | | | 19 |
5.011% due 06/01/2035 | | | | 18 | | | | 18 |
5.500% due 08/01/2035 - 07/13/2036 (a) | | | | 1,729 | | | | 1,660 |
|
| Freddie Mac |
4.396% due 09/01/2035 | | | | 6 | | | | 6 |
4.539% due 09/01/2035 | | | | 23 | | | | 23 |
4.715% due 08/01/2035 | | | | 20 | | | | 19 |
4.913% due 11/01/2034 | | | | 19 | | | | 18 |
5.000% due 12/15/2020 | | | | 9 | | | | 9 |
5.211% due 02/25/2045 | | | | 7 | | | | 7 |
| | | | | | | | |
|
Total U.S. Government Agencies (Cost $1,919) | | | | 1,879 |
| | | | | | | | |
|
| |
| U.S. TREASURY OBLIGATIONS 0.0% |
| Treasury Inflation Protected Securities (b) |
2.000% due 01/15/2026 | | | | 2 | | | | 2 |
| | | | | | | | |
|
Total U.S. Treasury Obligations (Cost $2) | | | | 2 |
| | | | | | | | |
|
| |
| | | | | | | | | |
| MORTGAGE-BACKED SECURITIES 3.8% |
| American Home Mortgage Investment Trust |
4.390% due 02/25/2045 | | $ | | 16 | | | $ | | 15 |
|
| Indymac Index Mortgage Loan Trust |
5.199% due 01/25/2036 | | | | 9 | | | | | 9 |
|
| LB-UBS Commercial Mortgage Trust |
4.990% due 11/15/2030 | | | | 90 | | | | | 89 |
|
| Wells Fargo Mortgage-Backed Securities Trust |
4.950% due 03/25/2036 | | | | 10 | | | | | 10 |
| | | | | | | | | |
|
Total Mortgage-Backed Securities
(Cost $125) | | 123 |
| | | | | | | | | |
|
| |
| ASSET-BACKED SECURITIES 0.9% |
| Argent Securities, Inc. |
5.462% due 12/25/2035 | | | | 11 | | | | | 12 |
|
| FBR Securitization Trust |
5.432% due 10/25/2035 | | | | 5 | | | | | 5 |
5.442% due 10/25/2035 | | | | 5 | | | | | 5 |
|
| SACO I, Inc. |
5.432% due 09/25/2035 | | | | 6 | | | | | 6 |
| | | | | | | | | |
|
Total Asset-Backed Securities (Cost $28) | | | | | | | | | 28 |
| | | | | | | | | |
|
| |
| | | | | #OF
CONTRACTS | | | | | |
| PURCHASED PUT OPTIONS 0.0% |
| 90-Day Eurodollar December Futures (CME) |
Strike @ $92.500 Exp. 12/18/2006 | | | | 2 | | | | | 0 |
|
| 90-Day Eurodollar June Futures (CME) |
Strike @ $91.000 Exp. 06/18/2007 | | | | 16 | | | | | 0 |
Strike @ $91.250 Exp. 06/18/2007 | | | | 2 | | | | | 0 |
Strike @ $91.500 Exp. 06/18/2007 | | | | 2 | | | | | 0 |
|
| 90-Day Eurodollar March Futures (CME) |
Strike @ $92.000 Exp. 03/19/2007 | | | | 4 | | | | | 0 |
|
| 90-Day Eurodollar September Futures (CME) |
Strike @ $94.000 Exp. 09/18/2006 | | | | 2 | | | | | 0 |
|
| S&P 500 Index September Futures (CME) |
Strike @ $575.000 Exp. 09/15/2006 | | | | 9 | | | | | 0 |
| | | | | | | | | |
|
Total Purchased Put Options (Cost $0) | | 0 |
| | | | | | | | | |
|
| |
| | | | | PRINCIPAL
AMOUNT
(000S) | | | | | |
| SHORT-TERM INSTRUMENTS (e) 51.4% |
| |
| REPURCHASE AGREEMENTS 14.5% |
| Credit Suisse First Boston |
4.580% due 07/03/2006 | | $ | | 200 | | | | | 200 |
(Dated 06/30/2006. Collateralized by U.S. Treasury Notes 4.000% due 06/15/2009 valued at $206. Repurchase proceeds are $200.) |
|
| State Street Bank |
4.900% due 07/03/2006 | | | | 269 | | | | | 269 |
(Dated 06/30/2006. Collateralized by Federal Home Loan Bank 4.875% due 02/15/2007 valued at $279. Repurchase proceeds are $269.) |
| | | | | | | | | |
|
| | | | | | | | | | 469 |
| | | | | | | | | |
|
| | | | | | | | |
| BELGIUM TREASURY BILL 0.4% |
2.759% due 09/14/2006 | | EUR | | 10 | | $ | | 13 |
| | | | | | | | |
|
| |
| FRANCE TREASURY BILLS 17.3% |
2.503% due 07/20/2006 -09/28/2006 (a) | | | | 440 | | | | 562 |
| | | | | | | | |
|
| |
| GERMANY TREASURY BILL 0.8% |
2.668% due 08/16/2006 | | | | 20 | | | | 25 |
| | | | | | | | |
|
| |
| SPAIN TREASURY BILL 3.9% |
2.890% due 12/22/2006 | | | | 100 | | | | 126 |
| | | | | | | | |
|
| |
| U.S. TREASURY BILLS 14.5% |
4.799% due 08/31/2006 -09/14/2006 (a)(c) | | $ | | 475 | | | | 470 |
| | | | | | | | |
|
Total Short-Term Instruments (Cost $1,650) | | | | 1,665 |
| | | | | | | | |
|
| |
| Total Investments 121.9% (Cost $3,978) | | | | | | $ | | 3,950 |
| |
| Other Assets and Liabilities (Net) (21.9%) | | (709) |
| | | | | | | | |
|
| Net Assets 100.0% | | | | | | $ | | 3,241 |
| | | | | | | | |
|
| | | | | | |
| See Accompanying Notes | | Semiannual Report | | June 30, 2006 | | 9 |
Schedule of Investments StocksPLUS® Total Return Portfolio (Cont.)
| | |
| Notes to Schedule of Investments (amounts in thousands, except number of contracts): |
| |
(a) Securities are grouped by coupon or range of coupons and represent a range of maturities. |
| |
(b) Principal amount of security is adjusted for inflation. |
| |
(c) Securities with an aggregate market value of $470 have been segregated with the custodian to cover margin requirements for the following open futures contracts on June 30, 2006: |
| | | | | | | | | | |
| Description | | Type | | Expiration
Month | | # of
Contracts | | Unrealized
Appreciation/
(Depreciation) | |
90-Day Eurodollar December Futures | | Long | | 12/2006 | | 2 | | $ | (3 | ) |
90-Day Eurodollar December Futures | | Long | | 12/2007 | | 5 | | | (8 | ) |
90-Day Eurodollar June Futures | | Long | | 06/2007 | | 3 | | | (5 | ) |
90-Day Eurodollar March Futures | | Long | | 03/2007 | | 1 | | | (2 | ) |
90-Day Eurodollar March Futures | | Long | | 03/2008 | | 1 | | | (1 | ) |
90-Day Eurodollar September Futures | | Long | | 09/2006 | | 1 | | | (1 | ) |
90-Day Eurodollar September Futures | | Long | | 12/2006 | | 5 | | | (2 | ) |
90-Day Eurodollar September Futures | | Long | | 09/2007 | | 5 | | | (10 | ) |
E-mini S&P 500 Index September Futures | | Short | | 09/2006 | | 6 | | | 4 | |
S&P 500 Index September Futures | | Short | | 09/2006 | | 9 | | | (104 | ) |
U.S. Treasury 10-Year Note September Futures | | Long | | 09/2006 | | 1 | | | (1 | ) |
| | | | | | | | |
|
|
|
| | | | | | | | | $ | (133 | ) |
| | | | | | | | |
|
|
|
| | | | | | | | | | | | | | | |
(d) Swap agreements outstanding on June 30, 2006: | |
| Interest Rate Swaps | |
| Counterparty | | Floating Rate
Index | | Pay/Receive
Floating Rate | | Fixed Rate | | Expiration
Date | | Notional
Amount | | Unrealized
(Depreciation) | |
J.P. Morgan Chase & Co. | | 3-month USD- LIBOR | | Pay | | 5.000% | | 12/20/2011 | | $ | 200 | | $ | (2 | ) |
| | | | | | | | | | | | | |
|
|
|
| | | | | | | | | | | | | | | | | |
(e) Forward foreign currency contracts outstanding on June 30, 2006: | | | | | |
| Type | | | | Principal
Amount
Covered by
Contract | | Settlement
Month | | Unrealized
Appreciation | | Unrealized
(Depreciation) | | | Net Unrealized
Appreciation/
(Depreciation) | |
Buy | | CAD | | 11 | | 07/2006 | | $ | 0 | | $ | 0 | | | $ | 0 | |
Buy | | EUR | | 5 | | 07/2006 | | | 0 | | | 0 | | | | 0 | |
Sell | | | | 417 | | 07/2006 | | | 2 | | | (2 | ) | | | 0 | |
Sell | | | | 106 | | 08/2006 | | | 0 | | | (2 | ) | | | (2 | ) |
Sell | | | | 42 | | 09/2006 | | | 0 | | | (1 | ) | | | (1 | ) |
Buy | | GBP | | 10 | | 07/2006 | | | 0 | | | 0 | | | | 0 | |
Buy | | JPY | | 10,548 | | 08/2006 | | | 0 | | | (3 | ) | | | (3 | ) |
Buy | | KRW | | 4,538 | | 05/2007 | | | 0 | | | 0 | | | | 0 | |
Buy | | SGD | | 2 | | 08/2006 | | | 0 | | | 0 | | | | 0 | |
Buy | | TWD | | 36 | | 08/2006 | | | 0 | | | 0 | | | | 0 | |
| | | | | | | | |
|
| |
|
|
| |
|
|
|
| | | | | | | | | $ | 2 | | $ | (8 | ) | | $ | (6 | ) |
| | | | | | | | |
|
| |
|
|
| |
|
|
|
| | | | |
| 10 | | PIMCO Variable Insurance Trust | | See Accompanying Notes |
| | |
| |
| Notes to Financial Statements | | June 30, 2006 (Unaudited) |
1. ORGANIZATION
The StocksPLUS® Total Return Portfolio (the “Portfolio”) is a series of the PIMCO Variable Insurance Trust (the “Trust”). The Trust is registered under the Investment Company Act of 1940 (the “Act”), as amended, as an open-end investment management company organized as a Delaware business trust on October 3, 1997. The Portfolio offers two classes of shares: Institutional and Administrative. Information presented in these financial statements pertains to the Administrative Class of the Portfolio. Certain detailed financial information for the Institutional Class is provided separately and is available upon request. The Trust is designed to be used as an investment vehicle by Separate Accounts of insurance companies that fund variable annuity contracts and variable life insurance policies and by qualified pension and retirement plans.
2. SIGNIFICANT ACCOUNTING POLICIES
The following is a summary of significant accounting policies consistently followed by the Portfolio in the preparation of its financial statements in conformity with accounting principles generally accepted in the United States of America (“GAAP”). The preparation of financial statements in accordance with GAAP requires management to make estimates and assumptions that affect the reported amounts and disclosures in the financial statements. Actual results could differ from those estimates.
Security Valuation. Portfolio securities are valued as of the close of regular trading (normally 4:00 p.m., Eastern Time) on each day that the New York Stock Exchange (“NYSE”) is open. Portfolio securities and other assets for which market quotes are readily available are stated at market value. Market value is generally determined on the basis of last reported sales prices, or if no sales are reported, based on quotes obtained from a quotation reporting system, established market makers, or pricing services. Fixed-income securities and non-exchange traded derivatives are normally valued on the basis of quotes obtained from brokers and dealers or pricing services. Prices obtained from independent pricing services use information provided by market makers or estimates of market values obtained from yield data relating to investments or securities with similar characteristics. Certain fixed-income securities purchased on a delayed-delivery basis are marked to market daily until settlement at the forward settlement date. Short-term investments having a maturity of 60 days or less are generally valued at amortized cost. Exchange traded options, futures and options on futures are valued at the settlement price determined by the relevant exchange.
Investments initially valued in currencies other than the U.S. dollar are converted to the U.S. dollar using exchange rates obtained from pricing services. As a result, the NAV of the Portfolio’s shares may be affected by changes in the value of currencies in relation to the U.S. dollar. The value of securities traded in markets outside the United States or denominated in currencies other than the U.S. dollar may be affected significantly on a day that the NYSE is closed and an investor is not able to purchase, redeem or exchange shares.
Securities and other assets for which market quotes are not readily available are valued at fair value as determined in good faith by the Board of Trustees or persons acting at their direction. The Board of Trustees has adopted methods for valuing securities and other assets in circumstances where market quotes are not readily available, and has delegated to Pacific Investment Management Company LLC (“PIMCO”) the responsibility for applying the valuation methods. In the event that market quotes are not readily available, and the security or asset cannot be valued pursuant to one of the valuation methods, the value of the security or asset will be determined in good faith by the Valuation Committee of the Board of Trustees, generally based upon recommendations provided by PIMCO.
Market quotes are considered not readily available in circumstances where there is an absence of current or reliable market-based data (e.g., trade information, bid/asked information, broker quotes), including where events occur after the close of the relevant market, but prior to the close of regular trading, that materially affect the values of the Portfolio’s securities or assets. In addition, market quotes are considered not readily available when, due to extraordinary circumstances, the exchanges or markets on which the securities trade do not open for trading for the entire day and no other market prices are available. The Board has delegated to PIMCO the responsibility for monitoring significant events that may materially affect the values of the Portfolio’s securities or assets and for determining whether the value of the applicable securities or assets should be re-evaluated in light of such significant events. When the Portfolio uses fair value pricing to determine its NAV, securities will not be priced on the basis of quotations from the primary market in which they are traded, but rather may be priced by another method that the Board of Trustees or persons acting at their direction believe accurately reflects fair value. The Trust’s policy is intended to result in a calculation of the Portfolio’s NAV that fairly reflects security values as of the time of pricing. However, fair values determined by the Board of Trustees or persons acting at their direction may not accurately reflect the price that the Portfolio could obtain for a security if it were to dispose of that security as of the time of pricing. Because foreign securities can trade on non-business days, the NAV of the Portfolio may change on days when shareholders will not be able to purchase or redeem shares. The prices used by the Portfolio may differ from the value that would be realized if the securities were sold and the differences could be material to the financial statements.
Securities Transactions and Investment Income. Securities transactions are recorded as of the trade date. Securities purchased or sold on a when-issued or delayed-delivery basis may be settled a month or more after the trade date. Realized gains and losses from securities sold are recorded on the identified cost basis. Dividend income is recorded on the ex-dividend date, except certain dividends from foreign securities where the ex-dividend date may have passed, which are recorded as soon as the Portfolio is informed of the ex-dividend date. Interest income, adjusted for the accretion of discounts and amortization of premiums, is recorded on the accrual basis. Paydown gains and losses on mortgage-related or asset-backed securities are recorded as components of interest income in the Statement of Operations.
Dividends and Distributions to Shareholders. Dividends from net investment income, if any, are declared and distributed to shareholders quarterly. Net realized capital gains earned by the Portfolio, if any, will be distributed no less frequently than once each year. Most shareholders choose to reinvest their dividends and capital gain distribution in additional shares of the Portfolio.
Income dividends and capital gain distributions are determined in accordance with income tax regulations which may differ from GAAP. Differences between tax regulations and GAAP may change the fiscal year when income and capital items are recognized for tax and GAAP purposes. Examples of events that give rise to timing differences include wash sales, straddles, net operating losses and capital loss carryforwards. Further, the character of investment income and capital gains may be different for certain transactions under the two methods of accounting. Examples of characterization differences include the treatment of mortgage paydowns, swaps, foreign currency transactions and contingent debt instruments. As a result, income dividends and capital gain distributions declared during a fiscal period may differ significantly from the net investment income and realized capital gain reported in the Portfolio’s annual financial statements presented under GAAP.
Distributions classified as a tax basis return of capital, if any, are reflected in the accompanying Statements of Changes in Net Assets and have been reclassified to paid in capital. In addition, other amounts have been reclassified between undistributed net investment income, accumulated undistributed net realized gains or losses and/or paid in capital to more appropriately conform financial accounting to tax characterizations of dividend distributions.
| | | | | | |
| | | Semiannual Report | | June 30, 2006 | | 11 |
Notes to Financial Statements (Cont.)
Federal Income Taxes. The Portfolio intends to qualify as a regulated investment company under sub-chapter M of the Internal Revenue Code and distribute all of its taxable income and net realized gains, if applicable, to shareholders. Accordingly, no provision for Federal income taxes has been made.
Foreign Currency. The accounting records of the Portfolio are maintained in U.S. dollar. The market values of foreign securities, currency holdings and other assets and liabilities are translated into U.S. dollar based on the current exchange rates each business day. Fluctuations in the value of currency holdings and other assets and liabilities resulting from changes in exchange rates are recorded as unrealized foreign currency gains or losses. Realized gains or losses and unrealized appreciation or depreciation on investment securities and income and expenses are translated on the respective dates of such transactions. The effects of changes in foreign currency exchange rates on investments in securities are not segregated in the Statement of Operations from the effects of changes in market prices of those securities, but are included with the net realized and unrealized gain or loss on investment securities.
| | | | | | |
|
| Non-U.S. currency symbols utilized throughout the report are defined as follows: |
| CAD | | Canadian Dollar | | KRW | | South Korean Won |
| EUR | | Euro | | SGD | | Singapore Dollar |
| GBP | | British Pound | | TWD | | Taiwan Dollar |
| JPY | | Japanese Yen | | | | |
Forward Currency Transactions. The Portfolio may enter into forward currency contracts in connection with settling planned purchases or sales of securities, to hedge the currency exposure associated with some or all of the Portfolio’s securities or as a part of an investment strategy. A forward currency contract is an agreement between two parties to buy and sell a currency at a set price on a future date. The market value of a forward currency contract fluctuates with changes in forward currency exchange rates. Forward currency contracts are marked to market daily and the change in value is recorded by the Portfolio as an unrealized gain or loss. Realized gains or losses equal to the difference between the value of the contract at the time it was opened and the value at the time it was closed are recorded upon delivery or receipt of the currency or, if a forward currency contract is offset by entering into another forward currency contract with the same broker, upon settlement of the net gain or loss. These contracts may involve market risk in excess of the unrealized gain or loss reflected in the Portfolio’s Statement of Assets and Liabilities. In addition, the Portfolio could be exposed to risk if the counterparties are unable to meet the terms of the contracts or if the value of the currency changes unfavorably to the U.S. dollar.
Futures Contracts. The Portfolio is authorized to enter into futures contracts. The Portfolio may use futures contracts to manage its exposure to the securities markets or to movements in interest rates and currency values. The primary risks associated with the use of futures contracts are the imperfect correlation between the change in market value of the securities held by the Portfolio and the prices of futures contracts, the possibility of an illiquid market, and the inability of the counterparty to meet the terms of the contract. Futures contracts are valued based upon their quoted daily settlement prices. Upon entering into a futures contract, the Portfolio is required to deposit with its custodian, in a segregated account in the name of the futures broker, an amount of cash or U.S. Government and Agency Obligations in accordance with the initial margin requirements of the broker or exchange. Futures contracts are marked to market daily and an appropriate payable or receivable for the change in value (“variation margin”) is recorded by the Portfolio. Gains or losses are recognized but not considered realized until the contracts expire or are closed. Futures contracts involve, to varying degrees, risk of loss in excess of the variation margin disclosed in the Statement of Assets and Liabilities.
Repurchase Agreements. The Portfolio may engage in repurchase transactions. Under the terms of a typical repurchase agreement, the Portfolio takes possession of an underlying debt obligation subject to an obligation of the seller to repurchase, and the Portfolio to resell, the obligation at an agreed-upon price and time. The market value of the collateral must be equal to or exceed at all times the total amount of the repurchase obligations, including interest. Securities purchased under repurchase agreements are reflected as an asset in the Statement of Assets and Liabilities. Generally, in the event of counterparty default, the Portfolio has the right to use the collateral to offset losses incurred. If the counterparty should default, the Portfolio will seek to sell the securities which it holds as collateral. This could involve procedural costs or delays in addition to a loss on the securities if their value should fall below their repurchase price.
Mortgage-Related and Other Asset-Backed Securities. The Portfolio may invest in mortgage-related or other asset-backed securities. These securities include mortgage pass-through securities, collateralized mortgage obligations (“CMOs”), commercial mortgage-backed securities, mortgage dollar rolls, CMO residuals, stripped mortgage-backed securities (“SMBSs”) and other securities that directly or indirectly represent a participation in, or are secured by and payable from, mortgage loans on real property. The value of some mortgage- or asset-backed securities may be particularly sensitive to changes in prevailing interest rates. Early repayment of principal on some mortgage-related securities may expose the Portfolio to a lower rate of return upon reinvestment of principal. The value of these securities may fluctuate in response to the market’s perception of the creditworthiness of the issuers. Additionally, although mortgages and mortgage-related securities are generally supported by some form of government or private guarantee and/or insurance, there is no assurance that private guarantors or insurers will meet their obligations.
One type of SMBS has one class receiving all of the interest from the mortgage assets (the interest-only, or “IO” class), while the other class will receive all of the principal (the principal-only, or “PO” class). Payments received for IOs are included in interest income in the Statement of Operations. Because principal will not be received at the maturity of an IO, adjustments are made to the book value of the security on a daily basis until maturity. These adjustments are included in interest income in the Statement of Operations. Payments received for POs are treated as reductions to the cost and par value of the securities.
Swap Agreements. The Portfolio may engage in swap transactions, including, but not limited to, swap agreements on interest rate, total return and credit default to manage its exposure to interest rates and credit risk. In connection with these agreements, securities may be identified as collateral in accordance with the terms of the respective swap agreements.
Interest rate swap agreements involve the exchange by the Portfolio with another party of their respective commitments to pay or receive interest, e.g., an exchange of floating rate payments for fixed rate payments with respect to the notional amount of principal.
Total return swap agreements involve commitments to pay interest in exchange for a market-linked return, both based on notional amounts. To the extent the total return of the security or index underlying the transaction exceeds or falls short of the offsetting interest rate obligation, the Portfolio will receive a payment from or make a payment to the counterparty.
Credit default swap agreements involve one party making a stream of payments to another party in exchange for the right to receive a specified return in the event of a default by a third party, typically corporate issues or sovereign issues of an emerging country, on its obligation. The Portfolio may use credit default swaps to provide a measure of protection against defaults of the issuers (i.e., to reduce risk where the Portfolio owns or has exposure to the sovereign issuer) or to take an
| | | | |
| 12 | | PIMCO Variable Insurance Trust | | |
| | |
| |
| | | June 30, 2006 (Unaudited) |
active long or short position with respect to the likelihood of a particular issuer’s default. As a seller of protection, the Portfolio generally receives an upfront payment or a fixed rate of income throughout the term of the swap provided that there is no credit event. If the Portfolio is a seller of protection and a credit event occurs, as defined under the terms of that particular swap agreement, the Portfolio will pay to the buyer of the protection an amount up to the notional value of the swap and in certain instances take delivery of the security. As the seller, a Portfolio would effectively add leverage to its portfolio because, in addition to its total net assets, the Portfolio would be subject to investment exposure on the notional amount of the swap. As a buyer of protection, a Portfolio generally receives an amount up to the notional value of the swap if a credit event occurs. The treatment of credit default swaps and other swap agreements that provide for contingent, non-periodic, bullet-type payments as “notional principal contracts” for federal income tax purposes is uncertain. Were the Internal Revenue Service to take the position that a credit default swap or other bullet-type swap is not a “notional principal contract” for federal income tax purposes, payments received by the Portfolio from such investments might be subject to income taxes.
Swaps are marked to market daily based upon quotations from market makers and the change in value, if any, is recorded as unrealized gain or loss in the Statement of Operations. Payments received or made at the beginning of the measurement period are reflected as such in the Statement of Assets and Liabilities. These upfront payments are recorded as realized gain or loss in the Statement of Operations upon termination or maturity of the swap. A liquidation payment received or made at the termination of the swap is recorded as realized gain or loss in the Statement of Operations. Net periodic payments received or paid by the Portfolio are included as part of realized gain or loss in the Statement of Operations. Entering into these agreements involves, to varying degrees, elements of credit, market and documentation risk in excess of the amounts recognized in the Statement of Assets and Liabilities. Such risks involve the possibility that there will be no liquid market for these agreements, that the counterparty to the agreements may default on its obligation to perform or disagree as to the meaning of contractual terms in the agreements and that there may be unfavorable changes in interest rates.
U.S. Government Agencies or Government-Sponsored Enterprises. Securities issued by U.S. Government agencies or government-sponsored enterprises may not be guaranteed by the U.S. Treasury. The Government National Mortgage Association (“GNMA”), a wholly owned U.S. Government corporation, is authorized to guarantee, with the full faith and credit of the U.S. Government, the timely payment of principal and interest on securities issued by institutions approved by GNMA and backed by pools of mortgages insured by the Federal Housing Administration or guaranteed by the Department of Veterans Affairs. Government-related guarantors (i.e., not backed by the full faith and credit of the U.S. Government) include the Federal National Mortgage Association (“FNMA” or “Fannie Mae”) and the Federal Home Loan Mortgage Corporation (“FHLMC” or “Freddie Mac”). Pass-through securities issued by FNMA are guaranteed as to timely payment of principal and interest by FNMA but are not backed by the full faith and credit of the U.S. Government. FHLMC guarantees the timely payment of interest and ultimate collection of principal, but its participation certificates are not backed by the full faith and credit of the U.S. Government.
Guarantees and Indemnifications. Under the Trust’s organizational documents, each Trustee, officer, employee or other agent of the Trust (including the Trust’s investment manager) is indemnified against certain liabilities that may arise out of performance of their duties to the Portfolio. Additionally, in the normal course of business, the Portfolio enters into contracts that contain a variety of indemnification clauses. The Portfolio’s maximum exposure under these arrangements is unknown as this would involve future claims that may be made against the Portfolio that have not yet occurred. However, the Portfolio has not had prior claims or losses pursuant to these contracts, and believes the risk of loss to be remote.
New Accounting Policies. In July 2006, the Financial Accounting Standards Board issued Interpretation No. 48, “Accounting for Uncertainty in Income Taxes—an Interpretation of FASB Statement No. 109” (the “Interpretation”). The Interpretation is effective for fiscal years beginning after December 15, 2006. Management is currently evaluating the application of the Interpretation to the Portfolio and will provide additional information in relation to the Interpretation in the Portfolio’s annual financial statements for the year ending December 31, 2006.
3. FEES, EXPENSES, AND RELATED PARTY TRANSACTIONS
Investment Advisory Fee. PIMCO is a majority-owned subsidiary of Allianz Global Investors of America L.P. (“AGI”), and serves as investment adviser (the “Adviser”) to the Trust, pursuant to an investment advisory contract. The Adviser receives a monthly fee at an annual rate based on average daily net assets of the Portfolio. The Advisory Fee is charged at an annual rate of 0.49%.
Administration Fee. PIMCO serves as administrator (the “Administrator”), and provides administrative services to the Trust for which it receives a monthly administrative fee based on average daily net assets of the Portfolio. As the Administrator, PIMCO bears the costs of various third-party services, including audit, custodial, portfolio accounting, legal, transfer agency and printing costs. The Administration Fee is charged at the annual rate of 0.25%.
Distribution and Servicing Fees. Allianz Global Investors Distributors LLC (“AGID”) is an indirect wholly-owned subsidiary of AGI and serves as the distributor of the Trust’s shares. The Trust is permitted to reimburse AGID on a quarterly basis, out of the Administrative Class assets of the Portfolio in the amount of 0.15% on an annual basis of the average daily net assets of that class, for payments made to financial intermediaries that provide services in connection with the distribution of shares or administration of plans or programs that use Portfolio shares as their funding medium. The effective rate paid to AGID was 0.15% during the current fiscal year.
Expenses. The Trust is responsible for the following expenses: (i) salaries and other compensation of any of the Trust’s executive officers and employees who are not officers, directors, stockholders or employees of PIMCO or its subsidiaries or affiliates; (ii) taxes and governmental fees; (iii) brokerage fees and commissions and other portfolio transaction expenses; (iv) the costs of borrowing money, including interest expenses and bank overdraft charges; (v) fees and expenses of the Trustees who are not “interested persons” of PIMCO or the Trust, and any counsel retained exclusively for their benefit; (vi) extraordinary expenses, including costs of litigation and indemnification expenses; (vii) organization expenses and (viii) any expenses allocated or allocable to a specific class of shares, which include service fees payable with respect to the Administrative Class shares and may include certain other expenses as permitted by the Trust’s Multiple Class Plan adopted pursuant to Rule 18f-3 under the Act and subject to review and approval by the Trustees. The ratio of expenses to average net assets per share class, as disclosed in the Financial Highlights, may differ from the annual portfolio operating expenses per share class as disclosed in the Prospectus for the reasons set forth above.
PIMCO has agreed to waive a portion of its administrative fees to the extent that the payment of the Portfolio’s pro rata share of organization expenses and Trustee fees cause the actual expense ratio to rise above the rates disclosed in the then-current prospectus plus 0.49 basis points as set forth below (calculated as a percentage of the Portfolio’s average daily net assets attributable to each class):
| | | |
| Administrative Class | | 0.89 | % |
| | | | | | |
| | | Semiannual Report | | June 30, 2006 | | 13 |
Notes to Financial Statements (Cont.)
PIMCO may be reimbursed for these waived amounts in future periods, not to exceed thirty-six months. Expenses that have been waived and may still be reimbursed by the Administrator, to the extent the Portfolio’s annualized total portfolio operating expenses plus the amount so reimbursed does not exceed the operating expense limitation, are as follows (amounts in thousands):
| | | | | | | | | | |
| | | | | | 12/31/2005 | | | | | 06/30/2006 |
Amount Available for Reimbursement | | | | $ | 9 | | | | $ | 0 |
For the current period ended June 30, 2006, each unaffiliated Trustee received an annual retainer of $15,000, plus $2,000 for each Board of Trustees quarterly meeting attended, $500 for each Board of Trustees committee meeting attended and $500 for each special board meeting attended, plus reimbursement of related expenses. In addition, each Committee Chair received an additional annual retainer of $500 and each Audit Committee Chair received an additional annual retainer of $1,500. These expenses are allocated on a pro-rata basis to each Portfolio of the Trust according to its respective net assets. The Trust pays no compensation directly to any Trustee or any other officer who is affiliated with the Administrator, all of whom receive remuneration for their services to the Trust from the Administrator or its affiliates.
4. PURCHASES AND SALES OF SECURITIES
The length of time the Portfolio has held a particular security is not generally a consideration in investment decisions. A change in the securities held by the Portfolio is known as “portfolio turnover”. The Portfolio may engage in frequent and active trading of portfolio securities to achieve its investment objective, particularly during periods of volatile market movements. High portfolio turnover (e.g., over 100%) involves correspondingly greater expenses to the Portfolio, including brokerage commissions or dealer mark-ups and other transaction costs on the sale of securities and reinvestments in other securities. Such sales may also result in realization of taxable capital gains, including short-term capital gains (which are generally taxed at ordinary income tax rates). The trading costs and tax effects associated with portfolio turnover may adversely affect the Portfolio’s performance.
Purchases and sales of securities (excluding short-term investments) for the period ended June 30, 2006 were as follows (amounts in thousands):
| | | | | | | | | | | | |
| U.S Government/Agency | | | | All Other |
| Purchases | | | | Sales | | | | Purchases | | | | Sales |
| $5,772 | | | | $6,023 | | | | $246 | | | | $206 |
5. TRANSACTIONS IN WRITTEN CALL AND PUT OPTIONS
Transactions in written call and put options were as follows (amounts in thousands, except number of contracts):
| | | | | | | | | | | |
| | | | | # of
Contracts |
| | | | | Premium | |
Balance at 12/31/2005 | | | | 2 | | | | | $ | 1 | |
Sales | | | | 3 | | | | | | 0 | |
Closing Buys | | | | (4 | ) | | | | | (1 | ) |
Expirations | | | | (1 | ) | | | | | 0 | |
Exercised | | | | 0 | | | | | | 0 | |
Balance at 06/30/2006 | | | | 0 | | | | | $ | 0 | |
6. SHARES OF BENEFICIAL INTEREST
The Portfolio may issue an unlimited number of shares of beneficial interest with a $0.001 par value. Changes in shares of beneficial interest were as follows (shares and amounts in thousands):
| | | | | | | | | | | | | | | | |
| | | | | Six Months Ended
06/30/2006 | | | | | Period from 09/30/2005
to 12/31/2005 |
| | | | | Shares | | | Amount | | | | | Shares | | Amount |
| | | | | | |
Receipts for shares sold | | | | | | | | | | | | | | | | |
Administrative Class | | | | 34 | | | $ | 352 | | | | | 300 | | $ | 3,000 |
Issued as reinvestment of distributions | | | | | | | | | | | | | | |
Administrative Class | | | | 1 | | | | 15 | | | | | 0 | | | 0 |
Cost of shares redeemed | | | | | | | | | | | | | | | | |
Administrative Class | | | | (13 | ) | | | (141 | ) | | | | 0 | | | 0 |
Net increase resulting from Portfolio share transactions | | | | 22 | | | $ | 226 | | | | | 300 | | $ | 3,000 |
The following schedule shows the number of shareholders each owning 5% or more of the Portfolio and the total percentage of the Portfolio held by such shareholders:
| | | | | | |
| | | | | Number of
Shareholders | | % of Portfolio
Held |
Administrative Class | | | | 2 | | 100 |
7. FEDERAL INCOME TAX MATTERS
As of June 30, 2006, the aggregate cost of investments was the same for federal income tax and financial statement purposes. The net unrealized appreciation (depreciation) of investment securities for federal income tax purposes is as follows (amounts in thousands):
| | | | |
Aggregate Gross Unrealized Appreciation | | Aggregate Gross Unrealized (Depreciation) | | Net Unrealized (Depreciation) |
$ 17 | | $ (45) | | $ (28) |
8. REGULATORY AND LITIGATION MATTERS
On June 1, 2004, the Attorney General of the State of New Jersey announced that it had dismissed PIMCO from a complaint filed by the New Jersey Attorney General on February 17, 2004, and that it had entered into a settlement agreement (the “New Jersey Settlement”) with Allianz Global Investors of America L.P. (“AGI”) (formerly known as Allianz Dresdner Asset Management of America L.P.), PEA Capital LLC (an entity affiliated with PIMCO through common ownership) (“PEA”) and Allianz Global Investors Distributors LLC (“AGID”), in connection with the same matter. In the New Jersey Settlement, AGI, PEA and AGID neither admitted nor denied the allegations or conclusions of law, but did agree to pay New Jersey a civil fine of $15 million and $3 million for investigative costs and further potential enforcement initiatives against unrelated parties. They also undertook to implement certain governance changes. The complaint relating to the New Jersey Settlement alleged, among other things, that AGI, PEA and AGID had failed to disclose that they improperly allowed certain hedge funds to engage in “market timing” in certain funds. The complaint sought injunctive relief, civil monetary penalties, restitution and disgorgement of profits.
Since February 2004, PIMCO, AGI, PEA, AGID, and certain of their affiliates, including the PIMCO Funds, the Allianz Funds (formerly known as PIMCO Funds: Multi-Manager Series), and the Trustees and employees of the PIMCO Funds, have been named as defendants in fifteen lawsuits filed in various jurisdictions. Eleven
| | | | |
| 14 | | PIMCO Variable Insurance Trust | | |
| | |
| |
| | | June 30, 2006 (Unaudited) |
of those lawsuits concern “market timing,” and they have been transferred to and consolidated for pre-trial proceedings in a multi-district litigation proceeding in the U.S. District Court for the District of Maryland; the other four lawsuits concern “revenue sharing” and have been consolidated into a single action in the U.S. District Court for the District of Connecticut. The lawsuits have been commenced as putative class actions on behalf of investors who purchased, held or redeemed shares of the various series of the PIMCO Funds and the Allianz Funds during specified periods, or as derivative actions on behalf of the PIMCO Funds and Allianz Funds.
The market timing actions in the District of Maryland generally allege that certain hedge funds were allowed to engage in “market timing” in certain of the PIMCO Funds and the Allianz Funds and this alleged activity was not disclosed. Pursuant to tolling agreements entered into with the derivative and class action plaintiffs, PIMCO, the Trustees, and certain employees of PIMCO who were previously named as defendants have all been dropped as defendants in the market timing actions; the plaintiffs continue to assert claims on behalf of the shareholders of the PIMCO Funds or on behalf of the PIMCO Funds themselves against other defendants. By order dated November 3, 2005, the U.S. District Court for the District of Maryland granted the PIMCO Funds’ motion to dismiss claims asserted against it in a consolidated amended complaint where the PIMCO Funds were named, in the complaint, as a nominal defendant. The revenue sharing action in the District of Connecticut generally alleges that fund assets were inappropriately used to pay brokers to promote the PIMCO Funds and Allianz Funds, including directing fund brokerage transactions to such brokers, and that such alleged arrangements were not fully disclosed to shareholders. On August 11, 2005 the U.S. District Court for the District of Connecticut conducted a hearing on defendants’ motion to dismiss the consolidated amended complaint in the revenue sharing action but has not yet ruled on the motion to dismiss. The market timing and revenue sharing lawsuits seek, among other things, unspecified compensatory damages plus interest and, in some cases, punitive damages, the rescission of investment advisory contracts, the return of fees paid under those contracts and restitution.
Under Section 9(a) of the Investment Company Act of 1940, as amended (“1940 Act”), if the New Jersey Settlement or any of the lawsuits described above were to result in a court injunction against AGI, PEA, AGID and/or their affiliates, PIMCO could, in the absence of exemptive relief granted by the SEC, be barred from serving as an investment adviser, and AGID could be barred from serving as principal underwriter, to any registered investment company, including the Portfolios of the Trust. In connection with an inquiry from the SEC concerning the status of the New Jersey Settlement under Section 9(a), PEA, AGID, AGI and certain of their affiliates (including PIMCO) (together, the “Applicants”) have sought exemptive relief from the SEC under Section 9(c) of the 1940 Act. The SEC has granted the Applicants a temporary exemption from the provisions of Section 9(a) with respect to the New Jersey Settlement until the earlier of (i) September 13, 2006 and (ii) the date on which the SEC takes final action on their application for a permanent order. There is no assurance that the SEC will issue a permanent order.
Two nearly identical class action civil complaints have been filed in August 2005, in the Northern District of Illinois Eastern Division alleging that the plaintiffs each purchased and sold a 10-year Treasury note futures contract and suffered damages from an alleged shortage when PIMCO held both physical and futures positions in 10-year Treasury notes for its client accounts. The two actions have been consolidated into one action, and the two separate complaints have been replaced by a consolidated complaint. PIMCO is a named defendant, and the PIMCO Funds have been added as a defendant, to the consolidated action. PIMCO strongly believes the complaint (and any consolidated complaint filed hereafter) is without merit and intends to vigorously defend itself.
Certain Portfolios of the Trust were recently served in an adversary proceeding brought by the Official Committee of Asbestos Claimants of G-I Holdings, Inc. in G-I Holdings, Inc.’s bankruptcy in the District of New Jersey. PIMCO was previously named in this lawsuit and remains a defendant. The plaintiff seeks to recover for the bankruptcy estate assets that were transferred by the predecessor entity of G-I Holdings, Inc. to a wholly-owned subsidiary in 1994. The subsidiary has since issued notes, of which certain Portfolios of the Trust are alleged to be holders. The complaint alleges that in 2000, more than two hundred noteholders—including certain Portfolios of the Trust—were granted a second priority lien on the assets of the subsidiary in exchange for their consent to a refinancing transaction and the granting of a first priority lien to the lending banks. The plaintiff is seeking invalidation of the lien in favor of the noteholders and/or the value of the lien.
It is possible that these matters and/or other developments resulting from these matters could result in increased fund redemptions or other adverse consequences to the Portfolios. However, PIMCO and AGID believe that these matters are not likely to have a material adverse effect on the Portfolios or on PIMCO’s or AGID’s ability to perform their respective investment advisory or distribution services relating to the Portfolios.
| | | | | | |
| | | Semiannual Report | | June 30, 2006 | | 15 |
Investment Adviser and Administrator
Pacific Investment Management Company LLC
840 Newport Center Drive
Newport Beach, California 92660
Distributor
Allianz Global Investors Distributors LLC
2187 Atlantic Street
Stamford, Connecticut 06902
Custodian
State Street Bank & Trust Company
801 Pennsylvania
Kansas City, Missouri 64105
Transfer Agent
Boston Financial Data Services–Midwest
330 W. 9th Street
Kansas City, Missouri 64105
Legal Counsel
Dechert LLP
1775 I Street, N.W.
Washington, D.C. 20006
Independent Registered Public Accounting Firm
PricewaterhouseCoopers LLP
1055 Broadway
Kansas City, Missouri 64105
P I M C O

Share Class Administrative
Semiannual Report June 30, 2006
PIMCO Variable Insurance Trust
Total Return Portfolio
Table of Contents
This material is authorized for use only when preceded or accompanied by the current PIMCO Variable Insurance Trust (the “Trust”) prospectus. Investors should consider the investment objectives, risks, charges and expenses of this Trust carefully before investing. Ask your financial professional to explain all charges that may apply. This and other information is contained in the Trust’s prospectus. The variable product prospectus may be obtained by contacting your Investment Consultant. Please read the Trust and variable product prospectus carefully before you invest or send money.
Chairman’s Letter
Dear PIMCO Variable Insurance Trust Shareholder:
It is our pleasure to present to you the semiannual report for the PIMCO Variable Insurance Trust covering the six-month period ended June 30, 2006.
Highlights of the global bond markets during the six-month period included:
| | n | | Most fixed-income sectors lost ground during the first half of 2006, as concern about accelerating inflation and central bank tightening pushed interest rates higher worldwide. The benchmark Lehman Brothers Aggregate Bond Index (which includes Treasury, Investment-Grade Corporate, and Residential Mortgage-Backed Securities) returned -0.72% for the first six months of the year. On June 30, the benchmark ten-year Treasury yielded 5.14%, 0.75% higher than at the start of the year. The U.S. yield curve remained flat as shorter-maturity yields rose by a comparable amount. |
| | n | | The Federal Reserve tightened four times during the reporting period, bringing the Federal Funds Rate to 5.25%. The increase near the end of the period was the Federal Reserve’s 17th consecutive rate hike since the start of its tightening cycle in 2004. The Federal Reserve was not alone, as central banks in Europe, India, and China tightened credit in unison for the first time since 2000. The Bank of Japan, whose zero-interest-rate policy has flooded global markets with liquidity, looked set to reverse this policy in the coming months. |
In these pages please find a more complete Portfolio review as it relates to financial-market activities, as well as details about total-return investment performance for the six-month reporting period. Thank you for the trust you have placed in us. We will continue to work diligently to meet your investment needs.
Sincerely,
Brent R. Harris
Chairman, PIMCO Variable Insurance Trust
July 31, 2006
| | | | | | |
| | | Semiannual Report | | June 30, 2006 | | 1 |
Important Information About the Portfolio
PIMCO Variable Insurance Trust (the “Trust”) is an open-end management investment company currently consisting of nineteen separate investment portfolios, including the Total Return Portfolio (the “Portfolio”). The Portfolio is only available as a funding vehicle under variable life insurance policies or variable annuity contracts issued by insurance companies (“Variable Contracts”). Individuals may not purchase shares of the Portfolio directly. Shares of the Portfolio also may be sold to qualified pension and retirement plans outside of the separate account context.
We believe that bond funds have an important role to play in a well diversified investment portfolio. It is important to note, however, that in an environment where interest rates may trend upward, rising rates would negatively impact the performance of most bond funds, and fixed-income securities held by a fund are likely to decrease in value. The price volatility of fixed-income securities can also increase during periods of rising interest rates resulting in increased losses to a fund. Bond funds and individual bonds with a longer duration (a measure of the expected life of a security) tend to be more sensitive to changes in interest rates, usually making them more volatile than securities or funds with shorter durations. The longer-term performance of most bond funds has benefited from capital gains in part resulting from an extended period of declining interest rates. In the event interest rates increase, these capital gains should not be expected to recur.
The Portfolio may be subject to various risks in addition to those described above. Some of these risks may include, but are not limited to, the following: credit risk, high yield risk, market risk, issuer risk, liquidity risk, derivatives risk, mortgage risk, non-U.S. investment risk, currency risk, leveraging risk and management risk. A complete description of these risks is contained in the Portfolio’s prospectus. The Portfolio may use derivative instruments for hedging purposes or as part of an investment strategy. Use of these instruments may involve certain costs and risks such as liquidity risk, interest rate risk, market risk, credit risk, management risk and the risk that the Portfolio could not close out a position when it would be most advantageous to do so. A Portfolio investing in derivatives could lose more than the principal amount invested in these instruments. Investing in non-U.S. securities may entail risk due to non-U.S. economic and political developments; this risk may be increased when investing in emerging markets.
On the performance summary page in this Semiannual Report, the Total Return Investment Performance table measures performance assuming that all dividend and capital gain distributions were reinvested.
An investment in the Portfolio is not a deposit of a bank and is not guaranteed or insured by the Federal Deposit Insurance Corporation or any other government agency. It is possible to lose money on investments in the Portfolio.
PIMCO has adopted written proxy voting policies and procedures (“Proxy Policy”) as required by Rule 206(4)-6 under the Investment Advisers Act of 1940. The Proxy Policy has been adopted by the Trust as the policies and procedures that PIMCO will use when voting proxies on behalf of the Portfolio. Copies of the written Proxy Policy and the factors that PIMCO may consider in determining how to vote proxies for the Portfolio, and information about how the Portfolio voted proxies relating to portfolio securities held during the most recent twelve-month period ended June 30, are available without charge, upon request, by calling the Trust at 1-866-746-2606 and on the Securities and Exchange Commission’s (“SEC”) website at http://www.sec.gov.
The Portfolio files its complete schedule of portfolio holdings with the SEC for the first and third quarters of each fiscal year on Form N-Q. A copy of the Trust’s Form N-Q is available on the SEC’s website at http://www.sec.gov and may be reviewed and copied at the SEC’s Public Reference Room in Washington D.C. Information on the operation of the Public Reference Room may be obtained by calling 1-800-SEC-0330.
PIMCO Variable Insurance Trust is distributed by Allianz Global Investors Distributors LLC, 2187 Atlantic Street, Stamford, CT 06902.
| | | | |
| 2 | | PIMCO Variable Insurance Trust | | |
The following disclosure provides important information regarding the Portfolio’s Expense Example (“Example” or “Expense Example”), which appears in this Semiannual Report. Please refer to this information when reviewing the Expense Example for the Portfolio.
Example
As a shareholder of the Portfolio, you incur two types of costs: (1) transaction costs and (2) ongoing costs, including advisory and administrative fees; distribution and/or service (12b-1) fees (Administrative Class only); and other Portfolio expenses. The Example is intended to help you understand your ongoing costs (in dollars) of investing in the Portfolio and to compare these costs with the ongoing costs of investing in other mutual funds. The Expense Example does not reflect any fees or other expenses imposed by the Variable Contracts. If it did, the expenses reflected in the Expense Examples would be higher. The Example is based on an investment of $1,000 invested at the beginning of the period and held for the entire period indicated, which is from January 1, 2006 to June 30, 2006.
Actual Expenses
The information in the table under the heading “Actual Performance” provides information about actual account values and actual expenses. You may use the information in these columns, together with the amount you invested, to estimate the expenses that you paid over the period. Simply divide your account value by $1,000 (for example, an $8,600 account value divided by $1,000 = 8.60), then multiply the result by the number in the appropriate column for your share class, in the row titled “Expenses Paid During Period” to estimate the expenses you paid on your account during this period.
Hypothetical Example for Comparison Purposes
The information in the table under the heading “Hypothetical Performance (5% return before expenses)” provides information about hypothetical account values and hypothetical expenses based on the Portfolio’s actual expense ratio and an assumed rate of return of 5% per year before expenses, which is not the Portfolio’s actual return. The hypothetical account values and expenses may not be used to estimate the actual ending account balance or expenses you paid for the period. You may use this information to compare the ongoing costs of investing in the Portfolio and other portfolios. To do so, compare this 5% hypothetical example with the 5% hypothetical examples that appear in the shareholder reports of the other portfolios.
Please note that the expenses shown in the table are meant to highlight your ongoing costs only and do not reflect any transactional costs. Therefore, the information under the heading “Hypothetical Performance (5% return before expenses)” is useful in comparing ongoing costs only, and will not help you determine the relative total costs of owning different portfolios. In addition, if these transactional costs were included, your costs would have been higher.
The expense ratio may vary period to period because of various factors, such as an increase in expenses not covered by the advisory and administrative fees (such as expenses of the trustees and their counsel or litigation expense).
Portfolio Benchmark
Lehman Brothers Aggregate Bond Index represents securities that are taxable, and dollar denominated. The index covers the U.S. investment grade fixed rate bond market, with index components for government and corporate securities, mortgage pass-through securities, and asset-backed securities. These major sectors are subdivided into more specific indices that are calculated and reported on a regular basis. It is not possible to invest directly in this index.
| | | | | | |
| | | Semiannual Report | | June 30, 2006 | | 3 |
| | | | |
| | |
| PIMCO Total Return Portfolio | | | | |
| | | | |
Cumulative Returns Through June 30, 2006
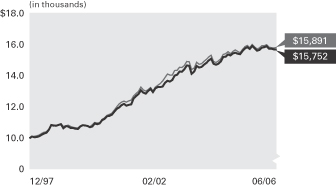
Total Return
Portfolio Lehman Brothers
Administrative Aggregate Bond
Class Index
------------- --------------
12/31/1997 $10,000 $10,000
01/31/1998 10,102 10,128
02/28/1998 10,059 10,120
03/31/1998 10,081 10,156
04/30/1998 10,124 10,209
05/31/1998 10,222 10,305
06/30/1998 10,302 10,393
07/31/1998 10,355 10,415
08/31/1998 10,546 10,584
09/30/1998 10,861 10,832
10/31/1998 10,820 10,775
11/30/1998 10,806 10,836
12/31/1998 10,861 10,869
01/31/1999 10,907 10,946
02/28/1999 10,641 10,755
03/31/1999 10,769 10,815
04/30/1999 10,754 10,849
05/31/1999 10,660 10,754
06/30/1999 10,668 10,720
07/31/1999 10,611 10,674
08/31/1999 10,596 10,669
09/30/1999 10,755 10,793
10/31/1999 10,843 10,832
11/30/1999 10,829 10,832
12/31/1999 10,798 10,779
01/31/2000 10,713 10,744
02/29/2000 10,756 10,874
03/31/2000 10,959 11,017
04/30/2000 10,909 10,986
05/31/2000 10,959 10,981
06/30/2000 11,161 11,209
07/31/2000 11,250 11,311
08/31/2000 11,419 11,475
09/30/2000 11,451 11,547
10/31/2000 11,520 11,623
11/30/2000 11,727 11,813
12/31/2000 11,895 12,033
01/31/2001 11,999 12,229
02/28/2001 12,139 12,336
03/31/2001 12,224 12,398
04/30/2001 12,104 12,346
05/31/2001 12,160 12,421
06/30/2001 12,200 12,468
07/31/2001 12,589 12,746
08/31/2001 12,733 12,892
09/30/2001 12,861 13,043
10/31/2001 13,108 13,316
11/30/2001 12,950 13,132
12/31/2001 12,891 13,049
01/31/2002 13,052 13,154
02/28/2002 13,197 13,282
03/31/2002 12,995 13,061
04/30/2002 13,234 13,314
05/31/2002 13,317 13,427
06/30/2002 13,319 13,543
07/31/2002 13,350 13,707
08/31/2002 13,596 13,938
09/30/2002 13,715 14,164
10/31/2002 13,666 14,099
11/30/2002 13,767 14,096
12/31/2002 14,059 14,387
01/31/2003 14,117 14,399
02/28/2003 14,317 14,598
03/31/2003 14,314 14,587
04/30/2003 14,468 14,707
05/31/2003 14,716 14,982
06/30/2003 14,691 14,952
07/31/2003 14,176 14,449
08/31/2003 14,320 14,545
09/30/2003 14,688 14,930
10/31/2003 14,582 14,791
11/30/2003 14,611 14,826
12/31/2003 14,768 14,977
01/31/2004 14,876 15,098
02/29/2004 15,038 15,261
03/31/2004 15,161 15,375
04/30/2004 14,826 14,975
05/31/2004 14,761 14,915
06/30/2004 14,825 15,000
07/31/2004 14,980 15,148
08/31/2004 15,263 15,437
09/30/2004 15,284 15,479
10/31/2004 15,439 15,609
11/30/2004 15,363 15,484
12/31/2004 15,490 15,627
01/31/2005 15,547 15,725
02/28/2005 15,482 15,632
03/31/2005 15,442 15,552
04/30/2005 15,663 15,762
05/31/2005 15,829 15,933
06/30/2005 15,906 16,020
07/31/2005 15,790 15,874
08/31/2005 15,987 16,078
09/30/2005 15,831 15,912
10/31/2005 15,668 15,786
11/30/2005 15,722 15,856
12/31/2005 15,869 16,006
01/31/2006 15,907 16,007
02/28/2006 15,974 16,061
03/31/2006 15,799 15,903
04/30/2006 15,807 15,874
05/31/2006 15,753 15,857
06/30/2006 15,752 15,891
$10,000 invested at the beginning of the first full month following the inception date of the Portfolio’s Administrative Class.
Sector Breakdown‡
| | |
U.S. Government Agencies | | 44.8% |
Short-Term Instruments | | 42.3% |
Corporate Bonds & Notes | | 4.6% |
Mortgage-Backed Securities | | 3.2% |
Other | | 5.1% |
| | ‡ | % of Total Investments as of June 30, 2006 |
| | | | | | | | | | | | |
| Average Annual Total Return for the period ended June 30, 2006 |
| | | | | | | 6 Months* | | 1 Year | | 5 Years | | Since
Inception
(12/31/97) |
| | |
| | PIMCO Total Return Portfolio Administrative Class | | -0.74% | | -0.97% | | 5.24% | | 5.49% |
| | |
| | Lehman Brothers Aggregate Bond Index | | -0.72% | | -0.81% | | 4.97% | | 5.60% |
All Portfolio returns are net of fees and expenses.
* Cumulative return.
Past performance is no guarantee of future results. The performance quoted represents past performance. Investment return and principal value will fluctuate so the Portfolio shares, when redeemed, may be worth more or less than their original cost. The Portfolio’s performance does not reflect the deduction of additional charges and expenses imposed in connection with investing in Variable Contracts, which will reduce returns. Current performance may be lower or higher than the performance data quoted. Performance data current to the most recent month-end is available by calling (800) 927-4648.
| | | | | | | | | | |
| Expense Example | | | | Actual Performance | | | | Hypothetical Performance |
| | | | | | | | | (5% return before expenses) |
Beginning Account Value (01/01/06) | | | | $ | 1,000.00 | | | | $ | 1,000.00 |
Ending Account Value (06/30/06) | | | | $ | 992.60 | | | | $ | 1,021.57 |
Expenses Paid During Period† | | | | $ | 3.21 | | | | $ | 3.26 |
† Expenses are equal to the Portfolio’s Administrative Class annualized expense ratio of 0.65%, multiplied by the average account value over the period, multiplied by 181/365 (to reflect the one-half year period). Overall fees and expenses of investing in the Portfolio will be higher because the example does not reflect Variable Contract fees and expenses.
Please refer to page 3 herein for a description of the Portfolio’s benchmark and an explanation of the information presented in the above Expense Example.
Portfolio Insights
| » | | The PIMCO Total Return Portfolio seeks to achieve its investment objective by investing under normal circumstances at least 65% of its total assets in a diversified portfolio of Fixed-Income Instruments of varying maturities. |
| » | | The Portfolio’s above-benchmark duration detracted from returns as yields rose in the first half of the year. |
| » | | An emphasis on short-term maturities detracted from performance as short-term yields rose more than longer-dated yields. The Federal Reserve continued with its tightening policy, sending short-term rates higher while intermediate- and longer-term rates shifted higher. |
| » | | An overweight to mortgages contributed to returns as this sector outperformed like-duration Treasuries. |
| » | | An underweight to corporate securities detracted from returns as this sector outperformed like-duration Treasuries. |
| » | | Strategies designed to benefit when Euroland bonds underperform Treasuries added to returns as European yields increased more than yields in the U.S. |
| » | | An allocation to the Yen and the Euro was positive for returns, as both currencies appreciated relative to the dollar. |
| » | | Emerging Market bonds added to performance, as strong demand for their attractive yields and improving credit fundamentals caused yield premiums to decline. |
| » | | A tactical allocation to municipal bonds was positive for performance as municipal yields rose less than Treasury yields. |
| | | | |
| 4 | | PIMCO Variable Insurance Trust | | |
| | |
| |
| Financial Highlights Total Return Portfolio | | |
| | | | | | | | | | | | | | | | | | | | | | | | |
| Selected Per Share Data for the Year or Period Ended: | | 06/30/2006+ | | | 12/31/2005 | | | 12/31/2004 | | | 12/31/2003 | | | 12/31/2002 | | | 12/31/2001 | |
| | | | | | |
Administrative Class | | | | | | | | | | | | | | | | | | | | | | | | |
| Net asset value beginning of period | | $ | 10.24 | | | $ | 10.51 | | | $ | 10.36 | | | $ | 10.23 | | | $ | 9.89 | | | $ | 9.77 | |
| Net investment income (a) | | | 0.21 | | | | 0.35 | | | | 0.19 | | | | 0.25 | | | | 0.41 | | | | 0.45 | |
| Net realized/unrealized gain (loss) on investments (a) | | | (0.28 | ) | | | (0.09 | ) | | | 0.31 | | | | 0.26 | | | | 0.47 | | | | 0.35 | |
| Total income (loss) from investment operations | | | (0.07 | ) | | | 0.26 | | | | 0.50 | | | | 0.51 | | | | 0.88 | | | | 0.80 | |
| Dividends from net investment income | | | (0.22 | ) | | | (0.36 | ) | | | (0.20 | ) | | | (0.30 | ) | | | (0.41 | ) | | | (0.49 | ) |
| Distributions from net realized capital gains | | | 0.00 | | | | (0.17 | ) | | | (0.15 | ) | | | (0.08 | ) | | | (0.13 | ) | | | (0.19 | ) |
| Total distributions | | | (0.22 | ) | | | (0.53 | ) | | | (0.35 | ) | | | (0.38 | ) | | | (0.54 | ) | | | (0.68 | ) |
| Net asset value end of period | | $ | 9.95 | | | $ | 10.24 | | | $ | 10.51 | | | $ | 10.36 | | | $ | 10.23 | | | $ | 9.89 | |
| Total return | | | (0.74 | )% | | | 2.45 | % | | | 4.89 | % | | | 5.04 | % | | | 9.07 | % | | | 8.37 | % |
| Net assets end of period (000s) | | $ | 2,812,124 | | | $ | 2,704,383 | | | $ | 2,352,679 | | | $ | 1,908,336 | | | $ | 1,161,299 | | | $ | 332,823 | |
| Ratio of expenses to average net assets | | | 0.65 | %* | | | 0.65 | % | | | 0.65 | % | | | 0.65 | % | | | 0.65 | %(b) | | | 0.65 | %(b) |
| Ratio of net investment income to average net assets | | | 4.20 | %* | | | 3.38 | % | | | 1.79 | % | | | 2.45 | % | | | 4.07 | % | | | 4.55 | % |
| Portfolio turnover rate | | | 168 | % | | | 344 | % | | | 373 | % | | | 193 | % | | | 222 | % | | | 217 | % |
+ Unaudited
* Annualized
(a) Per share amounts based on average number of shares outstanding during the period.
(b) If the investment manager had not reimbursed expenses, the ratio of expenses to average net assets would have been 0.66%.
| | | | | | |
| See Accompanying Notes | | Semiannual Report | | June 30, 2006 | | 5 |
| | |
| |
| Statement of Assets and Liabilities Total Return Portfolio | | |
| | | | |
| (Amounts in thousands, except per share amounts) | | June 30, 2006
(Unaudited) | |
| |
Assets: | | | | |
Investments, at value | | $ | 3,407,611 | |
Cash | | | 61 | |
Foreign currency, at value | | | 81,813 | |
Receivable for investments sold | | | 15,669 | |
Receivable for investments sold on delayed-delivery basis | | | 919 | |
Receivable for Portfolio shares sold | | | 23,363 | |
Interest and dividends receivable | | | 9,921 | |
Variation margin receivable | | | 2,016 | |
Swap premiums paid | | | 731 | |
Unrealized appreciation on forward foreign currency contracts | | | 1,600 | |
Unrealized appreciation on swap agreements | | | 941 | |
| | | | 3,544,645 | |
| |
Liabilities: | | | | |
Payable for investments purchased | | $ | 539,396 | |
Payable for Portfolio shares redeemed | | | 2,491 | |
Written options outstanding | | | 12,179 | |
Dividends payable | | | 1,607 | |
Accrued investment advisory fee | | | 644 | |
Accrued administration fee | | | 644 | |
Accrued servicing fee | | | 330 | |
Swap premiums received | | | 3,127 | |
Unrealized depreciation on forward foreign currency contracts | | | 12,289 | |
Unrealized depreciation on swap agreements | | | 1,949 | |
| | | | 574,656 | |
| |
Net Assets | | $ | 2,969,989 | |
| |
Net Assets Consist of: | | | | |
Paid in capital | | $ | 3,062,923 | |
Undistributed net investment income | | | 14,505 | |
Accumulated undistributed net realized (loss) | | | (34,688 | ) |
Net unrealized (depreciation) | | | (72,751 | ) |
| | | $ | 2,969,989 | |
| |
Net Assets: | | | | |
Institutional Class | | $ | 153,328 | |
Administrative Class | | | 2,812,124 | |
Advisor Class | | | 4,537 | |
| |
Shares Issued and Outstanding: | | | | |
Institutional Class | | | 15,415 | |
Administrative Class | | | 282,722 | |
Advisor Class | | | 456 | |
| |
Net Asset Value and Redemption Price Per Share (Net Assets Per Share Outstanding) | | | | |
Institutional Class | | $ | 9.95 | |
Administrative Class | | | 9.95 | |
Advisor Class | | | 9.95 | |
| |
Cost of Investments Owned | | $ | 3,442,782 | |
Cost of Foreign Currency Held | | $ | 80,689 | |
Premiums Received on Written Options | | $ | 9,947 | |
| | | | |
| 6 | | PIMCO Variable Insurance Trust | | See Accompanying Notes |
| | |
| |
| Statement of Operations Total Return Portfolio | | |
| | | | |
| (Amounts in Thousands) | | Six Months Ended
June 30, 2006
(Unaudited) | |
| |
Investment Income: | | | | |
Interest | | $ | 69,794 | |
Dividends | | | 409 | |
Miscellaneous income | | | 28 | |
Total Income | | | 70,231 | |
| |
Expenses: | | | | |
Investment advisory fees | | | 3,619 | |
Administration fees | | | 3,619 | |
Servicing fees – Administrative Class | | | 2,060 | |
Distribution and/or serving fees – Advisor Class | | | 1 | |
Trustees’ fees | | | 17 | |
Total Expenses | | | 9,316 | |
| |
Net Investment Income | | | 60,915 | |
| |
Net Realized and Unrealized Gain (Loss): | | | | |
Net realized (loss) on investments | | | (10,853 | ) |
Net realized (loss) on futures contracts, options and swaps | | | (5,390 | ) |
Net realized (loss) on foreign currency transactions | | | (2,076 | ) |
Net change in unrealized (depreciation) on investments | | | (42,712 | ) |
Net change in unrealized (depreciation) on futures contracts, options and swaps | | | (30,889 | ) |
Net change in unrealized appreciation on translation of assets and liabilities denominated in foreign currencies | | | 7,617 | |
Net (Loss) | | | (84,303 | ) |
| |
Net (Decrease) in Net Assets Resulting from Operations | | $ | (23,388 | ) |
| | | | | | |
| See Accompanying Notes | | Semiannual Report | | June 30, 2006 | | 7 |
| | |
| |
| Statements of Changes in Net Assets Total Return Portfolio | | |
| | | | | | | | |
| (Amounts in Thousands) | | Six Months Ended June 30, 2006
(Unaudited) | | | Year Ended
December 31, 2005 | |
| | |
Increase (Decrease) in Net Assets from: | | | | | | | | |
| | |
Operations: | | | | | | | | |
Net investment income | | $ | 60,915 | | | $ | 89,824 | |
Net realized gain (loss) | | | (18,319 | ) | | | 3,530 | |
Net change in unrealized (depreciation) | | | (65,984 | ) | | | (30,402 | ) |
Net increase (decrease) resulting from operations | | | (23,388 | ) | | | 62,952 | |
| | |
Distributions to Shareholders: | | | | | | | | |
| From net investment income | | | | | | | | |
Institutional Class | | | (3,281 | ) | | | (4,842 | ) |
Administrative Class | | | (58,991 | ) | | | (86,714 | ) |
Advisor Class | | | (15 | ) | | | 0 | |
| From net realized capital gains | | | | | | | | |
Institutional Class | | | 0 | | | | (2,255 | ) |
Administrative Class | | | 0 | | | | (42,750 | ) |
Advisor Class | | | 0 | | | | 0 | |
| | |
Total Distributions | | | (62,287 | ) | | | (136,561 | ) |
| | |
Portfolio Share Transactions: | | | | | | | | |
| Receipts for shares sold | | | | | | | | |
Institutional Class | | | 37,370 | | | | 43,745 | |
Administrative Class | | | 384,517 | | | | 630,483 | |
Advisor Class | | | 4,550 | | | | 0 | |
| Issued in reorganization | | | | | | | | |
Institutional Class | | | 0 | | | | 88,822 | |
Administrative Class | | | 0 | | | | 0 | |
Advisor Class | | | 0 | | | | 0 | |
| Issued as reinvestment of distributions | | | | | | | | |
Institutional Class | | | 3,281 | | | | 7,097 | |
Administrative Class | | | 50,219 | | | | 110,757 | |
Advisor Class | | | 15 | | | | 0 | |
| Cost of shares redeemed | | | | | | | | |
Institutional Class | | | (26,672 | ) | | | (55,888 | ) |
Administrative Class | | | (245,706 | ) | | | (319,629 | ) |
Advisor Class | | | (13 | ) | | | 0 | |
Net increase resulting from Portfolio share transactions | | | 207,561 | | | | 505,387 | |
| | |
Total Increase in Net Assets | | | 121,886 | | | | 431,778 | |
| | |
Net Assets: | | | | | | | | |
Beginning of period | | | 2,848,103 | | | | 2,416,325 | |
End of period* | | $ | 2,969,989 | | | $ | 2,848,103 | |
| | |
*Including undistributed net investment income of: | | $ | 14,505 | | | $ | 15,877 | |
| | | | |
| 8 | | PIMCO Variable Insurance Trust | | See Accompanying Notes |
| | |
| |
| Schedule of Investments Total Return Portfolio | | June 30, 2006 (Unaudited) |
| | | | |
| | | PRINCIPAL | | |
| | | AMOUNT | | VALUE |
| | | (000S) | | (000S) |
| | | | | |
| | | | | | | | |
| BANK LOAN OBLIGATIONS 0.1% |
| Cablevision Systems Corp. | | | | | | | | |
6.670% due 02/24/2013 | | $ | | 7 | | $ | | 6 |
6.740% due 02/24/2013 | | | | 743 | | | | 740 |
|
| CSC Holdings, Inc. | | | | | | | | |
6.880% due 02/24/2013 | | | | 743 | | | | 740 |
6.988% due 02/24/2013 | | | | 1,108 | | | | 1,104 |
| | | | | | | | |
|
Total Bank Loan Obligations
(Cost $2,600) | | | | 2,590 |
| | | | | | | | |
|
| |
| CORPORATE BONDS & NOTES 5.3% |
| |
| BANKING & FINANCE 3.3% | | | | | | | | |
| American General Finance Corp. |
5.489% due 03/23/2007 | | | | 1,600 | | | | 1,601 |
|
| American International Group, Inc. |
5.050% due 10/01/2015 | | | | 1,300 | | | | 1,215 |
|
| Atlantic & Western Re Ltd. |
10.990% due 01/09/2007 | | | | 600 | | | | 591 |
|
| China Development Bank |
5.000% due 10/15/2015 | | | | 900 | | | | 842 |
|
| CIT Group Holdings, Inc. |
5.276% due 01/30/2009 | | | | 6,400 | | | | 6,417 |
|
| Citigroup, Inc. |
5.520% due 12/26/2008 | | | | 8,200 | | | | 8,208 |
|
| Export-Import Bank of China |
4.875% due 07/21/2015 | | | | 900 | | | | 836 |
|
| Export-Import Bank of Korea |
4.125% due 02/10/2009 | | | | 140 | | | | 134 |
|
| Ford Motor Credit Co. |
6.374% due 03/21/2007 | | | | 900 | | | | 897 |
|
| General Electric Capital Corp. |
5.050% due 01/03/2008 | | | | 14,360 | | | | 14,385 |
|
| Goldman Sachs Group, Inc. |
5.250% due 11/10/2008 | | | | 7,100 | | | | 7,108 |
|
| HBOS PLC |
5.920% due 09/29/2049 | | | | 1,100 | | | | 1,015 |
|
| HSBC Bank USA N.A. |
5.494% due 09/21/2007 | | | | 14,500 | | | | 14,517 |
|
| Morgan Stanley |
5.276% due 02/09/2009 | | | | 14,600 | | | | 14,627 |
|
| MUFG Capital Finance 1 Ltd. |
6.346% due 07/29/2049 | | | | 700 | | | | 676 |
|
| Petroleum Export Ltd. |
5.265% due 06/15/2011 | | | | 956 | | | | 928 |
|
| Phoenix Quake Ltd. |
7.440% due 07/03/2008 | | | | 800 | | | | 811 |
|
| Phoenix Quake Wind II Ltd. |
8.490% due 07/03/2008 | | | | 400 | | | | 364 |
|
| Phoenix Quake Wind Ltd. |
7.440% due 07/03/2008 | | | | 800 | | | | 808 |
|
| Premium Asset Trust |
5.645% due 09/08/2007 | | | | 100 | | | | 100 |
|
| Resona Bank Ltd. |
5.850% due 09/29/2049 | | | | 1,200 | | | | 1,118 |
|
| Royal Bank of Scotland PLC |
5.125% due 07/21/2008 | | | | 6,400 | | | | 6,405 |
|
| UFJ Finance Aruba AEC |
6.750% due 07/15/2013 | | | | 300 | | | | 313 |
|
| USB Capital IX |
6.189% due 04/15/2042 | | | | 900 | | | | 881 |
| | | | | | | | |
| Vita Capital Ltd. |
6.340% due 01/01/2007 | | $ | | 500 | | $ | | 502 |
|
| Wachovia Bank N.A. |
5.480% due 06/27/2008 | | | | 6,300 | | | | 6,302 |
5.489% due 03/23/2009 | | | | 7,100 | | | | 7,100 |
| | | | | | | | |
|
| | | | | | | | | 98,701 |
| | | | | | | | |
|
| |
| INDUSTRIALS 1.1% | | | | | | | | |
| DaimlerChrysler N.A. Holding Corp. |
6.160% due 08/08/2006 | | | | 900 | | | | 900 |
|
| El Paso Corp. |
6.750% due 05/15/2009 | | | | 6,000 | | | | 5,955 |
9.625% due 05/15/2012 | | | | 800 | | | | 878 |
7.875% due 06/15/2012 | | | | 5,800 | | | | 5,931 |
7.800% due 08/01/2031 | | | | 1,500 | | | | 1,464 |
|
| HJ Heinz Co. |
6.428% due 12/01/2008 | | | | 1,100 | | | | 1,118 |
|
| Morgan Stanley Bank AG for OAO Gazprom |
9.625% due 03/01/2013 | | | | 100 | | | | 115 |
|
| Pemex Project Funding Master Trust |
8.000% due 11/15/2011 | | | | 100 | | | | 106 |
5.750% due 12/15/2015 | | | | 2,300 | | | | 2,121 |
8.625% due 02/01/2022 | | | | 1,200 | | | | 1,345 |
9.500% due 09/15/2027 | | | | 55 | | | | 66 |
|
| United Airlines, Inc. |
8.030% due 07/01/2011 (b) | | | | 465 | | | | 475 |
6.071% due 03/01/2013 | | | | 5,423 | | | | 5,413 |
|
| Viacom, Inc. |
5.750% due 04/30/2011 | | | | 1,000 | | | | 983 |
|
| Williams Cos., Inc. |
6.375% due 10/01/2010 | | | | 7,000 | | | | 6,860 |
| | | | | | | | |
|
| | | | | | | | | 33,730 |
| | | | | | | | |
|
| |
| UTILITIES 0.9% | | | | | | | | |
| AT&T, Inc. |
4.214% due 06/05/2007 | | | | 8,600 | | | | 8,504 |
|
| Entergy Gulf States, Inc. |
6.000% due 12/01/2012 | | | | 6,500 | | | | 6,399 |
5.700% due 06/01/2015 | | | | 8,300 | | | | 7,822 |
|
| Korea Electric Power Corp. |
5.125% due 04/23/2034 | | | | 90 | | | | 86 |
|
| Qwest Capital Funding, Inc. |
7.250% due 02/15/2011 | | | | 657 | | | | 642 |
|
| Ras Laffan LNG III |
5.838% due 09/30/2027 | | | | 2,600 | | | | 2,428 |
|
| TPSA Finance BV |
7.750% due 12/10/2008 | | | | 120 | | | | 125 |
| | | | | | | | |
|
| | | | | | | | | 26,006 |
| | | | | | | | |
|
Total Corporate Bonds & Notes (Cost $157,270) | | | | | | | | 158,437 |
| | | | | | | | |
|
| |
| MUNICIPAL BONDS & NOTES 1.8% |
| Arizona State Salt River Project Agricultural Improvement and Power District Revenue Bonds, Series 2005 |
5.800% due 01/01/2035 | | | | 95 | | | | 91 |
|
| Badger, Wisconsin Tobacco Asset Securitization Corporations Revenue Notes, Series 2002 |
6.000% due 06/01/2017 | | | | 3,700 | | | | 3,906 |
|
| Chicago, Illinois General Obligation Bonds, (MBIA Insured), Series 2003 |
5.000% due 01/01/2035 | | | | 10,000 | | | | 10,125 |
| | | | | | | | |
| Golden State, California Tobacco Securitization Corporations Revenue Bonds, Series 2003 |
6.250% due 06/01/2033 | | $ | | 2,900 | | $ | | 3,162 |
|
| Iowa State Tobacco Settlement Authority Revenue Notes, Series 2005 |
6.500% due 06/01/2023 | | | | 1,185 | | | | 1,166 |
|
| New Jersey State Tobacco Settlement Financing Corporations Revenue Bonds, Series 2002 |
6.000% due 06/01/2037 | | | | 1,530 | | | | 1,611 |
|
| New Jersey State Tobacco Settlement Financing Corporations Revenue Bonds, Series 2003 |
6.750% due 06/01/2039 | | | | 5,450 | | | | 6,061 |
|
| New Jersey State Tobacco Settlement Financing Corporations Revenue Notes, Series 2003 |
4.375% due 06/01/2019 | | | | 3,115 | | | | 3,110 |
|
| New York City, New York General Obligation Notes, Series 2005 |
5.000% due 03/01/2030 | | | | 1,500 | | | | 1,521 |
|
| New York City, New York Municipal Finance Authority Water & Sewer Revenue Bonds, Series 2006-C |
4.750% due 06/15/2033 | | | | 17,400 | | | | 17,037 |
|
| New York State Environmental Facilities Corporations Revenue Notes, Series 2002 |
5.980% due 06/15/2023 | | | | 850 | | | | 914 |
|
| Texas State General Obligation Bonds, Series 2005 |
4.750% due 04/01/2035 | | | | 3,600 | | | | 3,495 |
| | | | | | | | |
|
Total Municipal Bonds & Notes
(Cost $50,324) | | | | 52,199 |
| | | | | | | | |
|
| |
| U.S. GOVERNMENT AGENCIES 51.5% |
| Fannie Mae |
2.500% due 06/15/2008 | | | | 2,480 | | | | 2,346 |
4.000% due 10/01/2018 | | | | 474 | | | | 439 |
4.500% due 08/17/2021 - 04/01/2035 (d) | | | | 2,240 | | | | 2,068 |
4.685% due 05/25/2035 | | | | 1,300 | | | | 1,260 |
4.712% due 04/01/2035 | | | | 3,351 | | | | 3,284 |
4.752% due 04/01/2035 | | | | 4,995 | | | | 4,865 |
4.933% due 11/01/2035 | | | | 363 | | | | 364 |
4.982% due 10/01/2032 | | | | 1,876 | | | | 1,879 |
5.000% due 01/01/2018 - 07/13/2036 (d) | | | | 257,949 | | | | 243,480 |
5.249% due 11/28/2035 | | | | 302 | | | | 302 |
5.312% due 09/22/2006 | | | | 10,300 | | | | 10,299 |
5.411% due 09/01/2040 | | | | 107 | | | | 108 |
5.500% due 04/01/2014 - 07/13/2036 (d) | | | | 1,175,621 | | | | 1,131,558 |
5.672% due 03/25/2044 | | | | 8,393 | | | | 8,404 |
5.695% due 09/01/2034 | | | | 3,155 | | | | 3,140 |
5.702% due 11/01/2025 | | | | 3 | | | | 3 |
5.707% due 09/01/2039 | | | | 118 | | | | 121 |
5.736% due 12/01/2036 | | | | 3,099 | | | | 3,083 |
6.000% due 04/01/2016 - 08/14/2036 (d) | | | | 30,736 | | | | 30,440 |
6.500% due 06/01/2029 - 04/01/2032 (d) | | | | 418 | | | | 422 |
7.000% due 04/25/2023 - 06/01/2032 (d) | | | | 4,202 | | | | 4,319 |
|
| Federal Home Loan Bank |
4.200% due 02/05/2007 | | | | 2,000 | | | | 1,925 |
|
| Federal Housing Administration |
7.430% due 01/25/2023 | | | | 55 | | | | 55 |
| | | | | | |
| See Accompanying Notes | | Semiannual Report | | June 30, 2006 | | 9 |
| | |
| |
| Schedule of Investments Total Return Portfolio (Cont.) | | |
| | | | |
| | | PRINCIPAL | | |
| | | AMOUNT | | VALUE |
| | | (000S) | | (000S) |
| | | | | |
| | | | | | | | |
| Freddie Mac |
4.500% due 04/01/2018 - 10/01/2018 (d) | | $ | | 2,653 | | $ | | 2,511 |
5.000% due 04/01/2018 - 09/01/2035 (d) | | | | 9,788 | | | | 9,345 |
5.211% due 02/25/2045 | | | | 1,453 | | | | 1,442 |
5.500% due 04/01/2033 - 07/13/2036 (d) | | | | 38,066 | | | | 36,573 |
5.649% due 11/15/2030 | | | | 41 | | | | 41 |
5.699% due 09/15/2030 | | | | 38 | | | | 38 |
5.957% due 01/01/2028 | | | | 3 | | | | 4 |
6.000% due 07/01/2016 - 11/01/2033 (d) | | | | 7,206 | | | | 7,141 |
6.045% due 07/01/2030 | | | | 3 | | | | 3 |
6.099% due 07/01/2027 | | | | 3 | | | | 3 |
6.500% due 03/01/2013 - 03/01/2034 (d) | | | | 1,156 | | | | 1,170 |
7.000% due 06/15/2023 | | | | 2,262 | | | | 2,327 |
7.500% due 07/15/2030 - 03/01/2032 (d) | | | | 359 | | | | 371 |
8.500% due 08/01/2024 | | | | 20 | | | | 21 |
|
| Government National Mortgage Association |
4.375% due 04/20/2026 - 05/20/2030 (d) | | | | 156 | | | | 156 |
4.500% due 07/20/2030 | | | | 22 | | | | 22 |
4.750% due 02/20/2032 | | | | 1,359 | | | | 1,350 |
5.125% due 10/20/2029 - 11/20/2029 (d) | | | | 425 | | | | 428 |
5.375% due 02/20/2027 | | | | 7 | | | | 7 |
5.500% due 04/15/2033 - 09/15/2033 (d) | | | | 670 | | | | 650 |
5.667% due 06/20/2030 | | | | 3 | | | | 3 |
5.767% due 09/20/2030 | | | | 33 | | | | 34 |
6.500% due 03/15/2031 - 04/15/2032 (d) | | | | 318 | | | | 322 |
|
| Small Business Administration |
6.030% due 02/10/2012 | | | | 7,101 | | | | 7,178 |
6.344% due 08/01/2011 | | | | 880 | | | | 897 |
7.449% due 08/01/2010 | | | | 15 | | | | 15 |
8.017% due 02/10/2010 | | | | 101 | | | | 106 |
|
| Small Business Administration Participation Certificates |
5.130% due 09/01/2023 | | | | 85 | | | | 82 |
6.290% due 01/01/2021 | | | | 237 | | | | 242 |
7.500% due 04/01/2017 | | | | 1,310 | | | | 1,360 |
| | | | | | | | |
|
Total U.S. Government Agencies (Cost $1,575,938) | | | | 1,528,006 |
| | | | | | | | |
|
| |
| U.S. TREASURY OBLIGATIONS 1.1% |
| Treasury Inflation Protected Securities (c) |
3.375% due 01/15/2007 (f) | | | | 509 | | | | 511 |
2.375% due 01/15/2025 | | | | 15,396 | | | | 14,989 |
2.000% due 01/15/2026 | | | | 16,348 | | | | 14,972 |
3.625% due 04/15/2028 | | | | 2,492 | | | | 2,958 |
| | | | | | | | |
|
Total U.S. Treasury Obligations
(Cost $36,126) | | | | 33,430 |
| | | | | | | | |
|
| |
| MORTGAGE-BACKED SECURITIES 3.7% |
| American Home Mortgage Investment Trust |
4.390% due 02/25/2045 | | | | 4,785 | | | | 4,618 |
|
| Banc of America Commercial Mortgage, Inc. |
4.875% due 06/10/2039 | | | | 590 | | | | 574 |
4.128% due 07/10/2042 | | | | 395 | | | | 378 |
|
| Banc of America Funding Corp. |
4.116% due 05/25/2035 | | | | 5,662 | | | | 5,459 |
|
| Banc of America Mortgage Securities |
6.500% due 10/25/2031 | | | | 1,847 | | | | 1,860 |
5.403% due 10/20/2032 | | | | 245 | | | | 245 |
6.500% due 09/25/2033 | | | | 632 | | | | 630 |
| | | | | | | | |
| Bear Stearns Adjustable Rate Mortgage Trust |
5.546% due 11/25/2030 | | $ | | 14 | | $ | | 14 |
5.340% due 02/25/2033 | | | | 504 | | | | 503 |
5.621% due 02/25/2033 | | | | 330 | | | | 326 |
5.062% due 04/25/2033 | | | | 1,568 | | | | 1,552 |
4.812% due 01/25/2034 | | | | 3,826 | | | | 3,754 |
4.750% due 10/25/2035 | | | | 23,957 | | | | 23,515 |
|
| Bear Stearns Alt-A Trust |
5.448% due 05/25/2035 | | | | 9,122 | | | | 9,018 |
|
| Citigroup Mortgage Loan Trust, Inc. |
4.700% due 12/25/2035 | | | | 1,998 | | | | 1,959 |
|
| Countrywide Alternative Loan Trust |
4.673% due 08/25/2034 | | | | 350 | | | | 347 |
|
| Countrywide Home Loan Mortgage Pass-Through Trust |
5.592% due 05/25/2034 | | | | 1,435 | | | | 1,433 |
5.250% due 02/20/2036 | | | | 2,404 | | | | 2,358 |
|
| CS First Boston Mortgage Securities Corp. |
6.257% due 06/25/2032 | | | | 197 | | | | 197 |
5.672% due 10/25/2032 | | | | 112 | | | | 112 |
|
| First Nationwide Trust |
6.750% due 08/21/2031 | | | | 121 | | | | 121 |
|
| Greenwich Capital Commercial Funding Corp. |
5.317% due 06/10/2036 | | | | 915 | | | | 884 |
|
| GS Mortgage Securities Corp. II |
5.396% due 08/10/2038 | | | | 905 | | | | 876 |
|
| GSR Mortgage Loan Trust |
4.541% due 09/25/2035 | | | | 24,774 | | | | 24,118 |
|
| Impac CMB Trust |
5.572% due 04/25/2034 | | | | 1,587 | | | | 1,588 |
|
| Indymac ARM Trust |
6.648% due 01/25/2032 | | | | 13 | | | | 13 |
|
| Merrill Lynch Mortgage Trust |
4.353% due 02/12/2042 | | | | 515 | | | | 498 |
|
| Morgan Stanley Capital I |
4.050% due 01/13/2041 | | | | 530 | | | | 503 |
|
| Prime Mortgage Trust |
5.722% due 02/25/2019 | | | | 327 | | | | 328 |
5.722% due 02/25/2034 | | | | 1,430 | | | | 1,435 |
|
| Residential Funding Mortgage Security I |
6.500% due 03/25/2032 | | | | 1,679 | | | | 1,672 |
|
| Structured Asset Mortgage Investments, Inc. |
5.582% due 09/19/2032 | | | | 361 | | | | 362 |
|
| Structured Asset Securities Corp. |
6.103% due 02/25/2032 | | | | 35 | | | | 35 |
6.150% due 07/25/2032 | | | | 92 | | | | 93 |
|
| Superannuation Members Home Loans Global Fund |
5.548% due 06/15/2026 | | | | 1 | | | | 1 |
|
| Torrens Trust |
5.459% due 07/15/2031 | | | | 394 | | | | 394 |
|
| Washington Mutual, Inc. |
5.126% due 10/25/2032 | | | | 433 | | | | 430 |
5.410% due 08/25/2042 | | | | 6,304 | | | | 6,302 |
5.612% due 10/25/2045 | | | | 2,969 | | | | 2,988 |
|
| Wells Fargo Mortgage-Backed Securities Trust |
4.950% due 03/25/2036 | | | | 9,327 | | | | 9,201 |
| | | | | | | | |
|
Total Mortgage-Backed Securities (Cost $112,567) | | | | 110,694 |
| | | | | | | | |
|
| |
| ASSET-BACKED SECURITIES 0.2% |
| AAA Trust | | | | | | | | |
5.422% due 11/26/2035 | | | | 1,009 | | | | 1,011 |
|
| Amortizing Residential Collateral Trust |
5.592% due 06/25/2032 | | | | 546 | | | | 547 |
| | | | | | | | |
| Carrington Mortgage Loan Trust |
5.402% due 06/25/2035 | | $ | | 491 | | $ | | 491 |
|
| Citifinancial Mortgage Securities, Inc. |
3.082% due 08/25/2033 | | | | 9 | | | | 9 |
3.221% due 10/25/2033 | | | | 39 | | | | 38 |
|
| Conseco Finance |
5.569% due 12/15/2029 | | | | 110 | | | | 110 |
|
| EMC Mortgage Loan Trust |
5.692% due 05/25/2040 | | | | 902 | | | | 905 |
|
| GSAMP Trust |
5.512% due 10/25/2033 | | | | 839 | | | | 840 |
|
| Morgan Stanley Dean Witter Capital I |
5.652% due 07/25/2032 | | | | 14 | | | | 14 |
|
| Residential Asset Mortgage Products, Inc. |
4.450% due 07/25/2028 | | | | 1,145 | | | | 1,134 |
4.230% due 05/25/2029 | | | | 152 | | | | 151 |
4.003% due 01/25/2030 | | | | 143 | | | | 142 |
|
| Structured Asset Securities Corp. |
5.371% due 01/25/2033 | | | | 73 | | | | 74 |
4.370% due 10/25/2034 | | | | 525 | | | | 518 |
| | | | | | | | |
|
Total Asset-Backed Securities
(Cost $5,999) | | 5,984 |
| | | | | | | | |
|
| |
| SOVEREIGN ISSUES 0.5% | | | | |
| Brazilian Government International Bond |
10.500% due 07/14/2014 | | | | 2,340 | | | | 2,823 |
8.000% due 01/15/2018 | | | | 3,000 | | | | 3,172 |
8.875% due 04/15/2024 | | | | 90 | | | | 100 |
|
| Financing Corp. Fico | | | | | | | | |
0.000% due 04/05/2019 | | | | 840 | | | | 416 |
0.000% due 09/26/2019 | | | | 830 | | | | 399 |
|
| Mexico Government International Bond | | |
8.375% due 01/14/2011 | | | | 200 | | | | 219 |
|
| Panama Government International Bond | | |
9.625% due 02/08/2011 | | | | 480 | | | | 535 |
8.875% due 09/30/2027 | | | | 5,200 | | | | 5,915 |
6.700% due 01/26/2036 | | | | 431 | | | | 397 |
|
| South Africa Government International Bond |
9.125% due 05/19/2009 | | | | 500 | | | | 538 |
| | | | | | | | |
|
Total Sovereign Issues (Cost $13,334) | | 14,514 |
| | | | | | | | |
|
| |
| FOREIGN CURRENCY-DENOMINATED ISSUES (j) 1.5% |
| Netherlands Government Bond |
3.000% due 07/15/2006 | | EUR | | 29,700 | | | | 37,987 |
|
| United Kingdom Gilt | | | | | | | | |
4.750% due 06/07/2010 | | GBP | | 2,700 | | | | 4,984 |
4.750% due 09/07/2015 | | | | 1,000 | | | | 1,853 |
| | | | | | | | |
|
Total Foreign Currency-Denominated Issues (Cost $44,437) | | 44,824 |
| | | | | | | | |
|
| | | | |
| 10 | | PIMCO Variable Insurance Trust | | See Accompanying Notes |
| | |
| |
| | | June 30, 2006 (Unaudited) |
| | | | | | | | |
| | | | | NOTIONAL | | | | |
| | | | | AMOUNT | | | | VALUE |
| | | | | (000S) | | | | (000S) |
| | | | | | | | | |
| PURCHASED CALL OPTIONS 0.1% |
| 2-Year Interest Rate Swap (OTC) Pay 3-Month USD-LIBOR Floating Rate Index |
Strike @ 4.500% Exp. 10/04/2006 | | $ | | 78,500 | | $ | | 0 |
Strike @ 4.750% Exp. 08/07/2006 | | | | 123,000 | | | | 0 |
Strike @ 4.750% Exp. 08/08/2006 | | | | 37,000 | | | | 0 |
Strike @ 4.800% Exp. 12/22/2006 | | | | 83,000 | | | | 11 |
Strike @ 5.000% Exp. 03/08/2007 | | | | 130,000 | | | | 112 |
Strike @ 5.080% Exp. 04/19/2007 | | | | 98,900 | | | | 143 |
Strike @ 5.130% Exp. 10/25/2006 | | | | 190,000 | | | | 57 |
Strike @ 5.170% Exp. 02/01/2007 | | | | 73,500 | | | | 88 |
Strike @ 5.200% Exp. 05/09/2007 | | | | 163,400 | | | | 357 |
Strike @ 5.200% Exp. 05/23/2007 | | | | 138,000 | | | | 319 |
Strike @ 5.250% Exp. 06/07/2007 | | | | 169,000 | | | | 464 |
Strike @ 5.500% Exp. 06/29/2007 | | | | 138,000 | | | | 662 |
| | | | | | | | |
|
Total Purchased Call Options
(Cost $5,539) | | 2,213 |
| | | | | | | | |
|
| |
| | | | | #OF
CONTRACTS | | | | |
| PURCHASED PUT OPTIONS 0.0% |
| 90-Day Eurodollar December Futures (CME) |
Strike @ $91.750 Exp. 12/18/2006 | | | | 764 | | | | 5 |
Strike @ $92.000 Exp. 12/18/2006 | | | | 2,995 | | | | 19 |
Strike @ $92.250 Exp. 12/18/2006 | | | | 1,663 | | | | 10 |
Strike @ $92.500 Exp. 12/18/2006 | | | | 450 | | | | 3 |
Strike @ $92.750 Exp. 12/18/2006 | | | | 790 | | | | 5 |
Strike @ $93.000 Exp. 12/18/2006 | | | | 50 | | | | 0 |
|
| 90-Day Eurodollar June Futures (CME) |
Strike @ $91.000 Exp. 06/18/2007 | | | | 1,328 | | | | 8 |
Strike @ $91.250 Exp. 06/18/2007 | | | | 1,855 | | | | 12 |
|
| 90-Day Eurodollar March Futures (CME) |
Strike @ $92.000 Exp. 03/19/2007 | | | | 987 | | | | 6 |
Strike @ $92.250 Exp. 03/19/2007 | | | | 585 | | | | 4 |
|
| 90-Day Eurodollar September Futures (CME) |
Strike @ $91.000 Exp. 09/17/2007 | | | | 637 | | | | 4 |
Strike @ $92.500 Exp. 09/18/2006 | | | | 675 | | | | 4 |
| | | | | | | | |
|
Total Purchased Put Options (Cost $121) | | 80 |
| | | | | | | | |
|
| |
| | | | | NOTIONAL AMOUNT
(000S) | | | | |
PURCHASED STRADDLE
OPTIONS (g) 0.0% |
| Call & Put – OTC U.S. dollar versus Japanese Yen Forward Delta Neutral Straddle |
Strike @ $0.000 Exp. 08/23/2007 | | $ | | 35,000 | | | | 21 |
| | | | | | | | |
|
Total Purchased Straddle Options (Cost $0) | | 21 |
| | | | | | | | |
|
| | | | | | | | |
| PREFERRED STOCK 0.4% |
| DG Funding Trust | | | | | | | | |
7.210% due 12/31/2049 | | | | 1,239 | | $ | | 13,079 |
| | | | | | | | |
|
Total Preferred Stock (Cost $13,056) | | 13,079 |
| | | | | | | | |
|
| |
| | | | | PRINCIPAL AMOUNT
(000S) | | | | |
| SHORT-TERM INSTRUMENTS (j) 48.5% |
| |
| CERTIFICATES OF DEPOSIT 4.8% |
| Citibank N.A. | | | | | | | | |
5.275% due 09/11/2006 | | $ | | 63,000 | | | | 63,000 |
|
| Wells Fargo Bank N.A. | | |
5.280% due 07/11/2006 | | | | 80,000 | | | | 80,000 |
| | | | | | | | |
|
| | | | | | | | | 143,000 |
| | | | | | | | |
|
| |
| COMMERCIAL PAPER 25.1% |
| Bank of America Corp. | | | | | | | | |
5.040% due 08/03/2006 | | | | 53,000 | | | | 52,770 |
5.090% due 08/21/2006 | | | | 30,000 | | | | 29,792 |
|
| Barclays U.S. Funding Corp. | | |
5.055% due 07/18/2006 | | | | 8,200 | | | | 8,183 |
5.050% due 08/14/2006 | | | | 80,700 | | | | 80,225 |
|
| Cox Communications, Inc. | | |
4.720% due 07/17/2006 | | | | 3,500 | | | | 3,500 |
|
| Danske Corp. | | |
5.040% due 07/05/2006 | | | | 54,500 | | | | 54,485 |
|
| Fannie Mae | | |
5.140% due 08/01/2006 | | | | 56,900 | | | | 56,664 |
|
| Fortis Funding LLC | | |
5.175% due 07/10/2006 | | | | 80,700 | | | | 80,619 |
|
| San Paolo IMI U.S. Financial Co. | | |
5.270% due 07/05/2006 | | | | 80,000 | | | | 79,977 |
|
| Skandinaviska Enskilda Banken AB | | |
4.960% due 07/20/2006 | | | | 79,500 | | | | 79,314 |
|
| Societe Generale N.A. | | |
5.250% due 07/05/2006 | | | | 8,100 | | | | 8,098 |
5.260% due 07/05/2006 | | | | 79,600 | | | | 79,577 |
|
| Total Captial S.A. | | |
5.270% due 07/03/2006 | | | | 43,300 | | | | 43,300 |
|
| UBS Finance Delaware LLC | | |
5.235% due 08/08/2006 | | | | 22,600 | | | | 22,482 |
5.000% due 08/25/2006 | | | | 47,300 | | | | 46,952 |
5.095% due 09/22/2006 | | | | 19,200 | | | | 18,960 |
| | | | | | | | |
|
| | | | | | | | | 744,898 |
| | | | | | | | |
|
| |
| REPURCHASE AGREEMENT 0.7% |
| Lehman Brothers Inc. |
4.500% due 07/03/2006 | | | | 20,100 | | | | 20,100 |
| | | | | | | | |
|
(Dated 06/30/2006. Collateralized by Treasury Inflation Protected Securities 2.000% due 07/15/2014 valued at $20,579. Repurchase proceeds are $20,108.) |
| |
| TRI-PARTY REPURCHASE AGREEMENT 0.2% |
| State Street Bank |
4.900% due 07/03/2006 | | | | 5,608 | | | | 5,608 |
| | | | | | | | |
|
(Dated 06/30/2006. Collateralized by Federal Home Loan Bank 4.250% due 04/16/2007 valued at $5,722. Repurchase proceeds are $5,610.) |
| |
| BELGIUM TREASURY BILL 0.3% |
2.757% due 10/12/2006 | | EUR | | 8,680 | | | | 11,014 |
| | | | | | | | |
|
| |
| FRANCE TREASURY BILLS 8.5% |
2.691% due 07/06/2006-12/21/2006 | | | | 198,130 | | | | 251,970 |
| | | | | | | | |
|
| | | | | | | | |
| GERMANY TREASURY BILLS 7.8% |
2.641% due 07/12/2006-11/15/2006 | | EUR | | 181,750 | | $ | | 231,595 |
| | | | | | | | |
|
| |
| U.S. TREASURY BILLS 1.1% |
4.042% due 08/31/2006-09/14/2006 (d)(e)(f) | | $ | | 33,720 | | $ | | 33,354 |
| | | | | | | | |
|
Total Short-Term Instruments
(Cost $1,425,471) | | 1,441,539 |
| | | | | | | | |
|
| |
| Total Investments (a) 114.7% (Cost $3,442,782) | | | | $ | | 3,407,611 |
| |
Written Options (i) (0.4%)
(Premiums $9,947) | | | | | | | | (12,179) |
| |
| Other Assets and Liabilities (Net) (14.3%) | | (425,443) |
| | | | | | | | |
|
| Net Assets 100.0% | | | | | | $ | | 2,969,989 |
| | | | | | | | |
|
| | | | | | |
| See Accompanying Notes | | Semiannual Report | | June 30, 2006 | | 11 |
Schedule of Investments Total Return Portfolio (Cont.)
|
Notes to Schedule of Investments (amounts in thousands, except number of contracts): |
(a) As of June 30, 2006, portfolio securities with an aggregate market value of $155 were valued in good faith and pursuant to guidelines established by the Board of Trustees. |
| |
(b) Security is in default. |
| |
(c) Principal amount of security is adjusted for inflation. |
| |
(d) Securities are grouped by coupon or range of coupons and represent a range of maturities. |
| |
(e) Securities with an aggregate market value of $5,689 have been pledged as collateral for swap and swaption contracts on June 30, 2006. |
| |
(f) Securities with an aggregate market value of $27,691 have been segregated with the custodian to cover margin requirements for the following open futures contracts on June 30, 2006: |
| | | | | | | | | | |
| Description | | Type | | Expiration
Month | | # of
Contracts | | Unrealized
(Depreciation) | |
90-Day Eurodollar December Futures | | Long | | 12/2006 | | 4,923 | | $ | (7,046 | ) |
90-Day Eurodollar December Futures | | Long | | 12/2007 | | 1,045 | | | (969 | ) |
90-Day Eurodollar June Futures | | Long | | 06/2007 | | 2,686 | | | (4,502 | ) |
90-Day Eurodollar March Futures | | Long | | 03/2007 | | 3,609 | | | (6,727 | ) |
90-Day Eurodollar March Futures | | Long | | 03/2008 | | 368 | | | (214 | ) |
90-Day Eurodollar September Futures | | Long | | 09/2006 | | 727 | | | (736 | ) |
90-Day Eurodollar September Futures | | Long | | 09/2007 | | 2,047 | | | (3,020 | ) |
Euro-Bobl 5-Year Note September Futures | | Long | | 09/2006 | | 63 | | | (83 | ) |
U.S. Treasury 5-Year Note September Futures | | Long | | 09/2006 | | 598 | | | (321 | ) |
U.S. Treasury 10-Year Note September Futures | | Long | | 09/2006 | | 518 | | | (253 | ) |
U.S. Treasury 30-Year Bond September Futures | | Long | | 09/2006 | | 160 | | | (164 | ) |
United Kingdom 90-Day LIBOR Sterling Interest Rate December Futures Put Options Strike @ GBP95.500 | | Short | | 12/2006 | | 94 | | | (51 | ) |
| | | | | | | | |
|
|
|
| | | | | | | | | $ | (24,086 | ) |
| | | | | | | | |
|
|
|
| | | | | | | | |
(g) Exercise price and premium determined on a future date, based upon implied volatility parameters. |
| | | | | | | | | | | | | | | |
(h) Swap agreements outstanding on June 30, 2006: | |
| Interest Rate Swaps | | | | | | | | | | | | | | | |
| Counterparty | | Floating Rate
Index | | Pay/Receive
Floating Rate | | Fixed Rate | | Expiration
Date | | Notional
Amount | | Unrealized
Appreciation/
(Depreciation) | |
Barclays Bank PLC | | 5-year French CLPI Ex Tobacco Daily Reference Index | | Pay | | 2.103% | | 10/15/2010 | | EUR | 1,400 | | $ | (6 | ) |
BNP Paribas Bank | | 5-year French CLPI Ex Tobacco Daily Reference Index | | Pay | | 2.090% | | 10/15/2010 | | | 10,200 | | | (29 | ) |
Deutsche Bank AG | | 6-month EUR-LIBOR | | Receive | | 4.000% | | 12/15/2011 | | | 30,500 | | | 232 | |
Merrill Lynch & Co., Inc. | | 6-month EUR-LIBOR | | Receive | | 4.000% | | 12/15/2011 | | | 39,800 | | | 52 | |
UBS Warburg LLC | | 5-year French CLPI Ex Tobacco Daily Reference Index | | Pay | | 2.146% | | 10/15/2010 | | | 1,900 | | | (3 | ) |
Barclays Bank PLC | | 6-month GBP-LIBOR | | Pay | | 5.000% | | 06/15/2007 | | GBP | 32,400 | | | (272 | ) |
Barclays Bank PLC | | 6-month GBP-LIBOR | | Pay | | 5.000% | | 06/16/2011 | | | 1,800 | | | (37 | ) |
Barclays Bank PLC | | 6-month GBP-LIBOR | | Receive | | 4.000% | | 12/15/2035 | | | 2,900 | | | 86 | |
Lehman Brothers, Inc. | | 6-month GBP-LIBOR | | Pay | | 4.500% | | 09/20/2009 | | | 17,500 | | | (422 | ) |
Merrill Lynch & Co., Inc. | | 6-month GBP-LIBOR | | Receive | | 4.000% | | 12/15/2035 | | | 2,200 | | | 70 | |
Goldman Sachs & Co. | | 6-month JPY-LIBOR | | Receive | | 2.000% | | 06/15/2012 | | JPY | 387,100 | | | 49 | |
Morgan Stanley Dean Witter & Co. | | 6-month JPY-LIBOR | | Receive | | 2.000% | | 06/15/2012 | | | 626,000 | | | 24 | |
UBS Warburg LLC | | 6-month JPY-LIBOR | | Receive | | 2.000% | | 06/15/2012 | | | 1,625,000 | | | (46 | ) |
Barclays Bank PLC | | 3-month USD-LIBOR | | Pay | | 5.000% | | 12/20/2008 | | $ | 64,200 | | | (57 | ) |
Goldman Sachs & Co. | | 3-month USD-LIBOR | | Pay | | 5.000% | | 12/20/2016 | | | 13,900 | | | (172 | ) |
Goldman Sachs & Co. | | 3-month USD-LIBOR | | Pay | | 5.000% | | 12/15/2035 | | | 5,900 | | | (155 | ) |
Lehman Brothers, Inc. | | 3-month USD-LIBOR | | Pay | | 5.000% | | 12/20/2011 | | | 23,900 | | | (214 | ) |
Lehman Brothers, Inc. | | 3-month USD-LIBOR | | Pay | | 5.000% | | 12/20/2016 | | | 6,300 | | | (78 | ) |
Lehman Brothers, Inc. | | 3-month USD-LIBOR | | Pay | | 5.000% | | 12/15/2035 | | | 6,500 | | | (173 | ) |
Royal Bank of Scotland PLC | | 3-month USD-LIBOR | | Pay | | 5.000% | | 12/20/2011 | | | 11,000 | | | (97 | ) |
UBS Warburg LLC | | 3-month USD-LIBOR | | Pay | | 5.000% | | 12/20/2008 | | | 9,800 | | | (9 | ) |
| | | | | | | | | | | | | |
|
|
|
| | | | | | | | | | | | | | $ | (1,257 | ) |
| | | | | | | | | | | | | |
|
|
|
| | | | |
| 12 | | PIMCO Variable Insurance Trust | | See Accompanying Notes |
| | |
| |
| | | June 30, 2006 (Unaudited) |
| | | | | | | | | | | | | | | | |
| Credit Default Swaps | | | | | | | | | | | | | | | | |
| Counterparty | | Reference Entity | | Buy/Sell
Protection+ | | (Pay)Receive
Fixed Rate | | | Expiration
Date | | Notional
Amount | | Unrealized
Appreciation/
(Depreciation) | |
Bear Stearns & Co., Inc. | | Ford Motor Credit Co. 7.000% due 10/01/2013 | | Sell | | 1.300% | | | 09/20/2006 | | $ | 1,800 | | $ | (1 | ) |
Bear Stearns & Co., Inc. | | General Motors Acceptance Corp.
6.875% due 08/28/2012 | | Sell | | 2.100% | | | 12/20/2006 | | | 12,400 | | | 28 | |
Bear Stearns & Co., Inc. | | Ford Motor Credit Co. 7.000% due 10/01/2013 | | Sell | | 4.750% | | | 06/20/2007 | | | 200 | | | 4 | |
Bear Stearns & Co., Inc. | | Ford Motor Credit Co. 7.000% due 10/01/2013 | | Sell | | 2.320% | | | 09/20/2007 | | | 2,100 | | | (12 | ) |
Citibank N.A. | | General Motors Acceptance Corp.
6.875% due 08/28/2012 | | Sell | | 1.700% | | | 09/20/2006 | | | 2,600 | | | 4 | |
Goldman Sachs & Co. | | Ford Motor Credit Co. 7.000% due 10/01/2013 | | Sell | | 2.400% | | | 09/20/2007 | | | 4,200 | | | (20 | ) |
Goldman Sachs & Co. | | Dow Jones CDX N.A. HV5 Index | | Buy | | (0.850% | ) | | 12/20/2010 | | | 13,900 | | | (63 | ) |
HSBC Bank USA | | Russia Government International Bond, 5.000% until 03/31/2007 and 7.500% thereafter, due 03/31/2030 | | Sell | | 0.390% | | | 09/20/2006 | | | 800 | | | 1 | |
J.P. Morgan Chase & Co. | | Ford Motor Credit Co. 7.000% due 10/01/2013 | | Sell | | 4.750% | | | 06/20/2007 | | | 400 | | | 8 | |
J.P. Morgan Chase & Co. | | Ford Motor Credit Co. 7.000% due 10/01/2013 | | Sell | | 4.700% | | | 06/20/2007 | | | 1,800 | | | 37 | |
J.P. Morgan Chase & Co. | | Mexico Government International Bond 7.500% due 04/08/2033 | | Sell | | 0.920% | | | 03/20/2016 | | | 1,200 | | | (13 | ) |
Lehman Brothers, Inc. | | Multiple Reference Entities of Gazprom | | Sell | | 1.430% | | | 06/20/2011 | | | 600 | | | 1 | |
Lehman Brothers, Inc. | | Mexico Government International Bond 7.500% due 04/08/2033 | | Sell | | 0.920% | | | 03/20/2016 | | | 3,100 | | | (34 | ) |
Morgan Stanley Dean Witter & Co. | | Ford Motor Credit Co. 7.000% due 10/01/2013 | | Sell | | 5.200% | | | 12/20/2006 | | | 9,300 | | | 166 | |
Morgan Stanley Dean Witter & Co. | | Russia Government International Bond, 5.000% until 03/31/2007 and 7.500% thereafter, due 03/31/2030 | | Sell | | 0.460% | | | 06/20/2007 | | | 1,300 | | | 1 | |
UBS Warburg LLC | | Ford Motor Credit Co. 7.000% due 10/01/2013 | | Sell | | 4.750% | | | 12/20/2006 | | | 10,700 | | | 167 | |
UBS Warburg LLC | | Ford Motor Credit Co. 7.000% due 10/01/2013 | | Sell | | 3.350% | | | 06/20/2007 | | | 1,500 | | | 11 | |
Wachovia Bank N.A. | | Dow Jones CDX N.A. HV5 Index | | Sell | | 0.850% | | | 12/20/2010 | | | 5,000 | | | (36 | ) |
| | | | | | | | | | | | | | |
|
|
|
| | | | | | | | | | | | | | | $ | 249 | |
| | | | | | | | | | | | | | |
|
|
|
|
| + If the Portfolio is a seller of protection and a credit event occurs, as defined under the terms of that particular swap agreement, the Portfolio will Pay to the buyer of the protection an amount up to the Notional value of the swap and in certain instances, take delivery of the security. As a buyer of protection, the Portfolio will generally receive from the seller of protection an amount up to the notional amount of the swap if a credit event occurs. | |
| | | | | | | | | | | | |
(i) Written options outstanding on June 30, 2006: |
| Options on Exchange-Traded Futures Contracts |
| Description | | Exercise
Price | | Expiration
Date | | # of
Contracts | | Premium | | Value |
Call - CBOT U.S. Treasury 10-Year Note September Futures | | $ 108.000 | | 08/25/2006 | | 1,654 | | $ | 219 | | $ | 52 |
Call - CBOT U.S. Treasury 10-Year Note September Futures | | 106.000 | | 08/25/2006 | | 185 | | | 108 | | | 49 |
Put - CBOT U.S. Treasury 10-Year Note September Futures | | 103.000 | | 08/25/2006 | | 1,839 | | | 320 | | | 259 |
Put - CME 90-Day Eurodollar March Futures | | 95.250 | | 03/19/2007 | | 116 | | | 108 | | | 238 |
Call - CME 90-Day Eurodollar September Futures | | 95.500 | | 09/18/2006 | | 112 | | | 30 | | | 1 |
Put - CME 90-Day Eurodollar September Futures | | 95.000 | | 09/18/2006 | | 209 | | | 109 | | | 303 |
Put - CME 90-Day Eurodollar September Futures | | 95.250 | | 09/18/2006 | | 448 | | | 347 | | | 930 |
Put - CME 90-Day Eurodollar December Futures | | 95.000 | | 12/18/2006 | | 195 | | | 103 | | | 295 |
Put - CME 90-Day Eurodollar December Futures | | 95.250 | | 12/18/2006 | | 2,975 | | | 2,357 | | | 6,303 |
Put - CME 90-Day Eurodollar December Futures | | 95.500 | | 12/18/2006 | | 297 | | | 331 | | | 813 |
| | | | | | | | |
|
| |
|
|
| | | | | | | | | $ | 4,032 | | $ | 9,243 |
| | | | | | | | |
|
| |
|
|
| | | | | | |
| See Accompanying Notes | | Semiannual Report | | June 30, 2006 | | 13 |
Schedule of Investments Total Return Portfolio (Cont.)
| | | | | | | | | | | | | | | | | | | |
| Interest Rate Swaptions | | | | | | | | | | | | | | | | | | | |
| Description | | Counterparty | | Floating Rate
Index | | Pay/Receive
Floating Rate | | Exercise
Rate | | Expiration
Date | | Notional
Amount | | Premium | | Value |
Put - OTC 1-Year Interest Rate Swap | | HSBC Bank USA | | 6-month GBP-LIBOR | | Pay | | 4.500% | | 12/20/2006 | | | GBP 53,900 | | $ | 263 | | $ | 586 |
Call - OTC 5-Year Interest Rate Swap | | Bear Stearns & Co., Inc. | | 3-month USD-LIBOR | | Receive | | 5.210% | | 10/25/2006 | | $ | 40,000 | | | 145 | | | 44 |
Call - OTC 5-Year Interest Rate Swap | | Bear Stearns & Co., Inc. | | 3-month USD-LIBOR | | Receive | | 5.040% | | 03/08/2007 | | | 37,000 | | | 357 | | | 75 |
Call - OTC 5-Year Interest Rate Swap | | Citibank N.A. | | 3-month USD-LIBOR | | Receive | | 4.540% | | 10/04/2006 | | | 14,100 | | | 165 | | | 0 |
Call - OTC 5-Year Interest Rate Swap | | Citibank N.A. | | 3-month USD-LIBOR | | Receive | | 4.850% | | 12/22/2006 | | | 36,000 | | | 473 | | | 14 |
Call - OTC 5-Year Interest Rate Swap | | Goldman Sachs & Co. | | 3-month USD-LIBOR | | Receive | | 4.780% | | 08/07/2006 | | | 53,000 | | | 434 | | | 0 |
Call - OTC 5-Year Interest Rate Swap | | Goldman Sachs & Co. | | 3-month USD-LIBOR | | Receive | | 5.210% | | 10/25/2006 | | | 28,400 | | | 128 | | | 31 |
Call - OTC 5-Year Interest Rate Swap | | Merrill Lynch & Co., Inc. | | 3-month USD-LIBOR | | Receive | | 4.780% | | 08/08/2006 | | | 16,000 | | | 151 | | | 0 |
Call - OTC 5-Year Interest Rate Swap | | Merrill Lynch & Co., Inc. | | 3-month USD-LIBOR | | Receive | | 4.540% | | 10/04/2006 | | | 20,000 | | | 239 | | | 0 |
Call - OTC 5-Year Interest Rate Swap | | Royal Bank of Scotland PLC | | 3-month USD-LIBOR | | Receive | | 5.040% | | 03/08/2007 | | | 19,000 | | | 212 | | | 38 |
Call - OTC 5-Year Interest Rate Swap | | Royal Bank of Scotland PLC | | 3-month USD-LIBOR | | Receive | | 5.220% | | 04/19/2007 | | | 43,000 | | | 340 | | | 188 |
Call - OTC 5-Year Interest Rate Swap | | Royal Bank of Scotland PLC | | 3-month USD-LIBOR | | Receive | | 5.315% | | 05/09/2007 | | | 71,500 | | | 738 | | | 424 |
Call - OTC 5-Year Interest Rate Swap | | Royal Bank of Scotland PLC | | 3-month USD-LIBOR | | Receive | | 5.300% | | 05/23/2007 | | | 59,000 | | | 590 | | | 354 |
Call - OTC 5-Year Interest Rate Swap | | Royal Bank of Scotland PLC | | 3-month USD-LIBOR | | Receive | | 5.340% | | 06/07/2007 | | | 62,000 | | | 631 | | | 425 |
Call - OTC 5-Year Interest Rate Swap | | Royal Bank of Scotland PLC | | 3-month USD-LIBOR | | Receive | | 5.600% | | 06/29/2007 | | | 60,000 | | | 663 | | | 663 |
Call - OTC 5-Year Interest Rate Swap | | Wachovia Bank N.A. | | 3-month USD-LIBOR | | Receive | | 5.210% | | 10/25/2006 | | | 12,900 | | | 50 | | | 14 |
Call - OTC 5-Year Interest Rate Swap | | Wachovia Bank N.A. | | 3-month USD-LIBOR | | Receive | | 5.240% | | 02/01/2007 | | | 31,800 | | | 196 | | | 120 |
Call - OTC 5-Year Interest Rate Swap | | Wachovia Bank N.A. | | 3-month USD-LIBOR | | Receive | | 5.325% | | 06/07/2007 | | | 11,000 | | | 94 | | | 73 |
| | | | | | | | | | | | �� | | | |
|
| |
|
|
| | | | | | | | | | | | | | | | $ | 5,869 | | $ | 3,049 |
| | | | | | | | | | | | | | | |
|
| |
|
|
| | | | | | | | | | | | | | | | |
| Straddle Options | | | | | | | | | | | | | | | | |
| Description | | Counterparty | | Exercise
Price* | | Expiration
Date | | Notional
Amount | | Premium* | | Value | |
Call & Put - OTC U.S. dollar versus Japanese Yen Forward Delta Neutral Straddle | | Goldman Sachs & Co. | | $ 0.000 | | 08/23/2007 | | $ | 16,500 | | $ | 14 | | $ | (93 | ) |
Call & Put - OTC U.S. dollar versus Japanese Yen Forward Delta Neutral Straddle | | J.P. Morgan Chase & Co. | | 0.000 | | 08/23/2007 | | | 3,000 | | | 17 | | | (16 | ) |
Call & Put - OTC U.S. dollar versus Japanese Yen Forward Delta Neutral Straddle | | J.P. Morgan Chase & Co. | | 0.000 | | 08/24/2007 | | | 1,000 | | | 4 | | | (4 | ) |
| | | | | | | | | | | |
|
| |
|
|
|
| | | | | | | | | | | | $ | 46 | | $ | (113 | ) |
| | | | | | | | | | | |
|
| |
|
|
|
| |
| * Exercise price and final premium determined on a future date, based upon implied volatility parameters. | | | | |
| | | | | | | | | | | | | | | | | |
(j) Forward foreign currency contracts outstanding on June 30, 2006: | | | | | |
| Type | | | | Principal
Amount
Covered by
Contract | | Settlement
Month | | Unrealized
Appreciation | | Unrealized
(Depreciation) | | | Net Unrealized
Appreciation/
(Depreciation) | |
Buy | | BRL | | 3,804 | | 07/2006 | | $ | 112 | | $ | 0 | | | $ | 112 | |
Sell | | | | 3,803 | | 07/2006 | | | 0 | | | (95 | ) | | | (95 | ) |
Buy | | | | 1,608 | | 09/2006 | | | 41 | | | 0 | | | | 41 | |
Buy | | CAD | | 10,212 | | 07/2006 | | | 0 | | | (105 | ) | | | (105 | ) |
Buy | | CLP | | 854,883 | | 07/2006 | | | 0 | | | (37 | ) | | | (37 | ) |
Sell | | | | 854,884 | | 07/2006 | | | 15 | | | (2 | ) | | | 13 | |
Buy | | | | 615,000 | | 08/2006 | | | 0 | | | (13 | ) | | | (13 | ) |
Buy | | | | 94,184 | | 09/2006 | | | 2 | | | 0 | | | | 2 | |
Buy | | CNY | | 23,779 | | 03/2007 | | | 0 | | | (22 | ) | | | (22 | ) |
Buy | | EUR | | 5,966 | | 07/2006 | | | 137 | | | 0 | | | | 137 | |
Sell | | | | 433,474 | | 07/2006 | | | 695 | | | (8,630 | ) | | | (7,935 | ) |
Buy | | | | 13 | | 12/2006 | | | 0 | | | 0 | | | | 0 | |
Buy | | GBP | | 3,048 | | 07/2006 | | | 21 | | | 0 | | | | 21 | |
Buy | | INR | | 51,600 | | 08/2006 | | | 0 | | | (30 | ) | | | (30 | ) |
Sell | | | | 50,590 | | 08/2006 | | | 20 | | | 0 | | | | 20 | |
Buy | | | | 34,136 | | 09/2006 | | | 0 | | | (16 | ) | | | (16 | ) |
Buy | | JPY | | 9,727,278 | | 08/2006 | | | 0 | | | (2,670 | ) | | | (2,670 | ) |
Buy | | KRW | | 966,900 | | 07/2006 | | | 32 | | | 0 | | | | 32 | |
Sell | | | | 966,900 | | 07/2006 | | | 0 | | | (11 | ) | | | (11 | ) |
Buy | | | | 1,503,584 | | 08/2006 | | | 28 | | | 0 | | | | 28 | |
Sell | | | | 230,950 | | 08/2006 | | | 0 | | | (6 | ) | | | (6 | ) |
Buy | | | | 3,109,199 | | 09/2006 | | | 67 | | | 0 | | | | 67 | |
Sell | | | | 2,194,499 | | 09/2006 | | | 0 | | | (63 | ) | | | (63 | ) |
Buy | | | | 4,130,499 | | 05/2007 | | | 0 | | | (9 | ) | | | (9 | ) |
Buy | | MXN | | 23,220 | | 08/2006 | | | 0 | | | (143 | ) | | | (143 | ) |
Sell | | | | 15,940 | | 08/2006 | | | 35 | | | 0 | | | | 35 | |
Buy | | | | 5,620 | | 09/2006 | | | 0 | | | (29 | ) | | | (29 | ) |
Buy | | PEN | | 8,692 | | 08/2006 | | | 62 | | | 0 | | | | 62 | |
| | | | |
| 14 | | PIMCO Variable Insurance Trust | | See Accompanying Notes |
| | |
| |
| | | June 30, 2006 (Unaudited) |
| | | | | | | | | | | | | | | | | |
| Type | | | | Principal
Amount
Covered by
Contract | | Settlement
Month | | Unrealized
Appreciation | | Unrealized
(Depreciation) | | | Net Unrealized
Appreciation/
(Depreciation) | |
Sell | | | | 8,692 | | 08/2006 | | $ | 0 | | $ | (89 | ) | | $ | (89 | ) |
Buy | | | | 1,762 | | 09/2006 | | | 12 | | | 0 | | | | 12 | |
Sell | | | | 1,762 | | 09/2006 | | | 0 | | | (19 | ) | | | (19 | ) |
Buy | | PLN | | 1,414 | | 09/2006 | | | 5 | | | 0 | | | | 5 | |
Buy | | | | 1,500 | | 11/2006 | | | 0 | | | (12 | ) | | | (12 | ) |
Buy | | RUB | | 12,595 | | 07/2006 | | | 20 | | | 0 | | | | 20 | |
Sell | | | | 12,596 | | 07/2006 | | | 0 | | | (4 | ) | | | (4 | ) |
Buy | | | | 60,141 | | 08/2006 | | | 107 | | | 0 | | | | 107 | |
Sell | | | | 53,107 | | 08/2006 | | | 0 | | | (73 | ) | | | (73 | ) |
Buy | | | | 27,885 | | 09/2006 | | | 22 | | | 0 | | | | 22 | |
Buy | | SGD | | 746 | | 07/2006 | | | 9 | | | 0 | | | | 9 | |
Sell | | | | 746 | | 07/2006 | | | 0 | | | (8 | ) | | | (8 | ) |
Buy | | | | 5,695 | | 08/2006 | | | 62 | | | (8 | ) | | | 54 | |
Sell | | | | 4,003 | | 08/2006 | | | 0 | | | (52 | ) | | | (52 | ) |
Buy | | | | 1,116 | | 09/2006 | | | 13 | | | 0 | | | | 13 | |
Buy | | SKK | | 83,996 | | 09/2006 | | | 75 | | | 0 | | | | 75 | |
Sell | | | | 44,840 | | 09/2006 | | | 0 | | | (59 | ) | | | (59 | ) |
Buy | | TWD | | 70,791 | | 08/2006 | | | 0 | | | (46 | ) | | | (46 | ) |
Sell | | | | 37,104 | | 08/2006 | | | 1 | | | 0 | | | | 1 | |
Buy | | | | 16,682 | | 09/2006 | | | 0 | | | (5 | ) | | | (5 | ) |
Sell | | | | 16,682 | | 09/2006 | | | 0 | | | 0 | | | | 0 | |
Buy | | ZAR | | 964 | | 08/2006 | | | 0 | | | (22 | ) | | | (22 | ) |
Sell | | | | 964 | | 08/2006 | | | 7 | | | 0 | | | | 7 | |
Buy | | | | 964 | | 10/2006 | | | 0 | | | (7 | ) | | | (7 | ) |
Buy | | | | 148 | | 11/2006 | | | 0 | | | (4 | ) | | | (4 | ) |
| | | | | | | | |
|
| |
|
|
| |
|
|
|
| | | | | | | | | $ | 1,600 | | $ | (12,289 | ) | | $ | (10,689 | ) |
| | | | | | | | |
|
| |
|
|
| |
|
|
|
| | | | | | |
| See Accompanying Notes | | Semiannual Report | | June 30, 2006 | | 15 |
Notes to Financial Statements
1. ORGANIZATION
The Total Return Portfolio (the “Portfolio”) is a series of the PIMCO Variable Insurance Trust (the “Trust”). The Trust is registered under the Investment Company Act of 1940 (the “Act”), as amended, as an open-end investment management company organized as a Delaware business trust on October 3, 1997. The Portfolio offers three classes of shares: Institutional, Administrative and Advisor. Information presented in these financial statements pertains to the Administrative Class of the Portfolio. Certain detailed financial information for the Institutional Class and Advisor Class is provided separately and is available upon request. The Trust is designed to be used as an investment vehicle by Separate Accounts of insurance companies that fund variable annuity contracts and variable life insurance policies and by qualified pension and retirement plans.
2. SIGNIFICANT ACCOUNTING POLICIES
The following is a summary of significant accounting policies consistently followed by the Portfolio in the preparation of its financial statements in conformity with accounting principles generally accepted in the United States of America (“GAAP”). The preparation of financial statements in accordance with GAAP requires management to make estimates and assumptions that affect the reported amounts and disclosures in the financial statements. Actual results could differ from those estimates.
Security Valuation. Portfolio securities are valued as of the close of regular trading (normally 4:00 p.m., Eastern Time) on each day that the New York Stock Exchange (“NYSE”) is open. Portfolio securities and other assets for which market quotes are readily available are stated at market value. Market value is generally determined on the basis of last reported sales prices, or if no sales are reported, based on quotes obtained from a quotation reporting system, established market makers, or pricing services. Fixed-income securities and non-exchange traded derivatives are normally valued on the basis of quotes obtained from brokers and dealers or pricing services. Prices obtained from independent pricing services use information provided by market makers or estimates of market values obtained from yield data relating to investments or securities with similar characteristics. Certain fixed-income securities purchased on a delayed-delivery basis are marked to market daily until settlement at the forward settlement date. Short-term investments having a maturity of 60 days or less are generally valued at amortized cost. Exchange traded options, futures and options on futures are valued at the settlement price determined by the relevant exchange.
Investments initially valued in currencies other than the U.S. dollar are converted to the U.S. dollar using exchange rates obtained from pricing services. As a result, the NAV of the Portfolio’s shares may be affected by changes in the value of currencies in relation to the U.S. dollar. The value of securities traded in markets outside the United States or denominated in currencies other than the U.S. dollar may be affected significantly on a day that the NYSE is closed and an investor is not able to purchase, redeem or exchange shares.
Securities and other assets for which market quotes are not readily available are valued at fair value as determined in good faith by the Board of Trustees or persons acting at their direction. The Board of Trustees has adopted methods for valuing securities and other assets in circumstances where market quotes are not readily available, and has delegated to Pacific Investment Management Company LLC (“PIMCO”) the responsibility for applying the valuation methods. In the event that market quotes are not readily available, and the security or asset cannot be valued pursuant to one of the valuation methods, the value of the security or asset will be determined in good faith by the Valuation Committee of the Board of Trustees, generally based upon recommendations provided by PIMCO.
Market quotes are considered not readily available in circumstances where there is an absence of current or reliable market-based data (e.g., trade information, bid/asked information, broker quotes), including where events occur after the close of the relevant market, but prior to the close of regular trading, that materially affect the values of the Portfolio’s securities or assets. In addition, market quotes are considered not readily available when, due to extraordinary circumstances, the exchanges or markets on which the securities trade do not open for trading for the entire day and no other market prices are available. The Board has delegated to PIMCO the responsibility for monitoring significant events that may materially affect the values of the Portfolio’s securities or assets and for determining whether the value of the applicable securities or assets should be re-evaluated in light of such significant events. When the Portfolio uses fair value pricing to determine its NAV, securities will not be priced on the basis of quotations from the primary market in which they are traded, but rather may be priced by another method that the Board of Trustees or persons acting at their direction believe accurately reflects fair value. The Trust’s policy is intended to result in a calculation of the Portfolio’s NAV that fairly reflects security values as of the time of pricing. However, fair values determined by the Board of Trustees or persons acting at their direction may not accurately reflect the price that the Portfolio could obtain for a security if it were to dispose of that security as of the time of pricing. Because foreign securities can trade on non-business days, the NAV of the Portfolio may change on days when shareholders will not be able to purchase or redeem shares. The prices used by the Portfolio may differ from the value that would be realized if the securities were sold and the differences could be material to the financial statements.
Securities Transactions and Investment Income. Securities transactions are recorded as of the trade date. Securities purchased or sold on a when-issued or delayed-delivery basis may be settled a month or more after the trade date. Realized gains and losses from securities sold are recorded on the identified cost basis. Dividend income is recorded on the ex-dividend date, except certain dividends from foreign securities where the ex-dividend date may have passed, which are recorded as soon as the Portfolio is informed of the ex-dividend date. Interest income, adjusted for the accretion of discounts and amortization of premiums, is recorded on the accrual basis. Paydown gains and losses on mortgage-related or asset-backed securities are recorded as components of interest income in the Statement of Operations.
Dividends and Distributions to Shareholders. Dividends from net investment income, if any, are declared on each day the Portfolio is open for business and are distributed to shareholders monthly. Net realized capital gains earned by the Portfolio, if any, will be distributed no less frequently than once each year. Most shareholders choose to reinvest their dividends and capital gain distribution in additional shares of the Portfolio.
Income dividends and capital gain distributions are determined in accordance with income tax regulations which may differ from GAAP. Differences between tax regulations and GAAP may change the fiscal year when income and capital items are recognized for tax and GAAP purposes. Examples of events that give rise to timing differences include wash sales, straddles, net operating losses and capital loss carryforwards. Further, the character of investment income and capital gains may be different for certain transactions under the two methods of accounting. Examples of characterization differences include the treatment of mortgage paydowns, swaps, foreign currency transactions and contingent debt instruments. As a result, income dividends and capital gain distributions declared during a fiscal period may differ significantly from the net investment income and realized capital gain reported in the Portfolio’s annual financial statements presented under GAAP.
Distributions classified as a tax basis return of capital, if any, are reflected in the accompanying Statements of Changes in Net Assets and have been reclassified to
| | | | |
| 16 | | PIMCO Variable Insurance Trust | | |
| | |
| |
| | | June 30, 2006 (Unaudited) |
paid in capital. In addition, other amounts have been reclassified between undistributed net investment income, accumulated undistributed net realized gains or losses and/or paid in capital to more appropriately conform financial accounting to tax characterizations of dividend distributions.
Multiclass Operations. Each class offered by the Portfolio has equal rights as to assets and voting privileges (except that shareholders of a class have exclusive voting rights regarding any matter relating solely to that class of shares). Income and non-class specific expenses of the Portfolio are allocated daily to each class of shares based on the relative value of settled shares. Realized and unrealized capital gains and losses of the Portfolio are allocated daily to each class of shares based on the relative net assets of each class. Class specific expenses, where applicable, currently include administrative, distribution and servicing fees.
Delayed-Delivery Transactions. The Portfolio may purchase or sell securities on a when-issued or delayed-delivery basis. These transactions involve a commitment by the Portfolio to purchase or sell securities for a predetermined price or yield, with payment and delivery taking place beyond the customary settlement period. When delayed-delivery purchases are outstanding, the Portfolio will designate liquid assets in an amount sufficient to meet the purchase price. When purchasing a security on a delayed-delivery basis, the Portfolio assumes the rights and risks of ownership of the security, including the risk of price and yield fluctuations, and takes such fluctuations into account when determining its net asset value. The Portfolio may dispose of or renegotiate a delayed-delivery transaction after it is entered into, and may sell when-issued securities before they are delivered, which may result in a capital gain or loss. When the Portfolio has sold a security on a delayed-delivery basis, the Portfolio does not participate in future gains and losses with respect to the security.
Federal Income Taxes. The Portfolio intends to qualify as a regulated investment company under sub-chapter M of the Internal Revenue Code and distribute all of its taxable income and net realized gains, if applicable, to shareholders. Accordingly, no provision for Federal income taxes has been made.
Foreign Currency. The accounting records of the Portfolio are maintained in U.S. dollar. The market values of foreign securities, currency holdings and other assets and liabilities are translated into U.S. dollar based on the current exchange rates each business day. Fluctuations in the value of currency holdings and other assets and liabilities resulting from changes in exchange rates are recorded as unrealized foreign currency gains or losses. Realized gains or losses and unrealized appreciation or depreciation on investment securities and income and expenses are translated on the respective dates of such transactions. The effects of changes in foreign currency exchange rates on investments in securities are not segregated in the Statement of Operations from the effects of changes in market prices of those securities, but are included with the net realized and unrealized gain or loss on investment securities.
| | | | | | |
|
| Non-U.S. currency symbols utilized throughout the report are defined as follows: |
| BRL | | Brazilian Real | | MXN | | Mexican Peso |
| CAD | | Canadian Dollar | | PEN | | Peruvian New Sol |
| CLP | | Chilean Peso | | PLN | | Polish Zloty |
| CNY | | Chinese Yuan Renminbi | | RUB | | Russian Ruble |
| EUR | | Euro | | SGD | | Singapore Dollar |
| GBP | | British Pound | | SKK | | Slovakian Koruna |
| INR | | Indian Rupee | | TWD | | Taiwan Dollar |
| JPY | | Japanese Yen | | ZAR | | South African Rand |
| KRW | | South Korean Won | | | | |
Forward Currency Transactions. The Portfolio may enter into forward currency contracts in connection with settling planned purchases or sales of securities, to hedge the currency exposure associated with some or all of the Portfolio’s securities or as a part of an investment strategy. A forward currency contract is an agreement between two parties to buy and sell a currency at a set price on a future date. The market value of a forward currency contract fluctuates with changes in forward currency exchange rates. Forward currency contracts are marked to market daily and the change in value is recorded by the Portfolio as an unrealized gain or loss. Realized gains or losses equal to the difference between the value of the contract at the time it was opened and the value at the time it was closed are recorded upon delivery or receipt of the currency or, if a forward currency contract is offset by entering into another forward currency contract with the same broker, upon settlement of the net gain or loss. These contracts may involve market risk in excess of the unrealized gain or loss reflected in the Portfolio’s Statement of Assets and Liabilities. In addition, the Portfolio could be exposed to risk if the counterparties are unable to meet the terms of the contracts or if the value of the currency changes unfavorably to the U.S. dollar.
Futures Contracts. The Portfolio is authorized to enter into futures contracts. The Portfolio may use futures contracts to manage its exposure to the securities markets or to movements in interest rates and currency values. The primary risks associated with the use of futures contracts are the imperfect correlation between the change in market value of the securities held by the Portfolio and the prices of futures contracts, the possibility of an illiquid market, and the inability of the counterparty to meet the terms of the contract. Futures contracts are valued based upon their quoted daily settlement prices. Upon entering into a futures contract, the Portfolio is required to deposit with its custodian, in a segregated account in the name of the futures broker, an amount of cash or U.S. Government and Agency Obligations in accordance with the initial margin requirements of the broker or exchange. Futures contracts are marked to market daily and an appropriate payable or receivable for the change in value (“variation margin”) is recorded by the Portfolio. Gains or losses are recognized but not considered realized until the contracts expire or are closed. Futures contracts involve, to varying degrees, risk of loss in excess of the variation margin disclosed in the Statement of Assets and Liabilities.
Guarantees and Indemnifications. Under the Trust’s organizational documents, each Trustee, officer, employee or other agent of the Trust (including the Trust’s investment manager) is indemnified against certain liabilities that may arise out of performance of their duties to the Portfolio. Additionally, in the normal course of business, the Portfolio enters into contracts that contain a variety of indemnification clauses. The Portfolio’s maximum exposure under these arrangements is unknown as this would involve future claims that may be made against the Portfolio that have not yet occurred. However, the Portfolio has not had prior claims or losses pursuant to these contracts, and believes the risk of loss to be remote.
Inflation-Indexed Bonds. The Portfolio may invest in inflation-indexed bonds. Inflation-indexed bonds are fixed-income securities whose principal value is periodically adjusted to the rate of inflation. The interest rate on these bonds is generally fixed at issuance at a rate lower than typical bonds. Over the life of an inflation-indexed bond, however, interest will be paid based on a principal value, which is adjusted for inflation. Any increase in the principal amount of an inflation-indexed bond will be included as interest income in the Statement of Operations, even though investors do not receive their principal until maturity.
Loan Participant and Assignments. The Portfolio may invest in direct debt instruments which are interests in amounts owned by corporate, governmental, or other borrowers to lenders or lending syndicates. The Portfolio’s investments in loans may be in the form of participations in loans or assignments of all or a portion of loans from third parties. A loan is often administered by a bank or other
| | | | | | |
| | | Semiannual Report | | June 30, 2006 | | 17 |
Notes to Financial Statements (Cont.)
financial institution (the “lender”) that acts as agent for all holders. Then agent administers the terms of the loan, as specified in the loan agreement. When investing in a loan participation, the Portfolio has the right to receive payments of principal, interest and any fees to which it is entitled only from the lender selling the loan agreement and only upon receipt by the lender of payments from the borrower. The Portfolio generally has no right to enforce compliance with the terms of the loan agreement with the borrower. As a result, the Portfolio may be subject to the credit of both the borrower and the lender that is selling the loan agreement. When the Portfolio purchases assignments from lenders it acquires direct rights against the borrower on the loan. At the end of the period, the Portfolio had no unfunded loan commitments.
Options Contracts. The Portfolio may write call and put options on futures, swaps, securities or currencies it owns or in which it may invest. Writing put options tends to increase the Portfolio’s exposure to the underlying instrument. Writing call options tends to decrease the Portfolio’s exposure to the underlying instrument. When the Portfolio writes a call or put option, an amount equal to the premium received is recorded as a liability and subsequently marked to market to reflect the current value of the option written. These liabilities are reflected as written options outstanding in the Statement of Assets and Liabilities. Certain options may be written with premiums to determined on a future date. The premiums for these options are based upon implied volatility parameters at specified terms. Premiums received from writing options which expire are treated as realized gains. Premiums received from writing options which are exercised or closed are added to the proceeds or offset against amounts paid on the underlying future, swap, security or currency transaction to determine the realized gain or loss. The Portfolio as a writer of an option has no control over whether the underlying future, swap, security or currency may be sold (call) or purchased (put) and as a result bears the market risk of an unfavorable change in the price of the future, swap, security or currency underlying the written option. There is the risk the Portfolio may not be able to enter into a closing transaction because of an illiquid market.
The Portfolio may also purchase put and call options. Purchasing call options tends to increase the Portfolio’s exposure to the underlying instrument. Purchasing put options tends to decrease the Portfolio’s exposure to the underlying instrument. The Portfolio pays a premium which is included in the Portfolio’s Statement of Assets and Liabilities as an investment and subsequently marked to market to reflect the current value of the option. Premiums paid for purchasing options which expire are treated as realized losses. Certain options may be purchased with premiums to be determined on a future date. The premiums for these options are based upon implied volatility parameters at specified terms. The risk associated with purchasing put and call options is limited to the premium paid. Premiums paid for purchasing options which are exercised or closed are added to the amounts paid or offset against the proceeds on the underlying future, swap, security or currency transaction to determine the realized gain or loss.
Repurchase Agreements. The Portfolio may engage in repurchase transactions. Under the terms of a typical repurchase agreement, the Portfolio takes possession of an underlying debt obligation subject to an obligation of the seller to repurchase, and the Portfolio to resell, the obligation at an agreed-upon price and time. The underlying securities for all repurchase agreements are held in safekeeping at the Portfolio’s custodian or designated subcustodians under triparty repurchase agreements. The market value of the collateral must be equal to or exceed at all times the total amount of the repurchase obligations, including interest. Securities purchased under repurchase agreements are reflected as an asset in the Statement of Assets and Liabilities. Generally, in the event of counterparty default, the Portfolio has the right to use the collateral to offset losses incurred. If the counterparty should default, the Portfolio will seek to sell the securities which it holds as collateral. This could involve procedural costs or delays in addition to a loss on the securities if their value should fall below their repurchase price.
Mortgage-Related and Other Asset-Backed Securities. The Portfolio may invest in mortgage-related or other asset-backed securities. These securities include mortgage pass-through securities, collateralized mortgage obligations (“CMOs”), commercial mortgage-backed securities, mortgage dollar rolls, CMO residuals, stripped mortgage-backed securities (“SMBSs”) and other securities that directly or indirectly represent a participation in, or are secured by and payable from, mortgage loans on real property. The value of some mortgage- or asset-backed securities may be particularly sensitive to changes in prevailing interest rates. Early repayment of principal on some mortgage-related securities may expose a Portfolio to a lower rate of return upon reinvestment of principal. The value of these securities may fluctuate in response to the market’s perception of the creditworthiness of the issuers. Additionally, although mortgages and mortgage-related securities are generally supported by some form of government or private guarantee and/or insurance, there is no assurance that private guarantors or insurers will meet their obligations.
One type of SMBS has one class receiving all of the interest from the mortgage assets (the interest-only, or “IO” class), while the other class will receive all of the principal (the principal-only, or “PO” class). Payments received for IOs are included in interest income in the Statement of Operations. Because principal will not be received at the maturity of an IO, adjustments are made to the book value of the security on a daily basis until maturity. These adjustments are included in interest income in the Statement of Operations. Payments received for POs are treated as reductions to the cost and par value of the securities.
Swap Agreements. The Portfolio may engage in swap transactions, including, but not limited to, swap agreements on interest rate and credit default to manage its exposure to interest rates and credit risk. In connection with these agreements, securities may be identified as collateral in accordance with the terms of the respective swap agreements.
Interest rate swap agreements involve the exchange by the Portfolio with another party of their respective commitments to pay or receive interest, e.g., an exchange of floating rate payments for fixed rate payments with respect to the notional amount of principal.
Credit default swap agreements involve one party making a stream of payments to another party in exchange for the right to receive a specified return in the event of a default by a third party, typically corporate issues or sovereign issues of an emerging country, on its obligation. The Portfolio may use credit default swaps to provide a measure of protection against defaults of the issuers (i.e., to reduce risk where the Portfolio owns or has exposure to the sovereign issuer) or to take an active long or short position with respect to the likelihood of a particular issuer’s default. As a seller of protection, the Portfolio generally receives an upfront payment or a fixed rate of income throughout the term of the swap provided that there is no credit event. If the Portfolio is a seller of protection and a credit event occurs, as defined under the terms of that particular swap agreement, the Portfolio will pay to the buyer of the protection an amount up to the notional value of the swap and in certain instances take delivery of the security. As the seller, a Portfolio would effectively add leverage to its portfolio because, in addition to its total net assets, the Portfolio would be subject to investment exposure on the notional amount of the swap. As a buyer of protection, a Portfolio generally receives an amount up to the notional value of the swap if a credit event occurs. The treatment of credit default swaps and other swap agreements that provide for contingent, non-periodic, bullet-type payments as “notional principal contracts” for federal income tax purposes is uncertain. Were the Internal Revenue Service to take the position that a credit default swap or other bullet-type swap is not a “notional principal contract” for federal income tax purposes, payments received by the Portfolio from such investments might be subject to income taxes.
Swaps are marked to market daily based upon quotations from market makers and the change in value, if any, is recorded as unrealized gain or loss in the Statement of Operations. Payments received or made at the beginning of the measurement
| | | | |
| 18 | | PIMCO Variable Insurance Trust | | |
| | |
| |
| | | June 30, 2006 (Unaudited) |
period are reflected as such in the Statement of Assets and Liabilities. These upfront payments are recorded as realized gain or loss in the Statement of Operations upon termination or maturity of the swap. A liquidation payment received or made at the termination of the swap is recorded as realized gain or loss in the Statement of Operations. Net periodic payments received or paid by the Portfolio are included as part of realized gain or loss in the Statement of Operations. Entering into these agreements involves, to varying degrees, elements of credit, market and documentation risk in excess of the amounts recognized in the Statement of Assets and Liabilities. Such risks involve the possibility that there will be no liquid market for these agreements, that the counterparty to the agreements may default on its obligation to perform or disagree as to the meaning of contractual terms in the agreements and that there may be unfavorable changes in interest rates.
U.S. Government Agencies or Government-Sponsored Enterprises. Securities issued by U.S. Government agencies or government-sponsored enterprises may not be guaranteed by the U.S. Treasury. The Government National Mortgage Association (“GNMA”), a wholly owned U.S. Government corporation, is authorized to guarantee, with the full faith and credit of the U.S. Government, the timely payment of principal and interest on securities issued by institutions approved by GNMA and backed by pools of mortgages insured by the Federal Housing Administration or guaranteed by the Department of Veterans Affairs. Government-related guarantors (i.e., not backed by the full faith and credit of the U.S. Government) include the Federal National Mortgage Association (“FNMA” or “Fannie Mae”) and the Federal Home Loan Mortgage Corporation (“FHLMC” or “Freddie Mac”). Pass-through securities issued by FNMA are guaranteed as to timely payment of principal and interest by FNMA but are not backed by the full faith and credit of the U.S. Government. FHLMC guarantees the timely payment of interest and ultimate collection of principal, but its participation certificates are not backed by the full faith and credit of the U.S. Government.
New Accounting Policies. In July 2006, the Financial Accounting Standards Board issued Interpretation No. 48, “Accounting for Uncertainty in Income Taxes—an Interpretation of FASB Statement No. 109” (the “Interpretation”). The Interpretation is effective for fiscal years beginning after December 15, 2006. Management is currently evaluating the application of the Interpretation to the Portfolio and will provide additional information in relation to the Interpretation in the Portfolio’s annual financial statements for the year ending December 31, 2006.
3. FEES, EXPENSES, AND RELATED PARTY TRANSACTIONS
Investment Advisory Fee. PIMCO is a majority-owned subsidiary of Allianz Global Investors of America L.P. (“AGI”), and serves as investment adviser (the “Adviser”) to the Trust, pursuant to an investment advisory contract. The Adviser receives a monthly fee at an annual rate based on average daily net assets of the Portfolio. The Advisory Fee is charged at an annual rate of 0.25%.
Administration Fee. PIMCO serves as administrator (the “Administrator”), and provides administrative services to the Trust for which it receives a monthly administrative fee based on average daily net assets of the Portfolio. As the Administrator, PIMCO bears the costs of various third-party services, including audit, custodial, portfolio accounting, legal, transfer agency and printing costs. The Administration Fee is charged at the annual rate of 0.25%.
Distribution and Servicing Fees. Allianz Global Investors Distributors LLC (“AGID”) is an indirect wholly-owned subsidiary of AGI and serves as the distributor of the Trust’s shares. The Trust is permitted to reimburse AGID on a quarterly basis, out of the Administrative Class assets of the Portfolio in the amount of 0.15% on an annual basis of the average daily net assets of that class, for payments made to financial intermediaries that provide services in connection with the distribution of shares or administration of plans or programs that use Portfolio shares as their funding medium. The effective rate paid to AGID was 0.15% during the current fiscal year.
Expenses. The Trust is responsible for the following expenses: (i) salaries and other compensation of any of the Trust’s executive officers and employees who are not officers, directors, stockholders or employees of PIMCO or its subsidiaries or affiliates; (ii) taxes and governmental fees; (iii) brokerage fees and commissions and other portfolio transaction expenses; (iv) the costs of borrowing money, including interest expenses and bank overdraft charges; (v) fees and expenses of the Trustees who are not “interested persons” of PIMCO or the Trust, and any counsel retained exclusively for their benefit; (vi) extraordinary expenses, including costs of litigation and indemnification expenses; (vii) organization expenses and (viii) any expenses allocated or allocable to a specific class of shares, which include service fees payable with respect to the Administrative Class shares and may include certain other expenses as permitted by the Trust’s Multiple Class Plan adopted pursuant to Rule 18f-3 under the Act and subject to review and approval by the Trustees. The ratio of expenses to average net assets per share class, as disclosed in the Financial Highlights, may differ from the annual portfolio operating expenses per share class as disclosed in the Prospectus for the reasons set forth above.
For the current period ended June 30, 2006, each unaffiliated Trustee received an annual retainer of $15,000, plus $2,000 for each Board of Trustees quarterly meeting attended, $500 for each Board of Trustees committee meeting attended and $500 for each special board meeting attended, plus reimbursement of related expenses. In addition, each Committee Chair received an additional annual retainer of $500 and each Audit Committee Chair received an additional annual retainer of $1,500. These expenses are allocated on a pro-rata basis to each Portfolio of the Trust according to its respective net assets. The Trust pays no compensation directly to any Trustee or any other officer who is affiliated with the Administrator, all of whom receive remuneration for their services to the Trust from the Administrator or its affiliates.
4. PURCHASES AND SALES OF SECURITIES
The length of time the Portfolio has held a particular security is not generally a consideration in investment decisions. A change in the securities held by the Portfolio is known as “portfolio turnover”. The Portfolio may engage in frequent and active trading of portfolio securities to achieve its investment objective, particularly during periods of volatile market movements. High portfolio turnover (e.g., over 100%) involves correspondingly greater expenses to the Portfolio, including brokerage commissions or dealer mark-ups and other transaction costs on the sale of securities and reinvestments in other securities. Such sales may also result in realization of taxable capital gains, including short-term capital gains (which are generally taxed at ordinary income tax rates). The trading costs and tax effects associated with portfolio turnover may adversely affect the Portfolio’s performance.
Purchases and sales of securities (excluding short-term investments) for the period ended June 30, 2006 were as follows (amounts in thousands):
| | | | | | | | | | | | |
| U.S Government/Agency | | | | All Other |
| Purchases | | | | Sales | | | | Purchases | | | | Sales |
| $ 3,483,913 | | | | $ 3,849,012 | | | | $ 258,320 | | | | $ 224,153 |
| | | | | | |
| | | Semiannual Report | | June 30, 2006 | | 19 |
Notes to Financial Statements (Cont.)
5. TRANSACTIONS IN WRITTEN CALL AND PUT OPTIONS
Transactions in written call and put options were as follows (amounts in thousands, except number of contracts):
| | | | | | | | | | | | | | | | | | | | | | | |
| | | | | # of
Contracts |
| | | |
| Notional
Amount
in $ |
| | | |
| Notional
Amount
in GBP |
| | | | | Premium | |
Balance at 12/31/2005 | | | | 6,803 | | | | | $ | 359,600 | | | | | GBP | 57,200 | | | | | $ | 7,607 | |
Sales | | | | 6,512 | | | | | | 544,200 | | | | | | 0 | | | | | | 5,852 | |
Closing Buys | | | | 0 | | | | | | (169,900 | ) | | | | | 0 | | | | | | (1,267 | ) |
Expirations | | | | (5,062 | ) | | | | | (98,700 | ) | | | | | (3,300 | ) | | | | | (2,085 | ) |
Exercised | | | | (223 | ) | | | | | 0 | | | | | | 0 | | | | | | (160 | ) |
Balance at 06/30/2006 | | | | 8,030 | | | | | $ | 635,200 | | | | | GBP | 53,900 | | | | | $ | 9,947 | |
6. REORGANIZATION
The Acquiring Portfolio (“Total Return Portfolio”), as listed below, acquired the assets and certain liabilities of the Acquired Fund (“CIGNA Times Square VP Core Plus Bond Fund”), also listed below, in a tax-free exchange for shares of the Acquiring Portfolio, pursuant to a plan of reorganization approved by the Acquired Portfolio’s shareholders (shares and amounts in thousands):
| | | | | | | | | | | | | | | | | | | | | |
| Acquiring Portfolio | | Acquired Fund | | Date | | Shares Issued by
Acquiring
Portfolio | | Value of Shares Issued by
Acquiring
Portfolio | | Total Net
Assets of
Acquired Fund | | Total Net Assets of
Acquiring
Portfolio | | Total net Assets of
Acquiring
Portfolio After
Acquisition | | Acquired Fund’s
Unrealized
Appreciation |
Total Return Portfolio | | Times Square VP Core Plus Bond Fund | | April 22, 2005 | | 8,435 | | $ | 88,822 | | $ | 88,822 | | $ | 2,474,546 | | $ | 2,563,368 | | $ | 710 |
7. SHARES OF BENEFICIAL INTEREST
The Portfolio may issue an unlimited number of shares of beneficial interest with a $0.001 par value. Changes in shares of beneficial interest were as follows (shares and amounts in thousands):
| | | | | | | | | | | | | | | | | | |
| | | | | Six Months Ended 06/30/2006 | | | | | Year Ended 12/31/2005 | |
| | | | | Shares | | | Amount | | | | | Shares | | | Amount | |
| | | | | | |
Receipts for shares sold | | | | | | | | | | | | | | | | | | |
Institutional Class | | | | 3,699 | | | $ | 37,370 | | | | | 4,171 | | | $ | 43,745 | |
Administrative Class | | | | 38,033 | | | | 384,517 | | | | | 60,180 | | | | 630,483 | |
Advisor Class | | | | 455 | | | | 4,550 | | | | | 0 | | | | 0 | |
Issued in reorganization | | | | | | | | | | | | | | | | | | |
Institutional Class | | | | 0 | | | | 0 | | | | | 8,435 | | | | 88,822 | |
Administrative Class | | | | 0 | | | | 0 | | | | | 0 | | | | 0 | |
Advisor Class | | | | 0 | | | | 0 | | | | | 0 | | | | 0 | |
Issued as reinvestment of distributions | | | | | | | | | | | | | | | | | | |
Institutional Class | | | | 325 | | | | 3,281 | | | | | 683 | | | | 7,097 | |
Administrative Class | | | | 4,979 | | | | 50,219 | | | | | 10,667 | | | | 110,757 | |
Advisor Class | | | | 2 | | | | 15 | | | | | 0 | | | | 0 | |
Cost of shares redeemed | | | | | | | | | | | | | | | | | | |
Institutional Class | | | | (2,642 | ) | | | (26,672 | ) | | | | (5,309 | ) | | | (55,888 | ) |
Administrative Class | | | | (24,338 | ) | | | (245,706 | ) | | | | (30,537 | ) | | | (319,629 | ) |
Advisor Class | | | | (1 | ) | | | (13 | ) | | | | 0 | | | | 0 | |
Net increase resulting from
Portfolio share transactions | | | | 20,512 | | | $ | 207,561 | | | | | 48,290 | | | $ | 505,387 | |
The following schedule shows the number of shareholders each owning 5% or more of the Portfolio and the total percentage of the Portfolio held by such shareholders:
| | | | | | | |
| | | | | Number of
Shareholders | | % of Portfolio
Held | |
Institutional Class | | | | 4 | | 90 | |
Administrative Class | | | | 4 | | 55 | * |
Advisor Class | | | | 2 | | 98 | |
* One of the shareholders, Allianz Life Insurance Co. of North America, is an indirect wholly owned subsidiary of AGI and a related party to the Portfolio.
| | | | |
| 20 | | PIMCO Variable Insurance Trust | | |
| | |
| |
| | | June 30, 2006 (Unaudited) |
8. FEDERAL INCOME TAX MATTERS
As of June 30, 2006, the aggregate cost of investments was the same for federal income tax and financial statement purposes. The net unrealized appreciation (depreciation) of investment securities for federal income tax purposes is as follows (amounts in thousands):
| | | | |
Aggregate
Gross
Unrealized
Appreciation | | Aggregate
Gross
Unrealized
(Depreciation) | | Net
Unrealized
(Depreciation) |
$ 23,153 | | $ (58,324) | | $ (35,171) |
9. REGULATORY AND LITIGATION MATTERS
On June 1, 2004, the Attorney General of the State of New Jersey announced that it had dismissed PIMCO from a complaint filed by the New Jersey Attorney General on February 17, 2004, and that it had entered into a settlement agreement (the “New Jersey Settlement”) with Allianz Global Investors of America L.P. (“AGI”) (formerly known as Allianz Dresdner Asset Management of America L.P.), PEA Capital LLC (an entity affiliated with PIMCO through common ownership) (“PEA”) and Allianz Global Investors Distributors LLC (“AGID”), in connection with the same matter. In the New Jersey Settlement, AGI, PEA and AGID neither admitted nor denied the allegations or conclusions of law, but did agree to pay New Jersey a civil fine of $15 million and $3 million for investigative costs and further potential enforcement initiatives against unrelated parties. They also undertook to implement certain governance changes. The complaint relating to the New Jersey Settlement alleged, among other things, that AGI, PEA and AGID had failed to disclose that they improperly allowed certain hedge funds to engage in “market timing” in certain funds. The complaint sought injunctive relief, civil monetary penalties, restitution and disgorgement of profits.
Since February 2004, PIMCO, AGI, PEA, AGID, and certain of their affiliates, including the PIMCO Funds, the Allianz Funds (formerly known as PIMCO Funds: Multi-Manager Series), and the Trustees and employees of the PIMCO Funds, have been named as defendants in fifteen lawsuits filed in various jurisdictions. Eleven of those lawsuits concern “market timing,” and they have been transferred to and consolidated for pre-trial proceedings in a multi-district litigation proceeding in the U.S. District Court for the District of Maryland; the other four lawsuits concern “revenue sharing” and have been consolidated into a single action in the U.S. District Court for the District of Connecticut. The lawsuits have been commenced as putative class actions on behalf of investors who purchased, held or redeemed shares of the various series of the PIMCO Funds and the Allianz Funds during specified periods, or as derivative actions on behalf of the PIMCO Funds and Allianz Funds.
The market timing actions in the District of Maryland generally allege that certain hedge funds were allowed to engage in “market timing” in certain of PIMCO Funds and the Allianz Funds and the this alleged activity was not disclosed. Pursuant to tolling agreements entered into with the derivative and class action plaintiffs, PIMCO, the Trustees, and certain employees of PIMCO who were previously named as defendants have all been dropped as defendants in the market timing actions; the plaintiffs continue to assert claims on behalf of the shareholders of the PIMCO Funds or on behalf of the PIMCO Funds themselves against other defendants. By order dated November 3, 2005, the U.S. District Court for the District of Maryland granted the PIMCO Funds’ motion to dismiss claims asserted against it in a consolidated amended complaint where the PIMCO Funds were named, in the complaint, as a nominal defendant. The revenue sharing action in the District of Connecticut generally alleges that fund assets were inappropriately used to pay brokers to promote the PIMCO Funds and Allianz Funds, including directing fund brokerage transactions to such brokers, and that such alleged arrangements were not fully disclosed to shareholders. On August 11, 2005 the U.S. District Court for the District of Connecticut conducted a hearing on defendants’ motion to dismiss the consolidated amended complaint in the revenue sharing action but has not yet ruled on the motion to dismiss. The market timing and revenue sharing lawsuits seek, among other things, unspecified compensatory damages plus interest and, in some cases, punitive damages, the rescission of investment advisory contracts, the return of fees paid under those contracts and restitution.
Under Section 9(a) of the Investment Company Act of 1940, as amended (“1940 Act”), if the New Jersey Settlement or any of the lawsuits described above were to result in a court injunction against AGI, PEA, AGID and/or their affiliates, PIMCO could, in the absence of exemptive relief granted by the SEC, be barred from serving as an investment adviser, and AGID could be barred from serving as principal underwriter, to any registered investment company, including the Portfolios of the Trust. In connection with an inquiry from the SEC concerning the status of the New Jersey Settlement under Section 9(a), PEA, AGID, AGI and certain of their affiliates (including PIMCO) (together, the “Applicants”) have sought exemptive relief from the SEC under Section 9(c) of the 1940 Act. The SEC has granted the Applicants a temporary exemption from the provisions of Section 9(a) with respect to the New Jersey Settlement until the earlier of (i) September 13, 2006 and (ii) the date on which the SEC takes final action on their application for a permanent order. There is no assurance that the SEC will issue a permanent order.
Two nearly identical class action civil complaints have been filed in August 2005, in the Northern District of Illinois Eastern Division alleging that the plaintiffs each purchased and sold a 10-year Treasury note futures contract and suffered damages from an alleged shortage when PIMCO held both physical and futures positions in 10-year Treasury notes for its client accounts. The two actions have been consolidated into one action, and the two separate complaints have been replaced by a consolidated complaint. PIMCO is a named defendant, and the PIMCO Funds have been added as a defendant, to the consolidated action. PIMCO strongly believes the complaint (and any consolidated complaint filed hereafter) is without merit and intends to vigorously defend itself.
Certain Portfolios of the Trust were recently served in an adversary proceeding brought by the Official Committee of Asbestos Claimants of G-I Holdings, Inc. in G-I Holdings, Inc.’s bankruptcy in the District of New Jersey. PIMCO was previously named in this lawsuit and remains a defendant. The plaintiff seeks to recover for the bankruptcy estate assets that were transferred by the predecessor entity of G-I Holdings, Inc. to a wholly-owned subsidiary in 1994. The subsidiary has since issued notes, of which certain Portfolios of the Trust are alleged to be holders. The complaint alleges that in 2000, more than two hundred noteholders—including certain Portfolios of the Trust—were granted a second priority lien on the assets of the subsidiary in exchange for their consent to a refinancing transaction and the granting of a first priority lien to the lending banks. The plaintiff is seeking invalidation of the lien in favor of the noteholders and/or the value of the lien.
It is possible that these matters and/or other developments resulting from these matters could result in increased fund redemptions or other adverse consequences to the Portfolios. However, PIMCO and AGID believe that these matters are not likely to have a material adverse effect on the Portfolios or on PIMCO’s or AGID’s ability to perform their respective investment advisory or distribution services relating to the Portfolios.
| | | | | | |
| | | Semiannual Report | | June 30, 2006 | | 21 |
Investment Adviser and Administrator
Pacific Investment Management Company LLC
840 Newport Center Drive
Newport Beach, California 92660
Distributor
Allianz Global Investors Distributors LLC
2187 Atlantic Street
Stamford, Connecticut 06902
Custodian
State Street Bank & Trust Company
801 Pennsylvania
Kansas City, Missouri 64105
Transfer Agent
Boston Financial Data Services–Midwest
330 W. 9th Street
Kansas City, Missouri 64105
Legal Counsel
Dechert LLP
1775 I Street, N.W.
Washington, D.C. 20006
Independent Registered Public Accounting Firm
PricewaterhouseCoopers LLP
1055 Broadway
Kansas City, Missouri 64105
P I M C O

Share Class Institutional
Semiannual Report June 30, 2006
PIMCO Variable Insurance Trust
Total Return Portfolio
Table of Contents
This material is authorized for use only when preceded or accompanied by the current PIMCO Variable Insurance Trust (the “Trust”) prospectus. Investors should consider the investment objectives, risks, charges and expenses of this Trust carefully before investing. Ask your financial professional to explain all charges that may apply. This and other information is contained in the Trust’s prospectus. The variable product prospectus may be obtained by contacting your Investment Consultant. Please read the Trust and variable product prospectus carefully before you invest or send money.
Chairman’s Letter
Dear PIMCO Variable Insurance Trust Shareholder:
It is our pleasure to present to you the semiannual report for the PIMCO Variable Insurance Trust covering the six-month period ended June 30, 2006.
Highlights of the global bond markets during the six-month period included:
| | n | | Most fixed-income sectors lost ground during the first half of 2006, as concern about accelerating inflation and central bank tightening pushed interest rates higher worldwide. The benchmark Lehman Brothers Aggregate Bond Index (which includes Treasury, Investment-Grade Corporate, and Residential Mortgage-Backed Securities) returned -0.72% for the first six months of the year. On June 30, the benchmark ten-year Treasury yielded 5.14%, 0.75% higher than at the start of the year. The U.S. yield curve remained flat as shorter-maturity yields rose by a comparable amount. |
| | n | | The Federal Reserve tightened four times during the reporting period, bringing the Federal Funds Rate to 5.25%. The increase near the end of the period was the Federal Reserve’s 17th consecutive rate hike since the start of its tightening cycle in 2004. The Federal Reserve was not alone, as central banks in Europe, India, and China tightened credit in unison for the first time since 2000. The Bank of Japan, whose zero-interest-rate policy has flooded global markets with liquidity, looked set to reverse this policy in the coming months. |
In these pages please find a more complete Portfolio review as it relates to financial-market activities, as well as details about total-return investment performance for the six-month reporting period. Thank you for the trust you have placed in us. We will continue to work diligently to meet your investment needs.
Sincerely,
Brent R. Harris
Chairman, PIMCO Variable Insurance Trust
July 31, 2006
| | | | | | |
| | | Semiannual Report | | June 30, 2006 | | 1 |
Important Information About the Portfolio
PIMCO Variable Insurance Trust (the “Trust”) is an open-end management investment company currently consisting of nineteen separate investment portfolios, including the Total Return Portfolio (the “Portfolio”). The Portfolio is only available as a funding vehicle under variable life insurance policies or variable annuity contracts issued by insurance companies (“Variable Contracts”). Individuals may not purchase shares of the Portfolio directly. Shares of the Portfolio also may be sold to qualified pension and retirement plans outside of the separate account context.
We believe that bond funds have an important role to play in a well diversified investment portfolio. It is important to note, however, that in an environment where interest rates may trend upward, rising rates would negatively impact the performance of most bond funds, and fixed-income securities held by a fund are likely to decrease in value. The price volatility of fixed-income securities can also increase during periods of rising interest rates resulting in increased losses to a fund. Bond funds and individual bonds with a longer duration (a measure of the expected life of a security) tend to be more sensitive to changes in interest rates, usually making them more volatile than securities or funds with shorter durations. The longer-term performance of most bond funds has benefited from capital gains in part resulting from an extended period of declining interest rates. In the event interest rates increase, these capital gains should not be expected to recur.
The Portfolio may be subject to various risks in addition to those described above. Some of these risks may include, but are not limited to, the following: credit risk, high yield risk, market risk, issuer risk, liquidity risk, derivatives risk, mortgage risk, non-U.S. investment risk, currency risk, leveraging risk and management risk. A complete description of these risks is contained in the Portfolio’s prospectus. The Portfolio may use derivative instruments for hedging purposes or as part of an investment strategy. Use of these instruments may involve certain costs and risks such as liquidity risk, interest rate risk, market risk, credit risk, management risk and the risk that the Portfolio could not close out a position when it would be most advantageous to do so. A Portfolio investing in derivatives could lose more than the principal amount invested in these instruments. Investing in non-U.S. securities may entail risk due to non-U.S. economic and political developments; this risk may be increased when investing in emerging markets.
On the performance summary page in this Semiannual Report, the Total Return Investment Performance table measures performance assuming that all dividend and capital gain distributions were reinvested.
An investment in the Portfolio is not a deposit of a bank and is not guaranteed or insured by the Federal Deposit Insurance Corporation or any other government agency. It is possible to lose money on investments in the Portfolio.
PIMCO has adopted written proxy voting policies and procedures (“Proxy Policy”) as required by Rule 206(4)-6 under the Investment Advisers Act of 1940. The Proxy Policy has been adopted by the Trust as the policies and procedures that PIMCO will use when voting proxies on behalf of the Portfolio. Copies of the written Proxy Policy and the factors that PIMCO may consider in determining how to vote proxies for the Portfolio, and information about how the Portfolio voted proxies relating to portfolio securities held during the most recent twelve-month period ended June 30, are available without charge, upon request, by calling the Trust at 1-866-746-2606 and on the Securities and Exchange Commission’s (“SEC”) website at http://www.sec.gov.
The Portfolio files its complete schedule of portfolio holdings with the SEC for the first and third quarters of each fiscal year on Form N-Q. A copy of the Trust’s Form N-Q is available on the SEC’s website at http://www.sec.gov and may be reviewed and copied at the SEC’s Public Reference Room in Washington D.C. Information on the operation of the Public Reference Room may be obtained by calling 1-800-SEC-0330.
PIMCO Variable Insurance Trust is distributed by Allianz Global Investors Distributors LLC, 2187 Atlantic Street, Stamford, CT 06902.
| | | | |
| 2 | | PIMCO Variable Insurance Trust | | |
The following disclosure provides important information regarding the Portfolio’s Expense Example (“Example” or “Expense Example”), which appears in this Semiannual Report. Please refer to this information when reviewing the Expense Example for the Portfolio.
Example
As a shareholder of the Portfolio, you incur two types of costs: (1) transaction costs and (2) ongoing costs, including advisory and administrative fees; distribution and/or service (12b-1) fees (Administrative Class only); and other Portfolio expenses. The Example is intended to help you understand your ongoing costs (in dollars) of investing in the Portfolio and to compare these costs with the ongoing costs of investing in other mutual funds. The Expense Example does not reflect any fees or other expenses imposed by the Variable Contracts. If it did, the expenses reflected in the Expense Examples would be higher. The Example is based on an investment of $1,000 invested at the beginning of the period and held for the entire period indicated, which is from January 1, 2006 to June 30, 2006.
Actual Expenses
The information in the table under the heading “Actual Performance” provides information about actual account values and actual expenses. You may use the information in these columns, together with the amount you invested, to estimate the expenses that you paid over the period. Simply divide your account value by $1,000 (for example, an $8,600 account value divided by $1,000 = 8.60), then multiply the result by the number in the appropriate column for your share class, in the row titled “Expenses Paid During Period” to estimate the expenses you paid on your account during this period.
Hypothetical Example for Comparison Purposes
The information in the table under the heading “Hypothetical Performance (5% return before expenses)” provides information about hypothetical account values and hypothetical expenses based on the Portfolio’s actual expense ratio and an assumed rate of return of 5% per year before expenses, which is not the Portfolio’s actual return. The hypothetical account values and expenses may not be used to estimate the actual ending account balance or expenses you paid for the period. You may use this information to compare the ongoing costs of investing in the Portfolio and other portfolios. To do so, compare this 5% hypothetical example with the 5% hypothetical examples that appear in the shareholder reports of the other portfolios.
Please note that the expenses shown in the table are meant to highlight your ongoing costs only and do not reflect any transactional costs. Therefore, the information under the heading “Hypothetical Performance (5% return before expenses)” is useful in comparing ongoing costs only, and will not help you determine the relative total costs of owning different portfolios. In addition, if these transactional costs were included, your costs would have been higher.
The expense ratio may vary period to period because of various factors, such as an increase in expenses not covered by the advisory and administrative fees (such as expenses of the trustees and their counsel or litigation expense).
Portfolio Benchmark
Lehman Brothers Aggregate Bond Index represents securities that are taxable, and dollar denominated. The index covers the U.S. investment grade fixed rate bond market, with index components for government and corporate securities, mortgage pass-through securities, and asset-backed securities. These major sectors are subdivided into more specific indices that are calculated and reported on a regular basis. It is not possible to invest directly in this index.
| | | | | | |
| | | Semiannual Report | | June 30, 2006 | | 3 |
|
|
| PIMCO Total Return Portfolio |
|
Cumulative Returns Through June 30, 2006
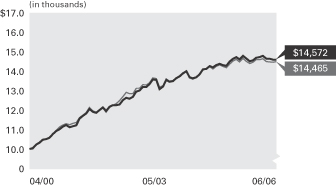
Total Return Portfolio Lehman Brothers
Institutional Class Aggregate Bond Index
------------------- --------------------
04/30/2000 $10,000 $10,000
05/31/2000 10,047 9,995
06/30/2000 10,233 10,203
07/31/2000 10,316 10,296
08/31/2000 10,472 10,445
09/30/2000 10,503 10,511
10/31/2000 10,567 10,580
11/30/2000 10,759 10,753
12/31/2000 10,914 10,953
01/31/2001 11,011 11,132
02/28/2001 11,141 11,229
03/31/2001 11,221 11,285
04/30/2001 11,111 11,238
05/31/2001 11,164 11,306
06/30/2001 11,202 11,349
07/31/2001 11,560 11,603
08/31/2001 11,694 11,736
09/30/2001 11,814 11,872
10/31/2001 12,042 12,121
11/30/2001 11,899 11,954
12/31/2001 11,845 11,878
01/31/2002 11,995 11,974
02/28/2002 12,129 12,090
03/31/2002 11,946 11,889
04/30/2002 12,167 12,119
05/31/2002 12,244 12,222
06/30/2002 12,248 12,328
07/31/2002 12,278 12,477
08/31/2002 12,506 12,688
09/30/2002 12,617 12,893
10/31/2002 12,573 12,834
11/30/2002 12,667 12,831
12/31/2002 12,938 13,096
01/31/2003 12,993 13,107
02/28/2003 13,179 13,288
03/31/2003 13,178 13,278
04/30/2003 13,321 13,388
05/31/2003 13,551 13,637
06/30/2003 13,529 13,610
07/31/2003 13,057 13,153
08/31/2003 13,192 13,240
09/30/2003 13,532 13,590
10/31/2003 13,437 13,464
11/30/2003 13,465 13,496
12/31/2003 13,611 13,633
01/31/2004 13,713 13,743
02/29/2004 13,863 13,892
03/31/2004 13,979 13,996
04/30/2004 13,672 13,632
05/31/2004 13,613 13,577
06/30/2004 13,674 13,654
07/31/2004 13,819 13,789
08/31/2004 14,081 14,052
09/30/2004 14,102 14,090
10/31/2004 14,247 14,208
11/30/2004 14,179 14,095
12/31/2004 14,298 14,225
01/31/2005 14,352 14,314
02/28/2005 14,294 14,230
03/31/2005 14,258 14,157
04/30/2005 14,464 14,348
05/31/2005 14,620 14,503
06/30/2005 14,693 14,582
07/31/2005 14,587 14,450
08/31/2005 14,771 14,635
09/30/2005 14,629 14,484
10/31/2005 14,480 14,370
11/30/2005 14,532 14,433
12/31/2005 14,670 14,570
01/31/2006 14,706 14,571
02/28/2006 14,770 14,619
03/31/2006 14,611 14,476
04/30/2006 14,619 14,450
05/31/2006 14,572 14,434
06/30/2006 14,572 14,465
$10,000 invested at the beginning of the first full month following the inception date of the Portfolio’s Institutional Class.
Sector Breakdown‡
| | |
U.S. Government Agencies | | 44.8% |
Short-Term Instruments | | 42.3% |
Corporate Bonds & Notes | | 4.6% |
Mortgage-Backed Securities | | 3.2% |
Other | | 5.1% |
| | ‡ | % of Total Investments as of June 30, 2006 |
| | | | | | | | | | | | |
| Average Annual Total Return for the period ended June 30, 2006 |
| | | | | | | 6 Months* | | 1 Year | | 5 Years | | Since Inception
(04/10/00)** |
| | |
| | PIMCO Total Return Portfolio Institutional Class | | -0.67% | | -0.82% | | 5.40% | | 6.03% |
| | |
| | Lehman Brothers Aggregate Bond Index | | -0.72% | | -0.81% | | 4.97% | | 6.04% |
All Portfolio returns are net of fees and expenses.
* Cumulative return.
** The Institutional Class shares operations on 04/10/00. Index comparisons began on 03/31/00.
Past performance is no guarantee of future results. The performance quoted represents past performance. Investment return and principal value will fluctuate so the Portfolio shares, when redeemed, may be worth more or less than their original cost. The Portfolio’s performance does not reflect the deduction of additional charges and expenses imposed in connection with investing in Variable Contracts, which will reduce returns. Current performance may be lower or higher than the performance data quoted. Performance data current to the most recent month-end is available by calling (800) 927-4648.
| | | | | | | | |
| Expense Example | | Actual Performance | | | | Hypothetical Performance |
| | | | | | | (5% return before expenses) |
Beginning Account Value (01/01/06) | | $ | 1,000.00 | | | | $ | 1,000.00 |
Ending Account Value (06/30/06) | | $ | 993.30 | | | | $ | 1,022.32 |
Expenses Paid During Period† | | $ | 2.47 | | | | $ | 2.51 |
† Expenses are equal to the Portfolio’s Institutional Class annualized expense ratio of 0.50%, multiplied by the average account value over the period, multiplied by 181/365 (to reflect the one-half year period). Overall fees and expenses of investing in the Portfolio will be higher because the example does not reflect Variable Contract fees and expenses.
Please refer to page 3 herein for a description of the Portfolio’s benchmark and an explanation of the information presented in the above Expense Example.
Portfolio Insights
| » | | The PIMCO Total Return Portfolio seeks to achieve its investment objective by investing under normal circumstances at least 65% of its total assets in a diversified portfolio of Fixed-Income Instruments of varying maturities. |
| » | | The Portfolio’s above-benchmark duration detracted from returns as yields rose in the first half of the year. |
| » | | An emphasis on short-term maturities detracted from performance as short-term yields rose more than longer-dated yields. The Federal Reserve continued with its tightening policy, sending short-term rates higher while intermediate- and longer-term rates shifted higher. |
| » | | An overweight to mortgages contributed to returns as this sector outperformed like-duration Treasuries. |
| » | | An underweight to corporate securities detracted from returns as this sector outperformed like-duration Treasuries. |
| » | | Strategies designed to benefit when Euroland bonds underperform Treasuries added to returns as European yields increased more than yields in the U.S. |
| » | | An allocation to the Yen and the Euro was positive for returns, as both currencies appreciated relative to the dollar. |
| » | | Emerging Market bonds added to performance, as strong demand for their attractive yields and improving credit fundamentals caused yield premiums to decline. |
| » | | A tactical allocation to municipal bonds was positive for performance as municipal yields rose less than Treasury yields. |
| | | | | | |
| 4 | | PIMCO Variable Insurance Trust | | | | |
|
|
| Financial Highlights Total Return Portfolio |
| | | | | | | | | | | | | | | | | | | | | | | | |
| Selected Per Share Data for the Year or Period Ended: | | 06/30/2006+ | | | 12/31/2005 | | | 12/31/2004 | | | 12/31/2003 | | | 12/31/2002 | | | 12/31/2001 | |
| | | | | | |
Institutional Class | | | | | | | | | | | | | | | | | | | | | | | | |
| Net asset value beginning of period | | $ | 10.24 | | | $ | 10.51 | | | $ | 10.36 | | | $ | 10.23 | | | $ | 9.89 | | | $ | 9.77 | |
| Net investment income (a) | | | 0.22 | | | | 0.39 | | | | 0.20 | | | | 0.27 | | | | 0.43 | | | | 0.50 | |
| Net realized/unrealized gain (loss) on investments (a) | | | (0.29 | ) | | | (0.12 | ) | | | 0.31 | | | | 0.25 | | | | 0.47 | | | | 0.31 | |
| Total income (loss) from investment operations | | | (0.07 | ) | | | 0.27 | | | | 0.51 | | | | 0.52 | | | | 0.90 | | | | 0.81 | |
| Dividends from net investment income | | | (0.22 | ) | | | (0.37 | ) | | | (0.21 | ) | | | (0.31 | ) | | | (0.43 | ) | | | (0.50 | ) |
| Distributions from net realized capital gains | | | 0.00 | | | | (0.17 | ) | | | (0.15 | ) | | | (0.08 | ) | | | (0.13 | ) | | | (0.19 | ) |
| Total distributions | | | (0.22 | ) | | | (0.54 | ) | | | (0.36 | ) | | | (0.39 | ) | | | (0.56 | ) | | | (0.69 | ) |
| Net asset value end of period | | $ | 9.95 | | | $ | 10.24 | | | $ | 10.51 | | | $ | 10.36 | | | $ | 10.23 | | | $ | 9.89 | |
| Total return | | | (0.67 | )% | | | 2.60 | % | | | 5.05 | % | | | 5.20 | % | | | 9.23 | % | | | 8.53 | % |
| Net assets end of period (000s) | | $ | 153,328 | | | $ | 143,720 | | | $ | 63,646 | | | $ | 75,540 | | | $ | 46,548 | | | $ | 35,231 | |
| Ratio of expenses to average net assets | | | 0.50 | %* | | | 0.50 | % | | | 0.50 | % | | | 0.50 | % | | | 0.50 | % | | | 0.50 | % |
| Ratio of net investment income to average net assets | | | 4.35 | %* | | | 3.69 | % | | | 1.92 | % | | | 2.60 | % | | | 4.23 | % | | | 5.00 | % |
| Portfolio turnover rate | | | 168 | % | | | 344 | % | | | 373 | % | | | 193 | % | | | 222 | % | | | 217 | % |
+ Unaudited
* Annualized
(a) Per share amounts based on average number of shares outstanding during the period.
| | | | | | |
| See Accompanying Notes | | Semiannual Report | | June 30, 2006 | | 5 |
| | |
| |
| Statement of Assets and Liabilities Total Return Portfolio | | |
| | | | |
| (Amounts in thousands, except per share amounts) | | June 30, 2006
(Unaudited) | |
| |
Assets: | | | | |
Investments, at value | | $ | 3,407,611 | |
Cash | | | 61 | |
Foreign currency, at value | | | 81,813 | |
Receivable for investments sold | | | 15,669 | |
Receivable for investments sold on delayed-delivery basis | | | 919 | |
Receivable for Portfolio shares sold | | | 23,363 | |
Interest and dividends receivable | | | 9,921 | |
Variation margin receivable | | | 2,016 | |
Swap premiums paid | | | 731 | |
Unrealized appreciation on forward foreign currency contracts | | | 1,600 | |
Unrealized appreciation on swap agreements | | | 941 | |
| | | | 3,544,645 | |
| |
Liabilities: | | | | |
Payable for investments purchased | | $ | 539,396 | |
Payable for Portfolio shares redeemed | | | 2,491 | |
Written options outstanding | | | 12,179 | |
Dividends payable | | | 1,607 | |
Accrued investment advisory fee | | | 644 | |
Accrued administration fee | | | 644 | |
Accrued servicing fee | | | 330 | |
Swap premiums received | | | 3,127 | |
Unrealized depreciation on forward foreign currency contracts | | | 12,289 | |
Unrealized depreciation on swap agreements | | | 1,949 | |
| | | | 574,656 | |
| |
Net Assets | | $ | 2,969,989 | |
| |
Net Assets Consist of: | | | | |
Paid in capital | | $ | 3,062,923 | |
Undistributed net investment income | | | 14,505 | |
Accumulated undistributed net realized (loss) | | | (34,688 | ) |
Net unrealized (depreciation) | | | (72,751 | ) |
| | | $ | 2,969,989 | |
| |
Net Assets: | | | | |
Institutional Class | | $ | 153,328 | |
Administrative Class | | | 2,812,124 | |
Advisor Class | | | 4,537 | |
| |
Shares Issued and Outstanding: | | | | |
Institutional Class | | | 15,415 | |
Administrative Class | | | 282,722 | |
Advisor Class | | | 456 | |
| |
Net Asset Value and Redemption Price Per Share (Net Assets Per Share Outstanding) | | | | |
Institutional Class | | $ | 9.95 | |
Administrative Class | | | 9.95 | |
Advisor Class | | | 9.95 | |
| |
Cost of Investments Owned | | $ | 3,442,782 | |
Cost of Foreign Currency Held | | $ | 80,689 | |
Premiums Received on Written Options | | $ | 9,947 | |
| | | | |
| 6 | | PIMCO Variable Insurance Trust | | See Accompanying Notes |
| | |
| |
| Statement of Operations Total Return Portfolio | | |
| | | | |
| (Amounts in Thousands) | | Six Months Ended
June 30, 2006
(Unaudited) | |
| |
Investment Income: | | | | |
Interest | | $ | 69,794 | |
Dividends | | | 409 | |
Miscellaneous income | | | 28 | |
Total Income | | | 70,231 | |
| |
Expenses: | | | | |
Investment advisory fees | | | 3,619 | |
Administration fees | | | 3,619 | |
Servicing fees – Administrative Class | | | 2,060 | |
Distribution and/or serving fees – Advisor Class | | | 1 | |
Trustees’ fees | | | 17 | |
Total Expenses | | | 9,316 | |
| |
Net Investment Income | | | 60,915 | |
| |
Net Realized and Unrealized Gain (Loss): | | | | |
Net realized (loss) on investments | | | (10,853 | ) |
Net realized (loss) on futures contracts, options and swaps | | | (5,390 | ) |
Net realized (loss) on foreign currency transactions | | | (2,076 | ) |
Net change in unrealized (depreciation) on investments | | | (42,712 | ) |
Net change in unrealized (depreciation) on futures contracts, options and swaps | | | (30,889 | ) |
Net change in unrealized appreciation on translation of assets and liabilities denominated in foreign currencies | | | 7,617 | |
Net (Loss) | | | (84,303 | ) |
| |
Net (Decrease) in Net Assets Resulting from Operations | | $ | (23,388 | ) |
| | | | | | |
| See Accompanying Notes | | Semiannual Report | | June 30, 2006 | | 7 |
| | |
| |
| Statements of Changes in Net Assets Total Return Portfolio | | |
| | | | | | | | |
| (Amounts in Thousands) | | Six Months Ended June 30, 2006
(Unaudited) | | | Year Ended
December 31, 2005 | |
| | |
Increase (Decrease) in Net Assets from: | | | | | | | | |
| | |
Operations: | | | | | | | | |
Net investment income | | $ | 60,915 | | | $ | 89,824 | |
Net realized gain (loss) | | | (18,319 | ) | | | 3,530 | |
Net change in unrealized (depreciation) | | | (65,984 | ) | | | (30,402 | ) |
Net increase (decrease) resulting from operations | | | (23,388 | ) | | | 62,952 | |
| | |
Distributions to Shareholders: | | | | | | | | |
| From net investment income | | | | | | | | |
Institutional Class | | | (3,281 | ) | | | (4,842 | ) |
Administrative Class | | | (58,991 | ) | | | (86,714 | ) |
Advisor Class | | | (15 | ) | | | 0 | |
| From net realized capital gains | | | | | | | | |
Institutional Class | | | 0 | | | | (2,255 | ) |
Administrative Class | | | 0 | | | | (42,750 | ) |
Advisor Class | | | 0 | | | | 0 | |
| | |
Total Distributions | | | (62,287 | ) | | | (136,561 | ) |
| | |
Portfolio Share Transactions: | | | | | | | | |
| Receipts for shares sold | | | | | | | | |
Institutional Class | | | 37,370 | | | | 43,745 | |
Administrative Class | | | 384,517 | | | | 630,483 | |
Advisor Class | | | 4,550 | | | | 0 | |
| Issued in reorganization | | | | | | | | |
Institutional Class | | | 0 | | | | 88,822 | |
Administrative Class | | | 0 | | | | 0 | |
Advisor Class | | | 0 | | | | 0 | |
| Issued as reinvestment of distributions | | | | | | | | |
Institutional Class | | | 3,281 | | | | 7,097 | |
Administrative Class | | | 50,219 | | | | 110,757 | |
Advisor Class | | | 15 | | | | 0 | |
| Cost of shares redeemed | | | | | | | | |
Institutional Class | | | (26,672 | ) | | | (55,888 | ) |
Administrative Class | | | (245,706 | ) | | | (319,629 | ) |
Advisor Class | | | (13 | ) | | | 0 | |
Net increase resulting from Portfolio share transactions | | | 207,561 | | | | 505,387 | |
| | |
Total Increase in Net Assets | | | 121,886 | | | | 431,778 | |
| | |
Net Assets: | | | | | | | | |
Beginning of period | | | 2,848,103 | | | | 2,416,325 | |
End of period* | | $ | 2,969,989 | | | $ | 2,848,103 | |
| | |
*Including undistributed net investment income of: | | $ | 14,505 | | | $ | 15,877 | |
| | | | |
| 8 | | PIMCO Variable Insurance Trust | | See Accompanying Notes |
| | |
| |
| Schedule of Investments Total Return Portfolio | | June 30, 2006 (Unaudited) |
| | | | | | | | |
| | | | | PRINCIPAL | | | | |
| | | | | AMOUNT | | | | VALUE |
| | | | | (000S) | | | | (000S) |
| | | | | | | | | |
| BANK LOAN OBLIGATIONS 0.1% |
| Cablevision Systems Corp. | | | | | | | | |
6.670% due 02/24/2013 | | $ | | 7 | | $ | | 6 |
6.740% due 02/24/2013 | | | | 743 | | | | 740 |
|
| CSC Holdings, Inc. | | | | | | | | |
6.880% due 02/24/2013 | | | | 743 | | | | 740 |
6.988% due 02/24/2013 | | | | 1,108 | | | | 1,104 |
| | | | | | | | |
|
Total Bank Loan Obligations
(Cost $2,600) | | | | 2,590 |
| | | | | | | | |
|
| |
| CORPORATE BONDS & NOTES 5.3% |
| |
| BANKING & FINANCE 3.3% | | | | | | | | |
| American General Finance Corp. |
5.489% due 03/23/2007 | | | | 1,600 | | | | 1,601 |
|
| American International Group, Inc. |
5.050% due 10/01/2015 | | | | 1,300 | | | | 1,215 |
|
| Atlantic & Western Re Ltd. |
10.990% due 01/09/2007 | | | | 600 | | | | 591 |
|
| China Development Bank |
5.000% due 10/15/2015 | | | | 900 | | | | 842 |
|
| CIT Group Holdings, Inc. |
5.276% due 01/30/2009 | | | | 6,400 | | | | 6,417 |
|
| Citigroup, Inc. |
5.520% due 12/26/2008 | | | | 8,200 | | | | 8,208 |
|
| Export-Import Bank of China |
4.875% due 07/21/2015 | | | | 900 | | | | 836 |
|
| Export-Import Bank of Korea |
4.125% due 02/10/2009 | | | | 140 | | | | 134 |
|
| Ford Motor Credit Co. |
6.374% due 03/21/2007 | | | | 900 | | | | 897 |
|
| General Electric Capital Corp. |
5.050% due 01/03/2008 | | | | 14,360 | | | | 14,385 |
|
| Goldman Sachs Group, Inc. |
5.250% due 11/10/2008 | | | | 7,100 | | | | 7,108 |
|
| HBOS PLC |
5.920% due 09/29/2049 | | | | 1,100 | | | | 1,015 |
|
| HSBC Bank USA N.A. |
5.494% due 09/21/2007 | | | | 14,500 | | | | 14,517 |
|
| Morgan Stanley |
5.276% due 02/09/2009 | | | | 14,600 | | | | 14,627 |
|
| MUFG Capital Finance 1 Ltd. |
6.346% due 07/29/2049 | | | | 700 | | | | 676 |
|
| Petroleum Export Ltd. |
5.265% due 06/15/2011 | | | | 956 | | | | 928 |
|
| Phoenix Quake Ltd. |
7.440% due 07/03/2008 | | | | 800 | | | | 811 |
|
| Phoenix Quake Wind II Ltd. |
8.490% due 07/03/2008 | | | | 400 | | | | 364 |
|
| Phoenix Quake Wind Ltd. |
7.440% due 07/03/2008 | | | | 800 | | | | 808 |
|
| Premium Asset Trust |
5.645% due 09/08/2007 | | | | 100 | | | | 100 |
|
| Resona Bank Ltd. |
5.850% due 09/29/2049 | | | | 1,200 | | | | 1,118 |
|
| Royal Bank of Scotland PLC |
5.125% due 07/21/2008 | | | | 6,400 | | | | 6,405 |
|
| UFJ Finance Aruba AEC |
6.750% due 07/15/2013 | | | | 300 | | | | 313 |
|
| USB Capital IX |
6.189% due 04/15/2042 | | | | 900 | | | | 881 |
| | | | | | | | |
| Vita Capital Ltd. |
6.340% due 01/01/2007 | | $ | | 500 | | $ | | 502 |
|
| Wachovia Bank N.A. |
5.480% due 06/27/2008 | | | | 6,300 | | | | 6,302 |
5.489% due 03/23/2009 | | | | 7,100 | | | | 7,100 |
| | | | | | | | |
|
| | | | | | | | | 98,701 |
| | | | | | | | |
|
| |
| INDUSTRIALS 1.1% | | | | | | | | |
| DaimlerChrysler N.A. Holding Corp. |
6.160% due 08/08/2006 | | | | 900 | | | | 900 |
|
| El Paso Corp. |
6.750% due 05/15/2009 | | | | 6,000 | | | | 5,955 |
9.625% due 05/15/2012 | | | | 800 | | | | 878 |
7.875% due 06/15/2012 | | | | 5,800 | | | | 5,931 |
7.800% due 08/01/2031 | | | | 1,500 | | | | 1,464 |
|
| HJ Heinz Co. |
6.428% due 12/01/2008 | | | | 1,100 | | | | 1,118 |
|
| Morgan Stanley Bank AG for OAO Gazprom |
9.625% due 03/01/2013 | | | | 100 | | | | 115 |
|
| Pemex Project Funding Master Trust |
8.000% due 11/15/2011 | | | | 100 | | | | 106 |
5.750% due 12/15/2015 | | | | 2,300 | | | | 2,121 |
8.625% due 02/01/2022 | | | | 1,200 | | | | 1,345 |
9.500% due 09/15/2027 | | | | 55 | | | | 66 |
|
| United Airlines, Inc. |
8.030% due 07/01/2011 (b) | | | | 465 | | | | 475 |
6.071% due 03/01/2013 | | | | 5,423 | | | | 5,413 |
|
| Viacom, Inc. |
5.750% due 04/30/2011 | | | | 1,000 | | | | 983 |
|
| Williams Cos., Inc. |
6.375% due 10/01/2010 | | | | 7,000 | | | | 6,860 |
| | | | | | | | |
|
| | | | | | | | | 33,730 |
| | | | | | | | |
|
| |
| UTILITIES 0.9% | | | | | | | | |
| AT&T, Inc. |
4.214% due 06/05/2007 | | | | 8,600 | | | | 8,504 |
|
| Entergy Gulf States, Inc. |
6.000% due 12/01/2012 | | | | 6,500 | | | | 6,399 |
5.700% due 06/01/2015 | | | | 8,300 | | | | 7,822 |
|
| Korea Electric Power Corp. |
5.125% due 04/23/2034 | | | | 90 | | | | 86 |
|
| Qwest Capital Funding, Inc. |
7.250% due 02/15/2011 | | | | 657 | | | | 642 |
|
| Ras Laffan LNG III |
5.838% due 09/30/2027 | | | | 2,600 | | | | 2,428 |
|
| TPSA Finance BV |
7.750% due 12/10/2008 | | | | 120 | | | | 125 |
| | | | | | | | |
|
| | | | | | | | | 26,006 |
| | | | | | | | |
|
Total Corporate Bonds & Notes (Cost $157,270) | | | | | | | | 158,437 |
| | | | | | | | |
|
| |
| MUNICIPAL BONDS & NOTES 1.8% |
| Arizona State Salt River Project Agricultural Improvement and Power District Revenue Bonds, Series 2005 |
5.800% due 01/01/2035 | | | | 95 | | | | 91 |
|
| Badger, Wisconsin Tobacco Asset Securitization Corporations Revenue Notes, Series 2002 |
6.000% due 06/01/2017 | | | | 3,700 | | | | 3,906 |
|
| Chicago, Illinois General Obligation Bonds, (MBIA Insured), Series 2003 |
5.000% due 01/01/2035 | | | | 10,000 | | | | 10,125 |
| | | | | | | | |
| Golden State, California Tobacco Securitization Corporations Revenue Bonds, Series 2003 |
6.250% due 06/01/2033 | | $ | | 2,900 | | $ | | 3,162 |
|
| Iowa State Tobacco Settlement Authority Revenue Notes, Series 2005 |
6.500% due 06/01/2023 | | | | 1,185 | | | | 1,166 |
|
| New Jersey State Tobacco Settlement Financing Corporations Revenue Bonds, Series 2002 |
6.000% due 06/01/2037 | | | | 1,530 | | | | 1,611 |
|
| New Jersey State Tobacco Settlement Financing Corporations Revenue Bonds, Series 2003 |
6.750% due 06/01/2039 | | | | 5,450 | | | | 6,061 |
|
| New Jersey State Tobacco Settlement Financing Corporations Revenue Notes, Series 2003 |
4.375% due 06/01/2019 | | | | 3,115 | | | | 3,110 |
|
| New York City, New York General Obligation Notes, Series 2005 |
5.000% due 03/01/2030 | | | | 1,500 | | | | 1,521 |
|
| New York City, New York Municipal Finance Authority Water & Sewer Revenue Bonds, Series 2006-C |
4.750% due 06/15/2033 | | | | 17,400 | | | | 17,037 |
|
| New York State Environmental Facilities Corporations Revenue Notes, Series 2002 |
5.980% due 06/15/2023 | | | | 850 | | | | 914 |
|
| Texas State General Obligation Bonds, Series 2005 |
4.750% due 04/01/2035 | | | | 3,600 | | | | 3,495 |
| | | | | | | | |
|
Total Municipal Bonds & Notes
(Cost $50,324) | | | | 52,199 |
| | | | | | | | |
|
| |
| U.S. GOVERNMENT AGENCIES 51.5% |
| Fannie Mae |
2.500% due 06/15/2008 | | | | 2,480 | | | | 2,346 |
4.000% due 10/01/2018 | | | | 474 | | | | 439 |
4.500% due 08/17/2021 - 04/01/2035 (d) | | | | 2,240 | | | | 2,068 |
4.685% due 05/25/2035 | | | | 1,300 | | | | 1,260 |
4.712% due 04/01/2035 | | | | 3,351 | | | | 3,284 |
4.752% due 04/01/2035 | | | | 4,995 | | | | 4,865 |
4.933% due 11/01/2035 | | | | 363 | | | | 364 |
4.982% due 10/01/2032 | | | | 1,876 | | | | 1,879 |
5.000% due 01/01/2018 - 07/13/2036 (d) | | | | 257,949 | | | | 243,480 |
5.249% due 11/28/2035 | | | | 302 | | | | 302 |
5.312% due 09/22/2006 | | | | 10,300 | | | | 10,299 |
5.411% due 09/01/2040 | | | | 107 | | | | 108 |
5.500% due 04/01/2014 - 07/13/2036 (d) | | | | 1,175,621 | | | | 1,131,558 |
5.672% due 03/25/2044 | | | | 8,393 | | | | 8,404 |
5.695% due 09/01/2034 | | | | 3,155 | | | | 3,140 |
5.702% due 11/01/2025 | | | | 3 | | | | 3 |
5.707% due 09/01/2039 | | | | 118 | | | | 121 |
5.736% due 12/01/2036 | | | | 3,099 | | | | 3,083 |
6.000% due 04/01/2016 - 08/14/2036 (d) | | | | 30,736 | | | | 30,440 |
6.500% due 06/01/2029 - 04/01/2032 (d) | | | | 418 | | | | 422 |
7.000% due 04/25/2023 - 06/01/2032 (d) | | | | 4,202 | | | | 4,319 |
|
| Federal Home Loan Bank |
4.200% due 02/05/2007 | | | | 2,000 | | | | 1,925 |
|
| Federal Housing Administration |
7.430% due 01/25/2023 | | | | 55 | | | | 55 |
| | | | | | |
| See Accompanying Notes | | Semiannual Report | | June 30, 2006 | | 9 |
| | |
| |
| Schedule of Investments Total Return Portfolio (Cont.) | | |
| | | | | | | | |
| | | | | PRINCIPAL | | | | |
| | | | | AMOUNT | | | | VALUE |
| | | | | (000S) | | | | (000S) |
| | | | | | | | | |
| Freddie Mac |
4.500% due 04/01/2018 - 10/01/2018 (d) | | $ | | 2,653 | | $ | | 2,511 |
5.000% due 04/01/2018 - 09/01/2035 (d) | | | | 9,788 | | | | 9,345 |
5.211% due 02/25/2045 | | | | 1,453 | | | | 1,442 |
5.500% due 04/01/2033 - 07/13/2036 (d) | | | | 38,066 | | | | 36,573 |
5.649% due 11/15/2030 | | | | 41 | | | | 41 |
5.699% due 09/15/2030 | | | | 38 | | | | 38 |
5.957% due 01/01/2028 | | | | 3 | | | | 4 |
6.000% due 07/01/2016 - 11/01/2033 (d) | | | | 7,206 | | | | 7,141 |
6.045% due 07/01/2030 | | | | 3 | | | | 3 |
6.099% due 07/01/2027 | | | | 3 | | | | 3 |
6.500% due 03/01/2013 - 03/01/2034 (d) | | | | 1,156 | | | | 1,170 |
7.000% due 06/15/2023 | | | | 2,262 | | | | 2,327 |
7.500% due 07/15/2030 - 03/01/2032 (d) | | | | 359 | | | | 371 |
8.500% due 08/01/2024 | | | | 20 | | | | 21 |
|
| Government National Mortgage Association |
4.375% due 04/20/2026 - 05/20/2030 (d) | | | | 156 | | | | 156 |
4.500% due 07/20/2030 | | | | 22 | | | | 22 |
4.750% due 02/20/2032 | | | | 1,359 | | | | 1,350 |
5.125% due 10/20/2029 - 11/20/2029 (d) | | | | 425 | | | | 428 |
5.375% due 02/20/2027 | | | | 7 | | | | 7 |
5.500% due 04/15/2033 - 09/15/2033 (d) | | | | 670 | | | | 650 |
5.667% due 06/20/2030 | | | | 3 | | | | 3 |
5.767% due 09/20/2030 | | | | 33 | | | | 34 |
6.500% due 03/15/2031 - 04/15/2032 (d) | | | | 318 | | | | 322 |
|
| Small Business Administration |
6.030% due 02/10/2012 | | | | 7,101 | | | | 7,178 |
6.344% due 08/01/2011 | | | | 880 | | | | 897 |
7.449% due 08/01/2010 | | | | 15 | | | | 15 |
8.017% due 02/10/2010 | | | | 101 | | | | 106 |
|
| Small Business Administration Participation Certificates |
5.130% due 09/01/2023 | | | | 85 | | | | 82 |
6.290% due 01/01/2021 | | | | 237 | | | | 242 |
7.500% due 04/01/2017 | | | | 1,310 | | | | 1,360 |
| | | | | | | | |
|
Total U.S. Government Agencies (Cost $1,575,938) | | | | 1,528,006 |
| | | | | | | | |
|
| |
| U.S. TREASURY OBLIGATIONS 1.1% |
| Treasury Inflation Protected Securities (c) |
3.375% due 01/15/2007 (f) | | | | 509 | | | | 511 |
2.375% due 01/15/2025 | | | | 15,396 | | | | 14,989 |
2.000% due 01/15/2026 | | | | 16,348 | | | | 14,972 |
3.625% due 04/15/2028 | | | | 2,492 | | | | 2,958 |
| | | | | | | | |
|
Total U.S. Treasury Obligations
(Cost $36,126) | | | | 33,430 |
| | | | | | | | |
|
| |
| MORTGAGE-BACKED SECURITIES 3.7% |
| American Home Mortgage Investment Trust |
4.390% due 02/25/2045 | | | | 4,785 | | | | 4,618 |
|
| Banc of America Commercial Mortgage, Inc. |
4.875% due 06/10/2039 | | | | 590 | | | | 574 |
4.128% due 07/10/2042 | | | | 395 | | | | 378 |
|
| Banc of America Funding Corp. |
4.116% due 05/25/2035 | | | | 5,662 | | | | 5,459 |
|
| Banc of America Mortgage Securities |
6.500% due 10/25/2031 | | | | 1,847 | | | | 1,860 |
5.403% due 10/20/2032 | | | | 245 | | | | 245 |
6.500% due 09/25/2033 | | | | 632 | | | | 630 |
| | | | | | | | |
| Bear Stearns Adjustable Rate Mortgage Trust |
5.546% due 11/25/2030 | | $ | | 14 | | $ | | 14 |
5.340% due 02/25/2033 | | | | 504 | | | | 503 |
5.621% due 02/25/2033 | | | | 330 | | | | 326 |
5.062% due 04/25/2033 | | | | 1,568 | | | | 1,552 |
4.812% due 01/25/2034 | | | | 3,826 | | | | 3,754 |
4.750% due 10/25/2035 | | | | 23,957 | | | | 23,515 |
|
| Bear Stearns Alt-A Trust |
5.448% due 05/25/2035 | | | | 9,122 | | | | 9,018 |
|
| Citigroup Mortgage Loan Trust, Inc. |
4.700% due 12/25/2035 | | | | 1,998 | | | | 1,959 |
|
| Countrywide Alternative Loan Trust |
4.673% due 08/25/2034 | | | | 350 | | | | 347 |
|
| Countrywide Home Loan Mortgage Pass-Through Trust |
5.592% due 05/25/2034 | | | | 1,435 | | | | 1,433 |
5.250% due 02/20/2036 | | | | 2,404 | | | | 2,358 |
|
| CS First Boston Mortgage Securities Corp. |
6.257% due 06/25/2032 | | | | 197 | | | | 197 |
5.672% due 10/25/2032 | | | | 112 | | | | 112 |
|
| First Nationwide Trust |
6.750% due 08/21/2031 | | | | 121 | | | | 121 |
|
| Greenwich Capital Commercial Funding Corp. |
5.317% due 06/10/2036 | | | | 915 | | | | 884 |
|
| GS Mortgage Securities Corp. II |
5.396% due 08/10/2038 | | | | 905 | | | | 876 |
|
| GSR Mortgage Loan Trust |
4.541% due 09/25/2035 | | | | 24,774 | | | | 24,118 |
|
| Impac CMB Trust |
5.572% due 04/25/2034 | | | | 1,587 | | | | 1,588 |
|
| Indymac ARM Trust |
6.648% due 01/25/2032 | | | | 13 | | | | 13 |
|
| Merrill Lynch Mortgage Trust |
4.353% due 02/12/2042 | | | | 515 | | | | 498 |
|
| Morgan Stanley Capital I |
4.050% due 01/13/2041 | | | | 530 | | | | 503 |
|
| Prime Mortgage Trust |
5.722% due 02/25/2019 | | | | 327 | | | | 328 |
5.722% due 02/25/2034 | | | | 1,430 | | | | 1,435 |
|
| Residential Funding Mortgage Security I |
6.500% due 03/25/2032 | | | | 1,679 | | | | 1,672 |
|
| Structured Asset Mortgage Investments, Inc. |
5.582% due 09/19/2032 | | | | 361 | | | | 362 |
|
| Structured Asset Securities Corp. |
6.103% due 02/25/2032 | | | | 35 | | | | 35 |
6.150% due 07/25/2032 | | | | 92 | | | | 93 |
|
| Superannuation Members Home Loans Global Fund |
5.548% due 06/15/2026 | | | | 1 | | | | 1 |
|
| Torrens Trust |
5.459% due 07/15/2031 | | | | 394 | | | | 394 |
|
| Washington Mutual, Inc. |
5.126% due 10/25/2032 | | | | 433 | | | | 430 |
5.410% due 08/25/2042 | | | | 6,304 | | | | 6,302 |
5.612% due 10/25/2045 | | | | 2,969 | | | | 2,988 |
|
| Wells Fargo Mortgage-Backed Securities Trust |
4.950% due 03/25/2036 | | | | 9,327 | | | | 9,201 |
| | | | | | | | |
|
Total Mortgage-Backed Securities (Cost $112,567) | | | | 110,694 |
| | | | | | | | |
|
| |
| ASSET-BACKED SECURITIES 0.2% |
| AAA Trust | | | | | | | | |
5.422% due 11/26/2035 | | | | 1,009 | | | | 1,011 |
|
| Amortizing Residential Collateral Trust |
5.592% due 06/25/2032 | | | | 546 | | | | 547 |
| | | | | | | | |
| Carrington Mortgage Loan Trust |
5.402% due 06/25/2035 | | $ | | 491 | | $ | | 491 |
|
| Citifinancial Mortgage Securities, Inc. |
3.082% due 08/25/2033 | | | | 9 | | | | 9 |
3.221% due 10/25/2033 | | | | 39 | | | | 38 |
|
| Conseco Finance |
5.569% due 12/15/2029 | | | | 110 | | | | 110 |
|
| EMC Mortgage Loan Trust |
5.692% due 05/25/2040 | | | | 902 | | | | 905 |
|
| GSAMP Trust |
5.512% due 10/25/2033 | | | | 839 | | | | 840 |
|
| Morgan Stanley Dean Witter Capital I |
5.652% due 07/25/2032 | | | | 14 | | | | 14 |
|
| Residential Asset Mortgage Products, Inc. |
4.450% due 07/25/2028 | | | | 1,145 | | | | 1,134 |
4.230% due 05/25/2029 | | | | 152 | | | | 151 |
4.003% due 01/25/2030 | | | | 143 | | | | 142 |
|
| Structured Asset Securities Corp. |
5.371% due 01/25/2033 | | | | 73 | | | | 74 |
4.370% due 10/25/2034 | | | | 525 | | | | 518 |
| | | | | | | | |
|
Total Asset-Backed Securities
(Cost $5,999) | | 5,984 |
| | | | | | | | |
|
| |
| SOVEREIGN ISSUES 0.5% | | | | |
| Brazilian Government International Bond |
10.500% due 07/14/2014 | | | | 2,340 | | | | 2,823 |
8.000% due 01/15/2018 | | | | 3,000 | | | | 3,172 |
8.875% due 04/15/2024 | | | | 90 | | | | 100 |
|
| Financing Corp. Fico | | | | | | | | |
0.000% due 04/05/2019 | | | | 840 | | | | 416 |
0.000% due 09/26/2019 | | | | 830 | | | | 399 |
|
| Mexico Government International Bond | | |
8.375% due 01/14/2011 | | | | 200 | | | | 219 |
|
| Panama Government International Bond | | |
9.625% due 02/08/2011 | | | | 480 | | | | 535 |
8.875% due 09/30/2027 | | | | 5,200 | | | | 5,915 |
6.700% due 01/26/2036 | | | | 431 | | | | 397 |
|
| South Africa Government International Bond |
9.125% due 05/19/2009 | | | | 500 | | | | 538 |
| | | | | | | | |
|
Total Sovereign Issues (Cost $13,334) | | 14,514 |
| | | | | | | | |
|
| |
| FOREIGN CURRENCY-DENOMINATED ISSUES (j) 1.5% |
| Netherlands Government Bond |
3.000% due 07/15/2006 | | EUR | | 29,700 | | | | 37,987 |
|
| United Kingdom Gilt | | | | | | | | |
4.750% due 06/07/2010 | | GBP | | 2,700 | | | | 4,984 |
4.750% due 09/07/2015 | | | | 1,000 | | | | 1,853 |
| | | | | | | | |
|
Total Foreign Currency-Denominated Issues (Cost $44,437) | | 44,824 |
| | | | | | | | |
|
| | | | |
| 10 | | PIMCO Variable Insurance Trust | | See Accompanying Notes |
| | |
| |
| | | June 30, 2006 (Unaudited) |
| | | | |
| | | NOTIONAL | | |
| | | AMOUNT | | VALUE |
| | | (000S) | | (000S) |
| | | | | | | | |
| PURCHASED CALL OPTIONS 0.1% |
| 2-Year Interest Rate Swap (OTC) Pay 3-Month USD-LIBOR Floating Rate Index |
Strike @ 4.500%
Exp. 10/04/2006 | | $ | | 78,500 | | $ | | 0 |
Strike @ 4.750%
Exp. 08/07/2006 | | | | 123,000 | | | | 0 |
Strike @ 4.750%
Exp. 08/08/2006 | | | | 37,000 | | | | 0 |
Strike @ 4.800%
Exp. 12/22/2006 | | | | 83,000 | | | | 11 |
Strike @ 5.000%
Exp. 03/08/2007 | | | | 130,000 | | | | 112 |
Strike @ 5.080%
Exp. 04/19/2007 | | | | 98,900 | | | | 143 |
Strike @ 5.130%
Exp. 10/25/2006 | | | | 190,000 | | | | 57 |
Strike @ 5.170%
Exp. 02/01/2007 | | | | 73,500 | | | | 88 |
Strike @ 5.200%
Exp. 05/09/2007 | | | | 163,400 | | | | 357 |
Strike @ 5.200%
Exp. 05/23/2007 | | | | 138,000 | | | | 319 |
Strike @ 5.250%
Exp. 06/07/2007 | | | | 169,000 | | | | 464 |
Strike @ 5.500%
Exp. 06/29/2007 | | | | 138,000 | | | | 662 |
| | | | | | | | |
|
Total Purchased Call Options
(Cost $5,539) | | 2,213 |
| | | | | | | | |
|
| |
| | | | | #OF
CONTRACTS | | | | |
| PURCHASED PUT OPTIONS 0.0% |
| 90-Day Eurodollar December Futures (CME) |
Strike @ $91.750
Exp. 12/18/2006 | | | | 764 | | | | 5 |
Strike @ $92.000
Exp. 12/18/2006 | | | | 2,995 | | | | 19 |
Strike @ $92.250
Exp. 12/18/2006 | | | | 1,663 | | | | 10 |
Strike @ $92.500
Exp. 12/18/2006 | | | | 450 | | | | 3 |
Strike @ $92.750
Exp. 12/18/2006 | | | | 790 | | | | 5 |
Strike @ $93.000
Exp. 12/18/2006 | | | | 50 | | | | 0 |
|
| 90-Day Eurodollar June Futures (CME) |
Strike @ $91.000
Exp. 06/18/2007 | | | | 1,328 | | | | 8 |
Strike @ $91.250
Exp. 06/18/2007 | | | | 1,855 | | | | 12 |
|
| 90-Day Eurodollar March Futures (CME) |
Strike @ $92.000
Exp. 03/19/2007 | | | | 987 | | | | 6 |
Strike @ $92.250
Exp. 03/19/2007 | | | | 585 | | | | 4 |
|
| 90-Day Eurodollar September Futures (CME) |
Strike @ $91.000
Exp. 09/17/2007 | | | | 637 | | | | 4 |
Strike @ $92.500
Exp. 09/18/2006 | | | | 675 | | | | 4 |
| | | | | | | | |
|
Total Purchased Put Options (Cost $121) | | 80 |
| | | | | | | | |
|
| |
| | | | | NOTIONAL AMOUNT
(000S) | | | | |
PURCHASED STRADDLE
OPTIONS (g) 0.0% |
| Call & Put – OTC U.S. dollar versus Japanese Yen Forward Delta Neutral Straddle |
Strike @ $0.000
Exp. 08/23/2007 | | $ | | 35,000 | | | | 21 |
| | | | | | | | |
|
Total Purchased Straddle Options (Cost $0) | | 21 |
| | | | | | | | |
|
| | | | | | | | |
| PREFERRED STOCK 0.4% |
| DG Funding Trust | | | | | | | | |
7.210% due 12/31/2049 | | | | 1,239 | | $ | | 13,079 |
| | | | | | | | |
|
Total Preferred Stock (Cost $13,056) | | 13,079 |
| | | | | | | | |
|
| |
| | | | | PRINCIPAL AMOUNT
(000S) | | | | |
| SHORT-TERM INSTRUMENTS (j) 48.5% |
| |
| CERTIFICATES OF DEPOSIT 4.8% |
| Citibank N.A. | | | | | | | | |
5.275% due 09/11/2006 | | $ | | 63,000 | | | | 63,000 |
|
| Wells Fargo Bank N.A. | | |
5.280% due 07/11/2006 | | | | 80,000 | | | | 80,000 |
| | | | | | | | |
|
| | | | | | | | | 143,000 |
| | | | | | | | |
|
| |
| COMMERCIAL PAPER 25.1% |
| Bank of America Corp. | | | | | | | | |
5.040% due 08/03/2006 | | | | 53,000 | | | | 52,770 |
5.090% due 08/21/2006 | | | | 30,000 | | | | 29,792 |
|
| Barclays U.S. Funding Corp. | | |
5.055% due 07/18/2006 | | | | 8,200 | | | | 8,183 |
5.050% due 08/14/2006 | | | | 80,700 | | | | 80,225 |
|
| Cox Communications, Inc. | | |
4.720% due 07/17/2006 | | | | 3,500 | | | | 3,500 |
|
| Danske Corp. | | |
5.040% due 07/05/2006 | | | | 54,500 | | | | 54,485 |
|
| Fannie Mae | | |
5.140% due 08/01/2006 | | | | 56,900 | | | | 56,664 |
|
| Fortis Funding LLC | | |
5.175% due 07/10/2006 | | | | 80,700 | | | | 80,619 |
|
| San Paolo IMI U.S. Financial Co. | | |
5.270% due 07/05/2006 | | | | 80,000 | | | | 79,977 |
|
| Skandinaviska Enskilda Banken AB | | |
4.960% due 07/20/2006 | | | | 79,500 | | | | 79,314 |
|
| Societe Generale N.A. | | |
5.250% due 07/05/2006 | | | | 8,100 | | | | 8,098 |
5.260% due 07/05/2006 | | | | 79,600 | | | | 79,577 |
|
| Total Captial S.A. | | |
5.270% due 07/03/2006 | | | | 43,300 | | | | 43,300 |
|
| UBS Finance Delaware LLC | | |
5.235% due 08/08/2006 | | | | 22,600 | | | | 22,482 |
5.000% due 08/25/2006 | | | | 47,300 | | | | 46,952 |
5.095% due 09/22/2006 | | | | 19,200 | | | | 18,960 |
| | | | | | | | |
|
| | | | | | | | | 744,898 |
| | | | | | | | |
|
| |
| REPURCHASE AGREEMENT 0.7% |
| Lehman Brothers Inc. |
4.500% due 07/03/2006 | | | | 20,100 | | | | 20,100 |
| | | | | | | | |
|
(Dated 06/30/2006. Collateralized by Treasury Inflation Protected Securities 2.000% due 07/15/2014 valued at $20,579. Repurchase proceeds are $20,108.) |
| |
| TRI-PARTY REPURCHASE AGREEMENT 0.2% |
| State Street Bank |
4.900% due 07/03/2006 | | | | 5,608 | | | | 5,608 |
| | | | | | | | |
|
(Dated 06/30/2006. Collateralized by Federal Home Loan Bank 4.250% due 04/16/2007 valued at $5,722. Repurchase proceeds are $5,610.) |
| |
| BELGIUM TREASURY BILL 0.3% |
2.757% due 10/12/2006 | | EUR | | 8,680 | | | | 11,014 |
| | | | | | | | |
|
| |
| FRANCE TREASURY BILLS 8.5% |
2.691% due 07/06/2006-12/21/2006 | | | | 198,130 | | | | 251,970 |
| | | | | | | | |
|
| | | | | | | | |
| GERMANY TREASURY BILLS 7.8% |
2.641% due 07/12/2006-11/15/2006 | | EUR | | 181,750 | | $ | | 231,595 |
| | | | | | | | |
|
| |
| U.S. TREASURY BILLS 1.1% |
4.042% due 08/31/2006-09/14/2006 (d)(e)(f) | | $ | | 33,720 | | $ | | 33,354 |
| | | | | | | | |
|
Total Short-Term Instruments
(Cost $1,425,471) | | 1,441,539 |
| | | | | | | | |
|
| |
| Total Investments (a) 114.7% (Cost $3,442,782) | | | | $ | | 3,407,611 |
| |
Written Options (i) (0.4%)
(Premiums $9,947) | | | | | | | | (12,179) |
| |
| Other Assets and Liabilities (Net) (14.3%) | | (425,443) |
| | | | | | | | |
|
| Net Assets 100.0% | | | | | | $ | | 2,969,989 |
| | | | | | | | |
|
| | | | | | |
| See Accompanying Notes | | Semiannual Report | | June 30, 2006 | | 11 |
Schedule of Investments Total Return Portfolio (Cont.)
|
Notes to Schedule of Investments (amounts in thousands, except number of contracts): |
(a) As of June 30, 2006, portfolio securities with an aggregate market value of $155 were valued in good faith and pursuant to guidelines established by the Board of Trustees. |
| |
(b) Security is in default. |
| |
(c) Principal amount of security is adjusted for inflation. |
| |
(d) Securities are grouped by coupon or range of coupons and represent a range of maturities. |
| |
(e) Securities with an aggregate market value of $5,689 have been pledged as collateral for swap and swaption contracts on June 30, 2006. |
| |
(f) Securities with an aggregate market value of $27,691 have been segregated with the custodian to cover margin requirements for the following open futures contracts on June 30, 2006: |
| | | | | | | | | | |
| Description | | Type | | Expiration
Month | | # of
Contracts | | Unrealized
(Depreciation) | |
90-Day Eurodollar December Futures | | Long | | 12/2006 | | 4,923 | | $ | (7,046 | ) |
90-Day Eurodollar December Futures | | Long | | 12/2007 | | 1,045 | | | (969 | ) |
90-Day Eurodollar June Futures | | Long | | 06/2007 | | 2,686 | | | (4,502 | ) |
90-Day Eurodollar March Futures | | Long | | 03/2007 | | 3,609 | | | (6,727 | ) |
90-Day Eurodollar March Futures | | Long | | 03/2008 | | 368 | | | (214 | ) |
90-Day Eurodollar September Futures | | Long | | 09/2006 | | 727 | | | (736 | ) |
90-Day Eurodollar September Futures | | Long | | 09/2007 | | 2,047 | | | (3,020 | ) |
Euro-Bobl 5-Year Note September Futures | | Long | | 09/2006 | | 63 | | | (83 | ) |
U.S. Treasury 5-Year Note September Futures | | Long | | 09/2006 | | 598 | | | (321 | ) |
U.S. Treasury 10-Year Note September Futures | | Long | | 09/2006 | | 518 | | | (253 | ) |
U.S. Treasury 30-Year Bond September Futures | | Long | | 09/2006 | | 160 | | | (164 | ) |
United Kingdom 90-Day LIBOR Sterling Interest Rate December Futures Put Options Strike @ GBP95.500 | | Short | | 12/2006 | | 94 | | | (51 | ) |
| | | | | | | | |
|
|
|
| | | | | | | | | $ | (24,086 | ) |
| | | | | | | | |
|
|
|
| | | | | | | | |
(g) Exercise price and premium determined on a future date, based upon implied volatility parameters. |
| | | | | | | | | | | | | | | |
(h) Swap agreements outstanding on June 30, 2006: | |
| Interest Rate Swaps | | | | | | | | | | | | | | | |
| Counterparty | | Floating Rate
Index | | Pay/Receive
Floating Rate | | Fixed Rate | | Expiration
Date | | Notional
Amount | | Unrealized
Appreciation/
(Depreciation) | |
Barclays Bank PLC | | 5-year French CLPI Ex Tobacco Daily Reference Index | | Pay | | 2.103% | | 10/15/2010 | | EUR | 1,400 | | $ | (6 | ) |
BNP Paribas Bank | | 5-year French CLPI Ex Tobacco Daily Reference Index | | Pay | | 2.090% | | 10/15/2010 | | | 10,200 | | | (29 | ) |
Deutsche Bank AG | | 6-month EUR-LIBOR | | Receive | | 4.000% | | 12/15/2011 | | | 30,500 | | | 232 | |
Merrill Lynch & Co., Inc. | | 6-month EUR-LIBOR | | Receive | | 4.000% | | 12/15/2011 | | | 39,800 | | | 52 | |
UBS Warburg LLC | | 5-year French CLPI Ex Tobacco Daily Reference Index | | Pay | | 2.146% | | 10/15/2010 | | | 1,900 | | | (3 | ) |
Barclays Bank PLC | | 6-month GBP-LIBOR | | Pay | | 5.000% | | 06/15/2007 | | GBP | 32,400 | | | (272 | ) |
Barclays Bank PLC | | 6-month GBP-LIBOR | | Pay | | 5.000% | | 06/16/2011 | | | 1,800 | | | (37 | ) |
Barclays Bank PLC | | 6-month GBP-LIBOR | | Receive | | 4.000% | | 12/15/2035 | | | 2,900 | | | 86 | |
Lehman Brothers, Inc. | | 6-month GBP-LIBOR | | Pay | | 4.500% | | 09/20/2009 | | | 17,500 | | | (422 | ) |
Merrill Lynch & Co., Inc. | | 6-month GBP-LIBOR | | Receive | | 4.000% | | 12/15/2035 | | | 2,200 | | | 70 | |
Goldman Sachs & Co. | | 6-month JPY-LIBOR | | Receive | | 2.000% | | 06/15/2012 | | JPY | 387,100 | | | 49 | |
Morgan Stanley Dean Witter & Co. | | 6-month JPY-LIBOR | | Receive | | 2.000% | | 06/15/2012 | | | 626,000 | | | 24 | |
UBS Warburg LLC | | 6-month JPY-LIBOR | | Receive | | 2.000% | | 06/15/2012 | | | 1,625,000 | | | (46 | ) |
Barclays Bank PLC | | 3-month USD-LIBOR | | Pay | | 5.000% | | 12/20/2008 | | $ | 64,200 | | | (57 | ) |
Goldman Sachs & Co. | | 3-month USD-LIBOR | | Pay | | 5.000% | | 12/20/2016 | | | 13,900 | | | (172 | ) |
Goldman Sachs & Co. | | 3-month USD-LIBOR | | Pay | | 5.000% | | 12/15/2035 | | | 5,900 | | | (155 | ) |
Lehman Brothers, Inc. | | 3-month USD-LIBOR | | Pay | | 5.000% | | 12/20/2011 | | | 23,900 | | | (214 | ) |
Lehman Brothers, Inc. | | 3-month USD-LIBOR | | Pay | | 5.000% | | 12/20/2016 | | | 6,300 | | | (78 | ) |
Lehman Brothers, Inc. | | 3-month USD-LIBOR | | Pay | | 5.000% | | 12/15/2035 | | | 6,500 | | | (173 | ) |
Royal Bank of Scotland PLC | | 3-month USD-LIBOR | | Pay | | 5.000% | | 12/20/2011 | | | 11,000 | | | (97 | ) |
UBS Warburg LLC | | 3-month USD-LIBOR | | Pay | | 5.000% | | 12/20/2008 | | | 9,800 | | | (9 | ) |
| | | | | | | | | | | | | |
|
|
|
| | | | | | | | | | | | | | $ | (1,257 | ) |
| | | | | | | | | | | | | |
|
|
|
| | | | |
| 12 | | PIMCO Variable Insurance Trust | | See Accompanying Notes |
| | |
| |
| | | June 30, 2006 (Unaudited) |
| | | | | | | | | | | | | | | | |
| Credit Default Swaps | | | | | | | | | | | | | | | | |
| Counterparty | | Reference Entity | | Buy/Sell
Protection+ | | (Pay)Receive
Fixed Rate | | | Expiration
Date | | Notional
Amount | | Unrealized
Appreciation/
(Depreciation) | |
Bear Stearns & Co., Inc. | | Ford Motor Credit Co. 7.000% due 10/01/2013 | | Sell | | 1.300% | | | 09/20/2006 | | $ | 1,800 | | $ | (1 | ) |
Bear Stearns & Co., Inc. | | General Motors Acceptance Corp.
6.875% due 08/28/2012 | | Sell | | 2.100% | | | 12/20/2006 | | | 12,400 | | | 28 | |
Bear Stearns & Co., Inc. | | Ford Motor Credit Co. 7.000% due 10/01/2013 | | Sell | | 4.750% | | | 06/20/2007 | | | 200 | | | 4 | |
Bear Stearns & Co., Inc. | | Ford Motor Credit Co. 7.000% due 10/01/2013 | | Sell | | 2.320% | | | 09/20/2007 | | | 2,100 | | | (12 | ) |
Citibank N.A. | | General Motors Acceptance Corp.
6.875% due 08/28/2012 | | Sell | | 1.700% | | | 09/20/2006 | | | 2,600 | | | 4 | |
Goldman Sachs & Co. | | Ford Motor Credit Co. 7.000% due 10/01/2013 | | Sell | | 2.400% | | | 09/20/2007 | | | 4,200 | | | (20 | ) |
Goldman Sachs & Co. | | Dow Jones CDX N.A. HV5 Index | | Buy | | (0.850% | ) | | 12/20/2010 | | | 13,900 | | | (63 | ) |
HSBC Bank USA | | Russia Government International Bond, 5.000% until 03/31/2007 and 7.500% thereafter, due 03/31/2030 | | Sell | | 0.390% | | | 09/20/2006 | | | 800 | | | 1 | |
J.P. Morgan Chase & Co. | | Ford Motor Credit Co. 7.000% due 10/01/2013 | | Sell | | 4.750% | | | 06/20/2007 | | | 400 | | | 8 | |
J.P. Morgan Chase & Co. | | Ford Motor Credit Co. 7.000% due 10/01/2013 | | Sell | | 4.700% | | | 06/20/2007 | | | 1,800 | | | 37 | |
J.P. Morgan Chase & Co. | | Mexico Government International Bond 7.500% due 04/08/2033 | | Sell | | 0.920% | | | 03/20/2016 | | | 1,200 | | | (13 | ) |
Lehman Brothers, Inc. | | Multiple Reference Entities of Gazprom | | Sell | | 1.430% | | | 06/20/2011 | | | 600 | | | 1 | |
Lehman Brothers, Inc. | | Mexico Government International Bond 7.500% due 04/08/2033 | | Sell | | 0.920% | | | 03/20/2016 | | | 3,100 | | | (34 | ) |
Morgan Stanley Dean Witter & Co. | | Ford Motor Credit Co. 7.000% due 10/01/2013 | | Sell | | 5.200% | | | 12/20/2006 | | | 9,300 | | | 166 | |
Morgan Stanley Dean Witter & Co. | | Russia Government International Bond, 5.000% until 03/31/2007 and 7.500% thereafter, due 03/31/2030 | | Sell | | 0.460% | | | 06/20/2007 | | | 1,300 | | | 1 | |
UBS Warburg LLC | | Ford Motor Credit Co. 7.000% due 10/01/2013 | | Sell | | 4.750% | | | 12/20/2006 | | | 10,700 | | | 167 | |
UBS Warburg LLC | | Ford Motor Credit Co. 7.000% due 10/01/2013 | | Sell | | 3.350% | | | 06/20/2007 | | | 1,500 | | | 11 | |
Wachovia Bank N.A. | | Dow Jones CDX N.A. HV5 Index | | Sell | | 0.850% | | | 12/20/2010 | | | 5,000 | | | (36 | ) |
| | | | | | | | | | | | | | |
|
|
|
| | | | | | | | | | | | | | | $ | 249 | |
| | | | | | | | | | | | | | |
|
|
|
|
| + If the Portfolio is a seller of protection and a credit event occurs, as defined under the terms of that particular swap agreement, the Portfolio will Pay to the buyer of the protection an amount up to the Notional value of the swap and in certain instances, take delivery of the security. As a buyer of protection, the Portfolio will generally receive from the seller of protection an amount up to the notional amount of the swap if a credit event occurs. | |
| | | | | | | | | | | | |
(i) Written options outstanding on June 30, 2006: |
| Options on Exchange-Traded Futures Contracts |
| Description | | Exercise
Price | | Expiration
Date | | # of
Contracts | | Premium | | Value |
Call - CBOT U.S. Treasury 10-Year Note September Futures | | $108.000 | | 08/25/2006 | | 1,654 | | $ | 219 | | $ | 52 |
Call - CBOT U.S. Treasury 10-Year Note September Futures | | 106.000 | | 08/25/2006 | | 185 | | | 108 | | | 49 |
Put - CBOT U.S. Treasury 10-Year Note September Futures | | 103.000 | | 08/25/2006 | | 1,839 | | | 320 | | | 259 |
Put - CME 90-Day Eurodollar March Futures | | 95.250 | | 03/19/2007 | | 116 | | | 108 | | | 238 |
Call - CME 90-Day Eurodollar September Futures | | 95.500 | | 09/18/2006 | | 112 | | | 30 | | | 1 |
Put - CME 90-Day Eurodollar September Futures | | 95.000 | | 09/18/2006 | | 209 | | | 109 | | | 303 |
Put - CME 90-Day Eurodollar September Futures | | 95.250 | | 09/18/2006 | | 448 | | | 347 | | | 930 |
Put - CME 90-Day Eurodollar December Futures | | 95.000 | | 12/18/2006 | | 195 | | | 103 | | | 295 |
Put - CME 90-Day Eurodollar December Futures | | 95.250 | | 12/18/2006 | | 2,975 | | | 2,357 | | | 6,303 |
Put - CME 90-Day Eurodollar December Futures | | 95.500 | | 12/18/2006 | | 297 | | | 331 | | | 813 |
| | | | | | | | |
|
| |
|
|
| | | | | | | | | $ | 4,032 | | $ | 9,243 |
| | | | | | | | |
|
| |
|
|
| | | | | | |
| See Accompanying Notes | | Semiannual Report | | June 30, 2006 | | 13 |
Schedule of Investments Total Return Portfolio (Cont.)
| | | | | | | | | | | | | | | | | | | |
| Interest Rate Swaptions | | | | | | | | | | | | | | | | | | | |
| Description | | Counterparty | | Floating Rate
Index | | Pay/Receive
Floating Rate | | Exercise
Rate | | Expiration
Date | | Notional
Amount | | Premium | | Value |
Put - OTC 1-Year Interest Rate Swap | | HSBC Bank USA | | 6-month GBP-LIBOR | | Pay | | 4.500% | | 12/20/2006 | | | GBP 53,900 | | $ | 263 | | $ | 586 |
Call - OTC 5-Year Interest Rate Swap | | Bear Stearns & Co., Inc. | | 3-month USD-LIBOR | | Receive | | 5.210% | | 10/25/2006 | | $ | 40,000 | | | 145 | | | 44 |
Call - OTC 5-Year Interest Rate Swap | | Bear Stearns & Co., Inc. | | 3-month USD-LIBOR | | Receive | | 5.040% | | 03/08/2007 | | | 37,000 | | | 357 | | | 75 |
Call - OTC 5-Year Interest Rate Swap | | Citibank N.A. | | 3-month USD-LIBOR | | Receive | | 4.540% | | 10/04/2006 | | | 14,100 | | | 165 | | | 0 |
Call - OTC 5-Year Interest Rate Swap | | Citibank N.A. | | 3-month USD-LIBOR | | Receive | | 4.850% | | 12/22/2006 | | | 36,000 | | | 473 | | | 14 |
Call - OTC 5-Year Interest Rate Swap | | Goldman Sachs & Co. | | 3-month USD-LIBOR | | Receive | | 4.780% | | 08/07/2006 | | | 53,000 | | | 434 | | | 0 |
Call - OTC 5-Year Interest Rate Swap | | Goldman Sachs & Co. | | 3-month USD-LIBOR | | Receive | | 5.210% | | 10/25/2006 | | | 28,400 | | | 128 | | | 31 |
Call - OTC 5-Year Interest Rate Swap | | Merrill Lynch & Co., Inc. | | 3-month USD-LIBOR | | Receive | | 4.780% | | 08/08/2006 | | | 16,000 | | | 151 | | | 0 |
Call - OTC 5-Year Interest Rate Swap | | Merrill Lynch & Co., Inc. | | 3-month USD-LIBOR | | Receive | | 4.540% | | 10/04/2006 | | | 20,000 | | | 239 | | | 0 |
Call - OTC 5-Year Interest Rate Swap | | Royal Bank of Scotland PLC | | 3-month USD-LIBOR | | Receive | | 5.040% | | 03/08/2007 | | | 19,000 | | | 212 | | | 38 |
Call - OTC 5-Year Interest Rate Swap | | Royal Bank of Scotland PLC | | 3-month USD-LIBOR | | Receive | | 5.220% | | 04/19/2007 | | | 43,000 | | | 340 | | | 188 |
Call - OTC 5-Year Interest Rate Swap | | Royal Bank of Scotland PLC | | 3-month USD-LIBOR | | Receive | | 5.315% | | 05/09/2007 | | | 71,500 | | | 738 | | | 424 |
Call - OTC 5-Year Interest Rate Swap | | Royal Bank of Scotland PLC | | 3-month USD-LIBOR | | Receive | | 5.300% | | 05/23/2007 | | | 59,000 | | | 590 | | | 354 |
Call - OTC 5-Year Interest Rate Swap | | Royal Bank of Scotland PLC | | 3-month USD-LIBOR | | Receive | | 5.340% | | 06/07/2007 | | | 62,000 | | | 631 | | | 425 |
Call - OTC 5-Year Interest Rate Swap | | Royal Bank of Scotland PLC | | 3-month USD-LIBOR | | Receive | | 5.600% | | 06/29/2007 | | | 60,000 | | | 663 | | | 663 |
Call - OTC 5-Year Interest Rate Swap | | Wachovia Bank N.A. | | 3-month USD-LIBOR | | Receive | | 5.210% | | 10/25/2006 | | | 12,900 | | | 50 | | | 14 |
Call - OTC 5-Year Interest Rate Swap | | Wachovia Bank N.A. | | 3-month USD-LIBOR | | Receive | | 5.240% | | 02/01/2007 | | | 31,800 | | | 196 | | | 120 |
Call - OTC 5-Year Interest Rate Swap | | Wachovia Bank N.A. | | 3-month USD-LIBOR | | Receive | | 5.325% | | 06/07/2007 | | | 11,000 | | | 94 | | | 73 |
| | | | | | | | | | | | | | | |
|
| |
|
|
| | | | | | | | | | | | | | | | $ | 5,869 | | $ | 3,049 |
| | | | | | | | | | | | | | | |
|
| |
|
|
| | | | | | | | | | | | | | | | |
| Straddle Options | | | | | | | | | | | | | | | | |
| Description | | Counterparty | | Exercise
Price* | | Expiration
Date | | Notional
Amount | | Premium* | | Value | |
Call & Put - OTC U.S. dollar versus Japanese Yen Forward Delta Neutral Straddle | | Goldman Sachs & Co. | | $ 0.000 | | 08/23/2007 | | $ | 16,500 | | $ | 14 | | $ | (93 | ) |
Call & Put - OTC U.S. dollar versus Japanese Yen Forward Delta Neutral Straddle | | J.P. Morgan Chase & Co. | | 0.000 | | 08/23/2007 | | | 3,000 | | | 17 | | | (16 | ) |
Call & Put - OTC U.S. dollar versus Japanese Yen Forward Delta Neutral Straddle | | J.P. Morgan Chase & Co. | | 0.000 | | 08/24/2007 | | | 1,000 | | | 4 | | | (4 | ) |
| | | | | | | | | | | |
|
| |
|
|
|
| | | | | | | | | | | | $ | 46 | | $ | (113 | ) |
| | | | | | | | | | | |
|
| |
|
|
|
| |
| * Exercise price and final premium determined on a future date, based upon implied volatility parameters. | | | | |
| | | | | | | | | | | | | | | | | |
(j) Forward foreign currency contracts outstanding on June 30, 2006: | | | | | |
| Type | | | | Principal
Amount
Covered by
Contract | | Settlement
Month | | Unrealized
Appreciation | | Unrealized
(Depreciation) | | | Net Unrealized
Appreciation/
(Depreciation) | |
Buy | | BRL | | 3,804 | | 07/2006 | | $ | 112 | | $ | 0 | | | $ | 112 | |
Sell | | | | 3,803 | | 07/2006 | | | 0 | | | (95 | ) | | | (95 | ) |
Buy | | | | 1,608 | | 09/2006 | | | 41 | | | 0 | | | | 41 | |
Buy | | CAD | | 10,212 | | 07/2006 | | | 0 | | | (105 | ) | | | (105 | ) |
Buy | | CLP | | 854,883 | | 07/2006 | | | 0 | | | (37 | ) | | | (37 | ) |
Sell | | | | 854,884 | | 07/2006 | | | 15 | | | (2 | ) | | | 13 | |
Buy | | | | 615,000 | | 08/2006 | | | 0 | | | (13 | ) | | | (13 | ) |
Buy | | | | 94,184 | | 09/2006 | | | 2 | | | 0 | | | | 2 | |
Buy | | CNY | | 23,779 | | 03/2007 | | | 0 | | | (22 | ) | | | (22 | ) |
Buy | | EUR | | 5,966 | | 07/2006 | | | 137 | | | 0 | | | | 137 | |
Sell | | | | 433,474 | | 07/2006 | | | 695 | | | (8,630 | ) | | | (7,935 | ) |
Buy | | | | 13 | | 12/2006 | | | 0 | | | 0 | | | | 0 | |
Buy | | GBP | | 3,048 | | 07/2006 | | | 21 | | | 0 | | | | 21 | |
Buy | | INR | | 51,600 | | 08/2006 | | | 0 | | | (30 | ) | | | (30 | ) |
Sell | | | | 50,590 | | 08/2006 | | | 20 | | | 0 | | | | 20 | |
Buy | | | | 34,136 | | 09/2006 | | | 0 | | | (16 | ) | | | (16 | ) |
Buy | | JPY | | 9,727,278 | | 08/2006 | | | 0 | | | (2,670 | ) | | | (2,670 | ) |
Buy | | KRW | | 966,900 | | 07/2006 | | | 32 | | | 0 | | | | 32 | |
Sell | | | | 966,900 | | 07/2006 | | | 0 | | | (11 | ) | | | (11 | ) |
Buy | | | | 1,503,584 | | 08/2006 | | | 28 | | | 0 | | | | 28 | |
Sell | | | | 230,950 | | 08/2006 | | | 0 | | | (6 | ) | | | (6 | ) |
Buy | | | | 3,109,199 | | 09/2006 | | | 67 | | | 0 | | | | 67 | |
Sell | | | | 2,194,499 | | 09/2006 | | | 0 | | | (63 | ) | | | (63 | ) |
Buy | | | | 4,130,499 | | 05/2007 | | | 0 | | | (9 | ) | | | (9 | ) |
Buy | | MXN | | 23,220 | | 08/2006 | | | 0 | | | (143 | ) | | | (143 | ) |
Sell | | | | 15,940 | | 08/2006 | | | 35 | | | 0 | | | | 35 | |
Buy | | | | 5,620 | | 09/2006 | | | 0 | | | (29 | ) | | | (29 | ) |
Buy | | PEN | | 8,692 | | 08/2006 | | | 62 | | | 0 | | | | 62 | |
| | | | |
| 14 | | PIMCO Variable Insurance Trust | | See Accompanying Notes |
| | |
| |
| | | June 30, 2006 (Unaudited) |
| | | | | | | | | | | | | | | | | |
| Type | | | | Principal
Amount
Covered by
Contract | | Settlement
Month | | Unrealized
Appreciation | | Unrealized
(Depreciation) | | | Net Unrealized
Appreciation/
(Depreciation) | |
Sell | | | | 8,692 | | 08/2006 | | $ | 0 | | $ | (89 | ) | | $ | (89 | ) |
Buy | | | | 1,762 | | 09/2006 | | | 12 | | | 0 | | | | 12 | |
Sell | | | | 1,762 | | 09/2006 | | | 0 | | | (19 | ) | | | (19 | ) |
Buy | | PLN | | 1,414 | | 09/2006 | | | 5 | | | 0 | | | | 5 | |
Buy | | | | 1,500 | | 11/2006 | | | 0 | | | (12 | ) | | | (12 | ) |
Buy | | RUB | | 12,595 | | 07/2006 | | | 20 | | | 0 | | | | 20 | |
Sell | | | | 12,596 | | 07/2006 | | | 0 | | | (4 | ) | | | (4 | ) |
Buy | | | | 60,141 | | 08/2006 | | | 107 | | | 0 | | | | 107 | |
Sell | | | | 53,107 | | 08/2006 | | | 0 | | | (73 | ) | | | (73 | ) |
Buy | | | | 27,885 | | 09/2006 | | | 22 | | | 0 | | | | 22 | |
Buy | | SGD | | 746 | | 07/2006 | | | 9 | | | 0 | | | | 9 | |
Sell | | | | 746 | | 07/2006 | | | 0 | | | (8 | ) | | | (8 | ) |
Buy | | | | 5,695 | | 08/2006 | | | 62 | | | (8 | ) | | | 54 | |
Sell | | | | 4,003 | | 08/2006 | | | 0 | | | (52 | ) | | | (52 | ) |
Buy | | | | 1,116 | | 09/2006 | | | 13 | | | 0 | | | | 13 | |
Buy | | SKK | | 83,996 | | 09/2006 | | | 75 | | | 0 | | | | 75 | |
Sell | | | | 44,840 | | 09/2006 | | | 0 | | | (59 | ) | | | (59 | ) |
Buy | | TWD | | 70,791 | | 08/2006 | | | 0 | | | (46 | ) | | | (46 | ) |
Sell | | | | 37,104 | | 08/2006 | | | 1 | | | 0 | | | | 1 | |
Buy | | | | 16,682 | | 09/2006 | | | 0 | | | (5 | ) | | | (5 | ) |
Sell | | | | 16,682 | | 09/2006 | | | 0 | | | 0 | | | | 0 | |
Buy | | ZAR | | 964 | | 08/2006 | | | 0 | | | (22 | ) | | | (22 | ) |
Sell | | | | 964 | | 08/2006 | | | 7 | | | 0 | | | | 7 | |
Buy | | | | 964 | | 10/2006 | | | 0 | | | (7 | ) | | | (7 | ) |
Buy | | | | 148 | | 11/2006 | | | 0 | | | (4 | ) | | | (4 | ) |
| | | | | | | | |
|
| |
|
|
| |
|
|
|
| | | | | | | | | $ | 1,600 | | $ | (12,289 | ) | | $ | (10,689 | ) |
| | | | | | | | |
|
| |
|
|
| |
|
|
|
| | | | | | |
| See Accompanying Notes | | Semiannual Report | | June 30, 2006 | | 15 |
Notes to Financial Statements
1. ORGANIZATION
The Total Return Portfolio (the “Portfolio”) is a series of the PIMCO Variable Insurance Trust (the “Trust”). The Trust is registered under the Investment Company Act of 1940 (the “Act”), as amended, as an open-end investment management company organized as a Delaware business trust on October 3, 1997. The Portfolio offers three classes of shares: Institutional, Administrative and Advisor. Information presented in these financial statements pertains to the Institutional Class of the Portfolio. Certain detailed financial information for the Administrative Class and Advisor Class is provided separately and is available upon request. The Trust is designed to be used as an investment vehicle by Separate Accounts of insurance companies that fund variable annuity contracts and variable life insurance policies and by qualified pension and retirement plans.
2. SIGNIFICANT ACCOUNTING POLICIES
The following is a summary of significant accounting policies consistently followed by the Portfolio in the preparation of its financial statements in conformity with accounting principles generally accepted in the United States of America (“GAAP”). The preparation of financial statements in accordance with GAAP requires management to make estimates and assumptions that affect the reported amounts and disclosures in the financial statements. Actual results could differ from those estimates.
Security Valuation. Portfolio securities are valued as of the close of regular trading (normally 4:00 p.m., Eastern Time) on each day that the New York Stock Exchange (“NYSE”) is open. Portfolio securities and other assets for which market quotes are readily available are stated at market value. Market value is generally determined on the basis of last reported sales prices, or if no sales are reported, based on quotes obtained from a quotation reporting system, established market makers, or pricing services. Fixed-income securities and non-exchange traded derivatives are normally valued on the basis of quotes obtained from brokers and dealers or pricing services. Prices obtained from independent pricing services use information provided by market makers or estimates of market values obtained from yield data relating to investments or securities with similar characteristics. Certain fixed-income securities purchased on a delayed-delivery basis are marked to market daily until settlement at the forward settlement date. Short-term investments having a maturity of 60 days or less are generally valued at amortized cost. Exchange traded options, futures and options on futures are valued at the settlement price determined by the relevant exchange.
Investments initially valued in currencies other than the U.S. dollar are converted to the U.S. dollar using exchange rates obtained from pricing services. As a result, the NAV of the Portfolio’s shares may be affected by changes in the value of currencies in relation to the U.S. dollar. The value of securities traded in markets outside the United States or denominated in currencies other than the U.S. dollar may be affected significantly on a day that the NYSE is closed and an investor is not able to purchase, redeem or exchange shares.
Securities and other assets for which market quotes are not readily available are valued at fair value as determined in good faith by the Board of Trustees or persons acting at their direction. The Board of Trustees has adopted methods for valuing securities and other assets in circumstances where market quotes are not readily available, and has delegated to Pacific Investment Management Company LLC (“PIMCO”) the responsibility for applying the valuation methods. In the event that market quotes are not readily available, and the security or asset cannot be valued pursuant to one of the valuation methods, the value of the security or asset will be determined in good faith by the Valuation Committee of the Board of Trustees, generally based upon recommendations provided by PIMCO.
Market quotes are considered not readily available in circumstances where there is an absence of current or reliable market-based data (e.g., trade information, bid/asked information, broker quotes), including where events occur after the close of the relevant market, but prior to the close of regular trading, that materially affect the values of the Portfolio’s securities or assets. In addition, market quotes are considered not readily available when, due to extraordinary circumstances, the exchanges or markets on which the securities trade do not open for trading for the entire day and no other market prices are available. The Board has delegated to PIMCO the responsibility for monitoring significant events that may materially affect the values of the Portfolio’s securities or assets and for determining whether the value of the applicable securities or assets should be re-evaluated in light of such significant events. When the Portfolio uses fair value pricing to determine its NAV, securities will not be priced on the basis of quotations from the primary market in which they are traded, but rather may be priced by another method that the Board of Trustees or persons acting at their direction believe accurately reflects fair value. The Trust’s policy is intended to result in a calculation of the Portfolio’s NAV that fairly reflects security values as of the time of pricing. However, fair values determined by the Board of Trustees or persons acting at their direction may not accurately reflect the price that the Portfolio could obtain for a security if it were to dispose of that security as of the time of pricing. Because foreign securities can trade on non-business days, the NAV of the Portfolio may change on days when shareholders will not be able to purchase or redeem shares. The prices used by the Portfolio may differ from the value that would be realized if the securities were sold and the differences could be material to the financial statements.
Securities Transactions and Investment Income. Securities transactions are recorded as of the trade date. Securities purchased or sold on a when-issued or delayed-delivery basis may be settled a month or more after the trade date. Realized gains and losses from securities sold are recorded on the identified cost basis. Dividend income is recorded on the ex-dividend date, except certain dividends from foreign securities where the ex-dividend date may have passed, which are recorded as soon as the Portfolio is informed of the ex-dividend date. Interest income, adjusted for the accretion of discounts and amortization of premiums, is recorded on the accrual basis. Paydown gains and losses on mortgage-related or asset-backed securities are recorded as components of interest income in the Statement of Operations.
Dividends and Distributions to Shareholders. Dividends from net investment income, if any, are declared on each day the Portfolio is open for business and are distributed to shareholders monthly. Net realized capital gains earned by the Portfolio, if any, will be distributed no less frequently than once each year. Most shareholders choose to reinvest their dividends and capital gain distribution in additional shares of the Portfolio.
Income dividends and capital gain distributions are determined in accordance with income tax regulations which may differ from GAAP. Differences between tax regulations and GAAP may change the fiscal year when income and capital items are recognized for tax and GAAP purposes. Examples of events that give rise to timing differences include wash sales, straddles, net operating losses and capital loss carryforwards. Further, the character of investment income and capital gains may be different for certain transactions under the two methods of accounting. Examples of characterization differences include the treatment of mortgage paydowns, swaps, foreign currency transactions and contingent debt instruments. As a result, income dividends and capital gain distributions declared during a fiscal period may differ significantly from the net investment income and realized capital gain reported in the Portfolio’s annual financial statements presented under GAAP.
Distributions classified as a tax basis return of capital, if any, are reflected in the accompanying Statements of Changes in Net Assets and have been reclassified to
| | | | |
| 16 | | PIMCO Variable Insurance Trust | | |
| | |
| |
| | | June 30, 2006 (Unaudited) |
paid in capital. In addition, other amounts have been reclassified between undistributed net investment income, accumulated undistributed net realized gains or losses and/or paid in capital to more appropriately conform financial accounting to tax characterizations of dividend distributions.
Multiclass Operations. Each class offered by the Portfolio has equal rights as to assets and voting privileges (except that shareholders of a class have exclusive voting rights regarding any matter relating solely to that class of shares). Income and non-class specific expenses of the Portfolio are allocated daily to each class of shares based on the relative value of settled shares. Realized and unrealized capital gains and losses of the Portfolio are allocated daily to each class of shares based on the relative net assets of each class. Class specific expenses, where applicable, currently include administrative, distribution and servicing fees.
Delayed-Delivery Transactions. The Portfolio may purchase or sell securities on a when-issued or delayed-delivery basis. These transactions involve a commitment by the Portfolio to purchase or sell securities for a predetermined price or yield, with payment and delivery taking place beyond the customary settlement period. When delayed-delivery purchases are outstanding, the Portfolio will designate liquid assets in an amount sufficient to meet the purchase price. When purchasing a security on a delayed-delivery basis, the Portfolio assumes the rights and risks of ownership of the security, including the risk of price and yield fluctuations, and takes such fluctuations into account when determining its net asset value. The Portfolio may dispose of or renegotiate a delayed-delivery transaction after it is entered into, and may sell when-issued securities before they are delivered, which may result in a capital gain or loss. When the Portfolio has sold a security on a delayed-delivery basis, the Portfolio does not participate in future gains and losses with respect to the security.
Federal Income Taxes. The Portfolio intends to qualify as a regulated investment company under sub-chapter M of the Internal Revenue Code and distribute all of its taxable income and net realized gains, if applicable, to shareholders. Accordingly, no provision for Federal income taxes has been made.
Foreign Currency. The accounting records of the Portfolio are maintained in U.S. dollar. The market values of foreign securities, currency holdings and other assets and liabilities are translated into U.S. dollar based on the current exchange rates each business day. Fluctuations in the value of currency holdings and other assets and liabilities resulting from changes in exchange rates are recorded as unrealized foreign currency gains or losses. Realized gains or losses and unrealized appreciation or depreciation on investment securities and income and expenses are translated on the respective dates of such transactions. The effects of changes in foreign currency exchange rates on investments in securities are not segregated in the Statement of Operations from the effects of changes in market prices of those securities, but are included with the net realized and unrealized gain or loss on investment securities.
| | | | | | |
|
| Non-U.S. currency symbols utilized throughout the report are defined as follows: |
| BRL | | Brazilian Real | | MXN | | Mexican Peso |
| CAD | | Canadian Dollar | | PEN | | Peruvian New Sol |
| CLP | | Chilean Peso | | PLN | | Polish Zloty |
| CNY | | Chinese Yuan Renminbi | | RUB | | Russian Ruble |
| EUR | | Euro | | SGD | | Singapore Dollar |
| GBP | | British Pound | | SKK | | Slovakian Koruna |
| INR | | Indian Rupee | | TWD | | Taiwan Dollar |
| JPY | | Japanese Yen | | ZAR | | South African Rand |
| KRW | | South Korean Won | | | | |
Forward Currency Transactions. The Portfolio may enter into forward currency contracts in connection with settling planned purchases or sales of securities, to hedge the currency exposure associated with some or all of the Portfolio’s securities or as a part of an investment strategy. A forward currency contract is an agreement between two parties to buy and sell a currency at a set price on a future date. The market value of a forward currency contract fluctuates with changes in forward currency exchange rates. Forward currency contracts are marked to market daily and the change in value is recorded by the Portfolio as an unrealized gain or loss. Realized gains or losses equal to the difference between the value of the contract at the time it was opened and the value at the time it was closed are recorded upon delivery or receipt of the currency or, if a forward currency contract is offset by entering into another forward currency contract with the same broker, upon settlement of the net gain or loss. These contracts may involve market risk in excess of the unrealized gain or loss reflected in the Portfolio’s Statement of Assets and Liabilities. In addition, the Portfolio could be exposed to risk if the counterparties are unable to meet the terms of the contracts or if the value of the currency changes unfavorably to the U.S. dollar.
Futures Contracts. The Portfolio is authorized to enter into futures contracts. The Portfolio may use futures contracts to manage its exposure to the securities markets or to movements in interest rates and currency values. The primary risks associated with the use of futures contracts are the imperfect correlation between the change in market value of the securities held by the Portfolio and the prices of futures contracts, the possibility of an illiquid market, and the inability of the counterparty to meet the terms of the contract. Futures contracts are valued based upon their quoted daily settlement prices. Upon entering into a futures contract, the Portfolio is required to deposit with its custodian, in a segregated account in the name of the futures broker, an amount of cash or U.S. Government and Agency Obligations in accordance with the initial margin requirements of the broker or exchange. Futures contracts are marked to market daily and an appropriate payable or receivable for the change in value (“variation margin”) is recorded by the Portfolio. Gains or losses are recognized but not considered realized until the contracts expire or are closed. Futures contracts involve, to varying degrees, risk of loss in excess of the variation margin disclosed in the Statement of Assets and Liabilities.
Guarantees and Indemnifications. Under the Trust’s organizational documents, each Trustee, officer, employee or other agent of the Trust (including the Trust’s investment manager) is indemnified against certain liabilities that may arise out of performance of their duties to the Portfolio. Additionally, in the normal course of business, the Portfolio enters into contracts that contain a variety of indemnification clauses. The Portfolio’s maximum exposure under these arrangements is unknown as this would involve future claims that may be made against the Portfolio that have not yet occurred. However, the Portfolio has not had prior claims or losses pursuant to these contracts, and believes the risk of loss to be remote.
Inflation-Indexed Bonds. The Portfolio may invest in inflation-indexed bonds. Inflation-indexed bonds are fixed-income securities whose principal value is periodically adjusted to the rate of inflation. The interest rate on these bonds is generally fixed at issuance at a rate lower than typical bonds. Over the life of an inflation-indexed bond, however, interest will be paid based on a principal value, which is adjusted for inflation. Any increase in the principal amount of an inflation-indexed bond will be included as interest income in the Statement of Operations, even though investors do not receive their principal until maturity.
Loan Participant and Assignments. The Portfolio may invest in direct debt instruments which are interests in amounts owned by corporate, governmental, or other borrowers to lenders or lending syndicates. The Portfolio’s investments in loans may be in the form of participations in loans or assignments of all or a portion of loans from third parties. A loan is often administered by a bank or other
| | | | | | |
| | | Semiannual Report | | June 30, 2006 | | 17 |
Notes to Financial Statements (Cont.)
financial institution (the “lender”) that acts as agent for all holders. Then agent administers the terms of the loan, as specified in the loan agreement. When investing in a loan participation, the Portfolio has the right to receive payments of principal, interest and any fees to which it is entitled only from the lender selling the loan agreement and only upon receipt by the lender of payments from the borrower. The Portfolio generally has no right to enforce compliance with the terms of the loan agreement with the borrower. As a result, the Portfolio may be subject to the credit of both the borrower and the lender that is selling the loan agreement. When the Portfolio purchases assignments from lenders it acquires direct rights against the borrower on the loan. At the end of the period, the Portfolio had no unfunded loan commitments.
Options Contracts. The Portfolio may write call and put options on futures, swaps, securities or currencies it owns or in which it may invest. Writing put options tends to increase the Portfolio’s exposure to the underlying instrument. Writing call options tends to decrease the Portfolio’s exposure to the underlying instrument. When the Portfolio writes a call or put option, an amount equal to the premium received is recorded as a liability and subsequently marked to market to reflect the current value of the option written. These liabilities are reflected as written options outstanding in the Statement of Assets and Liabilities. Certain options may be written with premiums to determined on a future date. The premiums for these options are based upon implied volatility parameters at specified terms. Premiums received from writing options which expire are treated as realized gains. Premiums received from writing options which are exercised or closed are added to the proceeds or offset against amounts paid on the underlying future, swap, security or currency transaction to determine the realized gain or loss. The Portfolio as a writer of an option has no control over whether the underlying future, swap, security or currency may be sold (call) or purchased (put) and as a result bears the market risk of an unfavorable change in the price of the future, swap, security or currency underlying the written option. There is the risk the Portfolio may not be able to enter into a closing transaction because of an illiquid market.
The Portfolio may also purchase put and call options. Purchasing call options tends to increase the Portfolio’s exposure to the underlying instrument. Purchasing put options tends to decrease the Portfolio’s exposure to the underlying instrument. The Portfolio pays a premium which is included in the Portfolio’s Statement of Assets and Liabilities as an investment and subsequently marked to market to reflect the current value of the option. Premiums paid for purchasing options which expire are treated as realized losses. Certain options may be purchased with premiums to be determined on a future date. The premiums for these options are based upon implied volatility parameters at specified terms. The risk associated with purchasing put and call options is limited to the premium paid. Premiums paid for purchasing options which are exercised or closed are added to the amounts paid or offset against the proceeds on the underlying future, swap, security or currency transaction to determine the realized gain or loss.
Repurchase Agreements. The Portfolio may engage in repurchase transactions. Under the terms of a typical repurchase agreement, the Portfolio takes possession of an underlying debt obligation subject to an obligation of the seller to repurchase, and the Portfolio to resell, the obligation at an agreed-upon price and time. The underlying securities for all repurchase agreements are held in safekeeping at the Portfolio’s custodian or designated subcustodians under triparty repurchase agreements. The market value of the collateral must be equal to or exceed at all times the total amount of the repurchase obligations, including interest. Securities purchased under repurchase agreements are reflected as an asset in the Statement of Assets and Liabilities. Generally, in the event of counterparty default, the Portfolio has the right to use the collateral to offset losses incurred. If the counterparty should default, the Portfolio will seek to sell the securities which it holds as collateral. This could involve procedural costs or delays in addition to a loss on the securities if their value should fall below their repurchase price.
Mortgage-Related and Other Asset-Backed Securities. The Portfolio may invest in mortgage-related or other asset-backed securities. These securities include mortgage pass-through securities, collateralized mortgage obligations (“CMOs”), commercial mortgage-backed securities, mortgage dollar rolls, CMO residuals, stripped mortgage-backed securities (“SMBSs”) and other securities that directly or indirectly represent a participation in, or are secured by and payable from, mortgage loans on real property. The value of some mortgage- or asset-backed securities may be particularly sensitive to changes in prevailing interest rates. Early repayment of principal on some mortgage-related securities may expose a Portfolio to a lower rate of return upon reinvestment of principal. The value of these securities may fluctuate in response to the market’s perception of the creditworthiness of the issuers. Additionally, although mortgages and mortgage-related securities are generally supported by some form of government or private guarantee and/or insurance, there is no assurance that private guarantors or insurers will meet their obligations.
One type of SMBS has one class receiving all of the interest from the mortgage assets (the interest-only, or “IO” class), while the other class will receive all of the principal (the principal-only, or “PO” class). Payments received for IOs are included in interest income in the Statement of Operations. Because principal will not be received at the maturity of an IO, adjustments are made to the book value of the security on a daily basis until maturity. These adjustments are included in interest income in the Statement of Operations. Payments received for POs are treated as reductions to the cost and par value of the securities.
Swap Agreements. The Portfolio may engage in swap transactions, including, but not limited to, swap agreements on interest rate and credit default to manage its exposure to interest rates and credit risk. In connection with these agreements, securities may be identified as collateral in accordance with the terms of the respective swap agreements.
Interest rate swap agreements involve the exchange by the Portfolio with another party of their respective commitments to pay or receive interest, e.g., an exchange of floating rate payments for fixed rate payments with respect to the notional amount of principal.
Credit default swap agreements involve one party making a stream of payments to another party in exchange for the right to receive a specified return in the event of a default by a third party, typically corporate issues or sovereign issues of an emerging country, on its obligation. The Portfolio may use credit default swaps to provide a measure of protection against defaults of the issuers (i.e., to reduce risk where the Portfolio owns or has exposure to the sovereign issuer) or to take an active long or short position with respect to the likelihood of a particular issuer’s default. As a seller of protection, the Portfolio generally receives an upfront payment or a fixed rate of income throughout the term of the swap provided that there is no credit event. If the Portfolio is a seller of protection and a credit event occurs, as defined under the terms of that particular swap agreement, the Portfolio will pay to the buyer of the protection an amount up to the notional value of the swap and in certain instances take delivery of the security. As the seller, a Portfolio would effectively add leverage to its portfolio because, in addition to its total net assets, the Portfolio would be subject to investment exposure on the notional amount of the swap. As a buyer of protection, a Portfolio generally receives an amount up to the notional value of the swap if a credit event occurs. The treatment of credit default swaps and other swap agreements that provide for contingent, non-periodic, bullet-type payments as “notional principal contracts” for federal income tax purposes is uncertain. Were the Internal Revenue Service to take the position that a credit default swap or other bullet-type swap is not a “notional principal contract” for federal income tax purposes, payments received by the Portfolio from such investments might be subject to income taxes.
Swaps are marked to market daily based upon quotations from market makers and the change in value, if any, is recorded as unrealized gain or loss in the Statement of Operations. Payments received or made at the beginning of the measurement
| | | | |
| 18 | | PIMCO Variable Insurance Trust | | |
| | |
| |
| | | June 30, 2006 (Unaudited) |
period are reflected as such in the Statement of Assets and Liabilities. These upfront payments are recorded as realized gain or loss in the Statement of Operations upon termination or maturity of the swap. A liquidation payment received or made at the termination of the swap is recorded as realized gain or loss in the Statement of Operations. Net periodic payments received or paid by the Portfolio are included as part of realized gain or loss in the Statement of Operations. Entering into these agreements involves, to varying degrees, elements of credit, market and documentation risk in excess of the amounts recognized in the Statement of Assets and Liabilities. Such risks involve the possibility that there will be no liquid market for these agreements, that the counterparty to the agreements may default on its obligation to perform or disagree as to the meaning of contractual terms in the agreements and that there may be unfavorable changes in interest rates.
U.S. Government Agencies or Government-Sponsored Enterprises. Securities issued by U.S. Government agencies or government-sponsored enterprises may not be guaranteed by the U.S. Treasury. The Government National Mortgage Association (“GNMA”), a wholly owned U.S. Government corporation, is authorized to guarantee, with the full faith and credit of the U.S. Government, the timely payment of principal and interest on securities issued by institutions approved by GNMA and backed by pools of mortgages insured by the Federal Housing Administration or guaranteed by the Department of Veterans Affairs. Government-related guarantors (i.e., not backed by the full faith and credit of the U.S. Government) include the Federal National Mortgage Association (“FNMA” or “Fannie Mae”) and the Federal Home Loan Mortgage Corporation (“FHLMC” or “Freddie Mac”). Pass-through securities issued by FNMA are guaranteed as to timely payment of principal and interest by FNMA but are not backed by the full faith and credit of the U.S. Government. FHLMC guarantees the timely payment of interest and ultimate collection of principal, but its participation certificates are not backed by the full faith and credit of the U.S. Government.
New Accounting Policies. In July 2006, the Financial Accounting Standards Board issued Interpretation No. 48, “Accounting for Uncertainty in Income Taxes—an Interpretation of FASB Statement No. 109” (the “Interpretation”). The Interpretation is effective for fiscal years beginning after December 15, 2006. Management is currently evaluating the application of the Interpretation to the Portfolio and will provide additional information in relation to the Interpretation in the Portfolio’s annual financial statements for the year ending December 31, 2006.
3. FEES, EXPENSES, AND RELATED PARTY TRANSACTIONS
Investment Advisory Fee. PIMCO is a majority-owned subsidiary of Allianz Global Investors of America L.P. (“AGI”), and serves as investment adviser (the “Adviser”) to the Trust, pursuant to an investment advisory contract. The Adviser receives a monthly fee at an annual rate based on average daily net assets of the Portfolio. The Advisory Fee is charged at an annual rate of 0.25%.
Administration Fee. PIMCO serves as administrator (the “Administrator”), and provides administrative services to the Trust for which it receives a monthly administrative fee based on average daily net assets of the Portfolio. As the Administrator, PIMCO bears the costs of various third-party services, including audit, custodial, portfolio accounting, legal, transfer agency and printing costs. The Administration Fee is charged at the annual rate of 0.25%.
Distribution and Servicing Fees. Allianz Global Investors Distributors LLC (“AGID”) is an indirect wholly-owned subsidiary of AGI and serves as the distributor of the Trust’s shares. The Trust is permitted to reimburse AGID on a quarterly basis, out of the Administrative Class assets of the Portfolio in the amount of 0.15% on an annual basis of the average daily net assets of that class, for payments made to financial intermediaries that provide services in connection with the distribution of shares or administration of plans or programs that use Portfolio shares as their funding medium. The effective rate paid to AGID was 0.15% during the current fiscal year.
Expenses. The Trust is responsible for the following expenses: (i) salaries and other compensation of any of the Trust’s executive officers and employees who are not officers, directors, stockholders or employees of PIMCO or its subsidiaries or affiliates; (ii) taxes and governmental fees; (iii) brokerage fees and commissions and other portfolio transaction expenses; (iv) the costs of borrowing money, including interest expenses and bank overdraft charges; (v) fees and expenses of the Trustees who are not “interested persons” of PIMCO or the Trust, and any counsel retained exclusively for their benefit; (vi) extraordinary expenses, including costs of litigation and indemnification expenses; (vii) organization expenses and (viii) any expenses allocated or allocable to a specific class of shares, which include service fees payable with respect to the Administrative Class shares and may include certain other expenses as permitted by the Trust’s Multiple Class Plan adopted pursuant to Rule 18f-3 under the Act and subject to review and approval by the Trustees. The ratio of expenses to average net assets per share class, as disclosed in the Financial Highlights, may differ from the annual portfolio operating expenses per share class as disclosed in the Prospectus for the reasons set forth above.
For the current period ended June 30, 2006, each unaffiliated Trustee received an annual retainer of $15,000, plus $2,000 for each Board of Trustees quarterly meeting attended, $500 for each Board of Trustees committee meeting attended and $500 for each special board meeting attended, plus reimbursement of related expenses. In addition, each Committee Chair received an additional annual retainer of $500 and each Audit Committee Chair received an additional annual retainer of $1,500. These expenses are allocated on a pro-rata basis to each Portfolio of the Trust according to its respective net assets. The Trust pays no compensation directly to any Trustee or any other officer who is affiliated with the Administrator, all of whom receive remuneration for their services to the Trust from the Administrator or its affiliates.
4. PURCHASES AND SALES OF SECURITIES
The length of time the Portfolio has held a particular security is not generally a consideration in investment decisions. A change in the securities held by the Portfolio is known as “portfolio turnover”. The Portfolio may engage in frequent and active trading of portfolio securities to achieve its investment objective, particularly during periods of volatile market movements. High portfolio turnover (e.g., over 100%) involves correspondingly greater expenses to the Portfolio, including brokerage commissions or dealer mark-ups and other transaction costs on the sale of securities and reinvestments in other securities. Such sales may also result in realization of taxable capital gains, including short-term capital gains (which are generally taxed at ordinary income tax rates). The trading costs and tax effects associated with portfolio turnover may adversely affect the Portfolio’s performance.
Purchases and sales of securities (excluding short-term investments) for the period ended June 30, 2006 were as follows (amounts in thousands):
| | | | | | | | | | | | | | |
| | | U.S Government/Agency | | | | All Other |
| | | Purchases | | | | Sales | | | | Purchases | | | | Sales |
| | | $ 3,483,913 | | | | $ 3,849,012 | | | | $ 258,320 | | | | $ 224,153 |
| | | | | | |
| | | Semiannual Report | | June 30, 2006 | | 19 |
Notes to Financial Statements (Cont.)
5. TRANSACTIONS IN WRITTEN CALL AND PUT OPTIONS
Transactions in written call and put options were as follows (amounts in thousands, except number of contracts):
| | | | | | | | | | | | | | | | | | | | | | | |
| | | | | # of
Contracts |
| | | |
| Notional
Amount
in $ |
| | | |
| Notional
Amount
in GBP |
| | | | | Premium | |
Balance at 12/31/2005 | | | | 6,803 | | | | | $ | 359,600 | | | | | GBP | 57,200 | | | | | $ | 7,607 | |
Sales | | | | 6,512 | | | | | | 544,200 | | | | | | 0 | | | | | | 5,852 | |
Closing Buys | | | | 0 | | | | | | (169,900 | ) | | | | | 0 | | | | | | (1,267 | ) |
Expirations | | | | (5,062 | ) | | | | | (98,700 | ) | | | | | (3,300 | ) | | | | | (2,085 | ) |
Exercised | | | | (223 | ) | | | | | 0 | | | | | | 0 | | | | | | (160 | ) |
Balance at 06/30/2006 | | | | 8,030 | | | | | $ | 635,200 | | | | | GBP | 53,900 | | | | | $ | 9,947 | |
6. REORGANIZATION
The Acquiring Portfolio (“Total Return Portfolio”), as listed below, acquired the assets and certain liabilities of the Acquired Fund (“CIGNA Times Square VP Core Plus Bond Fund”), also listed below, in a tax-free exchange for shares of the Acquiring Portfolio, pursuant to a plan of reorganization approved by the Acquired Portfolio’s shareholders (shares and amounts in thousands):
| | | | | | | | | | | | | | | | | | | | | |
| Acquiring Portfolio | | Acquired Fund | | Date | | Shares Issued by
Acquiring
Portfolio | | Value of Shares Issued by
Acquiring
Portfolio | | Total Net
Assets of
Acquired Fund | | Total Net Assets of
Acquiring
Portfolio | | Total net Assets of
Acquiring
Portfolio After
Acquisition | | Acquired Fund’s
Unrealized
Appreciation |
Total Return Portfolio | | Times Square VP Core Plus Bond Fund | | April 22, 2005 | | 8,435 | | $ | 88,822 | | $ | 88,822 | | $ | 2,474,546 | | $ | 2,563,368 | | $ | 710 |
7. SHARES OF BENEFICIAL INTEREST
The Portfolio may issue an unlimited number of shares of beneficial interest with a $0.001 par value. Changes in shares of beneficial interest were as follows (shares and amounts in thousands):
| | | | | | | | | | | | | | | | | | |
| | | | | Six Months Ended 06/30/2006 | | | | | Year Ended 12/31/2005 | |
| | | | | Shares | | | Amount | | | | | Shares | | | Amount | |
| | | | | | |
Receipts for shares sold | | | | | | | | | | | | | | | | | | |
Institutional Class | | | | 3,699 | | | $ | 37,370 | | | | | 4,171 | | | $ | 43,745 | |
Administrative Class | | | | 38,033 | | | | 384,517 | | | | | 60,180 | | | | 630,483 | |
Advisor Class | | | | 455 | | | | 4,550 | | | | | 0 | | | | 0 | |
Issued in reorganization | | | | | | | | | | | | | | | | | | |
Institutional Class | | | | 0 | | | | 0 | | | | | 8,435 | | | | 88,822 | |
Administrative Class | | | | 0 | | | | 0 | | | | | 0 | | | | 0 | |
Advisor Class | | | | 0 | | | | 0 | | | | | 0 | | | | 0 | |
Issued as reinvestment of distributions | | | | | | | | | | | | | | | | | | |
Institutional Class | | | | 325 | | | | 3,281 | | | | | 683 | | | | 7,097 | |
Administrative Class | | | | 4,979 | | | | 50,219 | | | | | 10,667 | | | | 110,757 | |
Advisor Class | | | | 2 | | | | 15 | | | | | 0 | | | | 0 | |
Cost of shares redeemed | | | | | | | | | | | | | | | | | | |
Institutional Class | | | | (2,642 | ) | | | (26,672 | ) | | | | (5,309 | ) | | | (55,888 | ) |
Administrative Class | | | | (24,338 | ) | | | (245,706 | ) | | | | (30,537 | ) | | | (319,629 | ) |
Advisor Class | | | | (1 | ) | | | (13 | ) | | | | 0 | | | | 0 | |
Net increase resulting from
Portfolio share transactions | | | | 20,512 | | | $ | 207,561 | | | | | 48,290 | | | $ | 505,387 | |
The following schedule shows the number of shareholders each owning 5% or more of the Portfolio and the total percentage of the Portfolio held by such shareholders:
| | | | | | | |
| | | | | Number of
Shareholders | | % of Portfolio
Held | |
Institutional Class | | | | 4 | | 90 | |
Administrative Class | | | | 4 | | 55 | * |
Advisor Class | | | | 2 | | 98 | |
* One of the shareholders, Allianz Life Insurance Co. of North America, is an indirect wholly owned subsidiary of AGI and a related party to the Portfolio.
| | | | |
| 20 | | PIMCO Variable Insurance Trust | | |
| | |
| |
| | | June 30, 2006 (Unaudited) |
8. FEDERAL INCOME TAX MATTERS
As of June 30, 2006, the aggregate cost of investments was the same for federal income tax and financial statement purposes. The net unrealized appreciation (depreciation) of investment securities for federal income tax purposes is as follows (amounts in thousands):
| | | | |
Aggregate
Gross
Unrealized
Appreciation | | Aggregate
Gross
Unrealized
(Depreciation) | | Net
Unrealized
(Depreciation) |
$ 23,153 | | $ (58,324) | | $ (35,171) |
9. REGULATORY AND LITIGATION MATTERS
On June 1, 2004, the Attorney General of the State of New Jersey announced that it had dismissed PIMCO from a complaint filed by the New Jersey Attorney General on February 17, 2004, and that it had entered into a settlement agreement (the “New Jersey Settlement”) with Allianz Global Investors of America L.P. (“AGI”) (formerly known as Allianz Dresdner Asset Management of America L.P.), PEA Capital LLC (an entity affiliated with PIMCO through common ownership) (“PEA”) and Allianz Global Investors Distributors LLC (“AGID”), in connection with the same matter. In the New Jersey Settlement, AGI, PEA and AGID neither admitted nor denied the allegations or conclusions of law, but did agree to pay New Jersey a civil fine of $15 million and $3 million for investigative costs and further potential enforcement initiatives against unrelated parties. They also undertook to implement certain governance changes. The complaint relating to the New Jersey Settlement alleged, among other things, that AGI, PEA and AGID had failed to disclose that they improperly allowed certain hedge funds to engage in “market timing” in certain funds. The complaint sought injunctive relief, civil monetary penalties, restitution and disgorgement of profits.
Since February 2004, PIMCO, AGI, PEA, AGID, and certain of their affiliates, including the PIMCO Funds, the Allianz Funds (formerly known as PIMCO Funds: Multi-Manager Series), and the Trustees and employees of the PIMCO Funds, have been named as defendants in fifteen lawsuits filed in various jurisdictions. Eleven of those lawsuits concern “market timing,” and they have been transferred to and consolidated for pre-trial proceedings in a multi-district litigation proceeding in the U.S. District Court for the District of Maryland; the other four lawsuits concern “revenue sharing” and have been consolidated into a single action in the U.S. District Court for the District of Connecticut. The lawsuits have been commenced as putative class actions on behalf of investors who purchased, held or redeemed shares of the various series of the PIMCO Funds and the Allianz Funds during specified periods, or as derivative actions on behalf of the PIMCO Funds and Allianz Funds.
The market timing actions in the District of Maryland generally allege that certain hedge funds were allowed to engage in “market timing” in certain of PIMCO Funds and the Allianz Funds and the this alleged activity was not disclosed. Pursuant to tolling agreements entered into with the derivative and class action plaintiffs, PIMCO, the Trustees, and certain employees of PIMCO who were previously named as defendants have all been dropped as defendants in the market timing actions; the plaintiffs continue to assert claims on behalf of the shareholders of the PIMCO Funds or on behalf of the PIMCO Funds themselves against other defendants. By order dated November 3, 2005, the U.S. District Court for the District of Maryland granted the PIMCO Funds’ motion to dismiss claims asserted against it in a consolidated amended complaint where the PIMCO Funds were named, in the complaint, as a nominal defendant. The revenue sharing action in the District of Connecticut generally alleges that fund assets were inappropriately used to pay brokers to promote the PIMCO Funds and Allianz Funds, including directing fund brokerage transactions to such brokers, and that such alleged arrangements were not fully disclosed to shareholders. On August 11, 2005 the U.S. District Court for the District of Connecticut conducted a hearing on defendants’ motion to dismiss the consolidated amended complaint in the revenue sharing action but has not yet ruled on the motion to dismiss. The market timing and revenue sharing lawsuits seek, among other things, unspecified compensatory damages plus interest and, in some cases, punitive damages, the rescission of investment advisory contracts, the return of fees paid under those contracts and restitution.
Under Section 9(a) of the Investment Company Act of 1940, as amended (“1940 Act”), if the New Jersey Settlement or any of the lawsuits described above were to result in a court injunction against AGI, PEA, AGID and/or their affiliates, PIMCO could, in the absence of exemptive relief granted by the SEC, be barred from serving as an investment adviser, and AGID could be barred from serving as principal underwriter, to any registered investment company, including the Portfolios of the Trust. In connection with an inquiry from the SEC concerning the status of the New Jersey Settlement under Section 9(a), PEA, AGID, AGI and certain of their affiliates (including PIMCO) (together, the “Applicants”) have sought exemptive relief from the SEC under Section 9(c) of the 1940 Act. The SEC has granted the Applicants a temporary exemption from the provisions of Section 9(a) with respect to the New Jersey Settlement until the earlier of (i) September 13, 2006 and (ii) the date on which the SEC takes final action on their application for a permanent order. There is no assurance that the SEC will issue a permanent order.
Two nearly identical class action civil complaints have been filed in August 2005, in the Northern District of Illinois Eastern Division alleging that the plaintiffs each purchased and sold a 10-year Treasury note futures contract and suffered damages from an alleged shortage when PIMCO held both physical and futures positions in 10-year Treasury notes for its client accounts. The two actions have been consolidated into one action, and the two separate complaints have been replaced by a consolidated complaint. PIMCO is a named defendant, and the PIMCO Funds have been added as a defendant, to the consolidated action. PIMCO strongly believes the complaint (and any consolidated complaint filed hereafter) is without merit and intends to vigorously defend itself.
Certain Portfolios of the Trust were recently served in an adversary proceeding brought by the Official Committee of Asbestos Claimants of G-I Holdings, Inc. in G-I Holdings, Inc.’s bankruptcy in the District of New Jersey. PIMCO was previously named in this lawsuit and remains a defendant. The plaintiff seeks to recover for the bankruptcy estate assets that were transferred by the predecessor entity of G-I Holdings, Inc. to a wholly-owned subsidiary in 1994. The subsidiary has since issued notes, of which certain Portfolios of the Trust are alleged to be holders. The complaint alleges that in 2000, more than two hundred noteholders—including certain Portfolios of the Trust—were granted a second priority lien on the assets of the subsidiary in exchange for their consent to a refinancing transaction and the granting of a first priority lien to the lending banks. The plaintiff is seeking invalidation of the lien in favor of the noteholders and/or the value of the lien.
It is possible that these matters and/or other developments resulting from these matters could result in increased fund redemptions or other adverse consequences to the Portfolios. However, PIMCO and AGID believe that these matters are not likely to have a material adverse effect on the Portfolios or on PIMCO’s or AGID’s ability to perform their respective investment advisory or distribution services relating to the Portfolios.
| | | | | | |
| | | Semiannual Report | | June 30, 2006 | | 21 |
Investment Adviser and Administrator
Pacific Investment Management Company LLC
840 Newport Center Drive
Newport Beach, California 92660
Distributor
Allianz Global Investors Distributors LLC
2187 Atlantic Street
Stamford, Connecticut 06902
Custodian
State Street Bank & Trust Company
801 Pennsylvania
Kansas City, Missouri 64105
Transfer Agent
Boston Financial Data Services–Midwest
330 W. 9th Street
Kansas City, Missouri 64105
Legal Counsel
Dechert LLP
1775 I Street, N.W.
Washington, D.C. 20006
Independent Registered Public Accounting Firm
PricewaterhouseCoopers LLP
1055 Broadway
Kansas City, Missouri 64105
P I M C O

Share Class Advisor
Semiannual Report June 30, 2006
PIMCO Variable Insurance Trust
Total Return Portfolio
Table of Contents
This material is authorized for use only when preceded or accompanied by the current PIMCO Variable Insurance Trust (the “Trust”) prospectus. Investors should consider the investment objectives, risks, charges and expenses of this Trust carefully before investing. Ask your financial professional to explain all charges that may apply. This and other information is contained in the Trust’s prospectus. The variable product prospectus may be obtained by contacting your Investment Consultant. Please read the Trust and variable product prospectus carefully before you invest or send money.
Chairman’s Letter
Dear PIMCO Variable Insurance Trust Shareholder:
It is our pleasure to present to you the semiannual report for the PIMCO Variable Insurance Trust covering the six-month period ended June 30, 2006.
Highlights of the global bond markets during the six-month period included:
| | n | | Most fixed-income sectors lost ground during the first half of 2006, as concern about accelerating inflation and central bank tightening pushed interest rates higher worldwide. The benchmark Lehman Brothers Aggregate Bond Index (which includes Treasury, Investment-Grade Corporate, and Residential Mortgage-Backed Securities) returned -0.72% for the first six months of the year. On June 30, the benchmark ten-year Treasury yielded 5.14%, 0.75% higher than at the start of the year. The U.S. yield curve remained flat as shorter-maturity yields rose by a comparable amount. |
| | n | | The Federal Reserve tightened four times during the reporting period, bringing the Federal Funds Rate to 5.25%. The increase near the end of the period was the Federal Reserve’s 17th consecutive rate hike since the start of its tightening cycle in 2004. The Federal Reserve was not alone, as central banks in Europe, India, and China tightened credit in unison for the first time since 2000. The Bank of Japan, whose zero-interest-rate policy has flooded global markets with liquidity, looked set to reverse this policy in the coming months. |
In these pages please find a more complete Portfolio review as it relates to financial-market activities, as well as details about total-return investment performance for the six-month reporting period. Thank you for the trust you have placed in us. We will continue to work diligently to meet your investment needs.
Sincerely,
Brent R. Harris
Chairman, PIMCO Variable Insurance Trust
July 31, 2006
| | | | | | |
| | | Semiannual Report | | June 30, 2006 | | 1 |
Important Information About the Portfolio
PIMCO Variable Insurance Trust (the “Trust”) is an open-end management investment company currently consisting of nineteen separate investment portfolios, including the Total Return Portfolio (the “Portfolio”). The Portfolio is only available as a funding vehicle under variable life insurance policies or variable annuity contracts issued by insurance companies (“Variable Contracts”). Individuals may not purchase shares of the Portfolio directly. Shares of the Portfolio also may be sold to qualified pension and retirement plans outside of the separate account context.
We believe that bond funds have an important role to play in a well diversified investment portfolio. It is important to note, however, that in an environment where interest rates may trend upward, rising rates would negatively impact the performance of most bond funds, and fixed-income securities held by a fund are likely to decrease in value. The price volatility of fixed-income securities can also increase during periods of rising interest rates resulting in increased losses to a fund. Bond funds and individual bonds with a longer duration (a measure of the expected life of a security) tend to be more sensitive to changes in interest rates, usually making them more volatile than securities or funds with shorter durations. The longer-term performance of most bond funds has benefited from capital gains in part resulting from an extended period of declining interest rates. In the event interest rates increase, these capital gains should not be expected to recur.
The Portfolio may be subject to various risks in addition to those described above. Some of these risks may include, but are not limited to, the following: credit risk, high yield risk, market risk, issuer risk, liquidity risk, derivatives risk, mortgage risk, non-U.S. investment risk, currency risk, leveraging risk and management risk. A complete description of these risks is contained in the Portfolio’s prospectus. The Portfolio may use derivative instruments for hedging purposes or as part of an investment strategy. Use of these instruments may involve certain costs and risks such as liquidity risk, interest rate risk, market risk, credit risk, management risk and the risk that the Portfolio could not close out a position when it would be most advantageous to do so. A Portfolio investing in derivatives could lose more than the principal amount invested in these instruments. Investing in non-U.S. securities may entail risk due to non-U.S. economic and political developments; this risk may be increased when investing in emerging markets.
On the performance summary page in this Semiannual Report, the Total Return Investment Performance table measures performance assuming that all dividend and capital gain distributions were reinvested.
An investment in the Portfolio is not a deposit of a bank and is not guaranteed or insured by the Federal Deposit Insurance Corporation or any other government agency. It is possible to lose money on investments in the Portfolio.
PIMCO has adopted written proxy voting policies and procedures (“Proxy Policy”) as required by Rule 206(4)-6 under the Investment Advisers Act of 1940. The Proxy Policy has been adopted by the Trust as the policies and procedures that PIMCO will use when voting proxies on behalf of the Portfolio. Copies of the written Proxy Policy and the factors that PIMCO may consider in determining how to vote proxies for the Portfolio, and information about how the Portfolio voted proxies relating to portfolio securities held during the most recent twelve-month period ended June 30, are available without charge, upon request, by calling the Trust at 1-866-746-2606 and on the Securities and Exchange Commission’s (“SEC”) website at http://www.sec.gov.
The Portfolio files its complete schedule of portfolio holdings with the SEC for the first and third quarters of each fiscal year on Form N-Q. A copy of the Trust’s Form N-Q is available on the SEC’s website at http://www.sec.gov and may be reviewed and copied at the SEC’s Public Reference Room in Washington D.C. Information on the operation of the Public Reference Room may be obtained by calling 1-800-SEC-0330.
PIMCO Variable Insurance Trust is distributed by Allianz Global Investors Distributors LLC, 2187 Atlantic Street, Stamford, CT 06902.
| | | | |
| 2 | | PIMCO Variable Insurance Trust | | |
The following disclosure provides important information regarding the Portfolio’s Expense Example (“Example” or “Expense Example”), which appears in this Semiannual Report. Please refer to this information when reviewing the Expense Example for the Portfolio.
Example
As a shareholder of the Portfolio, you incur two types of costs: (1) transaction costs and (2) ongoing costs, including advisory and administrative fees; distribution and/or service (12b-1) fees (Administrative Class only); and other Portfolio expenses. The Example is intended to help you understand your ongoing costs (in dollars) of investing in the Portfolio and to compare these costs with the ongoing costs of investing in other mutual funds. The Expense Example does not reflect any fees or other expenses imposed by the Variable Contracts. If it did, the expenses reflected in the Expense Examples would be higher. The Example is based on an investment of $1,000 invested at the beginning of the period and held for the entire period indicated, which is from January 1, 2006 to June 30, 2006.
Actual Expenses
The information in the table under the heading “Actual Performance” provides information about actual account values and actual expenses. You may use the information in these columns, together with the amount you invested, to estimate the expenses that you paid over the period. Simply divide your account value by $1,000 (for example, an $8,600 account value divided by $1,000 = 8.60), then multiply the result by the number in the appropriate column for your share class, in the row titled “Expenses Paid During Period” to estimate the expenses you paid on your account during this period.
Hypothetical Example for Comparison Purposes
The information in the table under the heading “Hypothetical Performance (5% return before expenses)” provides information about hypothetical account values and hypothetical expenses based on the Portfolio’s actual expense ratio and an assumed rate of return of 5% per year before expenses, which is not the Portfolio’s actual return. The hypothetical account values and expenses may not be used to estimate the actual ending account balance or expenses you paid for the period. You may use this information to compare the ongoing costs of investing in the Portfolio and other portfolios. To do so, compare this 5% hypothetical example with the 5% hypothetical examples that appear in the shareholder reports of the other portfolios.
Please note that the expenses shown in the table are meant to highlight your ongoing costs only and do not reflect any transactional costs. Therefore, the information under the heading “Hypothetical Performance (5% return before expenses)” is useful in comparing ongoing costs only, and will not help you determine the relative total costs of owning different portfolios. In addition, if these transactional costs were included, your costs would have been higher.
The expense ratio may vary period to period because of various factors, such as an increase in expenses not covered by the advisory and administrative fees (such as expenses of the trustees and their counsel or litigation expense).
Portfolio Benchmark
Lehman Brothers Aggregate Bond Index represents securities that are taxable, and dollar denominated. The index covers the U.S. investment grade fixed rate bond market, with index components for government and corporate securities, mortgage pass-through securities, and asset-backed securities. These major sectors are subdivided into more specific indices that are calculated and reported on a regular basis. It is not possible to invest directly in this index.
| | | | | | |
| | | Semiannual Report | | June 30, 2006 | | 3 |
|
|
| PIMCO Total Return Portfolio |
|
Cumulative Returns Through June 30, 2006
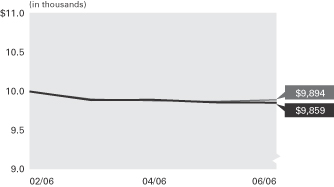
Total Return Lehman Brothers
Portfolio Advisor Class Aggregate Bond Index
----------------------- --------------------
02/28/2006 $10,000 $10,000
03/31/2006 9,890 9,902
04/30/2006 9,894 9,884
05/31/2006 9,860 9,873
06/30/2006 9,859 9,894
$10,000 invested at the beginning of the first full month following the inception date of the Portfolio’s Advisor Class.
Sector Breakdown‡
| | |
U.S. Government Agencies | | 44.8% |
Short-Term Instruments | | 42.3% |
Corporate Bonds & Notes | | 4.6% |
Mortgage-Backed Securities | | 3.2% |
Other | | 5.1% |
| | ‡ | % of Total Investments as of June 30, 2006 |
| | | | | | | | | | | | | | |
| Cumulative Total Return for the period ended June 30, 2006 |
| | | | | | | | | | | | | | | Since
Inception
(02/28/06) |
| | |
| | PIMCO Total Return Portfolio Advisor Class | | | | | | | | | | -1.41% |
| | |
| | Lehman Brothers Aggregate Bond Index | | | | | | | | | | -1.06% |
Past performance is no guarantee of future results. The performance quoted represents past performance. Investment return and principal value will fluctuate so that Fund shares, when redeemed, may be worth more or less than their original cost. The Portfolio’s performance does not reflect the deduction of additional charges and expenses imposed in connection with investing in Variable Contracts, which will reduce returns. Current performance may be lower or higher than the performance data quoted. Performance data current to the most recent month-end is available by calling (800) 927-4648.
| | | | | | | | | | |
| Expense Example | | | | Actual Performance | | | | Hypothetical Performance |
| | | | | | | | | (5% return before expenses) |
Beginning Account Value (02/28/06) | | | | $ | 1,000.00 | | | | $ | 1,000.00 |
Ending Account Value (06/30/06) | | | | $ | 985.90 | | | | $ | 1,014.32 |
Expenses Paid During Period† | | | | $ | 2.51 | | | | $ | 2.55 |
† Expenses are equal to the Portfolio’s Advisor Class annualized expense ratio of 0.75%, multiplied by the average account value over the period, multiplied by 123/365 (to reflect the period since the Portfolio’s Advisor Class shares commenced operations on 02/28/06). Overall fees and expenses of investing in the Portfolio will be higher because the example does not reflect Variable Contract fees and expenses.
Please refer to page 3 herein for a description of the Portfolio’s benchmark and an explanation of the information presented in the above Expense Example.
Portfolio Insights
| » | | The PIMCO Total Return Portfolio seeks to achieve its investment objective by investing under normal circumstances at least 65% of its total assets in a diversified portfolio of Fixed-Income Instruments of varying maturities. |
| » | | The Portfolio’s above-benchmark duration detracted from returns as yields rose in the first half of the year. |
| » | | An emphasis on short-term maturities detracted from performance as short-term yields rose more than longer-dated yields. The Federal Reserve continued with its tightening policy, sending short-term rates higher while intermediate- and longer-term rates shifted higher. |
| » | | An overweight to mortgages contributed to returns as this sector outperformed like-duration Treasuries. |
| » | | An underweight to corporate securities detracted from returns as this sector outperformed like-duration Treasuries. |
| » | | Strategies designed to benefit when Euroland bonds underperform Treasuries added to returns as European yields increased more than yields in the U.S. |
| » | | An allocation to the Yen and the Euro was positive for returns, as both currencies appreciated relative to the dollar. |
| » | | Emerging Market bonds added to performance, as strong demand for their attractive yields and improving credit fundamentals caused yield premiums to decline. |
| » | | A tactical allocation to municipal bonds was positive for performance as municipal yields rose less than Treasury yields. |
| | | | |
| 4 | | PIMCO Variable Insurance Trust | | |
| | |
| |
| Financial Highlights Total Return Portfolio | | |
| | | | |
| Selected Per Share Data for the Period Ended: | | 02/28/2006-
06/30/2006+ | |
| |
Advisor Class | | | | |
| Net asset value beginning of period | | $ | 10.24 | |
| Net investment income (a) | | | 0.15 | |
| Net realized/unrealized (loss) on investments (a) | | | (0.29 | ) |
| Total (loss) from investment operations | | | (0.14 | ) |
| Dividends from net investment income | | | (0.15 | ) |
| Total distributions | | | (0.15 | ) |
| Net asset value end of period | | $ | 9.95 | |
| Total return | | | (1.41 | )% |
| Net assets end of period (000s) | | $ | 4,537 | |
| Ratio of expenses to average net assets | | | 0.75 | %* |
| Ratio of net investment income to average net assets | | | 4.53 | %* |
| Portfolio turnover rate | | | 168 | % |
+ Unaudited
* Annualized
(a) Per share amounts based on average number of shares outstanding during the period.
| | | | | | |
| See Accompanying Notes | | Semiannual Report | | June 30, 2006 | | 5 |
| | |
| |
| Statement of Assets and Liabilities Total Return Portfolio | | |
| | | | |
| (Amounts in thousands, except per share amounts) | | June 30, 2006
(Unaudited) | |
| |
Assets: | | | | |
Investments, at value | | $ | 3,407,611 | |
Cash | | | 61 | |
Foreign currency, at value | | | 81,813 | |
Receivable for investments sold | | | 15,669 | |
Receivable for investments sold on delayed-delivery basis | | | 919 | |
Receivable for Portfolio shares sold | | | 23,363 | |
Interest and dividends receivable | | | 9,921 | |
Variation margin receivable | | | 2,016 | |
Swap premiums paid | | | 731 | |
Unrealized appreciation on forward foreign currency contracts | | | 1,600 | |
Unrealized appreciation on swap agreements | | | 941 | |
| | | | 3,544,645 | |
| |
Liabilities: | | | | |
Payable for investments purchased | | $ | 539,396 | |
Payable for Portfolio shares redeemed | | | 2,491 | |
Written options outstanding | | | 12,179 | |
Dividends payable | | | 1,607 | |
Accrued investment advisory fee | | | 644 | |
Accrued administration fee | | | 644 | |
Accrued servicing fee | | | 330 | |
Swap premiums received | | | 3,127 | |
Unrealized depreciation on forward foreign currency contracts | | | 12,289 | |
Unrealized depreciation on swap agreements | | | 1,949 | |
| | | | 574,656 | |
| |
Net Assets | | $ | 2,969,989 | |
| |
Net Assets Consist of: | | | | |
Paid in capital | | $ | 3,062,923 | |
Undistributed net investment income | | | 14,505 | |
Accumulated undistributed net realized (loss) | | | (34,688 | ) |
Net unrealized (depreciation) | | | (72,751 | ) |
| | | $ | 2,969,989 | |
| |
Net Assets: | | | | |
Institutional Class | | $ | 153,328 | |
Administrative Class | | | 2,812,124 | |
Advisor Class | | | 4,537 | |
| |
Shares Issued and Outstanding: | | | | |
Institutional Class | | | 15,415 | |
Administrative Class | | | 282,722 | |
Advisor Class | | | 456 | |
| |
Net Asset Value and Redemption Price Per Share (Net Assets Per Share Outstanding) | | | | |
Institutional Class | | $ | 9.95 | |
Administrative Class | | | 9.95 | |
Advisor Class | | | 9.95 | |
| |
Cost of Investments Owned | | $ | 3,442,782 | |
Cost of Foreign Currency Held | | $ | 80,689 | |
Premiums Received on Written Options | | $ | 9,947 | |
| | | | |
| 6 | | PIMCO Variable Insurance Trust | | See Accompanying Notes |
| | |
| |
| Statement of Operations Total Return Portfolio | | |
| | | | |
| (Amounts in Thousands) | | Six Months Ended
June 30, 2006
(Unaudited) | |
| |
Investment Income: | | | | |
Interest | | $ | 69,794 | |
Dividends | | | 409 | |
Miscellaneous income | | | 28 | |
Total Income | | | 70,231 | |
| |
Expenses: | | | | |
Investment advisory fees | | | 3,619 | |
Administration fees | | | 3,619 | |
Servicing fees – Administrative Class | | | 2,060 | |
Distribution and/or serving fees – Advisor Class | | | 1 | |
Trustees’ fees | | | 17 | |
Total Expenses | | | 9,316 | |
| |
Net Investment Income | | | 60,915 | |
| |
Net Realized and Unrealized Gain (Loss): | | | | |
Net realized (loss) on investments | | | (10,853 | ) |
Net realized (loss) on futures contracts, options and swaps | | | (5,390 | ) |
Net realized (loss) on foreign currency transactions | | | (2,076 | ) |
Net change in unrealized (depreciation) on investments | | | (42,712 | ) |
Net change in unrealized (depreciation) on futures contracts, options and swaps | | | (30,889 | ) |
Net change in unrealized appreciation on translation of assets and liabilities denominated in foreign currencies | | | 7,617 | |
Net (Loss) | | | (84,303 | ) |
| |
Net (Decrease) in Net Assets Resulting from Operations | | $ | (23,388 | ) |
| | | | | | |
| See Accompanying Notes | | Semiannual Report | | June 30, 2006 | | 7 |
| | |
| |
| Statements of Changes in Net Assets Total Return Portfolio | | |
| | | | | | | | |
| (Amounts in Thousands) | | Six Months Ended June 30, 2006
(Unaudited) | | | Year Ended
December 31, 2005 | |
| | |
Increase (Decrease) in Net Assets from: | | | | | | | | |
| | |
Operations: | | | | | | | | |
Net investment income | | $ | 60,915 | | | $ | 89,824 | |
Net realized gain (loss) | | | (18,319 | ) | | | 3,530 | |
Net change in unrealized (depreciation) | | | (65,984 | ) | | | (30,402 | ) |
Net increase (decrease) resulting from operations | | | (23,388 | ) | | | 62,952 | |
| | |
Distributions to Shareholders: | | | | | | | | |
| From net investment income | | | | | | | | |
Institutional Class | | | (3,281 | ) | | | (4,842 | ) |
Administrative Class | | | (58,991 | ) | | | (86,714 | ) |
Advisor Class | | | (15 | ) | | | 0 | |
| From net realized capital gains | | | | | | | | |
Institutional Class | | | 0 | | | | (2,255 | ) |
Administrative Class | | | 0 | | | | (42,750 | ) |
Advisor Class | | | 0 | | | | 0 | |
| | |
Total Distributions | | | (62,287 | ) | | | (136,561 | ) |
| | |
Portfolio Share Transactions: | | | | | | | | |
| Receipts for shares sold | | | | | | | | |
Institutional Class | | | 37,370 | | | | 43,745 | |
Administrative Class | | | 384,517 | | | | 630,483 | |
Advisor Class | | | 4,550 | | | | 0 | |
| Issued in reorganization | | | | | | | | |
Institutional Class | | | 0 | | | | 88,822 | |
Administrative Class | | | 0 | | | | 0 | |
Advisor Class | | | 0 | | | | 0 | |
| Issued as reinvestment of distributions | | | | | | | | |
Institutional Class | | | 3,281 | | | | 7,097 | |
Administrative Class | | | 50,219 | | | | 110,757 | |
Advisor Class | | | 15 | | | | 0 | |
| Cost of shares redeemed | | | | | | | | |
Institutional Class | | | (26,672 | ) | | | (55,888 | ) |
Administrative Class | | | (245,706 | ) | | | (319,629 | ) |
Advisor Class | | | (13 | ) | | | 0 | |
Net increase resulting from Portfolio share transactions | | | 207,561 | | | | 505,387 | |
| | |
Total Increase in Net Assets | | | 121,886 | | | | 431,778 | |
| | |
Net Assets: | | | | | | | | |
Beginning of period | | | 2,848,103 | | | | 2,416,325 | |
End of period* | | $ | 2,969,989 | | | $ | 2,848,103 | |
| | |
*Including undistributed net investment income of: | | $ | 14,505 | | | $ | 15,877 | |
| | | | |
| 8 | | PIMCO Variable Insurance Trust | | See Accompanying Notes |
| | |
| |
| Schedule of Investments Total Return Portfolio | | June 30, 2006 (Unaudited) |
| | | | | | | | |
| | | | | PRINCIPAL | | | | |
| | | | | AMOUNT | | | | VALUE |
| | | | | (000S) | | | | (000S) |
| BANK LOAN OBLIGATIONS 0.1% |
| Cablevision Systems Corp. | | | | | | | | |
6.670% due 02/24/2013 | | $ | | 7 | | $ | | 6 |
6.740% due 02/24/2013 | | | | 743 | | | | 740 |
|
| CSC Holdings, Inc. | | | | | | | | |
6.880% due 02/24/2013 | | | | 743 | | | | 740 |
6.988% due 02/24/2013 | | | | 1,108 | | | | 1,104 |
| | | | | | | | |
|
Total Bank Loan Obligations
(Cost $2,600) | | | | 2,590 |
| | | | | | | | |
|
| |
| CORPORATE BONDS & NOTES 5.3% |
| |
| BANKING & FINANCE 3.3% | | | | | | | | |
| American General Finance Corp. |
5.489% due 03/23/2007 | | | | 1,600 | | | | 1,601 |
|
| American International Group, Inc. |
5.050% due 10/01/2015 | | | | 1,300 | | | | 1,215 |
|
| Atlantic & Western Re Ltd. |
10.990% due 01/09/2007 | | | | 600 | | | | 591 |
|
| China Development Bank |
5.000% due 10/15/2015 | | | | 900 | | | | 842 |
|
| CIT Group Holdings, Inc. |
5.276% due 01/30/2009 | | | | 6,400 | | | | 6,417 |
|
| Citigroup, Inc. |
5.520% due 12/26/2008 | | | | 8,200 | | | | 8,208 |
|
| Export-Import Bank of China |
4.875% due 07/21/2015 | | | | 900 | | | | 836 |
|
| Export-Import Bank of Korea |
4.125% due 02/10/2009 | | | | 140 | | | | 134 |
|
| Ford Motor Credit Co. |
6.374% due 03/21/2007 | | | | 900 | | | | 897 |
|
| General Electric Capital Corp. |
5.050% due 01/03/2008 | | | | 14,360 | | | | 14,385 |
|
| Goldman Sachs Group, Inc. |
5.250% due 11/10/2008 | | | | 7,100 | | | | 7,108 |
|
| HBOS PLC |
5.920% due 09/29/2049 | | | | 1,100 | | | | 1,015 |
|
| HSBC Bank USA N.A. |
5.494% due 09/21/2007 | | | | 14,500 | | | | 14,517 |
|
| Morgan Stanley |
5.276% due 02/09/2009 | | | | 14,600 | | | | 14,627 |
|
| MUFG Capital Finance 1 Ltd. |
6.346% due 07/29/2049 | | | | 700 | | | | 676 |
|
| Petroleum Export Ltd. |
5.265% due 06/15/2011 | | | | 956 | | | | 928 |
|
| Phoenix Quake Ltd. |
7.440% due 07/03/2008 | | | | 800 | | | | 811 |
|
| Phoenix Quake Wind II Ltd. |
8.490% due 07/03/2008 | | | | 400 | | | | 364 |
|
| Phoenix Quake Wind Ltd. |
7.440% due 07/03/2008 | | | | 800 | | | | 808 |
|
| Premium Asset Trust |
5.645% due 09/08/2007 | | | | 100 | | | | 100 |
|
| Resona Bank Ltd. |
5.850% due 09/29/2049 | | | | 1,200 | | | | 1,118 |
|
| Royal Bank of Scotland PLC |
5.125% due 07/21/2008 | | | | 6,400 | | | | 6,405 |
|
| UFJ Finance Aruba AEC |
6.750% due 07/15/2013 | | | | 300 | | | | 313 |
|
| USB Capital IX |
6.189% due 04/15/2042 | | | | 900 | | | | 881 |
| | | | | | | | |
| Vita Capital Ltd. |
6.340% due 01/01/2007 | | $ | | 500 | | $ | | 502 |
|
| Wachovia Bank N.A. |
5.480% due 06/27/2008 | | | | 6,300 | | | | 6,302 |
5.489% due 03/23/2009 | | | | 7,100 | | | | 7,100 |
| | | | | | | | |
|
| | | | | | | | | 98,701 |
| | | | | | | | |
|
| |
| INDUSTRIALS 1.1% | | | | | | | | |
| DaimlerChrysler N.A. Holding Corp. |
6.160% due 08/08/2006 | | | | 900 | | | | 900 |
|
| El Paso Corp. |
6.750% due 05/15/2009 | | | | 6,000 | | | | 5,955 |
9.625% due 05/15/2012 | | | | 800 | | | | 878 |
7.875% due 06/15/2012 | | | | 5,800 | | | | 5,931 |
7.800% due 08/01/2031 | | | | 1,500 | | | | 1,464 |
|
| HJ Heinz Co. |
6.428% due 12/01/2008 | | | | 1,100 | | | | 1,118 |
|
| Morgan Stanley Bank AG for OAO Gazprom |
9.625% due 03/01/2013 | | | | 100 | | | | 115 |
|
| Pemex Project Funding Master Trust |
8.000% due 11/15/2011 | | | | 100 | | | | 106 |
5.750% due 12/15/2015 | | | | 2,300 | | | | 2,121 |
8.625% due 02/01/2022 | | | | 1,200 | | | | 1,345 |
9.500% due 09/15/2027 | | | | 55 | | | | 66 |
|
| United Airlines, Inc. |
8.030% due 07/01/2011 (b) | | | | 465 | | | | 475 |
6.071% due 03/01/2013 | | | | 5,423 | | | | 5,413 |
|
| Viacom, Inc. |
5.750% due 04/30/2011 | | | | 1,000 | | | | 983 |
|
| Williams Cos., Inc. |
6.375% due 10/01/2010 | | | | 7,000 | | | | 6,860 |
| | | | | | | | |
|
| | | | | | | | | 33,730 |
| | | | | | | | |
|
| |
| UTILITIES 0.9% | | | | | | | | |
| AT&T, Inc. |
4.214% due 06/05/2007 | | | | 8,600 | | | | 8,504 |
|
| Entergy Gulf States, Inc. |
6.000% due 12/01/2012 | | | | 6,500 | | | | 6,399 |
5.700% due 06/01/2015 | | | | 8,300 | | | | 7,822 |
|
| Korea Electric Power Corp. |
5.125% due 04/23/2034 | | | | 90 | | | | 86 |
|
| Qwest Capital Funding, Inc. |
7.250% due 02/15/2011 | | | | 657 | | | | 642 |
|
| Ras Laffan LNG III |
5.838% due 09/30/2027 | | | | 2,600 | | | | 2,428 |
|
| TPSA Finance BV |
7.750% due 12/10/2008 | | | | 120 | | | | 125 |
| | | | | | | | |
|
| | | | | | | | | 26,006 |
| | | | | | | | |
|
Total Corporate Bonds & Notes (Cost $157,270) | | | | | | | | 158,437 |
| | | | | | | | |
|
| |
| MUNICIPAL BONDS & NOTES 1.8% |
| Arizona State Salt River Project Agricultural Improvement and Power District Revenue Bonds, Series 2005 |
5.800% due 01/01/2035 | | | | 95 | | | | 91 |
|
| Badger, Wisconsin Tobacco Asset Securitization Corporations Revenue Notes, Series 2002 |
6.000% due 06/01/2017 | | | | 3,700 | | | | 3,906 |
|
| Chicago, Illinois General Obligation Bonds, (MBIA Insured), Series 2003 |
5.000% due 01/01/2035 | | | | 10,000 | | | | 10,125 |
| | | | | | | | | |
| Golden State, California Tobacco Securitization Corporations Revenue Bonds, Series 2003 |
6.250% due 06/01/2033 | | $ | | 2,900 | | | $ | | 3,162 |
|
| Iowa State Tobacco Settlement Authority Revenue Notes, Series 2005 |
6.500% due 06/01/2023 | | | | 1,185 | | | | | 1,166 |
|
| New Jersey State Tobacco Settlement Financing Corporations Revenue Bonds, Series 2002 |
6.000% due 06/01/2037 | | | | 1,530 | | | | | 1,611 |
|
| New Jersey State Tobacco Settlement Financing Corporations Revenue Bonds, Series 2003 |
6.750% due 06/01/2039 | | | | 5,450 | | | | | 6,061 |
|
| New Jersey State Tobacco Settlement Financing Corporations Revenue Notes, Series 2003 |
4.375% due 06/01/2019 | | | | 3,115 | | | | | 3,110 |
|
| New York City, New York General Obligation Notes, Series 2005 |
5.000% due 03/01/2030 | | | | 1,500 | | | | | 1,521 |
|
| New York City, New York Municipal Finance Authority Water & Sewer Revenue Bonds, Series 2006-C |
4.750% due 06/15/2033 | | | | 17,400 | | | | | 17,037 |
|
| New York State Environmental Facilities Corporations Revenue Notes, Series 2002 |
5.980% due 06/15/2023 | | | | 850 | | | | | 914 |
|
| Texas State General Obligation Bonds, Series 2005 |
4.750% due 04/01/2035 | | | | 3,600 | | | | | 3,495 |
| | | | | | | | | |
|
Total Municipal Bonds & Notes
(Cost $50,324) | | | | | 52,199 |
| | | | | | | | | |
|
| |
| U.S. GOVERNMENT AGENCIES 51.5% |
| Fannie Mae |
2.500% due 06/15/2008 | | | | 2,480 | | | | | 2,346 |
4.000% due 10/01/2018 | | | | 474 | | | | | 439 |
4.500% due 08/17/2021 - 04/01/2035 (d) | | | | 2,240 | | | | | 2,068 |
4.685% due 05/25/2035 | | | | 1,300 | | | | | 1,260 |
4.712% due 04/01/2035 | | | | 3,351 | | | | | 3,284 |
4.752% due 04/01/2035 | | | | 4,995 | | | | | 4,865 |
4.933% due 11/01/2035 | | | | 363 | | | | | 364 |
4.982% due 10/01/2032 | | | | 1,876 | | | | | 1,879 |
5.000% due 01/01/2018 - 07/13/2036 (d) | | | | 257,949 | | | | | 243,480 |
5.249% due 11/28/2035 | | | | 302 | | | | | 302 |
5.312% due 09/22/2006 | | | | 10,300 | | | | | 10,299 |
5.411% due 09/01/2040 | | | | 107 | | | | | 108 |
5.500% due 04/01/2014 - 07/13/2036 (d) | | | | 1,175,621 | | | | | 1,131,558 |
5.672% due 03/25/2044 | | | | 8,393 | | | | | 8,404 |
5.695% due 09/01/2034 | | | | 3,155 | | | | | 3,140 |
5.702% due 11/01/2025 | | | | 3 | | | | | 3 |
5.707% due 09/01/2039 | | | | 118 | | | | | 121 |
5.736% due 12/01/2036 | | | | 3,099 | | | | | 3,083 |
6.000% due 04/01/2016 - 08/14/2036 (d) | | | | 30,736 | | | | | 30,440 |
6.500% due 06/01/2029 - 04/01/2032 (d) | | | | 418 | | | | | 422 |
7.000% due 04/25/2023 - 06/01/2032 (d) | | | | 4,202 | | | | | 4,319 |
|
| Federal Home Loan Bank |
4.200% due 02/05/2007 | | | | 2,000 | | | | | 1,925 |
|
| Federal Housing Administration |
7.430% due 01/25/2023 | | | | 55 | | | | | 55 |
| | | | | | |
| See Accompanying Notes | | Semiannual Report | | June 30, 2006 | | 9 |
| | |
| |
| Schedule of Investments Total Return Portfolio (Cont.) | | |
| | | | | | | | |
| | | | | PRINCIPAL | | | | |
| | | | | AMOUNT | | | | VALUE |
| | | | | (000S) | | | | (000S) |
| Freddie Mac |
4.500% due 04/01/2018 - 10/01/2018 (d) | | $ | | 2,653 | | $ | | 2,511 |
5.000% due 04/01/2018 - 09/01/2035 (d) | | | | 9,788 | | | | 9,345 |
5.211% due 02/25/2045 | | | | 1,453 | | | | 1,442 |
5.500% due 04/01/2033 - 07/13/2036 (d) | | | | 38,066 | | | | 36,573 |
5.649% due 11/15/2030 | | | | 41 | | | | 41 |
5.699% due 09/15/2030 | | | | 38 | | | | 38 |
5.957% due 01/01/2028 | | | | 3 | | | | 4 |
6.000% due 07/01/2016 - 11/01/2033 (d) | | | | 7,206 | | | | 7,141 |
6.045% due 07/01/2030 | | | | 3 | | | | 3 |
6.099% due 07/01/2027 | | | | 3 | | | | 3 |
6.500% due 03/01/2013 - 03/01/2034 (d) | | | | 1,156 | | | | 1,170 |
7.000% due 06/15/2023 | | | | 2,262 | | | | 2,327 |
7.500% due 07/15/2030 - 03/01/2032 (d) | | | | 359 | | | | 371 |
8.500% due 08/01/2024 | | | | 20 | | | | 21 |
|
| Government National Mortgage Association |
4.375% due 04/20/2026 - 05/20/2030 (d) | | | | 156 | | | | 156 |
4.500% due 07/20/2030 | | | | 22 | | | | 22 |
4.750% due 02/20/2032 | | | | 1,359 | | | | 1,350 |
5.125% due 10/20/2029 - 11/20/2029 (d) | | | | 425 | | | | 428 |
5.375% due 02/20/2027 | | | | 7 | | | | 7 |
5.500% due 04/15/2033 - 09/15/2033 (d) | | | | 670 | | | | 650 |
5.667% due 06/20/2030 | | | | 3 | | | | 3 |
5.767% due 09/20/2030 | | | | 33 | | | | 34 |
6.500% due 03/15/2031 - 04/15/2032 (d) | | | | 318 | | | | 322 |
|
| Small Business Administration |
6.030% due 02/10/2012 | | | | 7,101 | | | | 7,178 |
6.344% due 08/01/2011 | | | | 880 | | | | 897 |
7.449% due 08/01/2010 | | | | 15 | | | | 15 |
8.017% due 02/10/2010 | | | | 101 | | | | 106 |
|
| Small Business Administration Participation Certificates |
5.130% due 09/01/2023 | | | | 85 | | | | 82 |
6.290% due 01/01/2021 | | | | 237 | | | | 242 |
7.500% due 04/01/2017 | | | | 1,310 | | | | 1,360 |
| | | | | | | | |
|
Total U.S. Government Agencies (Cost $1,575,938) | | | | 1,528,006 |
| | | | | | | | |
|
| |
| U.S. TREASURY OBLIGATIONS 1.1% |
| Treasury Inflation Protected Securities (c) |
3.375% due 01/15/2007 (f) | | | | 509 | | | | 511 |
2.375% due 01/15/2025 | | | | 15,396 | | | | 14,989 |
2.000% due 01/15/2026 | | | | 16,348 | | | | 14,972 |
3.625% due 04/15/2028 | | | | 2,492 | | | | 2,958 |
| | | | | | | | |
|
Total U.S. Treasury Obligations
(Cost $36,126) | | | | 33,430 |
| | | | | | | | |
|
| |
| MORTGAGE-BACKED SECURITIES 3.7% |
| American Home Mortgage Investment Trust |
4.390% due 02/25/2045 | | | | 4,785 | | | | 4,618 |
|
| Banc of America Commercial Mortgage, Inc. |
4.875% due 06/10/2039 | | | | 590 | | | | 574 |
4.128% due 07/10/2042 | | | | 395 | | | | 378 |
|
| Banc of America Funding Corp. |
4.116% due 05/25/2035 | | | | 5,662 | | | | 5,459 |
|
| Banc of America Mortgage Securities |
6.500% due 10/25/2031 | | | | 1,847 | | | | 1,860 |
5.403% due 10/20/2032 | | | | 245 | | | | 245 |
6.500% due 09/25/2033 | | | | 632 | | | | 630 |
| | | | | | | | |
| Bear Stearns Adjustable Rate Mortgage Trust |
5.546% due 11/25/2030 | | $ | | 14 | | $ | | 14 |
5.340% due 02/25/2033 | | | | 504 | | | | 503 |
5.621% due 02/25/2033 | | | | 330 | | | | 326 |
5.062% due 04/25/2033 | | | | 1,568 | | | | 1,552 |
4.812% due 01/25/2034 | | | | 3,826 | | | | 3,754 |
4.750% due 10/25/2035 | | | | 23,957 | | | | 23,515 |
|
| Bear Stearns Alt-A Trust |
5.448% due 05/25/2035 | | | | 9,122 | | | | 9,018 |
|
| Citigroup Mortgage Loan Trust, Inc. |
4.700% due 12/25/2035 | | | | 1,998 | | | | 1,959 |
|
| Countrywide Alternative Loan Trust |
4.673% due 08/25/2034 | | | | 350 | | | | 347 |
|
| Countrywide Home Loan Mortgage Pass-Through Trust |
5.592% due 05/25/2034 | | | | 1,435 | | | | 1,433 |
5.250% due 02/20/2036 | | | | 2,404 | | | | 2,358 |
|
| CS First Boston Mortgage Securities Corp. |
6.257% due 06/25/2032 | | | | 197 | | | | 197 |
5.672% due 10/25/2032 | | | | 112 | | | | 112 |
|
| First Nationwide Trust |
6.750% due 08/21/2031 | | | | 121 | | | | 121 |
|
| Greenwich Capital Commercial Funding Corp. |
5.317% due 06/10/2036 | | | | 915 | | | | 884 |
|
| GS Mortgage Securities Corp. II |
5.396% due 08/10/2038 | | | | 905 | | | | 876 |
|
| GSR Mortgage Loan Trust |
4.541% due 09/25/2035 | | | | 24,774 | | | | 24,118 |
|
| Impac CMB Trust |
5.572% due 04/25/2034 | | | | 1,587 | | | | 1,588 |
|
| Indymac ARM Trust |
6.648% due 01/25/2032 | | | | 13 | | | | 13 |
|
| Merrill Lynch Mortgage Trust |
4.353% due 02/12/2042 | | | | 515 | | | | 498 |
|
| Morgan Stanley Capital I |
4.050% due 01/13/2041 | | | | 530 | | | | 503 |
|
| Prime Mortgage Trust |
5.722% due 02/25/2019 | | | | 327 | | | | 328 |
5.722% due 02/25/2034 | | | | 1,430 | | | | 1,435 |
|
| Residential Funding Mortgage Security I |
6.500% due 03/25/2032 | | | | 1,679 | | | | 1,672 |
|
| Structured Asset Mortgage Investments, Inc. |
5.582% due 09/19/2032 | | | | 361 | | | | 362 |
|
| Structured Asset Securities Corp. |
6.103% due 02/25/2032 | | | | 35 | | | | 35 |
6.150% due 07/25/2032 | | | | 92 | | | | 93 |
|
| Superannuation Members Home Loans Global Fund |
5.548% due 06/15/2026 | | | | 1 | | | | 1 |
|
| Torrens Trust |
5.459% due 07/15/2031 | | | | 394 | | | | 394 |
|
| Washington Mutual, Inc. |
5.126% due 10/25/2032 | | | | 433 | | | | 430 |
5.410% due 08/25/2042 | | | | 6,304 | | | | 6,302 |
5.612% due 10/25/2045 | | | | 2,969 | | | | 2,988 |
|
| Wells Fargo Mortgage-Backed Securities Trust |
4.950% due 03/25/2036 | | | | 9,327 | | | | 9,201 |
| | | | | | | | |
|
Total Mortgage-Backed Securities (Cost $112,567) | | | | 110,694 |
| | | | | | | | |
|
| |
| ASSET-BACKED SECURITIES 0.2% |
| AAA Trust | | | | | | | | |
5.422% due 11/26/2035 | | | | 1,009 | | | | 1,011 |
|
| Amortizing Residential Collateral Trust |
5.592% due 06/25/2032 | | | | 546 | | | | 547 |
| | | | | | | | |
| Carrington Mortgage Loan Trust |
5.402% due 06/25/2035 | | $ | | 491 | | $ | | 491 |
|
| Citifinancial Mortgage Securities, Inc. |
3.082% due 08/25/2033 | | | | 9 | | | | 9 |
3.221% due 10/25/2033 | | | | 39 | | | | 38 |
|
| Conseco Finance |
5.569% due 12/15/2029 | | | | 110 | | | | 110 |
|
| EMC Mortgage Loan Trust |
5.692% due 05/25/2040 | | | | 902 | | | | 905 |
|
| GSAMP Trust |
5.512% due 10/25/2033 | | | | 839 | | | | 840 |
|
| Morgan Stanley Dean Witter Capital I |
5.652% due 07/25/2032 | | | | 14 | | | | 14 |
|
| Residential Asset Mortgage Products, Inc. |
4.450% due 07/25/2028 | | | | 1,145 | | | | 1,134 |
4.230% due 05/25/2029 | | | | 152 | | | | 151 |
4.003% due 01/25/2030 | | | | 143 | | | | 142 |
|
| Structured Asset Securities Corp. |
5.371% due 01/25/2033 | | | | 73 | | | | 74 |
4.370% due 10/25/2034 | | | | 525 | | | | 518 |
| | | | | | | | |
|
Total Asset-Backed Securities
(Cost $5,999) | | 5,984 |
| | | | | | | | |
|
| |
| SOVEREIGN ISSUES 0.5% | | | | |
| Brazilian Government International Bond |
10.500% due 07/14/2014 | | | | 2,340 | | | | 2,823 |
8.000% due 01/15/2018 | | | | 3,000 | | | | 3,172 |
8.875% due 04/15/2024 | | | | 90 | | | | 100 |
|
| Financing Corp. Fico | | | | | | | | |
0.000% due 04/05/2019 | | | | 840 | | | | 416 |
0.000% due 09/26/2019 | | | | 830 | | | | 399 |
|
| Mexico Government International Bond | | |
8.375% due 01/14/2011 | | | | 200 | | | | 219 |
|
| Panama Government International Bond | | |
9.625% due 02/08/2011 | | | | 480 | | | | 535 |
8.875% due 09/30/2027 | | | | 5,200 | | | | 5,915 |
6.700% due 01/26/2036 | | | | 431 | | | | 397 |
|
| South Africa Government International Bond |
9.125% due 05/19/2009 | | | | 500 | | | | 538 |
| | | | | | | | |
|
Total Sovereign Issues (Cost $13,334) | | 14,514 |
| | | | | | | | |
|
| |
| FOREIGN CURRENCY-DENOMINATED ISSUES (j) 1.5% |
| Netherlands Government Bond |
3.000% due 07/15/2006 | | EUR | | 29,700 | | | | 37,987 |
|
| United Kingdom Gilt | | | | | | | | |
4.750% due 06/07/2010 | | GBP | | 2,700 | | | | 4,984 |
4.750% due 09/07/2015 | | | | 1,000 | | | | 1,853 |
| | | | | | | | |
|
Total Foreign Currency-Denominated Issues (Cost $44,437) | | 44,824 |
| | | | | | | | |
|
| | | | |
| 10 | | PIMCO Variable Insurance Trust | | See Accompanying Notes |
| | |
| |
| | | June 30, 2006 (Unaudited) |
| | | | | | | | |
| | | | | NOTIONAL | | | | |
| | | | | AMOUNT | | | | VALUE |
| | | | | (000S) | | | | (000S) |
| PURCHASED CALL OPTIONS 0.1% |
| 2-Year Interest Rate Swap (OTC) Pay 3-Month USD-LIBOR Floating Rate Index |
Strike @ 4.500%
Exp. 10/04/2006 | | $ | | 78,500 | | $ | | 0 |
Strike @ 4.750%
Exp. 08/07/2006 | | | | 123,000 | | | | 0 |
Strike @ 4.750%
Exp. 08/08/2006 | | | | 37,000 | | | | 0 |
Strike @ 4.800%
Exp. 12/22/2006 | | | | 83,000 | | | | 11 |
Strike @ 5.000%
Exp. 03/08/2007 | | | | 130,000 | | | | 112 |
Strike @ 5.080%
Exp. 04/19/2007 | | | | 98,900 | | | | 143 |
Strike @ 5.130%
Exp. 10/25/2006 | | | | 190,000 | | | | 57 |
Strike @ 5.170%
Exp. 02/01/2007 | | | | 73,500 | | | | 88 |
Strike @ 5.200%
Exp. 05/09/2007 | | | | 163,400 | | | | 357 |
Strike @ 5.200%
Exp. 05/23/2007 | | | | 138,000 | | | | 319 |
Strike @ 5.250%
Exp. 06/07/2007 | | | | 169,000 | | | | 464 |
Strike @ 5.500%
Exp. 06/29/2007 | | | | 138,000 | | | | 662 |
| | | | | | | | |
|
Total Purchased Call Options
(Cost $5,539) | | 2,213 |
| | | | | | | | |
|
| |
| | | | | #OF
CONTRACTS | | | | |
| PURCHASED PUT OPTIONS 0.0% |
| 90-Day Eurodollar December Futures (CME) |
Strike @ $91.750
Exp. 12/18/2006 | | | | 764 | | | | 5 |
Strike @ $92.000
Exp. 12/18/2006 | | | | 2,995 | | | | 19 |
Strike @ $92.250
Exp. 12/18/2006 | | | | 1,663 | | | | 10 |
Strike @ $92.500
Exp. 12/18/2006 | | | | 450 | | | | 3 |
Strike @ $92.750
Exp. 12/18/2006 | | | | 790 | | | | 5 |
Strike @ $93.000
Exp. 12/18/2006 | | | | 50 | | | | 0 |
|
| 90-Day Eurodollar June Futures (CME) |
Strike @ $91.000
Exp. 06/18/2007 | | | | 1,328 | | | | 8 |
Strike @ $91.250
Exp. 06/18/2007 | | | | 1,855 | | | | 12 |
|
| 90-Day Eurodollar March Futures (CME) |
Strike @ $92.000
Exp. 03/19/2007 | | | | 987 | | | | 6 |
Strike @ $92.250
Exp. 03/19/2007 | | | | 585 | | | | 4 |
|
| 90-Day Eurodollar September Futures (CME) |
Strike @ $91.000
Exp. 09/17/2007 | | | | 637 | | | | 4 |
Strike @ $92.500
Exp. 09/18/2006 | | | | 675 | | | | 4 |
| | | | | | | | |
|
Total Purchased Put Options (Cost $121) | | 80 |
| | | | | | | | |
|
| |
| | | | | NOTIONAL AMOUNT
(000S) | | | | |
PURCHASED STRADDLE
OPTIONS (g) 0.0% |
| Call & Put – OTC U.S. dollar versus Japanese Yen Forward Delta Neutral Straddle |
Strike @ $0.000
Exp. 08/23/2007 | | $ | | 35,000 | | | | 21 |
| | | | | | | | |
|
Total Purchased Straddle Options (Cost $0) | | 21 |
| | | | | | | | |
|
| | | | | | | | |
| PREFERRED STOCK 0.4% |
| DG Funding Trust | | | | | | | | |
7.210% due 12/31/2049 | | | | 1,239 | | $ | | 13,079 |
| | | | | | | | |
|
Total Preferred Stock (Cost $13,056) | | 13,079 |
| | | | | | | | |
|
| |
| | | | | PRINCIPAL AMOUNT
(000S) | | | | |
| SHORT-TERM INSTRUMENTS (j) 48.5% |
| |
| CERTIFICATES OF DEPOSIT 4.8% |
| Citibank N.A. | | | | | | | | |
5.275% due 09/11/2006 | | $ | | 63,000 | | | | 63,000 |
|
| Wells Fargo Bank N.A. | | |
5.280% due 07/11/2006 | | | | 80,000 | | | | 80,000 |
| | | | | | | | |
|
| | | | | | | | | 143,000 |
| | | | | | | | |
|
| |
| COMMERCIAL PAPER 25.1% |
| Bank of America Corp. | | | | | | | | |
5.040% due 08/03/2006 | | | | 53,000 | | | | 52,770 |
5.090% due 08/21/2006 | | | | 30,000 | | | | 29,792 |
|
| Barclays U.S. Funding Corp. | | |
5.055% due 07/18/2006 | | | | 8,200 | | | | 8,183 |
5.050% due 08/14/2006 | | | | 80,700 | | | | 80,225 |
|
| Cox Communications, Inc. | | |
4.720% due 07/17/2006 | | | | 3,500 | | | | 3,500 |
|
| Danske Corp. | | |
5.040% due 07/05/2006 | | | | 54,500 | | | | 54,485 |
|
| Fannie Mae | | |
5.140% due 08/01/2006 | | | | 56,900 | | | | 56,664 |
|
| Fortis Funding LLC | | |
5.175% due 07/10/2006 | | | | 80,700 | | | | 80,619 |
|
| San Paolo IMI U.S. Financial Co. | | |
5.270% due 07/05/2006 | | | | 80,000 | | | | 79,977 |
|
| Skandinaviska Enskilda Banken AB | | |
4.960% due 07/20/2006 | | | | 79,500 | | | | 79,314 |
|
| Societe Generale N.A. | | |
5.250% due 07/05/2006 | | | | 8,100 | | | | 8,098 |
5.260% due 07/05/2006 | | | | 79,600 | | | | 79,577 |
|
| Total Captial S.A. | | |
5.270% due 07/03/2006 | | | | 43,300 | | | | 43,300 |
|
| UBS Finance Delaware LLC | | |
5.235% due 08/08/2006 | | | | 22,600 | | | | 22,482 |
5.000% due 08/25/2006 | | | | 47,300 | | | | 46,952 |
5.095% due 09/22/2006 | | | | 19,200 | | | | 18,960 |
| | | | | | | | |
|
| | | | | | | | | 744,898 |
| | | | | | | | |
|
| |
| REPURCHASE AGREEMENT 0.7% |
| Lehman Brothers Inc. |
4.500% due 07/03/2006 | | | | 20,100 | | | | 20,100 |
| | | | | | | | |
|
(Dated 06/30/2006. Collateralized by Treasury Inflation Protected Securities 2.000% due 07/15/2014 valued at $20,579. Repurchase proceeds are $20,108.) |
| |
| TRI-PARTY REPURCHASE AGREEMENT 0.2% |
| State Street Bank |
4.900% due 07/03/2006 | | | | 5,608 | | | | 5,608 |
| | | | | | | | |
|
(Dated 06/30/2006. Collateralized by Federal Home Loan Bank 4.250% due 04/16/2007 valued at $5,722. Repurchase proceeds are $5,610.) |
| |
| BELGIUM TREASURY BILL 0.3% |
2.757% due 10/12/2006 | | EUR | | 8,680 | | | | 11,014 |
| | | | | | | | |
|
| |
| FRANCE TREASURY BILLS 8.5% |
2.691% due 07/06/2006-12/21/2006 | | | | 198,130 | | | | 251,970 |
| | | | | | | | |
|
| | | | | | | | |
| GERMANY TREASURY BILLS 7.8% |
2.641% due 07/12/2006-11/15/2006 | | EUR | | 181,750 | | $ | | 231,595 |
| | | | | | | | |
|
| |
| U.S. TREASURY BILLS 1.1% |
4.042% due 08/31/2006-09/14/2006 (d)(e)(f) | | $ | | 33,720 | | $ | | 33,354 |
| | | | | | | | |
|
Total Short-Term Instruments
(Cost $1,425,471) | | 1,441,539 |
| | | | | | | | |
|
| |
| Total Investments (a) 114.7% (Cost $3,442,782) | | | | $ | | 3,407,611 |
| |
Written Options (i) (0.4%)
(Premiums $9,947) | | | | | | | | (12,179) |
| |
| Other Assets and Liabilities (Net) (14.3%) | | (425,443) |
| | | | | | | | |
|
| Net Assets 100.0% | | | | | | $ | | 2,969,989 |
| | | | | | | | |
|
| | | | | | |
| See Accompanying Notes | | Semiannual Report | | June 30, 2006 | | 11 |
Schedule of Investments Total Return Portfolio (Cont.)
|
Notes to Schedule of Investments (amounts in thousands, except number of contracts): |
(a) As of June 30, 2006, portfolio securities with an aggregate market value of $155 were valued in good faith and pursuant to guidelines established by the Board of Trustees. |
| |
(b) Security is in default. |
| |
(c) Principal amount of security is adjusted for inflation. |
| |
(d) Securities are grouped by coupon or range of coupons and represent a range of maturities. |
| |
(e) Securities with an aggregate market value of $5,689 have been pledged as collateral for swap and swaption contracts on June 30, 2006. |
| |
(f) Securities with an aggregate market value of $27,691 have been segregated with the custodian to cover margin requirements for the following open futures contracts on June 30, 2006: |
| | | | | | | | | | |
| Description | | Type | | Expiration
Month | | # of
Contracts | | Unrealized
(Depreciation) | |
90-Day Eurodollar December Futures | | Long | | 12/2006 | | 4,923 | | $ | (7,046 | ) |
90-Day Eurodollar December Futures | | Long | | 12/2007 | | 1,045 | | | (969 | ) |
90-Day Eurodollar June Futures | | Long | | 06/2007 | | 2,686 | | | (4,502 | ) |
90-Day Eurodollar March Futures | | Long | | 03/2007 | | 3,609 | | | (6,727 | ) |
90-Day Eurodollar March Futures | | Long | | 03/2008 | | 368 | | | (214 | ) |
90-Day Eurodollar September Futures | | Long | | 09/2006 | | 727 | | | (736 | ) |
90-Day Eurodollar September Futures | | Long | | 09/2007 | | 2,047 | | | (3,020 | ) |
Euro-Bobl 5-Year Note September Futures | | Long | | 09/2006 | | 63 | | | (83 | ) |
U.S. Treasury 5-Year Note September Futures | | Long | | 09/2006 | | 598 | | | (321 | ) |
U.S. Treasury 10-Year Note September Futures | | Long | | 09/2006 | | 518 | | | (253 | ) |
U.S. Treasury 30-Year Bond September Futures | | Long | | 09/2006 | | 160 | | | (164 | ) |
United Kingdom 90-Day LIBOR Sterling Interest Rate December Futures Put Options Strike @ GBP95.500 | | Short | | 12/2006 | | 94 | | | (51 | ) |
| | | | | | | | |
|
|
|
| | | | | | | | | $ | (24,086 | ) |
| | | | | | | | |
|
|
|
| | | | | | | | |
(g) Exercise price and premium determined on a future date, based upon implied volatility parameters. |
| | | | | | | | | | | | | | | |
(h) Swap agreements outstanding on June 30, 2006: | |
| Interest Rate Swaps | | | | | | | | | | | | | | | |
| Counterparty | | Floating Rate
Index | | Pay/Receive
Floating Rate | | Fixed Rate | | Expiration
Date | | Notional
Amount | | Unrealized
Appreciation/
(Depreciation) | |
Barclays Bank PLC | | 5-year French CLPI Ex Tobacco Daily Reference Index | | Pay | | 2.103% | | 10/15/2010 | | EUR | 1,400 | | $ | (6 | ) |
BNP Paribas Bank | | 5-year French CLPI Ex Tobacco Daily Reference Index | | Pay | | 2.090% | | 10/15/2010 | | | 10,200 | | | (29 | ) |
Deutsche Bank AG | | 6-month EUR-LIBOR | | Receive | | 4.000% | | 12/15/2011 | | | 30,500 | | | 232 | |
Merrill Lynch & Co., Inc. | | 6-month EUR-LIBOR | | Receive | | 4.000% | | 12/15/2011 | | | 39,800 | | | 52 | |
UBS Warburg LLC | | 5-year French CLPI Ex Tobacco Daily Reference Index | | Pay | | 2.146% | | 10/15/2010 | | | 1,900 | | | (3 | ) |
Barclays Bank PLC | | 6-month GBP-LIBOR | | Pay | | 5.000% | | 06/15/2007 | | GBP | 32,400 | | | (272 | ) |
Barclays Bank PLC | | 6-month GBP-LIBOR | | Pay | | 5.000% | | 06/16/2011 | | | 1,800 | | | (37 | ) |
Barclays Bank PLC | | 6-month GBP-LIBOR | | Receive | | 4.000% | | 12/15/2035 | | | 2,900 | | | 86 | |
Lehman Brothers, Inc. | | 6-month GBP-LIBOR | | Pay | | 4.500% | | 09/20/2009 | | | 17,500 | | | (422 | ) |
Merrill Lynch & Co., Inc. | | 6-month GBP-LIBOR | | Receive | | 4.000% | | 12/15/2035 | | | 2,200 | | | 70 | |
Goldman Sachs & Co. | | 6-month JPY-LIBOR | | Receive | | 2.000% | | 06/15/2012 | | JPY | 387,100 | | | 49 | |
Morgan Stanley Dean Witter & Co. | | 6-month JPY-LIBOR | | Receive | | 2.000% | | 06/15/2012 | | | 626,000 | | | 24 | |
UBS Warburg LLC | | 6-month JPY-LIBOR | | Receive | | 2.000% | | 06/15/2012 | | | 1,625,000 | | | (46 | ) |
Barclays Bank PLC | | 3-month USD-LIBOR | | Pay | | 5.000% | | 12/20/2008 | | $ | 64,200 | | | (57 | ) |
Goldman Sachs & Co. | | 3-month USD-LIBOR | | Pay | | 5.000% | | 12/20/2016 | | | 13,900 | | | (172 | ) |
Goldman Sachs & Co. | | 3-month USD-LIBOR | | Pay | | 5.000% | | 12/15/2035 | | | 5,900 | | | (155 | ) |
Lehman Brothers, Inc. | | 3-month USD-LIBOR | | Pay | | 5.000% | | 12/20/2011 | | | 23,900 | | | (214 | ) |
Lehman Brothers, Inc. | | 3-month USD-LIBOR | | Pay | | 5.000% | | 12/20/2016 | | | 6,300 | | | (78 | ) |
Lehman Brothers, Inc. | | 3-month USD-LIBOR | | Pay | | 5.000% | | 12/15/2035 | | | 6,500 | | | (173 | ) |
Royal Bank of Scotland PLC | | 3-month USD-LIBOR | | Pay | | 5.000% | | 12/20/2011 | | | 11,000 | | | (97 | ) |
UBS Warburg LLC | | 3-month USD-LIBOR | | Pay | | 5.000% | | 12/20/2008 | | | 9,800 | | | (9 | ) |
| | | | | | | | | | | | | |
|
|
|
| | | | | | | | | | | | | | $ | (1,257 | ) |
| | | | | | | | | | | | | |
|
|
|
| | | | |
| 12 | | PIMCO Variable Insurance Trust | | See Accompanying Notes |
| | |
| |
| | | June 30, 2006 (Unaudited) |
| | | | | | | | | | | | | | | | |
| Credit Default Swaps | | | | | | | | | | | | | | | | |
| Counterparty | | Reference Entity | | Buy/Sell
Protection+ | | (Pay)Receive
Fixed Rate | | | Expiration
Date | | Notional
Amount | | Unrealized
Appreciation/
(Depreciation) | |
Bear Stearns & Co., Inc. | | Ford Motor Credit Co. 7.000% due 10/01/2013 | | Sell | | 1.300% | | | 09/20/2006 | | $ | 1,800 | | $ | (1 | ) |
Bear Stearns & Co., Inc. | | General Motors Acceptance Corp.
6.875% due 08/28/2012 | | Sell | | 2.100% | | | 12/20/2006 | | | 12,400 | | | 28 | |
Bear Stearns & Co., Inc. | | Ford Motor Credit Co. 7.000% due 10/01/2013 | | Sell | | 4.750% | | | 06/20/2007 | | | 200 | | | 4 | |
Bear Stearns & Co., Inc. | | Ford Motor Credit Co. 7.000% due 10/01/2013 | | Sell | | 2.320% | | | 09/20/2007 | | | 2,100 | | | (12 | ) |
Citibank N.A. | | General Motors Acceptance Corp.
6.875% due 08/28/2012 | | Sell | | 1.700% | | | 09/20/2006 | | | 2,600 | | | 4 | |
Goldman Sachs & Co. | | Ford Motor Credit Co. 7.000% due 10/01/2013 | | Sell | | 2.400% | | | 09/20/2007 | | | 4,200 | | | (20 | ) |
Goldman Sachs & Co. | | Dow Jones CDX N.A. HV5 Index | | Buy | | (0.850% | ) | | 12/20/2010 | | | 13,900 | | | (63 | ) |
HSBC Bank USA | | Russia Government International Bond, 5.000% until 03/31/2007 and 7.500% thereafter, due 03/31/2030 | | Sell | | 0.390% | | | 09/20/2006 | | | 800 | | | 1 | |
J.P. Morgan Chase & Co. | | Ford Motor Credit Co. 7.000% due 10/01/2013 | | Sell | | 4.750% | | | 06/20/2007 | | | 400 | | | 8 | |
J.P. Morgan Chase & Co. | | Ford Motor Credit Co. 7.000% due 10/01/2013 | | Sell | | 4.700% | | | 06/20/2007 | | | 1,800 | | | 37 | |
J.P. Morgan Chase & Co. | | Mexico Government International Bond 7.500% due 04/08/2033 | | Sell | | 0.920% | | | 03/20/2016 | | | 1,200 | | | (13 | ) |
Lehman Brothers, Inc. | | Multiple Reference Entities of Gazprom | | Sell | | 1.430% | | | 06/20/2011 | | | 600 | | | 1 | |
Lehman Brothers, Inc. | | Mexico Government International Bond 7.500% due 04/08/2033 | | Sell | | 0.920% | | | 03/20/2016 | | | 3,100 | | | (34 | ) |
Morgan Stanley Dean Witter & Co. | | Ford Motor Credit Co. 7.000% due 10/01/2013 | | Sell | | 5.200% | | | 12/20/2006 | | | 9,300 | | | 166 | |
Morgan Stanley Dean Witter & Co. | | Russia Government International Bond, 5.000% until 03/31/2007 and 7.500% thereafter, due 03/31/2030 | | Sell | | 0.460% | | | 06/20/2007 | | | 1,300 | | | 1 | |
UBS Warburg LLC | | Ford Motor Credit Co. 7.000% due 10/01/2013 | | Sell | | 4.750% | | | 12/20/2006 | | | 10,700 | | | 167 | |
UBS Warburg LLC | | Ford Motor Credit Co. 7.000% due 10/01/2013 | | Sell | | 3.350% | | | 06/20/2007 | | | 1,500 | | | 11 | |
Wachovia Bank N.A. | | Dow Jones CDX N.A. HV5 Index | | Sell | | 0.850% | | | 12/20/2010 | | | 5,000 | | | (36 | ) |
| | | | | | | | | | | | | | |
|
|
|
| | | | | | | | | | | | | | | $ | 249 | |
| | | | | | | | | | | | | | |
|
|
|
|
| + If the Portfolio is a seller of protection and a credit event occurs, as defined under the terms of that particular swap agreement, the Portfolio will Pay to the buyer of the protection an amount up to the Notional value of the swap and in certain instances, take delivery of the security. As a buyer of protection, the Portfolio will generally receive from the seller of protection an amount up to the notional amount of the swap if a credit event occurs. | |
| | | | | | | | | | | | |
(i) Written options outstanding on June 30, 2006: |
| Options on Exchange-Traded Futures Contracts |
| Description | | Exercise
Price | | Expiration
Date | | # of
Contracts | | Premium | | Value |
Call - CBOT U.S. Treasury 10-Year Note September Futures | | $ 108.000 | | 08/25/2006 | | 1,654 | | $ | 219 | | $ | 52 |
Call - CBOT U.S. Treasury 10-Year Note September Futures | | 106.000 | | 08/25/2006 | | 185 | | | 108 | | | 49 |
Put - CBOT U.S. Treasury 10-Year Note September Futures | | 103.000 | | 08/25/2006 | | 1,839 | | | 320 | | | 259 |
Put - CME 90-Day Eurodollar March Futures | | 95.250 | | 03/19/2007 | | 116 | | | 108 | | | 238 |
Call - CME 90-Day Eurodollar September Futures | | 95.500 | | 09/18/2006 | | 112 | | | 30 | | | 1 |
Put - CME 90-Day Eurodollar September Futures | | 95.000 | | 09/18/2006 | | 209 | | | 109 | | | 303 |
Put - CME 90-Day Eurodollar September Futures | | 95.250 | | 09/18/2006 | | 448 | | | 347 | | | 930 |
Put - CME 90-Day Eurodollar December Futures | | 95.000 | | 12/18/2006 | | 195 | | | 103 | | | 295 |
Put - CME 90-Day Eurodollar December Futures | | 95.250 | | 12/18/2006 | | 2,975 | | | 2,357 | | | 6,303 |
Put - CME 90-Day Eurodollar December Futures | | 95.500 | | 12/18/2006 | | 297 | | | 331 | | | 813 |
| | | | | | | | |
|
| |
|
|
| | | | | | | | | $ | 4,032 | | $ | 9,243 |
| | | | | | | | |
|
| |
|
|
| | | | | | |
| See Accompanying Notes | | Semiannual Report | | June 30, 2006 | | 13 |
Schedule of Investments Total Return Portfolio (Cont.)
| | | | | | | | | | | | | | | | | | | |
| Interest Rate Swaptions | | | | | | | | | | | | | | | | | | | |
| Description | | Counterparty | | Floating Rate
Index | | Pay/Receive
Floating Rate | | Exercise
Rate | | Expiration
Date | | Notional
Amount | | Premium | | Value |
Put - OTC 1-Year Interest Rate Swap | | HSBC Bank USA | | 6-month GBP-LIBOR | | Pay | | 4.500% | | 12/20/2006 | | GBP | 53,900 | | $ | 263 | | $ | 586 |
Call - OTC 5-Year Interest Rate Swap | | Bear Stearns & Co., Inc. | | 3-month USD-LIBOR | | Receive | | 5.210% | | 10/25/2006 | | $ | 40,000 | | | 145 | | | 44 |
Call - OTC 5-Year Interest Rate Swap | | Bear Stearns & Co., Inc. | | 3-month USD-LIBOR | | Receive | | 5.040% | | 03/08/2007 | | | 37,000 | | | 357 | | | 75 |
Call - OTC 5-Year Interest Rate Swap | | Citibank N.A. | | 3-month USD-LIBOR | | Receive | | 4.540% | | 10/04/2006 | | | 14,100 | | | 165 | | | 0 |
Call - OTC 5-Year Interest Rate Swap | | Citibank N.A. | | 3-month USD-LIBOR | | Receive | | 4.850% | | 12/22/2006 | | | 36,000 | | | 473 | | | 14 |
Call - OTC 5-Year Interest Rate Swap | | Goldman Sachs & Co. | | 3-month USD-LIBOR | | Receive | | 4.780% | | 08/07/2006 | | | 53,000 | | | 434 | | | 0 |
Call - OTC 5-Year Interest Rate Swap | | Goldman Sachs & Co. | | 3-month USD-LIBOR | | Receive | | 5.210% | | 10/25/2006 | | | 28,400 | | | 128 | | | 31 |
Call - OTC 5-Year Interest Rate Swap | | Merrill Lynch & Co., Inc. | | 3-month USD-LIBOR | | Receive | | 4.780% | | 08/08/2006 | | | 16,000 | | | 151 | | | 0 |
Call - OTC 5-Year Interest Rate Swap | | Merrill Lynch & Co., Inc. | | 3-month USD-LIBOR | | Receive | | 4.540% | | 10/04/2006 | | | 20,000 | | | 239 | | | 0 |
Call - OTC 5-Year Interest Rate Swap | | Royal Bank of Scotland PLC | | 3-month USD-LIBOR | | Receive | | 5.040% | | 03/08/2007 | | | 19,000 | | | 212 | | | 38 |
Call - OTC 5-Year Interest Rate Swap | | Royal Bank of Scotland PLC | | 3-month USD-LIBOR | | Receive | | 5.220% | | 04/19/2007 | | | 43,000 | | | 340 | | | 188 |
Call - OTC 5-Year Interest Rate Swap | | Royal Bank of Scotland PLC | | 3-month USD-LIBOR | | Receive | | 5.315% | | 05/09/2007 | | | 71,500 | | | 738 | | | 424 |
Call - OTC 5-Year Interest Rate Swap | | Royal Bank of Scotland PLC | | 3-month USD-LIBOR | | Receive | | 5.300% | | 05/23/2007 | | | 59,000 | | | 590 | | | 354 |
Call - OTC 5-Year Interest Rate Swap | | Royal Bank of Scotland PLC | | 3-month USD-LIBOR | | Receive | | 5.340% | | 06/07/2007 | | | 62,000 | | | 631 | | | 425 |
Call - OTC 5-Year Interest Rate Swap | | Royal Bank of Scotland PLC | | 3-month USD-LIBOR | | Receive | | 5.600% | | 06/29/2007 | | | 60,000 | | | 663 | | | 663 |
Call - OTC 5-Year Interest Rate Swap | | Wachovia Bank N.A. | | 3-month USD-LIBOR | | Receive | | 5.210% | | 10/25/2006 | | | 12,900 | | | 50 | | | 14 |
Call - OTC 5-Year Interest Rate Swap | | Wachovia Bank N.A. | | 3-month USD-LIBOR | | Receive | | 5.240% | | 02/01/2007 | | | 31,800 | | | 196 | | | 120 |
Call - OTC 5-Year Interest Rate Swap | | Wachovia Bank N.A. | | 3-month USD-LIBOR | | Receive | | 5.325% | | 06/07/2007 | | | 11,000 | | | 94 | | | 73 |
| | | | | | | | | | | | | | | |
|
| |
|
|
| | | | | | | | | | | | | | | | $ | 5,869 | | $ | 3,049 |
| | | | | | | | | | | | | | | |
|
| |
|
|
| | | | | | | | | | | | | | | | |
| Straddle Options | | | | | | | | | | | | | | | | |
| Description | | Counterparty | | Exercise
Price* | | Expiration
Date | | Notional
Amount | | Premium* | | Value | |
Call & Put - OTC U.S. dollar versus Japanese Yen Forward Delta Neutral Straddle | | Goldman Sachs & Co. | | $ 0.000 | | 08/23/2007 | | $ | 16,500 | | $ | 14 | | $ | (93 | ) |
Call & Put - OTC U.S. dollar versus Japanese Yen Forward Delta Neutral Straddle | | J.P. Morgan Chase & Co. | | 0.000 | | 08/23/2007 | | | 3,000 | | | 17 | | | (16 | ) |
Call & Put - OTC U.S. dollar versus Japanese Yen Forward Delta Neutral Straddle | | J.P. Morgan Chase & Co. | | 0.000 | | 08/24/2007 | | | 1,000 | | | 4 | | | (4 | ) |
| | | | | | | | | | | |
|
| |
|
|
|
| | | | | | | | | | | | $ | 46 | | $ | (113 | ) |
| | | | | | | | | | | |
|
| |
|
|
|
| |
| * Exercise price and final premium determined on a future date, based upon implied volatility parameters. | | | | |
| | | | | | | | | | | | | | | | | |
(j) Forward foreign currency contracts outstanding on June 30, 2006: | | | | | |
| Type | | | | Principal
Amount
Covered by
Contract | | Settlement
Month | | Unrealized
Appreciation | | Unrealized
(Depreciation) | | | Net Unrealized
Appreciation/
(Depreciation) | |
Buy | | BRL | | 3,804 | | 07/2006 | | $ | 112 | | $ | 0 | | | $ | 112 | |
Sell | | | | 3,803 | | 07/2006 | | | 0 | | | (95 | ) | | | (95 | ) |
Buy | | | | 1,608 | | 09/2006 | | | 41 | | | 0 | | | | 41 | |
Buy | | CAD | | 10,212 | | 07/2006 | | | 0 | | | (105 | ) | | | (105 | ) |
Buy | | CLP | | 854,883 | | 07/2006 | | | 0 | | | (37 | ) | | | (37 | ) |
Sell | | | | 854,884 | | 07/2006 | | | 15 | | | (2 | ) | | | 13 | |
Buy | | | | 615,000 | | 08/2006 | | | 0 | | | (13 | ) | | | (13 | ) |
Buy | | | | 94,184 | | 09/2006 | | | 2 | | | 0 | | | | 2 | |
Buy | | CNY | | 23,779 | | 03/2007 | | | 0 | | | (22 | ) | | | (22 | ) |
Buy | | EUR | | 5,966 | | 07/2006 | | | 137 | | | 0 | | | | 137 | |
Sell | | | | 433,474 | | 07/2006 | | | 695 | | | (8,630 | ) | | | (7,935 | ) |
Buy | | | | 13 | | 12/2006 | | | 0 | | | 0 | | | | 0 | |
Buy | | GBP | | 3,048 | | 07/2006 | | | 21 | | | 0 | | | | 21 | |
Buy | | INR | | 51,600 | | 08/2006 | | | 0 | | | (30 | ) | | | (30 | ) |
Sell | | | | 50,590 | | 08/2006 | | | 20 | | | 0 | | | | 20 | |
Buy | | | | 34,136 | | 09/2006 | | | 0 | | | (16 | ) | | | (16 | ) |
Buy | | JPY | | 9,727,278 | | 08/2006 | | | 0 | | | (2,670 | ) | | | (2,670 | ) |
Buy | | KRW | | 966,900 | | 07/2006 | | | 32 | | | 0 | | | | 32 | |
Sell | | | | 966,900 | | 07/2006 | | | 0 | | | (11 | ) | | | (11 | ) |
Buy | | | | 1,503,584 | | 08/2006 | | | 28 | | | 0 | | | | 28 | |
Sell | | | | 230,950 | | 08/2006 | | | 0 | | | (6 | ) | | | (6 | ) |
Buy | | | | 3,109,199 | | 09/2006 | | | 67 | | | 0 | | | | 67 | |
Sell | | | | 2,194,499 | | 09/2006 | | | 0 | | | (63 | ) | | | (63 | ) |
Buy | | | | 4,130,499 | | 05/2007 | | | 0 | | | (9 | ) | | | (9 | ) |
Buy | | MXN | | 23,220 | | 08/2006 | | | 0 | | | (143 | ) | | | (143 | ) |
Sell | | | | 15,940 | | 08/2006 | | | 35 | | | 0 | | | | 35 | |
Buy | | | | 5,620 | | 09/2006 | | | 0 | | | (29 | ) | | | (29 | ) |
Buy | | PEN | | 8,692 | | 08/2006 | | | 62 | | | 0 | | | | 62 | |
| | | | |
| 14 | | PIMCO Variable Insurance Trust | | See Accompanying Notes |
| | |
| |
| | | June 30, 2006 (Unaudited) |
| | | | | | | | | | | | | | | | | |
| Type | | | | Principal
Amount
Covered by
Contract | | Settlement
Month | | Unrealized
Appreciation | | Unrealized
(Depreciation) | | | Net Unrealized
Appreciation/
(Depreciation) | |
Sell | | | | 8,692 | | 08/2006 | | $ | 0 | | $ | (89 | ) | | $ | (89 | ) |
Buy | | | | 1,762 | | 09/2006 | | | 12 | | | 0 | | | | 12 | |
Sell | | | | 1,762 | | 09/2006 | | | 0 | | | (19 | ) | | | (19 | ) |
Buy | | PLN | | 1,414 | | 09/2006 | | | 5 | | | 0 | | | | 5 | |
Buy | | | | 1,500 | | 11/2006 | | | 0 | | | (12 | ) | | | (12 | ) |
Buy | | RUB | | 12,595 | | 07/2006 | | | 20 | | | 0 | | | | 20 | |
Sell | | | | 12,596 | | 07/2006 | | | 0 | | | (4 | ) | | | (4 | ) |
Buy | | | | 60,141 | | 08/2006 | | | 107 | | | 0 | | | | 107 | |
Sell | | | | 53,107 | | 08/2006 | | | 0 | | | (73 | ) | | | (73 | ) |
Buy | | | | 27,885 | | 09/2006 | | | 22 | | | 0 | | | | 22 | |
Buy | | SGD | | 746 | | 07/2006 | | | 9 | | | 0 | | | | 9 | |
Sell | | | | 746 | | 07/2006 | | | 0 | | | (8 | ) | | | (8 | ) |
Buy | | | | 5,695 | | 08/2006 | | | 62 | | | (8 | ) | | | 54 | |
Sell | | | | 4,003 | | 08/2006 | | | 0 | | | (52 | ) | | | (52 | ) |
Buy | | | | 1,116 | | 09/2006 | | | 13 | | | 0 | | | | 13 | |
Buy | | SKK | | 83,996 | | 09/2006 | | | 75 | | | 0 | | | | 75 | |
Sell | | | | 44,840 | | 09/2006 | | | 0 | | | (59 | ) | | | (59 | ) |
Buy | | TWD | | 70,791 | | 08/2006 | | | 0 | | | (46 | ) | | | (46 | ) |
Sell | | | | 37,104 | | 08/2006 | | | 1 | | | 0 | | | | 1 | |
Buy | | | | 16,682 | | 09/2006 | | | 0 | | | (5 | ) | | | (5 | ) |
Sell | | | | 16,682 | | 09/2006 | | | 0 | | | 0 | | | | 0 | |
Buy | | ZAR | | 964 | | 08/2006 | | | 0 | | | (22 | ) | | | (22 | ) |
Sell | | | | 964 | | 08/2006 | | | 7 | | | 0 | | | | 7 | |
Buy | | | | 964 | | 10/2006 | | | 0 | | | (7 | ) | | | (7 | ) |
Buy | | | | 148 | | 11/2006 | | | 0 | | | (4 | ) | | | (4 | ) |
| | | | | | | | |
|
| |
|
|
| |
|
|
|
| | | | | | | | | $ | 1,600 | | $ | (12,289 | ) | | $ | (10,689 | ) |
| | | | | | | | |
|
| |
|
|
| |
|
|
|
| | | | | | |
| See Accompanying Notes | | Semiannual Report | | June 30, 2006 | | 15 |
Notes to Financial Statements
1. ORGANIZATION
The Total Return Portfolio (the “Portfolio”) is a series of the PIMCO Variable Insurance Trust (the “Trust”). The Trust is registered under the Investment Company Act of 1940 (the “Act”), as amended, as an open-end investment management company organized as a Delaware business trust on October 3, 1997. The Portfolio offers three classes of shares: Institutional, Administrative and Advisor. Information presented in these financial statements pertains to the Advisor Class of the Portfolio. Certain detailed financial information for the Institutional Class and Administrative Class is provided separately and is available upon request. The Trust is designed to be used as an investment vehicle by Separate Accounts of insurance companies that fund variable annuity contracts and variable life insurance policies and by qualified pension and retirement plans.
2. SIGNIFICANT ACCOUNTING POLICIES
The following is a summary of significant accounting policies consistently followed by the Portfolio in the preparation of its financial statements in conformity with accounting principles generally accepted in the United States of America (“GAAP”). The preparation of financial statements in accordance with GAAP requires management to make estimates and assumptions that affect the reported amounts and disclosures in the financial statements. Actual results could differ from those estimates.
Security Valuation. Portfolio securities are valued as of the close of regular trading (normally 4:00 p.m., Eastern Time) on each day that the New York Stock Exchange (“NYSE”) is open. Portfolio securities and other assets for which market quotes are readily available are stated at market value. Market value is generally determined on the basis of last reported sales prices, or if no sales are reported, based on quotes obtained from a quotation reporting system, established market makers, or pricing services. Fixed-income securities and non-exchange traded derivatives are normally valued on the basis of quotes obtained from brokers and dealers or pricing services. Prices obtained from independent pricing services use information provided by market makers or estimates of market values obtained from yield data relating to investments or securities with similar characteristics. Certain fixed-income securities purchased on a delayed-delivery basis are marked to market daily until settlement at the forward settlement date. Short-term investments having a maturity of 60 days or less are generally valued at amortized cost. Exchange traded options, futures and options on futures are valued at the settlement price determined by the relevant exchange.
Investments initially valued in currencies other than the U.S. dollar are converted to the U.S. dollar using exchange rates obtained from pricing services. As a result, the NAV of the Portfolio’s shares may be affected by changes in the value of currencies in relation to the U.S. dollar. The value of securities traded in markets outside the United States or denominated in currencies other than the U.S. dollar may be affected significantly on a day that the NYSE is closed and an investor is not able to purchase, redeem or exchange shares.
Securities and other assets for which market quotes are not readily available are valued at fair value as determined in good faith by the Board of Trustees or persons acting at their direction. The Board of Trustees has adopted methods for valuing securities and other assets in circumstances where market quotes are not readily available, and has delegated to Pacific Investment Management Company LLC (“PIMCO”) the responsibility for applying the valuation methods. In the event that market quotes are not readily available, and the security or asset cannot be valued pursuant to one of the valuation methods, the value of the security or asset will be determined in good faith by the Valuation Committee of the Board of Trustees, generally based upon recommendations provided by PIMCO.
Market quotes are considered not readily available in circumstances where there is an absence of current or reliable market-based data (e.g., trade information, bid/asked information, broker quotes), including where events occur after the close of the relevant market, but prior to the close of regular trading, that materially affect the values of the Portfolio’s securities or assets. In addition, market quotes are considered not readily available when, due to extraordinary circumstances, the exchanges or markets on which the securities trade do not open for trading for the entire day and no other market prices are available. The Board has delegated to PIMCO the responsibility for monitoring significant events that may materially affect the values of the Portfolio’s securities or assets and for determining whether the value of the applicable securities or assets should be re-evaluated in light of such significant events. When the Portfolio uses fair value pricing to determine its NAV, securities will not be priced on the basis of quotations from the primary market in which they are traded, but rather may be priced by another method that the Board of Trustees or persons acting at their direction believe accurately reflects fair value. The Trust’s policy is intended to result in a calculation of the Portfolio’s NAV that fairly reflects security values as of the time of pricing. However, fair values determined by the Board of Trustees or persons acting at their direction may not accurately reflect the price that the Portfolio could obtain for a security if it were to dispose of that security as of the time of pricing. Because foreign securities can trade on non-business days, the NAV of the Portfolio may change on days when shareholders will not be able to purchase or redeem shares. The prices used by the Portfolio may differ from the value that would be realized if the securities were sold and the differences could be material to the financial statements.
Securities Transactions and Investment Income. Securities transactions are recorded as of the trade date. Securities purchased or sold on a when-issued or delayed-delivery basis may be settled a month or more after the trade date. Realized gains and losses from securities sold are recorded on the identified cost basis. Dividend income is recorded on the ex-dividend date, except certain dividends from foreign securities where the ex-dividend date may have passed, which are recorded as soon as the Portfolio is informed of the ex-dividend date. Interest income, adjusted for the accretion of discounts and amortization of premiums, is recorded on the accrual basis. Paydown gains and losses on mortgage-related or asset-backed securities are recorded as components of interest income in the Statement of Operations.
Dividends and Distributions to Shareholders. Dividends from net investment income, if any, are declared on each day the Portfolio is open for business and are distributed to shareholders monthly. Net realized capital gains earned by the Portfolio, if any, will be distributed no less frequently than once each year. Most shareholders choose to reinvest their dividends and capital gain distribution in additional shares of the Portfolio.
Income dividends and capital gain distributions are determined in accordance with income tax regulations which may differ from GAAP. Differences between tax regulations and GAAP may change the fiscal year when income and capital items are recognized for tax and GAAP purposes. Examples of events that give rise to timing differences include wash sales, straddles, net operating losses and capital loss carryforwards. Further, the character of investment income and capital gains may be different for certain transactions under the two methods of accounting. Examples of characterization differences include the treatment of mortgage paydowns, swaps, foreign currency transactions and contingent debt instruments. As a result, income dividends and capital gain distributions declared during a fiscal period may differ significantly from the net investment income and realized capital gain reported in the Portfolio’s annual financial statements presented under GAAP.
Distributions classified as a tax basis return of capital, if any, are reflected in the accompanying Statements of Changes in Net Assets and have been reclassified to
| | | | |
| 16 | | PIMCO Variable Insurance Trust | | |
| | |
| |
| | | June 30, 2006 (Unaudited) |
paid in capital. In addition, other amounts have been reclassified between undistributed net investment income, accumulated undistributed net realized gains or losses and/or paid in capital to more appropriately conform financial accounting to tax characterizations of dividend distributions.
Multiclass Operations. Each class offered by the Portfolio has equal rights as to assets and voting privileges (except that shareholders of a class have exclusive voting rights regarding any matter relating solely to that class of shares). Income and non-class specific expenses of the Portfolio are allocated daily to each class of shares based on the relative value of settled shares. Realized and unrealized capital gains and losses of the Portfolio are allocated daily to each class of shares based on the relative net assets of each class. Class specific expenses, where applicable, currently include administrative, distribution and servicing fees.
Delayed-Delivery Transactions. The Portfolio may purchase or sell securities on a when-issued or delayed-delivery basis. These transactions involve a commitment by the Portfolio to purchase or sell securities for a predetermined price or yield, with payment and delivery taking place beyond the customary settlement period. When delayed-delivery purchases are outstanding, the Portfolio will designate liquid assets in an amount sufficient to meet the purchase price. When purchasing a security on a delayed-delivery basis, the Portfolio assumes the rights and risks of ownership of the security, including the risk of price and yield fluctuations, and takes such fluctuations into account when determining its net asset value. The Portfolio may dispose of or renegotiate a delayed-delivery transaction after it is entered into, and may sell when-issued securities before they are delivered, which may result in a capital gain or loss. When the Portfolio has sold a security on a delayed-delivery basis, the Portfolio does not participate in future gains and losses with respect to the security.
Federal Income Taxes. The Portfolio intends to qualify as a regulated investment company under sub-chapter M of the Internal Revenue Code and distribute all of its taxable income and net realized gains, if applicable, to shareholders. Accordingly, no provision for Federal income taxes has been made.
Foreign Currency. The accounting records of the Portfolio are maintained in U.S. dollar. The market values of foreign securities, currency holdings and other assets and liabilities are translated into U.S. dollar based on the current exchange rates each business day. Fluctuations in the value of currency holdings and other assets and liabilities resulting from changes in exchange rates are recorded as unrealized foreign currency gains or losses. Realized gains or losses and unrealized appreciation or depreciation on investment securities and income and expenses are translated on the respective dates of such transactions. The effects of changes in foreign currency exchange rates on investments in securities are not segregated in the Statement of Operations from the effects of changes in market prices of those securities, but are included with the net realized and unrealized gain or loss on investment securities.
| | | | | | |
|
| Non-U.S. currency symbols utilized throughout the report are defined as follows: |
| BRL | | Brazilian Real | | MXN | | Mexican Peso |
| CAD | | Canadian Dollar | | PEN | | Peruvian New Sol |
| CLP | | Chilean Peso | | PLN | | Polish Zloty |
| CNY | | Chinese Yuan Renminbi | | RUB | | Russian Ruble |
| EUR | | Euro | | SGD | | Singapore Dollar |
| GBP | | British Pound | | SKK | | Slovakian Koruna |
| INR | | Indian Rupee | | TWD | | Taiwan Dollar |
| JPY | | Japanese Yen | | ZAR | | South African Rand |
| KRW | | South Korean Won | | | | |
Forward Currency Transactions. The Portfolio may enter into forward currency contracts in connection with settling planned purchases or sales of securities, to hedge the currency exposure associated with some or all of the Portfolio’s securities or as a part of an investment strategy. A forward currency contract is an agreement between two parties to buy and sell a currency at a set price on a future date. The market value of a forward currency contract fluctuates with changes in forward currency exchange rates. Forward currency contracts are marked to market daily and the change in value is recorded by the Portfolio as an unrealized gain or loss. Realized gains or losses equal to the difference between the value of the contract at the time it was opened and the value at the time it was closed are recorded upon delivery or receipt of the currency or, if a forward currency contract is offset by entering into another forward currency contract with the same broker, upon settlement of the net gain or loss. These contracts may involve market risk in excess of the unrealized gain or loss reflected in the Portfolio’s Statement of Assets and Liabilities. In addition, the Portfolio could be exposed to risk if the counterparties are unable to meet the terms of the contracts or if the value of the currency changes unfavorably to the U.S. dollar.
Futures Contracts. The Portfolio is authorized to enter into futures contracts. The Portfolio may use futures contracts to manage its exposure to the securities markets or to movements in interest rates and currency values. The primary risks associated with the use of futures contracts are the imperfect correlation between the change in market value of the securities held by the Portfolio and the prices of futures contracts, the possibility of an illiquid market, and the inability of the counterparty to meet the terms of the contract. Futures contracts are valued based upon their quoted daily settlement prices. Upon entering into a futures contract, the Portfolio is required to deposit with its custodian, in a segregated account in the name of the futures broker, an amount of cash or U.S. Government and Agency Obligations in accordance with the initial margin requirements of the broker or exchange. Futures contracts are marked to market daily and an appropriate payable or receivable for the change in value (“variation margin”) is recorded by the Portfolio. Gains or losses are recognized but not considered realized until the contracts expire or are closed. Futures contracts involve, to varying degrees, risk of loss in excess of the variation margin disclosed in the Statement of Assets and Liabilities.
Guarantees and Indemnifications. Under the Trust’s organizational documents, each Trustee, officer, employee or other agent of the Trust (including the Trust’s investment manager) is indemnified against certain liabilities that may arise out of performance of their duties to the Portfolio. Additionally, in the normal course of business, the Portfolio enters into contracts that contain a variety of indemnification clauses. The Portfolio’s maximum exposure under these arrangements is unknown as this would involve future claims that may be made against the Portfolio that have not yet occurred. However, the Portfolio has not had prior claims or losses pursuant to these contracts, and believes the risk of loss to be remote.
Inflation-Indexed Bonds. The Portfolio may invest in inflation-indexed bonds. Inflation-indexed bonds are fixed-income securities whose principal value is periodically adjusted to the rate of inflation. The interest rate on these bonds is generally fixed at issuance at a rate lower than typical bonds. Over the life of an inflation-indexed bond, however, interest will be paid based on a principal value, which is adjusted for inflation. Any increase in the principal amount of an inflation-indexed bond will be included as interest income in the Statement of Operations, even though investors do not receive their principal until maturity.
Loan Participant and Assignments. The Portfolio may invest in direct debt instruments which are interests in amounts owned by corporate, governmental, or other borrowers to lenders or lending syndicates. The Portfolio’s investments in loans may be in the form of participations in loans or assignments of all or a portion of loans from third parties. A loan is often administered by a bank or other
| | | | | | |
| | | Semiannual Report | | June 30, 2006 | | 17 |
Notes to Financial Statements (Cont.)
financial institution (the “lender”) that acts as agent for all holders. Then agent administers the terms of the loan, as specified in the loan agreement. When investing in a loan participation, the Portfolio has the right to receive payments of principal, interest and any fees to which it is entitled only from the lender selling the loan agreement and only upon receipt by the lender of payments from the borrower. The Portfolio generally has no right to enforce compliance with the terms of the loan agreement with the borrower. As a result, the Portfolio may be subject to the credit of both the borrower and the lender that is selling the loan agreement. When the Portfolio purchases assignments from lenders it acquires direct rights against the borrower on the loan. At the end of the period, the Portfolio had no unfunded loan commitments.
Options Contracts. The Portfolio may write call and put options on futures, swaps, securities or currencies it owns or in which it may invest. Writing put options tends to increase the Portfolio’s exposure to the underlying instrument. Writing call options tends to decrease the Portfolio’s exposure to the underlying instrument. When the Portfolio writes a call or put option, an amount equal to the premium received is recorded as a liability and subsequently marked to market to reflect the current value of the option written. These liabilities are reflected as written options outstanding in the Statement of Assets and Liabilities. Certain options may be written with premiums to determined on a future date. The premiums for these options are based upon implied volatility parameters at specified terms. Premiums received from writing options which expire are treated as realized gains. Premiums received from writing options which are exercised or closed are added to the proceeds or offset against amounts paid on the underlying future, swap, security or currency transaction to determine the realized gain or loss. The Portfolio as a writer of an option has no control over whether the underlying future, swap, security or currency may be sold (call) or purchased (put) and as a result bears the market risk of an unfavorable change in the price of the future, swap, security or currency underlying the written option. There is the risk the Portfolio may not be able to enter into a closing transaction because of an illiquid market.
The Portfolio may also purchase put and call options. Purchasing call options tends to increase the Portfolio’s exposure to the underlying instrument. Purchasing put options tends to decrease the Portfolio’s exposure to the underlying instrument. The Portfolio pays a premium which is included in the Portfolio’s Statement of Assets and Liabilities as an investment and subsequently marked to market to reflect the current value of the option. Premiums paid for purchasing options which expire are treated as realized losses. Certain options may be purchased with premiums to be determined on a future date. The premiums for these options are based upon implied volatility parameters at specified terms. The risk associated with purchasing put and call options is limited to the premium paid. Premiums paid for purchasing options which are exercised or closed are added to the amounts paid or offset against the proceeds on the underlying future, swap, security or currency transaction to determine the realized gain or loss.
Repurchase Agreements. The Portfolio may engage in repurchase transactions. Under the terms of a typical repurchase agreement, the Portfolio takes possession of an underlying debt obligation subject to an obligation of the seller to repurchase, and the Portfolio to resell, the obligation at an agreed-upon price and time. The underlying securities for all repurchase agreements are held in safekeeping at the Portfolio’s custodian or designated subcustodians under triparty repurchase agreements. The market value of the collateral must be equal to or exceed at all times the total amount of the repurchase obligations, including interest. Securities purchased under repurchase agreements are reflected as an asset in the Statement of Assets and Liabilities. Generally, in the event of counterparty default, the Portfolio has the right to use the collateral to offset losses incurred. If the counterparty should default, the Portfolio will seek to sell the securities which it holds as collateral. This could involve procedural costs or delays in addition to a loss on the securities if their value should fall below their repurchase price.
Mortgage-Related and Other Asset-Backed Securities. The Portfolio may invest in mortgage-related or other asset-backed securities. These securities include mortgage pass-through securities, collateralized mortgage obligations (“CMOs”), commercial mortgage-backed securities, mortgage dollar rolls, CMO residuals, stripped mortgage-backed securities (“SMBSs”) and other securities that directly or indirectly represent a participation in, or are secured by and payable from, mortgage loans on real property. The value of some mortgage- or asset-backed securities may be particularly sensitive to changes in prevailing interest rates. Early repayment of principal on some mortgage-related securities may expose a Portfolio to a lower rate of return upon reinvestment of principal. The value of these securities may fluctuate in response to the market’s perception of the creditworthiness of the issuers. Additionally, although mortgages and mortgage-related securities are generally supported by some form of government or private guarantee and/or insurance, there is no assurance that private guarantors or insurers will meet their obligations.
One type of SMBS has one class receiving all of the interest from the mortgage assets (the interest-only, or “IO” class), while the other class will receive all of the principal (the principal-only, or “PO” class). Payments received for IOs are included in interest income in the Statement of Operations. Because principal will not be received at the maturity of an IO, adjustments are made to the book value of the security on a daily basis until maturity. These adjustments are included in interest income in the Statement of Operations. Payments received for POs are treated as reductions to the cost and par value of the securities.
Swap Agreements. The Portfolio may engage in swap transactions, including, but not limited to, swap agreements on interest rate and credit default to manage its exposure to interest rates and credit risk. In connection with these agreements, securities may be identified as collateral in accordance with the terms of the respective swap agreements.
Interest rate swap agreements involve the exchange by the Portfolio with another party of their respective commitments to pay or receive interest, e.g., an exchange of floating rate payments for fixed rate payments with respect to the notional amount of principal.
Credit default swap agreements involve one party making a stream of payments to another party in exchange for the right to receive a specified return in the event of a default by a third party, typically corporate issues or sovereign issues of an emerging country, on its obligation. The Portfolio may use credit default swaps to provide a measure of protection against defaults of the issuers (i.e., to reduce risk where the Portfolio owns or has exposure to the sovereign issuer) or to take an active long or short position with respect to the likelihood of a particular issuer’s default. As a seller of protection, the Portfolio generally receives an upfront payment or a fixed rate of income throughout the term of the swap provided that there is no credit event. If the Portfolio is a seller of protection and a credit event occurs, as defined under the terms of that particular swap agreement, the Portfolio will pay to the buyer of the protection an amount up to the notional value of the swap and in certain instances take delivery of the security. As the seller, a Portfolio would effectively add leverage to its portfolio because, in addition to its total net assets, the Portfolio would be subject to investment exposure on the notional amount of the swap. As a buyer of protection, a Portfolio generally receives an amount up to the notional value of the swap if a credit event occurs. The treatment of credit default swaps and other swap agreements that provide for contingent, non-periodic, bullet-type payments as “notional principal contracts” for federal income tax purposes is uncertain. Were the Internal Revenue Service to take the position that a credit default swap or other bullet-type swap is not a “notional principal contract” for federal income tax purposes, payments received by the Portfolio from such investments might be subject to income taxes.
Swaps are marked to market daily based upon quotations from market makers and the change in value, if any, is recorded as unrealized gain or loss in the Statement of Operations. Payments received or made at the beginning of the measurement
| | | | |
| 18 | | PIMCO Variable Insurance Trust | | |
| | |
| |
| | | June 30, 2006 (Unaudited) |
period are reflected as such in the Statement of Assets and Liabilities. These upfront payments are recorded as realized gain or loss in the Statement of Operations upon termination or maturity of the swap. A liquidation payment received or made at the termination of the swap is recorded as realized gain or loss in the Statement of Operations. Net periodic payments received or paid by the Portfolio are included as part of realized gain or loss in the Statement of Operations. Entering into these agreements involves, to varying degrees, elements of credit, market and documentation risk in excess of the amounts recognized in the Statement of Assets and Liabilities. Such risks involve the possibility that there will be no liquid market for these agreements, that the counterparty to the agreements may default on its obligation to perform or disagree as to the meaning of contractual terms in the agreements and that there may be unfavorable changes in interest rates.
U.S. Government Agencies or Government-Sponsored Enterprises. Securities issued by U.S. Government agencies or government-sponsored enterprises may not be guaranteed by the U.S. Treasury. The Government National Mortgage Association (“GNMA”), a wholly owned U.S. Government corporation, is authorized to guarantee, with the full faith and credit of the U.S. Government, the timely payment of principal and interest on securities issued by institutions approved by GNMA and backed by pools of mortgages insured by the Federal Housing Administration or guaranteed by the Department of Veterans Affairs. Government-related guarantors (i.e., not backed by the full faith and credit of the U.S. Government) include the Federal National Mortgage Association (“FNMA” or “Fannie Mae”) and the Federal Home Loan Mortgage Corporation (“FHLMC” or “Freddie Mac”). Pass-through securities issued by FNMA are guaranteed as to timely payment of principal and interest by FNMA but are not backed by the full faith and credit of the U.S. Government. FHLMC guarantees the timely payment of interest and ultimate collection of principal, but its participation certificates are not backed by the full faith and credit of the U.S. Government.
New Accounting Policies. In July 2006, the Financial Accounting Standards Board issued Interpretation No. 48, “Accounting for Uncertainty in Income Taxes—an Interpretation of FASB Statement No. 109” (the “Interpretation”). The Interpretation is effective for fiscal years beginning after December 15, 2006. Management is currently evaluating the application of the Interpretation to the Portfolio and will provide additional information in relation to the Interpretation in the Portfolio’s annual financial statements for the year ending December 31, 2006.
3. FEES, EXPENSES, AND RELATED PARTY TRANSACTIONS
Investment Advisory Fee. PIMCO is a majority-owned subsidiary of Allianz Global Investors of America L.P. (“AGI”), and serves as investment adviser (the “Adviser”) to the Trust, pursuant to an investment advisory contract. The Adviser receives a monthly fee at an annual rate based on average daily net assets of the Portfolio. The Advisory Fee is charged at an annual rate of 0.25%.
Administration Fee. PIMCO serves as administrator (the “Administrator”), and provides administrative services to the Trust for which it receives a monthly administrative fee based on average daily net assets of the Portfolio. As the Administrator, PIMCO bears the costs of various third-party services, including audit, custodial, portfolio accounting, legal, transfer agency and printing costs. The Administration Fee is charged at the annual rate of 0.25%.
Distribution and Servicing Fees. Allianz Global Investors Distributors LLC (“AGID”) is an indirect wholly-owned subsidiary of AGI and serves as the distributor of the Trust’s shares. The Trust is permitted to reimburse AGID on a quarterly basis, out of the Administrative Class assets of the Portfolio in the amount of 0.15% on an annual basis of the average daily net assets of that class, for payments made to financial intermediaries that provide services in connection with the distribution of shares or administration of plans or programs that use Portfolio shares as their funding medium. The effective rate paid to AGID was 0.15% during the current fiscal year.
Expenses. The Trust is responsible for the following expenses: (i) salaries and other compensation of any of the Trust’s executive officers and employees who are not officers, directors, stockholders or employees of PIMCO or its subsidiaries or affiliates; (ii) taxes and governmental fees; (iii) brokerage fees and commissions and other portfolio transaction expenses; (iv) the costs of borrowing money, including interest expenses and bank overdraft charges; (v) fees and expenses of the Trustees who are not “interested persons” of PIMCO or the Trust, and any counsel retained exclusively for their benefit; (vi) extraordinary expenses, including costs of litigation and indemnification expenses; (vii) organization expenses and (viii) any expenses allocated or allocable to a specific class of shares, which include service fees payable with respect to the Administrative Class shares and may include certain other expenses as permitted by the Trust’s Multiple Class Plan adopted pursuant to Rule 18f-3 under the Act and subject to review and approval by the Trustees. The ratio of expenses to average net assets per share class, as disclosed in the Financial Highlights, may differ from the annual portfolio operating expenses per share class as disclosed in the Prospectus for the reasons set forth above.
For the current period ended June 30, 2006, each unaffiliated Trustee received an annual retainer of $15,000, plus $2,000 for each Board of Trustees quarterly meeting attended, $500 for each Board of Trustees committee meeting attended and $500 for each special board meeting attended, plus reimbursement of related expenses. In addition, each Committee Chair received an additional annual retainer of $500 and each Audit Committee Chair received an additional annual retainer of $1,500. These expenses are allocated on a pro-rata basis to each Portfolio of the Trust according to its respective net assets. The Trust pays no compensation directly to any Trustee or any other officer who is affiliated with the Administrator, all of whom receive remuneration for their services to the Trust from the Administrator or its affiliates.
4. PURCHASES AND SALES OF SECURITIES
The length of time the Portfolio has held a particular security is not generally a consideration in investment decisions. A change in the securities held by the Portfolio is known as “portfolio turnover”. The Portfolio may engage in frequent and active trading of portfolio securities to achieve its investment objective, particularly during periods of volatile market movements. High portfolio turnover (e.g., over 100%) involves correspondingly greater expenses to the Portfolio, including brokerage commissions or dealer mark-ups and other transaction costs on the sale of securities and reinvestments in other securities. Such sales may also result in realization of taxable capital gains, including short-term capital gains (which are generally taxed at ordinary income tax rates). The trading costs and tax effects associated with portfolio turnover may adversely affect the Portfolio’s performance.
Purchases and sales of securities (excluding short-term investments) for the period ended June 30, 2006 were as follows (amounts in thousands):
| | | | | | | | | | | | |
| U.S Government/Agency | | | | All Other |
| Purchases | | | | Sales | | | | Purchases | | | | Sales |
| $ 3,483,913 | | | | $ 3,849,012 | | | | $ 258,320 | | | | $ 224,153 |
| | | | | | |
| | | Semiannual Report | | June 30, 2006 | | 19 |
Notes to Financial Statements (Cont.)
5. TRANSACTIONS IN WRITTEN CALL AND PUT OPTIONS
Transactions in written call and put options were as follows (amounts in thousands, except number of contracts):
| | | | | | | | | | | | | | | | | | | | | | | |
| | | | | # of
Contracts |
| | | |
| Notional
Amount
in $ |
| | | |
| Notional
Amount
in GBP |
| | | | | Premium | |
Balance at 12/31/2005 | | | | 6,803 | | | | | $ | 359,600 | | | | | GBP | 57,200 | | | | | $ | 7,607 | |
Sales | | | | 6,512 | | | | | | 544,200 | | | | | | 0 | | | | | | 5,852 | |
Closing Buys | | | | 0 | | | | | | (169,900 | ) | | | | | 0 | | | | | | (1,267 | ) |
Expirations | | | | (5,062 | ) | | | | | (98,700 | ) | | | | | (3,300 | ) | | | | | (2,085 | ) |
Exercised | | | | (223 | ) | | | | | 0 | | | | | | 0 | | | | | | (160 | ) |
Balance at 06/30/2006 | | | | 8,030 | | | | | $ | 635,200 | | | | | GBP | 53,900 | | | | | $ | 9,947 | |
6. REORGANIZATION
The Acquiring Portfolio (“Total Return Portfolio”), as listed below, acquired the assets and certain liabilities of the Acquired Fund (“CIGNA Times Square VP Core Plus Bond Fund”), also listed below, in a tax-free exchange for shares of the Acquiring Portfolio, pursuant to a plan of reorganization approved by the Acquired Portfolio’s shareholders (shares and amounts in thousands):
| | | | | | | | | | | | | | | | | | | | | |
| Acquiring Portfolio | | Acquired Fund | | Date | | Shares Issued by
Acquiring
Portfolio | | Value of Shares Issued by
Acquiring
Portfolio | | Total Net
Assets of
Acquired Fund | | Total Net Assets of
Acquiring
Portfolio | | Total net Assets of
Acquiring
Portfolio After
Acquisition | | Acquired Fund’s
Unrealized
Appreciation |
Total Return Portfolio | | Times Square VP Core Plus Bond Fund | | April 22, 2005 | | 8,435 | | $ | 88,822 | | $ | 88,822 | | $ | 2,474,546 | | $ | 2,563,368 | | $ | 710 |
7. SHARES OF BENEFICIAL INTEREST
The Portfolio may issue an unlimited number of shares of beneficial interest with a $0.001 par value. Changes in shares of beneficial interest were as follows (shares and amounts in thousands):
| | | | | | | | | | | | | | | | | | |
| | | | | Six Months Ended 06/30/2006 | | | | | Year Ended 12/31/2005 | |
| | | | | Shares | | | Amount | | | | | Shares | | | Amount | |
| | | | | | |
Receipts for shares sold | | | | | | | | | | | | | | | | | | |
Institutional Class | | | | 3,699 | | | $ | 37,370 | | | | | 4,171 | | | $ | 43,745 | |
Administrative Class | | | | 38,033 | | | | 384,517 | | | | | 60,180 | | | | 630,483 | |
Advisor Class | | | | 455 | | | | 4,550 | | | | | 0 | | | | 0 | |
Issued in reorganization | | | | | | | | | | | | | | | | | | |
Institutional Class | | | | 0 | | | | 0 | | | | | 8,435 | | | | 88,822 | |
Administrative Class | | | | 0 | | | | 0 | | | | | 0 | | | | 0 | |
Advisor Class | | | | 0 | | | | 0 | | | | | 0 | | | | 0 | |
Issued as reinvestment of distributions | | | | | | | | | | | | | | | | | | |
Institutional Class | | | | 325 | | | | 3,281 | | | | | 683 | | | | 7,097 | |
Administrative Class | | | | 4,979 | | | | 50,219 | | | | | 10,667 | | | | 110,757 | |
Advisor Class | | | | 2 | | | | 15 | | | | | 0 | | | | 0 | |
Cost of shares redeemed | | | | | | | | | | | | | | | | | | |
Institutional Class | | | | (2,642 | ) | | | (26,672 | ) | | | | (5,309 | ) | | | (55,888 | ) |
Administrative Class | | | | (24,338 | ) | | | (245,706 | ) | | | | (30,537 | ) | | | (319,629 | ) |
Advisor Class | | | | (1 | ) | | | (13 | ) | | | | 0 | | | | 0 | |
Net increase resulting from
Portfolio share transactions | | | | 20,512 | | | $ | 207,561 | | | | | 48,290 | | | $ | 505,387 | |
The following schedule shows the number of shareholders each owning 5% or more of the Portfolio and the total percentage of the Portfolio held by such shareholders:
| | | | | | | |
| | | | | Number of
Shareholders | | % of Portfolio
Held | |
Institutional Class | | | | 4 | | 90 | |
Administrative Class | | | | 4 | | 55 | * |
Advisor Class | | | | 2 | | 98 | |
* One of the shareholders, Allianz Life Insurance Co. of North America, is an indirect wholly owned subsidiary of AGI and a related party to the Portfolio.
| | | | |
| 20 | | PIMCO Variable Insurance Trust | | |
| | |
| |
| | | June 30, 2006 (Unaudited) |
8. FEDERAL INCOME TAX MATTERS
As of June 30, 2006, the aggregate cost of investments was the same for federal income tax and financial statement purposes. The net unrealized appreciation (depreciation) of investment securities for federal income tax purposes is as follows (amounts in thousands):
| | | | |
Aggregate
Gross
Unrealized
Appreciation | | Aggregate
Gross
Unrealized
(Depreciation) | | Net
Unrealized
(Depreciation) |
$ 23,153 | | $ (58,324) | | $ (35,171) |
9. REGULATORY AND LITIGATION MATTERS
On June 1, 2004, the Attorney General of the State of New Jersey announced that it had dismissed PIMCO from a complaint filed by the New Jersey Attorney General on February 17, 2004, and that it had entered into a settlement agreement (the “New Jersey Settlement”) with Allianz Global Investors of America L.P. (“AGI”) (formerly known as Allianz Dresdner Asset Management of America L.P.), PEA Capital LLC (an entity affiliated with PIMCO through common ownership) (“PEA”) and Allianz Global Investors Distributors LLC (“AGID”), in connection with the same matter. In the New Jersey Settlement, AGI, PEA and AGID neither admitted nor denied the allegations or conclusions of law, but did agree to pay New Jersey a civil fine of $15 million and $3 million for investigative costs and further potential enforcement initiatives against unrelated parties. They also undertook to implement certain governance changes. The complaint relating to the New Jersey Settlement alleged, among other things, that AGI, PEA and AGID had failed to disclose that they improperly allowed certain hedge funds to engage in “market timing” in certain funds. The complaint sought injunctive relief, civil monetary penalties, restitution and disgorgement of profits.
Since February 2004, PIMCO, AGI, PEA, AGID, and certain of their affiliates, including the PIMCO Funds, the Allianz Funds (formerly known as PIMCO Funds: Multi-Manager Series), and the Trustees and employees of the PIMCO Funds, have been named as defendants in fifteen lawsuits filed in various jurisdictions. Eleven of those lawsuits concern “market timing,” and they have been transferred to and consolidated for pre-trial proceedings in a multi-district litigation proceeding in the U.S. District Court for the District of Maryland; the other four lawsuits concern “revenue sharing” and have been consolidated into a single action in the U.S. District Court for the District of Connecticut. The lawsuits have been commenced as putative class actions on behalf of investors who purchased, held or redeemed shares of the various series of the PIMCO Funds and the Allianz Funds during specified periods, or as derivative actions on behalf of the PIMCO Funds and Allianz Funds.
The market timing actions in the District of Maryland generally allege that certain hedge funds were allowed to engage in “market timing” in certain of PIMCO Funds and the Allianz Funds and the this alleged activity was not disclosed. Pursuant to tolling agreements entered into with the derivative and class action plaintiffs, PIMCO, the Trustees, and certain employees of PIMCO who were previously named as defendants have all been dropped as defendants in the market timing actions; the plaintiffs continue to assert claims on behalf of the shareholders of the PIMCO Funds or on behalf of the PIMCO Funds themselves against other defendants. By order dated November 3, 2005, the U.S. District Court for the District of Maryland granted the PIMCO Funds’ motion to dismiss claims asserted against it in a consolidated amended complaint where the PIMCO Funds were named, in the complaint, as a nominal defendant. The revenue sharing action in the District of Connecticut generally alleges that fund assets were inappropriately used to pay brokers to promote the PIMCO Funds and Allianz Funds, including directing fund brokerage transactions to such brokers, and that such alleged arrangements were not fully disclosed to shareholders. On August 11, 2005 the U.S. District Court for the District of Connecticut conducted a hearing on defendants’ motion to dismiss the consolidated amended complaint in the revenue sharing action but has not yet ruled on the motion to dismiss. The market timing and revenue sharing lawsuits seek, among other things, unspecified compensatory damages plus interest and, in some cases, punitive damages, the rescission of investment advisory contracts, the return of fees paid under those contracts and restitution.
Under Section 9(a) of the Investment Company Act of 1940, as amended (“1940 Act”), if the New Jersey Settlement or any of the lawsuits described above were to result in a court injunction against AGI, PEA, AGID and/or their affiliates, PIMCO could, in the absence of exemptive relief granted by the SEC, be barred from serving as an investment adviser, and AGID could be barred from serving as principal underwriter, to any registered investment company, including the Portfolios of the Trust. In connection with an inquiry from the SEC concerning the status of the New Jersey Settlement under Section 9(a), PEA, AGID, AGI and certain of their affiliates (including PIMCO) (together, the “Applicants”) have sought exemptive relief from the SEC under Section 9(c) of the 1940 Act. The SEC has granted the Applicants a temporary exemption from the provisions of Section 9(a) with respect to the New Jersey Settlement until the earlier of (i) September 13, 2006 and (ii) the date on which the SEC takes final action on their application for a permanent order. There is no assurance that the SEC will issue a permanent order.
Two nearly identical class action civil complaints have been filed in August 2005, in the Northern District of Illinois Eastern Division alleging that the plaintiffs each purchased and sold a 10-year Treasury note futures contract and suffered damages from an alleged shortage when PIMCO held both physical and futures positions in 10-year Treasury notes for its client accounts. The two actions have been consolidated into one action, and the two separate complaints have been replaced by a consolidated complaint. PIMCO is a named defendant, and the PIMCO Funds have been added as a defendant, to the consolidated action. PIMCO strongly believes the complaint (and any consolidated complaint filed hereafter) is without merit and intends to vigorously defend itself.
Certain Portfolios of the Trust were recently served in an adversary proceeding brought by the Official Committee of Asbestos Claimants of G-I Holdings, Inc. in G-I Holdings, Inc.’s bankruptcy in the District of New Jersey. PIMCO was previously named in this lawsuit and remains a defendant. The plaintiff seeks to recover for the bankruptcy estate assets that were transferred by the predecessor entity of G-I Holdings, Inc. to a wholly-owned subsidiary in 1994. The subsidiary has since issued notes, of which certain Portfolios of the Trust are alleged to be holders. The complaint alleges that in 2000, more than two hundred noteholders—including certain Portfolios of the Trust—were granted a second priority lien on the assets of the subsidiary in exchange for their consent to a refinancing transaction and the granting of a first priority lien to the lending banks. The plaintiff is seeking invalidation of the lien in favor of the noteholders and/or the value of the lien.
It is possible that these matters and/or other developments resulting from these matters could result in increased fund redemptions or other adverse consequences to the Portfolios. However, PIMCO and AGID believe that these matters are not likely to have a material adverse effect on the Portfolios or on PIMCO’s or AGID’s ability to perform their respective investment advisory or distribution services relating to the Portfolios.
| | | | | | |
| | | Semiannual Report | | June 30, 2006 | | 21 |
Investment Adviser and Administrator
Pacific Investment Management Company LLC
840 Newport Center Drive
Newport Beach, California 92660
Distributor
Allianz Global Investors Distributors LLC
2187 Atlantic Street
Stamford, Connecticut 06902
Custodian
State Street Bank & Trust Company
801 Pennsylvania
Kansas City, Missouri 64105
Transfer Agent
Boston Financial Data Services–Midwest
330 W. 9th Street
Kansas City, Missouri 64105
Legal Counsel
Dechert LLP
1775 I Street, N.W.
Washington, D.C. 20006
Independent Registered Public Accounting Firm
PricewaterhouseCoopers LLP
1055 Broadway
Kansas City, Missouri 64105
P I M C O

Share Class Administrative
Semiannual Report June 30, 2006
PIMCO Variable Insurance Trust
Total Return Portfolio II
Table of Contents
This material is authorized for use only when preceded or accompanied by the current PIMCO Variable Insurance Trust (the “Trust”) prospectus. Investors should consider the investment objectives, risks, charges and expenses of this Trust carefully before investing. Ask your financial professional to explain all charges that may apply. This and other information is contained in the Trust’s prospectus. The variable product prospectus may be obtained by contacting your Investment Consultant. Please read the Trust and variable product prospectus carefully before you invest or send money.
Chairman’s Letter
Dear PIMCO Variable Insurance Trust Shareholder:
It is our pleasure to present to you the semiannual report for the PIMCO Variable Insurance Trust covering the six-month period ended June 30, 2006.
Highlights of the global bond markets during the six-month period included:
| | n | | Most fixed-income sectors lost ground during the first half of 2006, as concern about accelerating inflation and central bank tightening pushed interest rates higher worldwide. The benchmark Lehman Brothers Aggregate Bond Index (which includes Treasury, Investment-Grade Corporate, and Residential Mortgage-Backed Securities) returned -0.72% for the first six months of the year. On June 30, the benchmark ten-year Treasury yielded 5.14%, 0.75% higher than at the start of the year. The U.S. yield curve remained flat as shorter-maturity yields rose by a comparable amount. |
| | n | | The Federal Reserve tightened four times during the reporting period, bringing the Federal Funds Rate to 5.25%. The increase near the end of the period was the Federal Reserve’s 17th consecutive rate hike since the start of its tightening cycle in 2004. The Federal Reserve was not alone, as central banks in Europe, India, and China tightened credit in unison for the first time since 2000. The Bank of Japan, whose zero-interest-rate policy has flooded global markets with liquidity, looked set to reverse this policy in the coming months. |
In these pages please find a more complete Portfolio review as it relates to financial-market activities, as well as details about total-return investment performance for the six-month reporting period. Thank you for the trust you have placed in us. We will continue to work diligently to meet your investment needs.
Sincerely,
Brent R. Harris
Chairman, PIMCO Variable Insurance Trust
July 31, 2006
| | | | | | |
| | | Semiannual Report | | June 30, 2006 | | 1 |
Important Information About the Portfolio
PIMCO Variable Insurance Trust (the “Trust”) is an open-end management investment company currently consisting of nineteen separate investment portfolios, including the Total Return Portfolio II (the “Portfolio”). The Portfolio is only available as a funding vehicle under variable life insurance policies or variable annuity contracts issued by insurance companies (“Variable Contracts”). Individuals may not purchase shares of the Portfolio directly. Shares of the Portfolio also may be sold to qualified pension and retirement plans outside of the separate account context.
We believe that bond funds have an important role to play in a well diversified investment portfolio. It is important to note, however, that in an environment where interest rates may trend upward, rising rates would negatively impact the performance of most bond funds, and fixed-income securities held by a fund are likely to decrease in value. The price volatility of fixed-income securities can also increase during periods of rising interest rates resulting in increased losses to a fund. Bond funds and individual bonds with a longer duration (a measure of the expected life of a security) tend to be more sensitive to changes in interest rates, usually making them more volatile than securities or funds with shorter durations. The longer-term performance of most bond funds has benefited from capital gains in part resulting from an extended period of declining interest rates. In the event interest rates increase, these capital gains should not be expected to recur.
The Portfolio may be subject to various risks in addition to those described above. Some of these risks may include, but are not limited to, the following: credit risk, market risk, issuer risk, liquidity risk, derivatives risk, mortgage risk, leveraging risk and management risk. A complete description of these risks is contained in the Portfolio’s prospectus. The Portfolio may use derivative instruments for hedging purposes or as part of an investment strategy. Use of these instruments may involve certain costs and risks such as liquidity risk, interest rate risk, market risk, credit risk, management risk and the risk that the Portfolio could not close out a position when it would be most advantageous to do so. A Portfolio investing in derivatives could lose more than the principal amount invested in these instruments.
On the performance summary page in this Semiannual Report, the Total Return Investment Performance table measures performance assuming that all dividend and capital gain distributions were reinvested.
An investment in the Portfolio is not a deposit of a bank and is not guaranteed or insured by the Federal Deposit Insurance Corporation or any other government agency. It is possible to lose money on investments in the Portfolio.
PIMCO has adopted written proxy voting policies and procedures (“Proxy Policy”) as required by Rule 206(4)-6 under the Investment Advisers Act of 1940. The Proxy Policy has been adopted by the Trust as the policies and procedures that PIMCO will use when voting proxies on behalf of the Portfolio. Copies of the written Proxy Policy and the factors that PIMCO may consider in determining how to vote proxies for the Portfolio, and information about how the Portfolio voted proxies relating to portfolio securities held during the most recent twelve-month period ended June 30, are available without charge, upon request, by calling the Trust at 1-866-746-2606 and on the Securities and Exchange Commission’s (“SEC”) website at http://www.sec.gov.
The Portfolio files its complete schedule of portfolio holdings with the SEC for the first and third quarters of each fiscal year on Form N-Q. A copy of the Trust’s Form N-Q is available on the SEC’s website at http://www.sec.gov and may be reviewed and copied at the SEC’s Public Reference Room in Washington D.C. Information on the operation of the Public Reference Room may be obtained by calling 1-800-SEC-0330.
PIMCO Variable Insurance Trust is distributed by Allianz Global Investors Distributors LLC, 2187 Atlantic Street, Stamford, CT 06902.
| | | | |
| 2 | | PIMCO Variable Insurance Trust | | |
The following disclosure provides important information regarding the Portfolio’s Expense Example (“Example” or “Expense Example”), which appears in this Semiannual Report. Please refer to this information when reviewing the Expense Example for the Portfolio.
Example
As a shareholder of the Portfolio, you incur two types of costs: (1) transaction costs and (2) ongoing costs, including advisory and administrative fees; distribution and/or service (12b-1) fees (Administrative Class only); and other Portfolio expenses. The Example is intended to help you understand your ongoing costs (in dollars) of investing in the Portfolio and to compare these costs with the ongoing costs of investing in other mutual funds. The Expense Example does not reflect any fees or other expenses imposed by the Variable Contracts. If it did, the expenses reflected in the Expense Examples would be higher. The Example is based on an investment of $1,000 invested at the beginning of the period and held for the entire period indicated, which is from January 1, 2006 to June 30, 2006.
Actual Expenses
The information in the table under the heading “Actual Performance” provides information about actual account values and actual expenses. You may use the information in these columns, together with the amount you invested, to estimate the expenses that you paid over the period. Simply divide your account value by $1,000 (for example, an $8,600 account value divided by $1,000 = 8.60), then multiply the result by the number in the appropriate column for your share class, in the row titled “Expenses Paid During Period” to estimate the expenses you paid on your account during this period.
Hypothetical Example for Comparison Purposes
The information in the table under the heading “Hypothetical Performance (5% return before expenses)” provides information about hypothetical account values and hypothetical expenses based on the Portfolio’s actual expense ratio and an assumed rate of return of 5% per year before expenses, which is not the Portfolio’s actual return. The hypothetical account values and expenses may not be used to estimate the actual ending account balance or expenses you paid for the period. You may use this information to compare the ongoing costs of investing in the Portfolio and other portfolios. To do so, compare this 5% hypothetical example with the 5% hypothetical examples that appear in the shareholder reports of the other portfolios.
Please note that the expenses shown in the table are meant to highlight your ongoing costs only and do not reflect any transactional costs. Therefore, the information under the heading “Hypothetical Performance (5% return before expenses)” is useful in comparing ongoing costs only, and will not help you determine the relative total costs of owning different portfolios. In addition, if these transactional costs were included, your costs would have been higher.
The expense ratio may vary period to period because of various factors, such as an increase in expenses not covered by the advisory and administrative fees (such as expenses of the trustees and their counsel or litigation expense).
Portfolio Benchmark
Lehman Brothers Aggregate Bond Index represents securities that are taxable, and dollar denominated. The index covers the U.S. investment grade fixed rate bond market, with index components for government and corporate securities, mortgage pass-through securities, and asset-backed securities. These major sectors are subdivided into more specific indices that are calculated and reported on a regular basis. It is not possible to invest directly in this index.
| | | | | | |
| | | Semiannual Report | | June 30, 2006 | | 3 |
| | | | |
| | |
| PIMCO Total Return Portfolio II | | | | |
| | | | |
Cumulative Returns Through June 30, 2006
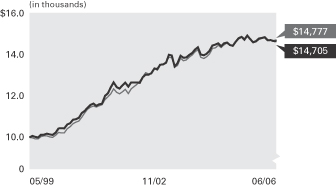
Total Return Portfolio II Lehman Brothers
Administrative Class Aggregate Bond Index
------------------------- --------------------
05/31/1999 $10,000 $10,000
06/30/1999 10,071 9,968
07/31/1999 10,025 9,926
08/31/1999 10,001 9,921
09/30/1999 10,127 10,036
10/31/1999 10,134 10,073
11/30/1999 10,180 10,072
12/31/1999 10,141 10,024
01/31/2000 10,115 9,991
02/29/2000 10,224 10,112
03/31/2000 10,435 10,245
04/30/2000 10,452 10,215
05/31/2000 10,436 10,211
06/30/2000 10,627 10,423
07/31/2000 10,697 10,518
08/31/2000 10,869 10,670
09/30/2000 10,883 10,737
10/31/2000 10,961 10,808
11/30/2000 11,193 10,985
12/31/2000 11,287 11,189
01/31/2001 11,448 11,372
02/28/2001 11,583 11,471
03/31/2001 11,651 11,529
04/30/2001 11,543 11,481
05/31/2001 11,625 11,550
06/30/2001 11,644 11,594
07/31/2001 12,035 11,853
08/31/2001 12,159 11,989
09/30/2001 12,444 12,128
10/31/2001 12,698 12,382
11/30/2001 12,465 12,211
12/31/2001 12,384 12,134
01/31/2002 12,553 12,232
02/28/2002 12,677 12,350
03/31/2002 12,491 12,145
04/30/2002 12,690 12,381
05/31/2002 12,693 12,486
06/30/2002 12,689 12,594
07/31/2002 12,668 12,746
08/31/2002 12,951 12,961
09/30/2002 13,068 13,171
10/31/2002 13,068 13,111
11/30/2002 13,148 13,107
12/31/2002 13,371 13,378
01/31/2003 13,322 13,389
02/28/2003 13,566 13,575
03/31/2003 13,574 13,564
04/30/2003 13,657 13,676
05/31/2003 14,046 13,931
06/30/2003 14,009 13,903
07/31/2003 13,476 13,436
08/31/2003 13,633 13,525
09/30/2003 14,002 13,883
10/31/2003 13,897 13,754
11/30/2003 13,916 13,787
12/31/2003 14,042 13,927
01/31/2004 14,138 14,039
02/29/2004 14,301 14,191
03/31/2004 14,417 14,297
04/30/2004 14,058 13,925
05/31/2004 14,025 13,870
06/30/2004 14,093 13,948
07/31/2004 14,241 14,086
08/31/2004 14,502 14,355
09/30/2004 14,548 14,394
10/31/2004 14,610 14,515
11/30/2004 14,467 14,399
12/31/2004 14,605 14,531
01/31/2005 14,642 14,622
02/28/2005 14,519 14,536
03/31/2005 14,493 14,461
04/30/2005 14,686 14,657
05/31/2005 14,857 14,816
06/30/2005 14,931 14,897
07/31/2005 14,790 14,761
08/31/2005 14,983 14,950
09/30/2005 14,816 14,796
10/31/2005 14,662 14,679
11/30/2005 14,702 14,744
12/31/2005 14,835 14,884
01/31/2006 14,871 14,885
02/28/2006 14,908 14,934
03/31/2006 14,759 14,788
04/30/2006 14,766 14,761
05/31/2006 14,719 14,745
06/30/2006 14,705 14,777
$10,000 invested at the beginning of the first full month following the inception date of the Portfolio’s Administrative Class.
Sector Breakdown‡
| | |
U.S. Government Agencies | | 56.0% |
Short-Term Instruments | | 33.5% |
Other | | 10.5% |
| | ‡ | % of Total Investments as of June 30, 2006 |
| | | | | | | | | | | | |
| Average Annual Total Return for the period ended June 30, 2006 |
| | | | | | | 6 Months* | | 1 Year | | 5 Years | | Since
Inception (05/28/99)** |
| | |
| | PIMCO Total Return Portfolio II Administrative Class | | -0.88% | | -1.51% | | 4.78% | | 5.59% |
| | |
| | Lehman Brothers Aggregate Bond Index | | -0.72% | | -0.81% | | 4.97% | | 5.67% |
All Portfolio returns are net of fees and expenses.
* Cumulative return.
** The Portfolio began operations on 05/28/99. Index comparisons began on 05/31/99.
Past performance is no guarantee of future results. The performance quoted represents past performance. Investment return and principal value will fluctuate so the Portfolio shares, when redeemed, may be worth more or less than their original cost. The Portfolio’s performance does not reflect the deduction of additional charges and expenses imposed in connection with investing in Variable Contracts, which will reduce returns. Current performance may be lower or higher than the performance data quoted. Performance data current to the most recent month-end is available by calling (800) 927-4648.
| | | | | | | | | | |
| Expense Example | | | | Actual Performance | | | | Hypothetical Performance |
| | | | | | | | | (5% return before expenses) |
Beginning Account Value (01/01/06) | | | | $ | 1,000.00 | | | | $ | 1,000.00 |
Ending Account Value (06/30/06) | | | | $ | 991.20 | | | | $ | 1,021,57 |
Expenses Paid During Period† | | | | $ | 3.21 | | | | $ | 3.26 |
† Expenses are equal to the Portfolio’s Administrative Class annualized expense ratio of 0.65%, multiplied by the average account value over the period, multiplied by 181/365 (to reflect the one-half year period). Overall fees and expenses of investing in the Portfolio will be higher because the example does not reflect Variable Contract fees and expenses.
Please refer to page 3 herein for a description of the Portfolio’s benchmark and an explanation of the information presented in the above Expense Example.
Portfolio Insights
| » | | The PIMCO Total Return Portfolio II seeks to achieve its investment objective by investing under normal circumstances at least 65% of its total assets in a diversified portfolio of Fixed-Income Instruments of varying maturities. |
| » | | The Portfolio’s above-benchmark duration detracted from returns as yields rose in the first half of the year. |
| » | | An emphasis on short-term maturities detracted from performance as short-term yields rose more than longer-dated yields. The Federal Reserve continued with its tightening policy, sending short-term rates higher while intermediate- and longer-term rates shifted higher. |
| » | | An overweight to mortgages contributed to returns as this sector outperformed like-duration Treasuries. |
| » | | An underweight to corporate securities detracted from returns as this sector outperformed like-duration Treasuries. |
| » | | A tactical allocation to municipal bonds was positive for performance as municipal yields rose less than Treasury yields. |
| | | | | | |
| 4 | | PIMCO Variable Insurance Trust | | | | |
| | |
| |
| Financial Highlights Total Return Portfolio II | | |
| | | | | | | | | | | | | | | | | | | | | | | | |
| Selected Per Share Data for the Year or Period Ended: | | 06/30/2006+ | | | 12/31/2005 | | | 12/31/2004 | | | 12/31/2003 | | | 12/31/2002 | | | 12/31/2001 | |
| | | | | | |
Administrative Class | | | | | | | | | | | | | | | | | | | | | | | | |
| Net asset value beginning of period | | $ | 10.04 | | | $ | 10.31 | | | $ | 10.31 | | | $ | 10.09 | | | $ | 10.12 | | | $ | 10.24 | |
| Net investment income (a) | | | 0.22 | | | | 0.34 | | | | 0.17 | | | | 0.17 | | | | 0.38 | | | | 0.48 | |
| Net realized/unrealized gain (loss) on investments (a) | | | (0.31 | ) | | | (0.18 | ) | | | 0.24 | | | | 0.33 | | | | 0.41 | | | | 0.49 | |
| Total income (loss) from investment operations | | | (0.09 | ) | | | 0.16 | | | | 0.41 | | | | 0.50 | | | | 0.79 | | | | 0.97 | |
| Dividends from net investment income | | | (0.22 | ) | | | (0.35 | ) | | | (0.17 | ) | | | (0.19 | ) | | | (0.40 | ) | | | (0.48 | ) |
| Distributions from net realized capital gains | | | 0.00 | | | | (0.08 | ) | | | (0.24 | ) | | | (0.09 | ) | | | (0.42 | ) | | | (0.61 | ) |
| Total distributions | | | (0.22 | ) | | | (0.43 | ) | | | (0.41 | ) | | | (0.28 | ) | | | (0.82 | ) | | | (1.09 | ) |
| Net asset value end of period | | $ | 9.73 | | | $ | 10.04 | | | $ | 10.31 | | | $ | 10.31 | | | $ | 10.09 | | | $ | 10.12 | |
| Total return | | | (0.88 | )% | | | 1.58 | % | | | 4.01 | % | | | 5.01 | % | | | 7.97 | % | | | 9.72 | % |
| Net assets end of period (000s) | | $ | 26,791 | | | $ | 24,922 | | | $ | 24,843 | | | $ | 17,474 | | | $ | 16,882 | | | $ | 2,403 | |
| Ratio of expenses to average net assets | | | 0.65 | %* | | | 0.65 | % | | | 0.65 | % | | | 0.65 | % | | | 0.66 | %(c) | | | 0.65 | %(b) |
| Ratio of net investment income to average net assets | | | 4.42 | %* | | | 3.31 | % | | | 1.58 | % | | | 1.62 | % | | | 3.71 | % | | | 4.55 | % |
| Portfolio turnover rate | | | 168 | % | | | 508 | % | | | 305 | % | | | 863 | % | | | 418 | % | | | 606 | % |
+ Unaudited
* Annualized
(a) Per share amounts based on average number of shares outstanding during the period.
(b) If the investment manager had not reimbursed expenses, the ratio of expenses to average net assets would have been 0.66%.
(c) Ratio of expenses to average net assets excluding interest expense is 0.65%.
| | | | | | |
| See Accompanying Notes | | Semiannual Report | | June 30, 2006 | | 5 |
| | |
| |
| Statement of Assets and Liabilities Total Return Portfolio II | | |
| | | | |
| (Amounts in thousands, except per share amounts) | | June 30, 2006
(Unaudited) | |
| |
Assets: | | | | |
Investments, at value | | $ | 27,923 | |
Repurchase agreement, at value | | | 3,275 | |
Receivable for investments sold | | | 12 | |
Interest and dividends receivable | | | 93 | |
Variation margin receivable | | | 17 | |
Unrealized appreciation on swap agreements | | | 3 | |
| | | | 31,323 | |
| |
Liabilities: | | | | |
Payable for investments purchased | | $ | 4,297 | |
Payable for Portfolio shares redeemed | | | 20 | |
Written options outstanding | | | 85 | |
Accrued investment advisory fee | | | 6 | |
Accrued administration fee | | | 6 | |
Accrued servicing fee | | | 3 | |
Variation margin payable | | | 1 | |
Swap premiums received | | | 8 | |
Unrealized depreciation on swap agreements | | | 3 | |
| | | | 4,429 | |
| |
Net Assets | | $ | 26,894 | |
| |
Net Assets Consist of: | | | | |
Paid in capital | | $ | 28,092 | |
Undistributed net investment income | | | 134 | |
Accumulated undistributed net realized (loss) | | | (445 | ) |
Net unrealized (depreciation) | | | (887 | ) |
| | | $ | 26,894 | |
| |
Net Assets: | | | | |
Institutional Class | | $ | 103 | |
Administrative Class | | | 26,791 | |
| |
Shares Issued and Outstanding: | | | | |
Institutional Class | | | 11 | |
Administrative Class | | | 2,753 | |
| |
Net Asset Value and Redemption Price Per Share (Net Assets Per Share Outstanding) | | | | |
Institutional Class | | $ | 9.73 | |
Administrative Class | | | 9.73 | |
| |
Cost of Investments Owned | | $ | 28,552 | |
Cost of Repurchase Agreements Owned | | $ | 3,275 | |
Premiums Received on Written Options | | $ | 69 | |
| | | | |
| 6 | | PIMCO Variable Insurance Trust | | See Accompanying Notes |
| | |
| |
| Statement of Operations Total Return Portfolio II | | |
| | | | |
| (Amounts in Thousands) | | Six Months Ended
June 30, 2006
(Unaudited) | |
| |
Investment Income: | | | | |
Interest | | $ | 667 | |
Dividends | | | 4 | |
Total Income | | | 671 | |
| |
Expenses: | | | | |
Investment advisory fees | | | 33 | |
Administration fees | | | 33 | |
Servicing fees – Administrative Class | | | 20 | |
Total Expenses | | | 86 | |
| |
Net Investment Income | | | 585 | |
| |
Net Realized and Unrealized Gain (Loss): | | | | |
Net realized (loss) on investments | | | (154 | ) |
Net realized (loss) on futures contracts, options and swaps | | | (5 | ) |
Net change in unrealized (depreciation) on investments | | | (407 | ) |
Net change in unrealized (depreciation) on futures contracts, options and swaps | | | (264 | ) |
Net (Loss) | | | (830 | ) |
| |
Net (Decrease) in Net Assets Resulting from Operations | | $ | (245 | ) |
| | | | | | |
| See Accompanying Notes | | Semiannual Report | | June 30, 2006 | | 7 |
| | |
| |
| Statements of Changes in Net Assets Total Return Portfolio II | | |
| | | | | | | | |
| (Amounts in Thousands) | | Six Months Ended
June 30, 2006
(Unaudited) | | | Year Ended
December 31, 2005 | |
| | |
Increase (Decrease) in Net Assets from: | | | | | | | | |
| | |
Operations: | | | | | | | | |
Net investment income | | $ | 585 | | | $ | 824 | |
Net realized (loss) | | | (159 | ) | | | (110 | ) |
Net change in unrealized (depreciation) | | | (671 | ) | | | (306 | ) |
Net increase (decrease) resulting from operations | | | (245 | ) | | | 408 | |
| | |
Distributions to Shareholders: | | | | | | | | |
| From net investment income | | | | | | | | |
Institutional Class | | | (1 | ) | | | (1 | ) |
Administrative Class | | | (601 | ) | | | (850 | ) |
| From net realized capital gains | | | | | | | | |
Institutional Class | | | 0 | | | | 0 | |
Administrative Class | | | 0 | | | | (200 | ) |
| | |
Total Distributions | | | (602 | ) | | | (1,051 | ) |
| | |
Portfolio Share Transactions: | | | | | | | | |
| Receipts for shares sold | | | | | | | | |
Institutional Class | | | 87 | | | | 0 | |
Administrative Class | | | 2,229 | | | | 0 | |
| Issued as reinvestment of distributions | | | | | | | | |
Institutional Class | | | 1 | | | | 1 | |
Administrative Class | | | 699 | | | | 1,050 | |
| Cost of shares redeemed | | | | | | | | |
Institutional Class | | | (1 | ) | | | 0 | |
Administrative Class | | | (213 | ) | | | (329 | ) |
Net increase resulting from Portfolio share transactions | | | 2,802 | | | | 722 | |
| | |
Total Increase in Net Assets | | | 1,955 | | | | 79 | |
| | |
Net Assets: | | | | | | | | |
Beginning of period | | | 24,939 | | | | 24,860 | |
End of period* | | $ | 26,894 | | | $ | 24,939 | |
| | |
*Including undistributed net investment income of: | | $ | 134 | | | $ | 151 | |
| | | | |
| 8 | | PIMCO Variable Insurance Trust | | See Accompanying Notes |
| | |
| |
| Schedule of Investments Total Return Portfolio II | | June 30, 2006 (Unaudited) |
| | | | |
| | | PRINCIPAL | | |
| | | AMOUNT | | VALUE |
| | | (000S) | | (000S) |
| | | | | |
| | | | | | | | |
| CORPORATE BONDS & NOTES 5.5% |
| |
| BANKING & FINANCE 4.9% | | | | |
| American General Finance Corp. | | | | |
5.489% due 03/23/2007 | | $ | | 100 | | $ | | 100 |
|
| Bank of America Corp. | | | | | | | | |
5.406% due 06/19/2009 | | | | 300 | | | | 300 |
|
| CIT Group Holdings, Inc. | | | | | | | | |
5.276% due 01/30/2009 | | | | 100 | | | | 100 |
|
| Citigroup Global Markets Holdings, Inc. | | |
5.276% due 03/07/2008 | | | | 100 | | | | 100 |
|
| Citigroup, Inc. | | | | | | | | |
5.422% due 06/09/2009 | | | | 200 | | | | 201 |
|
| Goldman Sachs Group, Inc. | | | | | | | | |
5.063% due 08/01/2006 | | | | 100 | | | | 100 |
5.226% due 07/29/2008 | | | | 200 | | | | 200 |
|
| Morgan Stanley | | | | | | | | |
5.193% due 01/18/2008 | | | | 100 | | | | 100 |
|
| UBS Preferred Funding Trust I | | | | | | | | |
8.622% due 10/29/2049 | | | | 100 | | | | 110 |
| | | | | | | | |
|
| | | | | | | | | 1,311 |
| | | | | | | | |
|
| |
| INDUSTRIALS 0.2% | | | | |
| El Paso Corp. | | | | | | | | |
6.750% due 05/15/2009 | | | | 50 | | | | 50 |
| |
| UTILITIES 0.4% | | | | |
| AT&T, Inc. | | | | | | | | |
4.389% due 06/05/2021 | | | | 100 | | | | 99 |
|
| MidAmerican Energy Holdings Co. |
6.125% due 04/01/2036 | | | | 30 | | | | 28 |
| | | | | | | | |
|
| | | | | | | | | 127 |
| | | | | | | | |
|
Total Corporate Bonds & Notes
(Cost $1,478) | | | | 1,488 |
| | | | | | | | |
|
| | | | | | | |
| MUNICIPAL BONDS & NOTES 1.9% |
| New Jersey State Tobacco Settlement Financing Corporations Revenue Bonds, Series 2003 |
6.750% due 06/01/2039 | | | | 100 | | | | 111 |
|
| New Jersey State Tobacco Settlement Financing Corporations Revenue Notes, Series 2003 |
4.375% due 06/01/2019 | | | | 45 | | | | 45 |
|
| New York City, New York Municipal Water Finance Authority Revenue Notes, Series 2005 |
5.000% due 06/15/2031 | | | | 200 | | | | 204 |
|
| New York State Environmental Facilities Corporations Revenue Notes, Series 2002 |
5.980% due 06/15/2023 | | | | 25 | | | | 27 |
|
| Texas State Eagle Mountain & Saginaw Independent School District General Obligation, (PSF Insured), Series 2005 |
4.750% due 08/15/2033 | | | | 120 | | | | 118 |
| | | | | | | | |
|
Total Municipal Bonds & Notes
(Cost $491) | | 505 |
| | | | | | | | |
|
| | | | | | | |
| U.S. GOVERNMENT AGENCIES 65.0% |
| Fannie Mae | | | | | | | | |
4.810% due 09/22/2006 | | | | 100 | | | | 100 |
5.000% due 06/01/2018 - 04/25/2033 (b) | | | | 7,300 | | | | 7,038 |
5.249% due 04/26/2035 | | | | 4 | | | | 5 |
5.442% due 03/25/2034 | | | | 32 | | | | 32 |
5.500% due 10/01/2017 - 07/13/2036 (b) | | | | 8,804 | | | | 8,470 |
5.695% due 09/01/2034 | | | | 33 | | | | 33 |
| | | | | | | | |
5.736% due 12/01/2036 | | $ | | 34 | | $ | | 34 |
6.000% due 07/01/2016 - 07/13/2036 (b) | | | | 1,086 | | | | 1,070 |
|
| Freddie Mac | | | | | | | | |
4.500% due 10/15/2022 | | | | 247 | | | | 243 |
5.000% due 10/01/2018 | | | | 63 | | | | 61 |
5.500% due 08/15/2030 | | | | 2 | | | | 2 |
5.682% due 10/25/2029 | | | | 67 | | | | 67 |
5.732% due 07/01/2027 | | | | 3 | | | | 3 |
5.951% due 01/01/2028 | | | | 3 | | | | 4 |
6.000% due 09/01/2016 | | | | 10 | | | | 10 |
|
| Government National Mortgage Association |
4.375% due 02/20/2027 - 05/20/2030 (b) | | | | 23 | | | | 23 |
5.767% due 09/20/2030 | | | | 3 | | | | 3 |
|
| Small Business Administration Participation Certificates |
4.750% due 07/01/2025 | | | | 295 | | | | 275 |
| | | | | | | | |
|
Total U.S. Government Agencies (Cost $18,077) | | | | 17,473 |
| | | | | | | | |
|
| | | | | | | |
| U.S. TREASURY OBLIGATIONS 1.4% |
| Treasury Inflation Protected Securities (a) |
3.375% due 01/15/2007 (d) | | | | 127 | | | | 127 |
2.000% due 01/15/2026 | | | | 122 | | | | 112 |
3.625% due 04/15/2028 | | | | 125 | | | | 148 |
| | | | | | | | |
|
Total U.S. Treasury Obligations (Cost $405) | | | | 387 |
| | | | | | | | |
|
| | | | | | | |
| MORTGAGE-BACKED SECURITIES 2.7% |
| American Home Mortgage Investment Trust |
4.390% due 02/25/2045 | | | | 64 | | | | 62 |
|
| Banc of America Funding Corp. |
4.115% due 05/25/2035 | | | | 85 | | | | 81 |
|
| Banc of America Mortgage Securities |
6.500% due 10/25/2031 | | | | 25 | | | | 25 |
6.500% due 02/25/2033 | | | | 5 | | | | 5 |
|
| Bear Stearns Adjustable Rate Mortgage Trust |
5.067% due 03/25/2033 | | | | 17 | | | | 17 |
4.679% due 12/25/2033 | | | | 35 | | | | 35 |
|
| Bear Stearns Alt-A Trust |
5.415% due 05/25/2035 | | | | 71 | | | | 70 |
|
| Countrywide Home Loan Mortgage Pass-Through Trust |
5.612% due 04/25/2035 | | | | 63 | | | | 63 |
|
| CS First Boston Mortgage Securities Corp. |
6.056% due 06/25/2032 | | | | 1 | | | | 1 |
6.489% due 06/25/2032 | | | | 5 | | | | 5 |
5.509% due 08/25/2033 | | | | 4 | | | | 4 |
|
| GSR Mortgage Loan Trust |
6.000% due 03/25/2032 | | | | 3 | | | | 3 |
|
| Impac CMB Trust |
5.722% due 07/25/2033 | | | | 35 | | | | 35 |
5.572% due 01/25/2034 | | | | 21 | | | | 21 |
|
| Mastr Adjustable Rate Mortgages Trust |
3.786% due 12/21/2034 | | | | 24 | | | | 24 |
|
| MASTR Asset Securitization Trust |
5.500% due 09/25/2033 | | | | 42 | | | | 40 |
|
| MLCC Mortgage Investors, Inc. |
5.812% due 01/25/2029 | | | | 32 | | | | 32 |
|
| Prime Mortgage Trust |
5.722% due 02/25/2034 | | | | 29 | | | | 29 |
|
| Structured Asset Mortgage Investments, Inc. |
5.582% due 09/19/2032 | | | | 3 | | | | 3 |
|
| Structured Asset Securities Corp. |
6.150% due 07/25/2032 | | | | 1 | | | | 1 |
| | | | | | | | | |
| Washington Mutual, Inc. |
5.009% due 02/27/2034 | | $ | | 21 | | | $ | | 21 |
5.410% due 08/25/2042 | | | | 64 | | | | | 64 |
|
| Wells Fargo Mortgage-Backed Securities Trust |
4.950% due 03/25/2036 | | | | 96 | | | | | 95 |
| | | | | | | | | |
|
Total Mortgage-Backed Securities (Cost $746) | | | | | 736 |
| | | | | | | | | |
|
| |
| ASSET-BACKED SECURITIES 0.1% |
| AAA Trust | | | | | | | | | |
5.422% due 04/25/2035 | | | | 7 | | | | | 7 |
|
| Amortizing Residential Collateral Trust |
5.592% due 06/25/2032 | | | | 4 | | | | | 4 |
|
| Carrington Mortgage Loan Trust | | | | | |
5.402% due 06/25/2035 | | | | 5 | | | | | 5 |
|
| CIT Group Home Equity Loan Trust | | | | | |
5.593% due 06/25/2033 | | | | 2 | | | | | 2 |
|
| CS First Boston Mortgage Securities Corp. |
5.632% due 01/25/2032 | | | | 6 | | | | | 7 |
|
| Equity One ABS, Inc. | | | | | | | | | |
5.602% due 11/25/2032 | | | | 9 | | | | | 9 |
| | | | | | | | | |
|
Total Asset-Backed Securities
(Cost $34) | | | | | 34 |
| | | | | | | | | |
|
| |
| | | | | NOTIONAL
AMOUNT
(000S) | | | | | |
| PURCHASED CALL OPTIONS 0.1% |
| 2-Year Interest Rate Swap (OTC) Pay 3-Month USD-LIBOR Floating Rate Index |
Strike @ 4.750% Exp. 08/07/2006 | | | | 2,000 | | | | | 0 |
Strike @ 5.080% Exp. 04/19/2007 | | | | 2,300 | | | | | 3 |
Strike @ 5.130% Exp. 10/25/2006 | | | | 2,000 | | | | | 1 |
Strike @ 5.200% Exp. 05/23/2007 | | | | 1,000 | | | | | 2 |
Strike @ 5.250% Exp. 06/07/2007 | | | | 2,000 | | | | | 6 |
| | | | | | | | | |
|
Total Purchased Call Options (Cost $31) | | | | | | | | | 12 |
| | | | | | | | | |
|
| |
| | | | | | | | |
| | | | | #OF
CONTRACTS | | | | |
| PURCHASED PUT OPTIONS 0.0% |
| 90-Day Eurodollar December Futures (CME) |
Strike @ $92.000 Exp. 12/18/2006 | | | | 24 | | | | 0 |
Strike @ $92.500 Exp. 12/18/2006 | | | | 16 | | | | 0 |
|
| 90-Day Eurodollar June Futures (CME) |
Strike @ $91.250 Exp. 06/18/2007 | | | | 90 | | | | 1 |
|
| 90-Day Eurodollar March Futures (CME) |
Strike @ $92.000 Exp. 03/19/2007 | | | | 19 | | | | 0 |
Strike @ $92.250 Exp. 03/19/2007 | | | | 1 | | | | 0 |
|
| 90-Day Eurodollar September Futures (CME) |
Strike @ $94.000 Exp. 09/18/2006 | | | | 10 | | | | 0 |
| | | | | | | | |
|
Total Purchased Put Options (Cost $2) | | | | 1 |
| | | | | | | | |
|
| | | | | | |
| See Accompanying Notes | | Semiannual Report | | June 30, 2006 | | 9 |
| | |
| |
| Schedule of Investments Total Return Portfolio II (Cont.) | | |
| | | | | | | | |
| | | | | | | | | |
| | | | | | | | | VALUE |
| | | | | SHARES | | | | (000S) |
| PREFERRED STOCK 0.4% |
| DG Funding Trust | | | | | | | | |
7.210% due 12/31/2049 | | | | 11 | | $ | | 116 |
| | | | | | | | |
|
Total Preferred Stock (Cost $116) | | | | 116 |
| | | | | | | | |
|
| | | | | | | |
| | | | | PRINCIPAL
AMOUNT
(000S) | | | | |
| SHORT-TERM INSTRUMENTS 38.9% |
| |
| CERTIFICATE OF DEPOSIT 3.0% | | | | |
| Wells Fargo Bank N.A. | | | | | | | | |
5.280% due 07/11/2006 | | $ | | 800 | | | | 800 |
| |
| COMMERCIAL PAPER 22.9% | | | | |
| Fannie Mae | | | | | | | | |
4.809% due 07/05/2006 | | | | 700 | | | | 700 |
|
| Federal Home Loan Bank | | | | | | | | |
5.234% due 08/30/2006 | | | | 3,200 | | | | 3,173 |
|
| Freddie Mac | | | | | | | | |
4.625% due 08/01/2006 | | | | 700 | | | | 697 |
4.792% due 08/01/2006 | | | | 700 | | | | 697 |
5.220% due 09/05/2006 | | | | 900 | | | | 891 |
| | | | | | | | |
|
| | | | | | | | | 6,158 |
| | | | | | | | |
|
| | | | | | | | |
| REPURCHASE AGREEMENTS 12.2% |
| Credit Suisse First Boston | | | | | | | | |
4.580% due 07/03/2006 | | $ | | 2,000 | | $ | | 2,000 |
(Dated 06/30/2006. Collateralized by U.S. Treasury Notes 4.000% due 06/15/2009 valued at $2,056. Repurchase proceeds are $2,001.) |
4.600% due 07/03/2006 | | | | 1,100 | | | | 1,100 |
(Dated 06/30/2006. Collateralized by U.S. Treasury Notes 3.250% due 08/15/2007 valued at $1,124. Repurchase proceeds are $1,100.) |
|
| State Street Bank | | | | | | | | |
4.900% due 07/03/2006 | | 175 | | | | 175 |
(Dated 06/30/2006. Collateralized by Federal Home Loan Bank 3.375% due 02/23/2007 valued at $180. Repurchase proceeds are $175.) |
| | | | | | | | |
|
| | | | | | | | | 3,275 |
| | | | | | | | |
|
| |
| U.S. TREASURY BILLS 0.8% | | | | |
4.788% due 08/31/2006-09/14/2006 (b)(d) | | | | 215 | | | | 213 |
| | | | | | | | |
|
Total Short-Term Instruments
(Cost $10,447) | | | | 10,446 |
| | | | | | | | |
|
| |
Total Investments (c) 116.0%
(Cost $31,827) | | $ | | 31,198 |
| |
Written Options (f) (0.3%)
(Premiums $69) | | | | (85) |
| |
| Other Assets and Liabilities (Net) (15.7%) | | (4,219) |
| | | | | | | | |
|
| Net Assets 100.0% | | $ | | 26,894 |
| | | | | | | | |
|
|
| Notes to Schedule of Investments (amounts in thousands, except number of contracts): |
| |
(a) Principal amount of security is adjusted for inflation. |
| |
(b) Securities are grouped by coupon or range of coupons and represent a range of maturities. |
| |
(c) As of June 30, 2006, portfolio securities with an aggregate market value of $4 were valued in good faith and pursuant to guidelines established by the Board of Trustees. |
| |
(d) Securities with an aggregate market value of $340 have been segregated with the custodian to cover margin requirements for the following open futures contracts on June 30, 2006: |
| | | | | | | | | | |
| Description | | Type | | Expiration
Month | | # of
Contracts | | Unrealized
(Depreciation) | |
90-Day Eurodollar December Futures | | Long | | 12/2006 | | 47 | | $ | (68 | ) |
90-Day Eurodollar December Futures | | Long | | 12/2007 | | 9 | | | (10 | ) |
90-Day Eurodollar June Futures | | Long | | 06/2007 | | 25 | | | (45 | ) |
90-Day Eurodollar March Futures | | Long | | 03/2007 | | 37 | | | (72 | ) |
90-Day Eurodollar March Futures | | Long | | 03/2008 | | 4 | | | (3 | ) |
90-Day Eurodollar September Futures | | Long | | 09/2006 | | 21 | | | (16 | ) |
90-Day Eurodollar September Futures | | Long | | 09/2007 | | 17 | | | (27 | ) |
U.S. Treasury 5-Year Note September Futures | | Long | | 09/2006 | | 2 | | | (2 | ) |
| | | | | | | | |
|
|
|
| | | | | | | | | $ | (243 | ) |
| | | | | | | | |
|
|
|
| | | | | | | | | | | | | | | |
(e) Swap agreements outstanding on June 30, 2006: | |
| Interest Rate Swaps | | | | | | | | | | | | | | | |
| Counterparty | | Floating Rate Index | | Pay/Receive
Floating Rate | | Fixed Rate | | Expiration
Date | | Notional
Amount | | Unrealized
(Depreciation) | |
Barclays Bank PLC | | 3-month USD-LIBOR | | Pay | | 5.000% | | 12/20/2008 | | $ | 800 | | $ | (1 | ) |
| | | | | | | | | | | | | |
|
|
|
| | | | |
| 10 | | PIMCO Variable Insurance Trust | | See Accompanying Notes |
| | |
| |
| | | June 30, 2006 (Unaudited) |
| | | | | | | | | | | | | | | | |
| Credit Default Swaps | | | | | | | | | | | | | | | | |
| Counterparty | | Reference Entity | | Buy/Sell
Protection+ | | (Pay)/Receive
Fixed Rate | | | Expiration
Date | | Notional
Amount | | Unrealized
Appreciation/
(Depreciation) | |
Bank of America | | Ford Motor Corp. 7.450% due 07/16/2031 | | Sell | | 4.150% | | | 06/20/2007 | | $ | 200 | | $ | (1 | ) |
Bear Stearns & Co., Inc. | | Ford Motor Credit Co. 7.000% due 10/01/2013 | | Sell | | 1.350% | | | 09/20/2006 | | | 100 | | | 0 | |
Goldman Sachs & Co. | | Dow Jones CDX N.A. HV5 Index | | Buy | | (0.850% | ) | | 12/20/2010 | | | 200 | | | (1 | ) |
Morgan Stanley Dean Witter & Co. | | Ford Motor Credit Co. 7.000% due 10/01/2013 | | Sell | | 5.200% | | | 12/20/2006 | | | 100 | | | 2 | |
UBS Warburg LLC | | Ford Motor Credit Co. 7.000% due 10/01/2013 | | Sell | | 4.750% | | | 12/20/2006 | | | 100 | | | 1 | |
| | | | | | | | | | | | | | |
|
|
|
| | | | | | | | | | | | | | | $ | 1 | |
| | | | | | | | | | | | | | |
|
|
|
|
| + If the Portfolio is a seller of protection and a credit event occurs, as defined under the terms of that particular swap agreement, the Portfolio will Pay to the buyer of the protection an amount up to the notional value of the swap and in certain instances, take delivery of the security. As a buyer of protection, the Portfolio will generally receive from the seller of protection an amount up to the notional amount of the swap if a credit event occurs. | |
| | | | | | | | | | | | |
(f) Written options outstanding on June 30, 2006: | | | | | | | | | | |
| Options on Exchange-Traded Futures Contracts | | | | | | | | | | | | |
| Description | | Exercise
Price | | Expiration
Date | | # of
Contracts | | Premium | | Value |
Call - CBOT U.S. Treasury 10-Year Note September Futures | | $ 108.000 | | 08/25/2006 | | 15 | | $ | 2 | | $ | 0 |
Call - CBOT U.S. Treasury 10-Year Note September Futures | | 106.000 | | 08/25/2006 | | 2 | | | 1 | | | 1 |
Put - CBOT U.S. Treasury 10-Year Note September Futures | | 103.000 | | 08/25/2006 | | 17 | | | 3 | | | 2 |
Call - CME 90-Day Eurodollar September Futures | | 95.500 | | 09/18/2006 | | 1 | | | 0 | | | 0 |
Put - CME 90-Day Eurodollar September Futures | | 95.250 | | 09/18/2006 | | 3 | | | 2 | | | 6 |
Put - CME 90-Day Eurodollar December Futures | | 95.000 | | 12/18/2006 | | 3 | | | 2 | | | 5 |
Put - CME 90-Day Eurodollar December Futures | | 95.250 | | 12/18/2006 | | 21 | | | 16 | | | 44 |
Put - CME 90-Day Eurodollar December Futures | | 95.500 | | 12/18/2006 | | 3 | | | 3 | | | 8 |
| | | | | | | | |
|
| |
|
|
| | | | | | | | | $ | 29 | | $ | 66 |
| | | | | | | | |
|
| |
|
|
| | | | | | | | | | | | | | | | | | | |
| Interest Rate Swaptions | | | | | | | | | | | | | |
| Description | | Counterparty | | Floating
Rate Index | | Pay/Receive
Floating Rate | | Exercise
Rate | | Expiration
Date | | Notional
Amount | | Premium | | Value |
Call - OTC 5-Year Interest Rate Swap | | Goldman Sachs & Co. | | 3-month USD-LIBOR | | Receive | | 4.780% | | 08/07/06 | | $ | 1,000 | | $ | 8 | | $ | 0 |
Call - OTC 5-Year Interest Rate Swap | | Bear Stearns & Co., Inc. | | 3-month USD-LIBOR | | Receive | | 5.210% | | 10/25/06 | | | 1,000 | | | 4 | | | 2 |
Call - OTC 5-Year Interest Rate Swap | | Royal Bank of Scotland PLC | | 3-month USD-LIBOR | | Receive | | 5.220% | | 04/19/07 | | | 1,000 | | | 8 | | | 4 |
Call - OTC 5-Year Interest Rate Swap | | Royal Bank of Scotland PLC | | 3-month USD-LIBOR | | Receive | | 5.300% | | 05/23/07 | | | 1,000 | | | 10 | | | 6 |
Call - OTC 5-Year Interest Rate Swap | | Royal Bank of Scotland PLC | | 3-month USD-LIBOR | | Receive | | 5.340% | | 06/07/07 | | | 1,000 | | | 10 | | | 7 |
| | | | | | | | | | | | | | | |
|
| |
|
|
| | | | | | | | | | | | | | | | $ | 40 | | $ | 19 |
| | | | | | | | | | | | | | | |
|
| |
|
|
| | | | | | |
| See Accompanying Notes | | Semiannual Report | | June 30, 2006 | | 11 |
Notes to Financial Statements
1. ORGANIZATION
The Total Return Portfolio II (the “Portfolio”) is a series of the PIMCO Variable Insurance Trust (the “Trust”). The Trust is registered under the Investment Company Act of 1940 (the “Act”), as amended, as an open-end investment management company organized as a Delaware business trust on October 3, 1997. The Portfolio offers two classes of shares: Institutional and Administrative. Information presented in these financial statements pertains to the Administrative Class of the Portfolio. Certain detailed financial information for the Institutional Class is provided separately and is available upon request. The Trust is designed to be used as an investment vehicle by Separate Accounts of insurance companies that fund variable annuity contracts and variable life insurance policies and by qualified pension and retirement plans.
2. SIGNIFICANT ACCOUNTING POLICIES
The following is a summary of significant accounting policies consistently followed by the Portfolio in the preparation of its financial statements in conformity with accounting principles generally accepted in the United States of America (“GAAP”). The preparation of financial statements in accordance with GAAP requires management to make estimates and assumptions that affect the reported amounts and disclosures in the financial statements. Actual results could differ from those estimates.
Security Valuation. Portfolio securities are valued as of the close of regular trading (normally 4:00 p.m., Eastern Time) on each day that the New York Stock Exchange (“NYSE”) is open. Portfolio securities and other assets for which market quotes are readily available are stated at market value. Market value is generally determined on the basis of last reported sales prices, or if no sales are reported, based on quotes obtained from a quotation reporting system, established market makers, or pricing services. Fixed-income securities and non-exchange traded derivatives are normally valued on the basis of quotes obtained from brokers and dealers or pricing services. Prices obtained from independent pricing services use information provided by market makers or estimates of market values obtained from yield data relating to investments or securities with similar characteristics. Certain fixed-income securities purchased on a delayed-delivery basis are marked to market daily until settlement at the forward settlement date. Short-term investments having a maturity of 60 days or less are generally valued at amortized cost. Exchange traded options, futures and options on futures are valued at the settlement price determined by the relevant exchange.
Investments initially valued in currencies other than the U.S. dollar are converted to the U.S. dollar using exchange rates obtained from pricing services. As a result, the NAV of the Portfolio’s shares may be affected by changes in the value of currencies in relation to the U.S. dollar. The value of securities traded in markets outside the United States or denominated in currencies other than the U.S. dollar may be affected significantly on a day that the NYSE is closed and an investor is not able to purchase, redeem or exchange shares.
Securities and other assets for which market quotes are not readily available are valued at fair value as determined in good faith by the Board of Trustees or persons acting at their direction. The Board of Trustees has adopted methods for valuing securities and other assets in circumstances where market quotes are not readily available, and has delegated to Pacific Investment Management Company LLC (“PIMCO”) the responsibility for applying the valuation methods. In the event that market quotes are not readily available, and the security or asset cannot be valued pursuant to one of the valuation methods, the value of the security or asset will be determined in good faith by the Valuation Committee of the Board of Trustees, generally based upon recommendations provided by PIMCO.
Market quotes are considered not readily available in circumstances where there is an absence of current or reliable market-based data (e.g., trade information, bid/asked information, broker quotes), including where events occur after the close of the relevant market, but prior to the close of regular trading, that materially affect the values of the Portfolio’s securities or assets. In addition, market quotes are considered not readily available when, due to extraordinary circumstances, the exchanges or markets on which the securities trade do not open for trading for the entire day and no other market prices are available. The Board has delegated to PIMCO the responsibility for monitoring significant events that may materially affect the values of the Portfolio’s securities or assets and for determining whether the value of the applicable securities or assets should be re-evaluated in light of such significant events. When the Portfolio uses fair value pricing to determine its NAV, securities will not be priced on the basis of quotations from the primary market in which they are traded, but rather may be priced by another method that the Board of Trustees or persons acting at their direction believe accurately reflects fair value. The Trust’s policy is intended to result in a calculation of the Portfolio’s NAV that fairly reflects security values as of the time of pricing. However, fair values determined by the Board of Trustees or persons acting at their direction may not accurately reflect the price that the Portfolio could obtain for a security if it were to dispose of that security as of the time of pricing. Because foreign securities can trade on non-business days, the NAV of the Portfolio may change on days when shareholders will not be able to purchase or redeem shares. The prices used by the Portfolio may differ from the value that would be realized if the securities were sold and the differences could be material to the financial statements.
Securities Transactions and Investment Income. Securities transactions are recorded as of the trade date. Securities purchased or sold on a when-issued or delayed-delivery basis may be settled a month or more after the trade date. Realized gains and losses from securities sold are recorded on the identified cost basis. Dividend income is recorded on the ex-dividend date, except certain dividends from foreign securities where the ex-dividend date may have passed, which are recorded as soon as the Portfolio is informed of the ex-dividend date. Interest income, adjusted for the accretion of discounts and amortization of premiums, is recorded on the accrual basis. Paydown gains and losses on mortgage-related or asset-backed securities are recorded as components of interest income in the Statement of Operations.
Dividends and Distributions to Shareholders. Dividends from net investment income, if any, are declared on each day the Portfolio is open for business and are distributed to shareholders monthly. Net realized capital gains earned by the Portfolio, if any, will be distributed no less frequently than once each year. Most shareholders choose to reinvest their dividends and capital gain distribution in additional shares of the Portfolio.
Income dividends and capital gain distributions are determined in accordance with income tax regulations which may differ from GAAP. Differences between tax regulations and GAAP may change the fiscal year when income and capital items are recognized for tax and GAAP purposes. Examples of events that give rise to timing differences include wash sales, straddles, net operating losses and capital loss carryforwards. Further, the character of investment income and capital gains may be different for certain transactions under the two methods of accounting. Examples of characterization differences include the treatment of mortgage paydowns, swaps, foreign currency transactions and contingent debt instruments. As a result, income dividends and capital gain distributions declared during a fiscal period may differ significantly from the net investment income and realized capital gain reported in the Portfolio’s annual financial statements presented under GAAP.
Distributions classified as a tax basis return of capital, if any, are reflected in the accompanying Statements of Changes in Net Assets and have been reclassified to paid in capital. In addition, other amounts have been reclassified between undistributed net investment income, accumulated undistributed net realized gains
| | | | |
| 12 | | PIMCO Variable Insurance Trust | | |
| | |
| |
| | | June 30, 2006 (Unaudited) |
or losses and/or paid in capital to more appropriately conform financial accounting to tax characterizations of dividend distributions.
Multiclass Operations. Each class offered by the Portfolio has equal rights as to assets and voting privileges (except that shareholders of a class have exclusive voting rights regarding any matter relating solely to that class of shares). Income and non-class specific expenses of the Portfolio are allocated daily to each class of shares based on the relative value of settled shares. Realized and unrealized capital gains and losses of the Portfolio are allocated daily to each class of shares based on the relative net assets of each class. Class specific expenses, where applicable, currently include administrative, distribution and servicing fees.
Federal Income Taxes. The Portfolio intends to qualify as a regulated investment company under sub-chapter M of the Internal Revenue Code and distribute all of its taxable income and net realized gains, if applicable, to shareholders. Accordingly, no provision for Federal income taxes has been made.
Futures Contracts. The Portfolio is authorized to enter into futures contracts. The Portfolio may use futures contracts to manage its exposure to the securities markets or to movements in interest rates and currency values. The primary risks associated with the use of futures contracts are the imperfect correlation between the change in market value of the securities held by the Portfolio and the prices of futures contracts, the possibility of an illiquid market, and the inability of the counterparty to meet the terms of the contract. Futures contracts are valued based upon their quoted daily settlement prices. Upon entering into a futures contract, the Portfolio is required to deposit with its custodian, in a segregated account in the name of the futures broker, an amount of cash or U.S. Government and Agency Obligations in accordance with the initial margin requirements of the broker or exchange. Futures contracts are marked to market daily and an appropriate payable or receivable for the change in value (“variation margin”) is recorded by the Portfolio. Gains or losses are recognized but not considered realized until the contracts expire or are closed. Futures contracts involve, to varying degrees, risk of loss in excess of the variation margin disclosed in the Statement of Assets and Liabilities.
Guarantees and Indemnifications. Under the Trust’s organizational documents, each Trustee, officer, employee or other agent of the Trust (including the Trust’s investment manager) is indemnified against certain liabilities that may arise out of performance of their duties to the Portfolio. Additionally, in the normal course of business, the Portfolio enters into contracts that contain a variety of indemnification clauses. The Portfolio’s maximum exposure under these arrangements is unknown as this would involve future claims that may be made against the Portfolio that have not yet occurred. However, the Portfolio has not had prior claims or losses pursuant to these contracts, and believes the risk of loss to be remote.
Inflation-Indexed Bonds. The Portfolio may invest in inflation-indexed bonds. Inflation-indexed bonds are fixed-income securities whose principal value is periodically adjusted to the rate of inflation. The interest rate on these bonds is generally fixed at issuance at a rate lower than typical bonds. Over the life of an inflation-indexed bond, however, interest will be paid based on a principal value, which is adjusted for inflation. Any increase in the principal amount of an inflation-indexed bond will be included as interest income in the Statement of Operations, even though investors do not receive their principal until maturity.
Options Contracts. The Portfolio may write call and put options on futures, swaps, securities or currencies it owns or in which it may invest. Writing put options tends to increase the Portfolio’s exposure to the underlying instrument. Writing call options tends to decrease the Portfolio’s exposure to the underlying instrument. When the Portfolio writes a call or put option, an amount equal to the premium received is recorded as a liability and subsequently marked to market to reflect the current value of the option written. These liabilities are reflected as written options outstanding in the Statement of Assets and Liabilities. Certain options may be written with premiums to determined on a future date. The premiums for these options are based upon implied volatility parameters at specified terms. Premiums received from writing options which expire are treated as realized gains. Premiums received from writing options which are exercised or closed are added to the proceeds or offset against amounts paid on the underlying future, swap, security or currency transaction to determine the realized gain or loss. The Portfolio as a writer of an option has no control over whether the underlying future, swap, security or currency may be sold (call) or purchased (put) and as a result bears the market risk of an unfavorable change in the price of the future, swap, security or currency underlying the written option. There is the risk the Portfolio may not be able to enter into a closing transaction because of an illiquid market.
The Portfolio may also purchase put and call options. Purchasing call options tends to increase the Portfolio’s exposure to the underlying instrument. Purchasing put options tends to decrease the Portfolio’s exposure to the underlying instrument. The Portfolio pays a premium which is included in the Portfolio’s Statement of Assets and Liabilities as an investment and subsequently marked to market to reflect the current value of the option. Premiums paid for purchasing options which expire are treated as realized losses. Certain options may be purchased with premiums to be determined on a future date. The premiums for these options are based upon implied volatility parameters at specified terms. The risk associated with purchasing put and call options is limited to the premium paid. Premiums paid for purchasing options which are exercised or closed are added to the amounts paid or offset against the proceeds on the underlying future, swap, security or currency transaction to determine the realized gain or loss.
Repurchase Agreements. The Portfolio may engage in repurchase transactions. Under the terms of a typical repurchase agreement, the Portfolio takes possession of an underlying debt obligation subject to an obligation of the seller to repurchase, and the Portfolio to resell, the obligation at an agreed-upon price and time. The market value of the collateral must be equal to or exceed at all times the total amount of the repurchase obligations, including interest. Securities purchased under repurchase agreements are reflected as an asset in the Statement of Assets and Liabilities. Generally, in the event of counterparty default, the Portfolio has the right to use the collateral to offset losses incurred. If the counterparty should default, the Portfolio will seek to sell the securities which it holds as collateral. This could involve procedural costs or delays in addition to a loss on the securities if their value should fall below their repurchase price.
Mortgage-Related and Other Asset-Backed Securities. The Portfolio may invest in mortgage-related or other asset-backed securities. These securities include mortgage pass-through securities, collateralized mortgage obligations (“CMOs”), commercial mortgage-backed securities, mortgage dollar rolls, CMO residuals, stripped mortgage-backed securities (“SMBSs”) and other securities that directly or indirectly represent a participation in, or are secured by and payable from, mortgage loans on real property. The value of some mortgage- or asset-backed securities may be particularly sensitive to changes in prevailing interest rates. Early repayment of principal on some mortgage-related securities may expose a Portfolio to a lower rate of return upon reinvestment of principal. The value of these securities may fluctuate in response to the market’s perception of the creditworthiness of the issuers. Additionally, although mortgages and mortgage-related securities are generally supported by some form of government or private guarantee and/or insurance, there is no assurance that private guarantors or insurers will meet their obligations.
One type of SMBS has one class receiving all of the interest from the mortgage assets (the interest-only, or “IO” class), while the other class will receive all of the principal (the principal-only, or “PO” class). Payments received for IOs are included
| | | | | | |
| | | Semiannual Report | | June 30, 2006 | | 13 |
Notes to Financial Statements (Cont.)
in interest income in the Statement of Operations. Because principal will not be received at the maturity of an IO, adjustments are made to the book value of the security on a daily basis until maturity. These adjustments are included in interest income in the Statement of Operations. Payments received for POs are treated as reductions to the cost and par value of the securities.
Swap Agreements. The Portfolio may engage in swap transactions, including, but not limited to, swap agreements on interest rate and credit default to manage its exposure to interest rates and credit risk. In connection with these agreements, securities may be identified as collateral in accordance with the terms of the respective swap agreements.
Interest rate swap agreements involve the exchange by the Portfolio with another party of their respective commitments to pay or receive interest, e.g., an exchange of floating rate payments for fixed rate payments with respect to the notional amount of principal.
Credit default swap agreements involve one party making a stream of payments to another party in exchange for the right to receive a specified return in the event of a default by a third party, typically corporate issues or sovereign issues of an emerging country, on its obligation. The Portfolio may use credit default swaps to provide a measure of protection against defaults of the issuers (i.e., to reduce risk where the Portfolio owns or has exposure to the sovereign issuer) or to take an active long or short position with respect to the likelihood of a particular issuer’s default. As a seller of protection, the Portfolio generally receives an upfront payment or a fixed rate of income throughout the term of the swap provided that there is no credit event. If the Portfolio is a seller of protection and a credit event occurs, as defined under the terms of that particular swap agreement, the Portfolio will pay to the buyer of the protection an amount up to the notional value of the swap and in certain instances take delivery of the security. As the seller, a Portfolio would effectively add leverage to its portfolio because, in addition to its total net assets, the Portfolio would be subject to investment exposure on the notional amount of the swap. As a buyer of protection, a Portfolio generally receives an amount up to the notional value of the swap if a credit event occurs. The treatment of credit default swaps and other swap agreements that provide for contingent, non-periodic, bullet-type payments as “notional principal contracts” for federal income tax purposes is uncertain. Were the Internal Revenue Service to take the position that a credit default swap or other bullet-type swap is not a “notional principal contract” for federal income tax purposes, payments received by the Portfolio from such investments might be subject to income taxes.
Swaps are marked to market daily based upon quotations from market makers and the change in value, if any, is recorded as unrealized gain or loss in the Statement of Operations. Payments received or made at the beginning of the measurement period are reflected as such in the Statement of Assets and Liabilities. These upfront payments are recorded as realized gain or loss in the Statement of Operations upon termination or maturity of the swap. A liquidation payment received or made at the termination of the swap is recorded as realized gain or loss in the Statement of Operations. Net periodic payments received or paid by the Portfolio are included as part of realized gain or loss in the Statement of Operations. Entering into these agreements involves, to varying degrees, elements of credit, market and documentation risk in excess of the amounts recognized in the Statement of Assets and Liabilities. Such risks involve the possibility that there will be no liquid market for these agreements, that the counterparty to the agreements may default on its obligation to perform or disagree as to the meaning of contractual terms in the agreements and that there may be unfavorable changes in interest rates.
U.S. Government Agencies or Government-Sponsored Enterprises. Securities issued by U.S. Government agencies or government-sponsored enterprises may not be guaranteed by the U.S. Treasury. The Government National Mortgage Association (“GNMA”), a wholly owned U.S. Government corporation, is authorized to guarantee, with the full faith and credit of the U.S. Government, the timely payment of principal and interest on securities issued by institutions approved by GNMA and backed by pools of mortgages insured by the Federal Housing Administration or guaranteed by the Department of Veterans Affairs. Government-related guarantors (i.e., not backed by the full faith and credit of the U.S. Government) include the Federal National Mortgage Association (“FNMA” or “Fannie Mae”) and the Federal Home Loan Mortgage Corporation (“FHLMC” or “Freddie Mac”). Pass-through securities issued by FNMA are guaranteed as to timely payment of principal and interest by FNMA but are not backed by the full faith and credit of the U.S. Government. FHLMC guarantees the timely payment of interest and ultimate collection of principal, but its participation certificates are not backed by the full faith and credit of the U.S. Government.
New Accounting Policies. In July 2006, the Financial Accounting Standards Board issued Interpretation No. 48, “Accounting for Uncertainty in Income Taxes—an Interpretation of FASB Statement No. 109” (the “Interpretation”). The Interpretation is effective for fiscal years beginning after December 15, 2006. Management is currently evaluating the application of the Interpretation to the Portfolio and will provide additional information in relation to the Interpretation in the Portfolio’s annual financial statements for the year ending December 31, 2006.
3. FEES, EXPENSES, AND RELATED PARTY TRANSACTIONS
Investment Advisory Fee. PIMCO is a majority-owned subsidiary of Allianz Global Investors of America L.P. (“AGI”), and serves as investment adviser (the “Adviser”) to the Trust, pursuant to an investment advisory contract. The Adviser receives a monthly fee at an annual rate based on average daily net assets of the Portfolio. The Advisory Fee is charged at an annual rate of 0.25%.
Administration Fee. PIMCO serves as administrator (the “Administrator”), and provides administrative services to the Trust for which it receives a monthly administrative fee based on average daily net assets of the Portfolio. As the Administrator, PIMCO bears the costs of various third-party services, including audit, custodial, portfolio accounting, legal, transfer agency and printing costs. The Administration Fee is charged at the annual rate of 0.25%.
Distribution and Servicing Fees. Allianz Global Investors Distributors LLC (“AGID”) is an indirect wholly-owned subsidiary of AGI and serves as the distributor of the Trust’s shares. The Trust is permitted to reimburse AGID on a quarterly basis, out of the Administrative Class assets of the Portfolio in the amount of 0.15% on an annual basis of the average daily net assets of that class, for payments made to financial intermediaries that provide services in connection with the distribution of shares or administration of plans or programs that use Portfolio shares as their funding medium. The effective rate paid to AGID was 0.15% during the current fiscal year.
Expenses. The Trust is responsible for the following expenses: (i) salaries and other compensation of any of the Trust’s executive officers and employees who are not officers, directors, stockholders or employees of PIMCO or its subsidiaries or affiliates; (ii) taxes and governmental fees; (iii) brokerage fees and commissions and other portfolio transaction expenses; (iv) the costs of borrowing money, including interest expenses and bank overdraft charges; (v) fees and expenses of the Trustees who are not “interested persons” of PIMCO or the Trust, and any counsel retained exclusively for their benefit; (vi) extraordinary expenses, including costs of litigation and indemnification expenses; (vii) organization expenses and (viii) any expenses allocated or allocable to a specific class of shares, which include service fees payable with respect to the Administrative Class shares and may include certain other expenses as permitted by the Trust’s Multiple Class Plan adopted pursuant to Rule 18f-3 under the Act and subject to review and approval
| | | | |
| 14 | | PIMCO Variable Insurance Trust | | |
| | |
| |
| | | June 30, 2006 (Unaudited) |
by the Trustees. The ratio of expenses to average net assets per share class, as disclosed in the Financial Highlights, may differ from the annual portfolio operating expenses per share class as disclosed in the Prospectus for the reasons set forth above.
For the current period ended June 30, 2006, each unaffiliated Trustee received an annual retainer of $15,000, plus $2,000 for each Board of Trustees quarterly meeting attended, $500 for each Board of Trustees committee meeting attended and $500 for each special board meeting attended, plus reimbursement of related expenses. In addition, each Committee Chair received an additional annual retainer of $500 and each Audit Committee Chair received an additional annual retainer of $1,500. These expenses are allocated on a pro-rata basis to each Portfolio of the Trust according to its respective net assets. The Trust pays no compensation directly to any Trustee or any other officer who is affiliated with the Administrator, all of whom receive remuneration for their services to the Trust from the Administrator or its affiliates.
4. PURCHASES AND SALES OF SECURITIES
The length of time the Portfolio has held a particular security is not generally a consideration in investment decisions. A change in the securities held by the Portfolio is known as “portfolio turnover”. The Portfolio may engage in frequent and active trading of portfolio securities to achieve its investment objective, particularly during periods of volatile market movements. High portfolio turnover (e.g., over 100%) involves correspondingly greater expenses to the Portfolio, including brokerage commissions or dealer mark-ups and other transaction costs on the sale of securities and reinvestments in other securities. Such sales may also result in realization of taxable capital gains, including short-term capital gains (which are generally taxed at ordinary income tax rates). The trading costs and tax effects associated with portfolio turnover may adversely affect the Portfolio’s performance.
Purchases and sales of securities (excluding short-term investments) for the period ended June 30, 2006 were as follows (amounts in thousands):
| | | | | | | | | | | | |
| U.S Government/Agency | | | | All Other |
| Purchases | | | | Sales | | | | Purchases | | | | Sales |
| $ 27,729 | | | | $ 40,414 | | | | $ 1,232 | | | | $ 209 |
5. TRANSACTIONS IN WRITTEN CALL AND PUT OPTIONS
Transactions in written call and put options were as follows (amounts in thousands, except number of contracts):
| | | | | | | | | | | | | | | | | |
| | | | | # of
Contracts |
| | | |
| Notional
Amount
in $ |
| | | | | Premium | |
Balance at 12/31/2005 | | | | 38 | | | | | $ | 5,100 | | | | | $ | 64 | |
Sales | | | | 65 | | | | | | 4,000 | | | | | | 46 | |
Closing Buys | | | | (1 | ) | | | | | (2,000 | ) | | | | | (18 | ) |
Expirations | | | | (37 | ) | | | | | (2,100 | ) | | | | | (23 | ) |
Exercised | | | | 0 | | | | | | 0 | | | | | | 0 | |
Balance at 06/30/2006 | | | | 65 | | | | | $ | 5,000 | | | | | $ | 69 | |
6. SHARES OF BENEFICIAL INTEREST
The Portfolio may issue an unlimited number of shares of beneficial interest with a $0.001 par value. Changes in shares of beneficial interest were as follows (shares and amounts in thousands):
| | | | | | | | | | | | | | | | | | |
| | | | | Six Months Ended
06/30/2006 | | | | | Year Ended
12/31/2005 | |
| | | | | Shares | | | Amount | | | | | Shares | | | Amount | |
| | | | | | |
Receipts for shares sold | | | | | | | | | | | | | | | | | | |
Institutional Class | | | | 9 | | | $ | 87 | | | | | 0 | | | $ | 0 | |
Administrative Class | | | | 222 | | | | 2,229 | | | | | 0 | | | | 0 | |
Issued as reinvestment of distributions | | | | | | | | | | | | | | | | | | |
Institutional Class | | | | 0 | | | | 1 | | | | | 0 | | | | 1 | |
Administrative Class | | | | 71 | | | | 699 | | | | | 103 | | | | 1,050 | |
Cost of shares redeemed | | | | | | | | | | | | | | | | | | |
Institutional Class | | | | 0 | | | | (1 | ) | | | | 0 | | | | 0 | |
Administrative Class | | | | (22 | ) | | | (213 | ) | | | | (32 | ) | | | (329 | ) |
Net increase resulting from Portfolio share transactions | | | | 280 | | | $ | 2,802 | | | | | 71 | | | $ | 722 | |
The following schedule shows the number of shareholders each owning 5% or more of the Portfolio and the total percentage of the Portfolio held by such shareholders:
| | | | | | |
| | | | | Number of
Shareholders | | % of Portfolio
Held |
Institutional Class | | | | 1 | | 100 |
Administrative Class | | | | 1 | | 100 |
7. FEDERAL INCOME TAX MATTERS
As of June 30, 2006, the aggregate cost of investments was the same for federal income tax and financial statement purposes. The net unrealized appreciation (depreciation) of investment securities for federal income tax purposes is as follows (amounts in thousands):
| | | | |
Aggregate
Gross
Unrealized
Appreciation | | Aggregate
Gross
Unrealized
(Depreciation) | | Net
Unrealized
(Depreciation) |
$ 28 | | $ (657) | | $ (629) |
8. REGULATORY AND LITIGATION MATTERS
On June 1, 2004, the Attorney General of the State of New Jersey announced that it had dismissed PIMCO from a complaint filed by the New Jersey Attorney General on February 17, 2004, and that it had entered into a settlement agreement (the “New Jersey Settlement”) with Allianz Global Investors of America L.P. (“AGI”) (formerly known as Allianz Dresdner Asset Management of America L.P.), PEA Capital LLC (an entity affiliated with PIMCO through common ownership) (“PEA”) and Allianz Global Investors Distributors LLC (“AGID”), in connection with the same matter. In the New Jersey Settlement, AGI, PEA and AGID neither admitted nor denied the allegations or conclusions of law, but did agree to pay New Jersey a civil fine of $15 million and $3 million for investigative costs and further potential enforcement initiatives against unrelated parties. They also undertook to implement certain governance changes. The complaint relating to the New Jersey Settlement alleged, among other things, that AGI, PEA and AGID had failed to disclose that they improperly allowed certain hedge funds to engage in “market timing” in certain funds. The complaint sought injunctive relief, civil monetary penalties, restitution and disgorgement of profits.
Since February 2004, PIMCO, AGI, PEA, AGID, and certain of their affiliates, including the PIMCO Funds, the Allianz Funds (formerly known as PIMCO Funds: Multi-Manager Series), and the Trustees and employees of the PIMCO Funds, have been named as defendants in fifteen lawsuits filed in various jurisdictions. Eleven of those lawsuits concern “market timing,” and they have been transferred to and consolidated for pre-trial proceedings in a multi-district litigation proceeding in the
| | | | | | |
| | | Semiannual Report | | June 30, 2006 | | 15 |
Notes to Financial Statements (Cont.)
U.S. District Court for the District of Maryland; the other four lawsuits concern “revenue sharing” and have been consolidated into a single action in the U.S. District Court for the District of Connecticut. The lawsuits have been commenced as putative class actions on behalf of investors who purchased, held or redeemed shares of the various series of the PIMCO Funds and the Allianz Funds during specified periods, or as derivative actions on behalf of the PIMCO Funds and Allianz Funds.
The market timing actions in the District of Maryland generally allege that certain hedge funds were allowed to engage in “market timing” in certain of the PIMCO Funds and the Allianz Funds and this alleged activity was not disclosed. Pursuant to tolling agreements entered into with the derivative and class action plaintiffs, PIMCO, the Trustees, and certain employees of PIMCO who were previously named as defendants have all been dropped as defendants in the market timing actions; the plaintiffs continue to assert claims on behalf of the shareholders of the PIMCO Funds or on behalf of the PIMCO Funds themselves against other defendants. By order dated November 3, 2005, the U.S. District Court for the District of Maryland granted the PIMCO Funds’ motion to dismiss claims asserted against it in a consolidated amended complaint where the PIMCO Funds were named, in the complaint, as a nominal defendant. The revenue sharing action in the District of Connecticut generally alleges that fund assets were inappropriately used to pay brokers to promote the PIMCO Funds and Allianz Funds including directing fund brokerage transactions to such brokers, and that such alleged arrangements were not fully disclosed to shareholders. On August 11, 2005 the U.S. District Court for the District of Connecticut conducted a hearing on defendants’ motion to dismiss the consolidated amended complaint in the revenue sharing action but has not yet ruled on the motion to dismiss. The market timing and revenue sharing lawsuits seek, among other things, unspecified compensatory damages plus interest and, in some cases, punitive damages, the rescission of investment advisory contracts, the return of fees paid under those contracts and restitution.
Under Section 9(a) of the Investment Company Act of 1940, as amended (“1940 Act”), if the New Jersey Settlement or any of the lawsuits described above were to result in a court injunction against AGI, PEA, AGID and/or their affiliates, PIMCO could, in the absence of exemptive relief granted by the SEC, be barred from serving as an investment adviser, and AGID could be barred from serving as principal underwriter, to any registered investment company, including the Portfolios of the Trust. In connection with an inquiry from the SEC concerning the status of the New Jersey Settlement under Section 9(a), PEA, AGID, AGI and certain of their affiliates (including PIMCO) (together, the “Applicants”) have sought exemptive relief from the SEC under Section 9(c) of the 1940 Act. The SEC has granted the Applicants a temporary exemption from the provisions of Section 9(a) with respect to the New Jersey Settlement until the earlier of (i) September 13, 2006 and (ii) the date on which the SEC takes final action on their application for a permanent order. There is no assurance that the SEC will issue a permanent order.
Two nearly identical class action civil complaints have been filed in August 2005, in the Northern District of Illinois Eastern Division alleging that the plaintiffs each purchased and sold a 10-year Treasury note futures contract and suffered damages from an alleged shortage when PIMCO held both physical and futures positions in 10-year Treasury notes for its client accounts. The two actions have been consolidated into one action, and the two separate complaints have been replaced by a consolidated complaint. PIMCO is a named defendant, and the PIMCO Funds have been added as a defendant, to the consolidated action. PIMCO strongly believes the complaint (and any consolidated complaint filed hereafter) is without merit and intends to vigorously defend itself.
Certain Portfolios of the Trust were recently served in an adversary proceeding brought by the Official Committee of Asbestos Claimants of G-I Holdings, Inc. in G-I Holdings, Inc.’s bankruptcy in the District of New Jersey. PIMCO was previously named in this lawsuit and remains a defendant. The plaintiff seeks to recover for the bankruptcy estate assets that were transferred by the predecessor entity of G-I Holdings, Inc. to a wholly-owned subsidiary in 1994. The subsidiary has since issued notes, of which certain Portfolios of the Trust are alleged to be holders. The complaint alleges that in 2000, more than two hundred noteholders—including certain Portfolios of the Trust—were granted a second priority lien on the assets of the subsidiary in exchange for their consent to a refinancing transaction and the granting of a first priority lien to the lending banks. The plaintiff is seeking invalidation of the lien in favor of the noteholders and/or the value of the lien.
It is possible that these matters and/or other developments resulting from these matters could result in increased fund redemptions or other adverse consequences to the Portfolios. However, PIMCO and AGID believe that these matters are not likely to have a material adverse effect on the Portfolios or on PIMCO’s or AGID’s ability to perform their respective investment advisory or distribution services relating to the Portfolios.
| | | | |
| 16 | | PIMCO Variable Insurance Trust | | |
Investment Adviser and Administrator
Pacific Investment Management Company LLC
840 Newport Center Drive
Newport Beach, California 92660
Distributor
Allianz Global Investors Distributors LLC
2187 Atlantic Street
Stamford, Connecticut 06902
Custodian
State Street Bank & Trust Company
801 Pennsylvania
Kansas City, Missouri 64105
Transfer Agent
Boston Financial Data Services–Midwest
330 W. 9th Street
Kansas City, Missouri 64105
Legal Counsel
Dechert LLP
1775 I Street, N.W.
Washington, D.C. 20006
Independent Registered Public Accounting Firm
PricewaterhouseCoopers LLP
1055 Broadway
Kansas City, Missouri 64105
P I M C O

Share Class Institutional
Semiannual Report June 30, 2006
PIMCO Variable Insurance Trust
Total Return Portfolio II
Table of Contents
This material is authorized for use only when preceded or accompanied by the current PIMCO Variable Insurance Trust (the “Trust”) prospectus. Investors should consider the investment objectives, risks, charges and expenses of this Trust carefully before investing. Ask your financial professional to explain all charges that may apply. This and other information is contained in the Trust’s prospectus. The variable product prospectus may be obtained by contacting your Investment Consultant. Please read the Trust and variable product prospectus carefully before you invest or send money.
Chairman’s Letter
Dear PIMCO Variable Insurance Trust Shareholder:
It is our pleasure to present to you the semiannual report for the PIMCO Variable Insurance Trust covering the six-month period ended June 30, 2006.
Highlights of the global bond markets during the six-month period included:
| | n | | Most fixed-income sectors lost ground during the first half of 2006, as concern about accelerating inflation and central bank tightening pushed interest rates higher worldwide. The benchmark Lehman Brothers Aggregate Bond Index (which includes Treasury, Investment-Grade Corporate, and Residential Mortgage-Backed Securities) returned -0.72% for the first six months of the year. On June 30, the benchmark ten-year Treasury yielded 5.14%, 0.75% higher than at the start of the year. The U.S. yield curve remained flat as shorter-maturity yields rose by a comparable amount. |
| | n | | The Federal Reserve tightened four times during the reporting period, bringing the Federal Funds Rate to 5.25%. The increase near the end of the period was the Federal Reserve’s 17th consecutive rate hike since the start of its tightening cycle in 2004. The Federal Reserve was not alone, as central banks in Europe, India, and China tightened credit in unison for the first time since 2000. The Bank of Japan, whose zero-interest-rate policy has flooded global markets with liquidity, looked set to reverse this policy in the coming months. |
In these pages please find a more complete Portfolio review as it relates to financial-market activities, as well as details about total-return investment performance for the six-month reporting period. Thank you for the trust you have placed in us. We will continue to work diligently to meet your investment needs.
Sincerely,
Brent R. Harris
Chairman, PIMCO Variable Insurance Trust
July 31, 2006
| | | | | | |
| | | Semiannual Report | | June 30, 2006 | | 1 |
Important Information About the Portfolio
PIMCO Variable Insurance Trust (the “Trust”) is an open-end management investment company currently consisting of nineteen separate investment portfolios, including the Total Return Portfolio II (the “Portfolio”). The Portfolio is only available as a funding vehicle under variable life insurance policies or variable annuity contracts issued by insurance companies (“Variable Contracts”). Individuals may not purchase shares of the Portfolio directly. Shares of the Portfolio also may be sold to qualified pension and retirement plans outside of the separate account context.
We believe that bond funds have an important role to play in a well diversified investment portfolio. It is important to note, however, that in an environment where interest rates may trend upward, rising rates would negatively impact the performance of most bond funds, and fixed-income securities held by a fund are likely to decrease in value. The price volatility of fixed-income securities can also increase during periods of rising interest rates resulting in increased losses to a fund. Bond funds and individual bonds with a longer duration (a measure of the expected life of a security) tend to be more sensitive to changes in interest rates, usually making them more volatile than securities or funds with shorter durations. The longer-term performance of most bond funds has benefited from capital gains in part resulting from an extended period of declining interest rates. In the event interest rates increase, these capital gains should not be expected to recur.
The Portfolio may be subject to various risks in addition to those described above. Some of these risks may include, but are not limited to, the following: credit risk, market risk, issuer risk, liquidity risk, derivatives risk, mortgage risk, leveraging risk and management risk. A complete description of these risks is contained in the Portfolio’s prospectus. The Portfolio may use derivative instruments for hedging purposes or as part of an investment strategy. Use of these instruments may involve certain costs and risks such as liquidity risk, interest rate risk, market risk, credit risk, management risk and the risk that the Portfolio could not close out a position when it would be most advantageous to do so. A Portfolio investing in derivatives could lose more than the principal amount invested in these instruments.
On the performance summary page in this Semiannual Report, the Total Return Investment Performance table measures performance assuming that all dividend and capital gain distributions were reinvested.
An investment in the Portfolio is not a deposit of a bank and is not guaranteed or insured by the Federal Deposit Insurance Corporation or any other government agency. It is possible to lose money on investments in the Portfolio.
PIMCO has adopted written proxy voting policies and procedures (“Proxy Policy”) as required by Rule 206(4)-6 under the Investment Advisers Act of 1940. The Proxy Policy has been adopted by the Trust as the policies and procedures that PIMCO will use when voting proxies on behalf of the Portfolio. Copies of the written Proxy Policy and the factors that PIMCO may consider in determining how to vote proxies for the Portfolio, and information about how the Portfolio voted proxies relating to portfolio securities held during the most recent twelve-month period ended June 30, are available without charge, upon request, by calling the Trust at 1-866-746-2606 and on the Securities and Exchange Commission’s (“SEC”) website at http://www.sec.gov.
The Portfolio files its complete schedule of portfolio holdings with the SEC for the first and third quarters of each fiscal year on Form N-Q. A copy of the Trust’s Form N-Q is available on the SEC’s website at http://www.sec.gov and may be reviewed and copied at the SEC’s Public Reference Room in Washington D.C. Information on the operation of the Public Reference Room may be obtained by calling 1-800-SEC-0330.
PIMCO Variable Insurance Trust is distributed by Allianz Global Investors Distributors LLC, 2187 Atlantic Street, Stamford, CT 06902.
| | | | |
| 2 | | PIMCO Variable Insurance Trust | | |
The following disclosure provides important information regarding the Portfolio’s Expense Example (“Example” or “Expense Example”), which appears in this Semiannual Report. Please refer to this information when reviewing the Expense Example for the Portfolio.
Example
As a shareholder of the Portfolio, you incur two types of costs: (1) transaction costs and (2) ongoing costs, including advisory and administrative fees; distribution and/or service (12b-1) fees (Administrative Class only); and other Portfolio expenses. The Example is intended to help you understand your ongoing costs (in dollars) of investing in the Portfolio and to compare these costs with the ongoing costs of investing in other mutual funds. The Expense Example does not reflect any fees or other expenses imposed by the Variable Contracts. If it did, the expenses reflected in the Expense Examples would be higher. The Example is based on an investment of $1,000 invested at the beginning of the period and held for the entire period indicated, which is from January 1, 2006 to June 30, 2006.
Actual Expenses
The information in the table under the heading “Actual Performance” provides information about actual account values and actual expenses. You may use the information in these columns, together with the amount you invested, to estimate the expenses that you paid over the period. Simply divide your account value by $1,000 (for example, an $8,600 account value divided by $1,000 = 8.60), then multiply the result by the number in the appropriate column for your share class, in the row titled “Expenses Paid During Period” to estimate the expenses you paid on your account during this period.
Hypothetical Example for Comparison Purposes
The information in the table under the heading “Hypothetical Performance (5% return before expenses)” provides information about hypothetical account values and hypothetical expenses based on the Portfolio’s actual expense ratio and an assumed rate of return of 5% per year before expenses, which is not the Portfolio’s actual return. The hypothetical account values and expenses may not be used to estimate the actual ending account balance or expenses you paid for the period. You may use this information to compare the ongoing costs of investing in the Portfolio and other portfolios. To do so, compare this 5% hypothetical example with the 5% hypothetical examples that appear in the shareholder reports of the other portfolios.
Please note that the expenses shown in the table are meant to highlight your ongoing costs only and do not reflect any transactional costs. Therefore, the information under the heading “Hypothetical Performance (5% return before expenses)” is useful in comparing ongoing costs only, and will not help you determine the relative total costs of owning different portfolios. In addition, if these transactional costs were included, your costs would have been higher.
The expense ratio may vary period to period because of various factors, such as an increase in expenses not covered by the advisory and administrative fees (such as expenses of the trustees and their counsel or litigation expense).
Portfolio Benchmark
Lehman Brothers Aggregate Bond Index represents securities that are taxable, and dollar denominated. The index covers the U.S. investment grade fixed rate bond market, with index components for government and corporate securities, mortgage pass-through securities, and asset-backed securities. These major sectors are subdivided into more specific indices that are calculated and reported on a regular basis. It is not possible to invest directly in this index.
| | | | | | |
| | | Semiannual Report | | June 30, 2006 | | 3 |
|
|
| PIMCO Total Return Portfolio II |
|
Cumulative Returns Through June 30, 2006
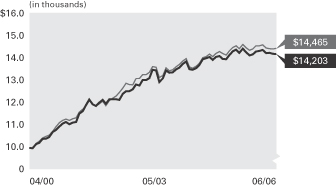
Total Return Portfolio II Lehman Brothers
Institutional Class Aggregate Bond Index
------------------------- --------------------
04/30/2000 $10,000 $10,000
05/31/2000 9,986 9,995
06/30/2000 10,167 10,203
07/31/2000 10,235 10,296
08/31/2000 10,401 10,445
09/30/2000 10,416 10,511
10/31/2000 10,492 10,580
11/30/2000 10,715 10,753
12/31/2000 10,807 10,953
01/31/2001 10,963 11,132
02/28/2001 11,093 11,229
03/31/2001 11,159 11,285
04/30/2001 11,057 11,238
05/31/2001 11,137 11,306
06/30/2001 11,156 11,349
07/31/2001 11,533 11,603
08/31/2001 11,654 11,736
09/30/2001 11,927 11,872
10/31/2001 12,173 12,121
11/30/2001 11,951 11,954
12/31/2001 11,875 11,878
01/31/2002 12,038 11,974
02/28/2002 12,158 12,090
03/31/2002 11,981 11,889
04/30/2002 12,174 12,119
05/31/2002 12,178 12,222
06/30/2002 12,176 12,328
07/31/2002 12,158 12,477
08/31/2002 12,430 12,688
09/30/2002 12,544 12,893
10/31/2002 12,546 12,834
11/30/2002 12,624 12,831
12/31/2002 12,840 13,096
01/31/2003 12,795 13,107
02/28/2003 13,039 13,288
03/31/2003 13,048 13,278
04/30/2003 13,130 13,388
05/31/2003 13,505 13,637
06/30/2003 13,471 13,610
07/31/2003 12,960 13,153
08/31/2003 13,112 13,240
09/30/2003 13,469 13,590
10/31/2003 13,370 13,464
11/30/2003 13,390 13,496
12/31/2003 13,513 13,633
01/31/2004 13,607 13,743
02/29/2004 13,765 13,892
03/31/2004 13,878 13,996
04/30/2004 13,535 13,632
05/31/2004 13,505 13,577
06/30/2004 13,571 13,654
07/31/2004 13,716 13,789
08/31/2004 13,969 14,052
09/30/2004 14,015 14,090
10/31/2004 14,077 14,208
11/30/2004 13,941 14,095
12/31/2004 14,075 14,225
01/31/2005 14,112 14,314
02/28/2005 13,995 14,230
03/31/2005 13,972 14,157
04/30/2005 14,159 14,348
05/31/2005 14,327 14,503
06/30/2005 14,400 14,582
07/31/2005 14,265 14,450
08/31/2005 14,453 14,635
09/30/2005 14,294 14,484
10/31/2005 14,147 14,370
11/30/2005 14,187 14,433
12/31/2005 14,318 14,570
01/31/2006 14,354 14,571
02/28/2006 14,391 14,619
03/31/2006 14,249 14,476
04/30/2006 14,258 14,450
05/31/2006 14,214 14,434
06/30/2006 14,203 14,465
$10,000 invested at the beginning of the first full month following the inception date of the Portfolio’s Institutional Class.
Sector Breakdown‡
| | |
U.S. Government Agencies | | 56.0% |
Short-Term Instruments | | 33.5% |
Other | | 10.5% |
| | ‡ | % of Total Investments as of June 30, 2006 |
| | | | | | | | | | | | |
| Average Annual Total Return for the period ended June 30, 2006 |
| | | | | | | 6 Months* | | 1 Year | | 5 Years | | Since Inception
(04/10/00)** |
| | |
| | PIMCO Total Return Portfolio II Institutional Class | | -0.80% | | -1.37% | | 4.94% | | 5.69% |
| | |
| | Lehman Brothers Aggregate Bond Index | | -0.72% | | -0.81% | | 4.97% | | 6.04% |
All Portfolio returns are net of fees and expenses.
* Cumulative return.
** The Institutional Class shares operations on 04/10/00. Index comparisons began on 03/31/00.
Past performance is no guarantee of future results. The performance quoted represents past performance. Investment return and principal value will fluctuate so the Portfolio shares, when redeemed, may be worth more or less than their original cost. The Portfolio’s performance does not reflect the deduction of additional charges and expenses imposed in connection with investing in Variable Contracts, which will reduce returns. Current performance may be lower or higher than the performance data quoted. Performance data current to the most recent month-end is available by calling (800) 927-4648.
| | | | | | | | |
| Expense Example | | Actual Performance | | | | Hypothetical Performance |
| | | | | | | (5% return before expenses) |
Beginning Account Value (01/01/06) | | $ | 1,000.00 | | | | $ | 1,000.00 |
Ending Account Value (06/30/06) | | $ | 992.00 | | | | $ | 1,022.32 |
Expenses Paid During Period† | | $ | 2.47 | | | | $ | 2.51 |
† Expenses are equal to the Portfolio’s Institutional Class annualized expense ratio of 0.50%, multiplied by the average account value over the period, multiplied by 181/365 (to reflect the one-half year period). Overall fees and expenses of investing in the Portfolio will be higher because the example does not reflect Variable Contract fees and expenses.
Please refer to page 3 herein for a description of the Portfolio’s benchmark and an explanation of the information presented in the above Expense Example.
Portfolio Insights
| » | | The PIMCO Total Return Portfolio II seeks to achieve its investment objective by investing under normal circumstances at least 65% of its total assets in a diversified portfolio of Fixed-Income Instruments of varying maturities. |
| » | | The Portfolio’s above-benchmark duration detracted from returns as yields rose in the first half of the year. |
| » | | An emphasis on short-term maturities detracted from performance as short-term yields rose more than longer-dated yields. The Federal Reserve continued with its tightening policy, sending short-term rates higher while intermediate- and longer-term rates shifted higher. |
| » | | An overweight to mortgages contributed to returns as this sector outperformed like-duration Treasuries. |
| » | | An underweight to corporate securities detracted from returns as this sector outperformed like-duration Treasuries. |
| » | | A tactical allocation to municipal bonds was positive for performance as municipal yields rose less than Treasury yields. |
| | | | | | |
| 4 | | PIMCO Variable Insurance Trust | | | | |
|
|
| Financial Highlights Total Return Portfolio II |
| | | | | | | | | | | | | | | | | | | | | | | | |
| Selected Per Share Data for the Year or Period Ended: | | 06/30/2006+ | | | 12/31/2005 | | | 12/31/2004 | | | 12/31/2003 | | | 12/31/2002 | | | 12/31/2001 | |
| | | | | | |
Institutional Class | | | | | | | | | | | | | | | | | | | | | | | | |
| Net asset value beginning of period | | $ | 10.04 | | | $ | 10.31 | | | $ | 10.31 | | | $ | 10.09 | | | $ | 10.12 | | | $ | 10.24 | |
| Net investment income (a) | | | 0.23 | | | | 0.35 | | | | 0.18 | | | | 0.16 | | | | 0.41 | | | | 0.50 | |
| Net realized/unrealized gain (loss) on investments (a) | | | (0.31 | ) | | | (0.18 | ) | | | 0.25 | | | | 0.36 | | | | 0.39 | | | | 0.49 | |
| Total income (loss) from investment operations | | | (0.08 | ) | | | 0.17 | | | | 0.43 | | | | 0.52 | | | | 0.80 | | | | 0.99 | |
| Dividends from net investment income | | | (0.23 | ) | | | (0.36 | ) | | | (0.19 | ) | | | (0.21 | ) | | | (0.41 | ) | | | (0.50 | ) |
| Distributions from net realized capital gains | | | 0.00 | | | | (0.08 | ) | | | (0.24 | ) | | | (0.09 | ) | | | (0.42 | ) | | | (0.61 | ) |
| Total distributions | | | (0.23 | ) | | | (0.44 | ) | | | (0.43 | ) | | | (0.30 | ) | | | (0.83 | ) | | | (1.11 | ) |
| Net asset value end of period | | $ | 9.73 | | | $ | 10.04 | | | $ | 10.31 | | | $ | 10.31 | | | $ | 10.09 | | | $ | 10.12 | |
| Total return | | | (0.80 | )% | | | 1.72 | % | | | 4.16 | % | | | 5.24 | % | | | 8.13 | % | | | 9.88 | % |
| Net assets end of period (000s) | | $ | 103 | | | $ | 17 | | | $ | 17 | | | $ | 16 | | | $ | 1,217 | | | $ | 3,845 | |
| Ratio of expenses to average net assets | | | 0.50 | %* | | | 0.50 | % | | | 0.50 | % | | | 0.50 | % | | | 0.51 | %(c) | | | 0.50 | %(b) |
| Ratio of net investment income to average net assets | | | 4.73 | %* | | | 3.46 | % | | | 1.70 | % | | | 1.56 | % | | | 3.97 | % | | | 4.70 | % |
| Portfolio turnover rate | | | 168 | % | | | 508 | % | | | 305 | % | | | 863 | % | | | 418 | % | | | 606 | % |
+ Unaudited
* Annualized
(a) Per share amounts based on average number of shares outstanding during the period.
(b) If the investment manager had not reimbursed expenses, the ratio of expenses to average net assets would have been 0.51%.
(c) Ratio of expenses to average net assets excluding interest expense is 0.50%.
| | | | | | |
| See Accompanying Notes | | Semiannual Report | | June 30, 2006 | | 5 |
| | |
| |
| Statement of Assets and Liabilities Total Return Portfolio II | | |
| | | | |
| (Amounts in thousands, except per share amounts) | | June 30, 2006
(Unaudited) | |
| |
Assets: | | | | |
Investments, at value | | $ | 27,923 | |
Repurchase agreement, at value | | | 3,275 | |
Receivable for investments sold | | | 12 | |
Interest and dividends receivable | | | 93 | |
Variation margin receivable | | | 17 | |
Unrealized appreciation on swap agreements | | | 3 | |
| | | | 31,323 | |
| |
Liabilities: | | | | |
Payable for investments purchased | | $ | 4,297 | |
Payable for Portfolio shares redeemed | | | 20 | |
Written options outstanding | | | 85 | |
Accrued investment advisory fee | | | 6 | |
Accrued administration fee | | | 6 | |
Accrued servicing fee | | | 3 | |
Variation margin payable | | | 1 | |
Swap premiums received | | | 8 | |
Unrealized depreciation on swap agreements | | | 3 | |
| | | | 4,429 | |
| |
Net Assets | | $ | 26,894 | |
| |
Net Assets Consist of: | | | | |
Paid in capital | | $ | 28,092 | |
Undistributed net investment income | | | 134 | |
Accumulated undistributed net realized (loss) | | | (445 | ) |
Net unrealized (depreciation) | | | (887 | ) |
| | | $ | 26,894 | |
| |
Net Assets: | | | | |
Institutional Class | | $ | 103 | |
Administrative Class | | | 26,791 | |
| |
Shares Issued and Outstanding: | | | | |
Institutional Class | | | 11 | |
Administrative Class | | | 2,753 | |
| |
Net Asset Value and Redemption Price Per Share (Net Assets Per Share Outstanding) | | | | |
Institutional Class | | $ | 9.73 | |
Administrative Class | | | 9.73 | |
| |
Cost of Investments Owned | | $ | 28,552 | |
Cost of Repurchase Agreements Owned | | $ | 3,275 | |
Premiums Received on Written Options | | $ | 69 | |
| | | | |
| 6 | | PIMCO Variable Insurance Trust | | See Accompanying Notes |
| | |
| |
| Statement of Operations Total Return Portfolio II | | |
| | | | |
| (Amounts in Thousands) | | Six Months Ended
June 30, 2006
(Unaudited) | |
| |
Investment Income: | | | | |
Interest | | $ | 667 | |
Dividends | | | 4 | |
Total Income | | | 671 | |
| |
Expenses: | | | | |
Investment advisory fees | | | 33 | |
Administration fees | | | 33 | |
Servicing fees – Administrative Class | | | 20 | |
Total Expenses | | | 86 | |
| |
Net Investment Income | | | 585 | |
| |
Net Realized and Unrealized Gain (Loss): | | | | |
Net realized (loss) on investments | | | (154 | ) |
Net realized (loss) on futures contracts, options and swaps | | | (5 | ) |
Net change in unrealized (depreciation) on investments | | | (407 | ) |
Net change in unrealized (depreciation) on futures contracts, options and swaps | | | (264 | ) |
Net (Loss) | | | (830 | ) |
| |
Net (Decrease) in Net Assets Resulting from Operations | | $ | (245 | ) |
| | | | | | |
| See Accompanying Notes | | Semiannual Report | | June 30, 2006 | | 7 |
| | |
| |
| Statements of Changes in Net Assets Total Return Portfolio II | | |
| | | | | | | | |
| (Amounts in Thousands) | | Six Months Ended
June 30, 2006
(Unaudited) | | | Year Ended
December 31, 2005 | |
| | |
Increase (Decrease) in Net Assets from: | | | | | | | | |
| | |
Operations: | | | | | | | | |
Net investment income | | $ | 585 | | | $ | 824 | |
Net realized (loss) | | | (159 | ) | | | (110 | ) |
Net change in unrealized (depreciation) | | | (671 | ) | | | (306 | ) |
Net increase (decrease) resulting from operations | | | (245 | ) | | | 408 | |
| | |
Distributions to Shareholders: | | | | | | | | |
| From net investment income | | | | | | | | |
Institutional Class | | | (1 | ) | | | (1 | ) |
Administrative Class | | | (601 | ) | | | (850 | ) |
| From net realized capital gains | | | | | | | | |
Institutional Class | | | 0 | | | | 0 | |
Administrative Class | | | 0 | | | | (200 | ) |
| | |
Total Distributions | | | (602 | ) | | | (1,051 | ) |
| | |
Portfolio Share Transactions: | | | | | | | | |
| Receipts for shares sold | | | | | | | | |
Institutional Class | | | 87 | | | | 0 | |
Administrative Class | | | 2,229 | | | | 0 | |
| Issued as reinvestment of distributions | | | | | | | | |
Institutional Class | | | 1 | | | | 1 | |
Administrative Class | | | 699 | | | | 1,050 | |
| Cost of shares redeemed | | | | | | | | |
Institutional Class | | | (1 | ) | | | 0 | |
Administrative Class | | | (213 | ) | | | (329 | ) |
Net increase resulting from Portfolio share transactions | | | 2,802 | | | | 722 | |
| | |
Total Increase in Net Assets | | | 1,955 | | | | 79 | |
| | |
Net Assets: | | | | | | | | |
Beginning of period | | | 24,939 | | | | 24,860 | |
End of period* | | $ | 26,894 | | | $ | 24,939 | |
| | |
*Including undistributed net investment income of: | | $ | 134 | | | $ | 151 | |
| | | | |
| 8 | | PIMCO Variable Insurance Trust | | See Accompanying Notes |
| | |
| |
| Schedule of Investments Total Return Portfolio II | | June 30, 2006 (Unaudited) |
| | | | | | | | |
| | | | | PRINCIPAL | | | | |
| | | | | AMOUNT | | | | VALUE |
| | | | | (000S) | | | | (000S) |
| | | | | | | | | |
| CORPORATE BONDS & NOTES 5.5% |
| |
| BANKING & FINANCE 4.9% | | | | |
| American General Finance Corp. | | | | |
5.489% due 03/23/2007 | | $ | | 100 | | $ | | 100 |
|
| Bank of America Corp. | | | | | | | | |
5.406% due 06/19/2009 | | | | 300 | | | | 300 |
|
| CIT Group Holdings, Inc. | | | | | | | | |
5.276% due 01/30/2009 | | | | 100 | | | | 100 |
|
| Citigroup Global Markets Holdings, Inc. | | |
5.276% due 03/07/2008 | | | | 100 | | | | 100 |
|
| Citigroup, Inc. | | | | | | | | |
5.422% due 06/09/2009 | | | | 200 | | | | 201 |
|
| Goldman Sachs Group, Inc. | | | | | | | | |
5.063% due 08/01/2006 | | | | 100 | | | | 100 |
5.226% due 07/29/2008 | | | | 200 | | | | 200 |
|
| Morgan Stanley | | | | | | | | |
5.193% due 01/18/2008 | | | | 100 | | | | 100 |
|
| UBS Preferred Funding Trust I | | | | | | | | |
8.622% due 10/29/2049 | | | | 100 | | | | 110 |
| | | | | | | | |
|
| | | | | | | | | 1,311 |
| | | | | | | | |
|
| |
| INDUSTRIALS 0.2% | | | | |
| El Paso Corp. | | | | | | | | |
6.750% due 05/15/2009 | | | | 50 | | | | 50 |
| |
| UTILITIES 0.4% | | | | |
| AT&T, Inc. | | | | | | | | |
4.389% due 06/05/2021 | | | | 100 | | | | 99 |
|
| MidAmerican Energy Holdings Co. |
6.125% due 04/01/2036 | | | | 30 | | | | 28 |
| | | | | | | | |
|
| | | | | | | | | 127 |
| | | | | | | | |
|
Total Corporate Bonds & Notes
(Cost $1,478) | | | | 1,488 |
| | | | | | | | |
|
| | | | | | | |
| MUNICIPAL BONDS & NOTES 1.9% |
| New Jersey State Tobacco Settlement Financing Corporations Revenue Bonds, Series 2003 |
6.750% due 06/01/2039 | | | | 100 | | | | 111 |
|
| New Jersey State Tobacco Settlement Financing Corporations Revenue Notes, Series 2003 |
4.375% due 06/01/2019 | | | | 45 | | | | 45 |
|
| New York City, New York Municipal Water Finance Authority Revenue Notes, Series 2005 |
5.000% due 06/15/2031 | | | | 200 | | | | 204 |
|
| New York State Environmental Facilities Corporations Revenue Notes, Series 2002 |
5.980% due 06/15/2023 | | | | 25 | | | | 27 |
|
| Texas State Eagle Mountain & Saginaw Independent School District General Obligation, (PSF Insured), Series 2005 |
4.750% due 08/15/2033 | | | | 120 | | | | 118 |
| | | | | | | | |
|
Total Municipal Bonds & Notes
(Cost $491) | | 505 |
| | | | | | | | |
|
| | | | | | | |
| U.S. GOVERNMENT AGENCIES 65.0% |
| Fannie Mae | | | | | | | | |
4.810% due 09/22/2006 | | | | 100 | | | | 100 |
5.000% due 06/01/2018 - 04/25/2033 (b) | | | | 7,300 | | | | 7,038 |
5.249% due 04/26/2035 | | | | 4 | | | | 5 |
5.442% due 03/25/2034 | | | | 32 | | | | 32 |
5.500% due 10/01/2017 - 07/13/2036 (b) | | | | 8,804 | | | | 8,470 |
5.695% due 09/01/2034 | | | | 33 | | | | 33 |
| | | | | | | | |
5.736% due 12/01/2036 | | $ | | 34 | | $ | | 34 |
6.000% due 07/01/2016 - 07/13/2036 (b) | | | | 1,086 | | | | 1,070 |
|
| Freddie Mac | | | | | | | | |
4.500% due 10/15/2022 | | | | 247 | | | | 243 |
5.000% due 10/01/2018 | | | | 63 | | | | 61 |
5.500% due 08/15/2030 | | | | 2 | | | | 2 |
5.682% due 10/25/2029 | | | | 67 | | | | 67 |
5.732% due 07/01/2027 | | | | 3 | | | | 3 |
5.951% due 01/01/2028 | | | | 3 | | | | 4 |
6.000% due 09/01/2016 | | | | 10 | �� | | | 10 |
|
| Government National Mortgage Association |
4.375% due 02/20/2027 - 05/20/2030 (b) | | | | 23 | | | | 23 |
5.767% due 09/20/2030 | | | | 3 | | | | 3 |
|
| Small Business Administration Participation Certificates |
4.750% due 07/01/2025 | | | | 295 | | | | 275 |
| | | | | | | | |
|
Total U.S. Government Agencies (Cost $18,077) | | | | 17,473 |
| | | | | | | | |
|
| | | | | | | |
| U.S. TREASURY OBLIGATIONS 1.4% |
| Treasury Inflation Protected Securities (a) |
3.375% due 01/15/2007 (d) | | | | 127 | | | | 127 |
2.000% due 01/15/2026 | | | | 122 | | | | 112 |
3.625% due 04/15/2028 | | | | 125 | | | | 148 |
| | | | | | | | |
|
Total U.S. Treasury Obligations (Cost $405) | | | | 387 |
| | | | | | | | |
|
| | | | | | | | |
| MORTGAGE-BACKED SECURITIES 2.7% |
| American Home Mortgage Investment Trust |
4.390% due 02/25/2045 | | | | 64 | | | | 62 |
|
| Banc of America Funding Corp. |
4.115% due 05/25/2035 | | | | 85 | | | | 81 |
|
| Banc of America Mortgage Securities |
6.500% due 10/25/2031 | | | | 25 | | | | 25 |
6.500% due 02/25/2033 | | | | 5 | | | | 5 |
|
| Bear Stearns Adjustable Rate Mortgage Trust |
5.067% due 03/25/2033 | | | | 17 | | | | 17 |
4.679% due 12/25/2033 | | | | 35 | | | | 35 |
|
| Bear Stearns Alt-A Trust |
5.415% due 05/25/2035 | | | | 71 | | | | 70 |
|
| Countrywide Home Loan Mortgage Pass-Through Trust |
5.612% due 04/25/2035 | | | | 63 | | | | 63 |
|
| CS First Boston Mortgage Securities Corp. |
6.056% due 06/25/2032 | | | | 1 | | | | 1 |
6.489% due 06/25/2032 | | | | 5 | | | | 5 |
5.509% due 08/25/2033 | | | | 4 | | | | 4 |
|
| GSR Mortgage Loan Trust |
6.000% due 03/25/2032 | | | | 3 | | | | 3 |
|
| Impac CMB Trust |
5.722% due 07/25/2033 | | | | 35 | | | | 35 |
5.572% due 01/25/2034 | | | | 21 | | | | 21 |
|
| Mastr Adjustable Rate Mortgages Trust |
3.786% due 12/21/2034 | | | | 24 | | | | 24 |
|
| MASTR Asset Securitization Trust |
5.500% due 09/25/2033 | | | | 42 | | | | 40 |
|
| MLCC Mortgage Investors, Inc. |
5.812% due 01/25/2029 | | | | 32 | | | | 32 |
|
| Prime Mortgage Trust |
5.722% due 02/25/2034 | | | | 29 | | | | 29 |
|
| Structured Asset Mortgage Investments, Inc. |
5.582% due 09/19/2032 | | | | 3 | | | | 3 |
|
| Structured Asset Securities Corp. |
6.150% due 07/25/2032 | | | | 1 | | | | 1 |
| | | | | | | | |
| Washington Mutual, Inc. |
5.009% due 02/27/2034 | | $ | | 21 | | $ | | 21 |
5.410% due 08/25/2042 | | | | 64 | | | | 64 |
|
| Wells Fargo Mortgage-Backed Securities Trust |
4.950% due 03/25/2036 | | | | 96 | | | | 95 |
| | | | | | | | |
|
Total Mortgage-Backed Securities (Cost $746) | | | | 736 |
| | | | | | | | |
|
| |
| ASSET-BACKED SECURITIES 0.1% |
| AAA Trust | | | | | | | | |
5.422% due 04/25/2035 | | | | 7 | | | | 7 |
|
| Amortizing Residential Collateral Trust |
5.592% due 06/25/2032 | | | | 4 | | | | 4 |
|
| Carrington Mortgage Loan Trust | | | | |
5.402% due 06/25/2035 | | | | 5 | | | | 5 |
|
| CIT Group Home Equity Loan Trust | | | | |
5.593% due 06/25/2033 | | | | 2 | | | | 2 |
|
| CS First Boston Mortgage Securities Corp. |
5.632% due 01/25/2032 | | | | 6 | | | | 7 |
|
| Equity One ABS, Inc. | | | | | | | | |
5.602% due 11/25/2032 | | | | 9 | | | | 9 |
| | | | | | | | |
|
Total Asset-Backed Securities
(Cost $34) | | | | 34 |
| | | | | | | | |
|
| |
| | | | | NOTIONAL
AMOUNT
(000S) | | | | |
| PURCHASED CALL OPTIONS 0.1% |
| 2-Year Interest Rate Swap (OTC) Pay 3-Month USD-LIBOR Floating Rate Index |
Strike @ 4.750%
Exp. 08/07/2006 | | | | 2,000 | | | | 0 |
Strike @ 5.080%
Exp. 04/19/2007 | | | | 2,300 | | | | 3 |
Strike @ 5.130%
Exp. 10/25/2006 | | | | 2,000 | | | | 1 |
Strike @ 5.200%
Exp. 05/23/2007 | | | | 1,000 | | | | 2 |
Strike @ 5.250%
Exp. 06/07/2007 | | | | 2,000 | | | | 6 |
| | | | | | | | |
|
Total Purchased Call Options (Cost $31) | | | | | | | | 12 |
| | | | | | | | |
|
| |
| | | | | | | | |
| | | | | #OF
CONTRACTS | | | | |
| PURCHASED PUT OPTIONS 0.0% |
| 90-Day Eurodollar December Futures (CME) |
Strike @ $92.000
Exp. 12/18/2006 | | | | 24 | | | | 0 |
Strike @ $92.500
Exp. 12/18/2006 | | | | 16 | | | | 0 |
|
| 90-Day Eurodollar June Futures (CME) |
Strike @ $91.250
Exp. 06/18/2007 | | | | 90 | | | | 1 |
|
| 90-Day Eurodollar March Futures (CME) |
Strike @ $92.000
Exp. 03/19/2007 | | | | 19 | | | | 0 |
Strike @ $92.250
Exp. 03/19/2007 | | | | 1 | | | | 0 |
|
| 90-Day Eurodollar September Futures (CME) |
Strike @ $94.000
Exp. 09/18/2006 | | | | 10 | | | | 0 |
| | | | | | | | |
|
Total Purchased Put Options (Cost $2) | | | | 1 |
| | | | | | | | |
|
| | | | | | |
| See Accompanying Notes | | Semiannual Report | | June 30, 2006 | | 9 |
| | |
| |
| Schedule of Investments Total Return Portfolio II (Cont.) | | |
| | | | | | | | |
| | | | | PRINCIPAL | | | | |
| | | | | AMOUNT | | | | VALUE |
| | | | | (000S) | | | | (000S) |
| | | | | | | | | |
| PREFERRED STOCK 0.4% |
| DG Funding Trust | | | | | | | | |
7.210% due 12/31/2049 | | | | 11 | | $ | | 116 |
| | | | | | | | |
|
Total Preferred Stock (Cost $116) | | | | 116 |
| | | | | | | | |
|
| | | | | | | |
| | | | | PRINCIPAL
AMOUNT
(000S) | | | | |
| SHORT-TERM INSTRUMENTS 38.9% |
| |
| CERTIFICATE OF DEPOSIT 3.0% | | | | |
| Wells Fargo Bank N.A. | | | | | | | | |
5.280% due 07/11/2006 | | $ | | 800 | | | | 800 |
| |
| COMMERCIAL PAPER 22.9% | | | | |
| Fannie Mae | | | | | | | | |
4.809% due 07/05/2006 | | | | 700 | | | | 700 |
|
| Federal Home Loan Bank | | | | | | | | |
5.234% due 08/30/2006 | | | | 3,200 | | | | 3,173 |
|
| Freddie Mac | | | | | | | | |
4.625% due 08/01/2006 | | | | 700 | | | | 697 |
4.792% due 08/01/2006 | | | | 700 | | | | 697 |
5.220% due 09/05/2006 | | | | 900 | | | | 891 |
| | | | | | | | |
|
| | | | | | | | | 6,158 |
| | | | | | | | |
|
| | | | | | | | |
| REPURCHASE AGREEMENTS 12.2% |
| Credit Suisse First Boston | | | | | | | | |
4.580% due 07/03/2006 | | $ | | 2,000 | | $ | | 2,000 |
(Dated 06/30/2006. Collateralized by U.S. Treasury Notes 4.000% due 06/15/2009 valued at $2,056. Repurchase proceeds are $2,001.) |
4.600% due 07/03/2006 | | | | 1,100 | | | | 1,100 |
(Dated 06/30/2006. Collateralized by U.S. Treasury Notes 3.250% due 08/15/2007 valued at $1,124. Repurchase proceeds are $1,100.) |
|
| State Street Bank | | | | | | | | |
4.900% due 07/03/2006 | | 175 | | | | 175 |
(Dated 06/30/2006. Collateralized by Federal Home Loan Bank 3.375% due 02/23/2007 valued at $180. Repurchase proceeds are $175.) |
| | | | | | | | |
|
| | | | | | | | | 3,275 |
| | | | | | | | |
|
| |
| U.S. TREASURY BILLS 0.8% | | | | |
4.788% due 08/31/2006-09/14/2006 (b)(d) | | | | 215 | | | | 213 |
| | | | | | | | |
|
Total Short-Term Instruments
(Cost $10,447) | | | | 10,446 |
| | | | | | | | |
|
| |
Total Investments (c) 116.0%
(Cost $31,827) | | $ | | 31,198 |
| |
Written Options (f) (0.3%)
(Premiums $69) | | | | (85) |
| |
| Other Assets and Liabilities (Net) (15.7%) | | (4,219) |
| | | | | | | | |
|
| Net Assets 100.0% | | $ | | 26,894 |
| | | | | | | | |
|
|
| Notes to Schedule of Investments (amounts in thousands, except number of contracts): |
| |
(a) Principal amount of security is adjusted for inflation. |
| |
(b) Securities are grouped by coupon or range of coupons and represent a range of maturities. |
| |
(c) As of June 30, 2006, portfolio securities with an aggregate market value of $4 were valued in good faith and pursuant to guidelines established by the Board of Trustees. |
| |
(d) Securities with an aggregate market value of $340 have been segregated with the custodian to cover margin requirements for the following open futures contracts on June 30, 2006: |
| | | | | | | | | | |
| Description | | Type | | Expiration
Month | | # of
Contracts | | Unrealized
(Depreciation) | |
90-Day Eurodollar December Futures | | Long | | 12/2006 | | 47 | | $ | (68 | ) |
90-Day Eurodollar December Futures | | Long | | 12/2007 | | 9 | | | (10 | ) |
90-Day Eurodollar June Futures | | Long | | 06/2007 | | 25 | | | (45 | ) |
90-Day Eurodollar March Futures | | Long | | 03/2007 | | 37 | | | (72 | ) |
90-Day Eurodollar March Futures | | Long | | 03/2008 | | 4 | | | (3 | ) |
90-Day Eurodollar September Futures | | Long | | 09/2006 | | 21 | | | (16 | ) |
90-Day Eurodollar September Futures | | Long | | 09/2007 | | 17 | | | (27 | ) |
U.S. Treasury 5-Year Note September Futures | | Long | | 09/2006 | | 2 | | | (2 | ) |
| | | | | | | | |
|
|
|
| | | | | | | | | $ | (243 | ) |
| | | | | | | | |
|
|
|
| | | | | | | | | | | | | | | |
(e) Swap agreements outstanding on June 30, 2006: | |
| Interest Rate Swaps | | | | | | | | | | | | | | | |
| Counterparty | | Floating Rate Index | | Pay/Receive
Floating Rate | | Fixed Rate | | Expiration
Date | | Notional
Amount | | Unrealized
(Depreciation) | |
Barclays Bank PLC | | 3-month USD-LIBOR | | Pay | | 5.000% | | 12/20/2008 | | $ | 800 | | $ | (1 | ) |
| | | | | | | | | | | | | |
|
|
|
| | | | |
| 10 | | PIMCO Variable Insurance Trust | | See Accompanying Notes |
| | |
| |
| | | June 30, 2006 (Unaudited) |
| | | | | | | | | | | | | | | | |
| Credit Default Swaps | | | | | | | | | | | | | | | | |
| Counterparty | | Reference Entity | | Buy/Sell
Protection+ | | (Pay)/Receive
Fixed Rate | | | Expiration
Date | | Notional
Amount | | Unrealized
Appreciation/
(Depreciation) | |
Bank of America | | Ford Motor Corp. 7.450% due 07/16/2031 | | Sell | | 4.150% | | | 06/20/2007 | | $ | 200 | | $ | (1 | ) |
Bear Stearns & Co., Inc. | | Ford Motor Credit Co. 7.000% due 10/01/2013 | | Sell | | 1.350% | | | 09/20/2006 | | | 100 | | | 0 | |
Goldman Sachs & Co. | | Dow Jones CDX N.A. HV5 Index | | Buy | | (0.850% | ) | | 12/20/2010 | | | 200 | | | (1 | ) |
Morgan Stanley Dean Witter & Co. | | Ford Motor Credit Co. 7.000% due 10/01/2013 | | Sell | | 5.200% | | | 12/20/2006 | | | 100 | | | 2 | |
UBS Warburg LLC | | Ford Motor Credit Co. 7.000% due 10/01/2013 | | Sell | | 4.750% | | | 12/20/2006 | | | 100 | | | 1 | |
| | | | | | | | | | | | | | |
|
|
|
| | | | | | | | | | | | | | | $ | 1 | |
| | | | | | | | | | | | | | |
|
|
|
|
| + If the Portfolio is a seller of protection and a credit event occurs, as defined under the terms of that particular swap agreement, the Portfolio will Pay to the buyer of the protection an amount up to the notional value of the swap and in certain instances, take delivery of the security. As a buyer of protection, the Portfolio will generally receive from the seller of protection an amount up to the notional amount of the swap if a credit event occurs. | |
| | | | | | | | | | | | |
(f) Written options outstanding on June 30, 2006: | | | | | | | | | | |
| Options on Exchange-Traded Futures Contracts | | | | | | | | | | | | |
| Description | | Exercise
Price | | Expiration
Date | | # of
Contracts | | Premium | | Value |
Call - CBOT U.S. Treasury 10-Year Note September Futures | | $ 108.000 | | 08/25/2006 | | 15 | | $ | 2 | | $ | 0 |
Call - CBOT U.S. Treasury 10-Year Note September Futures | | 106.000 | | 08/25/2006 | | 2 | | | 1 | | | 1 |
Put - CBOT U.S. Treasury 10-Year Note September Futures | | 103.000 | | 08/25/2006 | | 17 | | | 3 | | | 2 |
Call - CME 90-Day Eurodollar September Futures | | 95.500 | | 09/18/2006 | | 1 | | | 0 | | | 0 |
Put - CME 90-Day Eurodollar September Futures | | 95.250 | | 09/18/2006 | | 3 | | | 2 | | | 6 |
Put - CME 90-Day Eurodollar December Futures | | 95.000 | | 12/18/2006 | | 3 | | | 2 | | | 5 |
Put - CME 90-Day Eurodollar December Futures | | 95.250 | | 12/18/2006 | | 21 | | | 16 | | | 44 |
Put - CME 90-Day Eurodollar December Futures | | 95.500 | | 12/18/2006 | | 3 | | | 3 | | | 8 |
| | | | | | | | |
|
| |
|
|
| | | | | | | | | $ | 29 | | $ | 66 |
| | | | | | | | |
|
| |
|
|
| | | | | | | | | | | | | | | | | | | |
| Interest Rate Swaptions | | | | | | | | | | | | | |
| Description | | Counterparty | | Floating
Rate Index | | Pay/Receive
Floating Rate | | Exercise
Rate | | Expiration
Date | | Notional
Amount | | Premium | | Value |
Call - OTC 5-Year Interest Rate Swap | | Goldman Sachs & Co. | | 3-month USD-LIBOR | | Receive | | 4.780% | | 08/07/06 | | $ | 1,000 | | $ | 8 | | $ | 0 |
Call - OTC 5-Year Interest Rate Swap | | Bear Stearns & Co., Inc. | | 3-month USD-LIBOR | | Receive | | 5.210% | | 10/25/06 | | | 1,000 | | | 4 | | | 2 |
Call - OTC 5-Year Interest Rate Swap | | Royal Bank of Scotland PLC | | 3-month USD-LIBOR | | Receive | | 5.220% | | 04/19/07 | | | 1,000 | | | 8 | | | 4 |
Call - OTC 5-Year Interest Rate Swap | | Royal Bank of Scotland PLC | | 3-month USD-LIBOR | | Receive | | 5.300% | | 05/23/07 | | | 1,000 | | | 10 | | | 6 |
Call - OTC 5-Year Interest Rate Swap | | Royal Bank of Scotland PLC | | 3-month USD-LIBOR | | Receive | | 5.340% | | 06/07/07 | | | 1,000 | | | 10 | | | 7 |
| | | | | | | | | | | | | | | |
|
| |
|
|
| | | | | | | | | | | | | | | | $ | 40 | | $ | 19 |
| | | | | | | | | | | | | | | |
|
| |
|
|
| | | | | | |
| See Accompanying Notes | | Semiannual Report | | June 30, 2006 | | 11 |
Notes to Financial Statements
1. ORGANIZATION
The Total Return Portfolio II (the “Portfolio”) is a series of the PIMCO Variable Insurance Trust (the “Trust”). The Trust is registered under the Investment Company Act of 1940 (the “Act”), as amended, as an open-end investment management company organized as a Delaware business trust on October 3, 1997. The Portfolio offers two classes of shares: Institutional and Administrative. Information presented in these financial statements pertains to the Institutional Class of the Portfolio. Certain detailed financial information for the Administrative Class is provided separately and is available upon request. The Trust is designed to be used as an investment vehicle by Separate Accounts of insurance companies that fund variable annuity contracts and variable life insurance policies and by qualified pension and retirement plans.
2. SIGNIFICANT ACCOUNTING POLICIES
The following is a summary of significant accounting policies consistently followed by the Portfolio in the preparation of its financial statements in conformity with accounting principles generally accepted in the United States of America (“GAAP”). The preparation of financial statements in accordance with GAAP requires management to make estimates and assumptions that affect the reported amounts and disclosures in the financial statements. Actual results could differ from those estimates.
Security Valuation. Portfolio securities are valued as of the close of regular trading (normally 4:00 p.m., Eastern Time) on each day that the New York Stock Exchange (“NYSE”) is open. Portfolio securities and other assets for which market quotes are readily available are stated at market value. Market value is generally determined on the basis of last reported sales prices, or if no sales are reported, based on quotes obtained from a quotation reporting system, established market makers, or pricing services. Fixed-income securities and non-exchange traded derivatives are normally valued on the basis of quotes obtained from brokers and dealers or pricing services. Prices obtained from independent pricing services use information provided by market makers or estimates of market values obtained from yield data relating to investments or securities with similar characteristics. Certain fixed-income securities purchased on a delayed-delivery basis are marked to market daily until settlement at the forward settlement date. Short-term investments having a maturity of 60 days or less are generally valued at amortized cost. Exchange traded options, futures and options on futures are valued at the settlement price determined by the relevant exchange.
Investments initially valued in currencies other than the U.S. dollar are converted to the U.S. dollar using exchange rates obtained from pricing services. As a result, the NAV of the Portfolio’s shares may be affected by changes in the value of currencies in relation to the U.S. dollar. The value of securities traded in markets outside the United States or denominated in currencies other than the U.S. dollar may be affected significantly on a day that the NYSE is closed and an investor is not able to purchase, redeem or exchange shares.
Securities and other assets for which market quotes are not readily available are valued at fair value as determined in good faith by the Board of Trustees or persons acting at their direction. The Board of Trustees has adopted methods for valuing securities and other assets in circumstances where market quotes are not readily available, and has delegated to Pacific Investment Management Company LLC (“PIMCO”) the responsibility for applying the valuation methods. In the event that market quotes are not readily available, and the security or asset cannot be valued pursuant to one of the valuation methods, the value of the security or asset will be determined in good faith by the Valuation Committee of the Board of Trustees, generally based upon recommendations provided by PIMCO.
Market quotes are considered not readily available in circumstances where there is an absence of current or reliable market-based data (e.g., trade information, bid/asked information, broker quotes), including where events occur after the close of the relevant market, but prior to the close of regular trading, that materially affect the values of the Portfolio’s securities or assets. In addition, market quotes are considered not readily available when, due to extraordinary circumstances, the exchanges or markets on which the securities trade do not open for trading for the entire day and no other market prices are available. The Board has delegated to PIMCO the responsibility for monitoring significant events that may materially affect the values of the Portfolio’s securities or assets and for determining whether the value of the applicable securities or assets should be re-evaluated in light of such significant events. When the Portfolio uses fair value pricing to determine its NAV, securities will not be priced on the basis of quotations from the primary market in which they are traded, but rather may be priced by another method that the Board of Trustees or persons acting at their direction believe accurately reflects fair value. The Trust’s policy is intended to result in a calculation of the Portfolio’s NAV that fairly reflects security values as of the time of pricing. However, fair values determined by the Board of Trustees or persons acting at their direction may not accurately reflect the price that the Portfolio could obtain for a security if it were to dispose of that security as of the time of pricing. Because foreign securities can trade on non-business days, the NAV of the Portfolio may change on days when shareholders will not be able to purchase or redeem shares. The prices used by the Portfolio may differ from the value that would be realized if the securities were sold and the differences could be material to the financial statements.
Securities Transactions and Investment Income. Securities transactions are recorded as of the trade date. Securities purchased or sold on a when-issued or delayed-delivery basis may be settled a month or more after the trade date. Realized gains and losses from securities sold are recorded on the identified cost basis. Dividend income is recorded on the ex-dividend date, except certain dividends from foreign securities where the ex-dividend date may have passed, which are recorded as soon as the Portfolio is informed of the ex-dividend date. Interest income, adjusted for the accretion of discounts and amortization of premiums, is recorded on the accrual basis. Paydown gains and losses on mortgage-related or asset-backed securities are recorded as components of interest income in the Statement of Operations.
Dividends and Distributions to Shareholders. Dividends from net investment income, if any, are declared on each day the Portfolio is open for business and are distributed to shareholders monthly. Net realized capital gains earned by the Portfolio, if any, will be distributed no less frequently than once each year. Most shareholders choose to reinvest their dividends and capital gain distribution in additional shares of the Portfolio.
Income dividends and capital gain distributions are determined in accordance with income tax regulations which may differ from GAAP. Differences between tax regulations and GAAP may change the fiscal year when income and capital items are recognized for tax and GAAP purposes. Examples of events that give rise to timing differences include wash sales, straddles, net operating losses and capital loss carryforwards. Further, the character of investment income and capital gains may be different for certain transactions under the two methods of accounting. Examples of characterization differences include the treatment of mortgage paydowns, swaps, foreign currency transactions and contingent debt instruments. As a result, income dividends and capital gain distributions declared during a fiscal period may differ significantly from the net investment income and realized capital gain reported in the Portfolio’s annual financial statements presented under GAAP.
Distributions classified as a tax basis return of capital, if any, are reflected in the accompanying Statements of Changes in Net Assets and have been reclassified to paid in capital. In addition, other amounts have been reclassified between undistributed net investment income, accumulated undistributed net realized gains
| | | | |
| 12 | | PIMCO Variable Insurance Trust | | |
| | |
| |
| | | June 30, 2006 (Unaudited) |
or losses and/or paid in capital to more appropriately conform financial accounting to tax characterizations of dividend distributions.
Multiclass Operations. Each class offered by the Portfolio has equal rights as to assets and voting privileges (except that shareholders of a class have exclusive voting rights regarding any matter relating solely to that class of shares). Income and non-class specific expenses of the Portfolio are allocated daily to each class of shares based on the relative value of settled shares. Realized and unrealized capital gains and losses of the Portfolio are allocated daily to each class of shares based on the relative net assets of each class. Class specific expenses, where applicable, currently include administrative, distribution and servicing fees.
Federal Income Taxes. The Portfolio intends to qualify as a regulated investment company under sub-chapter M of the Internal Revenue Code and distribute all of its taxable income and net realized gains, if applicable, to shareholders. Accordingly, no provision for Federal income taxes has been made.
Futures Contracts. The Portfolio is authorized to enter into futures contracts. The Portfolio may use futures contracts to manage its exposure to the securities markets or to movements in interest rates and currency values. The primary risks associated with the use of futures contracts are the imperfect correlation between the change in market value of the securities held by the Portfolio and the prices of futures contracts, the possibility of an illiquid market, and the inability of the counterparty to meet the terms of the contract. Futures contracts are valued based upon their quoted daily settlement prices. Upon entering into a futures contract, the Portfolio is required to deposit with its custodian, in a segregated account in the name of the futures broker, an amount of cash or U.S. Government and Agency Obligations in accordance with the initial margin requirements of the broker or exchange. Futures contracts are marked to market daily and an appropriate payable or receivable for the change in value (“variation margin”) is recorded by the Portfolio. Gains or losses are recognized but not considered realized until the contracts expire or are closed. Futures contracts involve, to varying degrees, risk of loss in excess of the variation margin disclosed in the Statement of Assets and Liabilities.
Guarantees and Indemnifications. Under the Trust’s organizational documents, each Trustee, officer, employee or other agent of the Trust (including the Trust’s investment manager) is indemnified against certain liabilities that may arise out of performance of their duties to the Portfolio. Additionally, in the normal course of business, the Portfolio enters into contracts that contain a variety of indemnification clauses. The Portfolio’s maximum exposure under these arrangements is unknown as this would involve future claims that may be made against the Portfolio that have not yet occurred. However, the Portfolio has not had prior claims or losses pursuant to these contracts, and believes the risk of loss to be remote.
Inflation-Indexed Bonds. The Portfolio may invest in inflation-indexed bonds. Inflation-indexed bonds are fixed-income securities whose principal value is periodically adjusted to the rate of inflation. The interest rate on these bonds is generally fixed at issuance at a rate lower than typical bonds. Over the life of an inflation-indexed bond, however, interest will be paid based on a principal value, which is adjusted for inflation. Any increase in the principal amount of an inflation-indexed bond will be included as interest income in the Statement of Operations, even though investors do not receive their principal until maturity.
Options Contracts. The Portfolio may write call and put options on futures, swaps, securities or currencies it owns or in which it may invest. Writing put options tends to increase the Portfolio’s exposure to the underlying instrument. Writing call options tends to decrease the Portfolio’s exposure to the underlying instrument. When the Portfolio writes a call or put option, an amount equal to the premium received is recorded as a liability and subsequently marked to market to reflect the current value of the option written. These liabilities are reflected as written options outstanding in the Statement of Assets and Liabilities. Certain options may be written with premiums to determined on a future date. The premiums for these options are based upon implied volatility parameters at specified terms. Premiums received from writing options which expire are treated as realized gains. Premiums received from writing options which are exercised or closed are added to the proceeds or offset against amounts paid on the underlying future, swap, security or currency transaction to determine the realized gain or loss. The Portfolio as a writer of an option has no control over whether the underlying future, swap, security or currency may be sold (call) or purchased (put) and as a result bears the market risk of an unfavorable change in the price of the future, swap, security or currency underlying the written option. There is the risk the Portfolio may not be able to enter into a closing transaction because of an illiquid market.
The Portfolio may also purchase put and call options. Purchasing call options tends to increase the Portfolio’s exposure to the underlying instrument. Purchasing put options tends to decrease the Portfolio’s exposure to the underlying instrument. The Portfolio pays a premium which is included in the Portfolio’s Statement of Assets and Liabilities as an investment and subsequently marked to market to reflect the current value of the option. Premiums paid for purchasing options which expire are treated as realized losses. Certain options may be purchased with premiums to be determined on a future date. The premiums for these options are based upon implied volatility parameters at specified terms. The risk associated with purchasing put and call options is limited to the premium paid. Premiums paid for purchasing options which are exercised or closed are added to the amounts paid or offset against the proceeds on the underlying future, swap, security or currency transaction to determine the realized gain or loss.
Repurchase Agreements. The Portfolio may engage in repurchase transactions. Under the terms of a typical repurchase agreement, the Portfolio takes possession of an underlying debt obligation subject to an obligation of the seller to repurchase, and the Portfolio to resell, the obligation at an agreed-upon price and time. The market value of the collateral must be equal to or exceed at all times the total amount of the repurchase obligations, including interest. Securities purchased under repurchase agreements are reflected as an asset in the Statement of Assets and Liabilities. Generally, in the event of counterparty default, the Portfolio has the right to use the collateral to offset losses incurred. If the counterparty should default, the Portfolio will seek to sell the securities which it holds as collateral. This could involve procedural costs or delays in addition to a loss on the securities if their value should fall below their repurchase price.
Mortgage-Related and Other Asset-Backed Securities. The Portfolio may invest in mortgage-related or other asset-backed securities. These securities include mortgage pass-through securities, collateralized mortgage obligations (“CMOs”), commercial mortgage-backed securities, mortgage dollar rolls, CMO residuals, stripped mortgage-backed securities (“SMBSs”) and other securities that directly or indirectly represent a participation in, or are secured by and payable from, mortgage loans on real property. The value of some mortgage- or asset-backed securities may be particularly sensitive to changes in prevailing interest rates. Early repayment of principal on some mortgage-related securities may expose a Portfolio to a lower rate of return upon reinvestment of principal. The value of these securities may fluctuate in response to the market’s perception of the creditworthiness of the issuers. Additionally, although mortgages and mortgage-related securities are generally supported by some form of government or private guarantee and/or insurance, there is no assurance that private guarantors or insurers will meet their obligations.
One type of SMBS has one class receiving all of the interest from the mortgage assets (the interest-only, or “IO” class), while the other class will receive all of the principal (the principal-only, or “PO” class). Payments received for IOs are included
| | | | | | |
| | | Semiannual Report | | June 30, 2006 | | 13 |
Notes to Financial Statements (Cont.)
in interest income in the Statement of Operations. Because principal will not be received at the maturity of an IO, adjustments are made to the book value of the security on a daily basis until maturity. These adjustments are included in interest income in the Statement of Operations. Payments received for POs are treated as reductions to the cost and par value of the securities.
Swap Agreements. The Portfolio may engage in swap transactions, including, but not limited to, swap agreements on interest rate and credit default to manage its exposure to interest rates and credit risk. In connection with these agreements, securities may be identified as collateral in accordance with the terms of the respective swap agreements.
Interest rate swap agreements involve the exchange by the Portfolio with another party of their respective commitments to pay or receive interest, e.g., an exchange of floating rate payments for fixed rate payments with respect to the notional amount of principal.
Credit default swap agreements involve one party making a stream of payments to another party in exchange for the right to receive a specified return in the event of a default by a third party, typically corporate issues or sovereign issues of an emerging country, on its obligation. The Portfolio may use credit default swaps to provide a measure of protection against defaults of the issuers (i.e., to reduce risk where the Portfolio owns or has exposure to the sovereign issuer) or to take an active long or short position with respect to the likelihood of a particular issuer’s default. As a seller of protection, the Portfolio generally receives an upfront payment or a fixed rate of income throughout the term of the swap provided that there is no credit event. If the Portfolio is a seller of protection and a credit event occurs, as defined under the terms of that particular swap agreement, the Portfolio will pay to the buyer of the protection an amount up to the notional value of the swap and in certain instances take delivery of the security. As the seller, a Portfolio would effectively add leverage to its portfolio because, in addition to its total net assets, the Portfolio would be subject to investment exposure on the notional amount of the swap. As a buyer of protection, a Portfolio generally receives an amount up to the notional value of the swap if a credit event occurs. The treatment of credit default swaps and other swap agreements that provide for contingent, non-periodic, bullet-type payments as “notional principal contracts” for federal income tax purposes is uncertain. Were the Internal Revenue Service to take the position that a credit default swap or other bullet-type swap is not a “notional principal contract” for federal income tax purposes, payments received by the Portfolio from such investments might be subject to income taxes.
Swaps are marked to market daily based upon quotations from market makers and the change in value, if any, is recorded as unrealized gain or loss in the Statement of Operations. Payments received or made at the beginning of the measurement period are reflected as such in the Statement of Assets and Liabilities. These upfront payments are recorded as realized gain or loss in the Statement of Operations upon termination or maturity of the swap. A liquidation payment received or made at the termination of the swap is recorded as realized gain or loss in the Statement of Operations. Net periodic payments received or paid by the Portfolio are included as part of realized gain or loss in the Statement of Operations. Entering into these agreements involves, to varying degrees, elements of credit, market and documentation risk in excess of the amounts recognized in the Statement of Assets and Liabilities. Such risks involve the possibility that there will be no liquid market for these agreements, that the counterparty to the agreements may default on its obligation to perform or disagree as to the meaning of contractual terms in the agreements and that there may be unfavorable changes in interest rates.
U.S. Government Agencies or Government-Sponsored Enterprises. Securities issued by U.S. Government agencies or government-sponsored enterprises may not be guaranteed by the U.S. Treasury. The Government National Mortgage Association (“GNMA”), a wholly owned U.S. Government corporation, is authorized to guarantee, with the full faith and credit of the U.S. Government, the timely payment of principal and interest on securities issued by institutions approved by GNMA and backed by pools of mortgages insured by the Federal Housing Administration or guaranteed by the Department of Veterans Affairs. Government-related guarantors (i.e., not backed by the full faith and credit of the U.S. Government) include the Federal National Mortgage Association (“FNMA” or “Fannie Mae”) and the Federal Home Loan Mortgage Corporation (“FHLMC” or “Freddie Mac”). Pass-through securities issued by FNMA are guaranteed as to timely payment of principal and interest by FNMA but are not backed by the full faith and credit of the U.S. Government. FHLMC guarantees the timely payment of interest and ultimate collection of principal, but its participation certificates are not backed by the full faith and credit of the U.S. Government.
New Accounting Policies. In July 2006, the Financial Accounting Standards Board issued Interpretation No. 48, “Accounting for Uncertainty in Income Taxes—an Interpretation of FASB Statement No. 109” (the “Interpretation”). The Interpretation is effective for fiscal years beginning after December 15, 2006. Management is currently evaluating the application of the Interpretation to the Portfolio and will provide additional information in relation to the Interpretation in the Portfolio’s annual financial statements for the year ending December 31, 2006.
3. FEES, EXPENSES, AND RELATED PARTY TRANSACTIONS
Investment Advisory Fee. PIMCO is a majority-owned subsidiary of Allianz Global Investors of America L.P. (“AGI”), and serves as investment adviser (the “Adviser”) to the Trust, pursuant to an investment advisory contract. The Adviser receives a monthly fee at an annual rate based on average daily net assets of the Portfolio. The Advisory Fee is charged at an annual rate of 0.25%.
Administration Fee. PIMCO serves as administrator (the “Administrator”), and provides administrative services to the Trust for which it receives a monthly administrative fee based on average daily net assets of the Portfolio. As the Administrator, PIMCO bears the costs of various third-party services, including audit, custodial, portfolio accounting, legal, transfer agency and printing costs. The Administration Fee is charged at the annual rate of 0.25%.
Distribution and Servicing Fees. Allianz Global Investors Distributors LLC (“AGID”) is an indirect wholly-owned subsidiary of AGI and serves as the distributor of the Trust’s shares. The Trust is permitted to reimburse AGID on a quarterly basis, out of the Administrative Class assets of the Portfolio in the amount of 0.15% on an annual basis of the average daily net assets of that class, for payments made to financial intermediaries that provide services in connection with the distribution of shares or administration of plans or programs that use Portfolio shares as their funding medium. The effective rate paid to AGID was 0.15% during the current fiscal year.
Expenses. The Trust is responsible for the following expenses: (i) salaries and other compensation of any of the Trust’s executive officers and employees who are not officers, directors, stockholders or employees of PIMCO or its subsidiaries or affiliates; (ii) taxes and governmental fees; (iii) brokerage fees and commissions and other portfolio transaction expenses; (iv) the costs of borrowing money, including interest expenses and bank overdraft charges; (v) fees and expenses of the Trustees who are not “interested persons” of PIMCO or the Trust, and any counsel retained exclusively for their benefit; (vi) extraordinary expenses, including costs of litigation and indemnification expenses; (vii) organization expenses and (viii) any expenses allocated or allocable to a specific class of shares, which include service fees payable with respect to the Administrative Class shares and may include certain other expenses as permitted by the Trust’s Multiple Class Plan adopted pursuant to Rule 18f-3 under the Act and subject to review and approval
| | | | |
| 14 | | PIMCO Variable Insurance Trust | | |
| | |
| |
| | | June 30, 2006 (Unaudited) |
by the Trustees. The ratio of expenses to average net assets per share class, as disclosed in the Financial Highlights, may differ from the annual portfolio operating expenses per share class as disclosed in the Prospectus for the reasons set forth above.
For the current period ended June 30, 2006, each unaffiliated Trustee received an annual retainer of $15,000, plus $2,000 for each Board of Trustees quarterly meeting attended, $500 for each Board of Trustees committee meeting attended and $500 for each special board meeting attended, plus reimbursement of related expenses. In addition, each Committee Chair received an additional annual retainer of $500 and each Audit Committee Chair received an additional annual retainer of $1,500. These expenses are allocated on a pro-rata basis to each Portfolio of the Trust according to its respective net assets. The Trust pays no compensation directly to any Trustee or any other officer who is affiliated with the Administrator, all of whom receive remuneration for their services to the Trust from the Administrator or its affiliates.
4. PURCHASES AND SALES OF SECURITIES
The length of time the Portfolio has held a particular security is not generally a consideration in investment decisions. A change in the securities held by the Portfolio is known as “portfolio turnover”. The Portfolio may engage in frequent and active trading of portfolio securities to achieve its investment objective, particularly during periods of volatile market movements. High portfolio turnover (e.g., over 100%) involves correspondingly greater expenses to the Portfolio, including brokerage commissions or dealer mark-ups and other transaction costs on the sale of securities and reinvestments in other securities. Such sales may also result in realization of taxable capital gains, including short-term capital gains (which are generally taxed at ordinary income tax rates). The trading costs and tax effects associated with portfolio turnover may adversely affect the Portfolio’s performance.
Purchases and sales of securities (excluding short-term investments) for the period ended June 30, 2006 were as follows (amounts in thousands):
| | | | | | | | | | | | | | |
| | | U.S Government/Agency | | | | All Other |
| | | Purchases | | | | Sales | | | | Purchases | | | | Sales |
| | | $ 27,729 | | | | $ 40,414 | | | | $ 1,232 | | | | $ 209 |
5. TRANSACTIONS IN WRITTEN CALL AND PUT OPTIONS
Transactions in written call and put options were as follows (amounts in thousands, except number of contracts):
| | | | | | | | | | | | | | | | | |
| | | | | # of
Contracts |
| | | |
| Notional
Amount
in $ |
| | | | | Premium | |
Balance at 12/31/2005 | | | | 38 | | | | | $ | 5,100 | | | | | $ | 64 | |
Sales | | | | 65 | | | | | | 4,000 | | | | | | 46 | |
Closing Buys | | | | (1 | ) | | | | | (2,000 | ) | | | | | (18 | ) |
Expirations | | | | (37 | ) | | | | | (2,100 | ) | | | | | (23 | ) |
Exercised | | | | 0 | | | | | | 0 | | | | | | 0 | |
Balance at 06/30/2006 | | | | 65 | | | | | $ | 5,000 | | | | | $ | 69 | |
6. SHARES OF BENEFICIAL INTEREST
The Portfolio may issue an unlimited number of shares of beneficial interest with a $0.001 par value. Changes in shares of beneficial interest were as follows (shares and amounts in thousands):
| | | | | | | | | | | | | | | | | | |
| | | | | Six Months Ended
06/30/2006 | | | | | Year Ended
12/31/2005 | |
| | | | | Shares | | | Amount | | | | | Shares | | | Amount | |
| | | | | | |
Receipts for shares sold | | | | | | | | | | | | | | | | | | |
Institutional Class | | | | 9 | | | $ | 87 | | | | | 0 | | | $ | 0 | |
Administrative Class | | | | 222 | | | | 2,229 | | | | | 0 | | | | 0 | |
Issued as reinvestment of distributions | | | | | | | | | | | | | | | | | | |
Institutional Class | | | | 0 | | | | 1 | | | | | 0 | | | | 1 | |
Administrative Class | | | | 71 | | | | 699 | | | | | 103 | | | | 1,050 | |
Cost of shares redeemed | | | | | | | | | | | | | | | | | | |
Institutional Class | | | | 0 | | | | (1 | ) | | | | 0 | | | | 0 | |
Administrative Class | | | | (22 | ) | | | (213 | ) | | | | (32 | ) | | | (329 | ) |
Net increase resulting from Portfolio share transactions | | | | 280 | | | $ | 2,802 | | | | | 71 | | | $ | 722 | |
The following schedule shows the number of shareholders each owning 5% or more of the Portfolio and the total percentage of the Portfolio held by such shareholders:
| | | | | | |
| | | | | Number of
Shareholders | | % of Portfolio
Held |
Institutional Class | | | | 1 | | 100 |
Administrative Class | | | | 1 | | 100 |
7. FEDERAL INCOME TAX MATTERS
As of June 30, 2006, the aggregate cost of investments was the same for federal income tax and financial statement purposes. The net unrealized appreciation (depreciation) of investment securities for federal income tax purposes is as follows (amounts in thousands):
| | | | |
Aggregate
Gross
Unrealized
Appreciation | | Aggregate
Gross
Unrealized
(Depreciation) | | Net
Unrealized
(Depreciation) |
$ 28 | | $ (657) | | $ (629) |
8. REGULATORY AND LITIGATION MATTERS
On June 1, 2004, the Attorney General of the State of New Jersey announced that it had dismissed PIMCO from a complaint filed by the New Jersey Attorney General on February 17, 2004, and that it had entered into a settlement agreement (the “New Jersey Settlement”) with Allianz Global Investors of America L.P. (“AGI”) (formerly known as Allianz Dresdner Asset Management of America L.P.), PEA Capital LLC (an entity affiliated with PIMCO through common ownership) (“PEA”) and Allianz Global Investors Distributors LLC (“AGID”), in connection with the same matter. In the New Jersey Settlement, AGI, PEA and AGID neither admitted nor denied the allegations or conclusions of law, but did agree to pay New Jersey a civil fine of $15 million and $3 million for investigative costs and further potential enforcement initiatives against unrelated parties. They also undertook to implement certain governance changes. The complaint relating to the New Jersey Settlement alleged, among other things, that AGI, PEA and AGID had failed to disclose that they improperly allowed certain hedge funds to engage in “market timing” in certain funds. The complaint sought injunctive relief, civil monetary penalties, restitution and disgorgement of profits.
Since February 2004, PIMCO, AGI, PEA, AGID, and certain of their affiliates, including the PIMCO Funds, the Allianz Funds (formerly known as PIMCO Funds: Multi-Manager Series), and the Trustees and employees of the PIMCO Funds, have been named as defendants in fifteen lawsuits filed in various jurisdictions. Eleven of those lawsuits concern “market timing,” and they have been transferred to and consolidated for pre-trial proceedings in a multi-district litigation proceeding in the
| | | | | | |
| | | Semiannual Report | | June 30, 2006 | | 15 |
Notes to Financial Statements (Cont.)
U.S. District Court for the District of Maryland; the other four lawsuits concern “revenue sharing” and have been consolidated into a single action in the U.S. District Court for the District of Connecticut. The lawsuits have been commenced as putative class actions on behalf of investors who purchased, held or redeemed shares of the various series of the PIMCO Funds and the Allianz Funds during specified periods, or as derivative actions on behalf of the PIMCO Funds and Allianz Funds.
The market timing actions in the District of Maryland generally allege that certain hedge funds were allowed to engage in “market timing” in certain of the PIMCO Funds and the Allianz Funds and this alleged activity was not disclosed. Pursuant to tolling agreements entered into with the derivative and class action plaintiffs, PIMCO, the Trustees, and certain employees of PIMCO who were previously named as defendants have all been dropped as defendants in the market timing actions; the plaintiffs continue to assert claims on behalf of the shareholders of the PIMCO Funds or on behalf of the PIMCO Funds themselves against other defendants. By order dated November 3, 2005, the U.S. District Court for the District of Maryland granted the PIMCO Funds’ motion to dismiss claims asserted against it in a consolidated amended complaint where the PIMCO Funds were named, in the complaint, as a nominal defendant. The revenue sharing action in the District of Connecticut generally alleges that fund assets were inappropriately used to pay brokers to promote the PIMCO Funds and Allianz Funds including directing fund brokerage transactions to such brokers, and that such alleged arrangements were not fully disclosed to shareholders. On August 11, 2005 the U.S. District Court for the District of Connecticut conducted a hearing on defendants’ motion to dismiss the consolidated amended complaint in the revenue sharing action but has not yet ruled on the motion to dismiss. The market timing and revenue sharing lawsuits seek, among other things, unspecified compensatory damages plus interest and, in some cases, punitive damages, the rescission of investment advisory contracts, the return of fees paid under those contracts and restitution.
Under Section 9(a) of the Investment Company Act of 1940, as amended (“1940 Act”), if the New Jersey Settlement or any of the lawsuits described above were to result in a court injunction against AGI, PEA, AGID and/or their affiliates, PIMCO could, in the absence of exemptive relief granted by the SEC, be barred from serving as an investment adviser, and AGID could be barred from serving as principal underwriter, to any registered investment company, including the Portfolios of the Trust. In connection with an inquiry from the SEC concerning the status of the New Jersey Settlement under Section 9(a), PEA, AGID, AGI and certain of their affiliates (including PIMCO) (together, the “Applicants”) have sought exemptive relief from the SEC under Section 9(c) of the 1940 Act. The SEC has granted the Applicants a temporary exemption from the provisions of Section 9(a) with respect to the New Jersey Settlement until the earlier of (i) September 13, 2006 and (ii) the date on which the SEC takes final action on their application for a permanent order. There is no assurance that the SEC will issue a permanent order.
Two nearly identical class action civil complaints have been filed in August 2005, in the Northern District of Illinois Eastern Division alleging that the plaintiffs each purchased and sold a 10-year Treasury note futures contract and suffered damages from an alleged shortage when PIMCO held both physical and futures positions in 10-year Treasury notes for its client accounts. The two actions have been consolidated into one action, and the two separate complaints have been replaced by a consolidated complaint. PIMCO is a named defendant, and the PIMCO Funds have been added as a defendant, to the consolidated action. PIMCO strongly believes the complaint (and any consolidated complaint filed hereafter) is without merit and intends to vigorously defend itself.
Certain Portfolios of the Trust were recently served in an adversary proceeding brought by the Official Committee of Asbestos Claimants of G-I Holdings, Inc. in G-I Holdings, Inc.’s bankruptcy in the District of New Jersey. PIMCO was previously named in this lawsuit and remains a defendant. The plaintiff seeks to recover for the bankruptcy estate assets that were transferred by the predecessor entity of G-I Holdings, Inc. to a wholly-owned subsidiary in 1994. The subsidiary has since issued notes, of which certain Portfolios of the Trust are alleged to be holders. The complaint alleges that in 2000, more than two hundred noteholders—including certain Portfolios of the Trust—were granted a second priority lien on the assets of the subsidiary in exchange for their consent to a refinancing transaction and the granting of a first priority lien to the lending banks. The plaintiff is seeking invalidation of the lien in favor of the noteholders and/or the value of the lien.
It is possible that these matters and/or other developments resulting from these matters could result in increased fund redemptions or other adverse consequences to the Portfolios. However, PIMCO and AGID believe that these matters are not likely to have a material adverse effect on the Portfolios or on PIMCO’s or AGID’s ability to perform their respective investment advisory or distribution services relating to the Portfolios.
| | | | |
| 16 | | PIMCO Variable Insurance Trust | | |
Investment Adviser and Administrator
Pacific Investment Management Company LLC
840 Newport Center Drive
Newport Beach, California 92660
Distributor
Allianz Global Investors Distributors LLC
2187 Atlantic Street
Stamford, Connecticut 06902
Custodian
State Street Bank & Trust Company
801 Pennsylvania
Kansas City, Missouri 64105
Transfer Agent
Boston Financial Data Services–Midwest
330 W. 9th Street
Kansas City, Missouri 64105
Legal Counsel
Dechert LLP
1775 I Street, N.W.
Washington, D.C. 20006
Independent Registered Public Accounting Firm
PricewaterhouseCoopers LLP
1055 Broadway
Kansas City, Missouri 64105
P I M C O

Semiannual Report June 30, 2006
PIMCO Variable Insurance Trust
Share Class | Institutional
All Asset Portfolio
Foreign Bond Portfolio (U.S. Dollar-Hedged)
Global Bond Portfolio (Unhedged)
Share Class | Advisor
High Yield Portfolio Low Duration Portfolio
Table of Contents
| | | | |
| | |
| | | | | Page |
| | |
| | | | | |
Chairman’s Letter | | | | 1 |
Important Information About the Portfolio | | | | 2 |
Portfolio Summary | | | | 4 |
Financial Highlights | | | | 10 |
Statement of Assets and Liabilities | | | | 12 |
Statement of Operations | | | | 13 |
Statements of Changes in Net Assets | | | | 14 |
Schedule of Investments | | | | 16 |
Notes to Financial Statements | | | | 39 |
This material is authorized for use only when preceded or accompanied by the current PIMCO Variable Insurance Trust (the “Trust”) prospectus. Investors should consider the investment objectives, risks, charges and expenses of this Trust carefully before investing. Ask your financial professional to explain all charges that may apply. This and other information is contained in the Trust’s prospectus. The variable product prospectus may be obtained by contacting your Investment Consultant. Please read the Trust and variable product prospectus carefully before you invest or send money.
Chairman’s Letter
Dear PIMCO Variable Insurance Trust Shareholder:
It is our pleasure to present to you the semiannual report for the PIMCO Variable Insurance Trust covering the six-month period ended June 30, 2006.
Highlights of the global bond markets during the six-month period included:
| | n | | Most fixed-income sectors lost ground during the first half of 2006, as concern about accelerating inflation and central bank tightening pushed interest rates higher worldwide. The benchmark Lehman Brothers Aggregate Bond Index (which includes Treasury, Investment-Grade Corporate, and Residential Mortgage-Backed Securities) returned -0.72% for the first six months of the year. On June 30, the benchmark ten-year Treasury yielded 5.14%, 0.75% higher than at the start of the year. The U.S. yield curve remained flat as shorter-maturity yields rose by a comparable amount. |
| | n | | The Federal Reserve tightened four times during the reporting period, bringing the Federal Funds Rate to 5.25%. The increase near the end of the period was the Federal Reserve’s 17th consecutive rate hike since the start of its tightening cycle in 2004. The Federal Reserve was not alone, as central banks in Europe, India, and China tightened credit in unison for the first time since 2000. The Bank of Japan, whose zero-interest-rate policy has flooded global markets with liquidity, looked set to reverse this policy in the coming months. |
In these pages please find a more complete Portfolio review as it relates to financial-market activities, as well as details about total-return investment performance for the six-month reporting period. Thank you for the trust you have placed in us. We will continue to work diligently to meet your investment needs.
Sincerely,

Brent R. Harris
Chairman, PIMCO Variable Insurance Trust
July 31, 2006
| | | | | | |
| | | Semiannual Report | | June 30, 2006 | | 1 |
Important Information About the Portfolio
PIMCO Variable Insurance Trust (the “Trust”) is an open-end management investment company currently consisting of nineteen separate investment portfolios, including All Asset Portfolio, Foreign Bond Portfolio (U.S. Dollar-Hedged), Global Bond Portfolio (Unhedged), High Yield Portfolio and Low Duration Portfolio (each a “Portfolio” and collectively, the “Portfolios”). The Portfolios are only available as a funding vehicle under variable life insurance policies or variable annuity contracts issued by insurance companies (“Variable Contracts”). Individuals may not purchase shares of a Portfolio directly. Shares of a Portfolio also may be sold to qualified pension and retirement plans outside of the separate account context.
We believe that bond funds have an important role to play in a well diversified investment portfolio. It is important to note, however, that in an environment where interest rates may trend upward, rising rates would negatively impact the performance of most bond funds, and fixed-income securities held by a Portfolio are likely to decrease in value. The price volatility of fixed-income securities can also increase during periods of rising interest rates resulting in increased losses to a Portfolio.
Bond funds and individual bonds with a longer duration (a measure of the expected life of a security) tend to be more sensitive to changes in interest rates, usually making them more volatile than securities or funds with shorter durations. The longer-term performance of most bond funds has benefited from capital gains in part resulting from an extended period of declining interest rates. In the event interest rates increase, these capital gains should not be expected to recur.
The All Asset Portfolio is a “fund of funds,” which is a term used to describe mutual funds that pursue their investment objective by investing in other mutual funds instead of investing directly in stocks or bonds of other issuers. Under normal circumstances, the Portfolio invests substantially all of its assets in Institutional Class shares of PIMCO Funds, an affiliated open-end investment company, except the All Asset and All Asset All Authority Funds (“Underlying Funds”).
The cost of investing in the All Asset Portfolio will generally be higher than the cost of investing in a mutual fund that invests directly in individual stocks and bonds. By investing in the All Asset Portfolio, an investor will indirectly bear fees and expenses charged by the Underlying Funds in addition to the Portfolio’s direct fees and expenses.
Among the principal risks of investing in the All Asset Portfolio are allocation risk, Underlying Fund risk and issuer non-diversification risk. The Portfolio also is indirectly subject to the risks of the Underlying Funds, which are described below.
Certain Portfolios and Underlying Funds may be subject to various risks in addition to the investment rate risk described above. Some of these risks may include, but are not limited to, the following: credit risk, high yield risk, market risk, issuer risk, variable dividend risk, liquidity risk, derivatives risk, commodity risk, equity risk, mortgage risk, non-U.S. investment risk, real estate risk, emerging markets risk, currency risk, issuer non-diversification risk, leveraging risk, smaller company risk, management risk, California state specific risk, New York state specific risk, tax risk and index risk . A complete description of these risks is contained in the Portfolios’ and Underlying Funds’ prospectuses. Certain Portfolios and Underlying Funds may use derivative instruments for hedging purposes or as part of an investment strategy. Use of these instruments may involve certain costs and risks such as liquidity risk, interest rate risk, market risk, credit risk, management risk and the risk that the Portfolios or Underlying Funds could not close out a position when it would be most advantageous to do so. A Portfolio or Underlying Fund investing in derivatives could lose more than the principal amount invested in these instruments. Investing in non-U.S. securities may entail risk due to non-U.S. economic and political developments; this risk may be increased when investing in emerging markets. High-yield bonds typically have a lower credit rating then other bonds. Lower-rated bonds generally involve a greater risk to principal than higher-rated bonds.
On each individual Portfolio Summary page in this Semiannual Report, the Average Annual Total Return table measures performance assuming that all dividend and capital gain distributions were reinvested. An investment in a Portfolio is not a deposit of a bank and is not guaranteed or insured by the Federal Deposit Insurance Corporation or any other government agency. It is possible to lose money on investments in the Portfolios.
PIMCO has adopted written proxy voting policies and procedures (“Proxy Policy”) as required by Rule 206(4)-6 under the Investment Advisers Act of 1940. The Proxy Policy has been adopted by the Trust as the policies and procedures that PIMCO will use when voting proxies on behalf of the Portfolios. Copies of the written Proxy Policy and the factors that PIMCO may consider in determining how to vote proxies for the Portfolios, and information about how the Portfolios voted proxies relating to portfolios securities held during the most recent twelve-month period ended June 30, are available without charge, upon request, by calling the Trust at
1-866-746-2606 and on the Securities and Exchange Commission’s (“SEC”) website at http://www.sec.gov.
The Portfolios file their complete schedule of portfolio holdings with the SEC for the first and third quarters of each fiscal year on Form N-Q. A copy of the Trust’s Form N-Q is available on the SEC’s website at http://www.sec.gov and may be reviewed and copied at the SEC’s Public Reference Room in Washington D.C. Information on the operation of the Public Reference Room may be obtained by calling 1-800-SEC-0330.
PIMCO Variable Insurance Trust is distributed by Allianz Global Investors Distributors LLC, 2187 Atlantic Street, Stamford, CT 06902.
| | | | |
| 2 | | PIMCO Variable Insurance Trust | | |
The following disclosure provides important information regarding the Portfolio’s Expense Example (“Example” or “Expense Example”), which appears in this Semiannual Report. Please refer to this information when reviewing the Expense Example for the Portfolio.
Example
As a shareholder of the Portfolio, you incur two types of costs: (1) transaction costs and (2) ongoing costs, including advisory and administrative fees; distribution and/or service (12b-1) fees (Administrative Class, Advisor Class and Class M only); and other Portfolio expenses. The Example is intended to help you understand your ongoing costs (in dollars) of investing in the Portfolio and to compare these costs with the ongoing costs of investing in other mutual funds. The Expense Example does not reflect any fees or other expenses imposed by the Variable Contracts. If it did, the expenses reflected in the Expense Examples would be higher. The Example is based on an investment of $1,000 invested at the beginning of the period and held for the entire period indicated, which is from January 1, 2006 to June 30, 2006.
Actual Expenses
The information in the table under the heading “Actual Performance” provides information about actual account values and actual expenses. You may use the information in these columns, together with the amount you invested, to estimate the expenses that you paid over the period. Simply divide your account value by $1,000 (for example, an $8,600 account value divided by $1,000 = 8.60), then multiply the result by the number in the appropriate column for your share class, in the row titled “Expenses Paid During Period” to estimate the expenses you paid on your account during this period.
Hypothetical Example for Comparison Purposes
The information in the table under the heading “Hypothetical Performance (5% return before expenses)” provides information about hypothetical account values and hypothetical expenses based on the Portfolio’s actual expense ratio and an assumed rate of return of 5% per year before expenses, which is not the Portfolio’s actual return. The hypothetical account values and expenses may not be used to estimate the actual ending account balance or expenses you paid for the period. You may use this information to compare the ongoing costs of investing in the Portfolio and other portfolios. To do so, compare this 5% hypothetical example with the 5% hypothetical examples that appear in the shareholder reports of the other portfolios.
Please note that the expenses shown in the table are meant to highlight your ongoing costs only and do not reflect any transactional costs. Therefore, the information under the heading “Hypothetical Performance (5% return before expenses)” is useful in comparing ongoing costs only, and will not help you determine the relative total costs of owning different portfolios. In addition, if these transactional costs were included, your costs would have been higher.
The expense ratio may vary period to period because of various factors, such as an increase in expenses not covered by the advisory and administrative fees (such as expenses of the trustees and their counsel or litigation expense).
Portfolio Benchmark
Lehman Brothers U.S. TIPS: 1-10 Year is an unmanaged index market comprised of U.S. Treasury Inflation Linked securities having a maturity of at least 1 year and less than 10 years. It is not possible to invest directly in such an unmanaged index. The CPI + 500 Basis Points benchmark is created by adding 5% to the annual percentage change in the Consumer Price Index (“CPI”). This index reflects non-seasonally adjusted returns. The CPI is an unmanaged index representing the rate of inflation of the U.S. consumer prices as determined by the US Department of Labor Statistics. There can be no guarantee that the CPI or other indexes will reflect the exact level of inflation at any given time.
JPMorgan Government Bond Indices Global Ex-U.S. Index Hedged and Global FX NY Index Unhedged in USD is an unmanaged index market representative of the total return performance in U.S. dollars of major non-U.S. bond markets. It is not possible to invest directly in such an unmanaged index.
Merrill Lynch US High Yield, BB-B Rated Constrained Index tracks the performance of BB-B Rated US Dollar-denominated corporate bonds publicly issued in the US domestic market. Qualifying bonds are capitalization-weighted provided the total allocation to an individual issuer (defined by Bloomberg tickers) does not exceed 2%. Issuers that exceed the limit are reduced to 2% and the face value of each of their bonds is adjusted on a pro-rata basis.
The Merrill Lynch 1-3 Year Treasury Index is an unmanaged index that tracks the performance of the direct sovereign debt of the U.S. Government having a maturity of at least 1 year and less than 3 years. It is not possible to invest directly in the index.
| | | | | | |
| | | Semiannual Report | | June 30, 2006 | | 3 |
|
|
| PIMCO All Asset Portfolio |
|
Cumulative Returns Through June 30, 2006

Lehman
Brothers Consumer Price
All Asset Portfolio U.S. TIPS Index + 500
Institutional Class 1-10 Year Index Basis points
------------------- --------------- ------------
01/31/2006 $10,000 $10,000 $10,000
02/28/2006 10,025 9,971 10,062
03/31/2006 9,870 9,870 10,159
04/30/2006 9,887 9,920 10,288
05/31/2006 9,802 9,953 10,382
06/30/2006 9,797 9,983 10,446
$10,000 invested at the end of the nearest month to the inception date of the Portfolio’s Institutional Class.
PIMCO Funds Allocation‡
| | |
Real Return Asset | | 28.4% |
Real Return | | 18.1% |
Developing Local Markets | | 8.5% |
Floating Income | | 8.3% |
Long-Term U.S. Government | | 7.4% |
International StocksPLUS® TR Strategy | | 6.0% |
Emerging Markets Bond | | 5.6% |
Other | | 17.7% |
| | ‡ | % of Total Investments as of June 30, 2006 |
| | | | | | |
| Cumulative Total Return for the period ended June 30, 2006 |
| | | | | | | Since
Inception
(01/31/06) |
| | |
| | PIMCO All Asset Portfolio Institutional Class | | -2.03% |
| | |
| | Lehman Brothers U.S. TIPS 1-10 Year Index | | -0.17% |
| | | ------ | | Consumer Price Index + 500 Basis points | | 4.46% |
All Portfolio returns are net of fees and expenses.
Past performance is no guarantee of future results. The performance quoted represents past performance. Investment return and principal value will fluctuate so the Portfolio shares, when redeemed, may be worth more or less than their original cost. The Portfolio’s performance does not reflect the deduction of additional charges and expenses imposed in connection with investing in Variable Contracts, which will reduce returns. Current performance may be lower or higher than the performance data quoted. Performance data current to the most recent month-end is available by calling (800) 927-4648.
| | | | | | | | |
| Expense Example | | Actual Performance | | | | Hypothetical Performance |
| | | | | | | (5% return before expenses) |
Beginning Account Value (01/31/06) | | $ | 1,000.00 | | | | $ | 1,000.00 |
Ending Account Value (06/30/06) | | $ | 979.70 | | | | $ | 1,018.82 |
Expenses Paid During Period† | | $ | 1.84 | | | | $ | 1.88 |
† Expenses are equal to the Portfolio’s Institutional Class annualized expense ratio of 0.45%, multiplied by the average account value over the period, multiplied by 151/365 (to reflect the period since the Portfolio’s Institutional Class share commenced operations on 01/31/06). The expense ratio excludes the expenses of the Underlying Funds, which based upon the allocation of the Portfolio’s assets among the Underlying Funds are indirectly borne by the shareholders of the Portfolio. The Underlying Fund Expenses for the Portfolio are estimated at 0.63%. Overall fees and expenses of investing in the Portfolio will be higher because the example does not reflect Variable Contract fees and expenses.
Please refer to page 3 herein for a description of the Portfolio’s benchmark and an explanation of the information presented in the above Expense Example.
Portfolio Insights
| » | | The PIMCO All Asset Portfolio seeks to achieve its investment objective by investing under normal circumstances substantially all of its assets in Institutional Class Shares of the Underlying Funds (i.e., any of the PIMCO Funds, except the All Asset and All Asset All Authority Funds). |
| » | | Significant exposure to the Treasury Inflation-Protected Securities (“TIPS”) asset class detracted significantly from tactical asset allocation alpha due to the asset class, particularly longer dated TIPS, posting negative returns. |
| » | | Less than optimal exposure to commodities detracted from performance, as the Dow Jones AIG Commodity Index returned 3.58% over the period. |
| » | | Less than optimal exposure to Real Estate Investment Trusts (“REITs”) detracted from performance, as the Dow Jones Wilshire REIT Index gained 14.40% for the period. |
| » | | Significant exposure to lower duration instruments was positive for performance, as lower duration assets tend to outperform assets with longer duration in a rising interest rate environment. Exposure to the Floating Rate Income Fund provided positive returns. |
| » | | Significant exposure to the Developing Local Markets Fund and emerging market currencies added to performance with the fund returning 4.34%. |
| » | | Exposure to the High Yield Fund was positive due to coupon selection providing solid returns for the period. |
| | | | | | |
| 4 | | PIMCO Variable Insurance Trust | | | | |
|
|
| PIMCO Foreign Bond Portfolio (U.S. Dollar-Hedged) |
|
Cumulative Returns Through June 30, 2006

Foreign Bond Portfolio JPMorgan GBI
(U.S. Dollar-Hedged) Global ex-US Index
Institutional Class Hedged in USD
--------------------- -------------------
04/30/2000 $10,000 $10,000
05/31/2000 10,041 10,080
06/30/2000 10,115 10,128
07/31/2000 10,181 10,201
08/31/2000 10,187 10,203
09/30/2000 10,223 10,291
10/31/2000 10,232 10,374
11/30/2000 10,401 10,558
12/31/2000 10,602 10,675
01/31/2001 10,747 10,802
02/28/2001 10,847 10,895
03/31/2001 10,973 10,977
04/30/2001 10,882 10,903
05/31/2001 10,947 10,959
06/30/2001 11,005 11,019
07/31/2001 11,152 11,120
08/31/2001 11,255 11,213
09/30/2001 11,264 11,259
10/31/2001 11,584 11,465
11/30/2001 11,479 11,416
12/31/2001 11,424 11,321
01/31/2002 11,504 11,334
02/28/2002 11,541 11,344
03/31/2002 11,511 11,286
04/30/2002 11,620 11,377
05/31/2002 11,615 11,392
06/30/2002 11,800 11,539
07/31/2002 11,883 11,651
08/31/2002 11,996 11,791
09/30/2002 12,123 11,925
10/31/2002 12,140 11,920
11/30/2002 12,215 11,942
12/31/2002 12,379 12,114
01/31/2003 12,538 12,209
02/28/2003 12,685 12,293
03/31/2003 12,614 12,278
04/30/2003 12,670 12,305
05/31/2003 12,843 12,501
06/30/2003 12,806 12,436
07/31/2003 12,645 12,298
08/31/2003 12,547 12,209
09/30/2003 12,664 12,343
10/31/2003 12,543 12,228
11/30/2003 12,536 12,239
12/31/2003 12,675 12,354
01/31/2004 12,716 12,409
02/29/2004 12,829 12,528
03/31/2004 12,855 12,561
04/30/2004 12,827 12,463
05/31/2004 12,810 12,442
06/30/2004 12,788 12,426
07/31/2004 12,836 12,476
08/31/2004 12,984 12,653
09/30/2004 13,032 12,725
10/31/2004 13,121 12,806
11/30/2004 13,311 12,917
12/31/2004 13,395 12,997
01/31/2005 13,507 13,124
02/28/2005 13,459 13,061
03/31/2005 13,575 13,160
04/30/2005 13,735 13,327
05/31/2005 13,829 13,437
06/30/2005 13,952 13,582
07/31/2005 13,916 13,522
08/31/2005 14,028 13,632
09/30/2005 14,010 13,617
10/31/2005 13,924 13,547
11/30/2005 13,958 13,623
12/31/2005 14,102 13,724
01/31/2006 14,071 13,699
02/28/2006 14,134 13,730
03/31/2006 14,024 13,610
04/30/2006 13,957 13,533
05/31/2006 14,022 13,611
06/30/2006 14,009 13,606
$10,000 invested at the end of the nearest month to the inception date of the Portfolio’s Institutional Class.
Country Allocation‡
| | |
Short-Term Instruments | | 28.7% |
United States | | 27.4% |
Germany | | 15.0% |
Japan | | 9.9% |
Spain | | 7.4% |
United Kingdom | | 6.4% |
Other | | 5.2% |
| | ‡ | % of Total Investments as of June 30, 2006 |
| | | | | | | | | | | | |
| Average Annual Total Return for the period ended June 30, 2006 |
| | | | | | | 6 Months* | | 1 Year | | 5 Years | | Since
Inception
(04/10/00)** |
| | |
| | PIMCO Foreign Bond Portfolio (U.S. Dollar-Hedged) Institutional Class | | -0.66% | | 0.41% | | 4.95% | | 5.59% |
| | |
| | JPMorgan GBI Global ex-US Index Hedged in USD | | -0.86% | | 0.17% | | 4.31% | | 5.14% |
All Portfolio returns are net of fees and expenses.
* Cumulative return.
** The Institutional Class shares commenced operations on 04/10/00. Index comparisons began on 03/31/00.
Past performance is no guarantee of future results. The performance quoted represents past performance. Investment return and principal value will fluctuate so the Portfolio shares, when redeemed, may be worth more or less than their original cost. The Portfolio’s performance does not reflect the deduction of additional charges and expenses imposed in connection with investing in Variable Contracts, which will reduce returns. Current performance may be lower or higher than the performance data quoted. Performance data current to the most recent month-end is available by calling (800) 927-4648.
| | | | | | | | |
| Expense Example | | Actual Performance | | | | Hypothetical Performance |
| | | | | | | (5% return before expenses) |
Beginning Account Value (01/01/06) | | $ | 1,000.00 | | | | $ | 1,000.00 |
Ending Account Value (06/30/06) | | $ | 993.40 | | | | $ | 1,021.08 |
Expenses Paid During Period† | | $ | 3.71 | | | | $ | 3.76 |
† Expenses are equal to the Portfolio’s Institutional Class annualized expense ratio of 0.75%, multiplied by the average account value over the period, multiplied by 181/365 (to reflect the one-half year period). Overall fees and expenses of investing in the Portfolio will be higher because the example does not reflect Variable Contract fees and expenses.
Please refer to page 3 herein for a description of the Portfolio’s benchmark and an explanation of the information presented in the above Expense Example.
Portfolio Insights
| » | | The PIMCO Foreign Bond Portfolio (U.S. Dollar-Hedged) seeks to achieve its investment objective by investing under normal circumstances at least 80% of its assets in Fixed-Income Instruments of issuers located outside the United States, representing at least three foreign countries, which may be represented by futures contracts (including related options) with respect to such securities, and options on such securities. |
| » | | An underweight to Euroland duration and a curve flattening bias added to returns as these yields rose on stronger than expected economic data and hawkish European Central Bank comments. |
| » | | An overweight to U.S. duration and an emphasis on shorter maturities detracted from returns, as rates rose and the yield curve continued to flatten amid concern that the Federal Reserve would extend its tightening cycle. |
| » | | An emphasis on mortgage-backed securities was positive for performance as mortgages outperformed like-duration Treasuries amidst declining volatility and heightened investor demand. |
| » | | A focus on the short-to-intermediate portion of the U.K. curve was negative for returns as U.K. long-dated gilts outperformed on firmer demand for longer dated assets. |
| » | | A long position in the Euro and the Yen versus the U.S. dollar was positive for returns as the Euro and the Yen appreciated on improving growth and expectations of monetary tightening. |
| | | | | | |
| | | Semiannual Report | | June 30, 2006 | | 5 |
|
|
| PIMCO Global Bond Portfolio (Unhedged) |
|
Cumulative Returns Through June 30, 2006

Global Bond Portfolio JPMorgan GBI Global
(Unhedged) Institutional FX NY Index Unhedged
Class in USD
------------------------ --------------------
01/31/2006 $10,000 $10,000
02/28/2006 9,983 9,954
03/31/2006 9,880 9,833
04/30/2006 10,105 10,049
05/31/2006 10,219 10,228
06/30/2006 10,133 10,129
$10,000 invested at the end of the nearest month to the inception date of the Portfolio’s Institutional Class.
Country Allocation‡
| | |
United States | | 36.3% |
Short-Term Instruments | | 21.7% |
United Kingdom | | 12.4% |
Japan | | 10.3% |
Germany | | 9.7% |
Spain | | 5.5% |
Other | | 4.1% |
| | ‡ | % of Total Investments as of June 30, 2006 |
| | | | | | |
| Cumulative Total Return for the period ended June 30, 2006 |
| | | | | | | Since
Inception
(01/31/06) |
| | |
| | PIMCO Global Bond Portfolio (Unhedged) Institutional Class | | 1.32% |
| | |
| | JPMorgan GBI Global FX NY Index Unhedged in USD | | 1.29% |
All Portfolio returns are net of fees and expenses.
Past performance is no guarantee of future results. The performance quoted represents past performance. Investment return and principal value will fluctuate so the Portfolio shares, when redeemed, may be worth more or less than their original cost. The Portfolio’s performance does not reflect the deduction of additional charges and expenses imposed in connection with investing in Variable Contracts, which will reduce returns. Current performance may be lower or higher than the performance data quoted. Performance data current to the most recent month-end is available by calling (800) 927-4648.
| | | | | | | | |
| Expense Example | | Actual Performance | | | | Hypothetical Performance |
| | | | | | | (5% return before expenses) |
Beginning Account Value (01/31/06) | | $ | 1,000.00 | | | | $ | 1,000.00 |
Ending Account Value (06/30/06) | | $ | 1,013.20 | | | | $ | 1,017.58 |
Expenses Paid During Period† | | $ | 3.12 | | | | $ | 3.13 |
† Expenses are equal to the Portfolio’s Institutional Class annualized expense ratio of 0.75%, multiplied by the average account value over the period, multiplied by 151/365 (to reflect the period since the Portfolio’s Institutional Class share commenced operations on 01/31/06). Overall fees and expenses of investing in the Portfolio will be higher because the example does not reflect Variable Contract fees and expenses.
Please refer to page 3 herein for a description of the Portfolio’s benchmark and an explanation of the information presented in the above Expense Example.
Portfolio Insights
| » | | The PIMCO Global Bond Portfolio (Unhedged) seeks to achieve its investment objective by investing under normal circumstances at least 80% of its assets in Fixed-Income Instruments of issuers located in at least three countries (one of which may be the United States), which may be represented by futures contracts (including related options) with respect to such securities, and options on such securities. |
| » | | An underweight to Euroland duration and a curve flattening bias added to returns as these yields rose on stronger than expected economic data and hawkish European Central Bank comments. |
| » | | An overweight to U.S. duration and an emphasis on shorter maturities detracted from returns, as rates rose and the yield curve continued to flatten amid concern that the Federal Reserve would extend its tightening cycle. |
| » | | An emphasis on mortgage-backed securities was positive for performance as mortgages outperformed like-duration Treasuries amidst declining volatility and heightened investor demand. |
| » | | A focus on the short-to-intermediate portion of the U.K. curve was negative for returns as U.K. long-dated gilts outperformed on firmer demand for longer dated assets. |
| » | | A long position in the Euro and the Yen versus the U.S. dollar was positive for returns as the Euro and the Yen appreciated on improving growth and expectations of monetary tightening. |
| | | | | | |
| 6 | | PIMCO Variable Insurance Trust | | | | |
|
|
| PIMCO High Yield Portfolio |
|
Cumulative Returns Through June 30, 2006
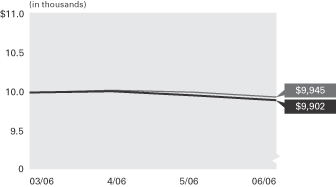
High Yield Merrill Lynch US
Portfolio High Yield, BB-B Rated,
Advisor Class Constrained Index
------------- -----------------
03/31/2006 $10,000 $10,000
04/30/2006 10,019 10,032
05/31/2006 9,964 10,004
06/30/2006 9,902 9,945
$10,000 invested at the beginning of the first full month following the inception date of the Portfolio’s Advisor Class.
Sector Breakdown‡
| | |
Corporate Bonds & Notes | | 82.3% |
Short-Term Instruments | | 7.4% |
Bank Loan Obligations | | 4.6% |
Foreign Currency-Denominated Issues | | 3.7% |
Other | | 2.0% |
| | ‡ | % of Total Investments as of June 30, 2006 |
| | | | | | |
| Cumulative Total Return for the period ended June 30, 2006 | | |
| | | | | | | Since
Inception
(03/31/06) |
| | |
| | PIMCO High Yield Portfolio Advisor Class | | -0.98% |
| | |
| | Merrill Lynch US High Yield, BB-B Rated, Constrained Index | | -0.55% |
All Portfolio returns are net of fees and expenses.
Past performance is no guarantee of future results. The performance quoted represents past performance. Investment return and principal value will fluctuate so that Fund shares, when redeemed, may be worth more or less than their original cost. The Portfolio’s performance does not reflect the deduction of additional charges and expenses imposed in connection with investing in Variable Contracts, which will reduce returns. Current performance may be lower or higher than the performance data quoted. Performance data current to the most recent month-end is available by calling (800) 927-4648.
| | | | | | | | | | |
| Expense Example | | | | Actual Performance | | | | Hypothetical Performance |
| | | | | | | | | (5% return before expenses) |
Beginning Account Value (03/31/06) | | | | $ | 1,000.00 | | | | $ | 1,000.00 |
Ending Account Value (06/30/06) | | | | $ | 990.20 | | | | $ | 1,010.46 |
Expenses Paid During Period† | | | | $ | 2.13 | | | | $ | 2.15 |
† Expenses are equal to the Portfolio’s Advisor Class annualized expense ratio of 0.85%, multiplied by the average account value over the period, multiplied by 92/365 (to reflect the period since the Portfolio’s Advisor Class share commenced operations on 03/31/06). Overall fees and expenses of investing in the Portfolio will be higher because the example does not reflect Variable Contract fees and expenses.
Please refer to page 3 herein for a description of the Portfolio’s benchmark and an explanation of the information presented in the above Expense Example.
Portfolio Insights
| » | | The PIMCO High Yield Portfolio seeks to achieve its investment objective by investing under normal circumstances at least 80% of its assets in a diversified portfolio of high-yield securities rated below investment grade but rated at least Caa (subject to a maximum of 5% of total assets in securities rated Caa) by Moody’s or S&P, or, if unrated, determined by PIMCO to be of comparable quality. |
| » | | An underweight to BB-rated bonds versus the index contributed to relative performance, as these issues underperformed B-rated bonds by about 1.50%. |
| » | | An overweight to the automotive sector helped performance as these bonds significantly outperformed the high-yield market. |
| » | | As cable/pay TV bonds outperformed the high- yield market, an overweight to the sector benefited the Portfolio. |
| » | | Security selection in the utility sector was positive as electric generation companies led the overall sector. |
| » | | As telecom bonds underperformed the market, an overweight to the sector negatively impacted the Portfolio’s performance. |
| » | | As the energy sector was among the worst performing broad market sectors in the first half of the year, an overweight to this industry category detracted from returns. |
| » | | Modest exposure to emerging market sovereign bonds, which underperformed high yield by about 3.75%, hurt performance. |
| | | | | | |
| | | Semiannual Report | | June 30, 2006 | | 7 |
|
|
| PIMCO Low Duration Portfolio |
|
Cumulative Returns Through June 30, 2006
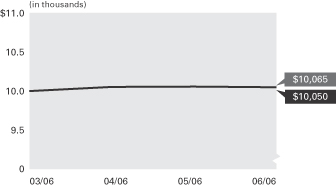
Low Duration Portfolio Merrill Lynch 1-3 year
Advisor Class Treasury Index
---------------------- ----------------------
03/31/2006 $10,000 $10,000
04/30/2006 10,052 10,031
05/31/2006 10,055 10,047
06/30/2006 10,050 10,065
$10,000 invested at the beginning of the first full month following the inception date of the Portfolio’s Advisor Class.
Sector Breakdown‡
| | |
Short-Term Instruments | | 51.7% |
U.S. Government Agencies | | 23.1% |
Corporate Bonds & Notes | | 12.3% |
Mortgage-Backed Securities | | 7.1% |
Asset-Backed Securities | | 5.6% |
Other | | 0.2% |
| | ‡ | % of Total Investments as of June 30, 2006 |
| | | | | | |
| Cumulative Total Return for the period ended June 30, 2006 |
| | | | | | | Since
Inception
(03/31/06) |
| | |
| | PIMCO Low Duration Portfolio Advisor Class | | 0.50% |
| | |
| | Merrill Lynch 1-3 Year Treasury Index | | 0.65% |
All Portfolio returns are net of fees and expenses.
Past performance is no guarantee of future results. The performance quoted represents past performance. Investment return and principal value will fluctuate so that Fund shares, when redeemed, may be worth more or less than their original cost. The Portfolio’s performance does not reflect the deduction of additional charges and expenses imposed in connection with investing in Variable Contracts, which will reduce returns. Current performance may be lower or higher than the performance data quoted. Performance data current to the most recent month-end is available by calling (800) 927-4648.
| | | | | | | | | | |
| Expense Example | | | | Actual Performance | | | | Hypothetical Performance |
| | | | | | | | | (5% return before expenses) |
Beginning Account Value (03/31/06) | | | | $ | 1,000.00 | | | | $ | 1,000.00 |
Ending Account Value (06/30/06) | | | | $ | 1,005.00 | | | | $ | 1,010.60 |
Expenses Paid During Period† | | | | $ | 1.87 | | | | $ | 1.88 |
† Expenses are equal to the Portfolio’s Advisor Class annualized expense ratio of 0.75%, multiplied by the average account value over the period, multiplied by 92/365 (to reflect the period since the Portfolio’s Advisor Class share commenced operations on 03/31/06). Overall fees and expenses of investing in the Portfolio will be higher because the example does not reflect Variable Contract fees and expenses.
Please refer to page 3 herein for a description of the Portfolio’s benchmark and an explanation of the information presented in the above Expense Example.
Portfolio Insights
| » | | The PIMCO Low Duration Portfolio seeks to achieve its investment objective by investing, under normal circumstances, at least 65% of its total assets in a diversified portfolio of Fixed-Income Securities of varying maturities. |
| » | | Duration and maturity structure were the most significant detractors from the Portfolio’s performance during the six-month period ended June 30, 2006. |
| » | | The Portfolio’s above index duration detracted from returns as concerns about accelerating inflation and more monetary tightening pushed interest rates higher. |
| » | | The Portfolio’s broader-than-index maturity structure with a curve steepening bias detracted from returns as the yield curve continued to flatten. |
| » | | A mortgage emphasis added to returns as this sector outperformed Treasuries on a like-duration basis. Security selection within the mortgage sector also enhanced performance. |
| » | | Investment grade and high-yield corporate bonds were positive as these issues benefited from a strengthening economy and investors’ search for extra yield. |
| » | | Minimal exposure to high-quality emerging markets was slightly positive for performance as emerging markets bonds benefited from continued improvement in credit fundamentals and investors’ demand for higher-yielding securities early in the period. |
| | | | | | |
| 8 | | PIMCO Variable Insurance Trust | | | | |
[THIS PAGE INTENTIONALLY LEFT BLANK]
| | | | | | |
| | | Semiannual Report | | June 30, 2006 | | 9 |
Financial Highlights
| | | | | | | | | | | | | | | | | | | | | | |
| | | | | | |
| Selected Per Share Data for the Period Ended: | | Net Asset Value
Beginning of
Period | | Net Investment
Income (a) | | Net Realized/
Unrealized Gain
(Loss) on
Investments (a) | | | Total Income
(Loss)
from Investment
Operations | | | Dividends from
Net Investment
Income | | | Distributions
from Net
Realized Capital
Gains | |
| | | | | | |
All Asset Portfolio | | | | | | | | | | | | | | | | | | | | | | |
| Institutional Class | | | | | | | | | | | | | | | | | | | | | | |
01/31/2006 - 06/30/2006+ | | $ | 11.93 | | $ | 0.22 | | $ | (0.46 | ) | | $ | (0.24 | ) | | $ | (0.24 | ) | | $ | 0.00 | |
| | | | | | |
Foreign Bond Portfolio (U.S. Dollar-Hedged) | | | | | | | | | | | | | | | | | | | | | | |
| Institutional Class | | | | | | | | | | | | | | | | | | | | | | |
06/30/2006+ | | $ | 10.34 | | $ | 0.18 | | $ | (0.25 | ) | | $ | (0.07 | ) | | $ | (0.16 | ) | | $ | 0.00 | |
12/31/2005 | | | 10.15 | | | 0.29 | | | 0.24 | | | | 0.53 | | | | (0.26 | ) | | | (0.08 | ) |
12/31/2004 | | | 10.03 | | | 0.24 | | | 0.33 | | | | 0.57 | | | | (0.22 | ) | | | (0.23 | ) |
12/31/2003 | | | 10.07 | | | 0.27 | | | (0.03 | ) | | | 0.24 | | | | (0.28 | ) | | | 0.00 | |
12/31/2002 | | | 9.69 | | | 0.32 | | | 0.47 | | | | 0.79 | | | | (0.37 | ) | | | (0.04 | ) |
12/31/2001 | | | 9.40 | | | 0.46 | | | 0.26 | | | | 0.72 | | | | (0.43 | ) | | | 0.00 | |
| | | | | | |
Global Bond Portfolio (Unhedged) | | | | | | | | | | | | | | | | | | | | | | |
| Institutional Class | | | | | | | | | | | | | | | | | | | | | | |
01/31/2006 - 06/30/2006+ | | $ | 12.00 | | $ | 0.18 | | $ | (0.02 | ) | | $ | 0.16 | | | $ | (0.17 | ) | | $ | 0.00 | |
| | | | | | |
High Yield Portfolio | | | | | | | | | | | | | | | | | | | | | | |
| Advisor Class | | | | | | | | | | | | | | | | | | | | | | |
01/31/2006 - 06/30/2006+ | | $ | 8.24 | | $ | 0.14 | | $ | (0.22 | ) | | $ | (0.08 | ) | | $ | (0.14 | ) | | $ | 0.00 | |
| | | | | | |
Low Duration Portfolio | | | | | | | | | | | | | | | | | | | | | | |
| Advisor Class | | | | | | | | | | | | | | | | | | | | | | |
01/31/2006 - 06/30/2006+ | | $ | 10.01 | | $ | 0.10 | | $ | (0.05 | ) | | $ | 0.05 | | | $ | (0.10 | ) | | $ | 0.00 | |
+ Unaudited
* Annualized
(a) Per share amounts based on average number of shares outstanding during the period.
(b) Ratio of expense to average net assets excluding interest expense is 0.75%.
| | | | |
| 10 | | PIMCO Variable Insurance Trust | | See Accompanying Notes |
| | | | | | | | | | | | | | | | | | | | |
Total
Distributions | | | Net Asset
Value End
of Period | | Total Return | | | Net Assets End
of Period (000s) | | Ratio of
Expenses to
Average
Net Assets | | | Ratio of Net
Investment
Income
to Average Net
Assets | | | Portfolio
Turnover Rate | |
| | | | | | |
| | | | | | | | | | | | | | | | | | | | | |
| | | | | | | | | | | | | | | | | | | | | |
| $ | (0.24 | ) | | $ | 11.45 | | (2.03 | )% | | $ | 10 | | 0.45 | %* | | 4.52 | %* | | 33 | % |
| | | | | | |
| | | | | | | | | | | | | | | | | | | | | |
| | | | | | | | | | | | | | | | | | | | | |
| $ | (0.16 | ) | | $ | 10.11 | | (0.66 | )% | | $ | 14 | | 0.75 | %* | | 3.60 | %* | | 193 | % |
| | (0.34 | ) | | | 10.34 | | 5.28 | | | | 14 | | 0.75 | | | 2.81 | | | 453 | |
| | (0.45 | ) | | | 10.15 | | 5.68 | | | | 13 | | 0.75 | | | 2.37 | | | 515 | |
| | (0.28 | ) | | | 10.03 | | 2.39 | | | | 13 | | 0.78 | (b) | | 2.69 | | | 600 | |
| | (0.41 | ) | | | 10.07 | | 8.36 | | | | 12 | | 0.75 | | | 3.36 | | | 321 | |
| | (0.43 | ) | | | 9.69 | | 7.75 | | | | 935 | | 0.75 | | | 4.80 | | | 285 | |
| | | | | | |
| | | | | | | | | | | | | | | | | | | | | |
| | | | | | | | | | | | | | | | | | | | | |
| $ | (0.17 | ) | | $ | 11.99 | | 1.32 | % | | $ | 10 | | 0.75 | %* | | 3.68 | %* | | 152 | % |
| | | | | | |
| | | | | | | | | | | | | | | | | | | | | |
| | | | | | | | | | | | | | | | | | | | | |
| $ | (0.14 | ) | | $ | 8.02 | | (0.98 | )% | | $ | 10 | | 0.85 | %* | | 7.02 | %* | | 45 | % |
| | | | | | |
| | | | | | | | | | | | | | | | | | | | | |
| | | | | | | | | | | | | | | | | | | | | |
| $ | (0.10 | ) | | $ | 9.96 | | 0.50 | % | | $ | 10 | | 0.75 | %* | | 4.14 | %* | | 127 | % |
| | | | | | |
| See Accompanying Notes | | Semiannual Report | | June 30, 2006 | | 11 |
| | |
| |
Statements of Assets and Liabilities | | June 30, 2006 (Unaudited) |
| | | | | | | | | | | | | | | | | | | | |
| | | All Asset
Portfolio | | | Foreign Bond
Portfolio
(U.S. Dollar-
Hedged) | | | Global Bond
Portfolio
(Unhedged) | | | High Yield
Portfolio | | | Low Duration
Portfolio | |
| | | | | |
Assets: | | | | | | | | | | | | | | | | | | | | |
Investments, at value | | $ | 0 | | | $ | 58,481 | | | $ | 146,967 | | | $ | 454,275 | | | $ | 720,319 | |
Investments in Affiliates, at value | | | 364,075 | | | | 0 | | | | 0 | | | | 0 | | | | 0 | |
Cash | | | 1 | | | | 5 | | | | 934 | | | | 1,169 | | | | 0 | |
Foreign currency, at value | | | 0 | | | | 656 | | | | 1,620 | | | | 1,682 | | | | 8 | |
Receivable for investments sold | | | 0 | | | | 4,472 | | | | 5,205 | | | | 1,449 | | | | 10 | |
Receivable for investments sold on delayed delivery basis | | | 0 | | | | 2,557 | | | | 403 | | | | 75 | | | | 0 | |
Receivable for Portfolio shares sold | | | 2,020 | | | | 425 | | | | 500 | | | | 5,977 | | | | 1,709 | |
Interest and dividends receivable | | | 0 | | | | 554 | | | | 1,334 | | | | 8,878 | | | | 1,181 | |
Interest and dividends receivable from Affiliates | | | 1,899 | | | | 0 | | | | 0 | | | | 0 | | | | 0 | |
Variation margin receivable | | | 0 | | | | 27 | | | | 91 | | | | 53 | | | | 197 | |
Swap premiums paid | | | 0 | | | | 871 | | | | 1,781 | | | | 0 | | | | 59 | |
Unrealized appreciation on forward foreign currency contracts | | | 0 | | | | 32 | | | | 599 | | | | 1 | | | | 212 | |
Unrealized appreciation on swap agreements | | | 0 | | | | 709 | | | | 1,258 | | | | 171 | | | | 70 | |
Other assets | | | 0 | | | | 0 | | | | 0 | | | | 0 | | | | 1 | |
| | | | 367,995 | | | | 68,789 | | | | 160,692 | | | | 473,730 | | | | 723,766 | |
| | | | | |
Liabilities: | | | | | | | | | | | | | | | | | | | | |
Payable for investments purchased | | $ | 0 | | | $ | 4,391 | | | $ | 18,639 | | | $ | 4,316 | | | $ | 98,291 | |
Payable for investments in Affiliates purchased | | | 3,433 | | | | 0 | | | | 0 | | | | 0 | | | | 0 | |
Payable for investments purchased on delayed delivery basis | | | 0 | | | | 8,316 | | | | 995 | | | | 17,885 | | | | 0 | |
Payable for short sale | | | 0 | | | | 384 | | | | 401 | | | | 0 | | | | 0 | |
Written options outstanding | | | 0 | | | | 90 | | | | 358 | | | | 73 | | | | 1,344 | |
Payable for Portfolio shares redeemed | | | 228 | | | | 171 | | | | 34 | | | | 118 | | | | 143 | |
Accrued investment advisory fee | | | 62 | | | | 12 | | | | 30 | | | | 100 | | | | 135 | |
Accrued administration fee | | | 77 | | | | 23 | | | | 60 | | | | 140 | | | | 135 | |
Accrued servicing fee | | | 62 | | | | 6 | | | | 19 | | | | 50 | | | | 70 | |
Variation margin payable | | | 0 | | | | 0 | | | | 0 | | | | 0 | | | | 23 | |
Recoupment payable to Manager | | | 5 | | | | 0 | | | | 0 | | | | 0 | | | | 0 | |
Swap premiums received | | | 0 | | | | 644 | | | | 1,465 | | | | 11 | | | | 0 | |
Unrealized depreciation on forward foreign currency contracts | | | 0 | | | | 224 | | | | 370 | | | | 288 | | | | 2,162 | |
Unrealized depreciation on swap agreements | | | 0 | | | | 264 | | | | 524 | | | | 44 | | | | 12 | |
| | | | 3,867 | | | | 14,525 | | | | 22,895 | | | | 23,025 | | | | 102,315 | |
| | | | | |
Net Assets | | $ | 364,128 | | | $ | 54,264 | | | $ | 137,797 | | | $ | 450,705 | | | $ | 621,451 | |
| | | | | |
Net Assets Consist of: | | | | | | | | | | | | | | | | | | | | |
Paid in capital | | $ | 368,395 | | | $ | 54,016 | | | $ | 138,099 | | | $ | 463,809 | | | $ | 635,900 | |
Undistributed (overdistributed) net investment income | | | 6,814 | | | | 600 | | | | (1,174 | ) | | | (507 | ) | | | 680 | |
Accumulated undistributed net realized gain (loss) | | | (1,686 | ) | | | (964 | ) | | | 514 | | | | (5,172 | ) | | | (8,247 | ) |
Net unrealized appreciation (depreciation) | | | (9,395 | ) | | | 612 | | | | 358 | | | | (7,425 | ) | | | (6,882 | ) |
| | | $ | 364,128 | | | $ | 54,264 | | | $ | 137,797 | | | $ | 450,705 | | | $ | 621,451 | |
| | | | | |
Net Assets: | | | | | | | | | | | | | | | | | | | | |
Institutional Class | | $ | 10 | | | $ | 14 | | | $ | 10 | | | $ | 1,042 | | | $ | 25,479 | |
Administrative Class | | | 233,824 | | | | 54,250 | | | | 137,787 | | | | 449,653 | | | | 595,962 | |
Advisor Class | | | 65,231 | | | | 0 | | | | 0 | | | | 10 | | | | 10 | |
Class M | | | 65,063 | | | | 0 | | | | 0 | | | | 0 | | | | 0 | |
| | | | | |
Shares Issued and Outstanding: | | | | | | | | | | | | | | | | | | | | |
Institutional Class | | | 1 | | | | 1 | | | | 1 | | | | 130 | | | | 2,557 | |
Administrative Class | | | 20,415 | | | | 5,364 | | | | 11,492 | | | | 56,036 | | | | 59,807 | |
Advisor Class | | | 5,693 | | | | 0 | | | | 0 | | | | 1 | | | | 1 | |
Class M | | | 5,684 | | | | 0 | | | | 0 | | | | 0 | | | | 0 | |
| | | | | |
Net Asset Value and Redemption Price Per Share (Net Assets Per Share Outstanding) | | | | | | | | | | | | | | | | | | | | |
Institutional Class | | $ | 11.45 | | | $ | 10.11 | | | $ | 11.99 | | | $ | 8.02 | | | $ | 9.96 | |
Administrative Class | | | 11.45 | | | | 10.11 | | | | 11.99 | | | | 8.02 | | | | 9.96 | |
Advisor Class | | | 11.45 | | | | 0.00 | | | | 0.00 | | | | 8.02 | | | | 9.96 | |
Class M | | | 11.44 | | | | 0.00 | | | | 0.00 | | | | 0.00 | | | | 0.00 | |
| | | | | |
Cost of Investments Owned | | $ | 0 | | | $ | 58,111 | | | $ | 147,653 | | | $ | 459,918 | | | $ | 719,941 | |
Cost of Investments in Affiliates Owned | | $ | 373,469 | | | $ | 0 | | | $ | 0 | | | $ | 0 | | | $ | 0 | |
Cost of Foreign Currency Held | | $ | 0 | | | $ | 650 | | | $ | 1,609 | | | $ | 1,658 | | | $ | 8 | |
Proceeds Received on Short Sales | | $ | 0 | | | $ | 387 | | | $ | 401 | | | $ | 0 | | | $ | 0 | |
Premiums Received on Written Options | | $ | 0 | | | $ | 235 | | | $ | 648 | | | $ | 283 | | | $ | 1,189 | |
| | | | |
| 12 | | PIMCO Variable Insurance Trust | | See Accompanying Notes |
Statements of Operations
| | | | | | | | | | | | | | | | | | | | |
| Six Months Ended June 30, 2006 (Unaudited) | | All Asset
Portfolio | | | Foreign Bond
Portfolio
(U.S. Dollar-
Hedged) | | | Global Bond
Portfolio
(Unhedged) | | | High Yield
Portfolio | | | Low Duration
Portfolio | |
| | | | | |
Investment Income: | | | | | | | | | | | | | | | | | | | | |
Interest, net of foreign taxes | | $ | 14 | | | $ | 1,083 | | | $ | 2,551 | | | $ | 17,337 | | | $ | 12,579 | |
Dividends, net of foreign taxes | | | 0 | | | | 21 | | | | 19 | | | | 92 | | | | 20 | |
Dividends from Affiliate investments | | | 7,717 | | | | 0 | | | | 0 | | | | 0 | | | | 0 | |
Miscellaneous income | | | 0 | | | | 1 | | | | 1 | | | | 595 | | | | 5 | |
Total Income | | | 7,731 | | | | 1,105 | | | | 2,571 | | | | 18,024 | | | | 12,604 | |
| | | | | |
Expenses: | | | | | | | | | | | | | | | | | | | | |
Investment advisory fees | | | 337 | | | | 64 | | | | 147 | | | | 579 | | | | 686 | |
Administration fees | | | 422 | | | | 127 | | | | 295 | | | | 811 | | | | 686 | |
Servicing fees - Administrative Class | | | 190 | | | | 38 | | | | 89 | | | | 347 | | | | 394 | |
Distribution and/or serving fee - Class M | | | 152 | | | | 0 | | | | 0 | | | | 0 | | | | 0 | |
Distribution and/or servicing fees - Advisor Class | | | 21 | | | | 0 | | | | 0 | | | | 0 | | | | 0 | |
Trustees’ fees | | | 0 | | | | 0 | | | | 1 | | | | 3 | | | | 3 | |
Interest expense | | | 1 | | | | 0 | | | | 0 | | | | 3 | | | | 0 | |
Miscellaneous expense | | | 10 | | | | 0 | | | | 0 | | | | 0 | | | | 0 | |
Total Expenses | | | 1,133 | | | | 229 | | | | 532 | | | | 1,743 | | | | 1,769 | |
| | | | | |
Net Investment Income | | | 6,598 | | | | 876 | | | | 2,039 | | | | 16,281 | | | | 10,835 | |
| | | | | |
Net Realized and Unrealized Gain (Loss): | | | | | | | | | | | | | | | | | | | | |
Net realized gain (loss) on investments | | | 0 | | | | (234 | ) | | | (598 | ) | | | 1,981 | | | | (1,479 | ) |
Net realized (loss) on Affiliate investments | | | (3,155 | ) | | | 0 | | | | 0 | | | | 0 | | | | 0 | |
Net realized gain (loss) on futures contracts, options and swaps | | | 0 | | | | (201 | ) | | | (446 | ) | | | 350 | | | | 1,174 | |
Net realized gain (loss) on foreign currency transactions | | | 0 | | | | (858 | ) | | | 1,865 | | | | (199 | ) | | | (1,885 | ) |
Net change in unrealized appreciation (depreciation) on investments | | | 0 | | | | (310 | ) | | | (827 | ) | | | (10,574 | ) | | | (2,194 | ) |
Net change in unrealized (depreciation) on Affiliate investments | | | (7,231 | ) | | | 0 | | | | 0 | | | | 0 | | | | 0 | |
Net change in unrealized appreciation (depreciation) on futures contracts, options and swaps | | | 0 | | | | 522 | | | | 691 | | | | (769 | ) | | | (5,438 | ) |
Net change in unrealized appreciation (depreciation) on translation of assets and liabilities denominated in foreign currencies | | | 0 | | | | (150 | ) | | | (162 | ) | | | (282 | ) | | | 2,742 | |
Net Gain (Loss) | | | (10,386 | ) | | | (1,231 | ) | | | 523 | | | | (9,493 | ) | | | (7,080 | ) |
| | | | | |
Net Increase (Decrease) in Net Assets Resulting from Operations | | $ | (3,788 | ) | | $ | (355 | ) | | $ | 2,562 | | | $ | 6,788 | | | $ | 3,755 | |
| | | | | | |
| See Accompanying Notes | | Semiannual Report | | June 30, 2006 | | 13 |
Statements of Changes in Net Assets
| | | | | | | | | | | | | | | | |
| | | All Asset Portfolio | | | Foreign Bond Portfolio
(U.S. Dollar-Hedged) | |
| | | | |
| (Amounts in Thousands) | | Six Months Ended
June 30, 2006
(Unaudited) | | | Year Ended
December 31, 2005 | | | Six Months Ended
June 30, 2006
(Unaudited) | | | Year Ended
December 31, 2005 | |
Increase (Decrease)
in Net Assets from: | | | | | | | | | | | | | | | | |
| | | | |
Operations: | | | | | | | | | | | | | | | | |
Net investment income | | $ | 6,598 | | | $ | 16,918 | | | $ | 876 | | | $ | 1,202 | |
Net realized gain (loss) | | | 0 | | | | 0 | | | | (1,293 | ) | | | 2,973 | |
Net realized gain (loss) on Affiliate investments | | | (3,155 | ) | | | 1,306 | | | | 0 | | | | 0 | |
Net capital gain distributions received from Underlying PIMCO Funds | | | 0 | | | | 712 | | | | 0 | | | | 0 | |
Net change in unrealized appreciation (depreciation) | | | 0 | | | | 0 | | | | 62 | | | | (1,986 | ) |
Net change in unrealized depreciation on Affiliate investments | | | (7,231 | ) | | | (3,656 | ) | | | 0 | | | | 0 | |
Net increase (decrease) resulting from operations | | | (3,788 | ) | | | 15,280 | | | | (355 | ) | | | 2,189 | |
| | | | |
Distributions to Shareholders: | | | | | | | | | | | | | | | | |
From net investment income | | | | | | | | | | | | | | | | |
Institutional Class | | | 0 | | | | 0 | | | | 0 | | | | 0 | |
Administrative Class | | | (5,038 | ) | | | (9,080 | ) | | | (777 | ) | | | (1,087 | ) |
Advisor Class | | | (632 | ) | | | (160 | ) | | | 0 | | | | 0 | |
Class M | | | (1,232 | ) | | | (2,166 | ) | | | 0 | | | | 0 | |
From net realized capital gains | | | | | | | | | | | | | | | | |
Institutional Class | | | 0 | | | | 0 | | | | 0 | | | | 0 | |
Administrative Class | | | 0 | | | | (735 | ) | | | 0 | | | | (365 | ) |
Advisor Class | | | 0 | | | | (22 | ) | | | 0 | | | | 0 | |
Class M | | | 0 | | | | (198 | ) | | | 0 | | | | 0 | |
| | | | |
Total Distributions | | | (6,902 | ) | | | (12,361 | ) | | | (777 | ) | | | (1,452 | ) |
| | | | |
Portfolio Share Transactions: | | | | | | | | | | | | | | | | |
Receipts for shares sold | | | | | | | | | | | | | | | | |
Institutional Class | | | 10 | | | | 0 | | | | 0 | | | | 0 | |
Administrative Class | | | 33,411 | | | | 166,191 | | | | 9,424 | | | | 17,519 | |
Advisor Class | | | 58,213 | | | | 7,545 | | | | 0 | | | | 0 | |
Class M | | | 11,550 | | | | 54,317 | | | | 0 | | | | 0 | |
Issued as reinvestment of distributions | | | | | | | | | | | | | | | | |
Institutional Class | | | 0 | | | | 0 | | | | 0 | | | | 0 | |
Administrative Class | | | 5,038 | | | | 9,815 | | | | 777 | | | | 1,452 | |
Advisor Class | | | 632 | | | | 182 | | | | 0 | | | | 0 | |
Class M | | | 1,232 | | | | 2,364 | | | | 0 | | | | 0 | |
Cost of shares redeemed | | | | | | | | | | | | | | | | |
Institutional Class | | | 0 | | | | 0 | | | | 0 | | | | 0 | |
Administrative Class | | | (48,154 | ) | | | (29,204 | ) | | | (4,459 | ) | | | (8,208 | ) |
Advisor Class | | | (431 | ) | | | (208 | ) | | | 0 | | | | 0 | |
Class M | | | (12,991 | ) | | | (8,152 | ) | | | 0 | | | | 0 | |
Net increase (decrease) resulting from
Portfolio share transactions | | | 48,510 | | | | 202,850 | | | | 5,742 | | | | 10,763 | |
| | | | |
Total Increase (Decrease) in Net Assets | | | 37,820 | | | | 205,769 | | | | 4,610 | | | | 11,500 | |
| | | | |
Net Assets: | | | | | | | | | | | | | | | | |
Beginning of period | | | 326,308 | | | | 120,539 | | | | 49,654 | | | | 38,154 | |
End of period* | | $ | 364,128 | | | $ | 326,308 | | | $ | 54,264 | | | $ | 49,654 | |
| | | | |
*Including undistributed (overdistributed) net investment income of: | | $ | 6,814 | | | $ | 7,118 | | | $ | 600 | | | $ | 501 | |
| | | | |
| 14 | | PIMCO Variable Insurance Trust | | See Accompanying Notes |
| | | | | | | | | | | | | | | | | | | | | | |
Global Bond Portfolio
(Unhedged) | | | High Yield Portfolio | | | Low Duration Portfolio | |
| | | | | |
Six Months Ended
June 30, 2006
(Unaudited) | | | Year Ended
December 31, 2005 | | | Six Months Ended
June 30, 2006
(Unaudited) | | | Year Ended
December 31, 2005 | | | Six Months Ended
June 30, 2006
(Unaudited) | | | Year Ended
December 31, 2005 | |
| | | | | |
| | | | | | | | | | | | | | | | | |
| | | | | |
| | | | | | | | | | | | | | | | | |
| $ | 2,039 | | | $ | 1,678 | | | $ | 16,281 | | | $ | 27,561 | | | $ | 10,835 | | | $ | 10,648 | |
| | 821 | | | | (3,310 | ) | | | 2,132 | | | | 4,638 | | | | (2,190 | ) | | | (3,618 | ) |
| | 0 | | | | 0 | | | | 0 | | | | 0 | | | | 0 | | | | 0 | |
| | 0 | | | | 0 | | | | 0 | | | | 0 | | | | 0 | | | | 0 | |
| | (298 | ) | | | (2,270 | ) | | | (11,625 | ) | | | (14,899 | ) | | | (4,890 | ) | | | (2,598 | ) |
| | 0 | | | | 0 | | | | 0 | | | | 0 | | | | 0 | | | | 0 | |
| | 2,562 | | | | (3,902 | ) | | | 6,788 | | | | 17,300 | | | | 3,755 | | | | 4,432 | |
| | | | | |
| | | | | | | | | | | | | | | | | |
| | | | | | | | | | | | | | | | | |
| | 0 | | | | 0 | | | | (29 | ) | | | (37 | ) | | | (467 | ) | | | (513 | ) |
| | (1,881 | ) | | | (1,572 | ) | | | (16,515 | ) | | | (27,841 | ) | | | (10,469 | ) | | | (10,349 | ) |
| | 0 | | | | 0 | | | | 0 | | | | 0 | | | | 0 | | | | 0 | |
| | 0 | | | | 0 | | | | 0 | | | | 0 | | | | 0 | | | | 0 | |
| | | | | | | | | | | | | | | | | |
| | 0 | | | | 0 | | | | 0 | | | | 0 | | | | 0 | | | | (48 | ) |
| | 0 | | | | (1,301 | ) | | | 0 | | | | 0 | | | | 0 | | | | (1,196 | ) |
| | 0 | | | | 0 | | | | 0 | | | | 0 | | | | 0 | | | | 0 | |
| | 0 | | | | 0 | | | | 0 | | | | 0 | | | | 0 | | | | 0 | |
| | | | | |
| | (1,881 | ) | | | (2,873 | ) | | | (16,544 | ) | | | (27,878 | ) | | | (10,936 | ) | | | (12,106 | ) |
| | | | | |
| | | | | | | | | | | | | | | | | |
| | | | | | | | | | | | | | | | | |
| | 10 | | | | 0 | | | | 360 | | | | 336 | | | | 10,012 | | | | 10,460 | |
| | 55,471 | | | | 63,454 | | | | 62,810 | | | | 167,640 | | | | 184,037 | | | | 239,555 | |
| | 0 | | | | 0 | | | | 0 | | | | 0 | | | | 0 | | | | 0 | |
| | 0 | | | | 0 | | | | 10 | | | | 0 | | | | 10 | | | | 0 | |
| | | | | | | | | | | | | | | | | |
| | 0 | | | | 0 | | | | 29 | | | | 37 | | | | 467 | | | | 561 | |
| | 1,881 | | | | 2,873 | | | | 16,529 | | | | 27,827 | | | | 10,471 | | | | 11,545 | |
| | 0 | | | | 0 | | | | 0 | | | | 0 | | | | 0 | | | | 0 | |
| | 0 | | | | 0 | | | | 0 | | | | 0 | | | | 0 | | | | 0 | |
| | | | | | | | | | | | | | | | | |
| | 0 | | | | 0 | | | | (12 | ) | | | (25 | ) | | | (2,796 | ) | | | (4,836 | ) |
| | (14,460 | ) | | | (7,033 | ) | | | (80,878 | ) | | | (138,029 | ) | | | (50,338 | ) | | | (66,805 | ) |
| | 0 | | | | 0 | | | | 0 | | | | 0 | | | | 0 | | | | 0 | |
| | 0 | | | | 0 | | | | 0 | | | | 0 | | | | 0 | | | | 0 | |
| | | | | |
| | 42,902 | | | | 59,294 | | | | (1,152 | ) | | | 57,786 | | | | 151,863 | | | | 190,480 | |
| | | | | |
| | 43,583 | | | | 52,519 | | | | (10,908 | ) | | | 47,208 | | | | 144,682 | | | | 182,806 | |
| | | | | |
| | | | | | | | | | | | | | | | | |
| | 94,214 | | | | 41,695 | | | | 461,613 | | | | 414,405 | | | | 476,769 | | | | 293,963 | |
| $ | 137,797 | | | $ | 94,214 | | | $ | 450,705 | | | $ | 461,613 | | | $ | 621,451 | | | $ | 476,769 | |
| | | | | |
| $ | (1,174 | ) | | $ | (1,332 | ) | | $ | (507 | ) | | $ | (244 | ) | | $ | 680 | | | $ | 781 | |
| | | | | | |
| See Accompanying Notes | | Semiannual Report | | June 30, 2006 | | 15 |
| | |
| |
| Schedule of Investments All Asset Portfolio (a) | | June 30, 2006 (Unaudited) |
| | | | | | | | |
| | | | | | | | | VALUE |
| | | | | SHARES | | | | (000S) |
| PIMCO FUNDS (b) 99.5% |
CommodityRealReturn Strategy Fund® | | | | 639,133 | | $ | | 9,395 |
Convertible Fund | | | | 99,294 | | | | 1,240 |
Developing Local Markets Fund | | | | 2,967,035 | | | | 30,946 |
Diversified Income Fund | | | | 95,839 | | | | 1,031 |
Emerging Markets Bond Fund | | | | 1,908,223 | | | | 20,552 |
Floating Income Fund | | | | 2,936,807 | | | | 30,396 |
Foreign Bond Fund (Unhedged) | | | | 81,715 | | | | 833 |
Fundamental IndexPLUS® Fund | | | | 162,512 | | | | 1,666 |
Fundamental IndexPLUS® TR Fund | | | | 780,708 | | | | 7,823 |
GNMA Fund | | | | 249,029 | | | | 2,670 |
High Yield Fund | | | | 1,318,660 | | | | 12,554 |
International StocksPLUS® TR Strategy Fund | | | | 1,888,909 | | | | 22,025 |
Long-Term U.S. Government Fund | | | | 2,636,612 | | | | 26,893 |
Low Duration Fund | | | | 304,426 | | | | 2,993 |
Real Return Asset Fund | | | | 9,461,298 | | | | 103,412 |
Real Return Fund | | | | 6,131,194 | | | | 65,726 |
RealEstateRealReturn Strategy Fund | | | | 202,957 | | | | 1,756 |
Short-Term Fund | | | | 994 | | | | 10 |
StocksPLUS® Fund | | | | 7,084 | | | | 72 |
StocksPLUS® Total Return Fund | | | | 148,481 | | | | 1,679 |
Total Return Fund | | | | 1,477,051 | | | | 15,036 |
Total Return Mortgage Fund | | | | 346,837 | | | | 3,586 |
| | | | | | | | |
|
Total PIMCO Funds (Cost $371,688) | | | | 362,294 |
| | | | | | | | |
|
| | | | | | | | | |
| SHORT-TERM INSTRUMENTS 0.5% |
| |
| REPURCHASE AGREEMENT 0.5% |
| State Street Bank | | | | | | | | | |
4.900% due 07/03/2006 | | $ | | 1,781 | | $ | | | 1,781 |
| | | | | | | | |
|
|
(Dated 06/30/2006. Collateralized by Federal Home Loan Bank 4.875% due 02/15/2007 valued at $1,819. Repurchase proceeds are $1,782.) |
| |
Total Short-Term Instruments
(Cost $1,781) | | | 1,781 |
| | | | | | | | |
|
|
| |
Total Investments 100.0%
(Cost $373,469) | | $ | | $ | 364,075 |
| |
| Other Assets and Liabilities (Net) 0.0% | | | 53 |
| | | | | | | | |
|
|
| Net Assets 100.0% | | $ | | | 364,128 |
| | | | | | | | |
|
|
| | | | | | | | |
Notes to Schedule of Investments: |
(a) The All Asset Portfolio is investing in shares of affiliated Funds. |
| | | | | | | | | |
(b) Institutional Class of each PIMCO Funds. |
| | | | |
| 16 | | PIMCO Variable Insurance Trust | | See Accompanying Notes |
| | |
| |
| Schedule of Investments Foreign Bond Portfolio (U.S. Dollar-Hedged) | | June 30, 2006 (Unaudited) |
| | | | | | | | |
| | | | | PRINCIPAL | | | | |
| | | | | AMOUNT | | | | VALUE |
| | | | | (000S) | | | | (000S) |
| AUSTRALIA 0.0% | | | | | | | | |
| Medallion Trust | | | | | | | | |
5.275% due 07/12/2031 | | $ | | 14 | | $ | | 14 |
| | | | | | | | |
|
Total Australia (Cost $14) | | 14 |
| | | | | | | | |
|
| | | | | | | | | |
| AUSTRIA (j) 1.0% | | | | | | | | |
| Austria Government Bond | | | | | | |
5.250% due 01/04/2011 | | EUR | | 300 | | | | 406 |
3.800% due 10/20/2013 | | | | 100 | | | | 127 |
| | | | | | | | |
|
Total Austria (Cost $441) | | 533 |
| | | | | | | | |
|
| | | | | | | | | |
| CAYMAN ISLANDS 0.8% |
| MUFG Capital Finance 1 Ltd. | | | | | | |
6.346% due 07/29/2049 | | $ | | 200 | | | | 193 |
|
| Vita Capital Ltd. | | | | | | | | |
6.340% due 01/01/2007 | | | | 250 | | | | 251 |
| | | | | | | | |
|
Total Cayman Islands (Cost $450) | | 444 |
| | | | | | | | |
|
| |
| DENMARK 0.0% (j) | | | | |
| Nykredit Realkredit A/S | | | | | | | | |
6.000% due 10/01/2029 | | DKK | | 67 | | | | 12 |
| | | | | | | | |
|
Total Denmark (Cost $7) | | | | | | | | 12 |
| | | | | | | | |
|
| |
| FRANCE 1.8% (j) | | | | | | | | |
| France Government Bond | | |
4.000% due 10/25/2009 | | EUR | | 30 | | | | 39 |
5.500% due 04/25/2010 | | | | 110 | | | | 149 |
5.750% due 10/25/2032 | | | | 500 | | | | 779 |
| | | | | | | | |
|
Total France (Cost $961) | | | | | | | | 967 |
| | | | | | | | |
|
| |
| GERMANY (j) 16.2% | | | | | | |
| Amadeus Global Travel Distribution S.A. | | |
5.549% due 04/08/2013 | | EUR | | 50 | | | | 65 |
6.049% due 04/08/2014 | | | | 50 | | | | 65 |
|
| Haus Ltd. | | | | | | | | |
3.169% due 12/14/2037 | | | | 48 | | | | 57 |
|
| Landesbank Baden-Wurttemberg | | |
5.500% due 04/02/2007 | | | | 30 | | | | 39 |
|
| Republic of Germany | | | | | | | | |
4.500% due 07/04/2009 | | | | 10 | | | | 13 |
5.250% due 07/04/2010 | | | | 1,400 | | | | 1,886 |
5.250% due 01/04/2011 | | | | 300 | | | | 406 |
6.250% due 01/04/2024 | | | | 600 | | | | 955 |
6.500% due 07/04/2027 | | | | 590 | | | | 981 |
5.625% due 01/04/2028 | | | | 2,650 | | | | 3,999 |
4.750% due 07/04/2028 | | | | 30 | | | | 41 |
5.500% due 01/04/2031 | | | | 100 | | | | 150 |
4.750% due 07/04/2034 | | | | 100 | | | | 137 |
| | | | | | | | |
|
Total Germany (Cost $7,989) | | | | 8,794 |
| | | | | | | | |
|
| |
| ITALY (j) 1.7% | | | | | | | | |
| Italy Buoni Poliennali Del Tesoro |
4.500% due 05/01/2009 | | EUR | | 360 | | | | 470 |
4.250% due 11/01/2009 | | | | 60 | | | | 78 |
5.500% due 11/01/2010 | | | | 110 | | | | 150 |
|
| Seashell Securities PLC | | | | | | | | |
3.079% due 10/25/2028 | | | | 100 | | | | 126 |
|
| Telecom Italia SpA | | | | | | | | |
5.625% due 02/01/2007 | | | | 70 | | | | 91 |
| | | | | | | | |
|
Total Italy (Cost $864) | | | | | | | | 915 |
| | | | | | | | |
|
| | | | | | | | |
| JAPAN (j) 10.7% | | | | | | | | |
| Bank of Tokyo-Mitsubishi UFJ Ltd. | | |
3.500% due 12/16/2015 | | EUR | | 100 | | | | 123 |
|
| Japan Finance Corp. for Municipal Enterprises |
5.875% due 03/14/2011 | | $ | | 80 | | | | 81 |
|
| Japan Government Bond | | | | | | | | |
0.700% due 09/20/2008 | | JPY | | 10,000 | | | | 87 |
1.500% due 03/20/2014 | | | | 90,000 | | | | 772 |
1.600% due 06/20/2014 | | | | 240,000 | | | | 2,068 |
1.600% due 09/20/2014 | | | | 60,000 | | | | 516 |
2.300% due 05/20/2030 | | | | 10,000 | | | | 85 |
2.400% due 03/20/2034 | | | | 20,000 | | | | 172 |
2.300% due 06/20/2035 | | | | 70,000 | | | | 585 |
2.500% due 09/20/2035 | | | | 140,000 | | | | 1,221 |
|
| Sumitomo Mitsui Banking Corp. | | | | |
5.625% due 07/29/2049 | | $ | | 100 | | | | 93 |
| | | | | | | | |
|
Total Japan (Cost $6,197) | | | | | | | | 5,803 |
| | | | | | | | |
|
| |
| SPAIN (j) 8.0% | | | | | | | | |
| Santander U.S. Debt S.A. Unipersonal | | |
5.220% due 02/06/2009 | | $ | | 200 | | | | 200 |
|
| Spain Government Bond | | | | | | | | |
5.150% due 07/30/2009 | | EUR | | 1,210 | | | | 1,611 |
4.000% due 01/31/2010 | | | | 100 | | | | 129 |
4.400% due 01/31/2015 | | | | 1,800 | | | | 2,361 |
| | | | | | | | |
|
Total Spain (Cost $4,081) | | | | | | | | 4,301 |
| | | | | | | | |
|
| |
| UNITED KINGDOM (j) 6.9% | | |
| Lloyds TSB Bank PLC | | | | | | | | |
5.625% due 07/15/2049 | | EUR | | 40 | | | | 53 |
5.438% due 11/29/2049 | | $ | | 100 | | | | 89 |
|
| United Kingdom Gilt | | | | | | | | |
5.000% due 03/07/2008 | | GBP | | 100 | | | | 186 |
4.750% due 06/07/2010 | | | | 600 | | | | 1,108 |
5.000% due 03/07/2012 | | | | 500 | | | | 936 |
4.750% due 09/07/2015 | | | | 700 | | | | 1,297 |
|
| Vodafone Group PLC | | | | | | | | |
5.560% due 06/29/2007 | | $ | | 100 | | | | 100 |
| | | | | | | | |
|
Total United Kingdom (Cost $3,736) | | | | 3,769 |
| | | | | | | | |
|
| |
| UNITED STATES (j) 29.5% | | |
| |
| ASSET-BACKED SECURITIES 3.1% | | |
| AAA Trust | | | | | | | | |
5.422% due 04/25/2035 | | $ | | 26 | | | | 26 |
|
| Amortizing Residential Collateral Trust | | |
5.672% due 10/25/2031 | | | | 4 | | | | 4 |
5.612% due 07/25/2032 | | | | 1 | | | | 1 |
|
| Amresco Residential Securities Mortgage Loan Trust |
6.262% due 06/25/2029 | | | | 2 | | | | 2 |
|
| Argent Securities, Inc. | | | | | | | | |
5.442% due 02/25/2036 | | | | 192 | | | | 192 |
|
| Capital One Auto Finance Trust | | | | |
5.117% due 05/15/2007 | | | | 82 | | | | 82 |
|
| Centex Home Equity | | | | | | | | |
5.372% due 06/25/2036 | | | | 194 | | | | 194 |
|
| CS First Boston Mortgage Securities Corp. | | |
5.632% due 01/25/2032 | | | | 3 | | | | 3 |
|
| First Alliance Mortgage Loan Trust | | |
5.497% due 12/20/2027 | | | | 3 | | | | 3 |
|
| First Franklin Mortgage Loan Asset-Backed Certificates |
5.731% due 02/25/2034 | | | | 9 | | | | 9 |
| | | | | | | | |
| GSR Mortgage Loan Trust | | | | | | | | |
5.422% due 12/25/2030 | | $ | | 148 | | $ | | 148 |
|
| IXIS Real Estate Capital Trust |
5.382% due 08/25/2036 | | | | 97 | | | | 97 |
|
| Morgan Stanley Home Equity Loans |
5.392% due 02/25/2036 | | | | 267 | | | | 267 |
|
| Novastar Home Equity Loan | | | | |
5.597% due 04/25/2028 | | | | 5 | | | | 5 |
|
| Quest Trust | | | | | | | | |
5.882% due 06/25/2034 | | | | 31 | | | | 31 |
|
| Residential Asset Mortgage Products, Inc. |
5.662% due 09/25/2033 | | | | 1 | | | | 1 |
5.402% due 10/25/2036 | | | | 180 | | | | 181 |
|
| Residential Asset Securities Corp. | | |
5.592% due 04/25/2032 | | | | 10 | | | | 10 |
5.572% due 07/25/2032 | | | | 14 | | | | 14 |
|
| SACO I, Inc. | | | | | | | | |
5.382% due 05/25/2036 | | | | 88 | | | | 88 |
|
| Securitized Asset-Backed Receivables LLC Trust |
5.382% due 03/25/2036 | | | | 180 | | | | 180 |
|
| SLM Student Loan Trust | | | | | | | | |
5.120% due 07/25/2013 | | | | 57 | | | | 57 |
5.110% due 01/26/2015 | | | | 79 | | | | 79 |
|
| Soundview Home Equity Loan Trust | | |
5.492% due 04/25/2035 | | | | 25 | | | | 25 |
|
| Structured Asset Securities Corp. | | |
5.371% due 01/25/2033 | | | | 4 | | | | 4 |
| | | | | | | | |
|
| | | | | | | | | 1,703 |
| | | | | | | | |
|
| |
| CORPORATE BONDS & NOTES 4.6% |
| Bear Stearns Cos., Inc. | | | | | | | | |
5.356% due 01/31/2011 | | | | 200 | | | | 200 |
|
| Charter One Bank N.A. | | | | | | | | |
5.157% due 04/24/2009 | | | | 250 | | | | 250 |
|
| CIT Group, Inc. | | | | | | | | |
5.259% due 02/21/2008 | | | | 100 | | | | 100 |
|
| Citigroup, Inc. | | | | | | | | |
5.520% due 12/26/2008 | | | | 100 | | | | 100 |
|
| CMS Energy Corp. | | | | | | | | |
8.900% due 07/15/2008 | | | | 100 | | | | 104 |
7.500% due 01/15/2009 | | | | 100 | | | | 102 |
|
| ConocoPhillips Australia Funding Co. | | |
5.128% due 04/09/2009 | | | | 200 | | | | 200 |
|
| HSBC Finance Corp. | | | | | | | | |
5.500% due 01/19/2016 | | | | 200 | | | | 191 |
|
| JP Morgan & Co., Inc. | | | | | | | | |
8.019% due 02/15/2012 | | | | 10 | | | | 10 |
|
| KFW International Finance, Inc. |
1.750% due 03/23/2010 | | JPY | | 11,000 | | | | 98 |
|
| Mizuho Preferred Capital Co. LLC | | |
8.790% due 12/29/2049 | | $ | | 100 | | | | 105 |
|
| Morgan Stanley | | | | | | | | |
5.276% due 02/09/2009 | | | | 200 | | | | 200 |
|
| Oracle Corp. & Ozark Holding, Inc. | | |
5.280% due 01/13/2009 | | | | 100 | | | | 100 |
|
| SB Treasury Co. LLC | | | | | | | | |
9.400% due 12/29/2049 | | | | 100 | | | | 106 |
|
| Toyota Motor Credit Corp. | | | | | | | | |
5.140% due 10/12/2007 | | | | 100 | | | | 100 |
|
| Unicredito Italiano | | | | | | | | |
5.231% due 12/03/2007 | | | | 100 | | | | 100 |
5.307% due 12/13/2007 | | | | 100 | | | | 100 |
| | | | | | |
| See Accompanying Notes | | Semiannual Report | | June 30, 2006 | | 17 |
| | |
| |
| Schedule of Investments Foreign Bond Portfolio (U.S. Dollar-Hedged) (Cont.) | | |
| | | | | | | | |
| | | | | PRINCIPAL | | | | |
| | | | | AMOUNT | | | | VALUE |
| | | | | (000S) | | | | (000S) |
| US Bancorp | | | | | | | | |
5.371% due 04/28/2009 | | $ | | 100 | | $ | | 100 |
|
| Wachovia Bank N.A. | | | | | | | | |
5.489% due 03/23/2009 | | | | 250 | | | | 250 |
| | | | | | | | |
|
| | | | | | | | | 2,516 |
| | | | | | | | |
|
| |
| MORTGAGE-BACKED SECURITIES 7.3% |
| Banc of America Commercial Mortgage, Inc. |
4.772% due 07/11/2043 | | | | 250 | | | | 244 |
|
| Banc of America Mortgage Securities | | |
5.000% due 05/25/2034 | | | | 204 | | | | 199 |
|
| Commercial Mortgage Asset Trust | | |
6.975% due 01/17/2032 | | | | 100 | | | | 106 |
|
| Countrywide Alternative Loan Trust | | |
5.291% due 02/25/2036 | | | | 288 | | | | 288 |
5.602% due 02/25/2036 | | | | 194 | | | | 195 |
|
| Countrywide Home Loan Mortgage Pass-Through Trust |
5.652% due 02/25/2035 | | | | 54 | | | | 55 |
5.642% due 03/25/2035 | | | | 397 | | | | 398 |
5.552% due 05/25/2035 | | | | 201 | | | | 200 |
|
| CS First Boston Mortgage Securities Corp. |
6.500% due 04/25/2033 | | | | 11 | | | | 11 |
5.872% due 08/25/2033 | | | | 13 | | | | 13 |
|
| CSAB Mortgage-Backed Trust | | | | |
5.423% due 06/25/2036 | | | | 94 | | | | 94 |
|
| First Horizon Asset Securities, Inc. | | |
6.250% due 08/25/2017 | | | | 90 | | | | 89 |
|
| GMAC Commercial Mortgage Securities, Inc. |
6.420% due 05/15/2035 | | | | 93 | | | | 94 |
|
| GMAC Mortgage Corp. Loan Trust |
5.500% due 09/25/2034 | | | | 131 | | | | 129 |
|
| Indymac Index Mortgage Loan Trust |
5.402% due 06/25/2046 | | | | 194 | | | | 194 |
|
| Mellon Residential Funding Corp. |
5.639% due 12/15/2030 | | | | 62 | | | | 62 |
|
| MLCC Mortgage Investors, Inc. | | |
5.579% due 03/15/2025 | | | | 23 | | | | 23 |
|
| Residential Accredit Loans, Inc. | | |
5.532% due 03/25/2046 | | | | 299 | | | | 299 |
|
| Sequoia Mortgage Trust | | | | | | | | |
5.567% due 08/20/2032 | | | | 30 | | | | 30 |
|
| Structured Asset Mortgage Investments, Inc. |
5.542% due 09/19/2032 | | | | 41 | | | | 41 |
5.582% due 09/19/2032 | | | | 26 | | | | 26 |
5.602% due 03/19/2034 | | | | 52 | | | | 52 |
5.542% due 09/25/2035 | | | | 300 | | | | 300 |
|
| Washington Mutual, Inc. | | | | | | | | |
5.592% due 12/25/2027 | | | | 95 | | | | 95 |
5.121% due 10/25/2032 | | | | 5 | | | | 5 |
5.009% due 02/27/2034 | | | | 32 | | | | 32 |
5.632% due 12/25/2044 | | | | 59 | | | | 59 |
5.552% due 04/25/2045 | | | | 65 | | | | 65 |
5.123% due 06/25/2046 | | | | 198 | | | | 198 |
|
| Wells Fargo Mortgage-Backed Securities Trust |
4.950% due 03/25/2036 | | | | 288 | | | | 285 |
5.240% due 05/25/2036 | | | | 92 | | | | 91 |
| | | | | | | | |
|
| | | | | | | | | 3,972 |
| | | | | | | | |
|
| |
| MUNICIPAL BONDS & NOTES 0.4% |
| Illinois State Educational Facilities Authority Revenue Bonds, Series 2003 |
5.000% due 07/01/2033 | | | | 100 | | | | 102 |
| | | | | | | | |
| Lower Colorado River, Texas Authority Revenue Notes, (FSA Insured), Series 2003 |
5.000% due 05/15/2023 | | $ | | 100 | | $ | | 102 |
| | | | | | | | |
|
| | | | | | | | | 204 |
| | | | | | | | |
|
| |
| | | | | SHARES | | | | |
| PREFERRED STOCK 1.3% | | | | | | | | |
| DG Funding Trust | | | | | | | | |
7.210% due 12/31/2049 | | | | 65 | | | | 686 |
| | | | | | | | |
|
| |
| | | | | PRINCIPAL
AMOUNT
(000S) | | | | |
| U.S. GOVERNMENT AGENCIES 8.2% |
| Fannie Mae | | | | | | | | |
4.192% due 11/01/2034 | | $ | | 414 | | | | 406 |
4.681% due 02/25/2036 | | | | 100 | | | | 97 |
4.964% due 12/01/2034 | | | | 59 | | | | 58 |
5.000% due 09/01/2018 - 07/13/2036 (c) | | | | 629 | | | | 591 |
5.211% due 10/01/2044 | | | | 193 | | | | 194 |
5.442% due 03/25/2034 | | | | 64 | | | | 64 |
5.472% due 08/25/2034 | | | | 60 | | | | 60 |
5.500% due 11/01/2016 - 02/01/2035 (c) | | | | 1,996 | | | | 1,929 |
5.672% due 09/25/2042 | | | | 100 | | | | 101 |
6.000% due 07/25/2044 | | | | 64 | | | | 64 |
|
| Freddie Mac |
5.211% due 10/25/2044 | | | | 193 | | | | 195 |
6.103% due 02/01/2029 | | | | 34 | | | | 35 |
6.530% due 11/26/2012 | | | | 300 | | | | 302 |
|
| Government National Mortgage Association |
4.375% due 04/20/2028 - 06/20/2030 (c) | | | | 32 | | | | 32 |
|
| Tennessee Valley Authority | | | | | | | | |
4.875% due 12/15/2016 | | | | 300 | | | | 300 |
| | | | | | | | |
|
| | | | | | | | | 4,428 |
| | | | | | | | |
|
| |
| U.S. TREASURY OBLIGATIONS 4.6% |
| Treasury Inflation Protected Securities (b) |
2.000% due 07/15/2014 | | | | 321 | | | | 309 |
3.625% due 04/15/2028 | | | | 125 | | | | 148 |
|
| U.S. Treasury Bond | | | | | | | | |
8.875% due 02/15/2019 | | | | 100 | | | | 133 |
8.125% due 08/15/2019 | | | | 300 | | | | 380 |
7.875% due 02/15/2021 | | | | 200 | | | | 252 |
8.125% due 05/15/2021 | | | | 400 | | | | 515 |
6.250% due 08/15/2023 | | | | 200 | | | | 221 |
|
| U.S. Treasury Note | | | | | | | | |
4.625% due 02/29/2008 | | | | 400 | | | | 396 |
4.250% due 08/15/2013 | | | | 100 | | | | 95 |
|
| U.S. Treasury Strip | | | | | | | | |
0.000% due 11/15/2021 (a) | | | | 100 | | | | 44 |
| | | | | | | | |
|
| | | | | | | | | 2,493 |
| | | | | | | | |
|
Total United States (Cost $16,317) | | | | 16,002 |
| | | | | | | | |
|
| |
| | | | | NOTIONAL
AMOUNT
(000S) | | | | |
| PURCHASED CALL OPTIONS 0.2% |
| 1-Year Interest Rate Swap (OTC) Pay 3-Month USD-LIBOR Floating Rate Index |
Strike @ 5.190%
Exp. 05/09/2007 | | $ | | 61,400 | | | | 62 |
|
| 2-Year Interest Rate Swap (OTC) Pay 3-Month USD-LIBOR Floating Rate Index |
Strike @ 4.500%
Exp. 10/18/2006 | | | | 2,300 | | | | 0 |
| | | | | | | | |
Strike @ 4.750%
Exp. 08/07/2006 | | $ | | 4,700 | | $ | | 0 |
Strike @ 5.080%
Exp. 04/19/2007 | | | | 4,600 | | | | 7 |
Strike @ 5.150%
Exp. 05/08/2007 | | | | 4,700 | | | | 9 |
Strike @ 5.130%
Exp. 10/25/2006 | | | | 2,300 | | | | 1 |
Strike @ 5.200%
Exp. 05/09/2007 | | | | 3,300 | | | | 7 |
|
| 30-Year Interest Rate Swap (OTC) Receive 3-Month USD-LIBOR Floating Rate Index |
Strike @ 5.750%
Exp. 04/27/2009 | | | | 200 | | | | 12 |
|
| U.S. dollar versus Japanese Yen (OTC) | | |
Strike @ JPY117.000
Exp. 12/11/2006 | | | | 370 | | | | 3 |
|
| |
| | | | | #OF
CONTRACTS | | | | |
| U.S. Treasury 30-Year Bond September Futures (CBOT) |
Strike @ $108.000
Exp. 08/25/2006 | | | | 9 | | | | 5 |
| | | | | | | | |
|
Total Purchased Call Options (Cost $224) | | 106 |
| | | | | | | | |
|
| |
| | | | | NOTIONAL
AMOUNT
(000S) | | | | |
| PURCHASED PUT OPTIONS 0.0% |
| 30-Year Interest Rate Swap (OTC) Receive 3-Month USD-LIBOR Floating Rate Index |
Strike @ 6.250%
Exp. 04/27/2009 | | $ | | 200 | | | | 8 |
|
| |
| | | | | #OF
CONTRACTS | | | | |
| U.S. Treasury 30-Year Bond September Futures (CBOT) |
Strike @ $103.000
Exp. 08/25/2006 | | 9 | | | | 2 |
| | | | | | | | |
|
Total Purchased Put Options (Cost $20) | | 10 |
| | | | | | | | |
|
| |
| | | | | NOTIONAL
AMOUNT
(000S) | | | | |
| PURCHASED STRADDLE OPTIONS 0.0% |
| Call & Put - OTC U.S. dollar versus Japanese Yen Forward Delta Neutral Straddle |
Strike @ $0.000 (f)
Exp. 08/23/2007 | | $ | | 5,000 | | | | 3 |
| | | | | | | | |
|
Total Purchased Straddle Options (Cost $0) | | 3 |
| | | | | | | | |
|
| |
| | | | | PRINCIPAL
AMOUNT
(000S) | | | | |
| SHORT-TERM INSTRUMENTS 31.0% |
| |
| CERTIFICATES OF DEPOSIT 0.6% | | |
| Countrywide Bank N.A. | | | | | | | | |
5.209% due 09/15/2006 | | $ | | 300 | | | | 300 |
| | | | | | | | |
|
| | | | | | | | | |
| COMMERCIAL PAPER 29.0% |
| Abbey National N.A. LLC | | | | | | | | |
5.100% due 07/05/2006 | | | | 1,400 | | | | 1,400 |
|
| Danske Corp. | | | | | | | | |
5.280% due 07/17/2006 | | | | 800 | | | | 798 |
4.955% due 07/20/2006 | | | | 800 | | | | 798 |
|
| Dexia Delaware LLC | | | | | | | | |
5.275% due 07/05/2006 | | | | 1,400 | | | | 1,400 |
|
| DnB NORBank ASA | | | | | | | | |
4.990% due 08/18/2006 | | | | 1,400 | | | | 1,391 |
| | | | |
| 18 | | PIMCO Variable Insurance Trust | | See Accompanying Notes |
| | |
| |
| | | June 30, 2006 (Unaudited) |
| | | | | | | | |
| | | | | PRINCIPAL | | | | |
| | | | | AMOUNT | | | | VALUE |
| | | | | (000S) | | | | (000S) |
| Fannie Mae | | | | | | | | |
4.958% due 09/13/2006 | | $ | | 400 | | $ | | 395 |
|
| HBOS Treasury Services PLC | | | | | | | | |
4.940% due 07/13/2006 | | | | 900 | | | | 899 |
5.100% due 08/25/2006 | | | | 600 | | | | 595 |
|
| Nordea N.A., Inc. | | | | | | | | |
5.090% due 08/24/2006 | | | | 300 | | | | 298 |
5.180% due 09/08/2006 | | | | 900 | | | | 890 |
|
| Societe Generale N.A. | | | | | | | | |
5.260% due 07/05/2006 | | | | 600 | | | | 600 |
4.985% due 08/22/2006 | | | | 1,000 | | | | 993 |
|
| Spintab AB | | | | | | | | |
5.120% due 08/01/2006 | | | | 800 | | | | 797 |
|
| Svenska Handelsbanken, Inc. | | | | |
4.890% due 07/06/2006 | | | | 1,400 | | | | 1,399 |
|
| Time Warner Telecom, Inc. | | | | | | | | |
5.240% due 09/19/2006 | | | | 100 | | | | 99 |
|
| Total Captial S.A. | | | | | | | | |
5.270% due 07/03/2006 | | | | 400 | | | | 400 |
|
| UBS Finance Delaware LLC | | | | | | | | |
4.930% due 07/10/2006 | | | | 600 | | | | 599 |
5.225% due 08/08/2006 | | | | 1,000 | | | | 995 |
| | | | | | | | |
| Westpac Trust Securities NZ Ltd. | | |
4.960% due 07/20/2006 | | $ | | 1,000 | | $ | | 998 |
| | | | | | | | |
|
| | | | | | | | | 15,744 |
| | | | | | | | |
|
| |
| REPURCHASE AGREEMENT 0.8% |
| State Street Bank | | | | | | | | |
4.900% due 07/03/2006 | | | | 413 | | | | 413 |
| | | | | | | | |
|
(Dated 06/30/2006. Collateralized by Freddie Mac 2.750% due 02/09/2007 valued at $423. Repurchase proceeds are $413.) |
| |
| U.S. TREASURY BILLS 0.6% | | | | | | | | |
4.794% due 08/31/2006 -09/14/2006 (c)(e) | | | | 355 | | | | 351 |
| | | | | | | | |
|
Total Short-Term Instruments
(Cost $16,810) | | | | 16,808 |
| | | | | | | | |
|
| |
Total Investments (d) 107.8%
(Cost $58,111) | | | | | | $ | | 58,481 |
| |
Written Options (h) (0.2%)
(Premiums $235) | | | | | | | | (90) |
| |
| Other Assets and Liabilities (Net) (7.6%) | | (4,127) |
| | | | | | | | |
|
| Net Assets 100.0% | | | | | | $ | | 54,264 |
| | | | | | | | |
|
|
| Notes to Schedule of Investments (amounts in thousands, except number of contracts): |
| |
(a) Principal only security. |
| |
(b) Principal amount of security is adjusted for inflation. |
| |
(c) Securities are grouped by coupon or range of coupons and represent a range of maturities. |
| |
(d) As of June 30, 2006, portfolio securities with an aggregate market value of $681 were valued in good faith and pursuant to guidelines established by the Board of Trustees. |
| |
(e) Securities with an aggregate market value of $351 have been segregated with the custodian to cover margin requirements for the following open futures contracts on June 30, 2006: |
| |
| | | | | | | | | | |
| Description | | Type | | Expiration
Month | | # of
Contracts | | Unrealized
(Depreciation) | |
90-Day Eurodollar June Futures | | Long | | 06/2007 | | 40 | | $ | (26 | ) |
Euro-Bobl 5-Year Note September Futures | | Long | | 09/2006 | | 2 | | | (1 | ) |
Euro-Bund 10-Year Note September Futures | | Long | | 09/2006 | | 53 | | | (40 | ) |
Japan Government 10-Year Note September Futures | | Long | | 09/2006 | | 13 | | | (9 | ) |
U.S. Treasury 5-Year Note September Futures | | Long | | 09/2006 | | 17 | | | (11 | ) |
U.S. Treasury 10-Year Note September Futures | | Long | | 09/2006 | | 19 | | | (13 | ) |
U.S. Treasury 30-Year Bond September Futures | | Long | | 09/2006 | | 3 | | | (2 | ) |
| | | | | | | | |
|
|
|
| | | | | | | | | $ | (102 | ) |
| | | | | | | | |
|
|
|
(f) Exercise price and premium determined on a future date, based upon implied volatility parameters. | |
| | |
(g) Swap agreements outstanding on June 30, 2006: | |
| | | | | | | | | | | | | | | |
|
| Interest Rate Swaps | |
| Counterparty | | Floating Rate
Index | | Pay/Receive
Floating Rate | | Fixed Rate | | Expiration
Date | | Notional
Amount | | Unrealized
Appreciation/
(Depreciation) | |
Citibank N.A. | | 6-month Australian Bank Bill | | Pay | | 6.000% | | 06/15/2010 | | AUD | 700 | | $ | (8 | ) |
Citibank N.A. | | 6-month Australian Bank Bill | | Receive | | 6.000% | | 06/15/2015 | | | 400 | | | 7 | |
Deutsche Bank AG | | 6-month Australian Bank Bill | | Pay | | 6.000% | | 12/15/2011 | | | 500 | | | (2 | ) |
Deutsche Bank AG | | 6-month Australian Bank Bill | | Receive | | 6.000% | | 12/15/2016 | | | 300 | | | 2 | |
HSBC Bank USA | | 6-month Australian Bank Bill | | Pay | | 6.000% | | 12/15/2011 | | | 300 | | | (1 | ) |
HSBC Bank USA | | 6-month Australian Bank Bill | | Receive | | 6.000% | | 12/15/2016 | | | 200 | | | 1 | |
UBS Warburg LLC | | 6-month Australian Bank Bill | | Pay | | 6.000% | | 06/15/2010 | | | 2,700 | | | (41 | ) |
UBS Warburg LLC | | 6-month Australian Bank Bill | | Receive | | 6.000% | | 06/15/2015 | | | 1,500 | | | 34 | |
Bank of America | | 3-month Canadian Bank Bill | | Receive | | 5.500% | | 12/16/2014 | | CAD | 500 | | | 6 | |
Royal Bank of Canada | | 3-month Canadian Bank Bill | | Receive | | 5.000% | | 06/15/2015 | | | 200 | | | 2 | |
| | | | | | |
| See Accompanying Notes | | Semiannual Report | | June 30, 2006 | | 19 |
Schedule of Investments Foreign Bond Portfolio (U.S. Dollar-Hedged) (Cont.)
| | | | | | | | | | | | | | | |
| Counterparty | | Floating Rate
Index | | Pay/Receive
Floating Rate | | Fixed Rate | | Expiration
Date | | Notional
Amount | | Unrealized
Appreciation/
(Depreciation) | |
BNP Paribas Bank | | 6-month EUR-LIBOR | | Pay | | 6.000% | | 06/18/2034 | | EUR | 100 | | $ | 1 | |
Citibank N.A. | | 6-month EUR-LIBOR | | Receive | | 5.000% | | 06/17/2012 | | | 200 | | | 11 | |
Citibank N.A. | | 6-month EUR-LIBOR | | Receive | | 4.000% | | 12/15/2014 | | | 1,280 | | | 85 | |
Citibank N.A. | | 6-month EUR-LIBOR | | Receive | | 4.500% | | 06/17/2015 | | | 100 | | | 6 | |
Citibank N.A. | | 6-month EUR-LIBOR | | Pay | | 6.000% | | 06/18/2034 | | | 100 | | | (10 | ) |
Deutsche Bank AG | | 6-month EUR-LIBOR | | Receive | | 4.000% | | 12/15/2011 | | | 200 | | | 0 | |
Goldman Sachs & Co. | | 6-month EUR-LIBOR | | Pay | | 4.000% | | 06/17/2010 | | | 200 | | | (2 | ) |
Goldman Sachs & Co. | | 6-month EUR-LIBOR | | Receive | | 4.000% | | 12/15/2014 | | | 600 | | | (1 | ) |
HSBC Bank USA | | 6-month EUR-LIBOR | | Receive | | 4.000% | | 12/15/2014 | | | 200 | | | 6 | |
J.P. Morgan Chase & Co. | | 6-month EUR-LIBOR | | Pay | | 4.000% | | 06/17/2010 | | | 200 | | | (8 | ) |
J.P. Morgan Chase & Co. | | 6-month EUR-LIBOR | | Receive | | 5.000% | | 06/17/2012 | | | 100 | | | 5 | |
Lehman Brothers, Inc. | | 6-month EUR-LIBOR | | Receive | | 4.000% | | 12/15/2014 | | | 400 | | | 27 | |
Merrill Lynch & Co., Inc. | | 6-month EUR-LIBOR | | Receive | | 4.000% | | 12/15/2014 | | | 2,600 | | | 171 | |
Morgan Stanley Dean Witter & Co. | | 6-month EUR-LIBOR | | Pay | | 4.000% | | 06/17/2010 | | | 100 | | | (4 | ) |
Morgan Stanley Dean Witter & Co. | | 6-month EUR-LIBOR | | Receive | | 4.000% | | 12/15/2011 | | | 2,000 | | | 15 | |
Morgan Stanley Dean Witter & Co. | | 6-month EUR-LIBOR | | Receive | | 4.000% | | 12/15/2014 | | | 300 | | | 18 | |
Morgan Stanley Dean Witter & Co. | | 6-month EUR-LIBOR | | Receive | | 4.500% | | 06/17/2015 | | | 400 | | | 44 | |
Morgan Stanley Dean Witter & Co. | | 6-month EUR-LIBOR | | Pay | | 6.000% | | 06/18/2034 | | | 1,100 | | | (4 | ) |
UBS Warburg LLC | | 6-month EUR-LIBOR | | Pay | | 4.000% | | 06/17/2010 | | | 200 | | | (9 | ) |
Barclays Bank PLC | | 6-month GBP-LIBOR | | Pay | | 5.000% | | 09/15/2010 | | GBP | 2,800 | | | (67 | ) |
Barclays Bank PLC | | 6-month GBP-LIBOR | | Receive | | 5.000% | | 09/15/2015 | | | 500 | | | 4 | |
Barclays Bank PLC | | 6-month GBP-LIBOR | | Pay | | 5.000% | | 06/18/2034 | | | 200 | | | (4 | ) |
Deutsche Bank AG | | 6-month GBP-LIBOR | | Pay | | 5.000% | | 06/15/2009 | | | 1,800 | | | 2 | |
Deutsche Bank AG | | 6-month GBP-LIBOR | | Receive | | 5.000% | | 09/15/2015 | | | 300 | | | 10 | |
Deutsche Bank AG | | 6-month GBP-LIBOR | | Receive | | 4.250% | | 06/12/2036 | | | 100 | | | 8 | |
Goldman Sachs & Co. | | 6-month GBP-LIBOR | | Receive | | 4.250% | | 06/12/2036 | | | 600 | | | 11 | |
HSBC Bank USA | | 6-month GBP-LIBOR | | Pay | | 5.000% | | 09/15/2010 | | | 1,400 | | | (34 | ) |
Merrill Lynch & Co., Inc. | | 6-month GBP-LIBOR | | Pay | | 5.000% | | 09/15/2010 | | | 1,000 | | | (24 | ) |
Morgan Stanley Dean Witter & Co. | | 6-month GBP-LIBOR | | Pay | | 5.000% | | 09/15/2015 | | | 300 | | | (1 | ) |
Goldman Sachs & Co. | | 3-month HKD-HIBOR | | Receive | | 4.235% | | 12/17/2008 | | HKD | 7,100 | | | 16 | |
Barclays Bank PLC | | 6-month JPY-LIBOR | | Receive | | 2.000% | | 12/15/2015 | | JPY | 30,000 | | | 3 | |
Deutsche Bank AG | | 6-month JPY-LIBOR | | Pay | | 1.000% | | 03/18/2008 | | | 100,000 | | | 0 | |
Deutsche Bank AG | | 6-month JPY-LIBOR | | Receive | | 2.000% | | 12/15/2015 | | | 50,000 | | | 4 | |
Goldman Sachs & Co. | | 6-month JPY-LIBOR | | Pay | | 1.000% | | 03/18/2008 | | | 400,000 | | | (2 | ) |
Goldman Sachs & Co. | | 6-month JPY-LIBOR | | Receive | | 2.020% | | 05/18/2010 | | | 17,000 | | | (4 | ) |
Goldman Sachs & Co. | | 6-month JPY-LIBOR | | Receive | | 1.300% | | 09/21/2011 | | | 40,000 | | | 5 | |
Goldman Sachs & Co. | | 6-month JPY-LIBOR | | Receive | | 2.000% | | 12/15/2015 | | | 350,000 | | | 19 | |
Merrill Lynch & Co., Inc. | | 6-month JPY-LIBOR | | Receive | | 2.000% | | 12/15/2015 | | | 50,000 | | | 4 | |
Morgan Stanley Dean Witter & Co. | | 6-month JPY-LIBOR | | Receive | | 2.000% | | 12/20/2013 | | | 130,000 | | | 14 | |
Morgan Stanley Dean Witter & Co. | | 6-month JPY-LIBOR | | Receive | | 2.000% | | 12/15/2015 | | | 420,000 | | | 29 | |
UBS Warburg LLC | | 6-month JPY-LIBOR | | Receive | | 0.800% | | 03/20/2012 | | | 50,000 | | | 4 | |
UBS Warburg LLC | | 6-month JPY-LIBOR | | Receive | | 2.000% | | 12/20/2013 | | | 190,000 | | | 28 | |
Bank of America | | 3-month USD-LIBOR | | Receive | | 5.000% | | 12/20/2016 | | $ | 200 | | | 2 | |
Bank of America | | 3-month USD-LIBOR | | Pay | | 5.000% | | 12/20/2036 | | | 500 | | | (5 | ) |
Goldman Sachs & Co. | | 3-month USD-LIBOR | | Receive | | 5.000% | | 12/20/2016 | | | 1,200 | | | 15 | |
J.P. Morgan Chase & Co. | | 3-month USD-LIBOR | | Pay | | 5.000% | | 12/20/2011 | | | 400 | | | (1 | ) |
J.P. Morgan Chase & Co. | | 3-month USD-LIBOR | | Receive | | 5.000% | | 12/20/2016 | | | 100 | | | 1 | |
Lehman Brothers, Inc. | | 3-month USD-LIBOR | | Pay | | 5.000% | | 12/20/2011 | | | 500 | | | (4 | ) |
Lehman Brothers, Inc. | | 3-month USD-LIBOR | | Receive | | 5.000% | | 12/20/2013 | | | 4,700 | | | 55 | |
Lehman Brothers, Inc. | | 3-month USD-LIBOR | | Receive | | 5.000% | | 12/20/2016 | | | 800 | | | 10 | |
Lehman Brothers, Inc. | | 3-month USD-LIBOR | | Pay | | 5.000% | | 12/20/2036 | | | 500 | | | (5 | ) |
Morgan Stanley Dean Witter & Co. | | 3-month USD-LIBOR | | Receive | | 5.000% | | 12/20/2016 | | | 1,900 | | | 23 | |
Royal Bank of Scotland PLC | | 3-month USD-LIBOR | | Pay | | 5.000% | | 12/20/2011 | | | 2,600 | | | (23 | ) |
| | | | | | | | | | | | | |
|
|
|
| | | | | | | | | | | | | | $ | 444 | |
| | | | | | | | | | | | | |
|
|
|
| | | | | | | | | | | | | | |
|
| Credit Default Swaps |
| Counterparty | | Reference Entity | | Buy/Sell
Protection+ | | (Pay)/Receive
Fixed Rate | | Expiration
Date | | Notional
Amount | | Unrealized
Appreciation |
Merrill Lynch & Co., Inc. | | Russia Government International Bond, 5.000% until 03/31/2007 and 7.500% thereafter, due 03/31/2030 | | Sell | | 0.410% | | 06/20/2007 | | $ | 100 | | $ | 0 |
UBS Warburg LLC | | Russia Government International Bond, 5.000% until 03/31/2007 and 7.500% thereafter, due 03/31/2030 | | Receive | | 5.000% | | 12/20/2026 | | | 900 | | | 1 |
| | | | | | | | | | | | | |
|
|
| | | | | | | | | | | | | | $ | 1 |
| | | | | | | | | | | | | |
|
|
|
| + If the Portfolio is a seller of protection and a credit event occurs, as defined under the terms of that particular swap agreement, the Portfolio will pay to the buyer of the protection an amount up to the notional value of the swap and in certain instances, take delivery of the security. As a buyer of protection, the Portfolio will generally receive from the seller of protection an amount up to the notional amount of the swap if a credit event occurs. |
| | | | |
| 20 | | PIMCO Variable Insurance Trust | | See Accompanying Notes |
| | |
| |
| | | June 30, 2006 (Unaudited) |
| | | | | | | | | | | | |
(h) Written options outstanding on June 30, 2006: |
Options on Exchange-Traded Futures Contracts
| | | | | | | | | | | | |
| Description | | Exercise
Price | | Expiration
Date | | # of
Contracts | | Premium | | Value |
Call - CBOT U.S. Treasury 10-Year Note September Futures | | $ 106.000 | | 08/25/2006 | | 15 | | $ | 9 | | $ | 4 |
Put - CBOT U.S. Treasury 10-Year Note September Futures | | 103.000 | | 08/25/2006 | | 15 | | | 5 | | | 2 |
| | | | | | | | |
|
| |
|
|
| | | | | | | | | $ | 14 | | $ | 6 |
| | | | | | | | |
|
| |
|
|
| | | | | | | | | | | | | | | | | | | | |
| | |
| Interest Rate Swaptions | | | | | | | |
| Description | | Counterparty | | Floating Rate
Index | | Pay/Receive
Floating Rate | | Exercise
Rate | | Expiration
Date | | Notional
Amount | | Premium | | Value | |
Call - OTC 5-Year Interest Rate Swap | | Goldman Sachs & Co. | | 3-month USD-LIBOR | | Receive | | 4.780% | | 08/07/2006 | | $ | 2,000 | | $ | 16 | | $ | 0 | |
Call - OTC 5-Year Interest Rate Swap | | Goldman Sachs & Co. | | 3-month USD-LIBOR | | Receive | | 5.210% | | 10/25/2006 | | | 1,000 | | | 4 | | | 1 | |
Call - OTC 5-Year Interest Rate Swap | | J.P. Morgan Chase & Co. | | 3-month USD-LIBOR | | Receive | | 4.560% | | 10/18/2006 | | | 1,000 | | | 10 | | | 0 | |
Call - OTC 5-Year Interest Rate Swap | | Royal Bank of Scotland PLC | | 3-month USD-LIBOR | | Receive | | 5.220% | | 04/19/2007 | | | 2,000 | | | 16 | | | 9 | |
Call - OTC 5-Year Interest Rate Swap | | Royal Bank of Scotland PLC | | 3-month USD-LIBOR | | Receive | | 5.280% | | 05/08/2007 | | | 2,000 | | | 18 | | | 11 | |
Call - OTC 5-Year Interest Rate Swap | | Royal Bank of Scotland PLC | | 3-month USD-LIBOR | | Receive | | 5.315% | | 05/09/2007 | | | 13,700 | | | 127 | | | 82 | |
Call - OTC 5-Year Interest Rate Swap | | Royal Bank of Scotland PLC | | 3-month USD-LIBOR | | Receive | | 5.315% | | 05/09/2007 | | | 1,400 | | | 13 | | | 8 | |
| | | | | | | | | | | | |
|
| |
|
|
|
| | | | | | | | | | | | | | | | $ | 204 | | $ | 111 | |
| | | | | | | | | | | | | | | |
|
| |
|
|
|
| | |
| Straddle Options | | | | | | | |
| Description | | Counterparty | | Exercise Price* | | Expiration
Date | | Notional
Amount | | Premium* | | Value | |
Call & Put - OTC U.S. dollar versus Japanese Yen Forward Delta Neutral Straddle | | Goldman Sachs & Co. | | $ 0.000 | | 08/23/2007 | | $ | 4,600 | | $ | 17 | | $ | (27 | ) |
| | | | | | | | | | | | | | | |
|
| |
|
|
|
|
* Exercise price and final premium determined on a future date, based upon implied volatility parameters. | |
| | | | | | | | | | | | | |
(i) Short sales outstanding on June 30, 2006: |
| Description | | Coupon | | Maturity
Date | | Principal
Amount | | Proceeds | | Value |
Fannie Mae | | 5.500% | | 07/13/2036 | | $ | 400 | | $ | 387 | | $ | 384 |
| | | | | | | | | |
|
| |
|
|
| | | | | | |
| See Accompanying Notes | | Semiannual Report | | June 30, 2006 | | 21 |
Schedule of Investments Foreign Bond Portfolio (U.S. Dollar-Hedged) (Cont.)
| | | | | | | | | | | | | | | | | |
(j) Forward foreign currency contracts outstanding on June 30, 2006: | |
| Type | | | | Principal
Amount
Covered by
Contract | | Settlement
Month | | Unrealized
Appreciation | | Unrealized
(Depreciation) | | | Net Unrealized
Appreciation/
(Depreciation) | |
Buy | | BRL | | 30 | | 07/2006 | | $ | 1 | | $ | 0 | | | $ | 1 | |
Sell | | | | 30 | | 07/2006 | | | 0 | | | 0 | | | | 0 | |
Buy | | | | 31 | | 08/2006 | | | 1 | | | 0 | | | | 1 | |
Buy | | | | 30 | | 09/2006 | | | 0 | | | 0 | | | | 0 | |
Buy | | CLP | | 4,000 | | 07/2006 | | | 0 | | | 0 | | | | 0 | |
Sell | | | | 4,000 | | 07/2006 | | | 0 | | | 0 | | | | 0 | |
Buy | | | | 6,033 | | 08/2006 | | | 0 | | | 0 | | | | 0 | |
Buy | | | | 4,000 | | 09/2006 | | | 0 | | | 0 | | | | 0 | |
Buy | | CNY | | 3,712 | | 05/2007 | | | 0 | | | (5 | ) | | | (5 | ) |
Sell | | DKK | | 178 | | 09/2006 | | | 0 | | | 0 | | | | 0 | |
Buy | | EUR | | 21 | | 07/2006 | | | 0 | | | 0 | | | | 0 | |
Sell | | | | 8,583 | | 07/2006 | | | 0 | | | (198 | ) | | | (198 | ) |
Buy | | GBP | | 60 | | 07/2006 | | | 1 | | | 0 | | | | 1 | |
Sell | | | | 1,817 | | 07/2006 | | | 0 | | | (13 | ) | | | (13 | ) |
Buy | | HKD | | 475 | | 07/2006 | | | 0 | | | 0 | | | | 0 | |
Sell | | | | 475 | | 07/2006 | | | 0 | | | 0 | | | | 0 | |
Buy | | | | 475 | | 09/2006 | | | 0 | | | 0 | | | | 0 | |
Buy | | JPY | | 12,529 | | 07/2006 | | | 0 | | | 0 | | | | 0 | |
Sell | | | | 507,968 | | 07/2006 | | | 25 | | | 0 | | | | 25 | |
Buy | | | | 3,912 | | 08/2006 | | | 0 | | | 0 | | | | 0 | |
Buy | | KRW | | 13,000 | | 07/2006 | | | 0 | | | 0 | | | | 0 | |
Sell | | | | 13,000 | | 07/2006 | | | 0 | | | 0 | | | | 0 | |
Buy | | | | 98,732 | | 08/2006 | | | 2 | | | 0 | | | | 2 | |
Buy | | | | 41,181 | | 09/2006 | | | 1 | | | 0 | | | | 1 | |
Buy | | MXN | | 277 | | 08/2006 | | | 0 | | | (2 | ) | | | (2 | ) |
Buy | | | | 68 | | 09/2006 | | | 0 | | | 0 | | | | 0 | |
Buy | | NZD | | 29 | | 08/2006 | | | 0 | | | 0 | | | | 0 | |
Buy | | PEN | | 51 | | 08/2006 | | | 0 | | | 0 | | | | 0 | |
Sell | | | | 51 | | 08/2006 | | | 0 | | | 0 | | | | 0 | |
Buy | | PLN | | 34 | | 08/2006 | | | 0 | | | (1 | ) | | | (1 | ) |
Buy | | | | 15 | | 09/2006 | | | 0 | | | 0 | | | | 0 | |
Buy | | | | 32 | | 11/2006 | | | 0 | | | 0 | | | | 0 | |
Buy | | RUB | | 201 | | 07/2006 | | | 0 | | | 0 | | | | 0 | |
Sell | | | | 200 | | 07/2006 | | | 0 | | | 0 | | | | 0 | |
Buy | | | | 457 | | 08/2006 | | | 1 | | | 0 | | | | 1 | |
Buy | | | | 200 | | 09/2006 | | | 0 | | | 0 | | | | 0 | |
Buy | | SGD | | 11 | | 07/2006 | | | 0 | | | 0 | | | | 0 | |
Sell | | | | 11 | | 07/2006 | | | 0 | | | 0 | | | | 0 | |
Buy | | | | 165 | | 08/2006 | | | 0 | | | (1 | ) | | | (1 | ) |
Buy | | | | 11 | | 09/2006 | | | 0 | | | 0 | | | | 0 | |
Buy | | SKK | | 478 | | 08/2006 | | | 0 | | | 0 | | | | 0 | |
Buy | | | | 362 | | 09/2006 | | | 0 | | | 0 | | | | 0 | |
Buy | | TWD | | 3,537 | | 08/2006 | | | 0 | | | (3 | ) | | | (3 | ) |
Buy | | ZAR | | 70 | | 08/2006 | | | 0 | | | (1 | ) | | | (1 | ) |
| | | | | | | | |
|
| |
|
|
|
| | | | | | | | | $ | 32 | | $ | (224 | ) | | $ | (192 | ) |
| | | | | | | | |
|
| |
|
|
| |
|
|
|
| | | | |
| 22 | | PIMCO Variable Insurance Trust | | See Accompanying Notes |
| | |
| |
| Schedule of Investments Global Bond Portfolio (Unhedged) | | June 30, 2006 (Unaudited) |
| | | | | | | | |
| | | | | PRINCIPAL | | | | |
| | | | | AMOUNT | | | | VALUE |
| | | | | (000S) | | | | (000S) |
| BELGIUM (i) 0.6% |
| Belgium Government Bond | | | | | | |
4.250% due 09/28/2014 | | EUR | | 600 | | $ | | 780 |
| | | | | | | | |
|
Total Belgium (Cost $763) | | | | | | 780 |
| | | | | | | | |
|
| |
| BRAZIL 0.2% |
| Vale Overseas Ltd. | | | | | | | | |
6.250% due 01/11/2016 | | $ | | 300 | | | | 287 |
| | | | | | | | |
|
Total Brazil (Cost $300) | | | | | | | | 287 |
| | | | | | | | |
|
| |
| CAYMAN ISLANDS (i) 0.6% |
| ASIF II | | | | | | | | |
4.540% due 06/15/2007 | | CAD | | 200 | | | | 179 |
|
| MUFG Capital Finance 1 Ltd. | | | | | | |
6.346% due 07/29/2049 | | $ | | 400 | | | | 387 |
|
| Vita Capital Ltd. | | | | | | | | |
6.340% due 01/01/2007 | | | | 250 | | | | 251 |
| | | | | | | | |
|
Total Cayman Islands (Cost $811) | | | | 817 |
| | | | | | | | |
|
| |
| FRANCE (i) 1.1% |
| France Government Bond | | | | | | |
6.500% due 04/25/2011 | | EUR | | 300 | | | | 428 |
3.150% due 07/25/2032 (c) | | | | 108 | | | | 171 |
5.750% due 10/25/2032 | | | | 600 | | | | 935 |
| | | | | | | | |
|
Total France (Cost $1,580) | | | | | | 1,534 |
| | | | | | | | |
|
| |
| GERMANY (i) 10.4% |
| Amadeus Global Travel Distribution S.A. | | |
5.549% due 04/08/2013 | | EUR | | 50 | | | | 65 |
6.049% due 04/08/2014 | | | | 50 | | | | 65 |
|
| Republic of Germany | | | | | | | | |
5.250% due 01/04/2011 | | | | 1,100 | | | | 1,488 |
4.250% due 01/04/2014 | | | | 1,400 | | | | 1,820 |
6.250% due 01/04/2024 | | | | 600 | | | | 955 |
6.500% due 07/04/2027 | | | | 1,100 | | | | 1,828 |
5.625% due 01/04/2028 | | | | 3,550 | | | | 5,357 |
4.750% due 07/04/2028 | | | | 1,000 | | | | 1,355 |
6.250% due 01/04/2030 | | | | 400 | | | | 654 |
5.500% due 01/04/2031 | | | | 400 | | | | 600 |
4.750% due 07/04/2034 | | | | 100 | | | | 137 |
| | | | | | | | |
|
Total Germany (Cost $14,046) | | | | 14,324 |
| | | | | | | | |
|
| |
| ITALY (i) 0.4% |
| Seashell Securities PLC | | | | | | | | |
3.079% due 10/25/2028 | | EUR | | 50 | | | | 63 |
|
| Siena Mortgages SpA | | | | | | | | |
3.191% due 12/16/2038 | | | | 274 | | | | 352 |
|
| Telecom Italia SpA | | | | | | | | |
5.625% due 02/01/2007 | | | | 60 | | | | 78 |
| | | | | | | | |
|
Total Italy (Cost $461) | | | | | | | | 493 |
| | | | | | | | |
|
| |
| JAPAN (i) 10.9% |
| Bank of Tokyo-Mitsubishi UFJ Ltd. | | | | |
3.500% due 12/16/2015 | | EUR | | 100 | | | | 123 |
|
| Japan Government Bond | | | | | | | | |
0.700% due 09/20/2008 | | JPY | | 20,000 | | | | 174 |
1.000% due 09/20/2010 | | | | 100,000 | | | | 864 |
1.500% due 03/20/2011 | | | | 620,000 | | | | 5,453 |
1.600% due 09/20/2013 | | | | 10,000 | | | | 87 |
1.500% due 03/20/2014 | | | | 50,000 | | | | 429 |
1.600% due 06/20/2014 | | | | 120,000 | | | | 1,034 |
1.600% due 09/20/2014 | | | | 240,000 | | | | 2,064 |
2.300% due 05/20/2030 | | | | 7,000 | | | | 60 |
2.400% due 03/20/2034 | | | | 130,000 | | | | 1,116 |
2.300% due 06/20/2035 | | | | 130,000 | | | | 1,087 |
2.500% due 09/20/2035 | | | | 280,000 | | | | 2,442 |
|
| | | | | | | | |
| Resona Bank Ltd. | | | | | | | | |
5.850% due 09/29/2049 | | $ | | 100 | | $ | | 93 |
|
| Sumitomo Mitsui Banking Corp. | | | | |
5.625% due 07/29/2049 | | | | 100 | | | | 93 |
| | | | | | | | |
|
Total Japan (Cost $15,509) | | | | | | 15,119 |
| | | | | | | | |
|
| |
| MEXICO 0.1% |
| Pemex Project Funding Master Trust | | | | |
5.750% due 12/15/2015 | | $ | | 100 | | | | 92 |
| | | | | | | | |
|
Total Mexico (Cost $97) | | | | | | | | 92 |
| | | | | | | | |
|
| |
| NETHERLANDS (i) 1.1% |
| Dutch Mortgage-Backed Securities BV |
3.094% due 10/02/2079 | | EUR | | 1,000 | | | | 1,285 |
|
| Netherlands Government Bond | | | | |
4.250% due 07/15/2013 | | | | 200 | | | | 260 |
| | | | | | | | |
|
Total Netherlands (Cost $1,479) | | | | 1,545 |
| | | | | | | | |
|
| |
| SPAIN (i) 5.9% |
| Banesto Banco de Emisiones | | | | |
3.118% due 10/04/2006 | | EUR | | 100 | | | | 128 |
|
| Spain Government Bond | | | | | | | | |
5.150% due 07/30/2009 | | | | 900 | | | | 1,198 |
4.750% due 07/30/2014 | | | | 5,000 | | | | 6,734 |
| | | | | | | | |
|
Total Spain (Cost $7,887) | | | | | | 8,060 |
| | | | | | | | |
|
| |
| UNITED KINGDOM (i) 13.2% |
| HBOS PLC | | | | | | | | |
5.920% due 09/29/2049 | | $ | | 200 | | | | 185 |
|
| Holmes Financing PLC | | | | | | | | |
3.004% due 10/15/2009 | | EUR | | 100 | | | | 128 |
3.024% due 07/25/2010 | | | | 100 | | | | 128 |
|
| Paragon Mortgages PLC | | | | | | | | |
3.309% due 03/15/2030 | | | | 200 | | | | 256 |
|
| United Kingdom Gilt | | | | | | | | |
5.000% due 03/07/2008 | | GBP | | 100 | | | | 186 |
4.750% due 06/07/2010 | | | | 7,520 | | | | 13,881 |
5.000% due 03/07/2012 | | | | 200 | | | | 374 |
4.750% due 09/07/2015 | | | | 1,500 | | | | 2,779 |
|
| Vodafone Group PLC | | | | | | | | |
5.560% due 06/29/2007 | | $ | | 300 | | | | 300 |
| | | | | | | | |
|
Total United Kingdom (Cost $17,911) | | 18,217 |
| | | | | | | | |
|
| |
| UNITED STATES 38.7% |
| |
| ASSET-BACKED SECURITIES 7.8% |
| AAA Trust | | | | | | | | |
5.422% due 11/26/2035 | | $ | | 26 | | | | 26 |
|
| Accredited Mortgage Loan Trust | | | | |
5.216% due 09/25/2036 | | | | 700 | | | | 700 |
|
| ACE Securities Corp. | | | | | | | | |
5.432% due 10/25/2035 | | | | 128 | | | | 128 |
|
| Aegis Asset-Backed Securities Trust | | |
5.680% due 10/25/2034 | | | | 53 | | | | 53 |
|
| Amortizing Residential Collateral Trust | | |
5.672% due 10/25/2031 | | | | 4 | | | | 4 |
5.612% due 07/25/2032 | | | | 1 | | | | 1 |
|
| Argent Securities, Inc. | | | | | | | | |
5.442% due 10/25/2035 | | | | 95 | | | | 95 |
5.442% due 02/25/2036 | | | | 575 | | | | 575 |
|
| Asset-Backed Funding Certificates | | | | |
5.432% due 08/25/2035 | | | | 25 | | | | 26 |
|
| Asset-Backed Securities Corp. Home Equity |
5.432% due 11/25/2035 | | | | 59 | | | | 59 |
|
| | | | | | | | |
| Bear Stearns Asset-Backed Securities, Inc. |
5.532% due 07/25/2031 | | $ | | 2 | | $ | | 2 |
5.492% due 12/25/2042 | | | | 15 | | | | 15 |
|
| Capital One Auto Finance Trust | | | | |
5.117% due 05/15/2007 | | | | 247 | | | | 247 |
|
| Carrington Mortgage Loan Trust | | | | |
5.402% due 06/25/2035 | | | | 18 | | | | 18 |
5.442% due 09/25/2035 | | | | 241 | | | | 241 |
|
| Centex Home Equity | | | | | | | | |
5.412% due 06/25/2035 | | | | 28 | | | | 28 |
5.372% due 06/25/2036 | | | | 582 | | | | 582 |
|
| Countrywide Asset-Backed Certificates | | |
5.402% due 10/25/2035 | | | | 12 | | | | 12 |
5.160% due 07/25/2036 | | | | 700 | | | | 701 |
|
| CS First Boston Mortgage Securities Corp. | | |
5.632% due 01/25/2032 | | | | 2 | | | | 2 |
|
| First Franklin Mortgage Loan Asset-Backed Certificates |
5.731% due 02/25/2034 | | | | 4 | | | | 4 |
5.352% due 05/25/2036 | | | | 587 | | | | 587 |
|
| GSAMP Trust | | | | | | | | |
5.612% due 03/25/2034 | | | | 71 | | | | 72 |
|
| Indymac Residential Asset-Backed Trust | | |
5.000% due 08/25/2036 | | | | 700 | | | | 699 |
|
| IXIS Real Estate Capital Trust | | | | |
5.382% due 08/25/2036 | | | | 291 | | | | 291 |
|
| Long Beach Mortgage Loan Trust | | | | |
5.382% due 04/25/2036 | | | | 461 | | | | 461 |
|
| Merrill Lynch Mortgage Investors, Inc. | | |
5.422% due 06/25/2036 | | | | 6 | | | | 7 |
|
| Morgan Stanley ABS Capital I | | | | |
5.381% due 06/25/2036 | | | | 600 | | | | 600 |
|
| Morgan Stanley Capital I | | | | | | | | |
5.392% due 02/25/2036 | | | | 513 | | | | 513 |
|
| Morgan Stanley Home Equity Loans | | | | |
5.392% due 02/25/2036 | | | | 533 | | | | 534 |
|
| Option One Mortgage Loan Trust | | | | |
5.392% due 01/25/2036 | | | | 487 | | | | 488 |
|
| Quest Trust | | | | | | | | |
5.402% due 12/25/2035 | | | | 128 | | | | 128 |
|
| Residential Asset Mortgage Products, Inc. | | |
5.652% due 12/25/2033 | | | | 3 | | | | 3 |
5.402% due 02/25/2036 | | | | 523 | | | | 523 |
5.402% due 10/25/2036 | | | | 433 | | | | 433 |
|
| Residential Asset Securities Corp. | | | | |
5.422% due 05/25/2027 | | | | 63 | | | | 63 |
5.382% due 04/25/2036 | | | | 192 | | | | 192 |
|
| SACO I, Inc. | | | | | | | | |
5.432% due 07/25/2035 | | | | 73 | | | | 73 |
5.382% due 05/25/2036 | | | | 262 | | | | 262 |
|
| Saxon Asset Securities Trust |
5.592% due 01/25/2032 | | | | 3 | | | | 3 |
|
| Securitized Asset-Backed Receivables LLC Trust |
5.382% due 03/25/2036 | | | | 541 | | | | 541 |
|
| Soundview Home Equity Loan Trust |
5.492% due 04/25/2035 | | | | 76 | | | | 76 |
5.432% due 11/25/2035 | | | | 127 | | | | 127 |
|
| Structured Asset Securities Corp. |
5.722% due 05/25/2034 | | | | 32 | | | | 32 |
4.900% due 04/25/2035 | | | | 71 | | | | 68 |
5.432% due 11/25/2035 | | | | 354 | | | | 354 |
|
| Truman Capital Mortgage Loan Trust |
5.662% due 01/25/2034 | | | | 41 | | | | 41 |
| | | | | | | | |
|
| | | | | | | | | 10,690 |
| | | | | | | | |
|
| | | | | | |
| See Accompanying Notes | | Semiannual Report | | June 30, 2006 | | 23 |
| | |
| |
| Schedule of Investments Global Bond Portfolio (Unhedged) (Cont.) | | |
| | | | | | | | |
| | | | | PRINCIPAL | | | | |
| | | | | AMOUNT | | | | VALUE |
| | | | | (000S) | | | | (000S) |
| CORPORATE BONDS & NOTES 6.5% |
| AT&T, Inc. | | | | | | | | |
5.262% due 05/15/2008 | | $ | | 600 | | $ | | 600 |
|
| Atlantic & Western Re Ltd. |
11.508% due 01/09/2007 | | | | 250 | | | | 246 |
|
| Boston Scientific Corp. |
6.000% due 06/15/2011 | | | | 200 | | | | 198 |
6.400% due 06/15/2016 | | | | 200 | | | | 195 |
|
| Charter One Bank N.A. |
5.157% due 04/24/2009 | | | | 1,000 | | | | 1,001 |
|
| CIT Group, Inc. |
5.259% due 02/21/2008 | | | | 300 | | | | 300 |
5.404% due 05/23/2008 | | | | 100 | | | | 100 |
5.380% due 06/08/2009 | | | | 500 | | | | 500 |
|
| Citigroup, Inc. |
5.520% due 12/26/2008 | | | | 200 | | | | 200 |
|
| CMS Energy Corp. |
8.900% due 07/15/2008 | | | | 200 | | | | 209 |
7.500% due 01/15/2009 | | | | 100 | | | | 102 |
|
| ConocoPhillips Australia Funding Co. |
5.128% due 04/09/2009 | | | | 500 | | | | 501 |
|
| Dominion Resources, Inc. |
5.790% due 09/28/2007 | | | | 100 | | | | 100 |
|
| General Electric Capital Corp. |
5.429% due 06/15/2009 | | | | 600 | | | | 601 |
|
| Harrah’s Operating Co., Inc. |
5.760% due 02/08/2008 | | | | 100 | | | | 100 |
|
| HJ Heinz Co. | | | | | | | | |
6.428% due 12/01/2020 | | | | 300 | | | | 305 |
|
| HSBC Finance Corp. |
5.459% due 09/15/2008 | | | | 100 | | | | 100 |
5.504% due 06/19/2009 | | | | 400 | | | | 400 |
5.500% due 01/19/2016 | | | | 200 | | | | 191 |
|
| Mizuho Preferred Capital Co. LLC |
8.790% due 12/29/2049 | | | | 100 | | | | 105 |
|
| Morgan Stanley |
5.276% due 02/09/2009 | | | | 500 | | | | 501 |
|
| Oracle Corp. & Ozark Holding, Inc. |
5.280% due 01/13/2009 | | | | 200 | | | | 200 |
|
| SB Treasury Co. LLC |
9.400% due 12/29/2049 | | | | 100 | | | | 106 |
|
| Tokai Preferred Capital Co. LLC |
9.980% due 12/29/2049 | | | | 200 | | | | 215 |
|
| Toyota Motor Credit Corp. |
5.140% due 10/12/2007 | | | | 400 | | | | 400 |
|
| Unicredito Italiano | | | | | | | | |
5.231% due 12/03/2007 | | | | 300 | | | | 301 |
5.307% due 12/13/2007 | | | | 400 | | | | 400 |
|
| US Bancorp | | | | | | | | |
5.371% due 04/28/2009 | | | | 300 | | | | 300 |
|
| Wachovia Bank N.A. | | | | | | | | |
5.489% due 03/23/2009 | | | | 500 | | | | 500 |
| | | | | | | | |
|
| | | | | | | | | 8,977 |
| | | | | | | | |
|
| |
| MORTGAGE-BACKED SECURITIES 8.3% |
| Banc of America Mortgage Securities |
5.000% due 05/25/2034 | | | | 272 | | | | 265 |
|
| Bear Stearns Commercial Mortgage Securities |
5.404% due 03/15/2019 | | | | 700 | | | | 699 |
|
| Countrywide Alternative Loan Trust |
5.291% due 02/25/2036 | | | | 479 | | | | 480 |
5.602% due 02/25/2036 | | | | 486 | | | | 487 |
6.209% due 08/25/2036 | | | | 700 | | | | 704 |
| | | | | | | | |
| Countrywide Home Loan Mortgage Pass-Through Trust |
5.602% due 08/25/2034 | | $ | | 35 | | $ | | 35 |
5.702% due 09/25/2034 | | | | 81 | | | | 82 |
5.652% due 02/25/2035 | | | | 54 | | | | 55 |
5.642% due 03/25/2035 | | | | 562 | | | | 563 |
5.612% due 04/25/2035 | | | | 54 | | | | 54 |
5.552% due 05/25/2035 | | | | 468 | | | | 468 |
|
| CS First Boston Mortgage Securities Corp. |
6.500% due 04/25/2033 | | | | 11 | | | | 11 |
|
| CSAB Mortgage-Backed Trust |
5.422% due 06/25/2036 | | | | 281 | | | | 281 |
|
| First Horizon Asset Securities, Inc. |
6.250% due 08/25/2017 | | | | 269 | | | | 268 |
|
| GE Capital Commercial Mortgage Corp. |
4.229% due 12/10/2037 | | | | 610 | | | | 589 |
|
| GMAC Commercial Mortgage Securities, Inc. |
6.420% due 05/15/2035 | | | | 93 | | | | 94 |
|
| GMAC Mortgage Corp. Loan Trust |
5.500% due 09/25/2034 | | | | 131 | | | | 129 |
|
| Greenpoint Mortgage Funding Trust |
5.592% due 11/25/2045 | | | | 67 | | | | 67 |
|
| GSR Mortgage Loan Trust |
3.405% due 06/01/2034 | | | | 107 | | | | 106 |
4.541% due 09/25/2035 | | | | 264 | | | | 258 |
|
| Harborview Mortgage Loan Trust |
5.622% due 02/25/2034 | | | | 34 | | | | 34 |
|
| Indymac Index Mortgage Loan Trust |
5.402% due 06/25/2046 | | | | 582 | | | | 583 |
|
| Lehman XS Trust | | | | | | | | |
5.402% due 06/25/2036 | | | | 700 | | | | 701 |
5.402% due 04/25/2046 | | | | 474 | | | | 474 |
|
| Mellon Residential Funding Corp. |
5.639% due 12/15/2030 | | | | 62 | | | | 62 |
|
| Nomura Asset Acceptance Corp. |
5.050% due 10/25/2035 | | | | 85 | | | | 83 |
|
| Residential Accredit Loans, Inc. |
5.532% due 03/25/2046 | | | | 598 | | | | 599 |
|
| Sequoia Mortgage Trust |
5.567% due 08/20/2032 | | | | 24 | | | | 24 |
|
| Structured Asset Mortgage Investments, Inc. |
5.602% due 03/19/2034 | | | | 52 | | | | 52 |
5.542% due 07/19/2034 | | | | 41 | | | | 41 |
5.542% due 09/25/2035 | | | | 599 | | | | 600 |
|
| Washington Mutual, Inc. |
5.592% due 12/25/2027 | | | | 142 | | | | 142 |
5.121% due 10/25/2032 | | | | 5 | | | | 5 |
5.009% due 02/27/2034 | | | | 21 | | | | 21 |
5.410% due 08/25/2042 | | | | 64 | | | | 64 |
5.632% due 12/25/2044 | | | | 59 | | | | 59 |
5.642% due 01/25/2045 | | | | 60 | | | | 60 |
5.612% due 10/25/2045 | | | | 170 | | | | 171 |
5.592% due 12/26/2045 | | | | 362 | | | | 363 |
5.259% due 07/25/2046 | | | | 700 | | | | 699 |
|
| Wells Fargo Mortgage-Backed Securities Trust |
4.750% due 10/25/2018 | | | | 258 | | | | 248 |
4.950% due 03/25/2036 | | | | 481 | | | | 474 |
5.240% due 05/25/2036 | | | | 184 | | | | 183 |
| | | | | | | | |
|
| | | | | | | | | 11,437 |
| | | | | | | | |
|
| |
| MUNICIPAL BONDS & NOTES 0.0% |
| New York City, New York Municipal Water Finance Authority Revenue Notes, Series 2004 |
5.000% due 02/01/2028 | | | | 25 | | | | 26 |
| | | | | | | | |
|
| |
| | | | | | | | |
| PREFERRED STOCK 0.4% |
| DG Funding Trust | | | | | | | | |
7.210% due 12/31/2049 | | | | 58 | | $ | | 612 |
| | | | | | | | |
|
| |
| | | | | PRINCIPAL
AMOUNT
(000S) | | | | |
| U.S. GOVERNMENT AGENCIES 8.7% |
| Fannie Mae | | | | | | | | |
4.192% due 11/01/2034 | | $ | | 414 | | | | 406 |
4.401% due 10/01/2034 | | | | 54 | | | | 53 |
4.964% due 12/01/2034 | | | | 59 | | | | 58 |
5.000% due 11/01/2018 - 07/13/2036 (d) | | | | 896 | | | | 850 |
5.442% due 03/25/2034 | | | | 64 | | | | 64 |
5.472% due 08/25/2034 | | | | 60 | | | | 60 |
5.500% due 10/01/2016 - 07/13/2036 (d) | | | | 5,534 | | | | 5,337 |
5.572% due 08/25/2030 | | | | 61 | | | | 61 |
6.000% due 07/25/2044 | | | | 129 | | | | 128 |
|
| Freddie Mac | | | | | | | | |
5.211% due 10/25/2044 | | | | 322 | | | | 324 |
5.500% due 06/01/2035 - 07/13/2036 (d) | | | | 4,862 | | | | 4,675 |
6.103% due 02/01/2029 | | | | 33 | | | | 34 |
|
| Government National Mortgage Association |
5.125% due 11/20/2024 | | | | 8 | | | | 9 |
| | | | | | | | |
|
| | | | | | | | | 12,059 |
| | | | | | | | |
|
| |
| U.S. TREASURY OBLIGATIONS 7.0% |
| Treasury Inflation Protected Securities (c) |
3.000% due 07/15/2012 | | | | 112 | | | | 115 |
2.000% due 01/15/2014 | | | | 109 | | | | 105 |
2.000% due 07/15/2014 | | | | 214 | | | | 206 |
|
| U.S. Treasury Bonds | | | | | | | | |
8.750% due 05/15/2017 | | | | 100 | | | | 129 |
8.875% due 02/15/2019 | | | | 200 | | | | 266 |
8.125% due 08/15/2019 | | | | 100 | | | | 127 |
8.125% due 05/15/2021 | | | | 1,100 | | | | 1,415 |
8.000% due 11/15/2021 | | | | 600 | | | | 768 |
7.125% due 02/15/2023 | | | | 600 | | | | 718 |
6.250% due 08/15/2023 | | | | 3,800 | | | | 4,192 |
|
| U.S. Treasury Notes | | | | | | | | |
4.625% due 02/29/2008 | | | | 800 | | | | 793 |
3.875% due 09/15/2010 | | | | 30 | | | | 29 |
4.250% due 08/15/2013 | | | | 100 | | | | 95 |
|
| U.S. Treasury Strips | | | | | | | | |
0.000% due 05/15/2017 (b) | | | | 430 | | | | 245 |
0.000% due 08/15/2020 (b) | | | | 300 | | | | 142 |
0.000% due 11/15/2021 (b) | | | | 600 | | | | 265 |
| | | | | | | | |
|
| | | | | | | | | 9,610 |
| | | | | | | | |
|
Total United States (Cost $54,215) | | | | 53,411 |
| | | | | | | | |
|
| |
| | | | | NOTIONAL
AMOUNT
(000S) | | | | |
| PURCHASED CALL OPTIONS 0.3% |
| 1-Year Interest Rate Swap (OTC) Pay 3-Month USD-LIBOR Floating Rate Index |
Strike @ 5.190%
Exp. 05/09/2007 | | $ | | 171,200 | | | | 174 |
|
| 2-Year Interest Rate Swap (OTC) Pay 3-Month USD-LIBOR Floating Rate Index |
Strike @ 4.500%
Exp. 10/18/2006 | | | | 4,700 | | | | 0 |
Strike @ 4.750%
Exp. 08/07/2006 | | | | 4,700 | | | | 0 |
Strike @ 5.080%
Exp. 04/19/2007 | | | | 4,600 | | | | 7 |
Strike @ 5.150%
Exp. 05/08/2007 | | | | 23,300 | | | | 45 |
| | | | |
| 24 | | PIMCO Variable Insurance Trust | | See Accompanying Notes |
| | |
| |
| | | June 30, 2006 (Unaudited) |
| | | | | | | | |
| | | | | NOTIONAL | | | | |
| | | | | AMOUNT | | | | VALUE |
| | | | | (000S) | | | | (000S) |
Strike @ 5.130%
Exp. 10/25/2006 | | $ | | 4,700 | | $ | | 1 |
Strike @ 5.200%
Exp. 05/09/2007 | | | | 10,600 | | | | 23 |
Strike @ 5.500%
Exp. 06/29/2007 | | | | 10,800 | | | | 52 |
|
| 30-Year Interest Rate Swap (OTC) Pay 3-Month USD-LIBOR Floating Rate Index |
Strike @ 5.750%
Exp. 04/27/2009 | | | | 100 | | | | 6 |
|
| U.S. dollar versus Japanese Yen (OTC) |
Strike @ JY117.000
Exp. 12/11/2006 | | | | 740 | | | | 5 |
Strike @ JY120.000
Exp. 12/11/2006 | | | | 50 | | | | 0 |
|
| |
| | | | | #OF
CONTRACTS | | | | |
| U.S. Treasury 30-Year Bond September Futures (CBOT) |
Strike @ $108.000
Exp. 08/25/2006 | | | | 23 | | | | 14 |
| | | | | | | | |
|
Total Purchased Call Options (Cost $622) | | 327 |
| | | | | | | | |
|
| |
| | | | | NOTIONAL
AMOUNT
(000S) | | | | |
| PURCHASED PUT OPTIONS 0.0% |
| 30-Year Interest Rate Swap (OTC) Receive 3-Month USD-LIBOR Floating Rate Index |
Strike @ 6.250%
Exp. 04/27/2009 | | $ | | 100 | | | | 4 |
| |
| | | | | # OF
CONTRACTS | | | | |
| 90-Day Eurodollar December Futures (CME) |
Strike @ $91.750
Exp. 12/18/2006 | | | | 161 | | | | 1 |
|
| U.S. Treasury 10-Year Note September Futures (CBOT) |
Strike @ $98.000
Exp. 08/25/2006 | | | | 100 | | | | 2 |
|
| U.S. Treasury 30-Year Bond September Futures (CBOT) |
Strike @ $103.000
Exp. 08/25/2006 | | | | 23 | | | | 4 |
| | | | | | | | |
|
Total Purchased Put Options (Cost $25) | | 11 |
| | | | | | | | |
|
| |
| | | | | | | | |
| PURCHASED STRADDLE OPTIONS (j) 0.0% |
| Call & Put–OTC U.S. dollar versus Japanese Yen Forward Delta Neutral Straddle |
Strike @ $0.000
Exp. 08/23/2007 | | $ | | 6,000 | | $ | | 3 |
| | | | | | | | |
|
Total Purchased Straddle Options (Cost $0) | | 3 |
| | | | | | | | |
|
| | | | | | | | | |
| | | | | PRINCIPAL
AMOUNT
(000S) | | | | |
| SHORT-TERM INSTRUMENTS 23.2% |
| |
| CERTIFICATES OF DEPOSIT 2.0% |
| Countrywide Bank N.A. | | | | | | | | |
5.209% due 09/15/2006 | | $ | | 700 | | | | 700 |
|
| Danske Corp. | | | | | | | | |
4.980% due 07/26/2006 | | | | 2,000 | | | | 1,994 |
| | | | | | | | |
|
| | | | | | | | | 2,694 |
| | | | | | | | |
|
| |
| COMMERCIAL PAPER 20.1% |
| Bank of Ireland | | | | | | | | |
5.090% due 08/17/2006 | | | | 2,800 | | | | 2,782 |
|
| BNP Paribas Finance | | | | | | | | |
5.000% due 08/28/2006 | | | | 3,300 | | | | 3,274 |
|
| CBA (de) Finance | | | | | | | | |
5.080% due 08/21/2006 | | | | 3,700 | | | | 3,674 |
|
| Dexia Delaware LLC | | | | | | | | |
4.980% due 07/25/2006 | | | | 1,800 | | | | 1,795 |
5.065% due 08/18/2006 | | | | 1,300 | | | | 1,292 |
|
| DnB NORBank ASA | | | | | | | | |
4.990% due 08/18/2006 | | | | 2,400 | | | | 2,385 |
|
| HBOS Treasury Services PLC | | | | | | | | |
5.055% due 08/17/2006 | | | | 3,100 | | | | 3,080 |
|
| Nordea N.A., Inc. | | | | | | | | |
5.120% due 09/05/2006 | | | | 3,500 | | | | 3,468 |
5.180% due 09/08/2006 | | | | 700 | | | | 693 |
|
| Societe Generale N.A. | | | | | | | | |
5.055% due 08/15/2006 | | | | 400 | | | | 398 |
4.985% due 08/22/2006 | | | | 1,500 | | | | 1,490 |
|
| Sumitomo Corp. of America | | | | | | | | |
4.980% due 09/12/2006 | | | | 200 | | | | 198 |
| | | | | | | | |
| Svenska Handelsbanken, Inc. | | | | |
5.190% due 09/11/2006 | | $ | | 2,900 | | $ | | 2,871 |
|
| Time Warner Telecom, Inc. | | | | | | | | |
5.240% due 09/19/2006 | | | | 300 | | | | 297 |
| | | | | | | | |
|
| | | | | | | | | 27,697 |
| | | | | | | | |
|
| |
| REPURCHASE AGREEMENT 0.5% |
| State Street Bank | | | | | | | | |
4.900% due 07/03/2006 | | | | 660 | | | | 660 |
| | | | | | | | |
|
(Dated 06/30/2006. Collateralized by Freddie Mac 2.750% due 02/09/2007 valued at $676. Repurchase proceeds are $660.) |
| |
| U.S. TREASURY BILLS 0.6% |
4.748% due 08/31/2006 - 09/14/2006 (d)(e) | | | | 905 | | | | 896 |
| | | | | | | | |
|
Total Short-Term Instruments
(Cost $31,947) | | | | 31,947 |
| | | | | | | | |
|
| | | | | | | |
Total Investments (a)
(Cost $147,653) 106.7% | | $ | | 146,967 |
| | | | | | | |
Written Options (g) (0.3%)
(Premiums $648) | | | | (358) |
| | | | | | | |
| Other Assets and Liabilities (Net) (6.4%) | | | | (8,812) |
| | | | | | | | |
|
| Net Assets 100.0% | | $ | | 137,797 |
| | | | | | | | |
|
|
Notes to Schedule of Investments (amounts in thousands, except number of contracts): |
(a) As of June 30, 2006, portfolio securities with an aggregate market value of $6,670 were valued in good faith and pursuant to guidelines established by the Board of Trustees. |
| |
(b) Principal only security. |
| |
(c) Principal amount of security is adjusted for inflation. |
| |
(d) Securities are grouped by coupon or range of coupons and represent a range of maturities. |
| |
(e) Securities with an aggregate market value of $649 have been segregated with the custodian to cover margin requirements for the following open futures contracts on June 30, 2006: |
| | | | | | | | | | |
| Description | | Type | | Expiration
Month | | # of
Contracts | | Unrealized
Appreciation/
(Depreciation) | |
90-Day Eurodollar June Futures | | Long | | 06/2007 | | 79 | | $ | (51 | ) |
Euro-Bobl 5-Year Note September Futures | | Long | | 09/2006 | | 8 | | | (5 | ) |
Euro-Bund 10-Year Note September Futures | | Long | | 09/2006 | | 68 | | | (56 | ) |
Euro-Bund 10-Year Note September Futures Put Option Strike @ EUR107.500 | | Long | | 09/2006 | | 50 | | | 0 | |
Japan Government 10-Year Note September Futures | | Long | | 09/2006 | | 19 | | | (12 | ) |
U.S. Treasury 5-Year Note September Futures | | Long | | 09/2006 | | 23 | | | (14 | ) |
U.S. Treasury 10-Year Note September Futures | | Long | | 09/2006 | | 87 | | | (42 | ) |
U.S. Treasury 30-Year Bond September Futures | | Long | | 09/2006 | | 11 | | | 1 | |
| | | | | | | | |
|
|
|
| | | | | | | | | $ | (179 | ) |
| | | | | | | | |
|
|
|
| | | | | | |
| See Accompanying Notes | | Semiannual Report | | June 30, 2006 | | 25 |
Schedule of Investments Global Bond Portfolio (Unhedged) (Cont.)
| | | | | | | | | | | | | | | | | |
(f) Swap agreements outstanding on June 30, 2006: | | | | |
| Interest Rate Swaps | | | | | | | | | | | | | | | | | |
| Counterparty | | Floating Rate
Index | | Pay/Receive
Floating Rate | | Fixed Rate | | Expiration
Date | | | | Notional
Amount | | Unrealized
Appreciation/
(Depreciation) | |
Citibank N.A. | | 6-month Australian Bank Bill | | Pay | | 6.000% | | 06/15/2010 | | | AUD | | 700 | | $ | (8 | ) |
Citibank N.A. | | 6-month Australian Bank Bill | | Receive | | 6.000% | | 06/15/2015 | | | | | 400 | | | 7 | |
Deutsche Bank AG | | 6-month Australian Bank Bill | | Pay | | 6.000% | | 12/15/2011 | | | | | 3,900 | | | (14 | ) |
Deutsche Bank AG | | 6-month Australian Bank Bill | | Receive | | 6.000% | | 12/15/2016 | | | | | 2,300 | | | 13 | |
HSBC Bank USA | | 6-month Australian Bank Bill | | Pay | | 6.000% | | 12/15/2011 | | | | | 3,100 | | | (5 | ) |
HSBC Bank USA | | 6-month Australian Bank Bill | | Receive | | 6.000% | | 12/15/2016 | | | | | 1,800 | | | 6 | |
UBS Warburg LLC | | 6-month Australian Bank Bill | | Pay | | 6.000% | | 06/15/2010 | | | | | 2,800 | | | (42 | ) |
UBS Warburg LLC | | 6-month Australian Bank Bill | | Receive | | 6.000% | | 06/15/2015 | | | | | 1,600 | | | 37 | |
Bank of America | | 3-month Canadian Bank Bill | | Receive | | 5.500% | | 12/16/2014 | | | CAD | | 500 | | | 6 | |
Merrill Lynch & Co., Inc. | | 3-month Canadian Bank Bill | | Receive | | 5.500% | | 12/16/2014 | | | | | 700 | | | 14 | |
Royal Bank of Canada | | 3-month Canadian Bank Bill | | Receive | | 5.000% | | 06/15/2015 | | | | | 1,500 | | | 16 | |
Barclays Bank PLC | | 6-month EUR-LIBOR | | Receive | | 4.000% | | 06/17/2010 | | | EUR | | 10 | | | 0 | |
Barclays Bank PLC | | 6-month EUR-LIBOR | | Receive | | 4.000% | | 12/15/2014 | | | | | 300 | | | 29 | |
BNP Paribas Bank | | 6-month EUR-LIBOR | | Pay | | 6.000% | | 06/18/2034 | | | | | 300 | | | 3 | |
Citibank N.A. | | 6-month EUR-LIBOR | | Receive | | 4.000% | | 12/15/2014 | | | | | 460 | | | 30 | |
Citibank N.A. | | 6-month EUR-LIBOR | | Pay | | 6.000% | | 06/18/2034 | | | | | 200 | | | (20 | ) |
Deutsche Bank AG | | 6-month EUR-LIBOR | | Receive | | 4.000% | | 12/15/2011 | | | | | 700 | | | 1 | |
Deutsche Bank AG | | 6-month EUR-LIBOR | | Pay | | 6.000% | | 06/18/2034 | | | | �� | 100 | | | (2 | ) |
J.P. Morgan Chase & Co. | | 6-month EUR-LIBOR | | Receive | | 5.000% | | 06/17/2012 | | | | | 900 | | | 48 | |
J.P. Morgan Chase & Co. | | 6-month EUR-LIBOR | | Receive | | 4.000% | | 12/15/2014 | | | | | 2,800 | | | 215 | |
Lehman Brothers, Inc. | | 6-month EUR-LIBOR | | Receive | | 4.000% | | 12/15/2014 | | | | | 1,600 | | | 111 | |
Merrill Lynch & Co., Inc. | | 6-month EUR-LIBOR | | Pay | | 6.000% | | 06/18/2034 | | | | | 300 | | | (2 | ) |
Morgan Stanley Dean Witter & Co. | | 6-month EUR-LIBOR | | Receive | | 4.000% | | 12/15/2011 | | | | | 5,300 | | | 40 | |
Morgan Stanley Dean Witter & Co. | | 6-month EUR-LIBOR | | Receive | | 4.000% | | 12/15/2014 | | | | | 2,300 | | | 148 | |
Morgan Stanley Dean Witter & Co. | | 6-month EUR-LIBOR | | Receive | | 4.500% | | 06/17/2015 | | | | | 500 | | | 54 | |
Morgan Stanley Dean Witter & Co. | | 6-month EUR-LIBOR | | Pay | | 6.000% | | 06/18/2034 | | | | | 3,100 | | | (8 | ) |
UBS Warburg LLC | | 6-month EUR-LIBOR | | Pay | | 4.000% | | 06/17/2010 | | | | | 200 | | | (9 | ) |
UBS Warburg LLC | | 6-month EUR-LIBOR | | Pay | | 6.000% | | 06/18/2034 | | | | | 200 | | | (4 | ) |
Barclays Bank PLC | | 6-month GBP-LIBOR | | Pay | | 5.000% | | 09/15/2010 | | | GBP | | 3,400 | | | (82 | ) |
Barclays Bank PLC | | 6-month GBP-LIBOR | | Receive | | 5.000% | | 09/15/2015 | | | | | 1,400 | | | 10 | |
Deutsche Bank AG | | 6-month GBP-LIBOR | | Pay | | 5.000% | | 06/15/2009 | | | | | 2,800 | | | 4 | |
Deutsche Bank AG | | 6-month GBP-LIBOR | | Receive | | 5.000% | | 09/15/2015 | | | | | 200 | | | 7 | |
Deutsche Bank AG | | 6-month GBP-LIBOR | | Receive | | 4.000% | | 12/15/2035 | | | | | 500 | | | 0 | |
Deutsche Bank AG | | 6-month GBP-LIBOR | | Receive | | 4.250% | | 06/12/2036 | | | | | 200 | | | 16 | |
Goldman Sachs & Co. | | 6-month GBP-LIBOR | | Receive | | 4.250% | | 06/12/2036 | | | | | 1,300 | | | 31 | |
HSBC Bank USA | | 6-month GBP-LIBOR | | Pay | | 5.000% | | 09/15/2010 | | | | | 400 | | | (10 | ) |
Merrill Lynch & Co., Inc. | | 6-month GBP-LIBOR | | Pay | | 5.000% | | 09/15/2010 | | | | | 4,300 | | | (105 | ) |
Morgan Stanley Dean Witter & Co. | | 6-month GBP-LIBOR | | Pay | | 5.000% | | 09/15/2015 | | | | | 700 | | | (1 | ) |
Goldman Sachs & Co. | | 3-month HKD-HIBOR | | Receive | | 4.235% | | 12/17/2008 | | | HKD | | 5,800 | | | 13 | |
Barclays Bank PLC | | 6-month JPY-LIBOR | | Receive | | 2.000% | | 12/15/2015 | | | JPY | | 60,000 | | | 5 | |
Deutsche Bank AG | | 6-month JPY-LIBOR | | Pay | | 1.000% | | 03/18/2008 | | | | | 100,000 | | | 0 | |
Goldman Sachs & Co. | | 6-month JPY-LIBOR | | Receive | | 2.000% | | 12/15/2015 | | | | | 910,000 | | | 50 | |
Merrill Lynch & Co., Inc. | | 6-month JPY-LIBOR | | Receive | | 2.000% | | 12/15/2015 | | | | | 120,000 | | | 9 | |
Morgan Stanley Dean Witter & Co. | | 6-month JPY-LIBOR | | Receive | | 2.000% | | 12/15/2015 | | | | | 510,000 | | | 35 | |
UBS Warburg LLC | | 6-month JPY-LIBOR | | Receive | | 0.800% | | 03/20/2012 | | | | | 50,000 | | | 4 | |
UBS Warburg LLC | | 6-month JPY-LIBOR | | Receive | | 2.000% | | 06/15/2012 | | | | | 45,000 | | | 11 | |
UBS Warburg LLC | | 6-month JPY-LIBOR | | Receive | | 2.000% | | 12/20/2013 | | | | | 420,000 | | | 60 | |
Bank of America | | 3-month USD-LIBOR | | Pay | | 5.000% | | 12/20/2036 | | $ | | | 1,000 | | | (9 | ) |
Barclays Bank PLC | | 3-month USD-LIBOR | | Receive | | 5.000% | | 12/20/2016 | | | | | 4,500 | | | 55 | |
Goldman Sachs & Co. | | 3-month USD-LIBOR | | Pay | | 5.500% | | 12/16/2014 | | | | | 700 | | | (16 | ) |
Goldman Sachs & Co. | | 3-month USD-LIBOR | | Receive | | 5.000% | | 12/20/2016 | | | | | 2,600 | | | 32 | |
J.P. Morgan Chase & Co. | | 3-month USD-LIBOR | | Pay | | 5.000% | | 12/20/2011 | | | | | 800 | | | (2 | ) |
J.P. Morgan Chase & Co. | | 3-month USD-LIBOR | | Receive | | 5.000% | | 12/20/2016 | | | | | 1,400 | | | 17 | |
Lehman Brothers, Inc. | | 3-month USD-LIBOR | | Pay | | 5.000% | | 12/20/2011 | | | | | 1,700 | | | (15 | ) |
Lehman Brothers, Inc. | | 3-month USD-LIBOR | | Receive | | 5.000% | | 12/20/2013 | | | | | 4,300 | | | 50 | |
Lehman Brothers, Inc. | | 3-month USD-LIBOR | | Receive | | 5.000% | | 12/20/2016 | | | | | 1,100 | | | 14 | |
Lehman Brothers, Inc. | | 3-month USD-LIBOR | | Pay | | 5.000% | | 12/20/2036 | | | | | 1,000 | | | (9 | ) |
Morgan Stanley Dean Witter & Co. | | 3-month USD-LIBOR | | Receive | | 5.000% | | 12/20/2016 | | | | | 4,600 | | | 57 | |
Royal Bank of Scotland PLC | | 3-month USD-LIBOR | | Pay | | 5.000% | | 12/20/2011 | | | | | 18,000 | | | (161 | ) |
| | | | | | | | | | | | | | | |
|
|
|
| | | | | | | | | | | | | | | | $ | 734 | |
| | | | | | | | | | | | | | | |
|
|
|
| | | | |
| 26 | | PIMCO Variable Insurance Trust | | See Accompanying Notes |
| | |
| |
| | | June 30, 2006 (Unaudited) |
| | | | | | | | | | | | | | |
| Credit Default Swaps | | | | | | | | | | | | | | |
| Counterparty | | Reference Entity | | Buy/Sell
Protection+ | | (Pay)/Receive
Fixed Rate | | Expiration
Date | | Notional
Amount | | Unrealized
Appreciation |
Merrill Lynch & Co., Inc. | | Russia Government International Bond, 5.000% until 03/31/2007 and 7.500% thereafter, due 03/31/2030 | | Sell | | 0.410% | | 06/20/2007 | | $ | 400 | | $ | 0 |
| | | | | | | | | | | | | |
|
|
|
| + If the Portfolio is a seller of protection and a credit event occurs, as defined under the terms of that particular swap agreement, the Portfolio will pay to the buyer of the protection an amount up to the notional value of the swap and in certain instances, take delivery of the security. As a buyer of protection, the Portfolio will generally the seller of protection an amount up to the notional amount of the swap if a credit event occurs. |
| | | | | | | | | | | | | | | | | |
(g) Written options outstanding on June 30, 2006: |
| Options on Exchange-Traded Futures Contracts | | | | | | | | | | | | | |
| Description | | | | | | Exercise
Price | | Expiration
Date | | # of
Contracts | | Premium | | Value |
Call - CBOT U.S. Treasury 10-Year Note September Futures | | $ | 106.000 | | 08/25/2006 | | 39 | | $ | 22 | | $ | 9 |
Put - CBOT U.S. Treasury 10-Year Note September Futures | | | 103.000 | | 08/25/2006 | | 39 | | | 13 | | | 5 |
| | | | | | | | | | | | | |
|
| |
|
|
| | | | | | | | | | | | | | $ | 35 | | $ | 14 |
| | | | | | | | | | | | | |
|
| |
|
|
| | | | | | | | | | | | | | | | | | | |
| | | | | | | | |
| Interest Rate Swaptions | | | | | | | | | | | | | | | | | | | |
| Description | | Counterparty | | Floating Rate
Index | | Pay/Receive
Floating Rate | | Exercise
Rate | | Expiration
Date | | Notional
Amount | | Premium | | Value |
Call - OTC 5-Year Interest Rate Swap | | Goldman Sachs & Co. | | 3-month USD-LIBOR | | Receive | | 4.780% | | 08/07/2006 | | $ | 2,000 | | $ | 16 | | $ | 0 |
Call - OTC 5-Year Interest Rate Swap | | Goldman Sachs & Co. | | 3-month USD-LIBOR | | Receive | | 5.210% | | 10/25/2006 | | | 2,000 | | | 9 | | | 2 |
Call - OTC 5-Year Interest Rate Swap | | J.P. Morgan Chase & Co. | | 3-month USD-LIBOR | | Receive | | 4.560% | | 10/18/2006 | | | 2,000 | | | 20 | | | 0 |
Call - OTC 5-Year Interest Rate Swap | | Royal Bank of Scotland PLC | | 3-month USD-LIBOR | | Receive | | 5.220% | | 04/19/2007 | | | 2,000 | | | 16 | | | 9 |
Call - OTC 5-Year Interest Rate Swap | | Royal Bank of Scotland PLC | | 3-month USD-LIBOR | | Receive | | 5.280% | | 05/08/2007 | | | 10,200 | | | 91 | | | 55 |
Call - OTC 5-Year Interest Rate Swap | | Royal Bank of Scotland PLC | | 3-month USD-LIBOR | | Receive | | 5.315% | | 05/09/2007 | | | 38,300 | | | 355 | | | 226 |
Call - OTC 5-Year Interest Rate Swap | | Royal Bank of Scotland PLC | | 3-month USD-LIBOR | | Receive | | 5.315% | | 05/09/2007 | | | 4,600 | | | 43 | | | 27 |
Call - OTC 5-Year Interest Rate Swap | | Royal Bank of Scotland PLC | | 3-month USD-LIBOR | | Receive | | 5.600% | | 06/29/2007 | | | 4,700 | | | 52 | | | 56 |
| | | | | | | | | | | | |
|
| |
|
|
| | | | | | | | | | | | | | | | $ | 602 | | $ | 375 |
| | | | | | | | | | | | | | | |
|
| |
|
|
| | | | | | | | | | | | | | | | |
| | | | | | |
| Straddle Options | | | | | | | | | | | | | | | | |
| Description | | Counterparty | | Exercise
Price* | | Expiration
Date | | Notional
Amount | | Premium* | | Value | |
Call & Put - OTC U.S. dollar versus Japanese Yen Forward Delta Neutral Straddle | | Goldman Sachs & Co. | | $0.000 | | 08/23/2007 | | $ | 5,000 | | $ | 11 | | $ | (31 | ) |
| | | | | | | | | | | |
|
| |
|
|
|
|
| * Exercise price and final premium determined on a future date, based upon implied volatility parameters. | |
| | | | | | | | | | | | | |
(h) Short sales outstanding on June 30, 2006: | | | | | | | | | | | |
| Description | | Coupon | | Maturity
Date | | Principal
Amount | | Proceeds | | Valueà |
U.S. Treasury Note | | 4.875% | | 05/31/2011 | | $ | 200 | | $ | 199 | | $ | 199 |
U.S. Treasury Note | | 5.125% | | 05/15/2016 | | | 200 | | | 202 | | | 202 |
| | | | | | | | | |
|
| |
|
|
| | | | | | | | | | $ | 401 | | $ | 401 |
| | | | | | | | | |
|
| |
|
|
|
à Market value includes $3 of interest payable on short sales. |
| | | | | | |
| See Accompanying Notes | | Semiannual Report | | June 30, 2006 | | 27 |
Schedule of Investments Global Bond Portfolio (Unhedged) (Cont.)
| | | | | | | | | | | | | | | | | |
(i) Forward foreign currency contracts outstanding on June 30, 2006: | | | | | |
| Type | | | | Principal
Amount
Covered by
Contract | | Settlement
Month | | Unrealized
Appreciation | | Unrealized
(Depreciation) | | | Net Unrealized
Appreciation/
(Depreciation) | |
Buy | | AUD | | 422 | | 08/2006 | | $ | 5 | | $ | 0 | | | $ | 5 | |
Buy | | CAD | | 3,184 | | 07/2006 | | | 0 | | | (33 | ) | | | (33 | ) |
Buy | | CLP | | 10,300 | | 07/2006 | | | 0 | | | 0 | | | | 0 | |
Sell | | | | 10,300 | | 07/2006 | | | 0 | | | 0 | | | | 0 | |
Buy | | | | 6,033 | | 08/2006 | | | 0 | | | 0 | | | | 0 | |
Buy | | | | 10,300 | | 09/2006 | | | 0 | | | 0 | | | | 0 | |
Buy | | CNY | | 9,364 | | 05/2007 | | | 0 | | | (12 | ) | | | (12 | ) |
Buy | | DKK | | 6,472 | | 09/2006 | | | 0 | | | (3 | ) | | | (3 | ) |
Buy | | EUR | | 30,275 | | 07/2006 | | | 572 | | | 0 | | | | 572 | |
Sell | | | | 6,625 | | 07/2006 | | | 0 | | | (37 | ) | | | (37 | ) |
Buy | | GBP | | 135 | | 07/2006 | | | 2 | | | 0 | | | | 2 | |
Sell | | | | 5,157 | | 07/2006 | | | 0 | | | (37 | ) | | | (37 | ) |
Buy | | | | 100 | | 07/2006 | | | 3 | | | 0 | | | | 3 | |
Sell | | | | 100 | | 07/2006 | | | 0 | | | (2 | ) | | | (2 | ) |
Buy | | | | 61 | | 08/2006 | | | 2 | | | 0 | | | | 2 | |
Buy | | | | 100 | | 09/2006 | | | 2 | | | 0 | | | | 2 | |
Buy | | INR | | 648 | | 08/2006 | | | 0 | | | 0 | | | | 0 | |
Buy | | JPY | | 15,213 | | 07/2006 | | | 0 | | | 0 | | | | 0 | |
Buy | | | | 3,302,687 | | 08/2006 | | | 0 | | | (230 | ) | | | (230 | ) |
Buy | | KRW | | 13,000 | | 07/2006 | | | 0 | | | 0 | | | | 0 | |
Sell | | | | 13,000 | | 07/2006 | | | 0 | | | 0 | | | | 0 | |
Buy | | | | 235,698 | | 08/2006 | | | 4 | | | 0 | | | | 4 | |
Buy | | | | 39,973 | | 09/2006 | | | 1 | | | 0 | | | | 1 | |
Buy | | MXN | | 457 | | 08/2006 | | | 0 | | | (3 | ) | | | (3 | ) |
Buy | | | | 68 | | 09/2006 | | | 0 | | | 0 | | | | 0 | |
Buy | | PEN | | 124 | | 08/2006 | | | 0 | | | 0 | | | | 0 | |
Sell | | | | 124 | | 08/2006 | | | 0 | | | 0 | | | | 0 | |
Buy | | PLN | | 34 | | 08/2006 | | | 0 | | | (1 | ) | | | (1 | ) |
Buy | | | | 15 | | 09/2006 | | | 0 | | | 0 | | | | 0 | |
Buy | | | | 75 | | 11/2006 | | | 0 | | | 0 | | | | 0 | |
Buy | | RUB | | 172 | | 07/2006 | | | 0 | | | 0 | | | | 0 | |
Sell | | | | 172 | | 07/2006 | | | 0 | | | 0 | | | | 0 | |
Buy | | | | 946 | | 08/2006 | | | 2 | | | 0 | | | | 2 | |
Buy | | | | 172 | | 09/2006 | | | 0 | | | 0 | | | | 0 | |
Buy | | SEK | | 8,983 | | 09/2006 | | | 4 | | | 0 | | | | 4 | |
Buy | | SGD | | 11 | | 07/2006 | | | 0 | | | 0 | | | | 0 | |
Sell | | | | 11 | | 07/2006 | | | 0 | | | 0 | | | | 0 | |
Buy | | | | 428 | | 08/2006 | | | 1 | | | (3 | ) | | | (2 | ) |
Buy | | | | 11 | | 09/2006 | | | 0 | | | 0 | | | | 0 | |
Buy | | SKK | | 478 | | 08/2006 | | | 0 | | | 0 | | | | 0 | |
Buy | | | | 788 | | 09/2006 | | | 1 | | | 0 | | | | 1 | |
Buy | | TWD | | 9,257 | | 08/2006 | | | 0 | | | (7 | ) | | | (7 | ) |
Buy | | ZAR | | 97 | | 08/2006 | | | 0 | | | (2 | ) | | | (2 | ) |
| | | | | | | | |
|
|
|
| | | | | | | | | $ | 599 | | $ | (370 | ) | | $ | 229 | |
| | | | | | | | |
|
|
|
|
| (j) Exercise price and premium determined on a future date, based upon implied volatility parameters. | |
| | | | |
| 28 | | PIMCO Variable Insurance Trust | | See Accompanying Notes |
| | |
| |
| Schedule of Investments High Yield Portfolio | | June 30, 2006 (Unaudited) |
| | | | | | | | |
| | | | | PRINCIPAL | | | | |
| | | | | AMOUNT | | | | VALUE |
| | | | | (000S) | | | | (000S) |
| |
| BANK LOAN OBLIGATIONS 4.7% |
| Amadeus Global Travel Distribution S.A. | | |
7.856% due 04/08/2013 | | $ | | 700 | | $ | | 708 |
8.356% due 04/08/2014 | | | | 700 | | | | 711 |
|
| Cablevision Systems Corp. | | | | | | | | |
6.740% due 02/24/2013 | | | | 571 | | | | 569 |
6.861% due 02/24/2013 | | | | 5 | | | | 5 |
|
| Centennial Cellular Operating Co. LLC | | |
7.230% due 01/20/2011 | | | | 22 | | | | 22 |
7.318% due 01/20/2011 | | | | 91 | | | | 91 |
7.749% due 01/20/2011 | | | | 300 | | | | 301 |
|
| Centennial Communications | | | | | | | | |
4.000% due 02/09/2011 | | | | 38 | | | | 38 |
7.749% due 02/09/2011 | | | | 375 | | | | 377 |
|
| Charter Communications Operating LLC | | |
5.000% due 04/25/2013 | | | | 1,500 | | | | 1,505 |
|
| CSC Holdings, Inc. | | | | | | | | |
6.580% due 02/24/2013 | | | | 571 | | | | 569 |
6.988% due 02/24/2013 | | | | 852 | | | | 849 |
|
| El Paso Corp. | | | | | | | | |
7.750% due 11/22/2009 | | | | 970 | | | | 977 |
|
| Georgia-Pacific Corp. | | | | | | | | |
7.880% due 12/23/2013 | | | | 222 | | | | 224 |
7.920% due 12/23/2013 | | | | 444 | | | | 449 |
7.957% due 12/23/2013 | | | | 444 | | | | 449 |
8.029% due 12/23/2013 | | | | 444 | | | | 449 |
8.086% due 12/23/2013 | | | | 444 | | | | 449 |
|
| Headwaters, Inc. | | | | | | | | |
6.766% due 04/30/2011 | | | | 1,348 | | | | 1,353 |
|
| HealthSouth Corp. | | | | | | | | |
8.150% due 02/02/2013 | | | | 1,900 | | | | 1,902 |
|
| Ineos Group Holdings PLC | | | | | | | | |
2.275% due 10/07/2012 | | | | 1,200 | | | | 1,205 |
|
| Intelsat Ltd. | | | | | | | | |
5.000% due 04/24/2016 | | | | 1,000 | | | | 1,002 |
|
| Invensys PLC | | | | | | | | |
7.791% due 09/05/2009 | | | | 126 | | | | 127 |
9.431% due 12/30/2009 | | | | 900 | | | | 911 |
|
| JSG Packaging | | | | | | | | |
7.397% due 11/29/2013 | | | | 650 | | | | 649 |
7.897% due 11/29/2014 | | | | 650 | | | | 649 |
|
| Nortel Networks Inc. | | | | | | | | |
8.375% due 02/15/2007 | | | | 1,250 | | | | 1,249 |
|
| Reliant Resources, Inc. | | | | | | | | |
7.175% due 12/22/2010 | | | | 181 | | | | 181 |
|
| Roundy’s Supermarket, Inc. | | | | | | | | |
7.870% due 11/01/2011 | | | | 495 | | | | 499 |
8.170% due 11/01/2011 | | | | 500 | | | | 504 |
4.000% due 11/03/2011 | | | | 3 | | | | 3 |
|
| Service Corp. International | | | | | | | | |
5.000% due 04/02/2016 | | | | 2,000 | | | | 2,008 |
| | | | | | | | |
|
Total Bank Loan Obligations
(Cost $20,962) | | 20,984 |
| | | | | | | | |
|
| |
| CORPORATE BONDS & NOTES 82.9% |
| |
| BANKING & FINANCE 11.6% |
| AES Ironwood LLC | | | | | | | | |
8.857% due 11/30/2025 | | | | 2,493 | | | | 2,705 |
|
| AES Red Oak LLC | | | | | | | | |
8.540% due 11/30/2019 | | | | 1,229 | | | | 1,303 |
| | | | | | | | |
| BCP Crystal U.S. Holdings Corp. | | | | |
9.625% due 06/15/2014 | | $ | | 3,317 | | $ | | 3,616 |
|
| Bluewater Finance Ltd. | | | | | | | | |
10.250% due 02/15/2012 | | | | 2,200 | | | | 2,238 |
|
| Bombardier Capital, Inc. | | | | |
7.090% due 03/30/2007 (i) | | | | 1,000 | | | | 1,005 |
|
| Corsair Netherlands BV | | | | |
11.121% due 03/07/2016 | | | | 1,400 | | | | 1,408 |
|
| Deutsche Bank AG | | | | |
1.800% due 05/29/2009 | | | | 400 | | | | 409 |
|
| Eircom Funding | | | | |
8.250% due 08/15/2013 | | | | 800 | | | | 852 |
|
| Ferrellgas Escrow LLC | | | | |
6.750% due 05/01/2014 | | | | 2,100 | | | | 2,000 |
|
| Ford Motor Credit Co. | | | | |
7.875% due 06/15/2010 | | | | 500 | | | | 462 |
8.625% due 11/01/2010 | | | | 260 | | | | 244 |
7.375% due 02/01/2011 | | | | 10,190 | | | | 9,133 |
|
| Forest City Enterprises, Inc. | | | | |
7.625% due 06/01/2015 | | | | 425 | | | | 430 |
|
| General Motors Acceptance Corp. | | | | |
7.250% due 03/02/2011 | | | | 2,000 | | | | 1,941 |
6.000% due 04/01/2011 | | | | 1,194 | | | | 1,087 |
7.000% due 02/01/2012 | | | | 500 | | | | 475 |
6.875% due 08/28/2012 | | | | 1,500 | | | | 1,415 |
8.000% due 11/01/2031 | | | | 1,975 | | | | 1,903 |
|
| IXIS Financial Products, Inc. | | | | |
0.800% due 06/15/2009 | | | | 350 | | | | 344 |
1.650% due 06/15/2009 | | | | 325 | | | | 325 |
1.875% due 06/15/2009 | | | | 350 | | | | 335 |
|
| K&F Acquisition, Inc. | | | | |
7.750% due 11/15/2014 | | | | 1,000 | | | | 990 |
|
| KRATON Polymers LLC | | | | |
8.125% due 01/15/2014 | | | | 1,700 | | | | 1,696 |
|
| Merrill Lynch & Co, Inc. | | | | |
2.300% due 06/22/2009 | | | | 325 | | | | 323 |
|
| Mirage Resorts, Inc. | | | | |
7.250% due 08/01/2017 | | | | 2,600 | | | | 2,502 |
|
| Rotech Healthcare, Inc. | | | | |
9.500% due 04/01/2012 | | | | 3,575 | | | | 2,994 |
|
| Tenneco, Inc. | | | | |
10.250% due 07/15/2013 | | | | 2,600 | | | | 2,863 |
8.625% due 11/15/2014 | | | | 975 | | | | 977 |
|
| TRAINS | | | | |
7.341% due 05/01/2016 | | | | 1,125 | | | | 1,104 |
|
| Universal City Development Partners | | | | |
11.750% due 04/01/2010 | | | | 800 | | | | 875 |
|
| Universal City Florida Holding Co. I | | | | |
8.375% due 05/01/2010 | | | | 1,425 | | | | 1,439 |
9.899% due 05/01/2010 | | | | 175 | | | | 182 |
|
| Ventas Realty LP | | | | |
9.000% due 05/01/2012 | | | | 500 | | | | 550 |
7.125% due 06/01/2015 | | | | 1,000 | | | | 1,005 |
|
| Wind Acquisition Finance S.A. | | | | |
10.750% due 12/01/2015 | | | | 1,000 | | | | 1,067 |
| | | | | | | | |
|
| | | | | | | | | 52,197 |
| | | | | | | | |
|
| |
| INDUSTRIALS 56.4% |
| Abitibi-Consolidated Co. of Canada | | | | |
8.375% due 04/01/2015 | | | | 1,475 | | | | 1,353 |
| | | | | | | | |
| Abitibi-Consolidated, Inc. | | | | | | | | |
8.550% due 08/01/2010 | | $ | | 1,850 | | $ | | 1,762 |
7.750% due 06/15/2011 | | | | 365 | | | | 337 |
7.400% due 04/01/2018 | | | | 400 | | | | 334 |
8.850% due 08/01/2030 | | | | 1,953 | | | | 1,660 |
|
| Alliance One International, Inc. | | | | |
11.000% due 05/15/2012 | | | | 650 | | | | 621 |
|
| Allied Waste North America, Inc. | | | | |
7.875% due 04/15/2013 | | | | 1,625 | | | | 1,633 |
7.250% due 03/15/2015 | | | | 4,600 | | | | 4,416 |
7.125% due 05/15/2016 | | | | 425 | | | | 403 |
|
| AmeriGas Partners LP | | | | | | | | |
7.250% due 05/20/2015 | | | | 1,850 | | | | 1,757 |
7.125% due 05/20/2016 | | | | 2,650 | | | | 2,498 |
|
| Arco Chemical Co. | | | | | | | | |
10.250% due 11/01/2010 | | | | 50 | | | | 55 |
|
| Armor Holdings, Inc. | | | | | | | | |
8.250% due 08/15/2013 | | | | 800 | | | | 832 |
|
| ArvinMeritor, Inc. | | | | | | | | |
8.750% due 03/01/2012 | | | | 3,225 | | | | 3,160 |
|
| Aviall, Inc. | | | | | | | | |
7.625% due 07/01/2011 | | | | 650 | | | | 681 |
|
| Bowater Canada Finance | | | | | | | | |
7.950% due 11/15/2011 | | | | 2,350 | | | | 2,244 |
|
| Bowater, Inc. | | | | | | | | |
6.500% due 06/15/2013 | | | | 300 | | | | 262 |
|
| Boyd Gaming Corp. | | | | | | | | |
7.125% due 02/01/2016 | | | | 4,000 | | | | 3,885 |
|
| Buhrmann US, Inc. | | | | | | | | |
8.250% due 07/01/2014 | | | | 1,000 | | | | 1,000 |
7.875% due 03/01/2015 | | | | 1,300 | | | | 1,290 |
|
| CanWest Media, Inc. | | | | | | | | |
8.000% due 09/15/2012 | | | | 1,520 | | | | 1,512 |
|
| Cascades, Inc. | | | | | | | | |
7.250% due 02/15/2013 | | | | 750 | | | | 697 |
|
| CCO Holdings LLC | | | | | | | | |
8.750% due 11/15/2013 | | | | 4,400 | | | | 4,312 |
|
| Celestica, Inc. | | | | | | | | |
7.625% due 07/01/2013 | | | | 950 | | | | 926 |
|
| Chart Industries, Inc. | | | | | | | | |
9.125% due 10/15/2015 | | | | 425 | | | | 436 |
|
| Charter Communications Operating LLC | | |
8.375% due 04/30/2014 | | | | 1,750 | | | | 1,761 |
|
| Chesapeake Energy Corp. | | | | | | | | |
7.625% due 07/15/2013 | | | | 800 | | | | 809 |
7.000% due 08/15/2014 | | | | 1,000 | | | | 972 |
6.375% due 06/15/2015 | | | | 1,695 | | | | 1,581 |
6.875% due 01/15/2016 | | | | 1,200 | | | | 1,140 |
|
| Choctaw Resort Development Enterprise | | |
7.250% due 11/15/2019 | | | | 1,400 | | | | 1,379 |
|
| Colorado Interstate Gas Co. | | | | | | | | |
6.850% due 06/15/2037 | | | | 200 | | | | 202 |
|
| Continental Airlines, Inc. | | | | | | | | |
6.920% due 04/02/2013 (i) | | | | 802 | | | | 808 |
7.373% due 12/15/2015 | | | | 273 | | | | 260 |
|
| Cooper-Standard Automotive, Inc. | | |
7.000% due 12/15/2012 | | | | 1,200 | | | | 1,080 |
|
| Corrections Corp. of America | | | | | | | | |
6.750% due 01/31/2014 | | | | 200 | | | | 193 |
| | | | | | |
| See Accompanying Notes | | Semiannual Report | | June 30, 2006 | | 29 |
| | |
| |
| Schedule of Investments High Yield Portfolio (Cont.) | | |
| | | | | | | | |
| | | | | PRINCIPAL | | | | |
| | | | | AMOUNT | | | | VALUE |
| | | | | (000S) | | | | (000S) |
| |
| Crown Americas LLC & Crown Americas Capital Corp. |
7.625% due 11/15/2013 | | $ | | 425 | | $ | | 420 |
7.750% due 11/15/2015 | | | | 1,400 | | | | 1,386 |
|
| CSC Holdings, Inc. | | | | | | | | |
8.125% due 08/15/2009 | | | | 1,500 | | | | 1,534 |
7.625% due 04/01/2011 | | | | 4,625 | | | | 4,648 |
|
| DaVita, Inc. | | | | | | | | |
7.250% due 03/15/2015 | | | | 2,850 | | | | 2,750 |
|
| Delhaize America, Inc. | | | | | | | | |
9.000% due 04/15/2031 | | | | 2,975 | | | | 3,277 |
|
| Delta Air Lines, Inc. | | | | | | | | |
7.379% due 05/18/2010 | | | | 211 | | | | 212 |
7.570% due 11/18/2010 | | | | 975 | | | | 979 |
|
| Dex Media West LLC | | | | | | | | |
9.875% due 08/15/2013 | | | | 2,200 | | | | 2,395 |
|
| DirecTV Holdings LLC | | | | | | | | |
8.375% due 03/15/2013 | | | | 1,184 | | | | 1,246 |
6.375% due 06/15/2015 | | | | 925 | | | | 858 |
|
| Dresser, Inc. | | | | | | | | |
9.375% due 04/15/2011 | | | | 3,350 | | | | 3,409 |
|
| Dresser-Rand Group, Inc. | | | | | | | | |
7.375% due 11/01/2014 | | | | 396 | | | | 380 |
|
| DRS Technologies, Inc. | | | | | | | | |
7.625% due 02/01/2018 | | | | 1,000 | | | | 1,000 |
|
| EchoStar DBS Corp. | | | | | | | | |
6.375% due 10/01/2011 | | | | 1,000 | | | | 960 |
6.625% due 10/01/2014 | | | | 2,975 | | | | 2,804 |
7.125% due 02/01/2016 | | | | 2,500 | | | | 2,419 |
|
| El Paso Corp. | | | | | | | | |
10.750% due 10/01/2010 | | | | 1,500 | | | | 1,642 |
9.625% due 05/15/2012 | | | | 200 | | | | 219 |
7.875% due 06/15/2012 | | | | 4,155 | | | | 4,248 |
8.050% due 10/15/2030 | | | | 1,300 | | | | 1,310 |
7.800% due 08/01/2031 | | | | 700 | | | | 683 |
7.750% due 01/15/2032 | | | | 1,200 | | | | 1,174 |
|
| El Paso Production Holding Co. | | |
7.750% due 06/01/2013 | | | | 2,250 | | | | 2,278 |
|
| Encore Acquisition Co. | | | | | | | | |
6.250% due 04/15/2014 | | | | 300 | | | | 277 |
7.250% due 12/01/2017 | | | | 1,075 | | | | 1,037 |
|
| Equistar Chemicals LP | | | | | | | | |
10.125% due 09/01/2008 | | | | 45 | | | | 48 |
8.750% due 02/15/2009 | | | | 2,035 | | | | 2,111 |
|
| Extendicare Health Services, Inc. | | |
9.500% due 07/01/2010 | | | | 800 | | | | 839 |
|
| Ferrellgas Partners LP | | | | | | | | |
8.870% due 08/01/2009 (i) | | | | 1,200 | | | | 1,242 |
8.750% due 06/15/2012 | | | | 1,525 | | | | 1,555 |
|
| Fisher Communications, Inc. | | | | | | | | |
8.625% due 09/15/2014 | | | | 1,000 | | | | 1,040 |
|
| Ford Motor Co. | | | | | | | | |
7.450% due 07/16/2031 | | | | 2,000 | | | | 1,455 |
|
| Fresenius Medical Care Capital Trust |
7.875% due 06/15/2011 | | | | 2,250 | | | | 2,284 |
|
| Gaylord Entertainment Co. | | | | | | | | |
8.000% due 11/15/2013 | | | | 1,000 | | | | 1,004 |
|
| General Motors Corp. | | | | | | | | |
8.250% due 07/15/2023 | | | | 2,200 | | | | 1,743 |
| | | | | | | | |
| | | | | | | | | |
| Georgia-Pacific Corp. | | | | | | | | |
8.000% due 01/15/2024 | | $ | | 775 | | $ | | 736 |
7.375% due 12/01/2025 | | | | 5,710 | | | | 5,196 |
|
| Greif, Inc. | | | | | | | | |
8.875% due 08/01/2012 | | | | 400 | | | | 423 |
|
| Grupo Transportacion Ferroviaria Mexicana S.A. de C.V. |
9.375% due 05/01/2012 | | | | 700 | | | | 749 |
|
| Hanover Compressor Co. | | | | | | | | |
9.000% due 06/01/2014 | | | | 500 | | | | 525 |
|
| HCA, Inc. | | | | | | | | |
6.950% due 05/01/2012 | | | | 1,550 | | | | 1,521 |
6.750% due 07/15/2013 | | | | 2,675 | | | | 2,568 |
7.190% due 11/15/2015 | | | | 200 | | | | 194 |
7.500% due 12/15/2023 | | | | 400 | | | | 373 |
|
| Herbst Gaming, Inc. | | | | | | | | |
7.000% due 11/15/2014 | | | | 1,000 | | | | 955 |
|
| Hertz Corp. | | | | | | | | |
8.875% due 01/01/2014 | | | | 1,925 | | | | 1,983 |
|
| Horizon Lines LLC | | | | | | | | |
9.000% due 11/01/2012 | | | | 2,016 | | | | 2,056 |
|
| Host Marriott LP | | | | | | | | |
7.000% due 08/15/2012 | | | | 100 | | | | 100 |
7.125% due 11/01/2013 | | | | 2,780 | | | | 2,783 |
|
| Ineos Group Holdings Plc | | | | | | | | |
8.500% due 02/15/2016 | | | | 1,325 | | | | 1,247 |
|
| Ingles Markets, Inc. | | | | | | | | |
8.875% due 12/01/2011 | | | | 1,450 | | | | 1,524 |
|
| Intelsat Bermuda Ltd. | | | | | | | | |
8.250% due 01/15/2013 | | | | 75 | | | | 75 |
9.250% due 06/15/2016 | | | | 1,275 | | | | 1,323 |
|
| Intelsat Subsidiary Holding Co. Ltd. | | |
9.614% due 01/15/2012 | | | | 1,000 | | | | 1,015 |
8.250% due 01/15/2013 | | | | 325 | | | | 324 |
8.625% due 01/15/2015 | | | | 2,700 | | | | 2,720 |
|
| Invensys PLC | | | | | | | | |
9.875% due 03/15/2011 | | | | 1,150 | | | | 1,253 |
|
| Jefferson Smurfit Corp. U.S. | | | | | | | | |
8.250% due 10/01/2012 | | | | 750 | | | | 707 |
7.500% due 06/01/2013 | | | | 775 | | | | 697 |
|
| JET Equipment Trust | | | | | | | | |
10.000% due 06/15/2012 (b) | | | | 653 | | | | 634 |
7.630% due 08/15/2012 (b) | | | | 352 | | | | 274 |
|
| JSG Funding PLC | | | | | | | | |
9.625% due 10/01/2012 | | | | 3,815 | | | | 3,949 |
|
| L-3 Communications Corp. | | | | | | | | |
7.625% due 06/15/2012 | | | | 500 | | | | 510 |
6.375% due 10/15/2015 | | | | 900 | | | | 864 |
|
| Legrand France | | | | | | | | |
8.500% due 02/15/2025 | | | | 475 | | | | 545 |
|
| Mandalay Resort Group | | | | | | | | |
9.375% due 02/15/2010 | | | | 2,300 | | | | 2,432 |
|
| Mediacom Broadband LLC | | | | | | | | |
11.000% due 07/15/2013 | | | | 2,940 | | | | 3,113 |
|
| MGM Mirage | | | | | | | | |
8.500% due 09/15/2010 | | | | 400 | | | | 417 |
8.375% due 02/01/2011 | | | | 825 | | | | 850 |
6.750% due 04/01/2013 | | | | 775 | | | | 743 |
6.625% due 07/15/2015 | | | | 2,100 | | | | 1,969 |
| | | | | | | | |
| Nalco Co. | | | | | | | | |
7.750% due 11/15/2011 | | $ | | 1,800 | | $ | | 1,805 |
8.875% due 11/15/2013 | | | | 700 | | | | 709 |
|
| New Skies Satellites NV | | | | | | | | |
9.125% due 11/01/2012 | | | | 825 | | | | 877 |
|
| Newfield Exploration Co. | | | | | | | | |
6.625% due 04/15/2016 | | | | 800 | | | | 758 |
|
| Newpark Resources | | | | | | | | |
8.625% due 12/15/2007 | | | | 1,390 | | | | 1,393 |
|
| Norampac, Inc. | | | | | | | | |
6.750% due 06/01/2013 | | | | 1,050 | | | | 950 |
|
| Nordic Telephone Co. Holdings ApS | | |
8.875% due 05/01/2016 | | | | 1,000 | | | | 1,033 |
|
| Nortel Networks Ltd. | | | | | | | | |
10.125% due 07/15/2013 | | | | 800 | | | | 818 |
10.750% due 07/15/2016 | | | | 475 | | | | 486 |
|
| Northwest Pipeline Corp. | | | | | | | | |
7.125% due 12/01/2025 | | | | 500 | | | | 483 |
|
| Novelis, Inc. |
7.250% due 02/15/2015 | | | | 1,200 | | | | 1,158 |
|
| Owens Brockway Glass Container, Inc. |
6.750% due 12/01/2014 | | | | 3,175 | | | | 2,961 |
|
| Peabody Energy Corp. | | | | | | | | |
6.875% due 03/15/2013 | | | | 2,041 | | | | 2,015 |
|
| Plains Exploration & Production Co. |
7.125% due 06/15/2014 | | | | 1,625 | | | | 1,609 |
|
| Pogo Producing Co. | | | | | | | | |
7.875% due 05/01/2013 | | | | 800 | | | | 806 |
|
| PQ Corp. | | | | | | | | |
7.500% due 02/15/2013 | | | | 2,225 | | | | 2,103 |
|
| Premier Entertainment Biloxi LLC |
10.750% due 02/01/2012 | | | | 750 | | | | 778 |
|
| Primedia, Inc. | | | | | | | | |
8.875% due 05/15/2011 | | | | 275 | | | | 265 |
8.000% due 05/15/2013 | | | | 400 | | | | 360 |
|
| Quiksilver, Inc. | | | | | | | | |
6.875% due 04/15/2015 | | | | 2,600 | | | | 2,431 |
|
| Qwest Communications International, Inc. |
7.250% due 02/15/2011 | | | | 5,125 | | | | 4,997 |
7.500% due 02/15/2014 | | | | 8,275 | | | | 8,110 |
|
| Reynolds American, Inc. | | | | | | | | |
7.250% due 06/01/2012 | | | | 925 | | | | 911 |
7.250% due 06/01/2013 | | | | 1,450 | | | | 1,425 |
7.625% due 06/01/2016 | | | | 925 | | | | 909 |
|
| RH Donnelley Corp. | | | | | | | | |
6.875% due 01/15/2013 | | | | 250 | | | | 231 |
8.875% due 01/15/2016 | | | | 1,350 | | | | 1,369 |
|
| Rhodia S.A. | | | | | | | | |
7.625% due 06/01/2010 | | | | 750 | | | | 746 |
|
| Rockwood Specialties Group, Inc. |
7.500% due 11/15/2014 | | | | 600 | | | | 591 |
|
| Rogers Cable, Inc. | | | | | | | | |
6.750% due 03/15/2015 | | | | 1,560 | | | | 1,494 |
8.750% due 05/01/2032 | | | | 800 | | | | 866 |
|
| Roseton | | | | | | | | |
7.270% due 11/08/2010 | | | | 2,275 | | | | 2,276 |
7.670% due 11/08/2016 | | | | 2,325 | | | | 2,321 |
|
| Russell Corp. | | | | | | | | |
9.250% due 05/01/2010 | | | | 550 | | | | 578 |
| | | | |
| 30 | | PIMCO Variable Insurance Trust | | See Accompanying Notes |
| | |
| |
| | | June 30, 2006 (Unaudited) |
| | | | | | | | |
| | | | | PRINCIPAL | | | | |
| | | | | AMOUNT | | | | VALUE |
| | | | | (000S) | | | | (000S) |
| |
| Sanmina-SCI Corp. | | | | | | | | |
8.125% due 03/01/2016 | | $ | | 1,175 | | $ | | 1,152 |
|
| SemGroup LP | | | | | | | | |
8.750% due 11/15/2015 | | | | 1,000 | | | | 1,000 |
|
| Seneca Gaming Corp. | | | | | | | | |
7.250% due 05/01/2012 | | | | 1,900 | | | | 1,850 |
|
| Sensata Technologies BV | | | | | | | | |
8.000% due 05/01/2014 | | | | 2,500 | | | | 2,425 |
|
| Smurfit Capital Funding PLC |
7.500% due 11/20/2025 | | | | 500 | | | | 458 |
|
| Smurfit-Stone Container Enterprises, Inc. |
9.750% due 02/01/2011 | | | | 430 | | | | 444 |
8.375% due 07/01/2012 | | | | 2,545 | | | | 2,418 |
|
| Solectron Global Finance Ltd. | | | | |
8.000% due 03/15/2016 | | | | 1,300 | | | | 1,287 |
|
| Sonat, Inc. | | | | | | | | |
7.000% due 02/01/2018 | | | | 500 | | | | 468 |
|
| Station Casinos, Inc. | | | | | | | | |
6.500% due 02/01/2014 | | | | 1,200 | | | | 1,122 |
6.875% due 03/01/2016 | | | | 2,500 | | | | 2,344 |
|
| Suburban Propane Partners LP |
6.875% due 12/15/2013 | | | | 2,750 | | | | 2,585 |
|
| Sungard Data Systems, Inc. | | | | | | | | |
9.125% due 08/15/2013 | | | | 3,050 | | | | 3,180 |
|
| Superior Essex Communications LLC |
9.000% due 04/15/2012 | | | | 500 | | | | 510 |
|
| Tenet Healthcare Corp. | | | | | | | | |
7.375% due 02/01/2013 | | | | 3,125 | | | | 2,867 |
|
| Triad Hospitals, Inc. | | | | | | | | |
7.000% due 11/15/2013 | | | | 2,275 | | | | 2,224 |
|
| Trinity Industries, Inc. | | | | | | | | |
6.500% due 03/15/2014 | | | | 780 | | | | 764 |
|
| TRW Automotive, Inc. | | | | | | | | |
9.375% due 02/15/2013 | | | | 2,025 | | | | 2,162 |
|
| United Airlines, Inc. | | | | | | | | |
6.201% due 09/01/2008 | | | | 177 | | | | 177 |
6.602% due 09/01/2013 | | | | 396 | | | | 398 |
|
| Unity Media GmbH | | | | | | | | |
10.375% due 02/15/2015 | | | | 750 | | | | 720 |
|
| US Airways Inc. | | | | | | | | |
9.330% due 01/01/2024 (b) | | | | 84 | | | | 1 |
9.625% due 09/01/2024 (b) | | | | 1,016 | | | | 4 |
|
| Valero Energy Corp. | | | | | | | | |
7.800% due 06/14/2010 | | | | 850 | | | | 855 |
|
| VWR International, Inc. | | | | | | | | |
6.875% due 04/15/2012 | | | | 460 | | | | 442 |
8.000% due 04/15/2014 | | | | 3,190 | | | | 3,114 |
|
| Williams Cos., Inc. | | | | | | | | |
7.625% due 07/15/2019 | | | | 3,950 | | | | 4,029 |
7.875% due 09/01/2021 | | | | 3,075 | | | | 3,137 |
7.750% due 06/15/2031 | | | | 650 | | | | 644 |
|
| Windstream Corp. | | | | | | | | |
8.625% due 08/01/2016 | | | | 1,050 | | | | 1,079 |
|
| Wynn Las Vegas LLC | | | | | | | | |
6.625% due 12/01/2014 | | | | 6,900 | | | | 6,538 |
|
| Xerox Corp. | | | | | | | | |
7.200% due 04/01/2016 | | | | 1,025 | | | | 1,033 |
| | | | | | | | |
|
| | | | | | | | | 254,517 |
| | | | | | | | |
|
| |
| | | | | | | | |
| | | | | | | | | |
UTILITIES 14.9% | | | | | | | | |
| AES Corp. | | | | | | | | |
8.750% due 05/15/2013 | | $ | | 2,825 | | $ | | 3,037 |
|
| American Cellular Corp. | | | | | | | | |
10.000% due 08/01/2011 | | | | 1,350 | | | | 1,428 |
|
| Cincinnati Bell, Inc. | | | | | | | | |
7.250% due 07/15/2013 | | | | 3,425 | | | | 3,391 |
8.375% due 01/15/2014 | | | | 1,970 | | | | 1,950 |
|
| Citizens Communications Co. | | | | | | | | |
7.000% due 11/01/2025 | | | | 75 | | | | 62 |
9.000% due 08/15/2031 | | | | 2,025 | | | | 2,060 |
7.450% due 07/01/2035 | | | | 250 | | | | 213 |
|
| CMS Energy Corp. | | | | | | | | |
7.500% due 01/15/2009 | | | | 375 | | | | 382 |
7.750% due 08/01/2010 | | | | 600 | | | | 612 |
8.500% due 04/15/2011 | | | | 1,000 | | | | 1,048 |
6.300% due 02/01/2012 | | | | 300 | | | | 285 |
|
| Edison Mission Energy | | | | | | | | |
7.500% due 06/15/2013 | | | | 750 | | | | 739 |
7.750% due 06/15/2016 | | | | 750 | | | | 741 |
|
| Hawaiian Telcom Communications, Inc. |
9.750% due 05/01/2013 | | | | 1,500 | | | | 1,534 |
10.789% due 05/01/2013 | | | | 500 | | | | 508 |
|
| Homer City Funding LLC | | | | | | | | |
8.734% due 10/01/2026 | | | | 983 | | | | 1,096 |
|
| IPALCO Enterprises, Inc. | | | | | | | | |
8.375% due 11/14/2008 | | | | 1,050 | | | | 1,084 |
8.625% due 11/14/2011 | | | | 490 | | | | 522 |
|
| Midwest Generation LLC | | | | | | | | |
8.560% due 01/02/2016 | | | | 4,784 | | | | 5,026 |
8.750% due 05/01/2034 | | | | 1,550 | | | | 1,651 |
|
| Mobile Telesystems Finance S.A. |
8.375% due 10/14/2010 | | | | 500 | | | | 502 |
8.000% due 01/28/2012 | | | | 450 | | | | 440 |
|
| MSW Energy Holdings II LLC | | | | | | | | |
7.375% due 09/01/2010 | | | | 650 | | | | 653 |
|
| MSW Energy Holdings LLC | | | | | | | | |
8.500% due 09/01/2010 | | | | 500 | | | | 518 |
|
| Northwestern Bell Telephone | | | | |
7.750% due 05/01/2030 | | | | 1,208 | | | | 1,154 |
|
| NRG Energy, Inc. | | | | | | | | |
7.250% due 02/01/2014 | | | | 2,775 | | | | 2,713 |
7.375% due 02/01/2016 | | | | 4,000 | | | | 3,910 |
|
| PSEG Energy Holdings LLC | | | | | | | | |
8.500% due 06/15/2011 | | | | 4,250 | | | | 4,484 |
|
| Qwest Capital Funding, Inc. | | | | | | | | |
7.900% due 08/15/2010 | | | | 1,650 | | | | 1,650 |
7.250% due 02/15/2011 | | | | 300 | | | | 293 |
|
| Qwest Corp. | | | | | | | | |
8.875% due 03/15/2012 | | | | 2,625 | | | | 2,783 |
7.500% due 06/15/2023 | | | | 1,000 | | | | 943 |
7.200% due 11/10/2026 | | | | 700 | | | | 642 |
|
| Reliant Energy, Inc. | | | | | | | | |
9.250% due 07/15/2010 | | | | 1,975 | | | | 1,985 |
6.750% due 12/15/2014 | | | | 3,075 | | | | 2,844 |
|
| Rogers Wireless, Inc. | | | | | | | | |
7.250% due 12/15/2012 | | | | 150 | | | | 152 |
8.000% due 12/15/2012 | | | | 520 | | | | 534 |
7.500% due 03/15/2015 | | | | 2,195 | | | | 2,228 |
|
| Rural Cellular Corp. | | | | | | | | |
9.875% due 02/01/2010 | | | | 1,275 | | | | 1,318 |
| | | | | | | | |
| Sierra Pacific Resources | | | | | | | | |
7.803% due 06/15/2012 | | $ | | 975 | | $ | | 993 |
8.625% due 03/15/2014 | | | | 500 | | | | 532 |
|
| South Point Energy Center LLC | | | | |
8.400% due 05/30/2012 | | | | 2,288 | | | | 2,231 |
|
| TECO Energy, Inc. | | | | | | | | |
6.750% due 05/01/2015 | | | | 1,000 | | | | 978 |
|
| Tenaska Alabama Partners LP | | | | |
7.000% due 06/30/2021 | | | | 2,266 | | | | 2,220 |
|
| Time Warner Telecom Holdings, Inc. |
9.250% due 02/15/2014 | | | | 2,875 | | | | 2,961 |
| | | | | | | | |
|
| | | | | | | | | 67,030 |
| | | | | | | | |
|
Total Corporate Bonds & Notes
(Cost $380,445) | | 373,744 |
| | | | | | | | |
|
| |
| CONVERTIBLE BONDS & NOTES 0.5% |
| | | | | | | | | |
| BANKING & FINANCE 0.2% |
| Lehman Brothers Holdings, Inc. |
1.383% due 06/15/2009 | | | | 350 | | | | 359 |
2.070% due 06/15/2009 | | | | 350 | | | | 347 |
3.119% due 06/15/2009 | | | | 350 | | | | 345 |
| | | | | | | | |
|
| | | | | | | | | 1,051 |
| | | | | | | | |
|
| |
| UTILITIES 0.3% | | | | | | | | |
| CMS Energy Corp. |
2.875% due 12/01/2024 | | | | 1,075 | | | | 1,152 |
| | | | | | | | |
|
Total Convertible Bonds & Notes
(Cost $2,271) | | 2,203 |
| | | | | | | | |
|
| |
| SOVEREIGN ISSUES 0.3% |
| Brazilian Government International Bond |
8.875% due 10/14/2019 | | | | 50 | | | | 56 |
8.750% due 02/04/2025 | | | | 50 | | | | 55 |
8.250% due 01/20/2034 | | | | 1,100 | | | | 1,157 |
| | | | | | | | |
|
Total Sovereign Issues (Cost $1,159) | | 1,268 |
| | | | | | | | |
|
| |
| FOREIGN CURRENCY-DENOMINATED ISSUES (j) 3.7% |
| Cognis Holding GmbH |
11.644% due 01/15/2015 (c) | | EUR | | 112 | | | | 138 |
|
| Development Bank of Japan |
2.875% due 12/20/2006 | | JPY | | 150,000 | | | | 1,327 |
|
| France Government International Bond |
4.500% due 07/12/2006 | | EUR | | 1,500 | | | | 1,919 |
|
| JSG Funding PLC |
10.125% due 10/01/2012 | | | | 650 | | | | 910 |
|
| JSG Holding PLC |
11.500% due 10/01/2015 (c) | | | | 1,252 | | | | 1,652 |
|
| Lighthouse International Co. S.A. |
8.000% due 04/30/2014 | | | | 2,220 | | | | 3,006 |
|
| Nordic Telephone |
5.207% due 11/30/2014 | | | | 550 | | | | 711 |
5.707% due 11/30/2015 | | | | 550 | | | | 714 |
|
| Nordic Telephone Co. Holdings ApS |
8.250% due 05/01/2016 | | | | 1,000 | | | | 1,314 |
|
| Rhodia S.A. |
8.000% due 06/01/2010 | | | | 1,000 | | | | 1,334 |
|
| SigmaKalon |
4.742% due 06/30/2012 | | | | 1,000 | | | | 1,279 |
| | | | | | |
| See Accompanying Notes | | Semiannual Report | | June 30, 2006 | | 31 |
| | |
| |
| Schedule of Investments High Yield Portfolio (Cont.) | | |
| | | | | | | | |
| | | | | PRINCIPAL | | | | |
| | | | | AMOUNT | | | | VALUE |
| | | | | (000S) | | | | (000S) |
| |
| UPC Broadband Holding BV |
5.000% due 03/31/2013 | | EC | | 500 | | $ | | 639 |
5.000% due 12/31/2013 | | | | 500 | | | | 639 |
|
| UPC Holding BV |
7.750% due 01/15/2014 | | | | 200 | | | | 241 |
8.625% due 01/15/2014 | | | | 800 | | | | 1,008 |
| | | | | | | | |
|
Total Foreign Currency-Denominated Issues (Cost $15,796) | | 16,831 |
| | | | | | | | |
|
| | | | |
| | | | | SHARES | | | | |
| CONVERTIBLE PREFERRED STOCK 0.1% |
| Chesapeake Energy Corp. | | | | | | |
4.500% due 12/31/2049 | | | | 5,000 | | | | 468 |
| | | | | | | | |
|
Total Convertible Preferred Stock
(Cost $499) | | 468 |
| | | | | | | | |
|
| |
| PREFERRED SECURITIES 1.2% |
| Fresenius Medical Care Capital Trust II |
7.875% due 02/01/2008 | | | | 2,050 | | | | 2,086 |
|
| Xerox Capital Trust I |
8.000% due 02/01/2027 | | | | 3,100,000 | | | | 3,127 |
| | | | | | | | |
|
Total Preferred Stock (Cost $5,370) | | 5,213 |
| | | | | | | | |
|
| | | | |
| | | | | PRINCIPAL
AMOUNT
(000S) | | | | |
| SHORT-TERM INSTRUMENTS (j) 7.4% |
| |
| COMMERCIAL PAPER 3.6% |
| Societe Generale N.A. |
5.250% due 07/05/2006 | | $ | | 300 | | | | 300 |
5.245% due 08/08/2006 | | | | 2,700 | | | | 2,686 |
|
| UBS Finance Delaware LLC |
5.225% due 08/08/2006 | | | | 6,000 | | | | 5,969 |
5.250% due 08/08/2006 | | | | 7,400 | | | | 7,361 |
| | | | | | | | |
|
| | | | | | | | | 16,316 |
| | | | | | | | |
|
| |
| | | | | | | | |
| | | | | | | | | |
| | | | | | | | | |
| | | | | | | | | |
| |
| REPURCHASE AGREEMENT 0.8% |
| State Street Bank |
4.900% due 07/03/2006 | | $ | | 3,644 | | $ | | 3,644 |
| | | | | | | | |
|
(Dated 06/30/2006. Collateralized by Federal Home Loan Bank 4.875% due 07/02/2005 valued at $3,720. Repurchase proceeds are $3,645.) |
| |
| BELGIUM TREASURY BILLS 2.7% |
2.808% due 09/14/2006 | | EUR | | 9,500 | | | | 12,083 |
| | | | | | | | |
|
| |
| SPAIN TREASURY BILLS 0.0% |
3.004% due 12/22/2006 | | | | 200 | | | | 252 |
| | | | | | | | |
|
| |
| U.S. TREASURY BILLS 0.3% |
4.725% due 08/31/2006 - 09/14/2006 (d)(e)(f) | | $ | | 1,280 | | | | 1,269 |
| | | | | | | | |
|
| |
Total Short-Term Instruments
(Cost $33,416) | | 33,564 |
| | | | | | | | |
|
| |
Total Investments (a) 100.8%
(Cost $459,918) | | $454,275 |
| |
Written Options (h) (0.0%)
(Premiums $283) | | (73) |
| |
| Other Assets and Liabilities (Net) (0.8%) | | (3,497) |
| | | | | | | | |
|
| Net Assets 100.0% | | $450,705 |
| | | | | | | | |
|
| | |
| Notes to Schedule of Investments (amounts in thousands, except number of contracts): |
| |
(a) As of June 30, 2006, portfolio securities with an aggregate market value of $8,370 were valued in good faith and pursuant to guidelines established by the Board of Trustees. |
| |
(b) Security is in default. |
| |
(c) Payment in-kind bond security. |
| |
(d) Securities are grouped by coupon or range of coupons and represent a range of maturities. |
| |
(e) Securities with an aggregate market value of $248 have been pledged as collateral for swap and swaption contracts on June 30, 2006. |
| |
(f) Securities with an aggregate market value of $1,021 have been segregated with the custodian to cover margin requirements for the following open futures contracts on June 30, 2006: |
| | | | | | | | | | |
| Description | | Type | | Expiration
Month | | # of
Contracts | | Unrealized
(Depreciation) | |
90-Day Eurodollar December Futures | | Long | | 12/2006 | | 844 | | $ | (1,651 | ) |
| | | | | | | | |
|
|
|
| | | | |
| 32 | | PIMCO Variable Insurance Trust | | See Accompanying Notes |
| | |
| |
| | | June 30, 2006 (Unaudited) |
| | | | | | | | | | | | | | | |
(g) Swap agreements outstanding on June 30, 2006: | |
| Credit Default Swaps | |
| Counterparty | | Reference Entity | | Buy/Sell
Protection+ | | (Pay)/Receive
Fixed Rate | | Expiration
Date | | Notional
Amount | | Unrealized
Appreciation/
(Depreciation) | |
Bank of America | | Ford Motor Credit Co. 7.000% due 10/01/2013 | | Sell | | 4.750% | | 12/20/2006 | | $ | 1,500 | | $ | 24 | |
Bank of America | | Dow Jones CDX N.A. HY6 Index | | Sell | | 3.450% | | 06/20/2011 | | | 900 | | | 18 | |
Citibank N.A. | | CMS Energy Corp. 8.500% due 04/05/2011 | | Sell | | 1.900% | | 06/20/2011 | | | 500 | | | 6 | |
Citibank N.A. | | CMS Energy Corp. 6.875% due 12/15/2015 | | Sell | | 1.720% | | 06/20/2011 | | | 1,000 | | | 5 | |
Credit Suisse First Boston | | CMS Energy Corp. 7.500% due 01/15/2009 | | Sell | | 1.800% | | 12/20/2010 | | | 625 | | | 6 | |
Credit Suisse First Boston | | Abitibi-Consolidated, Inc.
8.550% due 08/01/2010 | | Sell | | 5.350% | | 09/20/2011 | | | 1,000 | | | 27 | |
Deutsche Bank AG | | Russia Government International Bond, 5.000% until 03/31/2007 and 7.500% thereafter,
due 03/31/2030 | | Sell | | 0.440% | | 06/20/2007 | | | 2,500 | | | 1 | |
Goldman Sachs & Co. | | ArvinMeritor, Inc. 8.750% due 03/01/2012 | | Sell | | 2.400% | | 03/20/2007 | | | 700 | | | 9 | |
Goldman Sachs & Co. | | Host Marriott LP 7.125% due 11/01/2013 | | Sell | | 1.770% | | 12/20/2010 | | | 500 | | | 12 | |
J.P. Morgan Chase & Co. | | Lear Corp. 8.110% due 05/15/2009 | | Sell | | 7.750% | | 03/20/2007 | | | 1,400 | | | 59 | |
J.P. Morgan Chase & Co. | | Abitibi-Consolidated, Inc.
8.375% due 04/01/2015 | | Sell | | 1.500% | | 06/20/2007 | | | 500 | | | 0 | |
Lehman Brothers, Inc. | | Primedia, Inc. 8.875% due 05/15/2011 | | Sell | | 2.500% | | 03/20/2007 | | | 1,000 | | | (1 | ) |
Merrill Lynch & Co., Inc. | | AES Corp. 8.750% due 06/15/2008 | | Sell | | 0.950% | | 06/20/2007 | | | 1,300 | | | 3 | |
Merrill Lynch & Co., Inc. | | AES Corp. 8.750% due 06/15/2008 | | Sell | | 0.950% | | 06/20/2007 | | | 700 | | | 1 | |
Morgan Stanley Dean Witter & Co. | | Qwest Capital Funding, Inc.
7.250% due 02/15/2011 | | Sell | | 1.800% | | 06/20/2010 | | | 2,000 | | | (14 | ) |
Morgan Stanley Dean Witter & Co. | | Multiple reference entities of Gazprom | | Sell | | 1.050% | | 04/20/2011 | | | 3,000 | | | (29 | ) |
| | | | | | | | | | | | | |
|
|
|
| | | | | | | | | | | | | | $ | 127 | |
| | | | | | | | | | | | | |
|
|
|
|
| + If the Portfolio is a seller of protection and a credit event occurs, as defined under the terms of that particular swap agreement, the Portfolio will pay to the buyer of the protection an amount up to the notional value of the swap and in certain instances, take delivery of the security. As a buyer of protection, the Portfolio will generally receive from the seller of protection an amount up to the notional amount of the swap if a credit event occurs. | |
| | | | | | | | | | | | | | | |
(h) Written options outstanding on June 30, 2006: | | | | | | | | | | | | | |
| Options on Exchange-Traded Futures Contracts | | | | | | | | | | | | | |
| Description | | | | Exercise
Price | | Expiration
Date | | # of
Contracts | | Premium | | Value |
Call - CBOT U.S. Treasury 10-Year Note September Futures | | $ | 108.000 | | 08/25/2006 | | 319 | | $ | 113 | | $ | 10 |
Call - CBOT U.S. Treasury 10-Year Note September Futures | | | 107.000 | | 08/25/2006 | | 129 | | | 54 | | | 12 |
Put - CBOT U.S. Treasury 10-Year Note September Futures | | | 103.000 | | 08/25/2006 | | 319 | | | 94 | | | 45 |
Put - CBOT U.S. Treasury 10-Year Note September Futures | | | 102.000 | | 08/25/2006 | | 129 | | | 22 | | | 6 |
| | | | | | | | | | | |
|
|
| | | | | | | | | | | | $ | 283 | | $ | 73 |
| | | | | | | | | | | |
|
|
| | | | | | | | | | | | | | | | |
(i) Restricted securities as of June 30, 2006: | |
| Issuer Description | | Coupon | | Maturity
Date | | Acquisition
Date | | Cost | | Market
Value | | | Market Value
as Percentage
of Net Assets | |
Bombardier Capital, Inc. | | 7.090% | | 03/30/2007 | | 08/11/2003 | | $ 1,002 | | $ | 1,005 | | | | 0.22% | |
Continental Airlines, Inc. | | 6.920% | | 04/02/2013 | | 07/01/2003 | | 733 | | | 808 | | | | 0.18% | |
Ferrellgas Partners LP | | 8.870% | | 08/01/2009 | | 06/30/2003 | | 1,286 | | | 1,242 | | | | 0.28% | |
| | | | | | | | |
|
|
| | | | | | | | | $ 3,021 | | $ | 3,055 | | | | 0.68% | |
| | | | | | | | |
|
|
(j) Forward foreign currency contracts outstanding on June 30, 2006: | |
| Type | | | | Principal Amount Covered by Contract | | Settlement Month | | Unrealized Appreciation | | Unrealized (Depreciation) | | | Net Unrealized (Depreciation) | |
Sell | | EUR | | 11,581 | | 07/2006 | | $ 0 | | $ | (262 | ) | | $ | (262 | ) |
Buy | | JPY | | 545,951 | | 08/2006 | | 1 | | | (26 | ) | | | (25 | ) |
| | | | | | | | |
|
|
| | | | | | | | | $ 1 | | $ | (288 | ) | | $ | (287 | ) |
| | | | | | | | |
|
|
| | | | | | |
| See Accompanying Notes | | Semiannual Report | | June 30, 2006 | | 33 |
| | |
| |
| Schedule of Investments Low Duration Portfolio | | |
| | | | | | | | |
| | | | | PRINCIPAL | | | | |
| | | | | AMOUNT | | | | VALUE |
| | | | | (000S) | | | | (000S) |
| |
| CORPORATE BONDS & NOTES 14.3% |
| |
| BANKING & FINANCE 11.1% |
| American Express Credit Corp. |
5.170% due 06/12/2007 | | $ | | 1,000 | | $ | | 1,001 |
|
| American General Finance Corp. |
5.489% due 03/23/2007 | | | | 200 | | | | 200 |
|
| Bank of America Corp. |
5.406% due 06/19/2009 | | | | 6,100 | | | | 6,102 |
|
| Bear Stearns Cos., Inc. |
5.299% due 04/29/2008 | | | | 3,400 | | | | 3,409 |
5.589% due 03/30/2009 | | | | 2,300 | | | | 2,302 |
|
| CIT Group, Inc. |
5.404% due 05/23/2008 | | | | 4,600 | | | | 4,614 |
5.420% due 11/03/2010 | | | | 1,400 | | | | 1,406 |
|
| Citigroup, Inc. |
4.200% due 12/20/2007 | | | | 4,100 | | | | 4,021 |
5.520% due 12/26/2008 | | | | 200 | | | | 200 |
5.166% due 01/30/2009 | | | | 1,900 | | | | 1,901 |
|
| Ford Motor Credit Co. |
7.750% due 02/15/2007 | | | | 400 | | | | 401 |
6.374% due 03/21/2007 | | | | 2,000 | | | | 1,993 |
7.200% due 06/15/2007 | | | | 100 | | | | 99 |
|
| General Electric Capital Corp. |
5.222% due 01/08/2016 | | | | 300 | | | | 300 |
|
| Goldman Sachs Group, Inc. |
5.125% due 10/05/2007 | | | | 1,600 | | | | 1,603 |
5.226% due 07/29/2008 | | | | 1,200 | | | | 1,202 |
5.527% due 12/22/2008 | | | | 2,100 | | | | 2,103 |
5.420% due 07/23/2009 | | | | 1,300 | | | | 1,310 |
|
| HSBC Bank USA N.A. |
5.176% due 07/28/2008 | | | | 3,100 | | | | 3,104 |
|
| HSBC Finance Corp. |
5.459% due 09/15/2008 | | | | 500 | | | | 501 |
|
| Lehman Brothers Holdings, Inc. |
5.659% due 12/23/2010 | | | | 900 | | | | 902 |
|
| Merrill Lynch & Co., Inc. |
5.441% due 06/16/2008 | | | | 6,000 | | | | 6,009 |
|
| Morgan Stanley |
5.276% due 02/09/2009 | | | | 1,100 | | | | 1,102 |
5.318% due 01/18/2011 | | | | 1,500 | | | | 1,503 |
|
| Prudential Financial, Inc. |
4.104% due 11/15/2006 | | | | 400 | | | | 398 |
|
| Royal Bank of Scotland Group PLC |
5.424% due 12/21/2007 | | | | 1,200 | | | | 1,201 |
|
| Santander U.S. Debt S.A. Unipersonal |
5.434% due 09/21/2007 | | | | 2,000 | | | | 2,002 |
5.484% due 09/19/2008 | | | | 2,800 | | | | 2,803 |
|
| Unicredito Italiano |
5.231% due 12/03/2007 | | | | 5,400 | | | | 5,414 |
|
| Wachovia Bank N.A. |
5.270% due 05/25/2010 | | | | 6,000 | | | | 6,002 |
|
| Wells Fargo |
5.340% due 03/10/2008 | | | | 4,000 | | | | 4,003 |
| | | | | | | | |
|
| | | | | | | | | 69,111 |
| | | | | | | | |
|
| |
| INDUSTRIALS 1.7% | | | | | | | | |
| Altria Group, Inc. |
7.650% due 07/01/2008 | | | | 200 | | | | 207 |
|
| Clear Channel Communications, Inc. |
6.000% due 11/01/2006 | | | | 250 | | | | 250 |
| | | | | | | | |
| CSC Holdings, Inc. |
7.250% due 07/15/2008 | | $ | | 3,500 | | $ | | 3,522 |
|
| DaimlerChrysler N.A. Holding Corp. |
5.780% due 09/10/2007 | | | | 4,758 | | | | 4,774 |
|
| International Paper Co. |
7.625% due 01/15/2007 | | | | 250 | | | | 252 |
|
| Oracle Corp. & Ozark Holding, Inc. |
5.280% due 01/13/2009 | | | | 1,200 | | | | 1,202 |
| | | | | | | | |
|
| | | | | | | | | 10,207 |
| | | | | | | | |
|
| |
| UTILITIES 1.5% | | | | | | | | |
| AT&T, Inc. |
5.262% due 05/15/2008 | | | | 5,900 | | | | 5,903 |
|
| Entergy Mississippi, Inc. |
4.350% due 04/01/2008 | | | | 100 | | | | 97 |
|
| Qwest Capital Funding, Inc. |
6.375% due 07/15/2008 | | | | 1,870 | | | | 1,851 |
|
| Telefonica Emisones SAU |
5.714% due 06/19/2009 | | | | 1,700 | | | | 1,702 |
| | | | | | | | |
|
| | | | | | | | | 9,553 |
| | | | | | | | |
|
Total Corporate Bonds & Notes
(Cost $88,855) | | | | 88,871 |
| | | | | | | | |
|
| |
| U.S. GOVERNMENT AGENCIES 26.8% |
| Fannie Mae |
3.716% due 07/01/2034 | | | | 422 | | | | 416 |
4.350% due 03/01/2035 | | | | 414 | | | | 409 |
4.503% due 05/01/2035 | | | | 1,045 | | | | 1,025 |
4.526% due 05/01/2035 | | | | 1,045 | | | | 1,028 |
4.542% due 09/01/2035 | | | | 1,705 | | | | 1,681 |
4.599% due 11/01/2035 | | | | 1,904 | | | | 1,878 |
4.655% due 08/01/2035 | | | | 3,865 | | | | 3,773 |
4.683% due 07/01/2035 | | | | 673 | | | | 659 |
5.000% due 03/01/2018 - 04/25/2033 (b) | | | | 66,650 | | | | 64,227 |
5.211% due 07/01/2042 | | | | 738 | | | | 742 |
5.249% due 04/26/2035 | | | | 44 | | | | 44 |
5.261% due 09/01/2041 | | | | 919 | | | | 926 |
5.312% due 09/22/2006 | | | | 1,300 | | | | 1,300 |
5.372% due 09/25/2035 | | | | 581 | | | | 581 |
5.411% due 09/01/2040 | | | | 19 | | | | 20 |
5.442% due 03/25/2034 | | | | 255 | | | | 256 |
5.500% due 12/01/2009 - 07/13/2036 (b) | | | | 74,532 | | | | 73,025 |
5.672% due 09/25/2042 - 03/25/2044 (b) | | | | 2,056 | | | | 2,065 |
5.695% due 09/01/2034 | | | | 100 | | | | 99 |
5.722% due 05/25/2031 - 11/25/2032 (b) | | | | 1,752 | | | | 1,757 |
5.736% due 12/01/2036 | | | | 102 | | | | 102 |
5.977% due 11/01/2035 | | | | 657 | | | | 671 |
6.000% due 08/01/2016 - 03/01/2033 (b) | | | | 151 | | | | 150 |
6.500% due 01/01/2033 | | | | 29 | | | | 29 |
|
| Federal Housing Administration |
6.390% due 10/01/2020 | | | | 20 | | | | 21 |
|
| Freddie Mac |
4.715% due 06/01/2035 | | | | 2,733 | | | | 2,646 |
4.922% due 07/01/2035 | | | | 1,093 | | | | 1,066 |
5.000% due 10/01/2018 - 07/15/2024 (b) | | | | 2,257 | | | | 2,227 |
5.211% due 02/25/2045 | | | | 1,598 | | | | 1,587 |
5.500% due 08/15/2030 | | | | 13 | | | | 13 |
5.549% due 12/15/2030 | | | | 658 | | | | 659 |
5.582% due 08/25/2031 | | | | 640 | | | | 643 |
5.597% due 06/15/2018 | | | | 235 | | | | 235 |
6.000% due 09/01/2016 - 02/01/2033 (b) | | | | 134 | | | | 132 |
6.500% due 07/25/2043 | | | | 213 | | | | 215 |
| | | | | | | | |
| Government National Mortgage Association |
4.000% due 07/16/2027 | | $ | | 310 | | $ | | 305 |
| | | | | | | | |
|
Total U.S. Government Agencies
(Cost $169,232) | | | | 166,612 |
| | | | | | | | |
|
| |
| MORTGAGE-BACKED SECURITIES 8.2% |
| American Home Mortgage Investment Trust |
4.290% due 10/25/2034 | | | | 1,867 | | | | 1,816 |
4.390% due 02/25/2045 | | | | 766 | | | | 739 |
|
| Banc of America Funding Corp. |
4.116% due 05/25/2035 | | | | 8,620 | | | | 8,311 |
|
| Banc of America Mortgage Securities |
6.500% due 10/25/2031 | | | | 125 | | | | 126 |
5.403% due 10/20/2032 | | | | 5 | | | | 5 |
|
| Bear Stearns Adjustable Rate Mortgage Trust |
5.330% due 01/25/2033 | | | | 16 | | | | 16 |
5.450% due 03/25/2033 | | | | 56 | | | | 55 |
5.062% due 04/25/2033 | | | | 34 | | | | 34 |
4.819% due 01/25/2034 | | | | 163 | | | | 160 |
4.750% due 11/25/2035 | | | | 3,619 | | | | 3,553 |
|
| Bear Stearns Alt-A Trust |
5.406% due 05/25/2035 | | | | 1,202 | | | | 1,188 |
|
| Citigroup Mortgage Loan Trust, Inc. |
4.900% due 12/25/2035 | | | | 924 | | | | 918 |
|
| Countrywide Alternative Loan Trust |
6.500% due 06/25/2033 | | | | 27 | | | | 27 |
6.000% due 10/25/2033 | | | | 149 | | | | 144 |
4.500% due 06/25/2035 | | | | 3,638 | | | | 3,565 |
5.602% due 02/25/2036 | | | | 4,565 | | | | 4,575 |
|
| Countrywide Home Loan Mortgage Pass-Through Trust |
5.592% due 04/25/2034 | | | | 151 | | | | 151 |
5.250% due 11/20/2035 | | | | 1,441 | | | | 1,418 |
|
| CS First Boston Mortgage Securities Corp. |
4.938% due 05/15/2010 | | | | 752 | | | | 741 |
5.020% due 03/25/2032 | | | | 14 | | | | 14 |
6.056% due 06/25/2032 | | | | 1 | | | | 1 |
5.686% due 10/25/2032 | | | | 3 | | | | 3 |
5.872% due 08/25/2033 | | | | 13 | | | | 13 |
|
| GMAC Mortgage Corp. Loan Trust |
5.009% due 11/19/2035 | | | | 969 | | | | 957 |
GSR Mortgage Loan Trust | | | | | | | | |
6.000% due 03/25/2032 | | | | 4 | | | | 4 |
4.541% due 09/25/2035 | | | | 3,703 | | | | 3,605 |
|
| Impac CMB Trust |
5.722% due 07/25/2033 | | | | 77 | | | | 77 |
5.572% due 01/25/2034 | | | | 106 | | | | 106 |
|
| LB-UBS Commercial Mortgage Trust |
4.990% due 11/15/2030 | | | | 991 | | | | 977 |
|
| MASTR Adjustable Rate Mortgages Trust |
3.787% due 12/21/2034 | | | | 220 | | | | 220 |
|
| MASTR Asset Securitization Trust |
5.500% due 09/25/2033 | | | | 84 | | | | 80 |
|
| Mellon Residential Funding Corp. |
5.439% due 06/15/2030 | | | | 703 | | | | 706 |
|
| MLCC Mortgage Investors, Inc. |
6.628% due 01/25/2029 | | | | 192 | | | | 194 |
|
| Prime Mortgage Trust |
5.722% due 02/25/2034 | | | | 86 | | | | 86 |
5.722% due 02/25/2034 | | | | 27 | | | | 27 |
|
| Salomon Brothers Mortgage Securities VII |
4.000% due 12/25/2018 | | | | 369 | | | | 347 |
| | | | |
| 34 | | PIMCO Variable Insurance Trust | | See Accompanying Notes |
| | |
| |
| | | June 30, 2006 (Unaudited) |
| | | | | | | | |
| | | | | PRINCIPAL | | | | |
| | | | | AMOUNT | | | | VALUE |
| | | | | (000S) | | | | (000S) |
| |
| Sequoia Mortgage Trust |
5.607% due 05/20/2032 | | $ | | 21 | | $ | | 21 |
5.567% due 08/20/2032 | | | | 15 | | | | 15 |
|
| Structured Adjustable Rate Mortgage Loan Trust |
4.580% due 02/25/2034 | | | | 1,311 | | | | 1,285 |
5.355% due 08/25/2034 | | | | 1,635 | | | | 1,624 |
5.682% due 01/25/2035 | | | | 1,543 | | | | 1,558 |
|
| Structured Asset Mortgage Investments, Inc. |
5.582% due 09/19/2032 | | | | 31 | | | | 31 |
5.602% due 02/25/2035 | | | | 487 | | | | 486 |
|
| Structured Asset Securities Corp. |
6.150% due 07/25/2032 | | | | 1 | | | | 1 |
5.422% due 09/25/2035 | | | | 2,911 | | | | 2,913 |
|
| Washington Mutual, Inc. |
4.816% due 10/25/2032 | | | | 293 | | | | 290 |
5.009% due 02/27/2034 | | | | 85 | | | | 84 |
5.202% due 05/25/2041 | | | | 460 | | | | 462 |
5.543% due 06/25/2042 | | | | 395 | | | | 395 |
5.410% due 08/25/2042 | | | | 160 | | | | 160 |
5.612% due 10/25/2045 | | | | 4,156 | | | | 4,183 |
5.592% due 12/26/2045 | | | | 815 | | | | 818 |
|
| Wells Fargo Mortgage-Backed Securities Trust |
3.540% due 09/25/2034 | | | | 273 | | | | 272 |
4.950% due 03/25/2036 | | | | 1,635 | | | | 1,613 |
| | | | | | | | |
|
Total Mortgage-Backed Securities
(Cost $51,746) | | | | 51,170 |
| | | | | | | | |
|
| |
| ASSET-BACKED SECURITIES 6.5% |
| AAA Trust | | | | | | | | |
5.422% due 04/25/2035 | | | | 125 | | | | 125 |
|
| ACE Securities Corp. |
5.432% due 10/25/2035 | | | | 2,626 | | | | 2,628 |
|
| Amortizing Residential Collateral Trust |
5.612% due 07/25/2032 | | | | 13 | | | | 13 |
|
| Argent Securities, Inc. |
5.442% due 10/25/2035 | | | | 476 | | | | 477 |
5.462% due 12/25/2035 | | | | 1,780 | | | | 1,781 |
|
| Asset-Backed Funding Certificates |
5.432% due 08/25/2035 | | | | 882 | | | | 883 |
|
| Asset-Backed Securities Corp. Home Equity |
6.299% due 03/15/2032 | | | | 549 | | | | 550 |
5.422% due 07/25/2035 | | | | 79 | | | | 80 |
|
| Bear Stearns Asset-Backed Securities, Inc. |
5.522% due 09/25/2034 | | | | 286 | | | | 286 |
5.522% due 06/15/2043 | | | | 310 | | | | 310 |
|
| Carrington Mortgage Loan Trust |
5.402% due 06/25/2035 | | | | 73 | | | | 73 |
|
| Centex Home Equity |
5.412% due 06/25/2035 | | | | 526 | | | | 526 |
|
| Chase Manhattan Auto Owner Trust |
4.770% due 03/15/2008 | | | | 2,200 | | | | 2,196 |
|
| CIT Group Home Equity Loan Trust |
5.592% due 06/25/2033 | | | | 8 | | | | 8 |
|
| Citigroup Mortgage Loan Trust, Inc. |
5.412% due 07/25/2035 | | | | 117 | | | | 117 |
5.422% due 07/25/2035 | | | | 217 | | | | 217 |
5.432% due 09/25/2035 | | | | 411 | | | | 411 |
|
| Conseco Finance Securitizations Corp. |
6.090% due 09/01/2033 | | | | 3,351 | | | | 3,353 |
| | | | | | | | |
| | | | | | | | | |
| Countrywide Asset-Backed Certificates |
5.802% due 12/25/2031 | | $ | | 120 | | $ | | 120 |
5.442% due 03/25/2035 | | | | 63 | | | | 63 |
5.402% due 06/25/2035 | | | | 87 | | | | 87 |
5.422% due 08/25/2035 | | | | 562 | | | | 562 |
5.402% due 10/25/2035 | | | | 315 | | | | 315 |
|
| CS First Boston Mortgage Securities Corp. |
5.632% due 01/25/2032 | | | | 19 | | | | 20 |
|
| Equity One ABS, Inc. |
5.602% due 11/25/2032 | | | | 17 | | | | 17 |
|
| FBR Securitization Trust |
5.462% due 09/25/2035 | | | | 719 | | | | 719 |
5.442% due 11/25/2035 | | | | 3,416 | | | | 3,419 |
|
| First Franklin Mortgage Loan Asset-Backed Certificates |
5.432% due 03/25/2025 | | | | 270 | | | | 270 |
|
| First NLC Trust |
5.432% due 09/25/2035 | | | | 255 | | | | 255 |
5.432% due 12/25/2035 | | | | 412 | | | | 413 |
|
| Fremont Home Loan Trust |
5.412% due 01/25/2036 | | | | 690 | | | | 690 |
|
| GSAMP Trust |
5.512% due 10/25/2033 | | | | 71 | | | | 71 |
5.612% due 03/25/2034 | | | | 393 | | | | 394 |
GSR Mortgage Loan Trust | | | | | | | | |
5.422% due 12/25/2030 | | | | 740 | | | | 741 |
|
| HFC Home Equity Loan Asset-Backed Certificates |
5.617% due 09/20/2033 | | | | 297 | | | | 298 |
|
| Indymac Residential Asset-Backed Trust |
5.422% due 03/25/2036 | | | | 760 | | | | 761 |
|
| Long Beach Mortgage Loan Trust |
5.522% due 11/25/2034 | | | | 1,203 | | | | 1,204 |
5.442% due 09/25/2035 | | | | 690 | | | | 690 |
5.412% due 01/25/2036 | | | | 931 | | | | 931 |
5.402% due 02/25/2036 | | | | 943 | | | | 944 |
|
| New Century Home Equity Loan Trust |
5.432% due 09/25/2035 | | | | 802 | | | | 803 |
|
| Option One Mortgage Loan Trust |
5.422% due 08/25/2035 | | | | 53 | | | | 53 |
5.422% due 11/25/2035 | | | | 1,634 | | | | 1,635 |
|
| Park Place Securities, Inc. |
5.432% due 08/25/2035 | | | | 481 | | | | 482 |
|
| Quest Trust |
5.402% due 12/25/2035 | | | | 341 | | | | 341 |
|
| Renaissance Home Equity Loan Trust |
5.472% due 10/25/2035 | | | | 750 | | | | 751 |
|
| Residential Asset Mortgage Products, Inc. |
5.432% due 10/25/2025 | | | | 1,237 | | | | 1,238 |
5.662% due 09/25/2033 | | | | 8 | | | | 8 |
5.572% due 02/25/2034 | | | | 127 | | | | 127 |
5.422% due 03/25/2035 | | | | 886 | | | | 887 |
|
| SLM Student Loan Trust |
5.120% due 07/25/2013 | | | | 650 | | | | 651 |
5.110% due 01/26/2015 | | | | 904 | | | | 903 |
|
| Soundview Home Equity Loan Trust |
5.432% due 05/25/2035 | | | | 127 | | | | 127 |
5.422% due 07/25/2035 | | | | 15 | | | | 15 |
5.432% due 11/25/2035 | | | | 1,335 | | | | 1,336 |
5.422% due 12/25/2035 | | | | 431 | | | | 431 |
|
| Structured Asset Securities Corp. |
5.422% due 08/25/2035 | | | | 391 | | | | 391 |
5.452% due 12/25/2035 | | | | 1,459 | | | | 1,460 |
| | | | | | | | |
| Truman Capital Mortgage Loan Trust |
5.662% due 01/25/2034 | | $ | | 206 | | $ | | 207 |
|
| Wachovia Auto Owner Trust |
4.820% due 02/20/2009 | | | | 1,300 | | | | 1,296 |
| | | | | | | | |
|
Total Asset-Backed Securities
(Cost $40,143) | | | | 40,160 |
| | | | | | | | |
|
| |
| | | | | NOTIONAL
AMOUNT
(000S) | | | | |
| |
| PURCHASED CALL OPTIONS 0.1% |
| 2-Year Interest Rate Swap (OTC) Pay 3-Month USD-LIBOR Floating Rate Index |
Strike @ 4.500% Exp. 10/04/2006 | | | | 12,500 | | | | 0 |
Strike @ 4.750% Exp. 08/07/2006 | | | | 19,000 | | | | 0 |
Strike @ 4.750% Exp. 08/08/2006 | | | | 6,000 | | | | 0 |
Strike @ 4.800% Exp. 12/22/2006 | | | | 14,000 | | | | 2 |
Strike @ 5.000% Exp. 03/08/2007 | | | | 16,000 | | | | 14 |
Strike @ 5.000% Exp. 03/08/2007 | | | | 7,000 | | | | 6 |
Strike @ 5.080% Exp. 04/19/2007 | | | | 13,800 | | | | 20 |
Strike @ 5.130% Exp. 10/25/2006 | | | | 24,300 | | | | 7 |
Strike @ 5.130% Exp. 10/25/2006 | | | | 5,000 | | | | 2 |
Strike @ 5.170% Exp. 02/01/2007 | | | | 15,200 | | | | 18 |
Strike @ 5.200% Exp. 05/09/2007 | | | | 33,600 | | | | 73 |
Strike @ 5.250% Exp. 06/07/2007 | | | | 30,000 | | | | 82 |
| | | | | | | | |
|
Total Purchased Call Options
(Cost $743) | | | | 224 |
| | | | | | | | |
|
| |
| | | | | #OF
CONTRACTS | | | | |
| |
| PURCHASED PUT OPTIONS 0.0% |
| 90-Day Eurodollar December Futures (CME) |
Strike @ $92.250 Exp. 12/18/2006 | | | | 96 | | | | 1 |
Strike @ $92.500 Exp. 12/18/2006 | | | | 120 | | | | 1 |
|
| 90-Day Eurodollar June Futures (CME) |
Strike @ $91.000 Exp. 06/18/2007 | | | | 337 | | | | 2 |
Strike @ $91.250 Exp. 06/18/2007 | | | | 423 | | | | 3 |
|
| 90-Day Eurodollar March Futures (CME) |
Strike @ $92.000 Exp. 03/19/2007 | | | | 469 | | | | 3 |
|
| 90-Day Eurodollar September Futures (CME) |
Strike @ $92.750 Exp. 09/18/2006 | | | | 556 | | | | 3 |
| | | | | | | | |
|
Total Purchased Put Options
(Cost $19) | | | | 13 |
| | | | | | | | |
|
| |
| | | | | NOTIONAL
AMOUNT
(000S) | | | | |
| |
| PURCHASED STRADDLE OPTIONS 0.0% |
| Call & Put – OTC U.S. dollar versus Japanese Yen Forward Delta Neutral Straddle |
Strike @ $0.000 (g) Exp. 08/23/2007 | | $ | | 7,000 | | | | 4 |
| | | | | | | | |
|
Total Purchased Straddle Options (Cost $0) | | 4 |
| | | | | | | | |
|
| | | | | | |
| See Accompanying Notes | | Semiannual Report | | June 30, 2006 | | 35 |
| | |
| |
| Schedule of Investments Low Duration Portfolio (Cont.) | | |
| | | | | | | | |
| | | | | | | | | |
| | | | | | | | | VALUE |
| | | | | SHARES | | | | (000S) |
| |
| PREFERRED STOCK 0.1% |
| DG Funding Trust | | | | | | | | |
7.210% due 12/31/2049 | | | | 60 | | $ | | 633 |
| | | | | | | | |
|
Total Preferred Stock (Cost $632) | | | | 633 |
| | | | | | | | |
|
| |
| | | | | PRINCIPAL
AMOUNT
(000S) | | | | |
| SHORT-TERM INSTRUMENTS 59.9% |
| |
| BELGIUM TREASURY BILLS 4.7% |
2.757% due 10/12/2006 | | EUR | | 23,060 | | | | 29,262 |
| | | | | | | | |
|
| |
| |
| COMMERCIAL PAPER 37.1% |
| Barclays U.S. Fund | | | | | | | | |
5.055% due 08/16/2006 | | $ | | 12,200 | | | | 12,125 |
5.105% due 08/22/2006 | | | | 5,900 | | | | 5,858 |
|
| BNP Paribas Finance | | | | | | | | |
4.930% due 07/13/2006 | | | | 2,400 | | | | 2,397 |
5.079% due 08/22/2006 | | | | 15,600 | | | | 15,490 |
|
| Caisse d’Amortissement de la Dette Sociale |
5.270% due 08/03/2006 | | | | 17,000 | | | | 16,923 |
|
| Cox Communications, Inc. |
5.160% due 07/17/2006 | | | | 600 | | | | 600 |
|
| Danske Corp. | | | | | | | | |
5.280% due 07/17/2006 | | | | 5,400 | | | | 5,389 |
4.955% due 07/20/2006 | | | | 600 | | | | 599 |
4.980% due 07/26/2006 | | | | 4,100 | | | | 4,087 |
5.080% due 08/24/2006 | | | | 8,800 | | | | 8,735 |
|
| Dexia Delaware LLC | | | | | | | | |
5.275% due 07/05/2006 | | | | 3,300 | | | | 3,299 |
4.980% due 07/25/2006 | | | | 15,600 | | | | 15,553 |
|
| DnB NORBank ASA |
4.960% due 07/17/2006 | | | | 10,900 | | | | 10,879 |
|
| Fannie Mae |
4.809% due 07/05/2006 | | | | 17,200 | | | | 17,195 |
|
| Federal Home Loan Bank |
5.030% due 07/03/2006 | | | | 17,200 | | | | 17,200 |
| | | | | | | | |
| Fortis Funding |
5.265% due 07/26/2006 | | $ | | 3,100 | | $ | | 3,090 |
|
| General Electric Capital Corp. |
4.975% due 07/24/2006 | | | | 2,400 | | | | 2,393 |
|
| HBOS Treasury Services PLC |
4.985% due 07/26/2006 | | | | 14,900 | | | | 14,853 |
|
| Rabobank USA Financial Corp. |
5.250% due 07/03/2006 | | | | 17,200 | | | | 17,200 |
|
| Skandinaviska Enskilda Banken |
4.960% due 07/20/2006 | | | | 500 | | | | 499 |
|
| Societe Generale N.A. | | | | | | | | |
5.270% due 07/03/2006 | | | | 300 | | | | 300 |
5.245% due 08/08/2006 | | | | 16,500 | | | | 16,413 |
5.055% due 08/15/2006 | | | | 1,100 | | | | 1,093 |
4.985% due 08/22/2006 | | | | 1,000 | | | | 993 |
|
| Total Captial S.A. |
5.270% due 07/03/2006 | | | | 17,200 | | | | 17,200 |
|
| UBS Finance Delaware LLC |
5.270% due 07/03/2006 | | | | 400 | | | | 400 |
5.050% due 07/05/2006 | | | | 4,700 | | | | 4,699 |
4.790% due 07/07/2006 | | | | 3,900 | | | | 3,898 |
4.930% due 07/10/2006 | | | | 1,000 | | | | 999 |
5.095% due 09/22/2006 | | | | 9,000 | | | | 8,887 |
|
| Westpac Capital Corp. | | | | | | | | |
4.980% due 07/24/2006 | | | | 1,200 | | | | 1,196 |
| | | | | | | | |
|
| | | | | | | | | 230,442 |
| | | | | | | | |
|
| |
| FRANCE TREASURY BILLS 6.1% |
2.775% due 07/06/2006 -
11/23/2006 (b) | | EUR | | 29,900 | | | | 37,957 |
| | | | | | | | |
|
| |
| GERMANY TREASURY BILLS 8.5% |
2.590% due 07/12/2006 -
10/18/2006 (b) | | | | 41,410 | | | | 52,871 |
| | | | | | | | |
|
| | | | | | | | |
| REPURCHASE AGREEMENTS 2.5% |
| Credit Suisse First Boston | | | | |
4.580% due 07/03/2006 | | $ | | 4,600 | | $ | | 4,600 |
(Dated 06/30/2006. Collateralized by U.S. Treasury
Notes 4.000% due 06/15/2009 valued at $4,729. Repurchase proceeds are $4,602.) |
4.600% due 07/03/2006 | | | | 5,000 | | | | 5,000 |
(Dated 06/30/2006. Collateralized by U.S. Treasury Notes 3.250% due 08/15/2007 valued at $5,107. Repurchase proceeds are $5,002.) |
|
| State Street Bank | | | | | | | | |
4.900% due 07/03/2006 | | | | 5,892 | | | | 5,892 |
(Dated 06/30/2006. Collateralized by Freddie Mac 2.750% due 02/09/2007 valued at $6,011. Repurchase proceeds are $5,894.) |
| | | | | | | | |
|
| | | | | | | | | 15,492 |
| | | | | | | | |
|
| |
| SPAIN TREASURY BILLS 0.4% |
2.890% due 12/22/2006 | | EUR | | 2,500 | | | | 3,153 |
| | | | | | | | |
|
| |
| U.S. TREASURY BILLS 0.6% |
4.568% due 08/31/2006 -
09/14/2006 (b)(c) | | $ | | 3,495 | | | | 3,456 |
| | | | | | | | |
|
Total Short-Term Instruments
(Cost $368,571) | | | | 372,633 |
| | | | | | | | |
|
| |
Total Investments (a) 115.9%
(Cost $719,941) | | $ | | 720,320 |
| |
Written Options (e) (0.2%)
(Premiums $1,189) | | | | (1,344) |
| |
| Other Assets and Liabilities (Net) (15.7%) | | | | (97,525) |
| | | | | | | | |
|
| Net Assets 100.0% | | | | | | $ | | 621,451 |
| | | | | | | | |
|
| | |
Notes to Schedule of Investments (amounts in thousands, except number of contracts): |
| |
(a) As of June 30, 2006, portfolio securities with an aggregate market value of $1,606 were valued in good faith and pursuant to guidelines established by the Board of Trustees. |
| |
(b) Securities are grouped by coupon or range of coupons and represent a range of maturities. |
| |
(c) Securities with an aggregate market value of $3,456 have been segregated with the custodian to cover margin requirements for the following open futures contracts on June 30, 2006: |
| | | | | | | | | | |
| Description | | Type | | Expiration
Month | | # of
Contracts | | Unrealized
Appreciation/
(Depreciation) | |
90-Day Eurodollar December Futures | | Long | | 12/2006 | | 800 | | $ | (1,196 | ) |
90-Day Eurodollar December Futures | | Long | | 12/2007 | | 291 | | | (455 | ) |
90-Day Eurodollar June Futures | | Long | | 06/2007 | | 625 | | | (1,177 | ) |
90-Day Eurodollar March Futures | | Long | | 03/2007 | | 977 | | | (1,904 | ) |
90-Day Eurodollar March Futures | | Short | | 03/2008 | | 61 | | | 74 | |
90-Day Eurodollar September Futures | | Long | | 09/2007 | | 460 | | | (807 | ) |
U.S. Treasury 5-Year Note September Futures | | Short | | 09/2006 | | 349 | | | 191 | |
U.S. Treasury 10-Year Note September Futures | | Short | | 09/2006 | | 102 | | | 61 | |
U.S. Treasury 30-Year Bond September Futures | | Long | | 09/2006 | | 5 | | | (2 | ) |
| | | | | | | | |
|
|
|
| | | | | | | | | $ | (5,215 | ) |
| | | | | | | | |
|
|
|
| | | | |
| 36 | | PIMCO Variable Insurance Trust | | See Accompanying Notes |
| | |
| |
| | | June 30, 2006 (Unaudited) |
| | | | | | | | | | | | | | | | | |
(d) Swap agreements outstanding on June 30, 2006: | | | | |
| Interest Rate Swaps | | | | | | | | | | | | | | | | | |
| Counterparty | | Floating Rate Index | | Pay/Receive
Floating Rate | | Fixed Rate | | Expiration
Date | | | | Notional
Amount | | Unrealized
Appreciation/
(Depreciation) | |
BNP Paribas Bank | | 5-year French CPI Ex Tobacco Daily Reference Index | | Pay | | 2.090% | | 10/15/2010 | | | | EUR | 1,300 | | $ | (4 | ) |
Barclays Bank PLC | | 6-month GBP-LIBOR | | Pay | | 5.000% | | 06/15/2007 | | | | GBP | 400 | | | (3 | ) |
Lehman Brothers, Inc. | | 6-month GBP-LIBOR | | Pay | | 4.500% | | 09/20/2009 | | | | | 200 | | | (5 | ) |
Goldman Sachs & Co. | | 3-month USD-LIBOR | | Receive | | 5.000% | | 12/20/2011 | | | | $ | 2,900 | | | 25 | |
| | | | | | | | | | | | | | | |
|
|
|
| | | | | | | | | | | | | | | | $ | 13 | |
| | | | | | | | | | | | | | | |
|
|
|
| | | | | | | |
| Credit Default Swaps | | | | | | | | | | | | | | | | | |
| Counterparty | | Reference Entity | | Buy/Sell
Protection+ | | (Pay)/Receive
Fixed Rate | | Expiration
Date | | | | Notional
Amount | | Unrealized
Appreciation | |
Bear Stearns & Co., Inc. | | General Motors Acceptance Corp. 6.875% due 08/28/2012 | | Sell | | 2.100% | | 12/20/2006 | | | | $ | 2,600 | | $ | 6 | |
Bear Stearns & Co., Inc. | | Ford Motor Credit Co. 7.000% due 10/01/2013 | | Sell | | 4.650% | | 06/20/2007 | | | | | 400 | | | 8 | |
Bear Stearns & Co., Inc. | | Ford Motor Credit Co. 7.000% due 10/01/2013 | | Sell | | 4.700% | | 06/20/2007 | | | | | 300 | | | 6 | |
Citibank N.A. | | Ford Motor Credit Co. 7.000% due 10/01/2013 | | Sell | | 2.445% | | 12/20/2006 | | | | | 100 | | | 0 | |
Goldman Sachs & Co. | | Ford Motor Credit Co. 7.000% due 10/01/2013 | | Sell | | 2.400% | | 12/20/2006 | | | | | 200 | | | 1 | |
Goldman Sachs & Co. | | Ford Motor Credit Co. 7.000% due 10/01/2013 | | Sell | | 4.500% | | 06/20/2007 | | | | | 200 | | | 4 | |
J.P. Morgan Chase & Co. | | Russia Government International Bond,
5.000% until 03/31/2007 and 7.500%
thereafter, due 03/31/2030 | | Sell | | 0.690% | | 03/20/2007 | | | | | 1,200 | | | 5 | |
Morgan Stanley Dean Witter & Co. | | Ford Motor Credit Co. 7.000% due 10/01/2013 | | Sell | | 4.700% | | 12/20/2006 | | | | | 1,000 | | | 15 | |
Morgan Stanley Dean Witter & Co. | | Russia Government International Bond,
5.000% until 03/31/2007 and 7.500%
thereafter, due 03/31/2030 | | Sell | | 0.460% | | 06/20/2007 | | | | | 200 | | | 0 | |
| | | | | | | | | | | | | | | |
|
|
|
| | | | | | | | | | | | | | | | $ | 45 | |
| | | | | | | | | | | | | | | |
|
|
|
|
| + If the Portfolio is a seller of protection and a credit event occurs, as defined under the terms of that particular swap agreement, the Portfolio will pay to the buyer of the protection an amount up to the notional value of the swap and in certain instances, take delivery of the security. As a buyer of protection, the Portfolio will generally receive from the seller of protection an amount up to the notional amount of the swap if a credit event occurs. | |
| | | | | | | | | | | | |
(e) Written options outstanding on June 30, 2006: |
| Options on Exchange-Traded Futures Contracts | | | | | | | | |
| Description | | Exercise
Price | | Expiration
Date | | # of
Contracts | | Premium | | Value |
Call - CBOT U.S. Treasury 10-Year Note September Futures | | $108.000 | | 08/25/2006 | | 40 | | $ | 7 | | $ | 1 |
Put - CBOT U.S. Treasury 10-Year Note September Futures | | 103.000 | | 08/25/2006 | | 40 | | | 4 | | | 6 |
Put - CME 90-Day Eurodollar December Futures | | 95.000 | | 12/18/2006 | | 13 | | | 6 | | | 20 |
Put - CME 90-Day Eurodollar December Futures | | 95.250 | | 12/18/2006 | | 422 | | | 331 | | | 894 |
Put - CME 90-Day Eurodollar December Futures | | 95.500 | | 12/18/2006 | | 45 | | | 49 | | | 123 |
Put - CME 90-Day Eurodollar March Futures | | 94.750 | | 03/19/2007 | | 19 | | | 10 | | | 20 |
Put - CME 90-Day Eurodollar September Futures | | 95.000 | | 09/18/2006 | | 14 | | | 8 | | | 20 |
| | | | | | | | |
|
| |
|
|
| | | | | | | | | $ | 415 | | $ | 1,084 |
| | | | | | | | |
|
| |
|
|
| | | | | | | | | | | | | | | | | | | | |
| | | | | | | |
| Interest Rate Swaptions | | | | | | | | | | | | | | | | |
| Description | | Counterparty | | Floating Rate
Index | | Pay/Receive
Floating Rate | | Exercise
Rate | | Expiration
Date | | | | Notional
Amount | | Premium | | Value |
Put - OTC 1-Year Interest Rate Swap | | HSBC Bank USA | | 6-month GBP-LIBOR | | Pay | | 4.500% | | 12/20/2006 | | GBP | | 1,700 | | $ | 8 | | $ | 19 |
Call - OTC 5-Year Interest Rate Swap | | Bear Stearns & Co., Inc. | | 3-month USD-LIBOR | | Receive | | 5.210% | | 10/25/2006 | | $ | | 6,100 | | | 22 | | | 7 |
Call - OTC 5-Year Interest Rate Swap | | Bear Stearns & Co., Inc. | | 3-month USD-LIBOR | | Receive | | 5.040% | | 03/08/2007 | | | | 7,000 | | | 68 | | | 14 |
Call - OTC 5-Year Interest Rate Swap | | Citibank N.A. | | 3-month USD-LIBOR | | Receive | | 4.540% | | 10/04/2006 | | | | 2,100 | | | 25 | | | 0 |
Call - OTC 5-Year Interest Rate Swap | | Citibank N.A. | | 3-month USD-LIBOR | | Receive | | 4.850% | | 12/22/2006 | | | | 6,000 | | | 79 | | | 2 |
Call - OTC 5-Year Interest Rate Swap | | Goldman Sachs & Co. | | 3-month USD-LIBOR | | Receive | | 4.780% | | 08/07/2006 | | | | 8,000 | | | 65 | | | 0 |
Call - OTC 5-Year Interest Rate Swap | | Goldman Sachs & Co. | | 3-month USD-LIBOR | | Receive | | 5.210% | | 10/25/2006 | | | | 4,500 | | | 20 | | | 5 |
Call - OTC 5-Year Interest Rate Swap | | Merrill Lynch & Co., Inc. | | 3-month USD-LIBOR | | Receive | | 4.780% | | 08/08/2006 | | | | 3,000 | | | 28 | | | 0 |
Call - OTC 5-Year Interest Rate Swap | | Merrill Lynch & Co., Inc. | | 3-month USD-LIBOR | | Receive | | 4.540% | | 10/04/2006 | | | | 3,000 | | | 36 | | | 0 |
Call - OTC 5-Year Interest Rate Swap | | Royal Bank of Scotland PLC | | 3-month USD-LIBOR | | Receive | | 5.040% | | 03/08/2007 | | | | 3,000 | | | 33 | | | 6 |
Call - OTC 5-Year Interest Rate Swap | | Royal Bank of Scotland PLC | | 3-month USD-LIBOR | | Receive | | 5.220% | | 04/19/2007 | | | | 6,000 | | | 47 | | | 26 |
Call - OTC 5-Year Interest Rate Swap | | Royal Bank of Scotland PLC | | 3-month USD-LIBOR | | Receive | | 5.315% | | 05/09/2007 | | | | 14,700 | | | 152 | | | 87 |
Call - OTC 5-Year Interest Rate Swap | | Royal Bank of Scotland PLC | | 3-month USD-LIBOR | | Receive | | 5.340% | | 06/07/2007 | | | | 13,000 | | | 132 | | | 89 |
Call - OTC 5-Year Interest Rate Swap | | Wachovia Bank N.A. | | 3-month USD-LIBOR | | Receive | | 5.210% | | 10/25/2006 | | | | 2,200 | | | 9 | | | 2 |
Call - OTC 5-Year Interest Rate Swap | | Wachovia Bank N.A. | | 3-month USD-LIBOR | | Receive | | 5.240% | | 02/01/2007 | | | | 6,600 | | | 41 | | | 25 |
| | | | | | | | | | | | | | | | |
|
| |
|
|
| | | | | | | | | | | | | | | | | $ | 765 | | $ | 282 |
| | | | | | | | | | | | | | | | |
|
| |
|
|
| | | | | | |
| See Accompanying Notes | | Semiannual Report | | June 30, 2006 | | 37 |
| | |
| |
| Schedule of Investments Low Duration Portfolio (Cont.) | | |
| | | | | | | | | | | | | | | | | | | | | | | |
| Straddle Options | | | | | | | | | | | | | | | | | | | | | | | |
| Description | | Counterparty | | | | Exercise Price* | | Expiration Date | | | | Notional
Amount | | Premium* | | Value | |
Call & Put - OTC U.S. dollar versus Japanese Yen
Forward Delta Neutral Straddle | | Goldman Sachs & Co. | | | | $ | 0.000 | | 08/23/2007 | | | | $ | 3,100 | | $ | 3 | | $ | (17 | ) |
Call & Put - OTC U.S. dollar versus Japanese Yen
Forward Delta Neutral Straddle | | J.P. Morgan Chase & Co. | | | | | 0.000 | | 08/23/2007 | | | | | 1,000 | | | 6 | | | (5 | ) |
| | | | | | | | | | | | | | | | | | |
|
| |
|
|
|
| | | | | | | | | | | | | | | | | | | $ | 9 | | $ | (22 | ) |
| | | | | | | | | | | | | | | | | | |
|
| |
|
|
|
| | | | |
| * Exercise price and final premium determined on a future final date, based upon implied volatility parameters. | | | | | | | | | | | | |
| | | | | | | | | | | | | | | | | |
(f) Forward foreign currency contracts outstanding on June 30, 2006: | | | | | |
| Type | | | | Principal
Amount
Covered by
Contract | | Settlement
Month | | Unrealized
Appreciation | | Unrealized
(Depreciation) | | | Net Unrealized
Appreciation/
(Depreciation) | |
Buy | | BRL | | 852 | | 07/2006 | | $ | 25 | | $ | 0 | | | $ | 25 | |
Sell | | | | 853 | | 07/2006 | | | 0 | | | (20 | ) | | | (20 | ) |
Buy | | | | 422 | | 09/2006 | | | 11 | | | 0 | | | | 11 | |
Buy | | CAD | | 1,897 | | 07/2006 | | | 0 | | | (20 | ) | | | (20 | ) |
Buy | | CLP | | 174,323 | | 07/2006 | | | 0 | | | (7 | ) | | | (7 | ) |
Sell | | | | 174,323 | | 07/2006 | | | 4 | | | 0 | | | | 4 | |
Buy | | | | 86,000 | | 08/2006 | | | 0 | | | (2 | ) | | | (2 | ) |
Buy | | | | 44,534 | | 09/2006 | | | 0 | | | 0 | | | | 0 | |
Buy | | CNY | | 4,059 | | 03/2007 | | | 0 | | | (4 | ) | | | (4 | ) |
Buy | | EUR | | 167 | | 07/2006 | | | 4 | | | 0 | | | | 4 | |
Sell | | | | 51,095 | | 07/2006 | | | 71 | | | (623 | ) | | | (552 | ) |
Sell | | | | 14,390 | | 08/2006 | | | 0 | | | (330 | ) | | | (330 | ) |
Sell | | | | 26,000 | | 09/2006 | | | 0 | | | (471 | ) | | | (471 | ) |
Buy | | GBP | | 537 | | 07/2006 | | | 4 | | | 0 | | | | 4 | |
Buy | | INR | | 12,200 | | 08/2006 | | | 0 | | | (7 | ) | | | (7 | ) |
Sell | | | | 7,230 | | 08/2006 | | | 3 | | | 0 | | | | 3 | |
Buy | | | | 2,596 | | 09/2006 | | | 0 | | | (1 | ) | | | (1 | ) |
Buy | | JPY | | 2,039,610 | | 08/2006 | | | 0 | | | (571 | ) | | | (571 | ) |
Buy | | KRW | | 144,129 | | 08/2006 | | | 3 | | | 0 | | | | 3 | |
Buy | | | | 611,190 | | 09/2006 | | | 16 | | | 0 | | | | 16 | |
Sell | | | | 369,284 | | 09/2006 | | | 0 | | | (10 | ) | | | (10 | ) |
Buy | | | | 843,255 | | 05/2007 | | | 0 | | | (2 | ) | | | (2 | ) |
Buy | | MXN | | 3,960 | | 08/2006 | | | 0 | | | (24 | ) | | | (24 | ) |
Sell | | | | 2,377 | | 08/2006 | | | 6 | | | 0 | | | | 6 | |
Buy | | | | 1,125 | | 09/2006 | | | 0 | | | (6 | ) | | | (6 | ) |
Buy | | PEN | | 1,616 | | 08/2006 | | | 10 | | | 0 | | | | 10 | |
Sell | | | | 1,616 | | 08/2006 | | | 0 | | | (19 | ) | | | (19 | ) |
Buy | | | | 141 | | 09/2006 | | | 1 | | | 0 | | | | 1 | |
Sell | | | | 141 | | 09/2006 | | | 0 | | | (2 | ) | | | (2 | ) |
Buy | | PLN | | 162 | | 09/2006 | | | 1 | | | 0 | | | | 1 | |
Buy | | | | 349 | | 11/2006 | | | 0 | | | (3 | ) | | | (3 | ) |
Buy | | RUB | | 11,341 | | 08/2006 | | | 20 | | | 0 | | | | 20 | |
Sell | | | | 6,780 | | 08/2006 | | | 0 | | | (8 | ) | | | (8 | ) |
Buy | | | | 3,058 | | 09/2006 | | | 4 | | | 0 | | | | 4 | |
Buy | | SGD | | 1,140 | | 08/2006 | | | 13 | | | (2 | ) | | | 11 | |
Sell | | | | 676 | | 08/2006 | | | 0 | | | (8 | ) | | | (8 | ) |
Buy | | | | 172 | | 09/2006 | | | 2 | | | 0 | | | | 2 | |
Buy | | SKK | | 13,910 | | 09/2006 | | | 13 | | | 0 | | | | 13 | |
Sell | | | | 6,644 | | 09/2006 | | | 0 | | | (6 | ) | | | (6 | ) |
Buy | | TWD | | 10,582 | | 08/2006 | | | 0 | | | (8 | ) | | | (8 | ) |
Sell | | | | 7,383 | | 08/2006 | | | 0 | | | 0 | | | | 0 | |
Buy | | | | 3,337 | | 09/2006 | | | 0 | | | (1 | ) | | | (1 | ) |
Buy | | ZAR | | 106 | | 08/2006 | | | 0 | | | (2 | ) | | | (2 | ) |
Sell | | | | 106 | | 08/2006 | | | 1 | | | 0 | | | | 1 | |
Buy | | | | 106 | | 10/2006 | | | 0 | | | (1 | ) | | | (1 | ) |
Buy | | | | 202 | | 11/2006 | | | 0 | | | (4 | ) | | | (4 | ) |
| | | | | | | | |
|
| |
|
|
| |
|
|
|
| | | | | | | | | $ | 212 | | $ | (2,162 | ) | | $ | (1,950 | ) |
| | | | | | | | |
|
| |
|
|
| |
|
|
|
(g) Exercise price and premium determined on a future date, based upon implied volatility parameters. | |
| | | | |
| 38 | | PIMCO Variable Insurance Trust | | See Accompanying Notes |
Notes to Financial Statements
1. ORGANIZATION
Each of the Portfolios (hereinafter referred to individually as a “Portfolio” and collectively as the “Portfolios”) discussed in this report is a series of the PIMCO Variable Insurance Trust (the “Trust”). The Trust is registered under the Investment Company Act of 1940 (the “Act”), as amended, as an open-end investment management company organized as a Delaware business trust on October 3, 1997. The Portfolios may offer up to four classes of shares: Institutional, Administrative, Advisor and Class M. Information presented in these financial statements pertains to the different share classes of five of the Portfolios of the Trust. Certain detailed financial information for other share class (the “Other Classes”) is provided separately and is available upon request. The Trust is designed to be used as an investment vehicle by Separate Accounts of insurance companies that fund variable annuity contracts and variable life insurance policies and by qualified pension and retirement plans.
2. SIGNIFICANT ACCOUNTING POLICIES
The following is a summary of significant accounting policies consistently followed by the Trust in the preparation of its financial statements in conformity with accounting principles generally accepted in the United States of America (“GAAP”). The preparation of financial statements in accordance with GAAP requires management to make estimates and assumptions that affect the reported amounts and disclosures in the financial statements. Actual results could differ from those estimates.
Security Valuation. Investments in Funds within the PIMCO Funds are valued at their net assets value as reported by the Underlying Funds. Portfolio securities are valued as of the close of regular trading (normally 4:00 p.m., Eastern Time) on each day that the New York Stock Exchange (“NYSE”) is open. Portfolio securities and other assets for which market quotes are readily available are stated at market value. Market value is generally determined on the basis of last reported sales prices, or if no sales are reported, based on quotes obtained from a quotation reporting system, established market makers, or pricing services. Fixed-income securities and non-exchange traded derivatives are normally valued on the basis of quotes obtained from brokers and dealers or pricing services. Prices obtained from independent pricing services use information provided by market makers or estimates of market values obtained from yield data relating to investments or securities with similar characteristics. Certain fixed-income securities purchased on a delayed-delivery basis are marked to market daily until settlement at the forward settlement date. Short-term investments, which mature in 60 days or less, are generally valued at amortized cost, which approximates market value. Exchange traded options, futures and options on futures are valued at the settlement price determined by the relevant exchange.
Investments initially valued in currencies other than the U.S. dollar are converted to the U.S. dollar using exchange rates obtained from pricing services. As a result, the NAV of a Portfolio’s shares may be affected by changes in the value of currencies in relation to the U.S. dollar. The value of securities traded in markets outside the United States or denominated in currencies other than the U.S. dollar may be affected significantly on a day that the NYSE is closed and an investor is not able to purchase, redeem or exchange shares.
Securities and other assets for which market quotes are not readily available are valued at fair value as determined in good faith by the Board of Trustees or persons acting at their direction. The Board of Trustees has adopted methods for valuing securities and other assets in circumstances where market quotes are not readily available, and has delegated to Pacific Investment Management Company LLC (“PIMCO”) the responsibility for applying the valuation methods. In the event that market quotes are not readily available, and the security or asset cannot be valued pursuant to one of the valuation methods, the value of the security or asset will be determined in good faith by the Valuation Committee of the Board of Trustees, generally based upon recommendations provided by PIMCO.
Market quotes are considered not readily available in circumstances where there is an absence of current or reliable market-based data (e.g., trade information, bid/asked information, broker quotes), including where events occur after the close of the relevant market, but prior to the close of regular trading, that materially affect the values of a Portfolio’s securities or assets. In addition, market quotes are considered not readily available when, due to extraordinary circumstances, the exchanges or markets on which the securities trade do not open for trading for the entire day and no other market prices are available. The Board has delegated to PIMCO the responsibility for monitoring significant events that may materially affect the values of a Portfolio’s securities or assets and for determining whether the value of the applicable securities or assets should be re-evaluated in light of such significant events. When a Portfolio use fair value pricing to determine its NAV, securities will not be priced on the basis of quotations from the primary market in which they are traded, but rather may be priced by another method that the Board of Trustees or persons acting at their direction believe accurately reflects fair value. The Trust’s policy is intended to result in a calculation of a Portfolio’s NAV that fairly reflects security values as of the time of pricing. However, fair values determined by the Board of Trustees or persons acting at their direction may not accurately reflect the price that Portfolio could obtain for a security if it were to dispose of that security as of the time of pricing. Because foreign securities can trade on non-business days, the NAV of a Portfolio may change on days when shareholders will not be able to purchase or redeem shares. The prices used by a Portfolio may differ from the value that would be realized if the securities were sold and the differences could be material to the financial statements.
Securities Transactions and Investment Income. Securities transactions are recorded as of the trade date. Securities purchased or sold on a when-issued or delayed-delivery basis may be settled a month or more after the trade date. Realized gains and losses from securities sold are recorded on the identified cost basis. Dividend income is recorded on the ex-dividend date, except certain dividends from foreign securities where the ex-dividend date may have passed, which are recorded as soon as a Portfolio is informed of the ex-dividend date. Interest income, adjusted for the accretion of discounts and amortization of premiums, is recorded on the accrual basis. Paydown gains and losses on mortgage-related or asset-backed securities are recorded as components of interest income in the Statements of Operations.
Dividends and Distributions to Shareholders. Dividends from net investment income, if any, of each Portfolio, except the All Asset Portfolio, are declared on each day the Portfolio is open for business and are distributed to shareholders monthly. Dividends from net investment income, if any, of the All Asset Portfolio are declared and distributed to shareholders quarterly. Net realized capital gains earned by a Portfolio, if any, will be distributed no less frequently than once each year. Most shareholders choose to reinvest their dividends and capital gain distribution in additional shares of the Portfolio.
Income dividends and capital gain distributions are determined in accordance with income tax regulations which may differ from GAAP. Differences between tax regulations and GAAP may change the fiscal year when income and capital items are recognized for tax and GAAP purposes. Examples of events that give rise to timing differences include wash sales, straddles, net operating losses and capital loss carryforwards. Further, the character of investment income and capital gains may be different for certain transactions under the two methods of accounting. Examples of characterization differences include the treatment of mortgage paydowns, swaps, foreign currency transactions and contingent debt instruments. As a result, income dividends and capital gain distributions declared during a fiscal period may differ significantly from the net investment income and realized capital gain reported in a Portfolio’s annual financial statements presented under GAAP.
Distributions classified as a tax basis return of capital, if any, are reflected in the accompanying Statements of Changes in Net Assets and have been reclassified to
| | | | | | |
| | | Semiannual Report | | June 30, 2006 | | 39 |
Notes to Financial Statements (Cont.)
paid in capital. In addition, other amounts have been reclassified between undistributed net investment income, accumulated undistributed net realized gains or losses and/or paid in capital to more appropriately conform financial accounting to tax characterizations of dividend distributions.
Multiclass Operations. Each class offered by a Portfolio has equal rights as to assets and voting privileges (except that shareholders of a class have exclusive voting rights regarding any matter relating solely to that class of shares). Income and non-class specific expenses of each Portfolio, except the All Asset Portfolio, are allocated daily to each class of shares based on the relative value of settled shares. Realized and unrealized capital gains and losses of a Portfolio are allocated daily to each class of shares based on the relative net assets of each class. Class specific expenses, where applicable, currently include administrative, distribution and servicing fees.
Bridge Debt Commitments. At the period ended June 30, 2006, the High Yield Portfolio had $2,008,182 in commitments outstanding to fund high-yield bridge debt. The Portfolio is entitled to a fee upon the expiration of the commitment period. The bridge debt terms approximate market rates at the time the commitment is entered into.
Loan Participant and Assignments. Certain Portfolio may invest in direct debt instruments which are interests in amounts owned by corporate, governmental, or other borrowers to lenders or lending syndicates. A Portfolio’s investments in loans may be in the form of participations in loans or assignments of all or a portion of loans from third parties. A loan is often administered by a bank or other financial institution (the “lender”) that acts as agent for all holders. Then agent administers the terms of the loan, as specified in the loan agreement. When investing in a loan participation, a Portfolio has the right to receive payments of principal, interest and any fees to which it is entitled only from the lender selling the loan agreement and only upon receipt by the lender of payments from the borrower. A Portfolio generally has no right to enforce compliance with the terms of the loan agreement with the borrower. As a result, a Portfolio may be subject to the credit of both the borrower and the lender that is selling the loan agreement. When a Portfolio purchases assignments from lenders it acquires direct rights against the borrower on the loan. At the end of the period, the High Yield Portfolio had unfunded loan commitments of $2,008,182.
Delayed-Delivery Transactions. Certain Portfolios may purchase or sell securities on a when-issued or delayed-delivery basis. These transactions involve a commitment by a Portfolio to purchase or sell securities for a predetermined price or yield, with payment and delivery taking place beyond the customary settlement period. When delayed-delivery purchases are outstanding, a Portfolio will designate liquid assets in an amount sufficient to meet the purchase price. When purchasing a security on a delayed-delivery basis, a Portfolio assumes the rights and risks of ownership of the security, including the risk of price and yield fluctuations, and takes such fluctuations into account when determining its net asset value. A Portfolio may dispose of or renegotiate a delayed-delivery transaction after it is entered into, and may sell when-issued securities before they are delivered, which may result in a capital gain or loss. When a Portfolio has sold a security on a delayed-delivery basis, a Portfolio does not participate in future gains and losses with respect to the security.
Federal Income Taxes. Each Portfolio qualifies and intends to qualify as a regulated investment company and distribute all of its taxable income and net realized gains, if applicable, to shareholders. Accordingly, no provision for Federal income taxes has been made.
To the extent the All Asset Portfolio invest in the CommodityRealReturn Strategy Portfolio® (the “CRRS Portfolio”), an Underlying Fund, this Portfolio may be subject to the risks associated with commodity-linked derivative instruments.
One of the requirements for favorable tax treatment as a regulated investment company under the Code is that the CRRS Portfolio derive at least 90 percent of its gross income from certain qualifying sources of income. On December 16, 2005, the IRS issued Revenue Ruling 2006-01 which held that income from commodity index-linked swaps was not qualifying income. At the time Revenue Ruling 2006-01 was issued, the CRRS Portfolio invested primarily in commodity index-linked swaps to gain exposure to the commodity markets. Revenue Ruling 2006-01 provided an effective date of June 30, 2006, after which time the CRRS Portfolio’s ability to utilize commodity index-linked swaps as part of its investment strategy will be limited to a maximum of 10 percent of its gross income.
On June 2, 2006, the IRS issued Revenue Ruling 2006-31 which extends the effective date for Revenue Ruling 2006-01 from June 30, 2006 until September 30, 2006. Revenue Ruling 2006-31 also clarifies the holding of Revenue Ruling 2006-01 by providing that income from alternative instruments (such as certain commodity index-linked notes) that create commodity exposure may be considered qualifying income under the Code. In addition, the IRS has also issued private letter rulings to at least two other funds in which the IRS specifically concluded that income from certain commodity index-linked notes is qualifying income. The CRRS Portfolio has also obtained an opinion of counsel with respect to the treatment of income from commodity index-linked notes as qualifying income under the Code. Such an opinion is not binding upon the IRS.
Based on Revenue Ruling 2006-31, IRS guidance and advice of counsel, the CRRS Portfolio will seek to gain exposure to the commodity markets primarily through investments in commodity indexlinked notes. The use of commodity index-linked notes involves specific risks. The CRRS Portfolio will continue to seek ways to make use of other commodity-linked derivative instruments, including swap agreements, commodity options, futures and options on futures, and alternative structures within the Portfolio to gain exposure to commodity markets. Please refer to the prospectus for the Separate Account and Variable Contract for information regarding federal income tax treatment of distributions to the Separate Account.
Foreign Currency. The accounting records of the Portfolios are maintained in U.S. dollar. The market values of foreign securities, currency holdings and other assets and liabilities are translated into U.S. dollar based on the current exchange rates each business day. Fluctuations in the value of currency holdings and other assets and liabilities resulting from changes in exchange rates are recorded as unrealized foreign currency gains or losses. Realized gains or losses and unrealized appreciation or depreciation on investment securities and income and expenses are translated on the respective dates of such transactions. The effects of changes in foreign currency exchange rates on investments in securities are not segregated in the Statements of Operations from the effects of changes in market prices of those securities, but are included with the net realized and unrealized gain or loss on investment securities.
| | | | | | |
|
| Non-U.S. currency symbols utilized throughout the reports are defined as follows: |
| AUD | | Australian Dollar | | KRW | | South Korean Won |
| BRL | | Brazilian Real | | MXN | | Mexican Peso |
| CAD | | Canadian Dollar | | NZD | | New Zealand Dollar |
| CLP | | Chilean Peso | | PEN | | Peruvian New Sol |
| CNY | | Chinese Yuan Renminbi | | PLN | | Polish Zloty |
| DKK | | Danish Krone | | RUB | | Russian Ruble |
| EUR | | Euro | | SEK | | Swedish Krona |
| GBP | | British Pound | | SGD | | Singapore Dollar |
| HKD | | Hong Kong Dollar | | SKK | | Slovakian Koruna |
| INR | | Indian Rupee | | TWD | | Taiwan Dollar |
| JPY | | Japanese Yen | | ZAR | | South African Rand |
| | | | |
| 40 | | PIMCO Variable Insurance Trust | | |
| | |
| |
| | | June 30, 2006 (Unaudited) |
Forward Currency Transactions. Certain Portfolios may enter into forward currency contracts in connection with settling planned purchases or sales of securities, to hedge the currency exposure associated with some or all of a Portfolio’s securities or as a part of an investment strategy. A forward currency contract is an agreement between two parties to buy and sell a currency at a set price on a future date. The market value of a forward currency contract fluctuates with changes in forward currency exchange rates. Forward currency contracts are marked to market daily and the change in value is recorded by a Portfolio as an unrealized gain or loss. Realized gains or losses equal to the difference between the value of the contract at the time it was opened and the value at the time it was closed are recorded upon delivery or receipt of the currency or, if a forward currency contract is offset by entering into another forward currency contract with the same broker, upon settlement of the net gain or loss. These contracts may involve market risk in excess of the unrealized gain or loss reflected in a Portfolio’s Statement of Assets and Liabilities. In addition, a Portfolio could be exposed to risk if the counterparties are unable to meet the terms of the contracts or if the value of the currency changes unfavorably to the U.S. dollar.
Futures Contracts. Certain Portfolios are authorized to enter into futures contracts. A Portfolio may use futures contracts to manage its exposure to the securities markets or to movements in interest rates and currency values. The primary risks associated with the use of futures contracts are the imperfect correlation between the change in market value of the securities held by a Portfolio and the prices of futures contracts, the possibility of an illiquid market, and the inability of the counterparty to meet the terms of the contract. Futures contracts are valued based upon their quoted daily settlement prices. Upon entering into a futures contract, a Portfolio is required to deposit with its custodian, in a segregated account in the name of the futures broker, an amount of cash or U.S. Government and Agency Obligations in accordance with the initial margin requirements of the broker or exchange. Futures contracts are marked to market daily and an appropriate payable or receivable for the change in value (“variation margin”) is recorded by the Portfolio. Gains or losses are recognized but not considered realized until the contracts expire or are closed. Futures contracts involve, to varying degrees, risk of loss in excess of the variation margin disclosed in the Statements of Assets and Liabilities.
Guarantees and Indemnifications. Under the Trust’s organizational documents, each Trustee, officer, employee or other agent of the Trust (including the Trust’s investment manager) is indemnified against certain liabilities that may arise out of performance of their duties to the Portfolios. Additionally, in the normal course of business, the Portfolios enter into contracts that contain a variety of indemnification clauses. The Portfolios’ maximum exposure under these arrangements is unknown as this would involve future claims that may be made against the Portfolios that have not yet occurred. However, the Portfolios have not had prior claims or losses pursuant to these contracts, and believes the risk of loss to be remote.
Inflation-Indexed Bonds. Certain Portfolios may invest in inflation-indexed bonds. Inflation-indexed bonds are fixed-income securities whose principal value is periodically adjusted to the rate of inflation. The interest rate on these bonds is generally fixed at issuance at a rate lower than typical bonds. Over the life of an inflation-indexed bond, however, interest will be paid based on a principal value, which is adjusted for inflation. Any increase in the principal amount of an inflation-indexed bond will be included as interest income in the Statements of Operations, even though investors do not receive their principal until maturity.
Options Contracts. Certain Portfolios may write call and put options on futures, swaps, securities or currencies it owns or in which it may invest. Writing put options tends to increase a Portfolio’s exposure to the underlying instrument. Writing call options tends to decrease a Portfolio’s exposure to the underlying instrument. When a Portfolio writes a call or put option, an amount equal to the premium received is recorded as a liability and subsequently marked to market to reflect the current value of the option written. These liabilities are reflected as written options outstanding in the Statements of Assets and Liabilities. Certain options may be written with premiums to determined on a future date. The premiums for these options are based upon implied volatility parameters at specified terms. Premiums received from writing options which expire are treated as realized gains. Premiums received from writing options which are exercised or closed are added to the proceeds or offset against amounts paid on the underlying future, swap, security or currency transaction to determine the realized gain or loss. A Portfolio as a writer of an option has no control over whether the underlying future, swap, security or currency may be sold (call) or purchased (put) and as a result bears the market risk of an unfavorable change in the price of the future, swap, security or currency underlying the written option. There is the risk a Portfolio may not be able to enter into a closing transaction because of an illiquid market.
Certain Portfolios may also purchase put and call options. Purchasing call options tends to increase a Portfolio’s exposure to the underlying instrument. Purchasing put options tends to decrease a Portfolio’s exposure to the underlying instrument. A Portfolio pays a premium which is included in a Portfolio’s Statement of Assets and Liabilities as an investment and subsequently marked to market to reflect the current value of the option. Certain options may be purchased with premiums to be determined on a future date. The premiums for these options are based upon implied volatility parameters at specified terms. Premiums paid for purchasing options which expire are treated as realized losses. The risk associated with purchasing put and call options is limited to the premium paid. Premiums paid for purchasing options which are exercised or closed are added to the amounts paid or offset against the proceeds on the underlying future, swap, security or currency transaction to determine the realized gain or loss.
Payment In-Kind Securities. Certain Portfolios may invest in payment in-kind securities. Payment in-kind securities (PIKs) give the issuer the option at each interest payment date of making interest payments in either cash or additional debt securities. Those additional debt securities usually have the same term, including maturity dates and interest rates, and associated risks as the original bonds. The daily market quotations of the original bonds include the accrued interest (referred to as a dirty price) and require a pro rata adjustment from interest receivable to the unrealized appreciation or depreciation on investment in the Statements of Assets and Liabilities.
Repurchase Agreements. Certain Portfolios may engage in repurchase transactions. Under the terms of a typical repurchase agreement, a Portfolio takes possession of an underlying debt obligation subject to an obligation of the seller to repurchase, and a Portfolio to resell, the obligation at an agreed-upon price and time. The market value of the collateral must be equal to or exceed at all times the total amount of the repurchase obligations, including interest. Securities purchased under repurchase agreements are reflected as an asset in the Statements of Assets and Liabilities. Generally, in the event of counterparty default, a Portfolio has the right to use the collateral to offset losses incurred. If the counterparty should default, a Portfolio will seek to sell the securities which it holds as collateral. This could involve procedural costs or delays in addition to a loss on the securities if their value should fall below their repurchase price.
Restricted Securities. Certain Portfolios are permitted to invest in securities that are subject to legal or contractual restrictions on resale. These securities generally may be resold in transactions exempt from registration or to the public if the securities are registered. Disposal of these securities may involve time-consuming negotiations and expenses, and prompt sale at an acceptable price may be difficult.
Mortgage-Related and Other Asset-Backed Securities. Certain Portfolios may invest in mortgage-related or other asset-backed securities. These securities
| | | | | | |
| | | Semiannual Report | | June 30, 2006 | | 41 |
Notes to Financial Statements (Cont.)
include mortgage pass-through securities, collateralized mortgage obligations (“CMOs”), commercial mortgage-backed securities, mortgage dollar rolls, CMO residuals, stripped mortgage-backed securities (“SMBSs”) and other securities that directly or indirectly represent a participation in, or are secured by and payable from, mortgage loans on real property. The value of some mortgage- or asset-backed securities may be particularly sensitive to changes in prevailing interest rates. Early repayment of principal on some mortgage-related securities may expose a Portfolio to a lower rate of return upon reinvestment of principal. The value of these securities may fluctuate in response to the market’s perception of the creditworthiness of the issuers. Additionally, although mortgages and mortgage-related securities are generally supported by some form of government or private guarantee and/or insurance, there is no assurance that private guarantors or insurers will meet their obligations.
One type of SMBS has one class receiving all of the interest from the mortgage assets (the interest-only, or “IO” class), while the other class will receive all of the principal (the principal-only, or “PO” class). Payments received for IOs are included in interest income in the Statements of Operations. Because principal will not be received at the maturity of an IO, adjustments are made to the book value of the security on a daily basis until maturity. These adjustments are included in interest income in the Statements of Operations. Payments received for POs are treated as reductions to the cost and par value of the securities.
Swap Agreements. Certain Portfolios may engage in swap transactions, including, but not limited to, swap agreements on interest rate and credit default to manage its exposure to interest rates and credit risk. In connection with these agreements, securities may be identified as collateral in accordance with the terms of the respective swap agreements.
Interest rate swap agreements involve the exchange by a Portfolio with another party of their respective commitments to pay or receive interest, e.g., an exchange of floating rate payments for fixed rate payments with respect to the notional amount of principal.
Credit default swap agreements involve one party making a stream of payments to another party in exchange for the right to receive a specified return in the event of a default by a third party, typically corporate issues or sovereign issues of an emerging country, on its obligation. A Portfolio may use credit default swaps to provide a measure of protection against defaults of the issuers (i.e., to reduce risk where a Portfolio owns or has exposure to the sovereign issuer) or to take an active long or short position with respect to the likelihood of a particular issuer’s default. As a seller of protection, a Portfolio generally receives an upfront payment or a fixed rate of income throughout the term of the swap provided that there is no credit event. If a Portfolio is a seller of protection and a credit event occurs, as defined under the terms of that particular swap agreement, a Portfolio will pay to the buyer of the protection an amount up to the notional value of the swap and in certain instances take delivery of the security. As the seller, a Portfolio would effectively add leverage to its portfolio because, in addition to its total net assets, a Portfolio would be subject to investment exposure on the notional amount of the swap. As a buyer of protection, a Portfolio generally receives an amount up to the notional value of the swap if a credit event occurs. The treatment of credit default swaps and other swap agreements that provide for contingent, non-periodic, bullet-type payments as “notional principal contracts” for federal income tax purposes is uncertain. Were the Internal Revenue Service to take the position that a credit default swap or other bullet-type swap is not a “notional principal contract” for federal income tax purposes, payments received by the Portfolio from such investments might be subject to income taxes.
Swaps are marked to market daily based upon quotations from market makers and the change in value, if any, is recorded as unrealized gain or loss in the Statements of Operations. Payments received or made at the beginning of the measurement period are reflected as such in the Statements of Assets and Liabilities. These upfront payments are recorded as realized gain or loss in the Statements of Operations upon termination or maturity of the swap. A liquidation payment received or made at the termination of the swap is recorded as realized gain or loss in the Statements of Operations. Net periodic payments received or paid by a Portfolio are included as part of realized gain or loss in the Statements of Operations. Entering into these agreements involves, to varying degrees, elements of credit, market and documentation risk in excess of the amounts recognized in the Statements of Assets and Liabilities. Such risks involve the possibility that there will be no liquid market for these agreements, that the counterparty to the agreements may default on its obligation to perform or disagree as to the meaning of contractual terms in the agreements and that there may be unfavorable changes in interest rates.
U.S. Government Agencies or Government-Sponsored Enterprises. Securities issued by U.S. Government agencies or government-sponsored enterprises may not be guaranteed by the U.S. Treasury. The Government National Mortgage Association (“GNMA”), a wholly owned U.S. Government corporation, is authorized to guarantee, with the full faith and credit of the U.S. Government, the timely payment of principal and interest on securities issued by institutions approved by GNMA and backed by pools of mortgages insured by the Federal Housing Administration or guaranteed by the Department of Veterans Affairs. Government-related guarantors (i.e., not backed by the full faith and credit of the U.S. Government) include the Federal National Mortgage Association (“FNMA” or “Fannie Mae”) and the Federal Home Loan Mortgage Corporation (“FHLMC” or “Freddie Mac”). Pass-through securities issued by FNMA are guaranteed as to timely payment of principal and interest by FNMA but are not backed by the full faith and credit of the U.S. Government. FHLMC guarantees the timely payment of interest and ultimate collection of principal, but its participation certificates are not backed by the full faith and credit of the U.S. Government.
Underlying Funds. The Portfolio may invest in any or all of the Underlying Funds, but will not normally invest in every Underlying Fund at any particular time. The Underlying Funds are the Institutional Class shares of the PIMCO Funds, an affiliated open-end investment company, except All Asset and All Asset All Authority Funds. Though it is anticipated that the All Asset Portfolio will not currently invest in the European StocksPLUS® Total Return Strategy, Far East (ex-Japan) StocksPLUS® Total Return Strategy, Japanese StocksPLUS® TR Strategy, StocksPLUS® Municipal-Backed and StocksPLUS® TR Short Strategy Funds, the Portfolio may invest in these Funds in the future, without shareholder approval, at the discretion of the Portfolio’s asset allocation sub-adviser.
New Accounting Policies. In July 2006, the Financial Accounting Standards Board issued Interpretation No. 48, “Accounting for Uncertainty in Income Taxes—an Interpretation of FASB Statement No. 109” (the “Interpretation”). The Interpretation is effective for fiscal years beginning after December 15, 2006. Management is currently evaluating the application of the Interpretation to the Portfolio and will provide additional information in relation to the Interpretation in the Portfolio’s annual financial statements for the year ending December 31, 2006.
3. FEES, EXPENSES, AND RELATED PARTY TRANSACTIONS
Investment Advisory Fee. PIMCO is a majority-owned subsidiary of Allianz Global Investors of America L.P. (“AGI”), and serves as investment adviser (the “Adviser”) to the Trust, pursuant to an investment advisory contract. The Adviser receives a monthly fee at an annual rate based on average daily net assets of the Portfolios. The Advisory Fee is charged at an annual rate of 0.25% for all Portfolios except the All Asset Portfolio which is charged at an annual rate of 0.20%.
Administration Fee. PIMCO serves as administrator (the “Administrator”), and provides administrative services to the Trust for which it receives a monthly administrative fee based on average daily net assets of a Portfolio. As the Administrator, PIMCO bears the costs of various third-party services, including audit, custodial, portfolio accounting, legal, transfer agency and printing costs. The
| | | | |
| 42 | | PIMCO Variable Insurance Trust | | |
| | |
| |
| | | June 30, 2006 (Unaudited) |
Administration Fee for all Portfolios, except the Foreign Bond (U.S. Dollar-Hedged), Global Bond (Unhedged) and High Yield Portfolios, is charged at the annual rate of 0.25%. The Foreign Bond (U.S. Dollar-Hedged) and Global Bond (Unhedged) Portfolios are charged at an annual rate of 0.50%. The High Yield Portfolio is charged at an annual rate of 0.35%.
Distribution and Servicing Fees. Allianz Global Investors Distributors LLC (“AGID”) is an indirect wholly-owned subsidiary of AGI and serves as the distributor of the Trust’s shares. The Trust is permitted to reimburse AGID on a quarterly basis, out of the Administrative Class assets of a Portfolio in the amount of 0.15% on an annual basis of the average daily net assets of that class, for payments made to financial intermediaries that provide services in connection with the distribution of shares or administration of plans or programs that use Portfolio shares as their funding medium. The effective rate paid to AGID was 0.15% during the current fiscal year.
Expenses. The Trust is responsible for the following expenses: (i) salaries and other compensation of any of the Trust’s executive officers and employees who are not officers, directors, stockholders or employees of PIMCO or its subsidiaries or affiliates; (ii) taxes and governmental fees; (iii) brokerage fees and commissions and other portfolio transaction expenses; (iv) the costs of borrowing money, including interest expenses and bank overdraft charges; (v) fees and expenses of the Trustees who are not “interested persons” of PIMCO or the Trust, and any counsel retained exclusively for their benefit; (vi) extraordinary expenses, including costs of litigation and indemnification expenses; (vii) organization expenses and (viii) any expenses allocated or allocable to a specific class of shares, which include service fees payable with respect to the Administrative Class shares and may include certain other expenses as permitted by the Trust’s Multiple Class Plan adopted pursuant to Rule 18f-3 under the Act and subject to review and approval by the Trustees. The ratio of expenses to average net assets per share class, as disclosed in the Financial Highlights, may differ from the annual portfolio operating expenses per share class as disclosed in the Prospectus for the reasons set forth above.
PIMCO has agreed to waive a portion of its administrative fees to the extent that the payment of the All Asset Portfolio’s pro rata share of organization expenses and Trustee fees cause the actual expense ratio to rise above the rates disclosed in the then current prospectus plus 0.49 basis points as set forth below (calculated as a percentage of the Portfolio’s average daily net assets attributable to each class):
Administrative Class 0.60%
PIMCO may be reimbursed for these waived amounts in future periods, not to exceed thirty-six months. Expenses that have been waived and may still be reimbursed by the Administrator, to the extent the All Asset Portfolio’s annualized total portfolio operating expenses plus the amount so reimbursed does not exceed the operating expense limitation, are as follows (amounts in thousands):
| | | | | | | | | | | | | | | | | | | | |
| | | | | | 12/31/2003 | | | | | 12/31/2004 | | | | | 12/31/2005 | | | | | 06/30/2006 |
Amount Available for Reimbursement | | | | $ | 12 | | | | $ | 0 | | | | $ | 0 | | | | $ | 0 |
For the current period ended June 30, 2006, each unaffiliated Trustee received an annual retainer of $15,000, plus $2,000 for each Board of Trustees quarterly meeting attended, $500 for each Board of Trustees committee meeting attended and $500 for each special board meeting attended, plus reimbursement of related expenses. In addition, each Committee Chair received an additional annual retainer of $500 and each Audit Committee Chair received an additional annual retainer of $1,500. These expenses are allocated on a pro-rata basis to each Portfolio of the Trust according to its respective net assets. The Trust pays no compensation directly to any Trustee or any other officer who is affiliated with the Administrator, all of whom receive remuneration for their services to the Trust from the Administrator or its affiliates.
4. PURCHASES AND SALES OF SECURITIES
The length of time a Portfolio has held a particular security is not generally a consideration in investment decisions. A change in the securities held by a Portfolio is known as “portfolio turnover”. Each Portfolio may engage in frequent and active trading of portfolio securities to achieve its investment objective, particularly during periods of volatile market movements. High portfolio turnover (e.g., over 100%) involves correspondingly greater expenses to a Portfolio, including brokerage commissions or dealer mark-ups and other transaction costs on the sale of securities and reinvestments in other securities. Such sales may also result in realization of taxable capital gains, including short-term capital gains (which are generally taxed at ordinary income tax rates). The trading costs and tax effects associated with portfolio turnover may adversely affect a Portfolio’s performance.
Purchases and sales of securities (excluding short-term investments) for the period ended June 30, 2006 were as follows (amounts in thousands):
| | | | | | | | | | | | | | | | | | | |
| | | | |
| U.S Government/
Agency | | | | | All Other |
| | | | | | Purchases | | | | Sales | | | | | Purchases | | | | | Sales |
All Asset Portfolio | | | | $ | 0 | | | | $ 0 | | | | $ | 159,640 | | | | $ | 113,374 |
Foreign Bond Portfolio (U.S. Dollar-Hedged) | | | | | 44,576 | | | | 56,423 | | | | | 42,889 | | | | | 35,879 |
Global Bond Portfolio (Unhedged) | | | | | 102,156 | | | | 114,497 | | | | | 74,761 | | | | | 31,310 |
High Yield Portfolio | | | | | 0 | | | | 0 | | | | | 227,130 | | | | | 218,953 |
Low Duration Portfolio | | | | | 478,547 | | | | 426,544 | | | | | 66,669 | | | | | 27,434 |
5. TRANSACTIONS IN WRITTEN CALL AND PUT OPTIONS
Transactions in written call and put options were as follows (amounts in thousands, except number of contracts):
| | | | | | | | | | | | | | | | | | | | | | | | | | | | | | | | | | |
| | | | | Foreign Bond Portfolio
(U.S. Dollar-Hedged) |
| | | | Global Bond Portfolio
(Unhedged) |
|
| | | | | # of
Contracts |
| | | |
| Notional
Amount in $ |
| | | | | Premium | | | | | # of
Contracts |
| | | |
| Notional
Amount in $ |
| | | | | Premium | |
Balance at 12/31/2005 | | | | 64 | | | | | $ | 7,000 | | | | | $ | 68 | | | | | 124 | | | | | $ | 11,000 | | | | | $ | 112 | |
Sales | | | | 102 | | | | | | 26,600 | | | | | | 251 | | | | | 174 | | | | | | 71,200 | | | | | | 684 | |
Closing Buys | | | | 0 | | | | | | (5,800 | ) | | | | | (49 | ) | | | | 0 | | | | | | (9,900 | ) | | | | | (84 | ) |
Expirations | | | | (123 | ) | | | | | (100 | ) | | | | | (32 | ) | | | | (220 | ) | | | | | (1,500 | ) | | | | | (64 | ) |
Exercised | | | | (13 | ) | | | | | 0 | | | | | | (3 | ) | | | | 0 | | | | | | 0 | | | | | | 0 | |
Balance at 06/30/2006 | | | | 30 | | | | | $ | 27,700 | | | | | $ | 235 | | | | | 78 | | | | | $ | 70,800 | | | | | $ | 648 | |
| | | | | | | | | | | | | | | | | | | | | | | | | | | | | | | | | | | | | | | |
| | | | | High Yield Portfolio | | | | | Low Duration Portfolio | |
| | | | | # of
Contracts |
| | | |
| Notional
Amount in $ |
| | | | | Premium | | | | | # of
Contracts |
| | | |
| Notional
Amount in $ |
| | | | Notional
Amount in GBP |
| | | | | Premium | |
Balance at 12/31/2005 | | | | 707 | | | | | $ | 17,000 | | | | | $ | 285 | | | | | 460 | | | | | $ | 56,300 | | | | | GBP2,200 | | | | | $ | 868 | |
Sales | | | | 2,167 | | | | | | 1,500 | | | | | | 638 | | | | | 358 | | | | | | 75,100 | | | | | 0 | | | | | | 664 | |
Closing Buys | | | | (1,978 | ) | | | | | (18,500 | ) | | | | | (640 | ) | | | | (208 | ) | | | | | (32,700 | ) | | | | 0 | | | | | | (271 | ) |
Expirations | | | | 0 | | | | | | 0 | | | | | | 0 | | | | | (17 | ) | | | | | (9,400 | ) | | | | (500 | ) | | | | | (72 | ) |
Exercised | | | | 0 | | | | | | 0 | | | | | | 0 | | | | | 0 | | | | | | 0 | | | | | 0 | | | | | | 0 | |
Balance at 06/30/2006 | | | | 896 | | | | | $ | 0 | | | | | $ | 283 | | | | | 593 | | | | | $ | 89,300 | | | | | GBP1,700 | | | | | $ | 1,189 | |
| | | | | | |
| | | Semiannual Report | | June 30, 2006 | | 43 |
Notes to Financial Statements (Cont.)
6. SHARES OF BENEFICIAL INTEREST
The Trust may issue an unlimited number of shares of beneficial interest with a $0.001 par value. Changes in shares of beneficial interest were as follows (shares and amounts in thousands):
| | | | | | | | | | | | | | | | | | | | | | | | | | | | | | | | | | | | | | | | | | | | | | | | | | | | | | |
| | | | | All Asset Portfolio | | | | | Foreign Bond Portfolio
(U.S. Dollar-Hedged) | | | | | Global Bond Portfolio
(Unhedged) | |
| | | | | Six Months Ended
06/30/2006 | | | | | Year Ended
12/31/2005 | | | | | Six Months Ended
06/30/2006 | | | | | Year Ended
12/31/2005 | | | | | Six Months Ended
06/30/2006 | | | | | Year Ended
12/31/2005 | |
| | | | | Shares | | | Amount | | | | | Shares | | | Amount | | | | | Shares | | | Amount | | | | | Shares | | | Amount | | | | | Shares | | | Amount | | | | | Shares | | | Amount | |
| | | | | | | | | | | | | | | | | | |
Receipts for shares sold | | | | | | | | | | | | | | | | | | | | | | | | | | | | | | | | | | | | | | | | | | | | | | | | | | | | | | |
Institutional Class | | | | 1 | | | $ | 10 | | | | | 0 | | | $ | 0 | | | | | 0 | | | $ | 0 | | | | | 0 | | | $ | 0 | | | | | 1 | | | $ | 10 | | | | | 0 | | | $ | 0 | |
Administrative Class | | | | 2,843 | | | | 33,411 | | | | | 14,121 | | | | 166,191 | | | | | 925 | | | | 9,424 | | | | | 1,697 | | | | 17,519 | | | | | 4,637 | | | | 55,471 | | | | | 5,093 | | | | 63,454 | |
Advisor Class | | | | 5,043 | | | | 58,213 | | | | | 632 | | | | 7,545 | | | | | 0 | | | | 0 | | | | | 0 | | | | 0 | | | | | 0 | | | | 0 | | | | | 0 | | | | 0 | |
Class M | | | | 982 | | | | 11,550 | | | | | 4,617 | | | | 54,317 | | | | | 0 | | | | 0 | | | | | 0 | | | | 0 | | | | | 0 | | | | 0 | | | | | 0 | | | | 0 | |
Issued as reinvestment of distributions | | | | | | | | | | | | | | | | | | | | | | | | | | | | | | | | | | | | | | | | | | | | | | | | | | | | | | |
Institutional Class | | | | 0 | | | | 0 | | | | | 0 | | | | 0 | | | | | 0 | | | | 0 | | | | | 0 | | | | 0 | | | | | 0 | | | | 0 | | | | | 0 | | | | 0 | |
Administrative Class | | | | 437 | | | | 5,038 | | | | | 828 | | | | 9,815 | | | | | 76 | | | | 777 | | | | | 140 | | | | 1,452 | | | | | 157 | | | | 1,881 | | | | | 235 | | | | 2,873 | |
Advisor Class | | | | 56 | | | | 632 | | | | | 15 | | | | 182 | | | | | 0 | | | | 0 | | | | | 0 | | | | 0 | | | | | 0 | | | | 0 | | | | | 0 | | | | 0 | |
Class M | | | | 107 | | | | 1,232 | | | | | 200 | | | | 2,364 | | | | | 0 | | | | 0 | | | | | 0 | | | | 0 | | | | | 0 | | | | 0 | | | | | 0 | | | | 0 | |
Cost of shares redeemed | | | | | | | | | | | | | | | | | | | | | | | | | | | | | | | | | | | | | | | | | | | | | | | | | | | | | | |
Institutional Class | | | | 0 | | | | 0 | | | | | 0 | | | | 0 | | | | | 0 | | | | 0 | | | | | 0 | | | | 0 | | | | | 0 | | | | 0 | | | | | 0 | | | | 0 | |
Administrative Class | | | | (4,149 | ) | | | (48,154 | ) | | | | (2,453 | ) | | | (29,204 | ) | | | | (437 | ) | | | (4,459 | ) | | | | (793 | ) | | | (8,208 | ) | | | | (1,210 | ) | | | (14,460 | ) | | | | (561 | ) | | | (7,033 | ) |
Advisor Class | | | | (37 | ) | | | (431 | ) | | | | (17 | ) | | | (208 | ) | | | | 0 | | | | 0 | | | | | 0 | | | | 0 | | | | | 0 | | | | 0 | | | | | 0 | | | | 0 | |
Class M | | | | (1,114 | ) | | | (12,991 | ) | | | | (689 | ) | | | (8,152 | ) | | | | 0 | | | | 0 | | | | | 0 | | | | 0 | | | | | 0 | | | | 0 | | | | | 0 | | | | 0 | |
Net increase resulting from Portfolio share transactions | | | | 4,169 | | | $ | 48,510 | | | | | 17,254 | | | $ | 202,850 | | | | | 564 | | | $ | 5,742 | | | | | 1,044 | | | $ | 10,763 | | | | | 3,585 | | | $ | 42,902 | | | | | 4,767 | | | $ | 59,294 | |
| | | | | | | | | | | | | | | | | | | | | | | | | | | | | | | | | | | | |
| | | | | High Yield Portfolio | | | | | Low Duration Portfolio | |
| | | | | Six Months Ended
06/30/2006 | | | | | Year Ended
12/31/2005 | | | | | Six Months Ended
06/30/2006 | | | | | Year Ended
12/31/2005 | |
| | | | | Shares | | | Amount | | | | | Shares | | | Amount | | | | | Shares | | | Amount | | | | | Shares | | | Amount | |
| | | | | | | | | | | | |
Receipts for shares sold | | | | | | | | | | | | | | | | | | | | | | | | | | | | | | | | | | | | |
Institutional Class | | | | 43 | | | $ | 360 | | | | | 42 | | | $ | 336 | | | | | 996 | | | $ | 10,012 | | | | | 1,021 | | | $ | 10,460 | |
Administrative Class | | | | 7,675 | | | | 62,810 | | | | | 20,365 | | | | 167,640 | | | | | 18,333 | | | | 184,037 | | | | | 23,493 | | | | 239,555 | |
Advisor Class | | | | 1 | | | | 10 | | | | | 0 | | | | 0 | | | | | 1 | | | | 10 | | | | | 0 | | | | 0 | |
Issued as reinvestment of distributions | | | | | | | | | | | | | | | | | | | | | | | | | | | | | | | | | | | | |
Institutional Class | | | | 4 | | | | 29 | | | | | 4 | | | | 37 | | | | | 47 | | | | 467 | | | | | 55 | | | | 561 | |
Administrative Class | | | | 2,019 | | | | 16,529 | | | | | 3,377 | | | | 27,827 | | | | | 1,045 | | | | 10,471 | | | | | 1,136 | | | | 11,545 | |
Advisor Class | | | | 0 | | | | 0 | | | | | 0 | | | | 0 | | | | | 0 | | | | 0 | | | | | 0 | | | | 0 | |
Cost of shares redeemed | | | | | | | | | | | | | | | | | | | | | | | | | | | | | | | | | | | | |
Institutional Class | | | | (1 | ) | | | (12 | ) | | | | (3 | ) | | | (25 | ) | | | | (279 | ) | | | (2,796 | ) | | | | (473 | ) | | | (4,836 | ) |
Administrative Class | | | | (9,932 | ) | | | (80,878 | ) | | | | (16,769 | ) | | | (138,029 | ) | | | | (5,023 | ) | | | (50,338 | ) | | | | (6,536 | ) | | | (66,805 | ) |
Advisor Class | | | | 0 | | | | 0 | | | | | 0 | | | | 0 | | | | | 0 | | | | 0 | | | | | 0 | | | | 0 | |
Class M | | | | 0 | | | | 0 | | | | | 0 | | | | 0 | | | | | 0 | | | | 0 | | | | | 0 | | | | 0 | |
Net increase resulting from Portfolio share transactions | | | | (191 | ) | | $ | (1,152 | ) | | | | 7,016 | | | $ | 57,786 | | | | | 15,120 | | | $ | 151,863 | | | | | 18,696 | | | $ | 190,480 | |
| | | | |
| 44 | | PIMCO Variable Insurance Trust | | |
| | |
| |
| | | June 30, 2006 (Unaudited) |
The following schedule shows the number of shareholders each owning 5% or more of the Portfolio and the total percentage of the Portfolio held by such shareholders:
| | | | | | | | | | | | | | | | | | | | | | | | | | |
| | | | | All Asset Portfolio | | | | | Foreign Bond Portfolio
(U.S. Dollar-Hedged) | | | | Global Bond Portfolio
(Unhedged) |
|
| | | | | Number of
Shareholders | | | | % of Portfolio
Held |
| | | | Number of
Shareholders | | | | % of Portfolio
Held | | | | Number of
Shareholders | | | | % of Portfolio
Held |
|
Institutional Class | | | | 1 | | | | 100 | | | | | 1 | | | | 100 | | | | 1 | | | | 100 | |
Administrative Class | | | | 2 | | | | 89 | * | | | | 4 | | | | 91 | | | | 6 | | | | 95 | ** |
Advisor Class | | | | 2 | | | | 93 | | | | | – | | | | – | | | | – | | | | – | |
Class M | | | | 3 | | | | 97 | | | | | – | | | | – | | | | – | | | | – | |
| | | | | | | | | | | | | | | | | |
| | | | | High Yield Portfolio | | | | | Low Duration Portfolio |
| | | | | Number of
Shareholders | | | | % of Portfolio
Held |
| | | | Number of
Shareholders | | | | % of Portfolio
Held |
Institutional Class | | | | 1 | | | | 94 | | | | | 2 | | | | 100 |
Administrative Class | | | | 3 | | | | 79 | ** | | | | 2 | | | | 63 |
Advisor Class | | | | 1 | | | | 100 | | | | | 1 | | | | 100 |
* Allianz Life Insurance Co. of North America, an indirect wholly owned subsidiary of AGI and a Related party to the Portfolio, owned 25% or more of the outstanding shares of beneficial interest of the Portfolio, and therefore may be presumed to “control” the Portfolio, as that term is defined in the 1940 Act.
** One of the shareholders, Allianz Life Insurance Co. of North America, is an indirect wholly owned subsidiary of AGI and a related party to the Portfolio.
7. AFFILIATED TRANSACTIONS
The Underlying Funds are considered to be affiliated with the All Asset Portfolio. The table below shows the transactions in and earnings from investments in these affiliated Funds for the period ended June 30, 2006 (amounts in thousands):
| | | | | | | | | | | | | | | | | | | | | | | |
| Underlying Funds | | Market Value
12/31/2005 | | Purchases
at Cost | | Proceeds
from Sales | | Unrealized
Appreciation
(Depreciation) | | | Market Value
6/30/2006 | | Dividend
Income | | Net Capital and
Realized
Gain (Loss) | |
CommodityRealReturn Strategy Fund® | | $ | 11,984 | | $ | 3,509 | | $ | 6,126 | | $ | 130 | | | $ | 9,395 | | $ | 46 | | $ | (270 | ) |
Convertible Fund | | | 1,193 | | | 16 | | | 0 | | | 66 | | | | 1,240 | | | 16 | | | 0 | |
Developing Local Markets Fund | | | 23,695 | | | 11,797 | | | 5,002 | | | 582 | | | | 30,946 | | | 529 | | | 96 | |
Diversified Income Fund | | | 0 | | | 1,051 | | | 0 | | | (19 | ) | | | 1,031 | | | 11 | | | 0 | |
Emerging Markets Bond Fune | | | 26,326 | | | 9,172 | | | 13,874 | | | 321 | | | | 20,552 | | | 756 | | | (215 | ) |
Floating Income Fund | | | 23,662 | | | 14,886 | | | 8,178 | | | 272 | | | | 30,396 | | | 678 | | | 65 | |
Foreign Bond Fund (Unhedged) | | | 7,223 | | | 1,078 | | | 7,621 | | | 25 | | | | 833 | | | 80 | | | (356 | ) |
Fundamental IndexPLUS Fund | | | 1,258 | | | 1,753 | | | 1,411 | | | 28 | | | | 1,666 | | | 18 | | | 24 | |
Fundamental IndexPLUS TR Fund | | | 10,704 | | | 972 | | | 3,795 | | | (28 | ) | | | 7,823 | | | 164 | | | (158 | ) |
GNMA Fund | | | 3,197 | | | 539 | | | 988 | | | (63 | ) | | | 2,670 | | | 70 | | | (9 | ) |
High Yield Fund | | | 20,384 | | | 705 | | | 8,205 | | | (76 | ) | | | 12,554 | | | 705 | | | (85 | ) |
International StocksPLUS® TR Strategy Fund | | | 10,584 | | | 12,012 | | | 75 | | | (675 | ) | | | 22,025 | | | 379 | | | (9 | ) |
Long-Term U.S. Government Fund | | | 39,326 | | | 3,546 | | | 13,541 | | | (2,088 | ) | | | 26,893 | | | 717 | | | (831 | ) |
Low Duration Fund | | | 4,844 | | | 12,249 | | | 13,954 | | | (2 | ) | | | 2,993 | | | 158 | | | (146 | ) |
Real Return Asset Fund | | | 49,421 | | | 59,336 | | | 997 | | | (4,724 | ) | | | 103,412 | | | 1,423 | | | (38 | ) |
Real Return Fund | | | 43,544 | | | 24,385 | | | 591 | | | (2,425 | ) | | | 65,726 | | | 995 | | | (45 | ) |
RealEstateRealReturn Strategy Fund | | | 10,989 | | | 230 | | | 9,873 | | | 36 | | | | 1,756 | | | 230 | | | (537 | ) |
Short-Term Fund | | | 0 | | | 76 | | | 66 | | | 0 | | | | 10 | | | 0 | | | 0 | |
StocksPLUS® Fund | | | 70 | | | 1 | | | 0 | | | 3 | | | | 72 | | | 1 | | | 0 | |
StocksPLUS® Total Return Fund | | | 1,687 | | | 21 | | | 0 | | | (59 | ) | | | 1,679 | | | 21 | | | 0 | |
Total Return Fund | | | 26,281 | | | 2,128 | | | 12,615 | | | (576 | ) | | | 15,036 | | | 542 | | | (463 | ) |
Total Return Mortgage Fund | | | 10,041 | | | 178 | | | 6,462 | | | (123 | ) | | | 3,586 | | | 178 | | | (178 | ) |
Totals | | $ | 326,413 | | $ | 159,640 | | $ | 113,374 | | $ | (9,395 | ) | | $ | 362,294 | | $ | 7,717 | | $ | (3,155 | ) |
| | | | | | |
| | | Semiannual Report | | June 30, 2006 | | 45 |
Notes to Financial Statements (Cont.)
8. FEDERAL INCOME TAX MATTERS
As of June 30, 2006, the aggregate cost of investments was the same for federal income tax and financial statement purposes. The net unrealized appreciation (depreciation) of investment securities for federal income tax purposes is as follows (amounts in thousands):
| | | | | | | | | | |
| | | | | Aggregate
Gross
Unrealized
Appreciation | | Aggregate
Gross
Unrealized
(Depreciation) | | | Net
Unrealized
Appreciation/
(Depreciation) | |
All Asset Portfolio | | | | $ 1,463 | | $ (10,857 | ) | | $ (9,394 | ) |
Foreign Bond Portfolio (U.S. Dollar-Hedged) | | | | 1,351 | | (981 | ) | | (370 | ) |
Global Bond Portfolio (Unhedged) | | | | 1,160 | | (1,846 | ) | | (686 | ) |
High Yield Portfolio | | | | 5,358 | | (11,001 | ) | | (5,643 | ) |
Low Duration Portfolio | | | | 4,321 | | (3,943 | ) | | 378 | |
9. REGULATORY AND LITIGATION MATTERS
On June 1, 2004, the Attorney General of the State of New Jersey announced that it had dismissed PIMCO from a complaint filed by the New Jersey Attorney General on February 17, 2004, and that it had entered into a settlement agreement (the “New Jersey Settlement”) with Allianz Global Investors of America L.P. (“AGI”) (formerly known as Allianz Dresdner Asset Management of America L.P.), PEA Capital LLC (an entity affiliated with PIMCO through common ownership) (“PEA”) and Allianz Global Investors Distributors LLC (“AGID”), in connection with the same matter. In the New Jersey Settlement, AGI, PEA and AGID neither admitted nor denied the allegations or conclusions of law, but did agree to pay New Jersey a civil fine of $15 million and $3 million for investigative costs and further potential enforcement initiatives against unrelated parties. They also undertook to implement certain governance changes. The complaint relating to the New Jersey Settlement alleged, among other things, that AGI, PEA and AGID had failed to disclose that they improperly allowed certain hedge funds to engage in “market timing” in certain funds. The complaint sought injunctive relief, civil monetary penalties, restitution and disgorgement of profits.
Since February 2004, PIMCO, AGI, PEA, AGID, and certain of their affiliates, including the PIMCO Funds, the Allianz Funds (formerly known as PIMCO Funds: Multi-Manager Series), and the Trustees and employees of the PIMCO Funds, have been named as defendants in fifteen lawsuits filed in various jurisdictions. Eleven of those lawsuits concern “market timing,” and they have been transferred to and consolidated for pre-trial proceedings in a multi-district litigation proceeding in the U.S. District Court for the District of Maryland; the other four lawsuits concern “revenue sharing” and have been consolidated into a single action in the U.S. District Court for the District of Connecticut. The lawsuits have been commenced as putative class actions on behalf of investors who purchased, held or redeemed shares of the various series of the PIMCO Funds and the Allianz Funds during specified periods, or as derivative actions on behalf of the PIMCO Funds and Allianz Funds.
The market timing actions in the District of Maryland generally allege that certain hedge funds were allowed to engage in “market timing” in certain of the PIMCO Funds and the Allianz Funds and the and this alleged activity was not disclosed. Pursuant to tolling agreements entered into with the derivative and class action plaintiffs, PIMCO, the Trustees, and certain employees of PIMCO who were previously named as defendants have all been dropped as defendants in the market timing actions; the plaintiffs continue to assert claims on behalf of the shareholders of the PIMCO Funds or on behalf of the PIMCO Funds themselves against other defendants. By order dated November 3, 2005, the U.S. District Court for the District of Maryland granted the PIMCO Funds’ motion to dismiss claims asserted against it in a consolidated amended complaint where the PIMCO Funds were named, in the complaint, as a nominal defendant. The revenue sharing action in the District of Connecticut generally alleges that fund assets were inappropriately used to pay brokers to promote the PIMCO Funds and Allianz Funds , including directing fund brokerage transactions to such brokers, and that such alleged arrangements were not fully disclosed to shareholders. On August 11, 2005 the U.S. District Court for the District of Connecticut conducted a hearing on defendants’ motion to dismiss the consolidated amended complaint in the revenue sharing action but has not yet ruled on the motion to dismiss. The market timing and revenue sharing lawsuits seek, among other things, unspecified compensatory damages plus interest and, in some cases, punitive damages, the rescission of investment advisory contracts, the return of fees paid under those contracts and restitution.
Under Section 9(a) of the Investment Company Act of 1940, as amended (“1940 Act”), if the New Jersey Settlement or any of the lawsuits described above were to result in a court injunction against AGI, PEA, AGID and/or their affiliates, PIMCO could, in the absence of exemptive relief granted by the SEC, be barred from serving as an investment adviser, and AGID could be barred from serving as principal underwriter, to any registered investment company, including the Portfolios of the Trust. In connection with an inquiry from the SEC concerning the status of the New Jersey Settlement under Section 9(a), PEA, AGID, AGI and certain of their affiliates (including PIMCO) (together, the “Applicants”) have sought exemptive relief from the SEC under Section 9(c) of the 1940 Act. The SEC has granted the Applicants a temporary exemption from the provisions of Section 9(a) with respect to the New Jersey Settlement until the earlier of (i) September 13, 2006 and (ii) the date on which the SEC takes final action on their application for a permanent order. There is no assurance that the SEC will issue a permanent order.
Two nearly identical class action civil complaints have been filed in August 2005, in the Northern District of Illinois Eastern Division alleging that the plaintiffs each purchased and sold a 10-year Treasury note futures contract and suffered damages from an alleged shortage when PIMCO held both physical and futures positions in 10-year Treasury notes for its client accounts. The two actions have been consolidated into one action, and the two separate complaints have been replaced by a consolidated complaint. PIMCO is a named defendant, and the PIMCO Funds have been added as a defendant, to the consolidated action. PIMCO strongly believes the complaint (and any consolidated complaint filed hereafter) is without merit and intends to vigorously defend itself.
Certain Portfolios of the Trust were recently served in an adversary proceeding brought by the Official Committee of Asbestos Claimants of G-I Holdings, Inc. in G-I Holdings, Inc.’s bankruptcy in the District of New Jersey. PIMCO was previously named in this lawsuit and remains a defendant. The plaintiff seeks to recover for the bankruptcy estate assets that were transferred by the predecessor entity of G-I Holdings, Inc. to a wholly-owned subsidiary in 1994. The subsidiary has since issued notes, of which certain Portfolios of the Trust are alleged to be holders. The complaint alleges that in 2000, more than two hundred noteholders—including certain Portfolios of the Trust—were granted a second priority lien on the assets of the subsidiary in exchange for their consent to a refinancing transaction and the granting of a first priority lien to the lending banks. The plaintiff is seeking invalidation of the lien in favor of the noteholders and/or the value of the lien.
It is possible that these matters and/or other developments resulting from these matters could result in increased fund redemptions or other adverse consequences to the Portfolios. However, PIMCO and AGID believe that these matters are not likely to have a material adverse effect on the Portfolios or on PIMCO’s or AGID’s ability to perform their respective investment advisory or distribution services relating to the Portfolios.
| | | | |
| 46 | | PIMCO Variable Insurance Trust | | |
Investment Adviser and Administrator
Pacific Investment Management Company LLC
840 Newport Center Drive
Newport Beach, California 92660
Distributor
Allianz Global Investors Distributors LLC
2187 Atlantic Street
Stamford, Connecticut 06902
Custodian
State Street Bank & Trust Company
801 Pennsylvania
Kansas City, Missouri 64105
Transfer Agent
Boston Financial Data Services–Midwest
330 W. 9th Street
Kansas City, Missouri 64105
Legal Counsel
Dechert LLP
1775 I Street, N.W.
Washington, D.C. 20006
Independent Registered Public Accounting Firm
PricewaterhouseCoopers LLP
1055 Broadway
Kansas City, Missouri 64105
P I M C O
| | | | | | |
| |
Item 2. | | Code of Ethics |
| |
| | | The information required by this Item 2 is only required in an annual report on this Form N-CSR. |
| |
Item 3. | | Audit Committee Financial Expert |
| |
| | | The information required by this Item 3 is only required in an annual report on this Form N-CSR. |
| |
Item 4. | | Principal Accountant Fees and Services |
| |
| | | The information required by this Item 4 is only required in an annual report on this Form N-CSR. |
| |
Item 5. | | Audit Committee of Listed Registrants. Not applicable. |
| |
Item 6. | | Schedule of Investments. The Schedule of Investments is included as part of the reports to shareholders under Item 1. |
| |
Item 7. | | Disclosure of Proxy Voting Policies and Procedures for Closed-End Management Investment Companies. Not applicable. |
| |
Item 8. | | Portfolio Managers of Closed-End Management Investment Companies. Not applicable. |
| |
Item 9. | | Purchases of Equity Securities by Closed-End Management Investment Company and Affiliated Purchases. Not applicable. |
| |
Item 10. | | Submission of Matters to a Vote of Security Holders. Not applicable. |
| |
Item 11. | | Controls and Procedures |
| | |
| | | (a) | | The principal executive officer and principal financial officer of PIMCO Variable Insurance Trust (“Trust”) have concluded that the Trust’s disclosure controls and procedures (as defined in Rule 30a-3(c) under the Investment Company Act) provide reasonable assurances that material information relating to the Trust is made known to them by the appropriate persons, based on their evaluation of these controls and procedures as of a date within 90 days of the filing of this report. |
| | |
| | | (b) | | There were no changes in the Trust’s internal control over financial reporting that occurred during the second fiscal quarter of the period covered by this report that have materially affected, or are reasonably likely to materially affect, the Trust’s internal control over financial reporting. |
| | |
Item 12. | | Exhibits | | |
| | |
| | | (a)(1) | | Code of Ethics. Not applicable for semiannual reports. |
| | |
| | | (a)(2) | | Exhibit 99.CERT—Certifications pursuant to Section 302 of the Sarbanes-Oxley Act of 2002. |
| | |
| | | (b) | | Exhibit 99.906CERT—Certifications pursuant to Section 906 of the Sarbanes-Oxley Act of 2002. |
Signatures
Pursuant to the requirements of the Securities Exchange Act of 1934 and the Investment Company Act of 1940, the registrant has duly caused this report to be signed on its behalf by the undersigned, thereunto duly authorized.
| | |
| PIMCO Variable Insurance Trust |
| |
By: | | /s/ ERNEST L. SCHMIDER
|
| | | Ernest L. Schmider |
| | | President, Principal Executive Officer |
| |
Date: | | September 7, 2006 |
Pursuant to the requirements of the Securities Exchange Act of 1934 and the Investment Company Act of 1940, this report has been signed below by the following persons on behalf of the registrant and in the capacities and on the dates indicated.
| | |
| |
By: | | /s/ ERNEST L. SCHMIDER
|
| | | Ernest L. Schmider |
| | | President, Principal Executive Officer |
| |
Date: | | September 7, 2006 |
| |
By: | | /s/ JOHN P. HARDAWAY
|
| | | John P. Hardaway |
| | | Treasurer, Principal Financial Officer |
| |
Date: | | September 7, 2006 |